UNITED STATES
SECURITIES AND EXCHANGE COMMISSION
Washington, D.C. 20549
FORM N-CSR
CERTIFIED SHAREHOLDER REPORT OF REGISTERED
MANAGEMENT INVESTMENT COMPANIES
| | |
INVESTMENT COMPANY ACT FILE NUMBER: | | 811-05443 |
| |
| EXACT NAME OF REGISTRANT AS SPECIFIED IN CHARTER: | | Calamos Investment Trust |
| |
ADDRESS OF PRINCIPAL EXECUTIVE OFFICES: | | 2020 Calamos Court, Naperville Illinois 60563-2787 |
| |
NAME AND ADDRESS OF AGENT FOR SERVICE: | | John P Calamos, Sr., President, Calamos Advisors LLC 2020 Calamos Court, Naperville, Illinois 60563-2787 |
REGISTRANT’S TELEPHONE NUMBER, INCLUDING AREA CODE: (630) 245-7200
DATE OF FISCAL YEAR END: October 31, 2015
DATE OF REPORTING PERIOD: November 1, 2014 through April 30, 2015
Item 1. Report to Shareholders

Experience and Foresight
About Calamos Investments
For over 35 years, we have helped investors like you manage and build wealth to meet long-term objectives. Because investors have different time horizons, risk tolerances and goals, we offer funds to suit a variety of asset allocation needs. Our 19 mutual funds include equity, fixed income, convertible and alternative funds. We offer U.S. funds as well as global and international choices.
We are dedicated to helping our clients build and protect wealth. We understand when you entrust us with your assets, you also entrust us with your achievements, goals and aspirations. We believe we best honor this trust by making investment decisions guided by integrity, by discipline and by our conscientious research.
We believe an active, risk-conscious approach is essential for wealth creation. In the 1970s, we pioneered the use of convertible securities as a means to control risk in volatile markets. We followed with strategies that combine convertibles and stocks, with the aim of participating in equity market upside with potentially less volatility than an all-stock portfolio. In the 1990s, we introduced our first stock fund, which invests in growth companies both large and small. Across our funds, our investment process seeks to manage risk at multiple levels and draws upon our experience investing through many market cycles. In a rapidly changing environment, we believe that this active management is essential.
We are global in our perspective. We believe globalization offers tremendous opportunities for countries and companies all over the world. In our U.S., global and international portfolios, we are seeking to capitalize on the potential growth of the global economy.
We believe there are opportunities in all markets. Our history traces back to the 1970s, a period of significant volatility and economic concerns. We have invested through multiple market cycles, each with its own challenges. Out of this experience comes our belief that the flipside of volatility is opportunity.
Letter to Shareholders

JOHN P. CALAMOS, SR.
CEO and Global Co-CIO
Dear Fellow Shareholder:
Welcome to your semiannual report for the six-month period ended April 30, 2015. In this report, you will find commentary from the management teams of the Calamos Funds, as well as a listing of portfolio holdings, financial statements and highlights, and detailed information about each Fund’s performance and positioning.
Market Review
Stocks advanced during the reporting period, surmounting headwinds related to energy prices, unrest in Ukraine, political wrangling in the euro zone, global growth rates, and the potential impact of a strengthening dollar. In the U.S., unemployment continued to fall, the Federal Reserve maintained accommodative monetary policy, and corporate profits remained healthy. Outside the U.S., positive economic surprises in Europe and Japan boosted investor sentiment. Markets responded favorably to the European Central Bank’s decision to move forward with quantitative easing as well as to Japan’s concerted and coordinated efforts to promote economic recovery.
The MSCI World Index, a measure of stocks from developed markets, returned 5.38% for the six-month period. Growth stocks outperformed, with the MSCI World Growth Index gaining 7.49%. In the U.S., stocks extended their bull market run, with the S&P 500 Index advancing 4.40%. Investors also demonstrated a preference for growth stocks, with the Russell 3000 Growth Index returning 6.59%, versus the Russell 3000 Value Index, up 2.82%. Emerging market equities gained 4.04%, as measured by the MSCI Emerging Markets Index.
Convertible securities, which combine attributes of stocks and fixed income securities, captured a substantial measure of the stock market’s gains. U.S. convertibles advanced 3.64%, as measured by the BofA Merrill Lynch All U.S. Convertibles ex-Mandatory Index, and global convertibles gained 4.11%, as measured by the BofA Merrill Lynch Global 300 Convertible Index. The U.S. bond market produced more muted returns, with the Barclays U.S. Aggregate Bond Index rising 2.06%.
Outlook
Our team is optimistic about the global markets and the prospects for stocks and convertible securities. We see especially attractive potential for growth-oriented
Letter to Shareholders
companies—the focus of many of our funds, including our flagship Calamos Growth Fund (page 4) and Calamos International Growth Fund (page 22), which marked its 10-year anniversary during the reporting period.
Although the U.S. economy grew slowly during the first quarter of the year—due in large measure to unseasonably cold weather and turmoil in the energy sector—we believe the U.S. can resume its steady expansion for the remainder of 2015, if energy prices continue to stabilize, inflation remains contained, and the Federal Reserve maintains its accommodative stance. We also expect the global economy to expand in 2015, benefiting from ranging factors including central bank policy in the euro zone, Japan, and select emerging markets.
Looking beyond stocks and convertibles, we are concerned about the potential risks associated with oversized allocations to traditional fixed-income securities, as history has shown that interest rates can rise quickly. We believe investors should work proactively with their financial advisors to ensure appropriate diversification, which may include convertibles strategies and liquid alternative strategies. As a starting point for your discussions, you may wish to review the commentaries for two of our newer offerings, Calamos Global Convertible Fund (page 51) and Calamos Hedged Equity Income Fund (page 62).
While we see a good deal of opportunity, this is an environment where active management, rigorous research and keen awareness of risk will be important drivers of success. We anticipate market volatility will persist as investors respond to the activities of central banks (particularly those of the Federal Reserve), as well as geopolitical uncertainties. We believe that our disciplined, tested, and fundamentally driven approach will serve the Funds well.
In closing, I invite you to visit us at www.calamos.com. We’re continually updating our site with thought leadership, blogs and commentary designed to help you and your financial advisor decide which opportunities are most appropriate for you.
On behalf of all of us at Calamos Investments, I thank you for your trust. We are honored you have chosen us to help you pursue your investment goals.
Sincerely,

John P. Calamos, Sr.
CEO and Global Co-CIO
| | | | |
| 2 | | CALAMOS OPEN-END FAMILY OF FUNDS SEMIANNUAL REPORT | | |
Letter to Shareholders
Before investing, carefully consider a fund’s investment objectives, risks, charges and expenses. Please see the prospectus containing this and other information or call 800.582.6959. Please read the prospectus carefully. Performance data represents past performance, which is no guarantee of future results. Current performance may be lower or higher than the performance quoted.
The MSCI World Index is a market-capitalization weighted index composed of companies representative of the market structure of developed market countries in North America, Europe and the Asia/Pacific region. The MSCI World Growth Index captures large and mid cap securities exhibiting overall growth style characteristics across 23 developed markets countries. The S&P 500 Index is an unmanaged index generally considered representative of the U.S. stock market. The Russell 3000 Growth Index measures the performance of the broad growth segment of the U.S. equity universe. It includes those Russell 3000 companies with higher price-to-book ratios and higher forecasted growth values. The Russell 3000 Value Index measures the performance of the broad value segment of the U.S. equity universe. It includes those Russell 3000 companies with lower price-to-book ratios and lower forecasted growth values. The MSCI Emerging Markets Index is a free float-adjusted market capitalization index considered broadly representative of emerging market equity performance. The index represents companies within the constituent emerging markets that are available to investors worldwide. The BofA Merrill Lynch All U.S. Convertibles Ex-Mandatory Index represents the U.S. convertible securities market excluding mandatory convertibles. The BofA Merrill Lynch Global 300 Convertible Index is a global convertible index composed of companies representative of the market structure of countries in North America, Europe and the Asia/Pacific region. The Barclays U.S. Aggregate Bond Index is considered generally representative of the investment-grade bond market. Sources: Lipper, Inc.; Morningstar.
Unmanaged index returns assume reinvestment of any and all distributions and, unlike fund returns, do not reflect fees, expenses or sales charges. Investors cannot invest directly in an index. Investments in overseas markets pose special risks, including currency fluctuation and political risks. These risks are generally intensified for investments in emerging markets. Countries, regions, and sectors mentioned are presented to illustrate countries, regions, and sectors in which a fund may invest. Fund holdings are subject to change daily. The Funds are actively managed.
The information contained herein is based on internal research derived from various sources and does not purport to be statements of all material facts relating to the securities mentioned. The information contained herein, while not guaranteed as to accuracy or completeness, has been obtained from sources we believe to be reliable. There are certain risks involved with investing in convertible securities in addition to market risk, such as call risk, dividend risk, liquidity risk and default risk, that should be carefully considered prior to investing. This information is being provided for informational purposes only and should not be considered investment advice or an offer to buy or sell any security in the portfolio.
This report is intended for informational purposes only and should not be considered investment advice.
Calamos Growth Fund
OVERVIEW
The Fund invests in the equities of U.S. companies with a range of market capitalizations that we believe offer the best potential for growth.
KEY FEATURES
| | ¡ | | Utilize more than two decades of extensive research experience in growth investing | |
| | ¡ | | Active management with a focus on top-down views and bottom-up fundamentals | |
| | ¡ | | Research-driven approach identifies opportunities by combining top-down analysis and a research focus on key growth characteristics | |
PORTFOLIO FIT
This actively managed Fund seeks to provide attractive returns through its emphasis on higher-growth companies primarily in large and mid cap arenas.
| | |
| FUND NASDAQ SYMBOLS |
A Shares | | CVGRX |
B Shares | | CVGBX |
C Shares | | CVGCX |
I Shares | | CGRIX |
R Shares | | CGRRX |
| | | |
|
| FUND CUSIP NUMBERS |
A Shares | | 128119302 |
B Shares | | 128119740 |
C Shares | | 128119856 |
I Shares | | 128119807 |
R Shares | | 128119435 |
| | | |
CALAMOS GROWTH FUND
INVESTMENT TEAM DISCUSSION
How has the Fund performed?
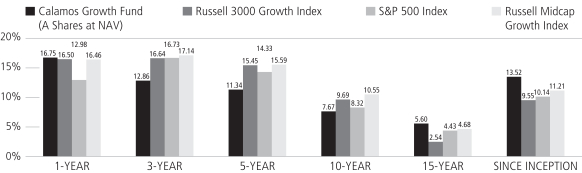
For the six-month period ended April 30, 2015, the Fund returned 6.27% (Class A shares at net asset value) versus the Russell 3000 Growth Index gain of 6.59%. For the same period the S&P 500 Index rose 4.40% and the Russell Midcap Growth Index returned 7.77%.
The Fund’s strong absolute results, which outperformed by 95 basis points the average return of peers in the Morningstar Large Growth category, reflected the strength of the growth equity market. We remain especially bullish on growth stocks as we believe earnings growth remains solidly positive and corporate earnings will continue to expand. We feel we have entered a growth regime, and recent market performance has aligned with our view. In the first quarter of 2015, growth stocks led value by 460 basis points, a spread not seen since the first quarter of 2009.
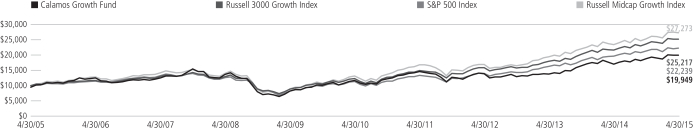
Since its inception on September 4, 1990, the Fund has returned 13.52% on an annualized basis (Class A shares at net asset value), demonstrating its ability to outdistance the growth and broad indices over full market cycles. Over the same period, the Russell 3000 Growth Index returned 9.55%, while the S&P 500 Index and the Russell Midcap Growth Index returned 10.14% and 11.21%, respectively.
What factors influenced performance over the period?
The U.S. equity market continues to be buoyed by solid corporate performance, benign inflation and the prospect of a slower path to interest rate increases. Our use of both cyclical and secular themes supports our stance that we are in the mid-stages of the business cycle, and this approach worked well for the Fund during the period.
Selection in financials contributed to performance versus the Russell 3000 Growth Index. Holdings in the asset management, custody banks and regional banks industries were especially strong. An underweight and selection within the consumer staples sector also added value. In particular, positioning and holdings within the tobacco and drug retail industries contributed to performance.
Although the Fund’s overweight to consumer discretionary was positive, selection held back relative performance. We believe the sector continues to benefit from an improving housing industry and sustained positive consumer sentiment. Selection in energy hampered performance. As we believe oil and gas prices could remain lower for an extended period, we remain underweight and will be selective moving forward.
How is the Fund positioned?
In this all-cap growth equity Fund, we seek to invest in U.S. companies that we believe have the best prospects for sustainable and high relative growth. The Fund offers a diversified approach and participates in long-term growth trends by focusing on companies with solid fundamentals, global brands, strong growth catalysts and attractive valuations.
We continue to actively manage our sector exposures in conjunction with our fundamental, bottom-up research. Our research points us to opportunities within the
| | | | |
| 4 | | CALAMOS OPEN-END FAMILY OF FUNDS SEMIANNUAL REPORT | | |
Calamos Growth Fund
technology, consumer discretionary and health care sectors, and the Fund is positioned as such. Overall, changes to sector weights were modest during the period. We added to the consumer discretionary sector by virtue of improving fundamentals and growth prospects as well as security-specific factors. For example, we added names from the general merchandise stores, apparel, accessories and luxury goods, and restaurants industries. On the other hand, we marginally reduced the Fund’s stake in consumer staples, industrials and financials. We sold companies marked by declining growth catalysts, deteriorating fundamentals and valuation concerns.
At period end, the Fund’s largest allocations in absolute terms included the information technology and consumer discretionary sectors. Relative to the Russell 3000 Growth Index, the portfolio’s largest overweight was in information technology, and its largest underweight was in consumer staples.
What closing thoughts do you have for Fund shareholders?
With the Fed likely to hold off on raising interest rates until later this year, we believe stock prices should continue their upward trend, though experiencing periodic bouts of volatility. With earnings yields still far in excess of long-term borrowing costs, it’s our belief that record merger and acquisition and buyback activity will likely continue. We remain bullish on equities, and particularly growth equities, where valuations remain attractive on a number of our favored measures. We believe the current growth regime is similar to 1995 – 1999, supported by low inflation, high cash levels and high innovation. We favor companies with strong growth catalysts, improving fundamentals and solid balance sheets. That mindset leads us to favor the information technology, consumer discretionary and health care sectors, while we remain underweight to consumer staples and materials.
| | | | |
| SECTOR WEIGHTINGS | |
Information Technology | | | 31.5 | % |
Consumer Discretionary | | | 20.4 | |
Health Care | | | 15.5 | |
Industrials | | | 11.8 | |
Financials | | | 6.2 | |
Energy | | | 4.6 | |
Consumer Staples | | | 3.4 | |
| | | | | |
Sector weightings are subject to change daily and are calculated as a percentage of net assets. The table excludes cash or cash equivalents, any government/sovereign bonds or broad based index hedging securities the Fund may hold.
ANNUALIZED RETURN: SINCE INCEPTION (9/4/90) THROUGH 4/30/15
Performance data quoted represents past performance, which is no guarantee of future results. Current performance may be lower or higher than the performance quoted.
The principal value and investment return of an investment will fluctuate so that your shares, when redeemed, may be worth more or less than their original cost. You can obtain performance data current to the most recent month end by visiting www.calamos.com. Average annual total return measures net investment income and capital gain or loss from portfolio investments as an annualized average. All performance shown assumes reinvestment of dividends and capital gains distributions. Performance is for the Fund’s Class A shares at net asset value and does not include the Fund’s maximum front-end sales charge of 4.75%—had it been included, the Fund’s return would have been lower. The Fund also offers Class B, Class C, Class I and Class R shares, the performance of which may vary. Source: State Street Corporation and Lipper, Inc.
Calamos Growth Fund
GROWTH OF $10,000: FOR THE 10-YEAR PERIOD ENDED 4/30/15
AVERAGE ANNUAL TOTAL RETURN† AS OF 4/30/15
| | | | | | | | | | | | | | | | |
| | | 6
MONTHS | | | 1
YEAR | | | 5
YEARS | | | 10 YEARS
OR ^SINCE
INCEPTION | |
Class A Shares – Inception 9/4/90 | | | | | | | | | | | | | | | | |
Without Sales Charge | | | 6.27 | % | | | 16.75 | % | | | 11.34 | % | | | 7.67 | % |
With Sales Charge | | | 1.23 | | | | 11.19 | | | | 10.26 | | | | 7.15 | |
Class B Shares – Inception 9/11/00 | | | | | | | | | | | | | | | | |
Without Sales Charge | | | 5.89 | | | | 15.87 | | | | 10.51 | | | | 7.03 | |
With Sales Charge | | | 1.70 | | | | 11.29 | | | | 10.28 | | | | 7.03 | |
Class C Shares – Inception 9/3/96 | | | | | | | | | | | | | | | | |
Without Sales Charge | | | 5.90 | | | | 15.89 | | | | 10.51 | | | | 6.87 | |
With Sales Charge | | | 5.10 | | | | 15.01 | | | | 10.51 | | | | 6.87 | |
Class I Shares – Inception 9/18/97 | | | 6.40 | | | | 17.03 | | | | 11.62 | | | | 7.94 | |
Class R Shares – Inception 3/1/07 | | | 6.15 | | | | 16.46 | | | | 11.06 | | | | 6.40 | ^ |
Performance data quoted represents past performance, which is no guarantee of future results. Current performance may be lower or higher than the performance quoted. The principal value and investment return of an investment will fluctuate so that your shares, when redeemed, may be worth more or less than their original cost.
As of the prospectus dated 3/1/15, the Fund’s gross expense ratio for Class A shares is 1.29%; Class B and C shares is 2.04%; Class I shares is 1.04%; Class R shares is 1.54%.
| † | Average annual total return measures net investment income and capital gain or loss from portfolio investments as an annualized average assuming reinvestment of dividends and capital gains distributions. Load-adjusted returns are adjusted for the maximum front-end sales load of 4.75% for Class A shares and returns for Class B and C have been adjusted for the contingent deferred sales charge (CDSC). |
NOTES:
The graphs do not reflect the income taxes that you would pay on fund distributions or the redemption of fund shares. Fund performance includes reinvestment of dividends and adjustment for the maximum sales charge for Class A shares. The performance of other classes will vary from the performance of the class shown based on the difference in sales charges and fees paid by shareholders investing in different share classes.
The Russell 3000® Growth Index measures the performance of companies with higher price-to-book ratios and higher forecasted growth values. Index data shown for the Annualized Return Since Inception graph is from 8/31/90, since comparative index data is only available for full monthly periods. Source: Lipper, Inc.
The S&P 500 Index is an unmanaged index generally considered representative of the U.S. stock market. Index data shown for the Annualized Return Since Inception graph is from 8/31/90, since comparative index data is only available for full monthly periods. Source: Lipper, Inc.
The Russell Midcap® Growth Index measures the performance of mid-sized companies with growth characteristics. Index data shown for the Annualized Return Since Inception graph is from 8/31/90, since comparative index data is only available for full monthly periods. Source: Lipper, Inc.
Morningstar Large Growth category funds invest primarily in big U.S. companies that are projected to grow faster than other large-cap stocks. Stocks in the top 70% of the capitalization of the U.S. equity market are defined as large cap. Growth is defined based on fast growth (high growth rates for earnings, sales, book value, and cash flow) and high valuations (high price ratios and low dividend yields). Most of these funds focus on companies in rapidly expanding industries.
Index returns assume reinvestment of dividends and do not reflect deduction of fees and expenses. It is not possible to invest directly in an index.
| | | | |
| 6 | | CALAMOS OPEN-END FAMILY OF FUNDS SEMIANNUAL REPORT | | |
Calamos Opportunistic Value Fund
CALAMOS OPPORTUNISTIC VALUE FUND
INVESTMENT TEAM DISCUSSION
How has the Fund performed?
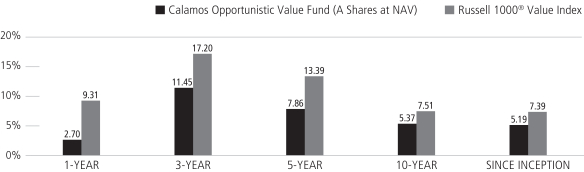
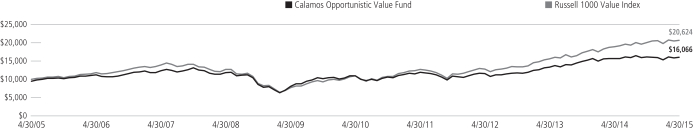
For the six-month period ended April 30, 2015, the Fund dipped 0.10% (Class A shares at net asset value) versus a 2.89% gain for the Russell 1000 Value Index.
This core value equity option invests in U.S. companies that we believe are undervalued according to certain financial measurements of their intrinsic values. We focus on companies with higher-quality attributes, such as high margins and cash flow growth, with reasonable stock prices. Our goal is to purchase companies that are battered but not broken, with potential catalysts to lead their stock prices higher.
Since its inception on January 2, 2002, the Fund has returned 5.19% on an annualized basis (Class A shares at net asset value) versus 7.39% for the Russell 1000 Value Index.
What factors influenced performance?
An overweight to and stock selection in consumer discretionary contributed to returns in the period. Holdings within both the movies and entertainment industry and the auto parts and equipment industry posted especially strong gains. Selection within consumer staples added to performance. Specifically, holdings within the drug retail and tobacco industries contributed to return.
The Fund’s average overweight to energy detracted from return, as this was the worst-performing sector during the period. We gradually reduced the Fund’s energy allocation throughout the time period and finished at a slight underweight. Although the Fund’s overweight to health care added value, stock selection, specifically holdings within health care services and pharmaceuticals, underperformed.
How is the Fund positioned?
The Fund seeks to identify attractively valued out of favor stocks or mispriced companies with good future business prospects. In essence, the Fund’s positioning reflects good businesses trading at value prices.
We continue to actively manage our sector exposures in conjunction with our fundamental, bottom-up research. Our research points us toward opportunities within the financials and health care sectors, and the Fund is positioned as such. Among selected changes in the period, we added to the Fund’s weights in the utilities, information technology and industrials sectors. These moves were made in part to bring underweight allocations up to market-equivalent levels within the respective sectors. In the case of technology, however, we moved to a slight overweight stance given attractive prospects within the sector. From a bottom-up perspective, we added holdings in response to improving fundamentals and favorable valuations as well as security-specific factors, such as attractive future business prospects. On the flipside, Fund positioning was reduced within the energy sector. We sold companies marked by declining profitability, deteriorating fundamentals and valuation concerns. Broadly, these moves were made to reduce a large overweight allocation to a slight underweight stance.
OVERVIEW
The Fund invests in the equities of small, midsize and large U.S. companies that we believe are undervalued according to certain financial measurements of their intrinsic values.
KEY FEATURES
| | ¡ | | Bottom-up stock picking and benchmark agnostic approach with a focus on good businesses with solid cash flow trading at value prices | |
| | ¡ | | Trading focus where positions are frequently monitored, investment assumptions are often questioned, and losing investments are quickly sold to protect capital | |
| | ¡ | | Options strategies to potentially generate income and lower risk | |
PORTFOLIO FIT
The Fund is a core value equity option that may balance a growth allocation and complement other value strategies. Our flexibility in analyzing all companies regardless of sector helps us avoid the cyclicality inherent in a deep value strategy or a momentum growth strategy over full market cycles.
| | |
| FUND NASDAQ SYMBOLS |
A Shares | | CVAAX |
B Shares | | CVABX |
C Shares | | CVACX |
I Shares | | CVAIX |
R Shares | | CVARX |
| |
|
| FUND CUSIP NUMBERS |
A Shares | | 128119666 |
B Shares | | 128119658 |
C Shares | | 128119641 |
I Shares | | 128119633 |
R Shares | | 128119419 |
| | | |
Calamos Opportunistic Value Fund
| | | | |
| SECTOR WEIGHTINGS | |
Financials | | | 29.4 | % |
Health Care | | | 15.0 | |
Energy | | | 10.6 | |
Information Technology | | | 10.0 | |
Industrials | | | 9.7 | |
Consumer Discretionary | | | 7.0 | |
Consumer Staples | | | 7.0 | |
Utilities | | | 5.3 | |
Materials | | | 2.9 | |
Telecommunication Services | | | 2.0 | |
Sector weightings are subject to change daily and are calculated as a percentage of net assets. The table excludes cash or cash equivalents, any government/sovereign bonds or broad based index hedging securities the Fund may hold.
What closing thoughts do you have for Fund shareholders?
With the Fed likely to hold off raising interest rates until later this year, we believe stock prices should continue their upward trend, while also experiencing periodic bouts of volatility. With earnings yields still far in excess of long-term borrowing costs, it’s our belief that record merger and acquisition and buyback activity will likely continue. We remain bullish on equities, where valuations remain attractive on a number of our favored measures. We believe we are in an environment supported by low inflation, high cash levels and high innovation. We feel our use of both cyclical and secular themes is appropriate and continue to favor good businesses that may be out of favor or mispriced.
ANNUALIZED RETURN: SINCE INCEPTION (1/2/02) THROUGH 4/30/15
Performance data quoted represents past performance, which is no guarantee of future results. Current performance may be lower or higher than the performance quoted.
The principal value and investment return of an investment will fluctuate so that your shares, when redeemed, may be worth more or less than their original cost. You can obtain performance data current to the most recent month end by visiting www.calamos.com. Average annual total return measures net investment income and capital gain or loss from portfolio investments as an annualized average. All performance shown assumes reinvestment of dividends and capital gains distributions. Performance is for the Fund’s Class A shares at net asset value and does not include the Fund’s maximum front-end sales charge of 4.75%—had it been included, the Fund’s return would have been lower. The Fund also offers Class B, Class C, Class I and Class R shares, the performance of which may vary. Performance shown reflects an expense reimbursement that improved results. Source: State Street Corporation and Lipper, Inc.
| | | | |
| 8 | | CALAMOS OPEN-END FAMILY OF FUNDS SEMIANNUAL REPORT | | |
Calamos Opportunistic Value Fund
GROWTH OF $10,000: FOR THE 10-YEAR PERIOD ENDED 4/30/15
AVERAGE ANNUAL TOTAL RETURN† AS OF 4/30/15
| | | | | | | | | | | | | | | | | | | | |
| | | 6
MONTHS | | 1
YEAR | | 5
YEARS | | 10 YEARS
OR ^SINCE
INCEPTION |
Class A Shares – Inception 1/2/02 | | | | | | | | | | | | | | | | | | | | |
Without Sales Charge | | | | -0.10 | % | | | | 2.70 | % | | | | 7.86 | % | | | | 5.37 | % |
With Sales Charge | | | | -4.83 | | | | | -2.17 | | | | | 6.81 | | | | | 4.86 | |
Class B Shares – Inception 1/2/02 | | | | | | | | | | | | | | | | | | | | |
Without Sales Charge | | | | -0.41 | | | | | 1.93 | | | | | 7.06 | | | | | 4.73 | |
With Sales Charge | | | | -5.03 | | | | | -2.80 | | | | | 6.75 | | | | | 4.73 | |
Class C Shares – Inception 1/2/02 | | | | | | | | | | | | | | | | | | | | |
Without Sales Charge | | | | -0.43 | | | | | 1.94 | | | | | 7.07 | | | | | 4.58 | |
With Sales Charge | | | | -1.35 | | | | | 0.99 | | | | | 7.07 | | | | | 4.58 | |
Class I Shares – Inception 3/1/02 | | | | 0.03 | | | | | 2.89 | | | | | 8.12 | | | | | 5.63 | |
Class R Shares – Inception 3/1/07 | | | | -0.18 | | | | | 2.43 | | | | | 7.60 | | | | | 3.58 | ^ |
Performance data quoted represents past performance, which is no guarantee of future results. Current performance may be lower or higher than the performance quoted. The principal value and investment return of an investment will fluctuate so that your shares, when redeemed, may be worth more or less than their original cost.
As of the prospectus dated 3/1/15, the Fund’s gross expense ratio for Class A shares is 1.50%; Class B and C shares is 2.25%; Class I shares is 1.25%; Class R shares is 1.75%. The Fund’s investment advisor has contractually agreed to reimburse Fund expenses through March 1, 2017, to the extent necessary so that Total Annual Fund Operating Expenses (excluding taxes, interest, short interest, short dividend expenses, brokerage commissions, acquired fund fees and expenses, and extraordinary expenses, if any) of Class A, Class B, Class C, Class I and Class R are limited to 1.15%, 1.90%, 1.90%, 0.90% and 1.40% of average net assets, respectively.
| † | Average annual total return measures net investment income and capital gain or loss from portfolio investments as an annualized average assuming reinvestment of dividends and capital gains distributions. Load-adjusted returns are adjusted for the maximum front-end sales load of 4.75% for Class A shares and returns for Class B and C shares have been adjusted for the contingent deferred sales charge (CDSC). |
NOTES:
The graphs do not reflect the income taxes that you would pay on fund distributions or the redemption of fund shares. Fund performance includes reinvestment of dividends and adjustment for the maximum sales charge for Class A shares. The performance of other classes will vary from the performance of the class shown based on the difference in sales charges and fees paid by shareholders investing in different share classes.
The Russell 1000® Value Index measures the performance of those companies in the Russell 1000® Index with lower price-to-book ratios and lower forecasted growth values. Index data shown for the Annualized Return Since Inception graph is from 12/31/01, since comparative index data is only available for full monthly periods. Source: Lipper, Inc.
Index returns assume reinvestment of dividends and do not reflect deduction of fees and expenses. It is not possible to invest directly in an index.
Calamos Focus Growth Fund
OVERVIEW
The Fund invests in a select portfolio of equities issued by “blue chip” U.S. companies that offer opportunities for growth.
KEY FEATURES
| | ¡ | | Active management utilizing over 20 years of extensive research experience in growth investing | |
| | ¡ | | A compact portfolio consisting of only those large cap stocks in which we have the greatest confidence of sustained growth | |
| | ¡ | | Stress company fundamentals, including global presence, strong and/or accelerated earnings growth, and solid returns on invested capital | |
PORTFOLIO FIT
The Fund is a core growth equity allocation option centered on a compact portfolio of large cap stocks.
| | |
| FUND NASDAQ SYMBOLS |
A Shares | | CBCAX |
B Shares | | CBCBX |
C Shares | | CBXCX |
I Shares | | CBCIX |
R Shares | | CBCRX |
| | | |
|
| FUND CUSIP NUMBERS |
A Shares | | 128119625 |
B Shares | | 128119617 |
C Shares | | 128119591 |
I Shares | | 128119583 |
R Shares | | 128119427 |
| | | |
CALAMOS FOCUS GROWTH FUND
INVESTMENT TEAM DISCUSSION
How has the Fund performed?
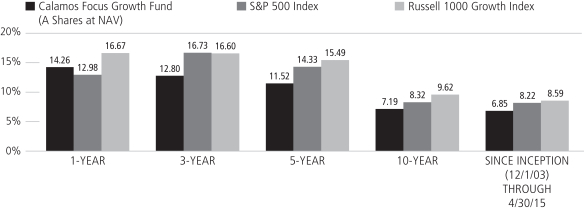
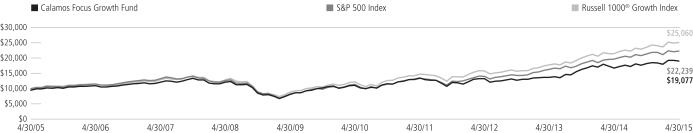
For the six-month period ended April 30, 2015, the Fund returned 5.10% (Class A shares at net asset value) versus the S&P 500 Index gain of 4.40% and the Russell 1000 Growth Index increase of 6.54%.
The Fund performed well on an absolute basis and outperformed the broad equity market, although it did not capture the full strength of the growth equity market. We remain especially bullish on growth stocks as we believe earnings growth remains solidly positive and corporate earnings will continue to expand. We feel we have entered a growth regime, and recent market performance has aligned with our view. In the first quarter, growth stocks led value by 460 basis points, a spread not seen since the first quarter of 2009.
Since its inception on December 1, 2003, the Fund has returned 6.85% on an annualized basis (Class A shares at net asset value) versus a return of 8.22% for the S&P 500 Index and an 8.59% return for the Russell 1000 Growth Index.
What factors influenced performance?
The U.S. equity market continues to be buoyed by solid corporate performance, benign inflation and the prospect of a slower path to interest rate increases. Our use of both cyclical and secular themes supports our stance that we are in the mid-stages of the business cycle, and this approach worked well for the Fund during the period.
In terms of economic sectors, selection in financials contributed to relative performance. Holdings in the asset management, custody banks and regional banks industries were especially strong. Selection in the consumer staples sector also added value. In particular, holdings within the tobacco industry and the packaged foods and meats industry contributed to performance.
Although the Fund’s overweight to consumer discretionary was positive, selection held back relative performance. Further, selection in health care hampered performance. Specifically, holdings within the health care equipment industry and life sciences tools and services industry underperformed. That said, we continue to seek growth opportunities based on new and modernized technologies in these industries. From a risk-management standpoint, we are mindful of the U.S. health care system’s changing dynamics and the potential impact of new regulations on current and future holdings.
How is the Fund positioned?
This large cap growth equity Fund invests in a more concentrated portfolio of common stocks. The Fund seeks to invest in U.S. companies that we believe have the best prospects for sustainable and high relative growth. The portfolio aims to participate in long-term growth trends by focusing on companies with solid fundamentals, global brands, strong growth catalysts and attractive valuations.
We continue to actively manage our sector exposures in conjunction with our fundamental, bottom-up research. Our research points us to opportunities within the technology, consumer discretionary and health care sectors, and the Fund is positioned
| | | | |
| 10 | | CALAMOS OPEN-END FAMILY OF FUNDS SEMIANNUAL REPORT | | |
Calamos Focus Growth Fund
as such. We added to the portfolio’s weight in the consumer staples sector by virtue of improving fundamentals and growth prospects, attractive valuations, as well as security-specific factors. For example, we added names from the tobacco, packaged foods and meats and food retail industries. We also modestly boosted the Fund’s health care allocation in the period. On the other hand, we reduced the Fund’s industrials position, selling across a number of industries, such as electrical components and equipment, construction machinery and heavy trucks, and aerospace and defense. The Fund’s weighting within consumer discretionary was also dialed back, as we selectively sold companies marked by declining growth catalysts, deteriorating fundamentals and valuation concerns.
At period end, the Fund’s largest allocations in absolute terms spanned the information technology and consumer discretionary sectors. Relative to the Russell 1000 Growth Index, the portfolio’s largest overweight was in the financials sector, and its largest underweight was in materials.
What closing thoughts do you have for Fund shareholders?
With the Fed likely to hold off on raising interest rates until later this year, we believe stock prices should continue their upward trend, though experiencing periodic bouts of volatility. With earnings yields still far in excess of long-term borrowing costs, it’s our belief that record merger and acquisition and buyback activity will likely continue. We remain bullish on equities, and particularly growth equities, where valuations remain attractive on a number of our favored measures. We favor companies with strong growth catalysts, improving fundamentals and solid balance sheets. That mindset leads us to favor the information technology, consumer discretionary and health care sectors, while we remain underweight to materials, utilities and telecommunication services.
| | | | |
| SECTOR WEIGHTINGS | |
Information Technology | | | 28.8 | % |
Consumer Discretionary | | | 19.0 | |
Health Care | | | 14.7 | |
Consumer Staples | | | 10.4 | |
Financials | | | 9.4 | |
Industrials | | | 8.3 | |
Energy | | | 5.1 | |
Telecommunication Services | | | 1.0 | |
Sector weightings are subject to change daily and are calculated as a percentage of net assets. The table excludes cash or cash equivalents, any government/sovereign bonds or broad based index hedging securities the Fund may hold.
ANNUALIZED RETURN: SINCE INCEPTION (12/1/03) THROUGH 4/30/15
Performance data quoted represents past performance, which is no guarantee of future results. Current performance may be lower or higher than the performance quoted.
The principal value and investment return of an investment will fluctuate so that your shares, when redeemed, may be worth more or less than their original cost. You can obtain performance data current to the most recent month end by visiting www.calamos.com. Average annual total return measures net investment income and capital gain or loss from portfolio investments as an annualized average. All performance shown assumes reinvestment of dividends and capital gains distributions. Performance is for the Fund’s Class A shares at net asset value and does not include the Fund’s maximum front-end sales charge of 4.75%—had it been included, the Fund’s return would have been lower. The Fund also offers Class B, Class C, Class I and Class R shares, the performance of which may vary. Performance shown reflects an expense reimbursement that improved results. Source: State Street Corporation and Lipper, Inc.
Calamos Focus Growth Fund
GROWTH OF $10,000: FOR THE 10-YEAR PERIOD ENDED 4/30/15
AVERAGE ANNUAL TOTAL RETURN† AS OF 4/30/15
| | | | | | | | | | | | | | | | |
| | | 6
MONTHS | | | 1
YEAR | | | 5
YEARS | | | 10 YEARS
OR ^SINCE
INCEPTION | |
Class A Shares – Inception 12/1/03 | | | | | | | | | | | | | | | | |
Without Sales Charge | | | 5.10 | % | | | 14.26 | % | | | 11.52 | % | | | 7.19 | % |
With Sales Charge | | | 0.09 | | | | 8.85 | | | | 10.44 | | | | 6.67 | |
Class B Shares – Inception 12/1/03 | | | | | | | | | | | | | | | | |
Without Sales Charge | | | 4.66 | | | | 13.38 | | | | 10.69 | | | | 6.55 | |
With Sales Charge | | | -0.03 | | | | 8.38 | | | | 10.43 | | | | 6.55 | |
Class C Shares – Inception 12/1/03 | | | | | | | | | | | | | | | | |
Without Sales Charge | | | 4.72 | | | | 13.38 | | | | 10.69 | | | | 6.39 | |
With Sales Charge | | | 3.78 | | | | 12.38 | | | | 10.69 | | | | 6.39 | |
Class I Shares – Inception 12/1/03 | | | 5.22 | | | | 14.49 | | | | 11.80 | | | | 7.46 | |
Class R Shares – Inception 3/1/07 | | | 5.00 | | | | 13.94 | | | | 11.24 | | | | 6.08 | ^ |
Performance data quoted represents past performance, which is no guarantee of future results. Current performance may be lower or higher than the performance quoted. The principal value and investment return of an investment will fluctuate so that your shares, when redeemed, may be worth more or less than their original cost.
As of the prospectus dated 3/1/15, the Fund’s gross expense ratio for Class A shares is 1.56%; Class B and C shares is 2.31%; Class I shares is 1.31%; Class R shares is 1.81%. The Fund’s investment advisor has contractually agreed to reimburse Fund expenses through March 1, 2017 to the extent necessary so that Total Annual Fund Operating Expenses (excluding taxes, interest, short interest, short dividend expenses, brokerage commissions, acquired fund fees and expenses, and extraordinary expenses, if any) of Class A, Class B, Class C, Class I and Class R are limited to 1.15%, 1.90%, 1.90%, 0.90% and 1.40% of average net assets, respectively.
| † | Average annual total return measures net investment income and capital gain or loss from portfolio investments as an annualized average assuming reinvestment of dividends and capital gains distributions. Load-adjusted returns are adjusted for the maximum front-end sales load of 4.75% for Class A shares and returns for Class B and C shares have been adjusted for the contingent deferred sales charge (CDSC). |
NOTES:
The graphs do not reflect the income taxes that you would pay on fund distributions or the redemption of fund shares. Fund performance includes reinvestment of dividends and adjustment for the maximum sales charge for Class A shares. The performance of other classes will vary from the performance of the class shown based on the difference in sales charges and fees paid by shareholders investing in different share classes.
The S&P 500 Index is an unmanaged index generally considered representative of the U.S. stock market. Index data shown for the Since Inception Growth of $10,000 graph is from 11/30/03, since comparative index data is only available for full monthly periods. Source: Lipper, Inc.
The Russell 1000® Growth Index measures the performance of the large-cap growth segment of the U.S. equity universe. It includes those Russell 1000 companies with higher price to-book ratios and higher forecasted growth values. Index data shown for the Since Inception Growth of $10,000 graph is from 11/30/03, since comparative index data is only available for full monthly periods. Source: Lipper, Inc.
Index returns assume reinvestment of dividends and do not reflect deduction of fees and expenses. It is not possible to invest directly in an index.
| | | | |
| 12 | | CALAMOS OPEN-END FAMILY OF FUNDS SEMIANNUAL REPORT | | |
Calamos Discovery Growth Fund
CALAMOS DISCOVERY GROWTH FUND
INVESTMENT TEAM DISCUSSION
How has the Fund performed?
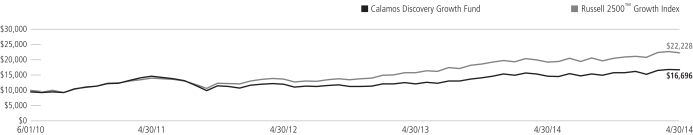
For the six-month period ended April 30, 2015, the Fund returned 5.72% (Class A shares at net asset value) versus an 8.31% gain for the Russell 2500 Growth Index. Although sector allocations added value to the Fund, stock selection detracted markedly, especially within health care and financials.
Growth stocks performed strongly and outperformed value during the period, and we believe we are in a growth regime similar to 1995 – 1999. We think growth stocks can perform well as earnings growth slows but remains solidly positive and corporate earnings continue to expand.
Since its inception on June 1, 2010, the Fund has returned 12.10% on an annualized basis (Class A shares at net asset value) versus a return of 18.28% for the Russell 2500 Growth Index.
What factors influenced performance?
Stock selection within industrials contributed to return in the period. Holdings in the industrial machinery, building products, and construction machinery and heavy trucks industries posted especially strong gains. An overweight allocation and selection within the information technology sector added value. In particular, Internet software and services holdings contributed to performance. We continue to own a larger relative weight to information technology because of attractive fundamentals, including the potential for strong earnings growth and cash flow. We believe the Fund’s tech holdings are well positioned to benefit from key secular themes, including innovation in mobility and connectivity, social media and e-commerce, and demand for productivity enhancements. Despite choppy global growth conditions, many of these businesses are capable of delivering strong revenue and earnings growth, capitalizing on synergistic product cycles and high-growth end markets.
Although the Fund’s overweight to health care was positive, selection within health care equipment underperformed. Portfolio selection within financials also hampered performance although our underweight to the sector helped partly offset the underperformance of individual stocks.
How is the Fund positioned?
The Fund offers a diversified way to participate in the long-term growth potential of small and mid-cap equities. We seek to invest in U.S. companies that we believe offer the best prospects for sustainable and high relative appreciation. The Fund aims to engage in long-term growth trends by focusing on companies with solid fundamentals, global brands, strong growth catalysts and attractive valuations.
The Fund is positioned to reflect our positive long-term outlook for equities. We believe a combination of secular and cyclical growth holdings is appropriate, given our view that we are in the mid-part of the business cycle with low inflation and moderate global growth. We are emphasizing small to mid-cap companies with sound growth fundamentals, increasing returns on invested capital and attractive valuations.
OVERVIEW
The Fund invests in small and midsize U.S. companies that we believe offer the best potential for growth.
KEY FEATURES
| | ¡ | | Bottom-up stock selection based on a combination of quantative and fundamental research drivers | |
| | ¡ | | In-depth research can add significant value in the inefficient small- and mid-cap market | |
| | ¡ | | Risk management and portfolio construction are central to the process, seeking greater risk-adjusted returns over full market cycles | |
PORTFOLIO FIT
The Fund is a SMID cap growth equity allocation option.
| | |
| FUND NASDAQ SYMBOLS |
A Shares | | CADGX |
B Shares | | CBDGX |
C Shares | | CCDGX |
I Shares | | CIDGX |
R Shares | | CRDGX |
| | | |
|
| FUND CUSIP NUMBERS |
A Shares | | 128120102 |
B Shares | | 128120201 |
C Shares | | 128120300 |
I Shares | | 128120409 |
R Shares | | 128120508 |
| | | |
Calamos Discovery Growth Fund
| | | | |
| SECTOR WEIGHTINGS | |
Information Technology | | | 24.3 | % |
Health Care | | | 22.4 | |
Consumer Discretionary | | | 17.5 | |
Industrials | | | 12.6 | |
Financials | | | 6.6 | |
Energy | | | 4.2 | |
Materials | | | 2.6 | |
Consumer Staples | | | 0.6 | |
Sector weightings are subject to change daily and are calculated as a percentage of net assets. The table excludes cash or cash equivalents, any government/sovereign bonds or broad based index hedging securities the Fund may hold.
We continue to actively manage our sector exposures in conjunction with our fundamental, bottom-up research. Our research points us to opportunities within the technology, consumer discretionary and health care sectors, and the Fund is positioned as such. Overall, changes to sector weights were modest during the period. By virtue of improving fundamentals and growth prospects as well as security-specific factors, we added to the Fund’s weight in the health care sector. For example, we added select holdings from the health care supplies, biotechnology and health care facilities industries. We also modestly increased the weighting to the energy sector. Conversely, we reduced the Fund’s stake within the industrials sector, selling companies susceptible to declining growth catalysts, deteriorating fundamentals and valuation concerns.
At period end, the fund’s largest allocations in absolute terms spanned the information technology and health care sectors. Relative to the Russell 2500 Growth Index, the Fund’s largest overweight went to the health care sector, and its largest underweights went to materials and industrials.
What closing thoughts do you have for Fund shareholders?
With the Fed likely to hold off on raising interest rates until later this year, we believe stock prices should continue their upward trend, though experiencing periodic bouts of volatility. With earnings yields still far in excess of long-term borrowing costs, it’s our belief that record merger and acquisition and buyback activity will likely continue. We feel our use of both cyclical and secular themes is appropriate, given our stance that we are in the mid-stages of the business cycle. We favor companies with strong growth catalysts, improving fundamentals and solid balance sheets that we believe will prosper in this growth environment.
| | | | |
| 14 | | CALAMOS OPEN-END FAMILY OF FUNDS SEMIANNUAL REPORT | | |
Calamos Discovery Growth Fund
GROWTH OF $10,000: SINCE INCEPTION (6/1/10) THROUGH 4/30/15
AVERAGE ANNUAL TOTAL RETURN† AS OF 4/30/15
| | | | | | | | | | | | |
| | | 6
MONTHS | | | 1
YEAR | | | SINCE
INCEPTION | |
Class A Shares – Inception 6/1/2010 | | | | | | | | | | | | |
Without Sales Charge | | | 5.72 | % | | | 14.25 | % | | | 12.10 | % |
With Sales Charge | | | 0.73 | | | | 8.83 | | | | 10.99 | |
Class B Shares – Inception 6/1/2010 | | | | | | | | | | | | |
Without Sales Charge | | | 5.40 | | | | 13.44 | | | | 11.29 | |
With Sales Charge | | | 0.64 | | | | 8.44 | | | | 11.02 | |
Class C Shares – Inception 6/1/2010 | | | | | | | | | | | | |
Without Sales Charge | | | 5.32 | | | | 13.35 | | | | 11.27 | |
With Sales Charge | | | 4.37 | | | | 12.35 | | | | 11.27 | |
Class I Shares – Inception 6/1/2010 | | | 5.87 | | | | 14.56 | | | | 12.39 | |
Class R Shares – Inception 6/1/2010 | | | 5.56 | | | | 13.92 | | | | 11.82 | |
Performance data quoted represents past performance, which is no guarantee of future results. Current performance may be lower or higher than the performance quoted. The principal value and investment return of an investment will fluctuate so that your shares, when redeemed, may be worth more or less than their original cost. You can obtain performance data current to the most recent month end by visiting www.calamos.com.
As of the prospectus dated 3/1/15, the Fund’s gross expense ratio for Class A shares is 1.63%; Class B is 2.38% and Class C shares is 2.38%; Class I shares is 1.38%; Class R shares is 1.88%. The Fund’s investment advisor has contractually agreed to reimburse Fund expenses through March 31, 2017, to the extent necessary so that Total Annual Fund Operating Expenses (excluding taxes, interest, short interest, short dividend expenses, brokerage commissions, acquired fund fees and expenses, and extraordinary expenses, if any) of Class A, Class B, Class C, Class I and Class R are limited to 1.50%, 2.25%, 2.25%, 1.25% and 1.75% of average net assets, respectively.
| † | Average annual total return measures net investment income and capital gain or loss from portfolio investments as an annualized average assuming reinvestment of dividends and capital gains distributions. Load-adjusted returns are adjusted for the maximum front-end sales load of 4.75% for Class A shares and returns for Class B and C shares have been adjusted for the contingent deferred sales charge (CDSC). |
NOTES:
The graph does not reflect the income taxes you would pay on fund distributions or the redemption of fund shares. Fund performance includes reinvestment of dividends and adjustment for the maximum sales charge for Class A shares. The performance of other classes will vary from the performance of the class shown based on the difference in sales charges and fees paid by shareholders investing in different share classes.
The Russell 2500™ Growth Index measures the performance of the small- to mid-cap growth segment of the U.S. equity universe. It includes those Russell 2500 companies with higher price-to-book ratios and higher forecasted growth values. Source: Lipper, Inc.
Index returns assume reinvestments of dividends and do not reflect deduction of fees and expenses. It is not possible to invest directly in an index.
Calamos Dividend Growth Fund
OVERVIEW
The Fund invests in companies that we believe have an ability to increase dividend over time, either through increasing profits or more efficient use of capital.
KEY FEATURES
| | ¡ | | Bottom-up stock picking and benchmark agnostic approach with a focus on good businesses with solid cash flow trading at value prices | |
| | ¡ | | Trading focus where positions are frequently monitored, investment assumptions are often questioned, and losing investments are quickly sold to protect capital | |
| | ¡ | | Options strategies to potentially generate income and lower risk | |
PORTFOLIO FIT
The Fund may be suitable for investors seeking a regular stream of income and dividend-paying equity investments that tend to be less volatile than non-dividend payers.
| | |
| FUND NASDAQ SYMBOLS |
A Shares | | CADVX |
C Shares | | CCDVX |
I Shares | | CIDVX |
R Shares | | CRDVX |
|
| FUND CUSIP NUMBERS |
A Shares | | 128120839 |
C Shares | | 128120821 |
I Shares | | 128120813 |
R Shares | | 128120797 |
CALAMOS DIVIDEND GROWTH FUND
INVESTMENT TEAM DISCUSSION
How has the Fund performed?
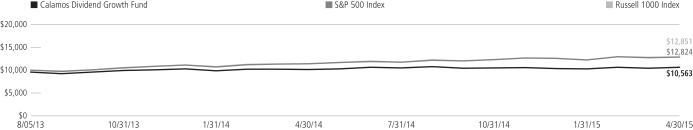
For the six-month period ended April 30, 2015, the Fund returned 0.88% (Class A shares at net asset value) versus a 4.40% gain for the S&P 500 Index and a 4.75% gain for the Russell 1000 Index.
Overall sector positioning and allocations within the fund detracted the most from performance in the period. The portfolio was rebalanced during the period to include companies that we believe can deliver higher dividends over time, either through increasing profits or more efficient use of capital. We believe dividend-paying companies can not only help provide income in a portfolio, but may do so while also delivering the potential for both lower volatility and better risk-adjusted performance than companies that don’t pay dividends.
Since its inception on August 5, 2013, the Fund gained 6.14% on an annualized basis (Class A shares at net asset value) versus returns of 14.55% for the S&P 500 Index and 14.64% for the Russell 1000 Index.
What factors influenced performance?
The Fund’s average overweight to energy detracted from return, as this was the worst-performing sector during the period. Specifically, an overweight allocation to the oil-and-gas storage and transportation industry hurt. We gradually reduced the Fund’s energy allocation throughout the time period and finished at a slight underweight.
An underweight stance and lagging selection within the consumer discretionary sector also hampered performance. In particular, automobile manufacturers and the hotels, resorts and cruise lines industry weighed on results. An underweight position and selection within health care detracted. Specifically, positioning and holdings within the pharmaceuticals, health care equipment, and managed health care industries underperformed.
Selection within consumer staples added to performance. Specifically, holdings within the drug retail and tobacco industries contributed to return. Selection in financials also contributed to relative return. Holdings in the asset management, custody banks and regional banks industries posted especially strong gains.
How is the Fund positioned?
The Fund’s investments reflect our positive long-term outlook for equities. We are emphasizing dividend-paying companies with sound fundamentals and attractive valuations. As stated earlier, we seek companies that have an ability to increase dividends over time, either through increasing profits or more efficient use of capital.
We continue to actively manage our sector exposures in conjunction with our fundamental, bottom-up research. Our research points us to opportunities within the technology, financials, health care and consumer discretionary sectors, and the Fund is positioned as such.
Among selected changes in the period, we added to the Fund’s allocations in the information technology, health care, consumer discretionary and industrials sectors. These moves were made to reduce underweight allocations and gravitate to a more
| | | | |
| 16 | | CALAMOS OPEN-END FAMILY OF FUNDS SEMIANNUAL REPORT | | |
Calamos Dividend Growth Fund
neutral stance within the respective sectors. From a bottom-up perspective, we added holdings based on improving fundamentals and attractive valuations as well as security-specific factors, such as increasing profitability. Conversely, Fund positioning was reduced within the financials and energy sectors. We sold companies marked by declining profitability, deteriorating fundamentals and valuation concerns. Broadly, these moves were made to reduce large overweight allocations and establish more sector-neutral positions.
The Fund’s largest allocations in absolute terms went to the financials and information technology sectors. Relative to the S&P 500 Index, the Fund’s largest overweight allocation went to the financials sector, and its largest underweight allocation went to consumer staples.
What closing thoughts do you have for Fund shareholders?
With the Fed likely to hold off raising interest rates until later this year, we believe stock prices should continue their upward trend, while also experiencing periodic bouts of volatility. With earnings yields still far in excess of long-term borrowing costs, it’s our belief that record merger and acquisition and buyback activity will likely continue. We remain bullish on equities, where valuations remain attractive on a number of our favored measures. We believe we are in an environment supported by low inflation, high cash levels and high innovation. We feel our use of both cyclical and secular themes is appropriate, given our stance that we are in the mid-stages of the business cycle. We favor companies with strong and improving fundamentals, solid balance sheets, and the ability to increase dividends over time. That mindset leads us to favor the information technology, financials and health care sectors, while we remain underweight to consumer staples and materials.
| | | | |
| SECTOR WEIGHTINGS | |
Information Technology | | | 18.9 | % |
Financials | | | 16.1 | |
Consumer Discretionary | | | 14.9 | |
Health Care | | | 14.3 | |
Industrials | | | 8.4 | |
Energy | | | 7.7 | |
Consumer Staples | | | 6.3 | |
Utilities | | | 3.9 | |
Telecommunication Services | | | 3.8 | |
Materials | | | 0.5 | |
Sector weightings are subject to change daily and are calculated as a percentage of net assets. The table excludes cash or cash equivalents, any government/sovereign bonds or broad based index hedging securities the Fund may hold.
Calamos Dividend Growth Fund
GROWTH OF $10,000: SINCE INCEPTION (8/5/13) THROUGH 4/30/15
AVERAGE ANNUAL TOTAL RETURN† AS OF 4/30/15
| | | | | | | | | | | | | | | |
| | | 6
MONTHS | | 1
YEAR | | SINCE
INCEPTION |
Class A Shares – Inception 8/5/2013 | | | | | | | | | | | | | | | |
Without Sales Charge | | | | 0.88 | % | | | | 4.52 | % | | | | 6.14 | % |
With Sales Charge | | | | -3.94 | | | | | -0.44 | | | | | 3.20 | |
Class C Shares – Inception 8/5/2013 | | | | | | | | | | | | | | | |
Without Sales Charge | | | | 0.42 | | | | | 3.69 | | | | | 5.33 | |
With Sales Charge | | | | -0.56 | | | | | 2.69 | | | | | 5.33 | |
Class I Shares – Inception 8/5/2013 | | | | 0.94 | | | | | 4.76 | | | | | 6.36 | |
Class R Shares – Inception 8/5/2013 | | | | 0.72 | | | | | 4.20 | | | | | 5.86 | |
Performance data quoted represents past performance, which is no guarantee of future results. Current performance may be lower or higher than the performance quoted. The principal value and investment return of an investment will fluctuate so that your shares, when redeemed, may be worth more or less than their original cost. You can obtain performance data current to the most recent month end by visiting www.calamos.com.
As of the prospectus dated 3/1/15, the Fund’s gross expense ratio for Class A shares is 1.74%; Class C shares is 2.45%; Class I shares is 1.49%; Class R shares is 1.98%. The Fund’s Investment Adviser has contractually agreed to reimburse Fund expenses through March 1, 2017 to the extent necessary so that Total Annual Fund Operating Expenses (excluding taxes, interest, short interest, short dividend expenses, brokerage commissions, acquired fund fees and expenses and extraordinary expenses, if any) of Class A, Class C, Class I and Class R are limited to 1.35%, 2.10%, 1.10% and 1.60% of average net assets, respectively. This agreement is not terminable by either party.
| † | Average annual total return measures net investment income and capital gain or loss from portfolio investments as an annualized average assuming reinvestment of dividends and capital gains distributions. Load-adjusted returns are adjusted for the maximum front-end sales load of 4.75% for Class A shares and C shares have been adjusted for the contingent deferred sales charge (CDSC). |
NOTES:
The graph does not reflect the income taxes that you would pay on fund distributions or the redemption of fund shares. Fund performance includes reinvestment of dividends and adjustment for the maximum sales charge for Class A shares. The performance of other classes will vary from the performance of the class shown based on the difference in sales charges and fees paid by shareholders investing in different share classes.
The S&P 500 Index is an unmanaged index generally considered representative of the U.S. stock market. Index data shown for the Annualized Return Since Inception graph is from 8/31/13, since comparative index data is only available for full monthly periods. Source: Lipper, Inc.
The Russell 1000 Index measures the performance of the large-cap segment of the U.S. equity universe. It is a subset of the Russell 3000 Index and includes approximately 1,000 of the largest securities based on a combination of their market cap and current index membership.
Index returns assume reinvestment of dividends and do not reflect deduction of fees and expenses. It is not possible to invest directly in an index.
| | | | |
| 18 | | CALAMOS OPEN-END FAMILY OF FUNDS SEMIANNUAL REPORT | | |
Calamos Mid Cap Growth Fund
CALAMOS MID CAP GROWTH FUND
INVESTMENT TEAM DISCUSSION
How has the Fund performed?
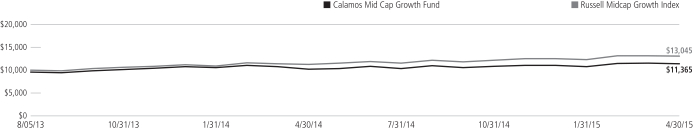
For the six-month period ended April 30, 2015, the Fund returned 5.02% (Class A shares at net asset value) versus a gain of 7.77% for the Russell Midcap Growth Index.
In this Fund, we selectively target mid-cap companies with established track records and strong revenue and earnings profiles relative to larger companies. While the Fund’s top-down allocations contributed to a strong period return, overall stock selection did not hold up to the benchmark’s return.
Since its inception on August 5, 2013, the Fund has returned 10.71% on an annualized basis (Class A shares at net asset value) versus a return of 15.17% for the Russell Midcap Growth Index.
What factors influenced performance?
Selection in financials contributed to relative performance. Holdings in the asset management, custody banks, regional banks and thrifts and mortgage finance industries posted especially strong gains. An overweight allocation and selection within the information technology sector added value as well. In particular, positioning and holdings within IT consulting and other services, and semiconductors contributed to performance. We continue to own a larger relative weight to information technology because of attractive fundamentals, including the potential for strong earnings growth and cash flow. We believe the Fund’s technology holdings are well positioned to benefit from key secular themes, including innovation in mobility and connectivity, social media and e-commerce, and demand for productivity enhancements. Despite choppy global growth conditions, many of these businesses are capable of delivering strong revenue and earnings growth, capitalizing on synergistic product cycles and high-growth end markets.
An underweight allocation and selection within the consumer discretionary sector detracted from return. Although the Fund’s overweight to health care was positive, selection within the health care equipment and pharmaceuticals industries underperformed.
How is the Fund positioned?
This Fund seeks to invest in midsized U.S. companies that we believe have the best prospects for sustainable and high relative growth. The Fund offers a diversified and active approach, and participates in long-term growth trends by focusing on companies with solid fundamentals, global brands, strong growth catalysts and attractive valuations.
Our investments reflect what we believe to be a positive long-term outlook for equities. We believe a combination of secular and cyclical growth holdings is appropriate, given our view that we are in the mid-part of the business cycle with low inflation and moderate global growth. We are emphasizing companies with sound growth fundamentals, increasing returns on invested capital and attractive valuations.
We continue to actively manage our sector exposures in conjunction with our fundamental, bottom-up research. Our research points us to opportunities within the information technology, consumer discretionary and health care sectors, and the Fund
OVERVIEW
The Fund invests primarily in equity securities issued by midsize U.S. companies that we believe offer the best opportunities for growth.
KEY FEATURES
| | ¡ | | Utilize more than two decades of extensive research experience in growth investing | |
| | ¡ | | Active management with a focus on top-down views and bottom-up fundamentals | |
| | ¡ | | Research-driven approach identifies opportunities by combining top-down analysis and a research focus on key growth characteristics | |
PORTFOLIO FIT
The Fund may be suitable for investors seeking to diversify equity allocations with a primarily mid cap growth strategy and add holdings in companies that historically have higher growth rates and returns than larger companies.
| | |
| FUND NASDAQ SYMBOLS |
A Shares | | CMXAX |
C Shares | | CMXCX |
I Shares | | CMXIX |
R Shares | | CMXRX |
|
| FUND CUSIP NUMBERS |
A Shares | | 128120870 |
C Shares | | 128120862 |
I Shares | | 128120854 |
R Shares | | 128120847 |
Calamos Mid Cap Growth Fund
| | | | |
| SECTOR WEIGHTINGS | |
Information Technology | | | 19.8 | % |
Consumer Discretionary | | | 19.8 | |
Health Care | | | 18.6 | |
Industrials | | | 13.9 | |
Financials | | | 10.1 | |
Energy | | | 3.8 | |
Consumer Staples | | | 3.3 | |
Materials | | | 1.4 | |
Sector weightings are subject to change daily and are calculated as a percentage of net assets. The table excludes cash or cash equivalents, any government/sovereign bonds or broad based index hedging securities the Fund may hold.
is positioned as such. Overall, changes to sector weights were modest during the period. We added to the consumer discretionary sector by virtue of improving fundamentals and growth prospects as well as security-specific factors. For example, we added names from the general merchandise stores, apparel, accessories and luxury goods, and restaurants industries. We also modestly dialed up the Fund’s allocation to health care in the period. Conversely, we lightened the Fund’s weight to the information technology sector by reducing holdings in the semiconductors, application software, and systems software industries. We also reduced the Fund’s exposure to energy where we sold companies susceptible to declining growth catalysts, deteriorating fundamentals and valuation concerns.
At period end, the fund’s largest allocations in absolute terms included the information technology and consumer discretionary sectors. Relative to the Russell Midcap Growth Index, the Fund’s largest overweight was in the health care sector, and its largest underweight was in consumer staples.
What closing thoughts do you have for Fund shareholders?
With the Fed likely to hold off on raising interest rates until later this year, we believe stock prices should continue their upward trend, though experiencing periodic bouts of volatility. With earnings yields still far in excess of long-term borrowing costs, it’s our belief that record merger and acquisition and buyback activity will likely continue. We remain bullish on equities, and particularly growth equities, where valuations remain attractive on a number of our favored measures. We believe we are in a growth regime (similar to 1995 – 1999), supported by low inflation, high cash levels and high innovation. We feel our use of both cyclical and secular themes is appropriate, given our stance that we are in the mid-stages of the business cycle. We favor companies with strong growth catalysts, improving fundamentals and solid balance sheets. That mindset leads us to favor the information technology, consumer discretionary and health care sectors, while we remain underweight to consumer staples and materials.
| | | | |
| 20 | | CALAMOS OPEN-END FAMILY OF FUNDS SEMIANNUAL REPORT | | |
Calamos Mid Cap Growth Fund
GROWTH OF $10,000: SINCE INCEPTION (8/5/13) THROUGH 4/30/15
AVERAGE ANNUAL TOTAL RETURN† AS OF 4/30/15
| | | | | | | | | | | | | | | |
| | | 6
MONTHS | | 1
YEAR | | SINCE
INCEPTION |
Class A Shares – Inception 8/5/2013 | | | | | | | | | | | | | | | |
Without Sales Charge | | | | 5.02 | % | | | | 11.60 | % | | | | 10.71 | % |
With Sales Charge | | | | 0.00 | | | | | 6.33 | | | | | 7.64 | |
Class C Shares – Inception 8/5/2013 | | | | | | | | | | | | | | | |
Without Sales Charge | | | | 4.62 | | | | | 10.82 | | | | | 9.89 | |
With Sales Charge | | | | 3.62 | | | | | 9.82 | | | | | 9.89 | |
Class I Shares – Inception 8/5/2013 | | | | 5.18 | | | | | 12.06 | | | | | 11.05 | |
Class R Shares – Inception 8/5/2013 | | | | 4.94 | | | | | 11.43 | | | | | 10.48 | |
Performance data quoted represents past performance, which is no guarantee of future results. Current performance may be lower or higher than the performance quoted. The principal value and investment return of an investment will fluctuate so that your shares, when redeemed, may be worth more or less than their original cost. You can obtain performance data current to the most recent month end by visiting www.calamos.com.
As of the prospectus dated 3/1/15, the Fund’s gross expense ratio for Class A shares is 1.69%; Class C shares is 2.42%; Class I shares is 1.47%; Class R shares is 1.98%. The Fund’s Investment Adviser has contractually agreed to reimburse the Fund expenses through March 1, 2017, to the extent necessary so that Total Annual Fund Operating Expenses (excluding taxes, interest, short interest, short dividend expenses, brokerage commissions, acquired funds fees and expenses and extraordinary expenses, if any) of Class A, Class C, Class I and Class R are limited to 1.25%, 2.00%, 1.00% and 1.50% of average net assets, respectively. This agreement is not terminable by either party.
| † | Average annual total return measures net investment income and capital gain or loss from portfolio investments as an annualized average assuming reinvestment of dividends and capital gains distributions. Load-adjusted returns are adjusted for the maximum front-end sales load of 4.75% for Class A shares and C shares have been adjusted for the contingent deferred sales charge (CDSC). |
NOTES:
The graph does not reflect the income taxes that you would pay on fund distributions or the redemption of fund shares. Fund performance includes reinvestment of dividends and adjustment for the maximum sales charge for Class A shares. The performance of other classes will vary from the performance of the class shown based on the difference in sales charges and fees paid by shareholders investing in different share classes.
The Russell Midcap Growth Index measures the performance of midcap growth companies.
Index returns assume reinvestment of dividends and do not reflect deduction of fees and expenses. It is not possible to invest directly in an index.
Calamos International Growth Fund
OVERVIEW
The Fund invests in non-U.S. growth companies, focusing on those firms demonstrating what we believe to be key growth characteristics, including increasing profit margins and high returns on invested capital.
KEY FEATURES
| | ¡ | | Focus on growth in an asset class that is mostly defined by core and value offerings | |
| | ¡ | | Stress company fundamentals, including global presence and strong and/or accelerating earnings growth | |
| | ¡ | | Investments driven by international sources of revenue for companies, not on location of headquarters | |
PORTFOLIO FIT
Only about 10% of international stock assets are currently invested in growth. The Fund stands as a potential growth-focused addition to a mostly core- or value-intensive international allocation.
| | |
| FUND NASDAQ SYMBOLS |
A Shares | | CIGRX |
B Shares | | CIGBX |
C Shares | | CIGCX |
I Shares | | CIGIX |
R Shares | | CIGFX |
| | | |
| |
| FUND CUSIP NUMBERS | | |
A Shares | | 128119575 |
B Shares | | 128119567 |
C Shares | | 128119559 |
I Shares | | 128119542 |
R Shares | | 128119393 |
| | | |
INTERNATIONAL GROWTH FUND
INVESTMENT TEAM DISCUSSION
How has the Fund performed?
For the six-month period ended April 30, 2015, the Fund gained 6.49% (Class A shares at net asset value) versus a gain of 7.48% for the MSCI ACWI ex-U.S. Growth Index and 8.51% for the MSCI EAFE Growth Index. While the Fund’s overall sector weights and regional allocations added value, trailing security selection caused the Fund to finish behind the index.
The Fund recently marked its 10-year anniversary with a top ranking for the period. As of April 30, the Fund’s I shares ranked #1 and the A shares ranked #2, both for the 10 year period, in the Morningstar Foreign Large Growth category peer group*. Since its inception on March 16, 2005, the Fund gained 7.97% on an annualized basis (Class A Shares at net asset value) versus a return of 5.97% for the MSCI EAFE Growth Index and 6.38% for the MSCI ACWI ex-U.S. Growth Index.
In launching our international growth strategy, we sought to provide investors access to growth opportunities outside the U.S. using our time-tested approach to growth investing. We believe the Fund’s 10-year track record and top-tier ranking is a testament to our focus on long-term investing and adding value over full market cycles.
What factors influenced performance?
From a geographic perspective, the Fund’s country weights contributed positively to performance while selection within countries trailed the index. In particular, underweight positions and better selection in Canada and Australia were key positives while lagging selection in China, Mexico and Switzerland hampered performance.
From a sector perspective, the Fund’s positioning in information technology contributed the most value to performance during the period. Holdings in the Internet software and semiconductors industries notably outperformed. We believe many of these holdings exhibit leading growth fundamentals and are well positioned to benefit from growth in mobility, social media, e-commerce and analytics—areas that are of key focus for our team from a thematic standpoint. Despite slow global growth conditions, many of these businesses are delivering strong revenue and earnings results by virtue of synergistic product cycles and high-growth end markets.
The Fund’s security selection in industrials also added significant value in the period. Our team has emphasized companies positioned to benefit from weakened currency and enhanced export opportunities. As a result of this emphasis, we have had an overweight to the industrial machinery industry, in particular those companies generating significant export growth and tied to one of our key themes of robotics and automation.
| * | Fund data is as of 4/30/15. Morningstar category percentile rating is based on annualized total return for the 10-year period. Calamos International Growth Fund Class A, Class I and Class A Load-waived shares were in the first percentile for the Morningstar Foreign Large Growth Category. Morningstar data is as of 4/30/15. Morningstar category percentile rating is based on annualized total return. Calamos International Growth Fund Class A and Class A Load-waived shares were in the 62nd, 96th, 46th, and 1st percentiles for the 1-year, 3-year, 5-year and 10-year periods, respectively, for the Morningstar Foreign Large Growth Category. Calamos International Growth Fund Class I shares were in the 58th, 95th, 40th, and 1st percentiles for the 1-year, 3-year, 5-year and 10-year periods, respectively, for the Morningstar Foreign Large Growth Category. |
| | | | |
| 22 | | CALAMOS OPEN-END FAMILY OF FUNDS SEMIANNUAL REPORT | | |
Calamos International Growth Fund
The Fund’s relative security selection and modest underweight position in health care detracted the most value from performance in the period. Select companies in the index performed especially well due to stock-specific events, such as merger and acquisition transactions. The Fund held a relatively lower weight in these stocks. We continue to hold a blend of secular growth and stable growth positions in this sector and believe the strong fundamental profile and valuation discipline position the Fund well to participate in potential sector gains. Within health care, we also seek to invest in higher-growth, higher-quality companies in diversified regions including Europe, Japan and India.
Although the Fund’s underweight allocation added value, trailing selection in the materials sector also negatively affected performance in the period. Security selection in the construction materials industry lagged the index because of company-specific factors. We have held an underweight position in the materials sector with respect to our relatively cautious view on commodity prices, pressured from measured global growth and a stronger U.S. dollar.
How is the Fund positioned?
The team’s investment process has remained consistent during the International Growth Fund’s 10-year tenure, combining our top-down insights with bottom-up fundamental research, and an approach to investing that focuses on understanding a company’s entire capital structure. The International Growth Fund’s strong 10-year performance speaks to our team’s ability to navigate many different market environments.
We continue to position the portfolio with the goal of including aspects of both secular and cyclical growth opportunities, while also paying close attention to valuation discipline. We continue to emphasize companies with attractive growth fundamentals, increasing returns on invested capital and reasonable valuations. While we expect global growth will continue at a moderate pace, we also believe there will be periods of spiking volatility within international markets and, therefore, we maintain a strong focus on risk and reward.
With respect to geographic positioning, the most notable changes occurred in Europe. We increased the Fund weight in Europe during the period and benefited from strong market performance year-to-date, driven by stabilizing economic data, positive corporate revisions, a weaker euro, and the ECB’s quantitative easing program. In addition to a larger allocation, we are favoring companies benefiting from asset reflation and export opportunities via the weakened currency.
We are holding a modest overweight in Japan, also reflecting a more constructive view on the market during the period. We added to our Japan allocation based on a combination of factors including relative valuation, accommodative monetary policy and corporate reforms. Economic data has been mixed to stable, but we are seeing individual companies surprise investors with more strategic capital allocation and shareholder friendly policies. We have seen an increase in stock buybacks, dividend payouts and capital expenditures. Against this backdrop, we believe Japan’s market is well positioned to climb, although a bottom-up approach remains paramount.
We offset additions to Europe and Japan by reducing the Fund’s weight in emerging markets during the period, reflecting our view of relative opportunities. We expect divergence in the near-term prospects of emerging market economies due to differing growth prospects and structural reform trajectories. We have favored commodity consumers relative to producers (given the lower-cost environment), exporters benefiting
| | | | |
| SECTOR WEIGHTINGS | |
Consumer Discretionary | | | 20.5 | % |
Information Technology | | | 17.1 | |
Industrials | | | 15.1 | |
Financials | | | 14.9 | |
Health Care | | | 14.8 | |
Consumer Staples | | | 10.6 | |
Energy | | | 3.5 | |
Telecommunication Services | | | 1.0 | |
Materials | | | 0.8 | |
| | | | | |
Sector weightings are subject to change daily and are calculated as a percentage of net assets. The table excludes cash or cash equivalents, any government/sovereign bonds or broad based index hedging securities the Fund may hold.
Calamos International Growth Fund
from increased developed market demand, and companies benefiting from pro-growth structural reform opportunities at home and abroad in the markets they serve.
In terms of sector positioning, we have positioned the portfolio to focus on a balance of secular and cyclical growth areas including information technology, consumer discretionary, health care and industrials. We increased the Fund weight in health care, discretionary, and industrials during the period while reducing the overweight to technology because of company-specific factors. The largest underweight positions are in materials, consumer staples and financials reflecting our view of relative growth and valuation characteristics.
What closing thoughts do you have for Fund shareholders?
We expect international equities to deliver additional gains this year but we believe investors should anticipate periods of higher volatility as markets confront slow global growth, policy uncertainty, and fluctuations in currencies and commodities. We believe acquisitions and share buyback activity may provide a floor for valuations and support higher prices and demand for equities. However, we think markets will continue to confront ambiguity as commodity prices fluctuate and global growth fears linger. We believe many investors remain underweight in Europe and Japan, but we expect that changing monetary conditions, relative valuations, stable and improving macro fundamentals, and positive sentiment could provide additional catalysts for investment in international equities. We continue to favor companies with higher cash flows, growth catalysts and balance sheet flexibility. The Fund reflects our emphasis on key secular themes related to mobility and connectivity, rising consumption, financial disintermediation, and the need for modernized infrastructure. We believe a selective return environment buffeted by many international market cross-currents will benefit our active investment approach.
ANNUALIZED RETURN: SINCE INCEPTION (3/16/05) THROUGH 4/30/15

Performance data quoted represents past performance, which is no guarantee of future results. Current performance may be lower or higher than the performance quoted.
The principal value and investment return of an investment will fluctuate so that your shares, when redeemed, may be worth more or less than their original cost. You can obtain performance data current to the most recent month end by visiting www.calamos.com. Average annual total return measures net investment income and capital gain or loss from portfolio investments as an annualized average. All performance shown assumes reinvestment of dividends and capital gains distributions. Performance is for the Fund’s Class A shares at net asset value and does not include the Fund’s maximum front-end sales charge of 4.75%—had it been included, the Fund’s return would have been lower. The Fund also offers Class B, Class C, Class I and Class R shares, the performance of which may vary. Source: State Street Corporation and Lipper, Inc.
| | | | |
| 24 | | CALAMOS OPEN-END FAMILY OF FUNDS SEMIANNUAL REPORT | | |
Calamos International Growth Fund
GROWTH OF $10,000: SINCE INCEPTION (3/16/05) THROUGH 4/30/15
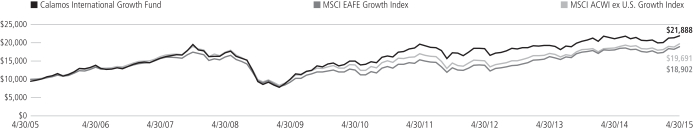
AVERAGE ANNUAL TOTAL RETURN† AS OF 4/30/15
| | | | | | | | | | | | | | | | | | | | |
| | | 6
MONTHS | | 1
YEAR | | 5
YEARS | | 10 YEARS
OR ^SINCE
INCEPTION |
Class A Shares – Inception 3/16/05 | | | | | | | | | | | | | | | | | | | | |
Without Sales Charge | | | | 6.49 | % | | | | 3.59 | % | | | | 7.91 | % | | | | 8.67 | % |
With Sales Charge | | | | 1.44 | | | | | -1.34 | | | | | 6.87 | | | | | 8.15 | |
Class B Shares – Inception 3/16/05 | | | | | | | | | | | | | | | | | | | | |
Without Sales Charge | | | | 6.14 | | | | | 2.86 | | | | | 7.11 | | | | | 8.03 | |
With Sales Charge | | | | 1.46 | | | | | -1.67 | | | | | 6.81 | | | | | 8.03 | |
Class C Shares – Inception 3/16/05 | | | | | | | | | | | | | | | | | | | | |
Without Sales Charge | | | | 6.08 | | | | | 2.80 | | | | | 7.11 | | | | | 7.87 | |
With Sales Charge | | | | 5.15 | | | | | 1.90 | | | | | 7.11 | | | | | 7.87 | |
Class I Shares – Inception 3/16/05 | | | | 6.63 | | | | | 3.86 | | | | | 8.20 | | | | | 8.95 | |
Class R Shares – Inception 3/1/07 | | | | 6.36 | | | | | 3.37 | | | | | 7.65 | | | | | 4.95 | ^ |
Performance data quoted represents past performance, which is no guarantee of future results. Current performance may be lower or higher than the performance quoted. The principal value and investment return of an investment will fluctuate so that your shares, when redeemed, may be worth more or less than their original cost.
As of the prospectus dated 3/1/15, the Fund’s gross expense ratio for Class A shares is 1.39%; Class B is 2.15%; C shares is 2.14%; Class I shares is 1.14%; Class R shares is 1.64%.
| † | Average annual total return measures net investment income and capital gain or loss from portfolio investments as an annualized average assuming reinvestment of dividends and capital gains distributions. Load-adjusted returns are adjusted for the maximum front-end sales load of 4.75% for Class A shares and returns for Class B and C shares have been adjusted for the contingent deferred sales charge (CDSC). |
NOTES:
The graphs do not reflect the income taxes that you would pay on fund distributions or the redemption of fund shares. Fund performance includes reinvestment of dividends and adjustment for the maximum sales charge for Class A shares. The performance of other classes will vary from the performance of the class shown based on the difference in sales charges and fees paid by shareholders investing in different share classes.
The MSCI EAFE Growth Index measures developed market growth equity performance (excluding the U.S. and Canada). Source: MSCI Barra.
The MSCI ACWI ex-U.S. Growth Index measures equity market performance of companies outside of the United States with higher growth values in developed and emerging markets.
Index returns assume reinvestment of dividends and do not reflect deduction of fees and expenses. It is not possible to invest directly in an index.
Calamos Evolving World Growth Fund
OVERVIEW
The Fund invests in growth companies globally, emphasizing companies with revenue streams derived within or from emerging markets. The Fund is designed to actively manage the risk profile over full market cycles.
KEY FEATURES
| | ¡ | | Active risk management with an aim of generating alpha and less downside risk than the benchmark and peers | |
| | ¡ | | Stress company fundamentals, including strong and/or accelerating earnings growth and solid returns on invested capital | |
| | ¡ | | Seek global growth companies that may benefit from long-term secular themes in the emerging markets such as the rise of the EM consumer | |
PORTFOLIO FIT
Because of its focus on risk management, the Fund can serve as a long-term emerging-market allocation.
| | |
| FUND NASDAQ SYMBOLS |
A Shares | | CNWGX |
B Shares | | CNWZX |
C Shares | | CNWDX |
I Shares | | CNWIX |
R Shares | | CNWRX |
| | | |
|
| FUND CUSIP NUMBERS |
A Shares | | 128119161 |
B Shares | | 128119153 |
C Shares | | 128119146 |
I Shares | | 128119138 |
R Shares | | 128119120 |
| | | |
EVOLVING WORLD GROWTH FUND
INVESTMENT TEAM DISCUSSION
How has the Fund performed?
For the six-month period ended April 30, 2015, Calamos Evolving World Growth Fund returned 3.66% (Class A shares at net asset value) versus the MSCI Emerging Markets Index return of 4.04%. Since its inception on August 15, 2008, the Fund gained 5.83% on an annualized basis (Class A shares at net asset value) versus 3.86% for the MSCI Emerging Markets Index.
On May 22, 2013, then Federal Reserve Chairman Ben Bernanke commented on the potential timing of the Quantitative Easing (QE) taper which set in motion the “taper tantrum” and elevated concerns about emerging markets. In the two years that have followed Bernanke’s statement, the Fund has demonstrated the virtues of an actively managed approach to investing in emerging market (EM) companies.
Our team’s focus on actively managing risk while pursuing opportunities tied to the growth trends in emerging markets (notably, the rise of the consumer) has led the Fund to outperform the benchmark since its inception. While there are risk factors that warrant close attention, we continue to see significant long-term growth potential in many markets and believe that clients can continue to benefit from the active management we provide through both calm and volatile periods.
What factors influenced performance?
Emerging market equities experienced bouts of volatility and generally choppy returns during the period. Against this backdrop, the Fund provided resilience versus the index during downturns and participated appreciably during periods of emerging market gains, including 91% of the benchmark’s upside during the period.
Late in 2014, investors exhibited a risk-off stance based on concerns of a global economic slowdown brought on by a slide in oil prices and Russia’s worsening financial crisis. However, emerging and developed market equities generated moderate gains in the first quarter of 2015 as investors responded to the Shanghai-Hong Kong connect program; the ECB pursued a major quantitative easing program; economic indexes surprised on the upside; and corporate earnings exceeded estimates in many regions. The end of the six-month period was marked by a return to a choppy and volatile performance environment. April took on a rotational nature as global markets saw a reversal in several prevalent market trends: the U.S. dollar sold off, crude oil prices jumped, and many emerging markets outperformed.
With respect to geographic influences on performance, the fund’s positions in developed market equities with significant economic ties to emerging markets performed well during the period. These holdings generally benefited from strong trends in developed market equities, particularly those in Europe and Japan, enjoying a tailwind from highly accommodative monetary policies, structural reforms and attractive relative valuation. In particular, our positioning in Japan performed well in response to these macro influences and strong bottom-up company execution. Within Japan, we are seeing individual companies surprise investors with more strategic capital allocation and shareholder friendly policies, including increased dividends, buybacks, and higher return on equity targets. These companies, many of which enjoy significant revenue generation in emerging markets, have been key contributors.
| | | | |
| 26 | | CALAMOS OPEN-END FAMILY OF FUNDS SEMIANNUAL REPORT | | |
Calamos Evolving World Growth Fund
In terms of economic sectors, the Fund’s security selection in industrials contributed to performance in the period. Specifically, holdings in the industrial machinery and industrial conglomerates industries outperformed. Our positioning in these industries benefited from a tailwind fanned by weakened currencies (vis-a-vis the U.S. dollar) and enhanced export opportunities. In fact, these factors have been key drivers behind our decision to overweight the industrial machinery industry, in particular those companies generating significant foreign sales and tied to our key theme related to the ubiquitous demand for robotics and automation. Holdings in this area performed well in the period and continue to be high-conviction positions.
Trailing selection in the consumer discretionary sector had a negative impact on Fund performance in the period. Specifically, Fund holdings in the education services and casinos and gaming industries underperformed as a consequence of unfavorable reform initiatives and slowing growth fundamentals. We have an overweight position in the sector and own companies that are well-positioned to tap into potential rising demand from emerging market consumers. Recent holdings within the sector span a number of industries including cable and satellite, automobiles, department stores, and apparel and accessories.
The Fund’s security selection in the materials sector also weighed on performance in the period, while the fund’s underweight allocation added value. Security selection in the construction materials industry lagged the index due to weaker demand, particularly in energy-related projects. We have held an underweight position in the materials sector based on our relatively cautious view of commodity prices under pressure from measured global growth and a stronger U.S. dollar.
How is the Fund positioned?
Broadly speaking, we have positioned the Fund toward net commodity-consuming nations, high-value exporters, and economies that benefit from positive economic and fiscal reforms. Within our top-down framework, we favor countries positioned to benefit from secular tailwinds, such as China, India, the Philippines, Indonesia and Mexico. We modestly increased the weight in local emerging market holdings during the period (relative to developed market holdings), reflecting potential valuation opportunities and company-specific growth factors.
In regard to select key markets, we are encouraged by China’s recent policy initiatives and stimulus actions, yet remain keenly aware of the Chinese market’s volatility and maintain what we believe to be an appropriate valuation discipline. Although India’s Prime Minister Narendra Modi faces increased pressure to deliver on expectations for reforms and economic growth, we remain positive on the prospects for India. Lower energy prices have allowed the central bank to be more accommodative. Our team continues to identify investments in the Philippines, which we believe is one of the faster growing emerging markets. Valuations are more expensive relative to some other emerging markets, but we are finding bottom-up opportunities that we believe are positioned to benefit from the Philippines’ economic growth potential.
From a sector perspective, the Fund is overweight to information technology, consumer discretionary and health care, while underweight toward commodity-intensive areas including energy and materials. We also have lower weights in utilities and telecommunication services, which are both challenged by low-growth and regulatory headwinds. Most sector positioning changes were relatively modest during the period.
| | | | |
| SECTOR WEIGHTINGS | |
Financials | | | 25.0 | % |
Information Technology | | | 23.1 | |
Consumer Discretionary | | | 16.9 | |
Consumer Staples | | | 8.1 | |
Industrials | | | 6.7 | |
Energy | | | 5.7 | |
Telecommunication Services | | | 4.3 | |
Health Care | | | 3.9 | |
Materials | | | 2.5 | |
Utilities | | | 1.1 | |
Sector weightings are subject to change daily and are calculated as a percentage of net assets. The table excludes cash or cash equivalents, any government/sovereign bonds or broad based index hedging securities the Fund may hold.
Calamos Evolving World Growth Fund
We reduced the weight to telecommunication services, energy and materials given our views noted earlier and company-specific factors. We added to financials reflecting a widening opportunity set and a more constructive view on sector fundamentals. We believe loan growth, attractive valuations and increased earnings power support a more positive yet selective view of the sector. We also rotated modestly from consumer discretionary to consumer staples based on bottom-up fundamentals.
What closing thoughts do you have for Fund shareholders?
We believe that market fluctuations will likely continue, but also believe that key reform initiatives, moderate economic growth, improving capital accounts and robust secular trends support our positioning. The nations that embrace these initiatives versus those that do not should result in greater differentiation between countries’ performances, underscoring the importance of selectivity. We are seeing stronger company fundamentals generally rewarded in emerging markets and we think that we will continue to see better prospects for commodity-consumer countries versus producers. We believe that countries with burgeoning domestic demand and positive reform catalysts are also positioned to benefit. Ultimately, we believe a selective environment and many emerging market crosscurrents, which cause countries to rise or fall, will benefit our active and risk-aware investment approach.
| | | | |
| 28 | | CALAMOS OPEN-END FAMILY OF FUNDS SEMIANNUAL REPORT | | |
Calamos Evolving World Growth Fund
GROWTH OF $10,000: SINCE INCEPTION (8/15/08) THROUGH 4/30/15
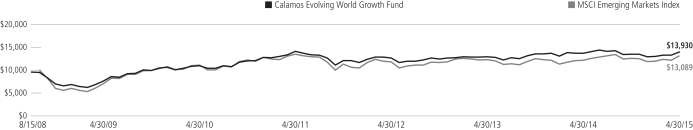
AVERAGE ANNUAL TOTAL RETURN† AS OF 4/30/15
| | | | | | | | | | | | | | | | | | | | |
| | | 6
MONTHS | | 1
YEAR | | 5
YEARS | | SINCE
INCEPTION |
Class A Shares – Inception 8/15/08 | | | | | | | | | | | | | | | | | | | | |
Without Sales Charge | | | | 3.66 | % | | | | 1.66 | % | | | | 4.93 | % | | | | 5.83 | % |
With Sales Charge | | | | -1.23 | | | | | -3.18 | | | | | 3.92 | | | | | 5.06 | |
Class B Shares – Inception 8/15/08 | | | | | | | | | | | | | | | | | | | | |
Without Sales Charge | | | | 3.26 | | | | | 0.83 | | | | | 4.13 | | | | | 5.03 | |
With Sales Charge | | | | -1.74 | | | | | -4.09 | | | | | 3.79 | | | | | 5.03 | |
Class C Shares – Inception 8/15/08 | | | | | | | | | | | | | | | | | | | | |
Without Sales Charge | | | | 3.26 | | | | | 0.90 | | | | | 4.15 | | | | | 5.05 | |
With Sales Charge | | | | 2.26 | | | | | -0.08 | | | | | 4.15 | | | | | 5.05 | |
Class I Shares – Inception 8/15/08 | | | | 3.74 | | | | | 1.83 | | | | | 5.18 | | | | | 6.09 | |
Class R Shares – Inception 8/15/08 | | | | 3.47 | | | | | 1.39 | | | | | 4.65 | | | | | 5.56 | |
Performance data quoted represents past performance, which is no guarantee of future results. Current performance may be lower or higher than the performance quoted. The principal value and investment return of an investment will fluctuate so that your shares, when redeemed, may be worth more or less than their original cost. You can obtain performance data current to the most recent month end by visiting www.calamos.com.
As of the prospectus dated 3/1/15, the Fund’s gross expense ratio for Class A shares is 1.62%; Class B shares is 2.36%; C shares is 2.37%; Class I shares is 1.37%; Class R shares is 1.86%.
| † | Average annual total return measures net investment income and capital gain or loss from portfolio investments as an annualized average assuming reinvestment of dividends and capital gains distributions. Load-adjusted returns are adjusted for the maximum front-end sales load of 4.75% for Class A shares and returns for Class B and C shares have been adjusted for the contingent deferred sales charge (CDSC). |
NOTES:
The graph does not reflect the income taxes that you would pay on fund distributions or the redemption of fund shares. Fund performance includes reinvestment of dividends and adjustment for the maximum sales charge for Class A shares. The performance of other classes will vary from the performance of the class shown based on the difference in sales charges and fees paid by shareholders investing in different share classes.
The MSCI Emerging Markets Index is a free float-adjusted market capitalization index considered broadly representative of emerging market equity performance. The index represents companies within the constituent emerging markets that are available to investors worldwide. Index data shown for the Since Inception Growth of $10,000 graph is from 8/31/08, since comparative index data is only available for full monthly periods. Source: Lipper, Inc.
Index returns assume reinvestment of dividends and do not reflect deduction of fees and expenses. It is not possible to invest directly in an index.
Calamos Emerging Market Equity Fund
OVERVIEW
The Fund invests in growth companies globally, whose principal activities are in a developing market or are economically tied to a developing market country that we believe offer the best opportunities for emerging-market growth.
KEY FEATURES
| | ¡ | | Stresses company fundamentals, including global presence, strong revenue and earnings growth, solid returns on invested capital and lower debt-to-capital levels | |
| | ¡ | | Actively seeks growth opportunities by investing in 100% equity, with at least 80% emerging-market exposure | |
| | ¡ | | Utilizes decades of Calamos experience investing globally through multiple economic, market and credit cycles | |
PORTFOLIO FIT
This actively managed Fund complements emerging-markets strategies with less pronounced growth orientations, such as those that more closely track broad emerging-markets equity.
| | |
| FUND NASDAQ SYMBOLS |
A Shares | | CEGAX |
C Shares | | CEGCX |
I Shares | | CIEIX |
R Shares | | CEGRX |
|
| FUND CUSIP NUMBERS |
A Shares | | 128120789 |
C Shares | | 128120771 |
I Shares | | 128120763 |
R Shares | | 128120755 |
EMERGING MARKET EQUITY FUND
INVESTMENT TEAM DISCUSSION
How has the Fund performed?
For the six-month period ended April 30, 2015, the Fund gained 2.15% (Class A shares at net asset value) versus a return of 4.04% for the MSCI Emerging Markets Index.
While the Fund’s overall sector weights added value during the period, the Fund trailed the index primarily because of security selection. In particular, security selection lagged in the materials sector as Fund holdings in construction materials reported decelerating growth fundamentals. We have held a cautious underweight in this sector and will continue to analyze relative growth and valuation attributes for investment opportunities.
Since its inception on December 31, 2013, the Fund returned 0.39% on an annualized basis (Class A shares at net asset value) versus a 6.07% gain for the index.
What factors influenced performance?
Emerging market equities experienced bouts of volatility and generally choppy returns during the period. Late in 2014, investors exhibited a risk-off stance based on concerns of a global economic slowdown brought on by a slide in oil prices and Russia’s worsening financial crisis. However, emerging market equities generated moderate gains in the first quarter of 2015 as investors responded to the Shanghai-Hong Kong connect program; the ECB pursued a major quantitative easing program; economic indexes surprised on the upside; and corporate earnings exceeded estimates in many regions. The end of the six-month period was marked by a return to a choppy and volatile performance environment in global markets. April took on a rotational nature as global markets saw a reversal in several prevalent market trends: the U.S. dollar sold off, crude oil prices jumped and many emerging markets outperformed.
Strong security selection in the financials sector contributed the most to relative performance in the period. In particular, holdings in the asset management and custody banks industry significantly outperformed those of the index. We have increased our investments in financials based on positive structural-reform catalysts and improved sector fundamentals. We believe loan growth, attractive valuations and increased earnings power support a more positive yet selective view of financials.
Selection in telecommunication services and an underweight position versus the index also added to return. Specifically, holdings in the wireless telecom services industry outperformed their index peers. We continue to seek attractive growth opportunities in the telecommunication services, traditionally a more defensive sector but one offering more substantial organic growth potential in many emerging market economies.
Selection in health care hindered results. In particular, holdings in the pharmaceuticals and health care equipment industries trailed the index. We invest in companies in the sector according to their research and development profile, return on invested capital characteristics and long-term growth potential within emerging markets. Selection in the consumer discretionary sector also held back performance. Specifically, holdings in education services and the casinos and gaming industries underperformed as a consequence of unfavorable reform initiatives and slowing growth fundamentals. We have an overweight position in the sector and own companies that are well positioned
| | | | |
| 30 | | CALAMOS OPEN-END FAMILY OF FUNDS SEMIANNUAL REPORT | | |
Calamos Emerging Market Equity Fund
to tap into potential rising demand from emerging market consumers. Recent holdings within the sector span a number of industries including cable and satellite, automobiles, department stores, and apparel and accessories.
From a geographic perspective, the Fund’s country weights contributed positively to performance while selection within countries trailed the index. In particular, overweight positions and stronger selection in Hong Kong and Taiwan led to positive results. Holdings in China delivered strong gains yet trailed the even higher returns in the index. Also, the Fund’s overweight stance in Mexico hampered performance as the market there performed poorly.
How is the Fund positioned?
Broadly speaking, we have positioned the Fund toward net commodity-consuming nations, high-value exporters, and economies benefiting from positive economic and fiscal reforms. Within our top-down framework, we favor countries that we believe are positioned to benefit from secular tailwinds, such as China, India, the Philippines, Indonesia and Mexico.
In regard to select key markets, we are encouraged by China’s recent policy initiatives and stimulus actions, yet we remain keenly aware of the Chinese market’s volatility and maintain what we believe to be an appropriate valuation discipline. Although India’s Prime Minister Narendra Modi faces increased pressure to deliver on expectations for reforms and economic growth, we remain positive on the prospects for India. Lower energy prices have allowed the central bank to be more accommodative. Our team continues to identify investments in the Philippines, which we believe to be one of the faster growing emerging markets. Valuations are more expensive relative to some other emerging markets, but we are finding bottom-up opportunities that we believe are positioned to benefit from the Philippines’ economic growth potential.
From a sector perspective, the Fund is overweight to information technology and consumer discretionary and underweight toward commodity-intensive areas including energy and materials. We also have lower weights in utilities and telecommunication services, which are both challenged by low-growth characteristics and regulatory headwinds.
Most sector positioning changes were relatively modest during the period. We reduced the weight in telecommunication services, energy and materials because of company-specific factors and our more cautious view toward commodity-producers. We added weight to the industrials and financials sectors reflecting a widening opportunity set and a more constructive view on sector fundamentals. We also rotated modestly from consumer discretionary to consumer staples based on bottom-up fundamentals.
In terms of geographic positioning, we added to greater China (including China and Hong Kong) and South Korea in acknowledgement of an increased opportunity set, structural reform initiatives and bottom-up security catalysts. Offsetting this, we modestly reduced the weight in Mexico and Brazil, and we trimmed holdings in Indonesia in response to company-specific rationale.
What closing thoughts do you have for Fund shareholders?
We believe that market fluctuations will likely continue, but also believe that key reform initiatives, moderate economic growth, improving capital accounts and robust secular trends support our positioning. The nations that embrace these initiatives versus those
| | | | |
| SECTOR WEIGHTINGS | |
Financials | | | 28.4 | % |
Information Technology | | | 24.1 | |
Consumer Discretionary | | | 13.2 | |
Industrials | | | 7.3 | |
Consumer Staples | | | 6.7 | |
Telecommunication Services | | | 5.2 | |
Energy | | | 5.1 | |
Materials | | | 2.2 | |
Health Care | | | 2.0 | |
Utilities | | | 1.6 | |
Sector weightings are subject to change daily and are calculated as a percentage of net assets. The table excludes cash or cash equivalents, any government/sovereign bonds or broad based index hedging securities the Fund may hold.
Calamos Emerging Market Equity Fund
that do not should result in greater differentiation between countries’ performances, underscoring the importance of selectivity. We are seeing stronger company fundamentals generally rewarded in emerging markets and we think that we will continue to see better prospects for commodity-consumer countries versus producers. We believe that countries with burgeoning domestic demand and positive reform catalysts are also positioned to benefit. Ultimately, we believe a selective environment and many emerging market crosscurrents will benefit our active and risk-aware investment approach.
GROWTH OF $10,000: SINCE INCEPTION (12/31/13) THROUGH 4/30/15
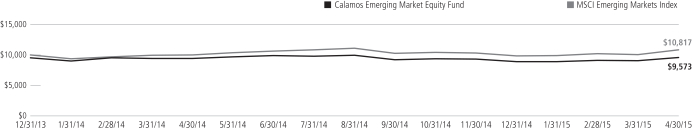
AVERAGE ANNUAL TOTAL RETURN† AS OF 4/30/15
| | | | | | | | | | | | | | | |
| | | 6
MONTHS | | 1
YEAR | | SINCE
INCEPTION |
| Class A Shares – Inception 12/31/2013 | | | | | | | | | | | | | | | |
Without Sales Charge | | | | 2.15 | % | | | | 1.74 | % | | | | 0.39 | % |
With Sales Charge | | | | -2.69 | | | | | -3.07 | | | | | -3.22 | |
Class C Shares – Inception 12/31/2013 | | | | | | | | | | | | | | | |
Without Sales Charge | | | | 1.84 | | | | | 1.12 | | | | | -0.30 | |
With Sales Charge | | | | 0.84 | | | | | 0.12 | | | | | -0.30 | |
Class I Shares – Inception 12/31/2013 | | | | 2.31 | | | | | 2.11 | | | | | 0.66 | |
Class R Shares – Inception 12/31/2013 | | | | 2.01 | | | | | 1.49 | | | | | 0.13 | |
Performance data quoted represents past performance, which is no guarantee of future results. Current performance may be lower or higher than the performance quoted. The principal value and investment return of an investment will fluctuate so that your shares, when redeemed, may be worth more or less than their original cost. You can obtain performance data current to the most recent month end by visiting www.calamos.com.
As of the prospectus dated 3/1/15, the Fund’s gross expense ratio for Class A shares is 3.45%; Class C shares is 4.07%; Class I shares is 3.03%; Class R shares is 3.71%. The Fund’s Investment Adviser has contractually agreed to reimburse the Fund expenses through March 1, 2017, to the extent necessary so that Total Annual Fund Operating Expenses (excluding taxes, interest, short interest, short dividend expenses, brokerage commissions, acquired funds fees and expenses and extraordinary expenses, if any) of Class A, Class C, Class I and Class R are limited to 1.25%, 2.00%, 1.00% and 1.50% of average net assets, respectively. This agreement is not terminable by either party.
| † | Average annual total return measures net investment income and capital gain or loss from portfolio investments as an annualized average assuming reinvestment of dividends and capital gains distributions. Load-adjusted returns are adjusted for the maximum front-end sales load of 4.75% for Class A shares and C shares have been adjusted for the contingent deferred sales charge (CDSC). |
NOTES:
The graph does not reflect the income taxes that you would pay on fund distributions or the redemption of fund shares. Fund performance includes reinvestment of dividends and adjustment for the maximum sales charge for Class A shares. The performance of other classes will vary from the performance of the class shown based on the difference in sales charges and fees paid by shareholders investing in different share classes.
The MSCI Emerging Markets Index is a free float-adjusted market capitalization index considered broadly representative of emerging market equity performance. The index represents companies within the constituent emerging markets that are available to investors worldwide. Index data shown for the Since Inception Growth of $10,000 graph is from 12/31/13, since comparative index data is only available for full monthly periods. Source: Lipper, Inc.
Index returns assume reinvestment of dividends and do not reflect deduction of fees and expenses. It is not possible to invest directly in an index.
| | | | |
| 32 | | CALAMOS OPEN-END FAMILY OF FUNDS SEMIANNUAL REPORT | | |
Calamos Global Equity Fund
GLOBAL EQUITY FUND
INVESTMENT TEAM DISCUSSION
How has the Fund performed?
For the six-month period ended April 30, 2015, the Fund gained 6.92% (Class A shares at net asset value) versus a 5.38% return for the MSCI World Index and 7.29% for the MSCI ACWI Growth Index.
The Fund’s strong results, which outperformed by 217 basis points the average return of peers in the Morningstar World Stock category, reflected the strength of the Fund’s growth holdings. We remain especially bullish on growth stocks as we believe earnings growth remains solidly positive and corporate earnings will continue to expand. We feel we have entered a growth regime, and recent market performance has aligned with our view. In the first quarter, U.S. growth stocks led value by 460 basis points, a spread not seen since the first quarter of 2009.
Since its inception on March 1, 2007, the Fund has returned 7.55% on an annualized basis (Class A shares at net asset value), outperforming the 5.07% return for the MSCI World Index as well as the 6.13% return for the MSCI ACWI Growth Index. We believe the Fund’s solid track record since its inception is a testament to our focus on long-term global investing and adding value over full market cycles.
What factors influenced performance?
From a geographic perspective, the Fund’s country weights contributed positively to performance while selection within countries trailed. In particular, overweight positions and stronger selection in Denmark and South Africa led to positive results while lagging selection in China and the U.S. hampered performance.
In terms of economic sectors, selection in industrials added the most value in the period. Our team has emphasized companies positioned to benefit from weakened currency and enhanced export opportunities. As a result of this emphasis, we have had an overweight to the industrial machinery industry, in particular those companies generating significant export growth and tied to one of our key themes of robotics and automation.
Selection in financials also added considerable value. In particular, holdings in the asset management and custody banks industry outperformed those of the index. We gradually increased our investments in financials based on improved sector fundamentals and our positive market outlook. We believe loan growth, attractive valuations and increased earnings power support a more positive yet selective view of the sector.
Selection in and a modest underweight to health care hindered performance. In particular, holdings in the health care equipment industry lagged their index peers. Select companies in the index, which we didn’t own, performed especially well due to stock-specific events, such as merger and acquisition transactions. Within health care, we prefer the higher-growth, higher-innovation opportunities in select industries including pharmaceuticals, biotechnology and health care technology. Fund holdings are mainly diversified across the U.S., Europe and Japan.
Although the Fund’s underweight allocation added value, selection in the materials sector held back performance. Holdings in the construction materials industry lagged
OVERVIEW
The Fund invests in equities of companies around the globe, focusing on those firms demonstrating what we believe to be key growth characteristics, including increasing profit margins and high returns on invested capital.
KEY FEATURES
| | ¡ | | Flexibility to seek growth globally, pursuing the best risk/reward opportunities across country, market capitalization and sector | |
| | ¡ | | Seeks global growth companies that may benefit from long-term secular themes, including a burgeoning global middle class and an increased demand for information and entertainment | |
PORTFOLIO FIT
The Fund is a growth-oriented addition to a strategic global equity allocation that may complement or provide an alternative to value or blended styles.
| | |
| FUND NASDAQ SYMBOLS |
A Shares | | CAGEX |
B Shares | | CBGEX |
C Shares | | CCGEX |
I Shares | | CIGEX |
R Shares | | CRGEX |
| | | |
|
| FUND CUSIP NUMBERS |
A Shares | | 128119484 |
B Shares | | 128119476 |
C Shares | | 128119468 |
I Shares | | 128119450 |
R Shares | | 128119443 |
| | | |
Calamos Global Equity Fund
| | | | |
| SECTOR WEIGHTINGS | |
Information Technology | | | 27.1 | % |
Consumer Discretionary | | | 21.9 | |
Health Care | | | 13.6 | |
Industrials | | | 12.5 | |
Financials | | | 11.6 | |
Consumer Staples | | | 5.8 | |
Energy | | | 3.6 | |
Materials | | | 1.3 | |
Telecommunication Services | | | 0.5 | |
| | | | | |
Sector weightings are subject to change daily and are calculated as a percentage of net assets. The table excludes cash or cash equivalents, any government/sovereign bonds or broad based index hedging securities the Fund may hold.
because of company-specific factors. We have held an underweight to materials as we believe commodity prices will remain under pressure from measured global growth and a stronger U.S. dollar.
How is the Fund positioned?
We continue to seek secular and cyclical growth opportunities that are appropriately valued. In the U.S., we favor companies that we think are poised to execute well and outperform despite a backdrop of low global growth. We are most interested in companies with attractive growth fundamentals, increasing returns on invested capital and reasonable valuations.
We increased the Fund’s weight to Europe where market performance has been strong because of stabilizing economic data, positive corporate revisions, a weaker euro and quantitative easing. In addition to a larger allocation, we are favoring companies benefiting from asset reflation and export opportunities via the weakened currency.
We are holding a modest overweight in Japan, which reflects our increasingly positive view on the market because of relative valuation, accommodative monetary policy and corporate reforms. Economic data has been mixed to stable, but we are seeing individual companies beating expectations with better strategic investments and shareholder friendly policies. For example, we have seen an increase in stock buybacks, dividend payouts and capital expenditures. Against this backdrop, we believe Japan’s market is well positioned to climb, although a bottom-up approach remains paramount.
With respect to emerging markets, we expect divergences in the near-term prospects of many economies due to differing growth prospects and structural reform. We have favored commodity consumers relative to producers (given the lower-cost environment), exporters benefiting from increased developed market demand and companies benefitting from pro-growth structural reform opportunities at home and abroad in the markets they serve.
In terms of sector positioning, we are focused on a combination of secular and cyclical growth areas including information technology, consumer discretionary, health care and industrials. We increased health care, consumer discretionary and industrials during the period and reduced the overweight to technology as we sold some holdings on company-specific issues. We also trimmed energy and materials because of weaker fundamentals. The largest underweight positions are in energy, materials, consumer staples and financials, reflecting our view of relative growth and valuation.
What closing thoughts do you have for Fund shareholders?
We expect global equities to deliver additional gains in 2015 but we also believe investors should anticipate periods of higher volatility as markets confront slow global growth, policy uncertainty, and fluctuations in currencies and commodities. We believe acquisitions and share buybacks may provide a floor for valuations and support higher prices for equities and equity-sensitive securities. We maintain our belief that global equities remain attractive against a backdrop of moderate economic growth, low inflation, reasonable valuations and highly accommodative central bank policy.
| | | | |
| 34 | | CALAMOS OPEN-END FAMILY OF FUNDS SEMIANNUAL REPORT | | |
Calamos Global Equity Fund
GROWTH OF $10,000: SINCE INCEPTION (3/1/07) THROUGH 4/30/15
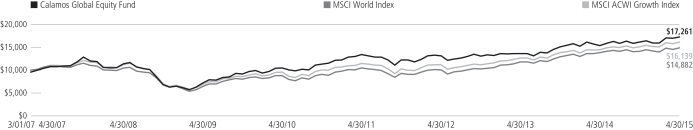
AVERAGE ANNUAL TOTAL RETURN† AS OF 4/30/15
| | | | | | | | | | | | | | | | | | | | |
| | | 6
MONTHS | | 1
YEAR | | 5
YEARS | | SINCE
INCEPTION |
Class A Shares – Inception 3/1/07 | | | | | | | | | | | | | | | | | | | | |
Without Sales Charge | | | | 6.92 | % | | | | 12.52 | % | | | | 10.54 | % | | | | 7.55 | % |
With Sales Charge | | | | 1.85 | | | | | 7.20 | | | | | 9.47 | | | | | 6.91 | |
Class B Shares – Inception 3/1/07 | | | | | | | | | | | | | | | | | | | | |
Without Sales Charge | | | | 6.56 | | | | | 11.76 | | | | | 9.72 | | | | | 6.77 | |
With Sales Charge | | | | 2.35 | | | | | 7.34 | | | | | 9.45 | | | | | 6.77 | |
| Class C Shares – Inception 3/1/07 | | | | | | | | | | | | | | | | | | | | |
Without Sales Charge | | | | 6.57 | | | | | 11.71 | | | | | 9.73 | | | | | 6.75 | |
With Sales Charge | | | | 5.73 | | | | | 10.83 | | | | | 9.73 | | | | | 6.75 | |
Class I Shares – Inception 3/1/07 | | | | 7.14 | | | | | 12.85 | | | | | 10.83 | | | | | 7.84 | |
Class R Shares – Inception 3/1/07 | | | | 6.83 | | | | | 12.29 | | | | | 10.27 | | | | | 7.29 | |
Performance data quoted represents past performance, which is no guarantee of future results. Current performance may be lower or higher than the performance quoted. The principal value and investment return of an investment will fluctuate so that your shares, when redeemed, may be worth more or less than their original cost. You can obtain performance data current to the most recent month end by visiting www.calamos.com.
As of the prospectus dated 3/1/15, the Fund’s gross expense ratio for Class A shares is 1.40%; Class B is 2.15%; Class C shares is 2.14%; Class I shares is 1.15%; Class R shares is 1.64%.
| † | Average annual total return measures net investment income and capital gain or loss from portfolio investments as an annualized average assuming reinvestment of dividends and capital gains distributions. Load-adjusted returns are adjusted for the maximum front-end sales load of 4.75% for Class A shares and returns for Class B and C shares have been adjusted for the contingent deferred sales charge (CDSC). |
NOTES:
The graph does not reflect the income taxes that you would pay on fund distributions or the redemption of fund shares. Fund performance includes reinvestment of dividends and adjustment for the maximum sales charge for Class A shares. The performance of other classes will vary from the performance of the class shown based on the difference in sales charges and fees paid by shareholders investing in different share classes.
The MSCI World Index (U.S. Dollars) is a market-capitalization weighted index composed of companies representative of the market structure of developed market countries in North America, Europe and the Asia/Pacific region. Since inception data for the index is shown from 2/28/07 since data is only available for full monthly periods. Source: Lipper, Inc.
The MSCI ACWI Growth Index is designed to measure the equity performance of companies with higher growth values in developed and emerging markets.
Morningstar World Stock category funds have few geographical limitations. It is common for these funds to invest the majority of their assets in the U.S., Europe and Japan, with the remainder divided among the globe’s smaller markets. These funds typically have 20% – 60% of assets in U.S. stocks.
Index returns assume reinvestment of dividends and do not reflect deduction of fees and expenses. It is not possible to invest directly in an index.
Calamos Growth and Income Fund
OVERVIEW
The Fund invests primarily in U.S. equity and convertible securities in an attempt to balance risk and reward while providing growth and income.
KEY FEATURES
| | ¡ | | Leverage more than three decades of research experience combining equities and convertible holdings to provide equity-like participation | |
| | ¡ | | Provide a core holding option that aims to maintain a consistent risk posture throughout the market cycle | |
| | ¡ | | Seek to participate in the upside movements of the equity market while lessening the blows of down periods | |
PORTFOLIO FIT
The Fund can provide a long-term core allocation to equities with the potential for lower volatility.
| | |
| FUND NASDAQ SYMBOLS |
A Shares | | CVTRX |
B Shares | | CVTYX |
C Shares | | CVTCX |
I Shares | | CGIIX |
R Shares | | CGNRX |
| | | |
|
| FUND CUSIP NUMBERS |
A Shares | | 128119104 |
B Shares | | 128119765 |
C Shares | | 128119831 |
I Shares | | 128119872 |
R Shares | | 128119336 |
| | | |
CALAMOS GROWTH AND INCOME FUND
INVESTMENT TEAM DISCUSSION
How has the Fund performed?
For the six-month period ended April 30, 2015, the Fund returned 2.10% (Class A shares at net asset value) versus returns of 4.40% for the S&P 500 Index and 3.64% for the BofA Merrill Lynch All U.S. Convertibles ex-Mandatory Index.
We manage this Fund with the goal of achieving upside equity participation and potential downside protection over full market cycles, and the Fund’s historical performance reflects our goal. Since its inception on September 22, 1988, the Fund returned 11.29% on an annualized basis (Class A shares at net asset value) versus a 10.40% gain for the S&P 500 Index and a 9.64% return for the BofA Merrill Lynch All U.S. Convertibles ex-Mandatory Index.
Please discuss the Fund’s lower-volatility characteristics?
We believe the Fund’s historical lower-volatility characteristics are a by-product of our investment style and focus on participating in equity market upside with less volatility than the market as a whole. Beta is one popular statistic for measuring volatility. Beta considers a fund’s historic volatility versus the market, which is assigned a beta of 1.0. A fund with half the volatility of the market would have a beta of 0.5, while a fund with a beta of 2.0 would have been twice as volatile as the market.
Since its inception, the Fund has had a beta of 0.72 (Class A shares) versus the S&P 500 Index. The Fund has therefore outperformed the broader equity market, as measured by the S&P 500 Index, with less volatility than the equity markets. Please note that past performance does not indicate future results and that beta is one of many measures of risk.
What factors influenced performance?
The Fund invests in a combination of stocks, convertible securities and bonds. It offers a total return-oriented investment that seeks to keep a consistent balance of risk and reward through full market cycles. As we focus on managing volatility, we strive to participate in a greater portion of equity market upside than downside.
During the six-month period, the Fund participated in equity upside. While the Fund’s equities performed generally in line with the market, the Fund’s convertible bond allocation trailed. The Fund did not hold a large weighting to the most equity-sensitive convertible bonds, and these bonds led the convertible bond market as equities continued to gain. We believe the asymmetric risk/reward characteristics of hybrid or “middle of the road” convertibles are more appealing in managing market volatility.
Selection in financials contributed to relative performance. Holdings in the asset management, custody banks and regional banks industries posted especially strong gains. An underweight allocation to the utilities and telecommunication services sectors also added value. Performance in these lower-growth sectors trailed the overall market in the period, and our underweight positioning helped. Underweight allocations to the utilities and telecom services sectors also added value. Performance in these lower -growth sectors trailed the overall market in the period, and our underweight positioning was helpful.
| | | | |
| 36 | | CALAMOS OPEN-END FAMILY OF FUNDS SEMIANNUAL REPORT | | |
Calamos Growth and Income Fund
In terms of economic sectors, positioning and security selection within the health care sector detracted from return. In particular, selection within the pharmaceuticals and health care equipment industries held back results. That said, we uphold our conviction regarding higher-growth and highly innovative companies within the pharmaceuticals, health care equipment and biotechnology industries. We believe these companies offer a desirable combination of growth and quality characteristics founded on strong fundamentals, in addition to a wider opportunity set within the convertible universe, which is well suited to our risk-adjusted portfolio mandate. Portfolio positioning and security selection within energy lagged during the period. Specifically, holdings within the oil-and-gas equipment and services industry along with names in the oil-and-gas exploration and production industry hampered performance.
| | | | |
| SECTOR WEIGHTINGS | |
Information Technology | | | 22.5 | % |
Financials | | | 16.5 | |
Health Care | | | 15.4 | |
Consumer Discretionary | | | 14.5 | |
Industrials | | | 9.7 | |
Consumer Staples | | | 7.7 | |
Energy | | | 6.2 | |
Utilities | | | 2.0 | |
Materials | | | 1.3 | |
Telecommunication Services | | | 0.5 | |
Sector weightings are subject to change daily and are calculated as a percentage of net assets. The table excludes cash or cash equivalents, any government/sovereign bonds or broad based index hedging securities the Fund may hold.
MANAGING RISK OVER MARKET CYCLES
The Growth and Income Fund historically has captured a significant amount of upside during bull markets and limited losses when markets have plunged.
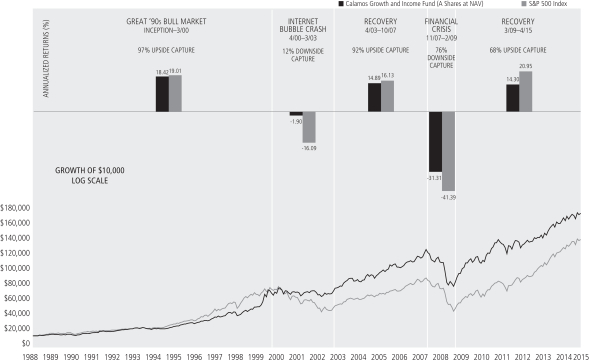
Performance data quoted represents past performance, which is no guarantee of future results. Current performance may be lower or higher than the performance quoted. The principal value and return of an investment will fluctuate so that your shares, when redeemed, may be worth more or less than their original cost. Performance reflected at NAV does not include the Fund’s maximum front-end sales load of 4.75% had it been included, the Fund’s return would have been lower. For the most recent fund performance information visit www.calamos.com.
There is no assurance that the Fund will achieve or maintain its investment objective. Results are before taxes on Fund distributions and assume reinvestment of dividends and capital gains. Index data shown is from 11/1/88, since comparative index data is available only for full monthly periods.
Calamos Growth and Income Fund
Logarithmic scales can be useful when looking at performance data over a long period of time. Common percent changes are represented by an equal spacing between the numbers in the scale. For example, the distance between $1 and $2 is equal to the distance between $2 and $4 because both scenarios represent a 100% increase in price.
Upside capture ratio measures a manager’s performance in up markets relative to the named index itself. It is calculated by taking the security’s upside capture return and dividing it by the benchmark’s upside capture return. Downside capture ratio measures manager’s performance in down markets as defined by the named index. A down-market is defined as those periods (months or quarters) in which named index return is less than 0. In essence, it tells you what percentage of the downmarket was captures by the manager. For example, if the ratio is 110%, the manager has captured 110% of the down-market and therefore underperformed the market on the downside. Source: State Street Corporation and Lipper, Inc.
Please describe the Fund’s participation in up and down markets since its inception.
The Fund invests in a combination of stocks, convertible securities and bonds to offer a total-return-oriented investment that seeks to keep a consistent balance of risk and reward through full market cycles. As we focus on managing volatility, we strive to participate in a greater portion of equity market upside than downside.
There are a variety of ways to express up- and down-market capture, whether it is calculated daily, monthly, quarterly, or as we look at the markets—in longer-term up-and-down market trends. In the chart above, you can see how the Fund performed through distinct market periods. In the five major market periods shown, the Fund has generally participated in the upside movements of the equity market while limiting the downside exposure during times of tumult.
How is the Fund positioned?
From a portfolio perspective, we seek to invest in U.S. companies that we believe have the best prospects for sustainable and high relative growth. The Fund offers a diversified approach and participates in long-term growth trends by focusing on companies with solid fundamentals, global brands, strong growth catalysts and attractive valuations. We believe the Fund’s historical low-volatility characteristics are a by-product of both our investment style and our focus on participating in equity market upside with less volatility than the market as a whole.
The Fund’s investments reflect our positive long-term outlook for equities and equity-sensitive securities. We believe a combination of secular and cyclical growth holdings is appropriate, given our view that we are in the mid-part of the business cycle with low inflation and moderate global growth. We are emphasizing companies with sound growth fundamentals, increasing returns on invested capital, and attractive valuations.
We continue to actively manage our sector exposures in conjunction with our fundamental, bottom-up research. Our research points us to opportunities within the technology, financials, health care and consumer discretionary sectors, and the Fund is positioned as such. Overall, changes to sector weights were modest during the period. Among selected changes, we added to the Fund’s weight in the health care sector by virtue of improving fundamentals and growth prospects as well as security-specific factors. For example, we added names from the pharmaceuticals and biotechnology industries. We also increased the Fund’s weighting to consumer staples. Conversely, Fund positioning was marginally reduced within the energy sector. We sold companies marked by declining growth catalysts, deteriorating fundamentals and valuation concerns. We pared back the industrials sector on lower oil prices, a strong U.S. dollar and a sluggish global economy.
The Fund’s largest allocation in absolute terms went to the information technology sector. Relative to the S&P 500 Index, the Fund’s largest overweight allocations went to the information technology and consumer discretionary sectors, and its largest underweights went to energy and materials.
| | | | |
| 38 | | CALAMOS OPEN-END FAMILY OF FUNDS SEMIANNUAL REPORT | | |
Calamos Growth and Income Fund
What closing thoughts do you have for Fund shareholders?
With the Fed likely to hold off on raising interest rates until later this year, we believe stock prices should continue their upward trend, though experiencing periodic bouts of volatility. With earnings yields still far in excess of long-term borrowing costs, it’s our belief that record merger and acquisition and buyback activity will likely continue. We remain bullish on equities, and particularly growth equities, where valuations remain attractive on a number of our favored measures. We believe we are in a growth regime (similar to 1995 – 1999), supported by low inflation, high cash levels and high innovation. We feel our use of both cyclical and secular themes is appropriate, given our stance that we are in the mid-stages of the business cycle. We favor companies with strong growth catalysts, improving fundamentals and solid balance sheets. That mindset leads us to favor the information technology, health care and consumer discretionary sectors, while we remain underweight to energy, materials and telecom services.
Convertible securities have tended to perform well in a slow-growth environment, when stocks are rising and interest rates are increasing slowly. We believe convertibles can also benefit from market volatility, as their embedded option can become more valuable. Because convertibles combine equity and fixed income characteristics, they offer the opportunity for upside equity participation with potential downside protection when equity markets decline. Against this backdrop, we believe the benefits of convertible securities are especially pronounced.
ANNUALIZED RETURN: SINCE INCEPTION (9/22/88) THROUGH 4/30/15
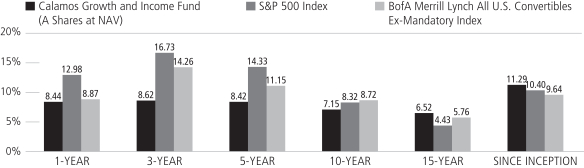
Performance data quoted represents past performance, which is no guarantee of future results. Current performance may be lower or higher than the performance quoted.
The principal value and investment return of an investment will fluctuate so that your shares, when redeemed, may be worth more or less than their original cost. You can obtain performance data current to the most recent month end by visiting www.calamos.com. Average annual total return measures net investment income and capital gain or loss from portfolio investments as an annualized average. All performance shown assumes reinvestment of dividends and capital gains distributions. Performance is for the Fund’s Class A shares at net asset value and does not include the Fund’s maximum front-end sales charge of 4.75%—had it been included, the Fund’s return would have been lower. The Fund also offers Class B, Class C, Class I and R shares, the performance of which may vary. Source: State Street Corporation and Lipper, Inc.
Calamos Growth and Income Fund
GROWTH OF $10,000: FOR 10-YEAR PERIOD ENDED 4/30/15
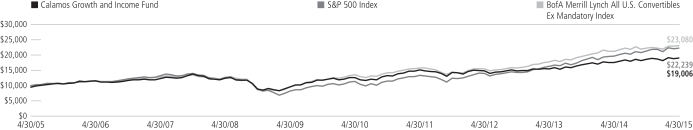
AVERAGE ANNUAL TOTAL RETURN† AS OF 4/30/15
| | | | | | | | | | | | | | | | | | | | |
| | | 6
MONTHS | | 1
YEAR | | 5
YEARS | | 10 YEARS
OR ^SINCE
INCEPTION |
Class A Shares – Inception 9/22/88 | | | | | | | | | | | | | | | | | | | | |
Without Sales Charge | | | | 2.10 | % | | | | 8.44 | % | | | | 8.42 | % | | | | 7.15 | % |
With Sales Charge | | | | -2.76 | | | | | 3.29 | | | | | 7.36 | | | | | 6.63 | |
Class B Shares – Inception 9/11/00 | | | | | | | | | | | | | | | | | | | | |
Without Sales Charge | | | | 1.74 | | | | | 7.77 | | | | | 7.84 | | | | | 6.57 | |
With Sales Charge | | | | -2.88 | | | | | 2.89 | | | | | 7.55 | | | | | 6.57 | |
Class C Shares – Inception 8/5/96 | | | | | | | | | | | | | | | | | | | | |
Without Sales Charge | | | | 1.74 | | | | | 7.65 | | | | | 7.60 | | | | | 6.35 | |
With Sales Charge | | | | 0.83 | | | | | 6.69 | | | | | 7.60 | | | | | 6.35 | |
Class I Shares – Inception 9/18/97 | | | | 2.24 | | | | | 8.71 | | | | | 8.69 | | | | | 7.42 | |
Class R Shares – Inception 3/1/07 | | | | 1.99 | | | | | 8.17 | | | | | 8.14 | | | | | 5.63 | ^ |
Performance data quoted represents past performance, which is no guarantee of future results. Current performance may be lower or higher than the performance quoted. The principal value and investment return of an investment will fluctuate so that your shares, when redeemed, may be worth more or less than their original cost.
As of the prospectus dated 3/1/15, the Fund’s gross expense ratio for Class A shares is 1.09%; Class B is 1.85%; Class C shares is 1.84%; Class I shares is 0.84%; Class R shares is 1.34%.
| † | Average annual total return measures net investment income and capital gain or loss from portfolio investments as an annualized average assuming reinvestment of dividends and capital gains distributions. Load-adjusted returns are adjusted for the maximum front-end sales load of 4.75% for Class A shares and returns for Class B and C shares have been adjusted for the contingent deferred sales charge (CDSC). |
NOTES:
The graphs do not reflect the income taxes that you would pay on fund distributions or the redemption of fund shares. Fund performance includes reinvestment of dividends and adjustment for the maximum sales charge for Class A shares. The performance of other classes will vary from the performance of the class shown based on the difference in sales charges and fees paid by shareholders investing in different share classes.
The S&P 500 Index is an unmanaged index generally considered representative of the U.S. stock market. Source: Lipper, Inc.
The BofA Merrill Lynch All U.S. Convertibles Ex-Mandatory Index represents the U.S. convertibles securities market excluding mandatory convertibles. Index data shown for the Annualized Return Since Inception graph is from 9/30/88, since comparative index data is only available for full monthly periods. Source: Lipper, Inc.
Index returns assume reinvestment of dividends and do not reflect deduction of fees and expenses. It is not possible to invest directly in an index.
| | | | |
| 40 | | CALAMOS OPEN-END FAMILY OF FUNDS SEMIANNUAL REPORT | | |
Calamos Global Growth and Income Fund
GLOBAL GROWTH AND INCOME FUND
INVESTMENT TEAM DISCUSSION
How has the Fund performed?
For the six-month period ended April 30, 2015, the Fund returned 4.74% (Class A shares at net asset value) versus a return of 5.24% for the MSCI ACWI Index and 5.38% for the MSCI World Index.
The Fund’s strong results, which outperformed by 240 basis points the average return of peers in the Morningstar World Allocation category, reflected the strength of the Fund’s growth holdings. Also, we manage this Fund with the goal of achieving upside equity participation with potential downside protection over full market cycles. The Fund’s performance captured 90% of the MSCI ACWI Index’s return and 88% of the MSCI World Index’s upside during the six-month period.
Since its inception on September 9, 1996, the Fund returned 8.45% on an annualized basis (Class A shares at net asset value) and outperformed the MSCI ACWI Index return of 6.98% and the MSCI World Index return of 7.02%.
Please discuss the Fund’s lower-volatility characteristics?
We believe the Fund’s historical lower-volatility characteristics are a by-product of our investment style and focus on participating in equity market upside with less volatility than the market as a whole. Beta is one popular statistic for measuring volatility. Beta considers a fund’s historic volatility versus the market, which is assigned a beta of 1.0. A fund with half the volatility of the market would have a beta of 0.5, while a fund with a beta of 2.0 would have been twice as volatile as the market.
Since its inception, the Fund has had a beta of 0.69 (Class A shares) versus the MSCI ACWI Index. The Fund has therefore outperformed the broader equity market, as measured by the MSCI ACWI Index, with less volatility than the equity markets. Please note that past performance does not indicate future results and that beta is one of many measures of risk.
What factors influenced performance?
From a geographic perspective, the Fund’s country weights contributed positively to performance while selection within countries trailed. In particular, overweight positions and stronger selection in South Africa, Hong Kong and Denmark led to positive results while lagging selection in China and the U.S. hampered performance.
In terms of economic sectors, selection in industrials added the most value in the period versus the MSCI ACWI Index benchmark. Our team has emphasized companies positioned to benefit from weakened currency and enhanced export opportunities. As a result of this emphasis, we have overweighted the industrial machinery industry, in particular those companies generating significant export growth and tied to one of our key themes of robotics and automation.
An overweight to the consumer discretionary sector also contributed positively to performance. Specifically, the Fund’s overweight stance and holdings in the cable and satellite and the apparel and accessories industries outperformed. We own companies that we believe comprise attractive growth fundamentals and are well positioned to
OVERVIEW
The Fund invests primarily in global equity and convertible securities in an attempt to balance risk and reward while providing growth and income.
KEY FEATURES
| | ¡ | | Combining equity and convertible holdings, aiming to limit downside risk while potentially capturing upside equity participation | |
| | ¡ | | Provide a core holding option that aims to maintain a consistent risk posture throughout the market cycle | |
| | ¡ | | Participate in the upside movements of the global equity market while lessening the damage of down periods | |
PORTFOLIO FIT
The Fund can provide a long-term core allocation to global equities with the potential for lower volatility over market cycles.
| | |
| FUND NASDAQ SYMBOLS |
A Shares | | CVLOX |
B Shares | | CVLDX |
C Shares | | CVLCX |
I Shares | | CGCIX |
R Shares | | CVLRX |
| | | |
|
| FUND CUSIP NUMBERS |
A Shares | | 128119500 |
B Shares | | 128119732 |
C Shares | | 128119708 |
I Shares | | 128119609 |
R Shares | | 128119385 |
| | | |
Calamos Global Growth and Income Fund
| | | | |
| SECTOR WEIGHTINGS | |
Information Technology | | | 25.0 | % |
Consumer Discretionary | | | 17.4 | |
Financials | | | 15.3 | |
Health Care | | | 12.0 | |
Industrials | | | 9.6 | |
Energy | | | 6.7 | |
Consumer Staples | | | 5.5 | |
Materials | | | 2.6 | |
Utilities | | | 1.3 | |
Telecommunication Services | | | 0.6 | |
Other | | | 0.4 | |
| | | | | |
Sector weightings are subject to change daily and are calculated as a percentage of net assets. The table excludes cash or cash equivalents, any government/sovereign bonds or broad based index hedging securities the Fund may hold.
tap into rising consumption in both developed and emerging markets. Recent holdings span a number of industries including cable and satellite, apparel and accessories, automobiles, and Internet retail.
Selection in and a modest underweight to health care hindered performance. In particular, holdings in the health care equipment industry lagged their index peers. Select companies in the index, which we didn’t own, performed especially well in response to stock-specific events, such as merger and acquisition transactions. Within health care, we prefer the higher-growth, higher-innovation opportunities in select industries including pharmaceuticals, biotechnology and health care technology. Fund holdings are mainly diversified across the U.S., Europe and Japan.
Although the Fund’s underweight allocation added value, selection in the materials sector held back performance. Holdings in the construction materials industry lagged because of company-specific factors. We have held an underweight to materials as we believe commodity prices will remain under pressure from measured global growth and a stronger U.S. dollar.
MANAGING RISK OVER MARKET CYCLES
The Global Growth and Income Fund historically has captured a significant amount of upside during bull markets and limited losses when global markets have plunged.
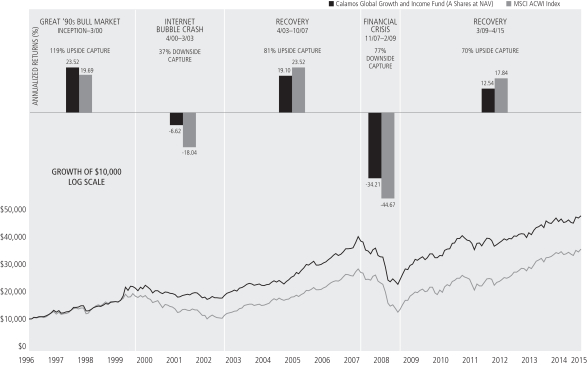
Performance data quoted represents past performance, which is no guarantee of future results. Current performance may be lower or higher than the performance quoted. The principal value and return of an investment will fluctuate so that your shares, when redeemed, may be worth more or less than their original cost. Performance reflected at NAV does not include the Fund’s maximum front-end sales load of 4.75% had it been included, the Fund’s return would have been lower. For the most recent fund performance information visit www.calamos.com.
There is no assurance that the fund will achieve or maintain its investment objective. Results are before taxes on fund distributions and assume reinvestment of dividends and capital gains. Index data shown is from 11/1/88, since comparative index data is available only for full monthly periods.
| | | | |
| 42 | | CALAMOS OPEN-END FAMILY OF FUNDS SEMIANNUAL REPORT | | |
Calamos Global Growth and Income Fund
Logarithmic scales can be useful when looking at performance data over a long period of time. Common percent changes are represented by an equal spacing between the numbers in the scale. For example, the distance between $1 and $2 is equal to the distance between $2 and $4 because both scenarios represent a 100% increase in price.
Upside capture ratio measures a manager’s performance in up markets relative to the named index itself. It is calculated by taking the security’s upside capture return and dividing it by the benchmark’s upside capture return. Downside capture ratio measures manager’s performance in down markets as defined by the named index. A down-market is defined as those periods (months or quarters) in which named index return is less than 0. In essence, it tells you what percentage of the downmarket was captures by the manager. For example, if the ratio is 110%, the manager has captured 110% of the down-market and therefore underperformed the market on the downside. Source: State Street Corporation and Lipper, Inc.
Please describe the Fund’s participation in up and down markets since its inception.
The Fund invests in a combination of stocks, convertible securities and bonds to offer a total return-oriented investment that seeks to keep a consistent balance of risk and reward through full market cycles. As we focus on managing volatility, we strive to participate in a greater portion of equity market upside than downside.
There are a variety of ways to express up- and down-market capture, whether it is calculated daily, monthly, quarterly, etc., or as we look at the markets—in longer-term up- and down-market trends. In the chart above, you can see how the Fund performed through a few distinct market periods. In the five major market periods shown, we believe that the Fund has participated in the upside movements of the equity market while limiting the downside exposure during times of tumult.
How is the Fund positioned?
We position the Fund with the goal of providing the opportunity for upside equity participation along with downside resilience in the event that markets retreat. We favor company structures that offer compelling risk/reward characteristics relative to their underlying common stocks. Generally, we view prevailing valuations of global growth companies relative to value companies as attractive by historic standards, and we anticipate outperformance in growth areas as the global economic recovery advances. At the same time, we remain mindful of risk and valuation discipline and are cognizant of the many cross-currents in markets and the potential effects of diverging monetary policies. We believe the global equity opportunity set is well suited to our active, risk-aware approach.
In the U.S., we favor companies that we believe possess attractive secular growth characteristics and are positioned to execute well and outperform despite a backdrop of low global growth. We are investing in companies with attractive growth fundamentals, increasing returns on invested capital and reasonable valuations.
During the period, we increased the Fund weight to Japan and held a moderate overweight at period end. We did this based on a combination of factors including relative valuation, accommodative monetary policy, and corporate reforms. Economic data has been mixed to stable, but we are seeing individual companies beat expectations with better strategic investments and shareholder friendly policies. For example, we have seen an increase in stock buybacks, dividend payouts and capital expenditures. Against this backdrop, we believe Japan’s market is well positioned to climb, although a bottom-up approach remains paramount.
We maintained a relatively stable weight in Europe during the period. Fund holdings benefited from strong market performance year-to-date, driven by stabilizing economic data, positive corporate revisions, a weaker euro and the central bank’s quantitative easing program. We are favoring companies benefiting from asset reflation and export opportunities born out of the weakened currency.
With respect to emerging markets, we expect divergences in the near-term prospects of many economies due to differing growth prospects and structural reform. We have favored commodity consumers relative to producers (given the lower-cost environment), exporters benefiting from increased developed market demand and companies benefitting from pro-growth structural reform opportunities at home and abroad in the markets they serve.
Calamos Global Growth and Income Fund
We are focused on a combination of secular and cyclical growth areas including information technology, consumer discretionary, health care and industrials. We increased the Fund’s weight to health care, consumer discretionary and industrials during the period and reduced the overweight to technology as we sold holdings on company-specific issues. We also trimmed energy and materials because of weaker fundamentals. The largest underweight positions are in energy, materials, consumer staples and financials reflecting our view of relative growth and valuation.
We increased the Fund’s weight to the health care sector by virtue of market performance and our identification of bottom-up opportunities offering attractive growth, quality and innovation characteristics. We decreased Fund weight to energy as a consequence of our relatively cautious view of sector fundamentals, in addition to the sector’s lagging performance.
What closing thoughts do you have for Fund shareholders?
We expect global equities to deliver additional gains in 2015 but we believe investors should anticipate periods of higher volatility as markets confront sluggish global growth, policy uncertainty, and fluctuations in currencies and commodities. We believe merger and acquisition and share buyback activity may provide a floor for market valuations, and support higher prices and investor demand for equities and equity-sensitive securities. However, we believe markets will continue to confront uncertainty as commodity prices fluctuate and geopolitical events and global growth fears linger.
It’s under this partly cloudy, partly sunny sky that we believe the benefits of convertible securities are especially pronounced. Convertibles have tended to perform well in a slow-growth environment, when stocks are rising and interest rates are increasing slowly. We believe convertibles can also benefit from market volatility, as their embedded option can become more valuable. Because convertibles combine equity and fixed income characteristics, they offer the opportunity for upside equity participation with potential downside protection when equity markets decline.
In summary, we believe global equities and convertible securities remain attractive against a backdrop of moderate economic growth, low inflation, reasonable valuations, and highly accommodative central bank policy.
ANNUALIZED RETURN: SINCE INCEPTION (9/9/96) THROUGH 4/30/15
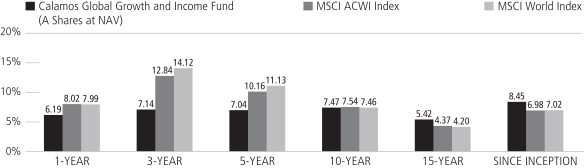
Performance data quoted represents past performance, which is no guarantee of future results. Current performance may be lower or higher than the performance quoted.
The principal value and investment return of an investment will fluctuate so that your shares, when redeemed, may be worth more or less than their original cost. You can obtain performance data current to the most recent month end by visiting www.calamos.com. Average annual total return measures net investment income and capital gain or loss from portfolio investments as an annualized average. All performance shown assumes reinvestment of dividends and capital gains distributions. Performance is for the Fund’s Class A shares at net asset value and does not include the Fund’s maximum front-end sales charge of 4.75%—had it been included, the Fund’s return would have been lower. The Fund also offers Class B, Class C, Class I and Class R shares, the performance of which may vary. Source: State Street Corporation and Lipper, Inc.
| | | | |
| 44 | | CALAMOS OPEN-END FAMILY OF FUNDS SEMIANNUAL REPORT | | |
Calamos Global Growth and Income Fund
GROWTH OF $10,000: FOR THE 10-YEAR PERIOD ENDED 4/30/15
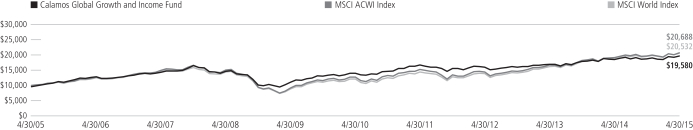
AVERAGE ANNUAL TOTAL RETURN† AS OF 4/30/15
| | | | | | | | | | | | | | | | | | | | |
| | | 6
MONTHS | | 1
YEAR | | 5
YEARS | | 10 YEARS
OR ^SINCE
INCEPTION |
Class A Shares – Inception 9/9/96 | | | | | | | | | | | | | | | | | | | | |
Without Sales Charge | | | | 4.74 | % | | | | 6.19 | % | | | | 7.04 | % | | | | 7.47 | % |
With Sales Charge | | | | -0.24 | | | | | 1.17 | | | | | 6.00 | | | | | 6.95 | |
Class B Shares – Inception 9/11/00 | | | | | | | | | | | | | | | | | | | | |
Without Sales Charge | | | | 4.30 | | | | | 5.42 | | | | | 6.25 | | | | | 6.82 | |
With Sales Charge | | | | -0.05 | | | | | 1.02 | | | | | 5.96 | | | | | 6.82 | |
Class C Shares – Inception 9/24/96 | | | | | | | | | | | | | | | | | | | | |
Without Sales Charge | | | | 4.28 | | | | | 5.39 | | | | | 6.24 | | | | | 6.66 | |
With Sales Charge | | | | 3.43 | | | | | 4.53 | | | | | 6.24 | | | | | 6.66 | |
Class I Shares – Inception 9/18/97 | | | | 4.77 | | | | | 6.30 | | | | | 7.29 | | | | | 7.73 | |
Class R Shares – Inception 3/1/07 | | | | 4.48 | | | | | 5.84 | | | | | 6.76 | | | | | 4.23 | ^ |
Performance data quoted represents past performance, which is no guarantee of future results. Current performance may be lower or higher than the performance quoted. The principal value and investment return of an investment will fluctuate so that your shares, when redeemed, may be worth more or less than their original cost.
As of the prospectus dated 3/1/15, the Fund’s gross expense ratio for Class A shares is 1.44%; Class B and C shares is 2.19%; Class I shares is 1.19%; Class R shares is 1.69%.
| † | Average annual total return measures net investment income and capital gain or loss from portfolio investments as an annualized average assuming reinvestment of dividends and capital gains distributions. Load-adjusted returns are adjusted for the maximum front-end sales load of 4.75% for Class A shares and returns for Class B and C shares have been adjusted for the contingent deferred sales charge (CDSC). |
NOTES:
The graphs do not reflect the income taxes that you would pay on fund distributions or the redemption of fund shares. Fund performance includes reinvestment of dividends and adjustment for the maximum sales charge for Class A shares. The performance of other classes will vary from the performance of the class shown based on the difference in sales charges and fees paid by shareholders investing in different share classes.
The MSCI ACWI Index is a free float-adjusted market capitalization weighted index that is designed to measure the equity market performance of developed and emerging markets.
The MSCI World Index (U.S. Dollars) is a market-capitalization weighted index composed of companies representative of the market structure of developed market countries in North America, Europe and the Asia/Pacific region. Since inception data for the index is shown from 9/30/96 since data is only available for full monthly periods. Source: Lipper, Inc.
Index returns assume reinvestment of dividends and do not reflect deduction of fees and expenses. It is not possible to invest directly in an index.
Calamos Convertible Fund
OVERVIEW
The Fund invests primarily in convertible securities of U.S. companies that are diversified across market sector and credit quality.
KEY FEATURES
| | ¡ | | Leverage more than three decades of research in convertible security investing | |
| | ¡ | | A portfolio diversified across market sector and credit quality emphasizing mid-sized companies with higher-quality balance sheets | |
| | ¡ | | Seeks to provide upside participation in equity markets with less exposure to downside than an equity-only portfolio over a full market cycle | |
PORTFOLIO FIT
The Fund offers a way to potentially manage risk alongside an equity allocation with securities that participate in upside equity movements with limited downside participation.
| | |
| FUND NASDAQ SYMBOLS |
A Shares | | CCVIX |
B Shares | | CALBX |
C Shares | | CCVCX |
I Shares | | CICVX |
R Shares | | CCVRX |
| | | |
|
| FUND CUSIP NUMBERS |
A Shares | | 128119401 |
B Shares | | 128119773 |
C Shares | | 128119823 |
I Shares | | 128119864 |
R Shares | | 128119369 |
| | | |
CALAMOS CONVERTIBLE FUND
INVESTMENT TEAM DISCUSSION
How has the Fund performed?
For the 6-month period ended April 30, 2015, Calamos Convertible Fund returned 1.60% (Class A shares at net asset value). For this same period, the BofA Merrill Lynch All U.S. Convertibles Index returned 3.91%, the Value Line Convertible Index gained 5.20%, and the S&P 500 Index returned 4.40%.
The Fund has historically been managed with an investment philosophy that seeks to use convertibles as a means of participating in the equity market’s upside while holding up better during down market periods. The portfolio delivered positive results but trailed the BofA Merrill Lynch All U.S. Convertibles Index, which was led by the strong performance of convertibles with the greatest equity sensitivity. We have been significantly underweight to these convertibles relative to the index as they do not offer downside protection when their underlying equities retreat.
Since its inception on June 21, 1985, the Fund returned 9.38% on an annualized basis (Class A shares at net asset value), compared with a gain of 8.86% for the Value Line Convertible Index and 10.89% for the S&P 500 Index.
Please discuss the Fund’s lower-volatility characteristics.
We believe the Fund’s historical lower-volatility characteristics are a by-product of our investment style and we focus on participating in equity market upside with less volatility than the market as a whole. Beta is one popular statistic for measuring volatility. Beta considers a fund’s historic volatility versus a market index, which is assigned a beta of 1.0. A fund with half the volatility of the benchmark index has a beta of 0.5, while a fund with a beta of 2.0 is twice as volatile as the market.
Since its inception, the Fund had a beta of 0.63 (Class A shares) versus the S&P 500 Index. The Fund has therefore provided comparable performance to the broader equity market, as measured by the S&P 500 Index, with less volatility. Please note that past performance does not indicate future results and that beta is one of many measures of risk.
What factors influenced performance over the period?
As discussed above, we actively seek securities that we believe offer the best risk-reward characteristics. This may lead us to invest differently from the benchmark, which has become increasingly equity sensitive with the long-term bull market. The most equity-sensitive convertibles tend to behave more like their underlying stocks and may have larger losses in down markets than other, more bond-like convertibles. Based on our proprietary analysis, about 40% of convertibles in the BofA Merrill Lynch All U.S. Convertibles Index are equity sensitive, as they participate in about 80% of the movement of their underlying equities. Those convertibles represented more than 70% of the index return during the period. Our underweight toward these types of convertibles hindered performance.
| | | | |
| 46 | | CALAMOS OPEN-END FAMILY OF FUNDS SEMIANNUAL REPORT | | |
Calamos Convertible Fund
On an economic sector basis, the Fund’s underweight toward the energy sector, the worst-performing sector during the period, contributed to relative performance. We had no holdings in the coal and consumer fuel industry, which dropped significantly, and we were underweight toward the oil and gas exploration industry that performed poorly. Further, the Fund’s underweight toward the materials sector, the second-worst performer behind energy, contributed to relative performance. We did not have any holdings in the steel or aluminum industries, which suffered losses.
Selection in the health care sector hindered performance. As mentioned previously, the portfolio had a considerably lower allocation to convertibles displaying high equity sensitivity within the outperforming biotechnology industry. Selection within financials also held back results, as diversified banks and life and health insurance lagged. We also were underweight to the relatively strong-performing REITs industries.
| | | | |
| SECTOR WEIGHTINGS | |
Information Technology | | | 32.8 | % |
Health Care | | | 23.0 | |
Financials | | | 14.8 | |
Consumer Discretionary | | | 13.0 | |
Energy | | | 6.4 | |
Industrials | | | 3.7 | |
Utilities | | | 2.7 | |
Consumer Staples | | | 1.5 | |
Telecommunication Services | | | 1.2 | |
| | | | | |
Sector weightings are subject to change daily and are calculated as a percentage of net assets. The table excludes cash or cash equivalents, any government/sovereign bonds or broad based index hedging securities the Fund may hold.
MANAGING RISK OVER MARKET CYCLES
Over the last 20 years, the Convertible Fund historically has captured a significant amount of upside during bull markets and limited losses when markets have plunged.
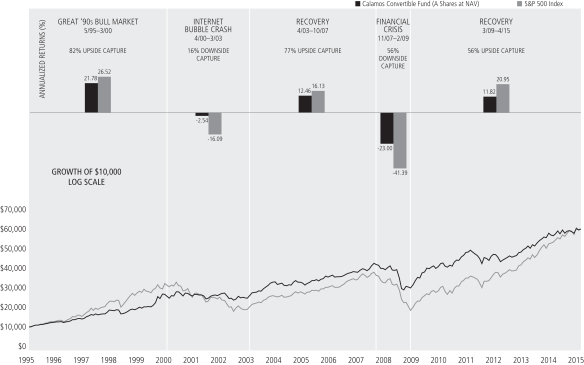
Performance data quoted represents past performance, which is no guarantee of future results. Current performance may be lower or higher than the performance quoted. The principal value and return of an investment will fluctuate so that your shares, when redeemed, may be worth more or less than their original cost. Performance reflected at NAV does not include the Fund’s maximum front-end sales load of 4.75% had it been included, the Fund’s return would have been lower. For the most recent fund performance information visit www.calamos.com.
There is no assurance that the Fund will achieve or maintain its investment objective. Results are before taxes on fund distributions and assume reinvestment of dividends and capital gains.
Calamos Convertible Fund
Logarithmic scales can be useful when looking at performance data over a long period of time. Common percent changes are represented by an equal spacing between the numbers in the scale. For example, the distance between $1 and $2 is equal to the distance between $2 and $4 because both scenarios represent a 100% increase in price.
Upside capture ratio measures a manager’s performance in up markets relative to the named index itself. It is calculated by taking the security’s upside capture return and dividing it by the benchmark’s upside capture return. Downside capture ratio measures manager’s performance in down markets as defined by the named index. A down-market is defined as those periods (months or quarters) in which named index return is less than 0. In essence, it tells you what percentage of the downmarket was captures by the manager. For example, if the ratio is 110%, the manager has captured 110% of the down-market and therefore underperformed the market on the downside. Source: State Street Corporation and Lipper, Inc.
Please describe the Fund’s participation in up and down markets since its inception.
Convertible securities combine characteristics of stocks and fixed income securities. Like stocks, convertibles typically offer potential upside participation in rising equity markets. Like bonds, convertible securities may provide income and potential downside protection in declining equity markets.
There are a variety of ways to express up-market and down-market capture, whether it is calculated daily, monthly, quarterly, or as we look at the markets—in longer-term up and down market trends. In the chart above, you can see how the Convertible Fund performed compared to the U.S. equity market through distinct market periods over the past 20 years. In the five major market periods shown, we believe that the Fund has participated in the upside movements of the equity market while limiting the downside exposure during times of tumult.
How is the Fund positioned?
Reflecting our belief that the economy remains within the midrange of its cycle, the portfolio is positioned heaviest towards the cyclical growth sectors, which we believe tend to outperform in this phase. As such, the portfolio’s largest allocations are to the information technology, health care, and consumer discretionary sectors. We also expect heightened volatility in this phase of the market cycle and continue to manage the portfolio with a risk-aware mindset. In response, we advocate an active approach to convertibles and place emphasis on those issues which strike a balance of risk and reward. Conversely, we remain underweight to convertibles displaying the most equity and credit sensitivities.
Valuations are attractive and our team is finding many securities that meet our criteria. More specifically, we seek out issues that offer higher skew on the upside. To identify these securities, we combine our proprietary credit research (given our emphasis on downside resilience) and equity analysis (to secure a healthy measure of equity upside).
We increased the portfolio’s weight in the health care sector by adding or swapping holdings within the pharmaceuticals and biotechnology industries. We continue to see the health care sector benefiting from several trends including increased access to health care in emerging markets and the U.S. implementation of the Affordable Care Act. We pared back the industrials sector on lower oil prices, a strong U.S. dollar and a sluggish global economy. Specifically, we sold holdings in the construction machinery and heavy trucks industry.
What are your closing thoughts for Fund shareholders?
Convertible securities have tended to perform well in a slow-growth environment, when stocks are rising and interest rates are increasing slowly. We believe convertibles can also benefit from market volatility, as their embedded option can become more valuable. Because convertibles combine equity and fixed income characteristics, they offer the opportunity for upside equity participation with potential downside protection when equity markets decline. Against this backdrop, we believe the benefits of convertible securities are especially pronounced.
| | | | |
| 48 | | CALAMOS OPEN-END FAMILY OF FUNDS SEMIANNUAL REPORT | | |
Calamos Convertible Fund
ANNUALIZED RETURN: SINCE INCEPTION (6/21/85) THROUGH 4/30/15
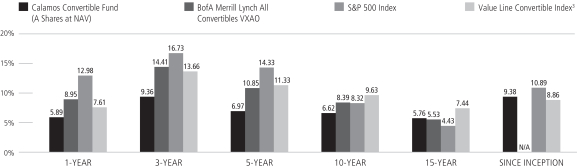
Performance data quoted represents past performance, which is no guarantee of future results. Current performance may be lower or higher than the performance quoted.
The principal value and investment return of an investment will fluctuate so that your shares, when redeemed, may be worth more or less than their original cost. You can obtain performance data current to the most recent month end by visiting www.calamos.com. Average annual total return measures net investment income and capital gain or loss from portfolio investments as an annualized average. All performance shown assumes reinvestment of dividends and capital gains distributions. Performance is for the Fund’s Class A shares at net asset value and does not include the Fund’s maximum front-end sales charge of 4.75%—had it been included, the Fund’s return would have been lower. The Fund also offers Class B, Class C, Class I and Class R shares, the performance of which may vary. Source: State Street Corporation, Lipper, Inc., and Mellon Analytical Solutions, LLC.
Calamos Convertible Fund
GROWTH OF $10,000: FOR THE 10-YEAR PERIOD ENDED 4/30/15
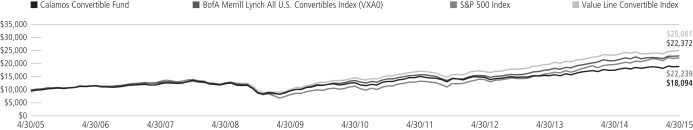
AVERAGE ANNUAL TOTAL RETURN† AS OF 4/30/15
| | | | | | | | | | | | | | | | | | | | |
| | | 6
MONTHS | | 1
YEAR | | 5
YEARS | | 10 YEARS
OR ^SINCE
INCEPTION |
Class A Shares – Inception 6/21/85 | | | | | | | | | | | | | | | | | | | | |
Without Sales Charge | | | | 1.60 | % | | | | 5.89 | % | | | | 6.97 | % | | | | 6.62 | % |
With Sales Charge | | | | -3.24 | | | | | 0.85 | | | | | 5.94 | | | | | 6.11 | |
Class B Shares – Inception 9/11/00 | | | | | | | | | | | | | | | | | | | | |
Without Sales Charge | | | | 1.19 | | | | | 5.06 | | | | | 6.16 | | | | | 5.99 | |
With Sales Charge | | | | -3.65 | | | | | 0.06 | | | | | 5.85 | | | | | 5.99 | |
Class C Shares – Inception 7/5/96 | | | | | | | | | | | | | | | | | | | | |
Without Sales Charge | | | | 1.23 | | | | | 5.10 | | | | | 6.16 | | | | | 5.83 | |
With Sales Charge | | | | 0.27 | | | | | 4.12 | | | | | 6.16 | | | | | 5.83 | |
Class I Shares – Inception 6/25/97 | | | | 1.71 | | | | | 6.18 | | | | | 7.24 | | | | | 6.89 | |
Class R Shares – Inception 3/1/07 | | | | 1.50 | | | | | 5.62 | | | | | 6.70 | | | | | 5.50 | ^ |
Performance data quoted represents past performance, which is no guarantee of future results. Current performance may be lower or higher than the performance quoted. The principal value and investment return of an investment will fluctuate so that your shares, when redeemed, may be worth more or less than their original cost.
As of the prospectus dated 3/1/15, the Fund’s gross expense ratio for Class A shares is 1.11%; Class B and C shares is 1.86%; Class I shares is 0.86%; Class R shares is 1.36%.
| † | Average annual total return measures net investment income and capital gain or loss from portfolio investments as an annualized average assuming reinvestment of dividends and capital gains distributions. Load-adjusted returns are adjusted for the maximum front-end sales load of 4.75% for Class A shares and returns for Class B and C shares have been adjusted for the contingent deferred sales charge (CDSC). |
NOTES:
The graphs do not reflect the income of taxes that you would pay on fund distributions or the redemption of fund shares. Fund performance includes reinvestment of dividends and adjustment for the maximum sales charge for Class A shares. The performance of other classes will vary from the performance of the class shown based on the difference in sales charges and fees paid by shareholders investing in different share classes.
The BofA Merrill Lynch All U.S. Convertibles Ex-Mandatory Index is comprised of approximately 700 issues of only convertible bonds and preferreds of all qualities.
The S&P 500 Index is an unmanaged index generally considered representative of the U.S. stock market.
The Value Line Convertible Index is an equally-weighted index of the larger convertibles, representing 90% of the U.S. convertible securities market. Index data shown for the Annualized Returns Since Inception graph is from 6/30/85, since comparative index data is only available for full monthly periods. Source: Mellon Analytical Solutions, LLC.
Index returns assume reinvestment of dividends and do not reflect deduction of fees and expenses. It is not possible to invest directly in an index.
| | | | |
| 50 | | CALAMOS OPEN-END FAMILY OF FUNDS SEMIANNUAL REPORT | | |
Calamos Global Convertible Fund
GLOBAL CONVERTIBLE FUND
INVESTMENT TEAM DISCUSSION
What is your rationale behind launching this Fund?
Calamos introduced the Calamos Global Convertible Fund on December 31, 2014, as a natural extension of the investment team’s established capabilities. Calamos has actively managed convertibles for more than 30 years and managed global convertible portfolios for institutional clients since 2001. Global convertible issuance has been robust in recent years, and 2014 was another strong year. Through the fund, investors can take advantage of the healthy sector breadth in convertible issuance as well as regional diversification.
Although the Federal Reserve may be patient, sooner or later interest rates will rise. When they do, traditional fixed-income investments often struggle. Historically, convertibles have proven less vulnerable to rate increases than traditional debt. In general, the more a convertible’s price is determined by the value of its underlying equity, the greater its resilience to rising interest rates, which allows it to outperform traditional bonds when rates rise.
Therefore, we believe the case for convertible securities is strong, and the use of convertibles in a risk-managed strategy may provide benefits that stock and bond allocations alone cannot. However, we believe convertible securities require active management to achieve a desired outcome.
How has the Fund performed?
Since the Fund’s inception on December 31, 2014 to April 30, 2015, the Global Convertible Fund returned 4.10% (Class A shares at net asset value). For this same period, the BofA Merrill Lynch Global 300 Convertible Index returned 3.92%.
The Fund is managed with an investment philosophy that seeks to use convertibles as a means of participating in the equity market’s upside while holding up better during down market periods. The portfolio outperformed the benchmark in a solid period for global convertibles, which captured most of the equity upside.
What factors influenced performance over the period?
In our active investment approach, we seek convertibles that we believe will participate in the equity market’s upside and have limited downside when equities fall. This philosophy generally leads us to invest in total return convertibles, or convertibles that display asymmetric upside and downside characteristics relative to their underlying stocks. During the inception-to-date period, the Fund’s A shares participated in the equity upside by capturing 84% of the MSCI World Index’s return.
At the same time, from a convertible market standpoint, the convertibles that displayed the highest equity sensitivity performed the strongest during the period. In the benchmark, about 39% of the convertibles are the most equity sensitive convertibles, defined as those that capture at least 80% of underlying equity movement (up or down). These names contributed 59% of the benchmark return. Given our more defensive investment philosophy, the Fund was significantly underweight to these more sensitive securities, which hindered results.
OVERVIEW
The Fund invests in global convertible securities, striving to balance risk and reward while providing growth and income.
KEY FEATURES
| | ¡ | | Provides broadly diversified exposure to the global convertible bond universe | |
| | ¡ | | Leverages more than 30 years of research in convertible security investing | |
| | ¡ | | Seeks to provide upside participation in equity markets with less exposure to downside than an equity-only portfolio over a full market cycle | |
| | ¡ | | Blends global investment themes and fundamental research via active management | |
PORTFOLIO FIT
Consisting of convertible securities that can participate in upside equity movements with potentially limited downside exposure, the Fund can provide a means to manage risk vis-a-vis an equity allocation. The Fund can also serve a role within a fixed-income allocation, as convertibles have performed well during periods of rising interest rates and inflation.
| | |
| FUND NASDAQ SYMBOLS |
A Shares | | CAGCX |
C Shares | | CCGCX |
I Shares | | CXGCX |
R Shares | | CRGCX |
|
| FUND CUSIP NUMBERS |
A Shares | | 128120748 |
C Shares | | 128120730 |
I Shares | | 128120722 |
R Shares | | 128120714 |
Calamos Global Convertible Fund
| | | | |
| SECTOR WEIGHTINGS | |
Information Technology | | | 16.2 | % |
Financials | | | 12.3 | |
Health Care | | | 6.8 | |
Consumer Discretionary | | | 6.5 | |
Industrials | | | 5.3 | |
Energy | | | 2.3 | |
Telecommunication Services | | | 2.0 | |
Materials | | | 1.8 | |
Utilities | | | 0.8 | |
| | | | | |
Sector weightings are subject to change daily and are calculated as a percentage of net assets. The table excludes cash or cash equivalents, any government/sovereign bonds or broad based index hedging securities the Fund may hold.
From an economic sector perspective, the Fund’s overweight position to and selection in industrials added value relative to the benchmark, in particular holdings in the aerospace and defense and electrical equipment businesses. Selection in the information technology sector also contributed with investments in the communication equipment, semiconductors and application software industries. Selection in the health care sector lagged, as we were underweight to the strong performing biotechnology and pharmaceuticals industries. Further, selection in the materials sector hindered results, as the Fund lacked holdings in the strong performing steel industry.
From a geographic perspective, the Fund’s underweight toward Europe and the weakened euro currency added value and our selection in Europe strongly outperformed. The underweight toward emerging markets and Latin America hindered results.
How is the Fund positioned?
The portfolio is positioned towards the high-growth sectors of the market which include information technology, financials, consumer discretionary, industrials and health care. As equity prices continue to move higher, the convertible market has become increasingly equity sensitive, as discussed above. While the convertible index is positioned to participate more fully with the equity market’s upside, it also offers less downside protection should the markets retreat. We recognize that there will be volatility in the markets and will proceed with a risk-aware mindset. As such, we follow an active approach to convertibles and emphasize those issues which strike a balance of risk and reward.
Versus the benchmark, the Fund has heavier allocations in the U.S. and emerging markets. The portfolio is significantly underweight in Europe.
What are your closing thoughts for shareholders?
We expect global convertibles to deliver additional gains in 2015, but we believe investors should anticipate periods of higher volatility as markets confront sluggish global growth, policy uncertainty, and fluctuations in currencies and commodities. We believe merger and acquisition and share buyback activity may provide a floor for market valuations and support higher prices. We believe markets will continue to confront uncertainty as commodity prices fluctuate and geopolitical events and global growth fears linger.
Although many investors remain underweight in Europe and Japan, potential catalysts could spur further investment. These include changing monetary conditions, relative valuations, stable and improving macro fundamentals, and more upbeat sentiment. U.S. companies remain relatively upbeat given solid earnings, strong balance sheets, and resilient consumer demand, while concerns linger regarding the impact of the strong U.S. dollar on multinational businesses and persistently low capital expenditures continue to plague many industries. We maintain our belief that global convertibles remain attractive against a backdrop of moderate economic growth, low inflation, reasonable valuations and highly accommodative central bank policy.
| | | | |
| 52 | | CALAMOS OPEN-END FAMILY OF FUNDS SEMIANNUAL REPORT | | |
Calamos Global Convertible Fund
AVERAGE ANNUAL TOTAL RETURN† AS OF 4/30/15
| | | | | |
| | | SINCE
INCEPTION* |
Class A Shares – Inception 12/31/2014 | | | | | |
Without Sales Charge | | | | 4.10 | % |
With Sales Charge | | | | -0.86 | |
Class C Shares – Inception 12/31/2014 | | | | | |
Without Sales Charge | | | | 3.90 | |
With Sales Charge | | | | 2.90 | |
Class I Shares – Inception 12/31/2014 | | | | 4.30 | |
Class R Shares – Inception 12/31/2014 | | | | 4.10 | |
Performance data quoted represents past performance, which is no guarantee of future results. Current performance may be lower or higher than the performance quoted. The principal value and investment return of an investment will fluctuate so that your shares, when redeemed, may be worth more or less than their original cost. You can obtain performance data current to the most recent month end by visiting www.calamos.com.
As of the prospectus dated 3/1/15, the Fund’s gross expense ratio for Class A shares is 2.75%; Class C shares is 3.50%; Class I shares is 2.50%; Class R shares is 3.00%. The fund’s investment adviser has contractually agreed to reimburse the fund expenses through March 1, 2017, to the extent necessary so that total annual fund operating expenses (excluding taxes, interest, short interest, short dividend expenses, brokerage commissions, acquired funds fees and expenses and extraordinary expenses, if any) of Class A, Class C, Class I and Class R are limited to 1.35%, 2.10%, 1.10% and 1.60% of average net assets, respectively.
| † | Average annual total return measures net investment income and capital gain or loss from portfolio investments as an annualized average assuming reinvestment of dividends and capital gains distributions. Load-adjusted returns are adjusted for the maximum front-end sales load of 4.75% for Class A shares and C shares have been adjusted for the contingent deferred sales charge (CDSC). |
| * | Cumulative since inception. |
NOTES:
The BofA Merrill Lynch Global 300 Convertible Index is a global convertible index composed of companies representative of the market structure of countries in North America, Europe and the Asia/Pacific region. Barclays Global Aggregate Index provides a broad-based measure of the global investment grade fixed-rate debt markets.
Unmanaged index returns assume reinvestment of any and all distributions and, unlike fund returns, do not reflect fees, expenses or sales charges. Investors cannot invest directly in an index.
Calamos Total Return Bond Fund
OVERVIEW
The Fund invests primarily in U.S. fixed income instruments, including government and agency securities, corporate debt and high yield debt.
KEY FEATURES
| | ¡ | | Active management blending global investment themes and fundamental research | |
| | ¡ | | Opportunistic sector allocations that provide greater flexibility in managing risk and reward | |
| | ¡ | | Broad diversified exposure to U.S. investment-grade bond market and complementary holdings that may include high yield securities, international bonds and currencies | |
| | ¡ | | Active interest rate analysis focused on conservative portfolio duration positioning, given our expectation of rising interest rates | |
PORTFOLIO FIT
The Fund offers broad exposure to the U.S. investment-grade bond market.
| | |
| FUND NASDAQ SYMBOLS |
A Shares | | CTRAX |
B Shares | | CTXBX |
C Shares | | CTRCX |
I Shares | | CTRIX |
R Shares | | CTRRX |
| | | |
|
| FUND CUSIP NUMBERS |
A Shares | | 128119310 |
B Shares | | 128119294 |
C Shares | | 128119286 |
I Shares | | 128119278 |
R Shares | | 128119260 |
| | | |
|
| ASSET ALLOCATION |
| | |
Corporate Bonds | | 88.4% |
U.S. Government and Agency Securities | | 8.8 |
Cash and Receivables/Payables | | 2.8 |
| | | |
Asset allocation is subject to change daily and is calculated as a percentage of net assets.
TOTAL RETURN BOND FUND
INVESTMENT TEAM DISCUSSION
How has the Fund performed?
For the six-month period ended April 30, 2015, Calamos Total Return Bond Fund gained 2.07% (Class A shares at net asset value) versus a 2.06% return for the Barclays U.S. Aggregate Bond Index.
Since its inception on June 27, 2007, the Fund gained 5.01% on an annualized basis (Class A shares at net asset value) versus a 5.21% return for the Barclays U.S. Aggregate Bond Index.
What factors influenced performance over the period?
The Fund benefited from its significant overweight in corporate bonds, which outperformed versus other bond sectors. Additionally, performance was aided by strong selection in corporate bonds and the overweight to BBB and BB credit tiers. The lack of mortgage and agency holdings also contributed, as those segments underperformed.
Conversely, the Fund’s shorter duration hindered results as longer-dated bonds outperformed as the yield curve flattened (long-term yields fell more than short-term yields). While the allocation to non-U.S. government bonds in the benchmark was very small, they outperformed versus other bond segments, and the Fund’s lack of ownership in those bonds slightly held back performance.
How is the Fund positioned?
Duration continues to be shorter than the benchmark as we think that the eventual rise in interest rates makes longer-term bonds too risky. The Fund remains overweight to corporate debt, which we believe is the most attractive segment. Within corporate bonds, we favor companies in the financials, consumer discretionary and information technology sectors. Our lightest positions are in utilities, telecommunication services and consumer staples.
What closing thoughts do you have for Fund shareholders?
We believe a combination of lower Treasury yields and moderate economic growth continues to support corporate bonds as companies strengthen their balance sheets and reduce interest expenses. However, we also believe that the focus is on interest rates. Investors are assessing the timing of the Federal Reserve’s first rate hike and the likely tempo of subsequent increases given weaker recent U.S. economic indicators, heightened fears of Greece exiting the euro zone and unimpressive first-quarter earnings. We believe interest rates will be range bound over the next few months while low global government yields offset the Fed’s intent to move inflation toward long-term targets. We feel that the Fund’s shorter duration gives us flexibility to reposition when higher-yield opportunities become available.
| | | | |
| 54 | | CALAMOS OPEN-END FAMILY OF FUNDS SEMIANNUAL REPORT | | |
Calamos Total Return Bond Fund
GROWTH OF $10,000: SINCE INCEPTION (6/27/07) THROUGH 04/30/15
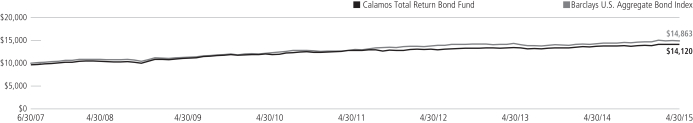
AVERAGE ANNUAL TOTAL RETURN† AS OF 04/30/15
| | | | | | | | | | | | | | | | | | | | |
| | | 6
MONTHS | | 1
YEAR | | 5
YEARS | | SINCE
INCEPTION |
Class A Shares – Inception 6/27/07 | | | | | | | | | | | | | | | | | | | | |
Without Sales Charge | | | | 2.07 | % | | | | 3.55 | % | | | | 3.37 | % | | | | 5.01 | % |
With Sales Charge | | | | -1.78 | | | | | -0.37 | | | | | 2.59 | | | | | 4.50 | |
Class B Shares – Inception 6/27/07 | | | | | | | | | | | | | | | | | | | | |
Without Sales Charge | | | | 1.69 | | | | | 2.78 | | | | | 2.60 | | | | | 4.23 | |
With Sales Charge | | | | -1.79 | | | | | -0.70 | | | | | 2.38 | | | | | 4.23 | |
Class C Shares – Inception 6/27/07 | | | | | | | | | | | | | | | | | | | | |
Without Sales Charge | | | | 1.69 | | | | | 2.88 | | | | | 2.60 | | | | | 4.23 | |
With Sales Charge | | | | 0.70 | | | | | 1.88 | | | | | 2.60 | | | | | 4.23 | |
Class I Shares – Inception 6/27/07 | | | | 2.20 | | | | | 3.91 | | | | | 3.64 | | | | | 5.28 | |
Class R Shares – Inception 6/27/07 | | | | 1.94 | | | | | 3.29 | | | | | 3.11 | | | | | 4.75 | |
Performance data quoted represents past performance, which is no guarantee of future results. Current performance may be lower or higher than the performance quoted. The principal value and investment return of an investment will fluctuate so that your shares, when redeemed, may be worth more or less than their original cost. You can obtain performance data current to the most recent month end by visiting www.calamos.com.
As of the prospectus dated 3/1/15, the Fund’s gross expense ratio for Class A shares is 1.05%; Class B and C shares is 1.80%; Class I shares is 0.80%; Class R shares is 1.29%. The Fund’s investment advisor has contractually agreed to reimburse Fund expenses through March 1, 2017 to the extent necessary so that Total Annual Fund Operating Expenses (excluding taxes, interest, short interest, short dividend expenses, brokerage commissions, acquired fund fees and expenses, and extraordinary expenses, if any) of Class A, Class B, Class C, Class I and Class R are limited to 0.90%, 1.65%, 1.65%, 0.65% and 1.15% of average net assets, respectively.
| † | Average annual total return measures net investment income and capital gain or loss from portfolio investments as an annualized average assuming reinvestment of dividends and capital gains distributions. Load-adjusted returns are adjusted for the maximum front-end sales load of 3.75% for Class A shares and returns for Class B and C shares have been adjusted for the contingent deferred sales charge (CDSC). |
NOTES:
The graph does not reflect the income taxes that you would pay on fund distributions or the redemption of fund shares. Fund performance includes reinvestment of dividends and adjustment for the maximum sales charge for Class A shares. The performance of other classes will vary from the performance of the class shown based on the difference in sales charges and fees paid by shareholders investing in different share classes.
The Barclays U.S. Aggregate Bond Index is considered generally representative of the investment-grade bond market. Index data shown for the Since Inception Growth of $10,000 graph is from 6/30/07, since comparative index data is only available for full monthly periods. Source: Lipper, Inc.
Index returns assume reinvestment of dividends and do not reflect deduction of fees and expenses. It is not possible to invest directly in an index.
Duration is useful in measuring a bond fund’s sensitivity to changes in interest rates. The longer the duration, the more a bond fund’s price will fluctuate when interest rates change.
Calamos High Income Fund
OVERVIEW
The Fund invests in a diversified portfolio of U.S. and non-U.S. high yield bonds.
KEY FEATURES
| | ¡ | | Uses three decades of experience in credit evaluation to find issuers with sustainable revenues and lower risk of default | |
| | ¡ | | Emphasis on total return, rather than an exclusive focus on yield, may enhance our ability to generate alpha and preserve capital over the entire credit cycles | |
| | ¡ | | A disciplined process using fundamental analysis which can potentially provide the best opportunity for identifying investments | |
PORTFOLIO FIT
The Fund can complement speculative-grade or investment-grade credit exposure which may provide an attractive option for fixed income investors concerned about generating income.
| | |
| FUND NASDAQ SYMBOLS |
A Shares | | CHYDX |
B Shares | | CAHBX |
C Shares | | CCHYX |
I Shares | | CIHYX |
R Shares | | CHYRX |
| | | |
|
| FUND CUSIP NUMBERS |
A Shares | | 128119815 |
B Shares | | 128119724 |
C Shares | | 128119799 |
I Shares | | 128119781 |
R Shares | | 128119377 |
| | | |
CALAMOS HIGH INCOME FUND
INVESTMENT TEAM DISCUSSION
How has the Fund performed?
For the six-month period ended April 30, 2015, Calamos High Income Fund gained 0.70% (Class A shares at net asset value) versus a 1.93% return for the BofA ML BB-B U.S. High Yield Constrained Index and a 1.33% gain for the Credit Suisse High Yield Index.
We believe the Fund will benefit from our commitment to specialized fundamental research with the strengthening of the firm’s team, including the addition of high yield expertise with the hiring of Jeremy Hughes, CFA, and Chris Langs, CFA, in 2013. Collectively, they have more than 40 years of investment experience. The Fund utilizes decades of experience in credit research to create a portfolio that is focused on total return and preserving capital, rather than an exclusive focus on yield.
Since its inception on August 2, 1999, the Fund gained 6.62% on an annualized basis (Class A shares at net asset value) versus a 6.91% return for BofA ML BB-B U.S. High Yield Constrained Index and 7.52% for the Credit Suisse High Yield Index over the same period.
What factors influenced performance over the period?
The high yield market was muted during the period, mostly because of weakness in the energy sector. Oil prices plummeted after a November decision by OPEC members not to cut production; a reduction by the cartel may have stabilized prices. In the later part of the period, energy companies and the high-yield market recovered as oil prices rallied. The average credit spread widened 34 basis points, or 0.34%, during the period. Spreads in the B credit tier widened 35 basis points while spreads in the BB credit tier increased 21 basis points.
The market also recovered as the Federal Reserve took the stance that decisions on whether to raise interest rates would be data dependent, and as of late U.S. economic indicators have been sluggish. While the greatly anticipated removal of the term “patient” from the March minutes occurred, subsequent commentary by Fed Chair Janet Yellen comforted the markets into believing that the Fed would still bide its time.
The Fund’s relative performance was impacted by the overweight to the energy sector, the worst performing sector during the period. Further, selection in telecommunication services, including holdings of alternative carriers, held back the Fund’s return. However, the Fund benefited from its overweight position and security selection in industrials, including aerospace and defense companies, as well as its overweight and selection in consumer discretionary, including holdings in the automobile manufacturers, specialty stores and apparel retail industries.
How is the Fund positioned?
We remain focused on issuers’ balance sheets and debt-servicing abilities. With equal diligence, we continue to assess the impact of various exogenous macro factors (such as a strengthening dollar, oil prices and interest rate increases) on the overall financial stability and creditworthiness of an issuer. We continue to favor mid-grade credits (BB/B) that we believe offer more favorable risk/reward profiles over the credit cycle,
| | | | |
| 56 | | CALAMOS OPEN-END FAMILY OF FUNDS SEMIANNUAL REPORT | | |
Calamos High Income Fund
especially given the possibilities of widening credit spreads and higher default rates. The Fund’s largest overweight positions relative to the BofA ML BB-B U.S. High Yield Constrained Index are to the industrials and information technology sectors. The largest underweights are to the financials and utilities sectors as of the end of the period.
In mid-January, we reduced our heavy exposure to the energy sector by selling our most stressed positions. With the plunge in oil prices, we felt there was still substantial downside if oil prices kept cratering. Within the oil-and-gas exploration and production industry specifically, we looked to position the Fund in names that could survive even if low oil prices persisted for the next several years. As such, we reduced our allocation to the lowest-quality names in favor of higher-quality names in this area. Our aim is to improve the risk/return profile of the sector allocation and the Fund as a whole. Further, we added holdings in the information technology and financials sectors.
From a credit quality perspective, the Fund is positioned relatively underweight to the BB credit tier while relatively overweight to B. We believe that the BB credit tier has the highest degree of interest rate sensitivity should rates move higher as we expect. In similar respect, we also maintain a lower overall duration in the Fund relative to the index.
What are your closing thoughts for Fund shareholders?
We believe interest rates will stay range-bound for the foreseeable future. When the Fed’s first rate hike approaches, we believe it will likely be counteracted by the historically low level of government-bond yields in Europe with its continued quantitative easing. In high yield, we expect volatility with some pressure on technicals, and we believe ultimately the market will price in the likelihood of higher default rates and higher liquidity premiums. However, we think defaults will not occur uniformly across industries, which we believe underscores the importance of rigorous fundamental research.
We think achieving better-than-coupon returns for the balance of the calendar year will be a challenge given strong returns this year. However, for risk-tolerant fixed income investors, we believe that the high-yield asset class still is attractive given the lack of fixed income alternatives. As we approach more volatile periods, we believe active security selection will become paramount to success.
| | | | |
| SECTOR WEIGHTINGS | |
Consumer Discretionary | | | 21.8 | % |
Industrials | | | 15.3 | |
Energy | | | 12.8 | |
Health Care | | | 10.7 | |
Materials | | | 10.0 | |
Information Technology | | | 9.1 | |
Telecommunication Services | | | 6.8 | |
Financials | | | 5.2 | |
Consumer Staples | | | 2.8 | |
Utilities | | | 1.1 | |
Sector weightings are subject to change daily and are calculated as a percentage of net assets. The table excludes cash or cash equivalents, any government/sovereign bonds or broad based index hedging securities the Fund may hold.
ANNUALIZED RETURN: SINCE INCEPTION (8/2/99) THROUGH 4/30/15
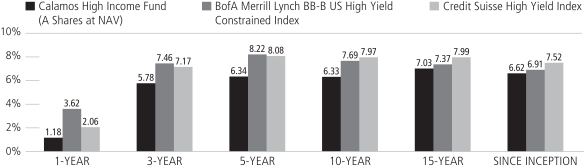
Performance data quoted represents past performance, which is no guarantee of future results. Current performance may be lower or higher than the performance quoted.
The principal value and investment return of an investment will fluctuate so that your shares, when redeemed, may be worth more or less than their original cost. You can obtain performance data current to the most recent month end by visiting www.calamos.com. Average annual total return measures net investment income and capital gain or loss from portfolio investments as an annualized average. All performance shown assumes reinvestment of dividends and capital gains distributions. Performance is for the Fund’s Class A shares at net asset value and does not include the Fund’s maximum front-end sales charge of 4.75%—had it been included, the Fund’s return would have been lower. The Fund also offers Class B, Class C, Class I and Class R shares, the performance of which may vary. Source: State Street Corporation and Mellon Analytical Solutions, LLC.
Calamos High Income Fund
GROWTH OF $10,000: FOR THE 10-YEAR PERIOD ENDED 04/30/15
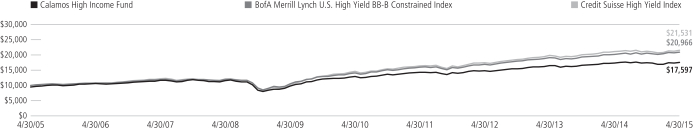
AVERAGE ANNUAL TOTAL RETURN† AS OF 4/30/15
| | | | | | | | | | | | | | | | | | | | |
| | | 6
MONTHS | | 1
YEAR | | 5
YEARS | | 10 YEARS
OR ^SINCE
INCEPTION |
Class A Shares – Inception 8/2/99 | | | | | | | | | | | | | | | | | | | | |
Without Sales Charge | | | | 0.70 | % | | | | 1.18 | % | | | | 6.34 | % | | | | 6.33 | % |
With Sales Charge | | | | -4.08 | | | | | -3.60 | | | | | 5.31 | | | | | 5.81 | |
Class B Shares – Inception 12/21/00 | | | | | | | | | | | | | | | | | | | | |
Without Sales Charge | | | | 0.28 | | | | | 0.34 | | | | | 5.53 | | | | | 5.70 | |
With Sales Charge | | | | -4.50 | | | | | -4.33 | | | | | 5.22 | | | | | 5.70 | |
Class C Shares – Inception 12/21/00 | | | | | | | | | | | | | | | | | | | | |
Without Sales Charge | | | | 0.30 | | | | | 0.37 | | | | | 5.53 | | | | | 5.53 | |
With Sales Charge | | | | -0.66 | | | | | -0.57 | | | | | 5.53 | | | | | 5.53 | |
Class I Shares – Inception 3/1/02 | | | | 0.82 | | | | | 1.44 | | | | | 6.61 | | | | | 6.60 | |
Class R Shares – Inception 3/1/07 | | | | 0.47 | | | | | 0.83 | | | | | 6.05 | | | | | 5.26 | ^ |
Performance data quoted represents past performance, which is no guarantee of future results. Current performance may be lower or higher than the performance quoted. The principal value and investment return of an investment will fluctuate so that your shares, when redeemed, may be worth more or less than their original cost.
As of the prospectus dated 3/1/15, the Fund’s gross expense ratio for Class A shares is 1.19%; Class B and C shares is 1.94%; Class I shares is 0.94%; Class R shares is 1.44%.
| † | Average annual total return measures net investment income and capital gain or loss from portfolio investments as an annualized average assuming reinvestment of dividends and capital gains distributions. Load-adjusted returns are adjusted for the maximum front-end sales load of 4.75% for Class A shares and returns for Class B and C shares have been adjusted for the contingent deferred sales charge (CDSC). |
NOTES:
The graphs do not reflect the income taxes that you would pay on fund distributions or the redemption of fund shares. Fund performance includes reinvestment of dividends and adjustment for the maximum sales charge for Class A shares. The performance of other classes will vary from the performance of the class shown based on the difference in sales charges and fees paid by shareholders investing in different share classes.
The BofA Merrill Lynch BB-B US High Yield Constrained index tracks the performance of BB and B rated high yield bonds.
The Credit Suisse High Yield Index is an unmanaged index of high yield debt securities. Index data shown is from 7/31/99, since comparative index data is only available for full monthly periods. Source: Mellon Analytical Solutions, LLC
Index returns assume reinvestment of dividends and do not reflect deduction of fees and expenses. It is not possible to invest directly in an index.
| | | | |
| 58 | | CALAMOS OPEN-END FAMILY OF FUNDS SEMIANNUAL REPORT | | |
Calamos Market Neutral Income Fund
CALAMOS MARKET NEUTRAL INCOME FUND
INVESTMENT TEAM DISCUSSION
How has the Fund performed?
For the six-month period ended April 30, 2015, Calamos Market Neutral Income Fund gained 1.54% (Class A shares at net asset value) versus a 2.12% return for the Barclays U.S. Government/Credit Bond Index and 0.01% return for the Citigroup 30-Day U.S. Treasury Bill Index.
The Fund is among the first liquid alternative offerings with more than 20 years of history that blends two main strategies, convertible arbitrage and covered call writing. In addition to offering an attractive historical risk/reward profile, the Fund may enhance long-term portfolio diversification potential, especially versus fixed income securities. The strategies all contributed positively to performance during the period.
Since inception on September 4, 1990, the Fund gained 6.65% on an annualized basis (Class A shares at net asset value). For the same period, the Barclays U.S. Government/Credit Bond Index gained 6.58% while the Citigroup 30-Day U.S. Treasury Bill Index returned 2.76%.
How did the covered call strategy contribute?
The strategy benefited from the positive return of the S&P 500 Index as the Fund’s equity basket advanced along with the stock market during the reporting period.
Volatility during the quarter was low on average, which made options selling challenging as low volatility depresses options prices. Still, there was significant “volatility in volatility” on a month-to-month basis. The equity volatility level, as measured by the CBOE Volatility Index (VIX), started the period at 14.03, rose to as high as 23.57 in mid-December, and finished the period at 14.55. As the price of options fluctuated with the changes in volatility, this environment provided opportunities to execute profitable trading strategies with sales of call options.
We also purchase put options that allow us to hedge the risk of loss from equities. Investors remain concerned about equity declines, which made purchasing put options expensive relative to the income we receive from the sale of call options. This hindered performance.
How did convertible arbitrage perform?
The convertible arbitrage strategy also benefited from rising equity prices as more value was gained on the long convertible than was lost on the short equity position over the six-month period. Two detractors for convertible arbitrage during the reporting period included the near-zero fed funds rate (no overnight interest received on cash from short equity positions) and widened credit spreads that exceeded the benefit from declining interest rates. The average high yield credit spread rose 34 basis points, or 0.34%, while the 5-Year Treasury yield fell 19 basis points.
How did the opportunistic allocation to the beta neutral long-short equity strategy perform?
The strategy seeks to minimize market risk by taking long positions in an economic sector or industry while simultaneously utilizing short positions in the same sector or
OVERVIEW
The Fund’s core market strategies include covered call writing and convertible arbitrage, complemented by an opportunistic sleeve. Together, these strategies are intended to provide the Fund with an enhanced potential for risk-managed returns due to their differing responses to volatility.
KEY FEATURES
| | ¡ | | One of the first alternative mutual funds, capitalizing on experience in the convertible space going back more than three decades | |
| | ¡ | | Low correlation with most fixed income benchmarks | |
| | ¡ | | Risk management is a primary focus, with risk characteristics that remain well below the equity and fixed income benchmarks | |
PORTFOLIO FIT
The Fund may provide potential diversification, in particular in a low interest-rate environment.
| | |
| FUND NASDAQ SYMBOLS |
A Shares | | CVSIX |
B Shares | | CAMNX |
C Shares | | CVSCX |
I Shares | | CMNIX |
R Shares | | CVSRX |
| | | |
|
| FUND CUSIP NUMBERS |
A Shares | | 128119203 |
B Shares | | 128119757 |
C Shares | | 128119849 |
I Shares | | 128119880 |
R Shares | | 128119351 |
| | | |
Calamos Market Neutral Income Fund
| | | | |
| SECTOR WEIGHTINGS | |
Information Technology | | | 29.1 | % |
Consumer Discretionary | | | 15.7 | |
Health Care | | | 13.7 | |
Financials | | | 12.2 | |
Energy | | | 8.6 | |
Industrials | | | 7.0 | |
Consumer Staples | | | 5.3 | |
Materials | | | 3.2 | |
Telecommunication Services | | | 1.6 | |
Utilities | | | 1.4 | |
Sector weightings are subject to change daily and are calculated as a percentage of net assets. The table excludes cash or cash equivalents, any government/sovereign bonds or broad based index hedging securities the Fund may hold.
industry. It provided a positive return that was largely in line with our expectations given its mandate and beta constraint. Given this strategy’s low correlation to the equity market, the Fund utilizes this strategy as a tool to help control volatility relative to equities.
How is the Fund positioned?
At the end of the reporting period, the Fund had its highest allocation in the core strategies of convertible arbitrage (49%) and covered call writing (45%). The opportunistic allocation to the beta-neutral long-short equity allocation was 6%. This reflected a slight reduction in convertible arbitrage and a slight increase in covered call writing during the period. Convertible arbitrage usually performs well in periods of rising volatility, so the slightly heavier emphasis in convertible arbitrage reflects our expectations that volatility will increase. At the same time, the lack of interest earned from cash on short positions in convertible arbitrage keeps us from raising the convertible arbitrage allocation higher.
What closing thoughts do you have for Fund shareholders?
We continue to expect rising volatility, an environment which may benefit the Fund. Geopolitical events, speculation on the Federal Reserve and interest rates, and concerns about a slowing global economy are among just a few factors that may fuel volatility. The Fund derives benefits from “volatility in volatility,” either from rebalancing opportunities in the convertible arbitrage strategy or more income from selling options in covered call writing. We believe the Fund is well positioned to provide stability in investors’ portfolios amid a relatively uncertain market environment. Additionally, when used to complement fixed income allocations, the Market Neutral Income Fund has historically provided bond-like returns and bond-like risk without bond-like interest rate sensitivity.
ANNUALIZED RETURN: SINCE INCEPTION (9/4/90) THROUGH 4/30/15
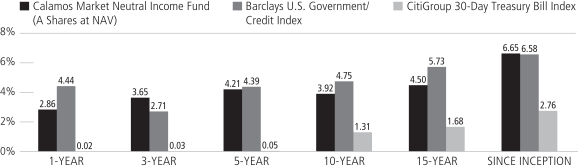
Performance data quoted represents past performance, which is no guarantee of future results. Current performance may be lower or higher than the performance quoted.
The principal value and investment return of an investment will fluctuate so that your shares, when redeemed, may be worth more or less than their original cost. You can obtain performance data current to the most recent month end by visiting www.calamos.com. Average annual total return measures net investment income and capital gain or loss from portfolio investments as an annualized average. All performance shown assumes reinvestment of dividends and capital gains distributions. Performance is for the Fund’s Class A shares at net asset value and does not include the Fund’s maximum front-end sales charge of 4.75%—had it been included, the Fund’s return would have been lower. The Fund also offers Class B, Class C, Class I and Class R shares, the performance of which may vary. Source: State Street Corporation, Lipper, Inc., and Mellon Analytical Solutions, LLC.
| | | | |
| 60 | | CALAMOS OPEN-END FAMILY OF FUNDS SEMIANNUAL REPORT | | |
Calamos Market Neutral Income Fund
GROWTH OF $10,000: FOR THE 10-YEAR PERIOD ENDED 4/30/15
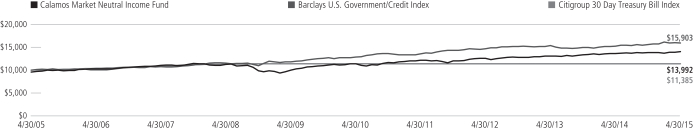
AVERAGE ANNUAL TOTAL RETURN† AS OF 4/30/15
| | | | | | | | | | | | | | | | | | | | |
| | | 6
MONTHS | | 1
YEAR | | 5
YEARS | | 10 YEARS
OR ^SINCE
INCEPTION |
Class A Shares – Inception 9/4/90 | | | | | | | | | | | | | | | | | | | | |
Without Sales Charge | | | | 1.54 | % | | | | 2.86 | % | | | | 4.21 | % | | | | 3.92 | % |
With Sales Charge | | | | -3.25 | | | | | -2.04 | | | | | 3.19 | | | | | 3.42 | |
Class B Shares – Inception 9/11/00 | | | | | | | | | | | | | | | | | | | | |
Without Sales Charge | | | | 1.14 | | | | | 2.09 | | | | | 3.42 | | | | | 3.30 | |
With Sales Charge | | | | -3.86 | | | | | -2.91 | | | | | 3.07 | | | | | 3.30 | |
Class C Shares – Inception 2/16/00 | | | | | | | | | | | | | | | | | | | | |
Without Sales Charge | | | | 1.22 | | | | | 2.15 | | | | | 3.42 | | | | | 3.15 | |
With Sales Charge | | | | 0.22 | | | | | 1.15 | | | | | 3.42 | | | | | 3.15 | |
Class I Shares – Inception 5/10/00 | | | | 1.69 | | | | | 3.08 | | | | | 4.47 | | | | | 4.18 | |
Class R Shares – Inception 3/1/07 | | | | 1.42 | | | | | 2.63 | | | | | 3.94 | | | | | 2.93 | ^ |
Performance data quoted represents past performance, which is no guarantee of future results. Current performance may be lower or higher than the performance quoted. The principal value and investment return of an investment will fluctuate so that your shares, when redeemed, may be worth more or less than their original cost.
As of the prospectus dated 3/1/15, the Fund’s gross expense ratio for Class A shares is 1.22%; Class B shares is 1.96% and C shares is 1.96%; Class I shares is 0.97%; Class R shares is 1.47%.
| † | Average annual total return measures net investment income and capital gain or loss from portfolio investments as an annualized average assuming reinvestment of dividends and capital gains distributions. Load-adjusted returns are adjusted for the maximum front-end sales load of 4.75% for Class A shares and returns for Class B and C shares have been adjusted for the contingent deferred sales charge (CDSC). |
NOTES:
The graphs do not reflect the income taxes that you would pay on fund distributions or the redemption of fund shares. Fund performance includes reinvestment of dividends and adjustment for the maximum sales charge for Class A shares. The performance of other classes will vary from the performance of the class shown based on the difference in sales charges and fees paid by shareholders investing in different share classes.
The Barclays U.S. Government/Credit Index is comprised of long-term government and investment-grade corporate debt securities and is generally considered representative of the performance of the broad U.S. bond market. Index data shown for the Annualized Returns Since Inception graph is from 8/31/90, since comparative index data is only available for full monthly periods. Source: Lipper, Inc.
The Citigroup 30-Day Treasury Bill Index is an unmanaged index generally considered representative of the performance of short-term money instruments. U.S. Treasury Bills are backed by the full faith and credit of the U.S. government and offer a guarantee as to the repayment of principal and interest at maturity. Index data shown for the Annualized Returns Since Inception graph is from 8/31/90, since comparative index data is only available for full monthly periods. Source: Mellon Analytical Solutions, LLC
The CBOE Volatility Index (VIX) is a leading measure of market expectations of near-term volatility conveyed by S&P 500 Index (SPX) option prices.
Index returns assume reinvestment of dividends and do not reflect deduction of fees and expenses. It is not possible to invest directly in an index.
Calamos Hedged Equity Income Fund
OVERVIEW
The Fund uses an alternative strategy that invests in equities and sells options with the aim of achieving the total return of equity markets with lower volatility. It utilizes a covered call strategy, which involves investing in a diversified portfolio of equities while using options to generate income and manage risk.
KEY FEATURES
| | ¡ | | Draws upon almost a decade of experience in covered call writing and more than two decades of equity investing | |
| | ¡ | | Option-based risk-management strategy may lower the volatility of equity investments | |
| | ¡ | | An alternative approach potentially provides upside participation in equity markets while limiting downside exposure | |
PORTFOLIO FIT
The Fund provides an alternative strategy that can generate income and equity exposure with potentially lower volatility than equities.
| | |
| FUND NASDAQ SYMBOLS |
A Shares | | CAHEX |
C Shares | | CCHEX |
I Shares | | CIHEX |
R Shares | | CRHEX |
|
| FUND CUSIP NUMBERS |
A Shares | | 128120698 |
C Shares | | 128120680 |
I Shares | | 128120672 |
R Shares | | 128120664 |
HEDGED EQUITY INCOME FUND
INVESTMENT TEAM DISCUSSION
What is the rationale behind launching the Fund?
The Calamos Hedged Equity Income Fund was launched on December 31, 2014, continuing the firm’s history of providing liquid alternative strategies with the aim of helping to generate income, total return and lower volatility. Covered call writing, the strategy utilized by the Fund, involves investing in a diversified portfolio of stocks that represents the S&P 500 Index and selling options to generate income and potentially reduce volatility over the long-term. We also purchase put options to limit losses from the equity basket in down markets. As one of the first asset managers to establish an alternative-oriented mutual fund, Calamos has almost a decade of experience with covered call writing. We believe the strategy is most likely to perform well in volatile equity markets that trend sideways or down. The Fund has low correlations to common asset classes, has asymmetric performance characteristics and is more liquid than hedge funds.
How has the Fund performed?
Since the Fund’s inception on December 31, 2014 to April 30, 2015, the Hedged Equity Income Fund returned 0.40% (Class A shares at net asset value). For this same period, the S&P 500 Index returned 1.92% and the Barclays U.S. Aggregate Bond Index returned 1.24%.
We believe it’s important to consider that the since inception performance comparison between the Fund and the benchmark S&P 500 Index was negatively affected by a timing issue. Fund trades made on the inception date of December 31, 2014, resulted in a loss as the equity market declined, reflected by a 1.03% fall in the S&P 500. However, inception dates for benchmarks conventionally start at the end of the trading day. While the loss on December 31 is reflected in the Fund’s performance, the equity market decline on the same day is not reflected in the S&P 500 because the benchmark inception commenced after the market closed.
What factors influenced performance over the period?
Volatility during the quarter was low on average, which made options selling challenging as low volatility depresses options prices. Still, there was significant “volatility in volatility” on a month-to-month basis. The equity volatility level as measured by the CBOE Volatility Index (VIX), a measure of market expectations of near-term volatility conveyed by S&P 500 Index (SPX) option prices, rose to as high as 23.57 in mid-December and finished the period at 14.55. As the price of options fluctuated with the changes in volatility, this environment provided opportunities to execute profitable trading strategies with sales of call options.
We also purchase put options that allow us to hedge the risk of loss from equities. Investors remain concerned about equity declines, which made purchasing put options expensive relative to the income we receive from the sale of call options. This hindered performance.
How is the Fund positioned?
Our relative positions between call and put options are frequently adjusted to maintain a balanced risk and reward profile in the Fund. At the end of April, the portfolio was
| | | | |
| 62 | | CALAMOS OPEN-END FAMILY OF FUNDS SEMIANNUAL REPORT | | |
Hedged Equity Income Fund
positioned with 80% calls written against the equity basket versus 67% puts purchased. Additionally, the calls written averaged roughly 1.9% out of the money with 45 days to expiration while the puts purchased averaged 2.2% out of the money with 6 days to expiration.
At the end of the reporting period, the equity basket was slightly overweight to the information technology, financials, consumer staples and utilities sectors versus the S&P 500 Index. The Fund had underweight positions in the consumer discretionary and industrials sectors. The Fund maintained a heavier relative weight to larger cap holdings and a lighter weight to small cap and mid cap names. Even with these differences, the equity basket tracked very closely to the S&P 500.
What closing thoughts do you have for Fund shareholders?
We continue to expect rising volatility in the markets. Geopolitical events, continued speculation on the Federal Reserve and interest rates, and concerns about a slowing global economy are among just a few factors that we believe will help fuel volatility. The Fund also derives benefits from swings in volatility, which creates opportunities to profit from option strategies. We remain optimistic that this environment is favorable to the Fund and its goal to achieve equity-like returns with lower volatility.
AVERAGE ANNUAL TOTAL RETURN† AS OF 4/30/15
| | | | |
| | | SINCE
INCEPTION* | |
Class A Shares – Inception 12/31/2014 | | | | |
Without Sales Charge | | | 0.40 | % |
With Sales Charge | | | -4.38 | |
Class C Shares – Inception 12/31/2014 | | | | |
Without Sales Charge | | | 0.20 | |
With Sales Charge | | | -0.80 | |
Class I Shares – Inception 12/31/2014 | | | 0.50 | |
Class R Shares – Inception 12/31/2014 | | | 0.40 | |
Performance data quoted represents past performance, which is no guarantee of future results. Current performance may be lower or higher than the performance quoted. The principal value and investment return of an investment will fluctuate so that your shares, when redeemed, may be worth more or less than their original cost. You can obtain performance data current to the most recent month end by visiting www.calamos.com.
As of the prospectus dated 3/1/15, the Fund’s gross expense ratio for Class A shares is 2.61%; Class C shares is 3.36%; Class I shares is 2.36%; Class R shares is 2.86%. The Fund’s investment advisor has contractually agreed to reimburse Fund expenses through March 1, 2017, to the extent necessary so that Total Annual Fund Operating Expenses (excluding taxes, interest, short interest, short dividend expenses, brokerage commissions, acquired fund fees and expenses, and extraordinary expenses, if any) of Class A, Class C, Class I and Class R are limited to 1.25%, 2.00%, 1.00% and 1.50% of average net assets, respectively.
| † | Average annual total return measures net investment income and capital gain or loss from portfolio investments as an annualized average assuming reinvestment of dividends and capital gains distributions. Load-adjusted returns are adjusted for the maximum front-end sales load of 3.75% for Class A shares and C shares have been adjusted for the contingent deferred sales charge (CDSC). |
| * | Cumulative since inception. |
NOTES:
The S&P 500 Index is an unmanaged index generally considered representative of the U.S. stock market.
The Barclays U.S. Aggregate Bond Index is considered generally representative of the investment-grade bond market. Index data shown for the Since Inception Growth of $10,000 graph is from 6/30/07, since comparative index data is only available for full monthly periods. Source: Lipper, Inc.
Index returns assume reinvestment of dividends and do not reflect deduction of fees and expenses. It is not possible to invest directly in an index.
| | | | |
| SECTOR WEIGHTINGS | |
Information Technology | | | 20.3 | % |
Financials | | | 15.9 | |
Health Care | | | 14.1 | |
Consumer Discretionary | | | 11.1 | |
Consumer Staples | | | 9.4 | |
Industrials | | | 9.3 | |
Energy | | | 8.5 | |
Materials | | | 3.1 | |
Utilities | | | 3.0 | |
Telecommunication Services | | | 2.3 | |
Sector weightings are subject to change daily and are calculated as a percentage of net assets. The table excludes cash or cash equivalents, any government/sovereign bonds or broad based index hedging securities the Fund may hold.
Calamos Long/Short Fund
OVERVIEW
The Fund utilizes a high-conviction, best ideas long/short strategy that invests primarily in U.S. equity securities and is diversified with exposure to key sectors.
KEY FEATURES
| | ¡ | | Seasoned team of investment professionals in the hedge fund and long/short space with deep expertise in the industries they cover | |
| | ¡ | | High-conviction investing with the aim of generating alpha through both long and short positions | |
| | ¡ | | Catalyst driven and bottom-up fundamental equity investment approach | |
| | ¡ | | Collaborative assessment of ideas that are vetted by the entire team rather than one portfolio manager | |
PORTFOLIO FIT
The Fund may be suitable for investors seeking an alternative solution to complement and diversify a long-only portfolio with an investment that has the potential to lower overall portfolio beta and create superior risk-adjusted returns.
| | |
| FUND NASDAQ SYMBOLS |
A Shares | | CALSX |
C Shares | | CCLSX |
I Shares | | CILSX |
R Shares | | CRLSX |
|
| FUND CUSIP NUMBERS |
A Shares | | 128120607 |
C Shares | | 128120706 |
I Shares | | 128120805 |
R Shares | | 128120888 |
CALAMOS LONG/SHORT FUND
INVESTMENT TEAM DISCUSSION
How has the Fund performed?
For the 6-month period ended April 30, 2015, Calamos Long/Short Fund returned 1.40% (Class A shares at net asset value) versus the HFRI Equity Hedge Index gain of 4.17% and S&P 500 Index return of 4.40%.
The Fund is an alternative strategy, where we take long positions on individual companies that gain when stocks rise and short positions that gain when stocks fall. We believe the Fund provides an opportunity for consistent performance under various market conditions. Our focus is on fundamental research, a consistent portfolio management process, and a mission to generate attractive risk-adjusted returns for our investors.
Since its inception on June 3, 2013, the Fund returned 5.54% on an annualized basis (Class A shares at net asset value). Over the same period, the HFRI Equity Hedge Index returned 6.90%, while the S&P 500 Index returned 15.73%.
What factors influenced performance over the period?
Stock selection and our preference for investments with the best risk-reward profiles benefited results, but overriding market factors that had the most impact on performance included subdued economic indicators, disappointing earnings guidance from companies, the stronger dollar and unstable oil prices. As fundamental investors we look forward to an environment of low correlation and high dispersion of returns among individual equities, an environment where our security selection can be most rewarded.
From an economic perspective, the largest contributors came from investments in the financials and materials sectors, while investments in the energy and health care sectors hindered performance. Long positions contributed positively to results and short investments detracted. Notable contributors during the period included long positions in Berry Plastics Group, Inc. (3.8%*), Blackstone Group Holdings LP (3.8%*) and Apple, Inc. (4.3%*). Notable detractors included long positions in WPX Energy, Inc. (5.36%†), Cameron International Corp. (3.93%†) and Lumber Liquidators Holdings Inc. (1.42%‡).
How is the Fund positioned?
The Fund’s gross exposure, or the sum of long and short positions, totaled 104%. The net long exposure, or the long position less the short position, totaled 45%. The team reduced its net long exposure throughout the period against the backdrop of market uncertainty. We plan to remain conservatively positioned for the time being while we proactively seek opportunities. We are on the hunt for emerging and disruptive trends, and we are focused on risk management as we enter the later stages of the economic cycle.
Our market cap exposure continues to remain fairly balanced between large and mid/small cap companies. We believe small capitalization securities provide relative shelter against a strengthening U.S. dollar, rising interest rates and an unstable energy sector. As always, we continue to invest the majority of our assets in the North America region where we believe that we have an edge through differentiated research.
| | | | |
| 64 | | CALAMOS OPEN-END FAMILY OF FUNDS SEMIANNUAL REPORT | | |
Calamos Long/Short Fund
The team expects that volatility will continue throughout 2015 and we stand ready to invest capital at prudent entry points during market selloffs, as we did in October last year. The team continuously utilizes industry-specific expertise to identify themes and opportunities to optimize the positioning of the portfolio. We seek investment opportunities in enduring or eroding franchises by identifying unappreciated change in market size, market share or structural profitability. The team continues to allocate the majority of its capital to its highest-conviction positions.
What are your closing thoughts for shareholders?
We believe in the Fund’s ability to mute portfolio volatility and protect during drawdowns by seeking skewed return profiles and remaining diligent with respect to entry and exit prices. Especially during periods of uncertainty, we believe investors should consider dampening drawdown risk by allocating a portion of their equity allocation to alternative equity strategies. Doing so may limit losses versus equity markets in downturns, lower volatility and increase alpha versus more traditional portfolios. These are important factors to increase wealth creation.
We view ourselves as playing an instrumental role in aligning our clients with their goals. As always, our ongoing commitment is to deliver superior risk-adjusted returns to our investors.
| | | | |
| SECTOR WEIGHTINGS | |
Consumer Discretionary | | | 26.5 | % |
Financials | | | 14.2 | |
Information Technology | | | 12.6 | |
Health Care | | | 10.9 | |
Materials | | | 3.8 | |
Consumer Staples | | | 0.1 | |
| | | | | |
Sector weightings are subject to change daily and are calculated as a percentage of net assets. The table excludes cash or cash equivalents, any government/sovereign bonds or broad based index hedging securities the Fund may hold.
Calamos Long/Short Fund
GROWTH OF $10,000: SINCE INCEPTION (6/3/13) THROUGH 4/30/15
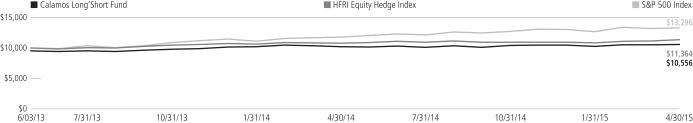
AVERAGE ANNUAL TOTAL RETURN† AS OF 4/30/15
| | | | | | | | | | | | | | | |
| | | 6
MONTHS | | 1
YEAR | | SINCE
INCEPTION |
Class A Shares – Inception 6/3/2013 | | | | | | | | | | | | | | | |
Without Sales Charge | | | | 1.40 | % | | | | 3.50 | % | | | | 5.54 | % |
With Sales Charge | | | | -3.42 | | | | | -1.42 | | | | | 2.87 | |
Class C Shares – Inception 6/3/2013 | | | | | | | | | | | | | | | |
Without Sales Charge | | | | 1.03 | | | | | 2.75 | | | | | 4.77 | |
With Sales Charge | | | | 0.03 | | | | | 1.75 | | | | | 4.77 | |
Class I Shares – Inception 6/3/2013 | | | | 1.58 | | | | | 3.77 | | | | | 5.81 | |
Class R Shares – Inception 6/3/2013 | | | | 1.31 | | | | | 3.22 | | | | | 5.29 | |
Performance data quoted represents past performance, which is no guarantee of future results. Current performance may be lower or higher than the performance quoted. The principal value and investment return of an investment will fluctuate so that your shares, when redeemed, may be worth more or less than their original cost. You can obtain performance data current to the most recent month end by visiting www.calamos.com.
As of the prospectus dated 3/1/15, the Fund’s gross expense ratio for Class A shares is 2.61%; Class C shares is 3.27%; Class I shares is 2.14%; Class R shares is 2.72%.
| † | Average annual total return measures net investment income and capital gain or loss from portfolio investments as an annualized average assuming reinvestment of dividends and capital gains distributions. Load-adjusted returns are adjusted for the maximum front-end sales load of 4.75% for Class A shares and C shares have been adjusted for the contingent deferred sales charge (CDSC). |
NOTES:
The graph does not reflect the income taxes that you would pay on fund distributions or the redemption of fund shares. Fund performance includes reinvestment of dividends and adjustment for the maximum sales charge for Class A shares. The performance of other classes will vary from the performance of the class shown based on the difference in sales charges and fees paid by shareholders investing in different share classes.
The HFRI Equity Hedge Index consists of funds where portfolio managers maintain long and short positions in primarily equity and derivative securities.
The S&P 500 Index is an unmanaged index generally considered representative of the U.S. stock market. Source: Lipper, Inc.
Index returns assume reinvestment of dividends and do not reflect deduction of fees and expenses. It is not possible to invest directly in an index.
| | | | |
| 66 | | CALAMOS OPEN-END FAMILY OF FUNDS SEMIANNUAL REPORT | | |
Expense Overview
EXPENSE OVERVIEW
As a shareholder of a mutual fund, you incur two types of costs. You incur:
1) Transaction costs, including sales charges, or loads, on purchase payment and redemption fees.
2) Ongoing costs, including management fees, distribution and/or service (12b-1) fees and other fund expenses.
The examples in this report are based on an investment of $1,000 made at the beginning of the period and held for the entire period from November 1, 2014 to April 30, 2015. It is intended to help you understand the ongoing costs associated with investing in each mutual fund and to compare these costs with the ongoing costs of investing in other mutual funds.
There are two parts of each Fund’s chart:
Actual
In this part of the chart, you’ll see the actual expenses you would have paid on a $1,000 investment made at the beginning of the period and held for the entire period in each fund from November 1, 2014 to April 30, 2015, the period covered by this report. This chart also shows the actual returns, after expenses, you would have earned during that time. This chart can help you estimate your own expenses. For example, if you invested $8,600 in Class A shares of a fund, simply divide $8,600 by $1,000, then multiply that result by the figure in the “Actual Expenses per $1,000” row. In this example, you would multiply 8.6 times the figure.
Hypothetical
In this part of the chart, you’ll see the hypothetical expenses you would have paid on a $1,000 investment from November 1, 2014 to April 30, 2015, and the hypothetical returns, after expenses, you would have earned during that time. The Securities and Exchange Commission (SEC) has established the guidelines for this chart, including the assumed 5% annual rate of return before expenses, which is what you’ll see in the chart. Note that this chart will not help you determine your own expenses, but will help you compare expenses of the fund you own to the expenses of another fund since the information for that fund should be calculated using the same assumptions.
Please note that the expenses shown in the chart are meant to highlight your ongoing costs only and do not include any transactional costs, such as sales charges (loads), redemption fees or exchange fees. Therefore, the second line of the chart is useful in comparing ongoing costs only and will not help you determine the relative total costs of owning different funds. In addition, if these transaction costs were included, your costs would have been higher.
Expense Example
The actual and hypothetical examples shown assume a $1,000 investment at the beginning of the period, November 1, 2014 and held through April 30, 2015.
| | | | | | | | | | | | | | | | | | | | |
| | | CLASS A
SHARES | | | CLASS B
SHARES | | | CLASS C
SHARES | | | CLASS I
SHARES | | | CLASS R
SHARES | |
| CALAMOS GROWTH FUND | | | | | | | | | | | | | | | | | | | | |
Actual Expenses per $1,000* | | $ | 6.65 | | | $ | 10.47 | | | $ | 10.47 | | | $ | 5.37 | | | $ | 7.92 | |
Actual – Ending Balance | | $ | 1,062.70 | | | $ | 1,058.90 | | | $ | 1,059.00 | | | $ | 1,064.00 | | | $ | 1,061.50 | |
| | | | |
Hypothetical Expenses per $1,000* | | $ | 6.51 | | | $ | 10.24 | | | $ | 10.24 | | | $ | 5.26 | | | $ | 7.75 | |
Hypothetical – Ending Value | | $ | 1,018.35 | | | $ | 1,014.63 | | | $ | 1,014.63 | | | $ | 1,019.59 | | | $ | 1,017.11 | |
| | | | |
Annualized expense ratio | | | 1.30% | | | | 2.05% | | | | 2.05% | | | | 1.05% | | | | 1.55% | |
| CALAMOS OPPORTUNISTIC VALUE FUND | | | | | | | | | | | | | | | | | |
Actual Expenses per $1,000* | | $ | 5.70 | | | $ | 9.40 | | | $ | 9.40 | | | $ | 4.46 | | | $ | 6.94 | |
Actual – Ending Balance | | $ | 999.00 | | | $ | 995.90 | | | $ | 995.70 | | | $ | 1,000.30 | | | $ | 998.20 | |
| | | | |
Hypothetical Expenses per $1,000* | | $ | 5.76 | | | $ | 9.49 | | | $ | 9.49 | | | $ | 4.51 | | | $ | 7.00 | |
Hypothetical – Ending Value | | $ | 1,019.09 | | | $ | 1,015.37 | | | $ | 1,015.37 | | | $ | 1,020.33 | | | $ | 1,017.85 | |
| | | | |
Annualized expense ratio(1) | | | 1.15% | | | | 1.90% | | | | 1.90% | | | | 0.90% | | | | 1.40% | |
| CALAMOS FOCUS GROWTH FUND | | | | | | | | | | | | | | | | | | | | |
Actual Expenses per $1,000* | | $ | 5.85 | | | $ | 9.64 | | | $ | 9.64 | | | $ | 4.58 | | | $ | 7.12 | |
Actual – Ending Balance | | $ | 1,051.00 | | | $ | 1,046.60 | | | $ | 1,047.20 | | | $ | 1,052.20 | | | $ | 1,050.00 | |
| | | | |
Hypothetical Expenses per $1,000* | | $ | 5.76 | | | $ | 9.49 | | | $ | 9.49 | | | $ | 4.51 | | | $ | 7.00 | |
Hypothetical – Ending Value | | $ | 1,019.09 | | | $ | 1,015.37 | | | $ | 1,015.37 | | | $ | 1,020.33 | | | $ | 1,017.85 | |
| | | | |
Annualized expense ratio(1) | | | 1.15% | | | | 1.90% | | | | 1.90% | | | | 0.90% | | | | 1.40% | |
| CALAMOS DISCOVERY GROWTH FUND | | | | | | | | | | | | | | | | | | | | |
Actual Expenses per $1,000* | | $ | 7.65 | | | $ | 11.46 | | | $ | 11.45 | | | $ | 6.38 | | | $ | 8.92 | |
Actual – Ending Balance | | $ | 1,057.20 | | | $ | 1,054.00 | | | $ | 1,053.20 | | | $ | 1,058.70 | | | $ | 1,055.60 | |
| | | | |
Hypothetical Expenses per $1,000* | | $ | 7.50 | | | $ | 11.23 | | | $ | 11.23 | | | $ | 6.26 | | | $ | 8.75 | |
Hypothetical – Ending Value | | $ | 1,017.36 | | | $ | 1,013.64 | | | $ | 1,013.64 | | | $ | 1,018.60 | | | $ | 1,016.12 | |
| | | | |
Annualized expense ratio(1) | | | 1.50% | | | | 2.25% | | | | 2.25% | | | | 1.25% | | | | 1.75% | |
| CALAMOS DIVIDEND GROWTH FUND | | | | | | | | | | | | | | | | | | | | |
Actual Expenses per $1,000* | | $ | 6.72 | | | | — | | | $ | 10.44 | | | $ | 5.48 | | | $ | 7.96 | |
Actual – Ending Balance | | $ | 1,008.80 | | | | — | | | $ | 1,004.20 | | | $ | 1,009.40 | | | $ | 1,007.20 | |
| | | | |
Hypothetical Expenses per $1,000* | | $ | 6.76 | | | | — | | | $ | 10.49 | | | $ | 5.51 | | | $ | 8.00 | |
Hypothetical – Ending Value | | $ | 1,018.10 | | | | — | | | $ | 1,014.38 | | | $ | 1,019.34 | | | $ | 1,016.86 | |
| | | | |
Annualized expense ratio(1) | | | 1.35% | | | | — | | | | 2.10% | | | | 1.10% | | | | 1.60% | |
| CALAMOS MID CAP GROWTH FUND | | | | | | | | | | | | | | | | | | | | |
Actual Expenses per $1,000* | | $ | 6.35 | | | | — | | | $ | 10.15 | | | $ | 5.09 | | | $ | 7.62 | |
Actual – Ending Balance | | $ | 1,050.20 | | | | — | | | $ | 1,046.20 | | | $ | 1,051.80 | | | $ | 1,049.40 | |
| | | | |
Hypothetical Expenses per $1,000* | | $ | 6.26 | | | | — | | | $ | 9.99 | | | $ | 5.01 | | | $ | 7.50 | |
Hypothetical – Ending Value | | $ | 1,018.60 | | | | — | | | $ | 1,014.88 | | | $ | 1,019.84 | | | $ | 1,017.36 | |
| | | | |
Annualized expense ratio(1) | | | 1.25% | | | | — | | | | 2.00% | | | | 1.00% | | | | 1.50% | |
| * | Expenses for all Fund Classes A, B, C, I and R, are equal to the Fund’s annualized expense ratio, multiplied by the average account value over the period, multiplied by 181/365. |
| (1) | Annualized Expense Ratios for Opportunistic Value Fund, Focus Growth Fund, Discovery Growth Fund, Dividend Growth Fund, Mid Cap Growth Fund, Emerging Market Equity Fund, Global Convertible Fund, Total Return Bond Fund and Hedged Equity Income Fund are adjusted to reflect fee waiver. |
| | | | |
| 68 | | CALAMOS OPEN-END FAMILY OF FUNDS SEMIANNUAL REPORT | | |
Expense Example
The actual and hypothetical examples shown assume a $1,000 investment at the beginning of the period, November 1, 2014 and held through April 30, 2015.
| | | | | | | | | | | | | | | | | | | | |
| | | CLASS A
SHARES | | | CLASS B
SHARES | | | CLASS C
SHARES | | | CLASS I
SHARES | | | CLASS R
SHARES | |
| CALAMOS INTERNATIONAL GROWTH FUND | | | | | | | | | | | | | | | | | |
Actual Expenses per $1,000* | | $ | 6.81 | | | $ | 10.63 | | | $ | 10.63 | | | $ | 5.53 | | | $ | 8.08 | |
Actual – Ending Balance | | $ | 1,064.95 | | | $ | 1,061.40 | | | $ | 1,060.80 | | | $ | 1,066.30 | | | $ | 1,063.60 | |
| | | | |
Hypothetical Expenses per $1,000* | | $ | 6.66 | | | $ | 10.39 | | | $ | 10.39 | | | $ | 5.41 | | | $ | 7.90 | |
Hypothetical – Ending Value | | $ | 1,018.20 | | | $ | 1,014.48 | | | $ | 1,014.48 | | | $ | 1,019.44 | | | $ | 1,016.96 | |
| | | | |
Annualized expense ratio | | | 1.33% | | | | 2.08% | | | | 2.08% | | | | 1.08% | | | | 1.58% | |
| CALAMOS EVOLVING WORLD GROWTH FUND | | | | | | | | | | | | | | | | | |
Actual Expenses per $1,000* | | $ | 8.33 | | | $ | 12.10 | | | $ | 12.10 | | | $ | 7.07 | | | $ | 9.59 | |
Actual – Ending Balance | | $ | 1,036.60 | | | $ | 1,032.60 | | | $ | 1,032.60 | | | $ | 1,037.40 | | | $ | 1,034.70 | |
| | | | |
Hypothetical Expenses per $1,000* | | $ | 8.25 | | | $ | 11.98 | | | $ | 11.98 | | | $ | 7.00 | | | $ | 9.49 | |
Hypothetical – Ending Value | | $ | 1,016.61 | | | $ | 1,012.89 | | | $ | 1,012.89 | | | $ | 1,017.85 | | | $ | 1,015.37 | |
| | | | |
Annualized expense ratio | | | 1.65% | | | | 2.40% | | | | 2.40% | | | | 1.40% | | | | 1.90% | |
| CALAMOS EMERGING MARKET EQUITY FUND | | | | | | | | | | | | | | | | | |
Actual Expenses per $1,000* | | $ | 8.77 | | | | — | | | $ | 12.51 | | | $ | 7.52 | | | $ | 10.02 | |
Actual – Ending Balance | | $ | 1,021.50 | | | | — | | | $ | 1,018.40 | | | $ | 1,023.10 | | | $ | 1,020.10 | |
| | | | |
Hypothetical Expenses per $1,000* | | $ | 8.75 | | | | — | | | $ | 12.47 | | | $ | 7.50 | | | $ | 9.99 | |
Hypothetical – Ending Value | | $ | 1,016.12 | | | | — | | | $ | 1,012.40 | | | $ | 1,017.36 | | | $ | 1,014.88 | |
| | | | |
Annualized expense ratio(1) | | | 1.75% | | | | — | | | | 2.50% | | | | 1.50% | | | | 2.00% | |
| CALAMOS GLOBAL EQUITY FUND | | | | | | | | | | | | | | | | | | | | |
Actual Expenses per $1,000* | | $ | 6.87 | | | $ | 10.70 | | | $ | 10.70 | | | $ | 5.60 | | | $ | 8.15 | |
Actual – Ending Balance | | $ | 1,069.20 | | | $ | 1,065.60 | | | $ | 1,065.70 | | | $ | 1,071.40 | | | $ | 1,068.30 | |
| | | | |
Hypothetical Expenses per $1,000* | | $ | 6.71 | | | $ | 10.44 | | | $ | 10.44 | | | $ | 5.46 | | | $ | 7.95 | |
Hypothetical – Ending Value | | $ | 1,018.15 | | | $ | 1,014.43 | | | $ | 1,014.43 | | | $ | 1,019.39 | | | $ | 1,016.91 | |
| | | | |
Annualized expense ratio | | | 1.34% | | | | 2.09% | | | | 2.09% | | | | 1.09% | | | | 1.59% | |
| CALAMOS GROWTH AND INCOME FUND | | | | | | | | | | | | | | | | | |
Actual Expenses per $1,000* | | $ | 5.46 | | | $ | 9.20 | | | $ | 9.20 | | | $ | 4.21 | | | $ | 6.71 | |
Actual – Ending Balance | | $ | 1,021.00 | | | $ | 1,017.40 | | | $ | 1,017.40 | | | $ | 1,022.40 | | | $ | 1,019.90 | |
| | | | |
Hypothetical Expenses per $1,000* | | $ | 5.46 | | | $ | 9.20 | | | $ | 9.20 | | | $ | 4.21 | | | $ | 6.71 | |
Hypothetical – Ending Value | | $ | 1,019.39 | | | $ | 1,015.67 | | | $ | 1,015.67 | | | $ | 1,020.63 | | | $ | 1,018.15 | |
| | | | |
Annualized expense ratio | | | 1.09% | | | | 1.84% | | | | 1.84% | | | | 0.84% | | | | 1.34% | |
| CALAMOS GLOBAL GROWTH AND INCOME FUND | | | | | | | | | | | | | | | | | |
Actual Expenses per $1,000* | | $ | 7.46 | | | $ | 11.25 | | | $ | 11.24 | | | $ | 6.19 | | | $ | 8.72 | |
Actual – Ending Balance | | $ | 1,047.40 | | | $ | 1,043.00 | | | $ | 1,042.80 | | | $ | 1,047.70 | | | $ | 1,044.80 | |
| | | | |
Hypothetical Expenses per $1,000* | | $ | 7.35 | | | $ | 11.08 | | | $ | 11.08 | | | $ | 6.11 | | | $ | 8.60 | |
Hypothetical – Ending Value | | $ | 1,017.51 | | | $ | 1,013.79 | | | $ | 1,013.79 | | | $ | 1,018.75 | | | $ | 1,016.27 | |
| | | | |
Annualized expense ratio | | | 1.47% | | | | 2.22% | | | | 2.22% | | | | 1.22% | | | | 1.72% | |
| CALAMOS CONVERTIBLE FUND | | | | | | | | | | | | | | | | | | | | |
Actual Expenses per $1,000* | | $ | 5.55 | | | $ | 9.28 | | | $ | 9.28 | | | $ | 4.30 | | | $ | 6.79 | |
Actual – Ending Balance | | $ | 1,016.00 | | | $ | 1,011.90 | | | $ | 1,012.30 | | | $ | 1,017.10 | | | $ | 1,015.00 | |
| | | | |
Hypothetical Expenses per $1,000* | | $ | 5.56 | | | $ | 9.30 | | | $ | 9.30 | | | $ | 4.31 | | | $ | 6.80 | |
Hypothetical – Ending Value | | $ | 1,019.29 | | | $ | 1,015.57 | | | $ | 1,015.57 | | | $ | 1,020.53 | | | $ | 1,018.05 | |
| | | | |
Annualized expense ratio | | | 1.11% | | | | 1.86% | | | | 1.86% | | | | 0.86% | | | | 1.36% | |
| * | Expenses for all Fund Classes A, B, C, I and R, are equal to the Fund’s annualized expense ratio, multiplied by the average account value over the period, multiplied by 181/365. |
| (1) | Annualized Expense Ratios for Opportunistic Value Fund, Focus Growth Fund, Discovery Growth Fund, Dividend Growth Fund, Mid Cap Growth Fund, Emerging Market Equity Fund, Global Convertible Fund, Total Return Bond Fund and Hedged Equity Income Fund are adjusted to reflect fee waiver. |
Expense Example
The actual and hypothetical examples shown assume a $1,000 investment at the beginning of the period, November 1, 2014 and held through April 30, 2015.
| | | | | | | | | | | | | | | | | | | | |
| | | CLASS A
SHARES | | | CLASS B
SHARES | | | CLASS C
SHARES | | | CLASS I
SHARES | | | CLASS R
SHARES | |
| CALAMOS GLOBAL CONVERTIBLE FUND† | | | | | | | | | | | | | | | | | |
Actual Expenses per $1,000 | | $ | 4.53 | | | | — | | | $ | 7.04 | | | $ | 3.69 | | | $ | 5.37 | |
Actual – Ending Balance | | $ | 1,041.00 | | | | — | | | $ | 1,039.00 | | | $ | 1,043.00 | | | $ | 1,041.00 | |
| | | | |
Hypothetical Expenses per $1,000 | | $ | 4.46 | | | | — | | | $ | 6.94 | | | $ | 3.64 | | | $ | 5.29 | |
Hypothetical – Ending Value | | $ | 1,012.00 | | | | — | | | $ | 1,009.53 | | | $ | 1,012.82 | | | $ | 1,011.18 | |
| | | | |
Annualized expense ratio(1) | | | 1.35% | | | | — | | | | 2.10% | | | | 1.10% | | | | 1.60% | |
| CALAMOS TOTAL RETURN BOND FUND | | | | | | | | | | | | | | | | | | | | |
Actual Expenses per $1,000* | | $ | 4.51 | | | $ | 8.25 | | | $ | 8.25 | | | $ | 3.26 | | | $ | 5.76 | |
Actual – Ending Balance | | $ | 1,020.70 | | | $ | 1,016.90 | | | $ | 1,016.90 | | | $ | 1,022.00 | | | $ | 1,019.40 | |
| | | | |
Hypothetical Expenses per $1,000* | | $ | 4.51 | | | $ | 8.25 | | | $ | 8.25 | | | $ | 3.26 | | | $ | 5.76 | |
Hypothetical – Ending Value | | $ | 1,020.33 | | | $ | 1,016.61 | | | $ | 1,016.61 | | | $ | 1,021.57 | | | $ | 1,019.09 | |
| | | | |
Annualized expense ratio(1) | | | 0.90% | | | | 1.65% | | | | 1.65% | | | | 0.65% | | | | 1.15% | |
| CALAMOS HIGH INCOME FUND | | | | | | | | | | | | | | | | | | | | |
Actual Expenses per $1,000* | | $ | 6.27 | | | $ | 9.98 | | | $ | 9.98 | | | $ | 5.03 | | | $ | 7.51 | |
Actual – Ending Balance | | $ | 1,007.00 | | | $ | 1,002.80 | | | $ | 1,003.00 | | | $ | 1,008.20 | | | $ | 1,004.70 | |
| | | | |
Hypothetical Expenses per $1,000* | | $ | 6.31 | | | $ | 10.04 | | | $ | 10.04 | | | $ | 5.06 | | | $ | 7.55 | |
Hypothetical – Ending Value | | $ | 1,018.55 | | | $ | 1,014.83 | | | $ | 1,014.83 | | | $ | 1,019.79 | | | $ | 1,017.31 | |
| | | | |
Annualized expense ratio | | | 1.26% | | | | 2.01% | | | | 2.01% | | | | 1.01% | | | | 1.51% | |
| CALAMOS MARKET NEUTRAL INCOME FUND | | | | | | | | | | | | | | | | | |
Actual Expenses per $1,000* | | $ | 6.15 | | | $ | 9.87 | | | $ | 9.88 | | | $ | 4.90 | | | $ | 7.39 | |
Actual – Ending Balance | | $ | 1,015.40 | | | $ | 1,011.40 | | | $ | 1,012.20 | | | $ | 1,016.90 | | | $ | 1,014.20 | |
| | | | |
Hypothetical Expenses per $1,000* | | $ | 6.16 | | | $ | 9.90 | | | $ | 9.90 | | | $ | 4.91 | | | $ | 7.40 | |
Hypothetical – Ending Value | | $ | 1,018.70 | | | $ | 1,015.67 | | | $ | 1,015.67 | | | $ | 1,019.94 | | | $ | 1,017.46 | |
| | | | |
Annualized expense ratio(2) | | | 1.23% | | | | 1.98% | | | | 1.98% | | | | 0.98% | | | | 1.48% | |
| CALAMOS HEDGED EQUITY INCOME FUND† | | | | | | | | | | | | | | | | | |
Actual Expenses per $1,000 | | $ | 4.15 | | | | — | | | $ | 6.64 | | | $ | 3.32 | | | $ | 4.98 | |
Actual – Ending Balance | | $ | 1,004.00 | | | | — | | | $ | 1,002.00 | | | $ | 1,005.00 | | | $ | 1,004.00 | |
| | | | |
Hypothetical Expenses per $1,000 | | $ | 4.17 | | | | — | | | $ | 6.66 | | | $ | 3.34 | | | $ | 5.00 | |
Hypothetical – Ending Value | | $ | 1,012.43 | | | | — | | | $ | 1,009.95 | | | $ | 1,013.26 | | | $ | 1,011.60 | |
| | | | |
Annualized expense ratio(1) | | | 1.25% | | | | — | | | | 2.00% | | | | 1.00% | | | | 1.50% | |
| CALAMOS LONG/SHORT FUND | | | | | | | | | | | | | | | | | | | | |
Actual Expenses per $1,000* | | $ | 11.34 | | | | — | | | $ | 15.00 | | | $ | 10.10 | | | $ | 12.58 | |
Actual – Ending Balance | | $ | 1,014.00 | | | | — | | | $ | 1,010.30 | | | $ | 1,015.80 | | | $ | 1,013.10 | |
| | | | |
Hypothetical Expenses per $1,000* | | $ | 11.33 | | | | — | | | $ | 15.02 | | | $ | 10.09 | | | $ | 12.57 | |
Hypothetical – Ending Value | | $ | 1,013.54 | | | | — | | | $ | 1,012.40 | | | $ | 1,014.78 | | | $ | 1,012.30 | |
| | | | |
Annualized expense ratio(2) | | | 2.27% | | | | — | | | | 3.01% | | | | 2.02% | | | | 2.52% | |
| † | December 31, 2014 (commencement of operations) through April 30, 2015. Expenses for all Fund Classes of the Global Convertible Fund and Hedged Equity Income Fund are equal to each Fund’s annualized expense ratio, multiplied by the average account value from inception to period end, multiplied by 120/365. |
| * | Expenses for all Fund Classes A, B, C, I and R, are equal to the Fund’s annualized expense ratio, multiplied by the average account value over the period, multiplied by 181/365. |
| (1) | Annualized Expense Ratios for Opportunistic Value Fund, Focus Growth Fund, Discovery Growth Fund, Dividend Growth Fund, Mid Cap Growth Fund, Emerging Market Equity Fund, Global Convertible Fund, Total Return Bond Fund and Hedged Equity Income Fund are adjusted to reflect fee waiver. |
| (2) | Includes 0.02%, 0.02%, 0.14% and 0.52% related to dividend expense on short positions for Market Neutral Income Fund and Long/Short Fund, respectively. |
| | | | |
| 70 | | CALAMOS OPEN-END FAMILY OF FUNDS SEMIANNUAL REPORT | | |
Growth Fund Schedule of Investments April 30, 2015 (Unaudited)
| | | | | | | | | | |
NUMBER OF
SHARES | | | | | | | VALUE | |
| | COMMON STOCKS (93.4%) | |
| | | | | | Consumer Discretionary (20.4%) | |
| | 82,000 | | | | | Amazon.com, Inc.# | | $ | 34,585,960 | |
| | 711,000 | | | | | Bloomin’ Brands, Inc. | | | 16,111,260 | |
| | 426,000 | | | | | Comcast Corp. - Class A | | | 24,605,760 | |
| | 806,000 | | | | | D.R. Horton, Inc. | | | 20,472,400 | |
| | 435,100 | | | | | Deckers Outdoor Corp.# | | | 32,197,400 | |
| | 604,000 | | | | | Dollar General Corp. | | | 43,916,840 | |
| | 464,100 | | | | | Home Depot, Inc. | | | 49,649,418 | |
| | 501,000 | | | | | Las Vegas Sands Corp. | | | 26,492,880 | |
| | 1,134,000 | | | | | Lions Gate Entertainment Corp.^ | | | 35,165,340 | |
| | 1,088,000 | | | | | LKQ Corp.# | | | 29,452,160 | |
| | 358,300 | | | | | Nike, Inc. - Class B | | | 35,414,372 | |
| | 59,513 | | | | | Priceline Group, Inc.# | | | 73,665,787 | |
| | 269,000 | | | | | PVH Corp. | | | 27,801,150 | |
| | 235,000 | | | | | Restoration Hardware Holdings, Inc.# | | | 20,249,950 | |
| | 305,000 | | | | | Royal Caribbean Cruises, Ltd. | | | 20,758,300 | |
| | 1,486,000 | | | | | Starbucks Corp. | | | 73,675,880 | |
| | 402,000 | | | | | Walt Disney Company | | | 43,705,440 | |
| | 1,784,000 | | | | | Wendy’s Company | | | 18,054,080 | |
| | 102,000 | | | | | Whirlpool Corp. | | | 17,911,200 | |
| | | | | | | | | | |
| | | | | | | | | 643,885,577 | |
| | | | | | | | | | |
| | | | | | Consumer Staples (3.4%) | |
| | 1,066,190 | | | | | Mondelez International, Inc. - Class A | | | 40,909,710 | |
| | 568,400 | | | | | Reynolds American, Inc. | | | 41,663,720 | |
| | 203,700 | | | | | Walgreens Boots Alliance, Inc. | | | 16,892,841 | |
| | 165,249 | | | | | WhiteWave Foods Company - Class A# | | | 7,265,999 | |
| | | | | | | | | | |
| | | | | | | | | 106,732,270 | |
| | | | | | | | | | |
| | | | | | Energy (4.6%) | |
| | 364,060 | | | | | Antero Resources Corp.#^ | | | 16,131,499 | |
| | 363,065 | | | | | EOG Resources, Inc. | | | 35,925,282 | |
| | 679,300 | | | | | Gulfport Energy Corp.# | | | 33,244,942 | |
| | 655,135 | | | | | Schlumberger, Ltd. | | | 61,982,322 | |
| | | | | | | | | | |
| | | | | | | | | 147,284,045 | |
| | | | | | | | | | |
| | | | | | Financials (6.2%) | |
| | 438,080 | | | | | Arthur J. Gallagher & Company | | | 20,953,366 | |
| | 662,000 | | | | | Blackstone Group, LP | | | 27,115,520 | |
| | 384,300 | | | | | Evercore Partners, Inc. - Class A | | | 18,538,632 | |
| | 400,055 | | | | | JPMorgan Chase & Company | | | 25,307,479 | |
| | 690,800 | | | | | Realogy Holdings Corp.# | | | 32,750,828 | |
| | 230,500 | | | | | SVB Financial Group# | | | 30,601,180 | |
| | 741,135 | | | | | Wells Fargo & Company | | | 40,836,539 | |
| | | | | | | | | | |
| | | | | | | | | 196,103,544 | |
| | | | | | | | | | |
| | | | | | Health Care (15.5%) | |
| | 452,067 | | | | | Acadia Healthcare Company, Inc.# | | | 30,966,589 | |
| | 121,200 | | | | | Biogen, Inc.# | | | 45,320,316 | |
| | | | | | | | | | |
NUMBER OF
SHARES | | | | | | | VALUE | |
| | 424,000 | | | | | Celgene Corp.# | | $ | 45,817,440 | |
| | 557,000 | | | | | Cepheid# | | | 31,247,700 | |
| | 1,365,300 | | | | | Cerner Corp.# | | | 98,042,193 | |
| | 703,000 | | | | | Envision Healthcare Holdings, Inc.# | | | 26,685,880 | |
| | 161,000 | | | | | Illumina, Inc.# | | | 29,664,250 | |
| | 418,000 | | | | | Insulet Corp.# | | | 12,477,300 | |
| | 86,800 | | | | | Jazz Pharmaceuticals, PLC# | | | 15,511,160 | |
| | 321,000 | | | | | Laboratory Corp. of America Holdings# | | | 38,378,760 | |
| | 233,400 | | | | | PAREXEL International Corp.# | | | 14,838,405 | |
| | 136,700 | | | | | Shire, PLC | | | 33,287,817 | |
| | 318,000 | | | | | Stryker Corp. | | | 29,332,320 | |
| | 146,281 | | | | | Wright Medical Group, Inc.# | | | 3,711,149 | |
| | 311,000 | | | | | Zimmer Holdings, Inc. | | | 34,160,240 | |
| | | | | | | | | | |
| | | | | | | | | 489,441,519 | |
| | | | | | | | | | |
| | | | | | Industrials (11.8%) | |
| | 313,045 | | | | | B/E Aerospace, Inc. | | | 18,716,961 | |
| | 158,025 | | | | | Boeing Company | | | 22,651,303 | |
| | 744,000 | | | | | Delta Air Lines, Inc. | | | 33,212,160 | |
| | 502,000 | | | | | Eaton Corp., PLC | | | 34,502,460 | |
| | 748,000 | | | | | Fortune Brands Home & Security, Inc. | | | 33,360,800 | |
| | 164,000 | | | | | Lockheed Martin Corp. | | | 30,602,400 | |
| | 194,900 | | | | | Manpowergroup, Inc. | | | 16,630,817 | |
| | 545,000 | | | | | Quanta Services, Inc.# | | | 15,755,950 | |
| | 338,050 | | | | | Rockwell Automation, Inc. | | | 40,092,730 | |
| | 484,140 | | | | | Spirit Airlines, Inc.# | | | 33,149,066 | |
| | 282,000 | | | | | United Parcel Service, Inc. - Class B | | | 28,349,460 | |
| | 291,000 | | | | | United Technologies Corp. | | | 33,101,250 | |
| | 264,500 | | | | | WABCO Holdings, Inc.# | | | 32,917,025 | |
| | | | | | | | | | |
| | | | | | | | | 373,042,382 | |
| | | | | | | | | | |
| | | | | | Information Technology (31.5%) | |
| | 2,287,700 | | | | | Apple, Inc. | | | 286,305,655 | |
| | 1,491,000 | | | | | Applied Materials, Inc. | | | 29,506,890 | |
| | 907,000 | | | | | Booz Allen Hamilton Holding Corp. | | | 24,942,500 | |
| | 788,000 | | | | | Cognizant Technology Solutions Corp. - Class A# | | | 46,129,520 | |
| | 141,100 | | | | | Equinix, Inc. | | | 36,111,723 | |
| | 1,432,000 | | | | | Facebook, Inc. - Class A# | | | 112,798,640 | |
| | 611,400 | | | | | FireEye, Inc.#^ | | | 25,250,820 | |
| | 155,600 | | | | | Google, Inc. - Class A# | | | 85,388,612 | |
| | 183,100 | | | | | LinkedIn Corp. - Class A# | | | 46,165,003 | |
| | 828,000 | | | | | MasterCard, Inc. - Class A | | | 74,693,880 | |
| | 1,426,000 | | | | | Microsoft Corp. | | | 69,360,640 | |
| | 1,082,000 | | | | | Sabre Corp. | | | 26,930,980 | |
| | 453,000 | | | | | Salesforce.com, Inc.#^ | | | 32,987,460 | |
| | 813,000 | | | HKD | | Tencent Holdings, Ltd. | | | 16,779,410 | |
| | 141,000 | | | | | Ultimate Software Group, Inc.# | | | 23,437,020 | |
| | | | | | |
| See accompanying Notes to Schedule of Investments | | www.calamos.com | | | 71 | |
Growth Fund Schedule of Investments April 30, 2015 (Unaudited)
| | | | | | | | | | |
NUMBER OF
SHARES | | | | | | | VALUE | |
| | 750,200 | | | | | VeriFone Systems, Inc.# | | $ | 26,834,654 | |
| | 328,300 | | | | | Western Digital Corp. | | | 32,088,042 | |
| | | | | | | | | | |
| | | | | | | | | 995,711,449 | |
| | | | | | | | | | |
| | | | | | TOTAL COMMON STOCKS
(Cost $2,146,923,539) | | | 2,952,200,786 | |
| | | | | | | | | | |
| | | | | | | | | | |
| | SHORT TERM INVESTMENT (7.5%) | |
| | 238,503,185 | | | | | Fidelity Prime Money Market Fund - Institutional Class (Cost $238,503,185) | | | 238,503,185 | |
| | | | | | | | | | |
NUMBER OF
SHARES/
PRINCIPAL
AMOUNT | | | | | | | VALUE | |
| INVESTMENT OF CASH COLLATERAL FOR SECURITIES
LOANED (2.8%) |
|
| | | | | | Federal Home Loan Bank Discount Notes | | | | |
| | 16,800,224 | | | | | 0.000%, 05/29/15 | | | 16,800,224 | |
| | 10,500,962 | | | | | 0.000%, 06/10/15 | | | 10,500,962 | |
| | 5,250,709 | | | | | 0.000%, 05/27/15 | | | 5,250,709 | |
| | 5,250,564 | | | | | 0.000%, 06/15/15 | | | 5,250,564 | |
| | 10,500,458 | | | | | Federal Home Loan Mortgage Corp. Discount Note
0.000%, 06/01/15 | | | 10,500,458 | |
| | 20,860,763 | | | | | Fidelity Prime Money Market Fund - Institutional Class | | | 20,860,763 | |
| | 9,567,963 | | | | | Goldman Sachs Financial Square Fund | | | 9,567,963 | |
| | 10,501,732 | | | | | Morgan Stanley Institutional Liquidity Fund | | | 10,501,732 | |
| | | | | | | | | | |
| | | | | | TOTAL INVESTMENT OF CASH
COLLATERAL FOR SECURITIES
LOANED
(Cost $89,233,375) | | | 89,233,375 | |
| | | | | | | | | | |
| |
| TOTAL INVESTMENTS (103.7%)
(Cost $2,474,660,099) | | | 3,279,937,346 | |
| | | | | | | | | | |
| |
| PAYABLE UPON RETURN OF SECURITIES ON
LOAN (-2.8%) | | | (89,233,375 | ) |
| | | | | | | | | | |
| |
| | LIABILITIES, LESS OTHER ASSETS (-0.9%) | | | (28,756,106 | ) |
| | | | | | | | | | |
| |
| | NET ASSETS (100.0%) | | $ | 3,161,947,865 | |
| | | | | | | | | | |
FORWARD FOREIGN CURRENCY CONTRACTS
| | | | | | | | | | | | | | | | |
COUNTER
PARTY | | LONG CONTRACTS | | SETTLEMENT DATE | | LOCAL CURRENCY | | | CURRENT VALUE | | | UNREALIZED
GAIN/LOSS | |
| Citibank N.A. | | Hong
Kong
Dollar | | 07/23/15 | | | 41,664,000 | | | $ | 5,375,568 | | | $ | 1,408 | |
| | | | | | | | | | | | | | | | |
| | | | | |
COUNTER
PARTY | | SHORT CONTRACTS | | SETTLEMENT DATE | | LOCAL CURRENCY | | | CURRENT VALUE | | | UNREALIZED
GAIN/LOSS | |
Northern
Trust
Company | | British Pound
Sterling | | 07/23/15 | | | 21,505,000 | | | $ | 32,992,193 | | | $ | (926,195 | ) |
Barclays
Bank
PLC | | Hong
Kong
Dollar | | 07/23/15 | | | 165,281,000 | | | | 21,324,867 | | | | (5,282 | ) |
| | | | | | | | | | | | | | | | |
| | | | | | | | | | | | | | $ | (931,477 | ) |
| | | | | | | | | | | | | | | | |
NOTES TO SCHEDULE OF INVESTMENTS
| # | Non-income producing security. |
| ^ | Security, or portion of security, is on loan. |
FOREIGN CURRENCY ABBREVIATION
Note: Value for securities denominated in foreign currencies is shown in U.S. dollars.
| | | | |
| 72 | | CALAMOS OPEN-END FAMILY OF FUNDS SEMIANNUAL REPORT | | See accompanying Notes to Financial Statements |
Opportunistic Value Fund Schedule of Investments April 30, 2015 (Unaudited)
| | | | | | | | | | |
NUMBER OF
SHARES | | | | | | | VALUE | |
| | COMMON STOCKS (98.9%) | |
| | | | | | Consumer Discretionary (7.0%) | |
| | 3,300 | | | | | Bed Bath & Beyond, Inc.# | | $ | 232,518 | |
| | 13,100 | | | | | Chico’s FAS, Inc. | | | 220,866 | |
| | 1,070 | | | | | Dillard’s, Inc. - Class A | | | 140,801 | |
| | 1,955 | | | | | Dollar General Corp. | | | 142,148 | |
| | 4,500 | | | | | Foot Locker, Inc. | | | 267,525 | |
| | 26,900 | | | | | Ford Motor Company | | | 425,020 | |
| | 11,900 | | | | | General Motors Company, Inc. | | | 417,214 | |
| | 14,000 | | | | | Gentex Corp. | | | 242,900 | |
| | 2,600 | | | | | Genuine Parts Company | | | 233,610 | |
| | 250 | | | | | Graham Holdings Company | | | 255,732 | |
| | 4,500 | | | | | Johnson Controls, Inc. | | | 226,710 | |
| | 2,250 | | | | | Lear Corp. | | | 249,818 | |
| | 4,000 | | | | | Macy’s, Inc. | | | 258,520 | |
| | 9,300 | | | | | Mattel, Inc. | | | 261,888 | |
| | 1,800 | | | | | Ralph Lauren Corp. | | | 240,138 | |
| | 4,300 | | | | | Target Corp. | | | 338,969 | |
| | 6,980 | | | | | Time Warner, Inc. | | | 589,182 | |
| | 7,000 | | | | | Twenty-First Century Fox, Inc. | | | 238,560 | |
| | 2,130 | | | | | Walt Disney Company | | | 231,574 | |
| | | | | | | | | | |
| | | | | | | | | 5,213,693 | |
| | | | | | | | | | |
| | | | | | Consumer Staples (7.0%) | |
| | 2,640 | | | | | Campbell Soup Company | | | 118,034 | |
| | 8,400 | | | | | CVS Health Corp. | | | 834,036 | |
| | 2,990 | | | | | Ingredion, Inc. | | | 237,406 | |
| | 11,700 | | | | | Mondelez International, Inc. - Class A | | | 448,929 | |
| | 5,100 | | | | | Philip Morris International, Inc. | | | 425,697 | |
| | 20,900 | | | | | Procter & Gamble Company | | | 1,661,759 | |
| | 13,400 | | | | | Wal-Mart Stores, Inc. | | | 1,045,870 | |
| | 2,505 | | | | | Walgreens Boots Alliance, Inc. | | | 207,740 | |
| | 4,400 | | | | | Whole Foods Market, Inc. | | | 210,144 | |
| | | | | | | | | | |
| | | | | | | | | 5,189,615 | |
| | | | | | | | | | |
| | | | | | Energy (10.6%) | |
| | 5,000 | | | | | Anadarko Petroleum Corp. | | | 470,500 | |
| | 3,300 | | | | | Apache Corp. | | | 225,720 | |
| | 14,470 | | | | | Chevron Corp. | | | 1,607,038 | |
| | 12,355 | | | | | ConocoPhillips | | | 839,152 | |
| | 3,888 | | | | | Devon Energy Corp. | | | 265,200 | |
| | 34,420 | | | | | Exxon Mobil Corp. | | | 3,007,275 | |
| | 9,100 | | | | | Kinder Morgan, Inc. | | | 390,845 | |
| | 4,200 | | | | | National Oilwell Varco, Inc. | | | 228,522 | |
| | 5,725 | | | | | Occidental Petroleum Corp. | | | 458,573 | |
| | 2,900 | | | | | Phillips 66 | | | 229,999 | |
| | 3,970 | | | | | Valero Energy Corp. | | | 225,893 | |
| | | | | | | | | | |
| | | | | | | | | 7,948,717 | |
| | | | | | | | | | |
| | | | | | | | | | |
NUMBER OF
SHARES | | | | | | | VALUE | |
| | | | | | | | | | |
| | | | | | Financials (29.4%) | |
| | 5,225 | | | | | American Financial Group, Inc. | | $ | 330,220 | |
| | 12,265 | | | | | American International Group, Inc. | | | 690,397 | |
| | 2,195 | | | | | AON, PLC | | | 211,225 | |
| | 7,190 | | | | | Aspen Insurance Holdings, Ltd. | | | 335,989 | |
| | 1,300 | | | | | AvalonBay Communities, Inc. | | | 213,642 | |
| | 80,400 | | | | | Bank of America Corp. | | | 1,280,772 | |
| | 5,540 | | | | | Bank of Hawaii Corp. | | | 334,561 | |
| | 10,900 | | | | | Bank of New York Mellon Corp. | | | 461,506 | |
| | 14,471 | | | | | Berkshire Hathaway, Inc. - Class B# | | | 2,043,450 | |
| | 1,225 | | | | | BlackRock, Inc. | | | 445,826 | |
| | 1,600 | | | | | Boston Properties, Inc. | | | 211,696 | |
| | 6,805 | | | | | Brown & Brown, Inc. | | | 217,420 | |
| | 5,500 | | | | | Capital One Financial Corp. | | | 444,675 | |
| | 16,200 | | | | | Charles Schwab Corp. | | | 494,100 | |
| | 3,295 | | | | | Chubb Corp. | | | 324,063 | |
| | 4,075 | | | | | Cincinnati Financial Corp. | | | 206,358 | |
| | 26,530 | | | | | Citigroup, Inc. | | | 1,414,579 | |
| | 7,805 | | | | | Commerce Bancshares, Inc. | | | 333,351 | |
| | 8,235 | | | | | East West Bancorp, Inc. | | | 334,259 | |
| | 2,800 | | | | | Equity Residential | | | 206,808 | |
| | 22,995 | | | | | First Horizon National Corp. | | | 327,679 | |
| | 6,125 | | | | | Franklin Resources, Inc. | | | 315,805 | |
| | 7,900 | | | | | General Growth Properties, Inc. | | | 216,460 | |
| | 3,455 | | | | | Goldman Sachs Group, Inc. | | | 678,631 | |
| | 4,635 | | | | | Hanover Insurance Group, Inc. | | | 317,822 | |
| | 5,400 | | | | | HCP, Inc. | | | 217,566 | |
| | 2,015 | | | | | Jones Lang LaSalle, Inc. | | | 334,611 | |
| | 32,470 | | | | | JPMorgan Chase & Company | | | 2,054,052 | |
| | 5,660 | | | | | Legg Mason, Inc. | | | 297,999 | |
| | 3,770 | | | | | Marsh & McLennan Companies, Inc. | | | 211,723 | |
| | 4,135 | | | | | Mercury General Corp. | | | 227,177 | |
| | 8,600 | | | | | MetLife, Inc. | | | 441,094 | |
| | 12,060 | | | | | Morgan Stanley | | | 449,959 | |
| | 4,800 | | | | | PNC Financial Services Group, Inc. | | | 440,304 | |
| | 6,390 | | | | | Principal Financial Group, Inc. | | | 326,657 | |
| | 8,340 | | | | | Progressive Corp. | | | 222,344 | |
| | 2,650 | | | | | Signature Bank# | | | 355,338 | |
| | 4,970 | | | | | StanCorp Financial Group, Inc. | | | 358,238 | |
| | 9,790 | | | | | Unum Group | | | 334,426 | |
| | 14,400 | | | | | US Bancorp | | | 617,328 | |
| | 2,030 | | | | | Vornado Realty Trust | | | 210,085 | |
| | 38,150 | | | | | Wells Fargo & Company | | | 2,102,065 | |
| | 6,605 | | | | | WR Berkley Corp. | | | 323,579 | |
| | | | | | | | | | |
| | | | | | | | | 21,915,839 | |
| | | | | | | | | | |
| | | | | | Health Care (15.0%) | |
| | 13,285 | | | | | Abbott Laboratories | | | 616,690 | |
| | 2,500 | | | | | Aetna, Inc. | | | 267,175 | |
| | | | | | |
| See accompanying Notes to Schedule of Investments | | www.calamos.com | | | 73 | |
Opportunistic Value Fund Schedule of Investments April 30, 2015 (Unaudited)
| | | | | | | | | | |
NUMBER OF
SHARES | | | | | | | VALUE | |
| | 1,500 | | | | | Anthem, Inc. | | $ | 226,395 | |
| | 7,500 | | | | | Bristol-Myers Squibb Company | | | 477,975 | |
| | 2,800 | | | | | Cardinal Health, Inc. | | | 236,152 | |
| | 2,050 | | | | | Cigna Corp. | | | 255,512 | |
| | 4,800 | | | | | DENTSPLY International, Inc. | | | 244,800 | |
| | 7,900 | | | | | Eli Lilly and Company | | | 567,773 | |
| | 2,850 | | | | | Express Scripts Holding Company# | | | 246,240 | |
| | 4,300 | | | | | Health Net, Inc.# | | | 226,395 | |
| | 19,100 | | | | | Johnson & Johnson | | | 1,894,720 | |
| | 2,050 | | | | | Laboratory Corp. of America Holdings# | | | 245,098 | |
| | 3,500 | | | | | MEDNAX, Inc.# | | | 247,730 | |
| | 10,200 | | | | | Medtronic, PLC | | | 759,390 | |
| | 21,325 | | | | | Merck & Company, Inc. | | | 1,270,117 | |
| | 52,621 | | | | | Pfizer, Inc. | | | 1,785,430 | |
| | 3,700 | | | | | St. Jude Medical, Inc. | | | 259,185 | |
| | 7,800 | | | | | UnitedHealth Group, Inc. | | | 868,920 | |
| | 4,700 | | | | | VCA, Inc.# | | | 239,559 | |
| | 2,040 | | | | | Zimmer Holdings, Inc. | | | 224,074 | |
| | | | | | | | | | |
| | | | | | | | | 11,159,330 | |
| | | | | | | | | | |
| | | | | | Industrials (9.7%) | |
| | 3,940 | | | | | Alaska Air Group, Inc. | | | 252,396 | |
| | 5,100 | | | | | Caterpillar, Inc. | | | 443,088 | |
| | 2,870 | | | | | Danaher Corp. | | | 234,996 | |
| | 5,300 | | | | | Delta Air Lines, Inc. | | | 236,592 | |
| | 3,375 | | | | | Dover Corp. | | | 255,555 | |
| | 4,280 | | | | | Emerson Electric Company | | | 251,792 | |
| | 1,395 | | | | | FedEx Corp. | | | 236,550 | |
| | 3,900 | | | | | Fluor Corp. | | | 234,546 | |
| | 3,050 | | | | | General Dynamics Corp. | | | 418,826 | |
| | 69,605 | | | | | General Electric Company | | | 1,884,904 | |
| | 2,135 | | | | | Hubbell Inc - Class B | | | 232,352 | |
| | 3,640 | | | | | Ingersoll-Rand, PLC | | | 239,658 | |
| | 6,040 | | | | | ITT Corp. | | | 239,486 | |
| | 1,880 | | | | | L-3 Communications Holdings, Inc. | | | 216,031 | |
| | 3,555 | | | | | Lincoln Electric Holdings, Inc. | | | 237,687 | |
| | 720 | | | | | Northrop Grumman Corp. | | | 110,909 | |
| | 2,015 | | | | | Parker-Hannifin Corp. | | | 240,510 | |
| | 1,205 | | | | | Raytheon Company | | | 125,320 | |
| | 5,480 | | | | | Textron, Inc. | | | 241,010 | |
| | 7,900 | | | | | United Technologies Corp. | | | 898,625 | |
| | | | | | | | | | |
| | | | | | | | | 7,230,833 | |
| | | | | | | | | | |
| | | | | | Information Technology (10.0%) | |
| | 4,750 | | | | | Amdocs, Ltd. | | | 261,583 | |
| | 1,896 | | | | | Apple, Inc. | | | 237,284 | |
| | | | | | | | | | |
NUMBER OF
SHARES | | | | | | | VALUE | |
| | 10,300 | | | | | Applied Materials, Inc. | | $ | 203,837 | |
| | 19,890 | | | | | Brocade Communications Systems, Inc. | | | 224,757 | |
| | 41,675 | | | | | Cisco Systems, Inc. | | | 1,201,490 | |
| | 23,100 | | | | | EMC Corp. | | | 621,621 | |
| | 22,000 | | | | | Hewlett-Packard Company | | | 725,340 | |
| | 37,730 | | | | | Intel Corp. | | | 1,228,112 | |
| | 27,300 | | | | | Microsoft Corp. | | | 1,327,872 | |
| | 6,420 | | | | | NetApp, Inc. | | | 232,725 | |
| | 9,785 | | | | | Symantec Corp. | | | 243,891 | |
| | 5,260 | | | | | Synopsys, Inc.# | | | 246,589 | |
| | 2,330 | | | | | Western Digital Corp. | | | 227,734 | |
| | 12,000 | | | | | Yahoo!, Inc.# | | | 510,780 | |
| | | | | | | | | | |
| | | | | | | | | 7,493,615 | |
| | | | | | | | | | |
| | | | | | Materials (2.9%) | |
| | 4,475 | | | | | Albemarle Corp. | | | 267,157 | |
| | 4,550 | | | | | Avery Dennison Corp. | | | 252,934 | |
| | 4,260 | | | | | Celanese Corp.^ | | | 282,694 | |
| | 5,100 | | | | | Domtar Corp. | | | 220,422 | |
| | 8,800 | | | | | Dow Chemical Company | | | 448,800 | |
| | 3,275 | | | | | Eastman Chemical Company | | | 249,621 | |
| | 4,320 | | | | | International Paper Company | | | 232,070 | |
| | 3,515 | | | | | Rock-Tenn Company - Class A | | | 221,375 | |
| | | | | | | | | | |
| | | | | | | | | 2,175,073 | |
| | | | | | | | | | |
| | | | | | Telecommunication Services (2.0%) | |
| | 42,500 | | | | | AT&T, Inc. | | | 1,472,200 | |
| | | | | | | | | | |
| | | | | | Utilities (5.3%) | |
| | 4,000 | | | | | American Electric Power Company, Inc. | | | 227,480 | |
| | 3,800 | | | | | Consolidated Edison, Inc. | | | 233,890 | |
| | 8,390 | | | | | Dominion Resources, Inc. | | | 601,395 | |
| | 7,870 | | | | | Duke Energy Corp. | | | 610,476 | |
| | 6,900 | | | | | Exelon Corp. | | | 234,738 | |
| | 5,845 | | | | | NextEra Energy, Inc. | | | 589,936 | |
| | 4,200 | | | | | PG&E Corp. | | | 222,264 | |
| | 6,800 | | | | | PPL Corp. | | | 231,404 | |
| | 5,450 | | | | | Public Service Enterprise Group, Inc. | | | 226,393 | |
| | 2,050 | | | | | Sempra Energy | | | 217,649 | |
| | 13,360 | | | | | Southern Company | | | 591,848 | |
| | | | | | | | | | |
| | | | | | | | | 3,987,473 | |
| | | | | | | | | | |
| | | | | | TOTAL COMMON STOCKS
(Cost $71,841,876) | | | 73,786,388 | |
| | | | | | | | | | |
| | | | | | | | | | |
| | SHORT TERM INVESTMENT (1.1%) | |
| | 811,324 | | | | | Fidelity Prime Money Market Fund - Institutional Class
(Cost $811,324) | | | 811,324 | |
| | | | | | | | | | |
| | | | |
| 74 | | CALAMOS OPEN-END FAMILY OF FUNDS SEMIANNUAL REPORT | | See accompanying Notes to Schedule of Investments |
Opportunistic Value Fund Schedule of Investments April 30, 2015 (Unaudited)
| | | | | | | | | | |
NUMBER OF SHARES/
PRINCIPAL
AMOUNT | | | | | | | VALUE | |
| INVESTMENT OF CASH COLLATERAL FOR SECURITIES
LOANED (0.1%) |
|
| | | | | | Federal Home Loan Bank
Discount Notes | | | | |
| | 14,083 | | | | | 0.000%, 05/29/15 | | $ | 14,083 | |
| | 8,803 | | | | | 0.000%, 06/10/15 | | | 8,803 | |
| | 4,401 | | | | | 0.000%, 05/27/15 | | | 4,401 | |
| | 4,401 | | | | | 0.000%, 06/15/15 | | | 4,401 | |
| | 8,802 | | | | | Federal Home Loan Mortgage Corp. Discount Note
0.000%, 06/01/15 | | | 8,802 | |
| | 17,487 | | | | | Fidelity Prime Money Market Fund - Institutional Class | | | 17,487 | |
| | 8,020 | | | | | Goldman Sachs Financial Square Fund | | | 8,020 | |
| | 8,803 | | | | | Morgan Stanley Institutional Liquidity Fund | | | 8,803 | |
| | | | | | | | | | |
| | | | | | TOTAL INVESTMENT OF CASH
COLLATERAL FOR
SECURITIES LOANED
(Cost $74,800) | | | 74,800 | |
| | | | | | | | | | |
| TOTAL INVESTMENTS (100.1%)
(Cost $72,728,000) | | | 74,672,512 | |
| | | | | | | | | | |
| |
| | PAYABLE UPON RETURN OF SECURITIES ON LOAN (-0.1%) | | | (74,800 | ) |
| | | | | | | | | | |
| |
| | OTHER ASSETS, LESS LIABILITIES (0.0%) | | | 11,859 | |
| | | | | | | | | | |
| |
| | NET ASSETS (100.0%) | | $ | 74,609,571 | |
| | | | | | | | | | |
NOTES TO SCHEDULE OF INVESTMENTS
| # | Non-income producing security. |
| ^ | Security, or portion of security, is on loan. |
| | | | | | |
| See accompanying Notes to Financial Statements | | www.calamos.com | | | 75 | |
Focus Growth Fund Schedule of Investments April 30, 2015 (Unaudited)
| | | | | | | | | | |
NUMBER OF
SHARES | | | | | | | VALUE | |
| | | | | | | | | | |
| | COMMON STOCKS (96.7%) | |
| | | | | | Consumer Discretionary (19.0%) | |
| | 18,200 | | | | | Deckers Outdoor Corp.#~ | | $ | 1,346,800 | |
| | 14,000 | | | | | Home Depot, Inc. | | | 1,497,720 | |
| | 16,500 | | | | | Nike, Inc. - Class B | | | 1,630,860 | |
| | 855 | | | | | Priceline Group, Inc.# | | | 1,058,328 | |
| | 16,565 | | | | | Restoration Hardware Holdings, Inc.#~ | | | 1,427,406 | |
| | 18,300 | | | | | Royal Caribbean Cruises, Ltd. | | | 1,245,498 | |
| | 29,000 | | | | | Starbucks Corp. | | | 1,437,820 | |
| | 16,000 | | | | | Under Armour, Inc.# | | | 1,240,800 | |
| | 14,600 | | | | | Walt Disney Company~ | | | 1,587,312 | |
| | | | | | | | | | |
| | | | | | | | | 12,472,544 | |
| | | | | | | | | | |
| | | | | | Consumer Staples (10.4%) | |
| | 17,300 | | | | | Keurig Green Mountain, Inc. | | | 2,013,201 | |
| | 28,300 | | | | | Mondelez International, Inc. - Class A | | | 1,085,871 | |
| | 32,300 | | | | | Reynolds American, Inc. | | | 2,367,590 | |
| | 30,100 | | | | | Sprouts Farmers Market, Inc.# | | | 962,748 | |
| | 8,679 | | | | | WhiteWave Foods Company - Class A# | | | 381,616 | |
| | | | | | | | | | |
| | | | | | | | | 6,811,026 | |
| | | | | | | | | | |
| | | | | | Energy (5.1%) | |
| | 10,600 | | | | | EOG Resources, Inc. | | | 1,048,870 | |
| | 24,600 | | | | | Schlumberger, Ltd. | | | 2,327,406 | |
| | | | | | | | | | |
| | | | | | | | | 3,376,276 | |
| | | | | | | | | | |
| | | | | | Financials (9.4%) | |
| | 25,700 | | | | | Blackstone Group, LP | | | 1,052,672 | |
| | 18,100 | | | | | Morgan Stanley | | | 675,311 | |
| | 28,300 | | | | | Realogy Holdings Corp.# | | | 1,341,703 | |
| | 10,400 | | | | | SVB Financial Group# | | | 1,380,704 | |
| | 89,500 | | | | | WisdomTree Investments, Inc. | | | 1,704,080 | |
| | | | | | | | | | |
| | | | | | | | | 6,154,470 | |
| | | | | | | | | | |
| | | | | | Health Care (14.7%) | |
| | 1,700 | | | | | Biogen, Inc.# | | | 635,681 | |
| | 11,600 | | | | | Cepheid# | | | 650,760 | |
| | 23,100 | | | | | Cerner Corp.# | | | 1,658,811 | |
| | 5,925 | | | | | Illumina, Inc.#~ | | | 1,091,681 | |
| | 45,700 | | | | | Insulet Corp.#~ | | | 1,364,145 | |
| | 11,400 | | | | | Laboratory Corp. of America Holdings# | | | 1,362,984 | |
| | 5,018 | | | | | Perrigo Company, PLC | | | 919,699 | |
| | 25,300 | | | | | Wright Medical Group, Inc.# | | | 641,861 | |
| | 12,300 | | | | | Zimmer Holdings, Inc. | | | 1,351,032 | |
| | | | | | | | | | |
| | | | | | | | | 9,676,654 | |
| | | | | | | | | | |
| | | | | | Industrials (8.3%) | |
| | 11,050 | | | | | Boeing Company | | | 1,583,907 | |
| | 9,200 | | | | | FedEx Corp. | | | 1,560,044 | |
| | 22,000 | | | | | Fortune Brands Home & Security, Inc. | | | 981,200 | |
| | 12,900 | | | | | Honeywell International, Inc. | | | 1,301,868 | |
| | | | | | | | | | |
| | | | | | | | | 5,427,019 | |
| | | | | | | | | | |
| | | | | | | | | | |
NUMBER OF
SHARES | | | | | | | VALUE | |
| | | | | | | | | | |
| | | | | | Information Technology (28.8%) | |
| | 52,000 | | | | | Apple, Inc.~ | | $ | 6,507,800 | |
| | 2,900 | | | | | Equinix, Inc. | | | 742,197 | |
| | 24,600 | | | | | Facebook, Inc. - Class A#~ | | | 1,937,742 | |
| | 23,700 | | | | | FireEye, Inc.#^ | | | 978,810 | |
| | 3,280 | | | | | Google, Inc. - Class A#~ | | | 1,799,966 | |
| | 30,400 | | | | | Microsoft Corp. | | | 1,478,656 | |
| | 91,100 | | | | | Tencent Holdings, Ltd.~ | | | 1,878,482 | |
| | 41,500 | | | | | Twitter, Inc.# | | | 1,616,840 | |
| | 29,800 | | | | | Visa, Inc. - Class A^ | | | 1,968,290 | |
| | | | | | | | | | |
| | | | | | | | | 18,908,783 | |
| | | | | | | | | | |
| | | | | | Telecommunication Services (1.0%) | |
| | 19,300 | | | | | T-Mobile USA, Inc.# | | | 656,972 | |
| | | | | | | | | | |
| | | | | | TOTAL COMMON STOCKS
(Cost $53,963,516) | | | 63,483,744 | |
| | | | | | | | | | |
| | | | | | | | | | |
| | SHORT TERM INVESTMENT (2.5%) | | | | |
| | 1,633,029 | | | | | Fidelity Prime Money Market
Fund - Institutional Class
(Cost $1,633,029) | | | 1,633,029 | |
| | | | | | | | | | |
| | | | | | | | | | |
NUMBER OF
SHARES/
PRINCIPAL
AMOUNT | | | | | | | VALUE | |
| | | | | | | | | | |
| INVESTMENT OF CASH COLLATERAL FOR SECURITIES
LOANED (1.7%) |
|
| | | | | | Federal Home Loan Bank
Discount Notes | | | | |
| | 214,631 | | | | | 0.000%, 05/29/15 | | | 214,631 | |
| | 134,155 | | | | | 0.000%, 06/10/15 | | | 134,155 | |
| | 67,080 | | | | | 0.000%, 05/27/15 | | | 67,080 | |
| | 67,079 | | | | | 0.000%, 06/15/15 | | | 67,079 | |
| | 134,148 | | | | | Federal Home Loan Mortgage Corp. Discount Note
0.000%, 06/01/15 | | | 134,148 | |
| | 266,507 | | | | | Fidelity Prime Money Market Fund - Institutional Class | | | 266,507 | |
| | 122,235 | | | | | Goldman Sachs Financial Square Fund | | | 122,235 | |
| | 134,165 | | | | | Morgan Stanley Institutional Liquidity Fund | | | 134,165 | |
| | | | | | | | | | |
| | | | | | TOTAL INVESTMENT OF
CASH COLLATERAL FOR
SECURITIES LOANED
(Cost $1,140,000) | | | 1,140,000 | |
| | | | | | | | | | |
| TOTAL INVESTMENTS (100.9%)
(Cost $56,736,545) | | | 66,256,773 | |
| | | | | | | | | | |
| |
| | PAYABLE UPON RETURN OF SECURITIES ON LOAN (-1.7%) | | | (1,140,000 | ) |
| | | | | | | | | | |
| |
| | OTHER ASSETS, LESS LIABILITIES (0.8%) | | | 540,723 | |
| | | | | | | | | | |
| |
| | NET ASSETS (100.0%) | | $ | 65,657,496 | |
| | | | | | | | | | |
| | | | |
| 76 | | CALAMOS OPEN-END FAMILY OF FUNDS SEMIANNUAL REPORT | | See accompanying Notes to Schedule of Investments |
Focus Growth Fund Schedule of Investments April 30, 2015 (Unaudited)
FORWARD FOREIGN CURRENCY CONTRACTS
| | | | | | | | | | | | | | | | |
| COUNTERPARTY | | SHORT
CONTRACTS | | SETTLEMENT
DATE | | LOCAL
CURRENCY | | | CURRENT
VALUE | | | UNREALIZED
GAIN/LOSS | |
| Barclays Bank plc | | Hong Kong Dollar | | 07/23/15 | | | 13,314,000 | | | $ | 1,717,797 | | | $ | (425 | ) |
| Northern Trust Company | | Hong Kong Dollar | | 07/23/15 | | | 794,000 | | | | 102,443 | | | | 1 | |
| | | | | | | | | | | | | | | | |
| | | | | | | | | | | | | | $ | (424 | ) |
| | | | | | | | | | | | | | | | |
NOTES TO SCHEDULE OF INVESTMENTS
| # | Non-income producing security. |
| ~ | Security, or portion of security, is segregated as collateral for written options. The aggregate value of such securities is $488,932. |
| ^ | Security, or portion of security, is on loan. |
| | | | | | |
| See accompanying Notes to Financial Statements | | www.calamos.com | | | 77 | |
Discovery Growth Fund Schedule of Investments April 30, 2015 (Unaudited)
| | | | | | | | | | |
NUMBER OF
SHARES | | | | | | | VALUE | |
| | | | | | | | | | |
| | COMMON STOCKS (90.8%) | | | | |
| | | | | | Consumer Discretionary (17.5%) | |
| | 8,600 | | | | | AMC Networks, Inc. - Class A# | | $ | 648,784 | |
| | 44,800 | | | | | Belmond, Ltd.# | | | 551,936 | |
| | 9,400 | | | | | Bloomin’ Brands, Inc. | | | 213,004 | |
| | 10,600 | | | | | D.R. Horton, Inc. | | | 269,240 | |
| | 2,600 | | | | | Deckers Outdoor Corp.# | | | 192,400 | |
| | 14,600 | | | | | Gentherm, Inc.# | | | 769,858 | |
| | 12,800 | | | | | Homeinns Hotel Group# | | | 358,016 | |
| | 28,200 | | | | | Kirkland’s, Inc.# | | | 669,468 | |
| | 16,000 | | | | | Lions Gate Entertainment Corp. | | | 496,160 | |
| | 41,800 | | | | | LKQ Corp.# | | | 1,131,526 | |
| | 11,300 | | | | | Monro Muffler Brake, Inc. | | | 676,757 | |
| | 5,300 | | | | | Norwegian Cruise Line Holdings, Ltd.# | | | 257,103 | |
| | 6,900 | | | | | Red Robin Gourmet Burgers, Inc.# | | | 518,121 | |
| | 18,300 | | | | | Sotheby’s | | | 781,593 | |
| | 13,800 | | | | | Vitamin Shoppe, Inc.# | | | 577,944 | |
| | 38,700 | | | | | Wendy’s Company | | | 391,644 | |
| | | | | | | | | | |
| | | | | | | | | 8,503,554 | |
| | | | | | | | | | |
| | | | | | Consumer Staples (0.6%) | |
| | 17,600 | | | | | Dean Foods Company | | | 286,000 | |
| | | | | | | | | | |
| | | | | | Energy (4.2%) | |
| | 12,200 | | | | | Carrizo Oil & Gas, Inc.# | | | 679,906 | |
| | 6,200 | | | | | Diamondback Energy, Inc.# | | | 511,934 | |
| | 4,000 | | | | | Dril-Quip, Inc.# | | | 318,880 | |
| | 10,500 | | | | | Gulfport Energy Corp.# | | | 513,870 | |
| | | | | | | | | | |
| | | | | | | | | 2,024,590 | |
| | | | | | | | | | |
| | | | | | Financials (6.6%) | |
| | 7,700 | | | | | BankUnited, Inc. | | | 253,022 | |
| | 13,800 | | | | | Evercore Partners, Inc. - Class A | | | 665,712 | |
| | 6,200 | | | | | PRA Group, Inc.# | | | 339,605 | |
| | 12,600 | | | | | PrivateBancorp, Inc. | | | 467,082 | |
| | 14,000 | | | | | Realogy Holdings Corp.# | | | 663,740 | |
| | 6,300 | | | | | SVB Financial Group# | | | 836,388 | |
| | | | | | | | | | |
| | | | | | | | | 3,225,549 | |
| | | | | | | | | | |
| | | | | | Health Care (22.4%) | |
| | 17,800 | | | | | Acadia Healthcare Company, Inc.# | | | 1,219,300 | |
| | 14,700 | | | | | Air Methods Corp.# | | | 671,790 | |
| | 8,500 | | | | | Alkermes, PLC# | | | 470,645 | |
| | 27,700 | | | | | Allscripts Healthcare Solutions, Inc.# | | | 368,410 | |
| | 8,700 | | | | | Amsurg Corp.# | | | 545,664 | |
| | 10,600 | | | | | Cepheid# | | | 594,660 | |
| | 11,500 | | | | | Community Health Systems, Inc.# | | | 617,320 | |
| | 25,500 | | | | | Endologix, Inc.# | | | 396,780 | |
| | 20,800 | | | | | Envision Healthcare Holdings, Inc.# | | | 789,568 | |
| | 26,800 | | | | | Globus Medical, Inc. - Class A# | | | 640,252 | |
| | 13,608 | | | | | Insulet Corp.# | | | 406,199 | |
| | | | | | | | | | |
NUMBER OF
SHARES | | | | | | | VALUE | |
| | 3,600 | | | | | Isis Pharmaceuticals, Inc.# | | $ | 204,192 | |
| | 3,700 | | | | | Jazz Pharmaceuticals, PLC# | | | 661,190 | |
| | 13,700 | | | | | NxStage Medical, Inc.# | | | 251,121 | |
| | 4,800 | | | | | PAREXEL International Corp.# | | | 305,160 | |
| | 6,600 | | | | | Phibro Animal Health Corp. | | | 209,616 | |
| | 29,600 | | | | | Spectranetics Corp.# | | | 759,240 | |
| | 68,200 | | | | | Staar Surgical Company#^ | | | 603,570 | |
| | 8,300 | | | | | STERIS Corp.^ | | | 551,950 | |
| | 9,368 | | | | | Wright Medical Group, Inc.# | | | 237,666 | |
| | 21,100 | | | | | XenoPort, Inc.# | | | 125,123 | |
| | 7,600 | | | | | Zeltiq Aesthetics, Inc.# | | | 233,320 | |
| | | | | | | | | | |
| | | | | | | | | 10,862,736 | |
| | | | | | | | | | |
| | | | | | Industrials (12.6%) | |
| | 7,900 | | | | | A.O. Smith Corp. | | | 504,810 | |
| | 22,000 | | | | | DigitalGlobe, Inc.# | | | 707,740 | |
| | 4,300 | | | | | Huron Consulting Group, Inc.# | | | 260,666 | |
| | 30,800 | | | | | JetBlue Airways Corp.# | | | 632,324 | |
| | 6,100 | | | | | Manpowergroup, Inc. | | | 520,513 | |
| | 5,400 | | | | | Power Solutions International, Inc.# | | | 344,520 | |
| | 25,600 | | | | | Quanta Services, Inc.# | | | 740,096 | |
| | 29,400 | | | | | Roadrunner Transportation Systems, Inc.# | | | 719,418 | |
| | 7,900 | | | | | Spirit Airlines, Inc.# | | | 540,913 | |
| | 9,400 | | | | | US Ecology, Inc. | | | 440,954 | |
| | 5,500 | | | | | WABCO Holdings, Inc.# | | | 684,475 | |
| | | | | | | | | | |
| | | | | | | | | 6,096,429 | |
| | | | | | | | | | |
| | | | | | Information Technology (24.3%) | |
| | 16,900 | | | | | Booz Allen Hamilton Holding Corp. | | | 464,750 | |
| | 60,500 | | | | | Calix, Inc.# | | | 447,095 | |
| | 5,700 | | | | | Criteo, SA# | | | 236,322 | |
| | 6,200 | | | | | Demandware, Inc.# | | | 381,920 | |
| | 1,100 | | | | | Equinix, Inc. | | | 281,523 | |
| | 8,700 | | | | | FireEye, Inc.# | | | 359,310 | |
| | 25,800 | | | | | GTT Communications, Inc.# | | | 471,108 | |
| | 11,500 | | | | | Guidewire Software, Inc.# | | | 574,425 | |
| | 15,200 | | | | | Hollysys Automation Technologies, Ltd. | | | 333,944 | |
| | 3,500 | | | | | IAC/InterActiveCorp | | | 244,370 | |
| | 11,200 | | | | | Imperva, Inc.# | | | 510,944 | |
| | 61,700 | | | | | Internap Network Services Corp.# | | | 579,980 | |
| | 8,500 | | | | | J2 Global, Inc. | | | 589,645 | |
| | 51,400 | | | | | MaxLinear, Inc. - Class A# | | | 438,442 | |
| | 11,400 | | | | | Mellanox Technologies, Ltd.# | | | 529,986 | |
| | 10,100 | | | | | NICE-Systems, Ltd. | | | 604,485 | |
| | 18,700 | | | | | Progress Software Corp.# | | | 493,680 | |
| | 5,250 | | | | | Proofpoint, Inc.# | | | 283,395 | |
| | 23,600 | | | | | Sabre Corp. | | | 587,404 | |
| | 16,200 | | | | | SunPower Corp.#^ | | | 521,478 | |
| | | | |
| 78 | | CALAMOS OPEN-END FAMILY OF FUNDS SEMIANNUAL REPORT | | See accompanying Notes to Schedule of Investments |
Discovery Growth Fund Schedule of Investments April 30, 2015 (Unaudited)
| | | | | | | | | | |
NUMBER OF
SHARES | | | | | | | VALUE | |
| | 4,500 | | | | | Ultimate Software Group, Inc.# | | $ | 747,990 | |
| | 9,000 | | | | | Vantiv, Inc. - Class A# | | | 351,900 | |
| | 15,750 | | | | | VeriFone Systems, Inc.# | | | 563,377 | |
| | 10,600 | | | | | Verint Systems, Inc.# | | | 651,158 | |
| | 7,300 | | | | | Virtusa Corp.# | | | 290,540 | |
| | 17,100 | | | | | Workiva, Inc.# | | | 247,437 | |
| | | | | | | | | | |
| | | | | | | | | 11,786,608 | |
| | | | | | | | | | |
| | | | | | Materials (2.6%) | |
| | 46,500 | | | | | Horsehead Holding Corp.# | | | 695,175 | |
| | 15,100 | | | | | PolyOne Corp. | | | 589,655 | |
| | | | | | | | | | |
| | | | | | | | | 1,284,830 | |
| | | | | | | | | | |
| | | | | | TOTAL COMMON STOCKS
(Cost $40,628,536) | | | 44,070,296 | |
| | | | | | | | | | |
| | | | | | | | | | |
| | SHORT TERM INVESTMENT (9.6%) | | | | |
| | 4,654,869 | | | | | Fidelity Prime Money Market Fund - Institutional Class
(Cost $4,654,869) | | | 4,654,869 | |
| | | | | | | | | | |
| | | | | | | | | | |
NUMBER OF
SHARES/
PRINCIPAL
AMOUNT | | | | | | | VALUE | |
| INVESTMENT OF CASH COLLATERAL FOR SECURITIES
LOANED (3.3%) |
|
| | | | | | Federal Home Loan Bank Discount Notes | | | | |
| | 298,525 | | | | | 0.000%, 05/29/15 | | | 298,525 | |
| | 186,593 | | | | | 0.000%, 06/10/15 | | | 186,593 | |
| | 93,301 | | | | | 0.000%, 05/27/15 | | | 93,301 | |
| | 93,298 | | | | | 0.000%, 06/15/15 | | | 93,298 | |
| | 186,584 | | | | | Federal Home Loan Mortgage Corp. Discount Note 0.000%, 06/01/15 | | | 186,584 | |
| | 370,678 | | | | | Fidelity Prime Money Market Fund -Institutional Class | | | 370,678 | |
| | 170,014 | | | | | Goldman Sachs Financial Square Fund | | | 170,014 | |
| | 186,607 | | | | | Morgan Stanley Institutional Liquidity Fund | | | 186,607 | |
| | | | | | | | | | |
| | | | | | TOTAL INVESTMENT OF
CASH COLLATERAL FOR
SECURITIES LOANED
(Cost $1,585,600) | | | 1,585,600 | |
| | | | | | | | | | |
| TOTAL INVESTMENTS (103.7%)
(Cost $46,869,005) | | | 50,310,765 | |
| | | | | | | | | | |
| |
| | PAYABLE UPON RETURN OF SECURITIES ON LOAN (-3.3%) | | | (1,585,600 | ) |
| | | | | | | | | | |
| |
| | LIABILITIES, LESS OTHER ASSETS (-0.4%) | | | (203,477 | ) |
| | | | | | | | | | |
| |
| | NET ASSETS (100.0%) | | $ | 48,521,688 | |
| | | | | | | | | | |
| | | | | | | | | | |
NOTES TO SCHEDULE OF INVESTMENTS
| # | Non-income producing security. |
| ^ | Security, or portion of security, is on loan. |
| | | | | | |
| See accompanying Notes to Financial Statements | | www.calamos.com | | | 79 | |
Dividend Growth Fund Schedule of Investments April 30, 2015 (Unaudited)
| | | | | | | | | | |
NUMBER OF SHARES | | | | | | | VALUE | |
| | | | | | | | | | |
| | COMMON STOCKS (94.8%) | | | | |
| | | | | | Consumer Discretionary (14.9%) | | | | |
| | 5,600 | | | | | Comcast Corp. - Class A | | $ | 323,456 | |
| | 9,715 | | | | | Ford Motor Company | | | 153,497 | |
| | 4,115 | | | | | General Motors Company, Inc. | | | 144,272 | |
| | 4,970 | | | | | Home Depot, Inc. | | | 531,691 | |
| | 17,300 | | | | | Lamar Advertising Company | | | 1,002,708 | |
| | 2,480 | | | | | Nike, Inc. - Class B | | | 245,123 | |
| | 9,470 | | | | | Omnicom Group, Inc. | | | 717,447 | |
| | 1,205 | | | | | Royal Caribbean Cruises, Ltd. | | | 82,012 | |
| | 7,200 | | | | | Starbucks Corp. | | | 356,976 | |
| | 10,120 | | | | | Target Corp. | | | 797,760 | |
| | 1,855 | | | | | Time Warner, Inc. | | | 156,580 | |
| | 3,200 | | | | | Walt Disney Company | | | 347,904 | |
| | | | | | | | | | |
| | | | | | | | | 4,859,426 | |
| | | | | | | | | | |
| | | | | | Consumer Staples (6.3%) | | | | |
| | 7,700 | | | | | Coca-Cola Company | | | 312,312 | |
| | 2,330 | | | | | Lorillard, Inc. | | | 162,774 | |
| | 3,300 | | | | | PepsiCo, Inc. | | | 313,896 | |
| | 5,385 | | | | | Philip Morris International, Inc. | | | 449,486 | |
| | 2,870 | | | | | Procter & Gamble Company | | | 228,193 | |
| | 6,915 | | | | | Walgreens Boots Alliance, Inc. | | | 573,461 | |
| | | | | | | | | | |
| | | | | | | | | 2,040,122 | |
| | | | | | | | | | |
| | | | | | Energy (7.7%) | | | | |
| | 3,940 | | | | | Chevron Corp. | | | 437,576 | |
| | 1,770 | | | | | EOG Resources, Inc. | | | 175,142 | |
| | 8,495 | | | | | Exxon Mobil Corp. | | | 742,208 | |
| | 18,140 | | | | | Kinder Morgan, Inc.~ | | | 779,113 | |
| | 3,865 | | | | | Schlumberger, Ltd. | | | 365,668 | |
| | | | | | | | | | |
| | | | | | | | | 2,499,707 | |
| | | | | | | | | | |
| | | | | | Financials (16.1%) | | | | |
| | 4,490 | | | | | Allstate Corp. | | | 312,773 | |
| | 19,510 | | | | | American Homes 4 Rent | | | 329,524 | |
| | 4,300 | | | | | American International Group, Inc. | | | 242,047 | |
| | 3,255 | | | | | Berkshire Hathaway, Inc. - Class B# | | | 459,639 | |
| | 14,700 | | | | | Blackstone Group, LP | | | 602,112 | |
| | 5,400 | | | | | Charles Schwab Corp. | | | 164,700 | |
| | 5,715 | | | | | Citigroup, Inc. | | | 304,724 | |
| | 10,780 | | | | | JPMorgan Chase & Company | | | 681,943 | |
| | 22,580 | | | | | Oaktree Capital Group, LLC | | | 1,207,578 | |
| | 14,670 | | | | | Senior Housing Properties Trust | | | 300,295 | |
| | 3,170 | | | | | State Street Corp. | | | 244,470 | |
| | 7,261 | | | | | Wells Fargo & Company~ | | | 400,081 | |
| | | | | | | | | | |
| | | | | | | | | 5,249,886 | |
| | | | | | | | | | |
| | | | | | Health Care (14.3%) | | | | |
| | 3,200 | | | | | AbbVie, Inc. | | | 206,912 | |
| | 2,300 | | | | | Anthem, Inc. | | | 347,139 | |
| | | | | | | | | | |
NUMBER OF SHARES | | | | | | | VALUE | |
| | 350 | | | | | Biogen, Inc.# | | $ | 130,875 | |
| | 3,200 | | | | | Bristol-Myers Squibb Company | | | 203,936 | |
| | 2,665 | | | | | Cardinal Health, Inc. | | | 224,766 | |
| | 2,900 | | | | | Gilead Sciences, Inc.# | | | 291,479 | |
| | 9,640 | | | | | Johnson & Johnson~ | | | 956,288 | |
| | 760 | | | | | Laboratory Corp. of America Holdings# | | | 90,866 | |
| | 14,765 | | | | | Merck & Company, Inc. | | | 879,403 | |
| | 25,294 | | | | | Pfizer, Inc. | | | 858,225 | |
| | 3,420 | | | | | Stryker Corp. | | | 315,461 | |
| | 1,340 | | | | | Zimmer Holdings, Inc. | | | 147,186 | |
| | | | | | | | | | |
| | | | | | | | | 4,652,536 | |
| | | | | | | | | | |
| | | | | | Industrials (8.4%) | | | | |
| | 3,095 | | | | | Boeing Company | | | 443,637 | |
| | 3,475 | | | | | Delta Air Lines, Inc. | | | 155,124 | |
| | 4,600 | | | | | Eaton Corp., PLC | | | 316,158 | |
| | 18,665 | | | | | General Electric Company | | | 505,448 | |
| | 1,530 | | | | | Honeywell International, Inc. | | | 154,408 | |
| | 3,550 | | | | | Ingersoll-Rand, PLC | | | 233,732 | |
| | 1,605 | | | | | Lockheed Martin Corp. | | | 299,493 | |
| | 2,980 | | | | | Union Pacific Corp. | | | 316,566 | |
| | 2,700 | | | | | United Technologies Corp. | | | 307,125 | |
| | | | | | | | | | |
| | | | | | | | | 2,731,691 | |
| | | | | | | | | | |
| | | | | | Information Technology (18.9%) | | | | |
| | 1,785 | | | | | Accenture, PLC - Class A | | | 165,380 | |
| | 10,810 | | | | | Apple, Inc. | | | 1,352,871 | |
| | 6,650 | | | | | Applied Materials, Inc. | | | 131,604 | |
| | 3,500 | | | | | Broadcom Corp. - Class A | | | 154,718 | |
| | 8,295 | | | | | Cisco Systems, Inc. | | | 239,145 | |
| | 2,995 | | | | | Facebook, Inc. - Class A# | | | 235,916 | |
| | 1,002 | | | | | Google, Inc. - Class C# | | | 538,415 | |
| | 12,830 | | | | | Intel Corp. | | | 417,616 | |
| | 1,695 | | | | | International Business Machines Corp. | | | 290,337 | |
| | 2,640 | | | | | MasterCard, Inc. - Class A | | | 238,154 | |
| | 22,495 | | | | | Microsoft Corp. | | | 1,094,157 | |
| | 6,000 | | | | | Oracle Corp. | | | 261,720 | |
| | 4,620 | | | | | QUALCOMM, Inc. | | | 314,160 | |
| | 2,415 | | | | | Salesforce.com, Inc.# | | | 175,860 | |
| | 10,000 | | | | | Symantec Corp. | | | 249,250 | |
| | 5,700 | | | | | Texas Instruments, Inc. | | | 308,997 | |
| | | | | | | | | | |
| | | | | | | | | 6,168,300 | |
| | | | | | | | | | |
| | | | | | Materials (0.5%) | | | | |
| | 3,310 | | | | | Dow Chemical Company | | | 168,810 | |
| | | | | | | | | | |
| | | | | | Telecommunication Services (3.8%) | | | | |
| | 9,400 | | | | | AT&T, Inc. | | | 325,616 | |
| | 18,284 | | | | | Verizon Communications, Inc. | | | 922,245 | |
| | | | | | | | | | |
| | | | | | | | | 1,247,861 | |
| | | | | | | | | | |
| | | | |
| 80 | | CALAMOS OPEN-END FAMILY OF FUNDS SEMIANNUAL REPORT | | See accompanying Notes to Schedule of Investments |
Dividend Growth Fund Schedule of Investments April 30, 2015 (Unaudited)
| | | | | | | | | | |
NUMBER OF SHARES | | | | | | | VALUE | |
| | | | | | | | | | |
| | | | | | Utilities (3.9%) | | | | |
| | 4,400 | | | | | Dominion Resources, Inc. | | $ | 315,392 | |
| | 4,000 | | | | | Duke Energy Corp. | | | 310,280 | |
| | 9,500 | | | | | Exelon Corp. | | | 323,190 | |
| | 3,100 | | | | | NextEra Energy, Inc. | | | 312,883 | |
| | | | | | | | | | |
| | | | | | | | | 1,261,745 | |
| | | | | | | | | | |
| | | | | | TOTAL COMMON STOCKS
(Cost $29,370,340) | | | 30,880,084 | |
| | | | | | | | | | |
| | | | | | | | | | |
| | SHORT TERM INVESTMENT (5.0%) | | | | |
| | 1,630,512 | | | | | Fidelity Prime Money Market Fund - Institutional Class
(Cost $1,630,512) | | | 1,630,512 | |
| | | | | | | | | | |
| TOTAL INVESTMENTS (99.8%)
(Cost $31,000,852) | | | 32,510,596 | |
| | | | | | | | | | |
| |
| | OTHER ASSETS, LESS LIABILITIES (0.2%) | | | 58,317 | |
| | | | | | | | | | |
| |
| | NET ASSETS (100.0%) | | $ | 32,568,913 | |
| | | | | | | | | | |
NOTES TO SCHEDULE OF INVESTMENTS
| ~ | Security, or portion of security, is segregated as collateral for written options. The aggregate value of such securities is $245,455. |
| # | Non-income producing security. |
| | | | | | |
| See accompanying Notes to Financial Statements | | www.calamos.com | | | 81 | |
Mid Cap Growth Fund Schedule of Investments April 30, 2015 (Unaudited)
| | | | | | | | | | |
NUMBER OF
SHARES | | | | | | | VALUE | |
| | | | | | | | | | |
| | COMMON STOCKS (90.7%) | | | | |
| | | | | | Consumer Discretionary (19.8%) | |
| | 700 | | | | | AutoZone, Inc.# | | $ | 470,862 | |
| | 13,600 | | | | | Bloomin’ Brands, Inc. | | | 308,176 | |
| | 10,900 | | | | | D.R. Horton, Inc. | | | 276,860 | |
| | 13,200 | | | | | Dave & Buster’s Entertainment, Inc.# | | | 416,064 | |
| | 15,800 | | | | | Deckers Outdoor Corp.# | | | 1,169,200 | |
| | 3,800 | | | | | Delphi Automotive, PLC | | | 315,400 | |
| | 8,400 | | | | | Dollar General Corp. | | | 610,764 | |
| | 4,900 | | | | | Gentherm, Inc.# | | | 258,377 | |
| | 17,400 | | | | | Lions Gate Entertainment Corp. | | | 539,574 | |
| | 26,500 | | | | | LKQ Corp.# | | | 717,355 | |
| | 2,300 | | | | | Mohawk Industries, Inc.# | | | 399,050 | |
| | 4,400 | | | | | PVH Corp. | | | 454,740 | |
| | 10,600 | | | | | Restoration Hardware Holdings, Inc.# | | | 913,402 | |
| | 5,500 | | | | | Royal Caribbean Cruises, Ltd. | | | 374,330 | |
| | 24,600 | | | | | Wendy’s Company | | | 248,952 | |
| | 2,750 | | | | | Whirlpool Corp. | | | 482,900 | |
| | | | | | | | | | |
| | | | | | | | | 7,956,006 | |
| | | | | | | | | | |
| | | | | | Consumer Staples (3.3%) | |
| | 18,700 | | | | | Dean Foods Company | | | 303,875 | |
| | 5,500 | | | | | Kroger Company | | | 379,005 | |
| | 18,500 | | | | | Smart & Final Stores, Inc.# | | | 320,420 | |
| | 6,839 | | | | | WhiteWave Foods Company - Class A# | | | 300,711 | |
| | | | | | | | | | |
| | | | | | | | | 1,304,011 | |
| | | | | | | | | | |
| | | | | | Energy (3.8%) | |
| | 7,500 | | | | | Antero Resources Corp.#^ | | | 332,325 | |
| | 11,300 | | | | | Bonanza Creek Energy, Inc.# | | | 311,428 | |
| | 2,000 | | | | | Cimarex Energy Company | | | 248,800 | |
| | 2,700 | | | | | Dril-Quip, Inc.# | | | 215,244 | |
| | 8,850 | | | | | Gulfport Energy Corp.# | | | 433,119 | |
| | | | | | | | | | |
| | | | | | | | | 1,540,916 | |
| | | | | | | | | | |
| | | | | | Financials (10.1%) | |
| | 1,200 | | | | | Affiliated Managers Group, Inc.# | | | 271,356 | |
| | 10,400 | | | | | Arthur J. Gallagher & Company | | | 497,432 | |
| | 7,000 | | | | | Blackstone Group, LP | | | 286,720 | |
| | 53,000 | | | | | MGIC Investment Corp.# | | | 552,260 | |
| | 29,233 | | | | | Och-Ziff Capital Management Group, LLC - Class A | | | 377,398 | |
| | 12,300 | | | | | Realogy Holdings Corp.# | | | 583,143 | |
| | 8,750 | | | | | SVB Financial Group# | | | 1,161,650 | |
| | 4,100 | | | | | T. Rowe Price Group, Inc. | | | 332,838 | |
| | | | | | | | | | |
| | | | | | | | | 4,062,797 | |
| | | | | | | | | | |
| | | | | | Health Care (18.6%) | |
| | 5,700 | | | | | Acadia Healthcare Company, Inc.# | | | 390,450 | |
| | 6,300 | | | | | Align Technology, Inc.# | | | 370,692 | |
| | 6,700 | | | | | Amsurg Corp.# | | | 420,224 | |
| | | | | | | | | | |
NUMBER OF
SHARES | | | | | | | VALUE | |
| | | | | | | | | | |
| | 8,400 | | | | | Cepheid# | | $ | 471,240 | |
| | 17,700 | | | | | Cerner Corp.# | | | 1,271,037 | |
| | 11,600 | | | | | Envision Healthcare Holdings, Inc.# | | | 440,336 | |
| | 4,425 | | | | | Illumina, Inc.# | | | 815,306 | |
| | 20,800 | | | | | Insulet Corp.# | | | 620,880 | |
| | 1,120 | | | | | Jazz Pharmaceuticals, PLC# | | | 200,144 | |
| | 4,400 | | | | | Laboratory Corp. of America Holdings# | | | 526,064 | |
| | 3,400 | | | | | PAREXEL International Corp.# | | | 216,155 | |
| | 5,700 | | | | | Stryker Corp. | | | 525,768 | |
| | 9,152 | | | | | Wright Medical Group, Inc.# | | | 232,186 | |
| | 19,500 | | | | | XenoPort, Inc.# | | | 115,635 | |
| | 7,725 | | | | | Zimmer Holdings, Inc. | | | 848,514 | |
| | | | | | | | | | |
| | | | | | | | | 7,464,631 | |
| | | | | | | | | | |
| | | | | | Industrials (13.9%) | |
| | 8,100 | | | | | B/E Aerospace, Inc. | | | 484,299 | |
| | 9,500 | | | | | Delta Air Lines, Inc. | | | 424,080 | |
| | 16,745 | | | | | DigitalGlobe, Inc.# | | | 538,687 | |
| | 16,500 | | | | | Fortune Brands Home & Security, Inc. | | | 735,900 | |
| | 5,100 | | | | | Huron Consulting Group, Inc.# | | | 309,162 | |
| | 2,600 | | | | | L-3 Communications Holdings, Inc. | | | 298,766 | |
| | 8,200 | | | | | Manpowergroup, Inc. | | | 699,706 | |
| | 4,200 | | | | | Quanta Services, Inc.# | | | 121,422 | |
| | 17,600 | | | | | Roadrunner Transportation Systems, Inc.# | | | 430,672 | |
| | 4,700 | | | | | Rockwell Automation, Inc. | | | 557,420 | |
| | 9,800 | | | | | Spirit Airlines, Inc.# | | | 671,006 | |
| | 2,450 | | | | | WABCO Holdings, Inc.# | | | 304,902 | |
| | | | | | | | | | |
| | | | | | | | | 5,576,022 | |
| | | | | | | | | | |
| | | | | | Information Technology (19.8%) | | | | |
| | 26,100 | | | | | Applied Materials, Inc. | | | 516,519 | |
| | 12,000 | | | | | Booz Allen Hamilton Holding Corp. | | | 330,000 | |
| | 12,700 | | | | | Cognizant Technology Solutions Corp. - Class A# | | | 743,458 | |
| | 800 | | | CAD | | Constellation Software, Inc. | | | 313,634 | |
| | 2,700 | | | | | Equinix, Inc. | | | 691,011 | |
| | 4,800 | | | | | FireEye, Inc.# | | | 198,240 | |
| | 8,550 | | | | | Guidewire Software, Inc.# | | | 427,073 | |
| | 13,700 | | | | | Hollysys Automation Technologies, Ltd. | | | 300,989 | |
| | 4,810 | | | | | LinkedIn Corp. - Class A# | | | 1,212,745 | |
| | 11,900 | | | | | Mellanox Technologies, Ltd.# | | | 553,231 | |
| | 20,800 | | | | | Sabre Corp. | | | 517,712 | |
| | 12,100 | | | | | SunPower Corp.# | | | 389,499 | |
| | 2,800 | | | | | Synaptics, Inc.# | | | 237,216 | |
| | 18,900 | | | | | Teradyne, Inc. | | | 344,925 | |
| | 1,400 | | | | | Ultimate Software Group, Inc.# | | | 232,708 | |
| | 7,400 | | | | | Vantiv, Inc. - Class A# | | | 289,340 | |
| | 12,700 | | | | | VeriFone Systems, Inc.# | | | 454,279 | |
| | 2,125 | | | | | Western Digital Corp. | | | 207,698 | |
| | | | | | | | | | |
| | | | | | | | | 7,960,277 | |
| | | | | | | | | | |
| | | | |
| 82 | | CALAMOS OPEN-END FAMILY OF FUNDS SEMIANNUAL REPORT | | See accompanying Notes to Schedule of Investments |
Mid Cap Growth Fund Schedule of Investments April 30, 2015 (Unaudited)
| | | | | | | | | | |
NUMBER OF
SHARES | | | | | | | VALUE | |
| | | | | | | | | | |
| | | | | | | | | | |
| | | | | | Materials (1.4%) | |
| | 7,800 | | | | | KapStone Paper and Packaging Corp. | | $ | 218,010 | |
| | 5,000 | | | | | Packaging Corp. of America | | | 345,950 | |
| | | | | | | | | | |
| | | | | | | | | 563,960 | |
| | | | | | | | | | |
| | | | | | TOTAL COMMON STOCKS
(Cost $33,272,378) | | | 36,428,620 | |
| | | | | | | | | | |
| | | | | | | | | | |
| | SHORT TERM INVESTMENT (9.0%) | | | | |
| | 3,628,818 | | | | | Fidelity Prime Money Market Fund - Institutional Class
(Cost $3,628,818) | | | 3,628,818 | |
| | | | | | | | | | |
| | | | | | | | | | |
NUMBER OF
SHARES/
PRINCIPAL
AMOUNT | | | | | | | VALUE | |
| | | | | | | | | | |
| INVESTMENT OF CASH COLLATERAL FOR SECURITIES
LOANED (0.2%) |
|
| | | | | | Federal Home Loan Bank Discount Notes | |
| | 18,837 | | | | | 0.000%, 05/29/15 | | | 18,837 | |
| | 11,774 | | | | | 0.000%, 06/10/15 | | | 11,774 | |
| | 5,887 | | | | | 0.000%, 05/27/15 | | | 5,887 | |
| | 5,887 | | | | | 0.000%, 06/15/15 | | | 5,887 | |
| | 11,773 | | | | | Federal Home Loan Mortgage Corp. Discount Note
0.000%, 06/01/15 | | | 11,773 | |
| | 23,389 | | | | | Fidelity Prime Money Market Fund - Institutional Class | | | 23,389 | |
| | | | | | | | | | |
NUMBER OF
SHARES/
PRINCIPAL
AMOUNT | | | | | | | VALUE | |
| | | | | | | | | | |
| | 11,775 | | | | | Morgan Stanley Institutional Liquidity Fund | | $ | 11,775 | |
| | 10,728 | | | | | Goldman Sachs Financial Square Fund | | | 10,728 | |
| | | | | | | | | | |
| | | | | | TOTAL INVESTMENT OF CASH
COLLATERAL FOR SECURITIES
LOANED
(Cost $100,050) | | | 100,050 | |
| | | | | | | | | | |
| TOTAL INVESTMENTS (99.9%)
(Cost $37,001,246) | | | 40,157,488 | |
| | | | | | | | | | |
| |
| | PAYABLE UPON RETURN OF SECURITIES ON LOAN (-0.2%) | | | (100,050 | ) |
| | | | | | | | | | |
| |
| | OTHER ASSETS, LESS LIABILITIES (0.3%) | | | 128,130 | |
| | | | | | | | | | |
| |
| | NET ASSETS (100.0%) | | $ | 40,185,568 | |
| | | | | | | | | | |
| | | | | | | | | | |
FORWARD FOREIGN CURRENCY CONTRACT
| | | | | | | | | | | | | | | | |
| COUNTERPARTY | | SHORT
CONTRACTS | | SETTLEMENT
DATE | | LOCAL
CURRENCY | | | CURRENT
VALUE | | | UNREALIZED
GAIN/LOSS | |
| Citibank N.A. | | Canadian Dollar | | 07/23/15 | | | 377,000 | | | $ | 312,120 | | | $ | (4,169 | ) |
| | | | | | | | | | | | | | | | |
NOTES TO SCHEDULE OF INVESTMENTS
| # | Non-income producing security. |
| ^ | Security, or portion of security, is on loan. |
FOREIGN CURRENCY ABBREVIATION
Note: Value for securities denominated in foreign currencies is shown in U.S. dollars.
| | | | | | |
| See accompanying Notes to Financial Statements | | www.calamos.com | | | 83 | |
International Growth Fund Schedule of Investments April 30, 2015 (Unaudited)
| | | | | | | | | | |
NUMBER OF
SHARES | | | | | | | VALUE | |
| | | | | | | | | | |
| | COMMON STOCKS (98.3%) | |
| | | | | | Consumer Discretionary (20.5%) | |
| | 57,000 | | | GBP | | ASOS, PLC# | | $ | 3,274,489 | |
| | 3,400,000 | | | HKD | | Brilliance China Automotive Holdings, Ltd. | | | 6,380,887 | |
| | 80,000 | | | CHF | | Compagnie Financière Richemont, SA | | | 7,130,636 | |
| | 390,000 | | | GBP | | Compass Group, PLC | | | 6,894,314 | |
| | 25,500 | | | EUR | | Continental, AG^ | | | 5,976,047 | |
| | 86,000 | | | EUR | | Daimler, AG | | | 8,268,621 | |
| | 13,500 | | | JPY | | Fast Retailing Co., Ltd. | | | 5,317,378 | |
| | 700,000 | | | INR | | Motherson Sumi Systems, Ltd. | | | 5,540,757 | |
| | 93,000 | | | ZAR | | Naspers, Ltd. - Class N | | | 14,590,382 | |
| | 200,000 | | | DKK | | Pandora, A/S | | | 20,672,306 | |
| | 141,000 | | | GBP | | Persimmon, PLC | | | 3,660,971 | |
| | 49,632 | | | EUR | | Renault, SA | | | 5,222,164 | |
| | 2,850,100 | | | HKD | | Samsonite International, SA | | | 10,394,795 | |
| | 170,000 | | | JPY | | Sony Corp.# | | | 5,139,397 | |
| | 202,800 | | | JPY | | Toyota Motor Corp. | | | 14,116,732 | |
| | 300,000 | | | EUR | | TUI, AG | | | 5,592,271 | |
| | 53,000 | | | GBP | | Whitbread, PLC | | | 4,255,866 | |
| | 385,131 | | | GBP | | WPP, PLC | | | 8,981,829 | |
| | | | | | | | | | |
| | | | | | | | | 141,409,842 | |
| | | | | | | | | | |
| | | | | | Consumer Staples (10.6%) | |
| | 140,000 | | | EUR | | Anheuser-Busch InBev, NV | | | 17,044,767 | |
| | 140,000 | | | GBP | | British American Tobacco, PLC | | | 7,692,107 | |
| | 391,000 | | | GBP | | Diageo, PLC | | | 10,855,086 | |
| | 185,000 | | | CHF | | Nestlé, SA | | | 14,353,081 | |
| | 34,800 | | | EUR | | Pernod Ricard, SA | | | 4,325,079 | |
| | 141,000 | | | JPY | | Seven & I Holdings Company, Ltd. | | | 6,060,793 | |
| | 195,000 | | | JPY | | Unicharm Corp. | | | 4,908,183 | |
| | 170,000 | | | EUR | | Unilever, NV^ | | | 7,415,502 | |
| | | | | | | | | | |
| | | | | | | | | 72,654,598 | |
| | | | | | | | | | |
| | | | | | Energy (3.5%) | |
| | 105,000 | | | EUR | | Royal Dutch Shell, PLC | | | 3,329,255 | |
| | 64,000 | | | | | Schlumberger, Ltd. | | | 6,055,040 | |
| | 150,000 | | | EUR | | TOTAL, SA | | | 8,122,494 | |
| | 190,000 | | | CAD | | Tourmaline Oil Corp.# | | | 6,557,480 | |
| | | | | | | | | | |
| | | | | | | | | 24,064,269 | |
| | | | | | | | | | |
| | | | | | Financials (14.9%) | |
| | 1,363,400 | | | HKD | | AIA Group, Ltd. | | | 9,067,265 | |
| | 358,600 | | | EUR | | Azimut Holding, S.p.A | | | 10,525,884 | |
| | 1,630,000 | | | JPY | | Daiwa Securities Group, Inc. | | | 13,522,181 | |
| | 231,506 | | | EUR | | Deutsche Annington Immobilien, SE | | | 7,770,528 | |
| | 1,310,000 | | | MXN | | Grupo Financiero Banorte, SAB de CV | | | 7,431,189 | |
| | 1,550,000 | | | GBP | | Henderson Group, PLC | | | 6,613,851 | |
| | 315,000 | | | INR | | Housing Development Finance Corp, Ltd. | | | 5,793,831 | |
| | | | | | | | | | |
NUMBER OF
SHARES | | | | | | | VALUE | |
| | | | | | | | | | |
| | 408,000 | | | EUR | | ING Groep, NV# | | $ | 6,259,354 | |
| | 2,330,000 | | | EUR | | Intesa Sanpaolo, S.p.A | | | 7,827,642 | |
| | 2,299,854 | | | PHP | | Metropolitan Bank & Trust Company | | | 4,794,279 | |
| | 268,000 | | | JPY | | Mitsui Fudosan Company, Ltd. | | | 7,944,673 | |
| | 210,000 | | | GBP | | Prudential, PLC | | | 5,228,483 | |
| | 356,000 | | | GBP | | St. James’s Place, PLC | | | 4,856,091 | |
| | 114,000 | | | SEK | | Svenska Handelsbanken, AB - Class A | | | 5,262,122 | |
| | | | | | | | | | |
| | | | | | | | | 102,897,373 | |
| | | | | | | | | | |
| | | | | | Health Care (14.8%) | |
| | 358,000 | | | JPY | | Chugai Pharmaceutical Co., Ltd. | | | 10,887,414 | |
| | 58,000 | | | EUR | | Fresenius, SE & Company KGaA | | | 3,450,590 | |
| | 267,000 | | | INR | | Glenmark Pharmaceuticals, Ltd. | | | 3,734,790 | |
| | 2,556,000 | | | AUD | | Healthscope, Ltd. | | | 5,728,162 | |
| | 167,000 | | | GBP | | Hikma Pharmaceuticals, PLC | | | 5,222,453 | |
| | 226,582 | | | INR | | Lupin, Ltd. | | | 6,314,337 | |
| | 151,000 | | | CHF | | Novartis, AG | | | 15,412,901 | |
| | 167,000 | | | DKK | | Novo Nordisk, A/S - Class B | | | 9,375,492 | |
| | 36,000 | | | CHF | | Roche Holding, AG | | | 10,301,584 | |
| | 58,000 | | | EUR | | Sanofi | | | 5,903,849 | |
| | 182,000 | | | GBP | | Shire, PLC | | | 14,789,974 | |
| | 152,000 | | | EUR | | UCB, SA^ | | | 10,948,994 | |
| | | | | | | | | | |
| | | | | | | | | 102,070,540 | |
| | | | | | | | | | |
| | | | | | Industrials (15.1%) | |
| | 240,000 | | | CHF | | ABB, Ltd.# | | | 5,258,986 | |
| | 60,000 | | | EUR | | Airbus Group, NV | | | 4,158,128 | |
| | 113,000 | | | EUR | | ANDRITZ, AG | | | 6,615,783 | |
| | 28,000 | | | CAD | | Canadian Pacific Railway, Ltd.^ | | | 5,338,450 | |
| | 200,000 | | | GBP | | Experian, PLC | | | 3,572,055 | |
| | 91,100 | | | JPY | | FANUC Corp. | | | 20,038,601 | |
| | 66,000 | | | EUR | | HOCHTIEF, AG^ | | | 5,099,613 | |
| | 590,000 | | | HKD | | Hutchison Whampoa, Ltd. | | | 8,674,013 | |
| | 7,500 | | | CHF | | Kaba Holding, AG# | | | 4,925,755 | |
| | 165,000 | | | EUR | | KION Group, AG | | | 7,320,211 | |
| | 175,000 | | | JPY | | MISUMI Group, Inc. | | | 6,567,423 | |
| | 124,000 | | | JPY | | Nidec Corp. | | | 9,275,797 | |
| | 231,250 | | | EUR | | Safran, SA^ | | | 16,896,823 | |
| | | | | | | | | | |
| | | | | | | | | 103,741,638 | |
| | | | | | | | | | |
| | | | | | Information Technology (17.1%) | |
| | 218,000 | | | JPY | | Alps Electric Company, Ltd. | | | 5,415,210 | |
| | 411,000 | | | GBP | | ARM Holdings, PLC | | | 6,983,458 | |
| | 33,000 | | | EUR | | ASML Holding, NV | | | 3,551,228 | |
| | 47,000 | | | | | Baidu, Inc.# | | | 9,413,160 | |
| | 80,000 | | | | | Check Point Software Technologies, Ltd.# | | | 6,678,400 | |
| | 29,700 | | | CAD | | Constellation Software, Inc. | | | 11,643,680 | |
| | 108,000 | | | CAD | | Enghouse Systems, Ltd. | | | 4,620,771 | |
| | 71,000 | | | TWD | | Hermes Microvision, Inc. | | | 4,992,563 | |
| | | | |
| 84 | | CALAMOS OPEN-END FAMILY OF FUNDS SEMIANNUAL REPORT | | See accompanying Notes to Schedule of Investments |
International Growth Fund Schedule of Investments April 30, 2015 (Unaudited)
| | | | | | | | | | |
NUMBER OF
SHARES | | | | | | | VALUE | |
| | 30,000 | | | EUR | | Ingenico^ | | $ | 3,764,180 | |
| | 9,000 | | | JPY | | Keyence Corp. | | | 4,804,642 | |
| | 52,000 | | | TWD | | Largan Precision Company, Ltd. | | | 5,210,716 | |
| | 221,600 | | | | | Mellanox Technologies, Ltd.# | | | 10,302,184 | |
| | 5,412 | | | KRW | | Samsung Electronics Co., Ltd. | | | 7,099,753 | |
| | 100,800 | | | EUR | | SAP SE | | | 7,616,953 | �� |
| | 1,503,000 | | | TWD | | Taiwan Semiconductor Manufacturing Company, Ltd. | | | 7,235,852 | |
| | 168,034 | | | INR | | Tata Consultancy Services, Ltd. | | | 6,550,456 | |
| | 393,900 | | | HKD | | Tencent Holdings, Ltd. | | | 8,129,655 | |
| | 75,000 | | | EUR | | United Internet, AG | | | 3,353,177 | |
| | | | | | | | | | |
| | | | | | | | | 117,366,038 | |
| | | | | | | | | | |
| | | | | | Materials (0.8%) | |
| | 1,150,000 | | | GBP | | Glencore, PLC# | | | 5,463,156 | |
| | | | | | | | | | |
| | | | | | Telecommunication Services (1.0%) | |
| | 107,000 | | | JPY | | SoftBank Corp. | | | 6,688,607 | |
| | | | | | | | | | |
| | | | | | TOTAL COMMON STOCKS
(Cost $609,388,009) | | | 676,356,061 | |
| | | | | | | | | | |
| | | | | | | | | | |
| | SHORT TERM INVESTMENT (2.4%) | |
| | 16,209,024 | | | | | Fidelity Prime Money Market Fund - Institutional Class
(Cost $16,209,024) | | | 16,209,024 | |
| | | | | | | | | | |
NUMBER OF
SHARES/
PRINCIPAL
AMOUNT | | | | | | | VALUE | |
| | | | | | | | | | |
| INVESTMENT OF CASH COLLATERAL FOR SECURITIES
LOANED (4.2%) |
|
| | | | | | Federal Home Loan Bank Discount Notes | |
| | 5,508,294 | | | | | 0.000%, 05/29/15 | | | 5,508,294 | |
| | 3,442,953 | | | | | 0.000%, 06/10/15 | | | 3,442,953 | |
| | 1,721,551 | | | | | 0.000%, 05/27/15 | | | 1,721,551 | |
| | 1,721,504 | | | | | 0.000%, 06/15/15 | | | 1,721,504 | |
| | 3,442,788 | | | | | Federal Home Loan Mortgage Corp. Discount Note 0.000%, 06/01/15 | | | 3,442,788 | |
| | 6,839,624 | | | | | Fidelity Prime Money Market Fund - Institutional Class | | | 6,839,624 | |
| | 3,137,050 | | | | | Goldman Sachs Financial Square Fund | | | 3,137,050 | |
| | 3,443,206 | | | | | Morgan Stanley Institutional Liquidity Fund | | | 3,443,206 | |
| | | | | | | | | | |
| | | | | | TOTAL INVESTMENT OF CASH
COLLATERAL FOR SECURITIES
LOANED
(Cost $29,256,970) | | | 29,256,970 | |
| | | | | | | | | | |
| TOTAL INVESTMENTS (104.9%)
(Cost $654,854,003) | | | 721,822,055 | |
| | | | | | | | | | |
| |
| | PAYABLE UPON RETURN OF SECURITIES ON LOAN (-4.2%) | | | (29,256,970 | ) |
| | | | | | | | | | |
| |
| | LIABILITIES, LESS OTHER ASSETS (-0.7%) | | | (4,649,501 | ) |
| | | | | | | | | | |
| |
| | NET ASSETS (100.0%) | | $ | 687,915,584 | |
| | | | | | | | | | |
FORWARD FOREIGN CURRENCY CONTRACTS
| | | | | | | | | | | | | | | | |
| COUNTERPARTY | | SHORT CONTRACTS | | SETTLEMENT DATE | | LOCAL CURRENCY | | | CURRENT
VALUE | | | UNREALIZED
GAIN/LOSS | |
| JPMorgan Chase Bank N.A. | | British Pound Sterling | | 05/29/15 | | | 13,085,000 | | | $ | 20,081,974 | | | $ | (234,332 | ) |
| Brown Brothers Harriman & Company | | European Monetary Unit | | 05/29/15 | | | 49,919,000 | | | | 56,068,910 | | | | (1,805,958 | ) |
| Northern Trust Company | | Japanese Yen | | 05/29/15 | | | 1,005,500,000 | | | | 8,422,840 | | | | (4,852 | ) |
| JPMorgan Chase Bank N.A. | | Japanese Yen | | 05/29/15 | | | 940,896,000 | | | | 7,881,667 | | | | 28,594 | |
| | | | | | | | | | | | | | | | |
| | | | | | | | | | | | | | $ | (2,016,548 | ) |
| | | | | | | | | | | | | | | | |
NOTES TO SCHEDULE OF INVESTMENTS
| # | Non-income producing security. |
| ^ | Security, or portion of security, is on loan. |
FOREIGN CURRENCY ABBREVIATIONS
| | |
| AUD | | Australian Dollar |
| CAD | | Canadian Dollar |
| CHF | | Swiss Franc |
| DKK | | Danish Krone |
| EUR | | European Monetary Unit |
| GBP | | British Pound Sterling |
| HKD | | Hong Kong Dollar |
| INR | | Indian Rupee |
| JPY | | Japanese Yen |
| KRW | | South Korean Won |
| MXN | | Mexican Peso |
| PHP | | Philippine Peso |
| SEK | | Swedish Krona |
| TWD | | New Taiwan Dollar |
| ZAR | | South African Rand |
Note: Value for securities denominated in foreign currencies is shown in U.S. dollars.
| | | | | | |
| See accompanying Notes to Financial Statements | | www.calamos.com | | | 85 | |
International Growth Fund Schedule of Investments April 30, 2015 (Unaudited)
CURRENCY EXPOSURE
APRIL 30, 2015
| | | | | | | | |
| | | VALUE | | | % OF TOTAL
INVESTMENTS | |
| European Monetary Unit | | $ | 176,359,137 | | | | 24.4 | % |
| Japanese Yen | | | 120,687,031 | | | | 16.7 | % |
| British Pound Sterling | | | 98,344,183 | | | | 13.6 | % |
| US Dollar | | | 77,914,778 | | | | 10.8 | % |
| Swiss Franc | | | 57,382,943 | | | | 8.0 | % |
| Hong Kong Dollar | | | 42,646,615 | | | | 5.9 | % |
| Danish Krone | | | 30,047,798 | | | | 4.2 | % |
| Canadian Dollar | | | 28,160,381 | | | | 3.9 | % |
| Indian Rupee | | | 27,934,171 | | | | 3.9 | % |
| New Taiwan Dollar | | | 17,439,131 | | | | 2.4 | % |
| South African Rand | | | 14,590,382 | | | | 2.0 | % |
| Mexican Peso | | | 7,431,189 | | | | 1.0 | % |
| South Korean Won | | | 7,099,753 | | | | 1.0 | % |
| Australian Dollar | | | 5,728,162 | | | | 0.8 | % |
| Swedish Krona | | | 5,262,122 | | | | 0.7 | % |
| Philippine Peso | | | 4,794,279 | | | | 0.7 | % |
| Total Investments | | $ | 721,822,055 | | | | 100.0 | % |
Currency exposure may vary over time.
| | | | |
| 86 | | CALAMOS OPEN-END FAMILY OF FUNDS SEMIANNUAL REPORT | | See accompanying Notes to Financial Statements |
Evolving World Growth Fund Schedule of Investments April 30, 2015 (Unaudited)
| | | | | | | | | | |
PRINCIPAL
AMOUNT | | | | | | | VALUE | |
| | | | | | | | | | |
| | CONVERTIBLE BONDS (17.3%) | |
| | | | | | Consumer Discretionary (3.8%) | |
| | 3,600,000 | | | EUR | | Adidas, AG
0.250%, 06/14/19 | | $ | 4,763,993 | |
| | 33,000,000 | | | HKD | | Hengan International Group Company, Ltd.
0.000%, 06/27/18 | | | 4,648,018 | |
| | 6,800,000,000 | | | KRW | | Lotte Shopping Company, Ltd.
0.000%, 01/24/18 | | | 6,508,769 | |
| | 3,650,000 | | | EUR | | Steinhoff Finance Holding, GmbH
4.500%, 03/31/18 | | | 7,183,169 | |
| | | | | | | | | | |
| | | | | | | | | 23,103,949 | |
| | | | | | | | | | |
| | | | | | Financials (5.0%) | |
| | 9,000,000 | | | | | AYC Finance, Ltd.
0.500%, 05/02/19 | | | 10,271,899 | |
| | 5,200,000 | | | | | China Overseas Finance Investment Cayman IV, Ltd.
0.000%, 02/04/21 | | | 6,587,781 | |
| | 4,000,000 | | | | | HKEx International, Ltd.
0.500%, 10/23/17 | | | 7,488,071 | |
| | 5,600,000 | | | | | National Bank of Abu Dhabi PJSC
1.000%, 03/12/18 | | | 5,976,375 | |
| | | | | | | | | | |
| | | | | | | | | 30,324,126 | |
| | | | | | | | | | |
| | | | | | Health Care (1.1%) | |
| | 7,600,000 | | | SGD | | Indah Capital, Ltd.
0.000%, 10/24/18 | | | 6,661,114 | |
| | | | | | | | | | |
| | | | | | Industrials (1.4%) | |
| | 8,110,000 | | | | | Larsen & Toubro, Ltd.
0.675%, 10/22/19 | | | 8,747,726 | |
| | | | | | | | | | |
| | | | | | Information Technology (2.5%) | |
| | 4,600,000 | | | | | Advanced Semiconductor Engineering, Inc.
0.000%, 09/05/18 | | | 6,224,008 | |
| | 3,990,000 | | | | | NXP Semiconductors, NV*
1.000%, 12/01/19 | | | 4,669,377 | |
| | 4,100,000 | | | | | Yahoo!, Inc.
0.000%, 12/01/18 | | | 4,363,364 | |
| | | | | | | | | | |
| | | | | | | | | 15,256,749 | |
| | | | | | | | | | |
| | | | | | Materials (2.0%) | |
| | 10,800,000 | | | | | Cemex, SAB de CV
3.250%, 03/15/16 | | | 12,529,836 | |
| | | | | | | | | | |
| | | | | | Telecommunication Services (1.0%) | |
| | 5,900,000 | | | | | Billion Express Investments, Ltd.
0.750%, 10/18/15 | | | 6,299,385 | |
| | | | | | | | | | |
| | | | | | Utilities (0.5%) | |
| | 2,500,000 | | | | | ENN Energy Holdings, Ltd.
0.000%, 02/26/18 | | | 3,147,369 | |
| | | | | | | | | | |
| | | | | | TOTAL CONVERTIBLE BONDS
(Cost $103,043,777) | | | 106,070,254 | |
| | | | | | | | | | |
| | | | | | | | | | |
NUMBER OF
SHARES | | | | | | | VALUE | |
| | COMMON STOCKS (79.3%) | |
| | | | | | Consumer Discretionary (13.1%) | |
| | 2,016,971 | | | MXN | | Alsea, SAB de CV#^ | | $ | 6,060,642 | |
| | 5,085,000 | | | IDR | | Astra International, Tbk PT | | | 2,675,890 | |
| | 4,500,000 | | | HKD | | Brilliance China Automotive Holdings, Ltd. | | | 8,445,292 | |
| | 476,280 | | | TWD | | Eclat Textile Company, Ltd. | | | 6,376,590 | |
| | 36,100 | | | KRW | | Hyundai Motor Company | | | 5,665,573 | |
| | 112,000 | | | INR | | Jubilant Foodworks, Ltd.# | | | 2,624,973 | |
| | 74,000 | | | | | Las Vegas Sands Corp. | | | 3,913,120 | |
| | 3,998,667 | | | IDR | | Matahari Department Store, Tbk PT | | | 5,377,845 | |
| | 760,000 | | | INR | | Motherson Sumi Systems, Ltd. | | | 6,015,679 | |
| | 141,290 | | | ZAR | | Naspers, Ltd. - Class N | | | 22,166,398 | |
| | 1,680,100 | | | HKD | | Samsonite International, SA | | | 6,127,608 | |
| | 197,000 | | | GBP | | WPP, PLC | | | 4,594,334 | |
| | | | | | | | | | |
| | | | | | | | | 80,043,944 | |
| | | | | | | | | | |
| | | | | | Consumer Staples (8.1%) | |
| | 1,164,500 | | | BRL | | Ambev, SA | | | 7,320,277 | |
| | 760,000 | | | HKD | | China Mengniu Dairy Company, Ltd. | | | 3,858,565 | |
| | 225,000 | | | GBP | | Diageo, PLC | | | 6,246,533 | |
| | 686,000 | | | MXN | | Fomento Economico Mexicano, SAB de CV# | | | 6,207,178 | |
| | 457,453 | | | BRL | | Hypermarcas, SA# | | | 3,018,359 | |
| | 559,750 | | | INR | | ITC, Ltd. | | | 2,836,803 | |
| | 80,000 | | | CHF | | Nestlé, SA | | | 6,206,738 | |
| | 150,000 | | | JPY | | Unicharm Corp. | | | 3,775,525 | |
| | 105,000 | | | EUR | | Unilever, NV^ | | | 4,580,163 | |
| | 2,500,000 | | | MXN | | Wal-Mart de Mexico SAB de CV^ | | | 5,882,545 | |
| | | | | | | | | | |
| | | | | | | | | 49,932,686 | |
| | | | | | | | | | |
| | | | | | Energy (5.7%) | |
| | 50,000 | | | | | Anadarko Petroleum Corp. | | | 4,705,000 | |
| | 2,000,000 | | | HKD | | CNOOC, Ltd. | | | 3,410,425 | |
| | 690,000 | | | INR | | Oil & Natural Gas Corp, Ltd. | | | 3,295,833 | |
| | 6,000,000 | | | HKD | | PetroChina Company, Ltd. - Class H | | | 7,738,585 | |
| | 913,000 | | | BRL | | Petróleo Brasileiro, SA# | | | 4,318,110 | |
| | 285,000 | | | THB | | PTT PCL | | | 3,072,882 | |
| | 83,000 | | | ZAR | | Sasol, Ltd. | | | 3,341,868 | |
| | 90,000 | | | EUR | | TOTAL, SA | | | 4,873,496 | |
| | | | | | | | | | |
| | | | | | | | | 34,756,199 | |
| | | | | | | | | | |
| | | | | | Financials (19.3%) | |
| | 997,000 | | | HKD | | AIA Group, Ltd. | | | 6,630,529 | |
| | 927,500 | | | INR | | Axis Bank, Ltd. | | | 8,279,586 | |
| | 4,725,000 | | | IDR | | Bank Mandiri Persero, Tbk PT | | | 3,886,507 | |
| | 542,000 | | | BRL | | BB Seguridade Participacoes, SA | | | 6,341,127 | |
| | 7,250,000 | | | HKD | | China Construction Bank Corp. | | | 7,037,827 | |
| | 1,100,000 | | | HKD | | China Life Insurance Company, Ltd. | | | 5,338,613 | |
| | 39,250 | | | | | Credicorp, Ltd. | | | 5,987,587 | |
| | 1,040,000 | | | MXN | | Fibra Uno Administracion, SA de CV^ | | | 2,593,560 | |
| | 2,167,000 | | | MXN | | Grupo Financiero Banorte, SAB de CV^ | | | 12,292,661 | |
| | | | | | |
| See accompanying Notes to Schedule of Investments | | www.calamos.com | | | 87 | |
Evolving World Growth Fund Schedule of Investments April 30, 2015 (Unaudited)
| | | | | | | | | | |
NUMBER OF
SHARES | | | | | | | VALUE | |
| | 6,925,207 | | | HKD | | Haitong International Securities Group, Ltd. | | $ | 7,701,905 | |
| | 1,458,000 | | | INR | | ICICI Bank, Ltd. | | | 7,617,095 | |
| | 8,600,000 | | | HKD | | Industrial & Commercial Bank of China, Ltd. | | | 7,460,164 | |
| | 397,300 | | | | | Itau Unibanco Holding, SA | | | 5,093,386 | |
| | 770,000 | | | BRL | | Itausa - Investimentos Itau, SA | | | 2,711,529 | |
| | 660,000 | | | THB | | Kasikornbank, PCL | | | 4,190,096 | |
| | 4,072,538 | | | PHP | | Metropolitan Bank & Trust Company | | | 8,489,619 | |
| | 18,500 | | | KRW | | Samsung Fire & Marine Insurance Company, Ltd. | | | 4,875,233 | |
| | 107,000 | | | KRW | | Shinhan Financial Group Company, Ltd. | | | 4,428,534 | |
| | 160,000 | | | INR | | Shriram Transport Finance Company, Ltd. | | | 2,441,890 | |
| | 657,000 | | | TRY | | Turkiye Garanti Bankasi AS | | | 2,090,412 | |
| | 1,100,000 | | | TRY | | Turkiye Is Bankasi - Class C | | | 2,473,434 | |
| | | | | | | | | | |
| | | | | | | | | 117,961,294 | |
| | | | | | | | | | |
| | | | | | Health Care (2.8%) | |
| | 470,000 | | | INR | | Glenmark Pharmaceuticals, Ltd. | | | 6,574,350 | |
| | 110,000 | | | GBP | | Hikma Pharmaceuticals, PLC | | | 3,439,939 | |
| | 248,437 | | | INR | | Lupin, Ltd. | | | 6,923,387 | |
| | | | | | | | | | |
| | | | | | | | | 16,937,676 | |
| | | | | | | | | | |
| | | | | | Industrials (5.3%) | |
| | 60,000 | | | EUR | | ANDRITZ, AG | | | 3,512,805 | |
| | 700,000 | | | TRY | | Aselsan Elektronik Sanayi Ve Ticaret AS | | | 3,650,161 | |
| | 1,000,000 | | | HKD | | China Communications Construction Company, Ltd. | | | 1,818,855 | |
| | 34,300 | | | JPY | | FANUC Corp. | | | 7,544,720 | |
| | 484,000 | | | HKD | | Hutchison Whampoa, Ltd. | | | 7,115,631 | |
| | 218,000 | | | BRL | | Valid Solucoes e Servicos de Seguranca em Meios de Pagamento e Identificacao, SA | | | 3,389,801 | |
| | 675,000 | | | HKD | | Zhuzhou CSR Times Electric Company, Ltd. | | | 5,739,589 | |
| | | | | | | | | | |
| | | | | | | | | 32,771,562 | |
| | | | | | | | | | |
| | | | | | Information Technology (20.6%) | |
| | 80,700 | | | | | Baidu, Inc.# | | | 16,162,596 | |
| | 380,000 | | | TWD | | Catcher Technology Company, Ltd. | | | 4,446,701 | |
| | 250,000 | | | INR | | HCL Technologies, Ltd. | | | 3,484,020 | |
| | 141,000 | | | TWD | | Hermes Microvision, Inc. | | | 9,914,809 | |
| | 61,000 | | | TWD | | Largan Precision Company, Ltd. | | | 6,112,570 | |
| | 3,201,000 | | | HKD | | Lenovo Group, Ltd. | | | 5,504,344 | |
| | 140,000 | | | BRL | | Linx, SA | | | 2,063,094 | |
| | 4,200 | | | KRW | | NAVER Corp. | | | 2,539,649 | |
| | 5,122,000 | | | HKD | | PAX Global Technology, Ltd.# | | | 7,441,228 | |
| | 15,594 | | | KRW | | Samsung Electronics Co., Ltd. | | | 20,457,049 | |
| | 94,000 | | | KRW | | SK Hynix, Inc. | | | 4,021,798 | |
| | 3,209,649 | | | TWD | | Taiwan Semiconductor Manufacturing Company, Ltd. | | | 15,452,125 | |
| | 277,518 | | | INR | | Tata Consultancy Services, Ltd. | | | 10,818,461 | |
| | 856,500 | | | HKD | | Tencent Holdings, Ltd. | | | 17,677,202 | |
| | | | | | | | | | |
| | | | | | | | | 126,095,646 | |
| | | | | | | | | | |
| | | | | | | | | | |
NUMBER OF
SHARES | | | | | | | VALUE | |
| | | | | | | | | | |
| | | | | | Materials (0.5%) | |
| | 1,000,000 | | | MXN | | Grupo Mexico, SAB de CV - Series B | | $ | 3,090,210 | |
| | | | | | | | | | |
| | | | | | Telecommunication Services (3.3%) | |
| | 874,500 | | | HKD | | China Mobile, Ltd. | | | 12,490,733 | |
| | 152,000 | | | ZAR | | MTN Group, Ltd. | | | 3,051,998 | |
| | 17,900 | | | KRW | | SK Telecom Company, Ltd. | | | 4,796,716 | |
| | | | | | | | | | |
| | | | | | | | | 20,339,447 | |
| | | | | | | | | | |
| | | | | | Utilities (0.6%) | |
| | 80,000 | | | KRW | | Korea Electric Power Corp. | | | 3,478,715 | |
| | | | | | | | | | |
| | | | | | TOTAL COMMON STOCKS
(Cost $443,611,312) | | | 485,407,379 | |
| | | | | | | | | | |
| | | | | | | | | | |
| | RIGHT (0.8%) # | |
| | | | | | Financials (0.8%) | |
| | 6,925,207 | | | | | HKD Haitong International Securities Group, Ltd.
(Cost $1,274,666) | | | 4,601,585 | |
| | | | | | | | | | |
| | | | | | | | | | |
| | SHORT TERM INVESTMENT (1.9%) | |
| | 11,764,356 | | | | | Fidelity Prime Money Market Fund - Institutional Class
(Cost $11,764,356) | | | 11,764,356 | |
| | | | | | | | | | |
| | | | | | | | | | |
NUMBER OF
SHARES/
PRINCIPAL
AMOUNT | | | | | | | VALUE | |
| INVESTMENT OF CASH COLLATERAL FOR SECURITIES
LOANED (0.8%) |
|
| | | | | | Federal Home Loan Bank Discount Notes | | | | |
| | 944,416 | | | | | 0.000%, 05/29/15 | | | 944,416 | |
| | 590,306 | | | | | 0.000%, 06/10/15 | | | 590,306 | |
| | 295,166 | | | | | 0.000%, 05/27/15 | | | 295,166 | |
| | 295,158 | | | | | 0.000%, 06/15/15 | | | 295,158 | |
| | 590,278 | | | | | Federal Home Loan Mortgage Corp. Discount Note 0.000%, 06/01/15 | | | 590,278 | |
| | 1,172,677 | | | | | Fidelity Prime Money Market Fund - Institutional Class | | | 1,172,677 | |
| | 537,858 | | | | | Goldman Sachs Financial Square Fund | | | 537,858 | |
| | 590,350 | | | | | Morgan Stanley Institutional Liquidity Fund | | | 590,350 | |
| | | | | | | | | | |
| | | | | | TOTAL INVESTMENT OF
CASH COLLATERAL FOR
SECURITIES LOANED
(Cost $5,016,209) | | | 5,016,209 | |
| | | | | | | | | | |
| TOTAL INVESTMENTS (100.1%)
(Cost $564,710,320) | | | 612,859,783 | |
| | | | | | | | | | |
| |
| | PAYABLE UPON RETURN OF SECURITIES ON LOAN (-0.8%) | | | (5,016,209 | ) |
| |
| | OTHER ASSETS, LESS LIABILITIES (0.7%) | | | 4,735,678 | |
| | | | | | | | | | |
| |
| | NET ASSETS (100.0%) | | $ | 612,579,252 | |
| | | | | | | | | | |
| | | | |
| 88 | | CALAMOS OPEN-END FAMILY OF FUNDS SEMIANNUAL REPORT | | See accompanying Notes to Schedule of Investments |
Evolving World Growth Fund Schedule of Investments April 30, 2015 (Unaudited)
FORWARD FOREIGN CURRENCY CONTRACTS
| | | | | | | | | | | | | | | | |
COUNTER
PARTY | | LONG
CONTRACTS | | SETTLEMENT
DATE | | LOCAL
CURRENCY | | | CURRENT
VALUE | | | UNREALIZED
GAIN/LOSS | |
Northern
Trust Company | | European Monetary Unit | | 05/29/15 | | | 4,536,000 | | | $ | 5,094,825 | | | $ | 24,017 | |
| | | | | | | | | | | | | | | | |
| | | | | |
COUNTER
PARTY | | SHORT CONTRACTS | | SETTLEMENT DATE | | LOCAL CURRENCY | | | CURRENT
VALUE | | | UNREALIZED
GAIN/LOSS | |
JPMorgan
Chase Bank N.A. | | British Pound Sterling | | 05/29/15 | | | 8,872,000 | | | $ | 13,616,146 | | | $ | (158,884 | ) |
Brown
Brothers Harriman & Company | | European Monetary Unit | | 05/29/15 | | | 24,385,000 | | | | 27,389,178 | | | | (882,195 | ) |
JPMorgan
Chase Bank N.A. | | Japanese Yen | | 05/29/15 | | | 1,352,794,000 | | | | 11,332,041 | | | | 41,112 | |
Income Repatriation
Hong Kong IBS | | Thai Baht | | 05/06/15 | | | 2,079,000 | | | | 63,067 | | | | 79 | |
| | | | | | | | | | | | | | | | |
| | | | | | | | | | | | | | $ | (999,888 | ) |
| | | | | | | | | | | | | | | | |
NOTES TO SCHEDULE OF INVESTMENTS
| * | Securities issued and sold pursuant to a Rule 144A transaction are excepted from the registration requirement of the Securities Act of 1933, as amended. These securities may only be sold to qualified institutional buyers (“QIBs”), such as the Fund. Any resale of these securities must generally be effected through a sale that is registered under the Act or otherwise exempted from such registration requirements. |
| # | Non-income producing security. |
| ^ | Security, or portion of security, is on loan. |
FOREIGN CURRENCY ABBREVIATIONS
| | |
| BRL | | Brazilian Real |
| CHF | | Swiss Franc |
| EUR | | European Monetary Unit |
| GBP | | British Pound Sterling |
| HKD | | Hong Kong Dollar |
| IDR | | Indonesian Rupiah |
| INR | | Indian Rupee |
| JPY | | Japanese Yen |
| KRW | | South Korean Won |
| MXN | | Mexican Peso |
| PHP | | Philippine Peso |
| SGD | | Singapore Dollar |
| THB | | Thai Baht |
| TRY | | Turkish Lira |
| TWD | | New Taiwan Dollar |
| ZAR | | South African Rand |
Note: Value for securities denominated in foreign currencies is shown in U.S. dollars. The principal amount for such securities is shown in the respective foreign currency.
CURRENCY EXPOSURE
APRIL 30, 2015
| | | | | | | | |
| | | VALUE | | | % OF TOTAL
INVESTMENTS | |
| Hong Kong Dollar | | $ | 130,786,698 | | | | 21.3% | |
| US Dollar | | | 128,947,445 | | | | 21.0% | |
| Indian Rupee | | | 60,912,077 | | | | 9.9% | |
| South Korean Won | | | 56,772,036 | | | | 9.3% | |
| New Taiwan Dollar | | | 42,302,795 | | | | 6.9% | |
| Mexican Peso | | | 36,126,796 | | | | 5.9% | |
| Brazilian Real | | | 29,162,297 | | | | 4.8% | |
| South African Rand | | | 28,560,264 | | | | 4.7% | |
| European Monetary Unit | | | 24,913,626 | | | | 4.1% | |
| British Pound Sterling | | | 14,280,806 | | | | 2.3% | |
| Indonesian Rupiah | | | 11,940,242 | | | | 2.0% | |
| Japanese Yen | | | 11,320,245 | | | | 1.8% | |
| Philippine Peso | | | 8,489,619 | | | | 1.4% | |
| Turkish Lira | | | 8,214,007 | | | | 1.3% | |
| Thai Baht | | | 7,262,978 | | | | 1.2% | |
| Singapore Dollar | | | 6,661,114 | | | | 1.1% | |
| Swiss Franc | | | 6,206,738 | | | | 1.0% | |
| Total Investments | | $ | 612,859,783 | | | | 100.0% | |
Currency exposure may vary over time.
| | | | | | |
| See accompanying Notes to Financial Statements | | www.calamos.com | | | 89 | |
Emerging Market Equity Fund Schedule of Investments April 30, 2015 (Unaudited)
| | | | | | | | | | |
NUMBER OF
SHARES | | | | | | | VALUE | |
| | | | | | | | | | |
| | COMMON STOCKS (95.8%) | |
| | | | | | Consumer Discretionary (13.2%) | |
| | 62,600 | | | MXN | | Alsea, SAB de CV# | | $ | 188,102 | |
| | 186,000 | | | IDR | | Astra International, Tbk PT | | | 97,879 | |
| | 136,000 | | | HKD | | Brilliance China Automotive Holdings, Ltd. | | | 255,236 | |
| | 13,960 | | | TWD | | Eclat Textile Company, Ltd. | | | 186,901 | |
| | 1,660 | | | KRW | | Hyundai Motor Company | | | 260,522 | |
| | 2,300 | | | KRW | | LOTTE Himart Company, Ltd. | | | 152,680 | |
| | 146,870 | | | IDR | | Matahari Department Store, Tbk PT | | | 197,527 | |
| | 4,219 | | | ZAR | | Naspers, Ltd. - Class N | | | 661,901 | |
| | 32,000 | | | ZAR | | Steinhoff International Holdings, Ltd. | | | 203,049 | |
| | 2,900 | | | | | Tata Motors, Ltd. | | | 119,451 | |
| | 33,000 | | | TWD | | Tung Thih Electronic Company, Ltd. | | | 149,952 | |
| | | | | | | | | | |
| | | | | | | | | 2,473,200 | |
| | | | | | | | | | |
| | | | | | Consumer Staples (6.7%) | |
| | 47,400 | | | BRL | | Ambev, SA | | | 297,966 | |
| | 32,000 | | | HKD | | China Mengniu Dairy Company, Ltd. | | | 162,466 | |
| | 20,200 | | | MXN | | Fomento Economico Mexicano, SAB de CV#^ | | | 182,777 | |
| | 19,540 | | | BRL | | Hypermarcas, SA# | | | 128,928 | |
| | 25,100 | | | | | ITC, Ltd.#~ | | | 127,182 | |
| | 2,660 | | | | | Magnit PJSC | | | 146,699 | |
| | 600 | | | | | Magnit PJSC~ | | | 33,090 | |
| | 75,000 | | | MXN | | Wal-Mart de Mexico SAB de CV | | | 176,476 | |
| | | | | | | | | | |
| | | | | | | | | 1,255,584 | |
| | | | | | | | | | |
| | | | | | Energy (5.1%) | |
| | 98,000 | | | HKD | | CNOOC, Ltd. | | | 167,111 | |
| | 1,800 | | | | | Lukoil OAO | | | 92,250 | |
| | 195,000 | | | HKD | | PetroChina Company, Ltd. - Class H | | | 251,504 | |
| | 27,800 | | | BRL | | Petróleo Brasileiro, SA# | | | 131,482 | |
| | 24,700 | | | THB | | PTT Exploration & Production, PCL | | | 87,666 | |
| | 13,000 | | | THB | | PTT PCL | | | 140,167 | |
| | 2,100 | | | ZAR | | Sasol, Ltd. | | | 84,553 | |
| | | | | | | | | | |
| | | | | | | | | 954,733 | |
| | | | | | | | | | |
| | | | | | Financials (28.4%) | |
| | 24,200 | | | HKD | | AIA Group, Ltd. | | | 160,942 | |
| | 8,050 | | | | | Axis Bank, Ltd.~ | | | 357,018 | |
| | 218,200 | | | PHP | | Ayala Land, Inc. | | | 188,773 | |
| | 4,400 | | | | | Banco Santander Chile | | | 95,964 | |
| | 96,000 | | | IDR | | Bank Mandiri Persero, Tbk PT | | | 78,964 | |
| | 320,000 | | | HKD | | Bank of China, Ltd. | | | 219,265 | |
| | 147,000 | | | IDR | | Bank Rakyat Indonesia Persero, Tbk PT | | | 131,242 | |
| | 18,200 | | | BRL | | BB Seguridade Participacoes, SA | | | 212,931 | |
| | 217,000 | | | HKD | | China Construction Bank Corp. | | | 210,650 | |
| | 3,000 | | | | | China Life Insurance Company, Ltd. | | | 218,010 | |
| | 24,000 | | | HKD | | China Overseas Land & Investment, Ltd. | | | 99,969 | |
| | | | | | | | | | |
NUMBER OF
SHARES | | | | | | | VALUE | |
| | | | | | | | | | |
| | 15,500 | | | ZAR | | Coronation Fund Managers, Ltd. | | $ | 118,428 | |
| | 1,100 | | | | | Credicorp, Ltd. | | | 167,805 | |
| | 33,400 | | | MXN | | Fibra Uno Administracion, SA de CV | | | 83,293 | |
| | 65,300 | | | MXN | | Grupo Financiero Banorte, SAB de CV | | | 370,425 | |
| | 36,800 | | | HKD | | Haitong Securities Company, Ltd. - Class H | | | 120,192 | |
| | 12,400 | | | EUR | | Hellenic Exchanges - Athens Stock Exchange, SA Holding# | | | 80,755 | |
| | 24,475 | | | | | ICICI Bank, Ltd. | | | 267,512 | |
| | 251,000 | | | HKD | | Industrial & Commercial Bank of China, Ltd. | | | 217,733 | |
| | 21,130 | | | BRL | | Itau Unibanco Holding, SA | | | 270,213 | |
| | 24,000 | | | BRL | | Itausa - Investimentos Itau, SA | | | 84,515 | |
| | 11,700 | | | THB | | Kasikornbank, PCL | | | 74,240 | |
| | 9,000 | | | THB | | Kasikornbank, PCL | | | 57,138 | |
| | 144,891 | | | PHP | | Metropolitan Bank & Trust Company | | | 302,040 | |
| | 26,400 | | | AED | | National Bank of Abu Dhabi PJSC | | | 79,569 | |
| | 740 | | | KRW | | Samsung Fire & Marine Insurance Company, Ltd. | | | 195,009 | |
| | 4,700 | | | KRW | | Shinhan Financial Group Company, Ltd. | | | 194,524 | |
| | 33,000 | | | | | Turkiye Garanti Bankasi AS | | | 105,930 | |
| | 50,000 | | | TRY | | Turkiye Is Bankasi - Class C | | | 112,429 | |
| | 153,000 | | | HKD | | Value Partners Group, Ltd. | | | 282,877 | |
| | 250,000 | | | TWD | | Yuanta Financial Holding Company, Ltd. | | | 145,308 | |
| | | | | | | | | | |
| | | | | | | | | 5,303,663 | |
| | | | | | | | | | |
| | | | | | Health Care (2.0%) | |
| | 3,100 | | | ZAR | | Aspen Pharmacare Holdings, Ltd.# | | | 94,270 | |
| | 3,590 | | | | | Dr. Reddy’s Laboratories, Ltd. | | | 186,608 | |
| | 201,000 | | | HKD | | PW Medtech Group, Ltd.# | | | 86,364 | |
| | | | | | | | | | |
| | | | | | | | | 367,242 | |
| | | | | | | | | | |
| | | | | | Industrials (7.3%) | |
| | 28,000 | | | TRY | | Aselsan Elektronik Sanayi Ve Ticaret AS | | | 146,006 | |
| | 177,000 | | | HKD | | AviChina Industry & Technology Company, Ltd. - Class H | | | 200,532 | |
| | 28,000 | | | HKD | | China Communications Construction Company, Ltd. | | | 50,928 | |
| | 12,000 | | | | | Controladora Vuela Cia de Aviacion SAB de CV# | | | 149,040 | |
| | 1,900 | | | KRW | | Hyundai Engineering & Construction Company, Ltd. | | | 91,412 | |
| | 7,300 | | | | | Larsen & Toubro, Ltd.~ | | | 186,515 | |
| | 12,400 | | | BRL | | Valid Solucoes e Servicos de Seguranca em Meios de Pagamento e Identificacao, SA | | | 192,814 | |
| | 504,000 | | | IDR | | Wijaya Karya Persero, Tbk PT | | | 115,547 | |
| | 27,000 | | | HKD | | Zhuzhou CSR Times Electric Company, Ltd. | | | 229,584 | |
| | | | | | | | | | |
| | | | | | | | | 1,362,378 | |
| | | | | | | | | | |
| | | | |
| 90 | | CALAMOS OPEN-END FAMILY OF FUNDS SEMIANNUAL REPORT | | See accompanying Notes to Schedule of Investments |
Emerging Market Equity Fund Schedule of Investments April 30, 2015 (Unaudited)
| | | | | | | | | | |
NUMBER OF
SHARES | | | | | | | VALUE | |
| | | | | | | | | | |
| | | | | | | | | | |
| | | | | | Information Technology (24.1%) | |
| | 121,000 | | | TWD | | Advanced Semiconductor Engineering, Inc. | | $ | 171,593 | |
| | 2,830 | | | | | Baidu, Inc.# | | | 566,792 | |
| | 16,000 | | | TWD | | Catcher Technology Company, Ltd. | | | 187,230 | |
| | 4,000 | | | TWD | | Hermes Microvision, Inc. | | | 281,271 | |
| | 10,590 | | | | | Infosys, Ltd. | | | 328,078 | |
| | 3,000 | | | TWD | | Largan Precision Company, Ltd. | | | 300,618 | |
| | 101,000 | | | HKD | | Lenovo Group, Ltd. | | | 173,677 | |
| | 5,300 | | | BRL | | Linx, SA | | | 78,103 | |
| | 210 | | | KRW | | NAVER Corp. | | | 126,982 | |
| | 193,000 | | | HKD | | PAX Global Technology, Ltd.# | | | 280,390 | |
| | 530 | | | KRW | | Samsung Electronics Co., Ltd. | | | 695,283 | |
| | 4,300 | | | KRW | | SK Hynix, Inc. | | | 183,976 | |
| | 103,000 | | | TWD | | Taiwan Semiconductor Manufacturing Company, Ltd. | | | 495,870 | |
| | 25,700 | | | HKD | | Tencent Holdings, Ltd. | | | 530,419 | |
| | 4,600 | | | | | Yandex, NV - Class A# | | | 88,504 | |
| | | | | | | | | | |
| | | | | | | | | 4,488,786 | |
| | | | | | | | | | |
| | | | | | Materials (2.2%) | | | | |
| | 325,353 | | | MXN | | Cemex, SAB de CV# | | | 314,071 | |
| | 32,200 | | | MXN | | Grupo Mexico, SAB de CV - Series B | | | 99,505 | |
| | | | | | | | | | |
| | | | | | | | | 413,576 | |
| | | | | | | | | | |
| | | | | | Telecommunication Services (5.2%) | | | | |
| | 26,500 | | | HKD | | China Mobile, Ltd. | | | 378,507 | |
| | 54,000 | | | HKD | | China Unicom Hong Kong, Ltd. | | | 101,419 | |
| | 9,450 | | | ZAR | | MTN Group, Ltd. | | | 189,746 | |
| | 880 | | | KRW | | SK Telecom Company, Ltd. | | | 235,816 | |
| | 3,800 | | | | | Tim Participacoes, SA | | | 59,736 | |
| | | | | | | | | | |
| | | | | | | | | 965,224 | |
| | | | | | | | | | |
| | | | | | Utilities (1.6%) | | | | |
| | 72,000 | | | HKD | | Huaneng Power International, Inc. | | | 102,112 | |
| | 4,400 | | | KRW | | Korea Electric Power Corp. | | | 191,329 | |
| | | | | | | | | | |
| | | | | | | | | 293,441 | |
| | | | | | | | | | |
| | | | | | TOTAL COMMON STOCKS
(Cost $16,795,107) | | | 17,877,827 | |
| | | | | | | | | | |
| | | | | | | | | | |
| | SHORT TERM INVESTMENT (3.7%) | | | | |
| | 677,275 | | | | | Fidelity Prime Money Market Fund - Institutional Class
(Cost $677,275) | | | 677,275 | |
| | | | | | | | | | |
| | | | | | | | | | |
NUMBER OF
SHARES/
PRINCIPAL
AMOUNT | | | | | | | VALUE | |
| | | | | | | | | | |
| INVESTMENT OF CASH COLLATERAL FOR SECURITIES
LOANED (0.5%) |
|
| | | | | | Federal Home Loan Bank Discount Notes | | | | |
| | 18,357 | | | | | 0.000%, 05/29/15 | | $ | 18,357 | |
| | 11,474 | | | | | 0.000%, 06/10/15 | | | 11,474 | |
| | 5,737 | | | | | 0.000%, 06/15/15 | | | 5,737 | |
| | 5,737 | | | | | 0.000%, 05/27/15 | | | 5,737 | |
| | 11,473 | | | | | Federal Home Loan Mortgage Corp. Discount Note
0.000%, 06/01/15 | | | 11,473 | |
| | 22,793 | | | | | Fidelity Prime Money Market Fund - Institutional Class | | | 22,793 | |
| | 10,454 | | | | | Goldman Sachs Financial Square Fund | | | 10,454 | |
| | 11,475 | | | | | Morgan Stanley Institutional Liquidity Fund | | | 11,475 | |
| | | | | | | | | | |
| | | | | | TOTAL INVESTMENT OF
CASH COLLATERAL FOR
SECURITIES LOANED
(Cost $97,500) | | | 97,500 | |
| | | | | | | | | | |
| TOTAL INVESTMENTS (100.0%)
(Cost $17,569,882) | | | 18,652,602 | |
| | | | | | | | | | |
| |
| | PAYABLE UPON RETURN OF SECURITIES ON LOAN (-0.5%) | | | (97,500 | ) |
| | | | | | | | | | |
| |
| | OTHER ASSETS, LESS LIABILITIES (0.5%) | | | 100,748 | |
| | | | | | | | | | |
| |
| | NET ASSETS (100.0%) | | $ | 18,655,850 | |
| | | | | | | | | | |
FORWARD FOREIGN CURRENCY CONTRACTS
| | | | | | | | | | | | | | | | |
| COUNTERPARTY | | SHORT CONTRACTS | | SETTLEMENT DATE | | LOCAL CURRENCY | | | CURRENT VALUE | | | UNREALIZED GAIN/LOSS | |
| Income Repatriation Hong Kong IBS | | Thai Baht | | 05/06/15 | | | 28,350 | | | $ | 860 | | | $ | 1 | |
| | | | | | | | | | | | | | | | |
NOTES TO SCHEDULE OF INVESTMENTS
| # | Non-income producing security. |
| ^ | Security, or portion of security, is on loan. |
| ~ | Security, or portion of security, is segregated as collateral for written options. The aggregate value of such securities is $108,156. |
| | | | | | |
| See accompanying Notes to Financial Statements | | www.calamos.com | | | 91 | |
Emerging Market Equity Fund Schedule of Investments April 30, 2015 (Unaudited)
FOREIGN CURRENCY ABBREVIATIONS
| | |
| AED | | UAE Dirham |
| BRL | | Brazilian Real |
| EUR | | European Monetary Unit |
| HKD | | Hong Kong Dollar |
| IDR | | Indonesian Rupiah |
| KRW | | South Korean Won |
| MXN | | Mexican Peso |
| PHP | | Philippine Peso |
| THB | | Thai Baht |
| TRY | | Turkish Lira |
| TWD | | New Taiwan Dollar |
| ZAR | | South African Rand |
Note: Value for securities denominated in foreign currencies is shown in U.S. dollars.
CURRENCY EXPOSURE
APRIL 30, 2015
| | | | | | | | |
| | | VALUE | | | % OF TOTAL
INVESTMENTS | |
| Hong Kong Dollar | | $ | 4,281,877 | | | | 23.0% | |
| US Dollar | | | 4,070,959 | | | | 21.8% | |
| South Korean Won | | | 2,327,533 | | | | 12.5% | |
| New Taiwan Dollar | | | 1,918,743 | | | | 10.3% | |
| Mexican Peso | | | 1,414,649 | | | | 7.6% | |
| Brazilian Real | | | 1,396,952 | | | | 7.5% | |
| South African Rand | | | 1,351,947 | | | | 7.3% | |
| Indonesian Rupiah | | | 621,159 | | | | 3.3% | |
| Philippine Peso | | | 490,813 | | | | 2.6% | |
| Thai Baht | | | 359,211 | | | | 1.9% | |
| Turkish Lira | | | 258,435 | | | | 1.4% | |
| European Monetary Unit | | | 80,755 | | | | 0.4% | |
| UAE Dirham | | | 79,569 | | | | 0.4% | |
| Total Investments | | $ | 18,652,602 | | | | 100.0% | |
Currency exposure may vary over time.
| | | | |
| 92 | | CALAMOS OPEN-END FAMILY OF FUNDS SEMIANNUAL REPORT | | See accompanying Notes to Financial Statements |
Global Equity Fund Schedule of Investments April 30, 2015 (Unaudited)
| | | | | | | | | | |
NUMBER OF
SHARES | | | | | | | VALUE | |
| | | | | | | | | | |
| | COMMON STOCKS (97.9%) | |
| | | | | | Consumer Discretionary (21.9%) | | | | |
| | 8,400 | | | | | Amazon.com, Inc.# | | $ | 3,542,952 | |
| | 778,000 | | | HKD | | Brilliance China Automotive Holdings, Ltd. | | | 1,460,097 | |
| | 27,000 | | | | | Comcast Corp. - Class A | | | 1,559,520 | |
| | 19,800 | | | CHF | | Compagnie Financière Richemont, SA | | | 1,764,833 | |
| | 16,900 | | | EUR | | Daimler, AG | | | 1,624,880 | |
| | 4,200 | | | JPY | | Fast Retailing Co., Ltd. | | | 1,654,295 | |
| | 20,000 | | | | | Home Depot, Inc. | | | 2,139,600 | |
| | 17,000 | | | | | Las Vegas Sands Corp. | | | 898,960 | |
| | 71,500 | | | | | Lions Gate Entertainment Corp.^ | | | 2,217,215 | |
| | 140,000 | | | INR | | Motherson Sumi Systems, Ltd. | | | 1,108,151 | |
| | 43,000 | | | ZAR | | Naspers, Ltd. - Class N | | | 6,746,090 | |
| | 59,400 | | | DKK | | Pandora, A/S | | | 6,139,675 | |
| | 3,600 | | | | | Priceline Group, Inc.# | | | 4,456,116 | |
| | 625,000 | | | HKD | | Samsonite International, SA | | | 2,279,480 | |
| | 22,800 | | | | | Starbucks Corp. | | | 1,130,424 | |
| | 32,700 | | | JPY | | Toyota Motor Corp. | | | 2,276,219 | |
| | 60,000 | | | EUR | | TUI, AG | | | 1,118,454 | |
| | 13,400 | | | | | Walt Disney Company | | | 1,456,848 | |
| | 103,000 | | | GBP | | WPP, PLC | | | 2,402,114 | |
| | | | | | | | | | |
| | | | | | | | | 45,975,923 | |
| | | | | | | | | | |
| | | | | | Consumer Staples (5.8%) | | | | |
| | 18,300 | | | EUR | | Anheuser-Busch InBev, NV | | | 2,227,995 | |
| | 20,700 | | | GBP | | British American Tobacco, PLC | | | 1,137,333 | |
| | 72,100 | | | GBP | | Diageo, PLC | | | 2,001,667 | |
| | 13,200 | | | | | Keurig Green Mountain, Inc. | | | 1,536,084 | |
| | 28,000 | | | | | Mondelez International, Inc. - Class A | | | 1,074,360 | |
| | 10,400 | | | EUR | | Pernod Ricard, SA | | | 1,292,552 | |
| | 39,000 | | | JPY | | Seven & I Holdings Company, Ltd. | | | 1,676,389 | |
| | 14,700 | | | | | Walgreens Boots Alliance, Inc. | | | 1,219,071 | |
| | | | | | | | | | |
| | | | | | | | | 12,165,451 | |
| | | | | | | | | | |
| | | | | | Energy (3.6%) | | | | |
| | 15,000 | | | | | Anadarko Petroleum Corp. | | | 1,411,500 | |
| | 18,000 | | | | | Continental Resources, Inc.# | | | 947,340 | |
| | 16,750 | | | | | EOG Resources, Inc. | | | 1,657,413 | |
| | 15,000 | | | | | Occidental Petroleum Corp. | | | 1,201,500 | |
| | 24,900 | | | | | Schlumberger, Ltd. | | | 2,355,789 | |
| | | | | | | | | | |
| | | | | | | | | 7,573,542 | |
| | | | | | | | | | |
| | | | | | Financials (11.6%) | | | | |
| | 281,600 | | | HKD | | AIA Group, Ltd. | | | 1,872,775 | |
| | 32,500 | | | | | Arthur J. Gallagher & Company | | | 1,554,475 | |
| | 94,500 | | | EUR | | Azimut Holding, S.p.A | | | 2,773,832 | |
| | 45,000 | | | | | Blackstone Group, LP | | | 1,843,200 | |
| | 52,000 | | | | | Citigroup, Inc. | | | 2,772,640 | |
| | 374,000 | | | JPY | | Daiwa Securities Group, Inc. | | | 3,102,635 | |
| | | | | | | | | | |
NUMBER OF
SHARES | | | | | | | VALUE | |
| | | | | | | | | | |
| | 30,335 | | | EUR | | Deutsche Annington Immobilien, SE | | $ | 1,018,198 | |
| | 165,000 | | | MXN | | Grupo Financiero Banorte, SAB de CV^ | | | 935,990 | |
| | 50,000 | | | INR | | Housing Development Finance Corp, Ltd. | | | 919,656 | |
| | 350,000 | | | EUR | | Intesa Sanpaolo S.p.A | | | 1,175,826 | |
| | 739,197 | | | PHP | | Metropolitan Bank & Trust Company | | | 1,540,931 | |
| | 40,000 | | | JPY | | Mitsui Fudosan Company, Ltd. | | | 1,185,772 | |
| | 13,000 | | | | | State Street Corp. | | | 1,002,560 | |
| | 30,000 | | | | | Wells Fargo & Company | | | 1,653,000 | |
| | 56,000 | | | | | WisdomTree Investments, Inc. | | | 1,066,240 | |
| | | | | | | | | | |
| | | | | | | | | 24,417,730 | |
| | | | | | | | | | |
| | | | | | Health Care (13.6%) | | | | |
| | 4,900 | | | | | Biogen, Inc.# | | | 1,832,257 | |
| | 6,250 | | | | | C.R. Bard, Inc. | | | 1,041,125 | |
| | 18,900 | | | | | Celgene Corp.# | | | 2,042,334 | |
| | 69,500 | | | | | Cerner Corp.# | | | 4,990,795 | |
| | 69,900 | | | JPY | | Chugai Pharmaceutical Co., Ltd. | | | 2,125,783 | |
| | 10,200 | | | | | Gilead Sciences, Inc.# | | | 1,025,202 | |
| | 11,000 | | | | | Illumina, Inc.# | | | 2,026,750 | |
| | 17,500 | | | | | Laboratory Corp. of America Holdings# | | | 2,092,300 | |
| | 26,500 | | | CHF | | Novartis, AG | | | 2,704,913 | |
| | 26,000 | | | DKK | | Novo Nordisk, A/S - Class B | | | 1,459,657 | |
| | 12,000 | | | EUR | | Sanofi | | | 1,221,486 | |
| | 27,500 | | | GBP | | Shire, PLC | | | 2,234,749 | |
| | 22,000 | | | | | Stryker Corp. | | | 2,029,280 | |
| | 15,500 | | | | | Zimmer Holdings, Inc. | | | 1,702,520 | |
| | | | | | | | | | |
| | | | | | | | | 28,529,151 | |
| | | | | | | | | | |
| | | | | | Industrials (12.5%) | | | | |
| | 50,000 | | | CHF | | ABB, Ltd.# | | | 1,095,622 | |
| | 35,100 | | | EUR | | ANDRITZ, AG | | | 2,054,991 | |
| | 5,500 | | | CAD | | Canadian Pacific Railway, Ltd.^ | | | 1,048,624 | |
| | 47,000 | | | | | Delta Air Lines, Inc. | | | 2,098,080 | |
| | 25,000 | | | JPY | | FANUC Corp. | | | 5,499,067 | |
| | 15,000 | | | EUR | | HOCHTIEF, AG | | | 1,159,003 | |
| | 157,000 | | | HKD | | Hutchison Whampoa, Ltd. | | | 2,308,170 | |
| | 2,300 | | | CHF | | Kaba Holding, AG# | | | 1,510,565 | |
| | 55,500 | | | EUR | | KION Group, AG | | | 2,462,253 | |
| | 59,800 | | | EUR | | Safran, SA | | | 4,369,427 | |
| | 16,600 | | | | | United Parcel Service, Inc. - Class B | | | 1,668,798 | |
| | 8,500 | | | | | United Technologies Corp. | | | 966,875 | |
| | | | | | | | | | |
| | | | | | | | | 26,241,475 | |
| | | | | | | | | | |
| | | | | | Information Technology (27.1%) | | | | |
| | 64,100 | | | | | Apple, Inc. | | | 8,022,115 | |
| | 125,000 | | | GBP | | ARM Holdings, PLC | | | 2,123,923 | |
| | 14,400 | | | | | Baidu, Inc.# | | | 2,884,032 | |
| | 32,300 | | | | | Cognizant Technology Solutions Corp. - Class A# | | | 1,890,842 | |
| | 5,300 | | | CAD | | Constellation Software, Inc. | | | 2,077,829 | |
| | | | | | |
| See accompanying Notes to Schedule of Investments | | www.calamos.com | | | 93 | |
Global Equity Fund Schedule of Investments April 30, 2015 (Unaudited)
| | | | | | | | | | |
NUMBER OF
SHARES | | | | | | | VALUE | |
| | | | | | | | | | |
| | 40,500 | | | | | Facebook, Inc. - Class A# | | $ | 3,190,185 | |
| | 12,025 | | | | | Google, Inc. - Class A# | | | 6,598,959 | |
| | 8,347 | | | | | Google, Inc. - Class C# | | | 4,485,177 | |
| | 1,900 | | | JPY | | Keyence Corp. | | | 1,014,313 | |
| | 76,000 | | | | | LendingClub Corp.#^ | | | 1,326,200 | |
| | 21,400 | | | | | LinkedIn Corp. - Class A# | | | 5,395,582 | |
| | 39,400 | | | | | MasterCard, Inc. - Class A | | | 3,554,274 | |
| | 32,900 | | | | | Mellanox Technologies, Ltd.# | | | 1,529,521 | |
| | 1,230 | | | KRW | | Samsung Electronics Co., Ltd. | | | 1,613,580 | |
| | 15,000 | | | EUR | | SAP SE | | | 1,133,475 | |
| | 30,000 | | | | | Splunk, Inc.# | | | 1,990,350 | |
| | 614,000 | | | TWD | | Taiwan Semiconductor Manufacturing Company, Ltd. | | | 2,955,964 | |
| | 247,200 | | | HKD | | Tencent Holdings, Ltd. | | | 5,101,931 | |
| | | | | | | | | | |
| | | | | | | | | 56,888,252 | |
| | | | | | | | | | |
| | | | | | Materials (1.3%) | | | | |
| | 1,560,000 | | | MXN | | Cemex, SAB de CV# | | | 1,505,905 | |
| | 270,000 | | | GBP | | Glencore, PLC# | | | 1,282,654 | |
| | | | | | | | | | |
| | | | | | | | | 2,788,559 | |
| | | | | | | | | | |
| | | | | | Telecommunication Services (0.5%) | | | | |
| | 16,800 | | | JPY | | SoftBank Corp. | | | 1,050,174 | |
| | | | | | | | | | |
| | | | | | TOTAL COMMON STOCKS
(Cost $170,382,012) | | | 205,630,257 | |
| | | | | | | | | | |
| | | | | | | | | | |
| | SHORT TERM INVESTMENT (1.9%) | |
| | 4,005,916 | | | | | Fidelity Prime Money Market Fund - Institutional Class
(Cost $4,005,916) | | | 4,005,916 | |
| | | | | | | | | | |
| | | | | | | | | | |
NUMBER OF
SHARES/
PRINCIPAL
AMOUNT | | | | | | | VALUE | |
| INVESTMENT OF CASH COLLATERAL FOR SECURITIES
LOANED (2.5%) |
|
| | | | | | Federal Home Loan Bank Discount Notes | | | | |
| | 984,357 | | | | | 0.000%, 05/29/15 | | | 984,357 | |
| | 615,271 | | | | | 0.000%, 06/10/15 | | | 615,271 | |
| | 307,649 | | | | | 0.000%, 05/27/15 | | | 307,649 | |
| | 307,640 | | | | | 0.000%, 06/15/15 | | | 307,640 | |
| | 615,242 | | | | | Federal Home Loan Mortgage Corp. Discount Note
0.000%, 06/01/15 | | | 615,242 | |
| | 1,222,271 | | | | | Fidelity Prime Money Market Fund - Institutional Class | | | 1,222,271 | |
| | 560,605 | | | | | Goldman Sachs Financial Square Fund | | | 560,605 | |
| | | | | | | | | | |
NUMBER OF
SHARES/
PRINCIPAL
AMOUNT | | | | | | | VALUE | |
| | | | | | | | | | |
| | 615,316 | | | | | Morgan Stanley Institutional Liquidity Fund | | $ | 615,316 | |
| | | | | | | | | | |
| | | | | | TOTAL INVESTMENT OF CASH
COLLATERAL FOR SECURITIES
LOANED
(Cost $5,228,351) | | | 5,228,351 | |
| | | | | | | | | | |
| TOTAL INVESTMENTS (102.3%)
(Cost $179,616,279) | | | 214,864,524 | |
| | | | | | | | | | |
| |
| | PAYABLE UPON RETURN OF SECURITIES ON LOAN (-2.5%) | | | (5,228,351 | ) |
| | | | | | | | | | |
| |
| | OTHER ASSETS, LESS LIABILITIES (0.2%) | | | 354,593 | |
| | | | | | | | | | |
| |
| | NET ASSETS (100.0%) | | $ | 209,990,766 | |
| | | | | | | | | | |
| | | | | | | | | | | | | | | | |
| FORWARD FOREIGN CURRENCY CONTRACTS | |
| | | | | |
| COUNTERPARTY | | LONG
CONTRACTS | | SETTLEMENT
DATE | | LOCAL
CURRENCY | | | CURRENT
VALUE | | | UNREALIZED
GAIN/LOSS | |
| Northern Trust Company | | European Monetary Unit | | 05/29/15 | | | 1,312,000 | | | $ | 1,473,635 | | | $ | 6,946 | |
| | | | | | | | | | | | | | | | |
| | | | | |
| COUNTERPARTY | | SHORT
CONTRACTS | | SETTLEMENT
DATE | | LOCAL CURRENCY | | | CURRENT
VALUE | | | UNREALIZED
GAIN/LOSS | |
| Brown Brothers Harriman & Company | | European Monetary Unit | | 05/29/15 | | | 9,194,000 | | | $ | 10,326,680 | | | $ | (332,618 | ) |
| | | | | | | | | | | | | | | | |
NOTES TO SCHEDULE OF INVESTMENTS
| # | Non-income producing security. |
| ^ | Security, or portion of security, is on loan. |
FOREIGN CURRENCY ABBREVIATIONS
| | |
| CAD | | Canadian Dollar |
| CHF | | Swiss Franc |
| DKK | | Danish Krone |
| EUR | | European Monetary Unit |
| GBP | | British Pound Sterling |
| HKD | | Hong Kong Dollar |
| INR | | Indian Rupee |
| JPY | | Japanese Yen |
| KRW | | South Korean Won |
| MXN | | Mexican Peso |
| PHP | | Philippine Peso |
| TWD | | New Taiwan Dollar |
| ZAR | | South African Rand |
Note: Value for securities denominated in foreign currencies is shown in U.S. dollars.
| | | | |
| 94 | | CALAMOS OPEN-END FAMILY OF FUNDS SEMIANNUAL REPORT | | See accompanying Notes to Financial Statements |
Global Equity Fund Schedule of Investments April 30, 2015 (Unaudited)
CURRENCY EXPOSURE
APRIL 30, 2015
| | | | | | | | |
| | | VALUE | | | % OF TOTAL
INVESTMENTS | |
| US Dollar | | $ | 112,314,627 | | | | 52.3% | |
| European Monetary Unit | | | 23,632,372 | | | | 11.0% | |
| Japanese Yen | | | 19,584,647 | | | | 9.1% | |
| Hong Kong Dollar | | | 13,022,453 | | | | 6.1% | |
| British Pound Sterling | | | 11,182,440 | | | | 5.2% | |
| Danish Krone | | | 7,599,332 | | | | 3.5% | |
| Swiss Franc | | | 7,075,933 | | | | 3.3% | |
| South African Rand | | | 6,746,090 | | | | 3.1% | |
| Canadian Dollar | | | 3,126,453 | | | | 1.5% | |
| New Taiwan Dollar | | | 2,955,964 | | | | 1.4% | |
| Mexican Peso | | | 2,441,895 | | | | 1.1% | |
| Indian Rupee | | | 2,027,807 | | | | 0.9% | |
| South Korean Won | | | 1,613,580 | | | | 0.8% | |
| Philippine Peso | | | 1,540,931 | | | | 0.7% | |
| Total Investments | | $ | 214,864,524 | | | | 100.0% | |
Currency exposure may vary over time.
| | | | | | |
| See accompanying Notes to Financial Statements | | www.calamos.com | | | 95 | |
Growth and Income Fund Schedule of Investments April 30, 2015 (Unaudited)
| | | | | | | | | | |
PRINCIPAL
AMOUNT | | | | | | | VALUE | |
| | | | | | | | | | |
| | CONVERTIBLE BONDS (21.4%) | |
| | | | | | Consumer Discretionary (5.0%) | |
| | | | | | Jarden Corp. | | | | |
| | 16,600,000 | | | | | 1.125%, 03/15/34^ | | $ | 19,216,326 | |
| | 9,275,000 | | | | | 1.500%, 06/15/19 | | | 12,858,906 | |
| | 38,195,000 | | | | | Liberty Interactive, LLC (Time Warner Cable, Inc., Time Warner, Inc.)§
0.750%, 03/30/43 | | | 55,318,583 | |
| | 13,063,000 | | | | | Liberty Media Corp.^
1.375%, 10/15/23 | | | 13,074,365 | |
| | 24,600,000 | | | | | Priceline Group, Inc.
1.000%, 03/15/18 | | | 34,459,803 | |
| | 6,000,000 | | | | | Tesla Motors, Inc.
1.250%, 03/01/21 | | | 5,553,210 | |
| | | | | | | | | | |
| | | | | | | | | 140,481,193 | |
| | | | | | | | | | |
| | | | | | Energy (0.4%) | |
| | 8,700,000 | | | | | Whiting Petroleum Corp.*
1.250%, 04/01/20 | | | 10,370,617 | |
| | | | | | | | | | |
| | | | | | Financials (1.1%) | |
| | 20,550,000 | | | | | Ares Capital Corp.^
5.750%, 02/01/16 | | | 21,197,736 | |
| | 5,850,000 | | | | | MGIC Investment Corp.
2.000%, 04/01/20 | | | 9,199,505 | |
| | | | | | | | | | |
| | | | | | | | | 30,397,241 | |
| | | | | | | | | | |
| | | | | | Health Care (6.8%) | |
| | 31,500,000 | | | | | Anthem, Inc.
2.750%, 10/15/42 | | | 63,627,952 | |
| | 9,904,000 | | | | | BioMarin Pharmaceutical, Inc.
1.500%, 10/15/20 | | | 13,917,844 | |
| | 15,130,000 | | | | | Cepheid
1.250%, 02/01/21 | | | 16,837,950 | |
| | 3,920,000 | | | | | Gilead Sciences, Inc.
1.625%, 05/01/16 | | | 17,307,016 | |
| | 14,100,000 | | | | | Hologic, Inc.‡
2.000%, 12/15/37 | | | 21,211,194 | |
| | 40,825,000 | | | | | Illumina, Inc.^*
0.000%, 06/15/19 | | | 45,494,359 | |
| | 8,457,000 | | | | | Molina Healthcare, Inc.*
1.625%, 08/15/44 | | | 9,876,761 | |
| | | | | | | | | | |
| | | | | | | | | 188,273,076 | |
| | | | | | | | | | |
| | | | | | Industrials (0.5%) | |
| | 10,050,000 | | | | | Air Lease Corp.
3.875%, 12/01/18 | | | 14,752,847 | |
| | | | | | | | | | |
| | | | | | Information Technology (6.6%) | |
| | 9,000,000 | | | | | Euronet Worldwide, Inc.*
1.500%, 10/01/44 | | | 9,834,435 | |
| | 9,300,000 | | | | | Intel Corp.
3.250%, 08/01/39 | | | 15,175,600 | |
| | 12,990,000 | | | | | LinkedIn Corp.*
0.500%, 11/01/19 | | | 14,419,420 | |
| | | | | | | | | | |
PRINCIPAL
AMOUNT | | | | | | | VALUE | |
| | 14,260,000 | | | | | Microchip Technology, Inc.*
1.625%, 02/15/25 | | $ | 14,579,495 | |
| | 17,270,000 | | | | | NVIDIA Corp.
1.000%, 12/01/18 | | | 21,083,389 | |
| | 7,375,000 | | | | | Rovi Corp.^*
0.500%, 03/01/20 | | | 7,166,472 | |
| | 23,700,000 | | | | | Salesforce.com, Inc.^
0.250%, 04/01/18 | | | 29,647,515 | |
| | 26,000,000 | | | | | SanDisk Corp.
0.500%, 10/15/20 | | | 26,910,390 | |
| | 12,974,000 | | | | | ServiceNow, Inc.
0.000%, 11/01/18 | | | 15,597,862 | |
| | 15,450,000 | | | | | Twitter, Inc.*
0.250%, 09/15/19 | | | 14,300,366 | |
| | 14,700,000 | | | | | Yahoo!, Inc.
0.000%, 12/01/18 | | | 15,644,254 | |
| | | | | | | | | | |
| | | | | | | | | 184,359,198 | |
| | | | | | | | | | |
| | | | | | Materials (1.0%) | |
| | 11,000,000 | | | | | Cemex, SAB de CV
3.250%, 03/15/16 | | | 12,761,870 | |
| | 12,721,000 | | | | | RTI International Metals, Inc.
1.625%, 10/15/19 | | | 15,108,923 | |
| | | | | | | | | | |
| | | | | | | | | 27,870,793 | |
| | | | | | | | | | |
| | | | | | TOTAL CONVERTIBLE BONDS
(Cost $507,550,814) | | | 596,504,965 | |
| | | | | | | | | | |
| | | | | | | | | | |
| | CORPORATE BONDS (6.8%) | |
| | | | | | Consumer Discretionary (3.5%) | |
| | | | | | DISH DBS Corp. | | | | |
| | 12,500,000 | | | | | 5.875%, 07/15/22 | | | 12,632,813 | |
| | 10,030,000 | | | | | 5.125%, 05/01/20 | | | 10,155,375 | |
| | 23,500,000 | | | | | Expedia, Inc.
5.950%, 08/15/20 | | | 26,499,070 | |
| | 6,500,000 | | | | | FCA US, LLC
8.250%, 06/15/21 | | | 7,182,500 | |
| | 9,900,000 | | | | | Home Depot, Inc.
2.700%, 04/01/23 | | | 10,019,295 | |
| | 1,020,000 | | | | | Icahn Enterprises, LP
4.875%, 03/15/19 | | | 1,039,125 | |
| | 23,000,000 | | | | | L Brands, Inc.
5.625%, 02/15/22 | | | 25,185,000 | |
| | 2,429,000 | | | | | Lowe’s Companies, Inc.
3.875%, 09/15/23 | | | 2,640,687 | |
| | 3,040,000 | | | | | PVH Corp.
4.500%, 12/15/22 | | | 3,116,000 | |
| | | | | | | | | | |
| | | | | | | | | 98,469,865 | |
| | | | | | | | | | |
| | | | | | Consumer Staples (0.4%) | |
| | 9,865,000 | | | | | Wal-Mart Stores, Inc.
3.300%, 04/22/24 | | | 10,412,902 | |
| | | | | | | | | | |
| | | | | | Financials (0.6%) | |
| | 4,950,000 | | | | | Berkshire Hathaway, Inc.
3.000%, 02/11/23 | | | 5,116,394 | |
| | | | |
| 96 | | CALAMOS OPEN-END FAMILY OF FUNDS SEMIANNUAL REPORT | | See accompanying Notes to Schedule of Investments |
Growth and Income Fund Schedule of Investments April 30, 2015 (Unaudited)
| | | | | | | | | | |
PRINCIPAL
AMOUNT | | | | | | | VALUE | |
| | 12,000,000 | | | | | Neuberger Berman Group, LLC*
5.875%, 03/15/22 | | $ | 12,911,940 | |
| | | | | | | | | | |
| | | | | | | | | 18,028,334 | |
| | | | | | | | | | |
| | | | | | Health Care (0.5%) | |
| | 10,750,000 | | | | | Endo International, PLC*
7.000%, 07/15/19 | | | 11,206,875 | |
| | 3,000,000 | | | | | Universal Health Services, Inc.*
4.750%, 08/01/22 | | | 3,168,750 | |
| | | | | | | | | | |
| | | | | | | | | 14,375,625 | |
| | | | | | | | | | |
| | | | | | Industrials (0.4%) | |
| | 9,941,000 | | | | | Actuant Corp. 5.625%, 06/15/22 | | | 10,264,083 | |
| | | | | | | | | | |
| | | | | | Information Technology (1.1%) | |
| | 2,230,000 | | | | | ACI Worldwide, Inc.*
6.375%, 08/15/20 | | | 2,349,863 | |
| | 4,935,000 | | | | | Apple, Inc.
3.450%, 05/06/24 | | | 5,194,433 | |
| | 11,415,000 | | | | | Brocade Communications Systems, Inc.
4.625%, 01/15/23 | | | 11,357,925 | |
| | 9,865,000 | | | | | Google, Inc.
3.375%, 02/25/24 | | | 10,395,194 | |
| | | | | | | | | | |
| | | | | | | | | 29,297,415 | |
| | | | | | | | | | |
| | | | | | Materials (0.3%) | |
| | 7,135,000 | | | | | Alcoa, Inc.
5.125%, 10/01/24 | | | 7,674,584 | |
| | | | | | | | | | |
| | | | | | TOTAL CORPORATE BONDS
(Cost $182,617,790) | | | 188,522,808 | |
| | | | | | | | | | |
| | | | | | | | | | |
NUMBER OF
SHARES | | | | | | | VALUE | |
| | CONVERTIBLE PREFERRED STOCKS (9.6%) | |
| | | | | | Consumer Staples (0.3%) | |
| | 176,350 | | | | | Tyson Foods, Inc.
4.750% | | | 8,674,657 | |
| | | | | | | | | | |
| | | | | | Energy (1.1%) | |
| | 35,950 | | | | | Chesapeake Energy Corp.
5.750% | | | 31,563,400 | |
| | | | | | | | | | |
| | | | | | Financials (2.9%) | |
| | 653,216 | | | | | Affiliated Managers Group, Inc.
5.150% | | | 40,213,610 | |
| | 161,930 | | | | | American Tower Corp.
5.250% | | | 16,788,902 | |
| | 220,000 | | | | | Crown Castle International Corp.
4.500% | | | 23,034,000 | |
| | | | | | | | | | |
| | | | | | | | | 80,036,512 | |
| | | | | | | | | | |
| | | | | | Health Care (1.1%) | |
| | 29,200 | | | | | Actavis, PLC
5.500% | | | 29,219,272 | |
| | | | | | | | | | |
| | | | | | | | | | |
NUMBER OF
SHARES | | | | | | | VALUE | |
| | | | | | | | | | |
| | | | | | Industrials (1.7%) | |
| | 135,000 | | | | | Stanley Black & Decker, Inc.^
6.250% | | $ | 15,776,100 | |
| | 553,500 | | | | | United Technologies Corp.
7.500% | | | 32,556,870 | |
| | | | | | | | | | |
| | | | | | | | | 48,332,970 | |
| | | | | | | | | | |
| | | | | | Telecommunication Services (0.5%) | |
| | 236,200 | | | | | T-Mobile USA, Inc.
5.500% | | | 14,727,070 | |
| | | | | | | | | | |
| | | | | | Utilities (2.0%) | |
| | 301,775 | | | | | Dominion Resources, Inc.
6.375% | | | 14,983,129 | |
| | 320,000 | | | | | Exelon Corp.^
6.500% | | | 15,766,400 | |
| | 380,000 | | | | | NextEra Energy, Inc.
5.889% | | | 24,187,000 | |
| | | | | | | | | | |
| | | | | | | | | 54,936,529 | |
| | | | | | | | | | |
| | | | | | TOTAL CONVERTIBLE PREFERRED STOCKS
(Cost $241,893,961) | | | 267,490,410 | |
| | | | | | | | | | |
| | | | | | | | | | |
| | COMMON STOCKS (58.5%) | |
| | | | | | Consumer Discretionary (6.0%) | |
| | 47,500 | | | | | Amazon.com, Inc.# | | | 20,034,550 | |
| | 480,000 | | | | | Home Depot, Inc. | | | 51,350,400 | |
| | 268,000 | | | | | Nike, Inc. - Class B | | | 26,489,120 | |
| | 508,000 | | | | | Starbucks Corp. | | | 25,186,640 | |
| | 435,000 | | | | | Twenty-First Century Fox, Inc. | | | 14,824,800 | |
| | 275,000 | | | | | Walt Disney Company | | | 29,898,000 | |
| | | | | | | | | | |
| | | | | | | | | 167,783,510 | |
| | | | | | | | | | |
| | | | | | Consumer Staples (7.0%) | |
| | 1,000,000 | | | | | Coca-Cola Company | | | 40,560,000 | |
| | 260,000 | | | | | Costco Wholesale Corp. | | | 37,193,000 | |
| | 560,000 | | | | | Mondelez International, Inc. - Class A | | | 21,487,200 | |
| | 215,000 | | | | | PepsiCo, Inc. | | | 20,450,800 | |
| | 200,000 | | | | | Philip Morris International, Inc. | | | 16,694,000 | |
| | 321,000 | | | | | Procter & Gamble Company | | | 25,522,710 | |
| | 415,000 | | | | | Walgreens Boots Alliance, Inc. | | | 34,415,950 | |
| | | | | | | | | | |
| | | | | | | | | 196,323,660 | |
| | | | | | | | | | |
| | | | | | Energy (4.7%) | |
| | 200,000 | | | | | Anadarko Petroleum Corp. | | | 18,820,000 | |
| | 130,600 | | | | | Chevron Corp. | | | 14,504,436 | |
| | 140,000 | | | | | EOG Resources, Inc. | | | 13,853,000 | |
| | 409,000 | | | | | Exxon Mobil Corp. | | | 35,734,330 | |
| | 400,000 | | | | | Occidental Petroleum Corp. | | | 32,040,000 | |
| | 179,000 | | | | | Schlumberger, Ltd. | | | 16,935,190 | |
| | | | | | | | | | |
| | | | | | | | | 131,886,956 | |
| | | | | | | | | | |
| | | | | | |
| See accompanying Notes to Schedule of Investments | | www.calamos.com | | | 97 | |
Growth and Income Fund Schedule of Investments April 30, 2015 (Unaudited)
| | | | | | | | | | |
NUMBER OF
SHARES | | | | | | | VALUE | |
| | | | | | | | | | |
| | | | | | Financials (11.9%) | |
| | 520,000 | | | | | American International Group, Inc. | | $ | 29,270,800 | |
| | 350,000 | | | | | Arthur J. Gallagher & Company | | | 16,740,500 | |
| | 420,000 | | | | | Blackstone Group, LP | | | 17,203,200 | |
| | 945,000 | | | | | Citigroup, Inc. | | | 50,387,400 | |
| | 1,140,000 | | | | | JPMorgan Chase & Company | | | 72,116,400 | |
| | 400,890 | | | | | MetLife, Inc. | | | 20,561,648 | |
| | 412,350 | | | | | State Street Corp. | | | 31,800,432 | |
| | 300,000 | | | | | T. Rowe Price Group, Inc. | | | 24,354,000 | |
| | 1,250,000 | | | | | Wells Fargo & Company | | | 68,875,000 | |
| | | | | | | | | | |
| | | | | | | | | 331,309,380 | |
| | | | | | | | | | |
| | | | | | Health Care (7.0%) | |
| | 33,200 | | | | | Biogen, Inc.# | | | 12,414,476 | |
| | 215,000 | | | | | Celgene Corp.# | | | 23,232,900 | |
| | 482,400 | | | | | Johnson & Johnson | | | 47,854,080 | |
| | 500,175 | | | | | Merck & Company, Inc. | | | 29,790,423 | |
| | 870,000 | | | | | Pfizer, Inc. | | | 29,519,100 | |
| | 281,000 | | | | | Stryker Corp. | | | 25,919,440 | |
| | 249,000 | | | | | Zimmer Holdings, Inc. | | | 27,350,160 | |
| | | | | | | | | | |
| | | | | | | | | 196,080,579 | |
| | | | | | | | | | |
| | | | | | Industrials (7.1%) | |
| | 196,000 | | | | | Boeing Company | | | 28,094,640 | |
| | 416,000 | | | | | Delta Air Lines, Inc. | | | 18,570,240 | |
| | 450,000 | | | | | Eaton Corp., PLC | | | 30,928,500 | |
| | 1,100,000 | | | | | General Electric Company | | | 29,788,000 | |
| | 136,000 | | | | | Honeywell International, Inc. | | | 13,725,120 | |
| | 72,800 | | | | | Lockheed Martin Corp. | | | 13,584,480 | |
| | 100,000 | | | | | Northrop Grumman Corp. | | | 15,404,000 | |
| | 220,000 | | | | | Union Pacific Corp. | | | 23,370,600 | |
| | 240,000 | | | | | United Parcel Service, Inc. - Class B | | | 24,127,200 | |
| | | | | | | | | | |
| | | | | | | | | 197,592,780 | |
| | | | | | | | | | |
| | | | | | Information Technology (14.8%) | |
| | 300,000 | | | | | Accenture, PLC - Class A | | | 27,795,000 | |
| | 1,234,000 | | | | | Apple, Inc. | | | 154,435,100 | |
| | 600,000 | | | | | Applied Materials, Inc. | | | 11,874,000 | |
| | 392,000 | | | | | Broadcom Corp. - Class A | | | 17,328,360 | |
| | 205,800 | | | | | Facebook, Inc. - Class A# | | | 16,210,866 | |
| | 67,500 | | | | | Google, Inc. - Class A# | | | 37,041,975 | |
| | 349,500 | | | | | MasterCard, Inc. - Class A | | | 31,528,395 | |
| | 1,315,000 | | | | | Microsoft Corp. | | | 63,961,600 | |
| | 375,000 | | | | | Oracle Corp. | | | 16,357,500 | |
| | 300,000 | | | | | QUALCOMM, Inc. | | | 20,400,000 | |
| | 275,000 | | | | | Texas Instruments, Inc. | | | 14,907,750 | |
| | | | | | | | | | |
| | | | | | | | | 411,840,546 | |
| | | | | | | | | | |
| | | | | | TOTAL COMMON STOCKS
(Cost $1,301,179,473) | | | 1,632,817,411 | |
| | | | | | | | | | |
| | | | | | | | | | |
| | | | | | | | | | |
NUMBER OF
SHARES | | | | | | | VALUE | |
| | SHORT TERM INVESTMENT (3.7%) | | | | |
| | 104,036,048 | | | | | Fidelity Prime Money Market Fund - Institutional Class (Cost $104,036,048) | | $ | 104,036,048 | |
| | | | | | | | | | |
| | | | | | | | | | |
NUMBER OF
SHARES/
PRINCIPAL
AMOUNT | | | | | | | VALUE | |
| | | | | | | | | | |
| INVESTMENT OF CASH COLLATERAL FOR SECURITIES
LOANED (2.4%) |
|
| | | | | | Federal Home Loan Bank Discount Notes | |
| | 12,451,936 | | | | | 0.000%, 05/29/15 | | | 12,451,936 | |
| | 7,783,069 | | | | | 0.000%, 06/10/15 | | | 7,783,069 | |
| | 3,891,703 | | | | | 0.000%, 05/27/15 | | | 3,891,703 | |
| | 3,891,596 | | | | | 0.000%, 06/15/15 | | | 3,891,596 | |
| | 7,782,696 | | | | | Federal Home Loan Mortgage Corp. Discount Note
0.000%, 06/01/15 | | | 7,782,696 | |
| | 15,461,513 | | | | | Fidelity Prime Money Market Fund - Institutional Class | | | 15,461,513 | |
| | 7,091,552 | | | | | Goldman Sachs Financial Square Fund | | | 7,091,552 | |
| | 7,783,640 | | | | | Morgan Stanley Institutional Liquidity Fund | | | 7,783,640 | |
| | | | | | | | | | |
| | | | | | TOTAL INVESTMENT OF CASH
COLLATERAL FOR SECURITIES
LOANED
(Cost $66,137,705) | | | 66,137,705 | |
| | | | | | | | | | |
| TOTAL INVESTMENTS (102.4%)
(Cost $2,403,415,791) | | | 2,855,509,347 | |
| | | | | | | | | | |
| |
| | PAYABLE UPON RETURN OF SECURITIES ON LOAN (-2.4%) | | | (66,137,705 | ) |
| | | | | | | | | | |
| |
| | LIABILITIES, LESS OTHER ASSETS (0.0%) | | | (156,996 | ) |
| | | | | | | | | | |
| |
| | NET ASSETS (100.0%) | | $ | 2,789,214,646 | |
| | | | | | | | | | |
FORWARD FOREIGN CURRENCY CONTRACT
| | | | | | | | | | | | | | | | |
| COUNTERPARTY | | SHORT
CONTRACTS | | SETTLEMENT
DATE | | LOCAL
CURRENCY | | | CURRENT
VALUE | | | UNREALIZED
GAIN/LOSS | |
| Northern Trust Company | | Mexican Peso | | 07/23/15 | | | 124,033,000 | | | $ | 8,039,534 | | | $ | 53,397 | |
| | | | | | | | | | | | | | | | |
NOTES TO SCHEDULE OF INVESTMENTS
| ^ | Security, or portion of security, is on loan. |
| § | Securities exchangeable or convertible into securities of one or more entities that are different than the issuer. Each entity is identified in the parenthetical. |
| * | Securities issued and sold pursuant to a Rule 144A transaction are excepted from the registration requirement of the Securities Act of |
| | | | |
| 98 | | CALAMOS OPEN-END FAMILY OF FUNDS SEMIANNUAL REPORT | | See accompanying Notes to Financial Statements |
Growth and Income Fund Schedule of Investments April 30, 2015 (Unaudited)
| | 1933, as amended. These securities may only be sold to qualified institutional buyers (“QIBs”), such as the Fund. Any resale of these securities must generally be effected through a sale that is registered under the Act or otherwise exempted from such registration requirements. |
| ‡ | Variable rate or step bond security. The rate shown is the rate in effect at April 30, 2015. |
| # | Non-income producing security. |
| | | | | | |
| See accompanying Notes to Financial Statements | | www.calamos.com | | | 99 | |
Global Growth and Income Fund Schedule of Investments April 30, 2015 (Unaudited)
| | | | | | | | | | |
PRINCIPAL
AMOUNT | | | | | | | VALUE | |
| | CONVERTIBLE BONDS (37.4%) | |
| | | | | | Consumer Discretionary (4.9%) | |
| | 2,800,000 | | | EUR | | Adidas, AG
0.250%, 06/14/19 | | $ | 3,705,328 | |
| | 220,000,000 | | | JPY | | HIS Company, Ltd.
0.000%, 08/30/19 | | | 2,090,061 | |
| | 1,950,000 | | | | | Liberty Interactive, LLC (Time Warner Cable, Inc., Time Warner, Inc.)§
0.750%, 03/30/43 | | | 2,824,224 | |
| | 8,300,000 | | | | | Priceline Group, Inc.^
0.350%, 06/15/20 | | | 9,791,136 | |
| | 1,100,000 | | | EUR | | Steinhoff Finance Holding, GmbH
4.500%, 03/31/18 | | | 2,164,791 | |
| | | | | | | | | | |
| | | | | | | | | 20,575,540 | |
| | | | | | | | | | |
| | | | | | Energy (0.7%) | |
| | 2,970,000 | | | | | SEACOR Holdings, Inc.
2.500%, 12/15/27 | | | 3,088,310 | |
| | | | | | | | | | |
| | | | | | Financials (7.6%) | |
| | | | | | Ares Capital Corp. | | | | |
| | 3,975,000 | | | | | 5.750%, 02/01/16 | | | 4,100,292 | |
| | 2,912,000 | | | | | 4.750%, 01/15/18 | | | 3,066,132 | |
| | 5,500,000 | | | | | AYC Finance, Ltd.
0.500%, 05/02/19 | | | 6,277,272 | |
| | 7,200,000 | | | EUR | | Azimut Holding, S.p.A.
2.125%, 11/25/20 | | | 10,206,712 | |
| | 2,000,000 | | | | | HKEx International, Ltd.
0.500%, 10/23/17 | | | 3,744,035 | |
| | 3,650,000 | | | EUR | | Industrivarden, AB
1.875%, 02/27/17 | | | 4,703,920 | |
| | | | | | | | | | |
| | | | | | | | | 32,098,363 | |
| | | | | | | | | | |
| | | | | | Health Care (3.6%) | |
| | 2,700,000 | | | | | Cepheid
1.250%, 02/01/21 | | | 3,004,789 | |
| | 6,915,000 | | | | | Illumina, Inc.^*
0.000%, 06/15/19 | | | 7,705,903 | |
| | 2,100,000 | | | | | Insulet Corp.
2.000%, 06/15/19 | | | 2,032,664 | |
| | 2,030,000 | | | | | Medidata Solutions, Inc.^
1.000%, 08/01/18 | | | 2,379,911 | |
| | | | | | | | | | |
| | | | | | | | | 15,123,267 | |
| | | | | | | | | | |
| | | | | | Industrials (4.6%) | |
| | 3,200,000 | | | GBP | | Carillion Finance Jersey, Ltd.
2.500%, 12/19/19 | | | 5,182,223 | |
| | 700,000 | | | EUR | | International Consolidated Airlines Group, SA
1.750%, 05/31/18 | | | 1,386,240 | |
| | 3,350,000 | | | | | Larsen & Toubro, Ltd.
0.675%, 10/22/19 | | | 3,613,426 | |
| | 4,800,000 | | | | | MISUMI Group, Inc.
0.000%, 10/22/18 | | | 5,477,826 | |
| | | | | | | | | | |
PRINCIPAL
AMOUNT | | | | | | | VALUE | |
| 265,000,000
|
| | JPY | | Nidec Corp.
0.000%, 09/18/15 | | $ | 3,725,470 | |
| | | | | | | | | | |
| | | | | | | | | 19,385,185 | |
| | | | | | | | | | |
| | | | | | Information Technology (13.5%) | |
| | 2,000,000 | | | | | Advanced Semiconductor Engineering, Inc. 0.000%, 09/05/18 | | | 2,706,091 | |
| | 220,000,000 | | | JPY | | Alps Electric Company, Ltd.
0.000%, 03/25/19 | | | 3,039,509 | |
| | 4,100,000 | | | | | Epistar Corp.
0.000%, 08/07/18 | | | 4,239,371 | |
| | 2,400,000 | | | | | Euronet Worldwide, Inc.*
1.500%, 10/01/44 | | | 2,622,516 | |
| | 3,225,000 | | | | | InvenSense, Inc.
1.750%, 11/01/18 | | | 3,124,783 | |
| | 8,200,000 | | | | | LinkedIn Corp.*
0.500%, 11/01/19 | | | 9,102,328 | |
| | 2,120,000 | | | | | Microchip Technology, Inc.*
1.625%, 02/15/25 | | | 2,167,499 | |
| | 2,103,000 | | | | | NVIDIA Corp.
1.000%, 12/01/18 | | | 2,567,363 | |
| | 3,100,000 | | | | | NXP Semiconductors, NV*
1.000%, 12/01/19 | | | 3,627,837 | |
| | 2,200,000 | | | | | ON Semiconductor Corp.
2.625%, 12/15/26 | | | 2,744,852 | |
| | 2,180,000 | | | | | Rovi Corp.^*
0.500%, 03/01/20 | | | 2,118,361 | |
| | 3,800,000 | | | | | Salesforce.com, Inc.
0.250%, 04/01/18 | | | 4,753,610 | |
| | 2,020,000 | | | | | SanDisk Corp.
0.500%, 10/15/20 | | | 2,090,730 | |
| | 1,332,000 | | | | | ServiceNow, Inc.
0.000%, 11/01/18 | | | 1,601,384 | |
| | 2,200,000 | | | | | Twitter, Inc.*
0.250%, 09/15/19 | | | 2,036,298 | |
| | 3,000,000 | | | | | Yahoo!, Inc.
0.000%, 12/01/18 | | | 3,192,705 | |
| | 405,000,000 | | | JPY | | Yaskawa Electric Corp.
0.000%, 03/16/17 | | | 5,024,746 | |
| | | | | | | | | | |
| | | | | | | | | 56,759,983 | |
| | | | | | | | | | |
| | | | | | Materials (2.5%) | |
| | 3,500,000 | | | EUR | | Buzzi Unicem, S.p.A.
1.375%, 07/17/19 | | | 4,735,119 | |
| | 5,025,000 | | | | | Cemex, SAB de CV
3.250%, 03/15/16 | | | 5,829,854 | |
| | | | | | | | | | |
| | | | | | | | | 10,564,973 | |
| | | | | | | | | | |
| | | | | | TOTAL CONVERTIBLE BONDS
(Cost $153,426,761) | | | 157,595,621 | |
| | | | | | | | | | |
| | | | | | | | | | |
| | SYNTHETIC CONVERTIBLE SECURITIES (4.9%)¤ | |
| | Corporate Bonds (4.3%) | |
| | | | | | Consumer Discretionary (2.1%) | |
| | 3,525,000 | | | | | FCA US, LLC
8.250%, 06/15/21 | | | 3,895,125 | |
| | | | |
| 100 | | CALAMOS OPEN-END FAMILY OF FUNDS SEMIANNUAL REPORT | | See accompanying Notes to Schedule of Investments |
Global Growth and Income Fund Schedule of Investments April 30, 2015 (Unaudited)
| | | | | | | | | | |
PRINCIPAL
AMOUNT | | | | | | | VALUE | |
| | 4,400,000 | | | | | L Brands, Inc.
5.625%, 02/15/22 | | $ | 4,818,000 | |
| | | | | | | | | | |
| | | | | | | | | 8,713,125 | |
| | | | | | | | | | |
| | | | | | Energy (0.9%) | |
| | | | | | Cimarex Energy Company | | | | |
| | 2,612,000 | | | | | 4.375%, 06/01/24 | | | 2,649,547 | |
| | 1,030,000 | | | | | 5.875%, 05/01/22 | | | 1,098,238 | |
| | | | | | | | | | |
| | | | | | | | | 3,747,785 | |
| | | | | | | | | | |
| | | | | | Industrials (1.2%) | |
| | | | | | Icahn Enterprises, LP | | | | |
| | 2,725,000 | | | | | 4.875%, 03/15/19 | | | 2,776,094 | |
| | 2,460,000 | | | | | 5.875%, 02/01/22 | | | 2,547,638 | |
| | | | | | | | | | |
| | | | | | | | | 5,323,732 | |
| | | | | | | | | | |
| | | | | | Materials (0.1%) | | | | |
| | 334,000 | | | | | FMG Resources^*
8.250%, 11/01/19 | | | 292,041 | |
| | | | | | | | | | |
| | | | | | TOTAL CORPORATE BONDS | | | 18,076,683 | |
| | | | | | | | | | |
| | | | | | | | | | |
NUMBER OF
CONTRACTS | | | | | | | VALUE | |
| | Purchased Options (0.6%)# | |
| | | | | | Consumer Discretionary (0.1%) | |
| | 1,550 | | | EUR | | Daimler, AG
Call, 06/19/15, Strike 88.00 | | | 539,529 | |
| | | | | | | | | | |
| | | | | | Financials (0.0%) | |
| | 2,300 | | | CHF | | Credit Suisse Group, AG
Call, 06/19/15, Strike 28.00 | | | 19,722 | |
| | | | | | | | | | |
| | | | | | Information Technology (0.1%) | |
| | 900 | | | | | Facebook, Inc.
Call, 06/19/15, Strike $80.00 | | | 204,300 | |
| | | | | | | | | | |
| | | | | | Other (0.4%) | |
| | 6,210 | | | | | iShares MSCI EAFE Index Fund
Put, 06/19/15, Strike $65.00 | | | 605,475 | |
| | 2,930 | | | | | Powershares QQQ Trust Series
Put, 06/30/15, Strike $108.00 | | | 858,490 | |
| | 735 | | | | | SPDR S&P 500 ETF Trust
Put, 06/30/15, Strike $210.00 | | | 408,293 | |
| | | | | | | | | | |
| | | | | | | | | 1,872,258 | |
| | | | | | | | | | |
| | | | | | TOTAL PURCHASED OPTIONS | | | 2,635,809 | |
| | | | | | | | | | |
| | | | | | TOTAL SYNTHETIC CONVERTIBLE SECURITIES
(Cost $22,880,664) | | | 20,712,492 | |
| | | | | | | | | | |
| | | | | | | | | | |
NUMBER OF
SHARES | | | | | | | VALUE | |
| | CONVERTIBLE PREFERRED STOCKS (4.9%) | |
| | | | | | Energy (1.4%) | | | | |
| | 6,488 | | | | | Chesapeake Energy Corp.
5.750% | | | 5,709,440 | |
| | | | | | | | | | |
| | | | | | | | | | |
NUMBER OF
SHARES | | | | | | | VALUE | |
| | | | | | | | | | |
| | | | | | Financials (0.7%) | |
| | 28,600 | | | | | American Tower Corp.
5.250% | | $ | 2,965,248 | |
| | | | | | | | | | |
| | | | | | Health Care (0.8%) | | | | |
| | 3,250 | | | | | Actavis, PLC
5.500% | | | 3,252,145 | |
| | | | | | | | | | |
| | | | | | Industrials (0.7%) | | | | |
| | 51,325 | | | | | United Technologies Corp.
7.500% | | | 3,018,937 | |
| | | | | | | | | | |
| | | | | | Utilities (1.3%) | | | | |
| | 97,500 | | | | | NextEra Energy, Inc.
5.799% | | | 5,546,775 | |
| | | | | | | | | | |
| | | | | | TOTAL CONVERTIBLE PREFERRED STOCKS
(Cost $21,134,558) | | | 20,492,545 | |
| | | | | | | | | | |
| | | | | | | | | | |
| | COMMON STOCKS (49.2%) | |
| | | | | | Consumer Discretionary (10.3%) | |
| | 37,500 | | | | | Comcast Corp. - Class A | | | 2,166,000 | |
| | 25,700 | | | CHF | | Compagnie Financière Richemont, SA | | | 2,290,717 | |
| | 28,000 | | | | | Home Depot, Inc. | | | 2,995,440 | |
| | 37,000 | | | | | Las Vegas Sands Corp. | | | 1,956,560 | |
| | 71,350 | | | ZAR | | Naspers, Ltd. - Class N | | | 11,193,804 | |
| | 81,625 | | | DKK | | Pandora, A/S | | | 8,436,885 | |
| | 37,000 | | | | | Starbucks Corp. | | | 1,834,460 | |
| | 58,800 | | | JPY | | Toyota Motor Corp. | | | 4,093,017 | |
| | 73,000 | | | | | Twenty-First Century Fox, Inc. | | | 2,487,840 | |
| | 28,000 | | | | | Walt Disney Company | | | 3,044,160 | |
| | 125,000 | | | GBP | | WPP, PLC | | | 2,915,186 | |
| | | | | | | | | | |
| | | | | | | | | 43,414,069 | |
| | | | | | | | | | |
| | | | | | Consumer Staples (5.5%) | |
| | 38,500 | | | EUR | | Anheuser-Busch InBev, NV | | | 4,687,311 | |
| | 43,000 | | | GBP | | British American Tobacco, PLC | | | 2,362,576 | |
| | 53,600 | | | | | Coca-Cola Company | | | 2,174,016 | |
| | 146,600 | | | GBP | | Diageo, PLC | | | 4,069,963 | |
| | 69,000 | | | CHF | | Nestlé, SA | | | 5,353,311 | |
| | 22,000 | | | EUR | | Pernod Ricard, SA | | | 2,734,246 | |
| | 19,200 | | | | | Walgreens Boots Alliance, Inc. | | | 1,592,256 | |
| | | | | | | | | | |
| | | | | | | | | 22,973,679 | |
| | | | | | | | | | |
| | | | | | Energy (3.7%) | |
| | 26,000 | | | | | Anadarko Petroleum Corp. | | | 2,446,600 | |
| | 30,000 | | | CAD | | Canadian Natural Resources, Ltd. | | | 996,850 | |
| | 34,597 | | | | | EOG Resources, Inc. | | | 3,423,373 | |
| | 38,450 | | | | | Schlumberger, Ltd. | | | 3,637,755 | |
| | 38,000 | | | EUR | | TOTAL, SA | | | 2,057,698 | |
| | 82,000 | | | CAD | | Tourmaline Oil Corp.# | | | 2,830,071 | |
| | | | | | | | | | |
| | | | | | | | | 15,392,347 | |
| | | | | | | | | | |
| | | | | | |
| See accompanying Notes to Schedule of Investments | | www.calamos.com | | | 101 | |
Global Growth and Income Fund Schedule of Investments April 30, 2015 (Unaudited)
| | | | | | | | | | |
NUMBER OF
SHARES | | | | | | | VALUE | |
| | | | | | | | | | |
| | | | | | Financials (7.0%) | |
| | 556,000 | | | HKD | | AIA Group, Ltd. | | $ | 3,697,667 | |
| | 49,000 | | | | | Arthur J. Gallagher & Company | | | 2,343,670 | |
| | 105,700 | | | | | Citigroup, Inc. | | | 5,635,924 | |
| | 497,000 | | | JPY | | Daiwa Securities Group, Inc. | | | 4,123,021 | |
| | 59,410 | | | EUR | | Deutsche Annington Immobilien, SE | | | 1,994,104 | |
| | 75,000 | | | JPY | | Mitsui Fudosan Company, Ltd. | | | 2,223,323 | |
| | 30,000 | | | | | State Street Corp. | | | 2,313,600 | |
| | 62,000 | | | JPY | | Sumitomo Mitsui Financial Group, Inc. | | | 2,707,205 | |
| | 81,000 | | | | | Wells Fargo & Company | | | 4,463,100 | |
| | | | | | | | | | |
| | | | | | | | | 29,501,614 | |
| | | | | | | | | | |
| | | | | | Health Care (7.6%) | |
| | 5,200 | | | | | Biogen, Inc.# | | | 1,944,436 | |
| | 13,000 | | | | | C.R. Bard, Inc. | | | 2,165,540 | |
| | 16,600 | | | | | Gilead Sciences, Inc.# | | | 1,668,466 | |
| | 72,700 | | | | | Johnson & Johnson | | | 7,211,840 | |
| | 43,500 | | | CHF | | Novartis, AG | | | 4,440,140 | |
| | 28,000 | | | DKK | | Novo Nordisk, A/S - Class B | | | 1,571,939 | |
| | 38,000 | | | EUR | | Sanofi | | | 3,868,039 | |
| | 54,600 | | | GBP | | Shire, PLC | | | 4,436,992 | |
| | 29,000 | | | | | Stryker Corp. | | | 2,674,960 | |
| | 19,500 | | | | | Zimmer Holdings, Inc. | | | 2,141,880 | |
| | | | | | | | | | |
| | | | | | | | | 32,124,232 | |
| | | | | | | | | | |
| | | | | | Industrials (3.1%) | |
| | 28,000 | | | JPY | | FANUC Corp. | | | 6,158,955 | |
| | 318,000 | | | HKD | | Hutchison Whampoa, Ltd. | | | 4,675,146 | |
| | 23,500 | | | | | United Parcel Service, Inc. - Class B | | | 2,362,455 | |
| | | | | | | | | | |
| | | | | | | | | 13,196,556 | |
| | | | | | | | | | |
| | | | | | Information Technology (11.4%) | |
| | 32,900 | | | | | Accenture, PLC - Class A | | | 3,048,185 | |
| | 69,300 | | | | | Apple, Inc. | | | 8,672,895 | |
| | 19,800 | | | | | Baidu, Inc.# | | | 3,965,544 | |
| | 24,500 | | | | | Google, Inc. - Class A# | | | 13,444,865 | |
| | 24,000 | | | | | MasterCard, Inc. - Class A | | | 2,165,040 | |
| | 72,000 | | | | | Microsoft Corp. | | | 3,502,080 | |
| | 1,607 | | | KRW | | Samsung Electronics Co., Ltd. | | | 2,108,149 | |
| | 1,203,000 | | | TWD | | Taiwan Semiconductor Manufacturing Company, Ltd. | | | 5,791,570 | |
| | 250,100 | | | HKD | | Tencent Holdings, Ltd. | | | 5,161,784 | |
| | | | | | | | | | |
| | | | | | | | | 47,860,112 | |
| | | | | | | | | | |
| | | | | | Telecommunication Services (0.6%) | |
| | 40,000 | | | JPY | | SoftBank Corp. | | | 2,500,414 | |
| | | | | | | | | | |
| | | | | | TOTAL COMMON STOCKS
(Cost $180,074,022) | | | 206,963,023 | |
| | | | | | | | | | |
| | | | | | | | | | |
NUMBER OF
SHARES | | | | | | | VALUE | |
| | SHORT TERM INVESTMENT (2.6%) | |
| | 10,815,796 | | | | | Fidelity Prime Money Market Fund - Institutional Class
(Cost $10,815,796) | | $ | 10,815,796 | |
| | | | | | | | | | |
NUMBER OF
SHARES/
PRINCIPAL
AMOUNT | | | | | | | VALUE | |
| INVESTMENT OF CASH COLLATERAL FOR SECURITIES
LOANED (3.1%) |
|
| | | | | | Federal Home Loan Bank Discount Notes | | | | |
| | 2,484,212 | | | | | 0.000%, 05/29/15 | | | 2,484,212 | |
| | 1,552,754 | | | | | 0.000%, 06/10/15 | | | 1,552,754 | |
| | 776,411 | | | | | 0.000%, 05/27/15 | | | 776,411 | |
| | 776,390 | | | | | 0.000%, 06/15/15 | | | 776,390 | |
| | 1,552,680 | | | | | Federal Home Loan Mortgage Corp. Discount Note
0.000%, 06/01/15 | | | 1,552,680 | |
| | 3,084,636 | | | | | Fidelity Prime Money Market Fund - Institutional Class | | | 3,084,636 | |
| | 1,414,794 | | | | | Goldman Sachs Financial Square Fund | | | 1,414,794 | |
| | 1,552,868 | | | | | Morgan Stanley Institutional Liquidity Fund | | | 1,552,868 | |
| | | | | | | | | | |
| | | | | | TOTAL INVESTMENT OF CASH
COLLATERAL FOR SECURITIES
LOANED
(Cost $13,194,745) | | | 13,194,745 | |
| | | | | | | | | | |
| TOTAL INVESTMENTS (102.1%)
(Cost $401,526,546) | | | 429,774,222 | |
| | | | | | | | | | |
| |
| | PAYABLE UPON RETURN OF SECURITIES ON LOAN (-3.1%) | | | (13,194,745 | ) |
| | | | | | | | | | |
| |
| | OTHER ASSETS, LESS LIABILITIES (1.0%) | | | 4,447,981 | |
| | | | | | | | | | |
| |
| | NET ASSETS (100.0%) | | $ | 421,027,458 | |
| | | | | | | | | | |
FORWARD FOREIGN CURRENCY CONTRACTS
| | | | | | | | | | | | | | | | |
COUNTER
PARTY | | LONG
CONTRACTS | | SETTLEMENT
DATE | | LOCAL
CURRENCY | | | CURRENT
VALUE | | | UNREALIZED
GAIN/LOSS | |
| Northern Trust Company | | European Monetary Unit | | 05/29/15 | | | 2,951,000 | | | $ | 3,314,557 | | | $ | 15,625 | |
| | | | | | | | | | | | | | | | |
| | | | | |
| COUNTERPARTY | | SHORT CONTRACTS | | SETTLEMENT DATE | | LOCAL CURRENCY | | | CURRENT
VALUE | | | UNREALIZED
GAIN/LOSS | |
| Brown Brothers Harriman & Company | | European Monetary Unit | | 05/29/15 | | | 9,294,000 | | | $ | 10,439,000 | | | $ | (336,236 | ) |
| | | | | | | | | | | | | | | | |
| | | | |
| 102 | | CALAMOS OPEN-END FAMILY OF FUNDS SEMIANNUAL REPORT | | See accompanying Notes to Schedule of Investments |
Global Growth and Income Fund Schedule of Investments April 30, 2015 (Unaudited)
NOTES TO SCHEDULE OF INVESTMENTS
| § | Securities exchangeable or convertible into securities of one or more entities that are different than the issuer. Each entity is identified in the parenthetical. |
| ^ | Security, or portion of security, is on loan. |
| * | Securities issued and sold pursuant to a Rule 144A transaction are excepted from the registration requirement of the Securities Act of 1933, as amended. These securities may only be sold to qualified institutional buyers (“QIBs”), such as the Fund. Any resale of these securities must generally be effected through a sale that is registered under the Act or otherwise exempted from such registration requirements. |
| ¤ | The synthetic convertible securities strategy combines separate securities that together possess the economic characteristics similar to a convertible security. |
| # | Non-income producing security. |
FOREIGN CURRENCY ABBREVIATIONS
| | |
| CAD | | Canadian Dollar |
| CHF | | Swiss Franc |
| DKK | | Danish Krone |
| EUR | | European Monetary Unit |
| GBP | | British Pound Sterling |
| HKD | | Hong Kong Dollar |
| JPY | | Japanese Yen |
| KRW | | South Korean Won |
| TWD | | New Taiwan Dollar |
| ZAR | | South African Rand |
Note: Value for securities denominated in foreign currencies is shown in U.S. dollars. The principal amount for such securities is shown in the respective foreign currency. The date on options represents the expiration date of the option contract. The option contract may be exercised at any date on or before the date shown.
CURRENCY EXPOSURE
APRIL 30, 2015
| | | | | | | | |
| | | VALUE | | | % OF TOTAL
INVESTMENTS | |
| US Dollar | | $ | 273,770,769 | | | | 63.7% | |
| European Monetary Unit | | | 42,783,037 | | | | 10.0% | |
| Japanese Yen | | | 35,685,721 | | | | 8.3% | |
| British Pound Sterling | | | 18,966,940 | | | | 4.4% | |
| Hong Kong Dollar | | | 13,534,597 | | | | 3.2% | |
| Swiss Franc | | | 12,103,890 | | | | 2.8% | |
| South African Rand | | | 11,193,804 | | | | 2.6% | |
| Danish Krone | | | 10,008,824 | | | | 2.3% | |
| New Taiwan Dollar | | | 5,791,570 | | | | 1.3% | |
| Canadian Dollar | | | 3,826,921 | | | | 0.9% | |
| South Korean Won | | | 2,108,149 | | | | 0.5% | |
| Total Investments | | $ | 429,774,222 | | | | 100.0% | |
Currency exposure may vary over time.
| | | | | | |
| See accompanying Notes to Financial Statements | | www.calamos.com | | | 103 | |
Convertible Fund Schedule of Investments April 30, 2015 (Unaudited)
| | | | | | | | | | |
PRINCIPAL AMOUNT | | | | | | | VALUE | |
| | CONVERTIBLE BONDS (71.4%) | | | | |
| | | | | | Consumer Discretionary (11.0%) | | | | |
| | | | | | Jarden Corp. | | | | |
| | 7,000,000 | | | | | 1.125%, 03/15/34^ | | $ | 8,103,270 | |
| | 1,750,000 | | | | | 1.500%, 06/15/19 | | | 2,426,209 | |
| | 6,100,000 | | | | | Lennar Corp.*
3.250%, 11/15/21 | | | 12,065,221 | |
| | 12,000,000 | | | | | Liberty Interactive, LLC (Time Warner Cable, Inc., Time Warner, Inc.)§
0.750%, 03/30/43 | | | 17,379,840 | |
| | 13,600,000 | | | | | Liberty Media Corp.^
1.375%, 10/15/23 | | | 13,611,832 | |
| | 27,300,000 | | | | | Priceline Group, Inc.
0.350%, 06/15/20 | | | 32,204,581 | |
| | 12,500,000 | | | | | Standard Pacific Corp.
1.250%, 08/01/32 | | | 14,591,125 | |
| | | | | | Tesla Motors, Inc. | | | | |
| | 20,200,000 | | | | | 1.250%, 03/01/21 | | | 18,695,807 | |
| | 6,700,000 | | | | | 0.250%, 03/01/19^ | | | 6,262,457 | |
| | 9,000,000 | | | EUR | | Volkswagen International Finance, NV*
5.500%, 11/09/15 | | | 13,314,583 | |
| | | | | | | | | | |
| | | | | | | | | 138,654,925 | |
| | | | | | | | | | |
| | | | | | Energy (2.9%) | | | | |
| | 1,496,000 | | | | | Hornbeck Offshore Services, Inc.^ 1.500%, 09/01/19 | | | 1,268,481 | |
| | 12,300,000 | | | | | SEACOR Holdings, Inc.
2.500%, 12/15/27 | | | 12,789,970 | |
| | 18,600,000 | | | | | Whiting Petroleum Corp.*
1.250%, 04/01/20 | | | 22,171,665 | |
| | | | | | | | | | |
| | | | | | | | | 36,230,116 | |
| | | | | | | | | | |
| | | | | | Financials (5.1%) | | | | |
| | | | | | Ares Capital Corp. | | | | |
| | 23,000,000 | | | | | 4.750%, 01/15/18 | | | 24,217,390 | |
| | 3,200,000 | | | | | 4.375%, 01/15/19^ | | | 3,360,832 | |
| | 4,200,000 | | | EUR | | Azimut Holding, S.p.A.
2.125%, 11/25/20 | | | 5,953,915 | |
| | 956,000 | | | | | PRA Group, Inc.
3.000%, 08/01/20 | | | 1,030,707 | |
| | 13,450,000 | | | | | Spirit Realty Capital, Inc.^
2.875%, 05/15/19 | | | 13,326,663 | |
| | 10,700,000 | | | | | Starwood Property Trust, Inc.
4.550%, 03/01/18 | | | 11,645,613 | |
| | 5,000,000 | | | | | Starwood Waypoint Residential Trust*
3.000%, 07/01/19 | | | 4,843,250 | |
| | | | | | | | | | |
| | | | | | | | | 64,378,370 | |
| | | | | | | | | | |
| | | | | | Health Care (18.8%) | | | | |
| | 10,800,000 | | | | | Acorda Therapeutics, Inc.
1.750%, 06/15/21 | | | 10,522,494 | |
| | 3,000,000 | | | | | Anacor Pharmaceuticals, Inc.*
2.000%, 10/15/21 | | | 5,400,630 | |
| | 17,600,000 | | | | | Anthem, Inc.
2.750%, 10/15/42 | | | 35,550,856 | |
| | | | | | | | | | |
PRINCIPAL AMOUNT | | | | | | | VALUE | |
| | 4,900,000 | | | | | BioMarin Pharmaceutical, Inc.
0.750%, 10/15/18 | | $ | 6,713,686 | |
| | 6,300,000 | | | | | Cepheid
1.250%, 02/01/21 | | | 7,011,176 | |
| | 8,574,000 | | | | | Depomed, Inc.
2.500%, 09/01/21 | | | 11,794,566 | |
| | 6,400,000 | | | | | Emergent Biosolutions, Inc.
2.875%, 01/15/21 | | | 7,582,208 | |
| | 2,900,000 | | | | | Gilead Sciences, Inc.
1.625%, 05/01/16 | | | 12,803,659 | |
| | 5,900,000 | | | | | HealthSouth Corp.
2.000%, 12/01/43 | | | 7,544,006 | |
| | 13,000,000 | | | | | Hologic, Inc.^‡
2.000%, 03/01/42 | | | 16,278,275 | |
| | 5,430,000 | | | | | Horizon Pharma Investment, Ltd.* 2.500%, 03/15/22 | | | 6,748,377 | |
| | | | | | Illumina, Inc. | | | | |
| | 7,250,000 | | | | | 0.000%, 06/15/19^* | | | 8,079,219 | |
| | 6,950,000 | | | | | 0.500%, 06/15/21^* | | | 8,067,039 | |
| | 3,700,000 | | | | | 0.250%, 03/15/16 | | | 8,154,892 | |
| | 3,700,000 | | | | | Incyte Corp.
0.375%, 11/15/18 | | | 7,082,855 | |
| | 12,900,000 | | | | | Integra LifeSciences Holdings Corp.
1.625%, 12/15/16 | | | 14,549,652 | |
| | 6,600,000 | | | | | Isis Pharmaceuticals, Inc.*
1.000%, 11/15/21 | | | 7,169,943 | |
| | 11,400,000 | | | | | Jazz Pharmaceuticals, PLC^*
1.875%, 08/15/21 | | | 13,660,677 | |
| | 9,733,000 | | | | | Medidata Solutions, Inc.
1.000%, 08/01/18 | | | 11,410,677 | |
| | | | | | Molina Healthcare, Inc. | | | | |
| | 7,100,000 | | | | | 1.625%, 08/15/44 | | | 8,426,138 | |
| | 5,557,000 | | | | | 1.625%, 08/15/44* | | | 6,489,909 | |
| | 2,198,000 | | | | | NuVasive, Inc.
2.750%, 07/01/17 | | | 2,708,639 | |
| | 7,584,000 | | | | | Wright Medical Group, Inc.*
2.000%, 02/15/20 | | | 7,930,323 | |
| | 5,000,000 | | | | | XenoPort, Inc.*
2.500%, 02/01/22 | | | 4,393,500 | |
| | | | | | | | | | |
| | | | | | | | | 236,073,396 | |
| | | | | | | | | | |
| | | | | | Industrials (1.1%) | | | | |
| | 6,300,000 | | | | | Echo Global Logistics, Inc.
2.500%, 05/01/20 | | | 6,457,500 | |
| | 5,135,000 | | | | | Greenbrier Companies, Inc.
3.500%, 04/01/18 | | | 7,876,859 | |
| | | | | | | | | | |
| | | | | | | | | 14,334,359 | |
| | | | | | | | | | |
| | | | | | Information Technology (32.5%) | | | | |
| | 12,300,000 | | | | | AOL, Inc.^*
0.750%, 09/01/19 | | | 12,441,634 | |
| | 12,500,000 | | | | | Citrix Systems, Inc.^*
0.500%, 04/15/19 | | | 13,360,000 | |
| | 4,500,000 | | | | | Electronic Arts, Inc.
0.750%, 07/15/16 | | | 8,243,730 | |
| | | | |
| 104 | | CALAMOS OPEN-END FAMILY OF FUNDS SEMIANNUAL REPORT | | See accompanying Notes to Schedule of Investments |
Convertible Fund Schedule of Investments April 30, 2015 (Unaudited)
| | | | | | | | | | |
PRINCIPAL AMOUNT | | | | | | | VALUE | |
| | 6,800,000 | | | | | Euronet Worldwide, Inc.*
1.500%, 10/01/44 | | $ | 7,430,462 | |
| | 8,100,000 | | | | | Intel Corp.
3.250%, 08/01/39 | | | 13,217,458 | |
| | 12,100,000 | | | | | InvenSense, Inc.
1.750%, 11/01/18 | | | 11,723,993 | |
| | 21,900,000 | | | | | Lam Research Corp.
0.500%, 05/15/16 | | | 27,715,983 | |
| | 13,700,000 | | | | | LinkedIn Corp.*
0.500%, 11/01/19 | | | 15,207,548 | |
| | 12,900,000 | | | | | Microchip Technology, Inc.*
1.625%, 02/15/25 | | | 13,189,024 | |
| | 24,100,000 | | | | | Micron Technology, Inc.
3.000%, 11/15/43 | | | 27,343,860 | |
| | 27,500,000 | | | | | NVIDIA Corp.
1.000%, 12/01/18 | | | 33,572,275 | |
| | 6,800,000 | | | | | NXP Semiconductors, NV*
1.000%, 12/01/19 | | | 7,957,836 | |
| | 10,800,000 | | | | | ON Semiconductor Corp.
2.625%, 12/15/26 | | | 13,474,728 | |
| | 5,150,000 | | | | | Palo Alto Networks, Inc.*
0.000%, 07/01/19 | | | 7,382,113 | |
| | 5,600,000 | | | | | Red Hat, Inc.^*
0.250%, 10/01/19 | | | 6,859,356 | |
| | 13,100,000 | | | | | Rovi Corp.^*
0.500%, 03/01/20 | | | 12,729,597 | |
| | 32,900,000 | | | | | Salesforce.com, Inc.^
0.250%, 04/01/18 | | | 41,156,255 | |
| | 23,500,000 | | | | | SanDisk Corp.
0.500%, 10/15/20 | | | 24,322,852 | |
| | 8,050,000 | | | | | ServiceNow, Inc.
0.000%, 11/01/18 | | | 9,678,032 | |
| | 14,500,000 | | | | | SunEdison, Inc.^*
0.250%, 01/15/20 | | | 16,280,310 | |
| | 8,300,000 | | | | | SunPower Corp.^
0.750%, 06/01/18 | | | 11,806,045 | |
| | 19,700,000 | | | | | Synchronoss Technologies, Inc.
0.750%, 08/15/19 | | | 22,824,420 | |
| | | | | | Twitter, Inc.* | | | | |
| | 13,300,000 | | | | | 1.000%, 09/15/21 | | | 12,095,951 | |
| | 5,830,000 | | | | | 0.250%, 09/15/19 | | | 5,396,190 | |
| | 13,900,000 | | | | | Verint Systems, Inc.^
1.500%, 06/01/21 | | | 16,244,374 | |
| | 5,500,000 | | | | | Workday, Inc.
0.750%, 07/15/18 | | | 6,943,503 | |
| | 8,900,000 | | | | | Yahoo!, Inc.
0.000%, 12/01/18 | | | 9,471,692 | |
| | | | | | | | | | |
| | | | | | | | | 408,069,221 | |
| | | | | | | | | | |
| | | | | | TOTAL CONVERTIBLE BONDS
(Cost $830,681,173) | | | 897,740,387 | |
| | | | | | | | | | |
| | | | | | | | | | |
PRINCIPAL AMOUNT | | | | | | | VALUE | |
| | SYNTHETIC CONVERTIBLE SECURITIES (3.3%)¤ | | | | |
| | Corporate Bonds (2.7%) | | | | |
| | | | | | Consumer Discretionary (1.5%) | | | | |
| | | | | | DISH DBS Corp. | | | | |
| | 3,170,000 | | | | | 5.125%, 05/01/20 | | $ | 3,209,625 | |
| | 2,830,000 | | | | | 5.875%, 07/15/22 | | | 2,860,069 | |
| | 7,000,000 | | | | | GameStop Corp.^*
5.500%, 10/01/19 | | | 7,240,625 | |
| | 5,534,000 | | | | | Outerwall, Inc.
6.000%, 03/15/19 | | | 5,461,366 | |
| | | | | | | | | | |
| | | | | | | | | 18,771,685 | |
| | | | | | | | | | |
| | | | | | Energy (0.6%) | | | | |
| | | | | | Cimarex Energy Company | | | | |
| | 3,092,000 | | | | | 4.375%, 06/01/24 | | | 3,136,447 | |
| | 1,815,000 | | | | | 5.875%, 05/01/22 | | | 1,935,244 | |
| | 2,289,000 | | | | | Rice Energy, Inc.
6.250%, 05/01/22 | | | 2,311,890 | |
| | | | | | | | | | |
| | | | | | | | | 7,383,581 | |
| | | | | | | | | | |
| | | | | | Telecommunication Services (0.6%) | | | | |
| | 7,200,000 | | | | | SBA Communications Corp.*
4.875%, 07/15/22 | | | 7,101,000 | |
| | | | | | | | | | |
| | | | | | TOTAL CORPORATE BONDS | | | 33,256,266 | |
| | | | | | | | | | |
| | | | | | | | | | |
NUMBER OF
CONTRACTS | | | | | | | VALUE | |
| | Purchased Options (0.6%)# | | | | |
| | | | | | Health Care (0.3%) | | | | |
| | 450 | | | | | Biogen, Inc.
Call, 10/16/15, Strike $425.00 | | | 783,000 | |
| | 3,350 | | | | | Mylan, NV
Call, 10/16/15, Strike $70.00 | | | 2,797,250 | |
| | | | | | | | | | |
| | | | | | | | | 3,580,250 | |
| | | | | | | | | | |
| | | | | | Industrials (0.1%) | | | | |
| | 2,750 | | | | | Delta Air Lines, Inc.
Call, 01/15/16, Strike $50.00 | | | 845,625 | |
| | | | | | | | | | |
| | | | | | Information Technology (0.2%) | | | | |
| | 1,680 | | | | | Apple, Inc.
Call, 01/15/16, Strike $125.71 | | | 1,835,400 | |
| | 1,650 | | | | | Twitter, Inc.
Call, 06/19/15, Strike $40.00 | | | 315,150 | |
| | 5,000 | | | | | Xilinx, Inc.
Call, 01/15/16, Strike $45.00 | | | 1,255,000 | |
| | | | | | | | | | |
| | | | | | | | | 3,405,550 | |
| | | | | | | | | | |
| | | | | | TOTAL PURCHASED OPTIONS | | | 7,831,425 | |
| | | | | | | | | | |
| | | | | | TOTAL SYNTHETIC CONVERTIBLE SECURITIES
(Cost $43,236,329) | | | 41,087,691 | |
| | | | | | | | | | |
| | | | | | |
| See accompanying Notes to Schedule of Investments | | www.calamos.com | | | 105 | |
Convertible Fund Schedule of Investments April 30, 2015 (Unaudited)
| | | | | | | | | | |
NUMBER OF
SHARES | | | | | | | VALUE | |
| | CONVERTIBLE PREFERRED STOCKS (24.3%) | | | | |
| | | | | | Consumer Discretionary (0.5%) | | | | |
| | 46,600 | | | | | Fiat Chrysler Automobiles, NV
7.875% | | $ | 5,992,084 | |
| | | | | | | | | | |
| | | | | | Consumer Staples (1.5%) | | | | |
| | 387,000 | | | | | Tyson Foods, Inc.
4.750% | | | 19,036,530 | |
| | | | | | | | | | |
| | | | | | Energy (2.9%) | | | | |
| | 25,800 | | | | | Chesapeake Energy Corp.
5.750% | | | 22,640,000 | |
| | 231,000 | | | | | Southwestern Energy Company
6.250% | | | 13,702,920 | |
| | | | | | | | | | |
| | | | | | | | | 36,342,920 | |
| | | | | | | | | | |
| | | | | | Financials (9.7%) | | | | |
| | 408,022 | | | | | Affiliated Managers Group, Inc.
5.150% | | | 25,118,854 | |
| | 131,000 | | | | | American Tower Corp.
5.250% | | | 13,582,080 | |
| | 22,100 | | | | | Bank of America Corp.
7.250% | | | 25,613,900 | |
| | 105,500 | | | | | Crown Castle International Corp.
4.500% | | | 11,045,850 | |
| | 135,000 | | | | | Health Care REIT, Inc.
6.500% | | | 8,606,250 | |
| | 26,200 | | | | | Wells Fargo & Company
7.500% | | | 31,931,250 | |
| | 111,500 | | | | | Weyerhaeuser Company
6.375% | | | 5,952,985 | |
| | | | | | | | | | |
| | | | | | | | | 121,851,169 | |
| | | | | | | | | | |
| | | | | | Health Care (3.9%) | | | | |
| | 39,425 | | | | | Actavis, PLC
5.500% | | | 39,451,021 | |
| | 75,900 | | | | | Amsurg Corp.
5.250% | | | 9,564,159 | |
| | | | | | | | | | |
| | | | | | | | | 49,015,180 | |
| | | | | | | | | | |
| | | | | | Industrials (2.5%) | | | | |
| | 145,000 | | | | | Stanley Black & Decker, Inc.^
4.750% | | | 19,946,925 | |
| | 207,000 | | | | | United Technologies Corp.
7.500% | | | 12,175,740 | |
| | | | | | | | | | |
| | | | | | | | | 32,122,665 | |
| | | | | | | | | | |
| | | | | | Telecommunication Services (0.6%) | | | | |
| | 113,500 | | | | | T-Mobile USA, Inc.
5.500% | | | 7,076,725 | |
| | | | | | | | | | |
| | | | | | Utilities (2.7%) | | | | |
| | 140,600 | | | | | Dominion Resources, Inc.
6.375% | | | 6,980,790 | |
| | 263,000 | | | | | Exelon Corp.
6.500% | | | 12,958,010 | |
| | | | | | | | | | |
NUMBER OF
SHARES | | | | | | | VALUE | |
| | 250,000 | | | | | NextEra Energy, Inc.
5.799% | | $ | 14,222,500 | |
| | | | | | | | | | |
| | | | | | | | | 34,161,300 | |
| | | | | | | | | | |
| | | | | | TOTAL CONVERTIBLE PREFERRED STOCKS
(Cost $297,305,282) | | | 305,598,573 | |
| | | | | | | | | | |
| | | | | | | | | | |
NUMBER OF
CONTRACTS | | | | | | | VALUE | |
| | PURCHASED OPTIONS (0.1%)# | | | | |
| | | | | | Information Technology (0.1%) | | | | |
| | 1,400 | | | | | Electronic Arts, Inc.
Put, 09/18/15, Strike $55.00 | | | 458,500 | |
| | 460 | | | | | Palo Alto Networks, Inc.
Put, 09/18/15, Strike $145.00 | | | 519,800 | |
| | | | | | | | | | |
| | | | | | TOTAL PURCHASED OPTIONS (Cost $1,064,524) | | | 978,300 | |
| | | | | | | | | | |
| | | | | | | | | | |
NUMBER OF
SHARES | | | | | | | VALUE | |
| | SHORT TERM INVESTMENT (1.5%) | | | | |
| | 18,305,987 | | | | | Fidelity Prime Money Market Fund - Institutional Class (Cost $18,305,987) | | | 18,305,987 | |
| | | | | | | | | | |
| | | | | | | | | | |
NUMBER OF
SHARES/
PRINCIPAL
AMOUNT | | | | | | | VALUE | |
| INVESTMENT OF CASH COLLATERAL FOR SECURITIES
LOANED (6.4%) |
|
| | | | | | Federal Home Loan Bank Discount Notes | | | | |
| | 15,174,711 | | | | | 0.000%, 05/29/15 | | | 15,174,711 | |
| | 9,484,938 | | | | | 0.000%, 06/10/15 | | | 9,484,938 | |
| | 4,742,674 | | | | | 0.000%, 05/27/15 | | | 4,742,674 | |
| | 4,742,544 | | | | | 0.000%, 06/15/15 | | | 4,742,544 | |
| | 9,484,482 | | | | | Federal Home Loan Mortgage Corp. Discount Note
0.000%, 06/01/15 | | | 9,484,482 | |
| | 18,842,371 | | | | | Fidelity Prime Money Market Fund - Institutional Class | | | 18,842,371 | |
| | 8,642,212 | | | | | Goldman Sachs Financial Square Fund | | | 8,642,212 | |
| | 9,485,633 | | | | | Morgan Stanley Institutional Liquidity Fund | | | 9,485,633 | |
| | | | | | | | | | |
| | | | | | TOTAL INVESTMENT OF
CASH COLLATERAL FOR
SECURITIES LOANED
(Cost $80,599,565) | | | 80,599,565 | |
| | | | | | | | | | |
| TOTAL INVESTMENTS (107.0%)
(Cost $1,271,192,860) | | | 1,344,310,503 | |
| | | | | | | | | | |
| |
| | PAYABLE UPON RETURN OF SECURITIES ON LOAN (-6.4%) | | | (80,599,565 | ) |
| | | | | | | | | | |
| |
| | LIABILITIES, LESS OTHER ASSETS (-0.6%) | | | (7,131,933 | ) |
| | | | | | | | | | |
| |
| | NET ASSETS (100.0%) | | $ | 1,256,579,005 | |
| | | | | | | | | | |
| | | | |
| 106 | | CALAMOS OPEN-END FAMILY OF FUNDS SEMIANNUAL REPORT | | See accompanying Notes to Schedule of Investments |
Convertible Fund Schedule of Investments April 30, 2015 (Unaudited)
| | | | | | | | | | |
NUMBER OF
CONTRACTS | | | | | | | VALUE | |
| | WRITTEN OPTION (0.0%)# | | | | |
| | | | | | Information Technology (0.0%) | | | | |
| | 460 | | | | | Palo Alto Networks, Inc. Put, 09/18/15, Strike $125.00 (Premium $168,568) | | $ | (179,400 | ) |
| | | | | | | | | | |
FORWARD FOREIGN CURRENCY CONTRACTS
| | | | | | | | | | | | | | | | |
| COUNTERPARTY | | SHORT
CONTRACTS | | SETTLEMENT
DATE | | LOCAL
CURRENCY | | | CURRENT
VALUE | | | UNREALIZED
GAIN/LOSS | |
| Citibank N.A. | | European Monetary Unit | | 07/23/15 | | | 17,118,000 | | | $ | 19,241,177 | | | $ | (833,815 | ) |
| Northern Trust Company | | Mexican Peso | | 07/23/15 | | | — | | | | — | | | | 29,286 | |
| | | | | | | | | | | | | | | | |
| | | | | | | | | | | | | | $ | (804,529 | ) |
| | | | | | | | | | | | | | | | |
NOTES TO SCHEDULE OF INVESTMENTS
| ^ | Security, or portion of security, is on loan. |
| * | Securities issued and sold pursuant to a Rule 144A transaction are excepted from the registration requirement of the Securities Act of 1933, as amended. These securities may only be sold to qualified institutional buyers (“QIBs”), such as the Fund. Any resale of these securities must generally be effected through a sale that is registered under the Act or otherwise exempted from such registration requirements. |
| § | Securities exchangeable or convertible into securities of one or more entities that are different than the issuer. Each entity is identified in the parenthetical. |
| ‡ | Variable rate or step bond security. The rate shown is the rate in effect at April 30, 2015. |
| ¤ | The synthetic convertible securities strategy combines separate securities that together possess the economic characteristics similar to a convertible security. |
| # | Non-income producing security. |
FOREIGN CURRENCY ABBREVIATION
| | |
| EUR | | European Monetary Unit |
Note: Value for securities denominated in foreign currencies is shown in U.S. dollars. The principal amount for such securities is shown in the respective foreign currency. The date on options represents the expiration date of the option contract. The option contract may be exercised at any date on or before the date shown.
| | | | | | |
| See accompanying Notes to Financial Statements | | www.calamos.com | | | 107 | |
Global Convertible Fund Schedule of Investments April 30, 2015 (Unaudited)
| | | | | | | | | | |
PRINCIPAL
AMOUNT | | | | | | | VALUE | |
| | CONVERTIBLE BONDS (41.7%) | |
| | | | | | Consumer Discretionary (4.5%) | |
| | 75,000 | | | | | Liberty Media Corp.
1.375%, 10/15/23 | | $ | 75,065 | |
| | | | | | Priceline Group, Inc. | | | | |
| | 125,000 | | | | | 0.900%, 09/15/21* | | | 124,292 | |
| | 70,000 | | | | | 1.000%, 03/15/18 | | | 98,056 | |
| | 50,000 | | | EUR | | Steinhoff Finance Holding, GmbH
4.500%, 03/31/18 | | | 98,400 | |
| | | | | | Tesla Motors, Inc. | | | | |
| | 100,000 | | | | | 1.250%, 03/01/21 | | | 92,554 | |
| | 60,000 | | | | | 0.250%, 03/01/19 | | | 56,082 | |
| | 100,000 | | | EUR | | Volkswagen International Finance, NV*
5.500%, 11/09/15 | | | 147,940 | |
| | | | | | | | | | |
| | | | | | | | | 692,389 | |
| | | | | | | | | | |
| | | | | | Energy (1.5%) | |
| | 96,000 | | | EUR | | Technip, SA
0.500%, 01/01/16 | | | 90,471 | |
| | 115,000 | | | | | Whiting Petroleum Corp.*
1.250%, 04/01/20 | | | 137,083 | |
| | | | | | | | | | |
| | | | | | | | | 227,554 | |
| | | | | | | | | | |
| | | | | | Financials (9.1%) | |
| | | | | | Ares Capital Corp. | | | | |
| | 75,000 | | | | | 5.750%, 02/01/16 | | | 77,364 | |
| | 35,000 | | | | | 4.750%, 01/15/18 | | | 36,853 | |
| | 200,000 | | | | | AYC Finance, Ltd.
0.500%, 05/02/19 | | | 228,264 | |
| | 100,000 | | | EUR | | Azimut Holding, S.p.A.
2.125%, 11/25/20 | | | 141,760 | |
| | 180,000 | | | EUR | | Credit Agricole, SA
0.000%, 12/06/16 | | | 152,694 | |
| | 200,000 | | | EUR | | Cromwell SPV Finance Pty, Ltd.
2.000%, 02/04/20 | | | 229,181 | |
| | 200,000 | | | EUR | | Magyar Nemzeti Vagyonkezelo Zrt
3.375%, 04/02/19 | | | 247,717 | |
| | 20,000 | | | | | PRA Group, Inc.
3.000%, 08/01/20 | | | 21,563 | |
| | 110,000 | | | | | Prospect Capital Corp.~
5.375%, 10/15/17 | | | 113,247 | |
| | 45,000 | | | | | Starwood Property Trust, Inc.
4.550%, 03/01/18 | | | 48,977 | |
| | 100,000 | | | | | Yamaguchi Financial Group
1.000%, 03/26/20 | | | 108,829 | |
| | | | | | | | | | |
| | | | | | | | | 1,406,449 | |
| | | | | | | | | | |
| | | | | | Health Care (5.2%) | |
| | 55,000 | | | | | Acorda Therapeutics, Inc.
1.750%, 06/15/21 | | | 53,587 | |
| | 40,000 | | | | | Anthem, Inc.~
2.750%, 10/15/42 | | | 80,797 | |
| | | | | | BioMarin Pharmaceutical, Inc. | | | | |
| | 20,000 | | | | | 1.500%, 10/15/20 | | | 28,105 | |
| | 20,000 | | | | | 0.750%, 10/15/18 | | | 27,403 | |
| | | | | | | | | | |
PRINCIPAL
AMOUNT | | | | | | | VALUE | |
| | 65,000 | | | | | Cepheid
1.250%, 02/01/21 | | $ | 72,338 | |
| | 41,000 | | | | | Emergent Biosolutions, Inc.
2.875%, 01/15/21 | | | 48,574 | |
| | 64,000 | | | EUR | | Groupe Artémis
3.250%, 01/01/16 | | | 126,427 | |
| | 50,000 | | | | | Hologic, Inc.‡
2.000%, 12/15/37 | | | 75,217 | |
| | | | | | Illumina, Inc.*~ | | | | |
| | 50,000 | | | | | 0.500%, 06/15/21 | | | 58,036 | |
| | 50,000 | | | | | 0.000%, 06/15/19 | | | 55,719 | |
| | 30,000 | | | | | Integra LifeSciences Holdings Corp.
1.625%, 12/15/16 | | | 33,836 | |
| | 110,000 | | | | | Molina Healthcare, Inc.*
1.625%, 08/15/44 | | | 128,467 | |
| | 22,000 | | | | | NuVasive, Inc.
2.750%, 07/01/17 | | | 27,111 | |
| | | | | | | | | | |
| | | | | | | | | 815,617 | |
| | | | | | | | | | |
| | | | | | Industrials (3.3%) | |
| | 100,000 | | | GBP | | Carillion Finance Jersey, Ltd.
2.500%, 12/19/19 | | | 161,944 | |
| | 200,000 | | | | | MISUMI Group, Inc.
0.000%, 10/22/18 | | | 228,243 | |
| | 5,000,000 | | | JPY | | Nidec Corp.
0.000%, 09/18/15 | | | 70,292 | |
| | 40,000 | | | | | Trinity Industries, Inc.~
3.875%, 06/01/36 | | | 51,963 | |
| | | | | | | | | | |
| | | | | | | | | 512,442 | |
| | | | | | | | | | |
| | | | | | Information Technology (16.0%) | |
| | 10,000,000 | | | JPY | | Alps Electric Company, Ltd.
0.000%, 03/25/19 | | | 138,160 | |
| | 130,000 | | | | | AOL, Inc.*
0.750%, 09/01/19 | | | 131,497 | |
| | 155,000 | | | | | Citrix Systems, Inc.*~
0.500%, 04/15/19 | | | 165,664 | |
| | 10,000 | | | | | Cornerstone OnDemand, Inc.
1.500%, 07/01/18 | | | 9,776 | |
| | 100,000 | | | | | Epistar Corp.
0.000%, 08/07/18 | | | 103,399 | |
| | 43,000 | | | | | Euronet Worldwide, Inc.*
1.500%, 10/01/44 | | | 46,987 | |
| | 50,000 | | | | | Finisar Corp.
0.500%, 12/15/33 | | | 50,609 | |
| | 75,000 | | | | | LinkedIn Corp.*~
0.500%, 11/01/19 | | | 83,253 | |
| | 25,000 | | | | | Mentor Graphics Corp.
4.000%, 04/01/31 | | | 31,280 | |
| | 100,000 | | | | | Microchip Technology, Inc.*
1.625%, 02/15/25 | | | 102,241 | |
| | 55,000 | | | | | Micron Technology, Inc.
3.000%, 11/15/43 | | | 62,403 | |
| | 150,000 | | | | | NVIDIA Corp.~
1.000%, 12/01/18 | | | 183,121 | |
| | | | |
| 108 | | CALAMOS OPEN-END FAMILY OF FUNDS SEMIANNUAL REPORT | | See accompanying Notes to Schedule of Investments |
Global Convertible Fund Schedule of Investments April 30, 2015 (Unaudited)
| | | | | | | | | | |
PRINCIPAL
AMOUNT | | | | | | | VALUE | |
| | 200,000 | | | | | NXP Semiconductors, NV*
1.000%, 12/01/19 | | $ | 234,054 | |
| | 20,000 | | | | | Palo Alto Networks, Inc.*
0.000%, 07/01/19 | | | 28,668 | |
| | 200,000 | | | | | Qihoo 360 Technology Company, Ltd.*
1.750%, 08/15/21 | | | 171,230 | |
| | 80,000 | | | | | Red Hat, Inc.*~
0.250%, 10/01/19 | | | 97,991 | |
| | 35,000 | | | | | Rovi Corp.*
0.500%, 03/01/20 | | | 34,010 | |
| | 130,000 | | | | | Salesforce.com, Inc.
0.250%, 04/01/18 | | | 162,624 | |
| | 145,000 | | | | | SanDisk Corp.~
0.500%, 10/15/20 | | | 150,077 | |
| | 85,000 | | | | | ServiceNow, Inc.
0.000%, 11/01/18 | | | 102,190 | |
| | 70,000 | | | | | SunEdison, Inc.*
0.250%, 01/15/20 | | | 78,595 | |
| | 40,000 | | | | | Synchronoss Technologies, Inc.
0.750%, 08/15/19 | | | 46,344 | |
| | 50,000 | | | | | Take-Two Interactive Software, Inc.
1.000%, 07/01/18 | | | 62,674 | |
| | | | | | Twitter, Inc.*~ | | | | |
| | 75,000 | | | | | 1.000%, 09/15/21 | | | 68,210 | |
| | 75,000 | | | | | 0.250%, 09/15/19 | | | 69,419 | |
| | 5,000,000 | | | JPY | | Yaskawa Electric Corp.
0.000%, 03/16/17 | | | 62,034 | |
| | | | | | | | | | |
| | | | | | | | | 2,476,510 | |
| | | | | | | | | | |
| | | | | | Materials (0.7%) | |
| | 100,000 | | | | | Cemex, SAB de CV
3.250%, 03/15/16 | | | 116,017 | |
| | | | | | | | | | |
| | | | | | Telecommunication Services (1.4%) | |
| | 200,000 | | | | | Billion Express Investments, Ltd.
0.750%, 10/18/15 | | | 213,538 | |
| | | | | | | | | | |
| | | | | | TOTAL CONVERTIBLE BONDS
(Cost $6,362,423) | | | 6,460,516 | |
| | | | | | | | | | |
| | SYNTHETIC CONVERTIBLE SECURITIES (5.1%)¤ | |
| | Corporate Bonds (4.4%) | |
| | | | | | Consumer Discretionary (1.3%) | |
| | 50,000 | | | | | D.R. Horton, Inc.
3.750%, 03/01/19 | | | 50,719 | |
| | 25,000 | | | | | GameStop Corp.*
5.500%, 10/01/19 | | | 25,859 | |
| | 75,000 | | | | | Mediacom Broadband, LLC / Mediacom Broadband Corp.
5.500%, 04/15/21 | | | 76,312 | |
| | 50,000 | | | | | Ryland Group, Inc.
6.625%, 05/01/20 | | | 54,938 | |
| | | | | | | | | | |
| | | | | | | | | 207,828 | |
| | | | | | | | | | |
| | | | | | | | | | |
PRINCIPAL
AMOUNT | | | | | | | VALUE | |
| | | | | | | | | | |
| | | | | | Energy (0.2%) | |
| | 25,000 | | | | | Gulfport Energy Corp.
7.750%, 11/01/20 | | $ | 26,453 | |
| | | | | | | | | | |
| | | | | | Health Care (0.4%) | |
| | 50,000 | | | | | HCA Holdings, Inc.
6.250%, 02/15/21 | | | 54,781 | |
| | | | | | | | | | |
| | | | | | Industrials (0.8%) | |
| | 70,000 | | | | | Icahn Enterprises, LP
4.875%, 03/15/19 | | | 71,313 | |
| | 50,000 | | | | | United Continental Holdings, Inc.
6.375%, 06/01/18 | | | 53,469 | |
| | | | | | | | | | |
| | | | | | | | | 124,782 | |
| | | | | | | | | | |
| | | | | | Materials (1.1%) | |
| | 50,000 | | | | | Chemtura Corp.
5.750%, 07/15/21 | | | 51,750 | |
| | 100,000 | | | EUR | | Huntsman International, LLC
5.125%, 04/15/21 | | | 119,794 | |
| | | | | | | | | | |
| | | | | | | | | 171,544 | |
| | | | | | | | | | |
| | | | | | Telecommunication Services (0.6%) | |
| | 38,000 | | | | | Sprint Corp.
7.250%, 09/15/21 | | | 38,261 | |
| | 50,000 | | | | | T-Mobile USA, Inc.
6.250%, 04/01/21 | | | 52,250 | |
| | | | | | | | | | |
| | | | | | | | | 90,511 | |
| | | | | | | | | | |
| | | | | | TOTAL CORPORATE BONDS | | | 675,899 | |
| | | | | | | | | | |
| | | | | | | | | | |
NUMBER OF
CONTRACTS | | | | | | | VALUE | |
| | | | | | | | | | |
| | Purchased Options (0.7%)# | |
| | | | | | Consumer Discretionary (0.1%) | |
| | 24 | | | EUR | | Daimler, AG
Call, 06/19/15, Strike 88.00 | | | 8,354 | |
| | 16 | | | | | Lennar Corp.
Call, 05/15/15, Strike $45.00 | | | 2,368 | |
| | 11 | | | | | Toyota Motor Corp.
Call, 07/17/15, Strike $135.00 | | | 7,645 | |
| | | | | | | | | | |
| | | | | | | | | 18,367 | |
| | | | | | | | | | |
| | | | | | Financials (0.0%) | |
| | 18 | | | | | American International Group, Inc.
Call, 01/15/16, Strike $57.50 | | | 5,805 | |
| | | | | | | | | | |
| | | | | | Health Care (0.2%) | |
| | 3 | | | | | Biogen, Inc.
Call, 10/16/15, Strike $425.00 | | | 5,220 | |
| | 22 | | | | | Mylan, NV
Call, 07/17/15, Strike $62.50 | | | 26,400 | |
| | | | | | | | | | |
| | | | | | | | | 31,620 | |
| | | | | | | | | | |
| | | | | | Industrials (0.2%) | |
| | 33 | | | EUR | | Airbus Group, NV
Call, 06/19/15, Strike 60.00 | | | 14,154 | |
| | | | | | |
| See accompanying Notes to Schedule of Investments | | www.calamos.com | | | 109 | |
Global Convertible Fund Schedule of Investments April 30, 2015 (Unaudited)
| | | | | | | | | | |
NUMBER OF
CONTRACTS | | | | | | | VALUE | |
| | 10 | | | GBP | | International Consolidated Airlines Group, SA
Call, 07/17/15, Strike 5.60 | | $ | 4,490 | |
| | 14 | | | EUR | | Siemens, AG
Call, 06/19/15, Strike 96.00 | | | 7,640 | |
| | | | | | | | �� | | |
| | | | | | | | | 26,284 | |
| | | | | | | | | | |
| | | | | | Information Technology (0.2%) | |
| | 7 | | | | | Apple, Inc.
Call, 01/15/16, Strike $125.71 | | | 7,648 | |
| | 9 | | | | | Lam Research Corp.
Call, 06/19/15, Strike $80.00 | | | 990 | |
| | 75 | | | | | Taiwan Semiconductor Manufacturing Company, Ltd.
Call, 07/17/15, Strike $25.00 | | | 6,750 | |
| | 30 | | | | | Xilinx, Inc.
Call, 01/15/16, Strike $45.00 | | | 7,530 | |
| | | | | | | | | | |
| | | | | | | | | 22,918 | |
| | | | | | | | | | |
| | | | | | TOTAL PURCHASED OPTIONS | | | 104,994 | |
| | | | | | | | | | |
| | | | | | TOTAL SYNTHETIC CONVERTIBLE SECURITIES
(Cost $773,976) | | | 780,893 | |
| | | | | | | | | | |
| | | | | | | | | | |
NUMBER OF
SHARES | | | | | | | VALUE | |
| | CONVERTIBLE PREFERRED STOCKS (6.6%) | |
| | | | | | Energy (0.6%) | |
| | 1,500 | | | | | Southwestern Energy Company
6.250% | | | 88,980 | |
| | | | | | | | | | |
| | | | | | Financials (3.2%) | |
| | 610 | | | | | American Tower Corp.
5.250% | | | 63,245 | |
| | 135 | | | | | Bank of America Corp.
7.250% | | | 156,465 | |
| | 655 | | | | | Crown Castle International Corp.
4.500% | | | 68,579 | |
| | 170 | | | | | Wells Fargo & Company
7.500% | | | 207,187 | |
| | | | | | | | | | |
| | | | | | | | | 495,476 | |
| | | | | | | | | | |
| | | | | | Health Care (1.0%) | |
| | 155 | | | | | Actavis, PLC
5.500% | | | 155,102 | |
| | | | | | | | | | |
| | | | | | Industrials (1.0%) | |
| | 2,625 | | | | | United Technologies Corp.
7.500% | | | 154,402 | |
| | | | | | | | | | |
| | | | | | Utilities (0.8%) | |
| | 905 | | | | | Exelon Corp.
6.500% | | | 44,589 | |
| | | | | | | | | | |
NUMBER OF
SHARES | | | | | | | VALUE | |
| | 1,405 | | | | | NextEra Energy, Inc.
5.799% | | $ | 79,931 | |
| | | | | | | | | | |
| | | | | | | | | 124,520 | |
| | | | | | | | | | |
| | | | | | TOTAL CONVERTIBLE PREFERRED STOCKS
(Cost $1,031,463) | | | 1,018,480 | |
| | | | | | | | | | |
| | COMMON STOCKS (0.5%) | |
| | | | | | Consumer Discretionary (0.5%) | |
| | 4,037 | | | | | MGM Resorts International#
(Cost $89,196) | | | 85,383 | |
| | | | | | | | | | |
| | SHORT TERM INVESTMENT (4.4%) | |
| | 691,197 | | | | | Fidelity Prime Money Market Fund - Institutional Class
(Cost $691,197) | | | 691,197 | |
| | | | | | | | | | |
| TOTAL INVESTMENTS (58.3%)
(Cost $8,948,255) | | | 9,036,469 | |
| | | | | | | | | | |
| |
| | OTHER ASSETS, LESS LIABILITIES (41.7%) | | | 6,463,239 | |
| | | | | | | | | | |
| |
| | NET ASSETS (100.0%) | | $ | 15,499,708 | |
| | | | | | | | | | |
NOTES TO SCHEDULE OF INVESTMENTS
| * | Securities issued and sold pursuant to a Rule 144A transaction are excepted from the registration requirement of the Securities Act of 1933, as amended. These securities may only be sold to qualified institutional buyers (“QIBs”), such as the Fund. Any resale of these securities must generally be effected through a sale that is registered under the Act or otherwise exempted from such registration requirements. |
| ~ | Security, or portion of security, is segregated as collateral for written options. The aggregate value of such securities is $733,931. |
| ‡ | Variable rate or step bond security. The rate shown is the rate in effect at April 30, 2015. |
| ¤ | The synthetic convertible securities strategy combines separate securities that together possess the economic characteristics similar to a convertible security. |
| # | Non-income producing security. |
FOREIGN CURRENCY ABBREVIATIONS
| | |
| EUR | | European Monetary Unit |
| GBP | | British Pound Sterling |
| JPY | | Japanese Yen |
Note: Value for securities denominated in foreign currencies is shown in U.S. dollars. The principal amount for such securities is shown in the respective foreign currency. The date on options represents the expiration date of the option contract. The option contract may be exercised at any date on or before the date shown.
| | | | |
| 110 | | CALAMOS OPEN-END FAMILY OF FUNDS SEMIANNUAL REPORT | | See accompanying Notes to Financial Statements |
Global Convertible Fund Schedule of Investments April 30, 2015 (Unaudited)
CURRENCY EXPOSURE
APRIL 30, 2015
| | | | | | | | |
| | | VALUE | | | % OF TOTAL
INVESTMENTS | |
| US Dollar | | $ | 7,215,017 | | | | 79.9% | |
| European Monetary Unit | | | 1,384,532 | | | | 15.3% | |
| Japanese Yen | | | 270,486 | | | | 3.0% | |
| British Pound Sterling | | | 166,434 | | | | 1.8% | |
| Total Investments | | $ | 9,036,469 | | | | 100.0% | |
Currency exposure may vary over time.
| | | | | | |
| See accompanying Notes to Financial Statements | | www.calamos.com | | | 111 | |
Total Return Bond Fund Schedule of Investments April 30, 2015 (Unaudited)
| | | | | | | | | | |
PRINCIPAL
AMOUNT | | | | | | | VALUE | |
| | CORPORATE BONDS (88.4%) | |
| | | | | | Consumer Discretionary (15.8%) | |
| | 1,000,000 | | | | | British Telecommunications, PLC
2.350%, 02/14/19 | | $ | 1,015,310 | |
| | 1,000,000 | | | | | Carnival Corp.
3.950%, 10/15/20 | | | 1,064,555 | |
| | 500,000 | | | | | CCO Holdings, LLC / CCO Holdings Capital Corp.
6.625%, 01/31/22 | | | 533,437 | |
| | 500,000 | | | | | DISH DBS Corp.
4.250%, 04/01/18 | | | 510,000 | |
| | 500,000 | | | | | Expedia, Inc.
5.950%, 08/15/20 | | | 563,810 | |
| | 500,000 | | | | | FCA US, LLC
8.000%, 06/15/19 | | | 523,225 | |
| | 700,000 | | | | | Ford Motor Credit Company, LLC
5.875%, 08/02/21 | | | 818,730 | |
| | 500,000 | | | | | GameStop Corp.*
5.500%, 10/01/19 | | | 517,188 | |
| | 1,000,000 | | | | | Harley-Davidson Financial Services, Inc.*
2.150%, 02/26/20 | | | 1,007,390 | |
| | 1,000,000 | | | | | Interpublic Group of Companies, Inc.
2.250%, 11/15/17 | | | 1,011,600 | |
| | 500,000 | | | | | Lennar Corp.
4.500%, 06/15/19 | | | 519,688 | |
| | 1,000,000 | | | | | Macy’s, Inc.
3.875%, 01/15/22 | | | 1,063,980 | |
| | 500,000 | | | | | Mattel, Inc.
2.350%, 05/06/19 | | | 498,860 | |
| | 375,000 | | | | | Netflix, Inc.*
5.500%, 02/15/22 | | | 395,391 | |
| | 1,000,000 | | | | | Ralph Lauren Corp.
2.125%, 09/26/18 | | | 1,015,255 | |
| | 500,000 | | | | | Toll Brothers Finance Corp.
5.625%, 01/15/24 | | | 545,312 | |
| | 500,000 | | | | | ZF North America Capital, Inc.*
4.500%, 04/29/22 | | | 502,500 | |
| | | | | | | | | | |
| | | | | | | | | 12,106,231 | |
| | | | | | | | | | |
| | | | | | Consumer Staples (3.3%) | |
| | 1,000,000 | | | | | Diageo, PLC
1.500%, 05/11/17 | | | 1,010,115 | |
| | 500,000 | | | | | Smithfield Foods, Inc.*
5.250%, 08/01/18 | | | 513,125 | |
| | 1,000,000 | | | | | WM Wrigley Jr. Company*
3.375%, 10/21/20 | | | 1,045,670 | |
| | | | | | | | | | |
| | | | | | | | | 2,568,910 | |
| | | | | | | | | | |
| | | | | | Energy (7.8%) | |
| | 1,000,000 | | | | | Chevron Corp.
1.961%, 03/03/20 | | | 1,007,040 | |
| | | | | | Cimarex Energy Company | | | | |
| | 277,000 | | | | | 4.375%, 06/01/24 | | | 280,982 | |
| | 265,000 | | | | | 5.875%, 05/01/22 | | | 282,556 | |
| | | | | | | | | | |
PRINCIPAL
AMOUNT | | | | | | | VALUE | |
| | 1,000,000 | | | | | Exxon Mobil Corp.
2.709%, 03/06/25 | | $ | 1,007,045 | |
| | 814,000 | | | | | Frontier Oil Corp.
6.875%, 11/15/18 | | | 842,234 | |
| | 1,000,000 | | | | | Hess Corp.
8.125%, 02/15/19 | | | 1,198,480 | |
| | 265,000 | | | | | Rowan Companies, Inc.
7.875%, 08/01/19 | | | 298,672 | |
| | 500,000 | | | | | SESI, LLC
7.125%, 12/15/21 | | | 527,670 | |
| | 500,000 | | | | | Tennessee Gas Pipeline Company
8.000%, 02/01/16 | | | 524,865 | |
| | | | | | | | | | |
| | | | | | | | | 5,969,544 | |
| | | | | | | | | | |
| | | | | | Financials (20.4%) | |
| | 1,000,000 | | | | | American Tower Corp.
5.900%, 11/01/21 | | | 1,146,285 | |
| | 1,000,000 | | | | | AON Corp.
5.000%, 09/30/20 | | | 1,122,085 | |
| | 1,500,000 | | | | | Bank of America Corp.
4.125%, 01/22/24 | | | 1,587,832 | |
| | 1,000,000 | | | | | Bank of New York Mellon Corp.
2.300%, 09/11/19 | | | 1,016,070 | |
| | 1,000,000 | | | | | BB&T Corp.
2.850%, 04/01/21 | | | 1,029,690 | |
| | 1,000,000 | | | | | Berkshire Hathaway Finance Corp.
2.900%, 10/15/20 | | | 1,051,180 | |
| | 1,000,000 | | | | | Fifth Third Bancorp
2.300%, 03/01/19 | | | 1,010,560 | |
| | 1,000,000 | | | | | Franklin Resources, Inc.
2.850%, 03/30/25 | | | 993,670 | |
| | 1,000,000 | | | | | Goldman Sachs Group, Inc.
2.625%, 01/31/19 | | | 1,019,380 | |
| | | | | | JPMorgan Chase & Company | | | | |
| | 1,500,000 | | | | | 3.875%, 09/10/24 | | | 1,520,558 | |
| | 500,000 | | | | | 3.875%, 02/01/24 | | | 524,790 | |
| | 1,000,000 | | | | | Simon Property Group, LP
3.375%, 10/01/24 | | | 1,028,295 | |
| | 1,000,000 | | | | | US Bancorp^
3.600%, 09/11/24 | | | 1,038,740 | |
| | 1,500,000 | | | | | Wells Fargo & Company
4.125%, 08/15/23 | | | 1,596,990 | |
| | | | | | | | | | |
| | | | | | | | | 15,686,125 | |
| | | | | | | | | | |
| | | | | | Health Care (8.6%) | |
| | 1,000,000 | | | | | AbbVie, Inc.
1.750%, 11/06/17 | | | 1,005,735 | |
| | 1,000,000 | | | | | Actavis, PLC
1.875%, 10/01/17 | | | 1,003,840 | |
| | 1,000,000 | | | | | Celgene Corp.
1.900%, 08/15/17 | | | 1,012,280 | |
| | 1,000,000 | | | | | Edwards Lifesciences Corp.
2.875%, 10/15/18 | | | 1,026,335 | |
| | 1,000,000 | | | | | Express Scripts Holding Company
2.650%, 02/15/17 | | | 1,023,795 | |
| | | | |
| 112 | | CALAMOS OPEN-END FAMILY OF FUNDS SEMIANNUAL REPORT | | See accompanying Notes to Schedule of Investments |
Total Return Bond Fund Schedule of Investments April 30, 2015 (Unaudited)
| | | | | | | | | | |
PRINCIPAL
AMOUNT | | | | | | | VALUE | |
| | 500,000 | | | | | HCA, Inc.
3.750%, 03/15/19 | | $ | 514,687 | |
| | 1,000,000 | | | | | Thermo Fisher Scientific, Inc.
1.850%, 01/15/18 | | | 1,006,885 | |
| | | | | | | | | | |
| | | | | | | | | 6,593,557 | |
| | | | | | | | | | |
| | | | | | Industrials (8.1%) | |
| | 500,000 | | | | | AerCap Ireland Capital, Ltd. / AerCap Global Aviation Trust*
5.000%, 10/01/21 | | | 537,187 | |
| | 1,000,000 | | | | | Eaton Corp.
1.500%, 11/02/17 | | | 1,006,290 | |
| | 500,000 | | | | | Icahn Enterprises, LP
4.875%, 03/15/19 | | | 509,375 | |
| | 1,000,000 | | | | | PACCAR Financial Corp.
1.600%, 03/15/17 | | | 1,012,865 | |
| | 1,000,000 | | | | | Parker-Hannifin Corp.
5.500%, 05/15/18 | | | 1,119,120 | |
| | 1,000,000 | | | | | Roper Industries, Inc.
1.850%, 11/15/17 | | | 1,008,125 | |
| | 500,000 | | | | | Southwest Airlines Company
2.750%, 11/06/19 | | | 510,910 | |
| | 500,000 | | | | | Verisk Analytics, Inc.
4.125%, 09/12/22 | | | 521,955 | |
| | | | | | | | | | |
| | | | | | | | | 6,225,827 | |
| | | | | | | | | | |
| | | | | | Information Technology (12.1%) | | | | |
| | 500,000 | | | | | Activision Blizzard, Inc.*
5.625%, 09/15/21 | | | 535,000 | |
| | 500,000 | | | | | Alibaba Group Holding, Ltd.*
3.125%, 11/28/21 | | | 500,655 | |
| | 500,000 | | | | | Alliance Data Systems Corp.*
5.375%, 08/01/22 | | | 506,250 | |
| | 1,000,000 | | | | | Amphenol Corp.
4.000%, 02/01/22 | | | 1,060,605 | |
| | 500,000 | | | | | Anixter, Inc.
5.625%, 05/01/19 | | | 540,312 | |
| | 1,000,000 | | | | | Apple, Inc.
2.150%, 02/09/22 | | | 984,110 | |
| | 500,000 | | | | | CDW, LLC / CDW Finance Corp.
5.000%, 09/01/23 | | | 516,250 | |
| | 500,000 | | | | | eBay, Inc.
3.250%, 10/15/20 | | | 518,740 | |
| | 500,000 | | | | | Equinix, Inc.
5.375%, 01/01/22 | | | 521,250 | |
| | 500,000 | | | | | Fiserv, Inc.
3.500%, 10/01/22 | | | 514,025 | |
| | 1,000,000 | | | | | Juniper Networks, Inc.
3.100%, 03/15/16 | | | 1,017,895 | |
| | 500,000 | | | | | Nuance Communications, Inc.*
5.375%, 08/15/20 | | | 507,500 | |
| | 1,000,000 | | | | | Oracle Corp.
2.250%, 10/08/19 | | | 1,018,380 | |
| | | | | | | | | | |
PRINCIPAL
AMOUNT | | | | | | | VALUE | |
| | 500,000 | | | | | Seagate Technology, PLC
3.750%, 11/15/18 | | $ | 523,153 | |
| | | | | | | | | | |
| | | | | | | | | 9,264,125 | |
| | | | | | | | | | |
| | | | | | Materials (5.6%) | | | | |
| | 355,000 | | | | | Alcoa, Inc.
5.125%, 10/01/24 | | | 381,847 | |
| | 500,000 | | | | | ArcelorMittal, SA
6.000%, 08/05/20 | | | 524,687 | |
| | 1,000,000 | | | | | Barrick Gold Corp.
6.950%, 04/01/19 | | | 1,169,675 | |
| | 1,000,000 | | | | | Georgia-Pacific, LLC*
3.600%, 03/01/25 | | | 1,019,440 | |
| | 300,000 | | | | | Huntsman International, LLC*
5.125%, 11/15/22 | | | 304,313 | |
| | 850,000 | | | | | Newmont Mining Corp.^
5.125%, 10/01/19 | | | 931,668 | |
| | | | | | | | | | |
| | | | | | | | | 4,331,630 | |
| | | | | | | | | | |
| | | | | | Telecommunication Services (4.1%) | | | | |
| | 1,000,000 | | | | | AT&T, Inc.†
3.000%, 06/30/22 | | | 995,320 | |
| | 500,000 | | | | | CenturyLink, Inc.^
6.750%, 12/01/23 | | | 544,898 | |
| | 1,000,000 | | | | | Sprint Capital Corp.
6.900%, 05/01/19 | | | 1,033,125 | |
| | 500,000 | | | | | Verizon Communications, Inc.
5.150%, 09/15/23 | | | 565,635 | |
| | | | | | | | | | |
| | | | | | | | | 3,138,978 | |
| | | | | | | | | | |
| | | | | | Utilities (2.6%) | | | | |
| | 1,000,000 | | | | | NextEra Energy, Inc.
2.700%, 09/15/19 | | | 1,024,405 | |
| | 1,000,000 | | | | | Southern Company
2.150%, 09/01/19 | | | 1,009,425 | |
| | | | | | | | | | |
| | | | | | | | | 2,033,830 | |
| | | | | | | | | | |
| | | | | | TOTAL CORPORATE BONDS
(Cost $65,586,278) | | | 67,918,757 | |
| | | | | | | | | | |
| | | | | | | | | | |
| | U.S. GOVERNMENT AND AGENCY SECURITIES (8.8%) | |
| | | | | | Other (8.8%) | | | | |
| | | | | | United States Treasury Note | | | | |
| | 3,000,000 | | | | | 2.250%, 11/15/24 | | | 3,057,246 | |
| | 1,500,000 | | | | | 2.000%, 02/15/25 | | | 1,494,961 | |
| | 1,250,000 | | | | | 1.625%, 12/31/19 | | | 1,263,159 | |
| | 500,000 | | | | | 1.500%, 01/31/22 | | | 490,996 | |
| | 500,000 | | | | | 0.750%, 04/15/18 | | | 497,754 | |
| | | | | | | | | | |
| | | | | | TOTAL U.S. GOVERNMENT AND AGENCY SECURITIES
(Cost $6,854,624) | | | 6,804,116 | |
| | | | | | | | | | |
| | | | | | | | | | |
| | | | | | |
| See accompanying Notes to Schedule of Investments | | www.calamos.com | | | 113 | |
Total Return Bond Fund Schedule of Investments April 30, 2015 (Unaudited)
| | | | | | | | | | |
NUMBER OF
SHARES | | | | | | | VALUE | |
| | SHORT TERM INVESTMENT (0.6%) | |
| | 481,236 | | | | | Fidelity Prime Money Market Fund - Institutional Class
(Cost $481,236) | | $ | 481,236 | |
| | | | | | | | | | |
| | | | | | | | | | |
NUMBER OF
SHARES/
PRINCIPAL
AMOUNT | | | | | | | VALUE | |
| INVESTMENT OF CASH COLLATERAL FOR SECURITIES
LOANED (1.5%) |
|
| | | | | | Federal Home Loan Bank Discount Notes | | | | |
| | 213,132 | | | | | 0.000%, 05/29/15 | | | 213,132 | |
| | 133,218 | | | | | 0.000%, 06/10/15 | | | 133,218 | |
| | 66,612 | | | | | 0.000%, 05/27/15 | | | 66,612 | |
| | 66,610 | | | | | 0.000%, 06/15/15 | | | 66,610 | |
| | 133,211 | | | | | Federal Home Loan Mortgage Corp. Discount Note
0.000%, 06/01/15 | | | 133,211 | |
| | 264,645 | | | | | Fidelity Prime Money Market Fund -
Institutional Class | | | 264,645 | |
| | 121,382 | | | | | Goldman Sachs Financial Square Fund | | | 121,382 | |
| | 133,228 | | | | | Morgan Stanley Institutional Liquidity Fund | | | 133,228 | |
| | | | | | | | | | |
| | | | | | TOTAL INVESTMENT OF
CASH COLLATERAL FOR
SECURITIES LOANED
(Cost $1,132,038) | | | 1,132,038 | |
| | | | | | | | | | |
| TOTAL INVESTMENTS (99.3%)
(Cost $74,054,176) | | | 76,336,147 | |
| | | | | | | | | | |
| |
| | PAYABLE UPON RETURN OF SECURITIES ON LOAN (-1.5%) | | | (1,132,038 | ) |
| | | | | | | | | | |
| |
| | OTHER ASSETS, LESS LIABILITIES (2.2%) | | | 1,639,773 | |
| | | | | | | | | | |
| |
| | NET ASSETS (100.0%) | | $ | 76,843,882 | |
| | | | | | | | | | |
| | | | | | | | | | |
NOTES TO SCHEDULE OF INVESTMENTS
| * | Securities issued and sold pursuant to a Rule 144A transaction are excepted from the registration requirement of the Securities Act of 1933, as amended. These securities may only be sold to qualified institutional buyers (“QIBs”), such as the Fund. Any resale of these securities must generally be effected through a sale that is registered under the Act or otherwise exempted from such registration requirements. |
| ^ | Security, or portion of security, is on loan. |
| † | Security or a portion of the security purchased on a delayed delivery or when-issued basis. |
| | | | |
| 114 | | CALAMOS OPEN-END FAMILY OF FUNDS SEMIANNUAL REPORT | | See accompanying Notes to Financial Statements |
High Income Fund Schedule of Investments April 30, 2015 (Unaudited)
| | | | | | | | | | |
PRINCIPAL
AMOUNT | | | | | | | VALUE | |
| | CORPORATE BONDS (93.1%) | |
| | | | | | Consumer Discretionary (21.8%) | |
| | 600,000 | | | | | Altice, SA*
7.750%, 05/15/22 | | $ | 607,500 | |
| | 1,060,000 | | | | | American Axle & Manufacturing, Inc.
6.625%, 10/15/22 | | | 1,131,550 | |
| | 210,000 | | | | | Brunswick Corp.*
4.625%, 05/15/21 | | | 211,706 | |
| | 1,250,000 | | | | | CCO Holdings, LLC / CCO Holdings Capital Corp.
6.625%, 01/31/22 | | | 1,333,594 | |
| | 1,090,000 | | | | | Cedar Fair, LP*
5.375%, 06/01/24 | | | 1,130,875 | |
| | 1,364,000 | | | | | Century Communities, Inc.
6.875%, 05/15/22 | | | 1,350,360 | |
| | 1,080,000 | | | | | DISH DBS Corp.
5.125%, 05/01/20 | | | 1,093,500 | |
| | 1,200,000 | | | | | Dufry Finance, SCA*
5.500%, 10/15/20 | | | 1,251,750 | |
| | 600,000 | | | | | FCA US, LLC
8.000%, 06/15/19 | | | 627,870 | |
| | 800,000 | | | | | Fiat Chrysler Automobiles, NV*
5.250%, 04/15/23 | | | 808,000 | |
| | 1,350,000 | | | | | GameStop Corp.*
5.500%, 10/01/19 | | | 1,396,406 | |
| | 1,300,000 | | | | | Goodyear Tire & Rubber Company
7.000%, 05/15/22 | | | 1,425,125 | |
| | 1,750,000 | | | | | L Brands, Inc.
5.625%, 02/15/22 | | | 1,916,250 | |
| | 1,050,000 | | | | | Lennar Corp.
4.500%, 06/15/19 | | | 1,091,344 | |
| | 1,400,000 | | | | | Liberty Interactive, LLC^
8.500%, 07/15/29 | | | 1,570,625 | |
| | 1,375,000 | | | | | Mediacom Broadband, LLC / Mediacom Broadband Corp.
5.500%, 04/15/21 | | | 1,399,062 | |
| | 445,000 | | | | | Meritage Homes Corp.
7.000%, 04/01/22 | | | 478,931 | |
| | 1,000,000 | | | | | Netflix, Inc.
5.375%, 02/01/21 | | | 1,048,750 | |
| | 1,330,000 | | | | | Nexstar Broadcasting, Inc.*
6.125%, 02/15/22 | | | 1,381,538 | |
| | 675,000 | | | | | Numericable Group, SA*
6.000%, 05/15/22 | | | 691,031 | |
| | 713,000 | | | | | Outerwall, Inc.
6.000%, 03/15/19 | | | 703,642 | |
| | 1,360,000 | | | | | Penske Automotive Group, Inc.
5.375%, 12/01/24 | | | 1,421,200 | |
| | 515,000 | | | | | Reliance Intermediate Holdings, LP*
6.500%, 04/01/23 | | | 541,716 | |
| | 858,000 | | | | | Ryland Group, Inc.
6.625%, 05/01/20 | | | 942,728 | |
| | 1,500,000 | | | | | Six Flags Entertainment Corp.*
5.250%, 01/15/21 | | | 1,556,250 | |
| | | | | | | | | | |
PRINCIPAL
AMOUNT | | | | | | | VALUE | |
| | 1,325,000 | | | | | Speedway Motorsports, Inc.*
5.125%, 02/01/23 | | $ | 1,349,844 | |
| | 1,275,000 | | | | | Time, Inc.*
5.750%, 04/15/22 | | | 1,253,484 | |
| | | | | | Toll Brothers Finance Corp. | | | | |
| | 1,200,000 | | | | | 4.000%, 12/31/18 | | | 1,242,750 | |
| | 850,000 | | | | | 5.625%, 01/15/24 | | | 927,031 | |
| | | | | | | | | | |
| | | | | | | | | 31,884,412 | |
| | | | | | | | | | |
| | | | | | Consumer Staples (2.8%) | |
| | 430,000 | | | | | Alphabet Holding Company, Inc.
7.750%, 11/01/17 | | | 429,463 | |
| | 850,000 | | | | | Land O’Lakes, Inc.*
6.000%, 11/15/22 | | | 916,937 | |
| | 634,000 | | | | | Post Holdings, Inc.
7.375%, 02/15/22 | | | 659,756 | |
| | 975,000 | | | | | Smithfield Foods, Inc.
6.625%, 08/15/22 | | | 1,051,781 | |
| | 990,000 | | | | | WhiteWave Foods Company - Class A
5.375%, 10/01/22 | | | 1,064,869 | |
| | | | | | | | | | |
| | | | | | | | | 4,122,806 | |
| | | | | | | | | | |
| | | | | | Energy (12.1%) | |
| | 370,000 | | | | | Atwood Oceanics, Inc.
6.500%, 02/01/20 | | | 363,294 | |
| | 590,000 | | | | | Berry Petroleum Company, LLC
6.750%, 11/01/20 | | | 497,444 | |
| | 420,000 | | | | | Bill Barrett Corp.
7.000%, 10/15/22 | | | 374,850 | |
| | 340,000 | | | | | Blue Racer Midstream, LLC / Blue Racer Finance Corp.*
6.125%, 11/15/22 | | | 358,062 | |
| | 1,030,000 | | | | | Bonanza Creek Energy, Inc.
6.750%, 04/15/21 | | | 1,049,312 | |
| | 188,000 | | | | | Calumet Specialty Products Partners, LP
6.500%, 04/15/21 | | | 187,530 | |
| | 375,000 | | | | | Carrizo Oil & Gas, Inc.
6.250%, 04/15/23 | | | 382,266 | |
| | 1,200,000 | | | | | Crestwood Midstream Partners, LP / Crestwood Midstream Finance Corp.
6.125%, 03/01/22 | | | 1,240,500 | |
| | 1,655,000 | | | | | Drill Rigs Holdings, Inc.*^
6.500%, 10/01/17 | | | 1,436,747 | |
| | 1,557,000 | | | | | Gulfmark Offshore, Inc.^
6.375%, 03/15/22 | | | 1,230,030 | |
| | | | | | Gulfport Energy Corp. | | | | |
| | 890,000 | | | | | 6.625%, 05/01/23* | | | 907,244 | |
| | 525,000 | | | | | 7.750%, 11/01/20 | | | 555,516 | |
| | 895,000 | | | | | Laredo Petroleum, Inc.
6.250%, 03/15/23 | | | 930,240 | |
| | 1,260,000 | | | | | Linn Energy, LLC^‡
6.250%, 11/01/19 | | | 1,068,637 | |
| | 1,000,000 | | | | | MarkWest Energy Partners, LP / MarkWest Energy Finance Corp.
4.875%, 12/01/24 | | | 1,042,500 | |
| | | | | | |
| See accompanying Notes to Schedule of Investments | | www.calamos.com | | | 115 | |
High Income Fund Schedule of Investments April 30, 2015 (Unaudited)
| | | | | | | | | | |
PRINCIPAL
AMOUNT | | | | | | | VALUE | |
| | 1,000,000 | | | | | Matador Resources Company*
6.875%, 04/15/23 | | $ | 1,030,625 | |
| | 1,500,000 | | | | | Oasis Petroleum, Inc.
6.875%, 01/15/23 | | | 1,530,000 | |
| | 600,000 | | | | | Pacific Drilling, SA*
5.375%, 06/01/20 | | | 513,000 | |
| | 775,000 | | | | | Petroleum Geo-Services, ASA*
7.375%, 12/15/18 | | | 730,922 | |
| | | | | | Rice Energy, Inc. | | | | |
| | 231,000 | | | | | 6.250%, 05/01/22^ | | | 233,310 | |
| | 145,000 | | | | | 7.250%, 05/01/23* | | | 151,072 | |
| | 920,000 | | | | | Seventy Seven Operating ,LLC
6.625%, 11/15/19 | | | 735,425 | |
| | 1,686,000 | | | | | W&T Offshore, Inc.
8.500%, 06/15/19 | | | 1,210,759 | |
| | | | | | | | | | |
| | | | | | | | | 17,759,285 | |
| | | | | | | | | | |
| | | | | | Financials (3.9%) | |
| | 1,210,000 | | | | | DuPont Fabros Technology, LP
5.875%, 09/15/21 | | | 1,258,400 | |
| | 910,000 | | | | | First Cash Financial Services, Inc.
6.750%, 04/01/21 | | | 950,381 | |
| | 1,325,000 | | | | | Iron Mountain, Inc. 6.000%,
08/15/23 | | | 1,422,719 | |
| | 750,000 | | | | | iStar Financial, Inc.
4.875%, 07/01/18 | | | 752,344 | |
| | | | | | Jefferies Finance, LLC* | | | | |
| | 694,000 | | | | | 6.875%, 04/15/22 | | | 664,071 | |
| | 75,000 | | | | | 7.375%, 04/01/20 | | | 74,250 | |
| | 600,000 | | | | | Nationstar Mortgage, LLC / Nationstar Capital Corp.
7.875%, 10/01/20 | | | 620,250 | |
| | | | | | | | | | |
| | | | | | | | | 5,742,415 | |
| | | | | | | | | | |
| | | | | | Health Care (10.2%) | |
| | 1,400,000 | | | | | Acadia Healthcare Company, Inc.*
5.625%, 02/15/23 | | | 1,435,000 | |
| | 850,000 | | | | | Alere, Inc.
6.500%, 06/15/20 | | | 895,687 | |
| | 2,000,000 | | | | | Ally Financial, Inc.
4.125%, 02/13/22 | | | 1,972,500 | |
| | 1,000,000 | | | | | Community Health Systems, Inc.
7.125%, 07/15/20 | | | 1,071,250 | |
| | 785,000 | | | | | Crimson Merger Sub, Inc.*
6.625%, 05/15/22 | | | 698,159 | |
| | 1,335,000 | | | | | ExamWorks Group, Inc.
5.625%, 04/15/23 | | | 1,384,228 | |
| | 725,000 | | | | | HCA Holdings, Inc.
6.250%, 02/15/21 | | | 794,328 | |
| | 1,581,000 | | | | | HCA, Inc.
4.750%, 05/01/23 | | | 1,664,991 | |
| | 905,000 | | | | | Hologic, Inc.
6.250%, 08/01/20 | | | 941,200 | |
| | 750,000 | | | | | Omnicare, Inc.
4.750%, 12/01/22 | | | 817,969 | |
| | | | | | | | | | |
PRINCIPAL
AMOUNT | | | | | | | VALUE | |
| | 558,000 | | | | | Teleflex, Inc.
5.250%, 06/15/24 | | $ | 545,794 | |
| | 840,000 | | | | | Tenet Healthcare Corp.^
6.750%, 02/01/20 | | | 887,775 | |
| | 500,000 | | | | | Valeant Pharmaceuticals International, Inc.*
7.250%, 07/15/22 | | | 534,062 | |
| | | | | | VPII Escrow Corp.* | | | | |
| | 450,000 | | | | | 6.750%, 08/15/18 | | | 477,563 | |
| | 290,000 | | | | | 7.500%, 07/15/21 | | | 315,375 | |
| | | | | | VRX Escrow Corp.* | | | | |
| | 249,000 | | | | | 6.125%, 04/15/25 | | | 257,715 | |
| | 249,000 | | | | | 5.875%, 05/15/23 | | | 255,381 | |
| | | | | | | | | | |
| | | | | | | | | 14,948,977 | |
| | | | | | | | | | |
| | | | | | Industrials (14.8%) | |
| | 1,155,000 | | | | | ACCO Brands Corp.^
6.750%, 04/30/20 | | | 1,217,803 | |
| | 1,075,000 | | | | | AerCap Ireland Capital, Ltd. / AerCap Global Aviation Trust*
5.000%, 10/01/21 | | | 1,154,953 | |
| | 1,000,000 | | | | | American Airlines Group, Inc.*
4.625%, 03/01/20 | | | 990,000 | |
| | 1,030,000 | | | | | DigitalGlobe, Inc.*
5.250%, 02/01/21 | | | 1,041,587 | |
| | 1,100,000 | | | | | Dycom Investments, Inc.
7.125%, 01/15/21 | | | 1,159,812 | |
| | 1,836,000 | | | | | Edgen Murray Corp.*
8.750%, 11/01/20 | | | 2,005,830 | |
| | 1,012,000 | | | | | Garda World Security Corp.*
7.250%, 11/15/21 | | | 1,013,265 | |
| | 790,000 | | | | | GrafTech International, Ltd.
6.375%, 11/15/20 | | | 661,131 | |
| | | | | | Icahn Enterprises, LP | | | | |
| | 744,000 | | | | | 5.875%, 02/01/22 | | | 770,505 | |
| | 190,000 | | | | | 4.875%, 03/15/19 | | | 193,563 | |
| | 725,000 | | | | | Meritor, Inc.
6.750%, 06/15/21 | | | 760,797 | |
| | | | | | Michael Baker International, LLC* | | | | |
| | 850,000 | | | | | 8.250%, 10/15/18 | | | 836,719 | |
| | 627,000 | | | | | 8.875%, 04/15/19 | | | 541,179 | |
| | 1,430,000 | | | | | Multi-Color Corp.*
6.125%, 12/01/22 | | | 1,492,562 | |
| | 740,000 | | | | | Navistar International Corp.^
8.250%, 11/01/21 | | | 735,375 | |
| | 960,000 | | | | | Oshkosh Corp.*
5.375%, 03/01/25 | | | 1,002,000 | |
| | 1,530,000 | | | | | Spirit AeroSystems Holdings, Inc.
5.250%, 03/15/22 | | | 1,609,369 | |
| | 1,030,000 | | | | | Terex Corp.
6.000%, 05/15/21 | | | 1,046,094 | |
| | 825,000 | | | | | Titan International, Inc.
6.875%, 10/01/20 | | | 748,172 | |
| | 1,200,000 | | | | | United Continental Holdings, Inc.
6.375%, 06/01/18 | | | 1,283,250 | |
| | | | |
| 116 | | CALAMOS OPEN-END FAMILY OF FUNDS SEMIANNUAL REPORT | | See accompanying Notes to Schedule of Investments |
High Income Fund Schedule of Investments April 30, 2015 (Unaudited)
| | | | | | | | | | |
PRINCIPAL
AMOUNT | | | | | | | VALUE | |
| | | | | | United Rentals North America, Inc. | | | | |
| | 750,000 | | | | | 7.625%, 04/15/22 | | $ | 829,688 | |
| | 462,000 | | | | | 8.250%, 02/01/21 | | | 501,559 | |
| | | | | | | | | | |
| | | | | | | | | 21,595,213 | |
| | | | | | | | | | |
| | | | | | Information Technology (9.1%) | |
| | 850,000 | | | | | Activision Blizzard, Inc.*
5.625%, 09/15/21 | | | 909,500 | |
| | 1,185,000 | | | | | Alliance Data Systems Corp.*
5.375%, 08/01/22 | | | 1,199,813 | |
| | 1,160,000 | | | | | Amkor Technology, Inc.
6.625%, 06/01/21 | | | 1,205,675 | |
| | 1,200,000 | | | | | Belden, Inc.*
5.500%, 09/01/22 | | | 1,239,000 | |
| | 1,000,000 | | | | | Cardtronics, Inc.*
5.125%, 08/01/22 | | | 995,625 | |
| | 1,335,000 | | | | | CDW, LLC / CDW Finance Corp.
5.000%, 09/01/23 | | | 1,378,387 | |
| | 1,400,000 | | | | | Equinix, Inc.
5.375%, 04/01/23 | | | 1,452,500 | |
| | 1,000,000 | | | | | Hughes Satellite Systems Corp.
7.625%, 06/15/21 | | | 1,118,750 | |
| | 1,330,000 | | | | | Micron Technology, Inc.*
5.250%, 08/01/23 | | | 1,340,806 | |
| | 640,000 | | | | | Nuance Communications, Inc.*
5.375%, 08/15/20 | | | 649,600 | |
| | 800,000 | | | | | NXP Semiconductors, NV*
5.750%, 02/15/21 | | | 855,500 | |
| | 900,000 | | | | | Viasystems, Inc.*
7.875%, 05/01/19 | | | 948,938 | |
| | | | | | | | | | |
| | | | | | | | | 13,294,094 | |
| | | | | | | | | | |
| | | | | | Materials (10.0%) | | | | |
| | 640,000 | | | | | Alcoa, Inc.
5.125%, 10/01/24 | | | 688,400 | |
| | 1,529,000 | | | | | ArcelorMittal, SA
6.000%, 08/05/20 | | | 1,604,494 | |
| | 1,363,000 | | | | | Chemtura Corp.
5.750%, 07/15/21 | | | 1,410,705 | |
| | 1,365,000 | | | | | Constellium, NV*
8.000%, 01/15/23 | | | 1,473,347 | |
| | | | | | First Quantum Minerals, Ltd.* | | | | |
| | 690,000 | | | | | 7.000%, 02/15/21 | | | 642,131 | |
| | 690,000 | | | | | 6.750%, 02/15/20 | | | 642,994 | |
| | | | | | FMG Resources* | | | | |
| | 518,000 | | | | | 8.250%, 11/01/19^ | | | 452,926 | |
| | 230,000 | | | | | 9.750%, 03/01/22 | | | 237,906 | |
| | 540,000 | | | | | Huntsman International, LLC*
5.125%, 11/15/22 | | | 547,763 | |
| | | | | | INEOS Group Holdings, SA*^ | | | | |
| | 800,000 | | | | | 6.125%, 08/15/18 | | | 820,500 | |
| | 600,000 | | | | | 5.875%, 02/15/19 | | | 608,625 | |
| | 850,000 | | | | | New Gold, Inc.*
6.250%, 11/15/22 | | | 840,969 | |
| | | | | | | | | | |
PRINCIPAL
AMOUNT | | | | | | | VALUE | |
| | | | | | Trinseo Materials Operating, SCA | | | | |
| | 1,337,000 | | | | | 8.750%, 02/01/19^ | | $ | 1,419,212 | |
| | 1,125,000 | | | | | 6.750%, 05/01/22*† | | | 1,143,281 | |
| | 754,000 | | | | | United States Steel Corp.^
6.875%, 04/01/21 | | | 759,655 | |
| | 1,355,000 | | | | | Vulcan Materials Company
4.500%, 04/01/25 | | | 1,382,947 | |
| | | | | | | | | | |
| | | | | | | | | 14,675,855 | |
| | | | | | | | | | |
| | | | | | Other (0.9%) | | | | |
| | 1,350,000 | | | | | ZF North America Capital, Inc.*
4.500%, 04/29/22 | | | 1,356,750 | |
| | | | | | | | | | |
| | | | | | Telecommunication Services (6.8%) | |
| | 912,000 | | | | | CenturyLink, Inc.
6.750%, 12/01/23 | | | 993,893 | |
| | | | | | Frontier Communications Corp. | | | | |
| | 745,000 | | | | | 7.625%, 04/15/24 | | | 760,831 | |
| | 145,000 | | | | | 6.875%, 01/15/25 | | | 140,831 | |
| | 1,425,000 | | | | | Inmarsat Finance, PLC*
4.875%, 05/15/22 | | | 1,426,781 | |
| | | | | | Intelsat, SA | | | | |
| | 950,000 | | | | | 7.750%, 06/01/21^ | | | 874,000 | |
| | 100,000 | | | | | 8.125%, 06/01/23 | | | 91,250 | |
| | 1,450,000 | | | | | SBA Communications Corp.*
4.875%, 07/15/22 | | | 1,430,063 | |
| | | | | | Sprint Corp. | | | | |
| | 2,570,000 | | | | | 7.250%, 09/15/21 | | | 2,587,669 | |
| | 320,000 | | | | | 7.125%, 06/15/24 | | | 309,000 | |
| | 1,320,000 | | | | | T-Mobile USA, Inc.
6.625%, 04/01/23 | | | 1,377,750 | |
| | | | | | | | | | |
| | | | | | | | | 9,992,068 | |
| | | | | | | | | | |
| | | | | | Utilities (0.7%) | | | | |
| | 1,000,000 | | | | | Calpine Corp.
5.500%, 02/01/24 | | | 1,001,875 | |
| | | | | | | | | | |
| | | | | | TOTAL CORPORATE BONDS
(Cost $135,770,867) | | | 136,373,750 | |
| | | | | | | | | | |
| | | | | | | | | | |
| | CONVERTIBLE BOND (0.8%) | |
| | | | | | | | | | |
| | | | | | Financials (0.8%) | |
| | 1,109,000 | | | | | Ares Capital Corp.
5.750%, 02/01/16
(Cost $1,126,352) | | | 1,143,956 | |
| | | | | | | | | | |
| | | | | | | | | | |
NUMBER OF
SHARES | | | | | | | VALUE | |
| | | | | | | | | | |
| | CONVERTIBLE PREFERRED STOCKS (2.6%) | |
| | | | | | Energy (0.7%) | | | | |
| | 1,125 | | | | | Chesapeake Energy Corp.
5.750% | | | 990,000 | |
| | | | | | | | | | |
| | | | | | Financials (0.5%) | |
| | 6,900 | | | | | Crown Castle International Corp.
4.500% | | | 722,430 | |
| | | | | | | | | | |
| | | | | | |
| See accompanying Notes to Schedule of Investments | | www.calamos.com | | | 117 | |
High Income Fund Schedule of Investments April 30, 2015 (Unaudited)
| | | | | | | | | | |
NUMBER OF
SHARES | | | | | | | VALUE | |
| | | | | | | | | | |
| | | | | | Health Care (0.5%) | |
| | 750 | | | | | Actavis, PLC
5.500% | | $ | 750,495 | |
| | | | | | | | | | |
| | | | | | Industrials (0.5%) | |
| | 12,700 | | | | | United Technologies Corp.
7.500% | | | 747,014 | |
| | | | | | | | | | |
| | | | | | Utilities (0.4%) | |
| | 12,500 | | | | | Dominion Resources, Inc.
6.375% | | | 620,625 | |
| | | | | | | | | | |
| | | | | | TOTAL CONVERTIBLE PREFERRED STOCKS
(Cost $4,188,815) | | | 3,830,564 | |
| | | | | | | | | | |
| | | | | | | | | | |
NUMBER OF
SHARES/
PRINCIPAL
AMOUNT | | | | | | | VALUE | |
| | | | | | | | | | |
| INVESTMENT OF CASH COLLATERAL FOR SECURITIES
LOANED (7.6%) |
|
| | | | | | Federal Home Loan Bank Discount Notes | |
| | 2,108,552 | | | | | 0.000%, 05/29/15 | | | 2,108,552 | |
| | 1,317,948 | | | | | 0.000%, 06/10/15 | | | 1,317,948 | |
| | 659,002 | | | | | 0.000%, 05/27/15 | | | 659,002 | |
| | 658,984 | | | | | 0.000%, 06/15/15 | | | 658,984 | |
| | 1,317,885 | | | | | Federal Home Loan Mortgage Corp. Discount Note
0.000%, 06/01/15 | | | 1,317,885 | |
| | 2,618,179 | | | | | Fidelity Prime Money Market Fund - Institutional Class | | | 2,618,179 | |
| | 1,318,045 | | | | | Morgan Stanley Institutional Liquidity Fund | | | 1,318,045 | |
| | 1,200,850 | | | | | Goldman Sachs Financial Square Fund | | | 1,200,850 | |
| | | | | | | | | | |
| | | | | | TOTAL INVESTMENT OF
CASH COLLATERAL FOR
SECURITIES LOANED
(Cost $11,199,445) | | | 11,199,445 | |
| | | | | | | | | | |
| | | | | | | | | | |
NUMBER OF
SHARES | | | | | | | VALUE | |
| | SHORT TERM INVESTMENT (2.8%) | |
| | 4,108,271 | | | | | Fidelity Prime Money Market Fund - Institutional Class
(Cost $4,108,271) | | | 4,108,271 | |
| | | | | | | | | | |
| TOTAL INVESTMENTS (106.9%)
(Cost $156,393,750) | | | 156,655,986 | |
| | | | | | | | | | |
| |
| | PAYABLE UPON RETURN OF SECURITIES ON LOAN (-7.6%) | | | (11,199,445 | ) |
| | | | | | | | | | |
| |
| | OTHER ASSETS, LESS LIABILITIES (0.7%) | | | 1,025,935 | |
| | | | | | | | | | |
| |
| | NET ASSETS (100.0%) | | $ | 146,482,476 | |
| | | | | | | | | | |
NOTES TO SCHEDULE OF INVESTMENTS
| * | Securities issued and sold pursuant to a Rule 144A transaction are excepted from the registration requirement of the Securities Act of 1933, as amended. These securities may only be sold to qualified institutional buyers (“QIBs”), such as the Fund. Any resale of these securities must generally be effected through a sale that is registered under the Act or otherwise exempted from such registration requirements. |
| ^ | Security, or portion of security, is on loan. |
| ‡ | Variable rate or step bond security. The rate shown is the rate in effect at April 30, 2015. |
| † | Security or a portion of the security purchased on a delayed delivery or when-issued basis. |
| | | | |
| 118 | | CALAMOS OPEN-END FAMILY OF FUNDS SEMIANNUAL REPORT | | See accompanying Notes to Financial Statements |
Market Neutral Income Fund Schedule of Investments April 30, 2015 (Unaudited)
| | | | | | | | | | |
PRINCIPAL
AMOUNT | | | | | | | VALUE | |
| | CONVERTIBLE BONDS (35.1%) | |
| | | | | | Consumer Discretionary (6.0%) | |
| | 15,000,000 | | | | | Ctrip.com International, Ltd.
1.250%, 10/15/18 | | $ | 16,655,625 | |
| | 6,000,000 | | | | | Iconix Brand Group, Inc.~
1.500%, 03/15/18 | | | 6,220,500 | |
| | | | | | Jarden Corp.~ | | | | |
| | 12,000,000 | | | | | 1.875%, 09/15/18 | | | 19,918,680 | |
| | 5,000,000 | | | | | 1.500%, 06/15/19 | | | 6,932,025 | |
| | 4,327,100 | | | | | Liberty Interactive, LLC~^*
1.000%, 09/30/43 | | | 4,067,020 | |
| | 10,000,000 | | | | | Live Nation Entertainment, Inc.^*
2.500%, 05/15/19 | | | 10,395,300 | |
| | 4,000,000 | | | | | M/I Homes, Inc.^
3.000%, 03/01/18 | | | 4,000,420 | |
| | 11,635,000 | | | | | Meritage Homes Corp.^
1.875%, 09/15/32 | | | 11,979,047 | |
| | | | | | Priceline Group, Inc.~ | | | | |
| | 15,000,000 | | | | | 1.000%, 03/15/18 | | | 21,012,075 | |
| | 15,000,000 | | | | | 0.900%, 09/15/21* | | | 14,915,100 | |
| | 10,000,000 | | | | | Restoration Hardware Holdings, Inc.^*
0.000%, 06/15/19 | | | 9,996,200 | |
| | 12,000,000 | | | | | Ryland Group, Inc.~
1.625%, 05/15/18 | | | 16,748,340 | |
| | 14,000,000 | | | | | Shutterfly, Inc.
0.250%, 05/15/18 | | | 13,848,520 | |
| | 6,500,000 | | | | | Standard Pacific Corp.~
1.250%, 08/01/32 | | | 7,587,385 | |
| | 5,250,000 | | | | | TAL Education Group~^*
2.500%, 05/15/19 | | | 7,796,591 | |
| | 32,500,000 | | | | | Tesla Motors, Inc.^
1.250%, 03/01/21 | | | 30,079,887 | |
| | 9,500,000 | | | | | Toll Brothers Finance Corp.
0.500%, 09/15/32 | | | 9,771,130 | |
| | 15,000,000 | | | | | Vipshop Holdings, Ltd.
1.500%, 03/15/19 | | | 22,907,925 | |
| | | | | | | | | | |
| | | | | | | | | 234,831,770 | |
| | | | | | | | | | |
| | | | | | Consumer Staples (0.1%) | |
| | 4,000,000 | | | | | IGI Laboratories, Inc.*
3.750%, 12/15/19 | | | 3,385,620 | |
| | | | | | | | | | |
| | | | | | Energy (2.2%) | |
| | 22,500,000 | | | | | Energy XXI, Ltd.^
3.000%, 12/15/18 | | | 8,870,400 | |
| | 6,850,000 | | | | | Helix Energy Solutions Group, Inc.
3.250%, 03/15/32 | | | 6,996,213 | |
| | 7,000,000 | | | | | Newpark Resources, Inc.~
4.000%, 10/01/17 | | | 8,267,035 | |
| | 11,500,000 | | | | | Petroleum Development Corp.~*
3.250%, 05/15/16 | | | 16,451,210 | |
| | 3,000,000 | | | | | Renewable Energy Group, Inc.^
2.750%, 06/15/19 | | | 2,854,620 | |
| | | | | | | | | | |
PRINCIPAL
AMOUNT | | | | | | | VALUE | |
| | | | | | SEACOR Holdings, Inc. | | | | |
| | 14,295,000 | | | | | 2.500%, 12/15/27~ | | $ | 14,864,441 | |
| | 4,000,000 | | | | | 3.000%, 11/15/28 | | | 3,647,040 | |
| | 6,000,000 | | | | | Stone Energy Corp.^
1.750%, 03/01/17 | | | 5,616,420 | |
| | 15,000,000 | | | | | Whiting Petroleum Corp.~*
1.250%, 04/01/20 | | | 17,880,375 | |
| | | | | | | | | | |
| | | | | | | | | 85,447,754 | |
| | | | | | | | | | |
| | | | | | Financials (1.8%) | |
| | 4,000,000 | | | | | American Residential Properties OP, LP~^*
3.250%, 11/15/18 | | | 4,168,860 | |
| | | | | | AmTrust Financial Services, Inc. | | | | |
| | 4,821,000 | | | | | 2.750%, 12/15/44 | | | 4,483,530 | |
| | 3,000,000 | | | | | 2.750%, 12/15/44* | | | 2,760,000 | |
| | 3,500,000 | | | | | Cowen Group, Inc.
3.000%, 03/15/19 | | | 4,187,785 | |
| | 5,000,000 | | | | | DDR Corp.~^
1.750%, 11/15/40 | | | 5,798,725 | |
| | | | | | Encore Capital Group, Inc. | | | | |
| | 5,000,000 | | | | | 3.000%, 11/27/17~ | | | 6,790,675 | |
| | 5,000,000 | | | | | 2.875%, 03/15/21^ | | | 4,683,725 | |
| | 3,000,000 | | | | | Ezcorp, Inc.*
2.125%, 06/15/19 | | | 2,581,485 | |
| | 6,000,000 | | | | | Forestar Group, Inc.^
3.750%, 03/01/20 | | | 5,558,730 | |
| | 1,000,000 | | | | | FXCM, Inc.
2.250%, 06/15/18 | | | 827,480 | |
| | 5,000,000 | | | | | SL Green Operating Partnership, LP*
3.000%, 10/15/17 | | | 7,553,275 | |
| | 5,000,000 | | | | | Starwood Property Trust, Inc.
3.750%, 10/15/17 | | | 5,188,775 | |
| | | | | | Starwood Waypoint Residential Trust* | | | | |
| | 6,000,000 | | | | | 3.000%, 07/01/19 | | | 5,811,900 | |
| | 5,000,000 | | | | | 4.500%, 10/15/17 | | | 5,154,200 | |
| | 8,000,000 | | | | | Walter Investment Management Corp.^
4.500%, 11/01/19 | | | 6,368,760 | |
| | | | | | | | | | |
| | | | | | | | | 71,917,905 | |
| | | | | | | | | | |
| | | | | | Health Care (4.7%) | |
| | 8,391,000 | | | | | Acorda Therapeutics, Inc.
1.750%, 06/15/21 | | | 8,175,393 | |
| | 5,000,000 | | | | | Allscripts Healthcare Solutions, Inc.
1.250%, 07/01/20 | | | 5,145,000 | |
| | 10,000,000 | | | | | AMAG Pharmaceuticals, Inc.
2.500%, 02/15/19 | | | 19,637,550 | |
| | 2,500,000 | | | | | Brocade Communications Systems, Inc.*
1.375%, 01/01/20 | | | 2,591,563 | |
| | 9,500,000 | | | | | Brookdale Senior Living, Inc.~
2.750%, 06/15/18 | | | 12,949,355 | |
| | 7,500,000 | | | | | Depomed, Inc.
2.500%, 09/01/21 | | | 10,317,150 | |
| | | | | | |
| See accompanying Notes to Schedule of Investments | | www.calamos.com | | | 119 | |
Market Neutral Income Fund Schedule of Investments April 30, 2015 (Unaudited)
| | | | | | | | | | |
PRINCIPAL
AMOUNT | | | | | | | VALUE | |
| | 3,500,000 | | | | | Emergent Biosolutions, Inc.^
2.875%, 01/15/21 | | $ | 4,146,520 | |
| | 7,000,000 | | | | | Healthways, Inc.
1.500%, 07/01/18 | | | 7,624,505 | |
| | 2,667,000 | | | | | Horizon Pharma Investment, Ltd.*
2.500%, 03/15/22 | | | 3,314,534 | |
| | 3,804,000 | | | | | Insulet Corp.
2.000%, 06/15/19 | | | 3,682,025 | |
| | 10,162,000 | | | | | Integra LifeSciences Holdings Corp.~
1.625%, 12/15/16 | | | 11,461,517 | |
| | 9,700,000 | | | | | Jazz Investments I, Ltd.~^*
1.875%, 08/15/21 | | | 11,623,558 | |
| | 7,000,000 | | | | | Ligand Pharmaceuticals, Inc.*
0.750%, 08/15/19 | | | 8,474,305 | |
| | | | | | Medicines Company | | | | |
| | 12,500,000 | | | | | 1.375%, 06/01/17 | | | 14,203,250 | |
| | 7,500,000 | | | | | 2.500%, 01/15/22* | | | 7,788,787 | |
| | | | | | Molina Healthcare, Inc. | | | | |
| | 9,416,000 | | | | | 1.625%, 08/15/44* | | | 10,996,758 | |
| | 5,000,000 | | | | | 1.125%, 01/15/20~ | | | 7,633,000 | |
| | 1,084,000 | | | | | 1.625%, 08/15/44 | | | 1,286,470 | |
| | 8,000,000 | | | | | NuVasive, Inc.
2.750%, 07/01/17 | | | 9,858,560 | |
| | 5,000,000 | | | | | Quidel Corp.
3.250%, 12/15/20 | | | 5,121,125 | |
| | 8,000,000 | | | | | Spectranetics Corp.
2.625%, 06/01/34 | | | 8,697,000 | |
| | 10,000,000 | | | | | Wright Medical Group, Inc.*
2.000%, 02/15/20 | | | 10,456,650 | |
| | | | | | | | | | |
| | | | | | | | | 185,184,575 | |
| | | | | | | | | | |
| | | | | | Industrials (1.2%) | | | | |
| | 3,750,000 | | | | | CBIZ, Inc.~*
4.875%, 10/01/15 | | | 4,764,000 | |
| | 2,400,000 | | | | | Echo Global Logistics, Inc.
2.500%, 05/01/20 | | | 2,460,000 | |
| | 4,000,000 | | | | | Greenbrier Companies, Inc.
3.500%, 04/01/18 | | | 6,135,820 | |
| | | | | | Navistar International Corp. | | | | |
| | 10,000,000 | | | | | 4.750%, 04/15/19 | | | 9,313,700 | |
| | 10,000,000 | | | | | 4.500%, 10/15/18^ | | | 9,222,150 | |
| | 5,000,000 | | | | | SolarCity Corp.*
1.625%, 11/01/19 | | | 4,886,575 | |
| | 10,000,000 | | | | | Trinity Industries, Inc.~
3.875%, 06/01/36 | | | 12,990,800 | |
| | | | | | | | | | |
| | | | | | | | | 49,773,045 | |
| | | | | | | | | | |
| | | | | | Information Technology (18.1%) | | | | |
| | 8,500,000 | | | | | AOL, Inc.*
0.750%, 09/01/19 | | | 8,597,878 | |
| | 3,000,000 | | | | | Blucora, Inc.
4.250%, 04/01/19 | | | 2,833,320 | |
| | 7,750,000 | | | | | Bottomline Technologies (de), Inc.~
1.500%, 12/01/17 | | | 8,477,880 | |
| | | | | | | | | | |
PRINCIPAL
AMOUNT | | | | | | | VALUE | |
| | 7,500,000 | | | | | Broadsoft, Inc.~
1.500%, 07/01/18 | | $ | 7,859,588 | |
| | 7,000,000 | | | | | Canadian Solar, Inc.
4.250%, 02/15/19 | | | 7,488,810 | |
| | 8,800,000 | | | | | Cardtronics, Inc.^
1.000%, 12/01/20 | | | 8,776,196 | |
| | 15,900,000 | | | | | Ciena Corp.*
3.750%, 10/15/18 | | | 20,707,126 | |
| | 10,000,000 | | | | | Citrix Systems, Inc.^*
0.500%, 04/15/19 | | | 10,688,000 | |
| | 12,000,000 | | | | | Cornerstone OnDemand, Inc.
1.500%, 07/01/18 | | | 11,731,320 | |
| | 10,716,000 | | | | | CSG Systems International, Inc.~*
3.000%, 03/01/17 | | | 14,067,536 | |
| | 5,000,000 | | | | | Dealertrack Technologies, Inc.~
1.500%, 03/15/17 | | | 6,034,875 | |
| | 30,000,000 | | | | | Electronic Arts, Inc.
0.750%, 07/15/16 | | | 54,958,200 | |
| | 10,500,000 | | | | | Electronics For Imaging, Inc.~*
0.750%, 09/01/19 | | | 10,824,083 | |
| | 11,900,000 | | | | | Emulex Corp.
1.750%, 11/15/18 | | | 12,082,070 | |
| | 5,000,000 | | | | | EnerNOC, Inc.*
2.250%, 08/15/19 | | | 3,694,975 | |
| | 5,000,000 | | | | | Envestnet, Inc.
1.750%, 12/15/19 | | | 5,371,000 | |
| | 5,000,000 | | | | | Euronet Worldwide, Inc.~*
1.500%, 10/01/44 | | | 5,463,575 | |
| | 12,752,000 | | | | | Finisar Corp. 0.500%, 12/15/33 | | | 12,907,256 | |
| | 8,000,000 | | | | | Homeaway, Inc.^
0.125%, 04/01/19 | | | 7,573,000 | |
| | 9,500,000 | | | | | Infinera Corp.
1.750%, 06/01/18 | | | 15,131,315 | |
| | 13,000,000 | | | | | InterDigital, Inc.
2.500%, 03/15/16 | | | 14,447,290 | |
| | 15,000,000 | | | | | JDS Uniphase Corp.^
0.625%, 08/15/33 | | | 15,330,000 | |
| | 7,500,000 | | | | | Lam Research Corp.~
0.500%, 05/15/16 | | | 9,491,775 | |
| | 12,500,000 | | | | | LinkedIn Corp.~*
0.500%, 11/01/19 | | | 13,875,500 | |
| | 10,000,000 | | | | | Mentor Graphics Corp.~
4.000%, 04/01/31 | | | 12,511,950 | |
| | 10,000,000 | | | | | MercadoLibre, Inc.*
2.250%, 07/01/19 | | | 12,809,600 | |
| | 10,000,000 | | | | | Microchip Technology, Inc.~*
1.625%, 02/15/25 | | | 10,224,050 | |
| | 2,500,000 | | | | | NetSuite, Inc.
0.250%, 06/01/18 | | | 2,668,475 | |
| | 25,000,000 | | | | | NVIDIA Corp.~
1.000%, 12/01/18 | | | 30,520,250 | |
| | 15,000,000 | | | | | NXP Semiconductors, NV*
1.000%, 12/01/19 | | | 17,554,050 | |
| | | | |
| 120 | | CALAMOS OPEN-END FAMILY OF FUNDS SEMIANNUAL REPORT | | See accompanying Notes to Schedule of Investments |
Market Neutral Income Fund Schedule of Investments April 30, 2015 (Unaudited)
| | | | | | | | | | |
PRINCIPAL
AMOUNT | | | | | | | VALUE | |
| | 25,000,000 | | | | | ON Semiconductor Corp.~
2.625%, 12/15/26 | | $ | 31,191,500 | |
| | 10,600,000 | | | | | Palo Alto Networks, Inc.*
0.000%, 07/01/19 | | | 15,194,252 | |
| | 5,200,000 | | | | | Photronics, Inc.
3.250%, 04/01/16 | | | 5,397,236 | |
| | 7,500,000 | | | | | Proofpoint, Inc.
1.250%, 12/15/18 | | | 11,147,587 | |
| | 3,000,000 | | | | | PROS Holdings, Inc.*
2.000%, 12/01/19 | | | 2,969,145 | |
| | 29,985,000 | | | | | Qihoo 360 Technology Company, Ltd.*
1.750%, 08/15/21 | | | 25,671,658 | |
| | 7,000,000 | | | | | Rambus, Inc.~^
1.125%, 08/15/18 | | | 8,997,065 | |
| | 7,500,000 | | | | | Rovi Corp.*
0.500%, 03/01/20 | | | 7,287,938 | |
| | 18,500,000 | | | | | Salesforce.com, Inc.
0.250%, 04/01/18 | | | 23,142,575 | |
| | | | | | SanDisk Corp. | | | | |
| | 30,000,000 | | | | | 1.500%, 08/15/17 | | | 43,038,150 | |
| | 5,000,000 | | | | | 0.500%, 10/15/20~ | | | 5,175,075 | |
| | 4,500,000 | | | | | ServiceNow, Inc.
0.000%, 11/01/18 | | | 5,410,080 | |
| | 10,000,000 | | | | | SINA Corp.
1.000%, 12/01/18 | | | 9,358,250 | |
| | | | | | SunEdison, Inc. | | | | |
| | 7,000,000 | | | | | 2.375%, 04/15/22* | | | 8,466,045 | |
| | 6,250,000 | | | | | 2.000%, 10/01/18^ | | | 11,240,437 | |
| | 4,651,000 | | | | | Synchronoss Technologies, Inc.
0.750%, 08/15/19 | | | 5,388,649 | |
| | | | | | Take-Two Interactive Software, Inc.~ | | | | |
| | 10,000,000 | | | | | 1.000%, 07/01/18 | | | 12,534,750 | |
| | 9,000,000 | | | | | 1.750%, 12/01/16 | | | 11,979,225 | |
| | 7,000,000 | | | | | TiVo, Inc.*
4.000%, 03/15/16 | | | 7,887,285 | |
| | 5,000,000 | | | | | TTM Technologies, Inc.
1.750%, 12/15/20 | | | 5,578,050 | |
| | | | | | Twitter, Inc.* | | | | |
| | 15,000,000 | | | | | 1.000%, 09/15/21~ | | | 13,642,050 | |
| | 15,000,000 | | | | | 0.250%, 09/15/19 | | | 13,883,850 | |
| | 14,500,000 | | | | | Workday, Inc.~
0.750%, 07/15/18 | | | 18,305,597 | |
| | 5,000,000 | | | | | Xilinx, Inc.~
2.625%, 06/15/17 | | | 7,591,275 | |
| | 5,000,000 | | | | | Yahoo!, Inc.~
0.000%, 12/01/18 | | | 5,321,175 | |
| | 16,601,000 | | | | | Yandex, NV
1.125%, 12/15/18 | | | 14,567,045 | |
| | 8,520,000 | | | | | YY, Inc.
2.250%, 04/01/19 | | | 8,017,192 | |
| | | | | | | | | | |
| | | | | | | | | 713,084,079 | |
| | | | | | | | | | |
| | | | | | Materials (1.0%) | | | | |
| | 4,000,000 | | | | | B2Gold Corp.
3.250%, 10/01/18 | | | 3,489,720 | |
| | | | | | | | | | |
PRINCIPAL
AMOUNT | | | | | | | VALUE | |
| | 15,000,000 | | | | | Cemex, SAB de CV~^
3.750%, 03/15/18 | | $ | 18,350,325 | |
| | 2,950,000 | | | | | Horsehead Holding Corp.~
3.800%, 07/01/17 | | | 3,464,347 | |
| | | | | | RTI International Metals, Inc. | | | | |
| | 4,000,000 | | | | | 3.000%, 12/01/15 | | | 4,490,040 | |
| | 3,600,000 | | | | | 1.625%, 10/15/19 | | | 4,275,774 | |
| | 3,750,000 | | | | | United States Steel Corp.~
2.750%, 04/01/19 | | | 4,519,163 | |
| | | | | | | | | | |
| | | | | | | | | 38,589,369 | |
| | | | | | | | | | |
| | | | | | TOTAL CONVERTIBLE BONDS
(Cost $1,342,848,863) | | | 1,382,214,117 | |
| | | | | | | | | | |
| | | | | | | | | | |
| | SYNTHETIC CONVERTIBLE SECURITIES (11.9%)¤ | |
| | Corporate Bonds (11.9%) | | | | |
| | | | | | Consumer Discretionary (3.1%) | | | | |
| | 500,000 | | | | | American Honda Finance Corp.~
1.125%, 10/07/16 | | | 502,688 | |
| | 6,000,000 | | | | | British Telecommunications, PLC~
1.250%, 02/14/17 | | | 6,006,330 | |
| | 6,820,000 | | | | | D.R. Horton, Inc.
3.750%, 03/01/19 | | | 6,918,038 | |
| | 5,000,000 | | | | | Daimler Finance North America, LLC~*
1.250%, 01/11/16 | | | 5,019,525 | |
| | | | | | DIRECTV Holdings, LLC~ | | | | |
| | 5,000,000 | | | | | 3.500%, 03/01/16 | | | 5,103,325 | |
| | 5,000,000 | | | | | 2.400%, 03/15/17 | | | 5,092,425 | |
| | 10,000,000 | | | | | DISH DBS Corp.
4.250%, 04/01/18 | | | 10,200,000 | |
| | 10,000,000 | | | | | FCA US, LLC
8.000%, 06/15/19 | | | 10,464,500 | |
| | | | | | Ford Motor Credit Company, LLC~ | | | | |
| | 5,000,000 | | | | | 1.700%, 05/09/16 | | | 5,027,400 | |
| | 2,000,000 | | | | | 1.500%, 01/17/17 | | | 2,004,450 | |
| | | | | | General Motors Company, Inc.~ | | | | |
| | 3,000,000 | | | | | 3.250%, 05/15/18 | | | 3,075,000 | |
| | 2,000,000 | | | | | 2.750%, 05/15/16 | | | 2,030,000 | |
| | 500,000 | | | | | 2.625%, 07/10/17 | | | 506,875 | |
| | 4,000,000 | | | | | Hyundai Capital America~*
1.625%, 10/02/15 | | | 4,015,320 | |
| | | | | | Lennar Corp.~ | | | | |
| | 8,760,000 | | | | | 4.500%, 06/15/19 | | | 9,104,925 | |
| | 7,000,000 | | | | | 4.125%, 12/01/18 | | | 7,153,125 | |
| | 5,745,000 | | | | | Meritage Homes Corp.
4.500%, 03/01/18 | | | 5,874,262 | |
| | 5,605,000 | | | | | NCL Corp., Ltd. - Class C
5.000%, 02/15/18 | | | 5,748,628 | |
| | 2,000,000 | | | | | Nissan Motor Acceptance Corp.~*‡
0.812%, 03/03/17 | | | 2,006,150 | |
| | 2,000,000 | | | | | Numericable Group, SA^*
4.875%, 05/15/19 | | | 2,025,000 | |
| | 5,333,000 | | | | | Sally Holdings, LLC
6.875%, 11/15/19 | | | 5,649,647 | |
| | | | | | |
| See accompanying Notes to Schedule of Investments | | www.calamos.com | | | 121 | |
Market Neutral Income Fund Schedule of Investments April 30, 2015 (Unaudited)
| | | | | | | | | | |
PRINCIPAL
AMOUNT | | | | | | | VALUE | |
| | 2,000,000 | | | | | Thomson Reuters Corp.~
0.875%, 05/23/16 | | $ | 1,999,530 | |
| | 2,500,000 | | | | | Time Warner, Inc.~
3.150%, 07/15/15 | | | 2,513,150 | |
| | 13,760,000 | | | | | Toll Brothers Finance Corp.
4.000%, 12/31/18 | | | 14,250,200 | |
| | | | | | | | | | |
| | | | | | | | | 122,290,493 | |
| | | | | | | | | | |
| | | | | | Consumer Staples (0.8%) | | | | |
| | | | | | ConAgra Foods, Inc.~ | | | | |
| | 5,000,000 | | | | | 1.350%, 09/10/15 | | | 5,009,675 | |
| | 4,500,000 | | | | | 1.300%, 01/25/16 | | | 4,514,063 | |
| | 4,000,000 | | | | | Constellation Brands, Inc.~
7.250%, 09/01/16 | | | 4,295,000 | |
| | 500,000 | | | | | General Mills, Inc.~
0.875%, 01/29/16 | | | 501,080 | |
| | 3,000,000 | | | | | Kraft Foods Group, Inc.~
1.625%, 06/04/15 | | | 3,002,655 | |
| | 11,347,000 | | | | | Reynolds American, Inc.~
1.050%, 10/30/15 | | | 11,352,106 | |
| | 1,000,000 | | | | | WM Wrigley Jr. Company~*
1.400%, 10/21/16 | | | 1,004,400 | |
| | | | | | | | | | |
| | | | | | | | | 29,678,979 | |
| | | | | | | | | | |
| | | | | | Energy (1.6%) | | | | |
| | 5,000,000 | | | | | Chesapeake Energy Corp.~^
3.250%, 03/15/16 | | | 5,006,250 | |
| | | | | | CNOOC, Ltd.~ | | | | |
| | 1,000,000 | | | | | 1.625%, 04/30/17 | | | 1,001,455 | |
| | 500,000 | | | | | 1.125%, 05/09/16 | | | 499,670 | |
| | 3,000,000 | | | | | Enbridge, Inc.~‡
0.924%, 10/01/16 | | | 3,012,915 | |
| | 3,235,000 | | | | | Exterran Holdings, Inc.
7.250%, 12/01/18 | | | 3,313,853 | |
| | 14,110,000 | | | | | Frontier Oil Corp.~
6.875%, 11/15/18 | | | 14,599,405 | |
| | 8,000,000 | | | | | Marathon Oil Corp.~
0.900%, 11/01/15 | | | 8,005,040 | |
| | 1,500,000 | | | | | Nabors Industries, Inc.~
2.350%, 09/15/16 | | | 1,505,603 | |
| | 3,197,000 | | | | | Oasis Petroleum, Inc.^
7.250%, 02/01/19 | | | 3,288,914 | |
| | 7,000,000 | | | | | Petrobras Global Finance, BV~
2.000%, 05/20/16 | | | 6,873,125 | |
| | 14,866,000 | | | | | SESI, LLC~
6.375%, 05/01/19 | | | 15,235,866 | |
| | 1,250,000 | | | | | Whiting Petroleum Corp.^
6.500%, 10/01/18 | | | 1,269,531 | |
| | | | | | | | | | |
| | | | | | | | | 63,611,627 | |
| | | | | | | | | | |
| | | | | | Financials (1.9%) | |
| | 5,000,000 | | | | | ABN AMRO Bank, NV~*
1.375%, 01/22/16 | | | 5,021,525 | |
| | 5,000,000 | | | | | Aviation Capital Group Corp.~*
3.875%, 09/27/16 | | | 5,153,300 | |
| | | | | | | | | | |
PRINCIPAL
AMOUNT | | | | | | | VALUE | |
| | 8,000,000 | | | | | Bank of America Corp.~
1.250%, 01/11/16 | | $ | 8,021,640 | |
| | 7,750,000 | | | | | BB&T Corp.~
1.000%, 04/03/17 | | | 7,742,095 | |
| | 1,000,000 | | | | | Berkshire Hathaway Finance Corp.~
0.950%, 08/15/16 | | | 1,004,605 | |
| | 500,000 | | | | | Berkshire Hathaway, Inc.~
0.800%, 02/11/16 | | | 501,400 | |
| | 5,000,000 | | | | | CIT Group, Inc.^
4.250%, 08/15/17 | | | 5,093,750 | |
| | 10,000,000 | | | | | Citigroup, Inc.~
1.300%, 04/01/16 | | | 10,036,800 | |
| | 1,850,000 | | | | | Deutsche Bank, AG~
1.400%, 02/13/17 | | | 1,853,154 | |
| | 7,000,000 | | | | | Goldman Sachs Group, Inc.~
1.600%, 11/23/15 | | | 7,036,575 | |
| | | | | | iStar Financial, Inc. | | | | |
| | 6,000,000 | | | | | 4.875%, 07/01/18 | | | 6,018,750 | |
| | 6,000,000 | | | | | 3.875%, 07/01/16 | | | 6,045,000 | |
| | 2,000,000 | | | | | 4.000%, 11/01/17 | | | 1,986,250 | |
| | 5,000,000 | | | | | Leucadia National Corp.~
8.125%, 09/15/15 | | | 5,128,125 | |
| | 6,000,000 | | | | | Morgan Stanley~
1.750%, 02/25/16 | | | 6,043,290 | |
| | | | | | | | | | |
| | | | | | | | | 76,686,259 | |
| | | | | | | | | | |
| | | | | | Health Care (1.0%) | |
| | 10,000,000 | | | | | AbbVie, Inc.~
1.200%, 11/06/15 | | | 10,025,950 | |
| | 1,000,000 | | | | | Actavis Funding SCS~
1.300%, 06/15/17 | | | 994,470 | |
| | 5,000,000 | | | | | Amgen, Inc.~
2.500%, 11/15/16 | | | 5,113,575 | |
| | 1,000,000 | | | | | ANZ New Zealand (Int’l), Ltd.~*
1.400%, 04/27/17 | | | 1,003,005 | |
| | 3,000,000 | | | | | Baxter International, Inc.~
0.950%, 06/01/16 | | | 3,002,970 | |
| | 6,000,000 | | | | | Community Health Systems, Inc.
5.125%, 08/15/18 | | | 6,187,500 | |
| | 5,000,000 | | | | | Fresenius US Finance II, Inc.*
9.000%, 07/15/15 | | | 5,071,875 | |
| | 2,703,000 | | | | | HCA, Inc.~
3.750%, 03/15/19 | | | 2,782,401 | |
| | | | | | Mylan, Inc. | | | | |
| | 1,000,000 | | | | | 1.800%, 06/24/16 | | | 1,006,520 | |
| | 500,000 | | | | | 1.350%, 11/29/16 | | | 498,790 | |
| | 3,050,000 | | | | | Thermo Fisher Scientific, Inc.
3.200%, 05/01/15 | | | 3,050,000 | |
| | 1,000,000 | | | | | VPII Escrow Corp.*
6.750%, 08/15/18 | | | 1,061,250 | |
| | | | | | | | | | |
| | | | | | | | | 39,798,306 | |
| | | | | | | | | | |
| | | | | | Industrials (1.5%) | |
| | 12,000,000 | | | | | AerCap Ireland Capital, Ltd. /
AerCap Global Aviation Trust~*
2.750%, 05/15/17 | | | 11,985,000 | |
| | | | |
| 122 | | CALAMOS OPEN-END FAMILY OF FUNDS SEMIANNUAL REPORT | | See accompanying Notes to Schedule of Investments |
Market Neutral Income Fund Schedule of Investments April 30, 2015 (Unaudited)
| | | | | | | | | | |
PRINCIPAL
AMOUNT | | | | | | | VALUE | |
| | 4,000,000 | | | | | Air Lease Corp.~ 4.500%, 01/15/16 | | $ | 4,090,340 | |
| | | | | | CNH Industrial Capital, LLC | | | | |
| | 7,675,000 | | | | | 3.875%, 11/01/15 | | | 7,742,156 | |
| | 4,800,000 | | | | | 3.250%, 02/01/17~^ | | | 4,827,000 | |
| | 5,000,000 | | | | | Deluxe Corp.
6.000%, 11/15/20 | | | 5,303,125 | |
| | 8,000,000 | | | | | Eaton Corp.~
0.950%, 11/02/15 | | | 8,007,240 | |
| | 1,000,000 | | | | | GATX Corp.~ 1.250%, 03/04/17 | | | 997,170 | |
| | 9,175,000 | | | | | Icahn Enterprises, LP~ 3.500%, 03/15/17 | | | 9,243,812 | |
| | 500,000 | | | | | John Deere Capital Corp.~ 1.050%, 10/11/16 | | | 502,468 | |
| | 1,000,000 | | | | | PACCAR Financial Corp.~ 0.800%, 02/08/16 | | | 1,002,875 | |
| | 5,000,000 | | | | | Penske Truck Leasing Company, LP~*
2.500%, 03/15/16 | | | 5,058,500 | |
| | 1,000,000 | | | | | Rockwell Collins, Inc.~‡
0.621%, 12/15/16 | | | 1,000,840 | |
| | | | | | | | | | |
| | | | | | | | | 59,760,526 | |
| | | | | | | | | | |
| | | | | | Information Technology (1.0%) | |
| | 14,700,000 | | | | | Alliance Data Systems Corp.*
5.250%, 12/01/17 | | | 15,306,375 | |
| | 5,000,000 | | | | | Hewlett-Packard Company~
3.000%, 09/15/16 | | | 5,132,825 | |
| | 5,000,000 | | | | | Jabil Circuit, Inc.~
7.750%, 07/15/16 | | | 5,350,000 | |
| | 7,000,000 | | | | | Sanmina Corp.*
4.375%, 06/01/19 | | | 7,070,000 | |
| | 5,000,000 | | | | | Seagate Technology, PLC~
3.750%, 11/15/18 | | | 5,231,525 | |
| | | | | | | | | | |
| | | | | | | | | 38,090,725 | |
| | | | | | | | | | |
| | | | | | Materials (0.5%) | |
| | 5,000,000 | | | | | ArcelorMittal, SA~
5.250%, 02/25/17 | | | 5,206,250 | |
| | 5,000,000 | | | | | Ashland, Inc.~ 3.000%, 03/15/16 | | | 5,043,750 | |
| | 1,000,000 | | | | | BHP Billiton Finance USA, Ltd.~‡
0.523%, 09/30/16 | | | 1,000,025 | |
| | 7,625,000 | | | | | Ecolab, Inc.~
1.000%, 08/09/15 | | | 7,635,751 | |
| | | | | | | | | | |
| | | | | | | | | 18,885,776 | |
| | | | | | | | | | |
| | | | | | Telecommunication Services (0.5%) | |
| | | | | | AT&T, Inc.~ | | | | |
| | 6,155,000 | | | | | 0.800%, 12/01/15 | | | 6,158,908 | |
| | 5,000,000 | | | | | 0.900%, 02/12/16 | | | 5,000,400 | |
| | 5,875,000 | | | | | Brightstar Corp.*
9.500%, 12/01/16 | | | 6,139,375 | |
| | | | | | | | | | |
PRINCIPAL
AMOUNT | | | | | | | VALUE | |
| | | | | | Verizon Communications, Inc.~ | | | | |
| | 500,000 | | | | | 1.801%, 09/15/16‡ | | $ | 507,820 | |
| | 343,000 | | | | | 2.500%, 09/15/16 | | | 350,186 | |
| | | | | | | | | | |
| | | | | | | | | 18,156,689 | |
| | | | | | | | | | |
| | | | | | TOTAL CORPORATE BONDS | | | 466,959,380 | |
| | | | | | | | | | |
| | | | | | | | | | |
NUMBER OF
CONTRACTS | | | | | | | VALUE | |
| | | | | | | | | | |
| | Purchased Options (0.0%)# | |
| | | | | | Consumer Discretionary (0.0%) | |
| | 460 | | | | | Cablevision Systems Corp.
Call, 06/19/15, Strike $19.00 | | | 67,850 | |
| | 383 | | | | | Kohl’s Corp.
Call, 05/15/15, Strike $77.50 | | | 13,405 | |
| | | | | | | | | | |
| | | | | | | | | 81,255 | |
| | | | | | | | | | |
| | | | | | Consumer Staples (0.0%) | |
| | 581 | | | | | Nu Skin Enterprises, Inc.
Call, 06/19/15, Strike $55.00 | | | 264,355 | |
| | | | | | | | | | |
| | | | | | Health Care (0.0%) | |
| | 380 | | | | | Illumina, Inc.
Call, 01/15/16, Strike $210.00 | | | 480,700 | |
| | | | | | | | | | |
| | | | | | Information Technology (0.0%) | |
| | 315 | | | | | VMware, Inc. - Class A
Call, 01/15/16, Strike $105.00 | | | 82,688 | |
| | | | | | | | | | |
| | | | | | TOTAL PURCHASED OPTIONS | | | 908,998 | |
| | | | | | | | | | |
| | | | | | TOTAL SYNTHETIC CONVERTIBLE SECURITIES
(Cost $465,572,243) | | | 467,868,378 | |
| | | | | | | | | | |
NUMBER OF
SHARES | | | | | | | VALUE | |
| | | | | | | | | | |
| | CONVERTIBLE PREFERRED STOCKS (2.4%) | |
| | | | | | Consumer Staples (0.1%) | |
| | 40,000 | | | | | Post Holdings, Inc.
5.250% | | | 3,820,000 | |
| | | | | | | | | | |
| | | | | | Energy (0.9%) | |
| | 600,000 | | | | | Southwestern Energy Company
6.250% | | | 35,592,000 | |
| | | | | | | | | | |
| | | | | | Financials (0.4%) | |
| | 150,000 | | | | | American Tower Corp.
5.500% | | | 15,390,000 | |
| | | | | | | | | | |
| | | | | | Health Care (0.9%) | |
| | 36,307 | | | | | Actavis, PLC
5.500% | | | 36,330,963 | |
| | | | | | | | | | |
| | | | | | Materials (0.1%) | |
| | 3,500 | | | | | Schulman A, Inc.
6.000% | | | 3,626,875 | |
| | | | | | | | | | |
| | | | | | TOTAL CONVERTIBLE PREFERRED STOCKS
(Cost $88,733,310) | | | 94,759,838 | |
| | | | | | | | | | |
| | | | | | | | | | |
| | | | | | |
| See accompanying Notes to Schedule of Investments | | www.calamos.com | | | 123 | |
Market Neutral Income Fund Schedule of Investments April 30, 2015 (Unaudited)
| | | | | | | | | | |
NUMBER OF
SHARES | | | | | | | VALUE | |
| | COMMON STOCKS (48.4%) | |
| | | | | | Consumer Discretionary (6.6%) | |
| | 17,393 | | | | | Advance Auto Parts, Inc. | | $ | 2,487,199 | |
| | 38,167 | | | | | Amazon.com, Inc.~# | | | 16,098,077 | |
| | 2,840 | | | | | AutoZone, Inc.~# | | | 1,910,354 | |
| | 75,533 | | | | | Brinker International, Inc. | | | 4,182,262 | |
| | 81,540 | | | | | Brunswick Corp. | | | 4,080,262 | |
| | 23,657 | | | | | CarMax, Inc.~# | | | 1,611,278 | |
| | 56,777 | | | | | Carnival Corp. | | | 2,496,485 | |
| | 151,378 | | | | | CBS Corp. - Class B~ | | | 9,405,115 | |
| | 54,411 | | | | | Coach, Inc.~ | | | 2,079,044 | |
| | 318,048 | | | | | Comcast Corp. - Class A~ | | | 18,370,452 | |
| | 33,121 | | | | | D.R. Horton, Inc.~ | | | 841,273 | |
| | 18,925 | | | | | Darden Restaurants, Inc.~ | | | 1,206,847 | |
| | 48,923 | | | | | Delphi Automotive, PLC | | | 4,060,609 | |
| | 91,791 | | | | | DIRECTV# | | | 8,325,903 | |
| | 23,657 | | | | | Discovery Communications, Inc. - Class A~# | | | 765,541 | |
| | 23,657 | | | | | Discovery Communications, Inc. - Class C~# | | | 715,151 | |
| | 24,604 | | | | | Dollar General Corp.~ | | | 1,788,957 | |
| | 382,301 | | | | | Ford Motor Company~ | | | 6,040,356 | |
| | 11,356 | | | | | Fossil Group, Inc.~# | | | 953,677 | |
| | 29,335 | | | | | Gap, Inc.~ | | | 1,162,839 | |
| | 101,916 | | | | | General Motors Company, Inc. | | | 3,573,175 | |
| | 219,918 | | | | | Home Depot, Inc.~ | | | 23,526,828 | |
| | 33,120 | | | | | Interpublic Group of Companies, Inc.~ | | | 690,221 | |
| | 327,793 | | | | | La Quinta Holdings, Inc.# | | | 7,893,255 | |
| | 18,169 | | | | | Lennar Corp. - Class A | | | 832,140 | |
| | 183,486 | | | | | Lowe’s Companies, Inc. | | | 12,634,846 | |
| | 26,023 | | | | | Macy’s, Inc.~ | | | 1,681,867 | |
| | 94,998 | | | | | McDonald’s Corp.~ | | | 9,172,057 | |
| | 20,411 | | | | | Michael Kors Holdings, Ltd.# | | | 1,262,624 | |
| | 9,464 | | | | | Mohawk Industries, Inc.~# | | | 1,642,004 | |
| | 3,076 | | | | | Netflix, Inc.~# | | | 1,711,794 | |
| | 121,820 | | | | | Nike, Inc. - Class B~ | | | 12,040,689 | |
| | 223,405 | | | | | Norwegian Cruise Line Holdings, Ltd.# | | | 10,837,377 | |
| | 119,398 | | | | | Party City Holdco, Inc.# | | | 2,482,284 | |
| | 6,434 | | | | | Priceline Group, Inc.~# | | | 7,964,070 | |
| | 87,059 | | | | | PulteGroup, Inc.~ | | | 1,680,239 | |
| | 10,410 | | | | | PVH Corp.~ | | | 1,075,874 | |
| | 18,925 | | | | | Ross Stores, Inc.~ | | | 1,871,304 | |
| | 33,121 | | | | | Royal Caribbean Cruises, Ltd. | | | 2,254,215 | |
| | 112,230 | | | | | Starbucks Corp.~ | | | 5,564,363 | |
| | 70,777 | | | | | Time Warner Cable, Inc.~ | | | 11,007,239 | |
| | 83,367 | | | | | Time Warner, Inc.~ | | | 7,037,008 | |
| | 34,824 | | | | | TJX Companies, Inc.~ | | | 2,247,541 | |
| | 8,800 | | | | | TripAdvisor, Inc.~# | | | 708,312 | |
| | | | | | | | | | |
NUMBER OF
SHARES | | | | | | | VALUE | |
| | 199,855 | | | | | Twenty-First Century Fox, Inc.~ | | $ | 6,811,058 | |
| | 37,190 | | | | | Viacom, Inc. - Class B~ | | | 2,582,846 | |
| | 150,942 | | | | | Vitamin Shoppe, Inc.# | | | 6,321,451 | |
| | 197,112 | | | | | Walt Disney Company~^ | | | 21,430,017 | |
| | 7,570 | | | | | Whirlpool Corp.~ | | | 1,329,292 | |
| | 11,355 | | | | | Wynn Resorts, Ltd.~ | | | 1,261,200 | |
| | 18,925 | | | | | Yum! Brands, Inc.~ | | | 1,626,793 | |
| | | | | | | | | | |
| | | | | | | | | 261,335,664 | |
| | | | | | | | | | |
| | | | | | Consumer Staples (4.3%) | |
| | 262,028 | | | | | Altria Group, Inc.~ | | | 13,114,501 | |
| | 112,135 | | | | | Archer-Daniels-Midland Company | | | 5,481,159 | |
| | 354,859 | | | | | Coca-Cola Company | | | 14,393,081 | |
| | 71,350 | | | | | Colgate-Palmolive Company~ | | | 4,800,428 | |
| | 37,852 | | | | | ConAgra Foods, Inc.~ | | | 1,368,350 | |
| | 25,549 | | | | | Costco Wholesale Corp.~ | | | 3,654,784 | |
| | 147,810 | | | | | CVS Health Corp. | | | 14,676,055 | |
| | 61,130 | | | | | General Mills, Inc. | | | 3,382,934 | |
| | 13,248 | | | | | Hershey Company~ | | | 1,217,756 | |
| | 33,121 | | | | | Kellogg Company~ | | | 2,097,553 | |
| | 30,566 | | | | | Kimberly-Clark Corp.~ | | | 3,352,785 | |
| | 59,459 | | | | | Kraft Foods Group, Inc. | | | 5,039,150 | |
| | 61,509 | | | | | Kroger Company | | | 4,238,585 | |
| | 58,102 | | | | | Lorillard, Inc. | | | 4,059,006 | |
| | 37,757 | | | | | Mead Johnson Nutrition Company~ | | | 3,621,651 | |
| | 198,816 | | | | | Mondelez International, Inc. - Class A | | | 7,628,570 | |
| | 189,447 | | | | | PepsiCo, Inc.~ | | | 18,020,199 | |
| | 158,031 | | | | | Philip Morris International, Inc.~ | | | 13,190,848 | |
| | 280,385 | | | | | Procter & Gamble Company | | | 22,293,411 | |
| | 190,109 | | | | | Wal-Mart Stores, Inc.~ | | | 14,838,007 | |
| | 99,361 | | | | | Walgreens Boots Alliance, Inc. | | | 8,240,008 | |
| | 32,173 | | | | | Whole Foods Market, Inc.~ | | | 1,536,583 | |
| | | | | | | | | | |
| | | | | | | | | 170,245,404 | |
| | | | | | | | | | |
| | | | | | Energy (3.9%) | |
| | 44,570 | | | | | Anadarko Petroleum Corp.~ | | | 4,194,037 | |
| | 23,184 | | | | | Apache Corp.~ | | | 1,585,786 | |
| | 45,895 | | | | | Baker Hughes, Inc.~ | | | 3,141,972 | |
| | 196,259 | | | | | Chevron Corp.~ | | | 21,796,524 | |
| | 117,244 | | | | | ConocoPhillips~ | | | 7,963,212 | |
| | 59,143 | | | | | Devon Energy Corp. | | | 4,034,144 | |
| | 85,922 | | | | | EOG Resources, Inc.~ | | | 8,501,982 | |
| | 26,496 | | | | | EQT Corp.~ | | | 2,383,050 | |
| | 444,302 | | | | | Exxon Mobil Corp. | | | 38,818,666 | |
| | 90,749 | | | | | Halliburton Company | | | 4,442,164 | |
| | 9,463 | | | | | Helmerich & Payne, Inc.~ | | | 737,830 | |
| | 17,032 | | | | | Hess Corp.~ | | | 1,309,761 | |
| | 137,213 | | | | | Kinder Morgan, Inc. | | | 5,893,298 | |
| | 56,779 | | | | | Marathon Oil Corp.~ | | | 1,765,827 | |
| | | | |
| 124 | | CALAMOS OPEN-END FAMILY OF FUNDS SEMIANNUAL REPORT | | See accompanying Notes to Schedule of Investments |
Market Neutral Income Fund Schedule of Investments April 30, 2015 (Unaudited)
| | | | | | | | | | |
NUMBER OF
SHARES | | | | | | | VALUE | |
| | 48,449 | | | | | Marathon Petroleum Corp. | | $ | 4,775,618 | |
| | 12,301 | | | | | Murphy Oil Corp.~ | | | 585,651 | |
| | 45,895 | | | | | National Oilwell Varco, Inc.~ | | | 2,497,147 | |
| | 66,241 | | | | | Noble Energy, Inc. | | | 3,359,743 | |
| | 76,460 | | | | | Occidental Petroleum Corp. | | | 6,124,446 | |
| | 75,372 | | | | | Phillips 66~ | | | 5,977,753 | |
| | 12,301 | | | | | Pioneer Natural Resources Company~ | | | 2,125,367 | |
| | 132,859 | | | | | Schlumberger, Ltd. | | | 12,569,790 | |
| | 96,900 | | | | | Spectra Energy Corp. | | | 3,609,525 | |
| | 99,361 | | | | | Valero Energy Corp.~ | | | 5,653,641 | |
| | | | | | | | | | |
| | | | | | | | | 153,846,934 | |
| | | | | | | | | | |
| | | | | | Financials (8.1%) | |
| | 27,442 | | | | | ACE, Ltd.~ | | | 2,936,020 | |
| | 35,013 | | | | | Aflac, Inc.~ | | | 2,207,220 | |
| | 96,900 | | | | | Allstate Corp.~ | | | 6,750,054 | |
| | 178,376 | | | | | American Express Company | | | 13,815,221 | |
| | 224,271 | | | | | American International Group, Inc. | | | 12,624,215 | |
| | 38,325 | | | | | American Tower Corp. | | | 3,622,862 | |
| | 30,566 | | | | | Ameriprise Financial, Inc.~ | | | 3,829,308 | |
| | 11,356 | | | | | AvalonBay Communities, Inc.~ | | | 1,866,245 | |
| | 1,040,919 | | | | | Bank of America Corp. | | | 16,581,840 | |
| | 203,925 | | | | | Bank of New York Mellon Corp. | | | 8,634,184 | |
| | 86,681 | | | | | BB&T Corp. | | | 3,319,015 | |
| | 203,925 | | | | | Berkshire Hathaway, Inc. - Class B# | | | 28,796,249 | |
| | 12,207 | | | | | BlackRock, Inc.~ | | | 4,442,616 | |
| | 114,062 | | | | | Blackstone Group, LP~ | | | 4,671,980 | |
| | 66,241 | | | | | Capital One Financial Corp. | | | 5,355,585 | |
| | 165,602 | | | | | Charles Schwab Corp.~ | | | 5,050,861 | |
| | 18,925 | | | | | Chubb Corp.~ | | | 1,861,274 | |
| | 28,334 | | | | | CIT Group, Inc. | | | 1,275,880 | |
| | 295,715 | | | | | Citigroup, Inc.~ | | | 15,767,524 | |
| | 31,418 | | | | | Crown Castle International Corp.~ | | | 2,624,346 | |
| | 48,261 | | | | | Discover Financial Services~ | | | 2,797,690 | |
| | 34,634 | | | | | Equity Residential~ | | | 2,558,067 | |
| | 104,091 | | | | | Fifth Third Bancorp~ | | | 2,081,820 | |
| | 451,802 | | | | | Fortress Investment Group, LLC - Class A | | | 3,668,632 | |
| | 40,217 | | | | | Franklin Resources, Inc.~ | | | 2,073,589 | |
| | 75,702 | | | | | Genworth Financial, Inc. - Class A~# | | | 665,421 | |
| | 43,814 | | | | | Goldman Sachs Group, Inc.~ | | | 8,605,946 | |
| | 42,583 | | | | | Hartford Financial Services Group, Inc.~ | | | 1,736,109 | |
| | 31,394 | | | | | Health Care REIT, Inc. | | | 2,260,996 | |
| | 184,768 | | | | | Hilltop Holdings, Inc.# | | | 3,715,684 | |
| | 83,273 | | | | | Host Hotels & Resorts, Inc. | | | 1,677,118 | |
| | 70,971 | | | | | Invesco, Ltd. | | | 2,939,619 | |
| | 502,290 | | | | | JPMorgan Chase & Company~ | | | 31,774,865 | |
| | 72,391 | | | | | Lincoln National Corp. | | | 4,089,368 | |
| | | | | | | | | | |
NUMBER OF
SHARES | | | | | | | VALUE | |
| | 14,194 | | | | | Macerich Company | | $ | 1,160,501 | |
| | 159,204 | | | | | MetLife, Inc.~ | | | 8,165,573 | |
| | 137,685 | | | | | Morgan Stanley~ | | | 5,137,027 | |
| | 262,694 | | | | | Navient Corp.~ | | | 5,133,041 | |
| | 54,648 | | | | | PNC Financial Services Group, Inc.~ | | | 5,012,861 | |
| | 45,234 | | | | | Principal Financial Group, Inc.~ | | | 2,312,362 | |
| | 52,046 | | | | | Prologis, Inc.~ | | | 2,092,249 | |
| | 85,639 | | | | | Prudential Financial, Inc.~ | | | 6,988,142 | |
| | 14,053 | | | | | Public Storage~ | | | 2,640,699 | |
| | 179,797 | | | | | Regions Financial Corp.~ | | | 1,767,404 | |
| | 41,826 | | | | | Simon Property Group, Inc. | | | 7,591,001 | |
| | 41,164 | | | | | State Street Corp.~ | | | 3,174,568 | |
| | 56,777 | | | | | SunTrust Banks, Inc.~ | | | 2,356,245 | |
| | 25,549 | | | | | T. Rowe Price Group, Inc.~ | | | 2,074,068 | |
| | 26,306 | | | | | Travelers Companies, Inc.~ | | | 2,659,800 | |
| | 243,197 | | | | | US Bancorp~ | | | 10,425,855 | |
| | 30,754 | | | | | Ventas, Inc.~ | | | 2,118,951 | |
| | 28,389 | | | | | Vornado Realty Trust | | | 2,937,978 | |
| | 481,093 | | | | | Wells Fargo & Company~ | | | 26,508,224 | |
| | | | | | | | | | |
| | | | | | | | | 316,933,972 | |
| | | | | | | | | | |
| | | | | | Health Care (7.1%) | |
| | 133,332 | | | | | Abbott Laboratories~ | | | 6,189,271 | |
| | 208,752 | | | | | AbbVie, Inc.~ | | | 13,497,904 | |
| | 48,123 | | | | | Actavis, PLC# | | | 13,612,072 | |
| | 56,304 | | | | | Aetna, Inc. | | | 6,017,209 | |
| | 223,438 | | | | | Agilent Technologies, Inc.~ | | | 9,243,630 | |
| | 19,873 | | | | | Alexion Pharmaceuticals, Inc.# | | | 3,363,108 | |
| | 75,419 | | | | | Amgen, Inc. | | | 11,909,414 | |
| | 38,325 | | | | | Anthem, Inc. | | | 5,784,392 | |
| | 61,130 | | | | | Baxter International, Inc.~ | | | 4,202,076 | |
| | 29,051 | | | | | Biogen, Inc.~# | | | 10,863,040 | |
| | 142,984 | | | | | Bristol-Myers Squibb Company~ | | | 9,112,370 | |
| | 113,756 | | | | | Celgene Corp.~# | | | 12,292,473 | |
| | 49,680 | | | | | Cerner Corp.# | | | 3,567,521 | |
| | 48,261 | | | | | Cigna Corp. | | | 6,015,251 | |
| | 18,925 | | | | | DaVita HealthCare Partners, Inc.~# | | | 1,534,818 | |
| | 22,003 | | | | | Edwards Lifesciences Corp.~# | | | 2,786,680 | |
| | 91,791 | | | | | Eli Lilly and Company~ | | | 6,597,019 | |
| | 99,266 | | | | | Express Scripts Holding Company~^# | | | 8,576,582 | |
| | 161,248 | | | | | Gilead Sciences, Inc.# | | | 16,207,037 | |
| | 67,729 | | | | | Insulet Corp.# | | | 2,021,711 | |
| | 286,205 | | | | | Johnson & Johnson | | | 28,391,536 | |
| | 22,712 | | | | | Laboratory Corp. of America Holdings~# | | | 2,715,447 | |
| | 181,767 | | | | | Medtronic, PLC | | | 13,532,553 | |
| | 350,883 | | | | | Merck & Company, Inc. | | | 20,898,592 | |
| | 42,993 | | | | | Mylan, NV# | | | 3,106,674 | |
| | 14,088 | | | | | Perrigo Company, PLC | | | 2,582,049 | |
| | | | | | |
| See accompanying Notes to Schedule of Investments | | www.calamos.com | | | 125 | |
Market Neutral Income Fund Schedule of Investments April 30, 2015 (Unaudited)
| | | | | | | | | | |
NUMBER OF
SHARES | | | | | | | VALUE | |
| | 661,268 | | | | | Pfizer, Inc.~ | | $ | 22,436,823 | |
| | 280,319 | | | | | Presbia, PLC^#** | | | 2,204,429 | |
| | 14,194 | | | | | Quest Diagnostics, Inc.~ | | | 1,013,736 | |
| | 3,785 | | | | | Regeneron Pharmaceuticals, Inc.~# | | | 1,731,486 | |
| | 52,283 | | | | | St. Jude Medical, Inc.~ | | | 3,662,424 | |
| | 42,583 | | | | | Stryker Corp.~ | | | 3,927,856 | |
| | 76,460 | | | | | Thermo Fisher Scientific, Inc.~ | | | 9,609,493 | |
| | 86,681 | | | | | UnitedHealth Group, Inc. | | | 9,656,263 | |
| | | | | | | | | | |
| | | | | | | | | 278,862,939 | |
| | | | | | | | | | |
| | | | | | Industrials (4.3%) | |
| | 51,951 | | | | | 3M Company | | | 8,124,617 | |
| | 94,630 | | | | | Boeing Company~ | | | 13,564,264 | |
| | 62,171 | | | | | Caterpillar, Inc.~ | | | 5,401,416 | |
| | 94,630 | | | | | CSX Corp.~ | | | 3,415,197 | |
| | 17,979 | | | | | Cummins, Inc.~ | | | 2,485,776 | |
| | 61,130 | | | | | Danaher Corp.~ | | | 5,005,324 | |
| | 68,890 | | | | | Deere & Company | | | 6,235,923 | |
| | 142,701 | | | | | Delta Air Lines, Inc. | | | 6,370,173 | |
| | 37,378 | | | | | Eaton Corp., PLC | | | 2,568,990 | |
| | 61,130 | | | | | Emerson Electric Company~ | | | 3,596,278 | |
| | 29,808 | | | | | Expeditors International of Washington, Inc.~ | | | 1,366,101 | |
| | 35,675 | | | | | FedEx Corp. | | | 6,049,410 | |
| | 31,228 | | | | | Fluor Corp.~ | | | 1,878,052 | |
| | 66,241 | | | | | General Dynamics Corp. | | | 9,096,214 | |
| | 894,623 | | | | | General Electric Company~ | | | 24,226,391 | |
| | 110,290 | | | | | Honeywell International, Inc.~ | | | 11,130,467 | |
| | 40,785 | | | | | Illinois Tool Works, Inc.~ | | | 3,816,660 | |
| | 21,883 | | | | | Jacobs Engineering Group, Inc.~# | | | 937,905 | |
| | 20,818 | | | | | Kansas City Southern~ | | | 2,133,637 | |
| | 13,058 | | | | | Lockheed Martin Corp. | | | 2,436,623 | |
| | 66,241 | | | | | Masco Corp.~ | | | 1,754,724 | |
| | 46,177 | | | | | Norfolk Southern Corp. | | | 4,656,950 | |
| | 33,121 | | | | | Pentair, PLC | | | 2,058,470 | |
| | 29,524 | | | | | Precision Castparts Corp. | | | 6,102,316 | |
| | 23,657 | | | | | Robert Half International, Inc.~ | | | 1,311,781 | |
| | 122,688 | | | | | Southwest Airlines Company~ | | | 4,976,225 | |
| | 81,570 | | | | | Union Pacific Corp.~ | | | 8,665,181 | |
| | 84,125 | | | | | United Parcel Service, Inc. - Class B | | | 8,457,086 | |
| | 95,008 | | | | | United Technologies Corp.~ | | | 10,807,160 | |
| | | | | | | | | | |
| | | | | | | | | 168,629,311 | |
| | | | | | | | | | |
| | | | | | Information Technology (10.0%) | |
| | 56,115 | | | | | Accenture, PLC - Class A~ | | | 5,199,055 | |
| | 37,852 | | | | | Akamai Technologies, Inc.~# | | | 2,792,721 | |
| | 37,852 | | | | | Amphenol Corp. - Class A~ | | | 2,095,865 | |
| | 724,525 | | | | | Apple, Inc. | | | 90,674,304 | |
| | 151,406 | | | | | Applied Materials, Inc. | | | 2,996,325 | |
| | 23,657 | | | | | Avago Technologies, Ltd. | | | 2,765,030 | |
| | | | | | | | | | |
NUMBER OF
SHARES | | | | | | | VALUE | |
| | 66,241 | | | | | Broadcom Corp. - Class A~ | | $ | 2,928,183 | |
| | 484,312 | | | | | Cisco Systems, Inc. | | | 13,962,715 | |
| | 71,445 | | | | | Cognizant Technology Solutions Corp. - Class A# | | | 4,182,390 | |
| | 108,506 | | | | | eBay, Inc.# | | | 6,321,559 | |
| | 284,739 | | | | | EMC Corp.~ | | | 7,662,326 | |
| | 21,293 | | | | | F5 Networks, Inc.~# | | | 2,598,172 | |
| | 251,880 | | | | | Facebook, Inc. - Class A~# | | | 19,840,588 | |
| | 61,130 | | | | | Fiserv, Inc.# | | | 4,743,688 | |
| | 35,693 | | | | | Google, Inc. - Class A~# | | | 19,587,248 | |
| | 33,287 | | | | | Google, Inc. - Class C~# | | | 17,886,437 | |
| | 229,002 | | | | | Hewlett-Packard Company~ | | | 7,550,196 | |
| | 129,201 | | | | | IAC/InterActiveCorp | | | 9,020,814 | |
| | 585,564 | | | | | Intel Corp.~ | | | 19,060,108 | |
| | 99,551 | | | | | International Business Machines Corp. | | | 17,052,091 | |
| | 68,591 | | | | | Juniper Networks, Inc.~ | | | 1,812,860 | |
| | 27,916 | | | | | KLA-Tencor Corp.~ | | | 1,641,461 | |
| | 160,206 | | | | | MasterCard, Inc. - Class A | | | 14,452,183 | |
| | 37,852 | | | | | Microchip Technology, Inc. | | | 1,803,837 | |
| | 104,091 | | | | | Micron Technology, Inc.~# | | | 2,928,080 | |
| | 938,057 | | | | | Microsoft Corp.~ | | | 45,627,092 | |
| | 351,263 | | | | | Oracle Corp. | | | 15,322,092 | |
| | 161,816 | | | | | QUALCOMM, Inc. | | | 11,003,488 | |
| | 18,925 | | | | | Red Hat, Inc.~# | | | 1,424,295 | |
| | 80,435 | | | | | Symantec Corp.~ | | | 2,004,842 | |
| | 37,852 | | | | | TE Connectivity, Ltd. | | | 2,519,051 | |
| | 18,925 | | | | | Teradata Corp.# | | | 832,511 | |
| | 122,356 | | | | | Texas Instruments, Inc.~ | | | 6,632,919 | |
| | 315,682 | | | | | Visa, Inc. - Class A^ | | | 20,850,796 | |
| | 31,506 | | | | | Western Digital Corp. | | | 3,079,396 | |
| | 73,338 | | | | | Yahoo!, Inc.# | | | 3,121,632 | |
| | | | | | | | | | |
| | | | | | | | | 393,976,350 | |
| | | | | | | | | | |
| | | | | | Materials (1.6%) | |
| | 26,496 | | | | | Air Products & Chemicals, Inc. | | | 3,800,321 | |
| | 6,150 | | | | | Airgas, Inc.~ | | | 622,872 | |
| | 23,657 | | | | | Allegheny Technologies, Inc.~ | | | 804,101 | |
| | 219,280 | | | | | Berry Plastics Group, Inc.# | | | 7,503,762 | |
| | 8,518 | | | | | CF Industries Holdings, Inc.~ | | | 2,448,669 | |
| | 163,141 | | | | | Dow Chemical Company~ | | | 8,320,191 | |
| | 99,929 | | | | | E.I. du Pont de Nemours and Company | | | 7,314,803 | |
| | 9,463 | | | | | Eastman Chemical Company~ | | | 721,270 | |
| | 166,170 | | | | | Freeport-McMoRan, Inc. | | | 3,866,776 | |
| | 51,005 | | | | | LyondellBasell Industries, NV - Class A | | | 5,280,038 | |
| | 88,667 | | | | | Monsanto Company | | | 10,104,491 | |
| | 71,350 | | | | | Mosaic Company | | | 3,139,400 | |
| | 79,488 | | | | | Newmont Mining Corp.~ | | | 2,105,637 | |
| | 16,276 | | | | | PPG Industries, Inc. | | | 3,606,111 | |
| | 35,675 | | | | | Praxair, Inc. | | | 4,349,853 | |
| | | | | | | | | | |
| | | | | | | | | 63,988,295 | |
| | | | | | | | | | |
| | | | |
| 126 | | CALAMOS OPEN-END FAMILY OF FUNDS SEMIANNUAL REPORT | | See accompanying Notes to Schedule of Investments |
Market Neutral Income Fund Schedule of Investments April 30, 2015 (Unaudited)
| | | | | | | | | | |
NUMBER OF
SHARES | | | | | | | VALUE | |
| | | | | | | | | | |
| | | | | | Telecommunication Services (1.1%) | |
| | 530,301 | | | | | AT&T, Inc.~ | | $ | 18,369,626 | |
| | 95,859 | | | | | CenturyLink, Inc.~ | | | 3,447,090 | |
| | 397,630 | | | | | Verizon Communications, Inc.~ | | | 20,056,457 | |
| | | | | | | | | | |
| | | | | | | | | 41,873,173 | |
| | | | | | | | | | |
| | | | | | Utilities (1.4%) | |
| | 99,361 | | | | | AES Corp.~ | | | 1,316,533 | |
| | 64,253 | | | | | American Electric Power Company, Inc.~ | | | 3,654,068 | |
| | 52,046 | | | | | CMS Energy Corp.~ | | | 1,765,921 | |
| | 37,852 | | | | | Consolidated Edison, Inc.~ | | | 2,329,791 | |
| | 45,895 | | | | | Dominion Resources, Inc.~ | | | 3,289,754 | |
| | 127,465 | | | | | Duke Energy Corp.~ | | | 9,887,460 | |
| | 47,314 | | | | | Edison International | | | 2,883,315 | |
| | 22,712 | | | | | Entergy Corp.~ | | | 1,752,912 | |
| | 18,925 | | | | | Eversource Energy~ | | | 922,783 | |
| | 66,241 | | | | | Exelon Corp.~ | | | 2,253,519 | |
| | 47,314 | | | | | FirstEnergy Corp.~ | | | 1,699,046 | |
| | 77,974 | | | | | NextEra Energy, Inc. | | | 7,869,916 | |
| | 56,777 | | | | | PG&E Corp. | | | 3,004,639 | |
| | 47,314 | | | | | PPL Corp.~ | | | 1,610,095 | |
| | 56,777 | | | | | Public Service Enterprise Group, Inc.~ | | | 2,358,517 | |
| | 164,181 | | | | | Southern Company | | | 7,273,218 | |
| | 42,583 | | | | | Xcel Energy, Inc.~ | | | 1,443,989 | |
| | | | | | | | | | |
| | | | | | | | | 55,315,476 | |
| | | | | | | | | | |
| | | | | | TOTAL COMMON STOCKS
(Cost $1,785,129,402) | | | 1,905,007,518 | |
| | | | | | | | | | |
| | | | | | | | | | |
NUMBER OF
CONTRACTS | | | | | | | VALUE | |
| | PURCHASED OPTIONS (0.4%)# | |
| | | | | | Industrials (0.0%) | | | | |
| | 750 | | | | | Greenbrier Companies, Inc. Put, 01/15/16, Strike $35.00 | | | 99,375 | |
| | | | | | | | | | |
| | | | | | Other (0.4%) | | | | |
| | 500 | | | | | United States Treasury Note Put, 05/22/15, Strike $109.50 | | | 54,688 | |
| | | | | | S & P 500 Index | | | | |
| | 2,000 | | | | | Put, 05/29/15, Strike $2,100.00 | | | 7,700,000 | |
| | 1,000 | | | | | Put, 05/01/15, Strike $1,990.00 | | | 10,000 | |
| | 1,000 | | | | | Put, 05/08/15, Strike $2,075.00 | | | 1,350,000 | |
| | 1,000 | | | | | Put, 05/08/15, Strike $1,975.00 | | | 100,000 | |
| | 1,000 | | | | | Put, 05/29/15, Strike $2,000.00 | | | 1,000,000 | |
| | 1,000 | | | | | Put, 06/30/15, Strike $2,075.00 | | | 4,500,000 | |
| | 1,000 | | | | | Put, 06/30/15, Strike $2,000.00 | | | 2,435,000 | |
| | 500 | | | | | Put, 05/08/15, Strike $2,040.00 | | | 260,000 | |
| | | | | | | | | | |
| | | | | | | | | 17,409,688 | |
| | | | | | | | | | |
| | | | | | TOTAL PURCHASED OPTIONS
(Cost $16,070,011) | | | 17,509,063 | |
| | | | | | | | | | |
| | | | | | | | | | |
NUMBER OF
SHARES | | | | | | | VALUE | |
| | SHORT TERM INVESTMENT (0.9%) | |
| | 35,238,278 | | | | | Fidelity Prime Money Market Fund -
Institutional Class
(Cost $35,238,278) | | | 35,238,278 | |
| | | | | | | | | | |
NUMBER OF
SHARES/
PRINCIPAL
AMOUNT | | | | | | | VALUE | |
| INVESTMENT OF CASH COLLATERAL FOR SECURITIES
LOANED (3.1%) |
|
| | | | | | Federal Home Loan Bank Discount Notes | |
| | 22,619,683 | | | | | 0.000%, 05/29/15 | | | 22,619,683 | |
| | 14,138,410 | | | | | 0.000%, 06/10/15 | | | 14,138,410 | |
| | 7,069,511 | | | | | 0.000%, 05/27/15 | | | 7,069,511 | |
| | 7,069,317 | | | | | 0.000%, 06/15/15 | | | 7,069,317 | |
| | 14,137,731 | | | | | Federal Home Loan Mortgage Corp. Discount Note
0.000%, 06/01/15 | | | 14,137,731 | |
| | 28,086,760 | | | | | Fidelity Prime Money Market Fund -
Institutional Class | | | 28,086,760 | |
| | 12,882,228 | | | | | Goldman Sachs Financial Square Fund | | | 12,882,228 | |
| | 14,139,447 | | | | | Morgan Stanley Institutional Liquidity Fund | | | 14,139,447 | |
| | | | | | | | | | |
| | | | | | TOTAL INVESTMENT OF
CASH COLLATERAL FOR
SECURITIES LOANED
(Cost $120,143,087) | | | 120,143,087 | |
| | | | | | | | | | |
| TOTAL INVESTMENTS (102.2%)
(Cost $3,853,735,194) | | | 4,022,740,279 | |
| | | | | | | | | | |
| |
| | PAYABLE UPON RETURN OF SECURITIES ON LOAN (-3.1%) | | | (120,143,087 | ) |
| | | | | | | | | | |
| |
| | OTHER ASSETS, LESS LIABILITIES (0.9%) | | | 34,166,226 | |
| | | | | | | | | | |
| |
| | NET ASSETS (100.0%) | | $ | 3,936,763,418 | |
| | | | | | | | | | |
| | | | | | | | | | |
NUMBER OF
SHARES | | | | | | | VALUE | |
| | COMMON STOCKS SOLD SHORT (-22.4%)# | |
| | | | | | Consumer Discretionary (-3.6%) | | | | |
| | (172,336 | ) | | | | Cablevision Systems Corp. | | | (3,443,273 | ) |
| | (57,853 | ) | | | | Cheesecake Factory, Inc. | | | (2,900,171 | ) |
| | (96,050 | ) | | | | Ctrip.com International, Ltd. | | | (6,116,464 | ) |
| | (78,500 | ) | | | | HomeAway, Inc. | | | (2,194,075 | ) |
| | (42,000 | ) | | | | HSN, Inc. | | | (2,621,640 | ) |
| | (130,300 | ) | | | | Iconix Brand Group, Inc. | | | (3,428,193 | ) |
| | (477,000 | ) | | | | Jarden Corp. | | | (24,412,860 | ) |
| | (74,630 | ) | | | | Kate Spade & Company | | | (2,440,401 | ) |
| | (38,367 | ) | | | | Kohl’s Corp. | | | (2,748,996 | ) |
| | (24,049 | ) | | | | L Brands, Inc. | | | (2,149,019 | ) |
| | (130,800 | ) | | | | Live Nation Entertainment, Inc. | | | (3,277,848 | ) |
| | | | | | |
| See accompanying Notes to Schedule of Investments | | www.calamos.com | | | 127 | |
Market Neutral Income Fund Schedule of Investments April 30, 2015 (Unaudited)
| | | | | | | | | | |
NUMBER OF
SHARES | | | | | | | VALUE | |
| | (60,500 | ) | | | | M/I Homes, Inc. | | $ | (1,364,880 | ) |
| | (96,650 | ) | | | | Meritage Homes Corp. | | | (4,133,720 | ) |
| | (27,355 | ) | | | | Omnicom Group, Inc. | | | (2,072,415 | ) |
| | (14,110 | ) | | | | Priceline Group, Inc. | | | (17,465,499 | ) |
| | (54,000 | ) | | | | Restoration Hardware Holdings, Inc. | | | (4,653,180 | ) |
| | (312,500 | ) | | | | Ryland Group, Inc. | | | (12,881,250 | ) |
| | (98,045 | ) | | | | Shutterfly, Inc. | | | (4,388,494 | ) |
| | (546,400 | ) | | | | Standard Pacific Corp. | | | (4,425,840 | ) |
| | (167,600 | ) | | | | TAL Education Group | | | (6,159,300 | ) |
| | (56,200 | ) | | | | Tesla Motors, Inc. | | | (12,704,010 | ) |
| | (80,000 | ) | | | | Toll Brothers, Inc. | | | (2,843,200 | ) |
| | (505,500 | ) | | | | Vipshop Holdings, Ltd. | | | (14,300,595 | ) |
| | (33,733 | ) | | | | Zumiez, Inc. | | | (1,069,673 | ) |
| | | | | | | | | | |
| | | | | | | | | (144,194,996 | ) |
| | | | | | | | | | |
| | | | | | Consumer Staples (-0.1%) | | | | |
| | (90,000 | ) | | | | IGI Laboratories, Inc. | | | (457,200 | ) |
| | (58,700 | ) | | | | Post Holdings, Inc. | | | (2,755,378 | ) |
| | | | | | | | | | |
| | | | | | | | | (3,212,578 | ) |
| | | | | | | | | | |
| | | | | | Energy (-1.7%) | | | | |
| | (156,000 | ) | | | | Helix Energy Solutions Group, Inc. | | | (2,570,880 | ) |
| | (336,328 | ) | | | | Newpark Resources, Inc. | | | (3,450,725 | ) |
| | (228,500 | ) | | | | PDC Energy, Inc. | | | (12,965,090 | ) |
| | (150,000 | ) | | | | Renewable Energy Group, Inc. | | | (1,381,500 | ) |
| | (105,550 | ) | | | | SEACOR Holdings, Inc. | | | (7,669,263 | ) |
| | (1,020,000 | ) | | | | Southwestern Energy Company | | | (28,590,600 | ) |
| | (32,000 | ) | | | | Stone Energy Corp. | | | (546,240 | ) |
| | (220,000 | ) | | | | Whiting Petroleum Corp. | | | (8,340,200 | ) |
| | | | | | | | | | |
| | | | | | | | | (65,514,498 | ) |
| | | | | | | | | | |
| | | | | | Financials (-1.4%) | |
| | (101,250 | ) | | | | American Residential Properties, Inc. | | | (1,899,450 | ) |
| | (115,000 | ) | | | | American Tower Corp. | | | (10,870,950 | ) |
| | (66,059 | ) | | | | Amtrust Financial Services, Inc. | | | (3,928,528 | ) |
| | (127,530 | ) | | | | Cohen & Steers, Inc. | | | (4,828,286 | ) |
| | (497,900 | ) | | | | Cowen Group, Inc. | | | (2,783,261 | ) |
| | (315,000 | ) | | | | DDR Corp. | | | (5,370,750 | ) |
| | (187,959 | ) | | | | Encore Capital Group, Inc. | | | (7,601,062 | ) |
| | (118,400 | ) | | | | Ezcorp, Inc. - Class A | | | (1,089,280 | ) |
| | (135,500 | ) | | | | Forestar Group, Inc. | | | (1,999,980 | ) |
| | (36,019 | ) | | | | NASDAQ OMX Group, Inc. | | | (1,751,604 | ) |
| | (59,000 | ) | | | | SL Green Realty Corp. | | | (7,219,240 | ) |
| | (40,000 | ) | | | | Starwood Property Trust, Inc. | | | (960,400 | ) |
| | (137,500 | ) | | | | Starwood Waypoint Residential Trust | | | (3,539,250 | ) |
| | | | | | | | | | |
| | | | | | | | | (53,842,041 | ) |
| | | | | | | | | | |
| | | | | | Health Care (-4.0%) | |
| | (134,000 | ) | | | | Acorda Therapeutics, Inc. | | | (4,029,380 | ) |
| | (82,000 | ) | | | | Actavis, PLC | | | (23,194,520 | ) |
| | | | | | | | | | |
NUMBER OF
SHARES | | | | | | | VALUE | |
| | (185,000 | ) | | | | Allscripts Healthcare Solutions, Inc. | | $ | (2,460,500 | ) |
| | (355,000 | ) | | | | AMAG Pharmaceuticals, Inc. | | | (18,094,350 | ) |
| | (280,500 | ) | | | | Brookdale Senior Living, Inc. | | | (10,162,515 | ) |
| | (334,000 | ) | | | | Depomed, Inc. | | | (7,768,840 | ) |
| | (34,321 | ) | | | | DexCom, Inc. | | | (2,319,070 | ) |
| | (80,000 | ) | | | | Emergent Biosolutions, Inc. | | | (2,375,200 | ) |
| | (260,000 | ) | | | | Healthways, Inc. | | | (4,524,000 | ) |
| | (75,000 | ) | | | | Horizon Pharma, PLC | | | (2,109,000 | ) |
| | (15,939 | ) | | | | Illumina, Inc. | | | (2,936,761 | ) |
| | (49,000 | ) | | | | Insulet Corp. | | | (1,462,650 | ) |
| | (127,500 | ) | | | | Integra LifeSciences Holdings Corp. | | | (7,494,450 | ) |
| | (37,500 | ) | | | | Jazz Pharmaceuticals, PLC | | | (6,701,250 | ) |
| | (78,200 | ) | | | | Ligand Pharmaceuticals, Inc. | | | (6,071,448 | ) |
| | (470,000 | ) | | | | Medicines Company | | | (12,036,700 | ) |
| | (242,852 | ) | | | | Molina Healthcare, Inc. | | | (14,384,124 | ) |
| | (125,500 | ) | | | | NuVasive, Inc. | | | (5,613,615 | ) |
| | (116,973 | ) | | | | Quidel Corp. | | | (2,725,471 | ) |
| | (181,000 | ) | | | | Spectranetics Corp. | | | (4,642,650 | ) |
| | (75,741 | ) | | DKK | | William Demant Holding, A/S | | | (6,230,733 | ) |
| | (210,000 | ) | | | | Wright Medical Group, Inc. | | | (5,327,700 | ) |
| | (35,578 | ) | | | | Zimmer Holdings, Inc. | | | (3,907,888 | ) |
| | | | | | | | | | |
| | | | | | | | | (156,572,815 | ) |
| | | | | | | | | | |
| | | | | | Industrials (-0.7%) | |
| | (444,400 | ) | | | | CBIZ, Inc. | | | (4,017,376 | ) |
| | (79,075 | ) | | | | Deluxe Corp. | | | (5,120,106 | ) |
| | (42,000 | ) | | | | Echo Global Logistics, Inc. | | | (1,213,800 | ) |
| | (183,600 | ) | | | | Navistar International Corp. | | | (5,500,656 | ) |
| | (55,225 | ) | | | | Nielsen, NV | | | (2,481,812 | ) |
| | (15,000 | ) | | | | SolarCity Corp. | | | (900,750 | ) |
| | (300,000 | ) | | | | Trinity Industries, Inc. | | | (8,127,000 | ) |
| | | | | | | | | | |
| | | | | | | | | (27,361,500 | ) |
| | | | | | | | | | |
| | | | | | Information Technology (-10.3%) | |
| | (80,000 | ) | | | | AOL, Inc. | | | (3,192,000 | ) |
| | (55,500 | ) | | | | Blucora, Inc. | | | (758,685 | ) |
| | (142,500 | ) | | | | Bottomline Technologies (de), Inc. | | | (3,813,300 | ) |
| | (98,200 | ) | | | | BroadSoft, Inc. | | | (3,107,048 | ) |
| | (74,176 | ) | | | | Brocade Communications Systems, Inc. | | | (838,189 | ) |
| | (50,000 | ) | | | | CalAmp Corp. | | | (985,500 | ) |
| | (85,000 | ) | | | | Canadian Solar, Inc. | | | (3,009,000 | ) |
| | (93,999 | ) | | | | Cardtronics, Inc. | | | (3,546,582 | ) |
| | (549,400 | ) | | | | Ciena Corp. | | | (11,702,220 | ) |
| | (52,600 | ) | | | | Citrix Systems, Inc. | | | (3,532,616 | ) |
| | (87,900 | ) | | | | Cornerstone OnDemand, Inc. | | | (2,516,577 | ) |
| | (392,600 | ) | | | | CSG Systems International, Inc. | | | (11,432,512 | ) |
| | (99,000 | ) | | | | Dealertrack Technologies, Inc. | | | (3,891,690 | ) |
| | (925,000 | ) | | | | Electronic Arts, Inc. | | | (53,733,250 | ) |
| | | | |
| 128 | | CALAMOS OPEN-END FAMILY OF FUNDS SEMIANNUAL REPORT | | See accompanying Notes to Schedule of Investments |
Market Neutral Income Fund Schedule of Investments April 30, 2015 (Unaudited)
| | | | | | | | | | |
NUMBER OF
SHARES | | | | | | | VALUE | |
| | (120,000 | ) | | | | Electronics For Imaging, Inc. | | $ | (5,007,600 | ) |
| | (637,500 | ) | | | | Emulex Corp. | | | (5,112,750 | ) |
| | (95,000 | ) | | | | EnerNOC, Inc. | | | (1,049,750 | ) |
| | (60,000 | ) | | | | Envestnet, Inc. | | | (3,075,600 | ) |
| | (40,200 | ) | | | | Euronet Worldwide, Inc. | | | (2,350,896 | ) |
| | (220,000 | ) | | | | Finisar Corp. | | | (4,472,600 | ) |
| | (666,750 | ) | | | | Infinera Corp. | | | (12,534,900 | ) |
| | (113,000 | ) | | | | InterDigital, Inc. | | | (6,183,360 | ) |
| | (317,800 | ) | | | | JDS Uniphase Corp. | | | (4,023,348 | ) |
| | (90,000 | ) | | | | Lam Research Corp. | | | (6,802,200 | ) |
| | (26,000 | ) | | | | LinkedIn Corp. | | | (6,555,380 | ) |
| | (342,900 | ) | | | | Mentor Graphics Corp. | | | (8,205,597 | ) |
| | (69,700 | ) | | | | MercadoLibre, Inc. | | | (9,920,401 | ) |
| | (156,000 | ) | | | | Microchip Technology, Inc. | | | (7,434,180 | ) |
| | (13,500 | ) | | | | NetSuite, Inc. | | | (1,290,195 | ) |
| | (781,000 | ) | | | | NVIDIA Corp. | | | (17,334,295 | ) |
| | (103,773 | ) | | | | NXP Semiconductors, NV | | | (9,974,661 | ) |
| | (1,297,000 | ) | | | | ON Semiconductor Corp. | | | (14,941,440 | ) |
| | (86,500 | ) | | | | Palo Alto Networks, Inc. | | | (12,777,780 | ) |
| | (230,575 | ) | | | | Photronics, Inc. | | | (2,022,143 | ) |
| | (170,400 | ) | | | | Proofpoint, Inc. | | | (9,198,192 | ) |
| | (58,200 | ) | | | | PROS Holdings, Inc. | | | (1,293,786 | ) |
| | (136,500 | ) | | | | Qihoo 360 Technology Company, Ltd. | | | (8,230,950 | ) |
| | (479,000 | ) | | | | Rambus, Inc. | | | (6,629,360 | ) |
| | (153,589 | ) | | | | Rovi Corp. | | | (2,842,932 | ) |
| | (174,700 | ) | | | | Salesforce.com, Inc. | | | (12,721,654 | ) |
| | (522,400 | ) | | | | SanDisk Corp. | | | (34,969,456 | ) |
| | (45,000 | ) | | | | ServiceNow, Inc. | | | (3,368,700 | ) |
| | (8,000 | ) | | | | SINA Corp. | | | (351,960 | ) |
| | (596,000 | ) | | | | SunEdison, Inc. | | | (15,090,720 | ) |
| | (63,500 | ) | | | | Synchronoss Technologies, Inc. | | | (2,913,380 | ) |
| | (776,000 | ) | | | | Take-Two Interactive Software, Inc. | | | (18,391,200 | ) |
| | (315,300 | ) | | | | TiVo, Inc. | | | (3,484,065 | ) |
| | (425,500 | ) | | | | TTM Technologies, Inc. | | | (3,978,425 | ) |
| | (175,000 | ) | | | | Twitter, Inc. | | | (6,818,000 | ) |
| | (10,425 | ) | | | | VMware, Inc. - Class A | | | (918,443 | ) |
| | (147,412 | ) | | | | Western Union Company | | | (2,989,515 | ) |
| | (113,200 | ) | | | | Workday, Inc. - Class A | | | (10,324,972 | ) |
| | (147,000 | ) | | | | Xilinx, Inc. | | | (6,373,920 | ) |
| | (51,000 | ) | | | | Yahoo!, Inc. | | | (2,170,815 | ) |
| | (132,900 | ) | | | | Yandex, NV - Class A | | | (2,556,996 | ) |
| | (34,400 | ) | | | | YY, Inc. | | | (2,186,464 | ) |
| | | | | | | | | | |
| | | | | | | | | (404,932,150 | ) |
| | | | | | | | | | |
| | | | | | Materials (-0.6%) | |
| | (60,000 | ) | | | | A Schulman, Inc. | | | (2,547,000 | ) |
| | (403,000 | ) | | | | B2Gold Corp. | | | (624,650 | ) |
| | (1,262,780 | ) | | | | Cemex, SAB de CV | | | (12,147,944 | ) |
| | | | | | | | | | |
NUMBER OF
SHARES | | | | | | | VALUE | |
| | (121,600 | ) | | | | Horsehead Holding Corp. | | $ | (1,817,920 | ) |
| | (130,000 | ) | | | | RTI International Metals, Inc. | | | (4,894,500 | ) |
| | (117,000 | ) | | | | United States Steel Corp. | | | (2,810,340 | ) |
| | | | | | | | | | |
| | | | | | | | | (24,842,354 | ) |
| | | | | | | | | | |
| | | | | | TOTAL COMMON STOCKS SOLD SHORT
(Proceeds $797,155,760) | | | (880,472,932 | ) |
| | | | | | | | | | |
| | | | | | | | | | |
| | EXCHANGE-TRADED FUNDS SOLD SHORT (-1.2%)# | |
| | | | | | Other (-1.2%) | |
| | (117,746 | ) | | | | Consumer Discretionary Select Sector SPDR Fund | | | (8,867,451 | ) |
| | (71,576 | ) | | | | Consumer Staples Select Sector SPDR Fund | | | (3,462,131 | ) |
| | (92,490 | ) | | | | Health Care Select Sector SPDR Fund | | | (6,629,683 | ) |
| | (9,688 | ) | | | | iShares NASDAQ Biotechnology ETF | | | (3,232,498 | ) |
| | (34,995 | ) | | | | iShares U.S. Healthcare Providers ETF | | | (4,498,257 | ) |
| | (47,272 | ) | | | | iShares U.S. Industrials ETF | | | (5,072,758 | ) |
| | (34,550 | ) | | | | iShares U.S. Medical Devices ETF | | | (4,038,895 | ) |
| | (90,000 | ) | | | | iShares US Telecommunications ETF | | | (2,767,500 | ) |
| | (82,534 | ) | | | | PowerShares QQQ | | | (8,883,135 | ) |
| | | | | | | | | | |
| | | | | | TOTAL EXCHANGE-TRADED FUNDS SOLD SHORT
(Proceeds $39,035,449) | | | (47,452,308 | ) |
| | | | | | | | | | |
| | | | | | | | | | |
NUMBER OF
CONTRACTS | | | | | | | VALUE | |
| | | | | | | | | | |
| | WRITTEN OPTIONS (-0.6%)# | |
| | | | | | Consumer Discretionary (-0.1%) | |
| | 244 | | | | | Brunswick Corp.
Put, 06/19/15, Strike $50.00 | | | (42,700 | ) |
| | 1,513 | | | | | Cbs Corp.
Call, 05/15/15, Strike $62.50 | | | (223,924 | ) |
| | 1,405 | | | | | Vipshop Holdings, Ltd.
Call, 01/15/16, Strike $7.00 | | | (3,076,950 | ) |
| | | | | | Vitamin Shoppe, Inc. | | | | |
| | 389 | | | | | Call, 05/15/15, Strike $45.00 | | | (17,505 | ) |
| | 389 | | | | | Call, 05/15/15, Strike $40.00 | | | (102,113 | ) |
| | | | | | | | | | |
| | | | | | | | | (3,463,192 | ) |
| | | | | | | | | | |
| | | | | | Energy (0.0%) | |
| | 750 | | | | | Whiting Petroleum Corp.
Call, 06/19/15, Strike $37.50 | | | (213,750 | ) |
| | | | | | | | | | |
| | | | | | Financials (0.0%) | |
| | 300 | | | | | Walter Investment Management Corp.
Call, 01/15/16, Strike $30.00 | | | (7,500 | ) |
| | | | | | | | | | |
| | | | | | Health Care (0.0%) | |
| | 291 | | | | | Express Scripts Holding Company
Put, 05/15/15, Strike $83.50 | | | (16,296 | ) |
| | | | | | |
| See accompanying Notes to Schedule of Investments | | www.calamos.com | | | 129 | |
Market Neutral Income Fund Schedule of Investments April 30, 2015 (Unaudited)
| | | | | | | | | | |
NUMBER OF
CONTRACTS | | | | | | | VALUE | |
| | 355 | | | | | Zimmer Holdings, Inc.
Put, 06/19/15, Strike $110.00 | | $ | (129,575 | ) |
| | | | | | | | | | |
| | | | | | | | | (145,871 | ) |
| | | | | | | | | | |
| | | | | | Industrials (0.0%) | |
| | 790 | | | | | Deluxe Corp.
Put, 05/15/15, Strike $65.00 | | | (118,500 | ) |
| | 750 | | | | | Greenbrier Companies, Inc.
Call, 01/15/16, Strike $55.00 | | | (532,500 | ) |
| | 350 | | | | | SolarCity Corp. Call,
01/20/17, Strike $85.00 | | | (202,125 | ) |
| | | | | | | | | | |
| | | | | | | | | (853,125 | ) |
| | | | | | | | | | |
| | | | | | Information Technology (0.0%) | |
| | 2,500 | | | | | Electronic Arts, Inc.
Put, 01/15/16, Strike $32.00 | | | (53,750 | ) |
| | 2,000 | | | | | SanDisk Corp.
Put, 01/15/16, Strike $50.00 | | | (293,000 | ) |
| | | | | | | | | | |
| | | | | | | | | (346,750 | ) |
| | | | | | | | | | |
| | | | | | Other (-0.5%) | |
| | | | | | S & P 500 Index | | | | |
| | 2,000 | | | | | Call, 05/08/15, Strike $2,100.00 | | | (1,900,000 | ) |
| | 2,000 | | | | | Put, 05/29/15, Strike $2,050.00 | | | (4,000,000 | ) |
| | 1,500 | | | | | Call, 06/30/15, Strike $2,125.00 | | | (3,300,000 | ) |
| | 1,250 | | | | | Call, 06/19/15, Strike $2,150.00 | | | (1,218,750 | ) |
| | 1,000 | | | | | Call, 05/22/15, Strike $2,125.00 | | | (750,000 | ) |
| | 1,000 | | | | | Put, 06/30/15, Strike $1,975.00 | | | (1,900,000 | ) |
| | 500 | | | | | Call, 06/30/15, Strike $2,100.00 | | | (1,692,500 | ) |
| | 500 | | | | | Call, 12/31/15, Strike $2,200.00 | | | (2,000,000 | ) |
| | | | | | | | | | |
| | | | | | | | | (16,761,250 | ) |
| | | | | | | | | | |
| | | | | | TOTAL WRITTEN OPTIONS
(Premium $24,480,848) | | | (21,791,438 | ) |
| | | | | | | | | | |
NOTES TO SCHEDULE OF INVESTMENTS
| ~ | Security, or portion of security, is segregated as collateral for written options and securities sold short. The aggregate value of such securities is $630,865,007. |
| ^ | Security, or portion of security, is on loan. |
| * | Securities issued and sold pursuant to a Rule 144A transaction are excepted from the registration requirement of the Securities Act of 1933, as amended. These securities may only be sold to qualified institutional buyers (“QIBs”), such as the Fund. Any resale of these securities must generally be effected through a sale that is registered under the Act or otherwise exempted from such registration requirements. |
| ¤ | The synthetic convertible securities strategy combines separate securities that together possess the economic characteristics similar to a convertible security. |
| ‡ | Variable rate or step bond security. The rate shown is the rate in effect at April 30, 2015. |
| # | Non-income producing security. |
| ** | In default status and considered illiquid and non-income producing. |
| | |
| FOREIGN CURRENCY ABBREVIATION |
| DKK | | Danish Krone |
Note: Value for securities denominated in foreign currencies is shown in U.S. dollars. The principal amount for such securities is shown in the respective foreign currency. The date on options represents the expiration date of the option contract. The option contract may be exercised at any date on or before the date shown.
| | | | |
| 130 | | CALAMOS OPEN-END FAMILY OF FUNDS SEMIANNUAL REPORT | | See accompanying Notes to Financial Statements |
Hedged Equity Income Fund Schedule of Investments April 30, 2015 (Unaudited)
| | | | | | | | | | |
NUMBER OF
SHARES | | | | | | | VALUE | |
| | COMMON STOCKS (97.0%) | |
| | | | | | Consumer Discretionary (11.1%) | |
| | 234 | | | | | Amazon.com, Inc.# | | $ | 98,697 | |
| | 17 | | | | | AutoZone, Inc.#~ | | | 11,435 | |
| | 145 | | | | | CarMax, Inc.#~ | | | 9,876 | |
| | 382 | | | | | Carnival Corp. | | | 16,797 | |
| | 334 | | | | | Coach, Inc. | | | 12,762 | |
| | 1,953 | | | | | Comcast Corp. - Class A~ | | | 112,805 | |
| | 203 | | | | | D.R. Horton, Inc. | | | 5,156 | |
| | 116 | | | | | Darden Restaurants, Inc. | | | 7,397 | |
| | 301 | | | | | Delphi Automotive, PLC | | | 24,983 | |
| | 564 | | | | | DIRECTV# | | | 51,158 | |
| | 145 | | | | | Discovery Communications, Inc. - Class A#~ | | | 4,692 | |
| | 145 | | | | | Discovery Communications, Inc. - Class C#~ | | | 4,383 | |
| | 152 | | | | | Dollar General Corp. | | | 11,052 | |
| | 2,348 | | | | | Ford Motor Company | | | 37,099 | |
| | 70 | | | | | Fossil Group, Inc.# | | | 5,879 | |
| | 180 | | | | | Gap, Inc.~ | | | 7,135 | |
| | 626 | | | | | General Motors Company, Inc. | | | 21,948 | |
| | 1,352 | | | | | Home Depot, Inc. | | | 144,637 | |
| | 204 | | | | | Interpublic Group of Companies, Inc. | | | 4,251 | |
| | 112 | | | | | Lennar Corp. - Class A | | | 5,130 | |
| | 1,127 | | | | | Lowe’s Companies, Inc. | | | 77,605 | |
| | 159 | | | | | Macy’s, Inc. | | | 10,276 | |
| | 584 | | | | | McDonald’s Corp. | | | 56,385 | |
| | 126 | | | | | Michael Kors Holdings, Ltd.#~ | | | 7,794 | |
| | 57 | | | | | Mohawk Industries, Inc.# | | | 9,890 | |
| | 18 | | | | | Netflix, Inc.# | | | 10,017 | |
| | 521 | | | | | Nike, Inc. - Class B | | | 51,496 | |
| | 39 | | | | | Priceline Group, Inc.# | | | 48,275 | |
| | 534 | | | | | PulteGroup, Inc. | | | 10,306 | |
| | 62 | | | | | PVH Corp. | | | 6,408 | |
| | 117 | | | | | Ross Stores, Inc. | | | 11,569 | |
| | 220 | | | | | Royal Caribbean Cruises, Ltd. | | | 14,973 | |
| | 690 | | | | | Starbucks Corp. | | | 34,210 | |
| | 125 | | | | | Time Warner Cable, Inc. | | | 19,440 | |
| | 513 | | | | | Time Warner, Inc. | | | 43,302 | |
| | 200 | | | | | TJX Companies, Inc. | | | 12,908 | |
| | 53 | | | | | TripAdvisor, Inc.# | | | 4,266 | |
| | 1,227 | | | | | Twenty-First Century Fox, Inc. | | | 41,816 | |
| | 215 | | | | | Viacom, Inc. - Class B | | | 14,932 | |
| | 1,211 | | | | | Walt Disney Company~ | | | 131,660 | |
| | 47 | | | | | Whirlpool Corp. | | | 8,253 | |
| | 70 | | | | | Wynn Resorts, Ltd. | | | 7,775 | |
| | 115 | | | | | Yum! Brands, Inc. | | | 9,885 | |
| | | | | | | | | | |
| | | | | | | | | 1,240,713 | |
| | | | | | | | | | |
| | | | | | | | | | |
NUMBER OF
SHARES | | | | | | | VALUE | |
| | | | | | | | | | |
| | | | | | Consumer Staples (9.4%) | |
| | 1,610 | | | | | Altria Group, Inc.~ | | $ | 80,581 | |
| | 688 | | | | | Archer-Daniels-Midland Company~ | | | 33,629 | |
| | 2,179 | | | | | Coca-Cola Company~ | | | 88,380 | |
| | 438 | | | | | Colgate-Palmolive Company | | | 29,469 | |
| | 232 | | | | | ConAgra Foods, Inc.~ | | | 8,387 | |
| | 157 | | | | | Costco Wholesale Corp. | | | 22,459 | |
| | 908 | | | | | CVS Health Corp. | | | 90,155 | |
| | 375 | | | | | General Mills, Inc. | | | 20,753 | |
| | 82 | | | | | Hershey Company~ | | | 7,537 | |
| | 204 | | | | | Kellogg Company | | | 12,919 | |
| | 189 | | | | | Kimberly-Clark Corp. | | | 20,731 | |
| | 366 | | | | | Kraft Foods Group, Inc. | | | 31,019 | |
| | 378 | | | | | Kroger Company | | | 26,048 | |
| | 356 | | | | | Lorillard, Inc. | | | 24,870 | |
| | 231 | | | | | Mead Johnson Nutrition Company | | | 22,158 | |
| | 1,221 | | | | | Mondelez International, Inc. - Class A | | | 46,850 | |
| | 1,164 | | | | | PepsiCo, Inc. | | | 110,720 | |
| | 970 | | | | | Philip Morris International, Inc. | | | 80,966 | |
| | 1,722 | | | | | Procter & Gamble Company | | | 136,916 | |
| | 1,168 | | | | | Wal-Mart Stores, Inc.~ | | | 91,162 | |
| | 610 | | | | | Walgreens Boots Alliance, Inc. | | | 50,587 | |
| | 197 | | | | | Whole Foods Market, Inc. | | | 9,409 | |
| | | | | | | | | | |
| | | | | | | | | 1,045,705 | |
| | | | | | | | | | |
| | | | | | Energy (8.5%) | |
| | 274 | | | | | Anadarko Petroleum Corp.~ | | | 25,784 | |
| | 143 | | | | | Apache Corp.~ | | | 9,781 | |
| | 281 | | | | | Baker Hughes, Inc.~ | | | 19,237 | |
| | 1,205 | | | | | Chevron Corp.~ | | | 133,827 | |
| | 721 | | | | | ConocoPhillips | | | 48,970 | |
| | 364 | | | | | Devon Energy Corp. | | | 24,829 | |
| | 528 | | | | | EOG Resources, Inc. | | | 52,246 | |
| | 164 | | | | | EQT Corp. | | | 14,750 | |
| | 2,728 | | | | | Exxon Mobil Corp. | | | 238,345 | |
| | 557 | | | | | Halliburton Company | | | 27,265 | |
| | 57 | | | | | Helmerich & Payne, Inc. | | | 4,444 | |
| | 105 | | | | | Hess Corp.~ | | | 8,075 | |
| | 843 | | | | | Kinder Morgan, Inc. | | | 36,207 | |
| | 349 | | | | | Marathon Oil Corp. | | | 10,854 | |
| | 297 | | | | | Marathon Petroleum Corp. | | | 29,275 | |
| | 76 | | | | | Murphy Oil Corp. | | | 3,618 | |
| | 281 | | | | | National Oilwell Varco, Inc. | | | 15,289 | |
| | 406 | | | | | Noble Energy, Inc. | | | 20,592 | |
| | 470 | | | | | Occidental Petroleum Corp. | | | 37,647 | |
| | 463 | | | | | Phillips 66 | | | 36,721 | |
| | 75 | | | | | Pioneer Natural Resources Company | | | 12,959 | |
| | 817 | | | | | Schlumberger, Ltd. | | | 77,296 | |
| | | | | | |
| See accompanying Notes to Schedule of Investments | | www.calamos.com | | | 131 | |
Hedged Equity Income Fund Schedule of Investments April 30, 2015 (Unaudited)
| | | | | | | | | | |
NUMBER OF
SHARES | | | | | | | VALUE | |
| | 595 | | | | | Spectra Energy Corp. | | $ | 22,164 | |
| | 610 | | | | | Valero Energy Corp. | | | 34,709 | |
| | | | | | | | | | |
| | | | | | | | | 944,884 | |
| | | | | | | | | | |
| | | | | | Financials (15.9%) | |
| | 169 | | | | | ACE, Ltd. | | | 18,081 | |
| | 215 | | | | | Aflac, Inc.~ | | | 13,554 | |
| | 559 | | | | | Allstate Corp.~ | | | 38,940 | |
| | 1,099 | | | | | American Express Company~ | | | 85,117 | |
| | 1,378 | | | | | American International Group, Inc.~ | | | 77,568 | |
| | 234 | | | | | American Tower Corp.~ | | | 22,120 | |
| | 189 | | | | | Ameriprise Financial, Inc.~ | | | 23,678 | |
| | 70 | | | | | AvalonBay Communities, Inc.~ | | | 11,504 | |
| | 6,392 | | | | | Bank of America Corp.~ | | | 101,824 | |
| | 1,252 | | | | | Bank of New York Mellon Corp.~ | | | 53,010 | |
| | 532 | | | | | BB&T Corp.~ | | | 20,370 | |
| | 1,252 | | | | | Berkshire Hathaway, Inc. - Class B# | | | 176,795 | |
| | 74 | | | | | BlackRock, Inc.~ | | | 26,932 | |
| | 406 | | | | | Capital One Financial Corp. | | | 32,825 | |
| | 1,017 | | | | | Charles Schwab Corp. | | | 31,018 | |
| | 116 | | | | | Chubb Corp. | | | 11,409 | |
| | 1,817 | | | | | Citigroup, Inc.~ | | | 96,882 | |
| | 195 | | | | | Crown Castle International Corp. | | | 16,288 | |
| | 296 | | | | | Discover Financial Services | | | 17,159 | |
| | 211 | | | | | Equity Residential | | | 15,584 | |
| | 639 | | | | | Fifth Third Bancorp | | | 12,780 | |
| | 247 | | | | | Franklin Resources, Inc. | | | 12,735 | |
| | 435 | | | | | Genworth Financial, Inc. - Class A# | | | 3,824 | |
| | 269 | | | | | Goldman Sachs Group, Inc. | | | 52,837 | |
| | 261 | | | | | Hartford Financial Services Group, Inc. | | | 10,641 | |
| | 195 | | | | | Health Care REIT, Inc. | | | 14,044 | |
| | 529 | | | | | Host Hotels & Resorts, Inc. | | | 10,654 | |
| | 435 | | | | | Invesco, Ltd. | | | 18,018 | |
| | 2,283 | | | | | JPMorgan Chase & Company | | | 144,423 | |
| | 444 | | | | | Lincoln National Corp. | | | 25,082 | |
| | 90 | | | | | Macerich Company | | | 7,358 | |
| | 978 | | | | | MetLife, Inc. | | | 50,162 | |
| | 845 | | | | | Morgan Stanley | | | 31,527 | |
| | 334 | | | | | PNC Financial Services Group, Inc. | | | 30,638 | |
| | 277 | | | | | Principal Financial Group, Inc. | | | 14,160 | |
| | 320 | | | | | Prologis, Inc. | | | 12,864 | |
| | 526 | | | | | Prudential Financial, Inc. | | | 42,922 | |
| | 89 | | | | | Public Storage | | | 16,724 | |
| | 1,103 | | | | | Regions Financial Corp. | | | 10,842 | |
| | 257 | | | | | Simon Property Group, Inc. | | | 46,643 | |
| | 252 | | | | | State Street Corp. | | | 19,434 | |
| | 349 | | | | | SunTrust Banks, Inc. | | | 14,483 | |
| | 157 | | | | | T. Rowe Price Group, Inc. | | | 12,745 | |
| | | | | | | | | | |
NUMBER OF
SHARES | | | | | | | VALUE | |
| | 161 | | | | | Travelers Companies, Inc. | | $ | 16,279 | |
| | 1,488 | | | | | US Bancorp~ | | | 63,791 | |
| | 190 | | | | | Ventas, Inc. | | | 13,091 | |
| | 175 | | | | | Vornado Realty Trust | | | 18,111 | |
| | 2,962 | | | | | Wells Fargo & Company | | | 163,206 | |
| | | | | | | | | | |
| | | | | | | | | 1,780,676 | |
| | | | | | | | | | |
| | | | | | Health Care (14.1%) | |
| | 819 | | | | | Abbott Laboratories~ | | | 38,018 | |
| | 1,282 | | | | | AbbVie, Inc.~ | | | 82,894 | |
| | 295 | | | | | Actavis, PLC# | | | 83,444 | |
| | 344 | | | | | Aetna, Inc.~ | | | 36,763 | |
| | 204 | | | | | Agilent Technologies, Inc.~ | | | 8,439 | |
| | 123 | | | | | Alexion Pharmaceuticals, Inc.#~ | | | 20,815 | |
| | 463 | | | | | Amgen, Inc.~ | | | 73,112 | |
| | 233 | | | | | Anthem, Inc.~ | | | 35,167 | |
| | 375 | | | | | Baxter International, Inc.~ | | | 25,777 | |
| | 176 | | | | | Biogen, Inc.#~ | | | 65,812 | |
| | 878 | | | | | Bristol-Myers Squibb Company~ | | | 55,955 | |
| | 466 | | | | | Celgene Corp.# | | | 50,356 | |
| | 305 | | | | | Cerner Corp.# | | | 21,902 | |
| | 295 | | | | | Cigna Corp. | | | 36,769 | |
| | 116 | | | | | DaVita HealthCare Partners, Inc.#~ | | | 9,408 | |
| | 134 | | | | | Edwards Lifesciences Corp.# | | | 16,971 | |
| | 564 | | | | | Eli Lilly and Company | | | 40,535 | |
| | 609 | | | | | Express Scripts Holding Company# | | | 52,618 | |
| | 991 | | | | | Gilead Sciences, Inc.# | | | 99,605 | |
| | 1,757 | | | | | Johnson & Johnson | | | 174,294 | |
| | 139 | | | | | Laboratory Corp. of America Holdings# | | | 16,619 | |
| | 673 | | | | | Medtronic, PLC | | | 50,105 | |
| | 2,155 | | | | | Merck & Company, Inc. | | | 128,352 | |
| | 266 | | | | | Mylan, NV# | | | 19,221 | |
| | 82 | | | | | Perrigo Company, PLC | | | 15,029 | |
| | 4,061 | | | | | Pfizer, Inc. | | | 137,790 | |
| | 87 | | | | | Quest Diagnostics, Inc. | | | 6,213 | |
| | 23 | | | | | Regeneron Pharmaceuticals, Inc.# | | | 10,521 | |
| | 321 | | | | | St. Jude Medical, Inc. | | | 22,486 | |
| | 258 | | | | | Stryker Corp. | | | 23,798 | |
| | 470 | | | | | Thermo Fisher Scientific, Inc. | | | 59,070 | |
| | 532 | | | | | UnitedHealth Group, Inc. | | | 59,265 | |
| | | | | | | | | | |
| | | | | | | | | 1,577,123 | |
| | | | | | | | | | |
| | | | | | Industrials (9.3%) | |
| | 319 | | | | | 3M Company | | | 49,888 | |
| | 580 | | | | | Boeing Company~ | | | 83,137 | |
| | 382 | | | | | Caterpillar, Inc. | | | 33,188 | |
| | 581 | | | | | CSX Corp. | | | 20,968 | |
| | 110 | | | | | Cummins, Inc. | | | 15,209 | |
| | 375 | | | | | Danaher Corp. | | | 30,705 | |
| | | | |
| 132 | | CALAMOS OPEN-END FAMILY OF FUNDS SEMIANNUAL REPORT | | See accompanying Notes to Schedule of Investments |
Hedged Equity Income Fund Schedule of Investments April 30, 2015 (Unaudited)
| | | | | | | | | | |
NUMBER OF
SHARES | | | | | | | VALUE | |
| | 425 | | | | | Deere & Company | | $ | 38,471 | |
| | 876 | | | | | Delta Air Lines, Inc. | | | 39,105 | |
| | 226 | | | | | Eaton Corp., PLC | | | 15,533 | |
| | 375 | | | | | Emerson Electric Company | | | 22,061 | |
| | 182 | | | | | Expeditors International of Washington, Inc.~ | | | 8,341 | |
| | 220 | | | | | FedEx Corp. | | | 37,305 | |
| | 192 | | | | | Fluor Corp. | | | 11,547 | |
| | 406 | | | | | General Dynamics Corp. | | | 55,752 | |
| | 5,494 | | | | | General Electric Company | | | 148,777 | |
| | 678 | | | | | Honeywell International, Inc. | | | 68,424 | |
| | 250 | | | | | Illinois Tool Works, Inc. | | | 23,395 | |
| | 135 | | | | | Jacobs Engineering Group, Inc.# | | | 5,786 | |
| | 128 | | | | | Kansas City Southern | | | 13,119 | |
| | 83 | | | | | Lockheed Martin Corp. | | | 15,488 | |
| | 406 | | | | | Masco Corp. | | | 10,755 | |
| | 283 | | | | | Norfolk Southern Corp. | | | 28,541 | |
| | 204 | | | | | Pentair, PLC | | | 12,679 | |
| | 181 | | | | | Precision Castparts Corp. | | | 37,411 | |
| | 145 | | | | | Robert Half International, Inc. | | | 8,040 | |
| | 754 | | | | | Southwest Airlines Company | | | 30,582 | |
| | 502 | | | | | Union Pacific Corp. | | | 53,327 | |
| | 517 | | | | | United Parcel Service, Inc. - Class B | | | 51,974 | |
| | 585 | | | | | United Technologies Corp. | | | 66,544 | |
| | | | | | | | | | |
| | | | | | | | | 1,036,052 | |
| | | | | | | | | | |
| | | | | | Information Technology (20.3%) | |
| | 345 | | | | | Accenture, PLC - Class A | | | 31,964 | |
| | 232 | | | | | Akamai Technologies, Inc.#~ | | | 17,117 | |
| | 232 | | | | | Amphenol Corp. - Class A~ | | | 12,846 | |
| | 4,001 | | | | | Apple, Inc. | | | 500,725 | |
| | 930 | | | | | Applied Materials, Inc.~ | | | 18,405 | |
| | 145 | | | | | Avago Technologies, Ltd. | | | 16,948 | |
| | 406 | | | | | Broadcom Corp. - Class A | | | 17,947 | |
| | 2,974 | | | | | Cisco Systems, Inc. | | | 85,740 | |
| | 442 | | | | | Cognizant Technology Solutions Corp. - Class A# | | | 25,875 | |
| | 665 | | | | | eBay, Inc.# | | | 38,743 | |
| | 1,757 | | | | | EMC Corp. | | | 47,281 | |
| | 130 | | | | | F5 Networks, Inc.# | | | 15,863 | |
| | 1,560 | | | | | Facebook, Inc. - Class A#~ | | | 122,881 | |
| | 375 | | | | | Fiserv, Inc.# | | | 29,100 | |
| | 169 | | | | | Google, Inc. - Class A#~ | | | 92,742 | |
| | 169 | | | | | Google, Inc. - Class C# | | | 90,810 | |
| | 1,414 | | | | | Hewlett-Packard Company | | | 46,620 | |
| | 3,615 | | | | | Intel Corp.~ | | | 117,668 | |
| | 612 | | | | | International Business Machines Corp.~ | | | 104,830 | |
| | 419 | | | | | Juniper Networks, Inc. | | | 11,074 | |
| | 172 | | | | | KLA-Tencor Corp. | | | 10,114 | |
| | | | | | | | | | |
NUMBER OF
SHARES | | | | | | | VALUE | |
| | 983 | | | | | MasterCard, Inc. - Class A | | $ | 88,676 | |
| | 231 | | | | | Microchip Technology, Inc. | | | 11,008 | |
| | 639 | | | | | Micron Technology, Inc.# | | | 17,975 | |
| | 5,756 | | | | | Microsoft Corp. | | | 279,972 | |
| | 2,157 | | | | | Oracle Corp.~ | | | 94,088 | |
| | 994 | | | | | QUALCOMM, Inc.~ | | | 67,592 | |
| | 116 | | | | | Red Hat, Inc.#~ | | | 8,730 | |
| | 494 | | | | | Symantec Corp. | | | 12,313 | |
| | 233 | | | | | TE Connectivity, Ltd. | | | 15,506 | |
| | 116 | | | | | Teradata Corp.# | | | 5,103 | |
| | 752 | | | | | Texas Instruments, Inc. | | | 40,766 | |
| | 1,936 | | | | | Visa, Inc. - Class A~ | | | 127,873 | |
| | 197 | | | | | Western Digital Corp. | | | 19,255 | |
| | 468 | | | | | Yahoo!, Inc.# | | | 19,920 | |
| | | | | | | | | | |
| | | | | | | | | 2,264,070 | |
| | | | | | | | | | |
| | | | | | Materials (3.1%) | | | | |
| | 162 | | | | | Air Products & Chemicals, Inc.~ | | | 23,236 | |
| | 37 | | | | | Airgas, Inc.~ | | | 3,747 | |
| | 145 | | | | | Allegheny Technologies, Inc.~ | | | 4,929 | |
| | 52 | | | | | CF Industries Holdings, Inc. | | | 14,948 | |
| | 1,002 | | | | | Dow Chemical Company | | | 51,102 | |
| | 614 | | | | | E.I. du Pont de Nemours and Company | | | 44,945 | |
| | 57 | | | | | Eastman Chemical Company | | | 4,344 | |
| | 1,020 | | | | | Freeport-McMoRan, Inc. | | | 23,735 | |
| | 314 | | | | | LyondellBasell Industries, NV - Class A | | | 32,505 | |
| | 545 | | | | | Monsanto Company | | | 62,108 | |
| | 438 | | | | | Mosaic Company | | | 19,272 | |
| | 487 | | | | | Newmont Mining Corp. | | | 12,901 | |
| | 101 | | | | | PPG Industries, Inc. | | | 22,378 | |
| | 220 | | | | | Praxair, Inc. | | | 26,825 | |
| | | | | | | | | | |
| | | | | | | | | 346,975 | |
| | | | | | | | | | |
| | | | | | Telecommunication Services (2.3%) | | | | |
| | 3,257 | | | | | AT&T, Inc.~ | | | 112,822 | |
| | 590 | | | | | CenturyLink, Inc. | | | 21,216 | |
| | 2,442 | | | | | Verizon Communications, Inc.~ | | | 123,175 | |
| | | | | | | | | | |
| | | | | | | | | 257,213 | |
| | | | | | | | | | |
| | | | | | Utilities (3.0%) | | | | |
| | 609 | | | | | AES Corp.~ | | | 8,069 | |
| | 394 | | | | | American Electric Power Company, Inc.~ | | | 22,407 | |
| | 320 | | | | | CMS Energy Corp.~ | | | 10,858 | |
| | 232 | | | | | Consolidated Edison, Inc. | | | 14,280 | |
| | 281 | | | | | Dominion Resources, Inc. | | | 20,142 | |
| | 783 | | | | | Duke Energy Corp. | | | 60,737 | |
| | 291 | | | | | Edison International | | | 17,734 | |
| | 139 | | | | | Entergy Corp. | | | 10,728 | |
| | 116 | | | | | Eversource Energy | | | 5,656 | |
| | 406 | | | | | Exelon Corp. | | | 13,812 | |
| | | | | | |
| See accompanying Notes to Schedule of Investments | | www.calamos.com | | | 133 | |
Hedged Equity Income Fund Schedule of Investments April 30, 2015 (Unaudited)
| | | | | | | | | | |
NUMBER OF
SHARES | | | | | | | VALUE | |
| | 291 | | | | | FirstEnergy Corp. | | $ | 10,450 | |
| | 478 | | | | | NextEra Energy, Inc. | | | 48,245 | |
| | 349 | | | | | PG&E Corp. | | | 18,469 | |
| | 291 | | | | | PPL Corp. | | | 9,903 | |
| | 349 | | | | | Public Service Enterprise Group, Inc. | | | 14,497 | |
| | 1,007 | | | | | Southern Company | | | 44,610 | |
| | 261 | | | | | Xcel Energy, Inc. | | | 8,850 | |
| | | | | | | | | | |
| | | | | | | | | 339,447 | |
| | | | | | | | | | |
| | | | | | TOTAL COMMON STOCKS
(Cost $10,844,170) | | | 10,832,858 | |
| | | | | | | | | | |
| | EXCHANGE-TRADED FUND (1.8%) | |
| | | | | | Other (1.8%) | | | | |
| | 950 | | | | | SPDR S&P 500 ETF Trust
(Cost $198,488) | | | 198,094 | |
| | | | | | | | | | |
| | | | | | | | | | |
NUMBER OF
CONTRACTS | | | | | | | VALUE | |
| | PURCHASED OPTIONS (0.4%) # | |
| | | | | | Other (0.4%) | | | | |
| | | | | | S & P 500 Index | | | | |
| | 10 | | | | | Put, 05/08/15, Strike $2,060.00 | | | 9,000 | |
| | 5 | | | | | Put, 05/01/15, Strike $1,990.00 | | | 50 | |
| | 5 | | | | | Put, 05/08/15, Strike $2,040.00 | | | 2,600 | |
| | 5 | | | | | Put, 06/30/15, Strike $2,000.00 | | | 12,175 | |
| | 3 | | | | | Put, 05/08/15, Strike $2,090.00 | | | 5,850 | |
| | 3 | | | | | Put, 05/22/15, Strike $2,100.00 | | | 10,500 | |
| | | | | | | | | | |
| | | | | | TOTAL PURCHASED OPTIONS
(Cost $50,287) | | | 40,175 | |
| | | | | | | | | | |
| | | | | | | | | | |
NUMBER OF
SHARES | | | | | | | VALUE | |
| | SHORT TERM INVESTMENT (0.7%) | |
| | 81,759 | | | | | Fidelity Prime Money Market Fund -
Institutional Class
(Cost $81,759) | | | 81,759 | |
| | | | | | | | | | |
| TOTAL INVESTMENTS (99.9%)
(Cost $11,174,704) | | | 11,152,886 | |
| | | | | | | | | | |
| |
| | OTHER ASSETS, LESS LIABILITIES (0.1%) | | | 12,742 | |
| | | | | | | | | | |
| |
| | NET ASSETS (100.0%) | | $ | 11,165,628 | |
| | | | | | | | | | |
| | | | | | | | | | |
NUMBER OF
CONTRACTS | | | | | | | VALUE | |
| | WRITTEN OPTIONS (-0.6%)# | |
| | | | | | Other (-0.6%) | | | | |
| | | | | | S & P 500 Index | | | | |
| | 13 | | | | | Call, 05/08/15, Strike $2,100.00 | | $ | (12,350 | ) |
| | 10 | | | | | Call, 06/30/15, Strike $2,125.00 | | | (22,000 | ) |
| | 9 | | | | | Call, 05/22/15, Strike $2,125.00 | | | (6,750 | ) |
| | 5 | | | | | Call, 06/19/15, Strike $2,150.00 | | | (4,875 | ) |
| | 3 | | | | | Call, 06/30/15, Strike $2,100.00 | | | (10,155 | ) |
| | 3 | | | | | Call, 12/31/15, Strike $2,200.00 | | | (12,000 | ) |
| | | | | | | | | | |
| | | | | | TOTAL WRITTEN OPTIONS
(Premium $111,569) | | | (68,130 | ) |
| | | | | | | | | | |
NOTES TO SCHEDULE OF INVESTMENTS
| # | Non-income producing security. |
| ~ | Security, or portion of security, is segregated as collateral for written options. The aggregate value of such securities is $2,732,591. |
Note: Value for securities denominated in foreign currencies is shown in U.S. dollars. The date on options represents the expiration date of the option contract. The option contract may be exercised at any date on or before the date shown.
| | | | |
| 134 | | CALAMOS OPEN-END FAMILY OF FUNDS SEMIANNUAL REPORT | | See accompanying Notes to Financial Statements |
Long/Short Fund Schedule of Investments April 30, 2015 (Unaudited)
| | | | | | | | | | |
NUMBER OF
SHARES | | | | | | | VALUE | |
| | COMMON STOCKS (68.0%) | |
| | | | | | Consumer Discretionary (26.5%) | |
| | 6,733 | | | | | Advance Auto Parts, Inc. | | $ | 962,819 | |
| | 31,109 | | | | | Brinker International, Inc. | | | 1,722,505 | |
| | 41,740 | | | | | Brunswick Corp.~ | | | 2,088,670 | |
| | 73,072 | | | | | CBS Corp. - Class B~ | | | 4,539,964 | |
| | 138,266 | | | | | La Quinta Holdings, Inc.~# | | | 3,329,445 | |
| | 15,274 | | | | | Nike, Inc. - Class B | | | 1,509,682 | |
| | 106,214 | | | | | Norwegian Cruise Line Holdings, Ltd.# | | | 5,152,441 | |
| | 49,176 | | | | | Party City Holdco, Inc.# | | | 1,022,369 | |
| | 20,781 | | | | | Time Warner Cable, Inc. | | | 3,231,861 | |
| | 81,307 | | | | | Vitamin Shoppe, Inc.~# | | | 3,405,137 | |
| | | | | | | | | | |
| | | | | | | | | 26,964,893 | |
| | | | | | | | | | |
| | | | | | Financials (14.2%) | |
| | 85,016 | | | | | Blackstone Group, LP~ | | | 3,482,255 | |
| | 13,337 | | | | | CIT Group, Inc.~ | | | 600,565 | |
| | 205,880 | | | | | Fortress Investment Group, LLC - Class A~ | | | 1,671,746 | |
| | 87,781 | | | | | Hilltop Holdings, Inc.~# | | | 1,765,276 | |
| | 60,884 | | | | | JPMorgan Chase & Company~ | | | 3,851,522 | |
| | 156,400 | | | | | Navient Corp.~ | | | 3,056,056 | |
| | | | | | | | | | |
| | | | | | | | | 14,427,420 | |
| | | | | | | | | | |
| | | | | | Health Care (10.9%) | |
| | 125,129 | | | | | Agilent Technologies, Inc.~ | | | 5,176,587 | |
| | 18,068 | | | | | Celgene Corp.~# | | | 1,952,428 | |
| | 30,510 | | | | | Insulet Corp.~# | | | 910,723 | |
| | 29,387 | | | | | Medtronic, PLC | | | 2,187,862 | |
| | 113,781 | | | | | Presbia, PLC#^** | | | 894,774 | |
| | 308,561 | | | | | Targeted Medical Pharma, Inc.~#** | | | 25,302 | |
| | | | | | | | | | |
| | | | | | | | | 11,147,676 | |
| | | | | | | | | | |
| | | | | | Information Technology (12.6%) | |
| | 35,009 | | | | | Apple, Inc.~ | | | 4,381,376 | |
| | 4,151 | | | | | Google, Inc. - Class A~# | | | 2,277,945 | |
| | 3,679 | | | | | Google, Inc. - Class C~# | | | 1,976,874 | |
| | 60,873 | | | | | IAC/InterActiveCorp~ | | | 4,250,153 | |
| | | | | | | | | | |
| | | | | | | | | 12,886,348 | |
| | | | | | | | | | |
| | | | | | Materials (3.8%) | |
| | 112,022 | | | | | Berry Plastics Group, Inc.# | | | 3,833,393 | |
| | | | | | | | | | |
| | | | | | TOTAL COMMON STOCKS
(Cost $63,589,893) | | | 69,259,730 | |
| | | | | | | | | | |
| | | | | | | | | | |
NUMBER OF
CONTRACTS | | | | | | | VALUE | |
| | PURCHASED OPTIONS (0.1%)# | |
| | | | | | Consumer Discretionary (0.0%) | |
| | 256 | | | | | Cablevision Systems Corp.
Call, 06/19/15, Strike $19.00 | | | 37,760 | |
| | | | | | | | | | |
NUMBER OF
CONTRACTS | | | | | | | VALUE | |
| | 154 | | | | | Kohl’s Corp.
Call, 05/15/15, Strike $77.50 | | $ | 5,390 | |
| | | | | | | | | | |
| | | | | | | | | 43,150 | |
| | | | | | | | | | |
| | | | | | Consumer Staples (0.1%) | |
| | 234 | | | | | Nu Skin Enterprises, Inc.
Call, 06/19/15, Strike $55.00 | | | 106,470 | |
| | | | | | | | | | |
| | | | | | TOTAL PURCHASED OPTIONS
(Cost $161,905) | | | 149,620 | |
| | | | | | | | | | |
NUMBER OF
SHARES | | | | | | | VALUE | |
| | | | | | | | | | |
| | SHORT TERM INVESTMENT (30.5%) | |
| | 31,114,474 | | | | | Fidelity Prime Money Market Fund - Institutional Class
(Cost $31,114,474) | | | 31,114,474 | |
| | | | | | | | | | |
| | | | | | | | | | |
NUMBER OF
SHARES/
PRINCIPAL
AMOUNT | | | | | | | VALUE | |
| | | | | | | | | | |
| INVESTMENT OF CASH COLLATERAL FOR SECURITIES
LOANED (0.4%) |
|
| | | | | | Federal Home Loan Bank Discount Notes | | | | |
| | 73,954 | | | | | 0.000%, 05/29/15 | | | 73,954 | |
| | 46,225 | | | | | 0.000%, 06/10/15 | | | 46,225 | |
| | 23,113 | | | | | 0.000%, 05/27/15 | | | 23,113 | |
| | 23,113 | | | | | 0.000%, 06/15/15 | | | 23,113 | |
| | 46,222 | | | | | Federal Home Loan Mortgage Corp. Discount Note
0.000%, 06/01/15 | | | 46,222 | |
| | 91,828 | | | | | Fidelity Prime Money Market Fund - Institutional Class | | | 91,828 | |
| | 42,117 | | | | | Goldman Sachs Financial Square Fund | | | 42,117 | |
| | 46,228 | | | | | Morgan Stanley Institutional Liquidity Fund | | | 46,228 | |
| | | | | | | | | | |
| | | | | | TOTAL INVESTMENT OF
CASH COLLATERAL FOR
SECURITIES LOANED
(Cost $392,800) | | | 392,800 | |
| | | | | | | | | | |
| TOTAL INVESTMENTS (99.0%)
(Cost $95,259,072) | | | 100,916,624 | |
| | | | | | | | | | |
| |
| | PAYABLE UPON RETURN OF SECURITIES ON LOAN (-0.4%) | | | (392,800 | ) |
| | | | | | | | | | |
| |
| | OTHER ASSETS, LESS LIABILITIES (1.4%) | | | 1,406,823 | |
| | | | | | | | | | |
| |
| | NET ASSETS (100.0%) | | $ | 101,930,647 | |
| | | | | | | | | | |
| | | | | | | | | | |
| | COMMON STOCKS SOLD SHORT (-25.5%)# | |
| | | | | | Consumer Discretionary (-8.2%) | |
| | (96,226 | ) | | | | Cablevision Systems Corp. | | | (1,922,595 | ) |
| | (37,877 | ) | | | | Cheesecake Factory, Inc. | | | (1,898,774 | ) |
| | (30,607 | ) | | | | Kate Spade & Company | | | (1,000,849 | ) |
| | | | | | |
| See accompanying Notes to Schedule of Investments | | www.calamos.com | | | 135 | |
Long/Short Fund Schedule of Investments April 30, 2015 (Unaudited)
| | | | | | | | | | |
NUMBER OF
SHARES/
PRINCIPAL
AMOUNT | | | | | | | VALUE | |
| | (15,483 | ) | | | | Kohl’s Corp. | | $ | (1,109,357 | ) |
| | (10,823 | ) | | | | L Brands, Inc. | | | (967,143 | ) |
| | (12,602 | ) | | | | Omnicom Group, Inc. | | | (954,728 | ) |
| | (15,182 | ) | | | | Zumiez, Inc. | | | (481,421 | ) |
| | | | | | | | | | |
| | | | | | | | | (8,334,867 | ) |
| | | | | | | | | | |
| | | | | | Financials (-3.2%) | |
| | (54,468 | ) | | | | Cohen & Steers, Inc. | | | (2,062,158 | ) |
| | (23,776 | ) | | | | NASDAQ OMX Group, Inc. | | | (1,156,227 | ) |
| | | | | | | | | | |
| | | | | | | | | (3,218,385 | ) |
| | | | | | | | | | |
| | | | | | Health Care (-8.5%) | |
| | (14,023 | ) | | | | DexCom, Inc. | | | (947,534 | ) |
| | (29,106 | ) | | | | Express Scripts Holding Company | | | (2,514,759 | ) |
| | (32,334 | ) | | DKK | | William Demant Holding, A/S | | | (2,659,914 | ) |
| | (23,492 | ) | | | | Zimmer Holdings, Inc. | | | (2,580,361 | ) |
| | | | | | | | | | |
| | | | | | | | | (8,702,568 | ) |
| | | | | | | | | | |
| | | | | | Industrials (-3.5%) | |
| | (37,270 | ) | | | | Deluxe Corp. | | | (2,413,232 | ) |
| | (26,006 | ) | | | | Nielsen, NV | | | (1,168,710 | ) |
| | | | | | | | | | |
| | | | | | | | | (3,581,942 | ) |
| | | | | | | | | | |
| | | | | | Information Technology (-1.2%) | |
| | (59,487 | ) | | | | Western Union Company | | | (1,206,396 | ) |
| | | | | | | | | | |
| | | | | | Telecommunication Services (-0.9%) | | | | |
| | (26,443 | ) | | | | AT&T, Inc. | | | (915,986 | ) |
| | | | | | | | | | |
| | | | | | TOTAL COMMON STOCKS SOLD SHORT
(Proceeds $23,894,838) | | | (25,960,144 | ) |
| | | | | | | | | | |
| | | | | | | | | | |
NUMBER OF
CONTRACTS | | | | | | | VALUE | |
| | WRITTEN OPTIONS (-0.3%)# | |
| | | | | | Consumer Discretionary (-0.1%) | |
| | 102 | | | | | Brunswick Corp.
Put, 06/19/15, Strike $50.00 | | | (17,850 | ) |
| | 730 | | | | | CBS Corp.
Call, 05/15/15, Strike $62.50 | | | (108,040 | ) |
| | | | | | Vitamin Shoppe, Inc. | | | | |
| | 210 | | | | | Call, 05/15/15, Strike $45.00 | | | (9,450 | ) |
| | 210 | | | | | Call, 05/15/15, Strike $40.00 | | | (55,125 | ) |
| | | | | | | | | | |
| | | | | | | | | (190,465 | ) |
| | | | | | | | | | |
| | | | | | Health Care (-0.1%) | |
| | 117 | | | | | Express Scripts Holding Company
Put, 05/15/15, Strike $83.50 | | | (6,552 | ) |
| | 234 | | | | | Zimmer Holdings, Inc.
Put, 06/19/15, Strike $110.00 | | | (85,410 | ) |
| | | | | | | | | | |
| | | | | | | | | (91,962 | ) |
| | | | | | | | | | |
| | | | | | | | | | |
NUMBER OF
CONTRACTS | | | | | | | VALUE | |
| | | | | | | | | | |
| | | | | | Industrials (-0.1%) | |
| | 370 | | | | | Deluxe Corp.
Put, 05/15/15, Strike $65.00 | | $ | (55,500 | ) |
| | | | | | | | | | |
| | | | | | TOTAL WRITTEN OPTIONS
(Premium $311,875) | | | (337,927 | ) |
| | | | | | | | | | |
NOTES TO SCHEDULE OF INVESTMENTS
| ~ | Security, or portion of security, is segregated as collateral for written options and securities sold short. The aggregate value of such securities is $10,884,434. |
| # | Non-income producing security. |
| ^ | Security, or portion of security, is on loan. |
| ** | In default status and considered illiquid and non-income producing. |
FOREIGN CURRENCY ABBREVIATION
Note: Value for securities denominated in foreign currencies is shown in U.S. dollars. The date on options represents the expiration date of the option contract. The option contract may be exercised at any date on or before the date shown.
| | | | |
| 136 | | CALAMOS OPEN-END FAMILY OF FUNDS SEMIANNUAL REPORT | | See accompanying Notes to Financial Statements |
Statements of Assets and Liabilities April 30, 2015 (Unaudited)
| | | | | | | | | | | | | | | | | | | | |
| | | GROWTH
FUND | | | OPPORTUNISTIC
VALUE FUND | | | FOCUS GROWTH
FUND | | | DISCOVERY
GROWTH FUND | | | DIVIDEND
GROWTH FUND | |
ASSETS | | | | | | | | | | | | | | | | | | | | |
Investments in securities, at cost | | $ | 2,474,660,099 | | | $ | 72,728,000 | | | $ | 56,736,545 | | | $ | 46,869,005 | | | $ | 31,000,852 | |
Investment in securities, at value | | $ | 3,279,937,346 | | | $ | 74,672,512 | | | $ | 66,256,773 | | | $ | 50,310,765 | | | $ | 32,510,596 | |
Cash with custodian (interest bearing) | | | — | | | | 9,715 | | | | — | | | | — | | | | — | |
Restricted cash for short positions (interest bearing) | | | — | | | | — | | | | — | | | | — | | | | — | |
Due from investment advisor | | | — | | | | 36,703 | | | | 25,280 | | | | 7,931 | | | | 15,895 | |
Restricted foreign currency for short positions (cost $-) | | | — | | | | — | | | | — | | | | — | | | | — | |
Foreign currency | | | — | | | | — | | | | — | | | | — | | | | — | |
Unrealized appreciation on forward foreign currency contracts | | | 1,408 | | | | — | | | | 1 | | | | — | | | | — | |
Receivables: | | | | | | | | | | | | | | | | | | | | |
Accrued interest and dividends | | | 1,198,597 | | | | 78,127 | | | | 27,258 | | | | 2,454 | | | | 54,874 | |
Investments sold | | | 2,398,331 | | | | — | | | | 1,198,278 | | | | 383,544 | | | | — | |
Fund shares sold | | | 819,042 | | | | 7,380 | | | | 8,252 | | | | 6,858 | | | | 4,077 | |
Prepaid expenses | | | 209,979 | | | | 40,414 | | | | 36,883 | | | | 21,970 | | | | 23,504 | |
Deferred offering costs | | | — | | | | — | | | | — | | | | — | | | | — | |
Other assets | | | 850,191 | | | | 103,711 | | | | 96,053 | | | | 37,586 | | | | 9,972 | |
Total assets | | | 3,285,414,894 | | | | 74,948,562 | | | | 67,648,778 | | | | 50,771,108 | | | | 32,618,918 | |
LIABILITIES | | | | | | | | | | | | | | | | | | | | |
Due to custodian bank | | | — | | | | — | | | | — | | | | — | | | | — | |
Collateral for securities loaned | | | 89,233,375 | | | | 74,800 | | | | 1,140,000 | | | | 1,585,600 | | | | — | |
Securities sold short, at value (proceeds $-) | | | — | | | | — | | | | — | | | | — | | | | — | |
Options written, at value (premium $-) | | | — | | | | — | | | | — | | | | — | | | | — | |
Unrealized depreciation on forward foreign currency contracts | | | 931,477 | | | | — | | | | 425 | | | | — | | | | — | |
Payables: | | | | | | | | | | | | | | | | | | | | |
Investments purchased | | | 23,742,174 | | | | — | | | | 665,991 | | | | 544,277 | | | | — | |
Fund shares redeemed | | | 5,035,894 | | | | 67,186 | | | | 7,096 | | | | 20,919 | | | | — | |
Dividends payable | | | — | | | | — | | | | — | | | | — | | | | — | |
Affiliates: | | | | | | | | | | | | | | | | | | | | |
Investment advisory fees | | | 2,240,805 | | | | 61,892 | | | | 55,277 | | | | 40,554 | | | | 26,441 | |
Distribution fees | | | 72,130 | | | | 1,048 | | | | 1,105 | | | | 733 | | | | 384 | |
Deferred compensation to trustees | | | 850,191 | | | | 103,711 | | | | 96,053 | | | | 37,586 | | | | 9,972 | |
Financial accounting fees | | | 30,429 | | | | 712 | | | | 635 | | | | 466 | | | | 304 | |
Trustees’ fees and officer compensation | | | 21,828 | | | | 1,901 | | | | 1,649 | | | | 1,543 | | | | 1,498 | |
Other accounts payable and accrued liabilities | | | 1,308,726 | | | | 27,741 | | | | 23,051 | | | | 17,742 | | | | 11,406 | |
Total liabilities | | | 123,467,029 | | | | 338,991 | | | | 1,991,282 | | | | 2,249,420 | | | | 50,005 | |
NET ASSETS | | $ | 3,161,947,865 | | | $ | 74,609,571 | | | $ | 65,657,496 | | | $ | 48,521,688 | | | $ | 32,568,913 | |
COMPOSITION OF NET ASSETS | | | | | | | | | | | | | | | | | | | | |
Paid in capital | | $ | 1,938,122,280 | | | $ | 66,061,261 | | | $ | 47,848,022 | | | $ | 44,184,397 | | | $ | 29,946,563 | |
Undistributed net investment income (loss) | | | (2,257,734 | ) | | | 463,336 | | | | 77,766 | | | | (324,060 | ) | | | 568,401 | |
Accumulated net realized gain (loss) on investments, foreign currency transactions, written options and short positions | | | 421,736,455 | | | | 6,140,462 | | | | 8,211,904 | | | | 1,219,591 | | | | 544,205 | |
Unrealized appreciation (depreciation) of investments, foreign currency translations, written options and short positions | | | 804,346,864 | | | | 1,944,512 | | | | 9,519,804 | | | | 3,441,760 | | | | 1,509,744 | |
NET ASSETS | | $ | 3,161,947,865 | | | $ | 74,609,571 | | | $ | 65,657,496 | | | $ | 48,521,688 | | | $ | 32,568,913 | |
CLASS A SHARES† | | | | | | | | | | | | | | | | | | | | |
Net assets applicable to shares outstanding | | $ | 1,584,009,971 | | | $ | 45,244,558 | | | $ | 18,793,557 | | | $ | 31,021,012 | | | $ | 24,801,773 | |
Shares outstanding | | | 37,102,701 | | | | 3,249,174 | | | | 1,064,364 | | | | 2,255,814 | | | | 2,342,806 | |
Net asset value and redemption price per share | | $ | 42.69 | | | $ | 13.92 | | | $ | 17.66 | | | $ | 13.75 | | | $ | 10.59 | |
Maximum offering price per share (Net asset value, plus 4.75% of offering price) | | $ | 44.82 | | | $ | 14.61 | | | $ | 18.54 | | | $ | 14.44 | | | $ | 11.12 | |
CLASS B SHARES†** | | | | | | | | | | | | | | | | | | | | |
Net assets applicable to shares outstanding | | $ | 26,823,334 | | | $ | 264,522 | | | $ | 420,841 | | | $ | 1,759,298 | | | $ | — | |
Shares outstanding | | | 669,384 | | | | 20,515 | | | | 25,719 | | | | 133,507 | | | | — | |
Net asset value and redemption price per share | | $ | 40.07 | | | $ | 12.89 | | | $ | 16.36 | | | $ | 13.18 | | | $ | — | |
CLASS C SHARES†** | | | | | | | | | | | | | | | | | | | | |
Net assets applicable to shares outstanding | | $ | 868,049,054 | | | $ | 7,277,976 | | | $ | 14,535,874 | | | $ | 2,644,069 | | | $ | 659,049 | |
Shares outstanding | | | 25,891,137 | | | | 572,467 | | | | 887,871 | | | | 200,748 | | | | 62,662 | |
Net asset value and redemption price per share | | $ | 33.53 | | | $ | 12.71 | | | $ | 16.37 | | | $ | 13.17 | | | $ | 10.52 | |
CLASS I SHARES† | | | | | | | | | | | | | | | | | | | | |
Net assets applicable to shares outstanding | | $ | 672,967,606 | | | $ | 21,670,693 | | | $ | 31,675,440 | | | $ | 11,175,338 | | | $ | 6,997,702 | |
Shares outstanding | | | 13,285,519 | | | | 1,519,018 | | | | 1,772,731 | | | | 801,040 | | | | 660,030 | |
Net asset value and redemption price per share | | $ | 50.65 | | | $ | 14.27 | | | $ | 17.87 | | | $ | 13.95 | | | $ | 10.60 | |
CLASS R SHARES† | | | | | | | | | | | | | | | | | | | | |
Net assets applicable to shares outstanding | | $ | 10,097,900 | | | $ | 151,822 | | | $ | 231,784 | | | $ | 1,921,971 | | | $ | 110,389 | |
Shares outstanding | | | 245,264 | | | | 11,021 | | | | 13,337 | | | | 141,606 | | | | 10,444 | |
Net asset value and redemption price per share | | $ | 41.17 | | | $ | 13.78 | | | $ | 17.38 | | | $ | 13.57 | | | $ | 10.57 | |
| † | No par value; unlimited number of shares authorized. |
| ** | Redemption price may be reduced by contingent deferred sales charge. |
| | | | | | |
| See accompanying Notes to Financial Statements | | www.calamos.com | | | 137 | |
Statements of Assets and Liabilities April 30, 2015 (Unaudited)
| | | | | | | | | | | | | | | | | | | | |
| | | MID CAP
GROWTH FUND | | | INTERNATIONAL
GROWTH FUND | | | EVOLVING WORLD GROWTH FUND | | | EMERGING MARKET EQUITY FUND | | | GLOBAL EQUITY FUND | |
ASSETS | | | | | | | | | | | | | | | | | | | | |
Investments in securities, at cost | | $ | 37,001,246 | | | $ | 654,854,003 | | | $ | 564,710,320 | | | $ | 17,569,882 | | | $ | 179,616,279 | |
Investment in securities, at value | | $ | 40,157,488 | | | $ | 721,822,055 | | | $ | 612,859,783 | | | $ | 18,652,602 | | | $ | 214,864,524 | |
Restricted cash for short positions (interest bearing) | | | — | | | | — | | | | — | | | | — | | | | — | |
Due from investment advisor | | | 16,695 | | | | — | | | | — | | | | 9,339 | | | | — | |
Restricted foreign currency for short positions (cost $-) | | | — | | | | — | | | | — | | | | — | | | | — | |
Foreign currency (cost $18,100, $127,325, $55,074, $2,617) | | | — | | | | 18,106 | | | | 126,641 | | | | 55,063 | | | | 1,429 | |
Unrealized appreciation on forward foreign currency contracts | | | — | | | | 28,594 | | | | 65,208 | | | | 1 | | | | 6,946 | |
Receivables: | | | | | | | | | | | | | | | | | | | | |
Accrued interest and dividends | | | 7,498 | | | | 2,326,998 | | | | 576,141 | | | | 9,533 | | | | 402,847 | |
Investments sold | | | 130,381 | | | | 3,533,077 | | | | 11,040,757 | | | | 91,253 | | | | 1,561,677 | |
Fund shares sold | | | 4,161 | | | | 682,823 | | | | 2,728,038 | | | | 22,441 | | | | 173,029 | |
Prepaid expenses | | | 24,295 | | | | 85,380 | | | | 66,082 | | | | 30,321 | | | | 49,207 | |
Deferred offering costs | | | — | | | | — | | | | — | | | | — | | | | — | |
Other assets | | | 10,006 | | | | 106,315 | | | | 61,562 | | | | 8,472 | | | | 69,991 | |
Total assets | | | 40,350,524 | | | | 728,603,348 | | | | 627,524,212 | | | | 18,879,025 | | | | 217,129,650 | |
LIABILITIES | | | | | | | | | | | | | | | | | | | | |
Due to custodian bank | | | — | | | | — | | | | — | | | | — | | | | — | |
Collateral for securities loaned | | | 100,050 | | | | 29,256,970 | | | | 5,016,209 | | | | 97,500 | | | | 5,228,351 | |
Securities sold short, at value (proceeds $-) | | | — | | | | — | | | | — | | | | — | | | | — | |
Options written, at value (premium $-) | | | — | | | | — | | | | — | | | | — | | | | — | |
Unrealized depreciation on forward foreign currency contracts | | | 4,169 | | | | 2,045,142 | | | | 1,041,079 | | | | — | | | | 332,618 | |
Payables: | | | | | | | | | | | | | | | | | | | | |
Investments purchased | | | 232 | | | | 7,277,651 | | | | 3,666,411 | | | | 53,039 | | | | 957,180 | |
Fund shares redeemed | | | — | | | | 1,020,959 | | | | 3,340,195 | | | | 26,578 | | | | 272,340 | |
Dividends payable | | | — | | | | — | | | | — | | | | — | | | | — | |
Affiliates: | | | | | | | | | | | | | | | | | | | | |
Investment advisory fees | | | 34,054 | | | | 472,910 | | | | 545,695 | | | | 16,752 | | | | 143,568 | |
Distribution fees | | | 472 | | | | 6,652 | | | | 4,559 | | | | 139 | | | | 2,714 | |
Deferred compensation to trustees | | | 10,006 | | | | 106,315 | | | | 61,562 | | | | 8,472 | | | | 69,991 | |
Financial accounting fees | | | 391 | | | | 6,530 | | | | 5,751 | | | | 175 | | | | 2,010 | |
Trustees’ fees and officer compensation | | | 1,547 | | | | 5,688 | | | | 4,861 | | | | 1,256 | | | | 2,650 | |
Other accounts payable and accrued liabilities | | | 14,035 | | | | 488,947 | | | | 1,258,638 | | | | 19,264 | | | | 127,462 | |
Total liabilities | | | 164,956 | | | | 40,687,764 | | | | 14,944,960 | | | | 223,175 | | | | 7,138,884 | |
NET ASSETS | | $ | 40,185,568 | | | $ | 687,915,584 | | | $ | 612,579,252 | | | $ | 18,655,850 | | | $ | 209,990,766 | |
COMPOSITION OF NET ASSETS | | | | | | | | | | | | | | | | | | | | |
Paid in capital | | $ | 35,691,751 | | | $ | 604,676,415 | | | $ | 572,236,710 | | | $ | 18,504,075 | | | $ | 167,092,574 | |
Undistributed net investment income (loss) | | | (12,375 | ) | | | 1,135,233 | | | | (1,869,382 | ) | | | (59,292 | ) | | | 166,876 | |
Accumulated net realized gain (loss) on investments, foreign currency transactions, written options and short positions | | | 1,354,118 | | | | 17,305,282 | | | | (3,988,579 | ) | | | (871,889 | ) | | | 7,802,924 | |
Unrealized appreciation (depreciation) of investments, foreign currency translations, written options and short positions | | | 3,152,074 | | | | 64,798,654 | * | | | 46,200,503 | * | | | 1,082,956 | | | | 34,928,392 | |
NET ASSETS | | $ | 40,185,568 | | | $ | 687,915,584 | | | $ | 612,579,252 | | | $ | 18,655,850 | | | $ | 209,990,766 | |
CLASS A SHARES† | | | | | | | | | | | | | | | | | | | | |
Net assets applicable to shares outstanding | | $ | 30,717,981 | | | $ | 231,786,577 | | | $ | 148,809,660 | | | $ | 8,472,116 | | | $ | 76,709,050 | |
Shares outstanding | | | 2,574,039 | | | | 12,719,567 | | | | 10,723,703 | | | | 847,077 | | | | 5,726,780 | |
Net asset value and redemption price per share | | $ | 11.93 | | | $ | 18.22 | | | $ | 13.88 | | | $ | 10.00 | | | $ | 13.39 | |
Maximum offering price per share (Net asset value, plus 4.75% of offering price) | | $ | 12.52 | | | $ | 19.13 | | | $ | 14.57 | | | $ | 10.50 | | | $ | 14.06 | |
CLASS B SHARES†** | | | | | | | | | | | | | | | | | | | | |
Net assets applicable to shares outstanding | | $ | — | | | $ | 1,594,069 | | | $ | 586,369 | | | $ | — | | | $ | 701,785 | |
Shares outstanding | | | — | | | | 93,683 | | | | 43,859 | | | | — | | | | 55,425 | |
Net asset value and redemption price per share | | $ | — | | | $ | 17.02 | | | $ | 13.37 | | | $ | — | | | $ | 12.66 | |
CLASS C SHARES†** | | | | | | | | | | | | | | | | | | | | |
Net assets applicable to shares outstanding | | $ | 753,123 | | | $ | 52,938,131 | | | $ | 43,242,920 | | | $ | 322,558 | | | $ | 24,632,166 | |
Shares outstanding | | | 63,925 | | | | 3,115,211 | | | | 3,235,516 | | | | 32,396 | | | | 1,950,185 | |
Net asset value and redemption price per share | | $ | 11.78 | | | $ | 16.99 | | | $ | 13.37 | | | $ | 9.96 | | | $ | 12.63 | |
CLASS I SHARES† | | | | | | | | | | | | | | | | | | | | |
Net assets applicable to shares outstanding | | $ | 8,595,587 | | | $ | 388,180,254 | | | $ | 418,128,591 | | | $ | 9,760,968 | | | $ | 99,895,516 | |
Shares outstanding | | | 717,082 | | | | 20,989,927 | | | | 29,963,478 | | | | 974,372 | | | | 7,362,050 | |
Net asset value and redemption price per share | | $ | 11.99 | | | $ | 18.49 | | | $ | 13.95 | | | $ | 10.02 | | | $ | 13.57 | |
CLASS R SHARES† | | | | | | | | | | | | | | | | | | | | |
Net assets applicable to shares outstanding | | $ | 118,877 | | | $ | 13,416,553 | | | $ | 1,811,712 | | | $ | 100,208 | | | $ | 8,052,249 | |
Shares outstanding | | | 10,002 | | | | 749,038 | | | | 131,564 | | | | 10,017 | | | | 614,152 | |
Net asset value and redemption price per share | | $ | 11.89 | | | $ | 17.91 | | | $ | 13.77 | | | $ | 10.00 | | | $ | 13.11 | |
| † | No par value; unlimited number of shares authorized. |
| ** | Redemption price may be reduced by contingent deferred sales charge. |
| * | Net of deferred foreign capital gains tax of $186,197 and $987,467, respectively. |
| | | | |
| 138 | | CALAMOS OPEN-END FAMILY OF FUNDS SEMIANNUAL REPORT | | See accompanying Notes to Financial Statements |
Statements of Assets and Liabilities April 30, 2015 (Unaudited)
| | | | | | | | | | | | | | | | | | | | |
| | | GROWTH AND
INCOME FUND | | | GLOBAL GROWTH
AND INCOME FUND | | | CONVERTIBLE
FUND | | | GLOBAL
CONVERTIBLE FUND | | | TOTAL RETURN
BOND FUND | |
ASSETS | | | | | | | | | | | | | | | | | | | | |
Investments in securities, at cost | | $ | 2,403,415,791 | | | $ | 401,526,546 | | | $ | 1,271,192,860 | | | $ | 8,948,255 | | | $ | 74,054,176 | |
Investment in securities, at value | | $ | 2,855,509,347 | | | $ | 429,774,222 | | | $ | 1,344,310,503 | | | $ | 9,036,469 | | | $ | 76,336,147 | |
Restricted cash for short positions (interest bearing) | | | — | | | | — | | | | — | | | | — | | | | — | |
Due from investment advisor | | | 14,348 | | | | — | | | | — | | | | 15,636 | | | | 17,422 | |
Restricted foreign currency for short positions (cost $-) | | | — | | | | — | | | | — | | | | — | | | | — | |
Foreign currency (cost $2) | | | — | | | | — | | | | — | | | | 2 | | | | — | |
Unrealized appreciation on forward foreign currency contracts | | | 53,397 | | | | 15,625 | | | | 30,378 | | | | — | | | | — | |
Receivables: | | | | | | | | | | | | | | | | | | | | |
Accrued interest and dividends | | | 6,467,251 | | | | 1,620,698 | | | | 4,970,523 | | | | 35,740 | | | | 622,764 | |
Investments sold | | | 752,595 | | | | 8,073,045 | | | | 24,904,290 | | | | — | | | | 3,109,289 | |
Fund shares sold | | | 1,546,931 | | | | 157,414 | | | | 1,866,436 | | | | 6,965,672 | | | | 91,708 | |
Prepaid expenses | | | 181,313 | | | | 61,985 | | | | 107,035 | | | | 4,253 | | | | 25,555 | |
Deferred offering costs | | | — | | | | — | | | | — | | | | 165,685 | | | | — | |
Other assets | | | 436,002 | | | | 170,399 | | | | 229,540 | | | | 403 | | | | 71,963 | |
Total assets | | | 2,864,961,184 | | | | 439,873,388 | | | | 1,376,418,705 | | | | 16,223,860 | | | | 80,274,848 | |
LIABILITIES | | | | | | | | | | | | | | | | | | | | |
Due to custodian bank | | | — | | | | 2,628,642 | | | | — | | | | — | | | | — | |
Collateral for securities loaned | | | 66,137,705 | | | | 13,194,745 | | | | 80,599,565 | | | | — | | | | 1,132,038 | |
Securities sold short, at value (proceeds $-) | | | — | | �� | | — | | | | — | | | | — | | | | — | |
Options written, at value (premium $168,568) | | | — | | | | — | | | | 179,400 | | | | — | | | | — | |
Unrealized depreciation on forward foreign currency contracts | | | — | | | | 336,236 | | | | 834,907 | | | | — | | | | — | |
Payables: | | | | | | | | | | | | | | | | | | | | |
Investments purchased | | | — | | | | 1,450,852 | | | | 33,708,595 | | | | 596,248 | | | | 1,997,440 | |
Fund shares redeemed | | | 6,583,477 | | | | 553,733 | | | | 3,194,083 | | | | 6,719 | | | | 139,248 | |
Dividends payable | | | — | | | | — | | | | — | | | | — | | | | 16,151 | |
Affiliates: | | | | | | | | | | | | | | | | | | | | |
Investment advisory fees | | | 1,572,522 | | | | 347,759 | | | | 745,467 | | | | 5,802 | | | | 35,307 | |
Distribution fees | | | 70,064 | | | | 9,380 | | | | 23,328 | | | | 81 | | | | 1,636 | |
Deferred compensation to trustees | | | 436,002 | | | | 170,399 | | | | 229,540 | | | | 403 | | | | 71,963 | |
Financial accounting fees | | | 26,723 | | | | 3,998 | | | | 12,095 | | | | 78 | | | | 738 | |
Trustees’ fees and officer compensation | | | 18,975 | | | | 4,219 | | | | 9,023 | | | | 427 | | | | 1,884 | |
Other accounts payable and accrued liabilities | | | 901,070 | | | | 145,967 | | | | 303,697 | | | | 114,394 | | | | 34,561 | |
Total liabilities | | | 75,746,538 | | | | 18,845,930 | | | | 119,839,700 | | | | 724,152 | | | | 3,430,966 | |
NET ASSETS | | $ | 2,789,214,646 | | | $ | 421,027,458 | | | $ | 1,256,579,005 | | | $ | 15,499,708 | | | $ | 76,843,882 | |
COMPOSITION OF NET ASSETS | | | | | | | | | | | | | | | | | | | | |
Paid in capital | | $ | 2,227,278,142 | | | $ | 377,637,222 | | | $ | 1,097,616,050 | | | $ | 15,273,731 | | | $ | 73,889,040 | |
Undistributed net investment income (loss) | | | (6,741,980 | ) | | | 1,115,598 | | | | (7,658,183 | ) | | | 49,020 | | | | (267,021 | ) |
Accumulated net realized gain (loss) on investments, foreign currency transactions, written options and short positions | | | 116,531,531 | | | | 14,329,272 | | | | 94,324,258 | | | | 89,458 | | | | 939,892 | |
Unrealized appreciation (depreciation) of investments, foreign currency translations, written options and short positions | | | 452,146,953 | | | | 27,945,366 | | | | 72,296,880 | | | | 87,499 | | | | 2,281,971 | |
NET ASSETS | | $ | 2,789,214,646 | | | $ | 421,027,458 | | | $ | 1,256,579,005 | | | $ | 15,499,708 | | | $ | 76,843,882 | |
CLASS A SHARES† | | | | | | | | | | | | | | | | | | | | |
Net assets applicable to shares outstanding | | $ | 1,194,218,454 | | | $ | 125,501,254 | | | $ | 453,719,342 | | | $ | 4,709,541 | | | $ | 45,296,314 | |
Shares outstanding | | | 37,445,332 | | | | 14,170,295 | | | | 25,568,694 | | | | 452,226 | | | | 4,256,351 | |
Net asset value and redemption price per share | | $ | 31.89 | | | $ | 8.86 | | | $ | 17.75 | | | $ | 10.41 | | | $ | 10.64 | |
Maximum offering price per share (Net asset value, plus 4.75% of offering price) | | $ | 33.48 | | | $ | 9.30 | | | $ | 18.64 | | | $ | 10.93 | | | $ | 11.05 | # |
CLASS B SHARES†** | | | | | | | | | | | | | | | | | | | | |
Net assets applicable to shares outstanding | | $ | 13,579,539 | | | $ | 3,325,314 | | | $ | 7,772,123 | | | $ | — | | | $ | 1,346,517 | |
Shares outstanding | | | 358,572 | | | | 368,822 | | | | 344,900 | | | | — | | | | 126,569 | |
Net asset value and redemption price per share | | $ | 37.87 | | | $ | 9.02 | | | $ | 22.53 | | | $ | — | | | $ | 10.64 | |
CLASS C SHARES†** | | | | | | | | | | | | | | | | | | | | |
Net assets applicable to shares outstanding | | $ | 943,453,988 | | | $ | 133,555,878 | | | $ | 299,592,800 | | | $ | 247,106 | | | $ | 17,031,315 | |
Shares outstanding | | | 29,464,971 | | | | 16,471,328 | | | | 17,031,109 | | | | 23,785 | | | | 1,601,025 | |
Net asset value and redemption price per share | | $ | 32.02 | | | $ | 8.11 | | | $ | 17.59 | | | $ | 10.39 | | | $ | 10.64 | |
CLASS I SHARES† | | | | | | | | | | | | | | | | | | | | |
Net assets applicable to shares outstanding | | $ | 621,119,145 | | | $ | 157,050,210 | | | $ | 493,232,996 | | | $ | 10,439,002 | | | $ | 12,937,490 | |
Shares outstanding | | | 20,078,952 | | | | 17,326,566 | | | | 30,541,699 | | | | 1,001,241 | | | | 1,216,016 | |
Net asset value and redemption price per share | | $ | 30.93 | | | $ | 9.06 | | | $ | 16.15 | | | $ | 10.43 | | | $ | 10.64 | |
CLASS R SHARES† | | | | | | | | | | | | | | | | | | | | |
Net assets applicable to shares outstanding | | $ | 16,843,520 | | | $ | 1,594,802 | | | $ | 2,261,744 | | | $ | 104,059 | | | $ | 232,246 | |
Shares outstanding | | | 531,991 | | | | 182,057 | | | | 127,876 | | | | 10,000 | | | | 21,828 | |
Net asset value and redemption price per share | | $ | 31.66 | | | $ | 8.76 | | | $ | 17.69 | | | $ | 10.41 | | | $ | 10.64 | |
| † | No par value; unlimited number of shares authorized. |
| ** | Redemption price may be reduced by contingent deferred sales charge. |
| # | For Total Return Bond Fund, maximum offering price per share is Net asset value plus 3.75% of offering price. |
| | | | | | |
| See accompanying Notes to Financial Statements | | www.calamos.com | | | 139 | |
Statements of Assets and Liabilities April 30, 2015 (Unaudited)
| | | | | | | | | | | | | | | | |
| | | HIGH INCOME FUND | | | MARKET NEUTRAL
INCOME FUND | | | HEDGED EQUITY
INCOME FUND | | | LONG/SHORT FUND | |
ASSETS | | | | | | | | | | | | | | | | |
Investments in securities, at cost | | $ | 156,393,750 | | | $ | 3,853,735,194 | | | $ | 11,174,704 | | | $ | 95,259,072 | |
Investment in securities, at value | | $ | 156,655,986 | | | $ | 4,022,740,279 | | | $ | 11,152,886 | | | $ | 100,916,624 | |
Restricted cash for short positions (interest bearing) | | | — | | | | 967,154,407 | | | | — | | | | 24,439,840 | |
Due from investment advisor | | | — | | | | — | | | | 15,117 | | | | — | |
Restricted foreign currency for short positions (cost $8,368,841, $3,584,702) | | | — | | | | 7,285,712 | | | | — | | | | 3,110,276 | |
Foreign currency | | | — | | | | — | | | | — | | | | — | |
Unrealized appreciation on forward foreign currency contracts | | | — | | | | — | | | | — | | | | — | |
Receivables: | | | | | | | | | | | | | | | | |
Accrued interest and dividends | | | 2,178,739 | | | | 12,670,537 | | | | 10,116 | | | | 75,674 | |
Investments sold | | | 389,629 | | | | 18,142,866 | | | | 14,893 | | | | 1,569,170 | |
Fund shares sold | | | 303,908 | | | | 8,390,209 | | | | 5,108 | | | | 95,913 | |
Prepaid expenses | | | 42,099 | | | | 270,382 | | | | 4,458 | | | | 27,067 | |
Deferred offering costs | | | — | | | | — | | | | 165,685 | | | | — | |
Other assets | | | 115,926 | | | | 238,345 | | | | 409 | | | | 10,988 | |
Total assets | | | 159,686,287 | | | | 5,036,892,737 | | | | 11,368,672 | | | | 130,245,552 | |
LIABILITIES | | | | | | | | | | | | | | | | |
Due to custodian bank | | | — | | | | 1,177,081 | | | | — | | | | — | |
Collateral for securities loaned | | | 11,199,445 | | | | 120,143,087 | | | | — | | | | 392,800 | |
Securities sold short, at value (proceeds $836,191,209, $23,894,838) | | | — | | | | 927,925,240 | | | | — | | | | 25,960,144 | |
Options written, at value (premium $24,480,848, $111,569, $311,875) | | | — | | | | 21,791,438 | | | | 68,130 | | | | 337,927 | |
Unrealized depreciation on forward foreign currency contracts | | | — | | | | — | | | | — | | | | — | |
Payables: | | | | | | | | | | | | | | | | |
Investments purchased | | | 1,332,121 | | | | 18,217,931 | | | | 18,506 | | | | 1,277,601 | |
Fund shares redeemed | | | 351,501 | | | | 7,194,784 | | | | — | | | | 185,770 | |
Dividends payable | | | 48,465 | | | | — | | | | — | | | | — | |
Affiliates: | | | | | | | | | | | | | | | | |
Investment advisory fees | | | 91,026 | | | | 2,205,167 | | | | 6,850 | | | | 105,355 | |
Distribution fees | | | 2,764 | | | | 34,854 | | | | 86 | | | | 849 | |
Deferred compensation to trustees | | | 115,926 | | | | 238,345 | | | | 409 | | | | 10,988 | |
Financial accounting fees | | | 1,395 | | | | 37,913 | | | | 105 | | | | 969 | |
Trustees’ fees and officer compensation | | | 2,404 | | | | 24,806 | | | | 384 | | | | 2,009 | |
Other accounts payable and accrued liabilities | | | 58,764 | | | | 1,138,673 | | | | 108,574 | | | | 40,493 | |
Total liabilities | | | 13,203,811 | | | | 1,100,129,319 | | | | 203,044 | | | | 28,314,905 | |
NET ASSETS | | $ | 146,482,476 | | | $ | 3,936,763,418 | | | $ | 11,165,628 | | | $ | 101,930,647 | |
COMPOSITION OF NET ASSETS | | | | | | | | | | | | | | | | |
Paid in capital | | $ | 148,707,530 | | | $ | 3,835,695,962 | | | $ | 11,103,384 | | | $ | 97,883,760 | |
Undistributed net investment income (loss) | | | (285,896 | ) | | | 9,428,785 | | | | 25,733 | | | | (571,827 | ) |
Accumulated net realized gain (loss) on investments, foreign currency transactions, written options and short positions | | | (2,201,394 | ) | | | 12,761,325 | | | | 14,890 | | | | 1,526,953 | |
Unrealized appreciation (depreciation) of investments, foreign currency translations, written options and short positions | | | 262,236 | | | | 78,877,346 | | | | 21,621 | | | | 3,091,761 | |
NET ASSETS | | $ | 146,482,476 | | | $ | 3,936,763,418 | | | $ | 11,165,628 | | | $ | 101,930,647 | |
CLASS A SHARES† | | | | | | | | | | | | | | | | |
Net assets applicable to shares outstanding | | $ | 93,682,617 | | | $ | 1,148,771,534 | | | $ | 5,568,756 | | | $ | 36,394,685 | |
Shares outstanding | | | 10,187,341 | | | | 87,580,278 | | | | 554,409 | | | | 3,349,752 | |
Net asset value and redemption price per share | | $ | 9.20 | | | $ | 13.12 | | | $ | 10.04 | | | $ | 10.86 | |
Maximum offering price per share (Net asset value, plus 4.75% of offering price) | | $ | 9.66 | | | $ | 13.77 | | | $ | 10.54 | | | $ | 11.40 | |
CLASS B SHARES†** | | | | | | | | | | | | | | | | |
Net assets applicable to shares outstanding | | $ | 1,289,543 | | | $ | 3,158,604 | | | $ | — | | | $ | — | |
Shares outstanding | | | 132,824 | | | | 227,557 | | | | — | | | | — | |
Net asset value and redemption price per share | | $ | 9.71 | | | $ | 13.88 | | | $ | — | | | $ | — | |
CLASS C SHARES†** | | | | | | | | | | | | | | | | |
Net assets applicable to shares outstanding | | $ | 25,452,952 | | | $ | 339,682,967 | | | $ | 100,195 | | | $ | 6,260,114 | |
Shares outstanding | | | 2,649,260 | | | | 25,508,247 | | | | 10,000 | | | | 583,841 | |
Net asset value and redemption price per share | | $ | 9.61 | | | $ | 13.32 | | | $ | 10.02 | | | $ | 10.72 | |
CLASS I SHARES† | | | | | | | | | | | | | | | | |
Net assets applicable to shares outstanding | | $ | 25,897,652 | | | $ | 2,436,964,948 | | | $ | 5,396,317 | | | $ | 59,165,475 | |
Shares outstanding | | | 2,816,254 | | | | 187,726,840 | | | | 536,824 | | | | 5,421,745 | |
Net asset value and redemption price per share | | $ | 9.20 | | | $ | 12.98 | | | $ | 10.05 | | | $ | 10.91 | |
CLASS R SHARES† | | | | | | | | | | | | | | | | |
Net assets applicable to shares outstanding | | $ | 159,712 | | | $ | 8,185,365 | | | $ | 100,360 | | | $ | 110,373 | |
Shares outstanding | | | 17,394 | | | | 626,361 | | | | 10,000 | | | | 10,199 | |
Net asset value and redemption price per share | | $ | 9.18 | | | $ | 13.07 | | | $ | 10.04 | | | $ | 10.82 | |
| † | No par value; unlimited number of shares authorized. |
| ** | Redemption price may be reduced by contingent deferred sales charge. |
| | | | |
| 140 | | CALAMOS OPEN-END FAMILY OF FUNDS SEMIANNUAL REPORT | | See accompanying Notes to Financial Statements |
Statements of Operations Six Months Ended April 30, 2015 (Unaudited)
| | | | | | | | | | | | | | | | | | | | |
| | | GROWTH
FUND | | | OPPORTUNISTIC
VALUE FUND | | | FOCUS GROWTH
FUND | | | DISCOVERY
GROWTH FUND | | | DIVIDEND
GROWTH FUND | |
INVESTMENT INCOME | | | | | | | | | | | | | | | | | | | | |
Interest | | $ | 1,075,339 | | | $ | — | | | $ | 25,342 | | | $ | — | | | $ | — | |
Dividends | | | 16,552,238 | | | | 1,030,402 | | | | 388,585 | | | | 79,681 | | | | 579,958 | |
Securities lending income | | | 1,206,972 | | | | 38,042 | | | | 3,608 | | | | 28,473 | | | | 14,489 | |
Dividend taxes withheld | | | (12,939 | ) | | | — | | | | — | | | | (797 | ) | | | — | |
Total investment income | | | 18,821,610 | | | | 1,068,444 | | | | 417,535 | | | | 107,357 | | | | 594,447 | |
| | | | | |
EXPENSES | | | | | | | | | | | | | | | | | | | | |
Investment advisory fees | | | 13,898,922 | | | | 427,992 | | | | 326,889 | | | | 236,304 | | | | 167,644 | |
Distribution fees | | | | | | | | | | | | | | | | | | | | |
Class A | | | 2,037,270 | | | | 62,923 | | | | 24,457 | | | | 38,017 | | | | 31,854 | |
Class B | | | 155,151 | | | | 1,488 | | | | 2,210 | | | | 8,517 | | | | — | |
Class C | | | 4,505,146 | | | | 41,601 | | | | 71,885 | | | | 12,809 | | | | 2,541 | |
Class R | | | 24,855 | | | | 370 | | | | 548 | | | | 4,625 | | | | 271 | |
Transfer agent fees | | | 2,357,556 | | | | 41,756 | | | | 23,707 | | | | 13,659 | | | | 7,623 | |
Printing and mailing fees | | | 311,971 | | | | 5,350 | | | | 3,585 | | | | 2,023 | | | | 1,771 | |
Financial accounting fees | | | 189,270 | | | | 4,927 | | | | 3,762 | | | | 2,719 | | | | 1,929 | |
Accounting fees | | | 92,515 | | | | 10,950 | | | | 10,189 | | | | 11,293 | | | | 9,899 | |
Registration fees | | | 76,874 | | | | 33,897 | | | | 27,571 | | | | 30,626 | | | | 24,035 | |
Trustees’ fees and officer compensation | | | 73,552 | | | | 7,359 | | | | 6,773 | | | | 6,380 | | | | 6,149 | |
Audit fees | | | 71,279 | | | | 6,425 | | | | 6,053 | | | | 5,638 | | | | 5,368 | |
Legal fees | | | 69,505 | | | | 11,258 | | | | 6,686 | | | | 6,247 | | | | 9,404 | |
Custodian fees | | | 54,243 | | | | 4,555 | | | | 5,462 | | | | 4,730 | | | | 3,320 | |
Dividend or interest expense on short positions | | | — | | | | — | | | | — | | | | — | | | | — | |
Offering costs and organizational fees | | | — | | | | — | | | | — | | | | — | | | | — | |
Other | | | 93,039 | | | | 7,124 | | | | 7,099 | | | | 4,470 | | | | 3,735 | |
Total expenses | | | 24,011,148 | | | | 667,975 | | | | 526,876 | | | | 388,057 | | | | 275,543 | |
Less expense reductions | | | — | | | | (176,400 | ) | | | (133,576 | ) | | | (28,708 | ) | | | (56,467 | ) |
Net expenses | | | 24,011,148 | | | | 491,575 | | | | 393,300 | | | | 359,349 | | | | 219,076 | |
NET INVESTMENT INCOME (LOSS) | | | (5,189,538 | ) | | | 576,869 | | | | 24,235 | | | | (251,992 | ) | | | 375,371 | |
| | | | | |
REALIZED AND UNREALIZED GAIN (LOSS) | | | | | | | | | | | | | | | | | | | | |
Net realized gain (loss) from: | | | | | | | | | | | | | | | | | | | | |
Investments | | | 419,698,322 | | | | 6,372,510 | | | | 8,209,610 | | | | 1,438,143 | | | | 646,916 | |
Purchased options | | | — | | | | (83,311 | ) | | | (37,290 | ) | | | — | | | | (31,824 | ) |
Foreign currency transactions | | | 3,974,151 | | | | — | | | | 8,046 | | | | — | | | | — | |
Written options | | | 942,581 | | | | (6,126 | ) | | | 41,881 | | | | — | | | | (75 | ) |
Short positions | | | — | | | | (73,203 | ) | | | — | | | | — | | | | (51,745 | ) |
Change in net unrealized appreciation/(depreciation) on: | | | | | | | | | | | | | | | | | | | | |
Investments | | | (217,878,724 | ) | | | (7,149,860 | ) | | | (5,037,475 | ) | | | 1,426,855 | | | | (755,036 | ) |
Purchased options | | | — | | | | — | | | | — | | | | — | | | | — | |
Foreign currency translations | | | (1,013,169 | ) | | | — | | | | 7,764 | | | | — | | | | — | |
Written options | | | (41,588 | ) | | | 40,594 | | | | — | | | | — | | | | 14,001 | |
Short positions | | | — | | | | — | | | | — | | | | — | | | | — | |
NET GAIN (LOSS) | | | 205,681,573 | | | | (899,396 | ) | | | 3,192,536 | | | | 2,864,998 | | | | (177,763 | ) |
NET INCREASE (DECREASE) IN NET ASSETS RESULTING FROM OPERATIONS | | $ | 200,492,035 | | | $ | (322,527 | ) | | $ | 3,216,771 | | | $ | 2,613,006 | | | $ | 197,608 | |
| | | | | | |
| See accompanying Notes to Financial Statements | | www.calamos.com | | | 141 | |
Statements of Operations Six Months Ended April 30, 2015 (Unaudited)
| | | | | | | | | | | | | | | | | | | | |
| | | MID CAP
GROWTH FUND | | | INTERNATIONAL
GROWTH FUND | | | EVOLVING WORLD GROWTH FUND | | | EMERGING MARKET EQUITY FUND | | | GLOBAL EQUITY FUND | |
INVESTMENT INCOME | | | | | | | | | | | | | | | | | | | | |
Interest | | $ | — | | | $ | — | | | $ | 1,153,339 | | | $ | — | | | $ | 5,374 | |
Dividends | | | 169,521 | | | | 6,158,610 | | | | 3,463,926 | | | | 112,110 | | | | 1,444,913 | |
Securities lending income | | | 54,989 | | | | 69,402 | | | | 27,683 | | | | 842 | | | | 9,103 | |
Dividend taxes withheld | | | (710 | ) | | | (624,107 | ) | | | (295,466 | ) | | | (12,992 | ) | | | (101,591 | ) |
Total investment income | | | 223,800 | | | | 5,603,905 | | | | 4,349,482 | | | | 99,960 | | | | 1,357,799 | |
| | | | | |
EXPENSES | | | | | | | | | | | | | | | | | | | | |
Investment advisory fees | | | 221,123 | | | | 2,863,752 | | | | 3,244,805 | | | | 95,074 | | | | 846,900 | |
Distribution fees | | | | | | | | | | | | | | | | | | | | |
Class A | | | 42,270 | | | | 292,847 | | | | 185,471 | | | | 9,507 | | | | 101,233 | |
Class B | | | — | | | | 9,308 | | | | 2,908 | | | | — | | | | 5,195 | |
Class C | | | 3,637 | | | | 268,240 | | | | 210,943 | | | | 1,513 | | | | 127,720 | |
Class R | | | 290 | | | | 35,865 | | | | 3,933 | | | | 236 | | | | 20,167 | |
Transfer agent fees | | | 7,868 | | | | 499,558 | | | | 463,353 | | | | 5,606 | | | | 148,271 | |
Printing and mailing fees | | | 1,946 | | | | 41,102 | | | | 58,405 | | | | 2,445 | | | | 36,789 | |
Financial accounting fees | | | 2,544 | | | | 39,792 | | | | 34,212 | | | | 995 | | | | 12,174 | |
Accounting fees | | | 10,062 | | | | 27,313 | | | | 25,033 | | | | 9,129 | | | | 15,936 | |
Registration fees | | | 26,307 | | | | 41,760 | | | | 55,604 | | | | 20,471 | | | | 31,414 | |
Trustees’ fees and officer compensation | | | 6,464 | | | | 19,931 | | | | 19,122 | | | | 7,212 | | | | 9,445 | |
Audit fees | | | 5,560 | | | | 19,731 | | | | 14,138 | | | | 5,273 | | | | 9,474 | |
Legal fees | | | 6,877 | | | | 39,292 | | | | 16,205 | | | | 4,073 | | | | 7,958 | |
Custodian fees | | | 5,471 | | | | 114,180 | | | | 188,723 | | | | 19,104 | | | | 23,456 | |
Dividend or interest expense on short positions | | | — | | | | — | | | | — | | | | — | | | | — | |
Offering costs and organizational fees | | | — | | | | — | | | | — | | | | — | | | | — | |
Other | | | 3,448 | | | | 26,805 | | | | 29,961 | | | | 4,464 | | | | 14,717 | |
Total expenses | | | 343,867 | | | | 4,339,476 | | | | 4,552,816 | | | | 185,102 | | | | 1,410,849 | |
Less expense reductions | | | (76,549 | ) | | | — | | | | — | | | | (44,198 | ) | | | — | |
Net expenses | | | 267,318 | | | | 4,339,476 | | | | 4,552,816 | | | | 140,904 | | | | 1,410,849 | |
NET INVESTMENT INCOME (LOSS) | | | (43,518 | ) | | | 1,264,429 | | | | (203,334 | ) | | | (40,944 | ) | | | (53,050 | ) |
| | | | | |
REALIZED AND UNREALIZED GAIN (LOSS) | | | | | | | | | | | | | | | | | | | | |
Net realized gain (loss) from: | | | | | | | | | | | | | | | | | | | | |
Investments | | | 1,600,858 | | | | 16,188,171 | (a) | | | (8,998,015 | )(a) | | | (576,597 | ) | | | 7,547,676 | |
Purchased options | | | — | | | | 59,824 | | | | 127,759 | | | | 4,108 | | | | 24,432 | |
Foreign currency transactions | | | 88,195 | | | | 1,057,347 | | | | 4,487,500 | | | | (5,917 | ) | | | 292,358 | |
Written options | | | 6,761 | | | | — | | | | — | | | | — | | | | — | |
Short positions | | | — | | | | — | | | | — | | | | — | | | | — | |
Change in net unrealized appreciation/(depreciation) on: | | | | | | | | | | | | | | | | | | | | |
Investments | | | 571,591 | | | | 26,031,763 | (b) | | | 25,572,534 | (b) | | | 1,074,785 | | | | 6,473,041 | |
Purchased options | | | — | | | | — | | | | — | | | | — | | | | — | |
Foreign currency translations | | | (11,198 | ) | | | (1,931,822 | ) | | | (1,975,013 | ) | | | (51 | ) | | | (313,615 | ) |
Written options | | | — | | | | — | | | | — | | | | — | | | | — | |
Short positions | | | — | | | | — | | | | — | | | | — | | | | — | |
NET GAIN (LOSS) | | | 2,256,207 | | | | 41,405,283 | | | | 19,214,765 | | | | 496,328 | | | | 14,023,892 | |
NET INCREASE (DECREASE) IN NET ASSETS RESULTING FROM OPERATIONS | | $ | 2,212,689 | | | $ | 42,669,712 | | | $ | 19,011,431 | | | $ | 455,384 | | | $ | 13,970,842 | |
| (a) | Net of foreign capital gains tax of $208,878 and $131,189, respectively. |
| (b) | Net of change of $275,906 and $230,035, respectively in deferred capital gains tax. |
| | | | |
| 142 | | CALAMOS OPEN-END FAMILY OF FUNDS SEMIANNUAL REPORT | | See accompanying Notes to Financial Statements |
Statements of Operations Six Months Ended April 30, 2015 (Unaudited)
| | | | | | | | | | | | | | | | | | | | |
| | | GROWTH AND
INCOME FUND | | | GLOBAL GROWTH
AND INCOME FUND | | | CONVERTIBLE
FUND | | | GLOBAL
CONVERTIBLE FUND(a) | | | TOTAL RETURN
BOND FUND | |
INVESTMENT INCOME | | | | | | | | | | | | | | | | | | | | |
Interest | | $ | 16,487,276 | | | $ | 3,490,105 | | | $ | 16,259,706 | | | $ | 63,184 | | | $ | 1,500,991 | |
Dividends | | | 25,286,147 | | | | 2,384,656 | | | | 6,458,259 | | | | 13,274 | | | | 499 | |
Securities lending income | | | 110,514 | | | | 36,188 | | | | 237,743 | | | | — | | | | 1,911 | |
Dividend taxes withheld | | | — | | | | (122,438 | ) | | | — | | | | 1 | | | | — | |
Total investment income | | | 41,883,937 | | | | 5,788,511 | | | | 22,955,708 | | | | 76,459 | | | | 1,503,401 | |
| | | | | |
EXPENSES | | | | | | | | | | | | | | | | | | | | |
Investment advisory fees | | | 9,774,050 | | | | 2,187,530 | | | | 4,597,020 | | | | 18,569 | | | | 236,388 | |
Distribution fees | | | | | | | | | | | | | | | | | | | | |
Class A | | | 1,551,426 | | | | 164,832 | | | | 587,673 | | | | 2,723 | | | | 66,814 | |
Class B | | | 79,809 | | | | 19,779 | | | | 44,662 | | | | — | | | | 7,897 | |
Class C | | | 4,853,369 | | | | 687,938 | | | | 1,533,276 | | | | 517 | | | | 87,112 | |
Class R | | | 45,591 | | | | 4,044 | | | | 6,126 | | | | 168 | | | | 563 | |
Transfer agent fees | | | 1,616,631 | | | | 255,370 | | | | 638,678 | | | | 2,963 | | | | 46,458 | |
Printing and mailing fees | | | 201,284 | | | | 31,671 | | | | 70,940 | | | | 1,320 | | | | 6,393 | |
Financial accounting fees | | | 166,492 | | | | 25,179 | | | | 74,818 | | | | 251 | | | | 4,947 | |
Accounting fees | | | 84,591 | | | | 23,167 | | | | 44,385 | | | | 6,356 | | | | 13,000 | |
Registration fees | | | 58,305 | | | | 39,788 | | | | 54,602 | | | | — | | | | 30,716 | |
Trustees’ fees and officer compensation | | | 67,095 | | | | 14,564 | | | | 34,568 | | | | 3,000 | | | | 7,021 | |
Audit fees | | | 58,357 | | | | 14,200 | | | | 26,742 | | | | 2,880 | | | | 6,516 | |
Legal fees | | | 58,324 | | | | 28,643 | | | | 28,209 | | | | 2,040 | | | | 7,226 | |
Custodian fees | | | 37,185 | | | | 26,181 | | | | 12,649 | | | | 5,400 | | | | 3,795 | |
Dividend or interest expense on short positions | | | — | | | | — | | | | — | | | | — | | | | — | |
Offering costs and organizational fees | | | — | | | | — | | | | — | | | | 36,160 | | | | — | |
Other | | | 73,048 | | | | 21,252 | | | | 32,543 | | | | 2,952 | | | | 11,199 | |
Total expenses | | | 18,725,557 | | | | 3,544,138 | | | | 7,786,891 | | | | 85,299 | | | | 536,045 | |
Less expense reductions | | | — | | | | — | | | | — | | | | (57,860 | ) | | | (94,292 | ) |
Net expenses | | | 18,725,557 | | | | 3,544,138 | | | | 7,786,891 | | | | 27,439 | | | | 441,753 | |
NET INVESTMENT INCOME (LOSS) | | | 23,158,380 | | | | 2,244,373 | | | | 15,168,817 | | | | 49,020 | | | | 1,061,648 | |
| | | | | |
REALIZED AND UNREALIZED GAIN (LOSS) | | | | | | | | | | | | | | | | | | | | |
Net realized gain (loss) from: | | | | | | | | | | | | | | | | | | | | |
Investments, excluding purchased options | | | 96,971,989 | | | | 11,833,727 | | | | 62,576,683 | | | | 16,208 | | | | 1,267,352 | |
Purchased options | | | 3,108,166 | | | | 322,124 | | | | 13,936,333 | | | | 69,396 | | | | — | |
Foreign currency transactions | | | 2,422,433 | | | | 539,678 | | | | 2,803,429 | | | | 3,854 | | | | — | |
Written options | | | — | | | | — | | | | 886,356 | | | | — | | | | — | |
Short positions | | | — | | | | — | | | | — | | | | — | | | | — | |
Change in net unrealized appreciation/(depreciation) on: | | | | | | | | | | | | | | | | | | | | |
Investments, excluding purchased options | | | (62,490,286 | ) | | | 5,104,915 | | | | (60,456,129 | ) | | | 94,148 | | | | (617,599 | ) |
Purchased options | | | (5,055,156 | ) | | | (1,008,200 | ) | | | (14,460,344 | ) | | | (5,934 | ) | | | — | |
Foreign currency translations | | | (36,944 | ) | | | (316,086 | ) | | | (891,197 | ) | | | (715 | ) | | | — | |
Written options | | | — | | | | — | | | | (355,423 | ) | | | — | | | | — | |
Short positions | | | — | | | | — | | | | — | | | | — | | | | — | |
NET GAIN (LOSS) | | | 34,920,202 | | | | 16,476,158 | | | | 4,039,708 | | | | 176,957 | | | | 649,753 | |
NET INCREASE (DECREASE) IN NET ASSETS RESULTING FROM OPERATIONS | | $ | 58,078,582 | | | $ | 18,720,531 | | | $ | 19,208,525 | | | $ | 225,977 | | | $ | 1,711,401 | |
| (a) | Global Convertible Fund commenced operations on December 31, 2014. |
| | | | | | |
| See accompanying Notes to Financial Statements | | www.calamos.com | | | 143 | |
Statements of Operations Six Months Ended April 30, 2015 (Unaudited)
| | | | | | | | | | | | | | | | |
| | | HIGH INCOME
FUND | | | MARKET NEUTRAL
INCOME FUND | | | HEDGED EQUITY
INCOME FUND(a) | | | LONG/SHORT
FUND | |
INVESTMENT INCOME | | | | | | | | | | | | | | | | |
Interest | | $ | 4,429,903 | | | $ | 34,771,984 | | | $ | — | | | $ | 468 | |
Dividends | | | 90,391 | | | | 21,180,800 | | | | 65,468 | | | | 545,251 | |
Securities lending income | | | 19,110 | | | | 221,739 | | | | — | | | | 15,762 | |
Dividend taxes withheld | | | — | | | | — | | | | — | | | | — | |
Total investment income | | | 4,539,404 | | | | 56,174,523 | | | | 65,468 | | | | 561,481 | |
| | | | |
EXPENSES | | | | | | | | | | | | | | | | |
Investment advisory fees | | | 559,219 | | | | 13,665,331 | | | | 26,186 | | | | 708,496 | |
Distribution fees | | | | | | | | | | | | | | | | |
Class A | | | 122,063 | | | | 1,515,726 | | | | 4,330 | | | | 47,658 | |
Class B | | | 8,074 | | | | 18,594 | | | | — | | | | — | |
Class C | | | 132,550 | | | | 1,711,162 | | | | 327 | | | | 31,916 | |
Class R | | | 450 | | | | 20,038 | | | | 164 | | | | 271 | |
Transfer agent fees | | | 81,634 | | | | 2,366,890 | | | | 2,968 | | | | 43,673 | |
Printing and mailing fees | | | 10,627 | | | | 240,867 | | | | 1,440 | | | | 6,207 | |
Financial accounting fees | | | 8,583 | | | | 235,400 | | | | 402 | | | | 6,524 | |
Accounting fees | | | 15,379 | | | | 151,929 | | | | 6,418 | | | | 11,019 | |
Registration fees | | | 32,651 | | | | 104,026 | | | | — | | | | 31,824 | |
Trustees’ fees and officer compensation | | | 8,597 | | | | 97,304 | | | | 3,000 | | | | 8,295 | |
Audit fees | | | 8,475 | | | | 67,750 | | | | 2,880 | | | | 5,997 | |
Legal fees | | | 8,724 | | | | 84,561 | | | | 2,040 | | | | 6,701 | |
Custodian fees | | | 5,401 | | | | 79,830 | | | | 4,320 | | | | 14,004 | |
Dividend or interest expense on short positions | | | — | | | | 2,821,257 | | | | — | | | | 299,087 | |
Offering costs and organizational fees | | | — | | | | — | | | | 36,160 | | | | — | |
Other | | | 12,089 | | | | 138,794 | | | | 2,760 | | | | 4,716 | |
Total expenses | | | 1,014,516 | | | | 23,319,459 | | | | 93,395 | | | | 1,226,388 | |
Less expense reductions | | | — | | | | — | | | | (53,660 | ) | | | — | |
Net expenses | | | 1,014,516 | | | | 23,319,459 | | | | 39,735 | | | | 1,226,388 | |
NET INVESTMENT INCOME (LOSS) | | | 3,524,888 | | | | 32,855,064 | | | | 25,733 | | | | (664,907 | ) |
| | | | |
REALIZED AND UNREALIZED GAIN (LOSS) | | | | | | | | | | | | | | | | |
Net realized gain (loss) from: | | | | | | | | | | | | | | | | |
Investments | | | (1,659,078 | ) | | | 60,634,316 | | | | 26,721 | | | | 269,038 | |
Purchased options | | | — | | | | (45,362,798 | ) | | | (153,073 | ) | | | 145,991 | |
Foreign currency transactions | | | — | | | | (22,342 | ) | | | — | | | | (6,167 | ) |
Written options | | | — | | | | (31,204,567 | ) | | | 141,242 | | | | 298,429 | |
Short positions | | | — | | | | (20,582,560 | ) | | | — | | | | 1,390,046 | |
Change in net unrealized appreciation/(depreciation) on: | | | | | | | | | | | | | | | | |
Investments | | | (2,230,518 | ) | | | 29,026,244 | | | | (11,706 | ) | | | 676,406 | |
Purchased options | | | — | | | | 11,102,837 | | | | (10,112 | ) | | | (61,950 | ) |
Foreign currency translations | | | — | | | | (560,522 | ) | | | — | | | | (266,670 | ) |
Written options | | | — | | | | 39,180,596 | | | | 43,439 | | | | (46,699 | ) |
Short positions | | | — | | | | (10,938,205 | ) | | | — | | | | (592,805 | ) |
NET GAIN (LOSS) | | | (3,889,596 | ) | | | 31,272,999 | | | | 36,511 | | | | 1,805,619 | |
NET INCREASE (DECREASE) IN NET ASSETS RESULTING FROM OPERATIONS | | $ | (364,708 | ) | | $ | 64,128,063 | | | $ | 62,244 | | | $ | 1,140,712 | |
| (a) | Hedged Equity Income Fund commenced operations December 31, 2014. |
| | | | |
| 144 | | CALAMOS OPEN-END FAMILY OF FUNDS SEMIANNUAL REPORT | | See accompanying Notes to Financial Statements |
Statements of Changes in Net Assets
| | | | | | | | | | | | | | | | | | | | | | | | |
| | | GROWTH FUND | | | OPPORTUNISTIC VALUE FUND | | | FOCUS GROWTH FUND | |
| | | (UNAUDITED) SIX MONTHS ENDED APRIL 30, 2015 | | | YEAR ENDED OCTOBER 31, 2014 | | | (UNAUDITED) SIX MONTHS ENDED APRIL 30,
2015 | | | YEAR ENDED OCTOBER 31, 2014 | | | (UNAUDITED) SIX MONTHS ENDED APRIL 30, 2015 | | | YEAR ENDED OCTOBER 31, 2014 | |
OPERATIONS | | | | | | | | | | | | | | | | | | | | | | | | |
Net investment income (loss) | | $ | (5,189,538 | ) | | $ | (22,580,354 | ) | | $ | 576,869 | | | $ | 1,286,323 | | | $ | 24,235 | | | $ | (213,187 | ) |
Net realized gain (loss) | | | 424,615,054 | | | | 737,769,087 | | | | 6,209,870 | | | | 7,981,689 | | | | 8,222,247 | | | | 10,204,758 | |
Change in unrealized appreciation/(depreciation) | | | (218,933,481 | ) | | | (210,834,316 | ) | | | (7,109,266 | ) | | | (1,359,198 | ) | | | (5,029,711 | ) | | | (2,530,005 | ) |
Net increase (decrease) in net assets resulting from operations | | | 200,492,035 | | | | 504,354,417 | | | | (322,527 | ) | | | 7,908,814 | | | | 3,216,771 | | | | 7,461,566 | |
| | | | | | |
DISTRIBUTIONS TO SHAREHOLDERS | | | | | | | | | | | | | | | | | | | | | | | | |
Net investment income | | | | | | | | | | | | | | | | | | | | | | | | |
Class A | | | — | | | | — | | | | (502,337 | ) | | | (694,484 | ) | | | — | | | | (29,408 | ) |
Class B | | | — | | | | — | | | | — | | | | (1,818 | ) | | | — | | | | — | |
Class C | | | — | | | | — | | | | (17,709 | ) | | | (65,180 | ) | | | — | | | | — | |
Class I | | | — | | | | — | | | | (360,195 | ) | | | (250,952 | ) | | | — | | | | (92,898 | ) |
Class R | | | — | | | | — | | | | (1,193 | ) | | | (929 | ) | | | — | | | | — | |
Net realized gains | | | | | | | | | | | | | | | | | | | | | | | | |
Class A | | | (334,486,283 | ) | | | (558,239,074 | ) | | | (3,570,562 | ) | | | (5,427,315 | ) | | | (1,885,461 | ) | | | — | |
Class B | | | (6,995,647 | ) | | | (20,551,728 | ) | | | (22,490 | ) | | | (79,512 | ) | | | (44,044 | ) | | | — | |
Class C | | | (223,372,174 | ) | | | (313,752,235 | ) | | | (636,667 | ) | | | (748,482 | ) | | | (1,433,556 | ) | | | — | |
Class I | | | (134,935,100 | ) | | | (229,597,726 | ) | | | (1,911,869 | ) | | | (1,585,880 | ) | | | (2,877,179 | ) | | | — | |
Class R | | | (2,037,555 | ) | | | (2,670,144 | ) | | | (10,016 | ) | | | (9,466 | ) | | | (20,197 | ) | | | — | |
Return of capital | | | | | | | | | | | | | | | | | | | | | | | | |
Class A | | | — | | | | — | | | | — | | | | — | | | | — | | | | — | |
Class I | | | — | | | | — | | | | — | | | | — | | | | — | | | | — | |
Total distributions | | | (701,826,759 | ) | | | (1,124,810,907 | ) | | | (7,033,038 | ) | | | (8,864,018 | ) | | | (6,260,437 | ) | | | (122,306 | ) |
| | | | | | |
CAPITAL SHARE TRANSACTIONS | | | 178,806,161 | | | | (336,219,913 | ) | | | (19,056,293 | ) | | | (7,595,737 | ) | | | 4,074,091 | | | | (8,868,607 | ) |
TOTAL INCREASE (DECREASE) IN NET ASSETS | | | (322,528,563 | ) | | | (956,676,403 | ) | | | (26,411,858 | ) | | | (8,550,941 | ) | | | 1,030,425 | | | | (1,529,347 | ) |
| | | | | | |
NET ASSETS | | | | | | | | | | | | | | | | | | | | | | | | |
Beginning of period | | $ | 3,484,476,428 | | | $ | 4,441,152,831 | | | $ | 101,021,429 | | | $ | 109,572,370 | | | $ | 64,627,071 | | | $ | 66,156,418 | |
End of period | | | 3,161,947,865 | | | | 3,484,476,428 | | | | 74,609,571 | | | | 101,021,429 | | | | 65,657,496 | | | | 64,627,071 | |
Undistributed net investment income (loss) | | $ | (2,257,734 | ) | | $ | 2,931,804 | | | $ | 463,336 | | | $ | 767,901 | | | $ | 77,766 | | | $ | 53,531 | |
| | | | | | |
| See accompanying Notes to Financial Statements | | www.calamos.com | | | 145 | |
Statements of Changes in Net Assets
| | | | | | | | | | | | | | | | | | | | | | | | |
| | | DISCOVERY GROWTH FUND | | | DIVIDEND GROWTH FUND | | | MID CAP GROWTH FUND | |
| | | (UNAUDITED)
SIX MONTHS
ENDED
APRIL 30, 2015 | | | YEAR ENDED
OCTOBER 31,
2014 | | | (UNAUDITED)
SIX MONTHS
ENDED
APRIL 30, 2015 | | | YEAR ENDED
OCTOBER 31,
2014 | | | (UNAUDITED)
SIX MONTHS
ENDED
APRIL 30, 2015 | | | YEAR ENDED
OCTOBER 31,
2014 | |
OPERATIONS | | | | | | | | | | | | | | | | | | | | | | | | |
Net investment income (loss) | | $ | (251,992 | ) | | $ | (519,564 | ) | | $ | 375,371 | | | $ | 1,368,926 | | | $ | (43,518 | ) | | $ | (218,150 | ) |
Net realized gain (loss) | | | 1,438,143 | | | | 6,704,516 | | | | 563,272 | | | | 372,679 | | | | 1,695,814 | | | | (304,230 | ) |
Change in unrealized appreciation/(depreciation) | | | 1,426,855 | | | | (740,542 | ) | | | (741,035 | ) | | | 462,096 | | | | 560,393 | | | | 2,351,400 | |
Net increase (decrease) in net assets resulting from operations | | | 2,613,006 | | | | 5,444,410 | | | | 197,608 | | | | 2,203,701 | | | | 2,212,689 | | | | 1,829,020 | |
| | | | | | |
DISTRIBUTIONS TO SHAREHOLDERS | | | | | | | | | | | | | | | | | | | | | | | | |
Net investment income | | | | | | | | | | | | | | | | | | | | | | | | |
Class A | | | — | | | | — | | | | (362,247 | ) | | | (476,475 | ) | | | — | | | | (4,021 | ) |
Class B | | | — | | | | — | | | | — | | | | — | | | | — | | | | — | |
Class C | | | — | | | | — | | | | (4,913 | ) | | | (3,693 | ) | | | — | | | | — | |
Class I | | | — | | | | — | | | | (114,838 | ) | | | (155,141 | ) | | | — | | | | (4,014 | ) |
Class R | | | — | | | | — | | | | (1,440 | ) | | | (1,592 | ) | | | — | | | | — | |
Net realized gains | | | | | | | | | | | | | | | | | | | | | | | | |
Class A | | | (2,749,737 | ) | | | (4,234,941 | ) | | | (319,688 | ) | | | (64,701 | ) | | | — | | | | (1,526 | ) |
Class B | | | (162,339 | ) | | | (232,562 | ) | | | — | | | | — | | | | — | | | | — | |
Class C | | | (244,677 | ) | | | (375,617 | ) | | | (4,968 | ) | | | (729 | ) | | | — | | | | (12 | ) |
Class I | | | (970,172 | ) | | | (1,398,357 | ) | | | (96,682 | ) | | | (19,232 | ) | | | — | | | | (574 | ) |
Class R | | | (171,966 | ) | | | (251,178 | ) | | | (1,326 | ) | | | (258 | ) | | | — | | | | (8 | ) |
Return of capital | | | | | | | | | | | | | | | | | | | | | | | | |
Class A | | | — | | | | — | | | | — | | | | — | | | | — | | | | (11 | ) |
Class I | | | — | | | | — | | | | — | | | | — | | | | — | | | | (11 | ) |
Total distributions | | | (4,298,891 | ) | | | (6,492,655 | ) | | | (906,102 | ) | | | (721,821 | ) | | | — | | | | (10,177 | ) |
| | | | | | |
CAPITAL SHARE TRANSACTIONS | | | 2,632,964 | | | | 863,360 | | | | (3,634,420 | ) | | | 1,565,128 | | | | (9,565,554 | ) | | | 25,159,893 | |
TOTAL INCREASE (DECREASE) IN NET ASSETS | | | 947,079 | | | | (184,885 | ) | | | (4,342,914 | ) | | | 3,047,008 | | | | (7,352,865 | ) | | | 26,978,736 | |
| | | | | | |
NET ASSETS | | | | | | | | | | | | | | | | | | | | | | | | |
Beginning of period | | $ | 47,574,609 | | | $ | 47,759,494 | | | $ | 36,911,827 | | | $ | 33,864,819 | | | $ | 47,538,433 | | | $ | 20,559,697 | |
End of period | | | 48,521,688 | | | | 47,574,609 | | | | 32,568,913 | | | | 36,911,827 | | | | 40,185,568 | | | | 47,538,433 | |
Undistributed net investment income (loss) | | $ | (324,060 | ) | | $ | (72,068 | ) | | $ | 568,401 | | | $ | 676,468 | | | $ | (12,375 | ) | | $ | 31,143 | |
| | | | |
| 146 | | CALAMOS OPEN-END FAMILY OF FUNDS SEMIANNUAL REPORT | | See accompanying Notes to Financial Statements |
Statements of Changes in Net Assets
| | | | | | | | | | | | | | | | | | | | | | | | |
| | | INTERNATIONAL GROWTH FUND | | | EVOLVING WORLD GROWTH FUND | | | EMERGING MARKET EQUITY FUND | |
| | | (UNAUDITED)
SIX MONTHS
ENDED
APRIL 30, 2015 | | | YEAR ENDED
OCTOBER 31,
2014 | | | (UNAUDITED)
SIX MONTHS
ENDED
APRIL 30, 2015 | | | YEAR ENDED
OCTOBER 31,
2014 | | | (UNAUDITED)
SIX MONTHS
ENDED
APRIL 30, 2015 | | | PERIOD ENDED
OCTOBER 31,
2014* | |
OPERATIONS | | | | | | | | | | | | | | | | | | | | | | | | |
Net investment income (loss) | | $ | 1,264,429 | | | $ | 4,163,624 | | | $ | (203,334 | ) | | $ | 3,139,061 | | | $ | (40,944 | ) | | $ | 41,684 | |
Net realized gain (loss) | | | 17,305,342 | | | | 95,194,298 | | | | (4,382,756 | ) | | | 12,761,694 | | | | (578,406 | ) | | | (304,414 | ) |
Change in unrealized appreciation/(depreciation) | | | 24,099,941 | | | | (90,456,725 | ) | | | 23,597,521 | | | | (23,918,187 | ) | | | 1,074,734 | | | | 8,222 | |
Net increase (decrease) in net assets resulting from operations | | | 42,669,712 | | | | 8,901,197 | | | | 19,011,431 | | | | (8,017,432 | ) | | | 455,384 | | | | (254,508 | ) |
DISTRIBUTIONS TO SHAREHOLDERS | | | | | | | | | | | | | | | | | | | | | | | | |
Net investment income | | | | | | | | | | | | | | | | | | | | | | | | |
Class A | | | — | | | | (1,474,327 | ) | | | (307,138 | ) | | | (102,330 | ) | | | (41,567 | ) | | | — | |
Class B | | | — | | | | — | | | | — | | | | — | | | | — | | | | — | |
Class C | | | — | | | | — | | | | — | | | | — | | | | — | | | | — | |
Class I | | | — | | | | (3,174,460 | ) | | | (2,034,410 | ) | | | (923,825 | ) | | | (61,523 | ) | | | — | |
Class R | | | — | | | | (40,645 | ) | | | — | | | | — | | | | (156 | ) | | | — | |
Net realized gains | | | | | | | | | | | | | | | | | | | | | | | | |
Class A | | | (26,448,259 | ) | | | — | | | | (3,433,350 | ) | | | (1,437,516 | ) | | | — | | | | — | |
Class B | | | (242,569 | ) | | | — | | | | (13,442 | ) | | | (14,719 | ) | | | — | | | | — | |
Class C | | | (6,563,935 | ) | | | — | | | | (1,003,187 | ) | | | (311,938 | ) | | | — | | | | — | |
Class I | | | (43,201,700 | ) | | | — | | | | (8,919,021 | ) | | | (2,656,170 | ) | | | — | | | | — | |
Class R | | | (1,648,974 | ) | | | — | | | | (32,328 | ) | | | (15,858 | ) | | | — | | | | — | |
Return of capital | | | | | | | | | | | | | | | | | | | | | | | | |
Class A | | | — | | | | — | | | | — | | | | — | | | | — | | | | — | |
Class I | | | — | | | | — | | | | — | | | | — | | | | — | | | | — | |
Total distributions | | | (78,105,437 | ) | | | (4,689,432 | ) | | | (15,742,876 | ) | | | (5,462,356 | ) | | | (103,246 | ) | | | — | |
| | | | | | |
CAPITAL SHARE TRANSACTIONS | | | (18,241,971 | ) | | | (183,336,549 | ) | | | (42,252,625 | ) | | | 151,229,636 | | | | 2,856,483 | | | | 15,701,737 | |
TOTAL INCREASE (DECREASE) IN NET ASSETS | | | (53,677,696 | ) | | | (179,124,784 | ) | | | (38,984,070 | ) | | | 137,749,848 | | | | 3,208,621 | | | | 15,447,229 | |
| | | | | | |
NET ASSETS | | | | | | | | | | | | | | | | | | | | | | | | |
Beginning of period | | $ | 741,593,280 | | | $ | 920,718,064 | | | $ | 651,563,322 | | | $ | 513,813,474 | | | $ | 15,447,229 | | | $ | — | |
End of period | | | 687,915,584 | | | | 741,593,280 | | | | 612,579,252 | | | | 651,563,322 | | | | 18,655,850 | | | | 15,447,229 | |
Undistributed net investment income (loss) | | $ | 1,135,233 | | | $ | (129,196 | ) | | $ | (1,869,382 | ) | | $ | 675,500 | | | $ | (59,292 | ) | | $ | 84,898 | |
| * | Emerging Market Equity commenced operations on December 31, 2013. |
| | | | | | |
| See accompanying Notes to Financial Statements | | www.calamos.com | | | 147 | |
Statements of Changes in Net Assets
| | | | | | | | | | | | | | | | | | | | | | | | |
| | | GLOBAL EQUITY FUND | | | GROWTH AND INCOME FUND | | | GLOBAL GROWTH AND INCOME FUND | |
| | | (UNAUDITED) SIX MONTHS ENDED APRIL 30, 2015 | | | YEAR ENDED OCTOBER 31, 2014 | | | (UNAUDITED) SIX MONTHS ENDED APRIL 30, 2015 | | | YEAR ENDED OCTOBER 31, 2014 | | | (UNAUDITED) SIX MONTHS ENDED APRIL 30, 2015 | | | YEAR ENDED OCTOBER 31, 2014 | |
OPERATIONS | | | | | | | | | | | | | | | | | | | | | | | | |
Net investment income (loss) | | $ | (53,050 | ) | | $ | (246,342 | ) | | $ | 23,158,380 | | | $ | 50,472,535 | | | $ | 2,244,373 | | | $ | 4,959,034 | |
Net realized gain (loss) | | | 7,864,466 | | | | 59,594,689 | | | | 102,502,588 | | | | 330,742,423 | | | | 12,695,529 | | | | 82,182,781 | |
Change in unrealized appreciation/(depreciation) | | | 6,159,426 | | | | (38,674,942 | ) | | | (67,582,386 | ) | | | (72,957,107 | ) | | | 3,780,629 | | | | (59,103,330 | ) |
Net increase (decrease) in net assets resulting from operations | | | 13,970,842 | | | | 20,673,405 | | | | 58,078,582 | | | | 308,257,851 | | | | 18,720,531 | | | | 28,038,485 | |
| | | | | | |
DISTRIBUTIONS TO SHAREHOLDERS | | | | | | | | | | | | | | | | | | | | | | | | |
Net investment income | | | | | | | | | | | | | | | | | | | | | | | | |
Class A | | | — | | | | (849,768 | ) | | | (9,389,170 | ) | | | (34,093,049 | ) | | | (549,399 | ) | | | (4,854,837 | ) |
Class B | | | — | | | | — | | | | (30,709 | ) | | | (560,141 | ) | | | — | | | | (125,709 | ) |
Class C | | | — | | | | — | | | | (3,640,468 | ) | | | (10,751,288 | ) | | | — | | | | (2,971,428 | ) |
Class I | | | — | | | | (1,047,636 | ) | | | (5,913,372 | ) | | | (17,953,025 | ) | | | (1,008,993 | ) | | | (6,086,968 | ) |
Class R | | | — | | | | (44,278 | ) | | | (116,247 | ) | | | (387,064 | ) | | | (3,985 | ) | | | (34,861 | ) |
Net realized gains | | | | | | | | | | | | | | | | | | | | | | | | |
Class A | | | (16,689,799 | ) | | | (2,386,305 | ) | | | (136,678,722 | ) | | | (138,834,231 | ) | | | (23,384,613 | ) | | | (29,539,610 | ) |
Class B | | | (228,886 | ) | | | (51,337 | ) | | | (1,585,363 | ) | | | (3,497,795 | ) | | | (715,924 | ) | | | (1,441,922 | ) |
Class C | | | (5,599,563 | ) | | | (613,953 | ) | | | (105,660,707 | ) | | | (95,532,118 | ) | | | (26,044,532 | ) | | | (28,499,801 | ) |
Class I | | | (18,756,109 | ) | | | (2,063,076 | ) | | | (73,482,783 | ) | | | (58,434,064 | ) | | | (27,529,458 | ) | | | (33,164,954 | ) |
Class R | | | (1,686,163 | ) | | | (168,513 | ) | | | (1,953,757 | ) | | | (1,980,893 | ) | | | (278,726 | ) | | | (244,791 | ) |
Return of capital | | | | | | | | | | | | | | | | | | | | | | | | |
Class A | | | — | | | | — | | | | — | | | | — | | | | — | | | | — | |
Class I | | | — | | | | — | | | | — | | | | — | | | | — | | | | — | |
Total distributions | | | (42,960,520 | ) | | | (7,224,866 | ) | | | (338,451,298 | ) | | | (362,023,668 | ) | | | (79,515,630 | ) | | | (106,964,881 | ) |
| | | | | | |
CAPITAL SHARE TRANSACTIONS | | | 11,185,576 | | | | (195,729,870 | ) | | | 17,283,141 | | | | (341,313,573 | ) | | | (4,442,456 | ) | | | (76,063,619 | ) |
TOTAL INCREASE (DECREASE) IN NET ASSETS | | | (17,804,102 | ) | | | (182,281,331 | ) | | | (263,089,575 | ) | | | (395,079,390 | ) | | | (65,237,555 | ) | | | (154,990,015 | ) |
| | | | | | |
NET ASSETS | | | | | | | | | | | | | | | | | | | | | | | | |
Beginning of period | | $ | 227,794,868 | | | $ | 410,076,199 | | | $ | 3,052,304,221 | | | $ | 3,447,383,611 | | | $ | 486,265,013 | | | $ | 641,255,028 | |
End of period | | | 209,990,766 | | | | 227,794,868 | | | | 2,789,214,646 | | | | 3,052,304,221 | | | | 421,027,458 | | | | 486,265,013 | |
Undistributed net investment income (loss) | | $ | 166,876 | | | $ | 219,926 | | | $ | (6,741,980 | ) | | $ | (10,810,394 | ) | | $ | 1,115,598 | | | $ | 433,602 | |
| | | | |
| 148 | | CALAMOS OPEN-END FAMILY OF FUNDS SEMIANNUAL REPORT | | See accompanying Notes to Financial Statements |
Statements of Changes in Net Assets
| | | | | | | | | | | | | | | | | | | | |
| | | CONVERTIBLE FUND | | | GLOBAL CONVERTIBLE FUND | | | TOTAL RETURN BOND FUND | |
| | | (UNAUDITED)
SIX MONTHS
ENDED
APRIL 30, 2015 | | | YEAR ENDED
OCTOBER 31,
2014 | | | (UNAUDITED)
PERIOD ENDED
APRIL 30, 20151 | | | (UNAUDITED)
SIX MONTHS
ENDED
APRIL 30, 2015 | | | YEAR ENDED
OCTOBER 31, 2014 | |
OPERATIONS | | | | | | | | | | | | | | | | | | | | |
Net investment income (loss) | | $ | 15,168,817 | | | $ | 27,815,452 | | | $ | 49,020 | | | $ | 1,061,648 | | | $ | 2,963,974 | |
Net realized gain (loss) | | | 80,202,801 | | | | 77,664,106 | | | | 89,458 | | | | 1,267,352 | | | | 2,266,974 | |
Change in unrealized appreciation/(depreciation) | | | (76,163,093 | ) | | | (568,367 | ) | | | 87,499 | | | | (617,599 | ) | | | (761,956 | ) |
Net increase (decrease) in net assets resulting from operations | | | 19,208,525 | | | | 104,911,191 | | | | 225,977 | | | | 1,711,401 | | | | 4,468,992 | |
| | | | | |
DISTRIBUTIONS TO SHAREHOLDERS | | | | | | | | | | | | | | | | | | | | |
Net investment income | | | | | | | | | | | | | | | | | | | | |
Class A | | | (6,053,798 | ) | | | (20,564,576 | ) | | | — | | | | (798,744 | ) | | | (3,992,366 | ) |
Class B | | | (53,466 | ) | | | (178,661 | ) | | | — | | | | (17,577 | ) | | | (178,947 | ) |
Class C | | | (2,829,961 | ) | | | (8,351,790 | ) | | | — | | | | (192,617 | ) | | | (954,511 | ) |
Class I | | | (7,974,679 | ) | | | (19,867,745 | ) | | | — | | | | (210,955 | ) | | | (1,623,053 | ) |
Class R | | | (26,470 | ) | | | (100,499 | ) | | | — | | | | (3,035 | ) | | | (51,821 | ) |
Net realized gains | | | | | | | | | | | | | | | | | | | | |
Class A | | | (22,983,932 | ) | | | (34,701,406 | ) | | | — | | | | (670,900 | ) | | | (339,398 | ) |
Class B | | | (361,425 | ) | | | (629,103 | ) | | | — | | | | (19,196 | ) | | | (19,414 | ) |
Class C | | | (15,095,422 | ) | | | (22,464,315 | ) | | | — | | | | (203,184 | ) | | | (97,491 | ) |
Class I | | | (27,856,761 | ) | | | (26,235,143 | ) | | | — | | | | (144,935 | ) | | | (165,178 | ) |
Class R | | | (115,733 | ) | | | (184,985 | ) | | | — | | | | (2,543 | ) | | | (6,611 | ) |
Return of capital | | | | | | | | | | | | | | | | | | | | |
Class A | | | — | | | | — | | | | — | | | | — | | | | — | |
Class I | | | — | | | | — | | | | — | | | | — | | | | — | |
Total distributions | | | (83,351,647 | ) | | | (133,278,223 | ) | | | — | | | | (2,263,686 | ) | | | (7,428,790 | ) |
| | | | | |
CAPITAL SHARE TRANSACTIONS | | | (54,234,638 | ) | | | 198,930,703 | | | | 15,273,731 | | | | (23,168,367 | ) | | | (64,806,114 | ) |
TOTAL INCREASE (DECREASE) IN NET ASSETS | | | (118,377,760 | ) | | | 170,563,671 | | | | 15,499,708 | | | | (23,720,652 | ) | | | (67,765,912 | ) |
| | | | | |
NET ASSETS | | | | | | | | | | | | | | | | | | | | |
Beginning of period | | $ | 1,374,956,765 | | | $ | 1,204,393,094 | | | $ | — | | | $ | 100,564,534 | | | $ | 168,330,446 | |
End of period | | | 1,256,579,005 | | | | 1,374,956,765 | | | | 15,499,708 | | | | 76,843,882 | | | | 100,564,534 | |
Undistributed net investment income (loss) | | $ | (7,658,183 | ) | | $ | (5,888,626 | ) | | $ | 49,020 | | | $ | (267,021 | ) | | $ | (105,741 | ) |
| 1 | Global Convertible Fund commenced operations on December 31, 2014. |
| | | | | | |
| See accompanying Notes to Financial Statements | | www.calamos.com | | | 149 | |
Statements of Changes in Net Assets
| | | | | | | | | | | | | | | | | | | | |
| | | HIGH INCOME FUND | | | MARKET NEUTRAL INCOME FUND | | | HEDGED EQUITY INCOME FUND | |
| | | (UNAUDITED) SIX MONTHS ENDED APRIL 30, 2015 | | | YEAR ENDED OCTOBER 31, 2014 | | | (UNAUDITED) SIX MONTHS ENDED APRIL 30, 2015 | | | YEAR ENDED OCTOBER 31, 2014 | | | (UNAUDITED) PERIOD ENDED APRIL 30, 20152 | |
OPERATIONS | | | | | | | | | | | | | | | | | | | | |
Net investment income (loss) | | $ | 3,524,888 | | | $ | 11,488,380 | | | $ | 32,855,064 | | | $ | 47,166,282 | | | $ | 25,733 | |
Net realized gain (loss) | | | (1,659,078 | ) | | | 8,261,670 | | | | (36,537,951 | ) | | | 55,651,180 | | | | 14,890 | |
Change in unrealized appreciation/(depreciation) | | | (2,230,518 | ) | | | (7,253,066 | ) | | | 67,810,950 | | | | 16,433,656 | | | | 21,621 | |
Net increase (decrease) in net assets resulting from operations | | | (364,708 | ) | | | 12,496,984 | | | | 64,128,063 | | | | 119,251,118 | | | | 62,244 | |
| | | | | |
DISTRIBUTIONS TO SHAREHOLDERS | | | | | | | | | | | | | | | | | | | | |
Net investment income | | | | | | | | | | | | | | | | | | | | |
Class A | | | (2,623,112 | ) | | | (10,016,160 | ) | | | (6,634,151 | ) | | | (13,925,582 | ) | | | — | |
Class B | | | (36,423 | ) | | | (121,002 | ) | | | (2,151 | ) | | | (12,236 | ) | | | — | |
Class C | | | (603,900 | ) | | | (1,481,953 | ) | | | (604,312 | ) | | | (884,774 | ) | | | — | |
Class I | | | (686,354 | ) | | | (1,489,891 | ) | | | (17,801,619 | ) | | | (23,624,478 | ) | | | — | |
Class R | | | (4,751 | ) | | | (10,433 | ) | | | (33,952 | ) | | | (45,966 | ) | | | — | |
Net realized gains | | | | | | | | | | | | | | | | | | | | |
Class A | | | (2,495,790 | ) | | | (3,754,356 | ) | | | (12,913,256 | ) | | | (27,945,831 | ) | | | — | |
Class B | | | (45,543 | ) | | | (59,311 | ) | | | (39,864 | ) | | | (154,437 | ) | | | — | |
Class C | | | (687,431 | ) | | | (619,759 | ) | | | (3,594,843 | ) | | | (5,789,060 | ) | | | — | |
Class I | | | (615,285 | ) | | | (470,722 | ) | | | (27,320,322 | ) | | | (32,685,336 | ) | | | — | |
Class R | | | (4,908 | ) | | | (3,752 | ) | | | (86,045 | ) | | | (106,077 | ) | | | — | |
Return of capital | | | | | | | | | | | | | | | | | | | | |
Class A | | | — | | | | — | | | | — | | | | — | | | | — | |
Class I | | | — | | | | — | | | | — | | | | — | | | | — | |
Total distributions | | | (7,803,497 | ) | | | (18,027,339 | ) | | | (69,030,515 | ) | | | (105,173,777 | ) | | | — | |
| | | | | |
CAPITAL SHARE TRANSACTIONS | | | (34,086,753 | ) | | | (70,303,582 | ) | | | (244,130,514 | ) | | | 939,297,704 | | | | 11,103,384 | |
TOTAL INCREASE (DECREASE) IN NET ASSETS | | | (42,254,958 | ) | | | (75,833,937 | ) | | | (249,032,966 | ) | | | 953,375,045 | | | | 11,165,628 | |
| | | | | |
NET ASSETS | | | | | | | | | | | | | | | | | | | | |
Beginning of period | | $ | 188,737,434 | | | $ | 264,571,371 | | | $ | 4,185,796,384 | | | $ | 3,232,421,339 | | | $ | — | |
End of period | | | 146,482,476 | | | | 188,737,434 | | | | 3,936,763,418 | | | | 4,185,796,384 | | | | 11,165,628 | |
Undistributed net investment income (loss) | | $ | (285,896 | ) | | $ | 143,756 | | | $ | 9,428,785 | | | $ | 1,649,906 | | | $ | 25,733 | |
| 2 | Hedged Equity Income Fund commenced operations December 31, 2014. |
| | | | |
| 150 | | CALAMOS OPEN-END FAMILY OF FUNDS SEMIANNUAL REPORT | | See accompanying Notes to Financial Statements |
Statements of Changes in Net Assets
| | | | | | | | |
| | | LONG/SHORT FUND | |
| | | (UNAUDITED)
SIX MONTHS
ENDED
APRIL 30, 2015 | | | YEAR ENDED
OCTOBER 31,
2014 | |
OPERATIONS | | | | | | | | |
| Net investment income (loss) | | $ | (664,907 | ) | | $ | (677,764 | ) |
| Net realized gain (loss) | | | 2,097,337 | | | | 2,296,374 | |
Change in unrealized appreciation/(depreciation) | | | (291,718 | ) | | | 2,569,782 | |
Net increase (decrease) in net assets resulting from operations | | | 1,140,712 | | | | 4,188,392 | |
| | |
DISTRIBUTIONS TO SHAREHOLDERS | | | | | | | | |
Net investment income | | | | | | | | |
Class A | | | — | | | | (193,717 | ) |
Class B | | | — | | | | — | |
Class C | | | — | | | | (7,374 | ) |
Class I | | | — | | | | (248,363 | ) |
Class R | | | — | | | | (590 | ) |
Net realized gains | | | | | | | | |
Class A | | | (470,012 | ) | | | (49,216 | ) |
Class B | | | — | | | | — | |
Class C | | | (77,702 | ) | | | (2,181 | ) |
Class I | | | (935,646 | ) | | | (104,959 | ) |
Class R | | | (1,308 | ) | | | (294 | ) |
Return of capital | | | | | | | | |
Class A | | | — | | | | — | |
Class I | | | — | | | | — | |
Total distributions | | | (1,484,668 | ) | | | (606,694 | ) |
| | |
CAPITAL SHARE TRANSACTIONS | | | (27,699,294 | ) | | | 80,215,423 | |
TOTAL INCREASE (DECREASE) IN NET ASSETS | | | (28,043,250 | ) | | | 83,797,121 | |
| | |
NET ASSETS | | | | | | | | |
Beginning of period | | $ | 129,973,897 | | | $ | 46,176,776 | |
End of period | | | 101,930,647 | | | | 129,973,897 | |
Undistributed net investment income (loss) | | $ | (571,827 | ) | | $ | 93,080 | |
| | | | | | |
| See accompanying Notes to Financial Statements | | www.calamos.com | | | 151 | |
Notes to Financial Statements (Unaudited)
Note 1 – Organization and Significant Accounting Policies
Organization. CALAMOS INVESTMENT TRUST, a Massachusetts business trust organized December 21, 1987 (the “Trust”), consists of nineteen series, Growth Fund, Opportunistic Value Fund, Focus Growth Fund, Discovery Growth Fund, Dividend Growth Fund, Mid Cap Growth Fund, International Growth Fund, Evolving World Growth Fund, Emerging Market Equity Fund, Global Equity Fund, Growth and Income Fund, Global Growth and Income Fund, Convertible Fund, Global Convertible Fund (commenced operations on December 31, 2014), Total Return Bond Fund, High Income Fund, Market Neutral Income Fund, Hedged Equity Income Fund (commenced operations on December 31, 2014) and Long/Short Fund (each a “Fund” and collectively the “Funds”). The Trust is registered under the Investment Company Act of 1940 as amended (the “1940 Act”) as an open-end management investment company. The Trust currently offers Class A, Class C, Class I and Class R shares of each of the Funds. Class B shares continue to be outstanding, but are no longer an offered class of shares.
Fund Valuation. The valuation of the Funds’ investments is in accordance with policies and procedures adopted by and under the ultimate supervision of the board of trustees.
Fund securities that are traded on U.S. securities exchanges, except option securities, are valued at the official closing price, which is the last current reported sales price on its principal exchange at the time each Fund determines its net asset value (“NAV”). Securities traded in the over-the-counter market and quoted on The NASDAQ Stock Market are valued at the NASDAQ Official Closing Price, as determined by NASDAQ, or lacking a NASDAQ Official Closing Price, the last current reported sale price on NASDAQ at the time a Fund determines its NAV. When a last sale or closing price is not available, equity securities, other than option securities, that are traded on a U.S. securities exchange and other equity securities traded in the over-the-counter market are valued at the mean between the most recent bid and asked quotations on its principal exchange in accordance with guidelines adopted by the board of trustees. Each option security traded on a U.S. securities exchange is valued at the mid-point of the consolidated bid/ask quote for the option security, also in accordance with guidelines adopted by the board of trustees. Each over-the-counter option that is not traded through the Options Clearing Corporation is valued based on a quotation provided by the counterparty to such option under the ultimate supervision of the board of trustees.
Fixed income securities, certain convertible preferred securities, and non-exchange traded derivatives are normally valued by independent pricing services or by dealers or brokers who make markets in such securities. Valuations of such fixed income securities, certain convertible preferred securities and non-exchange traded derivatives consider yield or price of equivalent securities of comparable quality, coupon rate, maturity, type of issue, trading characteristics and other market data and do not rely exclusively upon exchange or over-the-counter prices.
Trading on European and Far Eastern exchanges and over-the-counter markets is typically completed at various times before the close of business on each day on which the New York Stock Exchange (“NYSE”) is open. Each security trading on these exchanges or in over-the-counter markets may be valued utilizing a systematic fair valuation model provided by an independent pricing service approved by the board of trustees. The valuation of each security that meets certain criteria in relation to the valuation model is systematically adjusted to reflect the impact of movement in the U.S. market after the foreign markets close. Securities that do not meet the criteria, or that are principally traded in other foreign markets, are valued as of the last reported sale price at the time the respective Fund determines its NAV, or when reliable market prices or quotations are not readily available, at the mean between the most recent bid and asked quotations as of the close of the appropriate exchange or other designated time. Trading of foreign securities may not take place on every NYSE business day. In addition, trading may take place in various foreign markets on Saturdays or on other days when the NYSE is not open and on which the respective Fund’s NAV is not calculated.
If the pricing committee determines that the valuation of a security in accordance with the methods described above is not reflective of a fair value for such security, the security is valued at a fair value by the pricing committee, under the ultimate supervision of the board of trustees, following the guidelines and/or procedures adopted by the board of trustees.
Each Fund also may use fair value pricing, pursuant to guidelines adopted by the board of trustees and under the ultimate supervision of the board of trustees, if trading in the security is halted or if the value of a security it holds is materially affected by events occurring before the Fund’s pricing time but after the close of the primary market or exchange on which the security is listed. Those procedures may utilize valuations furnished by pricing services approved by the board of trustees, which may be based on market
| | | | |
| 152 | | CALAMOS OPEN-END FAMILY OF FUNDS SEMIANNUAL REPORT | | |
Notes to Financial Statements (Unaudited)
transactions for comparable securities and various relationships between securities that are generally recognized by institutional traders, a computerized matrix system, or appraisals derived from information concerning the securities or similar securities received from recognized dealers in those securities.
When fair value pricing of securities is employed, the prices of securities used by the Fund to calculate its NAV may differ from market quotations or official closing prices. In light of the judgment involved in fair valuations, there can be no assurance that a fair value assigned to a particular security is accurate.
Investment Transactions. Investment transactions are recorded on a trade date basis as of April 30, 2015. Net realized gains and losses from investment transactions are reported on an identified cost basis. Interest income is recognized using the accrual method and includes accretion of original issue and market discount and amortization of premium. Dividend income is recognized on the ex-dividend date, except that certain dividends from foreign securities are recorded as soon as the information becomes available after the ex-dividend date.
Foreign Currency Translation. Values of investments and other assets and liabilities denominated in foreign currencies are translated into U.S. dollars using a rate quoted by a major bank or dealer in the particular currency market, as reported by a recognized quotation dissemination service.
The Funds do not isolate that portion of the results of operations resulting from changes in foreign exchange rates on investments from the fluctuations arising from changes in market prices of securities held. Such fluctuations are included with the net realized and unrealized gain or loss from investments.
Reported net realized foreign currency gains or losses arise from disposition of foreign currency, the difference in the foreign exchange rates between the trade and settlement dates on securities transactions, and the difference between the amounts of dividends, interest and foreign withholding taxes recorded on the ex-date or accrual date and the U.S. dollar equivalent of the amounts actually received or paid. Net unrealized foreign exchange gains and losses arise from changes (due to the changes in the exchange rate) in the value of foreign currency and other assets and liabilities denominated in foreign currencies held at period end.
Allocation of Expenses Among Funds and Classes. Expenses directly attributable to a Fund are charged to that Fund; certain other common expenses of the Trust, Calamos Advisors Trust, Calamos ETF Trust, Calamos Convertible Opportunities and Income Fund, Calamos Convertible and High Income Fund, Calamos Strategic Total Return Fund, Calamos Global Total Return Fund, Calamos Global Dynamic Income Fund and Calamos Dynamic Convertible and Income Fund are allocated proportionately among each Fund to which the expenses relate in relation to the net assets of each Fund or on another reasonable basis. Expenses directly attributable to a particular class of a Fund in the Trust are charged directly to such class. In calculating the net asset value per share of each class, investment income, realized and unrealized gains and losses and expenses other than class specific expenses are allocated daily to each class of shares based upon the proportion of net assets of each class at the beginning of each day plus current day Fund share activity.
Use of Estimates. The preparation of financial statements in conformity with U.S. generally accepted accounting principles requires management to make estimates and assumptions that affect the amounts reported in the financial statements and accompanying notes. Actual results may differ from those estimates.
Income Taxes. No provision has been made for U.S. income taxes because the Trust’s policy is to continue to qualify as a regulated investment company under the Internal Revenue Code of 1986, as amended, and distribute to shareholders substantially all of the Funds’ taxable income and net realized gains.
Dividends and distributions paid to shareholders are recorded on the ex-dividend date. The amount of dividends and distributions from net investment income and net realized capital gains is determined in accordance with federal income tax regulations, which may differ from U.S. generally accepted accounting principles. To the extent these “book/tax” differences are permanent in nature, such amounts are reclassified within the capital accounts based on their federal tax-basis treatment. These differences are primarily due to differing treatments for foreign currency transactions, contingent payment debt instruments and methods of amortizing and accreting for fixed income securities. The financial statements are not adjusted for temporary differences.
Notes to Financial Statements (Unaudited)
The Funds recognized no liability for uncertain tax positions. A reconciliation is not provided as the beginning and ending amounts of unrecognized benefits are zero, with no interim additions, reductions or settlements. Tax years 2011 – 2014 remain subject to examination by the U.S. and the State of Illinois tax jurisdictions.
Indemnifications. Under the Trust’s organizational documents, the Trust is obligated to indemnify its officers and trustees against certain liabilities incurred by them by reason of having been an officer or trustee of the Trust. In addition, in the normal course of business, the Trust may enter into contracts that provide general indemnifications to other parties. Each Fund’s maximum exposure under these arrangements is unknown as this would involve future claims that may be made against the Fund that have not yet occurred. Currently, the Funds’ management expects the risk of material loss in connection to a potential claim to be remote.
Note 2 – Investment Adviser and Transactions With Affiliates Or Certain Other Parties
Pursuant to an investment advisory agreement with Calamos Advisors LLC (“Calamos Advisors”), each Fund pays a monthly investment advisory fee based on the average daily net assets of the Fund, as shown below:
| | | | | | | | | | | | | | | | |
| AVERAGE DAILY NET ASSETS | | GROWTH FUND
ANNUAL RATE | | | EVOLVING WORLD
GROWTH FUND,
EMERGING MARKET
EQUITY FUND
ANNUAL RATE | | | TOTAL RETURN
BOND FUND
ANNUAL RATE | | | OPPORTUNISTIC VALUE FUND, FOCUS GROWTH FUND, DIVIDEND GROWTH FUND, MID CAP GROWTH FUND,
INTERNATIONAL GROWTH FUND*,
GLOBAL EQUITY FUND*, GLOBAL GROWTH AND INCOME FUND
ANNUAL RATE | |
| First $500 million | | | 1.00% | | | | 1.10% | | | | 0.55% | | | | 1.00% | |
| | | | |
| Next $500 million | | | 0.90% | | | | 1.05% | | | | 0.53% | | | | 0.95% | |
| | | | |
| Next $5 billion | | | 0.80% | | | | 1.00% | | | | 0.51% | | | | 0.90% | |
| | | | |
| Next $5 billion | | | 0.78% | | | | 0.98% | | | | 0.49% | | | | 0.88% | |
| | | | |
| Next $5 billion | | | 0.76% | | | | 0.96% | | | | 0.48% | | | | 0.86% | |
| | | | |
| Next $5 billion | | | 0.74% | | | | 0.94% | | | | 0.47% | | | | 0.84% | |
| | | | |
| Next $5 billion | | | 0.72% | | | | 0.92% | | | | 0.46% | | | | 0.82% | |
| | | | |
| Over $26 billion | | | 0.70% | | | | 0.90% | | | | 0.45% | | | | 0.80% | |
| | | | |
| * | International Growth Fund and Global Equity Fund are subject to a possible adjustment based on performance as described below. |
| | | | | | | | | | | | | | | | |
| AVERAGE DAILY NET ASSETS | | GLOBAL
CONVERTIBLE
FUND | | | GROWTH AND INCOME FUND,
CONVERTIBLE FUND, HIGH
INCOME FUND, MARKET
NEUTRAL INCOME FUND, HEDGED EQUITY FUND ANNUAL RATE | | | LONG/SHORT FUND
ANNUAL RATE | | | DISCOVERY
GROWTH
FUND ANNUAL RATE | |
| First $500 million | | | 0.85% | | | | 0.75% | | | | 1.25% | | | | 1.00% | |
| | | | |
| Next $500 million | | | 0.80% | | | | 0.70% | | | | 1.20% | | | | 0.90% | |
| | | | |
| Over $1 billion | | | 0.75% | | | | 0.65% | | | | 1.15% | | | | 0.80% | |
| | | | |
Pursuant to an investment advisory agreement with Calamos Advisors, Global Convertible Fund and Hedged Equity Income Fund each pay a monthly investment advisory fee based on the average daily net assets of the each Fund at the annual rate of 0.85% and 0.75%, respectively.
Each of the International Growth and Global Equity Funds pays a fee based on average daily net assets of the Fund that is accrued daily and paid on a monthly basis, subject to possible adjustment based on the Fund’s investment performance (since March 2006 for International Growth Fund and since February 2008 for Global Equity Fund). The performance adjustment increases or decreases the management fee, on a monthly basis, by 1/12 of 0.03% of a Fund’s average daily net assets over the performance period for each full 1% increment amount by which a Fund outperforms or underperforms the benchmark index (“Index”), on an annualized basis, over the performance measurement period. The benchmark indexes are the MSCI EAFE Growth Index and the MSCI World Index for the International Growth Fund and Global Equity Fund, respectively.
| | | | |
| 154 | | CALAMOS OPEN-END FAMILY OF FUNDS SEMIANNUAL REPORT | | |
Notes to Financial Statements (Unaudited)
The base fee is shown in the table above. The performance adjustment rate is calculated by comparing over the performance measurement period the Fund’s Class A share performance to that of the respective Index. The performance measurement period commenced at the beginning of each Fund’s first full month of operation (April 2005 and March 2007 for the International Growth Fund and Global Equity Fund, respectively). The first performance adjustment was applied to the advisory fee at the end of the twelfth month. Each month subsequent to the twelfth month, a new month is added to the performance measurement period until the performance measurement period includes 36 months. Thereafter, the performance measurement period consists of the most recent month plus the previous 35 months.
The performance comparison is made at the end of each month. The maximum annualized performance adjustment rate is +/- 0.30% of the Fund’s average daily net assets over the performance measurement period. The performance adjustment rate is divided by twelve and multiplied by the Fund’s average daily net assets over the performance measurement period, and the resulting dollar amount is then added to or subtracted from the base fee. Calamos Advisors may receive a positive performance adjustment even if the Fund has a negative return over a performance measurement period if it otherwise outperforms the Index during that period.
Pursuant to a financial accounting services agreement, during the period the Funds paid Calamos Advisors a fee for financial accounting services payable monthly at the annual rate of 0.0175% on the first $1 billion of combined assets, 0.0150% on the next $1 billion of combined assets and 0.0110% on combined assets above $2 billion (for purposes of this calculation “combined assets” means the sum of the total average daily net assets of Calamos Investment Trust, Calamos Advisors Trust, Calamos ETF Trust and the total average weekly managed assets of Calamos Convertible and High Income Fund, Calamos Strategic Total Return Fund, Calamos Convertible Opportunities and Income Fund, Calamos Global Total Return Fund, Calamos Global Dynamic Income Fund and Calamos Dynamic Convertible and Income Fund). Financial accounting services include, but are not limited to, the following: managing expenses and expense payment processing; monitoring the calculation of expense accrual amounts; calculating, tracking and reporting tax adjustments on all assets; and monitoring trustee deferred compensation plan accruals and valuations. The Funds pay their pro rata share of the financial accounting services fee payable to Calamos Advisors based on their relative portion of combined assets used in calculating the fee.
The Trust reimburses Calamos Advisors for a portion of compensation paid to the Trust’s Chief Compliance Officer. This compensation is reported as part of the “Trustees’ fees and officer compensation” expense on the Statements of Operations.
Calamos Advisors has contractually agreed to limit the annual ordinary operating expenses of each Fund as a percentage of the average daily net assets as follows:
| | | | | | | | | | | | | | | | | | | | |
| FUND | | CLASS A
SHARES | | | CLASS B
SHARES | | | CLASS C
SHARES | | | CLASS I
SHARES | | | CLASS R
SHARES | |
| Growth Fund | | | 1.75% | | | | 2.50% | | | | 2.50% | | | | 1.50% | | | | 2.00% | |
| Opportunistic Value Fund | | | 1.15% | | | | 1.90% | | | | 1.90% | | | | 0.90% | | | | 1.40% | |
| Focus Growth Fund | | | 1.15% | | | | 1.90% | | | | 1.90% | | | | 0.90% | | | | 1.40% | |
| Discovery Growth Fund | | | 1.50% | | | | 2.25% | | | | 2.25% | | | | 1.25% | | | | 1.75% | |
| Dividend Growth Fund | | | 1.35% | | | | — | | | | 2.10% | | | | 1.10% | | | | 1.60% | |
| Mid Cap Growth Fund | | | 1.25% | | | | — | | | | 2.00% | | | | 1.00% | | | | 1.50% | |
| International Growth Fund | | | 1.40% | | | | 2.15% | | | | 2.15% | | | | 1.15% | | | | 1.65% | |
| Evolving World Growth Fund | | | 1.75% | | | | 2.50% | | | | 2.50% | | | | 1.50% | | | | 2.00% | |
| Emerging Market Equity Fund | | | 1.75% | | | | — | | | | 2.50% | | | | 1.50% | | | | 2.00% | |
| Global Equity Fund | | | 1.40% | | | | 2.15% | | | | 2.15% | | | | 1.15% | | | | 1.65% | |
| Growth and Income Fund | | | 1.75% | | | | 2.50% | | | | 2.50% | | | | 1.50% | | | | 2.00% | |
| Global Growth and Income Fund | | | 1.75% | | | | 2.50% | | | | 2.50% | | | | 1.50% | | | | 2.00% | |
| Convertible Fund | | | 1.75% | | | | 2.50% | | | | 2.50% | | | | 1.50% | | | | 2.00% | |
| Global Convertible Fund | | | 1.35% | | | | — | | | | 2.10% | | | | 1.10% | | | | 1.60% | |
| Total Return Bond Fund | | | 0.90% | | | | 1.65% | | | | 1.65% | | | | 0.65% | | | | 1.15% | |
| High Income Fund | | | 1.75% | | | | 2.50% | | | | 2.50% | | | | 1.50% | | | | 2.00% | |
| Market Neutral Income Fund | | | 1.75% | | | | 2.50% | | | | 2.50% | | | | 1.50% | | | | 2.00% | |
| Hedged Equity Income Fund | | | 1.25% | | | | — | | | | 2.00% | | | | 1.00% | | | | 1.50% | |
| Long/Short Fund | | | 2.00% | | | | — | | | | 2.75% | | | | 1.75% | | | | 2.25% | |
Notes to Financial Statements (Unaudited)
These agreements are binding on Calamos Advisors through March 1, 2017.
For the period ended April 30, 2015, the Funds waived or absorbed the following expenses:
| | | | |
| FUND | | AMOUNT | |
| Opportunistic Value Fund | | $ | 176,400 | |
| Focus Growth Fund | | | 133,576 | |
| Discovery Growth Fund | | | 28,708 | |
| Dividend Growth Fund | | | 56,467 | |
| Mid Cap Growth Fund | | | 76,549 | |
| Emerging Market Equity Fund | | | 44,198 | |
| Global Convertible Fund | | | 57,860 | |
| Total Return Bond Fund | | | 94,292 | |
| Hedged Equity Income Fund | | | 53,660 | |
These amounts are included in the Statements of Operations under the caption “Expense reductions”.
As Distributor, Calamos Financial Services LLC (“CFS”) assumed all expenses of personnel, office space, office facilities and equipment incidental to such service. Each Fund has adopted a Distribution Plan pursuant to Rule 12b-1 under the 1940 Act whereby the Fund pays to CFS a distribution and/or service fee at the annual rate of 0.25% of the average daily net assets of the Fund’s Class A shares; a service fee at the annual rate of 0.25% and a distribution fee at the rate of 0.75% of the average daily net assets of the Fund’s Class B and Class C shares; and a service fee at the annual rate of 0.25% and a distribution fee of 0.25% of the average daily net assets of the Fund’s Class R shares. No such fees are paid on each Fund’s Class I shares.
CFS also receives a sales commission and/or an underwriting fee on certain sales of each Fund’s Class A shares. During the period ended April 30, 2015, CFS received commissions and underwriting fees as follows:
| | | | |
| FUND | | AMOUNT | |
| Growth Fund | | $ | 43,677 | |
| Opportunistic Value Fund | | | 1,440 | |
| Focus Growth Fund | | | 1,991 | |
| Discovery Growth Fund | | | 1,623 | |
| Dividend Growth Fund | | | 328 | |
| Mid Cap Growth Fund | | | 29 | |
| International Growth Fund | | | 5,616 | |
| Evolving World Growth Fund | | | 9,809 | |
| Emerging Market Equity Fund | | | 54 | |
| Global Equity Fund | | | 4,039 | |
| Growth and Income Fund | | | 45,325 | |
| Global Growth and Income Fund | | | 4,381 | |
| Convertible Fund | | | 51,292 | |
| Global Convertible Fund | | | 1,460 | |
| Total Return Bond Fund | | | 560 | |
| High Income Fund | | | 2,012 | |
| Market Neutral Income Fund | | | 23,983 | |
| Hedged Equity Income Fund | | | 339 | |
| Long/Short Fund | | | 2,807 | |
Pursuant to an agreement with US Bancorp Fund Services, LLC, the Funds’ transfer agent (“US Bancorp”), CFS provides certain shareholder administrative services to US Bancorp. CFS receives from US Bancorp an annual aggregate fee of $175,000, paid in monthly installments, for providing these services which relate to Calamos Investment Trust and Calamos Advisors Trust. Also, US Bancorp pays license fees to unaffiliated third parties for CFS’ utilization of certain transfer agent and phone systems in providing the shareholder administrative services. The fees paid to CFS and the payment of license fees to third parties are borne by US Bancorp.
| | | | |
| 156 | | CALAMOS OPEN-END FAMILY OF FUNDS SEMIANNUAL REPORT | | |
Notes to Financial Statements (Unaudited)
The Funds have not assumed or incurred any additional expenses in connection with CFS providing these services to US Bancorp, and the transfer agency fees payable by the Funds to US Bancorp have not increased as a result thereof.
A trustee and certain officers of the Trust are also officers and directors of CFS and Calamos Advisors. Such trustee and officers serve without direct compensation from the Trust. The Funds’ Statement of Additional Information contains additional information about the Funds’ trustees and is available upon request without charge by calling our toll free number 800.582.6959.
As of April 30, 2015, certain affiliates of Calamos Advisors hold material investments in the Funds as follows:
| | | | |
| FUND | | PERCENTAGE | |
| Discovery Growth Fund | | | 51 | % |
| Emerging Market Equity Fund | | | 77 | |
| Global Convertible Fund | | | 34 | |
| Hedged Equity Fund | | | 90 | |
The Trust has adopted a deferred compensation plan (the “Plan”). Under the Plan, a trustee who is not an “interested person” (as defined in the 1940 Act) and has elected to participate in the Plan (a “participating trustee”) may defer receipt of all or a portion of their compensation from the Trust. The deferred compensation payable to the participating trustee is credited to the trustee’s deferral account as of the business day such compensation would have been paid to the participating trustee. The value of amounts deferred for a participating trustee is determined by reference to the change in value of Class I shares of one or more funds of the Trust designated by the participant. The value of the account increases with contributions to the account or with increases in the value of the measuring shares, and the value of the account decreases with withdrawals from the account or with declines in the value of the measuring shares.
At April 30, 2015, the Funds had deferred compensation balances, which are included in “Other assets” on the Statements of Assets and Liabilities, as follows:
| | | | |
| FUND | | AMOUNT | |
| Growth Fund | | $ | 850,191 | |
| Opportunistic Value Fund | | | 103,711 | |
| Focus Growth Fund | | | 96,053 | |
| Discovery Growth Fund | | | 37,586 | |
| Dividend Growth Fund | | | 9,972 | |
| Mid Cap Growth Fund | | | 10,006 | |
| International Growth Fund | | | 106,315 | |
| Evolving World Growth Fund | | | 61,562 | |
| Emerging Market Equity Fund | | | 8,472 | |
| Global Equity Fund | | | 69,991 | |
| Growth and Income Fund | | | 436,002 | |
| Global Growth and Income Fund | | | 170,399 | |
| Convertible Fund | | | 229,540 | |
| Global Convertible Fund | | | 403 | |
| Total Return Bond Fund | | | 71,963 | |
| High Income Fund | | | 115,926 | |
| Market Neutral Income Fund | | | 238,345 | |
| Hedged Equity Income Fund | | | 409 | |
| Long/Short Fund | | | 10,988 | |
Each Fund’s obligation to make payments under the Plan is a general obligation of the Fund and is included in “Payable for deferred compensation to trustees” on the Statements of Assets and Liabilities at April 30, 2015.
Notes to Financial Statements (Unaudited)
Note 3 – Investments
The cost of purchases and proceeds from sale of long-term investments for the period ended April 30, 2015 were as follows:
| | | | | | | | | | | | | | | | |
| | | COST OF PURCHASES | | | PROCEEDS FROM SALES | |
| Fund | | U.S. GOV’T
SECURITIES | | | OTHER | | | U.S. GOV’T
SECURITIES | | | OTHER | |
| Growth Fund | | $ | 0 | | | $ | 959,509,455 | | | $ | 0 | | | $ | 1,572,813,210 | |
| Opportunistic Value Fund | | | 0 | | | | 81,389,939 | | | | 0 | | | | 107,737,445 | |
| Focus Growth Fund | | | 0 | | | | 54,779,262 | | | | 0 | | | | 57,743,638 | |
| Discovery Growth Fund | | | 0 | | | | 20,916,617 | | | | 0 | | | | 24,122,851 | |
| Dividend Growth Fund | | | 0 | | | | 24,259,687 | | | | 0 | | | | 30,005,869 | |
| Mid Cap Growth Fund | | | 0 | | | | 14,864,272 | | | | 0 | | | | 25,692,381 | |
| International Growth Fund | | | 0 | | | | 268,200,846 | | | | 0 | | | | 355,852,015 | |
| Evolving World Growth Fund | | | 0 | | | | 182,533,604 | | | | 0 | | | | 236,500,609 | |
| Emerging Market Equity Fund | | | 0 | | | | 7,757,337 | | | | 0 | | | | 5,191,602 | |
| Global Equity Fund | | | 0 | | | | 58,278,472 | | | | 0 | | | | 88,030,953 | |
| Growth and Income Fund | | | 0 | | | | 426,024,451 | | | | 0 | | | | 669,495,038 | |
| Global Growth and Income Fund | | | 0 | | | | 117,368,656 | | | | 0 | | | | 194,232,210 | |
| Convertible Fund | | | 0 | | | | 466,792,472 | | | | 0 | | | | 581,701,769 | |
| Global Convertible Fund | | | 0 | | | | 7,609,853 | | | | 0 | | | | 206,222 | |
| Total Return Bond Fund | | | 12,935,246 | | | | 16,120,430 | | | | 6,085,647 | | | | 47,386,559 | |
| High Income Fund | | | 0 | | | | 52,889,865 | | | | 0 | | | | 86,661,165 | |
| Market Neutral Income Fund | | | 0 | | | | 885,295,452 | | | | 0 | | | | 1,305,939,414 | |
| Hedged Equity Income Fund | | | 0 | | | | 12,317,500 | | | | 0 | | | | 1,301,564 | |
| Long/Short Fund | | | 0 | | | | 73,197,004 | | | | 0 | | | | 104,181,597 | |
The following information is presented on a federal income tax basis as of April 30, 2015. Differences between the cost basis under U.S. generally accepted accounting principles and federal income tax purposes are primarily due to temporary differences.
The cost basis of investments for federal income tax purposes at April 30, 2015 was as follows:
| | | | | | | | | | | | | | | | |
| FUND | | COST BASIS OF
INVESTMENTS | | | GROSS UNREALIZED
APPRECIATION | | | GROSS UNREALIZED
DEPRECIATION | | | NET UNREALIZED
APPRECIATION
(DEPRECIATION) | |
| Growth Fund | | $ | 2,473,380,585 | | | $ | 838,921,835 | | | $ | (32,365,074 | ) | | $ | 806,556,761 | |
| Opportunistic Value Fund | | | 72,764,144 | | | | 3,614,216 | | | | (1,705,848 | ) | | | 1,908,368 | |
| Focus Growth Fund | | | 56,653,675 | | | | 10,915,999 | | | | (1,312,901 | ) | | | 9,603,098 | |
| Discovery Growth Fund | | | 47,121,033 | | | | 4,757,282 | | | | (1,567,550 | ) | | | 3,189,732 | |
| Dividend Growth Fund | | | 30,949,398 | | | | 1,995,392 | | | | (434,194 | ) | | | 1,561,198 | |
| Mid Cap Growth Fund | | | 36,977,878 | | | | 4,286,317 | | | | (1,106,707 | ) | | | 3,179,610 | |
| International Growth Fund | | | 654,854,003 | | | | 83,040,176 | | | | (16,072,124 | ) | | | 66,968,052 | |
| Evolving World Growth Fund | | | 564,358,353 | | | | 78,212,449 | | | | (29,711,019 | ) | | | 48,501,430 | |
| Emerging Market Equity Fund | | | 17,607,915 | | | | 1,997,010 | | | | (952,323 | ) | | | 1,044,687 | |
| Global Equity Fund | | | 179,544,945 | | | | 38,861,905 | | | | (3,542,326 | ) | | | 35,319,579 | |
| Growth and Income Fund | | | 2,405,953,952 | | | | 476,837,022 | | | | (27,281,627 | ) | | | 449,555,395 | |
| Global Growth and Income Fund | | | 400,306,960 | | | | 42,088,393 | | | | (12,621,131 | ) | | | 29,467,262 | |
| Convertible Fund | | | 1,266,800,421 | | | | 105,053,578 | | | | (27,543,496 | ) | | | 77,510,082 | |
| Global Convertible Fund | | | 8,935,893 | | | | 259,350 | | | | (158,774 | ) | | | 100,576 | |
| Total Return Bond Fund | | | 74,299,815 | | | | 2,161,815 | | | | (125,483 | ) | | | 2,036,332 | |
| High Income Fund | | | 156,766,463 | | | | 3,248,709 | | | | (3,359,186 | ) | | | (110,477 | ) |
| Market Neutral Income Fund | | | 3,831,896,584 | | | | 299,153,054 | | | | (108,309,359 | ) | | | 190,843,695 | |
| Hedged Equity Income Fund | | | 11,200,769 | | | | 326,788 | | | | (374,671 | ) | | | (47,883 | ) |
| Long/Short Fund | | | 95,404,946 | | | | 7,115,443 | | | | (1,603,765 | ) | | | 5,511,678 | |
| | | | |
| 158 | | CALAMOS OPEN-END FAMILY OF FUNDS SEMIANNUAL REPORT | | |
Notes to Financial Statements (Unaudited)
Note 4 – Income Taxes
The tax character of distributions for the period ended April 30, 2015 will be determined at the end of each Fund’s current fiscal year. Distributions during the fiscal period ended October 31, 2014 were characterized for federal income tax purposes as follows:
| | | | | | | | |
| | | YEAR ENDED OCTOBER 31, 2014 | |
| FUND | | ORDINARY
INCOME | | | LONG-TERM
CAPITAL GAIN | |
| Growth Fund | | $ | 79,113,077 | | | $ | 1,060,626,877 | |
| Opportunistic Value Fund | | | 10,604,683 | | | | 623,975 | |
| Focus Growth Fund | | | 122,306 | | | | 1,440,806 | |
| Discovery Growth Fund | | | 6,210,626 | | | | 2,324,459 | |
| Dividend Growth Fund | | | 911,944 | | | | 15,524 | |
| Mid Cap Growth Fund | | | 10,155 | | | | — | |
| International Growth Fund | | | 10,696,527 | | | | 9,283,676 | |
| Evolving World Growth Fund | | | 3,764,079 | | | | 4,436,201 | |
| Emerging Market Equity Fund | | | 21,107 | | | | — | |
| Global Equity Fund | | | 13,254,469 | | | | 10,186,933 | |
| Growth and Income Fund | | | 98,856,736 | | | | 298,279,101 | |
| Global Growth and Income Fund | | | 17,007,473 | | | | 95,810,958 | |
| Convertible Fund | | | 79,171,467 | | | | 61,609,167 | |
| Total Return Bond Fund | | | 7,177,416 | | | | 964,750 | |
| High Income Fund | | | 14,081,921 | | | | 6,259,012 | |
| Market Neutral Income Fund | | | 38,933,008 | | | | 66,724,661 | |
| Long/Short Fund | | | 772,392 | | | | — | |
As of October 31, 2014, the components of accumulated earnings/(loss) on a tax basis were as follows:
| | | | | | | | | | | | | | | | | | | | |
| | | GROWTH
FUND | | | OPPORTUNISTIC
VALUE FUND | | | FOCUS GROWTH
FUND | | | DISCOVERY
GROWTH FUND | | | DIVIDEND
GROWTH FUND | |
| Undistributed ordinary income | | $ | 43,628,766 | | | $ | 1,296,154 | | | $ | — | | | $ | 2,957,444 | | | $ | 524,515 | |
| Undistributed capital gains | | | 658,197,765 | | | | 5,628,856 | | | | 6,260,404 | | | | 1,341,433 | | | | 197,528 | |
| | | | |
| Total undistributed earnings | | | 701,826,531 | | | | 6,925,010 | | | | 6,260,404 | | | | 4,298,877 | | | | 722,043 | |
| Accumulated capital and other losses | | | — | | | | — | | | | — | | | | — | | | | — | |
| Net unrealized gain/(losses) | | | 1,023,899,163 | | | | 9,056,310 | | | | 14,651,320 | | | | 1,796,367 | | | | 2,611,514 | |
| | | | |
| Total accumulated earnings/(losses) | | | 1,725,725,694 | | | | 15,981,320 | | | | 20,911,724 | | | | 6,095,244 | | | | 3,333,557 | |
| Other | | | (565,385 | ) | | | (77,445 | ) | | | (58,584 | ) | | | (72,068 | ) | | | (2,713 | ) |
| Paid-in capital | | | 1,759,316,119 | | | | 85,117,554 | | | | 43,773,931 | | | | 41,551,433 | | | | 33,580,983 | |
| | | | |
| | $ | 3,484,476,428 | | | $ | 101,021,429 | | | $ | 64,627,071 | | | $ | 47,574,609 | | | $ | 36,911,827 | |
| | | | |
| | | | | |
| | | MID CAP
GROWTH FUND | | | INTERNATIONAL
GROWTH FUND | | | EVOLVING WORLD
GROWTH FUND | | | EMERGING
MARKET EQUITY
FUND | | | GLOBAL EQUITY
FUND | |
| Undistributed ordinary income | | $ | — | | | $ | — | | | $ | 2,341,411 | | | $ | 103,235 | | | $ | — | |
| Undistributed capital gains | | | — | | | | 78,105,377 | | | | 13,401,023 | | | | — | | | | 42,960,381 | |
| | | | |
| Total undistributed earnings | | | — | | | | 78,105,377 | | | | 15,742,434 | | | | 103,235 | | | | 42,960,381 | |
| Accumulated capital and other losses | | | (338,808 | ) | | | — | | | | — | | | | (287,481 | ) | | | — | |
| Net unrealized gain/(losses) | | | 2,625,391 | | | | 40,698,713 | | | | 22,442,880 | | | | (14,866 | ) | | | 28,976,815 | |
| | | | |
| Total accumulated earnings/(losses) | | | 2,286,583 | | | | 118,804,090 | | | | 38,185,314 | | | | (199,112 | ) | | | 71,937,196 | |
| Other | | | (5,455 | ) | | | (129,196 | ) | | | (1,111,327 | ) | | | (1,251 | ) | | | (49,326 | ) |
| Paid-in capital | | | 45,257,305 | | | | 622,918,386 | | | | 614,489,335 | | | | 15,647,592 | | | | 155,906,998 | |
| | | | |
| | $ | 47,538,433 | | | $ | 741,593,280 | | | $ | 651,563,322 | | | $ | 15,447,229 | | | $ | 227,794,868 | |
| | | | |
Notes to Financial Statements (Unaudited)
| | | | | | | | | | | | | | | | | | | | |
| | | GROWTH AND
INCOME FUND | | | GLOBAL GROWTH
AND INCOME
FUND | | | CONVERTIBLE
FUND | | | TOTAL RETURN
BOND FUND | | | HIGH INCOME
FUND | |
| Undistributed ordinary income | | $ | 8,191,179 | | | $ | 6,779,009 | | | $ | 5,337,407 | | | $ | 164,497 | | | $ | 232,689 | |
| Undistributed capital gains | | | 314,458,504 | | | | 72,736,606 | | | | 66,412,935 | | | | 1,040,699 | | | | 3,848,878 | |
| | | | |
| Total undistributed earnings | | | 322,649,683 | | | | 79,515,615 | | | | 71,750,342 | | | | 1,205,196 | | | | 4,081,567 | |
| Accumulated capital and other losses | | | — | | | | — | | | | — | | | | — | | | | — | |
| Net unrealized gain/(losses) | | | 520,103,428 | | | | 25,252,208 | | | | 151,617,402 | | | | 2,572,169 | | | | 1,950,517 | |
| | | | |
| Total accumulated earnings/(losses) | | | 842,753,111 | | | | 104,767,823 | | | | 223,367,744 | | | | 3,777,365 | | | | 6,032,084 | |
| Other | | | (443,891 | ) | | | (582,488 | ) | | | (261,667 | ) | | | (270,238 | ) | | | (88,933 | ) |
| Paid-in capital | | | 2,209,995,001 | | | | 382,079,678 | | | | 1,151,850,688 | | | | 97,057,407 | | | | 182,794,283 | |
| | | | |
| | $ | 3,052,304,221 | | | $ | 486,265,013 | | | $ | 1,374,956,765 | | | $ | 100,564,534 | | | $ | 188,737,434 | |
| | | | |
| | | | | |
| | | | | | | | | | | | MARKET NEUTRAL
INCOME FUND | | | LONG/SHORT
FUND | |
| Undistributed ordinary income | | | | | | | | | | | | | | $ | 10,044,280 | | | $ | 1,014,924 | |
| Undistributed capital gains | | | | | | | | | | | | | | | 38,180,824 | | | | 469,652 | |
| | | | | | | | | | | | | | | | |
| Total undistributed earnings | | | | | | | | | | | | | | | 48,225,104 | | | | 1,484,576 | |
| Accumulated capital and other losses | | | | | | | | | | | | | | | — | | | | — | |
| Net unrealized gain/(losses) | | | | | | | | | | | | | | | 71,917,892 | | | | 2,909,702 | |
| | | | | | | | | | | | | | | | |
| Total accumulated earnings/(losses) | | | | | | | | | | | | | | | 120,142,996 | | | | 4,394,278 | |
| Other | | | | | | | | | | | | | | | (14,173,088 | ) | | | (3,435 | ) |
| Paid-in capital | | | | | | | | | | | | | | | 4,079,826,476 | | | | 125,583,054 | |
| | | | | | | | | | | | | | | | |
| | | | | | | | | | | | | | $ | 4,185,796,384 | | | $ | 129,973,897 | |
| | | | | | | | | | | | | | | | |
The Regulated Investment Company Modernization Act of 2010 (the “Act”) modernized various tax rules for regulated investment companies, and was effective for taxable years beginning after the enactment date of December 22, 2010. One significant change is to the treatment of capital loss carryforwards. Now, any capital losses recognized will retain their character as either short-term or long-term capital losses, will be utilized before the pre-Act capital loss carryforwards, and will be carried forward indefinitely, until applied in offsetting future capital gains.
In addition, the funds below had post-Act capital losses as follows:
| | | | | | | | |
| FUND | | Short-Term | | | Long-Term | |
| Mid Cap Growth Fund | | $ | (330,729 | ) | | $ | (8,079 | ) |
| Emerging Market Equity Fund | | | (287,481 | ) | | | — | |
Note 5 – Short Sales
Securities sold short represent obligations to deliver the securities at a future date. A Fund may sell a security it does not own in anticipation of a decline in the value of that security before the delivery date. When the Fund sells a security short, it must borrow the security sold short and deliver it to the broker-dealer through which it made the short sale. Dividends paid on securities sold short are disclosed as an expense on the Statements of Operations. A gain, limited to the price at which the Fund sold the security short, or a loss, unlimited in size, will be realized upon the termination of a short sale.
To secure its obligation to deliver to the broker-dealer the securities sold short, the Fund must segregate an amount of cash or liquid securities with its custodian equal to any excess of the current market value of the securities sold short over any cash or liquid securities deposited as collateral with the broker in connection with the short sale (not including the proceeds of the short sale). As a result of that requirement, the Fund will not gain any leverage merely by selling short, except to the extent that it earns interest or other income or gains on the segregated cash or liquid securities while also being subject to the possibility of gain or loss from the securities sold short.
| | | | |
| 160 | | CALAMOS OPEN-END FAMILY OF FUNDS SEMIANNUAL REPORT | | |
Notes to Financial Statements (Unaudited)
Note 6 – Derivative Investments
Foreign Currency Risk. Each Fund may engage in portfolio hedging with respect to changes in currency exchange rates by entering into forward foreign currency contracts to purchase or sell currencies. A forward foreign currency contract is a commitment to purchase or sell a foreign currency at a future date at a negotiated forward rate. Risks associated with such contracts include, among other things, movement in the value of the foreign currency relative to the U.S. dollar and the ability of the counterparty to perform. To mitigate the counterparty risk, the Fund may enter into an International Swaps and Derivatives Association, Inc. Master Agreement (“ISDA Master Agreement”) or similar agreement with its derivative contract counterparties. An ISDA Master Agreement is a bilateral agreement between the Fund and a counterparty that governs over-the-counter derivatives and foreign exchange contracts and typically contains, among other things, collateral posting terms and netting provisions in the event of a default and/or termination event. Under an ISDA Master Agreement, the Fund may, under certain circumstances, offset with the counterparty certain derivative financial instrument’s payables and/or receivables with collateral held and/or posted and create one single net payment. The provisions of the ISDA Master Agreement typically permit a single net payment in the event of default (close-out netting) including the bankruptcy or insolvency of the counterparty. Generally, collateral is exchanged between the Fund and the counterparty and the amount of collateral due from the Fund or to a counterparty has to exceed a minimum transfer amount threshold before a transfer has to be made. To the extent amounts due to the Fund from its counterparties are not fully collateralized, contractually or otherwise, the Fund bears the risk of loss from counterparty nonperformance. For financial reporting purposes, the Funds do not offset derivative assets and derivative liabilities that are subject to netting arrangements in the Statements of Assets and Liabilities. The Funds’ net counterparty exposure is reflected in the counterparty table below. The net unrealized gain, if any, represents the credit risk to the respective Fund on a forward foreign currency contract. The contracts are valued daily at forward foreign exchange rates. The Funds realize a gain or loss when a position is closed or upon settlement of the contracts.
As of April 30, 2015, the Funds had outstanding forward foreign currency contracts listed on the Schedules of Investments.
Equity Risk. Each Fund may engage in option transactions and in doing so achieves similar objectives to what it would achieve through the sale or purchase of individual securities. A call option, upon payment of a premium, gives the purchaser of the option the right to buy, and the seller of the option the obligation to sell, the underlying security, index or other instrument at the exercise price. A put option gives the purchaser of the option, upon payment of a premium, the right to sell, and the seller the obligation to buy, the underlying security, index, or other instrument at the exercise price.
To seek to offset some of the risk of a potential decline in value of certain long positions, each Fund may also purchase put options on individual securities, broad-based securities indexes or certain exchange-traded funds (“ETFs”). Each Fund may also seek to generate income from option premiums by writing (selling) options on a portion of the equity securities (including securities that are convertible into equity securities) in the Fund’s portfolio, on broad-based securities indexes, or certain ETFs.
When a Fund purchases an option, it pays a premium and an amount equal to that premium is recorded as an asset. When a Fund writes an option, it receives a premium and an amount equal to that premium is recorded as a liability. The asset or liability is adjusted daily to reflect the current market value of the option. If an option expires unexercised, a Fund realizes a gain or loss to the extent of the premium received or paid. If an option is exercised, the premium received or paid is recorded as an adjustment to the proceeds from the sale or the cost basis of the purchase. The difference between the premium and the amount received or paid on a closing purchase or sale transaction is also treated as a realized gain or loss. The cost of securities acquired through the exercise of call options is increased by premiums paid. The proceeds from securities sold through the exercise of put options are decreased by the premiums paid. Gain or loss on written options and purchased options is presented separately as net realized gain or loss on written options and net realized gain or loss on purchased options, respectively.
Options written by a Fund do not typically give rise to counterparty credit risk since options written obligate the Fund and not the counterparty to perform. Exchange traded purchased options have minimal counterparty credit risk to a Fund since the exchange’s clearinghouse, as counterparty to such instruments, guarantees against a possible default.
Notes to Financial Statements (Unaudited)
As of April 30, 2015, the Funds had outstanding purchased options and/or written options as listed on the Schedules of Investments. For the period ended April 30, 2015, the Funds had the following transactions in options written:
| | | | | | | | | | | | | | | | |
| | | GROWTH FUND | | | OPPORTUNISTIC VALUE FUND | |
| | | NUMBER OF
CONTRACTS | | | PREMIUMS
RECEIVED | | | NUMBER OF
CONTRACTS | | | PREMIUMS
RECEIVED | |
| Options outstanding at October 31, 2014 | | | 2,550 | | | $ | 640,838 | | | | 145 | | | $ | 76,856 | |
| Option written | | | 2,270 | | | | 495,099 | | | | 36 | | | | 27,386 | |
| Options closed | | | (2,550 | ) | | | (640,838 | ) | | | (22 | ) | | | (17,434 | ) |
| Options exercised | | | — | | | | — | | | | (159 | ) | | | (86,808 | ) |
| Options expired | | | (2,270 | ) | | | (495,099 | ) | | | — | | | | — | |
| | | | |
| Options outstanding at April 30, 2015 | | | — | | | $ | — | | | | — | | | $ | — | |
| | |
| | | FOCUS GROWTH FUND | | | DIVIDEND GROWTH FUND | |
| | | NUMBER OF
CONTRACTS | | | PREMIUMS
RECEIVED | | | NUMBER OF
CONTRACTS | | | PREMIUMS
RECEIVED | |
| Options outstanding at October 31, 2014 | | | — | | | $ | — | | | | 50 | | | $ | 26,499 | |
| Option written | | | 1,289 | | | | 148,958 | | | | 20 | | | | 15,212 | |
| Options closed | | | (1,118 | ) | | | (112,890 | ) | | | (10 | ) | | | (8,104 | ) |
| Options exercised | | | — | | | | — | | | | (60 | ) | | | (33,607 | ) |
| Options expired | | | (171 | ) | | | (36,068 | ) | | | — | | | | — | |
| | | | |
| Options outstanding at April 30, 2015 | | | — | | | $ | — | | | | — | | | $ | — | |
| | |
| | | MID CAP GROWTH FUND | | | CONVERTIBLE FUND | |
| | | NUMBER OF
CONTRACTS | | | PREMIUMS
RECEIVED | | | NUMBER OF
CONTRACTS | | | PREMIUMS
RECEIVED | |
| Options outstanding at October 31, 2014 | | | — | | | $ | — | | | | 5,700 | | | $ | 558,341 | |
| Option written | | | 31 | | | | 6,761 | | | | 2,110 | | | | 603,810 | |
| Options closed | | | — | | | | — | | | | (4,500 | ) | | | (714,412 | ) |
| Options exercised | | | — | | | | — | | | | — | | | | — | |
| Options expired | | | (31 | ) | | | (6,761 | ) | | | (2,850 | ) | | | (279,171 | ) |
| | | | |
| Options outstanding at April 30, 2015 | | | — | | | $ | — | | | | 460 | | | $ | 168,568 | |
| | |
| | | MARKET NEUTRAL INCOME FUND | | | HEDGED EQUITY INCOME FUND | |
| | | NUMBER OF
CONTRACTS | | | PREMIUMS
RECEIVED | | | NUMBER OF
CONTRACTS | | | PREMIUMS
RECEIVED | |
| Options outstanding at October 31, 2014 | | | 13,621 | | | $ | 15,221,159 | | | | — | | | $ | — | |
| Option written | | | 79,146 | | | | 74,892,393 | | | | 167 | | | | 354,651 | |
| Options closed | | | (46,118 | ) | | | (63,233,884 | ) | | | (114 | ) | | | (241,768 | ) |
| Options exercised | | | (4,504 | ) | | | (1,161,101 | ) | | | — | | | | — | |
| Options expired | | | (20,369 | ) | | | (1,237,719 | ) | | | (10 | ) | | | (1,314 | ) |
| | | | |
| Options outstanding at April 30, 2015 | | | 21,776 | | | $ | 24,480,848 | | | | 43 | | | $ | 111,569 | |
| | |
| | | | | | LONG/SHORT FUND | |
| | | | | | | | | NUMBER OF
CONTRACTS | | | PREMIUMS
RECEIVED | |
| Options outstanding at October 31, 2014 | | | | | | | | | | | 1,130 | | | $ | 93,846 | |
| Option written | | | | | | | | | | | 10,598 | | | | 1,283,486 | |
| Options closed | | | | | | | | | | | (5,041 | ) | | | (625,643 | ) |
| Options exercised | | | | | | | | | | | (1,659 | ) | | | (205,409 | ) |
| Options expired | | | | | | | | | | | (3,055 | ) | | | (234,405 | ) |
| | | | | | | | | | | | |
| Options outstanding at April 30, 2015 | | | | | | | | | | | 1,973 | | | $ | 311,875 | |
| | | | |
| 162 | | CALAMOS OPEN-END FAMILY OF FUNDS SEMIANNUAL REPORT | | |
Notes to Financial Statements (Unaudited)
As of April 30, 2015, the Funds had outstanding derivative contracts which are reflected on the Statements of Assets and Liabilities as follows:
| | | | | | | | |
| | | ASSET
DERIVATIVES | | | LIABILITY
DERIVATIVES | |
| | | | |
| | | GROWTH FUND | |
| Gross amounts at fair value: | | | | | | | | |
| Forward foreign currency contracts(1) | | $ | 1,408 | | | $ | 931,477 | |
| | | | |
| | $ | 1,408 | | | $ | 931,477 | |
| | | | |
| |
| | | FOCUS GROWTH FUND | |
| Gross amounts at fair value: | | | | | | | | |
| Forward foreign currency contracts(1) | | $ | 1 | | | $ | 425 | |
| | | | |
| | $ | 1 | | | $ | 425 | |
| | | | |
| |
| | | MID CAP GROWTH FUND | |
| Gross amounts at fair value: | | | | | | | | |
| Forward foreign currency contracts(1) | | $ | — | | | $ | 4,169 | |
| | | | |
| | $ | — | | | $ | 4,169 | |
| | | | |
| |
| | | INTERNATIONAL GROWTH FUND | |
| Gross amounts at fair value: | | | | | | | | |
| Forward foreign currency contracts(1) | | $ | 28,594 | | | $ | 2,045,142 | |
| | | | |
| | $ | 28,594 | | | $ | 2,045,142 | |
| | | | |
| |
| | | EVOLVING WORLD GROWTH FUND | |
| Gross amounts at fair value: | | | | | | | | |
| Forward foreign currency contracts(1) | | $ | 65,208 | | | $ | 1,041,079 | |
| | | | |
| | $ | 65,208 | | | $ | 1,041,079 | |
| | | | |
| |
| | | EMERGING MARKET EQUITY FUND | |
| Gross amounts at fair value: | | | | | | | | |
| Forward foreign currency contracts(1) | | $ | 1 | | | $ | — | |
| | | | |
| | $ | 1 | | | $ | — | |
| | | | |
| |
| | | GLOBAL EQUITY FUND | |
| Gross amounts at fair value: | | | | | | | | |
| Forward foreign currency contracts(1) | | $ | 6,946 | | | $ | 332,618 | |
| | | | |
| | $ | 6,946 | | | $ | 332,618 | |
| | | | |
| |
| | | GROWTH AND INCOME FUND | |
| Gross amounts at fair value: | | | | | | | | |
| Forward foreign currency contracts(1) | | $ | 53,397 | | | $ | — | |
| | | | |
| | $ | 53,397 | | | $ | — | |
| | | | |
| |
| | | GLOBAL GROWTH AND INCOME FUND | |
| Gross amounts at fair value: | | | | | | | | |
| Forward foreign currency contracts(1) | | $ | 15,625 | | | $ | 336,236 | |
| Purchased options(2) | | | 2,635,809 | | | | — | |
| | | | |
| | $ | 2,651,434 | | | $ | 336,236 | |
| | | | |
Notes to Financial Statements (Unaudited)
| | | | | | | | |
| | | ASSET
DERIVATIVES | | | LIABILITY
DERIVATIVES | |
| | | CONVERTIBLE FUND | |
| Gross amounts at fair value: | | | | | | | | |
| Forward foreign currency contracts(1) | | $ | 30,378 | | | $ | 834,907 | |
| Purchased options(2) | | | 8,809,725 | | | | — | |
| Written options(3) | | | — | | | | 179,400 | |
| | | | |
| | $ | 8,840,103 | | | $ | 1,014,307 | |
| | | | |
| |
| | | GLOBAL CONVERTIBLE FUND | |
| Gross amounts at fair value: | | | | | | | | |
| Purchased options(2) | | $ | 104,994 | | | $ | — | |
| | | | |
| | $ | 104,994 | | | $ | — | |
| | | | |
| |
| | | MARKET NEUTRAL INCOME FUND | |
| Gross amounts at fair value: | | | | | | | | |
| Purchased options(2) | | $ | 18,418,061 | | | $ | — | |
| Written options(3) | | | — | | | | 21,791,438 | |
| | | | |
| | $ | 18,418,061 | | | $ | 21,791,438 | |
| | | | |
| |
| | | HEDGED EQUITY FUND | |
| Gross amounts at fair value: | | | | | | | | |
| Purchased options(2) | | $ | 40,175 | | | $ | — | |
| Written options(3) | | | — | | | | 68,130 | |
| | | | |
| | $ | 40,175 | | | $ | 68,130 | |
| | | | |
| |
| | | LONG/SHORT FUND | |
| Gross amounts at fair value: | | | | | | | | |
| Purchased options(2) | | $ | 149,620 | | | $ | — | |
| Written options(3) | | | — | | | | 337,927 | |
| | | | |
| | $ | 149,620 | | | $ | 337,927 | |
| | | | |
| | | | | | | | | | | | | | | | | | | | | | | | |
| | | GROSS AMOUNTS NOT OFFSET
IN THE STATEMENT OF ASSETS AND LIABILITIES | |
| | | | |
| GROWTH FUND | | GROSS AMOUNTS PRESENTED IN THE
STATEMENT OF ASSETS AND LIABILITIES | | | COLLATERAL PLEDGED | | | NET AMOUNT
RECEIVABLE
IN THE EVENT OF DEFAULT | | | NET AMOUNT
PAYABLE IN
THE EVENT OF DEFAULT | |
| Counterparty | | | | | ASSETS | | | LIABILITIES | | | | |
| Barclays Bank PLC | | | ISDA | | | $ | — | | | $ | 5,282 | | | $ | — | | | $ | — | | | $ | 5,282 | |
| Citibank N.A. | | | ISDA | | | | 1,408 | | | | — | | | | — | | | | 1,408 | | | | — | |
| Northern Trust Company | | | ISDA | | | | — | | | | 926,195 | | | | — | | | | — | | | | 926,195 | |
| | | | |
| | | $ | 1,408 | | | $ | 931,477 | | | $ | — | | | $ | 1,408 | | | $ | 931,477 | |
| | | | |
| | | | |
| FOCUS GROWTH FUND | | GROSS AMOUNTS PRESENTED IN THE
STATEMENT OF ASSETS AND LIABILITIES | | | COLLATERAL PLEDGED | | | NET AMOUNT
RECEIVABLE
IN THE EVENT OF DEFAULT | | | NET AMOUNT
PAYABLE IN
THE EVENT OF DEFAULT | |
| Counterparty | | | ASSETS | | | LIABILITIES | | | | |
| Barclays Bank PLC | | | ISDA | | | $ | — | | | $ | 425 | | | $ | — | | | $ | — | | | $ | 425 | |
| Northern Trust Company | | | ISDA | | | | 1 | | | | — | | | | — | | | | 1 | | | | — | |
| | | | |
| | | $ | 1 | | | $ | 425 | | | $ | — | | | $ | 1 | | | $ | 425 | |
| | | | |
| | | | |
| 164 | | CALAMOS OPEN-END FAMILY OF FUNDS SEMIANNUAL REPORT | | |
Notes to Financial Statements (Unaudited)
| | | | | | | | | | | | | | | | | | | | | | | | |
| | | GROSS AMOUNTS NOT OFFSET
IN THE STATEMENT OF ASSETS AND LIABILITIES | |
| | | | |
| MID CAP GROWTH FUND | | GROSS AMOUNTS PRESENTED IN THE
STATEMENT OF ASSETS AND LIABILITIES | | | COLLATERAL PLEDGED | | | NET AMOUNT
RECEIVABLE
IN THE EVENT OF DEFAULT | | | NET AMOUNT
PAYABLE IN
THE EVENT OF DEFAULT | |
| Counterparty | | | ASSETS | | | LIABILITIES | | | | |
| Citibank N.A. | | | ISDA | | | $ | — | | | $ | 4,169 | | | $ | — | | | $ | — | | | $ | 4,169 | |
| | | | |
| | | $ | — | | | $ | 4,169 | | | $ | — | | | $ | — | | | $ | 4,169 | |
| | | | |
| | | | |
| INTERNATIONAL GROWTH FUND | | GROSS AMOUNTS PRESENTED IN THE
STATEMENT OF ASSETS AND LIABILITIES | | | COLLATERAL PLEDGED | | | NET AMOUNT
RECEIVABLE
IN THE EVENT OF DEFAULT | | | NET AMOUNT
PAYABLE IN
THE EVENT OF DEFAULT | |
| Counterparty | | | ASSETS | | | LIABILITIES | | | | |
| Brown Brothers Harriman & Company | | | ISDA | | | $ | — | | | $ | 1,805,958 | | | $ | — | | | $ | — | | | $ | 1,805,958 | |
| JPMorgan Chase Bank N.A. | | | ISDA | | | | 28,594 | | | | 234,332 | | | | — | | | | — | | | | 205,738 | |
| Northern Trust Company | | | ISDA | | | | — | | | | 4,852 | | | | — | | | | — | | | | 4,852 | |
| | | | |
| | | $ | 28,594 | | | $ | 2,045,142 | | | $ | — | | | $ | — | | | $ | 2,016,548 | |
| | | | |
| | | | |
EVOLVING WORLD GROWTH
FUND | | GROSS AMOUNTS PRESENTED IN THE
STATEMENT OF ASSETS AND LIABILITIES | | | COLLATERAL PLEDGED | | | NET AMOUNT
RECEIVABLE
IN THE EVENT OF DEFAULT | | | NET AMOUNT
PAYABLE IN
THE EVENT OF DEFAULT | |
| Counterparty | | | ASSETS | | | LIABILITIES | | | | |
| Brown Brothers Harriman & Company | | | ISDA | | | $ | — | | | $ | 882,195 | | | $ | — | | | $ | — | | | $ | 882,195 | |
| JPMorgan Chase Bank N.A. | | | ISDA | | | | 41,112 | | | | 158,884 | | | | — | | | | — | | | | 117,772 | |
| Northern Trust Company | | | ISDA | | | | 24,017 | | | | — | | | | — | | | | 24,017 | | | | — | |
| Other derivatives(4) | | | | 79 | | | | — | | | | — | | | | 79 | | | | — | |
| | | | |
| | | $ | 65,208 | | | $ | 1,041,079 | | | $ | — | | | $ | 24,096 | | | $ | 999,967 | |
| | | | |
| | | | |
EMERGING MARKET EQUITY
FUND | | GROSS AMOUNTS PRESENTED IN THE
STATEMENT OF ASSETS AND LIABILITIES | | | COLLATERAL PLEDGED | | | NET AMOUNT
RECEIVABLE IN
THE EVENT OF DEFAULT | | | NET AMOUNT
PAYABLE IN
THE EVENT OF DEFAULT | |
| Counterparty | | | | | ASSETS | | | LIABILITIES | | | | |
| Other derivatives(4) | | | | | | $ | 1 | | | $ | — | | | $ | — | | | $ | 1 | | | $ | — | |
| | | | |
| | | $ | 1 | | | $ | — | | | $ | — | | | $ | 1 | | | $ | — | |
| | | | |
| | | | |
| GLOBAL EQUITY FUND | | GROSS AMOUNTS PRESENTED IN THE
STATEMENT OF ASSETS AND LIABILITIES | | | COLLATERAL PLEDGED | | | NET AMOUNT
RECEIVABLE
IN THE EVENT OF DEFAULT | | | NET AMOUNT
PAYABLE IN
THE EVENT OF DEFAULT | |
| Counterparty | | | | | ASSETS | | | LIABILITIES | | | | |
| Brown Brothers Harriman & Company | | | ISDA | | | $ | — | | | $ | 332,618 | | | $ | — | | | $ | — | | | $ | 332,618 | |
| Northern Trust Company | | | ISDA | | | | 6,946 | | | | — | | | | — | | | | 6,946 | | | | — | |
| | | | |
| | | $ | 6,946 | | | $ | 332,618 | | | $ | — | | | $ | 6,946 | | | $ | 332,618 | |
| | | | |
| | | | |
| GROWTH AND INCOME FUND | | GROSS AMOUNTS PRESENTED IN THE
STATEMENT OF ASSETS AND LIABILITIES | | | COLLATERAL PLEDGED | | | NET AMOUNT
RECEIVABLE
IN THE EVENT OF DEFAULT | | | NET AMOUNT
PAYABLE IN
THE EVENT OF DEFAULT | |
| Counterparty | | | | | ASSETS | | | LIABILITIES | | | | |
| Northern Trust Company | | | ISDA | | | $ | 53,397 | | | $ | — | | | $ | — | | | $ | 53,397 | | | $ | — | |
| | | | |
| | | $ | 53,397 | | | $ | — | | | $ | — | | | $ | 53,397 | | | $ | — | |
| | | | |
Notes to Financial Statements (Unaudited)
| | | | | | | | | | | | | | | | | | | | | | | | |
| | | GROSS AMOUNTS NOT OFFSET
IN THE STATEMENT OF ASSETS AND LIABILITIES | |
| | | | |
GLOBAL GROWTH AND INCOME
FUND | | GROSS AMOUNTS PRESENTED IN THE
STATEMENT OF ASSETS AND LIABILITIES | | | COLLATERAL PLEDGED | | | NET AMOUNT
RECEIVABLE
IN THE EVENT OF DEFAULT | | | NET AMOUNT
PAYABLE IN
THE EVENT OF DEFAULT | |
| Counterparty | | | | | ASSETS | | | LIABILITIES | | | | |
| Brown Brothers Harriman & Company | | | ISDA | | | $ | — | | | $ | 336,236 | | | $ | — | | | $ | — | | | $ | 336,236 | |
| Northern Trust Company | | | ISDA | | | | 15,625 | | | | — | | | | — | | | | 15,625 | | | | — | |
| | | | |
| | | $ | 15,625 | | | $ | 336,236 | | | $ | — | | | $ | 15,625 | | | $ | 336,236 | |
| | | | |
| | | | |
| CONVERTIBLE FUND | | GROSS AMOUNTS PRESENTED IN THE
STATEMENT OF ASSETS AND LIABILITIES | | | COLLATERAL PLEDGED | | | NET AMOUNT
RECEIVABLE
IN THE EVENT OF DEFAULT | | | NET AMOUNT
PAYABLE IN
THE EVENT OF DEFAULT | |
| Counterparty | | | | | ASSETS | | | LIABILITIES | | | | |
| Citibank N.A. | | | ISDA | | | $ | — | | | $ | 834,907 | | | $ | — | | | $ | — | | | $ | 834,907 | |
| Northern Trust Company | | | ISDA | | | | 30,378 | | | | — | | | | — | | | | 30,378 | | | | — | |
| | | | |
| | | $ | 30,378 | | | $ | 834,907 | | | $ | — | | | $ | 30,378 | | | $ | 834,907 | |
| | | | |
For the period ended April 30, 2015, the volume of derivative activity for the Funds is reflected below:*
| | | | | | | | | | | | |
| |
| | | DERIVATIVE TYPE | |
| | | FORWARD CONTRACTS FAIR VALUE(1) | | | OPTION PURCHASED FAIR VALUE(2) | | | OPTIONS WRITTEN FAIR VALUE(3) | |
| Growth Fund | | | 301,174,050 | | | | — | | | | 2,270 | |
| Opportunistic Value Fund | | | — | | | | 5,375 | | | | 36 | |
| Focus Growth Fund | | | 8,675,780 | | | | 597 | | | | 1,289 | |
| Dividend Growth Fund | | | — | | | | 2,005 | | | | 20 | |
| Mid Cap Growth Fund | | | 3,581,819 | | | | — | | | | 31 | |
| International Growth Fund | | | 242,914,181 | | | | 3,006 | | | | — | |
| Evolving World Growth Fund | | | 278,294,625 | | | | 6,419 | | | | — | |
| Emerging Market Equity Fund | | | — | | | | 206 | | | | — | |
| Global Equity Fund | | | 29,771,203 | | | | 1,228 | | | | — | |
| Growth and Income Fund | | | 53,076,116 | | | | — | | | | — | |
| Global Growth and Income Fund | | | 38,851,628 | | | | 18,096 | | | | — | |
| Convertible Fund | | | 43,059,318 | | | | 34,430 | | | | 2,110 | |
| Global Convertible Fund | | | — | | | | 549 | | | | — | |
| Market Neutral Income Fund | | | — | | | | 72,585 | | | | 79,146 | |
| Hedged Equity Fund | | | — | | | | 243 | | | | 167 | |
| Long/Short Fund | | | — | | | | 13,811 | | | | 10,598 | |
| * | Activity during the period is measured by opened number of contracts for options purchased or written and opened forward foreign currency contracts (measured in notional). |
| (1) | Generally, the Statement of Assets and Liabilities location for Forward foreign currency contracts is Unrealized appreciation on forward foreign currency contracts for asset derivatives and Unrealized depreciation on forward foreign currency contracts for liability derivatives. |
| (2) | Generally, the Statement of Assets and Liabilities location for Options purchased is Investments in securities, at value. |
| (3) | Generally, the Statement of Assets and Liabilities location for Options written is Options written, at value. |
| (4) | Other derivatives are not subject to a master netting agreement which include forward foreign currency contracts. |
Note 7 – Securities Lending
The Funds may loan one or more of their securities to broker-dealers and banks. Any such loan must be secured by collateral in cash or cash equivalents maintained on a current basis in an amount at least equal to the value of the securities loaned by the Funds. The Funds continue to receive the equivalent of the interest or dividends paid by the issuer on the securities loaned and also receive an additional return that may be in the form of a fixed fee or a percentage of the collateral. Upon receipt of cash or cash equivalent collateral, the Funds’ securities lending agent invests the collateral into short term investments following investment guidelines approved by Calamos Advisors. The Funds record the investment of collateral as an asset and the value of the collateral as a liability on the Statements of Assets and Liabilities. If the value of the invested collateral declines below the value of the collateral deposited
| | | | |
| 166 | | CALAMOS OPEN-END FAMILY OF FUNDS SEMIANNUAL REPORT | | |
Notes to Financial Statements (Unaudited)
by the borrower, the Funds will record unrealized depreciation equal to the decline in value of the invested collateral. The Funds may pay reasonable fees to persons unaffiliated with the Funds for services in arranging these loans. The Funds have the right to call a loan and obtain the securities loaned at any time. The Funds do not have the right to vote the securities during the existence of the loan but could call the loan in an attempt to permit voting of the securities in certain circumstances. Upon return of the securities loaned, the cash or cash equivalent collateral will be returned to the borrower. In the event of bankruptcy or other default of the borrower, the Funds could experience both delays in liquidating the loan collateral or recovering the loaned securities and losses, including (a) possible decline in the value of the collateral or in the value of the securities loaned during the period while the Funds seek to enforce its rights thereto, (b) possible subnormal levels of income and lack of access to income during this period, and (c) the expenses of enforcing their rights. In an effort to reduce these risks, the Funds’ security lending agent monitors and reports to Calamos Advisors on the creditworthiness of the firms to which a Fund lends securities.
At April 30, 2015, securities were on loan for the Funds below:
| | | | | | | | |
| Fund | | Value of securities
on loan to broker-dealers and
banks | | | Amount of collateral held in short
term investments and the
corresponding liability | |
| Growth Fund | | $ | 85,095,046 | | | $ | 89,233,375 | |
| Opportunistic Value Fund | | | 72,996 | | | | 74,800 | |
| Focus Growth Fund | | | 1,072,100 | | | | 1,140,000 | |
| Discovery Growth Fund | | | 1,497,587 | | | | 1,585,600 | |
| Dividend Growth Fund | | | — | | | | — | |
| Mid Cap Growth Fund | | | 101,913 | | | | 100,050 | |
| International Growth Fund | | | 35,125,310 | | | | 29,256,970 | |
| Evolving World Growth Fund | | | 9,236,220 | | | | 5,016,209 | |
| Emerging Market Equity Fund | | | 90,484 | | | | 97,500 | |
| Global Equity Fund | | | 4,961,255 | | | | 5,228,351 | |
| Growth and Income Fund | | | 64,605,438 | | | | 66,137,705 | |
| Global Growth and Income Fund | | | 12,721,291 | | | | 13,194,745 | |
| Convertible Fund | | | 78,493,025 | | | | 80,599,565 | |
| Global Convertible Fund | | | — | | | | — | |
| Total Return Bond Fund | | | 1,104,160 | | | | 1,132,038 | |
| High Income Fund | | | 10,748,563 | | | | 11,199,445 | |
| Market Neutral Income Fund | | | 116,862,138 | | | | 120,143,087 | |
| Hedged Equity Income Fund | | | — | | | | — | |
| Long/Short Fund | | | 386,122 | | | | 392,800 | |
Note 8 – Fair Value Measurement
Various inputs are used to determine the value of the Funds’ investments. These inputs are categorized into three broad levels as follows:
| | • | | Level 1 – Prices are determined using inputs from unadjusted quoted prices from active markets (including securities actively traded on a securities exchange) for identical assets. |
| | • | | Level 2 – Prices are determined using significant observable market inputs other than unadjusted quoted prices, including quoted prices of similar securities, fair value adjustments to quoted foreign securities, interest rates, credit risk, prepayment speeds, and other relevant data. |
| | • | | Level 3 – Prices reflect unobservable market inputs (including the Funds’ own judgments about assumptions market participants would use in determining fair value) when observable inputs are unavailable. |
Debt securities are valued based upon evaluated prices received from an independent pricing service or from a dealer or broker who makes markets in such securities. Pricing services utilize various observable market data and as such, debt securities are generally categorized as Level 2. The levels are not necessarily an indication of the risk or liquidity of the Fund’s investments. Transfers between the levels for investment securities or other financial instruments are measured at the end of the reporting period.
Notes to Financial Statements (Unaudited)
The following is a summary of the inputs used in valuing the Funds’ holdings at fair value:
| | | | | | | | | | | | | | | | |
| |
| | | GROWTH FUND | |
| | | LEVEL 1 | | | LEVEL 2 | | | LEVEL 3 | | | TOTAL | |
| Assets: | | | | | | | | | | | | | | | | |
Common Stocks U.S. | | $ | 2,935,421,376 | | | $ | — | | | $ | — | | | $ | 2,935,421,376 | |
Common Stocks Foreign | | | — | | | | 16,779,410 | | | | — | | | | 16,779,410 | |
Short Term Investment | | | 238,503,185 | | | | — | | | | — | | | | 238,503,185 | |
Investment of Cash Collateral For Securities Loaned | | | 40,930,458 | | | | 48,302,917 | | | | — | | | | 89,233,375 | |
Forward Foreign Currency Contracts | | | — | | | | 1,408 | | | | — | | | | 1,408 | |
| | | | |
Total | | $ | 3,214,855,019 | | | $ | 65,083,735 | | | $ | — | | | $ | 3,279,938,754 | |
| | | | |
| Liabilities: | | | | | | | | | | | | | | | | |
Collateral For Securities Loaned | | $ | — | | | $ | 89,233,375 | | | $ | — | | | $ | 89,233,375 | |
Forward Foreign Currency Contracts | | | — | | | | 931,477 | | | | — | | | | 931,477 | |
| | | | |
Total | | $ | — | | | $ | 90,164,852 | | | $ | — | | | $ | 90,164,852 | |
| | | | |
| |
| | | OPPORTUNISTIC VALUE FUND | |
| | | LEVEL 1 | | | LEVEL 2 | | | LEVEL 3 | | | TOTAL | |
| Assets: | | | | | | | | | | | | | | | | |
Common Stocks U.S. | | $ | 73,786,388 | | | $ | — | | | $ | — | | | $ | 73,786,388 | |
Short Term Investment | | | 811,324 | | | | — | | | | — | | | | 811,324 | |
Investment of Cash Collateral For Securities Loaned | | | 34,310 | | | | 40,490 | | | | — | | | | 74,800 | |
| | | | |
Total | | $ | 74,632,022 | | | $ | 40,490 | | | $ | — | | | $ | 74,672,512 | |
| | | | |
| Liabilities: | | | | | | | | | | | | | | | | |
Collateral For Securities Loaned | | $ | — | | | $ | 74,800 | | | $ | — | | | $ | 74,800 | |
| | | | |
Total | | $ | — | | | $ | 74,800 | | | $ | — | | | $ | 74,800 | |
| | | | |
| |
| | | FOCUS GROWTH FUND | |
| | | LEVEL 1 | | | LEVEL 2 | | | LEVEL 3 | | | TOTAL | |
| Assets: | | | | | | | | | | | | | | | | |
Common Stocks U.S. | | $ | 63,483,744 | | | $ | — | | | $ | — | | | $ | 63,483,744 | |
Short Term Investment | | | 1,633,029 | | | | — | | | | — | | | | 1,633,029 | |
Investment of Cash Collateral For Securities Loaned | | | 522,907 | | | | 617,093 | | | | — | | | | 1,140,000 | |
Forward Foreign Currency Contracts | | | — | | | | 1 | | | | — | | | | 1 | |
| | | | |
Total | | $ | 65,639,680 | | | $ | 617,094 | | | $ | — | | | $ | 66,256,774 | |
| | | | |
| Liabilities: | | | | | | | | | | | | | | | | |
Collateral For Securities Loaned | | $ | — | | | $ | 1,140,000 | | | $ | — | | | $ | 1,140,000 | |
Forward Foreign Currency Contracts | | | — | | | | 425 | | | | — | | | | 425 | |
| | | | |
| Total | | $ | — | | | $ | 1,140,425 | | | $ | — | | | $ | 1,140,425 | |
| | | | |
| | | | |
| 168 | | CALAMOS OPEN-END FAMILY OF FUNDS SEMIANNUAL REPORT | | |
Notes to Financial Statements (Unaudited)
| | | | | | | | | | | | | | | | |
| |
| | | DISCOVERY GROWTH FUND | |
| | | LEVEL 1 | | | LEVEL 2 | | | LEVEL 3 | | | TOTAL | |
| Assets: | | | | | | | | | | | | | | | | |
Common Stocks U.S. | | $ | 44,070,296 | | | $ | — | | | $ | — | | | $ | 44,070,296 | |
Short Term Investment | | | 4,654,869 | | | | — | | | | — | | | | 4,654,869 | |
Investment of Cash Collateral For Securities Loaned | | | 727,299 | | | | 858,301 | | | | — | | | | 1,585,600 | |
| | | | |
Total | | $ | 49,452,464 | | | $ | 858,301 | | | $ | — | | | $ | 50,310,765 | |
| | | | |
| Liabilities: | | | | | | | | | | | | | | | | |
Collateral For Securities Loaned | | $ | — | | | $ | 1,585,600 | | | $ | — | | | $ | 1,585,600 | |
| | | | |
Total | | $ | — | | | $ | 1,585,600 | | | $ | — | | | $ | 1,585,600 | |
| | | | |
| |
| | | DIVIDEND GROWTH FUND | |
| | | LEVEL 1 | | | LEVEL 2 | | | LEVEL 3 | | | TOTAL | |
| Assets: | | | | | | | | | | | | | | | | |
Common Stocks U.S. | | $ | 30,880,084 | | | $ | — | | | $ | — | | | $ | 30,880,084 | |
Short Term Investment | | | 1,630,512 | | | | — | | | | — | | | | 1,630,512 | |
| | | | |
Total | | $ | 32,510,596 | | | $ | — | | | $ | — | | | $ | 32,510,596 | |
| | | | |
| |
| | | MID CAP GROWTH FUND | |
| | | LEVEL 1 | | | LEVEL 2 | | | LEVEL 3 | | | TOTAL | |
| Assets: | | | | | | | | | | | | | | | | |
Common Stocks U.S. | | $ | 36,114,986 | | | $ | — | | | $ | — | | | $ | 36,114,986 | |
Common Stocks Foreign | | | 313,634 | | | | — | | | | — | | | | 313,634 | |
Short Term Investment | | | 3,628,818 | | | | — | | | | — | | | | 3,628,818 | |
Investment of Cash Collateral For Securities Loaned | | | 45,892 | | | | 54,158 | | | | — | | | | 100,050 | |
| | | | |
Total | | $ | 40,103,330 | | | $ | 54,158 | | | $ | — | | | $ | 40,157,488 | |
| | | | |
| Liabilities: | | | | | | | | | | | | | | | | |
Collateral For Securities Loaned | | $ | — | | | $ | 100,050 | | | $ | — | | | $ | 100,050 | |
Forward Foreign Currency Contracts | | | — | | | | 4,169 | | | | — | | | | 4,169 | |
| | | | |
Total | | $ | — | | | $ | 104,219 | | | $ | — | | | $ | 104,219 | |
| | | | |
| |
| | | INTERNATIONAL GROWTH FUND | |
| | | LEVEL 1 | | | LEVEL 2 | | | LEVEL 3 | | | TOTAL | |
| Assets: | | | | | | | | | | | | | | | | |
Common Stocks Foreign | | $ | 42,142,026 | | | $ | 601,765,251 | | | $ | — | | | $ | 643,907,277 | |
Common Stocks U.S. | | | 32,448,784 | | | | — | | | | — | | | | 32,448,784 | |
Short Term Investment | | | 16,209,024 | | | | — | | | | — | | | | 16,209,024 | |
Investment of Cash Collateral For Securities Loaned | | | 13,419,880 | | | | 15,837,090 | | | | — | | | | 29,256,970 | |
Forward Foreign Currency Contracts | | | — | | | | 28,594 | | | | — | | | | 28,594 | |
| | | | |
Total | | $ | 104,219,714 | | | $ | 617,630,935 | | | $ | — | | | $ | 721,850,649 | |
| | | | |
| Liabilities: | | | | | | | | | | | | | | | | |
Collateral For Securities Loaned | | $ | — | | | $ | 29,256,970 | | | $ | — | | | $ | 29,256,970 | |
Forward Foreign Currency Contracts | | | — | | | | 2,045,142 | | | | — | | | | 2,045,142 | |
| | | | |
Total | | $ | — | | | $ | 31,302,112 | | | $ | — | | | $ | 31,302,112 | |
| | | | |
Notes to Financial Statements (Unaudited)
| | | | | | | | | | | | | | | | |
| | | INTERNATIONAL GROWTH FUND | |
| | | TRANSFERS
IN TO
LEVEL 1* | | | TRANSFERS
OUT OF
LEVEL 1** | | | TRANSFERS IN TO LEVEL 2** | | | TRANSFERS
OUT OF
LEVEL 2* | |
| Investments at Value: | | | | | | | | | | | | | | | | |
Common Stock Foreign | | $ | 6,550,456 | | | $ | 4,255,865 | | | $ | 4,255,865 | | | $ | 6,550,456 | |
| | | | |
Total | | $ | 6,550,456 | | | $ | 4,255,865 | | | $ | 4,255,865 | | | $ | 6,550,456 | |
| | | | |
| * | Transfers from Level 2 to Level 1 were due to the availability of an applied factor utilizing a systematic fair valuation model on securities that trade on European and Far Eastern exchanges. |
| ** | Transfers from Level 1 to Level 2 were due to the availability of an applied factor utilizing a systematic fair valuation model on securities that trade on European and Far Eastern exchanges. |
| | | | | | | | | | | | | | | | |
| |
| | | EVOLVING WORLD GROWTH FUND | |
| | | LEVEL 1 | | | LEVEL 2 | | | LEVEL 3 | | | TOTAL | |
| Assets: | | | | | | | | | | | | | | | | |
Convertible Bonds | | $ | — | | | $ | 106,070,254 | | | $ | — | | | $ | 106,070,254 | |
Common Stocks Foreign | | | 87,460,022 | | | | 362,085,668 | | | | — | | | | 449,545,690 | |
Common Stocks U.S. | | | 35,861,689 | | | | — | | | | — | | | | 35,861,689 | |
Rights | | | — | | | | 4,601,585 | | | | — | | | | 4,601,585 | |
Short Term Investment | | | 11,764,356 | | | | — | | | | — | | | | 11,764,356 | |
Investment of Cash Collateral For Securities Loaned | | | 2,300,885 | | | | 2,715,324 | | | | — | | | | 5,016,209 | |
Forward Foreign Currency Contracts | | | — | | | | 65,208 | | | | — | | | | 65,208 | |
| | | | |
Total | | $ | 137,386,952 | | | $ | 475,538,039 | | | $ | — | | | $ | 612,924,991 | |
| | | | |
| Liabilities: | | | | | | | | | | | | | | | | |
Collateral For Securities Loaned | | $ | — | | | $ | 5,016,209 | | | $ | — | | | $ | 5,016,209 | |
Forward Foreign Currency Contracts | | | — | | | | 1,041,079 | | | | — | | | | 1,041,079 | |
| | | | |
Total | | $ | — | | | $ | 6,057,288 | | | $ | — | | | $ | 6,057,288 | |
| | | | |
| | | | |
| | | TRANSFERS IN
TO LEVEL 1* | | | TRANSFERS OUT
OF LEVEL 1** | | | TRANSFERS IN
TO LEVEL 2** | | | TRANSFERS OUT
OF LEVEL 2* | |
| Investments at Value: | | | | | | | | | | | | | | | | |
Common Stock Foreign | | $ | 14,302,481 | | | $ | 8,279,586 | | | $ | 8,279,586 | | | $ | 14,302,481 | |
| | | | |
Total | | $ | 14,302,481 | | | $ | 8,279,586 | | | $ | 8,279,586 | | | $ | 14,302,481 | |
| | | | |
| * | Transfers from Level 2 to Level 1 were due to the availability of an applied factor utilizing a systematic fair valuation model on securities that trade on European and Far Eastern exchanges. |
| ** | Transfers from Level 1 to Level 2 were due to the availability of an applied factor utilizing a systematic fair valuation model on securities that trade on European and Far Eastern exchanges. |
| | | | | | | | | | | | | | | | |
| |
| | | EMERGING MARKET EQUITY FUND | |
| | | LEVEL 1 | | | LEVEL 2 | | | LEVEL 3 | | | TOTAL | |
| Assets: | | | | | | | | | | | | | | | | |
Common Stocks Foreign | | $ | 3,205,367 | | | $ | 11,376,276 | | | $ | — | | | $ | 14,581,643 | |
Common Stocks U.S. | | | 3,296,184 | | | | | | | | — | | | | 3,296,184 | |
Short Term Investment | | | 677,275 | | | | — | | | | — | | | | 677,275 | |
Investment of Cash Collateral For Securities Loaned | | | 44,722 | | | | 52,778 | | | | — | | | | 97,500 | |
Forward Foreign Currency Contracts | | | — | | | | 1 | | | | — | | | | 1 | |
| | | | |
Total | | $ | 7,223,548 | | | $ | 11,429,055 | | | $ | — | | | $ | 18,652,603 | |
| | | | |
| Liabilities: | | | | | | | | | | | | | | | | |
Collateral For Securities Loaned | | $ | — | | | $ | 97,500 | | | $ | — | | | $ | 97,500 | |
| | | | |
Total | | $ | — | | | $ | 97,500 | | | $ | — | | | $ | 97,500 | |
| | | | |
| | | | |
| 170 | | CALAMOS OPEN-END FAMILY OF FUNDS SEMIANNUAL REPORT | | |
Notes to Financial Statements (Unaudited)
| | | | | | | | | | | | | | | | |
| | | EMERGING MARKET EQUITY FUND | |
| | | TRANSFERS IN
TO LEVEL 1 | | | TRANSFERS OUT
OF LEVEL 1* | | | TRANSFERS IN
TO LEVEL 2* | | | TRANSFERS OUT
OF LEVEL 2 | |
| Investments at Value: | | | | | | | | | | | | | | | | |
Common Stock Foreign | | $ | — | | | $ | 79,569 | | | $ | 79,569 | | | $ | — | |
| | | | |
Total | | $ | — | | | $ | 79,569 | | | $ | 79,569 | | | $ | — | |
| | | | |
| * | Transfer from Level 1 to Level 2 was due to the availability of an applied factor utilizing a systematic fair valuation model on securities that trade on European and Far Eastern exchanges. |
| | | | | | | | | | | | | | | | |
| |
| | | GLOBAL EQUITY FUND | |
| | | LEVEL 1 | | | LEVEL 2 | | | LEVEL 3 | | | TOTAL | |
| Assets: | | | | | | | | | | | | | | | | |
Common Stocks U.S. | | $ | 103,080,360 | | | $ | — | | | $ | — | | | $ | 103,080,360 | |
Common Stocks Foreign | | | 5,568,348 | | | | 96,981,549 | | | | — | | | | 102,549,897 | |
Short Term Investment | | | 4,005,916 | | | | — | | | | — | | | | 4,005,916 | |
Investment of Cash Collateral For Securities Loaned | | | — | | | | 5,228,351 | | | | — | | | | 5,228,351 | |
Forward Foreign Currency Contracts | | | — | | | | 6,946 | | | | — | | | | 6,946 | |
| | | | |
Total | | $ | 112,654,624 | | | $ | 102,216,846 | | | $ | — | | | $ | 214,871,470 | |
| | | | |
| Liabilities: | | | | | | | | | | | | | | | | |
Collateral For Securities Loaned | | $ | — | | | $ | 5,228,351 | | | $ | — | | | $ | 5,228,351 | |
Forward Foreign Currency Contracts | | | — | | | | 332,618 | | | | — | | | | 332,618 | |
| | | | |
Total | | $ | — | | | $ | 5,560,969 | | | $ | — | | | $ | 5,560,969 | |
| | | | |
| |
| | | GROWTH AND INCOME FUND | |
| | | LEVEL 1 | | | LEVEL 2 | | | LEVEL 3 | | | TOTAL | |
| Assets: | | | | | | | | | | | | | | | | |
Convertible Bonds | | $ | — | | | $ | 596,504,965 | | | $ | — | | | $ | 596,504,965 | |
Corporate Bonds | | | — | | | | 188,522,808 | | | | — | | | | 188,522,808 | |
Convertible Preferred Stocks | | | 195,713,400 | | | | 71,777,010 | | | | — | | | | 267,490,410 | |
Common Stocks U.S. | | | 1,632,817,411 | | | | — | | | | — | | | | 1,632,817,411 | |
Short Term Investment | | | 104,036,048 | | | | — | | | | — | | | | 104,036,048 | |
Investment of Cash Collateral For Securities Loaned | | | 30,336,705 | | | | 35,801,000 | | | | — | | | | 66,137,705 | |
Forward Foreign Currency Contracts | | | — | | | | 53,397 | | | | — | | | | 53,397 | |
| | | | |
Total | | $ | 1,962,903,564 | | | $ | 892,659,180 | | | $ | — | | | $ | 2,855,562,744 | |
| | | | |
| Liabilities: | | | | | | | | | | | | | | | | |
Collateral For Securities Loaned | | $ | — | | | $ | 66,137,705 | | | $ | — | | | $ | 66,137,705 | |
| | | | |
Total | | $ | — | | | $ | 66,137,705 | | | $ | — | | | $ | 66,137,705 | |
| | | | |
Notes to Financial Statements (Unaudited)
| | | | | | | | | | | | | | | | |
| |
| | | GLOBAL GROWTH AND INCOME FUND | |
| | | LEVEL 1 | | | LEVEL 2 | | | LEVEL 3 | | | TOTAL | |
| Assets: | | | | | | | | | | | | | | | | |
Convertible Bonds | | $ | — | | | $ | 157,595,621 | | | $ | — | | | $ | 157,595,621 | |
Synthetic Convertible Securities (Corporate Bonds) | | | — | | | | 18,076,683 | | | | — | | | | 18,076,683 | |
Synthetic Convertible Securities (Purchased Options) | | | 2,635,809 | | | | — | | | | — | | | | 2,635,809 | |
Convertible Preferred Stocks | | | 14,783,105 | | | | 5,709,440 | | | | — | | | | 20,492,545 | |
Common Stocks U.S. | | | 97,482,940 | | | | — | | | | — | | | | 97,482,940 | |
Common Stocks Foreign | | | 3,826,921 | | | | 105,653,162 | | | | — | | | | 109,480,083 | |
Short Term Investment | | | 10,815,796 | | | | — | | | | — | | | | 10,815,796 | |
Investment of Cash Collateral For Securities Loaned | | | 6,052,298 | | | | 7,142,447 | | | | — | | | | 13,194,745 | |
Forward Foreign Currency Contracts | | | — | | | | 15,625 | | | | — | | | | 15,625 | |
| | | | |
Total | | $ | 135,596,869 | | | $ | 294,192,978 | | | $ | — | | | $ | 429,789,847 | |
| | | | |
| Liabilities: | | | | | | | | | | | | | | | | |
Collateral For Securities Loaned | | $ | — | | | $ | 13,194,745 | | | $ | — | | | $ | 13,194,745 | |
Forward Foreign Currency Contracts | | | — | | | | 336,236 | | | | — | | | | 336,236 | |
| | | | |
Total | | $ | — | | | $ | 13,530,981 | | | $ | — | | | $ | 13,530,981 | |
| | | | |
| |
| | | CONVERTIBLE FUND | |
| | | LEVEL 1 | | | LEVEL 2 | | | LEVEL 3 | | | TOTAL | |
| Assets: | | | | | | | | | | | | | | | | |
Convertible Bonds | | $ | — | | | $ | 897,740,387 | | | $ | — | | | $ | 897,740,387 | |
Synthetic Convertible Securities (Corporate Bonds) | | | — | | | | 33,256,266 | | | | — | | | | 33,256,266 | |
Synthetic Convertible Securities (Purchased Options) | | | 7,831,425 | | | | — | | | | — | | | | 7,831,425 | |
Convertible Preferred Stocks | | | 251,847,635 | | | | 53,750,938 | | | | — | | | | 305,598,573 | |
Purchased Options | | | 978,300 | | | | — | | | | — | | | | 978,300 | |
Short Term Investment | | | 18,305,987 | | | | — | | | | — | | | | 18,305,987 | |
Investment of Cash Collateral For Securities Loaned | | | 36,970,216 | | | | 43,629,349 | | | | — | | | | 80,599,565 | |
Forward Foreign Currency Contracts | | | — | | | | 30,378 | | | | — | | | | 30,378 | |
| | | | |
Total | | $ | 315,933,563 | | | $ | 1,028,407,318 | | | $ | — | | | $ | 1,344,340,881 | |
| | | | |
| Liabilities: | | | | | | | | | | | | | | | | |
Collateral for Securities Loaned | | $ | — | | | $ | 80,599,565 | | | $ | — | | | $ | 80,599,565 | |
Written Option | | | 179,400 | | | | — | | | | — | | | | 179,400 | |
Forward Foreign Currency Contracts | | | — | | | | 834,907 | | | | — | | | | 834,907 | |
| | | | |
Total | | $ | 179,400 | | | $ | 81,434,472 | | | $ | — | | | $ | 81,613,872 | |
| | | | |
| |
| | | GLOBAL CONVERTIBLE FUND | |
| | | LEVEL 1 | | | LEVEL 2 | | | LEVEL 3 | | | TOTAL | |
| Assets: | | | | | | | | | | | | | | | | |
Convertible Bonds | | $ | — | | | $ | 6,460,516 | | | $ | — | | | $ | 6,460,516 | |
Synthetic Convertible Securities (Corporate Bonds) | | | — | | | | 675,899 | | | | — | | | | 675,899 | |
Synthetic Convertible Securities (Purchased Options) | | | 104,994 | | | | — | | | | — | | | | 104,994 | |
Convertible Preferred Stocks | | | 1,018,480 | | | | — | | | | — | | | | 1,018,480 | |
Common Stocks U.S. | | | 85,383 | | | | — | | | | — | | | | 85,383 | |
Short Term Investment | | | 691,197 | | | | — | | | | — | | | | 691,197 | |
| | | | |
Total | | $ | 1,900,054 | | | $ | 7,136,415 | | | $ | — | | | $ | 9,036,469 | |
| | | | |
| | | | |
| 172 | | CALAMOS OPEN-END FAMILY OF FUNDS SEMIANNUAL REPORT | | |
Notes to Financial Statements (Unaudited)
| | | | | | | | | | | | | | | | |
| |
| | | TOTAL RETURN BOND FUND | |
| | | LEVEL 1 | | | LEVEL 2 | | | LEVEL 3 | | | TOTAL | |
| Assets: | | | | | | | | | | | | | | | | |
Corporate Bonds | | $ | — | | | $ | 67,918,757 | | | $ | — | | | $ | 67,918,757 | |
U.S. Government and Agency Securities | | | — | | | | 6,804,116 | | | | — | | | | 6,804,116 | |
Short Term Investment | | | 481,236 | | | | — | | | | — | | | | 481,236 | |
Investment of Cash Collateral For Securities Loaned | | | 519,255 | | | | 612,783 | | | | — | | | | 1,132,038 | |
| | | | |
Total | | $ | 1,000,491 | | | $ | 75,335,656 | | | $ | — | | | $ | 76,336,147 | |
| | | | |
| Liabilities: | | | | | | | | | | | | | | | | |
Collateral For Securities Loaned | | $ | — | | | $ | 1,132,038 | | | $ | — | | | $ | 1,132,038 | |
| | | | |
Total | | $ | — | | | $ | 1,132,038 | | | $ | — | | | $ | 1,132,038 | |
| | | | |
| |
| | | HIGH INCOME FUND | |
| | | LEVEL 1 | | | LEVEL 2 | | | LEVEL 3 | | | TOTAL | |
| Assets: | | | | | | | | | | | | | | | | |
Corporate Bonds | | $ | — | | | $ | 136,373,750 | | | $ | — | | | $ | 136,373,750 | |
Convertible Bonds | | | — | | | | 1,143,956 | | | | — | | | | 1,143,956 | |
Convertible Preferred Stocks | | | 2,840,564 | | | | 990,000 | | | | — | | | | 3,830,564 | |
Investment of Cash Collateral For Securities Loaned | | | 5,137,074 | | | | 6,062,371 | | | | — | | | | 11,199,445 | |
Short Term Investment | | | 4,108,271 | | | | — | | | | — | | | | 4,108,271 | |
| | | | |
Total | | $ | 12,085,909 | | | $ | 144,570,077 | | | $ | — | | | $ | 156,655,986 | |
| | | | |
| Liabilities: | | | | | | | | | | | | | | | | |
Collateral For Securities Loaned | | $ | — | | | $ | 11,199,445 | | | $ | — | | | $ | 11,199,445 | |
| | | | |
Total | | $ | — | | | $ | 11,199,445 | | | $ | — | | | $ | 11,199,445 | |
| | | | |
| |
| | | MARKET NEUTRAL INCOME FUND | |
| | | LEVEL 1 | | | LEVEL 2 | | | LEVEL 3 | | | TOTAL | |
| Assets: | | | | | | | | | | | | | | | | |
Convertible Bonds | | $ | — | | | $ | 1,382,214,117 | | | $ | — | | | $ | 1,382,214,117 | |
Synthetic Convertible Securities (Corporate Bonds) | | | — | | | | 466,959,380 | | | | — | | | | 466,959,380 | |
Synthetic Convertible Securities (Purchased Options) | | | 908,998 | | | | — | | | | — | | | | 908,998 | |
Convertible Preferred Stocks | | | 87,312,963 | | | | 7,446,875 | | | | — | | | | 94,759,838 | |
Common Stocks U.S. | | | 1,902,803,089 | | | | 2,204,429 | | | | — | | | | 1,905,007,518 | |
Purchased Options | | | 17,509,063 | | | | — | | | | — | | | | 17,509,063 | |
Short Term Investment | | | 35,238,278 | | | | — | | | | — | | | | 35,238,278 | |
Investment of Cash Collateral For Securities Loaned | | | 55,108,435 | | | | 65,034,652 | | | | — | | | | 120,143,087 | |
| | | | |
Total | | $ | 2,098,880,826 | | | $ | 1,923,859,453 | | | $ | — | | | $ | 4,022,740,279 | |
| | | | |
| Liabilities: | | | | | | | | | | | | | | | | |
Collateral For Securities Loaned | | $ | — | | | $ | 120,143,087 | | | $ | — | | | $ | 120,143,087 | |
Common Stocks Sold Short U.S. | | | 880,472,932 | | | | — | | | | — | | | | 880,472,932 | |
Common Stocks Sold Short Foreign | | | 6,230,733 | | | | — | | | | — | | | | 6,230,733 | |
Exchange-Traded Funds Sold Short | | | 41,221,575 | | | | — | | | | — | | | | 41,221,575 | |
Written Options | | | 21,791,438 | | | | — | | | | — | | | | 21,791,438 | |
| | | | |
Total | | $ | 949,716,678 | | | $ | 120,143,087 | | | $ | — | | | $ | 1,069,859,765 | |
| | | | |
Notes to Financial Statements (Unaudited)
| | | | | | | | | | | | | | | | |
| | | MARKET NEUTRAL INCOME FUND | |
| | | TRANSFERS IN
TO LEVEL 1* | | | TRANSFERS OUT
OF LEVEL 1 | | | TRANSFERS IN TO LEVEL 2 | | | TRANSFERS OUT
OF LEVEL 2* | |
| Investments at Value: | | | | | | | | | | | | | | | | |
Common Stock Sold Short Foreign | | $ | (6,230,733 | ) | | $ | — | | | $ | — | | | $ | (6,230,733 | ) |
| | | | |
Total | | $ | (6,230,733 | ) | | $ | — | | | $ | — | | | $ | (6,230,733 | ) |
| | | | |
| * | Transfers from Level 2 to Level 1 were due to the availability of an applied factor utilizing a systematic fair valuation model on securities that trade on European and Far Eastern exchanges. |
| | | | | | | | | | | | | | | | |
| |
| | | HEDGED EQUITY INCOME FUND | |
| | | LEVEL 1 | | | LEVEL 2 | | | LEVEL 3 | | | TOTAL | |
| Assets: | | | | | | | | | | | | | | | | |
Common Stocks U.S. | | $ | 10,832,858 | | | $ | — | | | $ | — | | | $ | 10,832,858 | |
Exchange-Traded Funds | | | 198,094 | | | | — | | | | — | | | | 198,094 | |
Purchased Options | | | 40,175 | | | | — | | | | — | | | | 40,175 | |
Short Term Investment | | | 81,759 | | | | — | | | | — | | | | 81,759 | |
| | | | |
Total | | $ | 11,152,886 | | | $ | — | | | $ | — | | | $ | 11,152,886 | |
| | | | |
Liabilities: | | | | | | | | | | | | | | | | |
Written Options | | $ | 68,130 | | | $ | — | | | $ | — | | | $ | 68,130 | |
| | | | |
Total | | $ | 68,130 | | | $ | — | | | $ | — | | | $ | 68,130 | |
| | | | |
| |
| | | LONG/SHORT FUND | |
| | | LEVEL 1 | | | LEVEL 2 | | | LEVEL 3 | | | TOTAL | |
| Assets: | | | | | | | | | | | | | | | | |
Common Stocks U.S. | | $ | 68,364,956 | | | $ | 894,774 | | | $ | — | | | $ | 69,259,730 | |
Purchased Options | | | 149,620 | | | | — | | | | — | | | | 149,620 | |
Short Term Investment | | | 31,114,474 | | | | — | | | | — | | | | 31,114,474 | |
Investment of Cash Collateral For Securities Loaned | | | 180,173 | | | | 212,627 | | | | — | | | | 392,800 | |
| | | | |
Total | | $ | 99,809,223 | | | $ | 1,107,401 | | | $ | — | | | $ | 100,916,624 | |
| | | | |
Liabilities: | | | | | | | | | | | | | | | | |
Collateral For Securities Loaned | | $ | — | | | $ | 392,800 | | | $ | — | | | $ | 392,800 | |
Common Stocks Sold Short U.S. | | | 23,300,230 | | | | — | | | | — | | | | 23,300,230 | |
Common Stocks Sold Short Foreign | | | 2,659,914 | | | | — | | | | — | | | | 2,659,914 | |
Written Options | | | 337,927 | | | | — | | | | — | | | | 337,927 | |
| | | | |
Total | | $ | 26,298,071 | | | $ | 392,800 | | | $ | — | | | $ | 26,690,871 | |
| | | | |
| | | | |
| | | TRANSFERS IN
TO LEVEL 1* | | | TRANSFERS OUT
OF LEVEL 1** | | | TRANSFERS IN
TO LEVEL 2** | | | TRANSFERS OUT
OF LEVEL 2* | |
| Investments at Value: | | | | | | | | | | | | | | | | |
Common Stock U.S. | | $ | — | | | $ | 25,302 | | | $ | 25,302 | | | $ | — | |
Common Stock Sold Short Foreign | | | (2,659,914 | ) | | | — | | | | — | | | | (2,659,914 | ) |
| | | | |
Total | | $ | (2,659,914 | ) | | $ | 25,302 | | | $ | 25,302 | | | $ | (2,659,914 | ) |
| | | | |
| * | Transfers from Level 2 to Level 1 were due to the availability of an applied factor utilizing a systematic fair valuation model on securities that trade on European and Far Eastern exchanges. |
| ** | Transfers from Level 1 to Level 2 were due to the availability of an applied factor utilizing a systematic fair valuation model on securities that trade on European and Far Eastern exchanges. |
| | | | |
| 174 | | CALAMOS OPEN-END FAMILY OF FUNDS SEMIANNUAL REPORT | | |
Notes to Financial Statements (Unaudited)
Note 9 – Capital Share Transactions
The following table summarizes the activity in capital shares of the Funds:
| | | | | | | | | | | | | | | | | | | | | | | | |
| For the Fiscal Year or Period Ended April 30, 2015 | | | | | | | | | | | | | | | | | | |
| | | GROWTH FUND | | | OPPORTUNISTIC VALUE FUND | | | FOCUS GROWTH FUND | |
| Class A | | Shares | | | Dollars | | | Shares | | | Dollars | | | Shares | | | Dollars | |
| Shares sold | | | 1,938,810 | | | $ | 82,745,254 | | | | 100,297 | | | $ | 1,417,846 | | | | 144,694 | | | $ | 2,509,378 | |
| Shares issued as reinvestment of distributions | | | 7,699,312 | | | | 313,669,997 | | | | 288,966 | | | | 3,984,849 | | | | 102,952 | | | | 1,750,183 | |
| Less shares redeemed | | | (6,802,134 | ) | | | (296,536,792 | ) | | | (1,017,708 | ) | | | (14,314,860 | ) | | | (243,601 | ) | | | (4,262,765 | ) |
| | | | |
| Net increase (decrease) | | | 2,835,988 | | | $ | 99,878,459 | | | | (628,445 | ) | | $ | (8,912,165 | ) | | | 4,045 | | | $ | (3,204 | ) |
| | | | |
| | | | | | |
| Class B | | Shares | | | Dollars | | | Shares | | | Dollars | | | Shares | | | Dollars | |
| Shares sold* | | | 13,820 | | | $ | 535,177 | | | | 33 | | | $ | 424 | | | | 5,005 | | | $ | 79,265 | |
| Shares issued as reinvestment of distributions | | | 166,267 | | | | 6,374,662 | | | | 1,724 | | | | 22,066 | | | | 2,271 | | | | 35,880 | |
| Less shares redeemed | | | (280,651 | ) | | | (11,740,708 | ) | | | (6,175 | ) | | | (81,647 | ) | | | (7,357 | ) | | | (120,934 | ) |
| | | | |
| Net increase (decrease) | | | (100,564 | ) | | $ | (4,830,869 | ) | | | (4,418 | ) | | $ | (59,157 | ) | | | (81 | ) | | $ | (5,789 | ) |
| | | | |
| | | | | | |
| Class C | | Shares | | | Dollars | | | Shares | | | Dollars | | | Shares | | | Dollars | |
| Shares sold | | | 1,577,995 | | | $ | 51,271,995 | | | | 36,433 | | | $ | 465,661 | | | | 142,420 | | | $ | 2,295,571 | |
| Shares issued as reinvestment of distributions | | | 5,597,832 | | | | 179,578,429 | | | | 44,005 | | | | 555,342 | | | | 62,358 | | | | 985,892 | |
| Less shares redeemed | | | (4,315,094 | ) | | | (151,122,401 | ) | | | (230,540 | ) | | | (3,003,898 | ) | | | (125,715 | ) | | | (2,041,488 | ) |
| | | | |
| Net increase (decrease) | | | 2,860,733 | | | $ | 79,728,023 | | | | (150,102 | ) | | $ | (1,982,895 | ) | | | 79,063 | | | $ | 1,239,975 | |
| | | | |
| | | | | | |
| Class I | | Shares | | | Dollars | | | Shares | | | Dollars | | | Shares | | | Dollars | |
| Shares sold | | | 1,744,742 | | | $ | 93,459,199 | | | | 302,649 | | | $ | 4,288,580 | | | | 62,858 | | | $ | 1,098,000 | |
| Shares issued as reinvestment of distributions | | | 2,364,190 | | | | 114,166,718 | | | | 149,268 | | | | 2,106,173 | | | | 166,012 | | | | 2,853,725 | |
| Less shares redeemed | | | (4,011,406 | ) | | | (205,051,155 | ) | | | (1,015,520 | ) | | | (14,516,176 | ) | | | (63,956 | ) | | | (1,146,058 | ) |
| | | | |
| Net increase (decrease) | | | 97,526 | | | $ | 2,574,762 | | | | (563,603 | ) | | $ | (8,121,423 | ) | | | 164,914 | | | $ | 2,805,667 | |
| | | | |
| | | | | | |
| Class R | | Shares | | | Dollars | | | Shares | | | Dollars | | | Shares | | | Dollars | |
| Shares sold | | | 18,549 | | | $ | 774,406 | | | | 550 | | | $ | 8,151 | | | | 1,354 | | | $ | 23,048 | |
| Shares issued as reinvestment of distributions | | | 48,258 | | | | 1,897,525 | | | | 821 | | | | 11,210 | | | | 939 | | | | 15,742 | |
| Less shares redeemed | | | (28,389 | ) | | | (1,216,145 | ) | | | (1 | ) | | | (14 | ) | | | (80 | ) | | | (1,348 | ) |
| | | | |
| Net increase (decrease) | | | 38,418 | | | $ | 1,455,786 | | | | 1,370 | | | $ | 19,347 | | | | 2,213 | | | $ | 37,442 | |
| | | | |
| * | Class B shares continue to be outstanding but are no longer an offered class of shares. |
Notes to Financial Statements (Unaudited)
| | | | | | | | | | | | | | | | | | | | | | | | |
| | | DISCOVERY
GROWTH FUND | | | DIVIDEND
GROWTH FUND | | | MID CAP
GROWTH FUND | |
| Class A | | Shares | | | Dollars | | | Shares | | | Dollars | | | Shares | | | Dollars | |
| Shares sold | | | 130,278 | | | $ | 1,747,640 | | | | 211,051 | | | $ | 2,233,566 | | | | 81,172 | | | $ | 935,033 | |
| Shares issued as reinvestment of distributions | | | 208,175 | | | | 2,735,426 | | | | 65,271 | | | | 674,912 | | | | — | | | | — | |
| Less shares redeemed | | | (246,763 | ) | | | (3,381,211 | ) | | | (563,794 | ) | | | (5,915,026 | ) | | | (773,487 | ) | | | (8,976,391 | ) |
| | | | |
| Net increase (decrease) | | | 91,690 | | | $ | 1,101,855 | | | | (287,472 | ) | | $ | (3,006,548 | ) | | | (692,315 | ) | | $ | (8,041,358 | ) |
| | | | |
| | | | | | |
| Class B | | Shares | | | Dollars | | | Shares | | | Dollars | | | Shares | | | Dollars | |
| Shares sold* | | | — | | | $ | — | | | | — | | | $ | — | | | | — | | | $ | — | |
| Shares issued as reinvestment of distributions | | | 12,863 | | | | 162,339 | | | | — | | | | — | | | | — | | | | — | |
| Less shares redeemed | | | (977 | ) | | | (13,085 | ) | | | — | | | | — | | | | — | | | | — | |
| | | | |
| Net increase (decrease) | | | 11,886 | | | $ | 149,254 | | | | — | | | $ | — | | | | — | | | $ | — | |
| | | | |
| | | | | | |
| Class C | | Shares | | | Dollars | | | Shares | | | Dollars | | | Shares | | | Dollars | |
| Shares sold | | | 4,728 | | | $ | 61,634 | | | | 26,723 | | | $ | 279,828 | | | | 55,956 | | | $ | 623,198 | |
| Shares issued as reinvestment of distributions | | | 19,388 | | | | 244,677 | | | | 959 | | | | 9,882 | | | | — | | | | — | |
| Less shares redeemed | | | (7,210 | ) | | | (92,770 | ) | | | (3,920 | ) | | | (42,289 | ) | | | (43,847 | ) | | | (503,645 | ) |
| | | | |
| Net increase (decrease) | | | 16,906 | | | $ | 213,541 | | | | 23,762 | | | $ | 247,421 | | | | 12,109 | | | $ | 119,553 | |
| | | | |
| | | | | | |
| Class I | | Shares | | | Dollars | | | Shares | | | Dollars | | | Shares | | | Dollars | |
| Shares sold | | | 193,869 | | | $ | 2,655,609 | | | | 268,151 | | | $ | 2,799,682 | | | | 391,103 | | | $ | 4,647,737 | |
| Shares issued as reinvestment of distributions | | | 72,836 | | | | 970,172 | | | | 20,437 | | | | 211,519 | | | | — | | | | — | |
| Less shares redeemed | | | (191,095 | ) | | | (2,626,846 | ) | | | (371,532 | ) | | | (3,889,260 | ) | | | (527,642 | ) | | | (6,291,486 | ) |
| | | | |
| Net increase (decrease) | | | 75,610 | | | $ | 998,935 | | | | (82,944 | ) | | $ | (878,059 | ) | | | (136,539 | ) | | $ | (1,643,749 | ) |
| | | | |
| | | | | | |
| Class R | | Shares | | | Dollars | | | Shares | | | Dollars | | | Shares | | | Dollars | |
| Shares sold | | | — | | | $ | — | | | | — | | | $ | — | | | | — | | | $ | — | |
| Shares issued as reinvestment of distributions | | | 13,249 | | | | 171,966 | | | | 268 | | | | 2,766 | | | | — | | | | — | |
| Less shares redeemed | | | (199 | ) | | | (2,587 | ) | | | — | | | | — | | | | — | | | | — | |
| | | | |
| Net increase (decrease) | | | 13,050 | | | $ | 169,379 | | | | 268 | | | $ | 2,766 | | | | — | | | $ | — | |
| | | | |
| * | Class B shares continue to be outstanding but are no longer an offered class of shares. |
| | | | |
| 176 | | CALAMOS OPEN-END FAMILY OF FUNDS SEMIANNUAL REPORT | | |
Notes to Financial Statements (Unaudited)
| | | | | | | | | | | | | | | | | | | | | | | | |
| | | INTERNATIONAL
GROWTH FUND | | | EVOLVING WORLD
GROWTH FUND | | | EMERGING MARKET
EQUITY FUND | |
| Class A | | Shares | | | Dollars | | | Shares | | | Dollars | | | Shares | | | Dollars | |
| Shares sold | | | 1,697,471 | | | $ | 29,632,374 | | | | 1,548,274 | | | $ | 20,535,182 | | | | 352,909 | | | $ | 3,398,204 | |
| Shares issued as reinvestment of distributions | | | 1,335,539 | | | | 22,316,855 | | | | 284,910 | | | | 3,638,296 | | | | 4,508 | | | | 41,566 | |
| Less shares redeemed | | | (3,515,019 | ) | | | (62,127,470 | ) | | | (3,370,086 | ) | | | (44,366,186 | ) | | | (55,000 | ) | | | (519,474 | ) |
| | | | |
| Net increase (decrease) | | | (482,009 | ) | | $ | (10,178,241 | ) | | | (1,536,902 | ) | | $ | (20,192,708 | ) | | | 302,417 | | | $ | 2,920,296 | |
| | | | |
| | | | | | |
| Class B | | Shares | | | Dollars | | | Shares | | | Dollars | | | Shares | | | Dollars | |
| Shares sold* | | | 1,152 | | | $ | 18,186 | | | | 410 | | | $ | 5,463 | | | | — | | | $ | — | |
| Shares issued as reinvestment of distributions | | | 13,946 | | | | 218,110 | | | | 1,091 | | | | 13,442 | | | | — | | | | — | |
| Less shares redeemed | | | (47,909 | ) | | | (798,654 | ) | | | (11,385 | ) | | | (149,127 | ) | | | — | | | | — | |
| | | | |
| Net increase (decrease) | | | (32,811 | ) | | $ | (562,358 | ) | | | (9,884 | ) | | $ | (130,222 | ) | | | — | | | $ | — | |
| | | | |
| | | | | | |
| Class C | | Shares | | | Dollars | | | Shares | | | Dollars | | | Shares | | | Dollars | |
| Shares sold | | | 206,123 | | | $ | 3,370,042 | | | | 302,793 | | | $ | 3,886,056 | | | | 4,278 | | | $ | 40,947 | |
| Shares issued as reinvestment of distributions | | | 342,126 | | | | 5,344,015 | | | | 74,080 | | | | 913,410 | | | | — | | | | — | |
| Less shares redeemed | | | (720,239 | ) | | | (11,977,238 | ) | | | (506,600 | ) | | | (6,432,527 | ) | | | (1,335 | ) | | | (12,943 | ) |
| | | | |
| Net increase (decrease) | | | (171,990 | ) | | $ | (3,263,181 | ) | | | (129,727 | ) | | $ | (1,633,061 | ) | | | 2,943 | | | $ | 28,004 | |
| | | | |
| | | | | | |
| Class I | | Shares | | | Dollars | | | Shares | | | Dollars | | | Shares | | | Dollars | |
| Shares sold | | | 2,622,981 | | | $ | 46,522,946 | | | | 6,159,293 | | | $ | 82,061,329 | | | | 10,059 | | | $ | 94,117 | |
| Shares issued as reinvestment of distributions | | | 2,336,056 | | | | 39,572,790 | | | | 758,102 | | | | 9,726,453 | | | | 6,673 | | | | 61,523 | |
| Less shares redeemed | | | (5,016,540 | ) | | | (89,864,581 | ) | | | (8,516,306 | ) | | | (112,490,062 | ) | | | (26,305 | ) | | | (247,613 | ) |
| | | | |
| Net increase (decrease) | | | (57,503 | ) | | $ | (3,768,845 | ) | | | (1,598,911 | ) | | $ | (20,702,280 | ) | | | (9,573 | ) | | $ | (91,973 | ) |
| | | | |
| | | | | | |
| Class R | | Shares | | | Dollars | | | Shares | | | Dollars | | | Shares | | | Dollars | |
| Shares sold | | | 116,217 | | | $ | 2,041,369 | | | | 54,855 | | | $ | 718,106 | | | | — | | | $ | — | |
| Shares issued as reinvestment of distributions | | | 76,975 | | | | 1,265,465 | | | | 2,473 | | | | 31,360 | | | | 17 | | | | 156 | |
| Less shares redeemed | | | (215,226 | ) | | | (3,776,180 | ) | | | (25,754 | ) | | | (343,820 | ) | | | — | | | | — | |
| | | | |
| Net increase (decrease) | | | (22,034 | ) | | $ | (469,346 | ) | | | 31,574 | | | $ | 405,646 | | | | 17 | | | $ | 156 | |
| | | | |
| * | Class B shares continue to be outstanding but are no longer an offered class of shares. |
Notes to Financial Statements (Unaudited)
| | | | | | | | | | | | | | | | | | | | | | | | |
| | | GLOBAL EQUITY FUND | | | GROWTH AND
INCOME FUND | | | GLOBAL GROWTH AND
INCOME FUND | |
| Class A | | Shares | | | Dollars | | | Shares | | | Dollars | | | Shares | | | Dollars | |
| Shares sold | | | 591,420 | | | $ | 7,727,029 | | | | 1,791,145 | | | $ | 57,837,112 | | | | 692,719 | | | $ | 6,110,385 | |
| Shares issued as reinvestment of distributions | | | 1,222,600 | | | | 15,074,660 | | | | 4,217,060 | | | | 132,985,831 | | | | 2,591,794 | | | | 21,822,907 | |
| Less shares redeemed | | | (1,702,719 | ) | | | (22,662,798 | ) | | | (5,945,511 | ) | | | (193,026,582 | ) | | | (3,435,894 | ) | | | (30,765,793 | ) |
| | | | |
| Net increase (decrease) | | | 111,301 | | | $ | 138,891 | | | | 62,694 | | | $ | (2,203,639 | ) | | | (151,381 | ) | | $ | (2,832,501 | ) |
| | | | |
| | | | | | |
| Class B | | Shares | | | Dollars | | | Shares | | | Dollars | | | Shares | | | Dollars | |
| Shares sold* | | | 1,576 | | | $ | 19,712 | | | | 7,329 | | | $ | 276,869 | | | | 8,670 | | | $ | 78,842 | |
| Shares issued as reinvestment of distributions | | | 19,094 | | | | 223,214 | | | | 38,074 | | | | 1,425,273 | | | | 74,467 | | | | 640,419 | |
| Less shares redeemed | | | (43,126 | ) | | | (548,264 | ) | | | (173,481 | ) | | | (6,754,270 | ) | | | (190,475 | ) | | | (1,767,791 | ) |
| | | | |
| Net increase (decrease) | | | (22,456 | ) | | $ | (305,338 | ) | | | (128,078 | ) | | $ | (5,052,128 | ) | | | (107,338 | ) | | $ | (1,048,530 | ) |
| | | | |
| | | | | | |
| Class C | | Shares | | | Dollars | | | Shares | | | Dollars | | | Shares | | | Dollars | |
| Shares sold | | | 222,099 | | | $ | 2,693,978 | | | | 1,301,968 | | | $ | 41,735,071 | | | | 1,051,099 | | | $ | 8,267,523 | |
| Shares issued as reinvestment of distributions | | | 368,575 | | | | 4,297,586 | | | | 2,724,612 | | | | 86,309,740 | | | | 2,710,087 | | | | 20,948,975 | |
| Less shares redeemed | | | (561,039 | ) | | | (7,071,459 | ) | | | (3,115,564 | ) | | | (101,281,168 | ) | | | (3,194,939 | ) | | | (26,260,494 | ) |
| | | | |
| Net increase (decrease) | | | 29,635 | | | $ | (79,895 | ) | | | 911,016 | | | $ | 26,763,643 | | | | 566,247 | | | $ | 2,956,004 | |
| | | | |
| | | | | | |
| Class I | | Shares | | | Dollars | | | Shares | | | Dollars | | | Shares | | | Dollars | |
| Shares sold | | | 1,390,860 | | | $ | 18,474,650 | | | | 2,289,796 | | | $ | 71,972,158 | | | | 1,405,042 | | | $ | 12,586,879 | |
| Shares issued as reinvestment of distributions | | | 1,213,118 | | | | 15,139,713 | | | | 2,183,495 | | | | 66,787,087 | | | | 2,955,029 | | | | 25,442,796 | |
| Less shares redeemed | | | (1,660,798 | ) | | | (23,088,111 | ) | | | (4,471,094 | ) | | | (140,995,402 | ) | | | (4,482,813 | ) | | | (41,610,951 | ) |
| | | | |
| Net increase (decrease) | | | 943,180 | | | $ | 10,526,252 | | | | 2,197 | | | $ | (2,236,157 | ) | | | (122,742 | ) | | $ | (3,581,276 | ) |
| | | | |
| | | | | | |
| Class R | | Shares | | | Dollars | | | Shares | | | Dollars | | | Shares | | | Dollars | |
| Shares sold | | | 101,594 | | | $ | 1,328,136 | | | | 65,752 | | | $ | 2,139,820 | | | | 19,962 | | | $ | 173,608 | |
| Shares issued as reinvestment of distributions | | | 116,339 | | | | 1,405,379 | | | | 57,654 | | | | 1,805,360 | | | | 28,609 | | | | 238,597 | |
| Less shares redeemed | | | (142,928 | ) | | | (1,827,849 | ) | | | (121,473 | ) | | | (3,933,758 | ) | | | (38,482 | ) | | | (348,358 | ) |
| | | | |
| Net increase (decrease) | | | 75,005 | | | $ | 905,666 | | | | 1,933 | | | $ | 11,422 | | | | 10,089 | | | $ | 63,847 | |
| | | | |
| * | Class B shares continue to be outstanding but are no longer an offered class of shares. |
| | | | |
| 178 | | CALAMOS OPEN-END FAMILY OF FUNDS SEMIANNUAL REPORT | | |
Notes to Financial Statements (Unaudited)
| | | | | | | | | | | | | | | | | | | | | | | | |
| | | CONVERTIBLE FUND | | | GLOBAL CONVERTIBLE
FUND1 | | | TOTAL RETURN
BOND FUND | |
| Class A | | Shares | | | Dollars | | | Shares | | | Dollars | | | Shares | | | Dollars | |
| Shares sold | | | 4,421,689 | | | $ | 79,354,260 | | | | 453,017 | | | $ | 4,598,717 | | | | 649,535 | | | $ | 6,887,604 | |
| Shares issued as reinvestment of distributions | | | 1,464,348 | | | | 25,635,749 | | | | — | | | | — | | | | 132,067 | | | | 1,394,315 | |
| Less shares redeemed | | | (6,618,779 | ) | | | (118,053,407 | ) | | | (791 | ) | | | (8,240 | ) | | | (2,813,830 | ) | | | (29,888,799 | ) |
| | | | |
| Net increase (decrease) | | | (732,742 | ) | | $ | (13,063,398 | ) | | | 452,226 | | | $ | 4,590,477 | | | | (2,032,228 | ) | | $ | (21,606,880 | ) |
| | | | |
| | | | | | |
| Class B | | Shares | | | Dollars | | | Shares | | | Dollars | | | Shares | | | Dollars | |
| Shares sold* | | | 5,297 | | | $ | 117,532 | | | | — | | | $ | — | | | | 375 | | | $ | 3,957 | |
| Shares issued as reinvestment of distributions | | | 11,794 | | | | 261,695 | | | | — | | | | — | | | | 2,789 | | | | 29,409 | |
| Less shares redeemed | | | (96,375 | ) | | | (2,178,207 | ) | | | — | | | | — | | | | (52,286 | ) | | | (556,310 | ) |
| | | | |
| Net increase (decrease) | | | (79,284 | ) | | $ | (1,798,980 | ) | | | — | | | $ | — | | | | (49,122 | ) | | $ | (522,944 | ) |
| | | | |
| | | | | | |
| Class C | | Shares | | | Dollars | | | Shares | | | Dollars | | | Shares | | | Dollars | |
| Shares sold | | | 1,058,834 | | | $ | 18,635,994 | | | | 23,785 | | | $ | 242,250 | | | | 137,845 | | | $ | 1,464,869 | |
| Shares issued as reinvestment of distributions | | | 764,391 | | | | 13,267,429 | | | | — | | | | — | | | | 25,045 | | | | 264,096 | |
| Less shares redeemed | | | (2,133,345 | ) | | | (37,698,410 | ) | | | — | | | | — | | | | (227,745 | ) | | | (2,419,972 | ) |
| | | | |
| Net increase (decrease) | | | (310,120 | ) | | $ | (5,794,987 | ) | | | 23,785 | | | $ | 242,250 | | | | (64,855 | ) | | $ | (691,007 | ) |
| | | | |
| | | | | | |
| Class I | | Shares | | | Dollars | | | Shares | | | Dollars | | | Shares | | | Dollars | |
| Shares sold | | | 4,865,252 | | | $ | 79,116,823 | | | | 1,001,439 | | | $ | 10,343,067 | | | | 191,697 | | | $ | 2,037,151 | |
| Shares issued as reinvestment of distributions | | | 1,856,932 | | | | 29,604,332 | | | | — | | | | — | | | | 31,929 | | | | 337,347 | |
| Less shares redeemed | | | (8,710,591 | ) | | | (141,696,790 | ) | | | (198 | ) | | | (2,063 | ) | | | (255,334 | ) | | | (2,721,710 | ) |
| | | | |
| Net increase (decrease) | | | (1,988,407 | ) | | $ | (32,975,635 | ) | | | 1,001,241 | | | $ | 10,341,004 | | | | (31,708 | ) | | $ | (347,212 | ) |
| | | | |
| | | | | | |
| Class R | | Shares | | | Dollars | | | Shares | | | Dollars | | | Shares | | | Dollars | |
| Shares sold | | | 9,784 | | | $ | 174,364 | | | | 10,000 | | | $ | 100,000 | | | | 1,230 | | | $ | 13,052 | |
| Shares issued as reinvestment of distributions | | | 6,530 | | | | 113,962 | | | | — | | | | — | | | | 527 | | | | 5,562 | |
| Less shares redeemed | | | (49,757 | ) | | | (889,964 | ) | | | — | | | | — | | | | (1,778 | ) | | | (18,938 | ) |
| | | | |
| Net increase (decrease) | | | (33,443 | ) | | $ | (601,638 | ) | | | 10,000 | | | $ | 100,000 | | | | (21 | ) | | $ | (324 | ) |
| | | | |
| 1 | Global Convertible Fund commenced operations on December 31, 2014 |
| * | Class B shares continue to be outstanding but are no longer an offered class of shares. |
Notes to Financial Statements (Unaudited)
| | | | | | | | | | | | | | | | |
| | | HIGH INCOME FUND | | | MARKET NEUTRAL
INCOME FUND | |
| Class A | | Shares | | | Dollars | | | Shares | | | Dollars | |
| Shares sold | | | 4,159,390 | | | $ | 37,662,308 | | | | 12,115,114 | | | $ | 157,916,983 | |
| Shares issued as reinvestment of distributions | | | 538,275 | | | | 4,869,796 | | | | 1,461,097 | | | | 18,912,192 | |
| Less shares redeemed | | | (8,266,906 | ) | | | (76,012,306 | ) | | | (28,972,807 | ) | | | (378,411,536 | ) |
| | | | |
| Net increase (decrease) | | | (3,569,241 | ) | | $ | (33,480,202 | ) | | | (15,396,596 | ) | | $ | (201,582,361 | ) |
| | | | |
| | | | |
| Class B | | Shares | | | Dollars | | | Shares | | | Dollars | |
| Shares sold* | | | 905 | | | $ | 8,736 | | | | 666 | | | $ | 9,183 | |
| Shares issued as reinvestment of distributions | | | 7,648 | | | | 72,741 | | | | 2,483 | | | | 34,010 | |
| Less shares redeemed | | | (82,289 | ) | | | (796,764 | ) | | | (95,568 | ) | | | (1,317,137 | ) |
| | | | |
| Net increase (decrease) | | | (73,736 | ) | | $ | (715,287 | ) | | | (92,419 | ) | | $ | (1,273,944 | ) |
| | | | |
| | | | |
| Class C | | Shares | | | Dollars | | | Shares | | | Dollars | |
| Shares sold | | | 52,014 | | | $ | 496,901 | | | | 2,125,575 | | | $ | 28,132,523 | |
| Shares issued as reinvestment of distributions | | | 108,325 | | | | 1,020,811 | | | | 252,437 | | | | 3,318,646 | |
| Less shares redeemed | | | (426,807 | ) | | | (4,083,174 | ) | | | (3,125,991 | ) | | | (41,320,166 | ) |
| | | | |
| Net increase (decrease) | | | (266,468 | ) | | $ | (2,565,462 | ) | | | (747,979 | ) | | $ | (9,868,997 | ) |
| | | | |
| | | | |
| Class I | | Shares | | | Dollars | | | Shares | | | Dollars | |
| Shares sold | | | 718,388 | | | $ | 6,600,809 | | | | 47,500,954 | | | $ | 613,990,718 | |
| Shares issued as reinvestment of distributions | | | 128,429 | | | | 1,161,386 | | | | 3,018,709 | | | | 38,682,486 | |
| Less shares redeemed | | | (553,006 | ) | | | (5,049,280 | ) | | | (52,953,591 | ) | | | (683,174,188 | ) |
| | | | |
| Net increase (decrease) | | | 293,811 | | | $ | 2,712,915 | | | | (2,433,928 | ) | | $ | (30,500,984 | ) |
| | | | |
| | | | |
| Class R | | Shares | | | Dollars | | | Shares | | | Dollars | |
| Shares sold | | | 791 | | | $ | 7,496 | | | | 149,421 | | | $ | 1,941,864 | |
| Shares issued as reinvestment of distributions | | | 964 | | | | 8,692 | | | | 7,609 | | | | 98,165 | |
| Less shares redeemed | | | (6,029 | ) | | | (54,905 | ) | | | (226,452 | ) | | | (2,944,257 | ) |
| | | | |
| Net increase (decrease) | | | (4,274 | ) | | $ | (38,717 | ) | | | (69,422 | ) | | $ | (904,228 | ) |
| | | | |
| * | Class B shares continue to be outstanding but are no longer an offered class of shares. |
| | | | |
| 180 | | CALAMOS OPEN-END FAMILY OF FUNDS SEMIANNUAL REPORT | | |
Notes to Financial Statements (Unaudited)
| | | | | | | | | | | | | | | | |
| | | HEDGED EQUITY
INCOME FUND | | | LONG/SHORT FUND | |
| Class A | | Shares | | | Dollars | | | Shares | | | Dollars | |
| Shares sold | | | 556,976 | | | $ | 5,562,783 | | | | 544,439 | | | $ | 5,870,735 | |
| Shares issued as reinvestment of distributions | | | — | | | | — | | | | 43,613 | | | | 468,408 | |
| Less shares redeemed | | | (2,567 | ) | | | (25,721 | ) | | | (902,182 | ) | | | (9,692,933 | ) |
| | | | |
| Net increase (decrease) | | | 554,409 | | | $ | 5,537,062 | | | | (314,130 | ) | | $ | (3,353,790 | ) |
| | | | |
| | | | |
| Class B | | Shares | | | Dollars | | | Shares | | | Dollars | |
| Shares sold | | | — | | | $ | — | | | | — | | | $ | — | |
| Shares issued as reinvestment of distributions | | | — | | | | — | | | | — | | | | — | |
| Less shares redeemed | | | — | | | | — | | | | — | | | | — | |
| | | | |
| Net increase (decrease) | | | — | | | $ | — | | | | — | | | $ | — | |
| | | | |
| | | | |
| Class C | | Shares | | | Dollars | | | Shares | | | Dollars | |
| Shares sold | | | 10,000 | | | $ | 100,000 | | | | 87,775 | | | $ | 937,661 | |
| Shares issued as reinvestment of distributions | | | — | | | | — | | | | 7,310 | | | | 77,702 | |
| Less shares redeemed | | | — | | | | — | | | | (115,431 | ) | | | (1,232,257 | ) |
| | | | |
| Net increase (decrease) | | | 10,000 | | | $ | 100,000 | | | | (20,346 | ) | | $ | (216,894 | ) |
| | | | |
| | | | |
| Class I | | Shares | | | Dollars | | | Shares | | | Dollars | |
| Shares sold | | | 536,824 | | | $ | 5,366,322 | | | | 934,867 | | | $ | 10,116,371 | |
| Shares issued as reinvestment of distributions | | | — | | | | — | | | | 86,795 | | | | 935,646 | |
| Less shares redeemed | | | — | | | | — | | | | (3,292,530 | ) | | | (35,181,935 | ) |
| | | | |
| Net increase (decrease) | | | 536,824 | | | $ | 5,366,322 | | | | (2,270,868 | ) | | $ | (24,129,918 | ) |
| | | | |
| | | | |
| Class R | | Shares | | | Dollars | | | Shares | | | Dollars | |
| Shares sold | | | 10,000 | | | $ | 100,000 | | | | — | | | $ | — | |
| Shares issued as reinvestment of distributions | | | — | | | | — | | | | 123 | | | | 1,308 | |
| Less shares redeemed | | | — | | | | — | | | | — | | | | — | |
| | | | |
| Net increase (decrease) | | | 10,000 | | | $ | 100,000 | | | | 123 | | | $ | 1,308 | |
| | | | |
| 1 | Hedged Equity Income Fund commenced operations on December 31, 2014 |
Notes to Financial Statements (Unaudited)
The following table summarizes the activity in capital shares of the Funds:
| | | | | | | | | | | | | | | | | | | | | | | | |
| For the Fiscal Year or Period Ended October 31, 2014 | | | | | | | |
| | | GROWTH FUND | | | OPPORTUNISTIC VALUE FUND | | | FOCUS GROWTH FUND | |
| Class A | | Shares | | | Dollars | | | Shares | | | Dollars | | | Shares | | | Dollars | |
| Shares sold | | | 4,169,402 | | | $ | 203,575,461 | | | | 986,113 | | | $ | 14,768,548 | | | | 1,344,082 | | | $ | 23,646,215 | |
| Shares issued as reinvestment of distributions | | | 11,438,191 | | | | 524,669,823 | | | | 420,977 | | | | 6,041,017 | | | | 1,608 | | | | 28,041 | |
| Less shares redeemed | | | (19,422,426 | ) | | | (949,192,457 | ) | | | (2,708,610 | ) | | | (40,395,770 | ) | | | (1,856,583 | ) | | | (33,035,632 | ) |
| | | | |
| Net increase (decrease) | | | (3,814,833 | ) | | $ | (220,947,173 | ) | | | (1,301,520 | ) | | $ | (19,586,205 | ) | | | (510,893 | ) | | $ | (9,361,376 | ) |
| | | | |
| | | | | | |
| Class B | | Shares | | | Dollars | | | Shares | | | Dollars | | | Shares | | | Dollars | |
| Shares sold* | | | 35,910 | | | $ | 1,586,358 | | | | 5,612 | | | $ | 78,620 | | | | 3,438 | | | $ | 58,529 | |
| Shares issued as reinvestment of distributions | | | 424,071 | | | | 18,676,120 | | | | 6,049 | | | | 80,879 | | | | — | | | | — | |
| Less shares redeemed | | | (1,178,174 | ) | | | (55,133,645 | ) | | | (64,557 | ) | | | (883,494 | ) | | | (28,187 | ) | | | (466,080 | ) |
| | | | |
| Net increase (decrease) | | | (718,193 | ) | | $ | (34,871,167 | ) | | | (52,896 | ) | | $ | (723,995 | ) | | | (24,749 | ) | | $ | (407,551 | ) |
| | | | |
| | | | | | |
| Class C | | Shares | | | Dollars | | | Shares | | | Dollars | | | Shares | | | Dollars | |
| Shares sold | | | 1,918,450 | | | $ | 74,764,571 | | | | 220,929 | | | $ | 3,024,995 | | | | 233,266 | | | $ | 3,799,871 | |
| Shares issued as reinvestment of distributions | | | 6,476,475 | | | | 248,372,816 | | | | 53,258 | | | | 704,065 | | | | — | | | | — | |
| Less shares redeemed | | | (6,623,740 | ) | | | (272,043,288 | ) | | | (164,812 | ) | | | (2,228,705 | ) | | | (116,860 | ) | | | (1,944,321 | ) |
| | | | |
| Net increase | | | 1,771,185 | | | $ | 51,094,099 | | | | 109,375 | | | $ | 1,500,355 | | | | 116,406 | | | $ | 1,855,550 | |
| | | | |
| | | | | | |
| Class I | | Shares | | | Dollars | | | Shares | | | Dollars | | | Shares | | | Dollars | |
| Shares sold | | | 6,106,079 | | | $ | 346,248,281 | | | | 1,163,752 | | | $ | 17,678,376 | | | | 164,697 | | | $ | 2,953,928 | |
| Shares issued as reinvestment of distributions | | | 3,644,971 | | | | 191,543,226 | | | | 116,680 | | | | 1,711,690 | | | | 5,239 | | | | 92,100 | |
| Less shares redeemed | | | (12,078,610 | ) | | | (669,064,186 | ) | | | (537,807 | ) | | | (8,193,218 | ) | | | (218,637 | ) | | | (3,917,909 | ) |
| | | | |
| Net increase (decrease) | | | (2,327,560 | ) | | $ | (131,272,679 | ) | | | 742,625 | | | $ | 11,196,848 | | | | (48,701 | ) | | $ | (871,881 | ) |
| | | | |
| | | | | | |
| Class R | | Shares | | | Dollars | | | Shares | | | Dollars | | | Shares | | | Dollars | |
| Shares sold | | | 45,853 | | | $ | 2,216,295 | | | | 461 | | | $ | 6,864 | | | | 1,514 | | | $ | 26,156 | |
| Shares issued as reinvestment of distributions | | | 55,617 | | | | 2,486,625 | | | | 731 | | | | 10,396 | | | | — | | | | — | |
| Less shares redeemed | | | (96,424 | ) | | | (4,925,913 | ) | | | — | | | | — | | | | (6,511 | ) | | | (109,505 | ) |
| | | | |
| Net increase (decrease) | | | 5,046 | | | $ | (222,993 | ) | | | 1,192 | | | $ | 17,260 | | | | (4,997 | ) | | $ | (83,349 | ) |
| | | | |
| * | Class B shares continue to be outstanding but are no longer an offered class of shares. |
| | | | |
| 182 | | CALAMOS OPEN-END FAMILY OF FUNDS SEMIANNUAL REPORT | | |
Notes to Financial Statements (Unaudited)
| | | | | | | | | | | | | | | | | | | | | | | | |
| | | DISCOVERY
GROWTH FUND | | | DIVIDEND
GROWTH FUND | | | MID CAP
GROWTH FUND | |
| Class A | | Shares | | | Dollars | | | Shares | | | Dollars | | | Shares | | | Dollars | |
| Shares sold | | | 877,889 | | | $ | 12,650,132 | | | | 718,584 | | | $ | 7,600,725 | | | | 2,580,733 | | | $ | 28,771,965 | |
| Shares issued as reinvestment of distributions | | | 318,417 | | | | 4,234,941 | | | | 51,460 | | | | 541,176 | | | | 511 | | | | 5,558 | |
| Less shares redeemed | | | (1,112,634 | ) | | | (15,919,384 | ) | | | (642,277 | ) | | | (6,841,721 | ) | | | (540,491 | ) | | | (5,987,253 | ) |
| | | | |
| Net increase (decrease) | | | 83,672 | | | $ | 965,689 | | | | 127,767 | | | $ | 1,300,180 | | | | 2,040,753 | | | $ | 22,790,270 | |
| | | | |
| | | | | | |
| Class B | | Shares | | | Dollars | | | Shares | | | Dollars | | | Shares | | | Dollars | |
| Shares sold* | | | 199 | | | $ | 2,553 | | | | — | | | $ | — | | | | — | | | $ | — | |
| Shares issued as reinvestment of distributions | | | 17,986 | | | | 232,562 | | | | — | | | | — | | | | — | | | | — | |
| Less shares redeemed | | | (9,776 | ) | | | (132,908 | ) | | | — | | | | — | | | | — | | | | — | |
| | | | |
| Net increase (decrease) | | | 8,409 | | | $ | 102,207 | | | | — | | | $ | — | | | | — | | | $ | — | |
| | | | |
| | | | | | |
| Class C | | Shares | | | Dollars | | | Shares | | | Dollars | | | Shares | | | Dollars | |
| Shares sold | | | 21,562 | | | $ | 294,494 | | | | 16,227 | | | $ | 173,846 | | | | 41,247 | | | $ | 464,867 | |
| Shares issued as reinvestment of distributions | | | 29,073 | | | | 375,617 | | | | 422 | | | | 4,422 | | | | 1 | | | | 12 | |
| Less shares redeemed | | | (43,874 | ) | | | (578,715 | ) | | | (2,202 | ) | | | (23,597 | ) | | | (973 | ) | | | (11,000 | ) |
| | | | |
| Net increase (decrease) | | | 6,761 | | | $ | 91,396 | | | | 14,447 | | | $ | 154,671 | | | | 40,275 | | | $ | 453,879 | |
| | | | |
| | | | | | |
| Class I | | Shares | | | Dollars | | | Shares | | | Dollars | | | Shares | | | Dollars | |
| Shares sold | | | 166,972 | | | $ | 2,309,779 | | | | 333,638 | | | $ | 3,570,422 | | | | 494,023 | | | $ | 5,550,945 | |
| Shares issued as reinvestment of distributions | | | 104,045 | | | | 1,398,357 | | | | 16,571 | | | | 174,373 | | | | 422 | | | | 4,599 | |
| Less shares redeemed | | | (288,515 | ) | | | (4,089,606 | ) | | | (339,122 | ) | | | (3,636,368 | ) | | | (326,803 | ) | | | (3,639,808 | ) |
| | | | |
| Net increase (decrease) | | | (17,498 | ) | | $ | (381,470 | ) | | | 11,087 | | | $ | 108,427 | | | | 167,642 | | | $ | 1,915,736 | |
| | | | |
| | | | | | |
| Class R | | Shares | | | Dollars | | | Shares | | | Dollars | | | Shares | | | Dollars | |
| Shares sold | | | — | | | $ | — | | | | — | | | $ | — | | | | — | | | $ | — | |
| Shares issued as reinvestment of distributions | | | 19,043 | | | | 251,178 | | | | 176 | | | | 1,850 | | | | 1 | | | | 8 | |
| Less shares redeemed | | | (12,312 | ) | | | (165,640 | ) | | | — | | | | — | | | | — | | | | — | |
| | | | |
| Net increase (decrease) | | | 6,731 | | | $ | 85,538 | | | | 176 | | | $ | 1,850 | | | | 1 | | | $ | 8 | |
| | | | |
| * | Class B shares continue to be outstanding but are no longer an offered class of shares. |
Notes to Financial Statements (Unaudited)
| | | | | | | | | | | | | | | | | | | | | | | | |
| | | INTERNATIONAL
GROWTH FUND | | | EVOLVING WORLD GROWTH FUND | | | EMERGING MARKET EQUITY FUND1 | |
| Class A | | Shares | | | Dollars | | | Shares | | | Dollars | | | Shares | | | Dollars | |
| Shares sold | | | 4,121,503 | | | $ | 81,370,181 | | | | 7,954,449 | | | $ | 110,962,598 | | | | 621,188 | | | $ | 6,213,623 | |
| Shares issued as reinvestment of distributions | | | 68,048 | | | | 1,315,376 | | | | 110,950 | | | | 1,517,798 | | | | — | | | | — | |
| Less shares redeemed | | | (10,161,635 | ) | | | (200,761,635 | ) | | | (7,563,915 | ) | | | (106,962,856 | ) | | | (76,528 | ) | | | (775,464 | ) |
| | | | |
| Net increase (decrease) | | | (5,972,084 | ) | | $ | (118,076,078 | ) | | | 501,484 | | | $ | 5,517,540 | | | | 544,660 | | | $ | 5,438,159 | |
| | | | |
| | | | | | |
| Class B | | Shares | | | Dollars | | | Shares | | | Dollars | | | Shares | | | Dollars | |
| Shares sold* | | | 1,632 | | | $ | 30,834 | | | | 7,297 | | | $ | 98,615 | | | | — | | | $ | — | |
| Shares issued as reinvestment of distributions | | | — | | | | — | | | | 1,107 | | | | 14,719 | | | | — | | | | — | |
| Less shares redeemed | | | (203,835 | ) | | | (3,821,643 | ) | | | (86,212 | ) | | | (1,213,178 | ) | | | — | | | | — | |
| | | | |
| Net increase (decrease) | | | (202,203 | ) | | $ | (3,790,809 | ) | | | (77,808 | ) | | $ | (1,099,844 | ) | | | — | | | $ | — | |
| | | | |
| | | | | | |
| Class C | | Shares | | | Dollars | | | Shares | | | Dollars | | | Shares | | | Dollars | |
| Shares sold | | | 363,989 | | | $ | 6,819,007 | | | | 1,429,701 | | | $ | 19,462,204 | | | | 31,670 | | | $ | 318,335 | |
| Shares issued as reinvestment of distributions | | | — | | | | — | | | | 21,045 | | | | 279,897 | | | | — | | | | — | |
| Less shares redeemed | | | (679,512 | ) | | | (12,663,987 | ) | | | (589,783 | ) | | | (7,970,084 | ) | | | (2,217 | ) | | | (20,754 | ) |
| | | | |
| Net increase (decrease) | | | (315,523 | ) | | $ | (5,844,980 | ) | | | 860,963 | | | $ | 11,772,017 | | | | 29,453 | | | $ | 297,581 | |
| | | | |
| | | | | | |
| Class I | | Shares | | | Dollars | | | Shares | | | Dollars | | | Shares | | | Dollars | |
| Shares sold | | | 7,889,142 | | | $ | 157,945,168 | | | | 19,554,553 | | | $ | 277,940,237 | | | | 1,051,043 | | | $ | 10,567,059 | |
| Shares issued as reinvestment of distributions | | | 140,580 | | | | 2,744,118 | | | | 232,806 | | | | 3,203,411 | | | | — | | | | — | |
| Less shares redeemed | | | (10,624,094 | ) | | | (211,395,184 | ) | | | (10,388,282 | ) | | | (145,524,332 | ) | | | (67,098 | ) | | | (701,062 | ) |
| | | | |
| Net increase (decrease) | | | (2,594,372 | ) | | $ | (50,705,898 | ) | | | 9,399,077 | | | $ | 135,619,316 | | | | 983,945 | | | $ | 9,865,997 | |
| | | | |
| | | | | | |
| Class R | | Shares | | | Dollars | | | Shares | | | Dollars | | | Shares | | | Dollars | |
| Shares sold | | | 225,586 | | | $ | 4,384,413 | | | | 155,991 | | | $ | 2,146,309 | | | | 10,000 | | | $ | 100,000 | |
| Shares issued as reinvestment of distributions | | | 1,538 | | | | 29,377 | | | | 1,166 | | | | 15,858 | | | | — | | | | — | |
| Less shares redeemed | | | (485,865 | ) | | | (9,332,574 | ) | | | (194,657 | ) | | | (2,741,560 | ) | | | — | | | | — | |
| | | | |
| Net increase (decrease) | | | (258,741 | ) | | $ | (4,918,784 | ) | | | (37,500 | ) | | $ | (579,393 | ) | | | 10,000 | | | $ | 100,000 | |
| | | | |
| * | Class B shares continue to be outstanding but are no longer an offered class of shares. |
| 1 | Emerging Market Equity Fund commenced operations on December 31, 2013. |
| | | | |
| 184 | | CALAMOS OPEN-END FAMILY OF FUNDS SEMIANNUAL REPORT | | |
Notes to Financial Statements (Unaudited)
| | | | | | | | | | | | | | | | | | | | | | | | |
| | | GLOBAL EQUITY FUND | | | GROWTH AND
INCOME FUND | | | GLOBAL GROWTH AND
INCOME FUND | |
| Class A | | Shares | | | Dollars | | | Shares | | | Dollars | | | Shares | | | Dollars | |
| Shares sold | | | 2,574,537 | | | $ | 39,112,015 | | | | 3,024,499 | | | $ | 102,499,417 | | | | 1,738,669 | | | $ | 18,016,612 | |
| Shares issued as reinvestment of distributions | | | 202,247 | | | | 3,011,453 | | | | 4,847,970 | | | | 158,770,504 | | | | 3,229,249 | | | | 31,618,850 | |
| Less shares redeemed | | | (7,320,032 | ) | | | (111,411,798 | ) | | | (15,525,637 | ) | | | (531,027,923 | ) | | | (8,517,784 | ) | | | (88,661,991 | ) |
| | | | |
| Net increase (decrease) | | | (4,543,248 | ) | | $ | (69,288,330 | ) | | | (7,653,168 | ) | | $ | (269,758,002 | ) | | | (3,549,866 | ) | | $ | (39,026,529 | ) |
| | | | |
| | | | | | |
| Class B | | Shares | | | Dollars | | | Shares | | | Dollars | | | Shares | | | Dollars | |
| Shares sold* | | | 5,022 | | | $ | 73,105 | | | | 20,650 | | | $ | 799,005 | | | | 17,877 | | | $ | 180,881 | |
| Shares issued as reinvestment of distributions | | | 3,469 | | | | 49,880 | | | | 89,387 | | | | 3,401,594 | | | | 136,244 | | | | 1,361,076 | |
| Less shares redeemed | | | (121,895 | ) | | | (1,821,588 | ) | | | (836,097 | ) | | | (33,056,075 | ) | | | (595,597 | ) | | | (6,280,338 | ) |
| | | | |
| Net increase (decrease) | | | (113,404 | ) | | $ | (1,698,603 | ) | | | (726,060 | ) | | $ | (28,855,476 | ) | | | (441,476 | ) | | $ | (4,738,381 | ) |
| | | | |
| | | | | | |
| Class C | | Shares | | | Dollars | | | Shares | | | Dollars | | | Shares | | | Dollars | |
| Shares sold | | | 202,949 | | | $ | 2,966,357 | | | | 1,292,908 | | | $ | 43,583,661 | | | | 1,155,910 | | | $ | 10,881,146 | |
| Shares issued as reinvestment of distributions | | | 32,906 | | | | 472,200 | | | | 2,544,234 | | | | 83,644,927 | | | | 2,696,480 | | | | 24,672,794 | |
| Less shares redeemed | | | (612,180 | ) | | | (9,022,346 | ) | | | (5,836,550 | ) | | | (199,478,339 | ) | | | (4,733,883 | ) | | | (45,552,842 | ) |
| | | | |
| Net increase (decrease) | | | (376,325 | ) | | $ | (5,583,789 | ) | | | (1,999,408 | ) | | $ | (72,249,751 | ) | | | (881,493 | ) | | $ | (9,998,902 | ) |
| | | | |
| | | | | | |
| Class I | | Shares | | | Dollars | | | Shares | | | Dollars | | | Shares | | | Dollars | |
| Shares sold | | | 2,153,492 | | | $ | 33,387,296 | | | | 5,818,571 | | | $ | 194,654,513 | | | | 4,182,731 | | | $ | 43,942,902 | |
| Shares issued as reinvestment of distributions | | | 171,983 | | | | 2,578,019 | | | | 1,983,416 | | | | 63,324,616 | | | | 3,397,387 | | | | 33,914,813 | |
| Less shares redeemed | | | (9,997,608 | ) | | | (153,601,588 | ) | | | (6,774,543 | ) | | | (225,229,614 | ) | | | (9,536,753 | ) | | | (100,435,221 | ) |
| | | | |
| Net increase (decrease) | | | (7,672,133 | ) | | $ | (117,636,273 | ) | | | 1,027,444 | | | $ | 32,749,515 | | | | (1,956,635 | ) | | $ | (22,577,506 | ) |
| | | | |
| | | | | | |
| Class R | | Shares | | | Dollars | | | Shares | | | Dollars | | | Shares | | | Dollars | |
| Shares sold | | | 371,122 | | | $ | 5,589,530 | | | | 115,758 | | | $ | 3,905,247 | | | | 56,656 | | | $ | 579,617 | |
| Shares issued as reinvestment of distributions | | | 12,709 | | | | 186,563 | | | | 63,698 | | | | 2,071,779 | | | | 26,946 | | | | 261,658 | |
| Less shares redeemed | | | (479,931 | ) | | | (7,298,968 | ) | | | (272,973 | ) | | | (9,176,885 | ) | | | (55,016 | ) | | | (563,576 | ) |
| | | | |
| Net increase (decrease) | | | (96,100 | ) | | $ | (1,522,875 | ) | | | (93,517 | ) | | $ | (3,199,859 | ) | | | 28,586 | | | $ | 277,699 | |
| | | | |
| * | Class B shares continue to be outstanding but are no longer an offered class of shares. |
Notes to Financial Statements (Unaudited)
| | | | | | | | | | | | | | | | | | | | | | | | |
| | | CONVERTIBLE FUND | | | TOTAL RETURN
BOND FUND | | | HIGH INCOME FUND | |
| Class A | | Shares | | | Dollars | | | Shares | | | Dollars | | | Shares | | | Dollars | |
| Shares sold | | | 9,987,438 | | | $ | 182,738,512 | | | | 2,179,054 | | | $ | 23,249,389 | | | | 4,804,505 | | | $ | 47,159,168 | |
| Shares issued as reinvestment of distributions | | | 2,806,489 | | | | 49,636,786 | | | | 392,228 | | | | 4,156,799 | | | | 1,360,453 | | | | 13,333,056 | |
| Less shares redeemed | | | (13,374,627 | ) | | | (246,089,080 | ) | | | (4,885,639 | ) | | | (52,345,904 | ) | | | (12,790,210 | ) | | | (125,436,872 | ) |
| | | | |
| Net increase (decrease) | | | (580,700 | ) | | $ | (13,713,782 | ) | | | (2,314,357 | ) | | $ | (24,939,716 | ) | | | (6,625,252 | ) | | $ | (64,944,648 | ) |
| | | | |
| | | | | | |
| Class B | | Shares | | | Dollars | | | Shares | | | Dollars | | | Shares | | | Dollars | |
| Shares sold* | | | 14,862 | | | $ | 332,596 | | | | 6,949 | | | $ | 74,076 | | | | 27,920 | | | $ | 289,625 | |
| Shares issued as reinvestment of distributions | | | 23,491 | | | | 517,586 | | | | 15,216 | | | | 160,931 | | | | 15,391 | | | | 158,355 | |
| Less shares redeemed | | | (103,690 | ) | | | (2,365,327 | ) | | | (334,873 | ) | | | (3,582,399 | ) | | | (158,366 | ) | | | (1,638,534 | ) |
| | | | |
| Net increase (decrease) | | | (65,337 | ) | | $ | (1,515,145 | ) | | | (312,708 | ) | | $ | (3,347,392 | ) | | | (115,055 | ) | | $ | (1,190,554 | ) |
| | | | |
| | | | | | |
| Class C | | Shares | | | Dollars | | | Shares | | | Dollars | | | Shares | | | Dollars | |
| Shares sold | | | 2,722,931 | | | $ | 49,155,974 | | | | 133,486 | | | $ | 1,416,851 | | | | 252,150 | | | $ | 2,569,644 | |
| Shares issued as reinvestment of distributions | | | 1,287,951 | | | | 22,560,787 | | | | 63,665 | | | | 673,709 | | | | 161,183 | | | | 1,643,279 | |
| Less shares redeemed | | | (3,939,459 | ) | | | (71,512,966 | ) | | | (916,226 | ) | | | (9,787,789 | ) | | | (815,712 | ) | | | (8,341,242 | ) |
| | | | |
| Net increase (decrease) | | | 71,423 | | | $ | 203,795 | | | | (719,075 | ) | | $ | (7,697,229 | ) | | | (402,379 | ) | | $ | (4,128,319 | ) |
| | | | |
| | | | | | |
| Class I | | Shares | | | Dollars | | | Shares | | | Dollars | | | Shares | | | Dollars | |
| Shares sold | | | 20,533,223 | | | $ | 343,816,639 | | | | 979,335 | | | $ | 10,449,287 | | | | 857,639 | | | $ | 8,444,246 | |
| Shares issued as reinvestment of distributions | | | 2,343,898 | | | | 38,110,323 | | | | 165,635 | | | | 1,752,368 | | | | 166,427 | | | | 1,630,648 | |
| Less shares redeemed | | | (10,049,092 | ) | | | (167,930,158 | ) | | | (3,673,387 | ) | | | (39,060,727 | ) | | | (1,037,040 | ) | | | (10,137,137 | ) |
| | | | |
| Net increase (decrease) | | | 12,828,029 | | | $ | 213,996,804 | | | | (2,528,417 | ) | | $ | (26,859,072 | ) | | | (12,974 | ) | | $ | (62,243 | ) |
| | | | |
| | | | | | |
| Class R | | Shares | | | Dollars | | | Shares | | | Dollars | | | Shares | | | Dollars | |
| Shares sold | | | 47,121 | | | $ | 854,312 | | | | 52,117 | | | $ | 564,971 | | | | 4,139 | | | $ | 40,847 | |
| Shares issued as reinvestment of distributions | | | 13,136 | | | | 231,610 | | | | 2,026 | | | | 21,521 | | | | 1,227 | | | | 12,008 | |
| Less shares redeemed | | | (60,437 | ) | | | (1,126,891 | ) | | | (238,719 | ) | | | (2,549,197 | ) | | | (3,107 | ) | | | (30,673 | ) |
| | | | |
| Net increase (decrease) | | | (180 | ) | | $ | (40,969 | ) | | | (184,576 | ) | | $ | (1,962,705 | ) | | | 2,259 | | | $ | 22,182 | |
| | | | |
| * | Class B shares continue to be outstanding but are no longer an offered class of shares. |
| | | | |
| 186 | | CALAMOS OPEN-END FAMILY OF FUNDS SEMIANNUAL REPORT | | |
Notes to Financial Statements (Unaudited)
| | | | | | | | | | | | | | | | |
| | | MARKET NEUTRAL
INCOME FUND | | | LONG/SHORT FUND | |
| Class A | | Shares | | | Dollars | | | Shares | | | Dollars | |
| Shares sold | | | 50,269,892 | | | $ | 654,756,366 | | | | 5,153,378 | | | $ | 55,032,659 | |
| Shares issued as reinvestment of distributions | | | 3,151,586 | | | | 40,742,177 | | | | 22,410 | | | | 242,933 | |
| Less shares redeemed | | | (53,858,000 | ) | | | (702,711,796 | ) | | | (2,412,813 | ) | | | (25,682,216 | ) |
| | | | |
| Net increase (decrease) | | | (436,522 | ) | | $ | (7,213,253 | ) | | | 2,762,975 | | | $ | 29,593,376 | |
| | | | |
| | | | |
| Class B | | Shares | | | Dollars | | | Shares | | | Dollars | |
| Shares sold* | | | 12,452 | | | $ | 171,144 | | | | — | | | $ | — | |
| Shares issued as reinvestment of distributions | | | 8,923 | | | | 121,669 | | | | — | | | | — | |
| Less shares redeemed | | | (361,322 | ) | | | (4,970,395 | ) | | | — | | | | — | |
| | | | |
| Net increase (decrease) | | | (339,947 | ) | | $ | (4,677,582 | ) | | | — | | | $ | — | |
| | | | |
| | | | |
| Class C | | Shares | | | Dollars | | | Shares | | | Dollars | |
| Shares sold | | | 8,550,550 | | | $ | 113,196,384 | | | | 641,920 | | | $ | 6,825,517 | |
| Shares issued as reinvestment of distributions | | | 392,424 | | | | 5,148,225 | | | | 887 | | | | 9,555 | |
| Less shares redeemed | | | (4,456,820 | ) | | | (58,996,872 | ) | | | (76,000 | ) | | | (789,563 | ) |
| | | | |
| Net increase (decrease) | | | 4,486,154 | | | $ | 59,347,737 | | | | 566,807 | | | $ | 6,045,509 | |
| | | | |
| | | | |
| Class I | | Shares | | | Dollars | | | Shares | | | Dollars | |
| Shares sold | | | 110,860,805 | | | $ | 1,431,307,473 | | | | 6,679,002 | | | $ | 71,222,333 | |
| Shares issued as reinvestment of distributions | | | 3,587,887 | | | | 45,980,143 | | | | 32,684 | | | | 353,322 | |
| Less shares redeemed | | | (45,692,384 | ) | | | (589,104,635 | ) | | | (2,560,986 | ) | | | (27,000,385 | ) |
| | | | |
| Net increase (decrease) | | | 68,756,308 | | | $ | 888,182,981 | | | | 4,150,700 | | | $ | 44,575,270 | |
| | | | |
| | | | |
| Class R | | Shares | | | Dollars | | | Shares | | | Dollars | |
| Shares sold | | | 482,810 | | | $ | 6,281,640 | | | | 1,624 | | | $ | 17,653 | |
| Shares issued as reinvestment of distributions | | | 9,557 | | | | 123,166 | | | | 82 | | | | 884 | |
| Less shares redeemed | | | (210,950 | ) | | | (2,746,985 | ) | | | (1,630 | ) | | | (17,269 | ) |
| | | | |
| Net increase (decrease) | | | 281,417 | | | $ | 3,657,821 | | | | 76 | | | $ | 1,268 | |
| | | | |
| * | Class B shares continue to be outstanding but are no longer an offered class of shares. |
Calamos Growth Fund Financial Highlights
Selected data for a share outstanding throughout each period were as follows:
| | | | | | | | | | | | | | | | | | | | | | | | |
| | | CLASS A | |
| | | (Unaudited)
Six Months
Ended
April 30, | | | Year Ended October 31, | |
| | | 2015 | | | 2014 | | | 2013 | | | 2012 | | | 2011 | | | 2010 | |
Net asset value, beginning of period | | | $50.16 | | | | $58.75 | | | | $49.90 | | | | $51.06 | | | | $49.18 | | | | $40.60 | |
Income from investment operations: | | | | | | | | | | | | | | | | | | | | | | | | |
Net investment income (loss)(a) | | | (0.03 | ) | | | (0.20 | ) | | | (0.05 | ) | | | (0.22 | ) | | | (0.32 | ) | | | (0.16 | ) |
Net realized and unrealized gain (loss) | | | 2.69 | | | | 6.90 | | | | 12.63 | | | | 1.21 | | | | 2.20 | | | | 8.74 | |
Total from investment operations | | | 2.66 | | | | 6.70 | | | | 12.58 | | | | 0.99 | | | | 1.88 | | | | 8.58 | |
Distributions: | | | | | | | | | | | | | | | | | | | | | | | | |
Dividends from net investment income | | | — | | | | — | | | | — | | | | — | | | | — | | | | — | |
Dividends from net realized gains | | | (10.13 | ) | | | (15.29 | ) | | | (3.73 | ) | | | (2.15 | ) | | | — | | | | — | |
Total distributions | | | (10.13 | ) | | | (15.29 | ) | | | (3.73 | ) | | | (2.15 | ) | | | — | | | | — | |
Net asset value, end of period | | | $42.69 | | | | $50.16 | | | | $58.75 | | | | $49.90 | | | | $51.06 | | | | $49.18 | |
Ratios and supplemental data: | | | | | | | | | | | | | | | | | | | | | | | | |
Total return(b) | | | 6.27% | | | | 13.84% | | | | 26.95% | | | | 2.26% | | | | 3.82% | | | | 21.13% | |
Net assets, end of period (000) | | | $1,584,010 | | | | $1,718,674 | | | | $2,237,328 | | | | $3,241,595 | | | | $4,232,942 | | | | $4,721,389 | |
Ratio of net expenses to average net assets | | | 1.30% | (c) | | | 1.26% | | | | 1.26% | | | | 1.29% | | | | 1.26% | | | | 1.27% | |
Ratio of gross expenses to average net assets prior to expense reductions | | | 1.30% | (c) | | | 1.26% | | | | 1.26% | | | | 1.29% | | | | 1.26% | | | | 1.27% | |
Ratio of net investment income (loss) to average net assets | | | (0.16% | )(c) | | | (0.42% | ) | | | (0.10% | ) | | | (0.44% | ) | | | (0.60% | ) | | | (0.37% | ) |
| | |
| | | (Unaudited)
Six Months
Ended
April 30, | | | Year Ended October 31, | |
| | | 2015 | | | 2014 | | | 2013 | | | 2012 | | | 2011 | | | 2010 | |
Portfolio turnover rate | | | 30.3% | | | | 41.8% | | | | 67.1% | | | | 57.0% | | | | 84.7% | | | | 52.7% | |
| (a) | Net investment income (loss) allocated based on average shares method. |
| (b) | Total return measures net investment income (loss) and capital gain or loss from portfolio investments assuming reinvestment of dividends and capital gains distributions. Total return is not annualized for periods that are less than a full year, does not reflect the effect of sales charge for Class A shares nor the contingent deferred sales charge for Class B and C shares and does not reflect the deduction of taxes that a shareholder would pay on fund distributions or the redemption of fund shares. |
| | | | |
| 188 | | CALAMOS OPEN-END FAMILY OF FUNDS SEMIANNUAL REPORT | | |
Calamos Growth Fund Financial Highlights
| | | | | | | | | | | | | | | | | | | | | | | | |
| | | CLASS B | |
| | | (Unaudited)
Six Months
Ended
April 30, | | | Year Ended October 31, | |
| | | 2015 | | | 2014 | | | 2013 | | | 2012 | | | 2011 | | | 2010 | |
Net asset value, beginning of period | | | $47.84 | | | | $57.05 | | | | $48.90 | | | | $50.44 | | | | $48.96 | | | | $40.72 | |
Income from investment operations: | | | | | | | | | | | | | | | | | | | | | | | | |
Net investment income (loss)(a) | | | (0.19 | ) | | | (0.56 | ) | | | (0.43 | ) | | | (0.59 | ) | | | (0.71 | ) | | | (0.50 | ) |
Net realized and unrealized gain (loss) | | | 2.55 | | | | 6.64 | | | | 12.31 | | | | 1.20 | | | | 2.19 | | | | 8.74 | |
Total from investment operations | | | 2.36 | | | | 6.08 | | | | 11.88 | | | | 0.61 | | | | 1.48 | | | | 8.24 | |
Distributions: | | | | | | | | | | | | | | | | | | | | | | | | |
Dividends from net investment income | | | — | | | | — | | | | — | | | | — | | | | — | | | | — | |
Dividends from net realized gains | | | (10.13 | ) | | | (15.29 | ) | | | (3.73 | ) | | | (2.15 | ) | | | — | | | | — | |
Total distributions | | | (10.13 | ) | | | (15.29 | ) | | | (3.73 | ) | | | (2.15 | ) | | | — | | | | — | |
Net asset value, end of period | | | $40.07 | | | | $47.84 | | | | $57.05 | | | | $48.90 | | | | $50.44 | | | | $48.96 | |
Ratios and supplemental data: | | | | | | | | | | | | | | | | | | | | | | | | |
Total return(b) | | | 5.89% | | | | 12.97% | | | | 26.00% | | | | 1.50% | | | | 3.02% | | | | 20.24% | |
Net assets, end of period (000) | | | $26,823 | | | | $36,835 | | | | $84,895 | | | | $171,357 | | | | $335,792 | | | | $508,828 | |
Ratio of net expenses to average net assets | | | 2.05% | (c) | | | 2.00% | | | | 2.02% | | | | 2.03% | | | | 2.01% | | | | 2.02% | |
Ratio of gross expenses to average net assets prior to expense reductions | | | 2.05% | (c) | | | 2.00% | | | | 2.02% | | | | 2.03% | | | | 2.01% | | | | 2.02% | |
Ratio of net investment income (loss) to average net assets | | | (0.90% | )(c) | | | (1.17% | ) | | | (0.86% | ) | | | (1.18% | ) | | | (1.34% | ) | | | (1.12% | ) |
| |
| | | CLASS C | |
| | | (Unaudited)
Six Months
Ended
April 30, | | | Year Ended October 31, | |
| | | 2015 | | | 2014 | | | 2013 | | | 2012 | | | 2011 | | | 2010 | |
Net asset value, beginning of period | | | $41.66 | | | | $51.58 | | | | $44.56 | | | | $46.16 | | | | $44.80 | | | | $37.26 | |
Income from investment operations: | | | | | | | | | | | | | | | | | | | | | | | | |
Net investment income (loss)(a) | | | (0.16 | ) | | | (0.48 | ) | | | (0.38 | ) | | | (0.54 | ) | | | (0.66 | ) | | | (0.45 | ) |
Net realized and unrealized gain (loss) | | | 2.16 | | | | 5.85 | | | | 11.13 | | | | 1.09 | | | | 2.02 | | | | 7.99 | |
Total from investment operations | | | 2.00 | | | | 5.37 | | | | 10.75 | | | | 0.55 | | | | 1.36 | | | | 7.54 | |
Distributions: | | | | | | | | | | | | | | | | | | | | | | | | |
Dividends from net investment income | | | — | | | | — | | | | — | | | | — | | | | — | | | | — | |
Dividends from net realized gains | | | (10.13 | ) | | | (15.29 | ) | | | (3.73 | ) | | | (2.15 | ) | | | — | | | | — | |
Total distributions | | | (10.13 | ) | | | (15.29 | ) | | | (3.73 | ) | | | (2.15 | ) | | | — | | | | — | |
Net asset value, end of period | | | $33.53 | | | | $41.66 | | | | $51.58 | | | | $44.56 | | | | $46.16 | | | | $44.80 | |
Ratios and supplemental data: | | | | | | | | | | | | | | | | | | | | | | | | |
Total return(b) | | | 5.90% | | | | 12.97% | | | | 26.00% | | | | 1.51% | | | | 3.04% | | | | 20.24% | |
Net assets, end of period (000) | | | $868,049 | | | | $959,445 | | | | $1,096,492 | | | | $1,272,104 | | | | $1,517,047 | | | | $1,718,714 | |
Ratio of net expenses to average net assets | | | 2.05% | (c) | | | 2.01% | | | | 2.01% | | | | 2.04% | | | | 2.01% | | | | 2.02% | |
Ratio of gross expenses to average net assets prior to expense reductions | | | 2.05% | (c) | | | 2.01% | | | | 2.01% | | | | 2.04% | | | | 2.01% | | | | 2.02% | |
Ratio of net investment income (loss) to average net assets | | | (0.90% | )(c) | | | (1.17% | ) | | | (0.85% | ) | | | (1.19% | ) | | | (1.35% | ) | | | (1.12% | ) |
| (a) | Net investment income (loss) allocated based on average shares method. |
| (b) | Total return measures net investment income (loss) and capital gain or loss from portfolio investments assuming reinvestment of dividends and capital gains distributions. Total return is not annualized for periods that are less than a full year, does not reflect the effect of sales charge for Class A shares nor the contingent deferred sales charge for Class B and C shares and does not reflect the deduction of taxes that a shareholder would pay on fund distributions or the redemption of fund shares. |
Calamos Growth Fund Financial Highlights
| | | | | | | | | | | | | | | | | | | | | | | | |
| | | CLASS I | |
| | | (Unaudited)
Six Months
Ended
April 30, | | | Year Ended October 31, | |
| | | 2015 | | | 2014 | | | 2013 | | | 2012 | | | 2011 | | | 2010 | |
Net asset value, beginning of period | | | $57.59 | | | | $65.15 | | | | $54.81 | | | | $55.72 | | | | $53.54 | | | | $44.09 | |
Income from investment operations: | | | | | | | | | | | | | | | | | | | | | | | | |
Net investment income (loss)(a) | | | 0.02 | | | | (0.10 | ) | | | 0.08 | | | | (0.10 | ) | | | (0.21 | ) | | | (0.05 | ) |
Net realized and unrealized gain (loss) | | | 3.17 | | | | 7.83 | | | | 13.99 | | | | 1.34 | | | | 2.39 | | | | 9.50 | |
Total from investment operations | | | 3.19 | | | | 7.73 | | | | 14.07 | | | | 1.24 | | | | 2.18 | | | | 9.45 | |
Distributions: | | | | | | | | | | | | | | | | | | | | | | | | |
Dividends from net investment income | | | — | | | | — | | | | — | | | | — | | | | — | | | | — | |
Dividends from net realized gains | | | (10.13 | ) | | | (15.29 | ) | | | (3.73 | ) | | | (2.15 | ) | | | — | | | | — | |
Total distributions | | | (10.13 | ) | | | (15.29 | ) | | | (3.73 | ) | | | (2.15 | ) | | | — | | | | — | |
Net asset value, end of period | | | $50.65 | | | | $57.59 | | | | $65.15 | | | | $54.81 | | | | $55.72 | | | | $53.54 | |
Ratios and supplemental data: | | | | | | | | | | | | | | | | | | | | | | | | |
Total return(b) | | | 6.40% | | | | 14.12% | | | | 27.27% | | | | 2.53% | | | | 4.07% | | | | 21.43% | |
Net assets, end of period (000) | | | $672,968 | | | | $759,432 | | | | $1,010,805 | | | | $1,690,739 | | | | $1,628,191 | | | | $1,335,967 | |
Ratio of net expenses to average net assets | | | 1.05% | (c) | | | 1.01% | | | | 1.02% | | | | 1.04% | | | | 1.01% | | | | 1.02% | |
Ratio of gross expenses to average net assets prior to expense reductions | | | 1.05% | (c) | | | 1.01% | | | | 1.02% | | | | 1.04% | | | | 1.01% | | | | 1.02% | |
Ratio of net investment income (loss) to average net assets | | | 0.09% | (c) | | | (0.18% | ) | | | 0.15% | | | | (0.19% | ) | | | (0.37% | ) | | | (0.11% | ) |
| |
| | | CLASS R | |
| | | (Unaudited)
Six Months
Ended
April 30, | | | Year Ended October 31, | |
| | | 2015 | | | 2014 | | | 2013 | | | 2012 | | | 2011 | | | 2010 | |
Net asset value, beginning of period | | | $48.78 | | | | $57.65 | | | | $49.15 | | | | $50.44 | | | | $48.71 | | | | $40.31 | |
Income from investment operations: | | | | | | | | | | | | | | | | | | | | | | | | |
Net investment income (loss)(a) | | | (0.09 | ) | | | (0.32 | ) | | | (0.18 | ) | | | (0.34 | ) | | | (0.46 | ) | | | (0.27 | ) |
Net realized and unrealized gain (loss) | | | 2.61 | | | | 6.74 | | | | 12.41 | | | | 1.20 | | | | 2.19 | | | | 8.67 | |
Total from investment operations | | | 2.52 | | | | 6.42 | | | | 12.23 | | | | 0.86 | | | | 1.73 | | | | 8.40 | |
Distributions: | | | | | | | | | | | | | | | | | | | | | | | | |
Dividends from net investment income | | | — | | | | — | | | | — | | | | — | | | | — | | | | — | |
Dividends from net realized gains | | | (10.13 | ) | | | (15.29 | ) | | | (3.73 | ) | | | (2.15 | ) | | | — | | | | — | |
Total distributions | | | (10.13 | ) | | | (15.29 | ) | | | (3.73 | ) | | | (2.15 | ) | | | — | | | | — | |
Net asset value, end of period | | | $41.17 | | | | $48.78 | | | | $57.65 | | | | $49.15 | | | | $50.44 | | | | $48.71 | |
Ratios and supplemental data: | | | | | | | | | | | | | | | | | | | | | | | | |
Total return(b) | | | 6.15% | | | | 13.56% | | | | 26.62% | | | | 2.02% | | | | 3.55% | | | | 20.84% | |
Net assets, end of period (000) | | | $10,098 | | | | $10,089 | | | | $11,634 | | | | $15,879 | | | | $13,030 | | | | $9,071 | |
Ratio of net expenses to average net assets | | | 1.55% | (c) | | | 1.51% | | | | 1.51% | | | | 1.54% | | | | 1.51% | | | | 1.52% | |
Ratio of gross expenses to average net assets prior to expense reductions | | | 1.55% | (c) | | | 1.51% | | | | 1.51% | | | | 1.54% | | | | 1.51% | | | | 1.52% | |
Ratio of net investment income (loss) to average net assets | | | (0.41% | )(c) | | | (0.67% | ) | | | (0.35% | ) | | | (0.68% | ) | | | (0.88% | ) | | | (0.62% | ) |
| (a) | Net investment income (loss) allocated based on average shares method. |
| (b) | Total return measures net investment income (loss) and capital gain or loss from portfolio investments assuming reinvestment of dividends and capital gains distributions. Total return is not annualized for periods that are less than a full year, does not reflect the effect of sales charge for Class A shares nor the contingent deferred sales charge for Class B and C shares and does not reflect the deduction of taxes that a shareholder would pay on fund distributions or the redemption of fund shares. |
| | | | |
| 190 | | CALAMOS OPEN-END FAMILY OF FUNDS SEMIANNUAL REPORT | | |
Calamos Opportunistic Value Fund Financial Highlights
Selected data for a share outstanding throughout each period were as follows:
| | | | | | | | | | | | | | | | | | | | | | | | |
| | | CLASS A | |
| | | (Unaudited)
Six Months
Ended
April 30, | | | Year Ended October 31, | |
| | | 2015 | | | 2014 | | | 2013 | | | 2012 | | | 2011 | | | 2010 | |
Net asset value, beginning of period | | | $15.07 | | | | $15.22 | | | | $12.15 | | | | $11.25 | | | | $11.02 | | | | $10.57 | |
Income from investment operations: | | | | | | | | | | | | | | | | | | | | | | | | |
Net investment income (loss)(a) | | | 0.09 | | | | 0.18 | | | | 0.18 | | | | 0.10 | | | | 0.01 | | | | (0.00 | )** |
Net realized and unrealized gain (loss) | | | (0.11 | ) | | | 0.92 | | | | 3.07 | | | | 0.80 | | | | 0.22 | | | | 0.48 | |
Total from investment operations | | | (0.02 | ) | | | 1.10 | | | | 3.25 | | | | 0.90 | | | | 0.23 | | | | 0.48 | |
Distributions: | | | | | | | | | | | | | | | | | | | | | | | | |
Dividends from net investment income | | | (0.14 | ) | | | (0.14 | ) | | | (0.18 | ) | | | — | | | | — | | | | (0.03 | ) |
Dividends from net realized gains | | | (0.99 | ) | | | (1.11 | ) | | | — | | | | — | | | | — | | | | — | |
Total distributions | | | (1.13 | ) | | | (1.25 | ) | | | (0.18 | ) | | | — | | | | — | | | | (0.03 | ) |
Net asset value, end of period | | | $13.92 | | | | $15.07 | | | | $15.22 | | | | $12.15 | | | | $11.25 | | | | $11.02 | |
Ratios and supplemental data: | | | | | | | | | | | | | | | | | | | | | | | | |
Total return(b) | | | (0.10% | ) | | | 7.67% | | | | 27.12% | | | | 8.00% | | | | 2.09% | | | | 4.52% | |
Net assets, end of period (000) | | | $45,245 | | | | $58,419 | | | | $78,843 | | | | $38,992 | | | | $23,964 | | | | $31,556 | |
Ratio of net expenses to average net assets | | | 1.15% | (c) | | | 1.15% | | | | 1.15% | | | | 1.15% | | | | 1.52% | | | | 1.60% | |
Ratio of gross expenses to average net assets prior to expense reductions | | | 1.56% | (c) | | | 1.50% | | | | 1.53% | | | | 1.72% | | | | 1.67% | | | | 1.60% | |
Ratio of net investment income (loss) to average net assets | | | 1.34% | (c) | | | 1.19% | | | | 1.31% | | | | 0.84% | | | | 0.11% | | | | 0.03% | |
| | |
| | | (Unaudited)
Six Months
Ended
April 30, | | | Year Ended October 31, | |
| | | 2015 | | | 2014 | | | 2013 | | | 2012 | | | 2011 | | | 2010 | |
Portfolio turnover rate | | | 95.1% | | | | 165.4% | | | | 250.3% | | | | 204.9% | | | | 27.4% | | | | 37.7% | |
| ** | Amounts are less than $0.005. |
| (a) | Net investment income (loss) allocated based on average shares method. |
| (b) | Total return measures net investment income (loss) and capital gain or loss from portfolio investments assuming reinvestment of dividends and capital gains distributions. Total return is not annualized for periods that are less than a full year, does not reflect the effect of sales charge for Class A shares nor the contingent deferred sales charge for Class B and C shares and does not reflect the deduction of taxes that a shareholder would pay on fund distributions or the redemption of fund shares. |
Calamos Opportunistic Value Fund Financial Highlights
| | | | | | | | | | | | | | | | | | | | | | | | |
| | | CLASS B | |
| | | (Unaudited)
Six Months
Ended
April 30, | | | Year Ended October 31, | |
| | | 2015 | | | 2014 | | | 2013 | | | 2012 | | | 2011 | | | 2010 | |
Net asset value, beginning of period | | | $13.94 | | | | $14.17 | | | | $11.24 | | | | $10.49 | | | | $10.35 | | | | $9.98 | |
Income from investment operations: | | | | | | | | | | | | | | | | | | | | | | | | |
Net investment income (loss)(a) | | | 0.04 | | | | 0.06 | | | | 0.07 | | | | 0.02 | | | | (0.07 | ) | | | (0.07 | ) |
Net realized and unrealized gain (loss) | | | (0.10 | ) | | | 0.85 | | | | 2.88 | | | | 0.73 | | | | 0.21 | | | | 0.44 | |
Total from investment operations | | | (0.06 | ) | | | 0.91 | | | | 2.95 | | | | 0.75 | | | | 0.14 | | | | 0.37 | |
Distributions: | | | | | | | | | | | | | | | | | | | | | | | | |
Dividends from net investment income | | | — | | | | (0.03 | ) | | | (0.02 | ) | | | — | | | | — | | | | — | |
Dividends from net realized gains | | | (0.99 | ) | | | (1.11 | ) | | | — | | | | — | | | | — | | | | — | |
Total distributions | | | (0.99 | ) | | | (1.14 | ) | | | (0.02 | ) | | | — | | | | — | | | | — | |
Net asset value, end of period | | | $12.89 | | | | $13.94 | | | | $14.17 | | | | $11.24 | | | | $10.49 | | | | $10.35 | |
Ratios and supplemental data: | | | | | | | | | | | | | | | | | | | | | | | | |
Total return(b) | | | (0.41% | ) | | | 6.74% | | | | 26.28% | | | | 7.15% | | | | 1.35% | | | | 3.71% | |
Net assets, end of period (000) | | | $265 | | | | $348 | | | | $1,103 | | | | $1,195 | | | | $2,308 | | | | $3,903 | |
Ratio of net expenses to average net assets | | | 1.90% | (c) | | | 1.90% | | | | 1.90% | | | | 1.90% | | | | 2.29% | | | | 2.34% | |
Ratio of gross expenses to average net assets prior to expense reductions | | | 2.31% | (c) | | | 2.24% | | | | 2.28% | | | | 2.47% | | | | 2.42% | | | | 2.34% | |
Ratio of net investment income (loss) to average net assets | | | 0.58% | (c) | | | 0.42% | | | | 0.59% | | | | 0.20% | | | | (0.63% | ) | | | (0.70% | ) |
| |
| | | CLASS C | |
| | | (Unaudited)
Six Months
Ended
April 30, | | | Year Ended October 31, | |
| | | 2015 | | | 2014 | | | 2013 | | | 2012 | | | 2011 | | | 2010 | |
Net asset value, beginning of period | | | $13.79 | | | | $14.09 | | | | $11.23 | | | | $10.48 | | | | $10.34 | | | | $9.97 | |
Income from investment operations: | | | | | | | | | | | | | | | | | | | | | | | | |
Net investment income (loss)(a) | | | 0.04 | | | | 0.06 | | | | 0.08 | | | | 0.02 | | | | (0.07 | ) | | | (0.07 | ) |
Net realized and unrealized gain (loss) | | | (0.10 | ) | | | 0.85 | | | | 2.85 | | | | 0.73 | | | | 0.21 | | | | 0.44 | |
Total from investment operations | | | (0.06 | ) | | | 0.91 | | | | 2.93 | | | | 0.75 | | | | 0.14 | | | | 0.37 | |
Distributions: | | | | | | | | | | | | | | | | | | | | | | | | |
Dividends from net investment income | | | (0.03 | ) | | | (0.10 | ) | | | (0.07 | ) | | | — | | | | — | | | | — | |
Dividends from net realized gains | | | (0.99 | ) | | | (1.11 | ) | | | — | | | | — | | | | — | | | | — | |
Total distributions | | | (1.02 | ) | | | (1.21 | ) | | | (0.07 | ) | | | — | | | | — | | | | — | |
Net asset value, end of period | | | $12.71 | | | | $13.79 | | | | $14.09 | | | | $11.23 | | | | $10.48 | | | | $10.34 | |
Ratios and supplemental data: | | | | | | | | | | | | | | | | | | | | | | | | |
Total return(b) | | | (0.43% | ) | | | 6.82% | | | | 26.27% | | | | 7.16% | | | | 1.35% | | | | 3.71% | |
Net assets, end of period (000) | | | $7,278 | | | | $9,964 | | | | $8,641 | | | | $3,753 | | | | $3,974 | | | | $5,915 | |
Ratio of net expenses to average net assets | | | 1.90% | (c) | | | 1.90% | | | | 1.90% | | | | 1.90% | | | | 2.28% | | | | 2.35% | |
Ratio of gross expenses to average net assets prior to expense reductions | | | 2.31% | (c) | | | 2.25% | | | | 2.28% | | | | 2.47% | | | | 2.42% | | | | 2.35% | |
Ratio of net investment income (loss) to average net assets | | | 0.60% | (c) | | | 0.44% | | | | 0.59% | | | | 0.16% | | | | (0.63% | ) | | | (0.71% | ) |
| (a) | Net investment income (loss) allocated based on average shares method. |
| (b) | Total return measures net investment income (loss) and capital gain or loss from portfolio investments assuming reinvestment of dividends and capital gains distributions. Total return is not annualized for periods that are less than a full year, does not reflect the effect of sales charge for Class A shares nor the contingent deferred sales charge for Class B and C shares and does not reflect the deduction of taxes that a shareholder would pay on fund distributions or the redemption of fund shares. |
| | | | |
| 192 | | CALAMOS OPEN-END FAMILY OF FUNDS SEMIANNUAL REPORT | | |
Calamos Opportunistic Value Fund Financial Highlights
| | | | | | | | | | | | | | | | | | | | | | | | |
| | | CLASS I | |
| | | (Unaudited)
Six Months
Ended
April 30, | | | Year Ended October 31, | |
| | | 2015 | | | 2014 | | | 2013 | | | 2012 | | | 2011 | | | 2010 | |
Net asset value, beginning of period | | | $15.44 | | | | $15.57 | | | | $12.41 | | | | $11.46 | | | | $11.20 | | | | $10.74 | |
Income from investment operations: | | | | | | | | | | | | | | | | | | | | | | | | |
Net investment income (loss)(a) | | | 0.12 | | | | 0.22 | | | | 0.22 | | | | 0.14 | | | | 0.04 | | | | 0.03 | |
Net realized and unrealized gain (loss) | | | (0.11 | ) | | | 0.94 | | | | 3.14 | | | | 0.81 | | | | 0.22 | | | | 0.48 | |
Total from investment operations | | | 0.01 | | | | 1.16 | | | | 3.36 | | | | 0.95 | | | | 0.26 | | | | 0.51 | |
Distributions: | | | | | | | | | | | | | | | | | | | | | | | | |
Dividends from net investment income | | | (0.19 | ) | | | (0.18 | ) | | | (0.20 | ) | | | — | | | | — | | | | (0.05 | ) |
Dividends from net realized gains | | | (0.99 | ) | | | (1.11 | ) | | | — | | | | — | | | | — | | | | — | |
Total distributions | | | (1.18 | ) | | | (1.29 | ) | | | (0.20 | ) | | | — | | | | — | | | | (0.05 | ) |
Net asset value, end of period | | | $14.27 | | | | $15.44 | | | | $15.57 | | | | $12.41 | | | | $11.46 | | | | $11.20 | |
Ratios and supplemental data: | | | | | | | | | | | | | | | | | | | | | | | | |
Total return(b) | | | 0.03% | | | | 7.87% | | | | 27.47% | | | | 8.29% | | | | 2.32% | | | | 4.79% | |
Net assets, end of period (000) | | | $21,671 | | | | $32,147 | | | | $20,857 | | | | $9,671 | | | | $11,227 | | | | $17,340 | |
Ratio of net expenses to average net assets | | | 0.90% | (c) | | | 0.90% | | | | 0.90% | | | | 0.90% | | | | 1.27% | | | | 1.35% | |
Ratio of gross expenses to average net assets prior to expense reductions | | | 1.31% | (c) | | | 1.25% | | | | 1.28% | | | | 1.48% | | | | 1.42% | | | | 1.35% | |
Ratio of net investment income (loss) to average net assets | | | 1.60% | (c) | | | 1.45% | | | | 1.56% | | | | 1.15% | | | | 0.37% | | | | 0.28% | |
| |
| | | CLASS R | |
| | | (Unaudited)
Six Months
Ended
April 30, | | | Year Ended October 31, | |
| | | 2015 | | | 2014 | | | 2013 | | | 2012 | | | 2011 | | | 2010 | |
Net asset value, beginning of period | | | $14.91 | | | | $15.09 | | | | $12.02 | | | | $11.16 | | | | $10.96 | | | | $10.52 | |
Income from investment operations: | | | | | | | | | | | | | | | | | | | | | | | | |
Net investment income (loss)(a) | | | 0.07 | | | | 0.14 | | | | 0.14 | | | | 0.07 | | | | (0.01 | ) | | | (0.02 | ) |
Net realized and unrealized gain (loss) | | | (0.09 | ) | | | 0.90 | | | | 3.07 | | | | 0.79 | | | | 0.21 | | | | 0.46 | |
Total from investment operations | | | (0.02 | ) | | | 1.04 | | | | 3.21 | | | | 0.86 | | | | 0.20 | | | | 0.44 | |
Distributions: | | | | | | | | | | | | | | | | | | | | | | | | |
Dividends from net investment income | | | (0.12 | ) | | | (0.11 | ) | | | (0.14 | ) | | | — | | | | — | | | | (0.00 | )** |
Dividends from net realized gains | | | (0.99 | ) | | | (1.11 | ) | | | — | | | | — | | | | — | | | | — | |
Total distributions | | | (1.11 | ) | | | (1.22 | ) | | | (0.14 | ) | | | — | | | | — | | | | — | |
Net asset value, end of period | | | $13.78 | | | | $14.91 | | | | $15.09 | | | | $12.02 | | | | $11.16 | | | | $10.96 | |
Ratios and supplemental data: | | | | | | | | | | | | | | | | | | | | | | | | |
Total return(b) | | | (0.18% | ) | | | 7.28% | | | | 26.94% | | | | 7.71% | | | | 1.82% | | | | 4.21% | |
Net assets, end of period (000) | | | $152 | | | | $144 | | | | $128 | | | | $98 | | | | $91 | | | | $89 | |
Ratio of net expenses to average net assets | | | 1.40% | (c) | | | 1.40% | | | | 1.40% | | | | 1.40% | | | | 1.76% | | | | 1.85% | |
Ratio of gross expenses to average net assets prior to expense reductions | | | 1.82% | (c) | | | 1.75% | | | | 1.78% | | | | 1.97% | | | | 1.93% | | | | 1.85% | |
Ratio of net investment income (loss) to average net assets | | | 1.04% | (c) | | | 0.95% | | | | 1.08% | | | | 0.65% | | | | (0.10% | ) | | | (0.23% | ) |
| ** | Amounts are less than $0.005. |
| (a) | Net investment income (loss) allocated based on average shares method. |
| (b) | Total return measures net investment income (loss) and capital gain or loss from portfolio investments assuming reinvestment of dividends and capital gains distributions. Total return is not annualized for periods that are less than a full year, does not reflect the effect of sales charge for Class A shares nor the contingent deferred sales charge for Class B and C shares and does not reflect the deduction of taxes that a shareholder would pay on fund distributions or the redemption of fund shares. |
Calamos Focus Growth Fund Financial Highlights
Selected data for a share outstanding throughout each period were as follows:
| | | | | | | | | | | | | | | | | | | | | | | | |
| | | CLASS A | |
| | | (Unaudited)
Six Months
Ended
April 30, | | | Year Ended October 31, | |
| | | 2015 | | | 2014 | | | 2013 | | | 2012 | | | 2011 | | | 2010 | |
Net asset value, beginning of period | | | $18.59 | | | | $16.71 | | | | $13.10 | | | | $12.37 | | | | $11.93 | | | | $10.51 | |
Income from investment operations: | | | | | | | | | | | | | | | | | | | | | | | | |
Net investment income (loss)(a) | | | 0.01 | | | | (0.04 | ) | | | 0.00 | ** | | | 0.01 | | | | (0.03 | ) | | | (0.02 | ) |
Net realized and unrealized gain (loss) | | | 0.87 | | | | 1.94 | | | | 3.67 | | | | 0.72 | | | | 0.47 | | | | 1.46 | |
Total from investment operations | | | 0.88 | | | | 1.90 | | | | 3.67 | | | | 0.73 | | | | 0.44 | | | | 1.44 | |
Distributions: | | | | | | | | | | | | | | | | | | | | | | | | |
Dividends from net investment income | | | — | | | | (0.02 | ) | | | (0.06 | ) | | | — | | | | — | | | | (0.02 | ) |
Dividends from net realized gains | | | (1.81 | ) | | | — | | | | — | | | | — | | | | — | | | | — | |
Total distributions | | | (1.81 | ) | | | (0.02 | ) | | | (0.06 | ) | | | — | | | | — | | | | (0.02 | ) |
Net asset value, end of period | | | $17.66 | | | | $18.59 | | | | $16.71 | | | | $13.10 | | | | $12.37 | | | | $11.93 | |
Ratios and supplemental data: | | | | | | | | | | | | | | | | | | | | | | | | |
Total return(b) | | | 5.10% | | | | 11.37% | | | | 28.15% | | | | 5.90% | | | | 3.69% | | | | 13.72% | |
Net assets, end of period (000) | | | $18,794 | | | | $19,709 | | | | $26,249 | | | | $22,389 | | | | $22,702 | | | | $24,518 | |
Ratio of net expenses to average net assets | | | 1.15% | (c) | | | 1.15% | | | | 1.15% | | | | 1.15% | | | | 1.44% | | | | 1.56% | |
Ratio of gross expenses to average net assets prior to expense reductions | | | 1.56% | (c) | | | 1.52% | | | | 1.63% | | | | 1.57% | | | | 1.57% | | | | 1.56% | |
Ratio of net investment income (loss) to average net assets | | | 0.13% | (c) | | | (0.25% | ) | | | 0.01% | | | | 0.06% | | | | (0.28% | ) | | | (0.18% | ) |
| | |
| | | (Unaudited)
Six Months
Ended
April 30, | | | Year Ended October 31, | |
| | | 2015 | | | 2014 | | | 2013 | | | 2012 | | | 2011 | | | 2010 | |
Portfolio turnover rate | | | 85.7% | | | | 61.0% | | | | 89.0% | | | | 47.9% | | | | 73.5% | | | | 49.4% | |
| ** | Amounts are less than $0.005. |
| (a) | Net investment income (loss) allocated based on average shares method. |
| (b) | Total return measures net investment income (loss) and capital gain or loss from portfolio investments assuming reinvestment of dividends and capital gains distributions. Total return is not annualized for periods that are less than a full year, does not reflect the effect of sales charge for Class A shares nor the contingent deferred sales charge for Class B and C shares and does not reflect the deduction of taxes that a shareholder would pay on fund distributions or the redemption of fund shares. |
| | | | |
| 194 | | CALAMOS OPEN-END FAMILY OF FUNDS SEMIANNUAL REPORT | | |
Calamos Focus Growth Fund Financial Highlights
| | | | | | | | | | | | | | | | | | | | | | | | |
| | | CLASS B | |
| | | (Unaudited)
Six Months
Ended
April 30, | | | Year Ended October 31, | |
| | | 2015 | | | 2014 | | | 2013 | | | 2012 | | | 2011 | | | 2010 | |
Net asset value, beginning of period | | | $17.42 | | | | $15.76 | | | | $12.39 | | | | $11.78 | | | | $11.45 | | | | $10.14 | |
Income from investment operations: | | | | | | | | | | | | | | | | | | | | | | | | |
Net investment income (loss)(a) | | | (0.05 | ) | | | (0.17 | ) | | | (0.09 | ) | | | (0.08 | ) | | | (0.13 | ) | | | (0.10 | ) |
Net realized and unrealized gain (loss) | | | 0.80 | | | | 1.83 | | | | 3.46 | | | | 0.69 | | | | 0.46 | | | | 1.41 | |
Total from investment operations | | | 0.75 | | | | 1.66 | | | | 3.37 | | | | 0.61 | | | | 0.33 | | | | 1.31 | |
Distributions: | | | | | | | | | | | | | | | | | | | | | | | | |
Dividends from net investment income | | | — | | | | — | | | | — | | | | — | | | | — | | | | — | |
Dividends from net realized gains | | | (1.81 | ) | | | — | | | | — | | | | — | | | | — | | | | — | |
Total distributions | | | (1.81 | ) | | | — | | | | — | | | | — | | | | — | | | | — | |
Net asset value, end of period | | | $16.36 | | | | $17.42 | | | | $15.76 | | | | $12.39 | | | | $11.78 | | | | $11.45 | |
Ratios and supplemental data: | | | | | | | | | | | | | | | | | | | | | | | | |
Total return(b) | | | 4.66% | | | | 10.53% | | | | 27.20% | | | | 5.18% | | | | 2.88% | | | | 12.92% | |
Net assets, end of period (000) | | | $421 | | | | $449 | | | | $796 | | | | $1,662 | | | | $2,893 | | | | $4,171 | |
Ratio of net expenses to average net assets | | | 1.90% | (c) | | | 1.90% | | | | 1.90% | | | | 1.90% | | | | 2.20% | | | | 2.31% | |
Ratio of gross expenses to average net assets prior to expense reductions | | | 2.31% | (c) | | | 2.27% | | | | 2.39% | | | | 2.33% | | | | 2.32% | | | | 2.31% | |
Ratio of net investment income (loss) to average net assets | | | (0.62% | )(c) | | | (1.00% | ) | | | (0.68% | ) | | | (0.70% | ) | | | (1.03% | ) | | | (0.92% | ) |
| |
| | | CLASS C | |
| | | (Unaudited)
Six Months
Ended
April 30, | | | Year Ended October 31, | |
| | | 2015 | | | 2014 | | | 2013 | | | 2012 | | | 2011 | | | 2010 | |
Net asset value, beginning of period | | | $17.42 | | | | $15.76 | | | | $12.39 | | | | $11.79 | | | | $11.45 | | | | $10.15 | |
Income from investment operations: | | | | | | | | | | | | | | | | | | | | | | | | |
Net investment income (loss)(a) | | | (0.05 | ) | | | (0.17 | ) | | | (0.10 | ) | | | (0.09 | ) | | | (0.12 | ) | | | (0.10 | ) |
Net realized and unrealized gain (loss) | | | 0.81 | | | | 1.83 | | | | 3.47 | | | | 0.69 | | | | 0.46 | | | | 1.40 | |
Total from investment operations | | | 0.76 | | | | 1.66 | | | | 3.37 | | | | 0.60 | | | | 0.34 | | | | 1.30 | |
Distributions: | | | | | | | | | | | | | | | | | | | | | | | | |
Dividends from net investment income | | | — | | | | — | | | | — | | | | — | | | | — | | | | — | |
Dividends from net realized gains | | | (1.81 | ) | | | — | | | | — | | | | — | | | | — | | | | — | |
Total distributions | | | (1.81 | ) | | | — | | | | — | | | | — | | | | — | | | | — | |
Net asset value, end of period | | | $16.37 | | | | $17.42 | | | | $15.76 | | | | $12.39 | | | | $11.79 | | | | $11.45 | |
Ratios and supplemental data: | | | | | | | | | | | | | | | | | | | | | | | | |
Total return(b) | | | 4.72% | | | | 10.53% | | | | 27.20% | | | | 5.09% | | | | 2.97% | | | | 12.81% | |
Net assets, end of period (000) | | | $14,536 | | | | $14,092 | | | | $10,914 | | | | $9,287 | | | | $10,153 | | | | $10,628 | |
Ratio of net expenses to average net assets | | | 1.90% | (c) | | | 1.90% | | | | 1.90% | | | | 1.90% | | | | 2.19% | | | | 2.31% | |
Ratio of gross expenses to average net assets prior to expense reductions | | | 2.31% | (c) | | | 2.27% | | | | 2.38% | | | | 2.33% | | | | 2.32% | | | | 2.31% | |
Ratio of net investment income (loss) to average net assets | | | (0.63% | )(c) | | | (1.01% | ) | | | (0.74% | ) | | | (0.70% | ) | | | (1.03% | ) | | | (0.92% | ) |
| (a) | Net investment income (loss) allocated based on average shares method. |
| (b) | Total return measures net investment income (loss) and capital gain or loss from portfolio investments assuming reinvestment of dividends and capital gains distributions. Total return is not annualized for periods that are less than a full year, does not reflect the effect of sales charge for Class A shares nor the contingent deferred sales charge for Class B and C shares and does not reflect the deduction of taxes that a shareholder would pay on fund distributions or the redemption of fund shares. |
Calamos Focus Growth Fund Financial Highlights
| | | | | | | | | | | | | | | | | | | | | | | | |
| | | CLASS I | |
| | | (Unaudited)
Six Months
Ended
April 30, | | | Year Ended October 31, | |
| | | 2015 | | | 2014 | | | 2013 | | | 2012 | | | 2011 | | | 2010 | |
Net asset value, beginning of period | | | $18.77 | | | | $16.86 | | | | $13.23 | | | | $12.46 | | | | $11.98 | | | | $10.56 | |
Income from investment operations: | | | | | | | | | | | | | | | | | | | | | | | | |
Net investment income (loss)(a) | | | 0.03 | | | | 0.00 | •• | | | 0.04 | | | | 0.04 | | | | (0.00 | ) | | | 0.01 | |
Net realized and unrealized gain (loss) | | | 0.88 | | | | 1.96 | | | | 3.69 | | | | 0.73 | | | | 0.48 | | | | 1.46 | |
Total from investment operations 0.91 | | | 1.96 | | | | 3.73 | | | | 0.77 | | | | 0.48 | | | | 1.47 | | | | | |
Distributions: | | | | | | | | | | | | | | | | | | | | | | | | |
Dividends from net investment income | | | — | | | | (0.05 | ) | | | (0.10 | ) | | | — | | | | — | | | | (0.05 | ) |
Dividends from net realized gains | | | (1.81 | ) | | | — | | | | — | | | | — | | | | — | | | | — | |
Total distributions | | | (1.81 | ) | | | (0.05 | ) | | | (0.10 | ) | | | — | | | | — | | | | (0.05 | ) |
Net asset value, end of period | | | $17.87 | | | | $18.77 | | | | $16.86 | | | | $13.23 | | | | $12.46 | | | | $11.98 | |
Ratios and supplemental data: | | | | | | | | | | | | | | | | | | | | | | | | |
Total return(b) | | | 5.22% | | | | 11.67% | | | | 28.42% | | | | 6.18% | | | | 4.01% | | | | 13.97% | |
Net assets, end of period (000) | | | $31,675 | | | | $30,173 | | | | $27,931 | | | | $24,863 | | | | $24,547 | | | | $23,441 | |
Ratio of net expenses to average net assets | | | 0.90% | (c) | | | 0.90% | | | | 0.90% | | | | 0.90% | | | | 1.18% | | | | 1.31% | |
Ratio of gross expenses to average net assets prior to expense reductions | | | 1.31% | (c) | | | 1.27% | | | | 1.38% | | | | 1.32% | | | | 1.32% | | | | 1.31% | |
Ratio of net investment income (loss) to average net assets | | | 0.38% | (c) | | | 0.00% | ••• | | | 0.27% | | | | 0.30% | | | | (0.02% | ) | | | 0.08% | |
| |
| | | CLASS R | |
| | | (Unaudited)
Six Months
Ended
April 30, | | | Year Ended October 31, | |
| | | 2015 | | | 2014 | | | 2013 | | | 2012 | | | 2011 | | | 2010 | |
Net asset value, beginning of period | | | $18.34 | | | | $16.51 | | | | $12.97 | | | | $12.28 | | | | $11.87 | | | | $10.47 | |
Income from investment operations: | | | | | | | | | | | | | | | | | | | | | | | | |
Net investment income (loss)(a) | | | (0.01 | ) | | | (0.08 | ) | | | (0.04 | ) | | | (0.03 | ) | | | (0.07 | ) | | | (0.05 | ) |
Net realized and unrealized gain (loss) | | | 0.86 | | | | 1.91 | | | | 3.63 | | | | 0.72 | | | | 0.48 | | | | 1.45 | |
Total from investment operations 0.85 | | | 1.83 | | | | 3.59 | | | | 0.69 | | | | 0.41 | | | | 1.40 | | | | | |
Distributions: | | | | | | | | | | | | | | | | | | | | | | | | |
Dividends from net investment income | | | — | | | | — | | | | (0.05 | ) | | | — | | | | — | | | | — | |
Dividends from net realized gains | | | (1.81 | ) | | | — | | | | — | | | | — | | | | — | | | | — | |
Total distributions | | | (1.81 | ) | | | — | | | | (0.05 | ) | | | — | | | | — | | | | — | |
Net asset value, end of period | | | $17.38 | | | | $18.34 | | | | $16.51 | | | | $12.97 | | | | $12.28 | | | | $11.87 | |
Ratios and supplemental data: | | | | | | | | | | | | | | | | | | | | | | | | |
Total return(b) | | | 5.00% | | | | 11.08% | | | | 27.80% | | | | 5.62% | | | | 3.45% | | | | 13.37% | |
Net assets, end of period (000) | | | $232 | | | | $204 | | | | $266 | | | | $172 | | | | $103 | | | | $99 | |
Ratio of net expenses to average net assets | | | 1.40% | (c) | | | 1.40% | | | | 1.40% | | | | 1.40% | | | | 1.68% | | | | 1.81% | |
Ratio of gross expenses to average net assets prior to expense reductions | | | 1.81% | (c) | | | 1.77% | | | | 1.88% | | | | 1.82% | | | | 1.82% | | | | 1.81% | |
Ratio of net investment income (loss) to average net assets | | | (0.14% | )(c) | | | (0.49% | ) | | | (0.26% | ) | | | (0.21% | ) | | | (0.52% | ) | | | (0.43% | ) |
| •• | Amounts are less than $0.005. |
| ••• | Amount is less than 0.005% |
| (a) | Net investment income (loss) allocated based on average shares method. |
| (b) | Total return measures net investment income (loss) and capital gain or loss from portfolio investments assuming reinvestment of dividends and capital gains distributions. Total return is not annualized for periods that are less than a full year, does not reflect the effect of sales charge for Class A shares nor the contingent deferred sales charge for Class B and C shares and does not reflect the deduction of taxes that a shareholder would pay on fund distributions or the redemption of fund shares. |
| | | | |
| 196 | | CALAMOS OPEN-END FAMILY OF FUNDS SEMIANNUAL REPORT | | |
Calamos Discovery Growth Fund Financial Highlights
Selected data for a share outstanding throughout each period were as follows:
| | | | | | | | | | | | | | | | | | | | | | | | |
| | | CLASS A | |
| | | (Unaudited)
Six Months
Ended
April 30, | | | Year Ended October 31, | | | June 1, 2010*
through
October 31, | |
| | | 2015 | | | 2014 | | | 2013 | | | 2012 | | | 2011 | | | 2010 | |
Net asset value, beginning of period | | | $14.33 | | | | $14.77 | | | | $11.82 | | | | $12.04 | | | | $11.64 | | | | $10.00 | |
Income from investment operations: | | | | | | | | | | | | | | | | | | | | | | | | |
Net investment income (loss)(a) | | | (0.07 | ) | | | (0.15 | ) | | | (0.12 | ) | | | (0.13 | ) | | | (0.14 | ) | | | (0.04 | ) |
Net realized and unrealized gain (loss) | | | 0.83 | | | | 1.78 | | | | 3.07 | | | | (0.09 | ) | | | 0.55 | | | | 1.68 | |
Total from investment operations | | | 0.76 | | | | 1.63 | | | | 2.95 | | | | (0.22 | ) | | | 0.41 | | | | 1.64 | |
Distributions: | | | | | | | | | | | | | | | | | | | | | | | | |
Dividends from net investment income | | | — | | | | — | | | | — | | | | — | | | | (0.01 | ) | | | — | |
Dividends from net realized gains | | | (1.34 | ) | | | (2.07 | ) | | | — | | | | — | | | | — | | | | — | |
Total distributions | | | (1.34 | ) | | | (2.07 | ) | | | — | | | | — | | | | (0.01 | ) | | | — | |
Net asset value, end of period | | | $13.75 | | | | $14.33 | | | | $14.77 | | | | $11.82 | | | | $12.04 | | | | $11.64 | |
Ratios and supplemental data: | | | | | | | | | | | | | | | | | | | | | | | | |
Total return(b) | | | 5.72% | | | | 12.14% | | | | 24.96% | | | | (1.83% | ) | | | 3.55% | | | | 16.40% | |
Net assets, end of period (000) | | | $31,021 | | | | $31,009 | | | | $30,726 | | | | $21,384 | | | | $23,463 | | | | $14,557 | |
Ratio of net expenses to average net assets | | | 1.50% | (c) | | | 1.50% | | | | 1.50% | | | | 1.50% | | | | 1.50% | | | | 1.50% | (c) |
Ratio of gross expenses to average net assets prior to expense reductions | | | 1.62% | (c) | | | 1.62% | | | | 1.69% | | | | 1.74% | | | | 1.84% | | | | 2.63% | (c) |
Ratio of net investment income (loss) to average net assets | | | (1.05% | )(c) | | | (1.06% | ) | | | (0.88% | ) | | | (1.10% | ) | | | (1.08% | ) | | | (0.99% | )(c) |
| | | |
| | | (Unaudited)
Six Months
Ended
April 30, | | | Year Ended October 31, | | | June 1, 2010*
through
October 31, | |
| | | 2015 | | | 2014 | | | 2013 | | | 2012 | | | 2011 | | | 2010 | |
Portfolio turnover rate | | | 47.1% | | | | 152.7% | | | | 248.3% | | | | 139.8% | | | | 97.1% | | | | 26.2% | |
| * | Commencement of operations. |
| (a) | Net investment income (loss) allocated based on average shares method. |
| (b) | Total return measures net investment income (loss) and capital gain or loss from portfolio investments assuming reinvestment of dividends and capital gains distributions. Total return is not annualized for periods that are less than a full year, does not reflect the effect of sales charge for Class A shares nor the contingent deferred sales charge for Class B and C shares and does not reflect the deduction of taxes that a shareholder would pay on fund distributions or the redemption of fund shares. |
Calamos Discovery Growth Fund Financial Highlights
| | | | | | | | | | | | | | | | | | | | | | | | |
| | | CLASS B | |
| | | (Unaudited)
Six Months
Ended
April 30, | | | Year Ended October 31, | | | June 1, 2010*
through
October 31, | |
| | | 2015 | | | 2014 | | | 2013 | | | 2012 | | | 2011 | | | 2010* | |
Net asset value, beginning of period | | | $13.83 | | | | $14.42 | | | | $11.63 | | | | $11.93 | | | | $11.60 | | | | $10.00 | |
Income from investment operations: | | | | | | | | | | | | | | | | | | | | | | | | |
Net investment income (loss)(a) | | | (0.12 | ) | | | (0.24 | ) | | | (0.20 | ) | | | (0.22 | ) | | | (0.24 | ) | | | (0.08 | ) |
Net realized and unrealized gain (loss) | | | 0.81 | | | | 1.72 | | | | 2.99 | | | | (0.08 | ) | | | 0.57 | | | | 1.68 | |
Total from investment operations | | | 0.69 | | | | 1.48 | | | | 2.79 | | | | (0.30 | ) | | | 0.33 | | | | 1.60 | |
Distributions: | | | | | | | | | | | | | | | | | | | | | | | | |
Dividends from net investment income | | | — | | | | — | | | | — | | | | — | | | | — | | | | — | |
Dividends from net realized gains | | | (1.34 | ) | | | (2.07 | ) | | | — | | | | — | | | | — | | | | — | |
Total distributions | | | (1.34 | ) | | | (2.07 | ) | | | — | | | | — | | | | — | | | | — | |
Net asset value, end of period | | | $13.18 | | | | $13.83 | | | | $14.42 | | | | $11.63 | | | | $11.93 | | | | $11.60 | |
Ratios and supplemental data: | | | | | | | | | | | | | | | | | | | | | | | | |
Total return(b) | | | 5.40% | | | | 11.28% | | | | 23.99% | | | | (2.51% | ) | | | 2.84% | | | | 16.00% | |
Net assets, end of period (000) | | | $1,759 | | | | $1,682 | | | | $1,633 | | | | $1,338 | | | | $1,451 | | | | $1,160 | |
Ratio of net expenses to average net assets | | | 2.25% | (c) | | | 2.25% | | | | 2.25% | | | | 2.25% | | | | 2.25% | | | | 2.25% | (c) |
Ratio of gross expenses to average net assets prior to expense reductions | | | 2.37% | (c) | | | 2.37% | | | | 2.44% | | | | 2.49% | | | | 2.61% | | | | 3.41% | (c) |
Ratio of net investment income (loss) to average net assets | | | (1.80% | )(c) | | | (1.81% | ) | | | (1.60% | ) | | | (1.84% | ) | | | (1.81% | ) | | | (1.74% | )(c) |
| |
| | | Class C | |
| | | (Unaudited)
Six Months
Ended
April 30, | | | Year Ended October 31, | | | June 1, 2010*
through
October 31, | |
| | | 2015 | | | 2014 | | | 2013 | | | 2012 | | | 2011 | | | 2010* | |
Net asset value, beginning of period | | | $13.83 | | | | $14.42 | | | | $11.64 | | | | $11.93 | | | | $11.60 | | | | $10.00 | |
Income from investment operations: | | | | | | | | | | | | | | | | | | | | | | | | |
Net investment income (loss)(a) | | | (0.12 | ) | | | (0.24 | ) | | | (0.20 | ) | | | (0.22 | ) | | | (0.24 | ) | | | (0.08 | ) |
Net realized and unrealized gain (loss) | | | 0.80 | | | | 1.72 | | | | 2.98 | | | | (0.07 | ) | | | 0.57 | | | | 1.68 | |
Total from investment operations | | | 0.68 | | | | 1.48 | | | | 2.78 | | | | (0.29 | ) | | | 0.33 | | | | 1.60 | |
Distributions: | | | | | | | | | | | | | | | | | | | | | | | | |
Dividends from net investment income | | | — | | | | — | | | | — | | | | — | | | | — | | | | — | |
Dividends from net realized gains | | | (1.34 | ) | | | (2.07 | ) | | | — | | | | — | | | | — | | | | — | |
Total distributions | | | (1.34 | ) | | | (2.07 | ) | | | — | | | | — | | | | — | | | | — | |
Net asset value, end of period | | | $13.17 | | | | $13.83 | | | | $14.42 | | | | $11.64 | | | | $11.93 | | | | $11.60 | |
Ratios and supplemental data: | | | | | | | | | | | | | | | | | | | | | | | | |
Total return(b) | | | 5.32% | | | | 11.30% | | | | 23.88% | | | | (2.43% | ) | | | 2.84% | | | | 16.00% | |
Net assets, end of period (000) | | | $2,644 | | | | $2,542 | | | | $2,553 | | | | $2,274 | | | | $2,524 | | | | $1,545 | |
Ratio of net expenses to average net assets | | | 2.25% | (c) | | | 2.25% | | | | 2.25% | | | | 2.25% | | | | 2.25% | | | | 2.25% | (c) |
Ratio of gross expenses to average net assets prior to expense reductions | | | 2.37% | (c) | | | 2.37% | | | | 2.45% | | | | 2.49% | | | | 2.59% | | | | 3.38% | (c) |
Ratio of net investment income (loss) to average net assets | | | (1.80% | )(c) | | | (1.80% | ) | | | (1.56% | ) | | | (1.84% | ) | | | (1.82% | ) | | | (1.76% | )(c) |
| * | Commencement of operations. |
| (a) | Net investment income (loss) allocated based on average shares method. |
| (b) | Total return measures net investment income (loss) and capital gain or loss from portfolio investments assuming reinvestment of dividends and capital gains distributions. Total return is not annualized for periods that are less than a full year, does not reflect the effect of sales charge for Class A shares nor the contingent deferred sales charge for Class B and C shares and does not reflect the deduction of taxes that a shareholder would pay on fund distributions or the redemption of fund shares. |
| | | | |
| 198 | | CALAMOS OPEN-END FAMILY OF FUNDS SEMIANNUAL REPORT | | |
Calamos Discovery Growth Fund Financial Highlights
| | | | | | | | | | | | | | | | | | | | | | | | |
| | | Class I | |
| | | (Unaudited)
Six Months
Ended
April 30, | | | Year Ended October 31, | | | June 1, 2010*
through
October 31, | |
| | | 2015 | | | 2014 | | | 2013 | | | 2012 | | | 2011 | | | 2010* | |
Net asset value, beginning of period | | $ | 14.50 | | | $ | 14.89 | | | $ | 11.89 | | | $ | 12.07 | | | $ | 11.65 | | | $ | 10.00 | |
Income from investment operations: | | | | | | | | | | | | | | | | | | | | | | | | |
Net investment income (loss)(a) | | | (0.05 | ) | | | (0.11 | ) | | | (0.08 | ) | | | (0.10 | ) | | | (0.12 | ) | | | (0.03 | ) |
Net realized and unrealized gain (loss) | | | 0.84 | | | | 1.79 | | | | 3.08 | | | | (0.08 | ) | | | 0.57 | | | | 1.68 | |
Total from investment operations | | | 0.79 | | | | 1.68 | | | | 3.00 | | | | (0.18 | ) | | | 0.45 | | | | 1.65 | |
Distributions: | | | | | | | | | | | | | | | | | | | | | | | | |
Dividends from net investment income | | | — | | | | — | | | | — | | | | — | | | | (0.03 | ) | | | — | |
Dividends from net realized gains | | | (1.34 | ) | | | (2.07 | ) | | | — | | | | — | | | | — | | | | — | |
Total distributions | | | (1.34 | ) | | | (2.07 | ) | | | — | | | | — | | | | (0.03 | ) | | | — | |
Net asset value, end of period | | $ | 13.95 | | | $ | 14.50 | | | $ | 14.89 | | | $ | 11.89 | | | $ | 12.07 | | | $ | 11.65 | |
Ratios and supplemental data: | | | | | | | | | | | | | | | | | | | | | | | | |
Total return(b) | | | 5.87 | % | | | 12.40 | % | | | 25.23 | % | | | (1.49 | %) | | | 3.82 | % | | | 16.50 | % |
Net assets, end of period (000) | | $ | 11,175 | | | $ | 10,519 | | | $ | 11,062 | | | $ | 8,608 | | | $ | 7,738 | | | $ | 2,540 | |
Ratio of net expenses to average net assets | | | 1.25 | %(c) | | | 1.25 | % | | | 1.25 | % | | | 1.25 | % | | | 1.25 | % | | | 1.25 | %(c) |
Ratio of gross expenses to average net assets prior to expense reductions | | | 1.37 | %(c) | | | 1.37 | % | | | 1.44 | % | | | 1.49 | % | | | 1.54 | % | | | 2.40 | %(c) |
Ratio of net investment income (loss) to average net assets | | | (0.80 | %)(c) | | | (0.81 | %) | | | (0.60 | %) | | | (0.83 | %) | | | (0.89 | %) | | | (0.74 | %)(c) |
| |
| | | CLASS R | |
| | | (Unaudited)
Six Months
Ended
April 30, | | | Year Ended October 31, | | | June 1, 2010*
through
October 31, | |
| | | 2015 | | | 2014 | | | 2013 | | | 2012 | | | 2011 | | | 2010* | |
Net asset value, beginning of period | | $ | 14.18 | | | $ | 14.66 | | | $ | 11.77 | | | $ | 12.01 | | | $ | 11.63 | | | $ | 10.00 | |
Income from investment operations: | | | | | | | | | | | | | | | | | | | | | | | | |
Net investment income (loss)(a) | | | (0.09 | ) | | | (0.18 | ) | | | (0.14 | ) | | | (0.16 | ) | | | (0.17 | ) | | | (0.05 | ) |
Net realized and unrealized gain (loss) | | | 0.82 | | | | 1.77 | | | | 3.03 | | | | (0.08 | ) | | | 0.55 | | | | 1.68 | |
Total from investment operations | | | 0.73 | | | | 1.59 | | | | 2.89 | | | | (0.24 | ) | | | 0.38 | | | | 1.63 | |
Distributions: | | | | | | | | | | | | | | | | | | | | | | | | |
Dividends from net investment income | | | — | | | | — | | | | — | | | | — | | | | — | | | | — | |
Dividends from net realized gains | | | (1.34 | ) | | | (2.07 | ) | | | — | | | | — | | | | — | | | | — | |
Total distributions | | | (1.34 | ) | | | (2.07 | ) | | | — | | | | — | | | | — | | | | — | |
Net asset value, end of period | | $ | 13.57 | | | $ | 14.18 | | | $ | 14.66 | | | $ | 11.77 | | | $ | 12.01 | | | $ | 11.63 | |
Ratios and supplemental data: | | | | | | | | | | | | | | | | | | | | | | | | |
Total return(b) | | | 5.56 | % | | | 11.93 | % | | | 24.55 | % | | | (2.00 | %) | | | 3.27 | % | | | 16.30 | % |
Net assets, end of period (000) | | $ | 1,922 | | | $ | 1,822 | | | $ | 1,787 | | | $ | 1,175 | | | $ | 1,201 | | | $ | 1,163 | |
Ratio of net expenses to average net assets | | | 1.75 | %(c) | | | 1.75 | % | | | 1.75 | % | | | 1.75 | % | | | 1.75 | % | | | 1.75 | %(c) |
Ratio of gross expenses to average net assets prior to expense reductions | | | 1.87 | %(c) | | | 1.87 | % | | | 1.94 | % | | | 1.99 | % | | | 2.13 | % | | | 2.91 | %(c) |
Ratio of net investment income (loss) to average net assets | | | (1.30 | %)(c) | | | (1.31 | %) | | | (1.11 | %) | | | (1.34 | %) | | | (1.29 | %) | | | (1.24 | %)(c) |
| * | Commencement of operations. |
| (a) | Net investment income (loss) allocated based on average shares method. |
| (b) | Total return measures net investment income (loss) and capital gain or loss from portfolio investments assuming reinvestment of dividends and capital gains distributions. Total return is not annualized for periods that are less than a full year, does not reflect the effect of sales charge for Class A shares nor the contingent deferred sales charge for Class B and C shares and does not reflect the deduction of taxes that a shareholder would pay on fund distributions or the redemption of fund shares. |
Calamos Dividend Growth Fund Financial Highlights
Selected data for a share outstanding throughout each period were as follows:
| | | | | | | | | | | | |
| | | CLASS A | |
| | | (Unaudited)
Six Months
Ended
April 30, | | | Year Ended
October 31, | | | August 5, 2013*
through
October 31, | |
| | | 2015 | | | 2014 | | | 2013 | |
Net asset value, beginning of period | | | $10.78 | | | | $10.36 | | | | $10.00 | |
Income from investment operations: | | | | | | | | | | | | |
Net investment income (loss)(a) | | | 0.12 | | | | 0.39 | | | | 0.05 | |
Net realized and unrealized gain (loss) | | | (0.03 | ) | | | 0.24 | | | | 0.31 | |
Total from investment operations | | | 0.09 | | | | 0.63 | | | | 0.36 | |
Distributions: | | | | | | | | | | | | |
Dividends from net investment income | | | (0.15 | ) | | | (0.18 | ) | | | — | |
Dividends from net realized gains | | | (0.13 | ) | | | (0.03 | ) | | | — | |
Total distributions | | | (0.28 | ) | | | (0.21 | ) | | | — | |
Net asset value, end of period | | | $10.59 | | | | $10.78 | | | | $10.36 | |
Ratios and supplemental data: | | | | | | | | | | | | |
Total return(b) | | | 0.88% | | | | 6.12% | | | | 3.60% | |
Net assets, end of period (000) | | | $24,802 | | | | $28,365 | | | | $25,922 | |
Ratio of net expenses to average net assets | | | 1.35% | (c) | | | 1.35% | | | | 1.35% | (c) |
Ratio of gross expenses to average net assets prior to expense reductions | | | 1.69% | (c) | | | 1.73% | | | | 2.14% | (c) |
Ratio of net investment income (loss) to average net assets | | | 2.20% | (c) | | | 3.68% | | | | 1.99% | (c) |
| | | |
| | | (Unaudited)
Six Months
Ended
April 30, | | | Year Ended
October 31, | | | August 5, 2013*
through
October 31, | |
| | | 2015 | | | 2014 | | | 2013 | |
Portfolio turnover rate | | | 75.3% | | | | 130.0% | | | | 20.7% | |
| * | Commencement of operations. |
| (a) | Net investment income (loss) allocated based on average shares method. |
| (b) | Total return measures net investment income (loss) and capital gain or loss from portfolio investments assuming reinvestment of dividends and capital gains distributions. Total return is not annualized for periods that are less than a full year, does not reflect the effect of sales charge for Class A shares nor the contingent deferred sales charge for Class C shares and does not reflect the deduction of taxes that a shareholder would pay on fund distributions or the redemption of fund shares. |
| | | | |
| 200 | | CALAMOS OPEN-END FAMILY OF FUNDS SEMIANNUAL REPORT | | |
Calamos Dividend Growth Fund Financial Highlights
| | | | | | | | | | | | |
| | | CLASS C | |
| | | (Unaudited)
Six Months
Ended
April 30, | | | Year Ended
October 31, | | | August 5, 2013*
through
October 31, | |
| | | 2015 | | | 2014 | | | 2013* | |
Net asset value, beginning of period | | | $10.74 | | | | $10.34 | | | | $10.00 | |
Income from investment operations: | | | | | | | | | | | | |
Net investment income (loss)(a) | | | 0.07 | | | | 0.31 | | | | 0.03 | |
Net realized and unrealized gain (loss) | | | (0.03 | ) | | | 0.25 | | | | 0.31 | |
Total from investment operations | | | 0.04 | | | | 0.56 | | | | 0.34 | |
Distributions: | | | | | | | | | | | | |
Dividends from net investment income | | | (0.13 | ) | | | (0.13 | ) | | | — | |
Dividends from net realized gains | | | (0.13 | ) | | | (0.03 | ) | | | — | |
Total distributions | | | (0.26 | ) | | | (0.16 | ) | | | — | |
Net asset value, end of period | | | $10.52 | | | | $10.74 | | | | $10.34 | |
Ratios and supplemental data: | | | | | | | | | | | | |
Total return(b) | | | 0.42% | | | | 5.40% | | | | 3.40% | |
Net assets, end of period (000) | | | $659 | | | | $418 | | | | $253 | |
Ratio of net expenses to average net assets | | | 2.10% | (c) | | | 2.10% | | | | 2.10% | (c) |
Ratio of gross expenses to average net assets prior to expense reductions | | | 2.46% | (c) | | | 2.44% | | | | 3.35% | (c) |
Ratio of net investment income (loss) to average net assets | | | 1.29% | (c) | | | 2.90% | | | | 1.39% | (c) |
| |
| | | Class I | |
| | | (Unaudited)
Six Months
Ended
April 30, | | | Year Ended
October 31, | | | August 5, 2013*
through
October 31, | |
| | | 2015 | | | 2014 | | | 2013* | |
Net asset value, beginning of period | | | $10.79 | | | | $10.37 | | | | $10.00 | |
Income from investment operations: | | | | | | | | | | | | |
Net investment income (loss)(a) | | | 0.13 | | | | 0.42 | | | | 0.05 | |
Net realized and unrealized gain (loss) | | | (0.04 | ) | | | 0.23 | | | | 0.32 | |
Total from investment operations | | | 0.09 | | | | 0.65 | | | | 0.37 | |
Distributions: | | | | | | | | | | | | |
Dividends from net investment income | | | (0.15 | ) | | | (0.20 | ) | | | — | |
Dividends from net realized gains | | | (0.13 | ) | | | (0.03 | ) | | | — | |
Total distributions | | | (0.28 | ) | | | (0.23 | ) | | | — | |
Net asset value, end of period | | | $10.60 | | | | $10.79 | | | | $10.37 | |
Ratios and supplemental data: | | | | | | | | | | | | |
Total return(b) | | | 0.94% | | | | 6.33% | | | | 3.70% | |
Net assets, end of period (000) | | | $6,998 | | | | $8,020 | | | | $7,586 | |
Ratio of net expenses to average net assets | | | 1.10% | (c) | | | 1.10% | | | | 1.10% | (c) |
Ratio of gross expenses to average net assets prior to expense reductions | | | 1.44% | (c) | | | 1.48% | | | | 2.13% | (c) |
Ratio of net investment income (loss) to average net assets | | | 2.44% | (c) | | | 3.97% | | | | 2.13% | (c) |
| * | Commencement of operations. |
| (a) | Net investment income (loss) allocated based on average shares method. |
| (b) | Total return measures net investment income (loss) and capital gain or loss from portfolio investments assuming reinvestment of dividends and capital gains distributions. Total return is not annualized for periods that are less than a full year, does not reflect the effect of sales charge for Class A shares nor the contingent deferred sales charge for Class C shares and does not reflect the deduction of taxes that a shareholder would pay on fund distributions or the redemption of fund shares. |
Calamos Dividend Growth Fund Financial Highlights
| | | | | | | | | | | | |
| | | Class R | |
| | | (Unaudited)
Six Months
Ended
April 30, | | | Year Ended
October 31, | | | August 5, 2013*
through
October 31, | |
| | | 2015 | | | 2014 | | | 2013* | |
Net asset value, beginning of period | | | $10.77 | | | | $10.35 | | | | $10.00 | |
Income from investment operations: | | | | | | | | | | | | |
Net investment income (loss)(a) | | | 0.10 | | | | 0.37 | | | | 0.04 | |
Net realized and unrealized gain (loss) | | | (0.03 | ) | | | 0.24 | | | | 0.31 | |
Total from investment operations | | | 0.07 | | | | 0.61 | | | | 0.35 | |
Distributions: | | | | | | | | | | | | |
Dividends from net investment income | | | (0.14 | ) | | | (0.16 | ) | | | — | |
Dividends from net realized gains | | | (0.13 | ) | | | (0.03 | ) | | | — | |
Total distributions | | | (0.27 | ) | | | (0.19 | ) | | | — | |
Net asset value, end of period | | | $10.57 | | | | $10.77 | | | | $10.35 | |
Ratios and supplemental data: | | | | | | | | | | | | |
Total return(b) | | | 0.72% | | | | 5.89% | | | | 3.50% | |
Net assets, end of period (000) | | | $110 | | | | $110 | | | | $104 | |
Ratio of net expenses to average net assets | | | 1.60% | (c) | | | 1.60% | | | | 1.60% | (c) |
Ratio of gross expenses to average net assets prior to expense reductions | | | 1.94% | (c) | | | 1.98% | | | | 3.22% | (c) |
Ratio of net investment income (loss) to average net assets | | | 1.90% | (c) | | | 3.44% | | | | 1.62% | (c) |
| * | Commencement of operations. |
| (a) | Net investment income (loss) allocated based on average shares method. |
| (b) | Total return measures net investment income (loss) and capital gain or loss from portfolio investments assuming reinvestment of dividends and capital gains distributions. Total return is not annualized for periods that are less than a full year, does not reflect the effect of sales charge for Class A shares nor the contingent deferred sales charge for Class C shares and does not reflect the deduction of taxes that a shareholder would pay on fund distributions or the redemption of fund shares. |
| | | | |
| 202 | | CALAMOS OPEN-END FAMILY OF FUNDS SEMIANNUAL REPORT | | |
Calamos Mid Cap Growth Fund Financial Highlights
Selected data for a share outstanding throughout each period were as follows:
| | | | | | | | | | | | |
| | | CLASS A | |
| | | (Unaudited)
Six Months
Ended
April 30, | | | Year Ended
October 31, | | | August 5, 2013*
through
October 31, | |
| | | 2015 | | | 2014 | | | 2013 | |
Net asset value, beginning of period | | | $11.36 | | | | $10.63 | | | | $10.00 | |
Income from investment operations: | | | | | | | | | | | | |
Net investment income (loss)(a) | | | (0.01 | ) | | | (0.06 | ) | | | (0.02 | ) |
Net realized and unrealized gain (loss) | | | 0.58 | | | | 0.79 | | | | 0.65 | |
Total from investment operations | | | 0.57 | | | | 0.73 | | | | 0.63 | |
Distributions: | | | | | | | | | | | | |
Dividends from net investment income | | | — | | | | (0.00 | )** | | | — | |
Dividends from net realized gains | | | — | | | | (0.00 | )** | | | — | |
Return of capital | | | — | | | | (0.00 | )** | | | — | |
Total distributions | | | — | | | | (0.00 | )** | | | — | |
Net asset value, end of period | | | $11.93 | | | | $11.36 | | | | $10.63 | |
Ratios and supplemental data: | | | | | | | | | | | | |
Total return(b) | | | 5.02% | | | | 6.90% | | | | 6.30% | |
Net assets, end of period (000) | | | $30,718 | | | | $37,112 | | | | $13,032 | |
Ratio of net expenses to average net assets | | | 1.25% | (c) | | | 1.25% | | | | 1.25% | (c) |
Ratio of gross expenses to average net assets prior to expense reductions | | | 1.60% | (c) | | | 1.68% | | | | 5.58% | (c) |
Ratio of net investment income (loss) to average net assets | | | (0.23% | )(c) | | | (0.58% | ) | | | (0.72% | )(c) |
| | | |
| | | (Unaudited)
Six Months
Ended
April 30, | | | Year Ended
October 31, | | | August 5, 2013*
through
October 31, | |
| | | 2015 | | | 2014 | | | 2013 | |
Portfolio turnover rate | | | 35.8% | | | | 69.2% | | | | 12.0% | |
| * | Commencement of operations. |
| ** | Amounts are less than $0.005. |
| (a) | Net investment income (loss) allocated based on average shares method. |
| (b) | Total return measures net investment income (loss) and capital gain or loss from portfolio investments assuming reinvestment of dividends and capital gains distributions. Total return is not annualized for periods that are less than a full year, does not reflect the effect of sales charge for Class A shares nor the contingent deferred sales charge for Class C shares and does not reflect the deduction of taxes that a shareholder would pay on fund distributions or the redemption of fund shares. |
Calamos Mid Cap Growth Fund Financial Highlights
| | | | | | | | | | | | |
| | | Class C | |
| | | (Unaudited)
Six Months
Ended
April 30, | | | Year Ended
October 31, | | | August 5, 2013*
through
October 31, | |
| | | 2015 | | | 2014 | | | 2013* | |
Net asset value, beginning of period | | | $11.26 | | | | $10.61 | | | | $10.00 | |
Income from investment operations: | | | | | | | | | | | | |
Net investment income (loss)(a) | | | (0.06 | ) | | | (0.14 | ) | | | (0.04 | ) |
Net realized and unrealized gain (loss) | | | 0.58 | | | | 0.79 | | | | 0.65 | |
Total from investment operations | | | 0.52 | | | | 0.65 | | | | 0.61 | |
Distributions: | | | | | | | | | | | | |
Dividends from net investment income | | | — | | | | — | | | | — | |
Dividends from net realized gains | | | — | | | | (0.00 | )** | | | — | |
Total distributions | | | — | | | | (0.00 | )** | | | — | |
Net asset value, end of period | | | $11.78 | | | | $11.26 | | | | $10.61 | |
Ratios and supplemental data: | | | | | | | | | | | | |
Total return(b) | | | 4.62% | | | | 6.13% | | | | 6.10% | |
Net assets, end of period (000) | | | $753 | | | | $583 | | | | $122 | |
Ratio of net expenses to average net assets | | | 2.00% | (c) | | | 2.00% | | | | 2.00% | (c) |
Ratio of gross expenses to average net assets prior to expense reductions | | | 2.35% | (c) | | | 2.41% | | | | 6.60% | (c) |
Ratio of net investment income (loss) to average net assets | | | (1.03% | )(c) | | | (1.32% | ) | | | (1.57% | )(c) |
| |
| | | Class I | |
| | | (Unaudited)
Six Months
Ended
April 30, | | | Year Ended
October 31, | | | August 5, 2013*
through
October 31, | |
| | | 2015 | | | 2014 | | | 2013* | |
Net asset value, beginning of period | | | $11.40 | | | | $10.64 | | | | $10.00 | |
Income from investment operations: | | | | | | | | | | | | |
Net investment income (loss)(a) | | | 0.00 | ** | | | (0.04 | ) | | | (0.01 | ) |
Net realized and unrealized gain (loss) | | | 0.59 | | | | 0.81 | | | | 0.65 | |
Total from investment operations | | | 0.59 | | | | 0.77 | | | | 0.64 | |
Distributions: | | | | | | | | | | | | |
Dividends from net investment income | | | — | | | | (0.01 | ) | | | — | |
Dividends from net realized gains | | | — | | | | (0.00 | )** | | | — | |
Return of capital | | | — | | | | (0.00 | )** | | | — | |
Total distributions | | | — | | | | (0.01 | ) | | | — | |
Net asset value, end of period | | | $11.99 | | | | $11.40 | | | | $10.64 | |
Ratios and supplemental data: | | | | | | | | | | | | |
Total return(b) | | | 5.18% | | | | 7.21% | | | | 6.40% | |
Net assets, end of period (000) | | | $8,596 | | | | $9,730 | | | | $7,299 | |
Ratio of net expenses to average net assets | | | 1.00% | (c) | | | 1.00% | | | | 1.00% | (c) |
Ratio of gross expenses to average net assets prior to expense reductions | | | 1.35% | (c) | | | 1.46% | | | | 5.59% | (c) |
Ratio of net investment income (loss) to average net assets | | | 0.00% | (c)*** | | | (0.33% | ) | | | (0.54% | )(c) |
| * | Commencement of operations. |
| ** | Amounts are less than $0.005. |
| *** | Amount is less than 0.005% |
| (a) | Net investment income (loss) allocated based on average shares method. |
| (b) | Total return measures net investment income (loss) and capital gain or loss from portfolio investments assuming reinvestment of dividends and capital gains distributions. Total return is not annualized for periods that are less than a full year, does not reflect the effect of sales charge for Class A shares nor the contingent deferred sales charge for Class C shares and does not reflect the deduction of taxes that a shareholder would pay on fund distributions or the redemption of fund shares. |
| | | | |
| 204 | | CALAMOS OPEN-END FAMILY OF FUNDS SEMIANNUAL REPORT | | |
Calamos Mid Cap Growth Fund Financial Highlights
| | | | | | | | | | | | |
| | | CLASS R | |
| | | (Unaudited)
Six Months
Ended
April 30, | | | Year Ended
October 31, | | | August 5, 2013*
through
October 31, | |
| | | 2015 | | | 2014 | | | 2013* | |
Net asset value, beginning of period | | | $11.33 | | | | $10.63 | | | | $10.00 | |
Income from investment operations: | | | | | | | | | | | | |
Net investment income (loss)(a) | | | (0.03 | ) | | | (0.09 | ) | | | (0.03 | ) |
Net realized and unrealized gain (loss) | | | 0.59 | | | | 0.79 | | | | 0.66 | |
Total from investment operations | | | 0.56 | | | | 0.70 | | | | 0.63 | |
Distributions: | | | | | | | | | | | | |
Dividends from net investment income | | | — | | | | — | | | | — | |
Dividends from net realized gains | | | — | | | | (0.00 | )** | | | — | |
Total distributions | | | — | | | | (0.00 | )** | | | — | |
Net asset value, end of period | | | $11.89 | | | | $11.33 | | | | $10.63 | |
Ratios and supplemental data: | | | | | | | | | | | | |
Total return(b) | | | 4.94% | | | | 6.59% | | | | 6.30% | |
Net assets, end of period (000) | | | $119 | | | | $113 | | | | $106 | |
Ratio of net expenses to average net assets | | | 1.50% | (c) | | | 1.50% | | | | 1.50% | (c) |
Ratio of gross expenses to average net assets prior to expense reductions | | | 1.85% | (c) | | | 1.98% | | | | 6.13% | (c) |
Ratio of net investment income (loss) to average net assets | | | (0.50% | )(c) | | | (0.82% | ) | | | (1.06% | )(c) |
| * | Commencement of operations. |
| ** | Amounts are less than $0.005. |
| (a) | Net investment income (loss) allocated based on average shares method. |
| (b) | Total return measures net investment income (loss) and capital gain or loss from portfolio investments assuming reinvestment of dividends and capital gains distributions. Total return is not annualized for periods that are less than a full year, does not reflect the effect of sales charge for Class A shares nor the contingent deferred sales charge for Class C shares and does not reflect the deduction of taxes that a shareholder would pay on fund distributions or the redemption of fund shares. |
Calamos International Growth Fund Financial Highlights
Selected data for a share outstanding throughout each period were as follows:
| | | | | | | | | | | | | | | | | | | | | | | | |
| | | CLASS A | |
| | | (Unaudited)
Six Months
Ended
April 30, | | | Year Ended October 31, | |
| | | 2015 | | | 2014 | | | 2013 | | | 2012 | | | 2011 | | | 2010 | |
Net asset value, beginning of period | | | $19.27 | | | | $19.24 | | | | $17.27 | | | | $16.32 | | | | $15.46 | | | | $12.64 | |
Income from investment operations: | | | | | | | | | | | | | | | | | | | | | | | | |
Net investment income (loss)(a) | | | 0.03 | | | | 0.09 | | | | 0.09 | | | | 0.06 | | | | (0.04 | ) | | | (0.04 | ) |
Net realized and unrealized gain (loss) | | | 1.03 | | | | 0.02 | | | | 1.92 | | | | 0.89 | | | | 0.90 | | | | 2.86 | |
Total from investment operations | | | 1.06 | | | | 0.11 | | | | 2.01 | | | | 0.95 | | | | 0.86 | | | | 2.82 | |
Distributions: | | | | | | | | | | | | | | | | | | | | | | | | |
Dividends from net investment income | | | — | | | | (0.08 | ) | | | (0.04 | ) | | | — | | | | — | | | | — | |
Dividends from net realized gains | | | (2.11 | ) | | | — | | | | — | | | | — | | | | — | | | | — | |
Total distributions | | | (2.11 | ) | | | (0.08 | ) | | | (0.04 | ) | | | — | | | | — | | | | — | |
Net asset value, end of period | | | $18.22 | | | | $19.27 | | | | $19.24 | | | | $17.27 | | | | $16.32 | | | | $15.46 | |
Ratios and supplemental data: | | | | | | | | | | | | | | | | | | | | | | | | |
Total return(b) | | | 6.49% | | | | 0.57% | | | | 11.64% | | | | 5.82% | | | | 5.56% | | | | 22.31% | |
Net assets, end of period (000) | | | $231,787 | | | | $254,400 | | | | $368,964 | | | | $459,516 | | | | $238,764 | | | | $136,723 | |
Ratio of net expenses to average net assets | | | 1.33% | (c) | | | 1.39% | | | | 1.40% | | | | 1.40% | | | | 1.49% | | | | 1.67% | |
Ratio of gross expenses to average net assets prior to expense reductions | | | 1.33% | (c) | | | 1.39% | | | | 1.48% | | | | 1.59% | | | | 1.58% | | | | 1.67% | |
Ratio of net investment income (loss) to average net assets | | | 0.28% | (c) | | | 0.43% | | | | 0.50% | | | | 0.36% | | | | (0.21% | ) | | | (0.26% | ) |
| | |
| | | (Unaudited)
Six Months
Ended
April 30, | | | Year Ended October 31, | |
| | | 2015 | | | 2014 | | | 2013 | | | 2012 | | | 2011 | | | 2010 | |
Portfolio turnover rate | | | 39.4% | | | | 81.6% | | | | 73.4% | | | | 55.7% | | | | 59.6% | | | | 63.1% | |
| (a) | Net investment income (loss) allocated based on average shares method. |
| (b) | Total return measures net investment income (loss) and capital gain or loss from portfolio investments assuming reinvestment of dividends and capital gains distributions. Total return is not annualized for periods that are less than a full year, does not reflect the effect of sales charge for Class A shares nor the contingent deferred sales charge for Class B and C shares and does not reflect the deduction of taxes that a shareholder would pay on fund distributions or the redemption of fund shares. |
| | | | |
| 206 | | CALAMOS OPEN-END FAMILY OF FUNDS SEMIANNUAL REPORT | | |
Calamos International Growth Fund Financial Highlights
| | | | | | | | | | | | | | | | | | | | | | | | |
| | | CLASS B | |
| | | (Unaudited)
Six Months
Ended
April 30, | | | Year Ended October 31, | |
| | | 2015 | | | 2014 | | | 2013 | | | 2012 | | | 2011 | | | 2010 | |
Net asset value, beginning of period | | | $18.20 | | | | $18.24 | | | | $16.45 | | | | $15.67 | | | | $14.96 | | | | $12.32 | |
Income from investment operations: | | | | | | | | | | | | | | | | | | | | | | | | |
Net investment income (loss)(a) | | | (0.05 | ) | | | (0.09 | ) | | | (0.05 | ) | | | (0.07 | ) | | | (0.16 | ) | | | (0.14 | ) |
Net realized and unrealized gain (loss) | | | 0.98 | | | | 0.05 | | | | 1.84 | | | | 0.85 | | | | 0.87 | | | | 2.78 | |
Total from investment operations | | | 0.93 | | | | (0.04 | ) | | | 1.79 | | | | 0.78 | | | | 0.71 | | | | 2.64 | |
Distributions: | | | | | | | | | | | | | | | | | | | | | | | | |
Dividends from net investment income | | | — | | | | — | | | | — | | | | — | | | | — | | | | — | |
Dividends from net realized gains | | | (2.11 | ) | | | — | | | | — | | | | — | | | | — | | | | — | |
Total distributions | | | (2.11 | ) | | | — | | | | — | | | | — | | | | — | | | | — | |
Net asset value, end of period | | | $17.02 | | | | $18.20 | | | | $18.24 | | | | $16.45 | | | | $15.67 | | | | $14.96 | |
Ratios and supplemental data: | | | | | | | | | | | | | | | | | | | | | | | | |
Total return(b) | | | 6.14% | | | | (0.22% | ) | | | 10.88% | | | | 4.98% | | | | 4.75% | | | | 21.43% | |
Net assets, end of period (000) | | | $1,594 | | | | $2,302 | | | | $5,995 | | | | $9,542 | | | | $13,500 | | | | $16,606 | |
Ratio of net expenses to average net assets | | | 2.08% | (c) | | | 2.15% | | | | 2.15% | | | | 2.15% | | | | 2.25% | | | | 2.42% | |
Ratio of gross expenses to average net assets prior to expense reductions | | | 2.08% | (c) | | | 2.15% | | | | 2.23% | | | | 2.34% | | | | 2.32% | | | | 2.42% | |
Ratio of net investment income (loss) to average net assets | | | (0.55% | )(c) | | | (0.46% | ) | | | (0.26% | ) | | | (0.45% | ) | | | (1.01% | ) | | | (1.02% | ) |
| |
| | | CLASS C | |
| | | (Unaudited)
Six Months
Ended
April 30, | | | Year Ended October 31, | |
| | | 2015 | | | 2014 | | | 2013 | | | 2012 | | | 2011 | | | 2010 | |
Net asset value, beginning of period | | | $18.18 | | | | $18.21 | | | | $16.43 | | | | $15.65 | | | | $14.94 | | | | $12.30 | |
Income from investment operations: | | | | | | | | | | | | | | | | | | | | | | | | |
Net investment income (loss)(a) | | | (0.04 | ) | | | (0.06 | ) | | | (0.04 | ) | | | (0.06 | ) | | | (0.16 | ) | | | (0.14 | ) |
Net realized and unrealized gain (loss) | | | 0.96 | | | | 0.03 | | | | 1.82 | | | | 0.84 | | | | 0.87 | | | | 2.78 | |
Total from investment operations | | | 0.92 | | | | (0.03 | ) | | | 1.78 | | | | 0.78 | | | | 0.71 | | | | 2.64 | |
Distributions: | | | | | | | | | | | | | | | | | | | | | | | | |
Dividends from net investment income | | | — | | | | — | | | | — | | | | — | | | | — | | | | — | |
Dividends from net realized gains | | | (2.11 | ) | | | — | | | | — | | | | — | | | | — | | | | — | |
Total distributions | | | (2.11 | ) | | | — | | | | — | | | | — | | | | — | | | | — | |
Net asset value, end of period | | | $16.99 | | | | $18.18 | | | | $18.21 | | | | $16.43 | | | | $15.65 | | | | $14.94 | |
Ratios and supplemental data: | | | | | | | | | | | | | | | | | | | | | | | | |
Total return(b) | | | 6.08% | | | | (0.16% | ) | | | 10.83% | | | | 4.98% | | | | 4.75% | | | | 21.46% | |
Net assets, end of period (000) | | | $52,938 | | | | $59,756 | | | | $65,622 | | | | $65,621 | | | | $53,355 | | | | $48,200 | |
Ratio of net expenses to average net assets | | | 2.08% | (c) | | | 2.13% | | | | 2.15% | | | | 2.15% | | | | 2.25% | | | | 2.42% | |
Ratio of gross expenses to average net assets prior to expense reductions | | | 2.08% | (c) | | | 2.13% | | | | 2.23% | | | | 2.34% | | | | 2.32% | | | | 2.42% | |
Ratio of net investment income (loss) to average net assets | | | (0.46% | )(c) | | | (0.32% | ) | | | (0.23% | ) | | | (0.41% | ) | | | (0.98% | ) | | | (1.01% | ) |
| (a) | Net investment income (loss) allocated based on average shares method. |
| (b) | Total return measures net investment income (loss) and capital gain or loss from portfolio investments assuming reinvestment of dividends and capital gains distributions. Total return is not annualized for periods that are less than a full year, does not reflect the effect of sales charge for Class A shares nor the contingent deferred sales charge for Class B and C shares and does not reflect the deduction of taxes that a shareholder would pay on fund distributions or the redemption of fund shares. |
Calamos International Growth Fund Financial Highlights
| | | | | | | | | | | | | | | | | | | | | | | | |
| | | CLASS I | |
| | | (Unaudited)
Six Months
Ended
April 30, | | | Year Ended October 31, | |
| | | 2015 | | | 2014 | | | 2013 | | | 2012 | | | 2011 | | | 2010 | |
Net asset value, beginning of period | | | $19.50 | | | | $19.48 | | | | $17.47 | | | | $16.47 | | | | $15.57 | | | | $12.72 | |
Income from investment operations: | | | | | | | | | | | | | | | | | | | | | | | | |
Net investment income (loss)(a) | | | 0.05 | | | | 0.13 | | | | 0.14 | | | | 0.10 | | | | 0.01 | | | | 0.01 | |
Net realized and unrealized gain (loss) | | | 1.05 | | | | 0.03 | | | | 1.94 | | | | 0.90 | | | | 0.89 | | | | 2.87 | |
Total from investment operations | | | 1.10 | | | | 0.16 | | | | 2.08 | | | | 1.00 | | | | 0.90 | | | | 2.88 | |
Distributions: | | | | | | | | | | | | | | | | | | | | | | | | |
Dividends from net investment income | | | — | | | | (0.14 | ) | | | (0.07 | ) | | | — | | | | — | | | | (0.03 | ) |
Dividends from net realized gains | | | (2.11 | ) | | | — | | | | — | | | | — | | | | — | | | | — | |
Total distributions | | | (2.11 | ) | | | (0.14 | ) | | | (0.07 | ) | | | — | | | | — | | | | (0.03 | ) |
Net asset value, end of period | | | $18.49 | | | | $19.50 | | | | $19.48 | | | | $17.47 | | | | $16.47 | | | | $15.57 | |
Ratios and supplemental data: | | | | | | | | | | | | | | | | | | | | | | | | |
Total return(b) | | | 6.63% | | | | 0.80% | | | | 11.97% | | | | 6.07% | | | | 5.78% | | | | 22.66% | |
Net assets, end of period (000) | | | $388,180 | | | | $410,485 | | | | $460,587 | | | | $415,463 | | | | $226,298 | | | | $96,003 | |
Ratio of net expenses to average net assets | | | 1.08% | (c) | | | 1.14% | | | | 1.15% | | | | 1.15% | | | | 1.23% | | | | 1.42% | |
Ratio of gross expenses to average net assets prior to expense reductions | | | 1.08% | (c) | | | 1.14% | | | | 1.23% | | | | 1.34% | | | | 1.33% | | | | 1.42% | |
Ratio of net investment income (loss) to average net assets | | | 0.55% | (c) | | | 0.66% | | | | 0.79% | | | | 0.61% | | | | 0.07% | | | | 0.06% | |
| |
| | | CLASS R | |
| | | (Unaudited)
Six Months
Ended
April 30, | | | Year Ended October 31, | |
| | | 2015 | | | 2014 | | | 2013 | | | 2012 | | | 2011 | | | 2010 | |
Net asset value, beginning of period | | | $19.00 | | | | $18.98 | | | | $17.06 | | | | $16.16 | | | | $15.35 | | | | $12.58 | |
Income from investment operations: | | | | | | | | | | | | | | | | | | | | | | | | |
Net investment income (loss)(a) | | | 0.01 | | | | 0.03 | | | | 0.06 | | | | 0.02 | | | | (0.08 | ) | | | (0.07 | ) |
Net realized and unrealized gain (loss) | | | 1.01 | | | | 0.03 | | | | 1.88 | | | | 0.88 | | | | 0.89 | | | | 2.84 | |
Total from investment operations | | | 1.02 | | | | 0.06 | | | | 1.94 | | | | 0.90 | | | | 0.81 | | | | 2.77 | |
Distributions: | | | | | | | | | | | | | | | | | | | | | | | | |
Dividends from net investment income | | | — | | | | (0.04 | ) | | | (0.02 | ) | | | — | | | | — | | | | — | |
Dividends from net realized gains | | | (2.11 | ) | | | — | | | | — | | | | — | | | | — | | | | — | |
Total distributions | | | (2.11 | ) | | | (0.04 | ) | | | (0.02 | ) | | | — | | | | — | | | | — | |
Net asset value, end of period | | | $17.91 | | | | $19.00 | | | | $18.98 | | | | $17.06 | | | | $16.16 | | | | $15.35 | |
Ratios and supplemental data: | | | | | | | | | | | | | | | | | | | | | | | | |
Total return(b) | | | 6.36% | | | | 0.33% | | | | 11.36% | | | | 5.57% | | | | 5.28% | | | | 22.02% | |
Net assets, end of period (000) | | | $13,417 | | | | $14,650 | | | | $19,550 | | | | $12,016 | | | | $3,667 | | | | $1,163 | |
Ratio of net expenses to average net assets | | | 1.58% | (c) | | | 1.64% | | | | 1.65% | | | | 1.65% | | | | 1.73% | | | | 1.92% | |
Ratio of gross expenses to average net assets prior to expense reductions | | | 1.58% | (c) | | | 1.64% | | | | 1.73% | | | | 1.84% | | | | 1.84% | | | | 1.92% | |
Ratio of net investment income (loss) to average net assets | | | 0.06% | (c) | | | 0.14% | | | | 0.33% | | | | 0.11% | | | | (0.46% | ) | | | (0.49% | ) |
| (a) | Net investment income (loss) allocated based on average shares method. |
| (b) | Total return measures net investment income (loss) and capital gain or loss from portfolio investments assuming reinvestment of dividends and capital gains distributions. Total return is not annualized for periods that are less than a full year, does not reflect the effect of sales charge for Class A shares nor the contingent deferred sales charge for Class B and C shares and does not reflect the deduction of taxes that a shareholder would pay on fund distributions or the redemption of fund shares. |
| | | | |
| 208 | | CALAMOS OPEN-END FAMILY OF FUNDS SEMIANNUAL REPORT | | |
Calamos Evolving World Growth Fund Financial Highlights
Selected data for a share outstanding throughout each period were as follows:
| | | | | | | | | | | | | | | | | | | | | | | | |
| | | CLASS A | |
| | | (Unaudited)
Six Months
Ended
April 30, | | | Year Ended October 31, | |
| | | 2015 | | | 2014 | | | 2013 | | | 2012 | | | 2011 | | | 2010 | |
Net asset value, beginning of period | | | $13.73 | | | | $13.97 | | | | $12.83 | | | | $12.47 | | | | $12.42 | | | | $10.30 | |
Income from investment operations: | | | | | | | | | | | | | | | | | | | | | | | | |
Net investment income (loss)(a) | | | (0.01 | ) | | | 0.06 | | | | 0.03 | | | | 0.04 | | | | 0.01 | | | | 0.08 | |
Net realized and unrealized gain (loss) | | | 0.49 | | | | (0.18 | ) | | | 1.11 | | | | 0.32 | | | | 0.08 | | | | 2.11 | |
Total from investment operations | | | 0.48 | | | | (0.12 | ) | | | 1.14 | | | | 0.36 | | | | 0.09 | | | | 2.19 | |
Distributions: | | | | | | | | | | | | | | | | | | | | | | | | |
Dividends from net investment income | | | (0.03 | ) | | | (0.01 | ) | | | — | | | | — | | | | (0.04 | ) | | | (0.07 | ) |
Dividends from net realized gains | | | (0.30 | ) | | | (0.11 | ) | | | — | | | | — | | | | — | | | | — | |
Total distributions | | | (0.33 | ) | | | (0.12 | ) | | | — | | | | — | | | | (0.04 | ) | | | (0.07 | ) |
Net asset value, end of period | | | $13.88 | | | | $13.73 | | | | $13.97 | | | | $12.83 | | | | $12.47 | | | | $12.42 | |
Ratios and supplemental data: | | | | | | | | | | | | | | | | | | | | | | | | |
Total return(b) | | | 3.66% | | | | (0.84% | ) | | | 8.89% | | | | 2.89% | | | | 0.68% | | | | 21.40% | |
Net assets, end of period (000) | | | $148,810 | | | | $168,332 | | | | $164,273 | | | | $138,718 | | | | $104,365 | | | | $44,895 | |
Ratio of net expenses to average net assets | | | 1.65% | (c) | | | 1.61% | | | | 1.63% | | | | 1.60% | | | | 1.58% | | | | 1.67% | |
Ratio of gross expenses to average net assets prior to expense reductions | | | 1.65% | (c) | | | 1.61% | | | | 1.63% | | | | 1.60% | | | | 1.58% | | | | 1.67% | |
Ratio of net investment income (loss) to average net assets | | | (0.20% | )(c) | | | 0.45% | | | | 0.23% | | | | 0.32% | | | | 0.08% | | | | 0.67% | |
| | |
| | | (Unaudited)
Six Months
Ended
April 30, | | | Year Ended October 31, | |
| | | 2015 | | | 2014 | | | 2013 | | | 2012 | | | 2011 | | | 2010 | |
Portfolio turnover rate | | | 31.1% | | | | 99.9% | | | | 85.8% | | | | 50.1% | | | | 67.4% | | | | 48.3% | |
| (a) | Net investment income (loss) allocated based on average shares method. |
| (b) | Total return measures net investment income (loss) and capital gain or loss from portfolio investments assuming reinvestment of dividends and capital gains distributions. Total return is not annualized for periods that are less than a full year, does not reflect the effect of sales charge for Class A shares nor the contingent deferred sales charge for Class B and C shares and does not reflect the deduction of taxes that a shareholder would pay on fund distributions or the redemption of fund shares. |
Calamos Evolving World Growth Fund Financial Highlights
| | | | | | | | | | | | | | | | | | | | | | | | |
| | | CLASS B | |
| | | (Unaudited)
Six Months
Ended
April 30, | | | Year Ended October 31, | |
| | | 2015 | | | 2014 | | | 2013 | | | 2012 | | | 2011 | | | 2010 | |
Net asset value, beginning of period | | | $13.26 | | | | $13.59 | | | | $12.58 | | | | $12.32 | | | | $12.32 | | | | $10.24 | |
Income from investment operations: | | | | | | | | | | | | | | | | | | | | | | | | |
Net investment income (loss)(a) | | | (0.06 | ) | | | (0.03 | ) | | | (0.07 | ) | | | (0.06 | ) | | | (0.09 | ) | | | (0.01 | ) |
Net realized and unrealized gain (loss) | | | 0.47 | | | | (0.19 | ) | | | 1.08 | | | | 0.32 | | | | 0.09 | | | | 2.10 | |
Total from investment operations | | | 0.41 | | | | (0.22 | ) | | | 1.01 | | | | 0.26 | | | | — | | | | 2.09 | |
Distributions: | | | | | | | | | | | | | | | | | | | | | | | | |
Dividends from net investment income | | | — | | | | — | | | | — | | | | — | | | | — | | | | (0.01 | ) |
Dividends from net realized gains | | | (0.30 | ) | | | (0.11 | ) | | | — | | | | — | | | | — | | | | — | |
Total distributions | | | (0.30 | ) | | | (0.11 | ) | | | — | | | | — | | | | — | | | | (0.01 | ) |
Net asset value, end of period | | | $13.37 | | | | $13.26 | | | | $13.59 | | | | $12.58 | | | | $12.32 | | | | $12.32 | |
Ratios and supplemental data: | | | | | | | | | | | | | | | | | | | | | | | | |
Total return(b) | | | 3.26% | | | | (1.59% | ) | | | 8.03% | | | | 2.11% | | | | 0.00% | | | | 20.42% | |
Net assets, end of period (000) | | | $586 | | | | $713 | | | | $1,788 | | | | $1,595 | | | | $1,815 | | | | $1,819 | |
Ratio of net expenses to average net assets | | | 2.40% | (c) | | | 2.35% | | | | 2.38% | | | | 2.34% | | | | 2.33% | | | | 2.43% | |
Ratio of gross expenses to average net assets prior to expense reductions | | | 2.40% | (c) | | | 2.35% | | | | 2.38% | | | | 2.34% | | | | 2.33% | | | | 2.43% | |
Ratio of net investment income (loss) to average net assets | | | (0.94% | )(c) | | | (0.23% | ) | | | (0.52% | ) | | | (0.46% | ) | | | (0.71% | ) | | | (0.11% | ) |
| |
| | | CLASS C | |
| | | (Unaudited)
Six Months
Ended
April 30, | | | Year Ended October 31, | |
| | | 2015 | | | 2014 | | | 2013 | | | 2012 | | | 2011 | | | 2010 | |
Net asset value, beginning of period | | | $13.26 | | | | $13.59 | | | | $12.57 | | | | $12.31 | | | | $12.31 | | | | $10.24 | |
Income from investment operations: | | | | | | | | | | | | | | | | | | | | | | | | |
Net investment income (loss)(a) | | | (0.06 | ) | | | (0.04 | ) | | | (0.06 | ) | | | (0.05 | ) | | | (0.09 | ) | | | (0.01 | ) |
Net realized and unrealized gain (loss) | | | 0.47 | | | | (0.18 | ) | | | 1.08 | | | | 0.31 | | | | 0.09 | | | | 2.10 | |
Total from investment operations | | | 0.41 | | | | (0.22 | ) | | | 1.02 | | | | 0.26 | | | | — | | | | 2.09 | |
Distributions: | | | | | | | | | | | | | | | | | | | | | | | | |
Dividends from net investment income | | | — | | | | — | | | | — | | | | — | | | | (0.00 | )** | | | (0.02 | ) |
Dividends from net realized gains | | | (0.30 | ) | | | (0.11 | ) | | | — | | | | — | | | | — | | | | — | |
Total distributions | | | (0.30 | ) | | | (0.11 | ) | | | — | | | | — | | | | — | | | | (0.02 | ) |
Net asset value, end of period | | | $13.37 | | | | $13.26 | | | | $13.59 | | | | $12.57 | | | | $12.31 | | | | $12.31 | |
Ratios and supplemental data: | | | | | | | | | | | | | | | | | | | | | | | | |
Total return(b) | | | 3.26% | | | | (1.59% | ) | | | 8.11% | | | | 2.11% | | | | 0.00% | | | | 20.43% | |
Net assets, end of period (000) | | | $43,243 | | | | $44,611 | | | | $34,022 | | | | $21,527 | | | | $8,913 | | | | $3,472 | |
Ratio of net expenses to average net assets | | | 2.40% | (c) | | | 2.37% | | | | 2.39% | | | | 2.35% | | | | 2.33% | | | | 2.43% | |
Ratio of gross expenses to average net assets prior to expense reductions | | | 2.40% | (c) | | | 2.37% | | | | 2.39% | | | | 2.35% | | | | 2.33% | | | | 2.43% | |
Ratio of net investment income (loss) to average net assets | | | (0.93% | )(c) | | | (0.33% | ) | | | (0.50% | ) | | | (0.41% | ) | | | (0.66% | ) | | | (0.07% | ) |
| ** | Amounts are less than $0.005. |
| (a) | Net investment income (loss) allocated based on average shares method. |
| (b) | Total return measures net investment income (loss) and capital gain or loss from portfolio investments assuming reinvestment of dividends and capital gains distributions. Total return is not annualized for periods that are less than a full year, does not reflect the effect of sales charge for Class A shares nor the contingent deferred sales charge for Class B and C shares and does not reflect the deduction of taxes that a shareholder would pay on fund distributions or the redemption of fund shares. |
| | | | |
| 210 | | CALAMOS OPEN-END FAMILY OF FUNDS SEMIANNUAL REPORT | | |
Calamos Evolving World Growth Fund Financial Highlights
| | | | | | | | | | | | | | | | | | | | | | | | |
| | | CLASS I | |
| | | (Unaudited)
Six Months
Ended
April 30, | | | Year Ended October 31, | |
| | | 2015 | | | 2014 | | | 2013 | | | 2012 | | | 2011 | | | 2010 | |
Net asset value, beginning of period | | | $13.83 | | | | $14.07 | | | | $12.92 | | | | $12.54 | | | | $12.46 | | | | $10.32 | |
Income from investment operations: | | | | | | | | | | | | | | | | | | | | | | | | |
Net investment income (loss)(a) | | | — | | | | 0.09 | | | | 0.07 | | | | 0.07 | | | | 0.04 | | | | 0.10 | |
Net realized and unrealized gain (loss) | | | 0.49 | | | | (0.18 | ) | | | 1.11 | | | | 0.32 | | | | 0.09 | | | | 2.12 | |
Total from investment operations | | | 0.49 | | | | (0.09 | ) | | | 1.18 | | | | 0.39 | | | | 0.13 | | | | 2.22 | |
Distributions: | | | | | | | | | | | | | | | | | | | | | | | | |
Dividends from net investment income | | | (0.07 | ) | | | (0.04 | ) | | | (0.03 | ) | | | (0.01 | ) | | | (0.05 | ) | | | (0.08 | ) |
Dividends from net realized gains | | | (0.30 | ) | | | (0.11 | ) | | | — | | | | — | | | | — | | | | — | |
Total distributions | | | (0.37 | ) | | | (0.15 | ) | | | (0.03 | ) | | | (0.01 | ) | | | (0.05 | ) | | | (0.08 | ) |
Net asset value, end of period | | | $13.95 | | | | $13.83 | | | | $14.07 | | | | $12.92 | | | | $12.54 | | | | $12.46 | |
Ratios and supplemental data: | | | | | | | | | | | | | | | | | | | | | | | | |
Total return(b) | | | 3.74% | | | | (0.60% | ) | | | 9.16% | | | | 3.11% | | | | 1.05% | | | | 21.68% | |
Net assets, end of period (000) | | | $418,129 | | | | $436,546 | | | | $311,823 | | | | $175,572 | | | | $89,205 | | | | $52,875 | |
Ratio of net expenses to average net assets | | | 1.40% | (c) | | | 1.37% | | | | 1.39% | | | | 1.35% | | | | 1.33% | | | | 1.43% | |
Ratio of gross expenses to average net assets prior to expense reductions | | | 1.40% | (c) | | | 1.37% | | | | 1.39% | | | | 1.35% | | | | 1.33% | | | | 1.43% | |
Ratio of net investment income (loss) to average net assets | | | 0.07% | (c) | | | 0.65% | | | | 0.53% | | | | 0.59% | | | | 0.33% | | | | 0.92% | |
| |
| | | CLASS R | |
| | | (Unaudited)
Six Months
Ended
April 30, | | | Year Ended October 31, | |
| | | 2015 | | | 2014 | | | 2013 | | | 2012 | | | 2011 | | | 2010 | |
Net asset value, beginning of period | | | $13.62 | | | | $13.88 | | | | $12.78 | | | | $12.45 | | | | $12.39 | | | | $10.28 | |
Income from investment operations: | | | | | | | | | | | | | | | | | | | | | | | | |
Net investment income (loss)(a) | | | (0.02 | ) | | | 0.04 | | | | — | | | | 0.01 | | | | (0.03 | ) | | | 0.04 | |
Net realized and unrealized gain (loss) | | | 0.47 | | | | (0.19 | ) | | | 1.10 | | | | 0.32 | | | | 0.09 | | | | 2.11 | |
Total from investment operations | | | 0.45 | | | | (0.15 | ) | | | 1.10 | | | | 0.33 | | | | 0.06 | | | | 2.15 | |
Distributions: | | | | | | | | | | | | | | | | | | | | | | | | |
Dividends from net investment income | | | — | | | | — | | | | — | | | | — | | | | — | | | | (0.04 | ) |
Dividends from net realized gains | | | (0.30 | ) | | | (0.11 | ) | | | — | | | | — | | | | — | | | | — | |
Total distributions | | | (0.30 | ) | | | (0.11 | ) | | | — | | | | — | | | | — | | | | (0.04 | ) |
Net asset value, end of period | | | $13.77 | | | | $13.62 | | | | $13.88 | | | | $12.78 | | | | $12.45 | | | | $12.39 | |
Ratios and supplemental data: | | | | | | | | | | | | | | | | | | | | | | | | |
Total return(b) | | | 3.47% | | | | (1.05% | ) | | | 8.61% | | | | 2.65% | | | | 0.48% | | | | 20.99% | |
Net assets, end of period (000) | | | $1,812 | | | | $1,361 | | | | $1,908 | | | | $1,555 | | | | $1,274 | | | | $1,252 | |
Ratio of net expenses to average net assets | | | 1.90% | (c) | | | 1.86% | | | | 1.88% | | | | 1.84% | | | | 1.83% | | | | 1.93% | |
Ratio of gross expenses to average net assets prior to expense reductions | | | 1.90% | (c) | | | 1.86% | | | | 1.88% | | | | 1.84% | | | | 1.83% | | | | 1.93% | |
Ratio of net investment income (loss) to average net assets | | | (0.38% | )(c) | | | 0.28% | | | | (0.04% | ) | | | 0.05% | | | | (0.21% | ) | | | 0.38% | |
| (a) | Net investment income (loss) allocated based on average shares method. |
| (b) | Total return measures net investment income (loss) and capital gain or loss from portfolio investments assuming reinvestment of dividends and capital gains distributions. Total return is not annualized for periods that are less than a full year, does not reflect the effect of sales charge for Class A shares nor the contingent deferred sales charge for Class B and C shares and does not reflect the deduction of taxes that a shareholder would pay on fund distributions or the redemption of fund shares. |
Calamos Emerging Market Equity Fund Financial Highlights
Selected data for a share outstanding throughout each period were as follows:
| | | | | | | | |
| | | Class A | |
| | | (Unaudited)
Six Months
Ended
April 30, | | | December 31, 2013*
through October 31, | |
| | | 2015 | | | 2014 | |
Net asset value, beginning of period | | | $9.84 | | | | $10.00 | |
Income from investment operations: | | | | | | | | |
Net investment income (loss)(a) | | | (0.03 | ) | | | 0.02 | |
Net realized and unrealized gain (loss) | | | 0.24 | | | | (0.18 | ) |
Total from investment operations | | | 0.21 | | | | (0.16 | ) |
Distributions: | | | | | | | | |
Dividends from net investment income | | | (0.05 | ) | | | — | |
Dividends from net realized gains | | | — | | | | — | |
Total distributions | | | (0.05 | ) | | | — | |
Net asset value, end of period | | | $10.00 | | | | $9.84 | |
Ratios and supplemental data: | | | | | | | | |
Total return(b) | | | 2.15% | | | | (1.60% | ) |
Net assets, end of period (000) | | | $8,472 | | | | $5,360 | |
Ratio of net expenses to average net assets | | | 1.75% | (c) | | | 1.75% | (c) |
Ratio of gross expenses to average net assets prior to expense reductions | | | 2.26% | (c) | | | 3.45% | (c) |
Ratio of net investment income (loss) to average net assets | | | (0.58% | )(c) | | | 0.24% | (c) |
| | |
| | | (Unaudited)
Six Months
Ended
April 30, | | | December 31, 2013*
through October 31, | |
| | | 2015 | | | 2014 | |
Portfolio turnover rate | | | 31.4% | | | | 109.2% | |
| * | Commencement of operations. |
| (a) | Net investment income (loss) allocated based on average shares method. |
| (b) | Total return measures net investment income (loss) and capital gain or loss from portfolio investments assuming reinvestment of dividends and capital gains distributions. Total return is not annualized for periods that are less than a full year, does not reflect the effect of sales charge for Class A shares nor the contingent deferred sales charge for Class C shares and does not reflect the deduction of taxes that a shareholder would pay on fund distributions or the redemption of fund shares. |
| | | | |
| 212 | | CALAMOS OPEN-END FAMILY OF FUNDS SEMIANNUAL REPORT | | |
Calamos Emerging Market Equity Fund Financial Highlights
| | | | | | | | |
| | | Class C | |
| | | (Unaudited)
Six Months
Ended
April 30, | | | December 31, 2013*
through October 31, | |
| | | 2015 | | | 2014 | |
Net asset value, beginning of period | | | $9.78 | | | | $10.00 | |
Income from investment operations: | | | | | | | | |
Net investment income (loss)(a) | | | (0.06 | ) | | | (0.04 | ) |
Net realized and unrealized gain (loss) | | | 0.24 | | | | (0.18 | ) |
Total from investment operations | | | 0.18 | | | | (0.22 | ) |
Distributions: | | | | | | | | |
Dividends from net investment income | | | — | | | | — | |
Dividends from net realized gains | | | — | | | | — | |
Total distributions | | | — | | | | — | |
Net asset value, end of period | | | $9.96 | | | | $9.78 | |
Ratios and supplemental data: | | | | | | | | |
Total return(b) | | | 1.84% | | | | (2.20% | ) |
Net assets, end of period (000) | | | $323 | | | | $288 | |
Ratio of net expenses to average net assets | | | 2.50% | (c) | | | 2.50% | (c) |
Ratio of gross expenses to average net assets prior to expense reductions | | | 3.01% | (c) | | | 4.08% | (c) |
Ratio of net investment income (loss) to average net assets | | | (1.35% | )(c) | | | (0.45% | )(c) |
| |
| | | CLASS I | |
| | | (Unaudited)
Six Months
Ended
April 30, | | | December 31, 2013*
through October 31, | |
| | | 2015 | | | 2014 | |
Net asset value, beginning of period | | | $9.86 | | | | $10.00 | |
Income from investment operations: | | | | | | | | |
Net investment income (loss)(a) | | | (0.02 | ) | | | 0.04 | |
Net realized and unrealized gain (loss) | | | 0.24 | | | | (0.18 | ) |
Total from investment operations | | | 0.22 | | | | (0.14 | ) |
Distributions: | | | | | | | | |
Dividends from net investment income | | | (0.06 | ) | | | — | |
Dividends from net realized gains | | | — | | | | — | |
Total distributions | | | (0.06 | ) | | | — | |
Net asset value, end of period | | | $10.02 | | | | $9.86 | |
Ratios and supplemental data: | | | | | | | | |
Total return(b) | | | 2.31% | | | | (1.40% | ) |
Net assets, end of period (000) | | | $9,761 | | | | $9,701 | |
Ratio of net expenses to average net assets | | | 1.50% | (c) | | | 1.50% | (c) |
Ratio of gross expenses to average net assets prior to expense reductions | | | 2.01% | (c) | | | 3.04% | (c) |
Ratio of net investment income (loss) to average net assets | | | (0.36% | )(c) | | | 0.50% | (c) |
| * | Commencement of operations. |
| (a) | Net investment income (loss) allocated based on average shares method. |
| (b) | Total return measures net investment income (loss) and capital gain or loss from portfolio investments assuming reinvestment of dividends and capital gains distributions. Total return is not annualized for periods that are less than a full year, does not reflect the effect of sales charge for Class A shares nor the contingent deferred sales charge for Class C shares and does not reflect the deduction of taxes that a shareholder would pay on fund distributions or the redemption of fund shares. |
Calamos Emerging Market Equity Fund Financial Highlights
| | | | | | | | |
| | | CLASS R | |
| | | (Unaudited)
Six Months
Ended
April 30, | | | December 31, 2013*
through October 31, | |
| | | 2015 | | | 2014 | |
Net asset value, beginning of period | | | $9.82 | | | | $10.00 | |
Income from investment operations: | | | | | | | | |
Net investment income (loss)(a) | | | (0.04 | ) | | | — | |
Net realized and unrealized gain (loss) | | | 0.24 | | | | (0.18 | ) |
Total from investment operations | | | 0.20 | | | | (0.18 | ) |
Distributions: | | | | | | | | |
Dividends from net investment income | | | (0.02 | ) | | | — | |
Dividends from net realized gains | | | — | | | | — | |
Total distributions | | | (0.02 | ) | | | — | |
Net asset value, end of period | | | $10.00 | | | | $9.82 | |
Ratios and supplemental data: | | | | | | | | |
Total return(b) | | | 2.01% | | | | (1.80% | ) |
Net assets, end of period (000) | | | $100 | | | | $98 | |
Ratio of net expenses to average net assets | | | 2.00% | (c) | | | 2.00% | (c) |
Ratio of gross expenses to average net assets prior to expense reductions | | | 2.51% | (c) | | | 3.72% | (c) |
Ratio of net investment income (loss) to average net assets | | | (0.85% | )(c) | | | (0.02% | )(c) |
| * | Commencement of operations. |
| (a) | Net investment income (loss) allocated based on average shares method. |
| (b) | Total return measures net investment income (loss) and capital gain or loss from portfolio investments assuming reinvestment of dividends and capital gains distributions. Total return is not annualized for periods that are less than a full year, does not reflect the effect of sales charge for Class A shares nor the contingent deferred sales charge for Class C shares and does not reflect the deduction of taxes that a shareholder would pay on fund distributions or the redemption of fund shares. |
| | | | |
| 214 | | CALAMOS OPEN-END FAMILY OF FUNDS SEMIANNUAL REPORT | | |
Calamos Global Equity Fund Financial Highlights
Selected data for a share outstanding throughout each period were as follows:
| | | | | | | | | | | | | | | | | | | | | | | | |
| | | CLASS A | |
| | | (Unaudited)
Six Months
Ended
April 30, | | | Year Ended October 31, | |
| | | 2015 | | | 2014 | | | 2013 | | | 2012 | | | 2011 | | | 2010 | |
Net asset value, beginning of period | | | $15.67 | | | | $14.97 | | | | $13.00 | | | | $12.14 | | | | $11.28 | | | | $9.12 | |
Income from investment operations: | | | | | | | | | | | | | | | | | | | | | | | | |
Net investment income (loss)(a) | | | (0.00 | )* | | | (0.01 | ) | | | 0.03 | | | | (0.02 | ) | | | (0.07 | ) | | | (0.07 | ) |
Net realized and unrealized gain (loss) | | | 0.82 | | | | 1.08 | | | | 1.96 | | | | 0.88 | | | | 0.93 | | | | 2.23 | |
Total from investment operations | | | 0.82 | | | | 1.07 | | | | 1.99 | | | | 0.86 | | | | 0.86 | | | | 2.16 | |
Distributions: | | | | | | | | | | | | | | | | | | | | | | | | |
Dividends from net investment income | | | — | | | | (0.10 | ) | | | (0.02 | ) | | | — | | | | — | | | | — | |
Dividends from net realized gains | | | (3.10 | ) | | | (0.27 | ) | | | — | | | | — | | | | — | | | | — | |
Total distributions | | | (3.10 | ) | | | (0.37 | ) | | | (0.02 | ) | | | — | | | | — | | | | — | |
Net asset value, end of period | | | $13.39 | | | | $15.67 | | | | $14.97 | | | | $13.00 | | | | $12.14 | | | | $11.28 | |
Ratios and supplemental data: | | | | | | | | | | | | | | | | | | | | | | | | |
Total return(b) | | | 6.92% | | | | 7.25% | | | | 15.35% | | | | 7.08% | | | | 7.62% | | | | 23.68% | |
Net assets, end of period (000) | | | $76,709 | | | | $87,989 | | | | $152,068 | | | | $113,260 | | | | $51,525 | | | | $30,212 | |
Ratio of net expenses to average net assets | | | 1.34% | (c) | | | 1.40% | | | | 1.40% | | | | 1.40% | | | | 1.57% | | | | 1.88% | |
Ratio of gross expenses to average net assets prior to expense reductions | | | 1.34% | (c) | | | 1.40% | | | | 1.44% | | | | 1.52% | | | | 1.66% | | | | 1.88% | |
Ratio of net investment income (loss) to average net assets | | | (0.07% | )(c) | | | (0.10% | ) | | | 0.22% | | | | (0.14% | ) | | | (0.60% | ) | | | (0.71% | ) |
| | |
| | | (Unaudited)
Six Months
Ended
April 30, | | | Year Ended October 31, | |
| | | 2015 | | | 2014 | | | 2013 | | | 2012 | | | 2011 | | | 2010 | |
Portfolio turnover rate | | | 27.9% | | | | 53.3% | | | | 75.3% | | | | 44.5% | | | | 58.8% | | | | 65.1% | |
| * | Amount is less than $0.005. |
| (a) | Net investment income (loss) allocated based on average shares method. |
| (b) | Total return measures net investment income (loss) and capital gain or loss from portfolio investments assuming reinvestment of dividends and capital gains distributions. Total return is not annualized for periods that are less than a full year, does not reflect the effect of sales charge for Class A shares nor the contingent deferred sales charge for Class B and C shares and does not reflect the deduction of taxes that a shareholder would pay on fund distributions or the redemption of fund shares. |
Calamos Global Equity Fund Financial Highlights
| | | | | | | | | | | | | | | | | | | | | | | | |
| | | CLASS B | |
| | | (Unaudited)
Six Months
Ended
April 30, | | | Year Ended October 31, | |
| | | 2015 | | | 2014 | | | 2013 | | | 2012 | | | 2011 | | | 2010 | |
Net asset value, beginning of period | | | $15.03 | | | | $14.38 | | | | $12.56 | | | | $11.82 | | | | $11.06 | | | | $9.02 | |
Income from investment operations: | | | | | | | | | | | | | | | | | | | | | | | | |
Net investment income (loss)(a) | | | (0.05 | ) | | | (0.12 | ) | | | (0.07 | ) | | | (0.11 | ) | | | (0.16 | ) | | | (0.15 | ) |
Net realized and unrealized gain (loss) | | | 0.78 | | | | 1.04 | | | | 1.89 | | | | 0.85 | | | | 0.92 | | | | 2.19 | |
Total from investment operations | | | 0.73 | | | | 0.92 | | | | 1.82 | | | | 0.74 | | | | 0.76 | | | | 2.04 | |
Distributions: | | | | | | | | | | | | | | | | | | | | | | | | |
Dividends from net investment income | | | — | | | | — | | | | — | | | | — | | | | — | | | | — | |
Dividends from net realized gains | | | (3.10 | ) | | | (0.27 | ) | | | — | | | | — | | | | — | | | | — | |
Total distributions | | | (3.10 | ) | | | (0.27 | ) | | | — | | | | — | | | | — | | | | — | |
Net asset value, end of period | | | $12.66 | | | | $15.03 | | | | $14.38 | | | | $12.56 | | | | $11.82 | | | | $11.06 | |
Ratios and supplemental data: | | | | | | | | | | | | | | | | | | | | | | | | |
Total return(b) | | | 6.56% | | | | 6.49% | | | | 14.49% | | | | 6.26% | | | | 6.87% | | | | 22.62% | |
Net assets, end of period (000) | | | $702 | | | | $1,171 | | | | $2,751 | | | | $2,519 | | | | $2,603 | | | | $2,552 | |
Ratio of net expenses to average net assets | | | 2.09% | (c) | | | 2.16% | | | | 2.15% | | | | 2.15% | | | | 2.35% | | | | 2.63% | |
Ratio of gross expenses to average net assets prior to expense reductions | | | 2.09% | (c) | | | 2.16% | | | | 2.19% | | | | 2.28% | | | | 2.42% | | | | 2.63% | |
Ratio of net investment income (loss) to average net assets | | | (0.82% | )(c) | | | (0.81% | ) | | | (0.53% | ) | | | (0.90% | ) | | | (1.37% | ) | | | (1.46% | ) |
| |
| | | CLASS C | |
| | | (Unaudited)
Six Months
Ended
April 30, | | | Year Ended October 31, | |
| | | 2015 | | | 2014 | | | 2013 | | | 2012 | | | 2011 | | | 2010 | |
Net asset value, beginning of period | | | $15.00 | | | | $14.36 | | | | $12.54 | | | | $11.80 | | | | $11.04 | | | | $9.00 | |
Income from investment operations: | | | | | | | | | | | | | | | | | | | | | | | | |
Net investment income (loss)(a) | | | (0.05 | ) | | | (0.12 | ) | | | (0.07 | ) | | | (0.11 | ) | | | (0.16 | ) | | | (0.15 | ) |
Net realized and unrealized gain (loss) | | | 0.78 | | | | 1.03 | | | | 1.89 | | | | 0.85 | | | | 0.92 | | | | 2.19 | |
Total from investment operations | | | 0.73 | | | | 0.91 | | | | 1.82 | | | | 0.74 | | | | 0.76 | | | | 2.04 | |
Distributions: | | | | | | | | | | | | | | | | | | | | | | | | |
Dividends from net investment income | | | — | | | | — | | | | — | | | | — | | | | — | | | | — | |
Dividends from net realized gains | | | (3.10 | ) | | | (0.27 | ) | | | — | | | | — | | | | — | | | | — | |
Total distributions | | | (3.10 | ) | | | (0.27 | ) | | | — | | | | — | | | | — | | | | — | |
Net asset value, end of period | | | $12.63 | | | | $15.00 | | | | $14.36 | | | | $12.54 | | | | $11.80 | | | | $11.04 | |
Ratios and supplemental data: | | | | | | | | | | | | | | | | | | | | | | | | |
Total return(b) | | | 6.57% | | | | 6.43% | | | | 14.51% | | | | 6.27% | | | | 6.88% | | | | 22.67% | |
Net assets, end of period (000) | | | $24,632 | | | | $28,811 | | | | $32,975 | | | | $25,749 | | | | $10,359 | | | | $6,523 | |
Ratio of net expenses to average net assets | | | 2.09% | (c) | | | 2.14% | | | | 2.15% | | | | 2.15% | | | | 2.32% | | | | 2.63% | |
Ratio of gross expenses to average net assets prior to expense reductions | | | 2.09% | (c) | | | 2.14% | | | | 2.19% | | | | 2.27% | | | | 2.41% | | | | 2.63% | |
Ratio of net investment income (loss) to average net assets | | | (0.83% | )(c) | | | (0.82% | ) | | | (0.51% | ) | | | (0.89% | ) | | | (1.33% | ) | | | (1.46% | ) |
| (a) | Net investment income (loss) allocated based on average shares method. |
| (b) | Total return measures net investment income (loss) and capital gain or loss from portfolio investments assuming reinvestment of dividends and capital gains distributions. Total return is not annualized for periods that are less than a full year, does not reflect the effect of sales charge for Class A shares nor the contingent deferred sales charge for Class B and C shares and does not reflect the deduction of taxes that a shareholder would pay on fund distributions or the redemption of fund shares. |
| | | | |
| 216 | | CALAMOS OPEN-END FAMILY OF FUNDS SEMIANNUAL REPORT | | |
Calamos Global Equity Fund Financial Highlights
| | | | | | | | | | | | | | | | | | | | | | | | |
| | | CLASS I | |
| | | (Unaudited)
Six Months
Ended
April 30, | | | Year Ended October 31, | |
| | | 2015 | | | 2014 | | | 2013 | | | 2012 | | | 2011 | | | 2010 | |
Net asset value, beginning of period | | | $15.81 | | | | $15.11 | | | | $13.11 | | | | $12.22 | | | | $11.31 | | | | $9.13 | |
Income from investment operations: | | | | | | | | | | | | | | | | | | | | | | | | |
Net investment income (loss)(a) | | | 0.01 | | | | 0.02 | | | | 0.06 | | | | 0.02 | | | | (0.04 | ) | | | (0.04 | ) |
Net realized and unrealized gain (loss) | | | 0.85 | | | | 1.09 | | | | 1.99 | | | | 0.87 | | | | 0.95 | | | | 2.22 | |
Total from investment operations | | | 0.86 | | | | 1.11 | | | | 2.05 | | | | 0.89 | | | | 0.91 | | | | 2.18 | |
Distributions: | | | | | | | | | | | | | | | | | | | | | | | | |
Dividends from net investment income | | | — | | | | (0.14 | ) | | | (0.05 | ) | | | — | | | | — | | | | — | |
Dividends from net realized gains | | | (3.10 | ) | | | (0.27 | ) | | | — | | | | — | | | | — | | | | — | |
Total distributions | | | (3.10 | ) | | | (0.41 | ) | | | (0.05 | ) | | | — | | | | — | | | | — | |
Net asset value, end of period | | | $13.57 | | | | $15.81 | | | | $15.11 | | | | $13.11 | | | | $12.22 | | | | $11.31 | |
Ratios and supplemental data: | | | | | | | | | | | | | | | | | | | | | | | | |
Total return(b) | | | 7.14% | | | | 7.48% | | | | 15.65% | | | | 7.28% | | | | 8.05% | | | | 23.88% | |
Net assets, end of period (000) | | | $99,896 | | | | $101,511 | | | | $212,913 | | | | $220,364 | | | | $63,563 | | | | $11,996 | |
Ratio of net expenses to average net assets | | | 1.09% | (c) | | | 1.15% | | | | 1.15% | | | | 1.15% | | | | 1.27% | | | | 1.63% | |
Ratio of gross expenses to average net assets prior to expense reductions | | | 1.09% | (c) | | | 1.15% | | | | 1.19% | | | | 1.27% | | | | 1.39% | | | | 1.63% | |
Ratio of net investment income (loss) to average net assets | | | 0.20% | (c) | | | 0.15% | | | | 0.46% | | | | 0.13% | | | | (0.29% | ) | | | (0.39% | ) |
| |
| | | CLASS R | |
| | | (Unaudited)
Six Months
Ended
April 30, | | | Year Ended October 31, | |
| | | 2015 | | | 2014 | | | 2013 | | | 2012 | | | 2011 | | | 2010 | |
Net asset value, beginning of period | | | $15.42 | | | | $14.75 | | | | $12.83 | | | | $12.02 | | | | $11.19 | | | | $9.07 | |
Income from investment operations: | | | | | | | | | | | | | | | | | | | | | | | | |
Net investment income (loss)(a) | | | (0.02 | ) | | | (0.04 | ) | | | 0.00 | * | | | (0.06 | ) | | | (0.10 | ) | | | (0.10 | ) |
Net realized and unrealized gain (loss) | | | 0.81 | | | | 1.05 | | | | 1.93 | | | | 0.87 | | | | 0.93 | | | | 2.22 | |
Total from investment operations | | | 0.79 | | | | 1.01 | | | | 1.93 | | | | 0.81 | | | | 0.83 | | | | 2.12 | |
Distributions: | | | | | | | | | | | | | | | | | | | | | | | | |
Dividends from net investment income | | | — | | | | (0.07 | ) | | | (0.01 | ) | | | — | | | | — | | | | — | |
Dividends from net realized gains | | | (3.10 | ) | | | (0.27 | ) | | | — | | | | — | | | | — | | | | — | |
Total distributions | | | (3.10 | ) | | | (0.34 | ) | | | (0.01 | ) | | | — | | | | — | | | | — | |
Net asset value, end of period | | | $13.11 | | | | $15.42 | | | | $14.75 | | | | $12.83 | | | | $12.02 | | | | $11.19 | |
Ratios and supplemental data: | | | | | | | | | | | | | | | | | | | | | | | | |
Total return(b) | | | 6.83% | | | | 6.97% | | | | 15.07% | | | | 6.74% | | | | 7.42% | | | | 23.37% | |
Net assets, end of period (000) | | | $8,052 | | | | $8,314 | | | | $9,369 | | | | $4,693 | | | | $1,709 | | | | $1,223 | |
Ratio of net expenses to average net assets | | | 1.59% | (c) | | | 1.64% | | | | 1.65% | | | | 1.65% | | | | 1.83% | | | | 2.13% | |
Ratio of gross expenses to average net assets prior to expense reductions | | | 1.59% | (c) | | | 1.64% | | | | 1.69% | | | | 1.78% | | | | 1.91% | | | | 2.13% | |
Ratio of net investment income (loss) to average net assets | | | (0.33% | )(c) | | | (0.29% | ) | | | 0.00% | | | | (0.45% | ) | | | (0.85% | ) | | | (0.96% | ) |
| * | Amount is less than $0.005. |
| (a) | Net investment income (loss) allocated based on average shares method. |
| (b) | Total return measures net investment income (loss) and capital gain or loss from portfolio investments assuming reinvestment of dividends and capital gains distributions. Total return is not annualized for periods that are less than a full year, does not reflect the effect of sales charge for Class A shares nor the contingent deferred sales charge for Class B and C shares and does not reflect the deduction of taxes that a shareholder would pay on fund distributions or the redemption of fund shares. |
Calamos Growth and Income Fund Financial Highlights
Selected data for a share outstanding throughout each period were as follows:
| | | | | | | | | | | | | | | | | | | | | | | | |
| | | CLASS A | |
| | | (Unaudited)
Six Months
Ended
April 30, | | | Year Ended October 31, | |
| | | 2015 | | | 2014 | | | 2013 | | | 2012 | | | 2011 | | | 2010 | |
Net asset value, beginning of period | | | $35.22 | | | | $35.84 | | | | $32.64 | | | | $32.12 | | | | $30.15 | | | | $27.49 | |
Income from investment operations: | | | | | | | | | | | | | | | | | | | | | | | | |
Net investment income (loss)(a) | | | 0.29 | | | | 0.60 | | | | 0.64 | | | | 0.52 | | | | 0.51 | | | | 0.64 | |
Net realized and unrealized gain (loss) | | | 0.39 | | | | 2.78 | | | | 3.70 | | | | 0.66 | | | | 1.89 | | | | 2.70 | |
Total from investment operations | | | 0.68 | | | | 3.38 | | | | 4.34 | | | | 1.18 | | | | 2.40 | | | | 3.34 | |
Distributions: | | | | | | | | | | | | | | | | | | | | | | | | |
Dividends from net investment income | | | (0.25 | ) | | | (0.80 | ) | | | (0.27 | ) | | | (0.66 | ) | | | (0.43 | ) | | | (0.68 | ) |
Dividends from net realized gains | | | (3.76 | ) | | | (3.20 | ) | | | (0.87 | ) | | | — | | | | — | | | | — | |
Total distributions | | | (4.01 | ) | | | (4.00 | ) | | | (1.14 | ) | | | (0.66 | ) | | | (0.43 | ) | | | (0.68 | ) |
Net asset value, end of period | | | $31.89 | | | | $35.22 | | | | $35.84 | | | | $32.64 | | | | $32.12 | | | | $30.15 | |
Ratios and supplemental data: | | | | | | | | | | | | | | | | | | | | | | | | |
Total return(b) | | | 2.10% | | | | 10.33% | | | | 13.72% | | | | 3.73% | | | | 8.04% | | | | 12.31% | |
Net assets, end of period (000) | | | $1,194,218 | | | | $1,316,498 | | | | $1,614,236 | | | | $1,974,535 | | | | $2,017,175 | | | | $1,706,548 | |
Ratio of net expenses to average net assets | | | 1.09% | (c) | | | 1.09% | | | | 1.09% | | | | 1.09% | | | | 1.08% | | | | 1.09% | |
Ratio of gross expenses to average net assets prior to expense reductions | | | 1.09% | (c) | | | 1.09% | | | | 1.09% | | | | 1.09% | | | | 1.08% | | | | 1.09% | |
Ratio of net investment income (loss) to average net assets | | | 1.80% | (c) | | | 1.76% | | | | 1.92% | | | | 1.62% | | | | 1.60% | | | | 2.26% | |
| | |
| | | (Unaudited)
Six Months
Ended
April 30, | | | Year Ended October 31, | |
| | | 2015 | | | 2014 | | | 2013 | | | 2012 | | | 2011 | | | 2010 | |
Portfolio turnover rate | | | 15.5% | | | | 32.8% | | | | 59.5% | | | | 42.8% | | | | 55.1% | | | | 54.6% | |
| (a) | Net investment income (loss) allocated based on average shares method. |
| (b) | Total return measures net investment income (loss) and capital gain or loss from portfolio investments assuming reinvestment of dividends and capital gains distributions. Total return is not annualized for periods that are less than a full year, does not reflect the effect of sales charge for Class A shares nor the contingent deferred sales charge for Class B and C shares and does not reflect the deduction of taxes that a shareholder would pay on fund distributions or the redemption of fund shares. |
| | | | |
| 218 | | CALAMOS OPEN-END FAMILY OF FUNDS SEMIANNUAL REPORT | | |
Calamos Growth and Income Fund Financial Highlights
| | | | | | | | | | | | | | | | | | | | | | | | |
| | | CLASS B | |
| | | (Unaudited)
Six Months
Ended
April 30, | | | Year Ended October 31, | |
| | | 2015 | | | 2014 | | | 2013 | | | 2012 | | | 2011 | | | 2010 | |
Net asset value, beginning of period | | | $41.04 | | | | $41.04 | | | | $37.26 | | | | $36.47 | | | | $34.22 | | | | $31.10 | |
Income from investment operations: | | | | | | | | | | | | | | | | | | | | | | | | |
Net investment income (loss)(a) | | | 0.20 | | | | 0.54 | | | | 0.70 | | | | 0.36 | | | | 0.32 | | | | 0.49 | |
Net realized and unrealized gain (loss) | | | 0.47 | | | | 3.21 | | | | 4.23 | | | | 0.77 | | | | 2.14 | | | | 3.05 | |
Total from investment operations | | | 0.67 | | | | 3.75 | | | | 4.93 | | | | 1.13 | | | | 2.46 | | | | 3.54 | |
Distributions: | | | | | | | | | | | | | | | | | | | | | | | | |
Dividends from net investment income | | | (0.08 | ) | | | (0.55 | ) | | | (0.28 | ) | | | (0.34 | ) | | | (0.21 | ) | | | (0.42 | ) |
Dividends from net realized gains | | | (3.76 | ) | | | (3.20 | ) | | | (0.87 | ) | | | — | | | | — | | | | — | |
Total distributions | | | (3.84 | ) | | | (3.75 | ) | | | (1.15 | ) | | | (0.34 | ) | | | (0.21 | ) | | | (0.42 | ) |
Net asset value, end of period | | | $37.87 | | | | $41.04 | | | | $41.04 | | | | $37.26 | | | | $36.47 | | | | $34.22 | |
Ratios and supplemental data: | | | | | | | | | | | | | | | | | | | | | | | | |
Total return(b) | | | 1.74% | | | | 9.88% | | | | 13.59% | | | | 3.12% | | | | 7.21% | | | | 11.46% | |
Net assets, end of period (000) | | | $13,580 | | | | $19,972 | | | | $49,769 | | | | $92,658 | | | | $184,989 | | | | $303,273 | |
Ratio of net expenses to average net assets | | | 1.84% | (c) | | | 1.44% | | | | 1.18% | | | | 1.73% | | | | 1.82% | | | | 1.84% | |
Ratio of gross expenses to average net assets prior to expense reductions | | | 1.84% | (c) | | | 1.44% | | | | 1.18% | | | | 1.73% | | | | 1.82% | | | | 1.84% | |
Ratio of net investment income (loss) to average net assets | | | 1.04% | (c) | | | 1.37% | | | | 1.85% | | | | 0.97% | | | | 0.88% | | | | 1.51% | |
| |
| | | CLASS C | |
| | | (Unaudited)
Six Months
Ended
April 30, | | | Year Ended October 31, | |
| | | 2015 | | | 2014 | | | 2013 | | | 2012 | | | 2011 | | | 2010 | |
Net asset value, beginning of period | | | $35.34 | | | | $35.78 | | | | $32.76 | | | | $32.23 | | | | $30.30 | | | | $27.62 | |
Income from investment operations: | | | | | | | | | | | | | | | | | | | | | | | | |
Net investment income (loss)(a) | | | 0.17 | | | | 0.35 | | | | 0.39 | | | | 0.28 | | | | 0.27 | | | | 0.43 | |
Net realized and unrealized gain (loss) | | | 0.40 | | | | 2.77 | | | | 3.71 | | | | 0.67 | | | | 1.91 | | | | 2.72 | |
Total from investment operations | | | 0.57 | | | | 3.12 | | | | 4.10 | | | | 0.95 | | | | 2.18 | | | | 3.15 | |
Distributions: | | | | | | | | | | | | | | | | | | | | | | | | |
Dividends from net investment income | | | (0.13 | ) | | | (0.36 | ) | | | (0.21 | ) | | | (0.42 | ) | | | (0.25 | ) | | | (0.47 | ) |
Dividends from net realized gains | | | (3.76 | ) | | | (3.20 | ) | | | (0.87 | ) | | | — | | | | — | | | | — | |
Total distributions | | | (3.89 | ) | | | (3.56 | ) | | | (1.08 | ) | | | (0.42 | ) | | | (0.25 | ) | | | (0.47 | ) |
Net asset value, end of period | | | $32.02 | | | | $35.34 | | | | $35.78 | | | | $32.76 | | | | $32.23 | | | | $30.30 | |
Ratios and supplemental data: | | | | | | | | | | | | | | | | | | | | | | | | |
Total return(b) | | | 1.74% | | | | 9.48% | | | | 12.88% | | | | 2.97% | | | | 7.23% | | | | 11.50% | |
Net assets, end of period (000) | | | $943,454 | | | | $1,009,029 | | | | $1,093,074 | | | | $1,255,629 | | | | $1,344,781 | | | | $1,291,168 | |
Ratio of net expenses to average net assets | | | 1.84% | (c) | | | 1.84% | | | | 1.84% | | | | 1.84% | | | | 1.83% | | | | 1.84% | |
Ratio of gross expenses to average net assets prior to expense reductions | | | 1.84% | (c) | | | 1.84% | | | | 1.84% | | | | 1.84% | | | | 1.83% | | | | 1.84% | |
Ratio of net investment income (loss) to average net assets | | | 1.05% | (c) | | | 1.02% | | | | 1.17% | | | | 0.87% | | | | 0.86% | | | | 1.51% | |
| (a) | Net investment income (loss) allocated based on average shares method. |
| (b) | Total return measures net investment income (loss) and capital gain or loss from portfolio investments assuming reinvestment of dividends and capital gains distributions. Total return is not annualized for periods that are less than a full year, does not reflect the effect of sales charge for Class A shares nor the contingent deferred sales charge for Class B and C shares and does not reflect the deduction of taxes that a shareholder would pay on fund distributions or the redemption of fund shares. |
Calamos Growth and Income Fund Financial Highlights
| | | | | | | | | | | | | | | | | | | | | | | | |
| | | CLASS I | |
| | | (Unaudited)
Six Months
Ended
April 30, | | | Year Ended October 31, | |
| | | 2015 | | | 2014 | | | 2013 | | | 2012 | | | 2011 | | | 2010 | |
Net asset value, beginning of period | | | $34.28 | | | | $35.07 | | | | $31.91 | | | | $31.41 | | | | $29.48 | | | | $26.89 | |
Income from investment operations: | | | | | | | | | | | | | | | | | | | | | | | | |
Net investment income (loss)(a) | | | 0.32 | | | | 0.68 | | | | 0.71 | | | | 0.59 | | | | 0.58 | | | | 0.70 | |
Net realized and unrealized gain (loss) | | | 0.38 | | | | 2.69 | | | | 3.62 | | | | 0.65 | | | | 1.84 | | | | 2.64 | |
Total from investment operations | | | 0.70 | | | | 3.37 | | | | 4.33 | | | | 1.24 | | | | 2.42 | | | | 3.34 | |
Distributions: | | | | | | | | | | | | | | | | | | | | | | | | |
Dividends from net investment income | | | (0.29 | ) | | | (0.96 | ) | | | (0.30 | ) | | | (0.74 | ) | | | (0.49 | ) | | | (0.75 | ) |
Dividends from net realized gains | | | (3.76 | ) | | | (3.20 | ) | | | (0.87 | ) | | | — | | | | — | | | | — | |
Total distributions | | | (4.05 | ) | | | (4.16 | ) | | | (1.17 | ) | | | (0.74 | ) | | | (0.49 | ) | | | (0.75 | ) |
Net asset value, end of period | | | $30.93 | | | | $34.28 | | | | $35.07 | | | | $31.91 | | | | $31.41 | | | | $29.48 | |
Ratios and supplemental data: | | | | | | | | | | | | | | | | | | | | | | | | |
Total return(b) | | | 2.24% | | | | 10.60% | | | | 13.99% | | | | 4.01% | | | | 8.31% | | | | 12.61% | |
Net assets, end of period (000) | | | $621,119 | | | | $688,258 | | | | $668,124 | | | | $915,394 | | | | $856,632 | | | | $683,473 | |
Ratio of net expenses to average net assets | | | 0.84% | (c) | | | 0.84% | | | | 0.84% | | | | 0.84% | | | | 0.83% | | | | 0.84% | |
Ratio of gross expenses to average net assets prior to expense reductions | | | 0.84% | (c) | | | 0.84% | | | | 0.84% | | | | 0.84% | | | | 0.83% | | | | 0.84% | |
Ratio of net investment income (loss) to average net assets | | | 2.05% | (c) | | | 2.04% | | | | 2.18% | | | | 1.87% | | | | 1.85% | | | | 2.51% | |
| |
| | | CLASS R | |
| | | (Unaudited)
Six Months
Ended
April 30, | | | Year Ended October 31, | |
| | | 2015 | | | 2014 | | | 2013 | | | 2012 | | | 2011 | | | 2010 | |
Net asset value, beginning of period | | | $34.99 | | | | $35.57 | | | | $32.46 | | | | $31.95 | | | | $30.02 | | | | $27.39 | |
Income from investment operations: | | | | | | | | | | | | | | | | | | | | | | | | |
Net investment income (loss)(a) | | | 0.25 | | | | 0.51 | | | | 0.55 | | | | 0.44 | | | | 0.43 | | | | 0.57 | |
Net realized and unrealized gain (loss) | | | 0.39 | | | | 2.75 | | | | 3.69 | | | | 0.66 | | | | 1.88 | | | | 2.69 | |
Total from investment operations | | | 0.64 | | | | 3.26 | | | | 4.24 | | | | 1.10 | | | | 2.31 | | | | 3.26 | |
Distributions: | | | | | | | | | | | | | | | | | | | | | | | | |
Dividends from net investment income | | | (0.21 | ) | | | (0.64 | ) | | | (0.26 | ) | | | (0.59 | ) | | | (0.38 | ) | | | (0.63 | ) |
Dividends from net realized gains | | | (3.76 | ) | | | (3.20 | ) | | | (0.87 | ) | | | — | | | | — | | | | — | |
Total distributions | | | (3.97 | ) | | | (3.84 | ) | | | (1.13 | ) | | | (0.59 | ) | | | (0.38 | ) | | | (0.63 | ) |
Net asset value, end of period | | | $31.66 | | | | $34.99 | | | | $35.57 | | | | $32.46 | | | | $31.95 | | | | $30.02 | |
Ratios and supplemental data: | | | | | | | | | | | | | | | | | | | | | | | | |
Total return(b) | | | 1.99% | | | | 10.04% | | | | 13.44% | | | | 3.49% | | | | 7.75% | | | | 12.05% | |
Net assets, end of period (000) | | | $16,844 | | | | $18,547 | | | | $22,181 | | | | $22,265 | | | | $15,486 | | | | $10,285 | |
Ratio of net expenses to average net assets | | | 1.34% | (c) | | | 1.34% | | | | 1.34% | | | | 1.34% | | | | 1.33% | | | | 1.34% | |
Ratio of gross expenses to average net assets prior to expense reductions | | | 1.34% | (c) | | | 1.34% | | | | 1.34% | | | | 1.34% | | | | 1.33% | | | | 1.34% | |
Ratio of net investment income (loss) to average net assets | | | 1.55% | (c) | | | 1.52% | | | | 1.66% | | | | 1.37% | | | | 1.34% | | | | 2.00% | |
| (a) | Net investment income (loss) allocated based on average shares method. |
| (b) | Total return measures net investment income (loss) and capital gain or loss from portfolio investments assuming reinvestment of dividends and capital gains distributions. Total return is not annualized for periods that are less than a full year, does not reflect the effect of sales charge for Class A shares nor the contingent deferred sales charge for Class B and C shares and does not reflect the deduction of taxes that a shareholder would pay on fund distributions or the redemption of fund shares. |
| | | | |
| 220 | | CALAMOS OPEN-END FAMILY OF FUNDS SEMIANNUAL REPORT | | |
Calamos Global Growth and Income Fund Financial Highlights
Selected data for a share outstanding throughout each period were as follows:
| | | | | | | | | | | | | | | | | | | | | | | | |
| | | CLASS A | |
| | | (Unaudited)
Six Months
Ended
April 30, | | | Year Ended October 31, | |
| | | 2015 | | | 2014 | | | 2013 | | | 2012 | | | 2011 | | | 2010 | |
Net asset value, beginning of period | | | $10.22 | | | | $11.78 | | | | $10.88 | | | | $10.77 | | | | $10.16 | | | | $9.20 | |
Income from investment operations: | | | | | | | | | | | | | | | | | | | | | | | | |
Net investment income (loss)(a) | | | 0.05 | | | | 0.11 | | | | 0.10 | | | | 0.11 | | | | 0.11 | | | | 0.17 | |
Net realized and unrealized gain (loss) | | | 0.34 | | | | 0.36 | | | | 1.13 | | | | 0.21 | | | | 0.50 | | | | 0.98 | |
Total from investment operations | | | 0.39 | | | | 0.47 | | | | 1.23 | | | | 0.32 | | | | 0.61 | | | | 1.15 | |
Distributions: | | | | | | | | | | | | | | | | | | | | | | | | |
Dividends from net investment income | | | (0.04 | ) | | | (0.29 | ) | | | (0.09 | ) | | | (0.21 | ) | | | — | | | | (0.04 | ) |
Dividends from net realized gains | | | (1.71 | ) | | | (1.74 | ) | | | (0.24 | ) | | | — | | | | — | | | | — | |
Return of capital | | | — | | | | — | | | | — | | | | — | | | | — | | | | (0.15 | ) |
Total distributions | | | (1.75 | ) | | | (2.03 | ) | | | (0.33 | ) | | | (0.21 | ) | | | — | | | | (0.19 | ) |
Net asset value, end of period | | | $8.86 | | | | $10.22 | | | | $11.78 | | | | $10.88 | | | | $10.77 | | | | $10.16 | |
Ratios and supplemental data: | | | | | | | | | | | | | | | | | | | | | | | | |
Total return(b) | | | 4.74% | | | | 4.77% | | | | 11.60% | | | | 3.03% | | | | 6.00% | | | | 12.64% | |
Net assets, end of period (000) | | | $125,501 | | | | $146,431 | | | | $210,537 | | | | $304,914 | | | | $373,595 | | | | $318,493 | |
Ratio of net expenses to average net assets | | | 1.47% | (c) | | | 1.44% | | | | 1.41% | | | | 1.32% | | | | 1.32% | | | | 1.36% | |
Ratio of gross expenses to average net assets prior to expense reductions | | | 1.47% | (c) | | | 1.44% | | | | 1.41% | | | | 1.32% | | | | 1.32% | | | | 1.36% | |
Ratio of net investment income (loss) to average net assets | | | 1.17% | (c) | | | 1.01% | | | | 0.92% | | | | 1.06% | | | | 1.01% | | | | 1.74% | |
| | |
| | | (Unaudited)
Six Months
Ended
April 30, | | | Year Ended October 31, | |
| | | 2015 | | | 2014 | | | 2013 | | | 2012 | | | 2011 | | | 2010 | |
Portfolio turnover rate | | | 27.4% | | | | 72.6% | | | | 48.2% | | | | 55.1% | | | | 73.1% | | | | 62.2% | |
| (a) | Net investment income (loss) allocated based on average shares method. |
| (b) | Total return measures net investment income (loss) and capital gain or loss from portfolio investments assuming reinvestment of dividends and capital gains distributions. Total return is not annualized for periods that are less than a full year, does not reflect the effect of sales charge for Class A shares nor the contingent deferred sales charge for Class B and C shares and does not reflect the deduction of taxes that a shareholder would pay on fund distributions or the redemption of fund shares. |
Calamos Global Growth and Income Fund Financial Highlights
| | | | | | | | | | | | | | | | | | | | | | | | |
| | | CLASS B | |
| | | (Unaudited)
Six Months
Ended
April 30, | | | Year Ended October 31, | |
| | | 2015 | | | 2014 | | | 2013 | | | 2012 | | | 2011 | | | 2010 | |
Net asset value, beginning of period | | | $10.37 | | | | $11.86 | | | | $10.97 | | | | $10.85 | | | | $10.32 | | | | $9.37 | |
Income from investment operations: | | | | | | | | | | | | | | | | | | | | | | | | |
Net investment income (loss)(a) | | | 0.02 | | | | 0.02 | | | | 0.02 | | | | 0.03 | | | | 0.03 | | | | 0.10 | |
Net realized and unrealized gain (loss) | | | 0.34 | | | | 0.38 | | | | 1.14 | | | | 0.21 | | | | 0.50 | | | | 1.00 | |
Total from investment operations | | | 0.36 | | | | 0.40 | | | | 1.16 | | | | 0.24 | | | | 0.53 | | | | 1.10 | |
Distributions: | | | | | | | | | | | | | | | | | | | | | | | | |
Dividends from net investment income | | | — | | | | (0.15 | ) | | | (0.03 | ) | | | (0.12 | ) | | | — | | | | (0.03 | ) |
Dividends from net realized gains | | | (1.71 | ) | | | (1.74 | ) | | | (0.24 | ) | | | — | | | | — | | | | — | |
Return of capital | | | — | | | | — | | | | — | | | | — | | | | — | | | | (0.12 | ) |
Total distributions | | | (1.71 | ) | | | (1.89 | ) | | | (0.27 | ) | | | (0.12 | ) | | | — | | | | (0.15 | ) |
Net asset value, end of period | | | $9.02 | | | | $10.37 | | | | $11.86 | | | | $10.97 | | | | $10.85 | | | | $10.32 | |
Ratios and supplemental data: | | | | | | | | | | | | | | | | | | | | | | | | |
Total return(b) | | | 4.30% | | | | 4.04% | | | | 10.77% | | | | 2.25% | | | | 5.14% | | | | 11.86% | |
Net assets, end of period (000) | | | $3,325 | | | | $4,937 | | | | $10,884 | | | | $16,654 | | | | $30,770 | | | | $43,323 | |
Ratio of net expenses to average net assets | | | 2.22% | (c) | | | 2.19% | | | | 2.16% | | | | 2.07% | | | | 2.07% | | | | 2.12% | |
Ratio of gross expenses to average net assets prior to expense reductions | | | 2.22% | (c) | | | 2.19% | | | | 2.16% | | | | 2.07% | | | | 2.07% | | | | 2.12% | |
Ratio of net investment income (loss) to average net assets | | | 0.39% | (c) | | | 0.22% | | | | 0.17% | | | | 0.30% | | | | 0.26% | | | | 0.99% | |
| |
| | | CLASS C | |
| | | (Unaudited)
Six Months
Ended
April 30, | | | Year Ended October 31, | |
| | | 2015 | | | 2014 | | | 2013 | | | 2012 | | | 2011 | | | 2010 | |
Net asset value, beginning of period | | | $9.50 | | | | $11.06 | | | | $10.25 | | | | $10.15 | | | | $9.65 | | | | $8.78 | |
Income from investment operations: | | | | | | | | | | | | | | | | | | | | | | | | |
Net investment income (loss)(a) | | | 0.02 | | | | 0.03 | | | | 0.02 | | | | 0.03 | | | | 0.03 | | | | 0.09 | |
Net realized and unrealized gain (loss) | | | 0.30 | | | | 0.33 | | | | 1.06 | | | | 0.20 | | | | 0.47 | | | | 0.94 | |
Total from investment operations | | | 0.32 | | | | 0.36 | | | | 1.08 | | | | 0.23 | | | | 0.50 | | | | 1.03 | |
Distributions: | | | | | | | | | | | | | | | | | | | | | | | | |
Dividends from net investment income | | | — | | | | (0.18 | ) | | | (0.03 | ) | | | (0.13 | ) | | | — | | | | (0.03 | ) |
Dividends from net realized gains | | | (1.71 | ) | | | (1.74 | ) | | | (0.24 | ) | | | — | | | | — | | | | — | |
Return of capital | | | — | | | | — | | | | — | | | | — | | | | — | | | | (0.13 | ) |
Total distributions | | | (1.71 | ) | | | (1.92 | ) | | | (0.27 | ) | | | (0.13 | ) | | | — | | | | (0.16 | ) |
Net asset value, end of period | | | $8.11 | | | | $9.50 | | | | $11.06 | | | | $10.25 | | | | $10.15 | | | | $9.65 | |
Ratios and supplemental data: | | | | | | | | | | | | | | | | | | | | | | | | |
Total return(b) | | | 4.28% | | | | 3.98% | | | | 10.82% | | | | 2.29% | | | | 5.18% | | | | 11.81% | |
Net assets, end of period (000) | | | $133,556 | | | | $151,091 | | | | $185,577 | | | | $235,194 | | | | $282,801 | | | | $276,141 | |
Ratio of net expenses to average net assets | | | 2.22% | (c) | | | 2.19% | | | | 2.16% | | | | 2.07% | | | | 2.07% | | | | 2.11% | |
Ratio of gross expenses to average net assets prior to expense reductions | | | 2.22% | (c) | | | 2.19% | | | | 2.16% | | | | 2.07% | | | | 2.07% | | | | 2.11% | |
Ratio of net investment income (loss) to average net assets | | | 0.43% | (c) | | | 0.27% | | | | 0.17% | | | | 0.31% | | | | 0.26% | | | | 0.99% | |
| (a) | Net investment income (loss) allocated based on average shares method. |
| (b) | Total return measures net investment income (loss) and capital gain or loss from portfolio investments assuming reinvestment of dividends and capital gains distributions. Total return is not annualized for periods that are less than a full year, does not reflect the effect of sales charge for Class A shares nor the contingent deferred sales charge for Class B and C shares and does not reflect the deduction of taxes that a shareholder would pay on fund distributions or the redemption of fund shares. |
| | | | |
| 222 | | CALAMOS OPEN-END FAMILY OF FUNDS SEMIANNUAL REPORT | | |
Calamos Global Growth and Income Fund Financial Highlights
| | | | | | | | | | | | | | | | | | | | | | | | |
| | | CLASS I | |
| | | (Unaudited)
Six Months
Ended
April 30, | | | Year Ended October 31, | |
| | | 2015 | | | 2014 | | | 2013 | | | 2012 | | | 2011 | | | 2010 | |
Net asset value, beginning of period | | | $10.43 | | | | $11.99 | | | | $11.06 | | | | $10.96 | | | | $10.32 | | | | $9.33 | |
Income from investment operations: | | | | | | | | | | | | | | | | | | | | | | | | |
Net investment income (loss)(a) | | | 0.07 | | | | 0.14 | | | | 0.13 | | | | 0.14 | | | | 0.14 | | | | 0.19 | |
Net realized and unrealized gain (loss) | | | 0.33 | | | | 0.36 | | | | 1.15 | | | | 0.22 | | | | 0.50 | | | | 1.00 | |
Total from investment operations | | | 0.40 | | | | 0.50 | | | | 1.28 | | | | 0.36 | | | | 0.64 | | | | 1.19 | |
Distributions: | | | | | | | | | | | | | | | | | | | | | | | | |
Dividends from net investment income | | | (0.06 | ) | | | (0.32 | ) | | | (0.11 | ) | | | (0.26 | ) | | | — | | | | (0.04 | ) |
Dividends from net realized gains | | | (1.71 | ) | | | (1.74 | ) | | | (0.24 | ) | | | — | | | | — | | | | — | |
Return of capital | | | — | | | | — | | | | — | | | | — | | | | — | | | | (0.16 | ) |
Total distributions | | | (1.77 | ) | | | (2.06 | ) | | | (0.35 | ) | | | (0.26 | ) | | | — | | | | (0.20 | ) |
Net asset value, end of period | | | $9.06 | | | | $10.43 | | | | $11.99 | | | | $11.06 | | | | $10.96 | | | | $10.32 | |
Ratios and supplemental data: | | | | | | | | | | | | | | | | | | | | | | | | |
Total return(b) | | | 4.77% | | | | 4.99% | | | | 11.90% | | | | 3.32% | | | | 6.20% | | | | 12.92% | |
Net assets, end of period (000) | | | $157,050 | | | | $182,064 | | | | $232,583 | | | | $986,986 | | | | $978,511 | | | | $763,531 | |
Ratio of net expenses to average net assets | | | 1.22% | (c) | | | 1.19% | | | | 1.14% | | | | 1.07% | | | | 1.07% | | | | 1.11% | |
Ratio of gross expenses to average net assets prior to expense reductions | | | 1.22% | (c) | | | 1.19% | | | | 1.14% | | | | 1.07% | | | | 1.07% | | | | 1.11% | |
Ratio of net investment income (loss) to average net assets | | | 1.43% | (c) | | | 1.29% | | | | 1.16% | | | | 1.31% | | | | 1.25% | | | | 1.97% | |
| |
| | | CLASS R | |
| | | (Unaudited)
Six Months
Ended
April 30, | | | Year Ended October 31, | |
| | | 2015 | | | 2014 | | | 2013 | | | 2012 | | | 2011 | | | 2010 | |
Net asset value, beginning of period | | | $10.13 | | | | $11.67 | | | | $10.79 | | | | $10.67 | | | | $10.09 | | | | $9.16 | |
Income from investment operations: | | | | | | | | | | | | | | | | | | | | | | | | |
Net investment income (loss)(a) | | | 0.04 | | | | 0.08 | | | | 0.07 | | | | 0.08 | | | | 0.08 | | | | 0.14 | |
Net realized and unrealized gain (loss) | | | 0.32 | | | | 0.37 | | | | 1.12 | | | | 0.21 | | | | 0.50 | | | | 0.97 | |
Total from investment operations | | | 0.36 | | | | 0.45 | | | | 1.19 | | | | 0.29 | | | | 0.58 | | | | 1.11 | |
Distributions: | | | | | | | | | | | | | | | | | | | | | | | | |
Dividends from net investment income | | | (0.02 | ) | | | (0.25 | ) | | | (0.07 | ) | | | (0.17 | ) | | | — | | | | (0.04 | ) |
Dividends from net realized gains | | | (1.71 | ) | | | (1.74 | ) | | | (0.24 | ) | | | — | | | | — | | | | — | |
Return of capital | | | — | | | | — | | | | — | | | | — | | | | — | | | | (0.14 | ) |
Total distributions | | | (1.73 | ) | | | (1.99 | ) | | | (0.31 | ) | | | (0.17 | ) | | | — | | | | (0.18 | ) |
Net asset value, end of period | | | $8.76 | | | | $10.13 | | | | $11.67 | | | | $10.79 | | | | $10.67 | | | | $10.09 | |
Ratios and supplemental data: | | | | | | | | | | | | | | | | | | | | | | | | |
Total return(b) | | | 4.48% | | | | 4.62% | | | | 11.27% | | | | 2.77% | | | | 5.75% | | | | 12.26% | |
Net assets, end of period (000) | | | $1,595 | | | | $1,741 | | | | $1,674 | | | | $3,045 | | | | $1,567 | | | | $1,302 | |
Ratio of net expenses to average net assets | | | 1.72% | (c) | | | 1.69% | | | | 1.66% | | | | 1.58% | | | | 1.57% | | | | 1.61% | |
Ratio of gross expenses to average net assets prior to expense reductions | | | 1.72% | (c) | | | 1.69% | | | | 1.66% | | | | 1.58% | | | | 1.57% | | | | 1.61% | |
Ratio of net investment income (loss) to average net assets | | | 0.94% | (c) | | | 0.77% | | | | 0.68% | | | | 0.75% | | | | 0.77% | | | | 1.43% | |
| (a) | Net investment income (loss) allocated based on average shares method. |
| (b) | Total return measures net investment income (loss) and capital gain or loss from portfolio investments assuming reinvestment of dividends and capital gains distributions. Total return is not annualized for periods that are less than a full year, does not reflect the effect of sales charge for Class A shares nor the contingent deferred sales charge for Class B and C shares and does not reflect the deduction of taxes that a shareholder would pay on fund distributions or the redemption of fund shares. |
Calamos Convertible Fund Financial Highlights
Selected data for a share outstanding throughout each period were as follows:
| | | | | | | | | | | | | | | | | | | | | | | | |
| | | CLASS A | |
| | | (Unaudited)
Six Months
Ended
April 30, | | | Year Ended October 31, | |
| | | 2015 | | | 2014 | | | 2013 | | | 2012 | | | 2011 | | | 2010 | |
Net asset value, beginning of period | | | $18.59 | | | | $19.14 | | | | $17.70 | | | | $19.28 | | | | $19.60 | | | | $18.31 | |
Income from investment operations: | | | | | | | | | | | | | | | | | | | | | | | | |
Net investment income (loss)(a) | | | 0.21 | | | | 0.40 | | | | 0.39 | | | | 0.37 | | | | 0.40 | | | | 0.53 | |
Net realized and unrealized gain (loss) | | | 0.06 | | | | 1.14 | | | | 2.63 | | | | (0.33 | ) | | | 0.14 | | | | 1.45 | |
Total from investment operations | | | 0.27 | | | | 1.54 | | | | 3.02 | | | | 0.04 | | | | 0.54 | | | | 1.98 | |
Distributions: | | | | | | | | | | | | | | | | | | | | | | | | |
Dividends from net investment income | | | (0.23 | ) | | | (0.76 | ) | | | (0.02 | ) | | | (0.14 | ) | | | (0.25 | ) | | | (0.69 | ) |
Dividends from net realized gains | | | (0.88 | ) | | | (1.33 | ) | | | (1.56 | ) | | | (1.48 | ) | | | (0.61 | ) | | | — | |
Total distributions | | | (1.11 | ) | | | (2.09 | ) | | | (1.58 | ) | | | (1.62 | ) | | | (0.86 | ) | | | (0.69 | ) |
Net asset value, end of period | | | $17.75 | | | | $18.59 | | | | $19.14 | | | | $17.70 | | | | $19.28 | | | | $19.60 | |
Ratios and supplemental data: | | | | | | | | | | | | | | | | | | | | | | | | |
Total return(b) | | | 1.60% | | | | 8.74% | | | | 18.50% | | | | 0.51% | | | | 2.73% | | | | 11.06% | |
Net assets, end of period (000) | | | $453,719 | | | | $488,842 | | | | $514,593 | | | | $650,100 | | | | $1,269,501 | | | | $1,741,954 | |
Ratio of net expenses to average net assets | | | 1.11% | (c) | | | 1.10% | | | | 1.11% | | | | 1.10% | | | | 1.07% | | | | 1.08% | |
Ratio of gross expenses to average net assets prior to expense reductions | | | 1.11% | (c) | | | 1.10% | | | | 1.11% | | | | 1.10% | | | | 1.07% | | | | 1.08% | |
Ratio of net investment income (loss) to average net assets | | | 2.42% | (c) | | | 2.18% | | | | 2.18% | | | | 2.07% | | | | 2.03% | | | | 2.82% | |
| | |
| | | (Unaudited)
Six Months
Ended
April 30, | | | Year Ended October 31, | |
| | | 2015 | | | 2014 | | | 2013 | | | 2012 | | | 2011 | | | 2010 | |
Portfolio turnover rate | | | 37.1% | | | | 68.1% | | | | 73.1% | | | | 56.6% | | | | 65.7% | | | | 77.4% | |
| (a) | Net investment income (loss) allocated based on average shares method. |
| (b) | Total return measures net investment income (loss) and capital gain or loss from portfolio investments assuming reinvestment of dividends and capital gains distributions. Total return is not annualized for periods that are less than a full year, does not reflect the effect of sales charge for Class A shares nor the contingent deferred sales charge for Class B and C shares and does not reflect the deduction of taxes that a shareholder would pay on fund distributions or the redemption of fund shares. |
| | | | |
| 224 | | CALAMOS OPEN-END FAMILY OF FUNDS SEMIANNUAL REPORT | | |
Calamos Convertible Fund Financial Highlights
| | | | | | | | | | | | | | | | | | | | | | | | |
| | | CLASS B | |
| | | (Unaudited)
Six Months
Ended
April 30, | | | Year Ended October 31, | |
| | | 2015 | | | 2014 | | | 2013 | | | 2012 | | | 2011 | | | 2010 | |
Net asset value, beginning of period | | | $23.29 | | | | $23.27 | | | | $21.31 | | | | $22.89 | | | | $23.14 | | | | $21.48 | |
Income from investment operations: | | | | | | | | | | | | | | | | | | | | | | | | |
Net investment income (loss)(a) | | | 0.19 | | | | 0.32 | | | | 0.31 | | | | 0.28 | | | | 0.32 | | | | 0.47 | |
Net realized and unrealized gain (loss) | | | 0.07 | | | | 1.41 | | | | 3.21 | | | | (0.38 | ) | | | 0.15 | | | | 1.69 | |
Total from investment operations | | | 0.26 | | | | 1.73 | | | | 3.52 | | | | (0.10 | ) | | | 0.47 | | | | 2.16 | |
Distributions: | | | | | | | | | | | | | | | | | | | | | | | | |
Dividends from net investment income | | | (0.14 | ) | | | (0.38 | ) | | | — | | | | (0.00 | )** | | | (0.11 | ) | | | (0.50 | ) |
Dividends from net realized gains | | | (0.88 | ) | | | (1.33 | ) | | | (1.56 | ) | | | (1.48 | ) | | | (0.61 | ) | | | — | |
Total distributions | | | (1.02 | ) | | | (1.71 | ) | | | (1.56 | ) | | | (1.48 | ) | | | (0.72 | ) | | | (0.50 | ) |
Net asset value, end of period | | | $22.53 | | | | $23.29 | | | | $23.27 | | | | $21.31 | | | | $22.89 | | | | $23.14 | |
Ratios and supplemental data: | | | | | | | | | | | | | | | | | | | | | | | | |
Total return(b) | | | 1.19% | | | | 7.89% | | | | 17.63% | | | | (0.25% | ) | | | 2.01% | | | | 10.20% | |
Net assets, end of period (000) | | | $7,772 | | | | $9,879 | | | | $11,391 | | | | $14,256 | | | | $21,517 | | | | $56,141 | |
Ratio of net expenses to average net assets | | | 1.86% | (c) | | | 1.86% | | | | 1.86% | | | | 1.85% | | | | 1.82% | | | | 1.83% | |
Ratio of gross expenses to average net assets prior to expense reductions | | | 1.86% | (c) | | | 1.86% | | | | 1.86% | | | | 1.85% | | | | 1.82% | | | | 1.83% | |
Ratio of net investment income (loss) to average net assets | | | 1.65% | (c) | | | 1.42% | | | | 1.43% | | | | 1.32% | | | | 1.36% | | | | 2.12% | |
| |
| | | CLASS C | |
| | | (Unaudited)
Six Months
Ended
April 30, | | | Year Ended October 31, | |
| | | 2015 | | | 2014 | | | 2013 | | | 2012 | | | 2011 | | | 2010 | |
Net asset value, beginning of period | | | $18.43 | | | | $18.87 | | | | $17.57 | | | | $19.15 | | | | $19.51 | | | | $18.24 | |
Income from investment operations: | | | | | | | | | | | | | | | | | | | | | | | | |
Net investment income (loss)(a) | | | 0.15 | | | | 0.26 | | | | 0.25 | | | | 0.23 | | | | 0.25 | | | | 0.38 | |
Net realized and unrealized gain (loss) | | | 0.05 | | | | 1.11 | | | | 2.61 | | | | (0.32 | ) | | | 0.14 | | | | 1.45 | |
Total from investment operations | | | 0.20 | | | | 1.37 | | | | 2.86 | | | | (0.09 | ) | | | 0.39 | | | | 1.83 | |
Distributions: | | | | | | | | | | | | | | | | | | | | | | | | |
Dividends from net investment income | | | (0.16 | ) | | | (0.48 | ) | | | — | | | | (0.01 | ) | | | (0.14 | ) | | | (0.56 | ) |
Dividends from net realized gains | | | (0.88 | ) | | | (1.33 | ) | | | (1.56 | ) | | | (1.48 | ) | | | (0.61 | ) | | | — | |
Total distributions | | | (1.04 | ) | | | (1.81 | ) | | | (1.56 | ) | | | (1.49 | ) | | | (0.75 | ) | | | (0.56 | ) |
Net asset value, end of period | | | $17.59 | | | | $18.43 | | | | $18.87 | | | | $17.57 | | | | $19.15 | | | | $19.51 | |
Ratios and supplemental data: | | | | | | | | | | | | | | | | | | | | | | | | |
Total return(b) | | | 1.23% | | | | 7.86% | | | | 17.62% | | | | (0.24% | ) | | | 1.99% | | | | 10.20% | |
Net assets, end of period (000) | | | $299,593 | | | | $319,654 | | | | $325,823 | | | | $390,649 | | | | $584,428 | | | | $706,108 | |
Ratio of net expenses to average net assets | | | 1.86% | (c) | | | 1.86% | | | | 1.86% | | | | 1.85% | | | | 1.82% | | | | 1.83% | |
Ratio of gross expenses to average net assets prior to expense reductions | | | 1.86% | (c) | | | 1.86% | | | | 1.86% | | | | 1.85% | | | | 1.82% | | | | 1.83% | |
Ratio of net investment income (loss) to average net assets | | | 1.67% | (c) | | | 1.43% | | | | 1.43% | | | | 1.32% | | | | 1.26% | | | | 2.03% | |
| ** | Amounts are less than $0.005. |
| (a) | Net investment income (loss) allocated based on average shares method. |
| (b) | Total return measures net investment income (loss) and capital gain or loss from portfolio investments assuming reinvestment of dividends and capital gains distributions. Total return is not annualized for periods that are less than a full year, does not reflect the effect of sales charge for Class A shares nor the contingent deferred sales charge for Class B and C shares and does not reflect the deduction of taxes that a shareholder would pay on fund distributions or the redemption of fund shares. |
Calamos Convertible Fund Financial Highlights
| | | | | | | | | | | | | | | | | | | | | | | | |
| | | CLASS I | |
| | | (Unaudited)
Six Months
Ended
April 30, | | | Year Ended October 31, | |
| | | 2015 | | | 2014 | | | 2013 | | | 2012 | | | 2011 | | | 2010 | |
Net asset value, beginning of period | | | $17.02 | | | | $17.74 | | | | $16.51 | | | | $18.10 | | | | $18.44 | | | | $17.27 | |
Income from investment operations: | | | | | | | | | | | | | | | | | | | | | | | | |
Net investment income (loss)(a) | | | 0.22 | | | | 0.41 | | | | 0.40 | | | | 0.39 | | | | 0.42 | | | | 0.53 | |
Net realized and unrealized gain (loss) | | | 0.04 | | | | 1.04 | | | | 2.44 | | | | (0.30 | ) | | | 0.14 | | | | 1.38 | |
Total from investment operations | | | 0.26 | | | | 1.45 | | | | 2.84 | | | | 0.09 | | | | 0.56 | | | | 1.91 | |
Distributions: | | | | | | | | | | | | | | | | | | | | | | | | |
Dividends from net investment income | | | (0.25 | ) | | | (0.84 | ) | | | (0.05 | ) | | | (0.20 | ) | | | (0.29 | ) | | | (0.74 | ) |
Dividends from net realized gains | | | (0.88 | ) | | | (1.33 | ) | | | (1.56 | ) | | | (1.48 | ) | | | (0.61 | ) | | | — | |
Total distributions | | | (1.13 | ) | | | (2.17 | ) | | | (1.61 | ) | | | (1.68 | ) | | | (0.90 | ) | | | (0.74 | ) |
Net asset value, end of period | | | $16.15 | | | | $17.02 | | | | $17.74 | | | | $16.51 | | | | $18.10 | | | | $18.44 | |
Ratios and supplemental data: | | | | | | | | | | | | | | | | | | | | | | | | |
Total return(b) | | | 1.71% | | | | 8.99% | | | | 18.78% | | | | 0.81% | | | | 3.00% | | | | 11.32% | |
Net assets, end of period (000) | | | $493,233 | | | | $553,594 | | | | $349,512 | | | | $475,526 | | | | $759,415 | | | | $883,151 | |
Ratio of net expenses to average net assets | | | 0.86% | (c) | | | 0.85% | | | | 0.86% | | | | 0.85% | | | | 0.82% | | | | 0.82% | |
Ratio of gross expenses to average net assets prior to expense reductions | | | 0.86% | (c) | | | 0.85% | | | | 0.86% | | | | 0.85% | | | | 0.82% | | | | 0.82% | |
Ratio of net investment income (loss) to average net assets | | | 2.67% | (c) | | | 2.46% | | | | 2.43% | | | | 2.33% | | | | 2.26% | | | | 2.97% | |
| |
| | | CLASS R | |
| | | (Unaudited)
Six Months
Ended
April 30, | | | Year Ended October 31, | |
| | | 2015 | | | 2014 | | | 2013 | | | 2012 | | | 2011 | | | 2010 | |
Net asset value, beginning of period | | | $18.52 | | | | $19.03 | | | | $17.63 | | | | $19.21 | | | | $19.55 | | | | $18.28 | |
Income from investment operations: | | | | | | | | | | | | | | | | | | | | | | | | |
Net investment income (loss)(a) | | | 0.19 | | | | 0.35 | | | | 0.34 | | | | 0.32 | | | | 0.34 | | | | 0.45 | |
Net realized and unrealized gain (loss) | | | 0.06 | | | | 1.13 | | | | 2.62 | | | | (0.32 | ) | | | 0.14 | | | | 1.48 | |
Total from investment operations | | | 0.25 | | | | 1.48 | | | | 2.96 | | | | — | | | | 0.48 | | | | 1.93 | |
Distributions: | | | | | | | | | | | | | | | | | | | | | | | | |
Dividends from net investment income | | | (0.20 | ) | | | (0.66 | ) | | | (0.00 | )** | | | (0.10 | ) | | | (0.21 | ) | | | (0.66 | ) |
Dividends from net realized gains | | | (0.88 | ) | | | (1.33 | ) | | | (1.56 | ) | | | (1.48 | ) | | | (0.61 | ) | | | — | |
Total distributions | | | (1.08 | ) | | | (1.99 | ) | | | (1.56 | ) | | | (1.58 | ) | | | (0.82 | ) | | | (0.66 | ) |
Net asset value, end of period | | | $17.69 | | | | $18.52 | | | | $19.03 | | | | $17.63 | | | | $19.21 | | | | $19.55 | |
Ratios and supplemental data: | | | | | | | | | | | | | | | | | | | | | | | | |
Total return(b) | | | 1.50% | | | | 8.44% | | | | 18.18% | | | | 0.29% | | | | 2.46% | | | | 10.78% | |
Net assets, end of period (000) | | | $2,262 | | | | $2,988 | | | | $3,074 | | | | $3,253 | | | | $4,134 | | | | $2,878 | |
Ratio of net expenses to average net assets | | | 1.36% | (c) | | | 1.36% | | | | 1.36% | | | | 1.35% | | | | 1.32% | | | | 1.32% | |
Ratio of gross expenses to average net assets prior to expense reductions | | | 1.36% | (c) | | | 1.36% | | | | 1.36% | | | | 1.35% | | | | 1.32% | | | | 1.32% | |
Ratio of net investment income (loss) to average net assets | | | 2.13% | (c) | | | 1.92% | | | | 1.93% | | | | 1.82% | | | | 1.72% | | | | 2.39% | |
| ** | Amounts are less than $0.005. |
| (a) | Net investment income (loss) allocated based on average shares method. |
| (b) | Total return measures net investment income (loss) and capital gain or loss from portfolio investments assuming reinvestment of dividends and capital gains distributions. Total return is not annualized for periods that are less than a full year, does not reflect the effect of sales charge for Class A shares nor the contingent deferred sales charge for Class B and C shares and does not reflect the deduction of taxes that a shareholder would pay on fund distributions or the redemption of fund shares. |
| | | | |
| 226 | | CALAMOS OPEN-END FAMILY OF FUNDS SEMIANNUAL REPORT | | |
Calamos Global Convertible Fund Financial Highlights
Selected data for a share outstanding throughout each period were as follows:
| | | | |
| | | CLASS A | |
| | | (Unaudited)
December 31,
2014*
through April 30, | |
| | | 2015 | |
Net asset value, beginning of period | | | $10.00 | |
Income from investment operations: | | | | |
Net investment income (loss)(a) | | | 0.07 | |
Net realized and unrealized gain (loss) | | | 0.34 | |
Total from investment operations | | | 0.41 | |
Distributions: | | | | |
Dividends from net investment income | | | — | |
Dividends from net realized gains | | | — | |
Total distributions | | | — | |
Net asset value, end of period | | | $10.41 | |
Ratios and supplemental data: | | | | |
Total return(b) | | | 4.10% | |
Net assets, end of period (000) | | | $4,710 | |
Ratio of net expenses to average net assets | | | 1.35% | (c) |
Ratio of gross expenses to average net assets prior to expense reductions | | | 3.94% | (c) |
Ratio of net investment income (loss) to average net assets | | | 2.16% | (c) |
| |
| | | (Unaudited)
December 31,
2014*
through
April 30, | |
| | | 2015 | |
Portfolio turnover rate | | | 4.3% | |
| * | Commencement of operations. |
| (a) | Net investment income (loss) allocated based on average shares method. |
| (b) | Total return measures net investment income (loss) and capital gain or loss from portfolio investments assuming reinvestment of dividends and capital gains distributions. Total return is not annualized for periods that are less than a full year, does not reflect the effect of sales charge for Class A shares nor the contingent deferred sales charge for Class C shares and does not reflect the deduction of taxes that a shareholder would pay on fund distributions or the redemption of fund shares. |
Calamos Global Convertible Fund Financial Highlights
| | | | |
| | | CLASS C | |
| | | (Unaudited)
December 31,
2014*
through
April 30, | |
| | | 2015 | |
Net asset value, beginning of period | | | $10.00 | |
Income from investment operations: | | | | |
Net investment income (loss)(a) | | | 0.05 | |
Net realized and unrealized gain (loss) | | | 0.34 | |
Total from investment operations | | | 0.39 | |
Distributions: | | | | |
Dividends from net investment income | | | — | |
Dividends from net realized gains | | | — | |
Total distributions | | | — | |
Net asset value, end of period | | | $10.39 | |
Ratios and supplemental data: | | | | |
Total return(b) | | | 3.90% | |
Net assets, end of period (000) | | | $247 | |
Ratio of net expenses to average net assets | | | 2.10% | (c) |
Ratio of gross expenses to average net assets prior to expense reductions | | | 4.61% | (c) |
Ratio of net investment income (loss) to average net assets | | | 1.40% | (c) |
| |
| | | CLASS I | |
| | | (Unaudited)
December 31,
2014*
through
April 30, | |
| | | 2015 | |
Net asset value, beginning of period | | | $10.00 | |
Income from investment operations: | | | | |
Net investment income (loss)(a) | | | 0.08 | |
Net realized and unrealized gain (loss) | | | 0.35 | |
Total from investment operations | | | 0.43 | |
Distributions: | | | | |
Dividends from net investment income | | | — | |
Dividends from net realized gains | | | — | |
Total distributions | | | — | |
Net asset value, end of period | | | $10.43 | |
Ratios and supplemental data: | | | | |
Total return(b) | | | 4.30% | |
Net assets, end of period (000) | | | $10,439 | |
Ratio of net expenses to average net assets | | | 1.10% | (c) |
Ratio of gross expenses to average net assets prior to expense reductions | | | 3.82% | (c) |
Ratio of net investment income (loss) to average net assets | | | 2.38% | (c) |
| * | Commencement of operations. |
| (a) | Net investment income allocated based on average shares method. |
| (b) | Total return measures net investment income (loss) and capital gain or loss from portfolio investments assuming reinvestment of dividends and capital gains distributions. Total return is not annualized for periods that are less than a full year, does not reflect the effect of sales charge for Class A shares nor the contingent deferred sales charge for Class C shares and does not reflect the deduction of taxes that a shareholder would pay on fund distributions or the redemption of fund shares. |
| | | | |
| 228 | | CALAMOS OPEN-END FAMILY OF FUNDS SEMIANNUAL REPORT | | |
Calamos Global Convertible Fund Financial Highlights
| | | | |
| | | CLASS R | |
| | | (Unaudited)
December 31,
2014*
through
April 30, | |
| | | 2015 | |
Net asset value, beginning of period | | | $10.00 | |
Income from investment operations: | | | | |
Net investment income (loss)(a) | | | 0.07 | |
Net realized and unrealized gain (loss) | | | 0.34 | |
Total from investment operations | | | 0.41 | |
Distributions: | | | | |
Dividends from net investment income | | | — | |
Dividends from net realized gains | | | — | |
Total distributions | | | — | |
Net asset value, end of period | | | $10.41 | |
Ratios and supplemental data: | | | | |
Total return(b) | | | 4.10% | |
Net assets, end of period (000) | | | $104 | |
Ratio of net expenses to average net assets | | | 1.60% | (c) |
Ratio of gross expenses to average net assets prior to expense reductions | | | 4.32% | (c) |
Ratio of net investment income (loss) to average net assets | | | 1.94% | (c) |
| * | Commencement of operations. |
| (a) | Net investment income (loss) allocated based on average shares method. |
| (b) | Total return measures net investment income (loss) and capital gain or loss from portfolio investments assuming reinvestment of dividends and capital gains distributions. Total return is not annualized for periods that are less than a full year, does not reflect the effect of sales charge for Class A shares nor the contingent deferred sales charge for Class C shares and does not reflect the deduction of taxes that a shareholder would pay on fund distributions or the redemption of fund shares. |
Calamos Total Return Bond Fund Financial Highlights
Selected data for a share outstanding throughout each period were as follows:
| | | | | | | | | | | | | | | | | | | | | | | | |
| | | CLASS A | |
| | | (Unaudited)
Six Months
Ended
April 30, | | | Year Ended October 31, | |
| | | 2015 | | | 2014 | | | 2013 | | | 2012 | | | 2011 | | | 2010 | |
Net asset value, beginning of period | | | $10.70 | | | | $10.89 | | | | $11.15 | | | | $11.14 | | | | $11.23 | | | | $11.06 | |
Income from investment operations: | | | | | | | | | | | | | | | | | | | | | | | | |
Net investment income (loss)(a) | | | 0.14 | | | | 0.26 | | | | 0.22 | | | | 0.22 | | | | 0.26 | | | | 0.31 | |
Net realized and unrealized gain (loss) | | | 0.08 | | | | 0.12 | | | | (0.17 | ) | | | 0.15 | | | | 0.02 | | | | 0.45 | |
Total from investment operations | | | 0.22 | | | | 0.38 | | | | 0.05 | | | | 0.37 | | | | 0.28 | | | | 0.76 | |
Distributions: | | | | | | | | | | | | | | | | | | | | | | | | |
Dividends from net investment income | | | (0.16 | ) | | | (0.53 | ) | | | (0.26 | ) | | | (0.32 | ) | | | (0.28 | ) | | | (0.59 | ) |
Dividends from net realized gains | | | (0.12 | ) | | | (0.04 | ) | | | (0.05 | ) | | | (0.04 | ) | | | (0.09 | ) | | | — | |
Total distributions | | | (0.28 | ) | | | (0.57 | ) | | | (0.31 | ) | | | (0.36 | ) | | | (0.37 | ) | | | (0.59 | ) |
Net asset value, end of period | | | $10.64 | | | | $10.70 | | | | $10.89 | | | | $11.15 | | | | $11.14 | | | | $11.23 | |
Ratios and supplemental data: | | | | | | | | | | | | | | | | | | | | | | | | |
Total return(b) | | | 2.07% | | | | 3.71% | | | | 0.48% | | | | 3.35% | | | | 2.64% | | | | 7.12% | |
Net assets, end of period (000) | | | $45,296 | | | | $67,287 | | | | $93,691 | | | | $137,672 | | | | $115,090 | | | | $114,922 | |
Ratio of net expenses to average net assets | | | 0.90% | (c) | | | 0.90% | | | | 0.90% | | | | 0.90% | | | | 0.90% | | | | 0.90% | |
Ratio of gross expenses to average net assets prior to expense reductions | | | 1.12% | (c) | | | 1.05% | | | | 0.99% | | | | 0.98% | | | | 0.97% | | | | 0.98% | |
Ratio of net investment income (loss) to average net assets | | | 2.60% | (c) | | | 2.47% | | | | 1.97% | | | | 1.98% | | | | 2.37% | | | | 2.83% | |
| | |
| | | (Unaudited)
Six Months
Ended
April 30, | | | Year Ended October 31, | |
| | | 2015 | | | 2014 | | | 2013 | | | 2012 | | | 2011 | | | 2010 | |
Portfolio turnover rate | | | 34.3% | | | | 35.3% | | | | 32.5% | | | | 34.4% | | | | 41.5% | | | | 55.7% | |
| (a) | Net investment income (loss) allocated based on average shares method. |
| (b) | Total return measures net investment income (loss) and capital gain or loss from portfolio investments assuming reinvestment of dividends and capital gains distributions. Total return is not annualized for periods that are less than a full year, does not reflect the effect of sales charge for Class A shares nor the contingent deferred sales charge for Class B and C shares and does not reflect the deduction of taxes that a shareholder would pay on fund distributions or the redemption of fund shares. |
| | | | |
| 230 | | CALAMOS OPEN-END FAMILY OF FUNDS SEMIANNUAL REPORT | | |
Calamos Total Return Bond Fund Financial Highlights
| | | | | | | | | | | | | | | | | | | | | | | | |
| | | CLASS B | |
| | | (Unaudited)
Six Months
Ended
April 30, | | | Year Ended October 31, | |
| | | 2015 | | | 2014 | | | 2013 | | | 2012 | | | 2011 | | | 2010 | |
Net asset value, beginning of period | | | $10.70 | | | | $10.89 | | | | $11.15 | | | | $11.14 | | | | $11.23 | | | | $11.06 | |
Income from investment operations: | | | | | | | | | | | | | | | | | | | | | | | | |
Net investment income (loss)(a) | | | 0.10 | | | | 0.18 | | | | 0.13 | | | | 0.14 | | | | 0.19 | | | | 0.23 | |
Net realized and unrealized gain (loss) | | | 0.08 | | | | 0.12 | | | | (0.16 | ) | | | 0.14 | | | | 0.01 | | | | 0.44 | |
Total from investment operations | | | 0.18 | | | | 0.30 | | | | (0.03 | ) | | | 0.28 | | | | 0.20 | | | | 0.67 | |
Distributions: | | | | | | | | | | | | | | | | | | | | | | | | |
Dividends from net investment income | | | (0.12 | ) | | | (0.45 | ) | | | (0.18 | ) | | | (0.23 | ) | | | (0.20 | ) | | | (0.50 | ) |
Dividends from net realized gains | | | (0.12 | ) | | | (0.04 | ) | | | (0.05 | ) | | | (0.04 | ) | | | (0.09 | ) | | | — | |
Total distributions | | | (0.24 | ) | | | (0.49 | ) | | | (0.23 | ) | | | (0.27 | ) | | | (0.29 | ) | | | (0.50 | ) |
Net asset value, end of period | | | $10.64 | | | | $10.70 | | | | $10.89 | | | | $11.15 | | | | $11.14 | | | | $11.23 | |
Ratios and supplemental data: | | | | | | | | | | | | | | | | | | | | | | | | |
Total return(b) | | | 1.69% | | | | 2.94% | | | | (0.27% | ) | | | 2.59% | | | | 1.88% | | | | 6.33% | |
Net assets, end of period (000) | | | $1,347 | | | | $1,879 | | | | $5,319 | | | | $9,108 | | | | $14,193 | | | | $21,402 | |
Ratio of net expenses to average net assets | | | 1.65% | (c) | | | 1.65% | | | | 1.65% | | | | 1.65% | | | | 1.65% | | | | 1.65% | |
Ratio of gross expenses to average net assets prior to expense reductions | | | 1.87% | (c) | | | 1.80% | | | | 1.74% | | | | 1.73% | | | | 1.72% | | | | 1.73% | |
Ratio of net investment income (loss) to average net assets | | | 1.85% | (c) | | | 1.72% | | | | 1.22% | | | | 1.25% | | | | 1.67% | | | | 2.10% | |
| |
| | | CLASS C | |
| | | (Unaudited)
Six Months
Ended
April 30, | | | Year Ended October 31, | |
| | | 2015 | | | 2014 | | | 2013 | | | 2012 | | | 2011 | | | 2010 | |
Net asset value, beginning of period | | | $10.70 | | | | $10.89 | | | | $11.15 | | | | $11.13 | | | | $11.22 | | | | $11.06 | |
Income from investment operations: | | | | | | | | | | | | | | | | | | | | | | | | |
Net investment income (loss)(a) | | | 0.10 | | | | 0.18 | | | | 0.13 | | | | 0.14 | | | | 0.18 | | | | 0.23 | |
Net realized and unrealized gain (loss) | | | 0.08 | | | | 0.12 | | | | (0.16 | ) | | | 0.15 | | | | 0.02 | | | | 0.43 | |
Total from investment operations | | | 0.18 | | | | 0.30 | | | | (0.03 | ) | | | 0.29 | | | | 0.20 | | | | 0.66 | |
Distributions: | | | | | | | | | | | | | | | | | | | | | | | | |
Dividends from net investment income | | | (0.12 | ) | | | (0.45 | ) | | | (0.18 | ) | | | (0.23 | ) | | | (0.20 | ) | | | (0.50 | ) |
Dividends from net realized gains | | | (0.12 | ) | | | (0.04 | ) | | | (0.05 | ) | | | (0.04 | ) | | | (0.09 | ) | | | — | |
Total distributions | | | (0.24 | ) | | | (0.49 | ) | | | (0.23 | ) | | | (0.27 | ) | | | (0.29 | ) | | | (0.50 | ) |
Net asset value, end of period | | | $10.64 | | | | $10.70 | | | | $10.89 | | | | $11.15 | | | | $11.13 | | | | $11.22 | |
Ratios and supplemental data: | | | | | | | | | | | | | | | | | | | | | | | | |
Total return(b) | | | 1.69% | | | | 2.94% | | | | (0.27% | ) | | | 2.68% | | | | 1.88% | | | | 6.24% | |
Net assets, end of period (000) | | | $17,031 | | | | $17,818 | | | | $25,964 | | | | $43,823 | | | | $48,612 | | | | $50,793 | |
Ratio of net expenses to average net assets | | | 1.65% | (c) | | | 1.65% | | | | 1.65% | | | | 1.65% | | | | 1.65% | | | | 1.65% | |
Ratio of gross expenses to average net assets prior to expense reductions | | | 1.87% | (c) | | | 1.80% | | | | 1.74% | | | | 1.73% | | | | 1.72% | | | | 1.73% | |
Ratio of net investment income (loss) to average net assets | | | 1.85% | (c) | | | 1.73% | | | | 1.23% | | | | 1.25% | | | | 1.63% | | | | 2.09% | |
| (a) | Net investment income (loss) allocated based on average shares method. |
| (b) | Total return measures net investment income (loss) and capital gain or loss from portfolio investments assuming reinvestment of dividends and capital gains distributions. Total return is not annualized for periods that are less than a full year, does not reflect the effect of sales charge for Class A shares nor the contingent deferred sales charge for Class B and C shares and does not reflect the deduction of taxes that a shareholder would pay on fund distributions or the redemption of fund shares. |
Calamos Total Return Bond Fund Financial Highlights
| | | | | | | | | | | | | | | | | | | | | | | | |
| | | CLASS I | |
| | | (Unaudited)
Six Months
Ended
April 30, | | | Year Ended October 31, | |
| | | 2015 | | | 2014 | | | 2013 | | | 2012 | | | 2011 | | | 2010 | |
Net asset value, beginning of period | | | $10.70 | | | | $10.89 | | | | $11.15 | | | | $11.13 | | | | $11.22 | | | | $11.06 | |
Income from investment operations: | | | | | | | | | | | | | | | | | | | | | | | | |
Net investment income (loss)(a) | | | 0.15 | | | | 0.29 | | | | 0.24 | | | | 0.25 | | | | 0.29 | | | | 0.34 | |
Net realized and unrealized gain (loss) | | | 0.08 | | | | 0.12 | | | | (0.16 | ) | | | 0.15 | | | | 0.02 | | | | 0.43 | |
Total from investment operations | | | 0.23 | | | | 0.41 | | | | 0.08 | | | | 0.40 | | | | 0.31 | | | | 0.77 | |
Distributions: | | | | | | | | | | | | | | | | | | | | | | | | |
Dividends from net investment income | | | (0.17 | ) | | | (0.56 | ) | | | (0.29 | ) | | | (0.34 | ) | | | (0.31 | ) | | | (0.61 | ) |
Dividends from net realized gains | | | (0.12 | ) | | | (0.04 | ) | | | (0.05 | ) | | | (0.04 | ) | | | (0.09 | ) | | | — | |
Total distributions | | | (0.29 | ) | | | (0.60 | ) | | | (0.34 | ) | | | (0.38 | ) | | | (0.40 | ) | | | (0.61 | ) |
Net asset value, end of period | | | $10.64 | | | | $10.70 | | | | $10.89 | | | | $11.15 | | | | $11.13 | | | | $11.22 | |
Ratios and supplemental data: | | | | | | | | | | | | | | | | | | | | | | | | |
Total return(b) | | | 2.20% | | | | 3.97% | | | | 0.73% | | | | 3.70% | | | | 2.90% | | | | 7.30% | |
Net assets, end of period (000) | | | $12,937 | | | | $13,347 | | | | $41,109 | | | | $43,464 | | | | $41,639 | | | | $46,625 | |
Ratio of net expenses to average net assets | | | 0.65% | (c) | | | 0.65% | | | | 0.65% | | | | 0.65% | | | | 0.65% | | | | 0.65% | |
Ratio of gross expenses to average net assets prior to expense reductions | | | 0.87% | (c) | | | 0.80% | | | | 0.74% | | | | 0.73% | | | | 0.72% | | | | 0.73% | |
Ratio of net investment income (loss) to average net assets | | | 2.84% | (c) | | | 2.70% | | | | 2.22% | | | | 2.24% | | | | 2.64% | | | | 3.07% | |
| |
| | | CLASS R | |
| | | (Unaudited)
Six Months
Ended
April 30, | | | Year Ended October 31, | |
| | | 2015 | | | 2014 | | | 2013 | | | 2012 | | | 2011 | | | 2010 | |
Net asset value, beginning of period | | | $10.70 | | | | $10.89 | | | | $11.15 | | | | $11.14 | | | | $11.23 | | | | $11.06 | |
Income from investment operations: | | | | | | | | | | | | | | | | | | | | | | | | |
Net investment income (loss)(a) | | | 0.12 | | | | 0.23 | | | | 0.19 | | | | 0.19 | | | | 0.23 | | | | 0.28 | |
Net realized and unrealized gain (loss) | | | 0.08 | | | | 0.13 | | | | (0.17 | ) | | | 0.15 | | | | 0.02 | | | | 0.45 | |
Total from investment operations | | | 0.20 | | | | 0.36 | | | | 0.02 | | | | 0.34 | | | | 0.25 | | | | 0.73 | |
Distributions: | | | | | | | | | | | | | | | | | | | | | | | | |
Dividends from net investment income | | | (0.14 | ) | | | (0.51 | ) | | | (0.23 | ) | | | (0.29 | ) | | | (0.25 | ) | | | (0.56 | ) |
Dividends from net realized gains | | | (0.12 | ) | | | (0.04 | ) | | | (0.05 | ) | | | (0.04 | ) | | | (0.09 | ) | | | — | |
Total distributions | | | (0.26 | ) | | | (0.55 | ) | | | (0.28 | ) | | | (0.33 | ) | | | (0.34 | ) | | | (0.56 | ) |
Net asset value, end of period | | | $10.64 | | | | $10.70 | | | | $10.89 | | | | $11.15 | | | | $11.14 | | | | $11.23 | |
Ratios and supplemental data: | | | | | | | | | | | | | | | | | | | | | | | | |
Total return(b) | | | 1.94% | | | | 3.45% | | | | 0.22% | | | | 3.09% | | | | 2.39% | | | | 6.86% | |
Net assets, end of period (000) | | | $232 | | | | $234 | | | | $2,248 | | | | $1,756 | | | | $1,638 | | | | $1,389 | |
Ratio of net expenses to average net assets | | | 1.15% | (c) | | | 1.15% | | | | 1.15% | | | | 1.15% | | | | 1.15% | | | | 1.15% | |
Ratio of gross expenses to average net assets prior to expense reductions | | | 1.37% | (c) | | | 1.28% | | | | 1.24% | | | | 1.23% | | | | 1.22% | | | | 1.23% | |
Ratio of net investment income (loss) to average net assets | | | 2.34% | (c) | | | 2.14% | | | | 1.72% | | | | 1.74% | | | | 2.10% | | | | 2.59% | |
| (a) | Net investment income (loss) allocated based on average shares method. |
| (b) | Total return measures net investment income (loss) and capital gain or loss from portfolio investments assuming reinvestment of dividends and capital gains distributions. Total return is not annualized for periods that are less than a full year, does not reflect the effect of sales charge for Class A shares nor the contingent deferred sales charge for Class B and C shares and does not reflect the deduction of taxes that a shareholder would pay on fund distributions or the redemption of fund shares. |
| | | | |
| 232 | | CALAMOS OPEN-END FAMILY OF FUNDS SEMIANNUAL REPORT | | |
Calamos High Income Fund Financial Highlights
Selected data for a share outstanding throughout each period were as follows:
| | | | | | | | | | | | | | | | | | | | | | | | |
| | | CLASS A | |
| | | (Unaudited)
Six Months
Ended
April 30, | | | Year Ended October 31, | |
| | | 2015 | | | 2014 | | | 2013 | | | 2012 | | | 2011 | | | 2010 | |
Net asset value, beginning of period | | | $9.65 | | | | $9.90 | | | | $9.92 | | | | $9.68 | | | | $9.97 | | | | $9.52 | |
Income from investment operations: | | | | | | | | | | | | | | | | | | | | | | | | |
Net investment income (loss)(a) | | | 0.22 | | | | 0.48 | | | | 0.51 | | | | 0.53 | | | | 0.59 | | | | 0.63 | |
Net realized and unrealized gain (loss) | | | (0.18 | ) | | | 0.01 | | | | 0.18 | | | | 0.35 | | | | (0.24 | ) | | | 0.58 | |
Total from investment operations | | | 0.04 | | | | 0.49 | | | | 0.69 | | | | 0.88 | | | | 0.35 | | | | 1.21 | |
Distributions: | | | | | | | | | | | | | | | | | | | | | | | | |
Dividends from net investment income | | | (0.25 | ) | | | (0.55 | ) | | | (0.58 | ) | | | (0.51 | ) | | | (0.64 | ) | | | (0.76 | ) |
Dividends from net realized gains | | | (0.24 | ) | | | (0.19 | ) | | | (0.13 | ) | | | (0.13 | ) | | | — | | | | — | |
Total distributions | | | (0.49 | ) | | | (0.74 | ) | | | (0.71 | ) | | | (0.64 | ) | | | (0.64 | ) | | | (0.76 | ) |
Net asset value, end of period | | | $9.20 | | | | $9.65 | | | | $9.90 | | | | $9.92 | | | | $9.68 | | | | $9.97 | |
Ratios and supplemental data: | | | | | | | | | | | | | | | | | | | | | | | | |
Total return(b) | | | 0.70% | | | | 5.11% | | | | 7.21% | | | | 9.39% | | | | 3.62% | | | | 13.26% | |
Net assets, end of period (000) | | | $93,683 | | | | $132,756 | | | | $201,791 | | | | $215,299 | | | | $182,515 | | | | $211,632 | |
Ratio of net expenses to average net assets | | | 1.26% | (c) | | | 1.18% | | | | 1.18% | | | | 1.19% | | | | 1.22% | | | | 1.21% | |
Ratio of gross expenses to average net assets prior to expense reductions | | | 1.26% | (c) | | | 1.18% | | | | 1.18% | | | | 1.19% | | | | 1.22% | | | | 1.21% | |
Ratio of net investment income (loss) to average net assets | | | 4.83% | (c) | | | 4.84% | | | | 5.11% | | | | 5.46% | | | | 6.01% | | | | 6.56% | |
| | |
| | | (Unaudited)
Six Months
Ended
April 30, | | | Year Ended October 31, | |
| | | 2015 | | | 2014 | | | 2013 | | | 2012 | | | 2011 | | | 2010 | |
Portfolio turnover rate | | | 35.9% | | | | 51.2% | | | | 55.1% | | | | 73.9% | | | | 72.6% | | | | 57.6% | |
| (a) | Net investment income (loss) allocated based on average shares method. |
| (b) | Total return measures net investment income (loss) and capital gain or loss from portfolio investments assuming reinvestment of dividends and capital gains distributions. Total return is not annualized for periods that are less than a full year, does not reflect the effect of sales charge for Class A shares nor the contingent deferred sales charge for Class B and C shares and does not reflect the deduction of taxes that a shareholder would pay on fund distributions or the redemption of fund shares. |
Calamos High Income Fund Financial Highlights
| | | | | | | | | | | | | | | | | | | | | | | | |
| | | CLASS B | |
| | | (Unaudited)
Six Months
Ended
April 30, | | | Year Ended October 31, | |
| | | 2015 | | | 2014 | | | 2013 | | | 2012 | | | 2011 | | | 2010 | |
Net asset value, beginning of period | | | $10.16 | | | | $10.38 | | | | $10.36 | | | | $10.09 | | | | $10.37 | | | | $9.86 | |
Income from investment operations: | | | | | | | | | | | | | | | | | | | | | | | | |
Net investment income (loss)(a) | | | 0.20 | | | | 0.42 | | | | 0.46 | | | | 0.48 | | | | 0.54 | | | | 0.58 | |
Net realized and unrealized gain (loss) | | | (0.19 | ) | | | 0.02 | | | | 0.18 | | | | 0.36 | | | | (0.26 | ) | | | 0.60 | |
Total from investment operations | | | 0.01 | | | | 0.44 | | | | 0.64 | | | | 0.84 | | | | 0.28 | | | | 1.18 | |
Distributions: | | | | | | | | | | | | | | | | | | | | | | | | |
Dividends from net investment income | | | (0.22 | ) | | | (0.47 | ) | | | (0.49 | ) | | | (0.44 | ) | | | (0.56 | ) | | | (0.67 | ) |
Dividends from net realized gains | | | (0.24 | ) | | | (0.19 | ) | | | (0.13 | ) | | | (0.13 | ) | | | — | | | | — | |
Total distributions | | | (0.46 | ) | | | (0.66 | ) | | | (0.62 | ) | | | (0.57 | ) | | | (0.56 | ) | | | (0.67 | ) |
Net asset value, end of period | | | $9.71 | | | | $10.16 | | | | $10.38 | | | | $10.36 | | | | $10.09 | | | | $10.37 | |
Ratios and supplemental data: | | | | | | | | | | | | | | | | | | | | | | | | |
Total return(b) | | | 0.28% | | | | 4.37% | | | | 6.40% | | | | 8.55% | | | | 2.79% | | | | 12.45% | |
Net assets, end of period (000) | | | $1,290 | | | | $2,098 | | | | $3,340 | | | | $5,973 | | | | $9,766 | | | | $17,387 | |
Ratio of net expenses to average net assets | | | 2.01% | (c) | | | 1.93% | | | | 1.93% | | | | 1.95% | | | | 1.96% | | | | 1.96% | |
Ratio of gross expenses to average net assets prior to expense reductions | | | 2.01% | (c) | | | 1.93% | | | | 1.93% | | | | 1.95% | | | | 1.96% | | | | 1.96% | |
Ratio of net investment income (loss) to average net assets | | | 4.09% | (c) | | | 4.10% | | | | 4.39% | | | | 4.73% | | | | 5.28% | | | | 5.82% | |
| |
| | | CLASS C | |
| | | (Unaudited)
Six Months
Ended
April 30, | | | Year Ended October 31, | |
| | | 2015 | | | 2014 | | | 2013 | | | 2012 | | | 2011 | | | 2010 | |
Net asset value, beginning of period | | | $10.06 | | | | $10.29 | | | | $10.28 | | | | $10.01 | | | | $10.29 | | | | $9.80 | |
Income from investment operations: | | | | | | | | | | | | | | | | | | | | | | | | |
Net investment income (loss)(a) | | | 0.19 | | | | 0.42 | | | | 0.45 | | | | 0.48 | | | | 0.54 | | | | 0.58 | |
Net realized and unrealized gain (loss) | | | (0.18 | ) | | | 0.01 | | | | 0.19 | | | | 0.36 | | | | (0.25 | ) | | | 0.58 | |
Total from investment operations | | | 0.01 | | | | 0.43 | | | | 0.64 | | | | 0.84 | | | | 0.29 | | | | 1.16 | |
Distributions: | | | | | | | | | | | | | | | | | | | | | | | | |
Dividends from net investment income | | | (0.22 | ) | | | (0.47 | ) | | | (0.50 | ) | | | (0.44 | ) | | | (0.57 | ) | | | (0.67 | ) |
Dividends from net realized gains | | | (0.24 | ) | | | (0.19 | ) | | | (0.13 | ) | | | (0.13 | ) | | | — | | | | — | |
Total distributions | | | (0.46 | ) | | | (0.66 | ) | | | (0.63 | ) | | | (0.57 | ) | | | (0.57 | ) | | | (0.67 | ) |
Net asset value, end of period | | | $9.61 | | | | $10.06 | | | | $10.29 | | | | $10.28 | | | | $10.01 | | | | $10.29 | |
Ratios and supplemental data: | | | | | | | | | | | | | | | | | | | | | | | | |
Total return(b) | | | 0.30% | | | | 4.32% | | | | 6.37% | | | | 8.65% | | | | 2.83% | | | | 12.34% | |
Net assets, end of period (000) | | | $25,453 | | | | $29,333 | | | | $34,146 | | | | $43,141 | | | | $39,764 | | | | $48,149 | |
Ratio of net expenses to average net assets | | | 2.01% | (c) | | | 1.93% | | | | 1.93% | | | | 1.94% | | | | 1.97% | | | | 1.96% | |
Ratio of gross expenses to average net assets prior to expense reductions | | | 2.01% | (c) | | | 1.93% | | | | 1.93% | | | | 1.94% | | | | 1.97% | | | | 1.96% | |
Ratio of net investment income (loss) to average net assets | | | 4.09% | (c) | | | 4.10% | | | | 4.37% | | | | 4.72% | | | | 5.26% | | | | 5.81% | |
| (a) | Net investment income (loss) allocated based on average shares method. |
| (b) | Total return measures net investment income (loss) and capital gain or loss from portfolio investments assuming reinvestment of dividends and capital gains distributions. Total return is not annualized for periods that are less than a full year, does not reflect the effect of sales charge for Class A shares nor the contingent deferred sales charge for Class B and C shares and does not reflect the deduction of taxes that a shareholder would pay on fund distributions or the redemption of fund shares. |
| | | | |
| 234 | | CALAMOS OPEN-END FAMILY OF FUNDS SEMIANNUAL REPORT | | |
Calamos High Income Fund Financial Highlights
| | | | | | | | | | | | | | | | | | | | | | | | |
| | | CLASS I | |
| | | (Unaudited)
Six Months
Ended
April 30, | | | Year Ended October 31, | |
| | | 2015 | | | 2014 | | | 2013 | | | 2012 | | | 2011 | | | 2010 | |
Net asset value, beginning of period | | | $9.65 | | | | $9.90 | | | | $9.92 | | | | $9.68 | | | | $9.97 | | | | $9.52 | |
Income from investment operations: | | | | | | | | | | | | | | | | | | | | | | | | |
Net investment income (loss)(a) | | | 0.23 | | | | 0.50 | | | | 0.53 | | | | 0.56 | | | | 0.62 | | | | 0.65 | |
Net realized and unrealized gain (loss) | | | (0.18 | ) | | | 0.02 | | | | 0.19 | | | | 0.34 | | | | (0.24 | ) | | | 0.58 | |
Total from investment operations | | | 0.05 | | | | 0.52 | | | | 0.72 | | | | 0.90 | | | | 0.38 | | | | 1.23 | |
Distributions: | | | | | | | | | | | | | | | | | | | | | | | | |
Dividends from net investment income | | | (0.26 | ) | | | (0.58 | ) | | | (0.61 | ) | | | (0.53 | ) | | | (0.67 | ) | | | (0.78 | ) |
Dividends from net realized gains | | | (0.24 | ) | | | (0.19 | ) | | | (0.13 | ) | | | (0.13 | ) | | | — | | | | — | |
Total distributions | | | (0.50 | ) | | | (0.77 | ) | | | (0.74 | ) | | | (0.66 | ) | | | (0.67 | ) | | | (0.78 | ) |
Net asset value, end of period | | | $9.20 | | | | $9.65 | | | | $9.90 | | | | $9.92 | | | | $9.68 | | | | $9.97 | |
Ratios and supplemental data: | | | | | | | | | | | | | | | | | | | | | | | | |
Total return(b) | | | 0.82% | | | | 5.37% | | | | 7.50% | | | | 9.63% | | | | 3.88% | | | | 13.58% | |
Net assets, end of period (000) | | | $25,898 | | | | $24,342 | | | | $25,103 | | | | $33,271 | | | | $21,424 | | | | $44,574 | |
Ratio of net expenses to average net assets | | | 1.01% | (c) | | | 0.93% | | | | 0.93% | | | | 0.94% | | | | 0.96% | | | | 0.96% | |
Ratio of gross expenses to average net assets prior to expense reductions | | | 1.01% | (c) | | | 0.93% | | | | 0.93% | | | | 0.94% | | | | 0.96% | | | | 0.96% | |
Ratio of net investment income (loss) to average net assets | | | 5.08% | (c) | | | 5.10% | | | | 5.37% | | | | 5.71% | | | | 6.29% | | | | 6.76% | |
| |
| | | CLASS R | |
| | | (Unaudited)
Six Months
Ended
April 30, | | | Year Ended October 31, | |
| | | 2015 | | | 2014 | | | 2013 | | | 2012 | | | 2011 | | | 2010 | |
Net asset value, beginning of period | | | $9.64 | | | | $9.89 | | | | $9.91 | | | | $9.67 | | | | $9.96 | | | | $9.52 | |
Income from investment operations: | | | | | | | | | | | | | | | | | | | | | | | | |
Net investment income (loss)(a) | | | 0.21 | | | | 0.45 | | | | 0.48 | | | | 0.51 | | | | 0.57 | | | | 0.60 | |
Net realized and unrealized gain (loss) | | | (0.19 | ) | | | 0.02 | | | | 0.18 | | | | 0.34 | | | | (0.24 | ) | | | 0.57 | |
Total from investment operations | | | 0.02 | | | | 0.47 | | | | 0.66 | | | | 0.85 | | | | 0.33 | | | | 1.17 | |
Distributions: | | | | | | | | | | | | | | | | | | | | | | | | |
Dividends from net investment income | | | (0.24 | ) | | | (0.53 | ) | | | (0.55 | ) | | | (0.48 | ) | | | (0.62 | ) | | | (0.73 | ) |
Dividends from net realized gains | | | (0.24 | ) | | | (0.19 | ) | | | (0.13 | ) | | | (0.13 | ) | | | — | | | | — | |
Total distributions | | | (0.48 | ) | | | (0.72 | ) | | | (0.68 | ) | | | (0.61 | ) | | | (0.62 | ) | | | (0.73 | ) |
Net asset value, end of period | | | $9.18 | | | | $9.64 | | | | $9.89 | | | | $9.91 | | | | $9.67 | | | | $9.96 | |
Ratios and supplemental data: | | | | | | | | | | | | | | | | | | | | | | | | |
Total return(b) | | | 0.47% | | | | 4.87% | | | | 6.92% | | | | 9.17% | | | | 3.37% | | | | 12.88% | |
Net assets, end of period (000) | | | $160 | | | | $209 | | | | $192 | | | | $373 | | | | $272 | | | | $248 | |
Ratio of net expenses to average net assets | | | 1.51% | (c) | | | 1.43% | | | | 1.43% | | | | 1.44% | | | | 1.47% | | | | 1.46% | |
Ratio of gross expenses to average net assets prior to expense reductions | | | 1.51% | (c) | | | 1.43% | | | | 1.43% | | | | 1.44% | | | | 1.47% | | | | 1.46% | |
Ratio of net investment income (loss) to average net assets | | | 4.59% | (c) | | | 4.60% | | | | 4.89% | | | | 5.21% | | | | 5.74% | | | | 6.28% | |
| (a) | Net investment income (loss) allocated based on average shares method. |
| (b) | Total return measures net investment income (loss) and capital gain or loss from portfolio investments assuming reinvestment of dividends and capital gains distributions. Total return is not annualized for periods that are less than a full year, does not reflect the effect of sales charge for Class A shares nor the contingent deferred sales charge for Class B and C shares and does not reflect the deduction of taxes that a shareholder would pay on fund distributions or the redemption of fund shares. |
Calamos Market Neutral Income Fund Financial Highlights
Selected data for a share outstanding throughout each period were as follows:
| | | | | | | | | | | | | | | | | | | | | | | | |
| | | CLASS A | |
| | | (Unaudited)
Six Months
Ended
April 30, | | | Year Ended October 31, | |
| | | 2015 | | | 2014 | | | 2013 | | | 2012 | | | 2011 | | | 2010 | |
Net asset value, beginning of period | | | $13.13 | | | | $13.09 | | | | $12.68 | | | | $12.11 | | | | $11.91 | | | | $11.35 | |
Income from investment operations: | | | | | | | | | | | | | | | | | | | | | | | | |
Net investment income (loss)(a) | | | 0.10 | | | | 0.15 | | | | 0.17 | | | | 0.21 | | | | 0.22 | | | | 0.23 | |
Net realized and unrealized gain (loss) | | | 0.10 | | | | 0.27 | | | | 0.42 | | | | 0.51 | | | | 0.18 | | | | 0.46 | |
Total from investment operations | | | 0.20 | | | | 0.42 | | | | 0.59 | | | | 0.72 | | | | 0.40 | | | | 0.69 | |
Distributions: | | | | | | | | | | | | | | | | | | | | | | | | |
Dividends from net investment income | | | (0.07 | ) | | | (0.12 | ) | | | (0.18 | ) | | | (0.15 | ) | | | (0.20 | ) | | | (0.13 | ) |
Dividends from net realized gains | | | (0.14 | ) | | | (0.26 | ) | | | — | | | | — | | | | — | | | | — | |
Total distributions | | | (0.21 | ) | | | (0.38 | ) | | | (0.18 | ) | | | (0.15 | ) | | | (0.20 | ) | | | (0.13 | ) |
Net asset value, end of period | | | $13.12 | | | | $13.13 | | | | $13.09 | | | | $12.68 | | | | $12.11 | | | | $11.91 | |
Ratios and supplemental data: | | | | | | | | | | | | | | | | | | | | | | | | |
Total return(b) | | | 1.54% | | | | 3.27% | | | | 4.71% | | | | 6.01% | | | | 3.40% | | | | 6.11% | |
Net assets, end of period (000) | | | $1,148,772 | | | | $1,351,641 | | | | $1,354,180 | | | | $1,155,161 | | | | $1,282,438 | | | | $1,203,750 | |
Ratio of net expenses to average net assets | | | 1.23% | (c) | | | 1.20% | | | | 1.26% | | | | 1.17% | | | | 1.21% | | | | 1.19% | |
Ratio of gross expenses to average net assets prior to expense reductions | | | 1.23% | (c) | | | 1.20% | | | | 1.26% | | | | 1.17% | | | | 1.21% | | | | 1.19% | |
Ratio of net investment income (loss) to average net assets | | | 1.53% | (c) | | | 1.17% | | | | 1.33% | | | | 1.65% | | | | 1.80% | | | | 2.00% | |
Ratio of net expenses, excluding dividend expense on short positions, to average net assets | | | 1.09% | (c) | | | 1.09% | | | | 1.12% | | | | 1.13% | | | | 1.14% | | | | 1.14% | |
| | |
| | | (Unaudited)
Six Months
Ended
April 30, | | | Year Ended October 31, | |
| | | 2015 | | | 2014 | | | 2013 | | | 2012 | | | 2011 | | | 2010 | |
Portfolio turnover rate | | | 18.0% | | | | 70.5% | | | | 110.6% | | | | 82.8% | | | | 98.5% | | | | 87.8% | |
| (a) | Net investment income (loss) allocated based on average shares method. |
| (b) | Total return measures net investment income (loss) and capital gain or loss from portfolio investments assuming reinvestment of dividends and capital gains distributions. Total return is not annualized for periods that are less than a full year, does not reflect the effect of sales charge for Class A shares nor the contingent deferred sales charge for Class B and C shares and does not reflect the deduction of taxes that a shareholder would pay on fund distributions or the redemption of fund shares. |
| | | | |
| 236 | | CALAMOS OPEN-END FAMILY OF FUNDS SEMIANNUAL REPORT | | |
Calamos Market Neutral Income Fund Financial Highlights
| | | | | | | | | | | | | | | | | | | | | | | | |
| | | CLASS B | |
| | | (Unaudited)
Six Months
Ended
April 30, | | | Year Ended October 31, | |
| | | 2015 | | | 2014 | | | 2013 | | | 2012 | | | 2011 | | | 2010 | |
Net asset value, beginning of period | | | $13.87 | | | | $13.82 | | | | $13.36 | | | | $12.75 | | | | $12.51 | | | | $11.92 | |
Income from investment operations: | | | | | | | | | | | | | | | | | | | | | | | | |
Net investment income (loss)(a) | | | 0.05 | | | | 0.06 | | | | 0.08 | | | | 0.12 | | | | 0.14 | | | | 0.15 | |
Net realized and unrealized gain (loss) | | | 0.11 | | | | 0.27 | | | | 0.45 | | | | 0.54 | | | | 0.20 | | | | 0.48 | |
Total from investment operations | | | 0.16 | | | | 0.33 | | | | 0.53 | | | | 0.66 | | | | 0.34 | | | | 0.63 | |
Distributions: | | | | | | | | | | | | | | | | | | | | | | | | |
Dividends from net investment income | | | (0.01 | ) | | | (0.02 | ) | | | (0.07 | ) | | | (0.05 | ) | | | (0.10 | ) | | | (0.04 | ) |
Dividends from net realized gains | | | (0.14 | ) | | | (0.26 | ) | | | — | | | | — | | | | — | | | | — | |
Total distributions | | | (0.15 | ) | | | (0.28 | ) | | | (0.07 | ) | | | (0.05 | ) | | | (0.10 | ) | | | (0.04 | ) |
Net asset value, end of period | | | $13.88 | | | | $13.87 | | | | $13.82 | | | | $13.36 | | | | $12.75 | | | | $12.51 | |
Ratios and supplemental data: | | | | | | | | | | | | | | | | | | | | | | | | |
Total return(b) | | | 1.14% | | | | 2.43% | | | | 3.98% | | | | 5.18% | | | | 2.70% | | | | 5.31% | |
Net assets, end of period (000) | | | $3,159 | | | | $4,436 | | | | $9,117 | | | | $12,940 | | | | $18,147 | | | | $25,349 | |
Ratio of net expenses to average net assets | | | 1.98% | (c) | | | 1.95% | | | | 2.03% | | | | 1.92% | | | | 1.97% | | | | 1.94% | |
Ratio of gross expenses to average net assets prior to expense reductions | | | 1.98% | (c) | | | 1.95% | | | | 2.03% | | | | 1.92% | | | | 1.97% | | | | 1.94% | |
Ratio of net investment income (loss) to average net assets | | | 0.78% | (c) | | | 0.44% | | | | 0.60% | | | | 0.91% | | | | 1.07% | | | | 1.27% | |
Ratio of net expenses, excluding dividend expense on short positions, to average net assets | | | 1.84% | (c) | | | 1.84% | | | | 1.87% | | | | 1.89% | | | | 1.89% | | | | 1.88% | |
| |
| | | CLASS C | |
| | | (Unaudited)
Six Months
Ended
April 30, | | | Year Ended October 31, | |
| | | 2015 | | | 2014 | | | 2013 | | | 2012 | | | 2011 | | | 2010 | |
Net asset value, beginning of period | | | $13.32 | | | | $13.30 | | | | $12.88 | | | | $12.29 | | | | $12.08 | | | | $11.52 | |
Income from investment operations: | | | | | | | | | | | | | | | | | | | | | | | | |
Net investment income (loss)(a) | | | 0.05 | | | | 0.06 | | | | 0.08 | | | | 0.11 | | | | 0.13 | | | | 0.15 | |
Net realized and unrealized gain (loss) | | | 0.11 | | | | 0.26 | | | | 0.42 | | | | 0.54 | | | | 0.18 | | | | 0.46 | |
Total from investment operations | | | 0.16 | | | | 0.32 | | | | 0.50 | | | | 0.65 | | | | 0.31 | | | | 0.61 | |
Distributions: | | | | | | | | | | | | | | | | | | | | | | | | |
Dividends from net investment income | | | (0.02 | ) | | | (0.04 | ) | | | (0.08 | ) | | | (0.06 | ) | | | (0.10 | ) | | | (0.05 | ) |
Dividends from net realized gains | | | (0.14 | ) | | | (0.26 | ) | | | — | | | | — | | | | — | | | | — | |
Total distributions | | | (0.16 | ) | | | (0.30 | ) | | | (0.08 | ) | | | (0.06 | ) | | | (0.10 | ) | | | (0.05 | ) |
Net asset value, end of period | | | $13.32 | | | | $13.32 | | | | $13.30 | | | | $12.88 | | | | $12.29 | | | | $12.08 | |
Ratios and supplemental data: | | | | | | | | | | | | | | | | | | | | | | | | |
Total return(b) | | | 1.22% | | | | 2.40% | | | | 3.93% | | | | 5.28% | | | | 2.61% | | | | 5.31% | |
Net assets, end of period (000) | | | $339,683 | | | | $349,791 | | | | $289,520 | | | | $267,646 | | | | $299,733 | | | | $353,019 | |
Ratio of net expenses to average net assets | | | 1.98% | (c) | | | 1.95% | | | | 2.02% | | | | 1.92% | | | | 1.97% | | | | 1.94% | |
Ratio of gross expenses to average net assets prior to expense reductions | | | 1.98% | (c) | | | 1.95% | | | | 2.02% | | | | 1.92% | | | | 1.97% | | | | 1.94% | |
Ratio of net investment income (loss) to average net assets | | | 0.76% | (c) | | | 0.42% | | | | 0.58% | | | | 0.90% | | | | 1.06% | | | | 1.26% | |
Ratio of net expenses, excluding dividend expense on short positions, to average net assets | | | 1.84% | (c) | | | 1.84% | | | | 1.87% | | | | 1.88% | | | | 1.89% | | | | 1.88% | |
| (a) | Net investment income (loss) allocated based on average shares method. |
| (b) | Total return measures net investment income (loss) and capital gain or loss from portfolio investments assuming reinvestment of dividends and capital gains distributions. Total return is not annualized for periods that are less than a full year, does not reflect the effect of sales charge for Class A shares nor the contingent deferred sales charge for Class B and C shares and does not reflect the deduction of taxes that a shareholder would pay on fund distributions or the redemption of fund shares. |
Calamos Market Neutral Income Fund Financial Highlights
| | | | | | | | | | | | | | | | | | | | | | | | |
| | | CLASS I | |
| | | (Unaudited)
Six Months
Ended
April 30, | | | Year Ended October 31, | |
| | | 2015 | | | 2014 | | | 2013 | | | 2012 | | | 2011 | | | 2010 | |
Net asset value, beginning of period | | | $12.99 | | | | $12.97 | | | | $12.56 | | | | $12.00 | | | | $11.80 | | | | $11.25 | |
Income from investment operations: | | | | | | | | | | | | | | | | | | | | | | | | |
Net investment income (loss)(a) | | | 0.11 | | | | 0.18 | | | | 0.20 | | | | 0.23 | | | | 0.24 | | | | 0.25 | |
Net realized and unrealized gain (loss) | | | 0.11 | | | | 0.25 | | | | 0.42 | | | | 0.51 | | | | 0.19 | | | | 0.46 | |
Total from investment operations | | | 0.22 | | | | 0.43 | | | | 0.62 | | | | 0.74 | | | | 0.43 | | | | 0.71 | |
Distributions: | | | | | | | | | | | | | | | | | | | | | | | | |
Dividends from net investment income | | | (0.09 | ) | | | (0.15 | ) | | | (0.21 | ) | | | (0.18 | ) | | | (0.23 | ) | | | (0.16 | ) |
Dividends from net realized gains | | | (0.14 | ) | | | (0.26 | ) | | | — | | | | — | | | | — | | | | — | |
Total distributions | | | (0.23 | ) | | | (0.41 | ) | | | (0.21 | ) | | | (0.18 | ) | | | (0.23 | ) | | | (0.16 | ) |
Net asset value, end of period | | | $12.98 | | | | $12.99 | | | | $12.97 | | | | $12.56 | | | | $12.00 | | | | $11.80 | |
Ratios and supplemental data: | | | | | | | | | | | | | | | | | | | | | | | | |
Total return(b) | | | 1.69% | | | | 3.40% | | | | 5.01% | | | | 6.25% | | | | 3.70% | | | | 6.33% | |
Net assets, end of period (000) | | | $2,436,965 | | | | $2,470,829 | | | | $1,574,197 | | | | $1,040,722 | | | | $738,421 | | | | $521,364 | |
Ratio of net expenses to average net assets | | | 0.98% | (c) | | | 0.95% | | | | 1.01% | | | | 0.92% | | | | 0.96% | | | | 0.96% | |
Ratio of gross expenses to average net assets prior to expense reductions | | | 0.98% | (c) | | | 0.95% | | | | 1.01% | | | | 0.92% | | | | 0.96% | | | | 0.96% | |
Ratio of net investment income (loss) to average net assets | | | 1.76% | (c) | | | 1.41% | | | | 1.57% | | | | 1.88% | | | | 2.04% | | | | 2.22% | |
Ratio of net expenses, excluding dividend expense on short positions, to average net assets | | | 0.84% | (c) | | | 0.84% | | | | 0.87% | | | | 0.88% | | | | 0.89% | | | | 0.89% | |
| |
| | | CLASS R | |
| | | (Unaudited)
Six Months
Ended
April 30, | | | Year Ended October 31, | |
| | | 2015 | | | 2014 | | | 2013 | | | 2012 | | | 2011 | | | 2010 | |
Net asset value, beginning of period | | | $13.08 | | | | $13.05 | | | | $12.64 | | | | $12.08 | | | | $11.88 | | | | $11.33 | |
Income from investment operations: | | | | | | | | | | | | | | | | | | | | | | | | |
Net investment income (loss)(a) | | | 0.08 | | | | 0.12 | | | | 0.14 | | | | 0.17 | | | | 0.19 | | | | 0.20 | |
Net realized and unrealized gain (loss) | | | 0.11 | | | | 0.26 | | | | 0.42 | | | | 0.52 | | | | 0.18 | | | | 0.46 | |
Total from investment operations | | | 0.19 | | | | 0.38 | | | | 0.56 | | | | 0.69 | | | | 0.37 | | | | 0.66 | |
Distributions: | | | | | | | | | | | | | | | | | | | | | | | | |
Dividends from net investment income | | | (0.06 | ) | | | (0.09 | ) | | | (0.15 | ) | | | (0.13 | ) | | | (0.17 | ) | | | (0.11 | ) |
Dividends from net realized gains | | | (0.14 | ) | | | (0.26 | ) | | | — | | | | — | | | | — | | | | — | |
Total distributions | | | (0.20 | ) | | | (0.35 | ) | | | (0.15 | ) | | | (0.13 | ) | | | (0.17 | ) | | | (0.11 | ) |
Net asset value, end of period | | | $13.07 | | | | $13.08 | | | | $13.05 | | | | $12.64 | | | | $12.08 | | | | $11.88 | |
Ratios and supplemental data: | | | | | | | | | | | | | | | | | | | | | | | | |
Total return(b) | | | 1.42% | | | | 2.97% | | | | 4.47% | | | | 5.72% | | | | 3.18% | | | | 5.84% | |
Net assets, end of period (000) | | | $8,185 | | | | $9,099 | | | | $5,408 | | | | $5,199 | | | | $3,114 | | | | $2,351 | |
Ratio of net expenses to average net assets | | | 1.48% | (c) | | | 1.45% | | | | 1.52% | | | | 1.42% | | | | 1.46% | | | | 1.46% | |
Ratio of gross expenses to average net assets prior to expense reductions | | | 1.48% | (c) | | | 1.45% | | | | 1.52% | | | | 1.42% | | | | 1.46% | | | | 1.46% | |
Ratio of net investment income (loss) to average net assets | | | 1.27% | (c) | | | 0.91% | | | | 1.08% | | | | 1.37% | | | | 1.55% | | | | 1.72% | |
Ratio of net expenses, excluding dividend expense on short positions, to average net assets | | | 1.34% | (c) | | | 1.34% | | | | 1.37% | | | | 1.38% | | | | 1.39% | | | | 1.39% | |
| (a) | Net investment income (loss) allocated based on average shares method. |
| (b) | Total return measures net investment income (loss) and capital gain or loss from portfolio investments assuming reinvestment of dividends and capital gains distributions. Total return is not annualized for periods that are less than a full year, does not reflect the effect of sales charge for Class A shares nor the contingent deferred sales charge for Class B and C shares and does not reflect the deduction of taxes that a shareholder would pay on fund distributions or the redemption of fund shares. |
| | | | |
| 238 | | CALAMOS OPEN-END FAMILY OF FUNDS SEMIANNUAL REPORT | | |
Calamos Hedged Equity Income Fund Financial Highlights
Selected data for a share outstanding throughout each period were as follows:
| | | | |
| | | CLASS A | |
| | | (Unaudited)
December 31,
2014*
through April 30, | |
| | | 2015 | |
Net asset value, beginning of period | | | $10.00 | |
Income from investment operations: | | | | |
Net investment income (loss)(a) | | | 0.02 | |
Net realized and unrealized gain (loss) | | | 0.02 | |
Total from investment operations | | | 0.04 | |
Distributions: | | | | |
Dividends from net investment income | | | — | |
Dividends from net realized gains | | | — | |
Total distributions | | | — | |
Net asset value, end of period | | | $10.04 | |
Ratios and supplemental data: | | | | |
Total return(b) | | | 0.40% | |
Net assets, end of period (000) | | | $5,569 | |
Ratio of net expenses to average net assets | | | 1.25% | (c) |
Ratio of gross expenses to average net assets prior to expense reductions | | | 2.79% | (c) |
Ratio of net investment income (loss) to average net assets | | | 0.63% | (c) |
| |
| | | (Unaudited)
Six Months
Ended
April 30, | |
| | | 2015 | |
Portfolio turnover rate | | | 15.4% | |
| * | Commencement of operations. |
| (a) | Net investment income (loss) allocated based on average shares method. |
| (b) | Total return measures net investment income (loss) and capital gain or loss from portfolio investments assuming reinvestment of dividends and capital gains distributions. Total return is not annualized for periods that are less than a full year, does not reflect the effect of sales charge for Class A shares nor the contingent deferred sales charge for Class C shares and does not reflect the deduction of taxes that a shareholder would pay on fund distributions or the redemption of fund shares. |
Calamos Hedged Equity Income Fund Financial Highlights
| | | | |
| | | CLASS C | |
| | | (Unaudited)
December 31,
2014*
through April 30, | |
| | | 2015 | |
Net asset value, beginning of period | | | $10.00 | |
Income from investment operations: | | | | |
Net investment income (loss)(a) | | | (0.00 | )** |
Net realized and unrealized gain (loss) | | | 0.02 | |
Total from investment operations | | | 0.02 | |
Distributions: | | | | |
Dividends from net investment income | | | — | |
Dividends from net realized gains | | | — | |
Total distributions | | | — | |
Net asset value, end of period | | | $10.02 | |
Ratios and supplemental data: | | | | |
Total return(b) | | | 0.20% | |
Net assets, end of period (000) | | | $100 | |
Ratio of net expenses to average net assets | | | 2.00% | (c) |
Ratio of gross expenses to average net assets prior to expense reductions | | | 3.54% | (c) |
Ratio of net investment income (loss) to average net assets | | | (0.13% | )(c) |
| |
| | | CLASS I | |
| | | (Unaudited)
December 31,
2014*
through
April 30, | |
| | | 2015 | |
Net asset value, beginning of period | | | $10.00 | |
Income from investment operations: | | | | |
Net investment income (loss)(a) | | | 0.03 | |
Net realized and unrealized gain (loss) | | | 0.02 | |
Total from investment operations | | | 0.05 | |
Distributions: | | | | |
Dividends from net investment income | | | — | |
Dividends from net realized gains | | | — | |
Total distributions | | | — | |
Net asset value, end of period | | | $10.05 | |
Ratios and supplemental data: | | | | |
Total return(b) | | | 0.50% | |
Net assets, end of period (000) | | | $5,396 | |
Ratio of net expenses to average net assets | | | 1.00% | (c) |
Ratio of gross expenses to average net assets prior to expense reductions | | | 2.54% | (c) |
Ratio of net investment income (loss) to average net assets | | | 0.87% | (c) |
| * | Commencement of operations. |
| ** | Amount is less than $0.005. |
| (a) | Net investment income (loss) allocated based on average shares method. |
| (b) | Total return measures net investment income (loss) and capital gain or loss from portfolio investments assuming reinvestment of dividends and capital gains distributions. Total return is not annualized for periods that are less than a full year, does not reflect the effect of sales charge for Class A shares nor the contingent deferred sales charge for Class C shares and does not reflect the deduction of taxes that a shareholder would pay on fund distributions or the redemption of fund shares. |
| | | | |
| 240 | | CALAMOS OPEN-END FAMILY OF FUNDS SEMIANNUAL REPORT | | |
Calamos Hedged Equity Income Fund Financial Highlights
| | | | |
| | | CLASS R | |
| | | (Unaudited)
December 31,
2014*
through
April 30, | |
| | | 2015 | |
Net asset value, beginning of period | | | $10.00 | |
Income from investment operations: | | | | |
Net investment income (loss)(a) | | | 0.01 | |
Net realized and unrealized gain (loss) | | | 0.03 | |
Total from investment operations | | | 0.04 | |
Distributions: | | | | |
Dividends from net investment income | | | — | |
Dividends from net realized gains | | | — | |
Total distributions | | | — | |
Net asset value, end of period | | | $10.04 | |
Ratios and supplemental data: | | | | |
Total return(b) | | | 0.40% | |
Net assets, end of period (000) | | | $100 | |
Ratio of net expenses to average net assets | | | 1.50% | (c) |
Ratio of gross expenses to average net assets prior to expense reductions | | | 3.04% | (c) |
Ratio of net investment income (loss) to average net assets | | | 0.38% | (c) |
| * | Commencement of operations. |
| (a) | Net investment income (loss) allocated based on average shares method. |
| (b) | Total return measures net investment income (loss) and capital gain or loss from portfolio investments assuming reinvestment of dividends and capital gains distributions. Total return is not annualized for periods that are less than a full year, does not reflect the effect of sales charge for Class A shares nor the contingent deferred sales charge for Class C shares and does not reflect the deduction of taxes that a shareholder would pay on fund distributions or the redemption of fund shares. |
Calamos Long/Short Fund Financial Highlights
Selected data for a share outstanding throughout each period were as follows:
| | | | | | | | | | | | |
| | | CLASS A | |
| | | (Unaudited)
Six Months
Ended
April 30, | | | Year Ended
October 31, | | | June 3,
2013*
through
October 31, | |
| | | 2015 | | | 2014 | | | 2013 | |
Net asset value, beginning of period | | | $10.84 | | | | $10.28 | | | | $10.00 | |
Income from investment operations: | | | | | | | | | | | | |
Net investment income (loss)(a) | | | (0.07 | ) | | | (0.11 | ) | | | (0.06 | ) |
Net realized and unrealized gain (loss) | | | 0.22 | | | | 0.76 | | | | 0.34 | |
Total from investment operations | | | 0.15 | | | | 0.65 | | | | 0.28 | |
Distributions: | | | | | | | | | | | | |
Dividends from net investment income | | | — | | | | (0.06 | ) | | | — | |
Dividends from net realized gains | | | (0.13 | ) | | | (0.03 | ) | | | — | |
Total distributions | | | (0.13 | ) | | | (0.09 | ) | | | — | |
Net asset value, end of period | | | $10.86 | | | | $10.84 | | | | $10.28 | |
Ratios and supplemental data: | | | | | | | | | | | | |
Total return(b) | | | 1.40% | | | | 6.33% | | | | 2.80% | |
Net assets, end of period (000) | | | $36,395 | | | | $39,722 | | | | $9,258 | |
Ratio of net expenses to average net assets | | | 2.27% | (c) | | | 2.57% | | | | 2.42% | (c) |
Ratio of gross expenses to average net assets prior to expense reductions | | | 2.27% | (c) | | | 2.57% | | | | 3.03% | (c) |
Ratio of net investment income (loss) to average net assets | | | (1.27% | )(c) | | | (1.07% | ) | | | (1.53% | )(c) |
Ratio of net expenses, excluding dividend expense on short positions, to average net assets | | | 1.75% | (c) | | | 1.79% | | | | 2.00% | (c) |
| | | |
| | | (Unaudited)
Six Months
Ended
April 30, | | | Year Ended
October 31, | | | June 3,
2013*
through
October 31, | |
| | | 2015 | | | 2014 | | | 2013 | |
Portfolio turnover rate | | | 66.1% | | | | 260.4% | | | | 132.1% | |
| (a) | Net investment income (loss) allocated based on average shares method. |
| (b) | Total return measures net investment income (loss) and capital gain or loss from portfolio investments assuming reinvestment of dividends and capital gains distributions. Total return is not annualized for periods that are less than a full year, does not reflect the effect of sales charge for Class A shares nor the contingent deferred sales charge for Class C shares and does not reflect the deduction of taxes that a shareholder would pay on fund distributions or the redemption of fund shares. |
| | | | |
| 242 | | CALAMOS OPEN-END FAMILY OF FUNDS SEMIANNUAL REPORT | | |
Calamos Long/Short Fund Financial Highlights
| | | | | | | | | | | | |
| | | CLASS C | |
| | | (Unaudited)
Six Months
Ended
April 30,
2015 | | | Year Ended
October 31,
2014 | | | June 3, 2013*
through
October 31,
2013* | |
Net asset value, beginning of period | | | $10.74 | | | | $10.24 | | | | $10.00 | |
Income from investment operations: | | | | | | | | | | | | |
Net investment income (loss)(a) | | | (0.11 | ) | | | (0.23 | ) | | | (0.09 | ) |
Net realized and unrealized gain (loss) | | | 0.22 | | | | 0.81 | | | | 0.33 | |
Total from investment operations | | | 0.11 | | | | 0.58 | | | | 0.24 | |
Distributions: | | | | | | | | | | | | |
Dividends from net investment income | | | — | | | | (0.05 | ) | | | — | |
Dividends from net realized gains | | | (0.13 | ) | | | (0.03 | ) | | | — | |
Total distributions | | | (0.13 | ) | | | (0.08 | ) | | | — | |
Net asset value, end of period | | | $10.72 | | | | $10.74 | | | | $10.24 | |
Ratios and supplemental data: | | | | | | | | | | | | |
Total return(b) | | | 1.03% | | | | 5.66% | | | | 2.40% | |
Net assets, end of period (000) | | | $6,260 | | | | $6,489 | | | | $383 | |
Ratio of net expenses to average net assets | | | 3.01% | (c) | | | 3.23% | | | | 3.13% | (c) |
Ratio of gross expenses to average net assets prior to expense reductions | | | 3.01% | (c) | | | 3.23% | | | | 3.52% | (c) |
Ratio of net investment income (loss) to average net assets | | | (2.01% | )(c) | | | (2.22%) | | | | (2.22% | )(c) |
Ratio of net expenses, excluding dividend expense on short positions, to average net assets | | | 2.50% | (c) | | | 2.51% | | | | 2.75% | (c) |
| |
| | | CLASS I | |
| | | (Unaudited)
Six Months
Ended
April 30, | | | Year Ended
October 31, | | | June 3, 2013*
through
October 31, | |
| | | 2015 | | | 2014 | | | 2013* | |
Net asset value, beginning of period | | | $10.87 | | | | $10.29 | | | | $10.00 | |
Income from investment operations: | | | | | | | | | | | | |
Net investment income (loss)(a) | | | (0.06 | ) | | | (0.05 | ) | | | (0.05 | ) |
Net realized and unrealized gain (loss) | | | 0.23 | | | | 0.73 | | | | 0.34 | |
Total from investment operations | | | 0.17 | | | | 0.68 | | | | 0.29 | |
Distributions: | | | | | | | | | | | | |
Dividends from net investment income | | | — | | | | (0.07 | ) | | | — | |
Dividends from net realized gains | | | (0.13 | ) | | | (0.03 | ) | | | — | |
Total distributions | | | (0.13 | ) | | | (0.10 | ) | | | — | |
Net asset value, end of period | | | $10.91 | | | | $10.87 | | | | $10.29 | |
Ratios and supplemental data: | | | | | | | | | | | | |
Total return(b) | | | 1.58% | | | | 6.56% | | | | 2.90% | |
Net assets, end of period (000) | | | $59,165 | | | | $83,654 | | | | $36,433 | |
Ratio of net expenses to average net assets | | | 2.02% | (c) | | | 2.10% | | | | 2.09% | (c) |
Ratio of gross expenses to average net assets prior to expense reductions | | | 2.02% | (c) | | | 2.10% | | | | 2.34% | (c) |
Ratio of net investment income (loss) to average net assets | | | (1.04% | )(c) | | | (0.43% | ) | | | (1.16% | )(c) |
Ratio of net expenses, excluding dividend expense on short positions, to average net assets | | | 1.49% | (c) | | | 1.55% | | | | 1.75% | (c) |
| * | Commencement of operations. |
| (a) | Net investment income (loss) allocated based on average shares method. |
| (b) | Total return measures net investment income (loss) and capital gain or loss from portfolio investments assuming reinvestment of dividends and capital gains distributions. Total return is not annualized for periods that are less than a full year, does not reflect the effect of sales charge for Class A shares nor the contingent deferred sales charge for Class C shares and does not reflect the deduction of taxes that a shareholder would pay on fund distributions or the redemption of fund shares. |
Calamos Long/Short Fund Financial Highlights
| | | | | | | | | | | | |
| | | CLASS R | |
| | | (Unaudited)
Six Months
Ended
April 30, | | | Year Ended
October 31, | | | June 3,
2013*
through
October 31, | |
| | | 2015 | | | 2014 | | | 2013* | |
Net asset value, beginning of period | | | $10.81 | | | | $10.27 | | | | $10.00 | |
Income from investment operations: | | | | | | | | | | | | |
Net investment income (loss)(a) | | | (0.08 | ) | | | (0.07 | ) | | | (0.07 | ) |
Net realized and unrealized gain (loss) | | | 0.22 | | | | 0.69 | | | | 0.34 | |
Total from investment operations | | | 0.14 | | | | 0.62 | | | | 0.27 | |
Distributions: | | | | | | | | | | | | |
Dividends from net investment income | | | — | | | | (0.05 | ) | | | — | |
Dividends from net realized gains | | | (0.13 | ) | | | (0.03 | ) | | | — | |
Total distributions | | | (0.13 | ) | | | (0.08 | ) | | | — | |
Net asset value, end of period | | | $10.82 | | | | $10.81 | | | | $10.27 | |
Ratios and supplemental data: | | | | | | | | | | | | |
Total return(b) | | | 1.31% | | | | 6.06% | | | | 2.70% | |
Net assets, end of period (000) | | | $110 | | | | $109 | | | | $103 | |
Ratio of net expenses to average net assets | | | 2.52% | (c) | | | 2.68% | | | | 2.60% | (c) |
Ratio of gross expenses to average net assets prior to expense reductions | | | 2.52% | (c) | | | 2.68% | | | | 3.26% | (c) |
Ratio of net investment income (loss) to average net assets | | | (1.50% | )(c) | | | (0.64% | ) | | | (1.68% | )(c) |
Ratio of net expenses, excluding dividend expense on short positions, to average net assets | | | 2.00% | (c) | | | 2.08% | | | | 2.25% | (c) |
| * | Commencement of operations. |
| (a) | Net investment income (loss) allocated based on average shares method. |
| (b) | Total return measures net investment income (loss) and capital gain or loss from portfolio investments assuming reinvestment of dividends and capital gains distributions. Total return is not annualized for periods that are less than a full year, does not reflect the effect of sales charge for Class A shares nor the contingent deferred sales charge for Class C shares and does not reflect the deduction of taxes that a shareholder would pay on fund distributions or the redemption of fund shares. |
| | | | |
| 244 | | CALAMOS OPEN-END FAMILY OF FUNDS SEMIANNUAL REPORT | | |
Report of Independent Registered Public Accounting Firm
To the Board of Trustees and Shareholders of Calamos Investment Trust
We have reviewed the accompanying statements of assets and liabilities, including the schedules of investments, of Calamos Investment Trust (the “Trust”), including Calamos Growth Fund, Calamos Opportunistic Value Fund, Calamos Focus Growth Fund, Calamos Discovery Growth Fund, Calamos Dividend Growth Fund, Calamos Mid Cap Growth Fund, Calamos International Growth Fund, Calamos Evolving World Growth Fund, Calamos Emerging Market Equity Fund, Calamos Global Equity Fund, Calamos Growth and Income Fund, Calamos Global Growth and Income Fund, Calamos Convertible Fund, Calamos Global Convertible Fund, Calamos Total Return Bond Fund, Calamos High Income Fund, Calamos Market Neutral Income Fund, Calamos Hedged Equity Fund, and Calamos Long/Short Fund (the “Funds”), as of April 30, 2015, and the related statements of operations and changes in net assets, and the financial highlights for the six month period then ended. These interim financial statements and financial highlights are the responsibility of the Trust’s management.
We conducted our reviews in accordance with standards of the Public Company Accounting Oversight Board (United States). A review of interim financial information consists principally of applying analytical procedures and making inquiries of persons responsible for financial and accounting matters. It is substantially less in scope than an audit conducted in accordance with standards of the Public Company Accounting Oversight Board (United States), the objective of which is the expression of an opinion regarding the financial statements and financial highlights taken as a whole. Accordingly, we do not express such an opinion.
Based on our reviews, we are not aware of any material modifications that should be made to such interim financial statements and financial highlights for them to be in conformity with accounting principles generally accepted in the United States of America.
We have previously audited, in accordance with the standards of the Public Company Accounting Oversight Board (United States), the statements of changes in net assets of the Funds for the year or period ended October 31, 2014 and the financial highlights for each of the periods presented; and in our report dated December 17, 2014, we expressed an unqualified opinion on such statements of changes in net assets and financial highlights.

Chicago, Illinois
June 17, 2015
Trustee Approval of Management Agreement (Unaudited)
The Board of Trustees of the Global Convertible Fund and Hedged Equity Income Fund (each a “New Fund” and, collectively, the “New Funds”) oversees the New Funds’ management, and, as required by law, determines whether to approve or (annually thereafter) continue the New Funds’ management agreements with Calamos Advisors under which Calamos Advisors serves as the investment manager and administrator for each New Fund. The “Independent Trustees,” who comprise more than 80% of the Board, have never been affiliated with Calamos Advisors.
In connection with their consideration regarding the approval of the management agreements for the New Funds, the Trustees received and reviewed a substantial amount of information provided by Calamos Advisors in response to detailed requests of the Independent Trustees and their independent legal counsel. In the course of their consideration of the agreements, the Independent Trustees were advised by their counsel and, in addition to meeting with management of Calamos Advisors, they met separately in executive session with their counsel.
At a meeting held on December 18, 2014, the Trustees determined, based on their evaluation of the information referred to at the meeting, and other information, that the overall arrangements between the Trust and Calamos Advisors with respect to the New Funds were fair and reasonable in light of the nature, extent and quality of the services to be provided by Calamos Advisors and its affiliates, the fees charged for those services, and other matters that the Trustees considered relevant in the exercise of their business judgment. At the meeting, the Trustees, including all of the Independent Trustees, approved the management agreement with respect to the New Funds.
The Trustees discussed the nature and quality of the advisory and other services to be provided by the Adviser to the New Funds. In connection with its consideration of the management agreements of the Trust, the Board considered, among other things: (i) the nature, extent and quality of the Adviser’s services to be provided, (ii) the fees and other expenses to be paid by the New Funds as well as expense information for comparable funds, (iii) the expected profitability of the Adviser and its affiliates from its relationship with the New Funds, (iv) whether economies of scale may be realized as the New Funds grow and whether potential economies may be shared, in some measure, with the New Funds’ investors; and (v) other benefits to the Adviser from its relationship with the New Funds. In the Board’s deliberations, no single factor was responsible for the Board’s decision to approve the management agreement, and each Trustee may have afforded different weight to the various factors.
Nature, Extent and Quality of Services. The Board’s consideration of the nature, extent and quality of the Adviser’s services to be provided to the New Funds took into account the knowledge that may be gained from the Board’s meetings with the Adviser throughout the year. In addition, the Board considered: (i) the Adviser’s long-term history of managing the other Funds in the Calamos fund complex; (ii) the consistency of investment approach; (iii) the background and experience of the Adviser’s investment personnel responsible for managing the New Funds; and (iv) the Adviser’s performance as administrator of the other Funds in the fund complex, including, among other things, in the areas of brokerage selection, trade execution, compliance and shareholder communications. The Board also reviewed the Adviser’s resources and key personnel expected to provide investment management services to the New Funds. The Board also considered compliance reports about the Adviser from the Trust’s Chief Compliance Officer. The Board concluded that the nature, extent and quality of the services to be provided by the Adviser to the New Funds were appropriate and consistent with the management agreement and that the New Funds were likely to benefit from services provided under the management agreement with the Adviser.
Investment Performance of the Fund. Because the New Funds had not yet commenced operations, the Board did not consider the investment performance of the New Funds.
Costs of Services Provided and Profits Realized by the Adviser. The Board evaluated the New Funds’ proposed management fee rates and estimated total expense ratios as compared to information provided by the Adviser regarding the median management fee rate and total expense ratios of each New Fund’s Morningstar Peer Group (the Funds’ “Expense Group”). The Board considered that the Global Convertible Fund’s proposed contractual management fee rate and estimated total expense ratio are above the median fee rate and total expense ratio of the Fund’s Expense Group. The Board also considered the Adviser’s assertion that the Fund’s Expense Group did not contain other global funds and that the proposed contractual management fee rate was in line with those of other global funds. The Board considered that the Hedged Equity Income Fund’s proposed contractual management fee rate and estimated total expense ratio were below the median fee rate and total expense ratio of its Expense Group. The Board noted the Adviser’s agreement to reimburse the New Funds for a portion of their expenses if the New Funds expense ratio otherwise would exceed a
| | | | |
| 246 | | CALAMOS OPEN-END FAMILY OF FUNDS SEMIANNUAL REPORT | | |
Trustee Approval of Management Agreement (Unaudited)
certain level. In light of all the information presented, the Board concluded that it would be in the best interest of the New Funds and their shareholders to approve the management agreement.
Economies of Scale and Fee Levels Reflecting Those Economies. The Board considered whether each New Fund’s proposed management fee shares with shareholders potential economies of scale that may be achieved by the Adviser. The Board recognized that breakpoints in the proposed fee schedule for the New Funds could result in the sharing of economies of scale as the New Funds’ assets increase. The Board also considered the Adviser’s agreement to reimburse the New Funds for a portion of their expenses if a New Funds’ respective expense ratios otherwise would exceed a certain level. The Board concluded that the breakpoints in the proposed fee schedule for the New Funds allow shareholders to benefit from potential economies of scale that may be achieved by the Adviser.
Profitability. The Board did not consider information concerning the costs incurred and profits realized by the Adviser as the New Funds had not yet commenced operations.
Other Benefits Derived from the Relationship with the Fund. The Board also considered other benefits that could accrue to the Adviser and its affiliates from their relationship with the New Funds. The Board concluded that the Funds and the Adviser may potentially benefit from their relationship with each other in ways other than the services to be provided by the Adviser and its affiliates pursuant to their agreements with the Funds and the fees payable by the Funds.
The Board also considered the Adviser’s use of a portion of the commissions paid by the New Funds on their portfolio brokerage transactions to obtain research products and services benefiting the New Funds and/or other clients of the Adviser and concluded, based on reports from the Funds’ Chief Compliance Officer, that the Adviser’s use of “soft” commission dollars to obtain research products and services was consistent with regulatory requirements.
After full consideration of the above factors as well as other factors that were instructive in their consideration, the trustees, including all of the Independent Trustees, concluded that the proposed amendment to the Trust’s management agreement with the Adviser to add the New Funds was in the best interest of the New Funds and their shareholders.
MANAGING YOUR CALAMOS FUNDS INVESTMENTS
Calamos Investments offers several convenient means to monitor, manage and feel confident about your Calamos investment choice.
24-HOUR AUTOMATED SHAREHOLDER ASSISTANCE: 800.823.7386
Through a single toll-free number, Calamos 24-Hour Shareholder Assistance is fast and easy. Get fund prices and account balances, review recent transactions, order statements, literature and more.
PERSONAL ASSISTANCE: 800.582.6959
Dial this toll-free number to speak with a knowledgeable Client Services Representative who can help answer questions or address issues concerning your Calamos Fund.
ONLINE ACCOUNT MANAGEMENT: www.calamos.com
Manage your personal account of Calamos Funds online at www.calamos.com. On your account access page, you can view account history and download data.
YOUR FINANCIAL ADVISOR
We encourage you to talk to your financial advisor to determine how the Calamos Funds can benefit your investment portfolio based on your financial goals, risk tolerance, time horizon and income needs.
This report, including the audited financial statements contained herein, is submitted for general information for the shareholders of the Funds. The report is not authorized for distribution to prospective investors in the Funds unless accompanied by a currently effective prospectus of the Funds and, after July 31, 2015, updated performance data for the most recently completed fiscal quarter. The views expressed in this report reflect those of Calamos Advisors LLC only through April 30, 2015. The managers’ views are subject to change at any time based on market and other conditions.
A description of the Calamos Proxy Voting Policies and Procedures and the Funds’ proxy voting record for the 12-month period ended June 30, 2014 are available free of charge upon request by calling 800.582.6959, by visiting the Calamos Web site at www.calamos.com, or by writing Calamos at: Calamos Investments, Attn: Client Services, 2020 Calamos Court, Naperville, IL 60563. The Funds’ proxy voting record is also available free of charge by visiting the SEC Web site at www.sec.gov.
The Funds file a complete list of their portfolio holdings with the SEC for the first and third quarters each fiscal year on Form N-Q. The Forms N-Q are available free of charge, upon request, by calling or writing Calamos Investments at the phone number or address provided above or by visiting the SEC Web site at www.sec.gov. You may also review or, for a fee, copy the forms at the SEC’s Public Reference Room in Washington, D.C. Information on the operation of the Public Reference Room may be obtained by calling 800.732.0330.
FOR 24-HOUR AUTOMATED SHAREHOLDER ASSISTANCE: 800.823.7386
TO OBTAIN INFORMATION ABOUT YOUR INVESTMENTS: 800.582.6959
VISIT OUR WEB SITE: www.calamos.com
INVESTMENT ADVISER:
Calamos Advisors LLC
2020 Calamos Court
Naperville, IL 60563-2787
CUSTODIAN AND FUND ACCOUNTING AGENT:
State Street Bank and Trust Company
Boston, MA
TRANSFER AGENT:
U.S. Bancorp Fund Services, LLC
615 E. Michigan St., 3rd Floor
Milwaukee, WI 53202
INDEPENDENT REGISTERED PUBLIC ACCOUNTING FIRM:
Deloitte & Touche LLP
Chicago, IL
LEGAL COUNSEL:
Ropes & Gray LLP
Chicago, IL
| | |

| | STAY CONNECTED www.calamos.com/connect |
|
Visit our Web site for timely fund performance, detailed fund profiles, fund news and insightful market commentary. |

2020 Calamos Court
Naperville, IL 60563-2787
800.582.6959
www.calamos.com
© 2015 Calamos Investments LLC. All Rights Reserved.
Calamos® and Calamos Investments® are registered
trademarks of Calamos Investments LLC.
MFSAN 1631 2015
ITEM 2. CODE OF ETHICS.
Not applicable.
ITEM 3. AUDIT COMMITTEE FINANCIAL EXPERT.
Not applicable.
ITEM 4. PRINCIPAL ACCOUNTANT FEES AND SERVICES.
Not applicable.
ITEM 5. AUDIT COMMITTEE OF LISTED REGISTRANTS.
Not applicable.
ITEM 6. SCHEDULE OF INVESTMENTS
Included in the Report to Shareholders in Item 1.
ITEM 7. DISCLOSURE OF PROXY VOTING POLICIES AND PROCEDURES FOR CLOSED-END MANAGEMENT INVESTMENT COMPANIES.
Not applicable.
ITEM 8. PORTFOLIO MANAGERS OF CLOSED-END MANAGEMENT INVESTMENT COMPANIES.
Not applicable.
ITEM 9. PURCHASES OF EQUITY SECURITIES BY CLOSED-END MANAGEMENT INVESTMENT COMPANY AND AFFILIATED PURCHASERS.
Not applicable.
ITEM 10. SUBMISSION OF MATTERS TO A VOTE OF SECURITY HOLDERS.
No material changes.
ITEM 11. CONTROLS AND PROCEDURES.
a) The registrant’s principal executive officer and principal financial officer have evaluated the registrant’s disclosure controls and procedures within 90 days of this filing and have concluded that the registrant’s disclosure controls and procedures were effective, as of that date, in ensuring that information required to be disclosed by the registrant in this Form N-CSR was recorded, processed, summarized, and timely reported.
b) There were no changes in the registrant’s internal controls over financial reporting (as defined in Rule 30a-3(d) under the Investment Company Act of 1940) that occurred during the second fiscal quarter of the period covered by this report that has materially affected, or is reasonably likely to materially affect, the registrant’s internal control over financial reporting.
ITEM 12. EXHIBITS.
(a)(1) Code of Ethics - Not applicable.
(a)(2)(i) Certification of Principal Executive Officer.
(a)(2)(ii) Certification of Principal Financial Officer.
SIGNATURES
Pursuant to the requirements of the Securities Exchange Act of 1934 and the Investment Company Act of 1940, the registrant has duly caused this report to be signed on its behalf by the undersigned, thereunto duly authorized.
Calamos Investment Trust
| | |
| |
| By: | | /s/ John P. Calamos, Sr. |
| Name: | | John P. Calamos, Sr. |
| Title: | | Principal Executive Officer |
| Date: | | June 19, 2015 |
| | |
| |
| By: | | /s/ Nimish S. Bhatt |
| Name: | | Nimish S. Bhatt |
| Title: | | Principal Financial Officer |
| Date: | | June 19, 2015 |
Pursuant to the requirements of the Securities Exchange Act of 1934 and the Investment Company Act of 1940, this report has been signed by the following persons on behalf of the registrant and in the capacities and on the dates indicated.
| | |
| |
| By: | | /s/ John P. Calamos, Sr. |
| Name: | | John P. Calamos, Sr. |
| Title: | | Principal Executive Officer |
| Date: | | June 19, 2015 |
| | |
| |
| By: | | /s/ Nimish S. Bhatt |
| Name: | | Nimish S. Bhatt |
| Title: | | Principal Financial Officer |
| Date: | | June 19, 2015 |