UNITED STATES
SECURITIES AND EXCHANGE COMMISSION
Washington, D.C. 20549
FORM N-CSR
CERTIFIED SHAREHOLDER REPORT OF REGISTERED
MANAGEMENT INVESTMENT COMPANIES
| | |
INVESTMENT COMPANY ACT FILE NUMBER: | | 811-05443 |
| |
| EXACT NAME OF REGISTRANT AS SPECIFIED IN CHARTER: | | Calamos Investment Trust |
| |
ADDRESS OF PRINCIPAL EXECUTIVE OFFICES: | | 2020 Calamos Court, Naperville Illinois 60563-2787 |
| |
NAME AND ADDRESS OF AGENT FOR SERVICE: | | John P Calamos, Sr., President, Calamos Advisors LLC 2020 Calamos Court, Naperville, Illinois 60563-2787 |
REGISTRANT’S TELEPHONE NUMBER, INCLUDING AREA CODE: (630) 245-7200
DATE OF FISCAL YEAR END: October 31, 2017
DATE OF REPORTING PERIOD: November 1, 2016 through April 30, 2017
Item 1. Report to Shareholders

Experience and Foresight
About Calamos Investments
For 40 years, we have helped investors like you manage and build wealth to meet long-term objectives. Because investors have different time horizons, risk tolerances and goals, we offer funds to suit a variety of asset allocation needs. Our 16 mutual funds include equity, fixed income, convertible and alternative funds. We offer U.S. funds as well as global and international choices.
We are dedicated to helping our clients build and protect wealth. We understand when you entrust us with your assets, you also entrust us with your achievements, goals and aspirations. We believe we best honor this trust by making investment decisions guided by integrity, discipline and our conscientious research.
We believe an active, risk-conscious approach is essential for wealth creation. In the 1970s, we pioneered the use of convertible securities as a means to control risk in volatile markets. We followed with strategies that combine convertibles and stocks, with the aim of participating in equity market upside with potentially less volatility than an all-stock portfolio. In the 1990s, we introduced our first stock fund, which invests in growth companies both large and small. Across our funds, our investment process seeks to manage risk at multiple levels and draws upon our experience investing through many market cycles. In a rapidly changing environment, we believe that this active management is essential.
We are global in our perspective. We believe globalization offers tremendous opportunities for countries and companies all over the world. In our U.S., global and international portfolios, we are seeking to capitalize on the potential growth of the global economy.
We believe there are opportunities in all markets. Our history traces back to the 1970s, a period of significant volatility and economic concerns. We have invested through multiple market cycles, each with its own challenges. Out of this experience comes our belief that the flipside of volatility is opportunity.
Letter to Shareholders

JOHN P. CALAMOS, SR.
Founder, Chairman and Global CIO
Dear Fellow Shareholder:
Welcome to your semiannual report for the six-month period ended April 30, 2017. In this report, you will find commentary from the Calamos portfolio management teams, as well as a listing of portfolio holdings, financial statements and highlights, and detailed information about the performance and positioning of the Calamos Funds. I encourage you to review this information carefully.
Market Review
During the semiannual period, investors were encouraged by the prospect of increased fiscal policy, generally improving economic data, globally accommodative monetary policy and a weakening dollar. Against this backdrop, equity markets around the world advanced. The MSCI World Index, a measure of developed market equity performance, returned 12.44%, while the S&P 500 Index, a measure of the U.S. market advanced even further, gaining 13.32%. Emerging market equities also rallied, gaining 9.03% based on the MSCI Emerging Markets Index. Convertible securities, which combine attributes of stocks and bonds, participated in the upside performance of the equity markets. The U.S. focused BofA Merrill Lynch All U.S. Convertibles ex-Mandatory Index returned 11.28%, while the BofA Merrill Lynch Global 300 Convertible Index advanced 7.44%.
As the Federal Reserve continued tightening short-term rates, investor enthusiasm for fixed income securities waned. Still, there were opportunities within the fixed income markets. Although the government and investment-grade corporate bond markets inched into negative territory for the period, as measured by a -0.67% return for the Bloomberg Barclays U.S. Aggregate Bond Index, high-yield securities benefited from their equity sensitivity and market participants’ continued quest for income, as demonstrated by the Credit Suisse U.S. High Yield Index’s gain of 5.64%.
Outlook
We expect sustained and balanced global economic growth to continue, supported by favorable economic trends in the United States, Europe, and many emerging markets. A stabilizing dollar, contained inflation, and an increased emphasis on fiscal policy—most notably but not exclusively in the United States—can provide tailwinds to sustain economic growth. These conditions also set the stage for additional stock market upside, particularly in growth areas of the market.
Letter to Shareholders
We expect the Federal Reserve to continue gradually tightening short-term rates. Many investors have been conditioned to think of any rate increase in negative terms, but we believe controlled rate increases made in response to improving economic conditions should be viewed more positively. For example, a more normal rate environment can provide incentives for banks to lend capital to smaller businesses, a key engine of job growth.
While we have a constructive outlook on the global economy and equity markets, we are vigilant to the crosscurrents of a highly politically charged environment, both in the U.S. and globally. Further, although pro-growth policies offer tremendous potential, fiscal policy takes time to implement and work through the economy. We expect volatility in the markets due to these factors, as well as longer-standing geopolitical concerns and conflicts.
Drawing on our collective experience navigating upside opportunity and downside risk, our investment organization believes the Calamos Funds are well positioned. As you will read in the investment manager commentaries, we continue to identify opportunities across the global markets. We see considerable potential for growth equities, as economic conditions continue to improve around the world. We also believe convertible securities remain an attractive diversification tool, as they have tended to demonstrate greater resilience to rising interest rates than traditional bonds, as well as resilience during equity market volatility. Finally, although rising interest rates are likely to create headwinds for some areas of the bond market, longer-term rates have remained well behaved and are unlikely to soar. In this environment, we believe there are opportunities for active managers in select segments, including in high yield.
Conclusion
As the saying goes, every bull market climbs a wall of worry. In other words, opportunity and volatility always go hand in hand. Even upward-moving markets see their share of shorter-term downturns and at times, corrections. When retracements occur, I encourage investors to maintain a long-term focus and rely on their financial advisors. A financial advisor can help align your asset allocation with the opportunities in the global markets as well as your risk tolerance and goals.
In closing, thank you for the trust you have placed in Calamos Investments to help you achieve your financial goals. We are honored to serve you. I invite you to visit our website, www.calamos.com, on an ongoing basis. You will find many resources, including blogs and videos from our investment team and thought leadership pieces.
Sincerely,

John P. Calamos, Sr.
Founder, Chairman and Global Chief Investment Officer
| | | | |
| 2 | | CALAMOS OPEN-END FAMILY OF FUNDS SEMIANNUAL REPORT | | |
Letter to Shareholders
Before investing, carefully consider a fund’s investment objectives, risks, charges and expenses. Please see the prospectus containing this and other information or call 800.582.6959. Please read the prospectus carefully. Performance data represents past performance, which is no guarantee of future results. Current performance may be lower or higher than the performance quoted.
The MSCI World Index is a market-capitalization weighted index composed of companies representative of the market structure of developed market countries in North America, Europe and the Asia/Pacific region. The S&P 500 Index is an unmanaged index generally considered representative of the U.S. stock market. The MSCI Emerging Markets Index is a free float-adjusted market capitalization index considered broadly representative of emerging market equity performance. The index represents companies within the constituent emerging markets that are available to investors worldwide. The BofA Merrill Lynch All U.S. Convertibles ex-Mandatory Index represents the U.S. convertible securities market excluding mandatory convertibles. The BofA Merrill Lynch Global 300 Convertible Index is a global convertible index composed of companies representative of the market structure of countries in North America, Europe and the Asia/Pacific region. The Credit Suisse U.S. High Yield Index is an unmanaged index of high yield debt securities. The Bloomberg Barclays U.S. Aggregate Bond Index is considered generally representative of the investment-grade bond market. Sources: Lipper, Inc. and Morningstar, Inc.
Unmanaged index returns assume reinvestment of any and all distributions and, unlike fund returns, do not reflect fees, expenses or sales charges. Investors cannot invest directly in an index. Investments in overseas markets pose special risks, including currency fluctuation and political risks. These risks are generally intensified for investments in emerging markets. Countries, regions, and sectors mentioned are presented to illustrate countries, regions, and sectors in which a fund may invest. Fund holdings are subject to change daily. The Funds are actively managed.
The information contained herein is based on internal research derived from various sources and does not purport to be statements of all material facts relating to the securities mentioned. The information contained herein, while not guaranteed as to accuracy or completeness, has been obtained from sources we believe to be reliable. There are certain risks involved with investing in convertible securities in addition to market risk, such as call risk, dividend risk, liquidity risk and default risk, that should be carefully considered prior to investing. This information is being provided for informational purposes only and should not be considered investment advice or an offer to buy or sell any security in the portfolio. Investments in alternative strategies may not be suitable for all investors.
This report is intended for informational purposes only and should not be considered investment advice.
Calamos Growth Fund
OVERVIEW
The fund invests in the equities of U.S. companies from a range of market capitalizations that we believe offer the best potential for growth.
KEY FEATURES
| | ◾ | | Utilizes more than two decades of extensive research experience in growth investing | |
| | ◾ | | Active management focuses on top-down views and bottom-up fundamentals | |
| | ◾ | | Research-driven approach identifies opportunities by combining top-down analysis with a focus on key growth characteristics | |
PORTFOLIO FIT
This actively managed fund seeks to provide attractive returns through its emphasis on higher growth companies primarily in large and mid cap arenas.
| | |
| FUND NASDAQ SYMBOLS |
A Shares | | CVGRX |
B Shares | | CVGBX |
C Shares | | CVGCX |
I Shares | | CGRIX |
R Shares | | CGRRX |
T Shares | | CVGTX |
|
| FUND CUSIP NUMBERS |
A Shares | | 128119302 |
B Shares | | 128119740 |
C Shares | | 128119856 |
I Shares | | 128119807 |
R Shares | | 128119435 |
T Shares | | 128120623 |
CALAMOS GROWTH FUND
INVESTMENT TEAM DISCUSSION
How has the Fund performed?
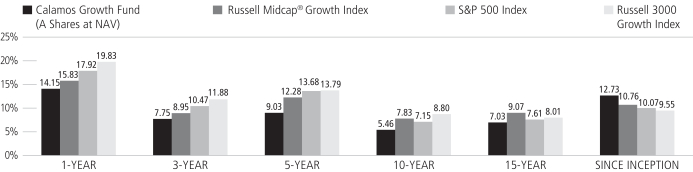
For the six-month period ended April 30, 2017, Calamos Growth Fund gained 12.22% (Class A shares at net asset value), versus a 15.47% gain for the Russell 3000 Growth Index. For the same period, the S&P 500 Index rose 13.32% and the Russell Midcap Growth Index gained 13.59%.
The U.S. equity market rallied strongly during the six-month period on the heels of the November election results. Pre- and post-election, President Trump discussed plans to reduce regulations, overhaul health care, decrease taxes, re-patriate overseas cash holdings and spur further infrastructure projects. Many have referred to the market’s rally as the “Trump Trade,” referencing the initial success of stocks for businesses that stand to gain from these proposals.
However, after a brief selloff in the beginning of November, the market actually started to rally ahead of the U.S. election. Perhaps the U.S. equity market rally was more a reflection of improving economic conditions, highlighted in employment data, consumer confidence, and housing data, to name a few. Toward the latter stages of the reporting period, the market rotated away from the “Trump Trade” while still moving higher and providing strong returns for investors.
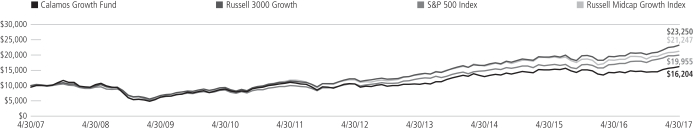
Since its inception on September 4, 1990, the Fund has returned 12.73% on an annualized basis (Class A shares at net asset value). We believe this demonstrates the Fund’s ability to outdistance the growth and broad indices over full market cycles. Over the same period, the Russell 3000 Growth Index returned 9.55%, while the S&P 500 Index and the Russell Midcap Growth Index returned 10.07% and 10.76%, respectively.
What factors influenced performance over the period?
The Fund’s overall conservative positioning led the Fund to lag the Russell 3000 Growth Index for the six-month period. While the Fund delivered strong absolute returns, the Fund lagged in the early stages of the period when deep cyclical stocks and more value-oriented names drove benchmark returns. Fund management at the time had a more cautious view of market and economic potential and thought the election would likely add more volatility to U.S. equity markets.
The Fund’s selection in information technology hindered performance. Holdings within semiconductors lagged those of the benchmark, and an underweight to that more cyclically oriented industry also detracted from relative performance. Selection within data processing also hindered relative performance. The Fund maintains a generous-but-selective investment to high-quality tech names. Our technology sector positioning reflects our positive view of the Internet and software industry and our selective view within the hardware and semiconductor industries.
Selection in financials also weighed on relative performance, as regional bank holdings and consumer finance names underperformed. The Fund has selectively increased investment in financials, as an improving economy and easing regulatory pressures should provide support for the businesses.
| | | | |
| 4 | | CALAMOS OPEN-END FAMILY OF FUNDS SEMIANNUAL REPORT | | |
Calamos Growth Fund
Health care selections were additive to the Fund’s relative performance as holdings within the pharmaceuticals and biotechnology industries strongly outperformed those of the benchmark. The Fund has a relatively neutral stance to benchmark weightings in health care, as the sector needs to tackle the problems of excessive costs. The good news is the sector is highly diverse, allowing for selective opportunities.
An underweight to consumer staples holdings was also beneficial to the Fund’s relative performance. Consumer staples significantly lagged the overall market and Fund management continues to believe the sector is broadly expensive relative to growth potential.
How is the Fund positioned?
In this all-cap growth equity Fund, we seek to invest in U.S. companies that we believe have the best prospects for sustainable and high relative growth. The Fund offers a diversified approach and participates in long-term growth trends by focusing on companies with solid fundamentals, global brands, and strong growth catalysts, while being mindful of valuations.
Information technology continues to be the Fund’s largest sector weight, but is only a modest overweight relative to the benchmark. The sector represents quite a diverse group of industries, and we have been selective in looking for those businesses that offer a compelling combination of higher-growth potential, strong balance sheets, and relatively attractive valuations. We also hold an overweight to financials as we are enthusiastic about the prospects for growth and the sector remains a relatively small percentage of the growth index. Financials may offer faster growth than other areas of the market and stand to gain with an improving economy and deregulation.
The Fund remains underweight to consumer staples, as we have been wary of the perceived safety trade and yield trade, which seemingly have driven the market over the past few years. The Fund holds a modest underweight within health care as political risks could potentially punish portions of that sector with either the prospect of reduced utilization due to changes to federal health care laws or onerous pricing regulations for biotechnology companies. As mentioned previously, health care must also contend with escalating costs.
What closing thoughts do you have for Fund shareholders?
We are constructive on the U.S. equity market given our view that the U.S. economy appears positioned for measured expansion with growth picking up steam as the year progresses. The equity market’s gains do not appear overly enthusiastic in our view, because they are underpinned by stronger earnings and sales growth, which the market hasn’t seen in many years. We also believe that the potent mix of potential tax reform and less regulation has yet to be fully priced into U.S. equities, offering further support for the U.S. equity market. In that sense, the “Trump Trade” may not be over and the Fund has accordingly increased cyclical growth opportunities while maintaining investments in higher, secular growth businesses. As global growth improves and central banks around the world look to synchronize their efforts toward normalization of interest rate policy, U.S. businesses and U.S. equities may yet see further support.
| | | | |
| SECTOR WEIGHTINGS | |
Information Technology | | | 34.2 | % |
Consumer Discretionary | | | 19.9 | |
Industrials | | | 14.6 | |
Health Care | | | 12.5 | |
Financials | | | 9.1 | |
Consumer Staples | | | 3.6 | |
Materials | | | 2.8 | |
Energy | | | 2.4 | |
Sector weightings are subject to change daily and are calculated as a percentage of net assets. The table excludes cash or cash equivalents, any government/sovereign bonds or broad-based index hedging securities the Fund may hold.
Calamos Growth Fund
ANNUALIZED RETURN: SINCE INCEPTION (9/4/90) THROUGH 4/30/17
Performance data quoted represents past performance, which is no guarantee of future results. Current performance may be lower or higher than the performance quoted.
The principal value and investment return of an investment will fluctuate so that your shares, when redeemed, may be worth more or less than their original cost. You can obtain performance data current to the most recent month end by visiting www.calamos.com. Average annual total return measures net investment income and capital gain or loss from portfolio investments as an annualized average. All performance shown assumes reinvestment of dividends and capital gains distributions. Performance is for the Fund’s Class A shares at net asset value and does not include the Fund’s maximum front-end sales charge of 4.75%. Had it been included, the Fund’s return would have been lower. The Fund also offers Class B, Class C, Class I and Class R shares, the performance of which may vary. Source: State Street Corporation and Lipper, Inc.
| | | | |
| 6 | | CALAMOS OPEN-END FAMILY OF FUNDS SEMIANNUAL REPORT | | |
Calamos Growth Fund
GROWTH OF $10,000: FOR THE 10-YEAR PERIOD ENDED 4/30/17
AVERAGE ANNUAL TOTAL RETURN† AS OF 4/30/17
| | | | | | | | | | | | | | | | | | | | |
| | | 6
MONTHS | | 1
YEAR | | 5
YEARS | | 10 YEARS OR ^SINCE
INCEPTION |
Class A Shares – Inception 9/4/90 | | | | | | | | | | | | | | | | | | | | |
Without Sales Charge | | | | 12.22 | % | | | | 14.15 | % | | | | 9.03 | % | | | | 5.46 | % |
With Sales Charge | | | | 6.90 | | | | | 8.72 | | | | | 7.97 | | | | | 4.94 | |
Class B Shares – Inception 9/11/00 | | | | | | | | | | | | | | | | | | | | |
Without Sales Charge | | | | 11.80 | | | | | 13.30 | | | | | 8.21 | | | | | 4.83 | |
With Sales Charge | | | | 6.80 | | | | | 8.30 | | | | | 8.05 | | | | | 4.83 | |
Class C Shares – Inception 9/3/96 | | | | | | | | | | | | | | | | | | | | |
Without Sales Charge | | | | 11.80 | | | | | 13.30 | | | | | 8.21 | | | | | 4.67 | |
With Sales Charge | | | | 10.80 | | | | | 12.30 | | | | | 8.21 | | | | | 4.67 | |
Class I Shares – Inception 9/18/97 | | | | 12.36 | | | | | 14.44 | | | | | 9.30 | | | | | 5.72 | |
Class R Shares – Inception 3/1/07 | | | | 12.08 | | | | | 13.88 | | | | | 8.76 | | | | | 5.20 | |
Class T Shares – Inception 2/28/17 | | | | | | | | | | | | | | | | | | | | |
Without Sales Charge | | | | | | | | | | | | | | | | | | | 2.88 | ^ |
With Sales Charge | | | | | | | | | | | | | | | | | | | 0.31 | ^ |
Performance data quoted represents past performance, which is no guarantee of future results. Current performance may be lower or higher than the performance quoted. The principal value and investment return of an investment will fluctuate so that your shares, when redeemed, may be worth more or less than their original cost.
As of the prospectus dated 2/28/17, the Fund’s gross expense ratio for Class A shares is 1.35%; Class B and C shares is 2.10%; Class I shares is 1.10%; Class R shares is 1.60%; Class T shares is 1.35%. The expense ratios shown above may differ from the more recent expense ratios reported in the Financial Highlights section of this report.
| † | Average annual total return measures net investment income and capital gain or loss from portfolio investments as an annualized average assuming reinvestment of dividends and capital gains distributions. Performance shown reflects the effects of an expense reimbursement that improved results and was in effect until March 31, 2000. Load-adjusted returns are adjusted for the maximum front-end sales load of 4.75% for Class A shares and returns for Class B and C shares have been adjusted for the contingent deferred sales charge (CDSC). |
NOTES:
The graphs do not reflect the income taxes that you would pay on fund distributions or the redemption of fund shares. Fund performance includes reinvestment of dividends and adjustment for the maximum sales charge for Class A shares. The performance of other classes will vary from the performance of the class shown based on the difference in sales charges and fees paid by shareholders investing in different share classes.
The Russell 3000® Growth Index measures the performance of companies with higher price-to-book ratios and higher forecasted growth values. Index data shown for the Annualized Return Since Inception graph is from 8/31/90, since comparative index data is only available for full monthly periods. Source: Lipper, Inc.
The S&P 500 Index is an unmanaged index generally considered representative of the U.S. stock market. Index data shown for the Annualized Return Since Inception graph is from 8/31/90, since comparative index data is only available for full monthly periods. Source: Lipper, Inc.
The Russell Midcap® Growth Index measures the performance of mid-sized companies with growth characteristics. Index data shown for the Annualized Return Since Inception graph is from 8/31/90, since comparative index data is only available for full monthly periods. Source: Lipper, Inc.
Index returns assume reinvestment of dividends and do not reflect deduction of fees and expenses. It is not possible to invest directly in an index.
Calamos Opportunistic Value Fund
OVERVIEW
The fund invests in the equities of small, midsize and large U.S. companies that we believe are undervalued according to certain financial measurements of their intrinsic values.
KEY FEATURES
| | ◾ | | Utilizes bottom-up stock picking and a benchmark-agnostic approach, which focuses on good businesses with solid cash flow and value prices | |
PORTFOLIO FIT
The fund is a core value option that may balance a growth allocation and complement other value strategies. Our flexibility in analyzing all companies regardless of sector helps us avoid the cyclicality inherent in a deep value strategy or momentum growth strategy.
| | |
| FUND NASDAQ SYMBOLS |
A Shares | | CVAAX |
B Shares | | CVABX |
C Shares | | CVACX |
I Shares | | CVAIX |
R Shares | | CVARX |
T Shares | | CVATX |
|
| FUND CUSIP NUMBERS |
A Shares | | 128119666 |
B Shares | | 128119658 |
C Shares | | 128119641 |
I Shares | | 128119633 |
R Shares | | 128119419 |
T Shares | | 128120615 |
CALAMOS OPPORTUNISTIC VALUE FUND
INVESTMENT TEAM DISCUSSION
How has the Fund performed?
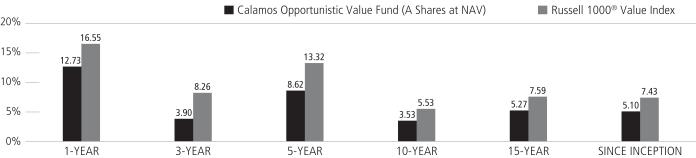
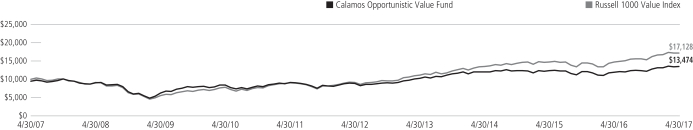
For the six-month period ended April 30, 2017, the Fund gained 10.85% (Class A shares at net asset value) versus a gain of 11.69% for the Russell 1000 Value Index.
The Fund performed in line, but slightly lagged the Russell 1000 Value Index for the reporting period. Prior to and following the U.S. election, investor sentiment was on the rise, leading the U.S. equity market to rally strongly during the six-month period. Pre- and post-election, President Trump discussed plans to reduce regulations, overhaul health care, decrease taxes, re-patriate overseas cash holdings and spur further infrastructure projects. Consequently, many referred to the market’s rally as the “Trump Trade.”
The initial success of stocks associated with businesses that stood to gain from President Trump’s proposed initiatives corroborated the idea of the “Trump Trade.” However, save for a brief sell-off in the beginning of November, the market had actually started to rally ahead of the U.S. election. Perhaps the U.S. equity market rally was more indicative of improving economic conditions overall, reflected in positive trends in employment, consumer confidence, and housing data, to name a few. Toward the latter stages of the reporting period, the market rotated away from the “Trump Trade” while still moving higher and providing strong returns for investors.
What factors influenced performance?
The Fund benefitted from the reflation trade that occurred during the reporting period, as the financials, industrials and materials sectors all enjoyed strong performance and outperformed the Russell 1000 Value Index on whole. Within both the Russell 1000 Value Index and the S&P 500 Index, companies with the highest debt-to-capital ratios—in other words, more leveraged and economically distressed companies—enjoyed the best returns. This phenomenon seems to indicate an investor preference for these more speculative, distressed names, suggesting a belief that a rising economy would benefit these businesses most. While the Fund did own some names within that group, the Fund was underweight lower-quality, more distressed businesses overall. Sector positioning was additive, as an overweight to information technology and a well-timed increase to consumer discretionary names proved additive. Within stock selection, securities in energy and materials lagged those of the market, and contributed to the slight lag in relative performance.
How is the Fund positioned?
The Fund seeks to identify attractively valued, temporarily out-of-favor stocks, or mispriced companies with good future business prospects. In essence, we believe that the Fund’s positioning reflects good businesses trading at value prices.
We continue to actively manage our sector exposures in conjunction with our fundamental, bottom-up research and our top-down views of economic and market opportunities. Our view of the economy is that we may continue to see reflationary opportunities, but that slow-yet-increasing economic growth may be most likely. As such, the Fund has taken a measured approach to balancing cyclical and secular
| | | | |
| 8 | | CALAMOS OPEN-END FAMILY OF FUNDS SEMIANNUAL REPORT | | |
Calamos Opportunistic Value Fund
growth opportunities. During the period, we added to information technology and consumer discretionary holdings on the belief that dynamic market leaders will be able to offer stronger growth and still trade with attractive valuations. Looking to cyclical growth opportunities, the Fund has slightly increased investment in the industrials sector, and still holds significant investment in the financials sector.
What closing thoughts do you have for Fund shareholders?
We are constructive on the U.S. equity market, given our view that the U.S. economy appears positioned for measured expansion with growth picking up steam as the year progresses. The equity market’s gains do not appear overly enthusiastic in our view, yet are supported by stronger earnings and sales growth, which the market hasn’t seen in many years. We also believe that the potent mix of potential tax reform and less regulation has yet to be fully priced into U.S. equities, offering support for the U.S. equity market. In that sense, the “Trump Trade” may not be over and the Fund has accordingly increased cyclical opportunities while maintaining investments in secular businesses. As global growth improves and central banks around the world look to synchronize their efforts toward normalization of interest rate policy, U.S. businesses and U.S. equities may see further support.
Our focus remains on solid businesses with sustainable cash flows that are trading at attractive prices. We are mindful of valuations and have been trimming positions where valuations may subject stocks to increased volatility. In addition, we have used market pullbacks in an attempt to selectively add to positions offering solid fundamentals.
| | | | |
| SECTOR WEIGHTINGS | |
Information Technology | | | 23.4 | % |
Financials | | | 19.5 | |
Industrials | | | 11.5 | |
Health Care | | | 11.0 | |
Consumer Discretionary | | | 9.8 | �� |
Energy | | | 6.7 | |
Consumer Staples | | | 6.1 | |
Utilities | | | 3.3 | |
Materials | | | 3.0 | |
Real Estate | | | 2.6 | |
Telecommunication Services | | | 1.2 | |
| | | | | |
Sector weightings are subject to change daily and are calculated as a percentage of net assets. The table excludes cash or cash equivalents, any government/sovereign bonds or broad-based index hedging securities the Fund may hold.
ANNUALIZED RETURN: SINCE INCEPTION (10/2/02) THROUGH 4/30/17
Performance data quoted represents past performance, which is no guarantee of future results. Current performance may be lower or higher than the performance quoted.
The principal value and investment return of an investment will fluctuate so that your shares, when redeemed, may be worth more or less than their original cost. You can obtain performance data current to the most recent month end by visiting www.calamos.com. Average annual total return measures net investment income and capital gain or loss from portfolio investments as an annualized average. All performance shown assumes reinvestment of dividends and capital gains distributions. Performance is for the Fund’s Class A shares at net asset value and does not include the Fund’s maximum front-end sales charge of 4.75%. Had it been included, the Fund’s return would have been lower. The Fund also offers Class B, Class C, Class I and Class R shares, the performance of which may vary. Performance shown reflects an expense reimbursement that improved results. Source: State Street Corporation and Lipper, Inc.
Calamos Opportunistic Value Fund
GROWTH OF $10,000: FOR THE 10-YEAR PERIOD ENDED 4/30/17
AVERAGE ANNUAL TOTAL RETURN† AS OF 4/30/17
| | | | | | | | | | | | | | | | |
| | | 6
MONTHS | | | 1
YEAR | | | 5
YEARS | | | 10 YEARS
OR ^SINCE
INCEPTION | |
Class A Shares – Inception 1/2/02 | | | | | | | | | | | | | | | | |
Without Sales Charge | | | 10.85 | % | | | 12.73 | % | | | 8.62 | % | | | 3.53 | % |
With Sales Charge | | | 5.57 | | | | 7.36 | | | | 7.56 | | | | 3.03 | |
Class B Shares – Inception 1/2/02 | | | | | | | | | | | | | | | | |
Without Sales Charge | | | 10.41 | | | | 11.86 | | | | 7.80 | | | | 2.91 | |
With Sales Charge | | | 5.41 | | | | 6.86 | | | | 7.50 | | | | 2.91 | |
Class C Shares – Inception 1/2/02 | | | | | | | | | | | | | | | | |
Without Sales Charge | | | 10.51 | | | | 11.98 | | | | 7.81 | | | | 2.76 | |
With Sales Charge | | | 9.51 | | | | 10.98 | | | | 7.81 | | | | 2.76 | |
Class I Shares – Inception 3/1/02 | | | 11.08 | | | | 13.09 | | | | 8.89 | | | | 3.79 | |
Class R Shares – Inception 3/1/07 | | | 10.75 | | | | 12.47 | | | | 8.35 | | | | 3.27 | |
Class T Shares – Inception 2/28/17 | | | | | | | | | | | | | | | | |
Without Sales Charge | | | | | | | | | | | | | | | -1.14 | ^ |
With Sales Charge | | | | | | | | | | | | | | | -3.61 | ^ |
Performance data quoted represents past performance, which is no guarantee of future results. Current performance may be lower or higher than the performance quoted. The principal value and investment return of an investment will fluctuate so that your shares, when redeemed, may be worth more or less than their original cost.
As of the prospectus dated 2/28/17, the Fund’s gross expense ratio for Class A shares is 1.57%; Class B shares is 2.33%; Class C shares is 2.32%; Class I shares is 1.32%; Class R shares is 1.83%; Class T shares is 1.57%. The Fund’s investment advisor has contractually agreed to reimburse Fund expenses through March 1, 2019, to the extent necessary so that Total Annual Fund Operating Expenses (excluding taxes, interest, short interest, short dividend expenses, brokerage commissions, acquired fund fees and expenses, and extraordinary expenses, if any) of Class A, Class B, Class C, Class I, Class R and T shares are limited to 1.12%, 1.88%, 1.87%, 0.87%, 1.37% and 1.12% of average net assets, respectively. The expense ratios shown above may differ from the more recent expense ratios reported in the Financial Highlights section of this report.
| † | Average annual total return measures net investment income and capital gain or loss from portfolio investments as an annualized average assuming reinvestment of dividends and capital gains distributions. Performance shown reflects the effects of an expense reimbursement that improved results and was in effect until March 31, 2004. Load-adjusted returns are adjusted for the maximum front-end sales load of 4.75% for Class A shares and returns for Class B and C shares have been adjusted for the contingent deferred sales charge (CDSC). |
NOTES:
The graphs do not reflect the income taxes that you would pay on fund distributions or the redemption of fund shares. Fund performance includes reinvestment of dividends and adjustment for the maximum sales charge for Class A shares. The performance of other classes will vary from the performance of the class shown based on the difference in sales charges and fees paid by shareholders investing in different share classes.
The Russell 1000® Value Index measures the performance of those companies in the Russell 1000® Index with lower price-to-book ratios and lower forecasted growth values. Index data shown for the Annualized Return Since Inception graph is from 12/31/01, since comparative index data is only available for full monthly periods. Source: Lipper, Inc.
The S&P 500 Index is an unmanaged index generally considered representative of the U.S. stock market.
Index returns assume reinvestment of dividends and do not reflect deduction of fees and expenses. It is not possible to invest directly in an index.
| | | | |
| 10 | | CALAMOS OPEN-END FAMILY OF FUNDS SEMIANNUAL REPORT | | |
Calamos Dividend Growth Fund
CALAMOS DIVIDEND GROWTH FUND
INVESTMENT TEAM DISCUSSION
How has the Fund performed?
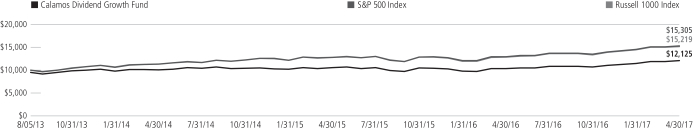
For the six-month period ended April 30, 2017, the Fund gained 13.13% (Class A shares at net asset value) versus a 13.32% gain for the S&P 500 Index and a 13.46% gain for the Russell 1000 Index.
The Fund performed broadly in line with the S&P 500 Index during a rapidly rising equity market which saw leadership changes between reflationary and cyclical stocks to secular and “defensive” growth stocks.
The U.S. equity market rallied strongly during the period following the U.S. election. Prior to and following the election, President Trump discussed plans to reduce regulations, overhaul health care, decrease taxes, re-patriate overseas cash holdings and spur further infrastructure projects. Consequently, many referred to the market’s rally as the “Trump Trade.”
The initial success of stocks associated with businesses that stood to gain from President Trump’s proposed initiatives corroborated the idea of the “Trump Trade.” However, save for a brief sell-off in the beginning of November, the market had actually started to rally ahead of the U.S. election. Perhaps the U.S. equity market rally was more indicative of improving economic conditions overall, reflected in positive employment numbers, consumer confidence, and housing data, to name a few. Toward the latter stages of the reporting period, the market rotated away from the “Trump Trade” while still moving higher, providing strong returns for investors.
Our screening and fundamental research process, which favors companies with higher-quality balance sheets over those likely to require additional financing to maintain operations, led us away from the riskier and higher-P/E* names within the market. Stocks of companies with higher levels of debt-to-capital and lower-quality ratings (as measured by Standard & Poor’s) outperformed the overall market. Despite the market’s preference and Fund management’s leaning toward risk management and higher-quality businesses, Fund performance was broadly in line with the S&P 500 Index during the period.
What factors influenced performance?
Even though the Fund’s overweights and underweights were not extreme, the Fund’s sector positioning was a slight positive to relative performance as compared to the S&P 500 Index. An overweight to financials and an underweight to real estate both proved beneficial, but a slight overweight to energy was a drag on relative performance. Stock selection was a positive as well, highlighted by strong selection in industrials, notably in the railroad space. Selection within consumer discretionary names—namely in cable and satellite stocks—was also additive to relative performance, as was our avoidance of struggling names in the apparel and luxury goods industry. Selection in financials lagged those of the market, as both regional bank holdings and asset management and custody bank holdings underperformed relative to the benchmark’s names. Cash,
| * | Price/earnings ratio is the current stock price over the trailing 12-month earnings per share. The P/E shows how much investors are willing to pay per dollar of earnings. |
OVERVIEW
The fund invests in companies that we believe have the ability to increase dividends over time, either through increasing profits or more efficient use of capital.
KEY FEATURES
| | ◾ | | Utilizes bottom-up stock picking and a benchmark-agnostic approach, which focuses on good businesses with solid cash flow and value prices | |
PORTFOLIO FIT
The fund seeks to provide a regular stream of income and dividend-paying equity investments that tend to be less volatile than non-dividend payers.
| | |
| FUND NASDAQ SYMBOLS |
A Shares | | CADVX |
C Shares | | CCDVX |
I Shares | | CIDVX |
T Shares | | CTDVX |
|
| FUND CUSIP NUMBERS |
A Shares | | 128120839 |
C Shares | | 128120821 |
I Shares | | 128120813 |
T Shares | | 128120490 |
Calamos Dividend Growth Fund
| | | | |
| SECTOR WEIGHTINGS | |
Information Technology | | | 22.4 | % |
Financials | | | 14.0 | |
Consumer Discretionary | | | 13.9 | |
Health Care | | | 13.7 | |
Industrials | | | 10.5 | |
Consumer Staples | | | 8.9 | |
Energy | | | 6.5 | |
Materials | | | 2.6 | |
Telecommunication Services | | | 2.3 | |
Utilities | | | 2.2 | |
Real Estate | | | 2.0 | |
| | | | | |
Sector weightings are subject to change daily and are calculated as a percentage of net assets. The table excludes cash or cash equivalents, any government/sovereign bonds or broad-based index hedging securities the Fund may hold.
which on average was less than 2% of Fund assets over the reporting period, also created a slight drag on performance during a time when the market showed high returns over a short period.
How is the Fund positioned?
The Fund’s investments reflect our positive long-term outlook for equities and our preference for dividend-paying companies with sound fundamentals and attractive valuations. Furthermore, we seek companies that have an ability to increase dividends over time, either through increasing profits or more efficient use of capital. We continue to actively manage our sector exposures in conjunction with our fundamental, bottom-up research approach. While we have a positive long-term view, we are cognizant of short-term risks, which include a market with higher valuations, increasing political risks, as well as low volatility as measured by the CBOE Volatility Index (VIX).
We have not made significant shifts to sector weights as a result of the market’s gains, but we have sold names where risk/reward dynamics may have changed. We are mindful of valuations and have been trimming positions where valuations may subject stocks to increased volatility. In addition, we have used market pullbacks in an attempt to selectively add to positions offering solid fundamentals. The Fund has a modest overweight to consumer discretionary names. The sector is quite diverse and we have found opportunities while being selective in areas such as Internet retail and restaurants. Our focus remains on solid businesses with sustainable cash flows, trading at attractive prices.
What closing thoughts do you have for Fund shareholders?
We are constructive on the U.S. equity market given our view that the U.S. economy appears positioned for measured expansion with growth picking up steam as the year progresses. The equity market’s gains do not appear overly enthusiastic in our view, given the increase is supported by stronger earnings and sales growth, which the market hasn’t seen in many years. We also believe that the potent mix of potential tax reform and reduced regulation has yet to be fully priced into U.S. equities. In that sense, the “Trump Trade” may not be over and the Fund has accordingly kept a balance of cyclical growth opportunities while maintaining investments in higher, secular growth businesses. As global growth improves and central banks around the world look to synchronize their efforts toward normalization of interest rate policy, U.S. businesses and U.S. equities may see further support.
| | | | |
| 12 | | CALAMOS OPEN-END FAMILY OF FUNDS SEMIANNUAL REPORT | | |
Calamos Dividend Growth Fund
GROWTH OF $10,000: SINCE INCEPTION (8/5/13) THROUGH 4/30/17
AVERAGE ANNUAL TOTAL RETURN† AS OF 4/30/17
| | | | | | | | | | | | |
| | | 6
MONTHS | | | 1
YEAR | | | SINCE
INCEPTION | |
Class A Shares – Inception 8/5/2013 | | | | | | | | | | | | |
Without Sales Charge | | | 13.13 | % | | | 16.77 | % | | | 6.68 | % |
With Sales Charge | | | 7.73 | | | | 11.26 | | | | 5.30 | |
Class C Shares – Inception 8/5/2013 | | | | | | | | | | | | |
Without Sales Charge | | | 12.70 | | | | 15.86 | | | | 5.88 | |
With Sales Charge | | | 11.70 | | | | 14.86 | | | | 5.88 | |
Class I Shares – Inception 8/5/2013 | | | 13.35 | | | | 17.15 | | | | 6.96 | |
Class T Shares – Inception 2/28/2017 | | | | | | | | | | | | |
Without Sales Charge | | | | | | | | | | | 1.20 | |
With Sales Charge | | | | | | | | | | | -1.33 | |
Performance data quoted represents past performance, which is no guarantee of future results. Current performance may be lower or higher than the performance quoted. The principal value and investment return of an investment will fluctuate so that your shares, when redeemed, may be worth more or less than their original cost.
As of the prospectus dated 2/28/17, the Fund’s gross expense ratio for Class A shares is 1.74%; Class C shares is 2.49%; Class I shares is 1.49%; Class T shares is 1.74%. The Fund’s Investment Adviser has contractually agreed to reimburse Fund expenses through March 1, 2019 to the extent necessary so that Total Annual Fund Operating Expenses (excluding taxes, interest, short interest, short dividend expenses, brokerage commissions, acquired fund fees and expenses and extraordinary expenses, if any) of Class A, Class C, Class I and Class T shares are limited to 1.34%, 2.09%,1.09% and 1.34% of average net assets, respectively. This agreement is not terminable by either party. The expense ratios shown above may differ from the more recent expense ratios reported in the Financial Highlights section of this report.
| † | Average annual total return measures net investment income and capital gain or loss from portfolio investments as an annualized average assuming reinvestment of dividends and capital gains distributions. Load-adjusted returns are adjusted for the maximum front-end sales load of 4.75% for Class A shares. Returns for Class C shares have been adjusted for the contingent deferred sales charge (CDSC). |
NOTES:
The graph does not reflect the income taxes that you would pay on fund distributions or the redemption of fund shares. Fund performance includes reinvestment of dividends and adjustment for the maximum sales charge for Class A shares. The performance of other classes will vary from the performance of the class shown based on the difference in sales charges and fees paid by shareholders investing in different share classes.
The S&P 500 Index is an unmanaged index generally considered representative of the U.S. stock market. Index data shown for the Annualized Return Since Inception graph is from 8/31/13, since comparative index data is only available for full monthly periods. Source: Lipper, Inc.
The Russell 1000 Index measures the performance of the large-cap segment of the U.S. equity universe. It is a subset of the Russell 3000 Index and includes approximately 1,000 of the largest securities based on a combination of their market cap and current index membership.
The Chicago Board Options Exchange Volatility Index (VIX) shows the market’s expectation of 30-day volatility by using the implied volatilities of a wide range of S&P 500 index options.
Index returns assume reinvestment of dividends and do not reflect deduction of fees and expenses. It is not possible to invest directly in an index.
Calamos International Growth Fund
OVERVIEW
The fund invests in non-U.S. growth companies. We focus on those firms that we believe demonstrate key growth characteristics, including increasing profit margins and high returns on invested capital.
KEY FEATURES
| | ◾ | | Focuses on growth in an asset class that is mostly defined by core and value offerings | |
| | ◾ | | Stresses company fundamentals, including global presence and strong or accelerated earnings growth | |
| | ◾ | | Investments driven by international sources of revenue for companies, not on location of headquarters | |
PORTFOLIO FIT
Investors tend to underinvest in growth outside the U.S. and emphasize growth with U.S.-oriented equity funds. The fund stands as a potential growth-focused addition to a mostly core- or value-intensive international allocation.
| | |
| FUND NASDAQ SYMBOLS |
A Shares | | CIGRX |
B Shares | | CIGBX |
C Shares | | CIGCX |
I Shares | | CIGIX |
R Shares | | CIGFX |
T Shares | | CITGX |
| |
| FUND CUSIP NUMBERS | | |
A Shares | | 128119575 |
B Shares | | 128119567 |
C Shares | | 128119559 |
I Shares | | 128119542 |
R Shares | | 128119393 |
T Shares | | 128120599 |
CALAMOS INTERNATIONAL GROWTH FUND
INVESTMENT TEAM DISCUSSION
How has the Fund performed?
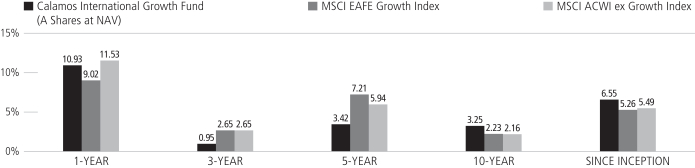
For the six-month period ended April 30, 2017, Calamos International Growth Fund returned 8.53% (Class A shares at net asset value), versus a 9.81% return for the MSCI ACWI ex-U.S. Growth Index and 10.60% for the MSCI EAFE Growth Index. International equities experienced a broad advance during the period, with gains across regions and almost all sectors. Higher prices reflected generally better economic data, higher corporate earnings and more bullish investor sentiment across both developed and emerging markets.
In the early stage of the six-month period—and in the time preceding it—our team had been skeptical of the sustainability of the global recovery and generally positioned the portfolio for a low growth environment. The Fund’s tilt toward higher growth and quality fundamentals detracted from relative security selection and moderated performance in the period, as more cyclical-oriented businesses outperformed on a wave of optimism for improving global growth. Following the resolution of certain geopolitical risks and given increasing evidence of a more synchronized international expansion, we became more comfortable with this uptick in growth and inflation, and chose to increase Fund holdings in financials, industrials, and select resource-related businesses as the period progressed.
What factors influenced performance over the period?
From a sector perspective, security selection in the consumer discretionary sector negatively affected Fund returns in the period. Specifically, holdings in both the autos and the apparel and accessories industries underperformed those in the index. We hold a significant weight in the sector and own companies in diversified categories, including Internet retail, apparel and accessories, automotive, and cable and satellite industries. The Fund’s holdings in the financials sector also trailed the index and hampered Fund return. In particular, Fund positions in the asset management and custody banks industry lagged those of the index. During the period, we added to our weight in financials in order to benefit from improving credit quality, increased lending activity, and the potential for higher interest rates.
Conversely, The Fund’s overweight position and selection in information technology contributed positively to performance. Fund holdings in both the data processing and outsourced services and the application software industries performed well on leading growth fundamentals. The Fund’s overweight stance in information technology reflects our view of positive fundamentals, reasonable valuations, and compelling secular tailwinds. The Fund’s underweight position and security selection in consumer staples also boosted performance in the period. Within the sector, we own a set of global leaders with long-term growth potential in multiple consumer categories. Our holdings offer diversified revenue streams, attractive free cash flow and earnings growth catalysts.
From a geographic perspective, the Fund’s country positioning contributed positively to performance, while selection within countries hurt overall return versus the index. In particular, the Fund’s selection in Germany and South Korea trailed the index. The Fund’s holdings in India and the Netherlands contributed the most to performance.
| | | | |
| 14 | | CALAMOS OPEN-END FAMILY OF FUNDS SEMIANNUAL REPORT | | |
Calamos International Growth Fund
How is the Fund positioned?
The Fund’s regional and country positioning reflects the combined inputs from our top-down global framework and our bottom-up security analysis. Our investment team continually evaluates macroeconomic factors and growth opportunities, then actively integrates these insights into investment decision making.
From a regional perspective, we hold a moderate overweight to Europe, reflecting our view of improving economic data, reasonable valuations, favorable liquidity and potential upside in corporate margins. We own select multinationals domiciled in Europe that place a greater emphasis on global revenue exposure.
We hold a relatively neutral view of Japan but have found a number of attractive individual opportunities. Japan’s macroeconomic fundamentals remain lackluster despite continued monetary accommodation. Equity valuations are attractive, and we favor exporters benefiting from the improvement in global growth and favorable currency effects.
We have a positive view and select overweight in emerging market holdings. On a regional basis, the Fund’s largest weight is in Emerging Asia with select positions in Emerging Europe and Latin America. The outlook for earnings growth is strong, and emerging markets are poised to benefit from the stabilization in many currencies and commodities, as well as from a pickup in global demand.
From a sector standpoint, we made certain shifts during the period. We increased the Fund’s weight in industrials, financials and select resource-related holdings, representing cyclical and bottom-up opportunities.
We offset this increase with decreased weights in consumer discretionary and health care, driven mainly by security-specific rationale. In terms of largest absolute weights, we have an emphasis in information technology, industrials, financials, and consumer companies.
What closing thoughts do you have for Fund shareholders?
Recent economic data points to a synchronized pickup in growth across international regions. Accommodative monetary policy overall and a pivot toward fiscal stimulus is also supporting global activity. As a result, we see continued opportunities in international equities, offering good fundamentals and valuations. In terms of broad positioning, we favor a blend of investments in secular and core growth companies, in addition to economically sensitive cyclical businesses. We see significant opportunities in companies with growing earnings and pricing power, solid cash flow generation, and improving-to-strong balance sheets. From a thematic and sector perspective, we see opportunities in the information technology sector, in consumer companies with targeted areas of demand, and in an increased universe of cyclical companies in the industrials, financials and resource sectors with improving fundamentals and catalysts. Our active investment approach and long-term perspective enables us to take advantage of the opportunities in international equities.
| | | | |
| SECTOR WEIGHTINGS | | | |
Information Technology | | | 23.8 | % |
Industrials | | | 16.7 | |
Financials | | | 13.7 | |
Consumer Discretionary | | | 12.2 | |
Consumer Staples | | | 11.3 | |
Health Care | | | 10.6 | |
Materials | | | 5.6 | |
Energy | | | 3.4 | |
Telecommunication Services | | | 1.0 | |
Real Estate | | | 0.7 | |
Other | | | 0.1 | |
| | | | | |
Sector weightings are subject to change daily and are calculated as a percentage of net assets. The table excludes cash or cash equivalents, any government/sovereign bonds or broad-based index hedging securities the Fund may hold.
Calamos International Growth Fund
ANNUALIZED RETURN: SINCE INCEPTION (3/16/05) THROUGH 4/30/17
Performance data quoted represents past performance, which is no guarantee of future results. Current performance may be lower or higher than the performance quoted.
The principal value and investment return of an investment will fluctuate so that your shares, when redeemed, may be worth more or less than their original cost. You can obtain performance data current to the most recent month end by visiting www.calamos.com. Average annual total return measures net investment income and capital gain or loss from portfolio investments as an annualized average. All performance shown assumes reinvestment of dividends and capital gains distributions. Performance is for the Fund’s Class A shares at net asset value and does not include the Fund’s maximum front-end sales charge of 4.75%. Had it been included, the Fund’s return would have been lower. The Fund also offers Class B, Class C, Class I and Class R shares, the performance of which may vary. Source: State Street Corporation and Lipper, Inc.
| | | | |
| 16 | | CALAMOS OPEN-END FAMILY OF FUNDS SEMIANNUAL REPORT | | |
Calamos International Growth Fund
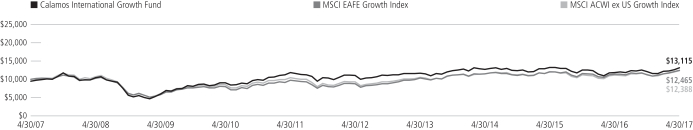
GROWTH OF $10,000: FOR THE 10-YEAR PERIOD ENDED 4/30/17
AVERAGE ANNUAL TOTAL RETURN† AS OF 4/30/17
| | | | | | | | | | | | | | | | |
| | | 6
MONTHS | | | 1
YEAR | | | 5
YEARS | | | 10 YEARS
OR ^SINCE
INCEPTION | |
Class A Shares – Inception 3/16/05 | | | | | | | | | | | | | | | | |
Without Sales Charge | | | 8.53 | % | | | 10.93 | % | | | 3.42 | % | | | 3.25 | % |
With Sales Charge | | | 3.38 | | | | 5.67 | | | | 2.43 | | | | 2.75 | |
Class B Shares – Inception 3/16/05 | | | | | | | | | | | | | | | | |
Without Sales Charge | | | 8.13 | | | | 10.07 | | | | 2.64 | | | | 2.63 | |
With Sales Charge | | | 3.13 | | | | 5.07 | | | | 2.28 | | | | 2.63 | |
Class C Shares – Inception 3/16/05 | | | | | | | | | | | | | | | | |
Without Sales Charge | | | 8.14 | | | | 10.08 | | | | 2.65 | | | | 2.48 | |
With Sales Charge | | | 7.14 | | | | 9.08 | | | | 2.65 | | | | 2.48 | |
Class I Shares – Inception 3/16/05 | | | 8.67 | | | | 11.23 | | | | 3.67 | | | | 3.51 | |
Class R Shares – Inception 3/1/07 | | | 8.34 | | | | 10.64 | | | | 3.15 | | | | 2.99 | |
Class T Shares – Inception 2/28/17 | | | | | | | | | | | | | | | | |
Without Sales Charge | | | | | | | | | | | | | | | 6.42 | ^ |
With Sales Charge | | | | | | | | | | | | | | | 3.76 | ^ |
Performance data quoted represents past performance, which is no guarantee of future results. Current performance may be lower or higher than the performance quoted. The principal value and investment return of an investment will fluctuate so that your shares, when redeemed, may be worth more or less than their original cost.
As of the prospectus dated 2/28/17, the Fund’s gross expense ratio for Class A shares is 1.39%; Class B shares is 2.13%; Class C shares is 2.14%; Class I shares is 1.14%; Class R shares is 1.64%; Class T shares is 1.39%. The Fund’s investment advisor has contractually agreed to reimburse Fund expenses through March 1, 2019, to the extent necessary so that Total Annual Fund Operating Expenses (excluding taxes, interest, short interest, short dividend expenses, brokerage commissions, acquired fund fees and expenses, and extraordinary expenses, if any) of Class A, Class B, Class C, Class I, Class R and Class T shares are 1.38%, 2.12%, 2.13%, 1.13%, 1.63% and 1.38%. The expense ratios shown above may differ from the more recent expense ratios reported in the Financial Highlights section of this report.
| † | Average annual total return measures net investment income and capital gain or loss from portfolio investments as an annualized average assuming reinvestment of dividends and capital gains distributions. Performance shown reflects the effects of an expense reimbursement that improved results and was in effect until March 31, 2005. Load-adjusted returns are adjusted for the maximum front-end sales load of 4.75% for Class A shares and returns for Class B and C shares have been adjusted for the contingent deferred sales charge (CDSC). |
NOTES:
The graphs do not reflect the income taxes that you would pay on fund distributions or the redemption of fund shares. Fund performance includes reinvestment of dividends and adjustment for the maximum sales charge for Class A shares. The performance of other classes will vary from the performance of the class shown based on the difference in sales charges and fees paid by shareholders investing in different share classes.
The MSCI EAFE Growth Index measures developed market growth equity performance (excluding the U.S. and Canada). Source: MSCI Barra.
The MSCI ACWI ex U.S. Growth Index measures equity market performance of companies outside of the United States with higher growth values in developed and emerging markets.
Index returns assume reinvestment of dividends and do not reflect deduction of fees and expenses. It is not possible to invest directly in an index.
Calamos Evolving World Growth Fund
OVERVIEW
The fund globally invests in growth companies, emphasizing businesses with revenue streams derived within or from emerging markets. The fund is designed to actively manage risk over a full market cycle.
KEY FEATURES
| | ◾ | | Active risk management aims to generate alpha with less downside risk than the benchmark and peers | |
| | ◾ | | Stresses strong or accelerated earnings growth and solid returns on invested capital | |
| | ◾ | | Targets well-positioned global growth companies that may benefit from long-term secular themes in emerging markets such as the rise of the emerging-market consumer | |
PORTFOLIO FIT
Given its focus on risk management, the fund can serve as a long-term emerging market allocation.
| | |
| FUND NASDAQ SYMBOLS |
A Shares | | CNWGX |
B Shares | | CNWZX |
C Shares | | CNWDX |
I Shares | | CNWIX |
R Shares | | CNWRX |
T Shares | | CNWTX |
|
| FUND CUSIP NUMBERS |
A Shares | | 128119161 |
B Shares | | 128119153 |
C Shares | | 128119146 |
I Shares | | 128119138 |
R Shares | | 128119120 |
T Shares | | 128120581 |
CALAMOS EVOLVING WORLD GROWTH FUND
INVESTMENT TEAM DISCUSSION
How has the Fund performed?
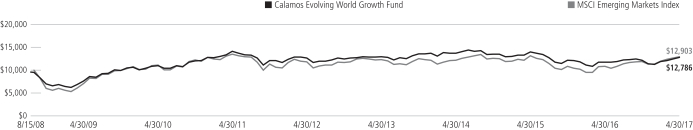
For the six-month period ended April 30, 2017, Calamos Evolving World Growth Fund returned 5.12% (Class A shares at net asset value), versus a 9.03% return for the MSCI Emerging Market Index.
Our risk-managed, higher-quality growth approach faced multiple challenges in the period. The portion of our Fund that holds developed-market companies with significant ties to emerging markets trailed the stronger high single-digit return in emerging market equities. In addition, the Fund’s select positions in equity-sensitive securities, primarily in convertible bonds, trailed the robust rally in equities. As part of the Fund’s risk-managed strategy, convertibles can provide a critical source of downside resilience over a market cycle.
What factors influenced performance?
With respect to specific positioning effects on performance during the period, we would highlight the following areas:
| • | | From a broad geographic perspective, country return perspective, the Fund’s positioning detracted from performance in terms of country weights and selection within countries. In particular, the Fund’s selection in Mexico and South Korea trailed the index, while the Fund’s holdings in India and Turkey contributed the most positively to performance. |
| • | | From a sector perspective, the Fund’s security selection in information technology contributed the most value to performance during the period. Holdings in both the data processing and outsourced services industry and internet software and services industry delivered strong gains. We hold our largest sector weight in information technology based on its large addressable markets and leading earnings growth potential. We see strong thematic alignment in the sector with holdings positioned to benefit from innovation in mobility, e-commerce, among other trends in emerging economies. |
| • | | The Fund’s holdings in industrials also lifted performance. Positions in the aerospace and defense industry performed well because of strong market demand and a leading fundamental profile. We see increasing opportunities in the sector and own positions in the machinery, construction and engineering and the defense industries, which are benefiting from a pickup in global demand and more cyclical growth prospects in emerging markets. |
| • | | The Fund’s overweight position and selection in the consumer discretionary sector negatively affected results. Specifically, holdings in the restaurants and automobile industries trailed those in the index. We have a positive view on trends in the sector and own companies in diverse industries including internet retail, automotive, cable and satellite, and casinos and gaming. |
| • | | The Fund’s underweight and selection in financials also held back returns in the period. In particular, our positions in the diversified banks industry trailed stronger gains in the index. We have a selective view of opportunities in financials and |
| | | | |
| 18 | | CALAMOS OPEN-END FAMILY OF FUNDS SEMIANNUAL REPORT | | |
Calamos Evolving World Growth Fund
| | | maintain a modest underweight stance toward banks and the sector overall. We expect our positioning to benefit as investors reward companies exhibiting higher-quality fundamentals, improvements in efficiency and earnings growth. |
How is the Fund positioned?
Our positioning favors economies benefiting from domestic demand trends, pro-growth fiscal reforms, and a blend of secular demand and more cyclical opportunities. We favor investments in China, India, South Korea and select opportunities in Brazil, Taiwan, Russia, Mexico, South Africa and Indonesia.
From a sector perspective, the Fund is overweight opportunities in information technology, consumer discretionary and industrials, while the Fund has an underweight stance in consumer staples, utilities, telecom services, financials and real estate, as compared to the index.
We maintained relatively stable sector weights during the period. We modestly increased the portfolio weight in financials, industrials and technology reflecting our view of increased opportunities in more economically sensitive areas within global and emerging markets. We offset this by decreasing the weight in consumer staples and health care based on our view of valuations in certain defensive areas and bottom-up fundamentals.
What closing thoughts do you have for Fund shareholders?
We have a positive view of investment opportunities in emerging markets. Emerging markets are navigating a path influenced by the U.S. dollar, higher interest rates, and potential protectionist sentiments regarding trade. Despite these potential headwinds, the outlook for earnings growth is strong and emerging markets are poised to benefit from stabilization in many currencies and commodities as well as a pickup in global demand.
Emerging market equity valuations and growth characteristics are favorable and may benefit from a re-focus on corporate fundamentals versus broader macro topics. While we do not expect a rapid acceleration in economic growth, we see improving trends in emerging market data and perhaps a greater appreciation of the divergent conditions among economies. We have also seen notable improvements in current account and fiscal measures, for both net commodity consumers and producers, which has significantly reduced vulnerability to external currencies and capital flows.
A significant portion of the upside move in emerging market equities over the last year was driven by a relatively narrow rally in many lower-quality, higher-beta companies. In 2017 year-to-date, we are seeing companies with higher-quality fundamentals and more sustainable growth characteristics perform well. We believe our active and risk-aware investment approach enables us to take advantage of the improving opportunity set while also providing downside resilience should market volatility return.
| | | | |
| SECTOR WEIGHTINGS | | | |
Information Technology | | | 24.9 | % |
Financials | | | 21.9 | |
Consumer Discretionary | | | 14.9 | |
Industrials | | | 10.4 | |
Telecommunication Services | | | 7.6 | |
Energy | | | 6.4 | |
Materials | | | 5.9 | |
Consumer Staples | | | 3.5 | |
Health Care | | | 2.2 | |
Real Estate | | | 1.6 | |
Other | | | 0.1 | |
| | | | | |
Sector weightings are subject to change daily and are calculated as a percentage of net assets. The table excludes cash or cash equivalents, any government/sovereign bonds or broad-based index hedging securities the Fund may hold.
Calamos Evolving World Growth Fund
GROWTH OF $10,000: SINCE INCEPTION (8/15/08) THROUGH 4/30/17
AVERAGE ANNUAL TOTAL RETURN† AS OF 4/30/17
| | | | | | | | | | | | | | | | | | | | |
| | | 6
MONTHS | | 1
YEAR | | 5
YEARS | | SINCE
INCEPTION |
Class A Shares – Inception 8/15/08 | | | | | | | | | | | | | | | | | | | | |
Without Sales Charge | | | | 5.12 | % | | | | 8.90 | % | | | | 0.26 | % | | | | 3.44 | % |
With Sales Charge | | | | 0.16 | | | | | 3.75 | | | | | -0.71 | | | | | 2.86 | |
Class B Shares – Inception 8/15/08 | | | | | | | | | | | | | | | | | | | | |
Without Sales Charge | | | | 4.67 | | | | | 8.13 | | | | | -0.48 | | | | | 2.73 | |
With Sales Charge | | | | -0.33 | | | | | 3.13 | | | | | -0.86 | | | | | 2.73 | |
Class C Shares – Inception 8/15/08 | | | | | | | | | | | | | | | | | | | | |
Without Sales Charge | | | | 4.68 | | | | | 8.14 | | | | | -0.49 | | | | | 2.67 | |
With Sales Charge | | | | 3.68 | | | | | 7.14 | | | | | -0.49 | | | | | 2.67 | |
Class I Shares – Inception 8/15/08 | | | | 5.17 | | | | | 9.11 | | | | | 0.49 | | | | | 3.69 | |
Class R Shares – Inception 8/15/08 | | | | 4.92 | | | | | 8.64 | | | | | 0.01 | | | | | 3.18 | |
Class T Shares – Inception 2/28/17 | | | | | | | | | | | | | | | | | | | | |
Without Sales Charge | | | | | | | | | | | | | | | | | | | 5.56 | |
With Sales Charge | | | | | | | | | | | | | | | | | | | 2.92 | |
Performance data quoted represents past performance, which is no guarantee of future results. Current performance may be lower or higher than the performance quoted. The principal value and investment return of an investment will fluctuate so that your shares, when redeemed, may be worth more or less than their original cost.
As of the prospectus dated 2/28/17, the Fund’s gross expense ratio for Class A shares is 1.64%; Class B is 2.41% and C shares is 2.39%; Class I shares is 1.39%; Class R shares is 1.89%; Class T shares is 1.64%. The expense ratios shown above may differ from the more recent expense ratios reported in the Financial Highlights section of this report.
| † | Average annual total return measures net investment income and capital gain or loss from portfolio investments as an annualized average assuming reinvestment of dividends and capital gains distributions. Load-adjusted returns are adjusted for the maximum front-end sales load of 4.75% for Class A shares and returns for Class B and C shares have been adjusted for the contingent deferred sales charge (CDSC). |
NOTES:
The graph does not reflect the income taxes that you would pay on fund distributions or the redemption of fund shares. Fund performance includes reinvestment of dividends and adjustment for the maximum sales charge for Class A shares. The performance of other classes will vary from the performance of the class shown based on the difference in sales charges and fees paid by shareholders investing in different share classes.
The MSCI Emerging Markets Index is a free float-adjusted market capitalization index considered broadly representative of emerging market equity performance. The index represents companies within the constituent emerging markets that are available to investors worldwide. Index data shown for the Since Inception Growth of $10,000 graph is from 8/31/08, since comparative index data is only available for full monthly periods. Source: Lipper, Inc.
Index returns assume reinvestment of dividends and do not reflect deduction of fees and expenses. It is not possible to invest directly in an index.
| | | | |
| 20 | | CALAMOS OPEN-END FAMILY OF FUNDS SEMIANNUAL REPORT | | |
Calamos Emerging Market Equity Fund
CALAMOS EMERGING MARKET
EQUITY FUND
INVESTMENT TEAM DISCUSSION
How has the Fund performed?
For the six-month period ended April 30, 2017, Calamos Emerging Market Equity Fund returned 4.07% (Class A shares at net asset value), versus a 9.03% return for the MSCI Emerging Market Index.
The period comprised two relatively distinct periods reflecting rotational markets and significant changes in sentiment and fundamentals. Our active, higher-quality growth approach faced challenges as many higher-beta and lower-quality emerging market equities outperformed, particularly in the first half of the period.
Following an extended period of heightened risk appetite, EMs experienced a widespread sell-off after the U.S. election due to concerns over rising protectionist sentiment, higher interest rates, and the path of the U.S. dollar. Fund returns struggled during this sell-off phase, due to our overweight positioning in India and Mexico and secular-growth holdings in China, which lagged many cyclical, value-oriented companies in the index.
What factors influenced performance?
Our conviction and overweight positioning in India as well as a higher-quality fundamental profile added considerable value in the second half of the period, as we saw performance broaden out beyond last year’s narrow value-led rally. Moreover, we believe our stance will continue to benefit the Fund in the current environment.
With respect to more specific positioning effects on performance during the period, we would highlight the following areas:
| • | | The Fund’s overweight position and selection in the consumer discretionary sector negatively affected results. Specifically, holdings in the restaurants and automobile industries trailed those in the index. We have a positive view on trends in the sector and own companies in diverse industries including internet retail, automotive, cable and satellite, and casinos and gaming. |
| • | | The Fund’s average underweight and selection in financials also hampered returns in the period. In particular, our positions in the diversified banks industry trailed stronger gains in the index. We increased our weight in financials in the period but maintain a selective view of opportunities. We expect our positioning to benefit as investors reward companies exhibiting relatively higher-quality fundamentals, improvements in efficiency and earnings growth. |
| • | | The Fund’s overweight allocation and stronger selection in information technology contributed the most value to performance during the period. Holdings in the data processing and outsourced services and semiconductors industries delivered strong gains. We hold a significant weight in information technology based on its large addressable markets and leading earnings growth potential. We see strong thematic alignment in the sector with holdings positioned to benefit from innovation in mobility, e-commerce, among other trends in emerging economies. |
OVERVIEW
The fund globally invests in growth companies, whose principal activities are in a developing market or are economically tied to a developing market country that we believe offers the best opportunities for growth.
KEY FEATURES
| | ◾ | | Stresses company fundamentals, including global presence, strong revenue and earnings growth, solid returns on invested capital, and lower debt-to-capital levels | |
| | ◾ | | Actively seeks growth opportunities by investing in equities with at least 80% emerging-market exposure | |
| | ◾ | | Draws upon decades of Calamos experience investing globally through multiple economic, market and credit cycles | |
PORTFOLIO FIT
This actively managed fund complements emerging-market strategies with a less-pronounced growth orientation, such as those that more closely track the broad EM equity market.
| | |
| FUND NASDAQ SYMBOLS |
A Shares | | CEGAX |
C Shares | | CEGCX |
I Shares | | CIEIX |
T Shares | | CEGTX |
|
| FUND CUSIP NUMBERS |
A Shares | | 128120789 |
C Shares | | 128120771 |
I Shares | | 128120763 |
T Shares | | 128120482 |
Calamos Emerging Market Equity Fund
| | | | |
| SECTOR WEIGHTINGS | |
Information Technology | | | 27.9 | % |
Financials | | | 25.7 | |
Consumer Discretionary | | | 13.1 | |
Industrials | | | 6.2 | |
Consumer Staples | | | 6.2 | |
Energy | | | 5.7 | |
Materials | | | 5.1 | |
Other | | | 3.7 | |
Telecommunication Services | | | 2.1 | |
Health Care | | | 1.5 | |
Real Estate | | | 0.6 | |
| | | | | |
Sector weightings are subject to change daily and are calculated as a percentage of net assets. The table excludes cash or cash equivalents, any government/sovereign bonds or broad-based index hedging securities the Fund may hold.
| • | | The Fund’s holdings in industrials also lifted performance. Positions in the aerospace and defense industry performed well because of strong market demand and a leading fundamental profile. We see increasing opportunities in the sector and own positions in the machinery, construction and engineering, and the defense industries, which are benefiting from a pickup in global demand and more cyclical growth prospects in emerging markets. |
| • | | From a country return perspective, the Fund’s positioning detracted from performance in terms of country weights and selection within countries. In particular, the Fund’s selection in Taiwan and South Korea trailed the index, while the Fund’s holdings in India and Turkey contributed the most positively to performance. |
How is the Fund positioned?
Our positioning favors economies benefiting from domestic demand trends, pro-growth fiscal reforms, and a blend of secular demand and more cyclical opportunities. We favor investments in China, India, South Korea and select opportunities in Brazil, Taiwan, Russia, Mexico, South Africa and Indonesia.
From a sector perspective, the Fund is overweight opportunities in technology, consumer discretionary, and industrials, while the Fund has an overall underweight stance in consumer staples, utilities, telecom services, financials and real estate versus the index.
We made select changes to the Fund’s sector weights during the period. We increased the portfolio weight in financials and technology reflecting our view of increased opportunities in more economically sensitive areas within emerging markets. We offset this by decreasing weight in consumer staples and health care, driven by our view of valuations in certain defensive industries and bottom-up fundamentals.
What closing thoughts do you have for Fund shareholders?
We have a positive view of investment opportunities in emerging markets. Emerging markets are navigating a path influenced by the U.S. dollar, higher interest rates, and potential protectionist sentiments regarding trade. Despite these potential headwinds, the outlook for earnings growth is strong and emerging markets are poised to benefit from stabilization in many currencies and commodities as well as a pickup in global demand.
Emerging market equity valuations and growth characteristics are favorable and may benefit from a re-focus on corporate fundamentals versus broader macro topics. While we do not expect a rapid acceleration in economic growth, we see improving trends in emerging market data and perhaps a greater appreciation of the divergent conditions among economies. We have also seen notable improvements in current account and fiscal measures for both net commodity consumers and producers, which has significantly reduced vulnerability to external currencies and capital flows.
A significant portion of the upside move in emerging market equities over the last year was driven by a relatively narrow rally in many lower-quality, higher-beta companies. To date in 2017, we are seeing companies with higher-quality fundamentals and more sustainable growth characteristics perform well. We believe our active, higher-quality growth investment approach will position us to take advantage of the widening opportunity set and improving growth dynamics in emerging markets.
| | | | |
| 22 | | CALAMOS OPEN-END FAMILY OF FUNDS SEMIANNUAL REPORT | | |
Calamos Emerging Market Equity Fund
GROWTH OF $10,000: SINCE INCEPTION (12/31/13) THROUGH 4/30/17

AVERAGE ANNUAL TOTAL RETURN† AS OF 4/30/17
| | | | | | | | | | | | | | | |
| | | 6
MONTHS | | 1
YEAR | | SINCE
INCEPTION |
Class A Shares – Inception 12/31/2013 | | | | | | | | | | | | | | | |
Without Sales Charge | | | | 4.07 | % | | | | 9.67 | % | | | | -3.06 | % |
With Sales Charge | | | | -0.88 | | | | | 4.43 | | | | | -4.47 | |
Class C Shares – Inception 12/31/2013 | | | | | | | | | | | | | | | |
Without Sales Charge | | | | 3.65 | | | | | 8.91 | | | | | -3.76 | |
With Sales Charge | | | | 2.65 | | | | | 7.91 | | | | | -3.76 | |
Class I Shares – Inception 12/31/2013 | | | | 4.18 | | | | | 9.91 | | | | | -2.84 | |
Class T Shares – Inception 2/28/2017 | | | | | | | | | | | | | | | |
Without Sales Charge | | | | | | | | | | | | | | 5.29 | |
With Sales Charge | | | | | | | | | | | | | | 2.66 | |
Performance data quoted represents past performance, which is no guarantee of future results. Current performance may be lower or higher than the performance quoted. The principal value and investment return of an investment will fluctuate so that your shares, when redeemed, may be worth more or less than their original cost.
As of the prospectus dated 2/28/17, the Fund’s gross expense ratio for Class A shares is 2.50%; Class C shares is 3.25%; Class I shares is 2.25%; Class T shares is 2.50%. The Fund’s Investment Adviser has contractually agreed to reimburse the Fund expenses through March 1, 2019, to the extent necessary so that Total Annual Fund Operating Expenses (excluding taxes, interest, short interest, short dividend expenses, brokerage commissions, acquired funds fees and expenses and extraordinary expenses, if any) of Class A, Class C, Class I and Class T shares are limited to 1.68%, 2.44%, 1.43% and 1.68% of average net assets, respectively. This agreement is not terminable by either party. The expense ratios shown above may differ from the more recent expense ratios reported in the Financial Highlights section of this report.
| † | Average annual total return measures net investment income and capital gain or loss from portfolio investments as an annualized average assuming reinvestment of dividends and capital gains distributions. Load-adjusted returns are adjusted for the maximum front-end sales load of 4.75% for Class A shares. Returns for Class C shares have been adjusted for the contingent deferred sales charge (CDSC). |
NOTES:
The graph does not reflect the income taxes that you would pay on fund distributions or the redemption of fund shares. Fund performance includes reinvestment of dividends and adjustment for the maximum sales charge for Class A shares. The performance of other classes will vary from the performance of the class shown based on the difference in sales charges and fees paid by shareholders investing in different share classes.
The MSCI Emerging Markets Index is a free float-adjusted market capitalization index considered broadly representative of emerging market equity performance. The index represents companies within the constituent emerging markets that are available to investors worldwide. Index data shown for the Since Inception Growth of $10,000 graph is from 12/31/13, since comparative index data is only available for full monthly periods. Source: Lipper, Inc.
Index returns assume reinvestment of dividends and do not reflect deduction of fees and expenses. It is not possible to invest directly in an index.
Calamos Global Equity Fund
OVERVIEW
The fund invests in equities of companies around the globe. We focus on those firms that we believe demonstrate key growth characteristics, including increasing profit margins and high returns on invested capital.
KEY FEATURES
| | ◾ | | Flexibly seeks growth globally, searching for the best risk/reward opportunities across countries, market capitalizations and sectors | |
| | ◾ | | Seeks global growth companies that may benefit from long-term secular themes, including a burgeoning global middle class and increasing demand for information and entertainment | |
PORTFOLIO FIT
The fund can serve as a growth-oriented addition to a strategic global equity allocation and may complement or provide an alternative to value or blended styles.
| | |
| FUND NASDAQ SYMBOLS |
A Shares | | CAGEX |
B Shares | | CBGEX |
C Shares | | CCGEX |
I Shares | | CIGEX |
R Shares | | CRGEX |
T Shares | | CTGEX |
|
| FUND CUSIP NUMBERS |
A Shares | | 128119484 |
B Shares | | 128119476 |
C Shares | | 128119468 |
I Shares | | 128119450 |
R Shares | | 128119443 |
T Shares | | 128120573 |
CALAMOS GLOBAL EQUITY FUND
INVESTMENT TEAM DISCUSSION
How has the Fund performed?
For the six-month period ended April 30, 2017, Calamos Global Equity Fund returned 10.34% (Class A shares at net asset value), versus a 12.66% return for the MSCI ACWI Growth Index and 12.44% gain for the MSCI World Index. Global equities saw gains across regions and almost all sectors, reflecting broad participation during the period.
What factors influenced performance?
Higher share prices reflected generally better global economic data, higher corporate earnings and more bullish investor sentiment. We had been skeptical of the sustainability of the global recovery and generally positioned the portfolio for a low growth environment leading into and early in the six-month period. The Fund’s overall tilt towards higher growth and quality detracted from relative security selection and moderated performance as cyclicals and value stocks re-rated on optimism for improving global growth. Following the November U.S. election and given increasing evidence of a more synchronized global expansion, we became more comfortable with this reflationary scenario and shifted the Fund toward more cyclical exposure, increasing exposure to financials, industrials, and select resource-related businesses.
From a sector perspective, the Fund’s moderate underweight position and specific holdings in the consumer discretionary sector negatively affected return in the period. Specifically, holdings in the apparel and accessories industry trailed those in the index because of slowing growth fundamentals. We hold a significant weight in the sector and own companies in diversified categories across industries including Internet retail, apparel and accessories, automotive, and homebuilding.
The Fund’s slight overweight position and selection in the materials sector also hampered return in the period. The Fund’s positioning in the gold mining and production industry underperformed the index. However, we see select opportunities in materials against a backdrop of stabilizing commodity prices, improved demand fundamentals, and the potential for increased global building and infrastructure projects.
The Fund’s underweight position and security selection in consumer staples contributed the most to performance in the period. Within the sector, we own a set of global leaders that feature long-term growth potential across multiple consumer categories. Our holdings offer attractive free cash flow and earnings growth potential, while not relying too heavily on a dividend yield profile that may be vulnerable to interest rate changes.
The Fund’s overweight position in information technology also contributed positively to Fund performance. Thanks to strong growth fundamentals, Fund holdings in both the data processing and outsourced services and the application software industries performed well during the quarter. The Fund’s overweight stance in information technology reflects our view of positive fundamentals, reasonable valuations, and compelling secular tailwinds in the sector.
From a geographic perspective, the Fund’s country and regional positioning contributed modestly to performance, while selection within countries hurt overall returns versus the index. In particular, the Fund’s selection in Germany and the U.S. trailed the index,
| | | | |
| 24 | | CALAMOS OPEN-END FAMILY OF FUNDS SEMIANNUAL REPORT | | |
Calamos Global Equity Fund
while the Fund’s overweight position and strong selection in India and Denmark added the most value in the period.
How is the Fund positioned?
We emphasize investments in companies with catalysts for earnings growth, solid cash flow generation and healthy balance sheets. These include opportunities in information technology, consumer discretionary, industrials, health care and select financials. We view the valuations of global companies as reasonable by historic standards, and we have positioned the portfolio with a combination of core and secular growth companies, in addition to more cyclical opportunities.
The Fund’s regional and country positioning reflects the combined inputs of our top-down global framework and bottom-up security analysis. Our investment team continually evaluates macroeconomic factors and growth opportunities, then actively integrates them into investment decision making.
From a geographic perspective, we have an underweight stance in the U.S. reflecting our view of relative valuations and fundamentals. We own a combination of holdings in core and secular growth areas in addition to more cyclical opportunities.
We are moderately overweight opportunities in Europe based on our view of improving economic data, reasonable valuations, favorable liquidity and an upside in corporate margins. We own select multinationals domiciled in Europe that provide a greater emphasis on global revenue exposure.
We have a positive view and select overweight in emerging markets. On a regional basis, the portfolio owns the largest weight in Emerging Asia in addition to select names in Emerging Europe and Latin America. The outlook for earnings growth is strong, and emerging markets are poised to benefit from the stabilization in many currencies and commodities as well as a pickup in global demand.
The Fund is modestly underweight in Japan, given our mixed view of economic and corporate fundamentals. Japan’s macroeconomic fundamentals remain lackluster despite continued monetary accommodation. Conversely, equity valuations are attractive, and we favor exporters benefiting from the improvement in global growth.
What closing thoughts do you have for Fund shareholders?
Recent economic data points to a synchronized pickup in global growth across regions. Accommodative monetary policy overall and a pivot toward fiscal stimulus is supporting global activity, and we see continued opportunities in global equities, offering good fundamentals and valuations. In terms of broad positioning, we favor a blend of investments in secular and core growth companies, in addition to economically sensitive cyclical businesses. We see significant opportunities in companies with earnings growth catalysts, solid cash flow generation and improving-to-strong balance sheets. From a thematic and sector perspective, we see opportunities in the information technology sector, consumer companies with targeted areas of demand, and more cyclical companies in the industrials, financials and energy sectors with improving fundamentals and catalysts. Our active investment approach and long-term perspective enables us to take advantage of the opportunities in global equities.
| | | | |
| SECTOR WEIGHTINGS | | | |
Information Technology | | | 29.8 | % |
Industrials | | | 13.6 | |
Financials | | | 12.9 | |
Consumer Discretionary | | | 10.9 | |
Health Care | | | 9.5 | |
Consumer Staples | | | 9.4 | |
Materials | | | 7.1 | |
Energy | | | 3.9 | |
Other | | | 0.6 | |
Real Estate | | | 0.5 | |
Sector weightings are subject to change daily and are calculated as a percentage of net assets. The table excludes cash or cash equivalents, any government/sovereign bonds or broad-based index hedging securities the Fund may hold.
Calamos Global Equity Fund
GROWTH OF $10,000: FOR THE 10-YEAR PERIOD ENDED 4/30/17
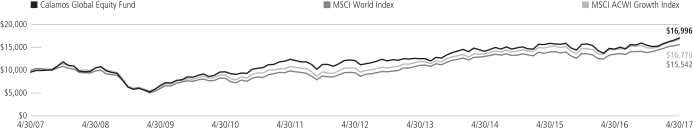
AVERAGE ANNUAL TOTAL RETURN† AS OF 4/30/17
| | | | | | | | | | | | | | | | | | | | |
| | | 6
MONTHS | | 1
YEAR | | 5
YEARS | | 10 YEARS
OR ^SINCE
INCEPTION |
Class A Shares – Inception 3/1/07 | | | | | | | | | | | | | | | | | | | | |
Without Sales Charge | | | | 10.34 | % | | | | 16.37 | % | | | | 7.12 | % | | | | 5.96 | % |
With Sales Charge | | | | 5.06 | | | | | 10.86 | | | | | 6.08 | | | | | 5.45 | |
Class B Shares – Inception 3/1/07 | | | | | | | | | | | | | | | | | | | | |
Without Sales Charge | | | | 9.97 | | | | | 15.51 | | | | | 6.32 | | | | | 5.33 | |
With Sales Charge | | | | 4.97 | | | | | 10.51 | | | | | 6.01 | | | | | 5.33 | |
Class C Shares – Inception 3/1/07 | | | | | | | | | | | | | | | | | | | | |
Without Sales Charge | | | | 10.00 | | | | | 15.55 | | | | | 6.33 | | | | | 5.18 | |
With Sales Charge | | | | 9.00 | | | | | 14.55 | | | | | 6.33 | | | | | 5.18 | |
Class I Shares – Inception 3/1/07 | | | | 10.56 | | | | | 16.69 | | | | | 7.39 | | | | | 6.24 | |
Class R Shares – Inception 3/1/07 | | | | 10.29 | | | | | 16.09 | | | | | 6.86 | | | | | 5.70 | |
Class T Shares – Inception 2/28/17 | | | | | | | | | | | | | | | | | | | | |
Without Sales Charge | | | | | | | | | | | | | | | | | | | 4.92 | ^ |
With Sales Charge | | | | | | | | | | | | | | | | | | | 2.30 | ^ |
Performance data quoted represents past performance, which is no guarantee of future results. Current performance may be lower or higher than the performance quoted. The principal value and investment return of an investment will fluctuate so that your shares, when redeemed, may be worth more or less than their original cost.
As of the prospectus dated 2/28/17, the Fund’s gross expense ratio for Class A shares is 1.50%; Class B is 2.26%; Class C shares is 2.25; Class I shares is 1.25%; Class R shares is 1.75%; Class T shares is 1.50%. The Fund’s investment advisor has contractually agreed to reimburse Fund expenses through March 1, 2019, to the extent necessary so that Total Annual Fund Operating Expenses (excluding taxes, interest, short interest, short dividend expenses, brokerage commissions, acquired fund fees and expenses, and extraordinary expenses, if any) of Class A, Class B, Class C, Class I, Class R and Class T shares are 1.38%, 2.14%, 2.13%, 1.13%, 1.63% and 1.38%. The expense ratios shown above may differ from the more recent expense ratios reported in the Financial Highlights section of this report.
| † | Average annual total return measures net investment income and capital gain or loss from portfolio investments as an annualized average assuming reinvestment of dividends and capital gains distributions. Load-adjusted returns are adjusted for the maximum front-end sales load of 4.75% for Class A shares and returns for Class B and C shares have been adjusted for the contingent deferred sales charge (CDSC). |
NOTES:
The graph does not reflect the income taxes that you would pay on fund distributions or the redemption of fund shares. Fund performance includes reinvestment of dividends and adjustment for the maximum sales charge for Class A shares. The performance of other classes will vary from the performance of the class shown based on the difference in sales charges and fees paid by shareholders investing in different share classes.
The MSCI World Index (U.S. Dollars) is a market-capitalization weighted index composed of companies representative of the market structure of developed market countries in North America, Europe and the Asia/Pacific region. Since inception data for the index is shown from 2/28/07 since data is only available for full monthly periods. Source: Lipper, Inc.
The MSCI ACWI Growth Index is designed to measure the equity performance of companies with higher growth values in developed and emerging markets.
Index returns assume reinvestment of dividends and do not reflect deduction of fees and expenses. It is not possible to invest directly in an index.
The Fund’s use of derivative instruments involves investment risks and transaction costs to which the Fund would not be subject absent the use of these instruments and, accordingly, may result in losses greater than if they had not been used. Derivative instruments can be illiquid, may disproportionately increase losses and may have a potentially large impact on Fund performance.
| | | | |
| 26 | | CALAMOS OPEN-END FAMILY OF FUNDS SEMIANNUAL REPORT | | |
Calamos Growth and Income Fund
CALAMOS GROWTH AND INCOME FUND
INVESTMENT TEAM DISCUSSION
How has the Fund performed?
For the six-month period ended April 30, 2017, the Fund gained 9.78% (Class A shares at net asset value) versus a return of 13.32% for the S&P 500 Index and gain of 11.28% for the BofA Merrill Lynch All U.S. Convertibles ex-Mandatory Index.
We manage this Fund with the goal of achieving upside equity participation and potential downside protection over full market cycles. Since its inception on September 22, 1988, the Fund returned 10.96% on an annualized basis (Class A shares at net asset value) versus a 10.32% gain for the S&P 500 Index and a 9.36% return for the BofA Merrill Lynch All U.S. Convertibles ex-Mandatory Index.
Please discuss the Fund’s lower-volatility characteristics.
We believe the Fund’s historical lower-volatility characteristics are a by-product of our investment style and focus on participating in equity market upside with less volatility than the market as a whole. Beta is one popular statistic for measuring volatility. Beta considers a fund’s historic volatility versus the market, which is assigned a beta of 1.0. A fund with half the volatility of the market would have a beta of 0.5, while a fund with a beta of 2.0 would have been twice as volatile as the market.
Since its inception, the Fund has had a beta of 0.72 (Class A shares) versus the S&P 500 Index. The Fund has therefore outperformed the broader equity market, as measured by the S&P 500 Index, with less volatility than the equity market. Please note that past performance does not indicate future results and that beta is one of many measures of risk.
What factors influenced performance?
The U.S. equity market rallied strongly during the six-month period on the heels of the election results. Both before and after the election, President Trump discussed plans to reduce regulations, overhaul health care, decrease taxes, re-patriate overseas cash holdings and spur further infrastructure projects. Consequently, many referred to the market’s rally as the “Trump Trade.”
The initial success of stocks associated with businesses that stood to gain from President Trump’s proposed initiatives corroborated the idea of the “Trump Trade.” However, save for a brief sell-off in the beginning of November, the market had actually started to rally ahead of the U.S. election. Perhaps the U.S. equity market rally was more indicative of improving economic conditions overall, reflected in positive trends in employment, consumer confidence, and housing data, to name a few. Toward the latter stages of the reporting period, the market rotated away from the “Trump Trade” while still moving higher and providing strong returns for investors.
In this environment, the Fund managed to protect assets during the market’s decline in early November, but lagged the equity market’s strong gains when value-oriented stocks and deep-cyclical stocks led the way. As the market leadership rotated away from the value and cyclical plays at the end of February, the Fund was able to outperform the equity benchmark.
In terms of economic sectors, the Fund’s allocation of investments was a slight drag on relative performance. An overweight to consumer discretionary and an underweight to
OVERVIEW
The fund invests primarily in U.S. equity and convertible securities in an attempt to balance risk/reward while providing growth and income.
KEY FEATURES
| | ◾ | | Leverages more than three decades of research experience combining equities and convertible holdings to provide equity-like participation | |
| | ◾ | | Provides a core holding option that aims to maintain a consistent risk posture throughout the market cycle | |
| | ◾ | | Research-driven approach identifies opportunities by combining top-down analysis with a focus on key growth characteristics | |
PORTFOLIO FIT
The fund can provide a long-term core equity allocation with the potential for lower volatility.
| | |
| FUND NASDAQ SYMBOLS |
A Shares | | CVTRX |
B Shares | | CVTYX |
C Shares | | CVTCX |
I Shares | | CGIIX |
R Shares | | CGNRX |
T Shares | | CVTTX |
|
| FUND CUSIP NUMBERS |
A Shares | | 128119104 |
B Shares | | 128119765 |
C Shares | | 128119831 |
I Shares | | 128119872 |
R Shares | | 128119336 |
T Shares | | 128120565 |
Calamos Growth and Income Fund
| | | | |
| SECTOR WEIGHTINGS | |
Information Technology | | | 21.5 | % |
Consumer Discretionary | | | 17.4 | |
Financials | | | 11.2 | |
Health Care | | | 11.0 | |
Industrials | | | 10.3 | |
Consumer Staples | | | 8.5 | |
Energy | | | 6.3 | |
Utilities | | | 3.5 | |
Real Estate | | | 2.9 | |
Telecommunication Services | | | 2.3 | |
Materials | | | 1.9 | |
Other | | | 0.3 | |
Sector weightings are subject to change daily and are calculated as a percentage of net assets. The table excludes cash or cash equivalents, any government/sovereign bonds or broad-based index hedging securities the Fund may hold.
the perceived safety of consumer staples were beneficial to relative performance, but an underweight to the resurgent financials sector and an overweight to information technology were negatives.
Selection amongst individual holdings proved disappointing during the period, as the Fund’s focus on lower volatility and risk management was less valuable during a quickly rising equity market. Stocks with lower-quality ratings as measured by Standard & Poor’s methodology outperformed, indicating investor willingness to embrace risk during the period. In the Internet and direct marketing retail space as well as in the cable and satellite space of consumer discretionary, portfolio holdings in convertible securities and the avoidance of certain speculative names hindered relative performance. Similarly, within information technology, the use of convertibles and lack of ownership in speculative securities weighed on results in semiconductors and application software.
Please describe the Fund’s participation in up- and down-markets since its inception.
The Fund invests in a combination of stocks, convertible securities and bonds to offer a total-return-oriented investment that seeks to consistently balance risk and reward through full market cycles. As we focus on managing volatility, we strive to participate in a greater portion of equity market upside than downside.
There are a variety of ways to express up-market and down-market capture, whether it is calculated daily, monthly, quarterly, or as we look at the markets—in longer-term trends. In the chart below, you can see how the Fund performed through distinct market periods. In the five major market periods shown, the Fund has generally participated in the upside movements of the equity market while limiting the downside exposure during times of tumult.
| | | | |
| 28 | | CALAMOS OPEN-END FAMILY OF FUNDS SEMIANNUAL REPORT | | |
Calamos Growth and Income Fund
MANAGING RISK OVER MARKET CYCLES
The Growth and Income Fund historically has captured a significant amount of upside during bull markets and limited losses when markets have plunged.
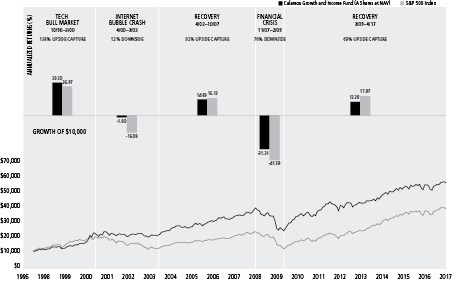
Performance data quoted represents past performance, which is no guarantee of future results. Current performance may be lower or higher than the performance quoted. The principal value and return of an investment will fluctuate so that your shares, when redeemed, may be worth more or less than their original cost. Performance reflected at NAV does not include the Fund’s maximum front-end sales load of 4.75%. Had it been included, the Fund’s return would have been lower. For the most recent fund performance information visit www.calamos.com.
There is no assurance that the fund will achieve or maintain its investment objective. Results are before taxes on fund distributions and assume reinvestments of dividends and capital gains.
How is the Fund positioned?
We continue to position the portfolio with the goal of participating in the U.S. equity market’s upside, while providing resilience during periods of market declines and downside volatility. We believe that actively managing equity market risks through blending equity and convertible securities allows us to construct a portfolio that can provide equity-like returns with significantly less volatility and equity beta over full market cycles.
The Fund is broadly diversified with holdings in each of the eleven GICS sectors. The portfolio is overweight the consumer discretionary sector, favoring businesses with strong franchises where consumer spending should revitalize despite a recent slowdown. The Fund is also marginally overweight the industrial sector, which could stand to gain with accelerating economic growth. The Fund is underweight the financials and health care sectors. Within financials, the Fund own shares in diversified banks and asset managers, but is underweight insurance and consumer finance. Health care remains an underweight as the politics around health care has created additional risks and higher costs. These factors have dampened our enthusiasm for the sector, but the Fund still holds shares in many pharmaceutical and managed health care securities.
Calamos Growth and Income Fund
We remain cognizant of valuations for the overall market and within the portfolio. We reduce exposure to more expensive names when given the opportunity.
What closing thoughts do you have for Fund shareholders?
We are constructive on the U.S. equity market given our view that the U.S. economy appears positioned for measured expansion with growth picking up steam as the year progresses. The equity market’s gains do not appear overly enthusiastic in our view, because they are underpinned by stronger earnings and sales growth, which the market hasn’t seen in many years. We also believe that the potent mix of potential tax reform and less regulation has yet to be fully priced into U.S. equities, offering further support for the U.S. equity market. In that sense, the “Trump Trade” may not be over and the Fund has accordingly increased cyclical growth opportunities while maintaining investments in higher, secular growth businesses. Many investors have concerns about the length of the economic recovery and overall valuations for U.S. equities. We see the Fund as an attractive way to help manage those concerns as blending common stocks with convertibles may allow for varying equity exposures, while any resurgence in volatility may prove supportive to the convertible holdings.
ANNUALIZED RETURN: SINCE INCEPTION (9/22/88) THROUGH 4/30/17
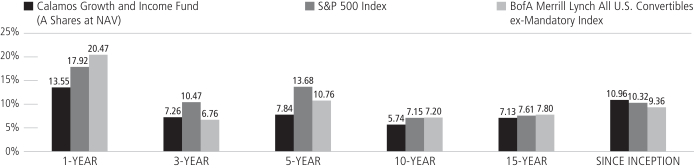
Performance data quoted represents past performance, which is no guarantee of future results. Current performance may be lower or higher than the performance quoted.
The principal value and investment return of an investment will fluctuate so that your shares, when redeemed, may be worth more or less than their original cost. You can obtain performance data current to the most recent month end by visiting www.calamos.com. Average annual total return measures net investment income and capital gain or loss from portfolio investments as an annualized average. All performance shown assumes reinvestment of dividends and capital gains distributions. Performance is for the Fund’s Class A shares at net asset value and does not include the Fund’s maximum front-end sales charge of 4.75%. Had it been included, the Fund’s return would have been lower. The Fund also offers Class B, Class C, Class I and R shares, the performance of which may vary. Source: State Street Corporation and Lipper, Inc.
| | | | |
| 30 | | CALAMOS OPEN-END FAMILY OF FUNDS SEMIANNUAL REPORT | | |
Calamos Growth and Income Fund
GROWTH OF $10,000: FOR 10-YEAR PERIOD ENDED 4/30/17
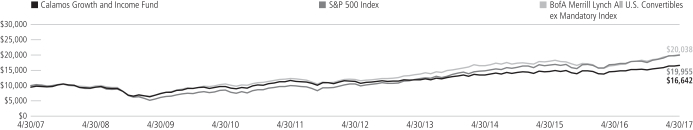
AVERAGE ANNUAL TOTAL RETURN† AS OF 4/30/17
| | | | | | | | | | | | | | | | | | | | |
| | | 6
MONTHS | | 1
YEAR | | 5
YEARS | | 10 YEARS
OR ^SINCE
INCEPTION |
Class A Shares – Inception 9/22/88 | | | | | | | | | | | | | | | | | | | | |
Without Sales Charge | | | | 9.78 | % | | | | 13.55 | % | | | | 7.84 | % | | | | 5.74 | % |
With Sales Charge | | | | 4.58 | | | | | 8.14 | | | | | 6.79 | | | | | 5.23 | |
Class B Shares – Inception 9/11/00 | | | | | | | | | | | | | | | | | | | | |
Without Sales Charge | | | | 9.33 | | | | | 12.64 | | | | | 7.25 | | | | | 5.22 | |
With Sales Charge | | | | 4.33 | | | | | 7.64 | | | | | 6.94 | | | | | 5.22 | |
Class C Shares – Inception 8/5/96 | | | | | | | | | | | | | | | | | | | | |
Without Sales Charge | | | | 9.39 | | | | | 12.69 | | | | | 7.01 | | | | | 4.94 | |
With Sales Charge | | | | 8.39 | | | | | 11.69 | | | | | 7.01 | | | | | 4.94 | |
Class I Shares – Inception 9/18/97 | | | | 9.95 | | | | | 13.82 | | | | | 8.10 | | | | | 6.00 | |
Class R Shares – Inception 3/1/07 | | | | 9.69 | | | | | 13.30 | | | | | 7.58 | | | | | 5.48 | |
Class T Shares – Inception 2/28/17 | | | | | | | | | | | | | | | | | | | | |
Without Sales Charge | | | | | | | | | | | | | | | | | | | 1.19 | ^ |
With Sales Charge | | | | | | | | | | | | | | | | | | | -1.36 | ^ |
Performance data quoted represents past performance, which is no guarantee of future results. Current performance may be lower or higher than the performance quoted. The principal value and investment return of an investment will fluctuate so that your shares, when redeemed, may be worth more or less than their original cost.
As of the prospectus dated 2/28/17, the Fund’s gross expense ratio for Class A shares is 1.12%; Class B and C shares is 1.87%; Class I shares is 0.87%; Class R shares is 1.37%; Class T shares is 1.12%. The expense ratios shown above may differ from the more recent expense ratios reported in the Financial Highlights section of this report.
| † | Average annual total return measures net investment income and capital gain or loss from portfolio investments as an annualized average assuming reinvestment of dividends and capital gains distributions. Load-adjusted returns are adjusted for the maximum front-end sales load of 4.75% for Class A shares and returns for Class B and C shares have been adjusted for the contingent deferred sales charge (CDSC). |
NOTES:
The graphs do not reflect the income taxes that you would pay on fund distributions or the redemption of fund shares. Fund performance includes reinvestment of dividends and adjustment for the maximum sales charge for Class A shares. The performance of other classes will vary from the performance of the class shown based on the difference in sales charges and fees paid by shareholders investing in different share classes.
The S&P 500 Index is an unmanaged index generally considered representative of the U.S. stock market. Source: Lipper, Inc.
The BofA Merrill Lynch All U.S. Convertibles ex-Mandatory Index represents the U.S. convertibles securities market excluding mandatory convertibles. Index data shown for the Annualized Return Since Inception graph is from 9/30/88, since comparative index data is only available for full monthly periods. Source: Lipper, Inc.
Index returns assume reinvestment of dividends and do not reflect deduction of fees and expenses. It is not possible to invest directly in an index.
Calamos Global Growth and Income Fund
OVERVIEW
The fund invests primarily in global equity and convertible securities in an attempt to balance risk/reward while providing growth and income.
KEY FEATURES
| | ◾ | | Combines equity and convertible holdings in order to limit downside risk while potentially capturing upside equity participation | |
| | ◾ | | Provides a core holding option that seeks to maintain a consistent risk posture throughout the market cycle | |
| | ◾ | | Seeks to participate in the upside movements of the global equity market while lessening the impact of down periods | |
PORTFOLIO FIT
The fund can provide a long-term, global-equity core allocation with the potential for lower volatility over a full market cycle.
| | |
| FUND NASDAQ SYMBOLS |
A Shares | | CVLOX |
B Shares | | CVLDX |
C Shares | | CVLCX |
I Shares | | CGCIX |
R Shares | | CVLRX |
T Shares | | CVLTX |
|
| FUND CUSIP NUMBERS |
A Shares | | 128119500 |
B Shares | | 128119732 |
C Shares | | 128119708 |
I Shares | | 128119609 |
R Shares | | 128119385 |
T Shares | | 128120557 |
CALAMOS GLOBAL GROWTH AND INCOME FUND
INVESTMENT TEAM DISCUSSION
How has the Fund performed?
For the six-month period ended April 30, 2017, Calamos Global Growth and Income Fund returned 6.97% (Class A shares at net asset value), versus a 12.06% return for the MSCI ACWI Index and 12.44% gain for the MSCI World Index.
Supported by positive investor sentiment and encouraging economic data, global equity markets advanced during the first quarter of 2017. We positioned the Fund to capture a majority of the global equity market upside over full market cycles, paying keen attention to mitigating downside risk. While we believe that our focus on potential downside protection can provide compelling advantages in a dynamic market environment, this approach hampered returns during this period as equities experienced a broad and brisk advance.
What factors influenced performance?
Our initial skepticism over the sustainability of the global recovery led us to generally position the Fund for a low-growth environment in the early days of the six-month period. The Fund’s tilt toward higher growth and quality detracted from performance versus the index as more cyclical companies outperformed on a wave of optimism for improving global growth. Following the U.S. election, increasing evidence of a more synchronized global expansion made us more comfortable with a reflationary scenario. Consequently, we took steps to increase the equity sensitivity in the Fund and make additional investments in cyclical and interest-rate sensitive businesses in financials, industrials, and select resource-related businesses.
The Fund’s holdings in the consumer discretionary sector negatively affected performance in the period. Specifically, holdings in the cable and satellite industry trailed those in the index because of slowing growth fundamentals. We hold an overweight position in the consumer sector and own companies in diversified categories across industries, including Internet retail, apparel and accessories, automotive, and homebuilding.
The Fund’s underweight position and security selection in financials also hampered return in the period. In particular, holdings in the asset management and custody banks industry underperformed those in the index. We increased weight in financials during the period, adding holdings positioned to benefit from improving credit quality, increased lending activity, and the potential for higher interest rates.
The Fund’s underweight position and better selection in consumer staples contributed the most to performance in the period. In particular, holdings in the packaged foods and personal products industries performed well. Within the sector, we own a set of global leaders with long-term growth potential and attractive cash flow characteristics across multiple consumer categories.
The Fund’s holdings in telecom services also contributed to returns. Specifically, holdings in the wireless telecom services industry outperformed those in the index. We continue to seek select growth opportunities in this traditionally defensive sector, including companies that offer significant addressable markets and revenue growth potential.
| | | | |
| 32 | | CALAMOS OPEN-END FAMILY OF FUNDS SEMIANNUAL REPORT | | |
Calamos Global Growth and Income Fund
From a geographic perspective, the Fund’s country positioning was relatively neutral in terms of performance versus the index, while selection within countries held back overall return. In particular, the Fund’s selection in Germany and the U.S. trailed the index, while the Fund’s overweight position and strong selection in India, Singapore and South Korea added the most value in the period.
Please describe the Fund’s participation in up- and down-markets since its inception.
The Fund invests in a combination of stocks, convertible securities and bonds to offer a total return-oriented portfolio that seeks to consistently balance risk and reward through full market cycles. As we focus on managing volatility, we strive to participate in a greater portion of equity market upside than downside.
There are a variety of ways to express up- and down-market capture, whether it is calculated daily, monthly, quarterly, or as we look at the markets—in longer-term up- and down-market trends. In the chart below, you can see how the Fund performed through a few distinct market periods. In the five major market periods shown, we believe that the Fund has participated in the upside movements of the equity market while limiting the downside exposure over times of tumult.
| | | | |
| SECTOR WEIGHTINGS | |
Information Technology | | | 23.4 | % |
Consumer Discretionary | | | 15.8 | |
Financials | | | 15.2 | |
Industrials | | | 11.8 | |
Health Care | | | 9.8 | |
Consumer Staples | | | 6.7 | |
Energy | | | 5.8 | |
Telecommunication Services | | | 5.6 | |
Materials | | | 2.9 | |
Real Estate | | | 1.1 | |
Utilities | | | 0.9 | |
Other | | | 0.1 | |
Sector weightings are subject to change daily and are calculated as a percentage of net assets. The table excludes cash or cash equivalents, any government/sovereign bonds or broad-based index hedging securities the Fund may hold.
MANAGING RISK OVER MARKET CYCLES
The Global Growth and Income Fund historically has captured a significant amount of upside during bull markets and limited losses when global markets have plunged.
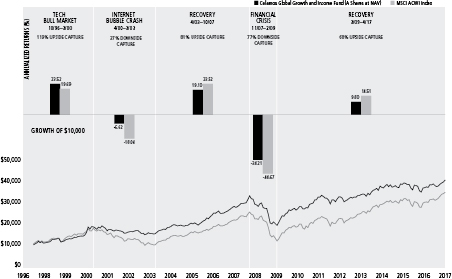
Performance data quoted represents past performance, which is no guarantee of future results. Current performance may be lower or higher than the performance quoted. The principal value and return of an investment will fluctuate so that your shares, when redeemed, may be worth more or less than their original cost. Performance reflected at NAV does not include the Fund’s maximum front-end sales load of 4.75%. Had it been included, the Fund’s return would have been lower. For the most recent fund performance information visit www.calamos.com.
There is no assurance that the fund will achieve or maintain its investment objective. Results are before taxes on fund distributions and assume reinvestment of dividends and capital gains.
Calamos Global Growth and Income Fund
How is the Fund positioned?
Our regional and country positioning reflects the combined inputs from our top-down global framework and our bottom-up security analysis. Our investment team continually evaluates macroeconomic factors and growth opportunities, then actively integrates them into investment decision making.
From a geographic perspective, we have a relatively neutral stance in the U.S. reflecting our view of higher relative valuations balanced against strong fundamentals. We own a combination of holdings in core and secular growth areas in addition to more cyclical opportunities.
We are moderately overweight opportunities in Europe, which reflects our view of improving economic data, reasonable valuations, favorable liquidity and upside in corporate margins. We own select multinationals domiciled in Europe that place a greater emphasis on increased global revenue exposure.
We have a positive view and select overweight in emerging markets. On a regional basis, the Fund’s largest weight is in Emerging Asia, which represents a combination of top-down view and bottom-up selection opportunities. The outlook for earnings growth is strong, and emerging markets are poised to benefit from the stabilization in many currencies and commodities, as well as from a pickup in global demand.
The Fund is modestly underweight to Japan, based on our mixed view of economic and corporate fundamentals. Japan’s macroeconomic fundamentals remain lackluster despite continued monetary accommodation. Valuations are attractive but some companies lack upside catalysts. Therefore, we favor exporters benefiting from the improvement in global growth.
From a sector perspective, we positioned the Fund with an emphasis on opportunities in information technology, consumer discretionary, industrials, health care and financials. We view the valuations of global companies as reasonable by historic standards and have positioned the portfolio accordingly with a combination of core and secular growth companies, in addition to more cyclical opportunities.
What closing thoughts do you have for Fund shareholders?
Recent economic data and corporate earnings point to a synchronized pickup in global growth across all regions. Accommodative monetary policy overall and a pivot toward fiscal stimulus supports global activity, and we see continued opportunities in global equities, offering good fundamentals and valuations. In terms of broad positioning, we favor a blend of investments in secular and core growth companies, in addition to economically sensitive cyclical businesses. We see significant opportunities in companies with earnings growth catalysts, solid cash flow generation and improving-to-strong balance sheets. From a thematic and sector perspective, we see opportunities in the information technology sector, in consumer companies with targeted areas of demand, and more cyclical companies in the industrials, financials and energy sectors that feature improving fundamentals and catalysts. We believe our active, risk-managed investment approach enables us to take advantage of the volatility and opportunities in global equities and convertible securities.
| | | | |
| 34 | | CALAMOS OPEN-END FAMILY OF FUNDS SEMIANNUAL REPORT | | |
Calamos Global Growth and Income Fund
ANNUALIZED RETURN: SINCE INCEPTION (9/9/96) THROUGH 4/30/17
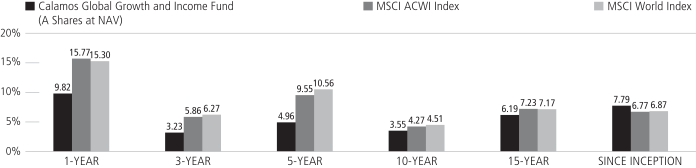
Performance data quoted represents past performance, which is no guarantee of future results. Current performance may be lower or higher than the performance quoted.
The principal value and investment return of an investment will fluctuate so that your shares, when redeemed, may be worth more or less than their original cost. You can obtain performance data current to the most recent month end by visiting www.calamos.com. Average annual total return measures net investment income and capital gain or loss from portfolio investments as an annualized average. All performance shown assumes reinvestment of dividends and capital gains distributions. Performance is for the Fund’s Class A shares at net asset value and does not include the Fund’s maximum front-end sales charge of 4.75%. Had it been included, the Fund’s return would have been lower. The Fund also offers Class B, Class C, Class I and Class R shares, the performance of which may vary. Source: State Street Corporation and Lipper, Inc.
Calamos Global Growth and Income Fund
GROWTH OF $10,000: FOR THE 10-YEAR PERIOD ENDED 4/30/17
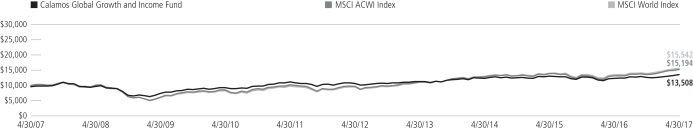
AVERAGE ANNUAL TOTAL RETURN† AS OF 4/30/17
| | | | | | | | | | | | | | | | | | | | |
| | | 6
MONTHS | | 1
YEAR | | 5
YEARS | | 10 YEARS
OR ^SINCE
INCEPTION |
Class A Shares – Inception 9/9/96 | | | | | | | | | | | | | | | | | | | | |
Without Sales Charge | | | | 6.97 | % | | | | 9.82 | % | | | | 4.96 | % | | | | 3.55 | % |
With Sales Charge | | | | 1.92 | | | | | 4.63 | | | | | 3.95 | | | | | 3.05 | |
Class B Shares – Inception 9/11/00 | | | | | | | | | | | | | | | | | | | | |
Without Sales Charge | | | | 6.69 | | | | | 8.99 | | | | | 4.18 | | | | | 2.93 | |
With Sales Charge | | | | 1.69 | | | | | 3.99 | | | | | 3.90 | | | | | 2.93 | |
Class C Shares – Inception 9/24/96 | | | | | | | | | | | | | | | | | | | | |
Without Sales Charge | | | | 6.66 | | | | | 8.94 | | | | | 4.15 | | | | | 2.78 | |
With Sales Charge | | | | 5.66 | | | | | 7.94 | | | | | 4.15 | | | | | 2.78 | |
Class I Shares – Inception 9/18/97 | | | | 7.26 | | | | | 10.17 | | | | | 5.23 | | | | | 3.81 | |
Class R Shares – Inception 3/1/07 | | | | 6.95 | | | | | 9.58 | | | | | 4.70 | | | | | 3.31 | |
Class T Shares – Inception 2/28/17 | | | | | | | | | | | | | | | | | | | | |
Without Sales Charge | | | | | | | | | | | | | | | | | | | 3.21 | ^ |
With Sales Charge | | | | | | | | | | | | | | | | | | | 0.67 | ^ |
Performance data quoted represents past performance, which is no guarantee of future results. Current performance may be lower or higher than the performance quoted. The principal value and investment return of an investment will fluctuate so that your shares, when redeemed, may be worth more or less than their original cost.
As of the prospectus dated 2/28/17, the Fund’s gross expense ratio for Class A shares is 1.46%; Class B is 2.22% and C shares is 2.21%; Class I shares is 1.21%; Class R shares is 1.71%; Class T shares is 1.46%. The expense ratios shown above may differ from the more recent expense ratios reported in the Financial Highlights section of this report.
| † | Average annual total return measures net investment income and capital gain or loss from portfolio investments as an annualized average assuming reinvestment of dividends and capital gains distributions. Performance shown reflects the effects of an expense reimbursement that improved results and was in effect until March 31, 2003. Load-adjusted returns are adjusted for the maximum front-end sales load of 4.75% for Class A shares and returns for Class B and C shares have been adjusted for the contingent deferred sales charge (CDSC). |
NOTES:
The graphs do not reflect the income taxes that you would pay on fund distributions or the redemption of fund shares. Fund performance includes reinvestment of dividends and adjustment for the maximum sales charge for Class A shares. The performance of other classes will vary from the performance of the class shown based on the difference in sales charges and fees paid by shareholders investing in different share classes.
The MSCI ACWI Index is a free float-adjusted market capitalization weighted index that is designed to measure the equity market performance of developed and emerging markets.
The MSCI World Index (U.S. Dollars) is a market-capitalization weighted index composed of companies representative of the market structure of developed market countries in North America, Europe and the Asia/Pacific region. Since inception data for the index is shown from 9/30/96 since data is only available for full monthly periods. Source: Lipper, Inc.
Index returns assume reinvestment of dividends and do not reflect deduction of fees and expenses. It is not possible to invest directly in an index.
The Fund’s use of derivative instruments involves investment risks and transaction costs to which the Fund would not be subject absent the use of these instruments and, accordingly, may result in losses greater than if they had not been used. Derivative instruments can be illiquid, may disproportionately increase losses and may have a potentially large impact on Fund performance.
| | | | |
| 36 | | CALAMOS OPEN-END FAMILY OF FUNDS SEMIANNUAL REPORT | | |
Calamos Convertible Fund
CALAMOS CONVERTIBLE FUND
INVESTMENT TEAM DISCUSSION
How has the Fund performed?
For the six-month period ended April 30, 2017, the Fund returned 8.88% (Class A shares at net asset value) versus the BofA Merrill Lynch All U.S. Convertibles Index increase of 10.52%. For the same period, the Value Line Convertible Index rose 9.21% and the S&P 500 Index gained 13.32%.
Since its inception on June 21, 1985, the Fund returned 8.93% on an annualized basis (Class A shares at net asset value), compared with a gain of 8.75% for the Value Line Convertible Index and 10.78% for the S&P 500 Index.*
Please discuss the Fund’s lower-volatility characteristics.
We believe the Fund’s historical lower-volatility characteristics are a by-product of our investment style and we focus on participating in equity market upside with less volatility than the market as a whole. Beta is one popular statistic for measuring volatility. Beta considers a fund’s historic volatility versus a market index, which is assigned a beta of 1.0. A fund with half the volatility of the benchmark index has a beta of 0.5, while a fund with a beta of 2.0 is twice as volatile as the market. Since its inception, the Fund had a beta of 0.74 (Class A shares) versus the S&P 500 Index. The Fund has therefore experienced 83% of the gain of the broader equity market, as measured by the S&P 500 Index, with less volatility. Please note that past performance does not indicate future results and that beta is one of many measures of risk.
What factors influenced performance?
After a largely unexpected election victory by Donald Trump, the convertible and equity markets rallied during the six-month reporting period. Investors were initially encouraged by the belief that a Trump presidency would provide favorable tailwinds, including tax reform, reduced regulation, and increased infrastructure spending. Investor sentiment also became more bullish in response to improved economic data and higher corporate earnings.
Interest rates moved higher during the period as the Federal Reserve hiked its Fed Funds rate twice during the period to 1.0%. The 3-Year U.S. Treasury Yield increased from 1.00% to 1.45%, while the 5-Year U.S. Treasury Yield moved from 1.31% to 1.81%, and the 10-year U.S. Treasury Yield climbed from 1.84% to 2.29%. After the 10-year U.S. Treasury Yield reached its bottom of 1.37% on July 8, 2016, the Bloomberg Barclays U.S. Government/Credit index declined -2.49% through April 30, 2017. This contrasted sharply with the positive 14.41% return of the BofA Merrill Lynch All U.S. Convertibles Index over the same period.
High yield credit spreads narrowed during the period, with JPMorgan reporting spreads contracting 105 basis points to 445 basis points above Treasurys. Narrower spreads were supportive to the largely below investment grade convertible market and especially to convertibles with CCC implied credit ratings. Consistent with our investment process, the Fund was relatively underweight to these weak credit names.
| * | The BofA Merrill Lynch All U.S. Convertibles Index start date was December 31, 1987. |
OVERVIEW
The fund invests primarily in convertible securities of U.S. companies that are diversified across market sector and credit quality.
KEY FEATURES
| | ◾ | | Leverages more than three decades of research and experience in convertible security investing | |
| | ◾ | | Provides diversification across market sectors and credit quality, emphasizing midsize companies with higher-quality balance sheets | |
| | ◾ | | Seeks to provide upside participation in equity markets with less exposure to downside than an equity-only portfolio over a full market cycle | |
PORTFOLIO FIT
When used in conjunction with an equity allocation, the fund offers a way potentially to manage risk by employing securities that engage in upside equity movements with limited downside participation.
| | |
| FUND NASDAQ SYMBOLS |
A Shares | | CCVIX |
B Shares | | CALBX |
C Shares | | CCVCX |
I Shares | | CICVX |
R Shares | | CCVRX |
T Shares | | CCVTX |
|
| FUND CUSIP NUMBERS |
A Shares | | 128119401 |
B Shares | | 128119773 |
C Shares | | 128119823 |
I Shares | | 128119864 |
R Shares | | 128119369 |
T Shares | | 128120540 |
Calamos Convertible Fund
| | | | |
| SECTOR WEIGHTINGS | |
Information Technology | | | 31.8 | % |
Consumer Discretionary | | | 19.5 | |
Health Care | | | 14.5 | |
Financials | | | 7.1 | |
Industrials | | | 6.1 | |
Real Estate | | | 5.4 | |
Energy | | | 5.2 | |
Utilities | | | 2.9 | |
Materials | | | 2.1 | |
Telecommunication Services | | | 1.8 | |
Other | | | 0.1 | |
| | | | | |
Sector weightings are subject to change daily and are calculated as a percentage of net assets. The table excludes cash or cash equivalents, any government/sovereign bonds or broad-based index hedging securities the Fund may hold.
During the period, the environment was favorable to the most equity-sensitive convertibles, which represented roughly 35% of the market on average during the reporting window. Convertibles with the most equity sensitivity were up 21.32%, as represented by the U.S. CV Index (VEQU), and strongly outperformed those with balanced risk/reward attributes (+9.53%), as represented by the U.S. CV Index (VTOT), and those with the most credit sensitivity (+6.44%), as represented by the U.S. CV Index (VYLD). Consistent with our investment approach, we were underweight to the most equity sensitive convertibles in favor of those with balanced risk/reward attributes.
An underweight position and selection in health care held back the result. Notably, portfolio holdings in the biotechnology and managed health care industries underperformed. An underweight position and selection within the energy sector also held back the semiannual result, as the portfolio holdings in both the oil and gas exploration and production and the oil and gas drilling industries lagged.
Conversely, security selection in the telecom services sector added value during the period. Specifically, portfolio holdings in the integrated telecommunication services industry outperformed the index. Security selection within the industrials sector also supported the semiannual return. In particular, selection within both the construction and engineering and the construction machinery and heavy trucks industries outperformed.
Please describe the Fund’s participation in up- and down-markets since its inception.
Convertible securities combine characteristics of stocks and fixed income securities. Like stocks, convertibles typically offer potential upside participation in rising equity markets. Like bonds, convertible securities may provide income and potential downside protection in declining equity markets. There are a variety of ways to express up-market and down-market capture, whether it is monthly, quarterly, or as we look at the markets—in longer-term up- and down-market trends. In the chart below, you can see how the Convertible Fund performs compared to the U.S. equity and convertible markets through the distinct market periods over the past 20 years. In the five major market periods shown, we believe that the Fund has participated in the upside movements of the equity market while limiting the downside exposure during times of tumult.
| | | | |
| 38 | | CALAMOS OPEN-END FAMILY OF FUNDS SEMIANNUAL REPORT | | |
Calamos Convertible Fund
MANAGING RISK OVER MARKET CYCLES
Over the last 20 years, the Convertible Fund historically has captured a significant amount of upside during bull markets and limited losses when markets have plunged.
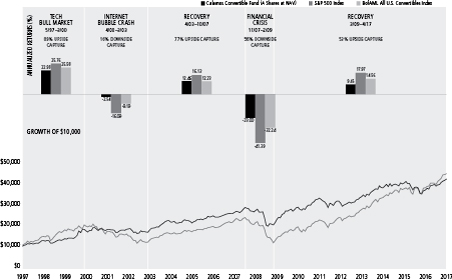
Performance data quoted represents past performance, which is no guarantee of future results. Current performance may be lower or higher than the performance quoted. The principal value and return of an investment will fluctuate so that your shares, when redeemed, may be worth more or less than their original cost. Performance reflected at NAV does not include the Fund’s maximum front-end sales load of 2.25%.* Had it been included, the Fund’s return would have been lower. For the most recent fund performance information visit www.calamos.com.
There is no assurance that the fund will achieve or maintain its investment objective. Results are before taxes on fund distributions and assume reinvestment of dividend and capital gains.
| | * | Prior to 2/28/17, the Fund had a maximum front-end sales charge of 4.75%. |
How is the Fund positioned?
Our positioning places an emphasis on the more balanced structures within the convertible market, which we believe enables us to protect on a downside equity move yet still participate in any upside. Within the more credit-sensitive structures, we favor higher quality balance sheets and companies we believe stand to improve their credit profiles. Within the equity sensitive structures, we are also highly mindful of valuation criteria. We seek companies with strong balance sheets that generate above-average organic growth.
The largest allocation in the portfolio went toward information technology, as we see opportunities within both secular and cyclical themes such as cloud computing, the expansion of semiconductors in multiple-end markets, the exponential growth of data, and upcoming product cycles. The information technology sector may also benefit from potential fiscal stimulus efforts and tax reform. The second-largest area and largest relative overweight is in consumer discretionary, where our selections have been largely bottom-up driven within the media and auto industries. The largest relative underweight is in financials, REITs, utilities and consumer staples, as these represent largely defensive sectors or sectors possessing a high number of unfavorable convertibles.
Calamos Convertible Fund
What closing thoughts do you have for Fund shareholders?
We are constructive on the equity and convertible markets given our view that the U.S. economy appears positioned for measured expansion with growth picking up steam as the year progresses. We also believe that the potent mix of tax reform and reduced regulation has yet to be priced fully into U.S. equities—a mix that will provide a further catalyst for the U.S. convertible market. Even so, the lack of certainty surrounding the timing of implementation of U.S. fiscal policy and ongoing geopolitical issues are likely to be sources of volatility going forward. We have positioned the convertible portfolio to participate in equity market advances, while providing a measure of downside protection during potential periods of volatility. We further believe that convertibles are a favored asset class given their strong historical performance in a rising-rate, higher equity market backdrop. Active management in convertibles remains important, given that market changes and new issuance can alter the profile of the convertible market over time. As such, we believe that our actively managed approach will allow us to take advantage of opportunities and maintain an attractive risk/reward profile that will be beneficial over full market cycles.
ANNUALIZED RETURN: SINCE INCEPTION (6/21/85) THROUGH 4/30/17
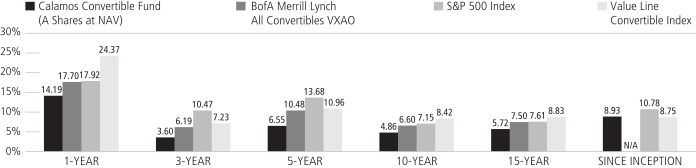
Performance data quoted represents past performance, which is no guarantee of future results. Current performance may be lower or higher than the performance quoted.
The principal value and investment return of an investment will fluctuate so that your shares, when redeemed, may be worth more or less than their original cost. You can obtain performance data current to the most recent month end by visiting www.calamos.com. Average annual total return measures net investment income and capital gain or loss from portfolio investments as an annualized average. All performance shown assumes reinvestment of dividends and capital gains distributions. Performance is for the Fund’s Class A shares at net asset value and does not include the Fund’s maximum front-end sales charge of 2.25%.* Had it been included, the Fund’s return would have been lower. The Fund also offers Class B, Class C, Class I and Class R shares, the performance of which may vary. Source: State Street Corporation, Lipper, Inc., and Mellon Analytical Solutions, LLC.
| * | Prior to 2/28/17, the Fund had a maximum front-end sales charge of 4.75%. |
| | | | |
| 40 | | CALAMOS OPEN-END FAMILY OF FUNDS SEMIANNUAL REPORT | | |
Calamos Convertible Fund
GROWTH OF $10,000: FOR THE 10-YEAR PERIOD ENDED 4/30/17
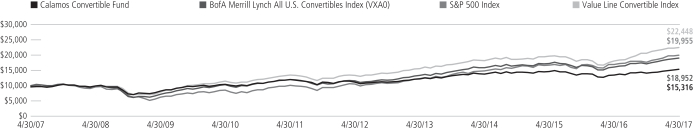
AVERAGE ANNUAL TOTAL RETURN† AS OF 4/30/17
| | | | | | | | | | | | | | | | | | | | |
| | | 6
MONTHS | | 1
YEAR | | 5
YEARS | | 10 YEARS
OR ^SINCE
INCEPTION |
Class A Shares – Inception 6/21/85 | | | | | | | | | | | | | | | | | | | | |
Without Sales Charge | | | | 8.88 | % | | | | 14.19 | % | | | | 6.55 | % | | | | 4.86 | % |
With Sales Charge | | | | 3.73 | | | | | 8.77 | | | | | 5.51 | | | | | 4.36 | |
Class B Shares – Inception 9/11/00 | | | | | | | | | | | | | | | | | | | | |
Without Sales Charge | | | | 8.47 | | | | | 13.32 | | | | | 5.75 | | | | | 4.23 | |
With Sales Charge | | | | 3.47 | | | | | 8.32 | | | | | 5.43 | | | | | 4.23 | |
Class C Shares – Inception 7/5/96 | | | | | | | | | | | | | | | | | | | | |
Without Sales Charge | | | | 8.41 | | | | | 13.31 | | | | | 5.75 | | | | | 4.07 | |
With Sales Charge | | | | 7.41 | | | | | 12.31 | | | | | 5.75 | | | | | 4.07 | |
Class I Shares – Inception 6/25/97 | | | | 9.01 | | | | | 14.44 | | | | | 6.82 | | | | | 5.13 | |
Class R Shares – Inception 3/1/07 | | | | 8.71 | | | | | 13.83 | | | | | 6.28 | | | | | 4.62 | |
Class T Shares – Inception 2/28/17 | | | | | | | | | | | | | | | | | | | | |
Without Sales Charge | | | | | | | | | | | | | | | | | | | 1.93 | ^ |
With Sales Charge | | | | | | | | | | | | | | | | | | | -0.61 | ^ |
Performance data quoted represents past performance, which is no guarantee of future results. Current performance may be lower or higher than the performance quoted. The principal value and investment return of an investment will fluctuate so that your shares, when redeemed, may be worth more or less than their original cost.
As of the prospectus dated 2/28/17, the Fund’s gross expense ratio for Class A shares is 1.15%; Class B and C shares is 1.90%; Class I shares is 0.90%; Class R shares is 1.40%; Class T shares is 1.15%. The expense ratios shown above may differ from the more recent expense ratios reported in the Financial Highlights section of this report.
| † | Average annual total return measures net investment income and capital gain or loss from portfolio investments as an annualized average assuming reinvestment of dividends and capital gains distributions. Load-adjusted returns are adjusted for the maximum front-end sales load of 2.25%* for Class A shares and returns for Class B and C shares have been adjusted for the contingent deferred sales charge (CDSC). * Prior to 2/28/17, the Fund had a maximum front-end sales charge of 4.75%. |
NOTES:
The graphs do not reflect the income of taxes that you would pay on fund distributions or the redemption of fund shares. Fund performance includes reinvestment of dividends and adjustment for the maximum sales charge for Class A shares. The performance of other classes will vary from the performance of the class shown based on the difference in sales charges and fees paid by shareholders investing in different share classes.
The BofA Merrill Lynch All U.S. Convertibles Index is comprised of approximately 700 issues of only convertible bonds and preferreds of all qualities.
The S&P 500 Index is an unmanaged index generally considered representative of the U.S. stock market.
The Value Line Convertible Index is an equally-weighted index of the larger convertibles, representing 90% of the U.S. convertible securities market. Index data shown for the Annualized Returns Since Inception graph is from 6/30/85, since comparative index data is only available for full monthly periods. Source: Mellon Analytical Solutions, LLC.
Due to their structural complexities, the attributes of convertibles may vary. Therefore, they are typically categorized as Yield Alternatives represented by the U.S. CV Index (VYLD), Total Return Alternatives represented by the U.S. CV Index (VTOT), or Equity Alternatives represented by the U.S. CV Index (VEQU).
Index returns assume reinvestment of dividends and do not reflect deduction of fees and expenses. It is not possible to invest directly in an index.
Calamos Global Convertible Fund
OVERVIEW
The fund invests in global convertible securities. It strives to balance risk/reward, while providing growth and income.
KEY FEATURES
| | ◾ | | Provides broadly diversified exposure to the global convertible bond universe | |
| | ◾ | | Leverages more than 30 years of research in convertible security investing | |
| | ◾ | | Seeks to provide upside participation in equity markets with less exposure to downside than an equity-only portfolio over a full market cycle | |
| | ◾ | | Blends global investment themes and fundamental research via active management | |
PORTFOLIO FIT
Consisting of convertible securities that can participate in upside equity movements with potentially limited downside exposure, the fund can provide a means to manage risk in conjunction with an equity allocation. The fund can also serve a role within a fixed income allocation, as convertibles have performed well during periods of rising interest rates and inflation.
| | |
| FUND NASDAQ SYMBOLS |
A Shares | | CAGCX |
C Shares | | CCGCX |
I Shares | | CXGCX |
R Shares | | CRGCX |
T Shares | | CTGCX |
|
| FUND CUSIP NUMBERS |
A Shares | | 128120748 |
C Shares | | 128120730 |
I Shares | | 128120722 |
R Shares | | 128120714 |
T Shares | | 128120474 |
CALAMOS GLOBAL CONVERTIBLE FUND
INVESTMENT TEAM DISCUSSION
How has the Fund performed?
For the six-month period ended April 30, 2017, the Fund returned 7.20% (Class A shares at net asset value) versus the BofA Merrill Lynch Global 300 Convertible Index return of 7.44%. Since its inception on December 31, 2014, the Fund increased 3.59% versus a 6.41% gain by the index.
What factors influenced performance?
The global equity and convertible markets performed strongly as prices reflected generally better global economic data, higher corporate earnings and more bullish investor sentiment. After a largely unexpected victory by President Donald Trump, the convertible and equity markets rallied during the six-month reporting period. Investors were encouraged by the initial belief that a Trump presidency would provide favorable tailwinds including tax reform, reduced regulation, and increased infrastructure spending.
Global interest rates moved higher during the six-month period as illustrated by the -1.63% return of the Bloomberg Barclays Global Aggregate Bond Index. U.S. Interest rates rose after the Federal Reserve hiked its Fed Funds rate twice during the period to 1.0%. The 3-year U.S. Treasury yield increased from 1.00% to 1.45%, while the 5-year U.S. Treasury yield moved from 1.31% to 1.81%). The 10-year U.S. Treasury yield increased from 1.84% to 2.29%. After the 10-year U.S. Treasury yield reached its bottom of 1.37% on July 8, 2016, the Bloomberg Barclays Global Aggregate Bond Index declined 4.2% through April 30, 2017. This contrasted sharply with the positive 11.0% return of the BofA Merrill Lynch Global 300 Convertible Index over the same period.
Global high yield credit spreads narrowed during the period with JPMorgan reporting global spreads contracting 105 basis points to 446 basis points above government securities. Narrower spreads were supportive to the largely below investment grade convertible market and especially to convertibles with CCC implied credit ratings. Consistent with our investment process, the Fund was relatively underweight to these weak credit names.
During the period, the market environment was favorable to the most equity-sensitive convertibles in the market. Convertibles with the most equity sensitivity were up 17.1% and strongly outperformed those with balanced risk/reward attributes (+6.6%) and those with the most credit sensitivity (+3.3%) Our investment approach led us to be underweight the most equity-sensitive convertibles in favor of those with balanced risk/reward attributes.
From an economic sector position, selection in consumer discretionary provided the greatest benefit to return. Holdings in movies and entertainment delivered a nice boost to performance as did our representation in automobile manufacturers. The portfolio’s relative security selection in industrials also contributed to return, notably issue selection in aerospace and defense and in construction machinery and heavy trucks.
Security selection in health care held back performance during the quarter. The portfolio was underweight to the biotechnology industry, which had a solid quarter, and our holdings lagged relative to the benchmark index. Additionally, positions within managed health care underperformed. An overweight to and selection in financials also detracted in the first quarter. The greatest setbacks occurred in asset management and custody
| | | | |
| 42 | | CALAMOS OPEN-END FAMILY OF FUNDS SEMIANNUAL REPORT | | |
Calamos Global Convertible Fund
banks. Optimism waned as it became evident the political process for future policy changes would be difficult—and bank stocks took a hit in March. Even so, we believe the portfolio’s holdings in this sector are positioned to benefit from higher interest rates, improving business fundamentals, and the prospect of reduced regulations.
Security selection in Europe and Japan added value during the reporting period. However, security selection in the United States as well as the Emerging Europe and South Africa and Emerging Asia regions lagged. In terms of currencies, the portfolio’s underweight to the Japanese yen, which weakened relative to the U.S. dollar, helped. An overweight allocation to the euro held back the six-month result.
How is the Fund positioned?
Our positioning has placed an emphasis on the more balanced structures within the convertible market, which we believe enable us to protect on a downside equity move, yet still participate in any upside. Within the more credit-sensitive structures, we favor higher-quality balance sheets and companies that we believe stand to improve their credit profiles. Within the equity-sensitive structures, we are also highly mindful of valuation criteria. We seek companies with strong balance sheets that generate above-average organic growth.
The largest allocation in the portfolio went toward information technology, as we see opportunities within both secular and cyclical themes such as cloud computing, the expansion of semiconductors in multiple end markets, the exponential growth of data and upcoming product cycles. The information technology sector may also benefit from potential fiscal stimulus efforts and tax reform. The second-largest area and largest relative overweight is in consumer discretionary, where our selections have been largely bottom-up driven within the media and auto industries. The portfolio has its lightest allocations in consumer staples, utilities, and materials as these sectors represent a minor portion of the convertible market.
From a geographic perspective relative to the BofA Merrill Lynch Global 300 Convertible Index, the Fund has slightly heavier weightings in the United States and the Emerging Europe and South Africa regions. The portfolio is relatively underweight to Japan and Emerging Asia.
What closing thoughts do you have for Fund shareholders?
We are constructive on the equity and convertible markets given our view that the global economy appears positioned for measured expansion with growth picking up steam. Accommodative monetary policy and a pivot toward fiscal stimulus is also supporting global activity, and we see continued opportunities in global convertibles offering good fundamentals and valuations. We also believe that the potent mix of tax reform and less regulation will provide a catalyst to the U.S. convertible market, which makes up the majority share of the global convertible market. Even so, the uncertainty surrounding the timing of implementation of U.S. fiscal policy is likely to be a source of volatility going forward. Geopolitical issues may also create volatility. We have positioned the convertible portfolio to participate in any further equity market advances while also providing a measure of downside protection during these potential periods of volatility. We further believe that convertibles are a favored asset class given their strong historical performance in a rising rate, higher equity market backdrop. Active management in convertibles remains important given that market changes and new issuance can alter the profile of the convertible market over time. As such, we believe that our actively managed approach will allow us to take advantage of opportunities and maintain an attractive risk/reward profile that will be beneficial over full market cycles.
| | | | |
| SECTOR WEIGHTINGS | |
Information Technology | | | 20.0 | % |
Consumer Discretionary | | | 17.4 | |
Industrials | | | 14.1 | |
Financials | | | 13.7 | |
Health Care | | | 10.6 | |
Real Estate | | | 5.8 | |
Energy | | | 5.4 | |
Telecommunication Services | | | 4.7 | |
Materials | | | 1.5 | |
Utilities | | | 1.5 | |
Other | | | 0.1 | |
| | | | | |
Sector weightings are subject to change daily and are calculated as a percentage of net assets. The table excludes cash or cash equivalents, any government/sovereign bonds or broad-based index hedging securities the Fund may hold.
Calamos Global Convertible Fund
GROWTH OF $10,000: SINCE INCEPTION (12/31/14) THROUGH 4/30/17
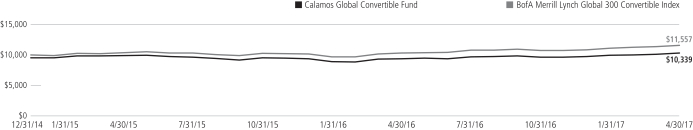
AVERAGE ANNUAL TOTAL RETURN† AS OF 4/30/17
| | | | | | | | | | | | | | | |
| | | 6
MONTHS | | 1
YEAR | | SINCE
INCEPTION |
Class A Shares – Inception 12/31/2014 | | | | | | | | | | | | | | | |
Without Sales Charge | | | | 7.20 | % | | | | 10.09 | % | | | | 3.59 | % |
With Sales Charge | | | | 2.14 | | | | | 4.90 | | | | | 1.44 | |
Class C Shares – Inception 12/31/2014 | | | | | | | | | | | | | | | |
Without Sales Charge | | | | 6.70 | | | | | 9.27 | | | | | 2.81 | |
With Sales Charge | | | | 5.70 | | | | | 8.27 | | | | | 2.81 | |
Class I Shares – Inception 12/31/2014 | | | | 7.20 | | | | | 10.33 | | | | | 3.86 | |
Class R Shares – Inception 12/31/2014 | | | | 6.93 | | | | | 9.75 | | | | | 3.30 | |
Class T Shares – Inception 2/28/2017 | | | | | | | | | | | | | | | |
Without Sales Charge | | | | | | | | | | | | | | 3.31 | |
With Sales Charge | | | | | | | | | | | | | | 0.73 | |
Performance data quoted represents past performance, which is no guarantee of future results. Current performance may be lower or higher than the performance quoted. The principal value and investment return of an investment will fluctuate so that your shares, when redeemed, may be worth more or less than their original cost.
As of the prospectus dated 2/28/17, the Fund’s gross expense ratio for Class A shares is 1.47%; Class C shares is 2.22%; Class I shares is 1.22%; Class R shares is 1.72%; Class T shares is 1.47%. The fund’s investment adviser has contractually agreed to reimburse the fund expenses through March 1, 2019, to the extent necessary so that total annual fund operating expenses (excluding taxes, interest, short interest, short dividend expenses, brokerage commissions, acquired funds fees and expenses and extraordinary expenses, if any) of Class A, Class C, Class I, Class R and Class T shares are limited to 1.36%, 2.11%, 1.11%, 1.60% and 1.36% of average net assets, respectively. The expense ratios shown above may differ from the more recent expense ratios reported in the Financial Highlights section of this report.
| † | Average annual total return measures net investment income and capital gain or loss from portfolio investments as an annualized average assuming reinvestment of dividends and capital gains distributions. Load-adjusted returns are adjusted for the maximum front-end sales load of 2.25%* for Class A shares. Returns for Class C shares have been adjusted for the contingent deferred sales charge (CDSC). *Prior to 2/28/17, the Fund had a maximum front-end sales charge of 4.75%. |
NOTES:
The BofA Merrill Lynch Global 300 Convertible Index is a global convertible index composed of companies representative of the market structure of countries in North America, Europe and the Asia/Pacific region.
Bloomberg Barclays Global Aggregate Bond Index provides a broad-based measure of the global investment grade fixed-rate debt markets. It is comprised of the U.S. Aggregate, Pan-European Aggregate, and the Asian-Pacific Aggregate Indexes. It also includes a wide range of standard and customized subindices by liquidity constraint, sector, quality and maturity.
Unmanaged index returns assume reinvestment of any and all distributions and, unlike fund returns, do not reflect fees, expenses or sales charges. Investors cannot invest directly in an index.
The Fund’s use of derivative instruments involves investment risks and transaction costs to which the Fund would not be subject absent the use of these instruments and, accordingly, may result in losses greater than if they had not been used. Derivative instruments can be illiquid, may disproportionately increase losses and may have a potentially large impact on Fund performance.
| | | | |
| 44 | | CALAMOS OPEN-END FAMILY OF FUNDS SEMIANNUAL REPORT | | |
Calamos Total Return Bond Fund
CALAMOS TOTAL RETURN BOND FUND
INVESTMENT TEAM DISCUSSION
How has the Fund performed?
For the six-month period ended April 30, 2017, Calamos Total Return Bond Fund dipped -0.18% (Class A shares at net asset value) finishing slightly ahead of the -0.67 decline for the Bloomberg Barclays U.S. Aggregate Bond Index.
Since its inception on June 27, 2007, the Fund gained 4.40% on an annualized basis (Class A shares at net asset value) versus a 4.50% return for the Bloomberg Barclays U.S. Aggregate Bond Index.
What factors influenced performance?
Interest rates moved higher during the period as the Federal Reserve increased the Fed Funds rate twice and lifted its target range to between 0.75% and 1.00%. In response, interest rates across the yield curve rose and led to negative price returns on U.S. Treasurys. As shown in the chart below, the 5-year Treasury yield moved from 1.31% to 1.81%, while the 10-year U.S. Treasury yield increased from 1.84% to 2.29%. The 30-year yield climbed from 2.58% to 2.96%.

Source: U.S. Department of Treasury
The Fund outperformed the index and benefited from its underweight allocation to U.S. Treasurys and longer-duration* credits. However, the Fund’s 10+ year duration bonds underperformed their index counterparts during the period, declining -2.36%.
Credit spreads narrowed during the period, which helped Baa-rated credits and corporate bonds offset much of the impact of rising interest rates. Within the index, Baa-rated holdings rose 0.75%, while Aaa, Aa, and A-rated issues posted negative returns of -1.02%, -0.42% and -0.26%, respectively. The corporate bond sector posted a positive result and returned 0.23% during the period. The portfolio benefited from its overweight to corporate bonds and to credits rated Baa or lower.
An overweight allocation to holdings with durations in the 7- to 10-year range slightly held back the period result. The portfolio’s lack of asset-backed pass-through securities also detracted from return.
| * | Duration is useful in measuring a bond fund’s sensitivity to changes in interest rates. The longer the duration, the more a bond fund’s price will fluctuate when interest rates change. |
OVERVIEW
The fund invests in a diversified portfolio of fixed income instruments, seeking total return consistent with capital preservation.
KEY FEATURES
| | ◾ | | Flexible mandate allows us to invest across the fixed income universe with a focus on investment grade credit, high yield credit and U.S. Treasury securities | |
| | ◾ | | Dynamic investment process combines rigorous, fundamental credit research with top-down macro views | |
| | ◾ | | Employs proprietary high yield research to identify securities with the best potential to migrate to investment grade status, ahead of ratings agency upgrades | |
PORTFOLIO FIT
The fund offers broad, diversified exposure to the U.S. investment grade bond market with opportunistic allocation to high yield securities.
| | |
| FUND NASDAQ SYMBOLS |
A Shares | | CTRAX |
B Shares | | CTXBX |
C Shares | | CTRCX |
I Shares | | CTRIX |
R Shares | | CTRRX |
T Shares | | CTRTX |
|
| FUND CUSIP NUMBERS |
A Shares | | 128119310 |
B Shares | | 128119294 |
C Shares | | 128119286 |
I Shares | | 128119278 |
R Shares | | 128119260 |
T Shares | | 128120532 |
Calamos Total Return Bond Fund
| | |
| ASSET ALLOCATION |
Corporate Bonds | | 69.4% |
U.S. Government and Agency Securities | | 26.5 |
Cash and Receivables/Payables | | 3.9 |
Investment of Cash Collateral for Securities Loaned | | 0.2 |
Sector weightings are subject to change daily and are calculated as a percentage of net assets. The table excludes cash or cash equivalents, any government/sovereign bonds or broad-based index hedging securities the Fund may hold.
How is the fund positioned?
The Fund’s duration of 5.37 years is shorter than the 5.89 years duration of the Bloomberg Barclays U.S. Aggregate Bond Index.
Relative to the index, we are overweight to corporate debt as we continue to see favorable risk-adjusted return opportunities in the credit markets. We also have a modest allocation to BB-rated bonds based on fundamentals and valuations. At the same time, corporate bond credit spreads have narrowed substantially, and we increased our allocation to U.S. Treasuries over the period, though we remain underweight. We are likewise underweight mortgages and agencies.
Within the corporate bond allocation, the portfolio has its heaviest weightings in the financials, consumer discretionary, and information technology sectors. Our lightest positioning is found in materials, energy and telecommunication services.
Do you have any closing thoughts for shareholders?
The Federal Reserve’s March Fed Funds rate increase signaled a new dynamic in its relationship with the market. In the recent past, the Fed was extremely sensitive to the market’s response to any hint of a rate increase and repeatedly forestalled rate hikes. With its recent release, the Fed stopped waiting for the markets to get comfortable. Instead, Chair Janet Yellen repeated her intentions, the market listened, and the Fed acted.
We believe that short-term rates are unlikely to move significantly higher, as we believe the economy still needs to improve and is not on the cusp of a breakout. Softer-than-expected GDP growth, slowing credit growth, and less-than-robust capital expenditures are among the indicators that point to a more cautious economic outlook. Additionally, minutes from the March Federal Reserve meeting indicated that the Fed backed a plan that would begin reducing its $4.5 trillion balance sheet. With this backdrop, it is our expectation that short-term rates may settle in the 1.75% to 2.00% range over the next four to five quarters, with two to three more Federal Reserve rate hikes expected over that time. We also expect that long-term rates will be more contained than many investors believe with 10-year interest rates hovering around 3% or under—a figure in line with market expectations.
The Fed’s new dynamic of providing less precise guidance is likely to create noise and require investors to do more of their homework, fostering an environment that is conducive to Calamos’ active and experienced management style. Consequently, we see many attractive opportunities in the bond market going forward.
| | | | |
| 46 | | CALAMOS OPEN-END FAMILY OF FUNDS SEMIANNUAL REPORT | | |
Calamos Total Return Bond Fund
GROWTH OF $10,000: SINCE INCEPTION (6/27/07) THROUGH 4/30/17
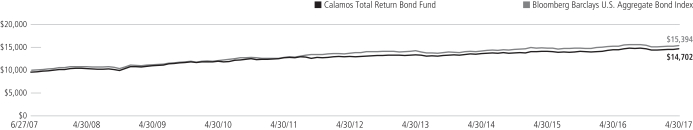
AVERAGE ANNUAL TOTAL RETURN† AS OF 4/30/17
| | | | | | | | | | | | | | | | | | | | |
| | | 6
MONTHS | | 1
YEAR | | 5
YEARS | | SINCE
INCEPTION |
Class A Shares – Inception 6/27/07 | | | | | | | | | | | | | | | | | | | | |
Without Sales Charge | | | | -0.18 | % | | | | 1.38 | % | | | | 2.41 | % | | | | 4.40 | % |
With Sales Charge | | | | -3.92 | | | | | -2.43 | | | | | 1.63 | | | | | 3.99 | |
Class B Shares – Inception 6/27/07 | | | | | | | | | | | | | | | | | | | | |
Without Sales Charge | | | | -0.46 | | | | | 0.82 | | | | | 1.67 | | | | | 3.77 | |
With Sales Charge | | | | -3.91 | | | | | -2.65 | | | | | 1.45 | | | | | 3.77 | |
Class C Shares – Inception 6/27/07 | | | | | | | | | | | | | | | | | | | | |
Without Sales Charge | | | | -0.55 | | | | | 0.73 | | | | | 1.65 | | | | | 3.62 | |
With Sales Charge | | | | -1.54 | | | | | -0.26 | | | | | 1.65 | | | | | 3.62 | |
Class I Shares – Inception 6/27/07 | | | | -0.06 | | | | | 1.73 | | | | | 2.66 | | | | | 4.66 | |
Class R Shares – Inception 6/27/07 | | | | -0.31 | | | | | 0.94 | | | | | 2.10 | | | | | 4.12 | |
Class T Shares – Inception 2/28/17 | | | | | | | | | | | | | | | | | | | | |
Without Sales Charge | | | | | | | | | | | | | | | | | | | 0.75 | |
With Sales Charge | | | | | | | | | | | | | | | | | | | -1.77 | |
Performance data quoted represents past performance, which is no guarantee of future results. Current performance may be lower or higher than the performance quoted. The principal value and investment return of an investment will fluctuate so that your shares, when redeemed, may be worth more or less than their original cost.
As of the prospectus dated 2/28/17, the Fund’s gross expense ratio for Class A shares is 1.07%; Class B is 1.83% and C shares is 1.82%; Class I shares is 0.82%; Class R shares is 1.31%; Class T shares is 1.07%. The Fund’s investment advisor has contractually agreed to reimburse Fund expenses through March 1, 2019 to the extent necessary so that Total Annual Fund Operating Expenses (excluding taxes, interest, short interest, short dividend expenses, brokerage commissions, acquired fund fees and expenses, and extraordinary expenses, if any) of Class A, Class B, Class C, Class I, Class R and Class T shares are limited to 0.88%, 1.64%, 1.63%, 0.63%, 1.12% and 0.88% of average net assets, respectively. The expense ratios shown above may differ from the more recent expense ratios reported in the Financial Highlights section of this report.
| † | Average annual total return measures net investment income and capital gain or loss from portfolio investments as an annualized average assuming reinvestment of dividends and capital gains distributions. Load-adjusted returns are adjusted for the maximum front-end sales load of 2.25%* for Class A shares and returns for Class B and C shares have been adjusted for the contingent deferred sales charge (CDSC). *Prior to 2/28/17, the Fund had a maximum front-end sales charge of 3.75%. |
NOTES:
The graph does not reflect the income taxes that you would pay on fund distributions or the redemption of fund shares. Fund performance includes reinvestment of dividends and adjustment for the maximum sales charge for Class A shares. The performance of other classes will vary from the performance of the class shown based on the difference in sales charges and fees paid by shareholders investing in different share classes.
The Bloomberg Barclays U.S. Aggregate Bond Index is considered generally representative of the investment-grade bond market. Index data shown for the Since Inception Growth of $10,000 graph is from 6/30/07, since comparative index data is only available for full monthly periods. Source: Lipper, Inc.
Index returns assume reinvestment of dividends and do not reflect deduction of fees and expenses. It is not possible to invest directly in an index.
Duration is useful in measuring a bond fund’s sensitivity to changes in interest rates. The longer the duration, the more a bond fund’s price will fluctuate when interest rates change.
Calamos High Income Fund
OVERVIEW
The fund invests primarily in a diversified portfolio of U.S. high yield bonds.
KEY FEATURES
| | ◾ | | Emphasizes total return rather than an exclusive focus on yield; our total-return framework enhances our ability to potentially generate alpha and preserve capital over entire credit cycles | |
| | ◾ | | A disciplined process utilizes proprietary credit research to identify securities most likely to migrate to investment grade, ahead of a rating agency upgrade | |
| | ◾ | | Multi-faceted risk management includes stress testing under various economic assumptions and avoids securities with a high probability of default and low expected recovery from default losses | |
PORTFOLIO FIT
The fund can complement investment grade credit exposure, providing attractive income and total-return potential for more risk-tolerant investors.
| | |
| FUND NASDAQ SYMBOLS |
A Shares | | CHYDX |
B Shares | | CAHBX |
C Shares | | CCHYX |
I Shares | | CIHYX |
R Shares | | CHYRX |
T Shares | | CHYTX |
|
| FUND CUSIP NUMBERS |
A Shares | | 128119815 |
B Shares | | 128119724 |
C Shares | | 128119799 |
I Shares | | 128119781 |
R Shares | | 128119377 |
T Shares | | 128120524 |
CALAMOS HIGH INCOME FUND
INVESTMENT TEAM DISCUSSION
How has the Fund performed?
For the six-month period ended April 30, 2017, the Fund returned 4.99% (Class A shares at net asset value) versus a gain of 4.67% for the BofA Merrill Lynch High Yield BB-B Constrained Index and 5.64% for the Credit Suisse U.S. High Yield Index.
Since its inception on August 2, 1999, the Fund gained 6.21% on an annualized basis (Class A shares at net asset value) versus a 6.74% return for the BofA Merrill Lynch BB-B U.S. High Yield Constrained Index and 7.34% return for the Credit Suisse U.S. High Yield Index.
What factors influenced performance?
After a largely unexpected victory by President Donald Trump, the high yield market rallied during the six-month reporting period. Investors were initially encouraged by the belief that a Trump presidency would provide favorable tailwinds including tax reform, reduced regulation, and increased infrastructure spending. Investor sentiment also became more bullish in response to improved economic data and higher corporate earnings.
Interest rates moved higher as the Federal Reserve hiked the Fed Funds rate twice during the period to 1.0%. Interest rates across the yield curve rose in response. The 3-year Treasury yield increased from 1.00% to 1.45%, while the 5-year Treasury yield moved from 1.31% to 1.81%. The 10-year U.S. Treasury yield climbed from 1.84% to 2.29%.
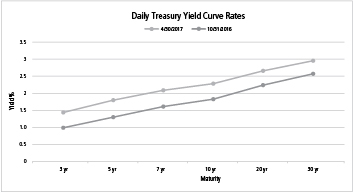
Source: U.S. Department of Treasury
High yield credit spreads narrowed during the period with JPMorgan reporting spreads contracting 105 basis points to 445 basis points above Treasurys. CCC credits benefited the most from this narrowing. Relative to the BB-B constrained benchmark, the Fund was overweight to CCC credits—which helped—but significantly underweight CCC-rated issuers when compared to the entire high yield market.
From an economic sector perspective, the portfolio benefited from strong selection in the energy and telecom services sectors. Conversely, security selection in real estate and materials held back the portfolio result.
| | | | |
| 48 | | CALAMOS OPEN-END FAMILY OF FUNDS SEMIANNUAL REPORT | | |
Calamos High Income Fund
How is the Fund positioned?
Regarding areas of emphasis, we focus on selecting issuers with strengthening balance sheets and improving debt-servicing capabilities. We also intently seek potential rising stars or issuers that may be upgraded from high yield to investment grade in the near term. Historically, identifying these securities in advance of rating agency upgrades has been a source of positive alpha. From an economic sector standpoint, the portfolio has its heaviest weightings in the consumer discretionary, materials and telecommunications sectors. Its lightest allocations are in utilities, consumer staples and financials. From a credit standpoint, the heaviest allocations went to the BB and B credit tiers with a modest allocation to CCC-rated issuers.
What closing thoughts do you have for shareholders?
While we expect default rates to trend lower, we remain cautiously positioned given the asymmetric risk-return profile of CCC issuers. We expect that energy defaults will almost certainly be lower, but will be offset somewhat by defaults in other areas (retail, for example, is growing increasingly distressed). With the combination of weaker relative technicals and spreads well through long-run averages, we expect the upside and corresponding price appreciation potential to be limited for the high yield asset class in the next year, amounting to mostly a “coupon clip” type of return. We believe that our active portfolio management with its rigorous bottom-up security selection process should be able to generate better-than-coupon returns in this environment.
| | | | |
| SECTOR WEIGHTINGS | |
Consumer Discretionary | | | 22.1 | % |
Industrials | | | 15.2 | |
Telecommunication Services | | | 10.5 | |
Energy | | | 10.0 | |
Health Care | | | 10.0 | |
Information Technology | | | 8.5 | |
Materials | | | 8.2 | |
Financials | | | 6.1 | |
Consumer Staples | | | 4.5 | |
Real Estate | | | 2.1 | |
Utilities | | | 0.6 | |
| | | | | |
Sector weightings are subject to change daily and are calculated as a percentage of net assets. The table excludes cash or cash equivalents, any government/sovereign bonds or broad-based index hedging securities the Fund may hold.
ANNUALIZED RETURN: SINCE INCEPTION (8/2/99) THROUGH 4/30/17
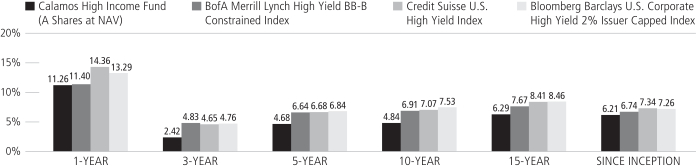
Performance data quoted represents past performance, which is no guarantee of future results. Current performance may be lower or higher than the performance quoted.
The principal value and investment return of an investment will fluctuate so that your shares, when redeemed, may be worth more or less than their original cost. You can obtain performance data current to the most recent month end by visiting www.calamos.com. Average annual total return measures net investment income and capital gain or loss from portfolio investments as an annualized average. All performance shown assumes reinvestment of dividends and capital gains distributions. Performance is for the Fund’s Class A shares at net asset value and does not include the Fund’s maximum front-end sales charge of 2.25%.* Had it been included, the Fund’s return would have been lower. The Fund also offers Class B, Class C, Class I and Class R shares, the performance of which may vary. Source: State Street Corporation and Mellon Analytical Solutions, LLC. *Prior to 2/28/17, the Fund had a maximum front-end sales charge of 4.75%.
Calamos High Income Fund
GROWTH OF $10,000: FOR THE 10-YEAR PERIOD ENDED 4/30/17
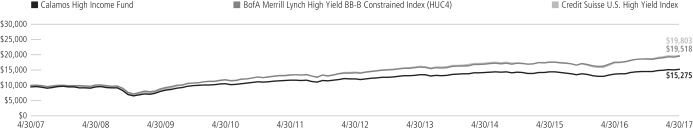
AVERAGE ANNUAL TOTAL RETURN† AS OF 4/30/17
| | | | | | | | | | | | | | | | | | | | |
| | | 6
MONTHS | | 1
YEAR | | 5
YEARS | | 10 YEARS
OR ^SINCE
INCEPTION |
Class A Shares – Inception 8/2/99 | | | | | | | | | | | | | | | | | | | | |
Without Sales Charge | | | | 4.99 | % | | | | 11.26 | % | | | | 4.68 | % | | | | 4.84 | % |
With Sales Charge | | | | 0.00 | | | | | 5.93 | | | | | 3.66 | | | | | 4.33 | |
Class B Shares – Inception 12/21/00 | | | | | | | | | | | | | | | | | | | | |
Without Sales Charge | | | | 4.55 | | | | | 10.38 | | | | | 3.88 | | | | | 4.20 | |
With Sales Charge | | | | -0.45 | | | | | 5.38 | | | | | 3.56 | | | | | 4.20 | |
Class C Shares – Inception 12/21/00 | | | | | | | | | | | | | | | | | | | | |
Without Sales Charge | | | | 4.60 | | | | | 10.39 | | | | | 3.87 | | | | | 4.04 | |
With Sales Charge | | | | 3.60 | | | | | 9.39 | | | | | 3.87 | | | | | 4.04 | |
Class I Shares – Inception 3/1/02 | | | | 5.12 | | | | | 11.42 | | | | | 4.92 | | | | | 5.09 | |
Class R Shares – Inception 3/1/07 | | | | 4.72 | | | | | 10.87 | | | | | 4.38 | | | | | 4.56 | |
Class T Shares – Inception 2/28/17 | | | | | | | | | | | | | | | | | | | | |
Without Sales Charge | | | | | | | | | | | | | | | | | | | 0.75 | ^ |
With Sales Charge | | | | | | | | | | | | | | | | | | | -1.77 | ^ |
Performance data quoted represents past performance, which is no guarantee of future results. Current performance may be lower or higher than the performance quoted. The principal value and investment return of an investment will fluctuate so that your shares, when redeemed, may be worth more or less than their original cost.
As of the prospectus dated 2/28/17, the Fund’s gross expense ratio for Class A shares is 1.33%; Class B shares is 2.09%; C shares is 2.08%; Class I shares is 1.08%; Class R shares is 1.57%; Class T shares is 1.33%. The expense ratios shown above may differ from the more recent expense ratios reported in the Financial Highlights section of this report.
| † | Average annual total return measures net investment income and capital gain or loss from portfolio investments as an annualized average assuming reinvestment of dividends and capital gains distributions. Performance shown reflects the effects of an expense reimbursement that improved results and was in effect until March 31, 2003. Load-adjusted returns are adjusted for the maximum front-end sales load of 2.25%* for Class A shares and returns for Class B and C shares have been adjusted for the contingent deferred sales charge (CDSC). *Prior to 2/28/17, the Fund had a maximum front-end sales charge of 4.75%. |
NOTES:
The graphs do not reflect the income taxes that you would pay on fund distributions or the redemption of fund shares. Fund performance includes reinvestment of dividends and adjustment for the maximum sales charge for Class A shares. The performance of other classes will vary from the performance of the class shown based on the difference in sales charges and fees paid by shareholders investing in different share classes.
The BofA Merrill Lynch High Yield BB-B Constrained Index tracks the performance of BB- and B-rated high yield bonds.
The Credit Suisse U.S. High Yield Index is an unmanaged index of high yield debt securities. Index data shown is from 7/31/99, since comparative index data is only available for full monthly periods. Source: Mellon Analytical Solutions, LLC
Bloomberg Barclays U.S. Corporate High Yield 2% Issuer Capped Index is not an official benchmark as of 4/30/17. It is shown for informational purposes only. The index measures the performance of high yield corporate bonds with a maximum allocation of 2% to any one issuer.
Index returns assume reinvestment of dividends and do not reflect deduction of fees and expenses. It is not possible to invest directly in an index.
| | | | |
| 50 | | CALAMOS OPEN-END FAMILY OF FUNDS SEMIANNUAL REPORT | | |
Calamos Market Neutral Income Fund
CALAMOS MARKET NEUTRAL INCOME FUND
INVESTMENT TEAM DISCUSSION
How has the Fund performed?
For the six-month period ended April 30, 2017, the Fund returned 2.92% (Class A shares at net asset value) versus a -0.70% loss for the Bloomberg Barclays U.S. Government/Credit Bond Index and a 0.22% return for the Citigroup 30-Day U.S. Treasury Bill Index.
For both the 5-year and 10-year periods as of April 30, 2017, the Fund’s A shares return ranked in the 10th percentile and 11th percentile, respectively, in the Morningstar Market Neutral category peer group.* Launched more than 25 years ago, the strategy is one of the first liquid alternative mutual funds and blends two main strategies, convertible arbitrage and covered call writing. In addition to offering an attractive historical risk/reward profile, the Fund may enhance long-term portfolio diversification potential, especially versus fixed income securities.
Both strategies utilized in the Fund, convertible arbitrage and covered call writing, contributed positively to performance during a period that included rising interest rates. Since its inception on September 4, 1990, the Fund gained 6.38% on an annualized basis (Class A shares at net asset value). For the same period, the Bloomberg Barclays U.S. Government/Credit Bond Index gained 6.22% while the Citigroup 30-Day U.S. Treasury bill Index returned 2.57%.
What factors influenced performance?
The convertible arbitrage and covered call writing facets of the Market Neutral Income Fund performed positively during the reporting period and contributed to the overall Fund Return.
Volatility declined during the six-month period, as evidenced by the CBOE Volatility Index (VIX)’s decline from 17.06% at the beginning of the period to 10.82%. With the exception of the first few days of the period, which coincided with the U.S. Presidential election, volatility traded significantly below its long-term average of 19.56% during the period. Lower overall volatility muted the Fund’s ability to generate results from convertible arbitrage rebalancing and call option premium capture. On the other hand, put protection was relatively inexpensive which worked to the Fund’s advantage.
Elevated option skew was also persistent during the period.† The Credit Suisse “Fear Barometer” Index, which compares the relative value of calls versus puts, finished the reporting period at 36.13%. This level was well above the 20.59% historical average of the index and indicated that calls are relatively inexpensive when compared to puts given the low interest rate environment. While the option skew presented the challenge of collecting narrower premium capture than historically, it also presented opportunities to harness call and put spreads.
The Federal Reserve raised the Fed Funds rate twice during the period, adding two 25-basis point hikes for a total of 1.0%. This was supportive to the interest carry on our convertible arbitrage short equity positions.
High yield credit spreads narrowed during the period, as JPMorgan reported that spreads contracted 105 basis points to 445 basis points above Treasurys. Narrower spreads supported the convertible arbitrage portion of the portfolio as the bond portion of the convertible became more valuable. Narrowing spreads also more than
| * | Data is as of 4/30/17. Morningstar category percentile ranking is based on annualized total return for the 5-year and 10-year periods. Calamos Market Neutral Income Fund Class A shares were in the 23rd, 17th, 10th, and 11th percentiles of 152, 125, 81 and 40 funds for the 1-year, 3-year, 5-year and 10-year periods, respectively, for the Morningstar Market Neutral category. |
| † | Skew describes asymmetry from the normal distribution in a set of statistical data. |
OVERVIEW
The fund’s core market strategies include covered call writing and convertible arbitrage, complemented by an opportunistic sleeve. Together, these strategies intend to provide the fund with an enhanced potential for risk-managed returns due to their differing responses to volatility.
KEY FEATURES
| | ◾ | | One of the first alternative mutual funds capitalizes on more than three decades of experience in the convertible space | |
| | ◾ | | Lower correlation with most fixed income benchmarks provides a means to dampen volatility | |
| | ◾ | | Risk-management focus blends strategies to achieve the most appropriate risk/reward profile | |
PORTFOLIO FIT
The fund may provide potential diversification, particularly in a low-interest-rate environment.
| | |
| FUND NASDAQ SYMBOLS |
A Shares | | CVSIX |
B Shares | | CAMNX |
C Shares | | CVSCX |
I Shares | | CMNIX |
R Shares | | CVSRX |
T Shares | | CVSTX |
|
| FUND CUSIP NUMBERS |
A Shares | | 128119203 |
B Shares | | 128119757 |
C Shares | | 128119849 |
I Shares | | 128119880 |
R Shares | | 128119351 |
T Shares | | 128120516 |
Calamos Market Neutral Income Fund
| | | | |
| SECTOR WEIGHTINGS | |
Information Technology | | | 34.3 | % |
Consumer Discretionary | | | 17.1 | |
Health Care | | | 13.4 | |
Financials | | | 7.7 | |
Industrials | | | 6.8 | |
Energy | | | 5.0 | |
Consumer Staples | | | 4.8 | |
Real Estate | | | 3.4 | |
Telecommunication Services | | | 3.2 | |
Materials | | | 2.6 | |
Utilities | | | 1.8 | |
Other | | | 0.8 | |
Sector weightings are subject to change daily and are calculated as a percentage of net assets. The table excludes cash or cash equivalents, any government/sovereign bonds or broad-based index hedging securities the Fund may hold.
offset rising interest rates during the period. Additionally, 3-year and 5-year Treasury yields moved 45 and 50 basis points higher to 1.45% and 1.84%, respectively.
How is the Fund positioned?
At the end of the reporting period, the Fund had a roughly equal allocation between convertible arbitrage (52.8%) and covered call writing (47.2%), as both strategies provided a similar though complementary return opportunity going forward in our view. Given the elevated option skew discussed above, we have found call and put spreads to be very valuable tools. By using slightly closer-to-the-money calls, buying out-of-the-money calls, and adding near-the-money put spreads, we are able to construct a more effective hedge that still has a delta and profile similar to that our historical hedge.
What closing thoughts do you have for Fund shareholders?
While index volatility has been historically low, single name volatility has not been as depressed and we have been able to find opportunities to use volatility in our convertible arbitrage strategy. Volatility in the market may increase at some point in the future stemming from a variety of potential sources. Post-Trump election euphoria may wane against a backdrop of a politically polarized Congress. Geopolitical events involving Syria, ISIS and North Korea may also potentially disrupt markets.
After a prolonged period of historically low interest rates, the Fed increased short-term rates and longer-term rates are poised to move higher. While accommodative monetary policies and purchase programs from other global central banks may prevent soaring U.S. interest rates, the interest rate environment is likely to see fluctuation amid speculation over the direction and magnitude of interest rates. We believe the Market Neutral Income Fund provides a unique opportunity for investors. When used within the fixed income allocation, the Fund has historically provided bond-like returns with bond-like risk—without having bond-like interest rate sensitivity. The Fund’s return versus the Bloomberg Barclays U.S. Government/Credit Bond Index bears this out. Additionally, as the Fund has lower correlations to other asset classes, portfolios should benefit as the Fund can provide stability in a market environment that could again become volatile.
ANNUALIZED RETURN: SINCE INCEPTION (9/4/90) THROUGH 4/30/17
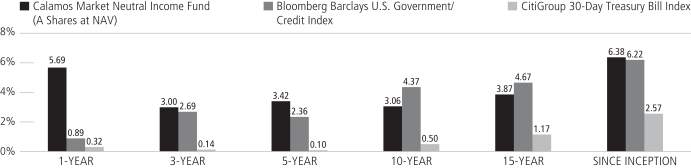
Performance data quoted represents past performance, which is no guarantee of future results. Current performance may be lower or higher than the performance quoted.
The principal value and investment return of an investment will fluctuate so that your shares, when redeemed, may be worth more or less than their original cost. You can obtain performance data current to the most recent month end by visiting www.calamos.com. Average annual total return measures net investment income and capital gain or loss from portfolio investments as an annualized average. All performance shown assumes reinvestment of dividends and capital gains distributions. Performance is for the Fund’s Class A shares at net asset value and does not include the Fund’s maximum front-end sales charge of 2.25%.* Had it been included, the Fund’s return would have been lower. The Fund also offers Class B, Class C, Class I and Class R shares, the performance of which may vary. Source: State Street Corporation, Lipper, Inc., and Mellon Analytical Solutions, LLC. *Prior to 2/28/17, the Fund had a maximum front-end sales charge of 4.75%.
| | | | |
| 52 | | CALAMOS OPEN-END FAMILY OF FUNDS SEMIANNUAL REPORT | | |
Calamos Market Neutral Income Fund
GROWTH OF $10,000: FOR THE 10-YEAR PERIOD ENDED 4/30/17
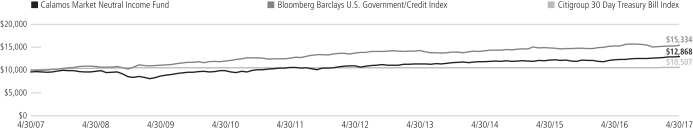
AVERAGE ANNUAL TOTAL RETURN† AS OF 4/30/17
| | | | | | | | | | | | | | | | | | | | |
| | | 6
MONTHS | | 1
YEAR | | 5
YEARS | | 10 YEARS
OR ^SINCE
INCEPTION |
Class A Shares – Inception 9/4/90 | | | | | | | | | | | | | | | | | | | | |
Without Sales Charge | | | | 2.92 | % | | | | 5.69 | % | | | | 3.42 | % | | | | 3.06 | % |
With Sales Charge | | | | -1.93 | | | | | 0.67 | | | | | 2.41 | | | | | 2.55 | |
Class B Shares – Inception 9/11/00 | | | | | | | | | | | | | | | | | | | | |
Without Sales Charge | | | | 2.59 | | | | | 4.90 | | | | | 2.66 | | | | | 2.43 | |
With Sales Charge | | | | -2.41 | | | | | -0.10 | | | | | 2.30 | | | | | 2.43 | |
Class C Shares – Inception 2/16/00 | | | | | | | | | | | | | | | | | | | | |
Without Sales Charge | | | | 2.57 | | | | | 4.87 | | | | | 2.65 | | | | | 2.28 | |
With Sales Charge | | | | 1.57 | | | | | 3.87 | | | | | 2.65 | | | | | 2.28 | |
Class I Shares – Inception 5/10/00 | | | | 3.17 | | | | | 6.02 | | | | | 3.68 | | | | | 3.31 | |
Class R Shares – Inception 3/1/07 | | | | 2.89 | | | | | 5.45 | | | | | 3.17 | | | | | 2.79 | |
Class T Shares – Inception 2/28/17 | | | | | | | | | | | | | | | | | | | | |
Without Sales Charge | | | | | | | | | | | | | | | | | | | 0.33 | ^ |
With Sales Charge | | | | | | | | | | | | | | | | | | | -2.18 | ^ |
Performance data quoted represents past performance, which is no guarantee of future results. Current performance may be lower or higher than the performance quoted. The principal value and investment return of an investment will fluctuate so that your shares, when redeemed, may be worth more or less than their original cost.
As of the prospectus dated 2/28/17, the Fund’s gross expense ratio for Class A shares is 1.22%; Class B and C shares is 1.97%; Class I shares is 0.97%; Class R shares is 1.47%; Class T shares is 1.22%. The expense ratios shown above may differ from the more recent expense ratios reported in the Financial Highlights section of this report.
| † | Average annual total return measures net investment income and capital gain or loss from portfolio investments as an annualized average assuming reinvestment of dividends and capital gains distributions. Performance shown reflects the effects of an expense reimbursement that improved results and was in effect until March 31, 2000. Load-adjusted returns are adjusted for the maximum front-end sales load of 2.25%* for Class A shares and returns for Class B and C shares have been adjusted for the contingent deferred sales charge (CDSC). *Prior to 2/28/17, the Fund had a maximum front-end sales charge of 4.75%. |
NOTES:
The graphs do not reflect the income taxes that you would pay on fund distributions or the redemption of fund shares. Fund performance includes reinvestment of dividends and adjustment for the maximum sales charge for Class A shares. The performance of other classes will vary from the performance of the class shown based on the difference in sales charges and fees paid by shareholders investing in different share classes.
The Bloomberg Barclays U.S. Government/Credit Index is comprised of long-term government and investment-grade corporate debt securities and is generally considered representative of the performance of the broad U.S. bond market. Index data shown for the Annualized Returns Since Inception graph is from 8/31/90, since comparative index data is only available for full monthly periods. Source: Lipper, Inc.
The Citigroup 30-Day Treasury Bill Index is an unmanaged index generally considered representative of the performance of short-term money instruments. U.S. Treasury Bills are backed by the full faith and credit of the U.S. government and offer a guarantee as to the repayment of principal and interest at maturity. Index data shown for the Annualized Returns Since Inception graph is from 8/31/90, since comparative index data is only available for full monthly periods. Source: Mellon Analytical Solutions, LLC
The CBOE Volatility Index (VIX) is a leading measure of market expectations of near-term volatility conveyed by S&P 500 Index (SPX) option prices.
Morningstar Market Neutral Category represent funds that attempt to eliminate the risks of the market by holding 50% of assets in long positions in stocks and 50% of assets in short positions.
The S&P 500 Volatility Index or VIX (based on its CBOE ticker symbol) shows the market’s expectation of 30-day volatility. It is constructed using the implied volatilities of a wide range of S&P 500 index options.
The Credit Suisse Fear Barometer essentially tracks the willingness of investors to pay up for downside protection with collar trades on the S&P 500 Index.
Index returns assume reinvestment of dividends and do not reflect deduction of fees and expenses. It is not possible to invest directly in an index.
The Fund’s use of derivative instruments involves investment risks and transaction costs to which the Fund would not be subject absent the use of these instruments and, accordingly, may result in losses greater than if they had not been used. Derivative instruments can be illiquid, may disproportionately increase losses and may have a potentially large impact on Fund performance.
Calamos Hedged Equity Income Fund
OVERVIEW
The fund is an alternative strategy that invests in equities and sells options with the aim of achieving the total return of equity markets with lower volatility. It utilizes a covered call strategy, which involves investing in a diversified portfolio of equities while using options to generate income and manage risk.
KEY FEATURES
| | ◾ | | Draws upon almost a decade of experience in covered call writing and two decades of equity investing | |
| | ◾ | | Option-based risk-management strategy attempts to lower the volatility of equity investments | |
| | ◾ | | An alternative approach potentially provides upside participation in equity markets while limiting downside exposure | |
PORTFOLIO FIT
The fund provides an alternative strategy that can generate income and provide equity exposure with potentially lower volatility than equities.
| | |
| FUND NASDAQ SYMBOLS |
A Shares | | CAHEX |
C Shares | | CCHEX |
I Shares | | CIHEX |
T Shares | | CAHTX |
|
| FUND CUSIP NUMBERS |
A Shares | | 128120698 |
C Shares | | 128120680 |
I Shares | | 128120672 |
T Shares | | 128120466 |
CALAMOS HEDGED EQUITY INCOME FUND
INVESTMENT TEAM DISCUSSION
How has the Fund performed?
For the six-month period ended April 30, 2017, Calamos Hedged Equity Income Fund gained 5.64% (Class A shares at net asset value) versus the S&P 500 Index gain of 13.32% and the Bloomberg Barclays U.S. Aggregate Bond Index return of -0.67%. Since its inception on December 31, 2014, the Fund gained 3.89% on an annualized basis (Class A shares at net asset value), versus 8.75% for the S&P 500 Index and 2.05% for the Bloomberg Barclays U.S. Aggregate Bond Index.
In this strategy, we utilize covered call writing in which we sell call options for income and buy a basket of equities that represents the broad stock market. The selling prices of call options tend to be higher when volatility is higher.
What factors influenced performance?
After a largely unexpected victory by President Trump, the S&P 500 Index rallied during the six-month reporting period. Investors were encouraged by the belief that a Trump presidency would provide favorable tailwinds including tax reform, reduced regulation, and increased infrastructure spending. Investor sentiment also became more bullish in response to improved economic data and higher corporate earnings, and the Fund benefited as it participated in some of the equity upside. We also benefited from being less than 100% overwritten in a rising market.
Volatility declined during the six-month period. The CBOE Volatility Index (VIX) declined from 17.06% at the beginning of the period to 10.82%. With the exception of the first few days of the period, which included the U.S. Presidential election, volatility traded significantly below its long-term average of 19.56% during the period. Lower overall volatility muted the Fund’s ability to generate results from call option premium capture. On the other hand, put protection was relatively inexpensive, and this worked to the Fund’s advantage. Lower volatility allowed the Fund to purchase more puts at a reduced cost. However, lower volatility also meant that premium capture opportunities were more limited.
Elevated option skew* was also persistent during the period. The Credit Suisse “Fear Barometer” Index, an index that compares the relative value of calls versus puts, finished the reporting period at 36.13%. This level was well above the 20.59% historical average of the index and was indicative that calls are relatively inexpensive when compared to puts given the low interest rate environment. While the option skew presented a challenge in terms of collecting narrower premium capture than historically, it also presented an opportunity to monetize call and put spreads.
How is the fund positioned?
Option Positioning. We frequently adjust the call and put quantities to maintain a balanced risk/reward. Excluding the long calls and short puts used in the option spreads, the portfolio had 92% calls written against its equity basket versus a 50% put hedge at the end of the period. Additionally, the calls written averaged roughly 2.7% in the money with 148 days to expiration. The puts purchased averaged 2.8% out of the money with 57 days to expiration. Put and call spreads remain a valuable tool and still continue to positively impact the current portfolio’s risk/reward (skew), providing
* Skew describes asymmetry from the normal distribution in a set of statistical data.
| | | | |
| 54 | | CALAMOS OPEN-END FAMILY OF FUNDS SEMIANNUAL REPORT | | |
Calamos Hedged Equity Income Fund
additional protection over and above our typical 40% to 50% put notional minimum and adding upside participation potential.
Sector Positioning. At the end of the reporting period and relative to the S&P 500 Index, the equity basket was slightly overweight to the health care, energy, and consumer discretionary sectors. The portfolio had slight underweight positions in the financials, consumer staples and materials sectors.
Market Cap Positioning. Relative to the S&P 500 Index, the portfolio maintained a heavier relative weight to larger cap (>$25 billion) holdings and a lighter weight to mid cap ($12 billion to $25 billion) names.
What closing thoughts do you have for Fund shareholders?
We are constructive on the equity markets given our view that the U.S. economy appears positioned for measured expansion. The potent mix of tax reform and lower regulations may provide fuel to move the markets higher. Despite index volatility being historically low, volatility in the market may increase at some point in the future stemming from a variety of potential sources. Post-Trump election euphoria may wane against a backdrop of a politically polarized Washington, D.C. Geopolitical events surrounding Syria, ISIS and North Korea may also disrupt markets.
We believe the Calamos Hedged Equity Income Fund to be well positioned in this environment. Should the equity markets continue to advance, the Fund is poised to participate in a portion of its upside while also providing an enhanced income stream from the equity dividends and premium capture. Conversely, should the markets retreat, the income stream and the Fund’s put protection will serve to provide a measure of downside protection.
| | | | |
| SECTOR WEIGHTINGS | |
Information Technology | | | 22.7 | % |
Health Care | | | 14.3 | |
Financials | | | 13.5 | |
Consumer Discretionary | | | 13.2 | |
Industrials | | | 10.4 | |
Consumer Staples | | | 8.9 | |
Energy | | | 6.8 | |
Utilities | | | 2.9 | |
Real Estate | | | 2.8 | |
Telecommunication Services | | | 2.6 | |
Materials | | | 2.5 | |
Other | | | 1.4 | |
Sector weightings are subject to change daily and are calculated as a percentage of net assets. The table excludes cash or cash equivalents, any government/sovereign bonds or broad-based index hedging securities the Fund may hold.
Calamos Hedged Equity Income Fund
GROWTH OF $10,000: SINCE INCEPTION (12/31/14) THROUGH 4/30/17
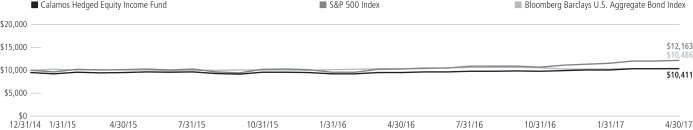
AVERAGE ANNUAL TOTAL RETURN† AS OF 4/30/17
| | | | | | | | | | | | | | | |
| | | 6
MONTHS | | 1
YEAR | | SINCE
INCEPTION |
Class A Shares – Inception 12/31/2014 | | | | | | | | | | | | | | | |
Without Sales Charge | | | | 5.64 | % | | | | 8.78 | % | | | | 3.89 | % |
With Sales Charge | | | | 0.62 | | | | | 3.59 | | | | | 1.74 | |
Class C Shares – Inception 12/31/2014 | | | | | | | | | | | | | | | |
Without Sales Charge | | | | 5.29 | | | | | 7.96 | | | | | 3.11 | |
With Sales Charge | | | | 4.29 | | | | | 6.96 | | | | | 3.11 | |
Class I Shares – Inception 12/31/2014 | | | | 5.77 | | | | | 9.05 | | | | | 4.15 | |
Class T Shares – Inception 2/28/2017 | | | | | | | | | | | | | | | |
Without Sales Charge | | | | | | | | | | | | | | 0.32 | |
With Sales Charge | | | | | | | | | | | | | | -2.19 | |
Performance data quoted represents past performance, which is no guarantee of future results. Current performance may be lower or higher than the performance quoted. The principal value and investment return of an investment will fluctuate so that your shares, when redeemed, may be worth more or less than their original cost.
As of the prospectus dated 2/28/17, the Fund’s gross expense ratio for Class A shares is 2.04%; Class C shares is 2.08%; Class I shares is 1.82%; Class T shares is 2.04%. The Fund’s investment advisor has contractually agreed to reimburse Fund expenses through March 1, 2019, to the extent necessary so that Total Annual Fund Operating Expenses (excluding taxes, interest, short interest, short dividend expenses, brokerage commissions, acquired fund fees and expenses, and extraordinary expenses, if any) of Class A, Class C, Class I and Class T shares are limited to 1.23%, 1.98%, 0.98% and 1.23% of average net assets, respectively. The expense ratios shown above may differ from the more recent expense ratios reported in the Financial Highlights section of this report.
| † | Average annual total return measures net investment income and capital gain or loss from portfolio investments as an annualized average assuming reinvestment of dividends and capital gains distributions. Load-adjusted returns are adjusted for the maximum front-end sales load of 4.75% for Class A shares. Returns for Class C shares have been adjusted for the contingent deferred sales charge (CDSC). |
NOTES:
The S&P 500 Index is an unmanaged index generally considered representative of the U.S. stock market.
The Bloomberg Barclays U.S. Aggregate Bond Index is considered generally representative of the investment-grade bond market. Index data shown for the Since Inception Growth of $10,000 graph is from 6/30/07, since comparative index data is only available for full monthly periods. Source: Lipper, Inc.
The CBOE Volatility Index (VIX) is a leading measure of market expectations of near-term volatility conveyed by S&P 500 Index (SPX) option prices.
The Credit Suisse Fear Barometer essentially tracks the willingness of investors to pay up for downside protection with collar trades on the S&P 500 Index.
Index returns assume reinvestment of dividends and do not reflect deduction of fees and expenses. It is not possible to invest directly in an index.
The Fund’s use of derivative instruments involves investment risks and transaction costs to which the Fund would not be subject absent the use of these instruments and, accordingly, may result in losses greater than if they had not been used. Derivative instruments can be illiquid, may disproportionately increase losses and may have a potentially large impact on Fund performance.
| | | | |
| 56 | | CALAMOS OPEN-END FAMILY OF FUNDS SEMIANNUAL REPORT | | |
Calamos Phineus Long/Short Fund
CALAMOS PHINEUS LONG/SHORT FUND
INVESTMENT TEAM DISCUSSION
What is your rationale behind launching the Calamos Phineus Long/Short Fund?
Calamos Phineus Long/short Fund offers our clients access to an institutionally managed global equity portfolio that has exhibited strong performance over its 15-year history by the same portfolio manager. Given the market environment of sluggish growth, low interest rates and sporadic episodes of high volatility, the Calamos Phineus Fund offers a compelling alternative to traditional long only equity managers in a strategy that has generated returns in excess of the S&P 500 and the MSCI Indices, with lower volatility. The product serves to broaden the Calamos suite of alternative investments within the global equity class.
What is the essence of the investment approach?
Through a global long/short structure, the Fund invests in publicly listed equity securities. Components of the strategy include:
| • | | A fundamental global approach that blends top-down and bottom-up considerations. Company analysis is integrated with industry, thematic and macro research. |
| • | | An inclusive framework for identifying potential returns and associated risks. The framework accounts for company, industry, style, country and market factors. |
| • | | Flexible capital allocation allowing for all investment styles, market caps and geographic regions. The investment universe is global, liquid and scalable. Exposure levels and investment styles depend upon market conditions and the economic cycle. |
How has the Fund performed?
For the six-month period ended April 30, 2017, Phineus Long/Short Fund increased 12.56% (Class A shares at net asset value). The MSCI World Index rose 12.44% and the S&P 500 Index rose 13.32% over the comparable period.
Equity markets enjoyed a respectable start to 2017, extending the prior year’s healthy performance. While the U.S. election and related hopes for tax reform, infrastructure spending and lessened regulation have undoubtedly supported this rally, this latest leg of the bull market began over a year ago—long before November—when U.S. corporate and consumer surveys first hinted that the global profit recession was approaching its close.
Since its inception on May 1, 2002, the Fund has returned 11.56% on an annualized basis (Class A Shares at net asset value) and thus, markedly outperformed both the MSCI World and S&P 500 Indexes, which returned 7.12% and 7.55% respectively over the same period.
FUND OVERVIEW
The fund seeks strong risk-adjusted and absolute returns across the global equity universe. The fund uses a global long/short strategy to invest in publicly listed equity securities.
KEY FEATURES
| | ◾ | | Fundamental global approach blends top-down and bottom-up considerations | |
| | ◾ | | Flexible asset allocation allows for all investment styles, market caps and geographic regions depending on the market environment | |
| | ◾ | | Comprehensive approach assesses stock, industry, style, country and market factors | |
| | ◾ | | Knowledge-based industry concentration includes technology, communications, media, financials and health care | |
PORTFOLIO FIT
The fund seeks to provide strong risk-adjusted returns via an alternative solution that complements and diversifies a global or U.S. equity allocation.
| | |
| FUND NASDAQ SYMBOLS |
A Shares | | CPLSX |
C Shares | | CPCLX |
I Shares | | CPLIX |
T Shares | | CPLTX |
|
| FUND CUSIP NUMBERS |
A Shares | | 128120656 |
C Shares | | 128120649 |
I Shares | | 128120631 |
T Shares | | 128120458 |
Calamos Phineus Long/Short Fund
| | | | |
| SECTOR WEIGHTINGS | |
Financials | | | 30.4 | % |
Information Technology | | | 15.7 | |
Other | | | 14.8 | |
Consumer Discretionary | | | 12.6 | |
Industrials | | | 7.5 | |
Health Care | | | 3.9 | |
Real Estate | | | 2.3 | |
Materials | | | 0.5 | |
Sector weightings are subject to change daily and are calculated as a percentage of net assets. The table excludes cash or cash equivalents, any government/sovereign bonds or broad-based index hedging securities the Fund may hold.
What contributed to performance over the six -month period under review?
The largest contributors arose from long investments in the financials and consumer discretionary sectors, while short exposure in consumer staples hindered performance. Notable contributors during the period included long positions in Bank of America 2.6%* and JPMorgan Chase 3.5%* (financials), Priceline.com 3.2%* (consumer discretionary) and Apple, Inc. 2.2%* (information technology). Detractors included short positions in Colgate-Palmolive -1.1%* (consumer staples) and Merck & Co. sold 1/12/17 (health care), as well as long positions in Radian 2.1%* (financials) and NCR Corp. 2.0%* (information technology).
How is the Fund positioned in the context of the global economic cycle?
The portfolio is positioned for what we anticipate will be a sustained global reflation cycle. Accordingly, our largest long positions include financials, select cyclicals and idiosyncratic growth technology. While some of these names performed well in 2016, we suspect financials in particular have entered a multi-year upcycle. More broadly, we emphasize companies where the valuation frameworks are clear, supported by healthy cash flow and earnings potential. Our investment in airlines is an example of a cyclical industry where valuations are modest due to “end of cycle” fears, while sustained U.S. economic conditions could prove lucrative as managements use cash flows to retire outstanding shares. In addition, we maintain selective investments in the information technology and consumer discretionary sectors, which we regard as the natural destination for monies that flow away from the overvalued “bond proxies” such as consumer staples, telecom services and utilities. We think information technology benefits from idiosyncratic growth, cash-rich balance sheets, and low leverage ratios and therefore should provide downside support in the event of a market drawdown.
The Fund maintains a short hedge in the consumer staples and health care sectors. We believe these industries will succumb to overvaluation pressures as deflation fears ease and these “bond proxies” are unlikely to regain their former leadership status. In our view, many consumer brand companies are particularly vulnerable to online retailers’ new push into private label grocery and household products.
Outside the U.S., the Fund is net long Europe, where compelling valuations combine with widening evidence of a sustained cyclical upswing. Political and economic conditions in Europe have greatly improved of late, which should provide support for global markets. With Germany and France appearing to move toward increased co-operation regarding economic policy and institutional structures, the EU should become a source of stability, rather than a tail risk for the global landscape. Finally, we maintained modest exposure to India and Vietnam, while adding monies tactically to Mexico in late January. We exited this position in April, after realizing a solid return.
The global economic setting appears healthier today than at any time since 2008. If the U.S. expansion continues into 2019 as we expect, it makes sense to look abroad incrementally for opportunities. Unlike the U.S., where sustained recovery is widely understood, Europe is on the cusp of sustained cyclical improvement. Consequently, we expect the green shoots of reflation to gather momentum across the euro zone in 2017. The latest figures from France show industrial production rising to the highest level since December 2011. Coupled with brisk activity in Spain and Germany, the French recovery implies the euro zone will be firing on three of its four main cylinders in a cyclical upswing that could be self-sustaining.
| *% | of net assets as of 4/30/17. |
| | | | |
| 58 | | CALAMOS OPEN-END FAMILY OF FUNDS SEMIANNUAL REPORT | | |
Calamos Phineus Long/Short Fund
Conditions in the emerging economies face a multi-year workout but have seen their worst. The crises here represent the last domino in the global deleveraging wave. The emergence of President Trump’s trade policies implies some risk to the growth models for these economies, and China in particular is vulnerable to an ongoing deceleration of its growth outlook. China remains the one major economy that has yet to de-lever, which we expect to gather pace in 2018 after this autumn’s political Congress. For now, we see selective opportunities in the emerging economies.
What are your closing thoughts for the coming year?
The rotation from defensive stocks into cyclicals that was prominent through the latter part of 2016 paused as the markets assessed the dynamics of deflation versus reflation. In our view, this pause in market leadership was based more on concerns regarding the fulfillment of President Trump’s agenda rather than any deterioration in economic fundamentals. Indeed, both business and consumer confidence remain near recent highs. Corporate managements appear inspired by the prospect of a more pro-growth, less-regulatory setting, and most acknowledge the ongoing improvement in conditions overseas.
International equities posted solid returns for the period as well. Overseas markets benefited from stability in the U.S. dollar, evidence of cyclical recovery, and subdued populist/protectionism support. In Europe, equity markets improved, supported by widening earnings growth and the perception that political risk relating to the potential breakup of the euro zone are receding. This has helped the European equity markets keep pace with the U.S. this year, after having underperformed through much of the post-2008 period.
We continue to believe markets are in the early stages of improving global GDP through 2017, supported by ongoing U.S. expansion, European cyclical recovery, and stabilization in select emerging economies. Stability in the U.S. dollar and in oil prices has lessened fears of an imminent default cycle. Generally speaking, 2017 should be the first year of many when the major economic blocs move along a more synchronized path, which implies that investors should increasingly look abroad for cyclical opportunity.
We believe the risk of a bear market in 2017 is low, primarily because the odds of a U.S. recession appear modest until late 2018 at the earliest. While the expansion is moving into its ninth year, its lack of fundamental progress in areas such as wage growth, capacity utilization and capital spending suggests that it is more mid-cycle than late-cycle in nature. The Trump victory underscores the globally rising focus on growth by policymakers. Although many uncertainties exist on the political side, politics are combining with the business cycle to underpin the longevity of the current U.S. expansion.
President Trump’s pro-growth policies have arrived at a moment when the long global deleveraging cycle was nearing its end. This wave of debt crises—which began in the U.S. in 2008, reached its nadir in Europe in 2012 and swept through the emerging economies in recent years—has created the conditions for a long global expansion. In this sense, fate favors many of Trump’s proposals including his “responsible nationalism” on trade, taxes and immigration. Both in the U.S., and increasingly in Europe, the political establishment is supportive of fiscal initiatives, which implies the limits of monetary policy have been acknowledged.
After the recent post-election run, markets are pausing to assess the Republican Party’s ability to deliver its policy agenda in the face of stiff bipartisanship. This political wrangling will remain front and center for investors, but we think the market could be a better judge of the combined political and economic risks. Through all the political
Calamos Phineus Long/Short Fund
noise, it seems clear that both consumers and businesses are significantly more positive about their future economic prospects than they were this time last year. This is consistent with our healthy assessment of the global economic picture, which remains the most important cue for markets. In our view, this will drive sustained rotation into equities as the fear of deflation gradually gives way to reflation confidence and ongoing economic expansion.
ANNUALIZED RETURN: SINCE INCEPTION (5/1/02) THROUGH 4/30/17
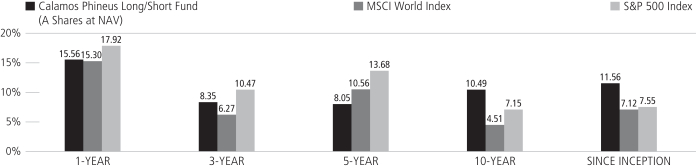
Performance data quoted represents past performance, which is no guarantee of future results. Current performance may be lower or higher than the performance quoted.
The principal value and investment return of an investment will fluctuate so that your shares, when redeemed, may be worth more or less than their original cost. You can obtain performance data current to the most recent month end by visiting www.calamos.com. Average annual total return measures net investment income and capital gain or loss from portfolio investments as an annualized average. All performance shown assumes reinvestment of dividends and capital gains distributions. Performance is for the Fund’s Class A shares at net asset value and does not include the Fund’s maximum front-end sales charge of 4.75%. Had it been included, the Fund’s return would have been lower. The Fund also offers Class C and Class I shares, the performance of which may vary. Source: Morningstar, Inc.
The performance shown for periods prior to April 5, 2016 is the performance of a predecessor investment vehicle (the “Predecessor Fund”). The Predecessor Fund was reorganized into the Fund on April 5, 2016, the date upon which the Fund commenced operations. On October 1, 2015, the parent company of Calamos Advisors, purchased Phineus Partners LP, the prior investment adviser to the Predecessor Fund (“Phineus”), and Calamos Advisors served as the Predecessor Fund’s investment adviser between October 1, 2015 until it was reorganized into the Fund. Phineus and Calamos Advisors managed the Predecessor Fund using investment policies, objectives, guidelines and restrictions that were in all material respects equivalent to those of the Fund. Phineus and Calamos Advisors managed the Predecessor Fund in this manner either directly or indirectly by investing all of the Predecessor Fund’s assets in a master fund structure. The Predecessor Fund performance information has been adjusted to reflect Class A, C and I share expenses. However, the Predecessor Fund was not a registered mutual fund and thus was not subject to the same investment and tax restrictions as the Fund. If it had been, the Predecessor Fund’s performance may have been lower.
| | | | |
| 60 | | CALAMOS OPEN-END FAMILY OF FUNDS SEMIANNUAL REPORT | | |
Calamos Phineus Long/Short Fund
GROWTH OF $10,000: FOR THE 10-YEAR PERIOD ENDED 4/30/17
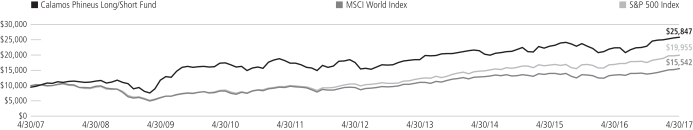
AVERAGE ANNUAL TOTAL RETURN† AS OF 4/30/17
| | | | | | | | | | | | | | | | | | | | |
| | | 6
MONTHS | | 1
YEAR | | 5
YEAR | | 10 YEARS
OR ^SINCE
INCEPTION |
Class A Shares (With Predecessor) – Inception 5/1/2002 | | | | | | | | | | | | | | | | | | | | |
Without Sales Charge | | | | 12.56 | % | | | | 15.56 | % | | | | 8.05 | % | | | | 10.49 | % |
With Sales Charge | | | | 7.18 | | | | | 10.10 | | | | | 7.01 | | | | | 9.96 | |
Class C Shares (With Predecessor) – Inception 5/1/2002 | | | | | | | | | | | | | | | | | | | | |
Without Sales Charge | | | | 12.14 | | | | | 14.70 | | | | | 7.26 | | | | | 9.67 | |
With Sales Charge | | | | 11.14 | | | | | 13.70 | | | | | 7.26 | | | | | 9.67 | |
Class I Shares (With Predecessor) – Inception 5/1/2002 | | | | 12.61 | | | | | 15.94 | | | | | 8.34 | | | | | 10.77 | |
Class T Shares – Inception 2/28/2017 | | | | | | | | | | | | | | | | | | | | |
Without Sales Charge | | | | | | | | | | | | | | | | | | | 1.86 | ^ |
With Sales Charge | | | | | | | | | | | | | | | | | | | -0.66 | ^ |
Performance data quoted represents past performance, which is no guarantee of future results. Current performance may be lower or higher than the performance quoted. The principal value and investment return of an investment will fluctuate so that your shares, when redeemed, may be worth more or less than their original cost.
As of the prospectus dated 2/28/27, the Fund’s gross expense ratio for Class A shares is 4.29%; Class C shares is 5.07%; Class I and Class T shares is 4.29%. The Fund’s investment advisor has contractually agreed to reimburse Fund expenses through March 31, 2019, to the extent necessary so that Total Annual Fund Operating Expenses (excluding taxes, interest, short interest, short dividend expenses, brokerage commissions, acquired fund fees and expenses, and extraordinary expenses, if any) of Class A, Class C, Class I and Class T shares are 3.24%, 3.94%, 3.02%, and 3.24%. The expense ratios shown above may differ from the more recent expense ratios reported in the Financial Highlights section of this report.
| † | Average annual total return measures net investment income and capital gain or loss from portfolio investments as an annualized average assuming reinvestment of dividends and capital gains distributions. Load-adjusted returns are adjusted for the maximum front-end sales load of 4.75% for Class A shares. Returns for Class C shares have been adjusted for the contingent deferred sales charge (CDSC). |
NOTES:
The graph does not reflect the income taxes that you would pay on fund distributions or the redemption of fund shares. Fund performance includes reinvestment of dividends and adjustment for the maximum sales charge for Class A shares. The performance of other classes will vary from the performance of the class shown based on the difference in sales charges and fees paid by shareholders investing in different share classes.
The MSCI World Index (U.S. Dollars) is a market-capitalization weighted index composed of companies representative of
the market structure of developed market countries in North America, Europe and the Asia/Pacific region. Since inception data for the index is shown from 4/30/02 since data is only available for full monthly periods. Source: Lipper, Inc.
The S&P 500 Index is an unmanaged index generally considered representative of the U.S. stock market. Source: Lipper, Inc.
The HFRI Equity Hedge Index consists of funds where portfolio managers maintain long and short positions in primarily equity and derivative securities.
Index returns assume reinvestment of dividends and do not reflect deduction of fees and expenses. It is not possible to invest directly in an index.
Expense Overview
EXPENSE OVERVIEW
As a shareholder of a mutual fund, you incur two types of costs. You incur:
1) Transaction costs, including sales charges, or loads, on purchase payment and redemption fees.
2) Ongoing costs, including management fees, distribution and/or service (12b-1) fees and other fund expenses.
The examples in this report are based on an investment of $1,000 made at the beginning of the period and held for the entire period from November 1, 2016 to April 30, 2017. It is intended to help you understand the ongoing costs associated with investing in each mutual fund and to compare these costs with the ongoing costs of investing in other mutual funds.
There are two parts of each Fund’s chart:
Actual
In this part of the chart, you’ll see the actual expenses you would have paid on a $1,000 investment made at the beginning of the period and held for the entire period in each fund from November 1, 2016 to April 30, 2017, the period covered by this report. This chart also shows the actual returns, after expenses, you would have earned during that time. This chart can help you estimate your own expenses. For example, if you invested $8,600 in Class A shares of the fund, simply divide $8,600 by $1,000, then multiply that result by the figure in the Actual Expenses per $1,000 row. In this example, you would multiply 8.6 times the figure.
Hypothetical
In this part of the chart, you’ll see the hypothetical expenses you would have paid on a $1,000 investment from November 1, 2016 to April 30, 2017, and the hypothetical returns, after expenses, you would have earned during that time. The Securities and Exchange Commission (SEC) has established the guidelines for this chart, including the assumed 5% annual rate of return before expenses, which is what you’ll see in the chart. Note that this chart will not help you determine your own expenses, but will help you compare expenses of the fund you own to the expenses of another fund since the information for that fund should be calculated using the same assumptions.
Please note that the expenses shown in the chart are meant to highlight your ongoing costs only and do not include any transactional costs, such as sales charges (loads), redemption fees or exchange fees. Therefore, the second line of the chart is useful in comparing ongoing costs only and will not help you determine the relative total costs of owning different funds. In addition, if these transaction costs were included, your costs would have been higher.
| | | | |
| 62 | | CALAMOS OPEN-END FAMILY OF FUNDS SEMIANNUAL REPORT | | |
Expense Example
The actual and hypothetical examples shown assume a $1,000 investment at the beginning of the period, November 1, 2016 and held through April 30, 2017.
| | | | | | | | | | | | | | | | | | | | | | | | |
| | | CLASS A
SHARES | | | CLASS B
SHARES | | | CLASS C
SHARES | | | CLASS I
SHARES | | | CLASS R
SHARES | | | CLASS T(1)
SHARES | |
| CALAMOS GROWTH FUND | | | | | | | | | | | | | | | | | | | | | |
Actual Expenses per $1,000** | | $ | 7.31 | | | $ | 11.24 | | | $ | 11.24 | | | $ | 6.00 | | | $ | 8.62 | | | $ | 2.36 | |
Actual – Ending Balance | | $ | 1,122.20 | | | $ | 1,118.00 | | | $ | 1,118.00 | | | $ | 1,123.60 | | | $ | 1,120.80 | | | $ | 1,028.80 | |
| | | | |
Hypothetical Expenses per $1,000* | | $ | 6.95 | | | $ | 10.69 | | | $ | 10.69 | | | $ | 5.71 | | | $ | 8.20 | | | $ | 2.33 | |
Hypothetical – Ending Value | | $ | 1,017.90 | | | $ | 1,014.18 | | | $ | 1,014.18 | | | $ | 1,019.14 | | | $ | 1,016.66 | | | $ | 1,006.17 | |
| | | | |
Annualized expense ratio(2) | | | 1.39% | | | | 2.14% | | | | 2.14% | | | | 1.14% | | | | 1.64% | | | | 1.37% | |
| CALAMOS OPPORTUNISTIC VALUE FUND | | | | | | | | | | | | | | | | | | | | | |
Actual Expenses per $1,000* | | $ | 6.01 | | | $ | 9.91 | | | $ | 9.92 | | | $ | 4.71 | | | $ | 7.32 | | | $ | 1.94 | |
Actual – Ending Balance | | $ | 1,108.50 | | | $ | 1,104.10 | | | $ | 1,105.10 | | | $ | 1,110.80 | | | $ | 1,107.50 | | | $ | 988.60 | |
| | | | |
Hypothetical Expenses per $1,000* | | $ | 5.76 | | | $ | 9.49 | | | $ | 9.49 | | | $ | 4.51 | | | $ | 7.00 | | | $ | 1.96 | |
Hypothetical – Ending Value | | $ | 1,019.09 | | | $ | 1,015.37 | | | $ | 1,015.37 | | | $ | 1,020.33 | | | $ | 1,017.85 | | | $ | 1,006.54 | |
| | | | |
Annualized expense ratio(2) | | | 1.15% | | | | 1.90% | | | | 1.90% | | | | 0.90% | | | | 1.40% | | | | 1.15% | |
| CALAMOS DIVIDEND GROWTH FUND | | | | | | | | | | | | | | | | | | | | | |
Actual Expenses per $1,000** | | $ | 7.13 | | | $ | — | | | $ | 11.07 | | | $ | 5.82 | | | $ | — | | | $ | 2.31 | |
Actual – Ending Balance | | $ | 1,131.30 | | | $ | — | | | $ | 1,127.00 | | | $ | 1,133.50 | | | $ | — | | | $ | 1,012.00 | |
| | | | |
Hypothetical Expenses per $1,000* | | $ | 6.76 | | | $ | — | | | $ | 10.49 | | | $ | 5.51 | | | $ | — | | | $ | 2.30 | |
Hypothetical – Ending Value | | $ | 1,018.10 | | | $ | — | | | $ | 1,014.38 | | | $ | 1,019.34 | | | $ | — | | | $ | 1,006.20 | |
| | | | |
Annualized expense ratio(2) | | | 1.35% | | | | — | | | | 2.10% | | | | 1.10% | | | | — | | | | 1.35% | |
| CALAMOS INTERNATIONAL GROWTH FUND | | | | | | | | | | | | | | | | | | | | | |
Actual Expenses per $1,000** | | $ | 7.08 | | | $ | 10.99 | | | $ | 10.94 | | | $ | 5.79 | | | $ | 8.37 | | | $ | 2.35 | |
Actual – Ending Balance | | $ | 1,085.30 | | | $ | 1,081.30 | | | $ | 1,081.40 | | | $ | 1,086.70 | | | $ | 1,083.40 | | | $ | 1,064.20 | |
| | | | |
Hypothetical Expenses per $1,000* | | $ | 6.85 | | | $ | 10.64 | | | $ | 10.59 | | | $ | 5.61 | | | $ | 8.10 | | | $ | 2.28 | |
Hypothetical – Ending Value | | $ | 1,018.00 | | | $ | 1,014.23 | | | $ | 1,014.28 | | | $ | 1,019.24 | | | $ | 1,016.76 | | | $ | 1,006.22 | |
| | | | |
Annualized expense ratio(2) | | | 1.37% | | | | 2.13% | | | | 2.12% | | | | 1.12% | | | | 1.62% | | | | 1.34% | |
| CALAMOS EVOLVING WORLD GROWTH FUND | | | | | | | | | | | | | | | | | | | | | |
Actual Expenses per $1,000** | | $ | 8.75 | | | $ | 12.48 | | | $ | 12.43 | | | $ | 7.38 | | | $ | 9.91 | | | $ | 2.88 | |
Actual – Ending Balance | | $ | 1,051.20 | | | $ | 1,046.70 | | | $ | 1,046.80 | | | $ | 1,051.70 | | | $ | 1,049.20 | | �� | $ | 1,055.60 | |
| | | | |
Hypothetical Expenses per $1,000* | | $ | 8.60 | | | $ | 12.28 | | | $ | 12.23 | | | $ | 7.25 | | | $ | 9.74 | | | $ | 2.81 | |
Hypothetical – Ending Value | | $ | 1,016.27 | | | $ | 1,012.60 | | | $ | 1,012.65 | | | $ | 1,017.60 | | | $ | 1,015.13 | | | $ | 1,005.69 | |
| | | | |
Annualized expense ratio | | | 1.72% | | | | 2.46% | | | | 2.45% | | | | 1.45% | | | | 1.95% | | | | 1.65% | |
| CALAMOS EMERGING MARKET EQUITY FUND | | | | | | | | | | | | | | | | | | | | | |
Actual Expenses per $1,000* | | $ | 8.85 | | | $ | — | | | $ | 12.62 | | | $ | 7.59 | | | $ | — | | | $ | 3.05 | |
Actual – Ending Balance | | $ | 1,040.70 | | | $ | — | | | $ | 1,036.50 | | | $ | 1,041.80 | | | $ | — | | | $ | 1,052.90 | |
| | | | |
Hypothetical Expenses per $1,000* | | $ | 8.75 | | | $ | — | | | $ | 12.47 | | | $ | 7.50 | | | $ | — | | | $ | 2.98 | |
Hypothetical – Ending Value | | $ | 1,016.12 | | | $ | — | | | $ | 1,012.40 | | | $ | 1,017.36 | | | $ | — | | | $ | 1,005.52 | |
| | | | |
Annualized expense ratio(2) | | | 1.75% | | | | — | | | | 2.50% | | | | 1.50% | | | | — | | | | 1.75% | |
| * | Expenses for all Fund Classes A, B, C, I, and R are equal to the Fund’s annualized expense ratio, multiplied by the average account value over the period, multiplied by 181/365. |
| (1) | Expenses for all Fund Class T are equal to the Fund’s annualized expense ratio, multiplied by the average account value over the period, multiplied by 62/365. |
| (2) | Annualized Expense Ratios for Opportunistic Value Fund, Dividend Growth Fund, International Growth Fund, and Emerging Market Equity Fund are adjusted to reflect fee waiver. |
Expense Example
The actual and hypothetical examples shown assume a $1,000 investment at the beginning of the period, November 1, 2016 and held through April 30, 2017.
| | | | | | | | | | | | | | | | | | | | | | | | |
| | | CLASS A
SHARES | | | CLASS B
SHARES | | | CLASS C
SHARES | | | CLASS I
SHARES | | | CLASS R
SHARES | | | CLASS T(1)
SHARES | |
| CALAMOS GLOBAL EQUITY FUND | | | | | | | | | | | | | | | | | | | | | |
Actual Expenses per $1,000** | | $ | 7.14 | | | $ | 11.04 | | | $ | 11.04 | | | $ | 5.85 | | | $ | 8.45 | | | $ | 2.33 | |
Actual – Ending Balance | | $ | 1,103.40 | | | $ | 1,099.70 | | | $ | 1,100.00 | | | $ | 1,105.60 | | | $ | 1,102.90 | | | $ | 1,049.20 | |
| | | | |
Hypothetical Expenses per $1,000* | | $ | 6.85 | | | $ | 10.59 | | | $ | 10.59 | | | $ | 5.61 | | | $ | 8.10 | | | $ | 2.28 | |
Hypothetical – Ending Value | | $ | 1,018.00 | | | $ | 1,014.28 | | | $ | 1,014.28 | | | $ | 1,019.24 | | | $ | 1,016.76 | | | $ | 1,006.22 | |
| | | | |
Annualized expense ratio(2) | | | 1.37% | | | | 2.12% | | | | 2.12% | | | | 1.12% | | | | 1.62% | | | | 1.34% | |
| CALAMOS GROWTH AND INCOME FUND | | | | | | | | | | | | | | | | | | | | | |
Actual Expenses per $1,000** | | $ | 5.83 | | | $ | 9.71 | | | $ | 9.71 | | | $ | 4.53 | | | $ | 7.12 | | | $ | 1.90 | |
Actual – Ending Balance | | $ | 1,097.80 | | | $ | 1,093.30 | | | $ | 1,093.90 | | | $ | 1,099.50 | | | $ | 1,096.90 | | | $ | 1,011.90 | |
| | | | |
Hypothetical Expenses per $1,000* | | $ | 5.61 | | | $ | 9.35 | | | $ | 9.35 | | | $ | 4.36 | | | $ | 6.85 | | | $ | 1.89 | |
Hypothetical – Ending Value | | $ | 1,019.24 | | | $ | 1,015.52 | | | $ | 1,015.52 | | | $ | 1,020.48 | | | $ | 1,018.00 | | | $ | 1,006.61 | |
| | | | |
Annualized expense ratio(2) | | | 1.12% | | | | 1.87% | | | | 1.87% | | | | 0.87% | | | | 1.37% | | | | 1.11% | |
| CALAMOS GLOBAL GROWTH AND INCOME FUND | | | | | | | | | | | | | | | | | | | | | |
Actual Expenses per $1,000** | | $ | 7.90 | | | $ | 11.74 | | | $ | 11.73 | | | $ | 6.63 | | | $ | 9.18 | | | $ | 2.68 | |
Actual – Ending Balance | | $ | 1,069.70 | | | $ | 1,066.90 | | | $ | 1,066.60 | | | $ | 1,072.60 | | | $ | 1,069.50 | | | $ | 1,032.10 | |
| | | | |
Hypothetical Expenses per $1,000* | | $ | 7.70 | | | $ | 11.43 | | | $ | 11.43 | | | $ | 6.46 | | | $ | 8.95 | | | $ | 2.64 | |
Hypothetical – Ending Value | | $ | 1,017.16 | | | $ | 1,013.44 | | | $ | 1,013.44 | | | $ | 1,018.40 | | | $ | 1,015.92 | | | $ | 1,005.86 | |
| | | | |
Annualized expense ratio | | | 1.54% | | | | 2.29% | | | | 2.29% | | | | 1.29% | | | | 1.79% | | | | 1.55% | |
| CALAMOS CONVERTIBLE FUND | | | | | | | | | | | | | | | | | | | | | |
Actual Expenses per $1,000** | | $ | 6.11 | | | $ | 10.03 | | | $ | 10.02 | | | $ | 4.87 | | | $ | 7.40 | | | $ | 1.99 | |
Actual – Ending Balance | | $ | 1,088.80 | | | $ | 1,084.70 | | | $ | 1,084.10 | | | $ | 1,090.10 | | | $ | 1,087.10 | | | $ | 1,019.30 | |
| | | | |
Hypothetical Expenses per $1,000* | | $ | 5.91 | | | $ | 9.69 | | | $ | 9.69 | | | $ | 4.71 | | | $ | 7.15 | | | $ | 1.98 | |
Hypothetical – Ending Value | | $ | 1,018.94 | | | $ | 1,015.17 | | | $ | 1,015.17 | | | $ | 1,020.13 | | | $ | 1,017.70 | | | $ | 1,006.52 | |
| | | | |
Annualized expense ratio(2) | | | 1.18% | | | | 1.94% | | | | 1.94% | | | | 0.94% | | | | 1.43% | | | | 1.16% | |
| CALAMOS GLOBAL CONVERTIBLE FUND | | | | | | | | | | | | | | | | | | | | | |
Actual Expenses per $1,000** | | $ | 6.94 | | | $ | — | | | $ | 10.76 | | | $ | 5.65 | | | $ | 8.21 | | | $ | 2.33 | |
Actual – Ending Balance | | $ | 1,072.00 | | | $ | — | | | $ | 1,067.00 | | | $ | 1,072.00 | | | $ | 1,069.30 | | | $ | 1,033.10 | |
| | | | |
Hypothetical Expenses per $1,000* | | $ | 6.76 | | | $ | — | | | $ | 10.49 | | | $ | 5.51 | | | $ | 8.00 | | | $ | 2.30 | |
Hypothetical – Ending Value | | $ | 1,018.10 | | | $ | — | | | $ | 1,014.38 | | | $ | 1,019.34 | | | $ | 1,016.86 | | | $ | 1,006.20 | |
| | | | |
Annualized expense ratio(2) | | | 1.35% | | | | — | | | | 2.10% | | | | 1.10% | | | | 1.60% | | | | 1.35% | |
| CALAMOS TOTAL RETURN BOND FUND | | | | | | | | | | | | | | | | | | | | | |
Actual Expenses per $1,000** | | $ | 4.46 | | | $ | 8.16 | | | $ | 8.16 | | | $ | 3.22 | | | $ | 5.69 | | | $ | 1.53 | |
Actual – Ending Balance | | $ | 998.20 | | | $ | 995.40 | | | $ | 994.50 | | | $ | 999.40 | | | $ | 996.90 | | | $ | 1,007.50 | |
| | | | |
Hypothetical Expenses per $1,000* | | $ | 4.51 | | | $ | 8.25 | | | $ | 8.25 | | | $ | 3.26 | | | $ | 5.76 | | | $ | 1.53 | |
Hypothetical – Ending Value | | $ | 1,020.33 | | | $ | 1,016.61 | | | $ | 1,016.61 | | | $ | 1,021.57 | | | $ | 1,019.09 | | | $ | 1,006.96 | |
| | | | |
Annualized expense ratio(2) | | | 0.90% | | | | 1.65% | | | | 1.65% | | | | 0.65% | | | | 1.15% | | | | 0.90% | |
| * | Expenses for all Fund Classes A, B, C, I, and R are equal to the Fund’s annualized expense ratio, multiplied by the average account value over the period, multiplied by 181/365. |
| (1) | Expenses for all Fund Class T are equal to the Fund’s annualized expense ratio, multiplied by the average account value over the period, multiplied by 62/365. |
| (2) | Annualized Expense Ratios for Global Equity Fund, Global Convertible Fund, and Total Return Bond Fund are adjusted to reflect fee waiver. |
| | | | |
| 64 | | CALAMOS OPEN-END FAMILY OF FUNDS SEMIANNUAL REPORT | | |
Expense Example
The actual and hypothetical examples shown assume a $1,000 investment at the beginning of the period, November 1, 2016 and held through April 30, 2017.
| | | | | | | | | | | | | | | | | | | | | | | | |
| | | CLASS A
SHARES | | | CLASS B
SHARES | | | CLASS C
SHARES | | | CLASS I
SHARES | | | CLASS R
SHARES | | | CLASS T(1)
SHARES | |
| CALAMOS HIGH INCOME FUND | | | | | | | | | | | | | | | | | | | | | |
Actual Expenses per $1,000** | | $ | 7.32 | | | $ | 11.11 | | | $ | 11.11 | | | $ | 6.05 | | | $ | 8.58 | | | $ | 2.42 | |
Actual – Ending Balance | | $ | 1,049.90 | | | $ | 1,045.50 | | | $ | 1,046.00 | | | $ | 1,051.20 | | | $ | 1,047.20 | | | $ | 1,007.50 | |
| | | | |
Hypothetical Expenses per $1,000* | | $ | 7.20 | | | $ | 10.94 | | | $ | 10.94 | | | $ | 5.96 | | | $ | 8.45 | | | $ | 2.42 | |
Hypothetical – Ending Value | | $ | 1,017.65 | | | $ | 1,013.93 | | | $ | 1,013.93 | | | $ | 1,018.89 | | | $ | 1,016.41 | | | $ | 1,006.08 | |
| | | | |
Annualized expense ratio(2) | | | 1.44% | | | | 2.19% | | | | 2.19% | | | | 1.19% | | | | 1.69% | | | | 1.42% | |
| CALAMOS MARKET NEUTRAL INCOME FUND | | | | | | | | | | | | | | | | | | | | | |
Actual Expenses per $1,000** | | $ | 6.39 | | | $ | 10.15 | | | $ | 10.15 | | | $ | 5.09 | | | $ | 7.65 | | | $ | 2.08 | |
Actual – Ending Balance | | $ | 1,029.20 | | | $ | 1,025.90 | | | $ | 1,025.70 | | | $ | 1,031.70 | | | $ | 1,028.90 | | | $ | 1,003.30 | |
| | | | |
Hypothetical Expenses per $1,000* | | $ | 6.36 | | | $ | 10.09 | | | $ | 10.09 | | | $ | 5.06 | | | $ | 7.60 | | | $ | 2.08 | |
Hypothetical – Ending Value | | $ | 1,018.50 | | | $ | 1,014.78 | | | $ | 1,014.78 | | | $ | 1,019.79 | | | $ | 1,017.26 | | | $ | 1,006.42 | |
| | | | |
Annualized expense ratio(2)(3) | | | 1.27% | | | | 2.02% | | | | 2.02% | | | | 1.01% | | | | 1.52% | | | | 1.22% | |
| CALAMOS HEDGED EQUITY INCOME FUND | | | | | | | | | | | | | | | | | | | | | |
Actual Expenses per $1,000** | | $ | 6.22 | | | $ | — | | | $ | 10.03 | | | $ | 4.95 | | | $ | — | | | $ | 1.96 | |
Actual – Ending Balance | | $ | 1,056.40 | | | $ | — | | | $ | 1,052.90 | | | $ | 1,057.70 | | | $ | — | | | $ | 1,003.20 | |
| | | | |
Hypothetical Expenses per $1,000* | | $ | 6.11 | | | $ | — | | | $ | 9.84 | | | $ | 4.86 | | | $ | — | | | $ | 1.96 | |
Hypothetical – Ending Value | | $ | 1,018.75 | | | $ | — | | | $ | 1,015.03 | | | $ | 1,019.98 | | | $ | — | | | $ | 1,006.54 | |
| | | | |
Annualized expense ratio(2) | | | 1.22% | | | | — | | | | 1.97% | | | | 0.97% | | | | — | | | | 1.15% | |
| CALAMOS PHINEUS LONG/SHORT FUND | | | | | | | | | | | | | | | | | | | | | |
Actual Expenses per $1,000** | | $ | 14.86 | | | $ | — | | | $ | 18.62 | | | $ | 13.28 | | | $ | — | | | $ | 5.28 | |
Actual – Ending Balance | | $ | 1,125.60 | | | $ | — | | | $ | 1,121.40 | | | $ | 1,126.10 | | | $ | — | | | $ | 1,018.60 | |
| | | | |
Hypothetical Expenses per $1,000* | | $ | 14.06 | | | $ | — | | | $ | 17.62 | | | $ | 12.57 | | | $ | — | | | $ | 5.24 | |
Hypothetical – Ending Value | | $ | 1,010.81 | | | $ | — | | | $ | 1,007.24 | | | $ | 1,012.30 | | | $ | — | | | $ | 1,003.26 | |
| | | | |
Annualized expense ratio(2)(3) | | | 2.82% | | | | — | | | | 3.54% | | | | 2.52% | | | | — | | | | 3.08% | |
| * | Expenses for all Fund Classes A, B, C, I, and R are equal to the Fund’s annualized expense ratio, multiplied by the average account value over the period, multiplied by 181/365. |
| (1) | Expenses for all Fund Class T are equal to the Fund’s annualized expense ratio, multiplied by the average account value over the period, multiplied by 62/365. |
| (2) | Annualized Expense Ratios for Hedged Equity Income Fund and Phineus Long/Short Fund are adjusted to reflect fee waiver. |
| (3) | Includes 0.19% and 0.97% related to dividend expense on short positions for Market Neutral Income Fund and Phineus Long/Short Fund. |
Growth Fund Schedule of Investments April 30, 2017 (Unaudited)
| | | | | | | | | | |
NUMBER OF
SHARES | | | | | | | VALUE | |
| | COMMON STOCKS (98.9%) | |
| | | | | | Consumer Discretionary (19.7%) | |
| | 59,300 | | | | | Advance Auto Parts, Inc. | | $ | 8,428,902 | |
| | 53,320 | | | | | Amazon.com, Inc.# | | | 49,320,467 | |
| | 241,800 | | | | | CarMax, Inc.#^ | | | 14,145,300 | |
| | 269,900 | | | | | Choice Hotels International, Inc. | | | 16,922,730 | |
| | 1,194,200 | | | | | Comcast Corp. - Class A | | | 46,800,698 | |
| | 405,000 | | | | | DeVry Education Group, Inc. | | | 15,329,250 | |
| | 118,200 | | | | | Expedia, Inc. | | | 15,805,704 | |
| | 35,200 | | | | | Home Depot, Inc. | | | 5,494,720 | |
| | 149,100 | | | | | Liberty Broadband Corp.# | | | 13,408,563 | |
| | 215,000 | | | | | Lowe’s Companies, Inc. | | | 18,249,200 | |
| | 798,400 | | | | | MGM Resorts International | | | 24,518,864 | |
| | 41,700 | | | | | Mohawk Industries, Inc.# | | | 9,790,743 | |
| | 15,500 | | | | | Priceline Group, Inc.# | | | 28,625,710 | |
| | 673,300 | | | | | PulteGroup, Inc. | | | 15,263,711 | |
| | 404,100 | | | | | Starbucks Corp. | | | 24,270,246 | |
| | 113,700 | | | | | TJX Companies, Inc. | | | 8,941,368 | |
| | 234,400 | | | | | Walt Disney Company | | | 27,096,640 | |
| | | | | | | | | | |
| | | | | | | | | 342,412,816 | |
| | | | | | | | | | |
| | | | | | Consumer Staples (3.6%) | |
| | 147,700 | | | | | Constellation Brands, Inc. - Class A | | | 25,484,158 | |
| | 512,800 | | | | | Kroger Company~ | | | 15,204,520 | |
| | 492,500 | | | | | Monster Beverage Corp.# | | | 22,349,650 | |
| | | | | | | | | | |
| | | | | | | | | 63,038,328 | |
| | | | | | | | | | |
| | | | | | Energy (2.4%) | | | | |
| | 261,900 | | | | | Halliburton Company | | | 12,015,972 | |
| | 89,100 | | | | | Hess Corp. | | | 4,350,753 | |
| | 199,900 | | | | | Schlumberger, Ltd. | | | 14,510,741 | |
| | 348,600 | | | | | Tenaris, SA^~ | | | 10,886,778 | |
| | | | | | | | | | |
| | | | | | | | | 41,764,244 | |
| | | | | | | | | | |
| | | | | | Financials (9.1%) | | | | |
| | 264,700 | | | | | CBOE Holdings, Inc. | | | 21,813,927 | |
| | 294,700 | | | | | Citigroup, Inc. | | | 17,422,664 | |
| | 663,100 | | | | | E*TRADE Financial Corp.# | | | 22,910,105 | |
| | 484,900 | | | | | First Horizon National Corp. | | | 8,897,915 | |
| | 400,500 | | | | | Intercontinental Exchange, Inc.~ | | | 24,110,100 | |
| | 1,005,500 | | | | | Radian Group, Inc. | | | 16,972,840 | |
| | 88,100 | | | | | S&P Global, Inc. | | | 11,822,139 | |
| | 1,147,000 | | | | | SLM Corp.# | | | 14,383,380 | |
| | 367,200 | | | | | Synchrony Financial | | | 10,208,160 | |
| | 258,500 | | | | | Zions Bancorporation | | | 10,347,755 | |
| | | | | | | | | | |
| | | | | | | | | 158,888,985 | |
| | | | | | | | | | |
| | | | | | Health Care (12.5%) | | | | |
| | 220,300 | | | | | Aetna, Inc. | | | 29,755,921 | |
| | 75,900 | | | | | Alexion Pharmaceuticals, Inc.# | | | 9,698,502 | |
| | | | | | | | | | |
NUMBER OF
SHARES | | | | | | | VALUE | |
| | 62,400 | | | | | Allergan, PLC | | $ | 15,216,864 | |
| | 107,000 | | | | | Amgen, Inc. | | | 17,475,240 | |
| | 586,600 | | | | | Baxter International, Inc. | | | 32,661,888 | |
| | 259,550 | | | | | Celgene Corp.# | | | 32,197,177 | |
| | 72,800 | | | | | Cooper Companies, Inc. | | | 14,584,024 | |
| | 125,400 | | | | | HCA Holdings, Inc.# | | | 10,559,934 | |
| | 430,658 | | | | | Hologic, Inc.# | | | 19,444,209 | |
| | 90,500 | | | | | Incyte Corp.# | | | 11,247,340 | |
| | 57,100 | | | | | UnitedHealth Group, Inc. | | | 9,985,648 | |
| | 263,900 | | | | | Zoetis, Inc. | | | 14,807,429 | |
| | | | | | | | | | |
| | | | | | | | | 217,634,176 | |
| | | | | | | | | | |
| | | | | | Industrials (14.6%) | | | | |
| | 368,600 | | | | | AECOM# | | | 12,609,806 | |
| | 395,800 | | | | | Air Lease Corp. | | | 15,095,812 | |
| | 211,400 | | | | | BWX Technologies, Inc. | | | 10,394,538 | |
| | 116,900 | | | | | Cintas Corp. | | | 14,316,743 | |
| | 274,300 | | | | | Colfax Corp.# | | | 11,100,921 | |
| | 297,300 | | | | | CSX Corp. | | | 15,114,732 | |
| | 250,300 | | | | | Delta Air Lines, Inc. | | | 11,373,632 | |
| | 251,600 | | | | | Flowserve Corp. | | | 12,798,892 | |
| | 259,500 | | | | | Genesee & Wyoming, Inc. - Class A# | | | 17,583,720 | |
| | 105,400 | | | | | L3 Technologies, Inc. | | | 18,104,558 | |
| | 144,100 | | | | | Masco Corp. | | | 5,334,582 | |
| | 74,600 | | | | | Parker-Hannifin Corp. | | | 11,995,680 | |
| | 120,800 | | | | | Raytheon Company | | | 18,749,368 | |
| | 234,100 | | | | | Spirit Airlines, Inc.# | | | 13,406,907 | |
| | 304,700 | | | | | TransUnion#~ | | | 12,197,141 | |
| | 398,600 | | | | | Waste Connections, Inc. | | | 36,679,172 | |
| | 241,900 | | | | | Waste Management, Inc. | | | 17,605,482 | |
| | | | | | | | | | |
| | | | | | | | | 254,461,686 | |
| | | | | | | | | | |
| | | | | | Information Technology (34.2%) | | | | |
| | 105,200 | | | | | Alphabet, Inc. - Class A# | | | 97,259,504 | |
| | 661,600 | | | | | Apple, Inc. | | | 95,038,840 | |
| | 391,300 | | | | | Applied Materials, Inc. | | | 15,890,693 | |
| | 326,700 | | | | | Facebook, Inc. - Class A# | | | 49,086,675 | |
| | 263,050 | | | | | Fidelity National Information Services, Inc. | | | 22,146,179 | |
| | 119,600 | | | | | FleetCor Technologies, Inc.# | | | 16,880,344 | |
| | 131,400 | | | | | Harris Corp. | | | 14,702,346 | |
| | 340,900 | | | | | InterXion Holding, NV# | | | 14,201,894 | |
| | 140,400 | | | | | Intuit, Inc.~ | | | 17,579,484 | |
| | 264,600 | | | | | Lumentum Holdings, Inc.# | | | 11,311,650 | |
| | 127,000 | | | | | Microchip Technology, Inc. | | | 9,598,660 | |
| | 663,900 | | | | | Microsoft Corp. | | | 45,450,594 | |
| | 636,300 | | | | | NCR Corp.# | | | 26,247,375 | |
| | 645,700 | | | | | ON Semiconductor Corp.# | | | 9,156,026 | |
| | 195,200 | | | | | Paycom Software, Inc.# | | | 11,760,800 | |
| | 416,600 | | | | | PayPal Holdings, Inc.# | | | 19,880,152 | |
| | | | |
| 66 | | CALAMOS OPEN-END FAMILY OF FUNDS SEMIANNUAL REPORT | | See accompanying Notes to Schedule of Investments |
Growth Fund Schedule of Investments April 30, 2017 (Unaudited)
| | | | | | | | | | |
NUMBER OF
SHARES | | | | | | | VALUE | |
| | 232,000 | | | | | Salesforce.com, Inc.# | | $ | 19,979,840 | |
| | 122,600 | | | | | Tech Data Corp.# | | | 11,726,690 | |
| | 219,100 | | | | | Total System Services, Inc.~ | | | 12,556,621 | |
| | 454,600 | | | | | Visa, Inc. - Class A | | | 41,468,612 | |
| | 200,000 | | | | | Workday, Inc. - Class A# | | | 17,480,000 | |
| | 592,800 | | | | | Zendesk, Inc.#~ | | | 17,043,000 | |
| | | | | | | | | | |
| | | | | | | | | 596,445,979 | |
| | | | | | | | | | |
| | | | | | Materials (2.8%) | | | | |
| | 109,800 | | | | | Celanese Corp. | | | 9,556,992 | |
| | 128,800 | | | | | Eagle Materials, Inc. | | | 12,360,936 | |
| | 369,900 | | | | | Steel Dynamics, Inc. | | | 13,368,186 | |
| | 107,200 | | | | | Vulcan Materials Company | | | 12,958,336 | |
| | | | | | | | | | |
| | | | | | | | | 48,244,450 | |
| | | | | | | | | | |
| | | | | | TOTAL COMMON STOCKS
(Cost $1,355,614,671) | | | 1,722,890,664 | |
| | | | | | | | | | |
NUMBER OF
CONTRACTS/
NOTIONAL
AMOUNT | | | | | | | VALUE | |
| | | | | | | | | | |
| | PURCHASED OPTIONS (0.2%) # | |
| | | | | | Health Care (0.0%) | | | | |
| 1,900
190,000 |
| | | | Gilead Sciences, Inc.
Call, 06/16/17, Strike $67.50 | | | 523,450 | |
| | | | | | | | | | |
| | | | | | Consumer Discretionary (0.2%) | |
| 485
48,500 |
| | | | Tesla, Inc.
Call, 11/17/17, Strike $270.00 | | | 2,942,738 | |
| | | | | | | | | | |
| | | | | | Information Technology (0.0%) | |
| 3,300
330,000 |
| | | | Apple, Inc.
Put, 05/05/17, Strike $140.00 | | | 366,300 | |
| | | | | | | | | | |
| | | | | | TOTAL PURCHASED OPTIONS
(Cost $2,242,914) | | | 3,832,488 | |
| | | | | | | | | | |
| | | | | | | | | | |
NUMBER OF
SHARES | | | | | | | VALUE | |
| | SHORT TERM INVESTMENTS (0.4%) | | | | |
| | 3,330,529 | | | | | Fidelity Prime Money Market Fund - Institutional Class | | | 3,331,862 | |
| | 3,154,814 | | | | | Morgan Stanley Institutional Liquidity Funds - Government Portfolio | | | 3,154,814 | |
| | | | | | | | | | |
| | | | | | TOTAL SHORT TERM INVESTMENTS
(Cost $6,486,676) | | | 6,486,676 | |
| | | | | | | | | | |
| | | | | | | | | | |
NUMBER OF
SHARES/
PRINCIPAL
AMOUNT | | | | | | | VALUE | |
| INVESTMENT OF CASH COLLATERAL FOR SECURITIES
LOANED (0.4%) |
|
| | 4,107,214 | | | | | Deutsche Bank Securities, Inc.†
0.830%, 05/01/17 | | $ | 4,107,214 | |
| | 2,232,182 | | | | | Goldman Sachs Financial Square Government Fund | | | 2,232,182 | |
| | | | | | | | | | |
| | | | | | TOTAL INVESTMENT OF CASH COLLATERAL FOR SECURITIES LOANED
(Cost $6,339,396) | | | 6,339,396 | |
| | | | | | | | | | |
| TOTAL INVESTMENTS (99.9%)
(Cost $1,370,683,657) | | | 1,739,549,224 | |
| | | | | | | | | | |
| |
| | PAYABLE UPON RETURN OF SECURITIES ON LOAN (-0.4%) | | | (6,339,396 | ) |
| | | | | | | | | | |
| |
| | OTHER ASSETS, LESS LIABILITIES (0.5%) | | | 8,715,006 | |
| | | | | | | | | | |
| |
| | NET ASSETS (100.0%) | | $ | 1,741,924,834 | |
| | | | | | | | | | |
| | | | | | | | | | |
NUMBER OF
CONTRACTS/
NOTIONAL
AMOUNT | | | | | | | VALUE | |
| | WRITTEN OPTIONS (0.0%) # | |
| | | | | | Consumer Discretionary (0.0%) | |
| 485
48,500 |
| | | | Tesla, Inc.
Put, 05/05/17, Strike $290.00 | | | (83,905 | ) |
| 670
67,000 |
| | | | Ulta Beauty, Inc.
Put, 06/16/17, Strike $260.00 | | | (237,850 | ) |
| | | | | | | | | | |
| | | | | | | | | (321,755 | ) |
| | | | | | | | | | |
| | | | | | Health Care (0.0%) | |
| 3,800
380,000 |
| | | | Gilead Sciences, Inc.
Put, 06/16/17, Strike $62.50 | | | (197,600 | ) |
| | | | | | | | | | |
| | | | | | TOTAL WRITTEN OPTIONS
(Premium $904,713) | | $ | (519,355 | ) |
| | | | | | | | | | |
NOTES TO SCHEDULE OF INVESTMENTS
| # | Non-income producing security. |
| ^ | Security, or portion of security, is on loan. |
| ~ | Security, or portion of security, is segregated as collateral (or potential collateral for future transactions) for written options. The aggregate value of such securities is $20,874,005. |
| † | Repurchase agreement collateralized by the following security: 4,189,186 United States Treasury Note, 3.625%, 02/15/20. |
| | | | | | |
| See accompanying Notes to Financial Statements | | www.calamos.com | | | 67 | |
Opportunistic Value Fund Schedule of Investments April 30, 2017 (Unaudited)
| | | | | | | | | | |
NUMBER OF
SHARES | | | | | | | VALUE | |
| | COMMON STOCKS (98.1%) | |
| | | | | | Consumer Discretionary (9.8%) | |
| | 775 | | | | | Amazon.com, Inc.# | | $ | 716,867 | |
| | 3,600 | | | | | Carnival Corp. | | | 222,372 | |
| | 13,270 | | | | | Comcast Corp. - Class A | | | 520,051 | |
| | 5,170 | | | | | D.R. Horton, Inc. | | | 170,041 | |
| | 6,900 | | | | | Discovery Communications, Inc. - Class A# | | | 198,582 | |
| | 2,700 | | | | | Foot Locker, Inc. | | | 208,818 | |
| | 4,810 | | | | | General Motors Company, Inc. | | | 166,619 | |
| | 7,660 | | | | | Gentex Corp. | | | 158,179 | |
| | 3,365 | | | | | Home Depot, Inc. | | | 525,277 | |
| | 1,200 | | | | | Lear Corp. | | | 171,192 | |
| | 2,070 | | | | | McDonald’s Corp. | | | 289,655 | |
| | 840 | | | | | Mohawk Industries, Inc.# | | | 197,224 | |
| | 3,530 | | | | | Nike, Inc. - Class B | | | 195,597 | |
| | 215 | | | | | Priceline Group, Inc.# | | | 397,066 | |
| | 1,490 | | | | | PVH Corp. | | | 150,535 | |
| | 4,180 | | | | | Starbucks Corp. | | | 251,051 | |
| | 3,600 | | | | | Time Warner, Inc. | | | 357,372 | |
| | 4,850 | | | | | Walt Disney Company | | | 560,660 | |
| | | | | | | | | | |
| | | | | | | | | 5,457,158 | |
| | | | | | | | | | |
| | | | | | Consumer Staples (6.1%) | |
| | 5,340 | | | | | Altria Group, Inc. | | | 383,305 | |
| | 3,470 | | | | | Church & Dwight Company, Inc. | | | 171,869 | |
| | 3,835 | | | | | Coca-Cola Company | | | 165,480 | |
| | 2,440 | | | | | Colgate-Palmolive Company | | | 175,778 | |
| | 2,300 | | | | | CVS Health Corp. | | | 189,612 | |
| | 1,580 | | | | | Hershey Company | | | 170,956 | |
| | 1,240 | | | | | JM Smucker Company | | | 157,133 | |
| | 1,370 | | | | | Kimberly-Clark Corp. | | | 177,758 | |
| | 3,775 | | | | | Mondelez International, Inc. - Class A | | | 169,988 | |
| | 3,840 | | | | | PepsiCo, Inc. | | | 434,995 | |
| | 4,315 | | | | | Philip Morris International, Inc. | | | 478,275 | |
| | 5,380 | | | | | Procter & Gamble Company | | | 469,835 | |
| | 3,360 | | | | | Walgreens Boots Alliance, Inc. | | | 290,774 | |
| | | | | | | | | | |
| | | | | | | | | 3,435,758 | |
| | | | | | | | | | |
| | | | | | Energy (6.7%) | |
| | 5,800 | | | | | Baker Hughes, Inc. | | | 344,346 | |
| | 3,690 | | | | | Cheniere Energy, Inc.# | | | 167,342 | |
| | 3,850 | | | | | Chevron Corp. | | | 410,795 | |
| | 6,820 | | | | | ConocoPhillips | | | 326,746 | |
| | 3,730 | | | | | EOG Resources, Inc. | | | 345,025 | |
| | 9,680 | | | | | Exxon Mobil Corp. | | | 790,372 | |
| | 7,970 | | | | | Kinder Morgan, Inc. | | | 164,421 | |
| | 2,660 | | | | | Occidental Petroleum Corp. | | | 163,696 | |
| | 1,910 | | | | | Pioneer Natural Resources Company | | | 330,411 | |
| | | | | | | | | | |
NUMBER OF
SHARES | | | | | | | VALUE | |
| | 3,860 | | | | | Schlumberger, Ltd. | | $ | 280,197 | |
| | 2,050 | | | | | Tesoro Corp. | | | 163,406 | |
| | 3,850 | | | | | Valero Energy Corp. | | | 248,749 | |
| | | | | | | | | | |
| | | | | | | | | 3,735,506 | |
| | | | | | | | | | |
| | | | | | Financials (19.5%) | |
| | 3,790 | | | | | Allstate Corp. | | | 308,089 | |
| | 5,800 | | | | | American Express Company | | | 459,650 | |
| | 1,785 | | | | | Ameriprise Financial, Inc. | | | 228,212 | |
| | 1,870 | | | | | Arch Capital Group, Ltd.# | | | 181,334 | |
| | 28,090 | | | | | Bank of America Corp. | | | 655,621 | |
| | 3,630 | | | | | Bank of New York Mellon Corp. | | | 170,828 | |
| | 5,180 | | | | | Berkshire Hathaway, Inc. - Class B# | | | 855,788 | |
| | 730 | | | | | BlackRock, Inc. | | | 280,736 | |
| | 4,700 | | | | | Brown & Brown, Inc. | | | 201,630 | |
| | 5,080 | | | | | Charles Schwab Corp. | | | 197,358 | |
| | 1,080 | | | | | Chubb Corp. | | | 148,230 | |
| | 9,800 | | | | | Citigroup, Inc. | | | 579,376 | |
| | 4,509 | | | | | Commerce Bancshares, Inc. | | | 247,770 | |
| | 2,400 | | | | | Cullen/Frost Bankers, Inc. | | | 226,536 | |
| | 4,305 | | | | | Discover Financial Services | | | 269,450 | |
| | 5,875 | | | | | E*TRADE Financial Corp.# | | | 202,981 | |
| | 640 | | | | | Goldman Sachs Group, Inc. | | | 143,232 | |
| | 5,480 | | | | | Hartford Financial Services Group, Inc. | | | 265,013 | |
| | 9,715 | | | | | JPMorgan Chase & Company | | | 845,205 | |
| | 8,690 | | | | | Morgan Stanley | | | 376,885 | |
| | 2,355 | | | | | Northern Trust Corp. | | | 211,950 | |
| | 1,290 | | | | | PNC Financial Services Group, Inc. | | | 154,477 | |
| | 5,400 | | | | | Principal Financial Group, Inc. | | | 351,702 | |
| | 8,340 | | | | | Progressive Corp. | | | 331,265 | |
| | 13,700 | | | | | Regions Financial Corp. | | | 188,375 | |
| | 2,035 | | | | | Reinsurance Group of America, Inc. | | | 254,456 | |
| | 2,530 | | | | | State Street Corp. | | | 212,267 | |
| | 4,950 | | | | | Synchrony Financial | | | 137,610 | |
| | 6,590 | | | | | Synovus Financial Corp. | | | 275,462 | |
| | 3,335 | | | | | Torchmark Corp. | | | 255,828 | |
| | 5,425 | | | | | Unum Group | | | 251,340 | |
| | 10,140 | | | | | US Bancorp | | | 519,979 | |
| | 12,600 | | | | | Wells Fargo & Company | | | 678,384 | |
| | 4,680 | | | | | Western Alliance Bancorp# | | | 224,172 | |
| | | | | | | | | | |
| | | | | | | | | 10,891,191 | |
| | | | | | | | | | |
| | | | | | Health Care (11.0%) | |
| | 3,540 | | | | | Abbott Laboratories | | | 154,486 | |
| | 6,470 | | | | | AbbVie, Inc. | | | 426,632 | |
| | 4,020 | | | | | Agilent Technologies, Inc. | | | 221,301 | |
| | 2,900 | | | | | Amgen, Inc. | | | 473,628 | |
| | 5,700 | | | | | Baxter International, Inc. | | | 317,376 | |
| | 2,800 | | | | | Cardinal Health, Inc. | | | 203,252 | |
| | | | |
| 68 | | CALAMOS OPEN-END FAMILY OF FUNDS SEMIANNUAL REPORT | | See accompanying Notes to Schedule of Investments |
Opportunistic Value Fund Schedule of Investments April 30, 2017 (Unaudited)
| | | | | | | | | | |
NUMBER OF
SHARES | | | | | | | VALUE | |
| | 4,485 | | | | | Celgene Corp.# | | $ | 556,364 | |
| | 1,140 | | | | | Cigna Corp. | | | 178,262 | |
| | 890 | | | | | Cooper Companies, Inc. | | | 178,294 | |
| | 8,530 | | | | | Johnson & Johnson | | | 1,053,199 | |
| | 1,200 | | | | | Laboratory Corp. of America Holdings# | | | 168,180 | |
| | 2,050 | | | | | Medtronic, PLC | | | 170,334 | |
| | 7,440 | | | | | Merck & Company, Inc. | | | 463,735 | |
| | 8,130 | | | | | Pfizer, Inc. | | | 275,770 | |
| | 2,195 | | | | | Quest Diagnostics, Inc. | | | 231,594 | |
| | 990 | | | | | Teleflex, Inc. | | | 204,821 | |
| | 1,090 | | | | | Thermo Fisher Scientific, Inc. | | | 180,210 | |
| | 2,610 | | | | | UnitedHealth Group, Inc. | | | 456,437 | |
| | 1,500 | | | | | WellCare Health Plans, Inc.# | | | 230,115 | |
| | | | | | | | | | |
| | | | | | | | | 6,143,990 | |
| | | | | | | | | | |
| | | | | | Industrials (11.5%) | |
| | 1,450 | | | | | 3M Company | | | 283,953 | |
| | 6,285 | | | | | Allison Transmission Holdings, Inc. | | | 243,104 | |
| | 2,820 | | | | | Boeing Company | | | 521,221 | |
| | 1,470 | | | | | Caterpillar, Inc. | | | 150,322 | |
| | 2,180 | | | | | Cummins, Inc. | | | 329,049 | |
| | 4,900 | | | | | DCT Industrial Trust, Inc. | | | 247,744 | |
| | 2,510 | | | | | Emerson Electric Company | | | 151,303 | |
| | 1,370 | | | | | General Dynamics Corp. | | | 265,492 | |
| | 14,800 | | | | | General Electric Company | | | 429,052 | |
| | 2,120 | | | | | Honeywell International, Inc. | | | 278,017 | |
| | 1,890 | | | | | IDEX Corp. | | | 197,996 | |
| | 2,615 | | | | | Ingersoll-Rand, PLC | | | 232,081 | |
| | 10,550 | | | | | JetBlue Airways Corp.# | | | 230,306 | |
| | 1,120 | | | | | Lennox International, Inc. | | | 185,237 | |
| | 2,370 | | | | | MSC Industrial Direct Company, Inc. - Class A | | | 212,186 | |
| | 1,450 | | | | | Norfolk Southern Corp. | | | 170,361 | |
| | 4,320 | | | | | Owens Corning | | | 262,872 | |
| | 1,965 | | | | | Parker-Hannifin Corp. | | | 315,972 | |
| | 1,270 | | | | | Raytheon Company | | | 197,117 | |
| | 2,030 | | | | | Regal Beloit Corp. | | | 160,066 | |
| | 1,055 | | | | | Rockwell Automation, Inc. | | | 166,004 | |
| | 3,060 | | | | | Southwest Airlines Company | | | 172,033 | |
| | 3,800 | | | | | Spirit AeroSystems Holdings, Inc., - Class A | | | 217,208 | |
| | 1,630 | | | | | Stanley Black & Decker, Inc. | | | 221,925 | |
| | 4,400 | | | | | Timken Company | | | 212,300 | |
| | 3,610 | | | | | Union Pacific Corp. | | | 404,176 | |
| | | | | | | | | | |
| | | | | | | | | 6,457,097 | |
| | | | | | | | | | |
| | | | | | Information Technology (23.4%) | |
| | 1,950 | | | | | Accenture, PLC - Class A | | | 236,535 | |
| | 1,925 | | | | | Alphabet, Inc. - Class A# | | | 1,779,701 | |
| | | | | | | | | | |
NUMBER OF
SHARES | | | | | | | VALUE | |
| | 3,350 | | | | | Analog Devices, Inc. | | $ | 255,270 | |
| | 2,100 | | | | | Ansys, Inc.# | | | 231,336 | |
| | 16,250 | | | | | Apple, Inc. | | | 2,334,312 | |
| | 5,495 | | | | | Applied Materials, Inc. | | | 223,152 | |
| | 5,250 | | | | | CA, Inc. | | | 172,358 | |
| | 13,460 | | | | | Cisco Systems, Inc. | | | 458,582 | |
| | 4,600 | | | | | CoreLogic, Inc.# | | | 196,604 | |
| | 7,370 | | | | | Facebook, Inc. - Class A# | | | 1,107,342 | |
| | 6,700 | | | | | FLIR Systems, Inc. | | | 246,091 | |
| | 17,050 | | | | | Intel Corp. | | | 616,358 | |
| | 1,660 | | | | | International Business Machines Corp. | | | 266,081 | |
| | 1,660 | | | | | Lam Research Corp. | | | 240,451 | |
| | 3,640 | | | | | MasterCard, Inc. - Class A | | | 423,405 | |
| | 23,150 | | | | | Microsoft Corp. | | | 1,584,849 | |
| | 2,110 | | | | | Motorola Solutions, Inc. | | | 181,397 | |
| | 6,735 | | | | | NetApp, Inc. | | | 268,390 | |
| | 4,700 | | | | | Oracle Corp. | | | 211,312 | |
| | 3,600 | | | | | Paychex, Inc. | | | 213,408 | |
| | 7,700 | | | | | QUALCOMM, Inc. | | | 413,798 | |
| | 3,900 | | | | | Synopsys, Inc.# | | | 287,430 | |
| | 4,980 | | | | | Trimble, Inc.# | | | 176,441 | |
| | 5,240 | | | | | Visa, Inc. - Class A | | | 477,993 | |
| | 2,345 | | | | | VMware, Inc. - Class A#^ | | | 220,711 | |
| | 4,100 | | | | | Xilinx, Inc. | | | 258,751 | |
| | | | | | | | | | |
| | | | | | | | | 13,082,058 | |
| | | | | | | | | | |
| | | | | | Materials (3.0%) | |
| | 3,270 | | | | | Celanese Corp. | | | 284,621 | |
| | 4,500 | | | | | Dow Chemical Company | | | 282,600 | |
| | 2,295 | | | | | E.I. du Pont de Nemours and Company | | | 183,026 | |
| | 3,420 | | | | | Eagle Materials, Inc. | | | 328,217 | |
| | 3,090 | | | | | Eastman Chemical Company | | | 246,427 | |
| | 1,900 | | | | | Scotts Miracle-Gro Company, Class A | | | 183,540 | |
| | 3,385 | | | | | Worthington Industries, Inc. | | | 147,248 | |
| | | | | | | | | | |
| | | | | | | | | 1,655,679 | |
| | | | | | | | | | |
| | | | | | Real Estate (2.6%) | |
| | 1,470 | | | | | AvalonBay Communities, Inc. | | | 279,065 | |
| | 1,040 | | | | | Boston Properties, Inc. | | | 131,664 | |
| | 1,990 | | | | | CoreSite Realty Corp. | | | 194,721 | |
| | 2,440 | | | | | Digital Realty Trust, Inc. | | | 280,210 | |
| | 17,100 | | | | | Host Hotels & Resorts, Inc. | | | 306,945 | |
| | 5,070 | | | | | Prologis, Inc. | | | 275,859 | |
| | | | | | | | | | |
| | | | | | | | | 1,468,464 | |
| | | | | | | | | | |
| | | | | | Telecommunication Services (1.2%) | |
| | 10,150 | | | | | AT&T, Inc. | | | 402,245 | |
| | 5,610 | | | | | Verizon Communications, Inc. | | | 257,555 | |
| | | | | | | | | | |
| | | | | | | | | 659,800 | |
| | | | | | | | | | |
| | | | | | |
| See accompanying Notes to Schedule of Investments | | www.calamos.com | | | 69 | |
Opportunistic Value Fund Schedule of Investments April 30, 2017 (Unaudited)
| | | | | | | | | | |
NUMBER OF
SHARES | | | | | | | VALUE | |
| | | | | | Utilities (3.3%) | |
| | 3,480 | | | | | Ameren Corp. | | $ | 190,321 | |
| | 4,055 | | | | | CMS Energy Corp. | | | 184,097 | |
| | 2,480 | | | | | Dominion Resources, Inc. | | | 192,026 | |
| | 1,670 | | | | | Duke Energy Corp. | | | 137,775 | |
| | 4,345 | | | | | Exelon Corp. | | | 150,467 | |
| | 2,150 | | | | | NextEra Energy, Inc. | | | 287,154 | |
| | 2,790 | | | | | PG&E Corp. | | | 187,070 | |
| | 3,800 | | | | | PPL Corp. | | | 144,818 | |
| | 3,835 | | | | | Southern Company | | | 190,983 | |
| | 2,100 | | | | | Southwest Gas Holdings, Inc. | | | 175,896 | |
| | | | | | | | | | |
| | | | | | | | | 1,840,607 | |
| | | | | | | | | | |
| | | | | | TOTAL COMMON STOCKS
(Cost $49,323,303) | | | 54,827,308 | |
| | | | | | | | | | |
| | | | | | | | | | |
| | SHORT TERM INVESTMENTS (0.4%) | | | | |
| | 107,559 | | | | | Fidelity Prime Money Market Fund - Institutional Class | | | 107,602 | |
| | 107,442 | | | | | Morgan Stanley Institutional Liquidity Funds - Government Portfolio | | | 107,442 | |
| | | | | | | | | | |
| | | | | | TOTAL SHORT TERM INVESTMENTS
(Cost $215,044) | | | 215,044 | |
| | | | | | | | | | |
| | | | | | | | | | |
NUMBER OF
SHARES/
PRINCIPAL
AMOUNT | | | | | | | VALUE | |
| INVESTMENT OF CASH COLLATERAL FOR SECURITIES
LOANED (0.2%) |
|
| | 71,754 | | | | | Deutsche Bank Securities, Inc.†
0.830%, 05/01/17 | | | 71,754 | |
| | 38,997 | | | | | Goldman Sachs Financial Square Government Fund | | | 38,997 | |
| | | | | | | | | | |
| | | | | | TOTAL INVESTMENT OF
CASH COLLATERAL FOR
SECURITIES LOANED
(Cost $110,751) | | | 110,751 | |
| | | | | | | | | | |
| TOTAL INVESTMENTS (98.7%)
(Cost $49,649,098) | | | 55,153,103 | |
| | | | | | | | | | |
| |
| | PAYABLE UPON RETURN OF SECURITIES ON LOAN (-0.2%) | | | (110,751 | ) |
| | | | | | | | | | |
| |
| | OTHER ASSETS, LESS LIABILITIES (1.5%) | | | 830,664 | |
| | | | | | | | | | |
| |
| | NET ASSETS (100.0%) | | $ | 55,873,016 | |
| | | | | | | | | | |
NOTES TO SCHEDULE OF INVESTMENTS
| # | Non-income producing security. |
| ^ | Security, or portion of security, is on loan. |
| † | Repurchase agreement collateralized by the following security: 73,186 United States Treasury Note, 3.625%, 02/15/20. |
| | | | |
| 70 | | CALAMOS OPEN-END FAMILY OF FUNDS SEMIANNUAL REPORT | | See accompanying Notes to Financial Statements |
Dividend Growth Fund Schedule of Investments April 30, 2017 (Unaudited)
| | | | | | | | | | |
NUMBER OF
SHARES | | | | | | | VALUE | |
| | COMMON STOCKS (99.0%) | |
| | | | | | Consumer Discretionary (13.9%) | |
| | 645 | | | | | Amazon.com, Inc.# | | $ | 596,618 | |
| | 685 | | | | | Charter Communications, Inc.# | | | 236,435 | |
| | 9,100 | | | | | Comcast Corp. - Class A | | | 356,629 | |
| | 8,340 | | | | | Ford Motor Company | | | 95,660 | |
| | 3,530 | | | | | General Motors Company, Inc. | | | 122,279 | |
| | 2,230 | | | | | Home Depot, Inc. | | | 348,103 | |
| | 2,040 | | | | | Lowe’s Companies, Inc. | | | 173,155 | |
| | 2,030 | | | | | McDonald’s Corp. | | | 284,058 | |
| | 410 | | | | | Netflix, Inc.# | | | 62,402 | |
| | 3,120 | | | | | Newell Rubbermaid, Inc. | | | 148,949 | |
| | 3,100 | | | | | Nike, Inc. - Class B | | | 171,771 | |
| | 1,055 | | | | | Omnicom Group, Inc. | | | 86,637 | |
| | 130 | | | | | Priceline Group, Inc.# | | | 240,087 | |
| | 1,205 | | | | | Royal Caribbean Cruises, Ltd. | | | 128,453 | |
| | 400 | | | | | Sherwin-Williams Company | | | 133,872 | |
| | 4,015 | | | | | Starbucks Corp. | | | 241,141 | |
| | 2,165 | | | | | Target Corp. | | | 120,915 | |
| | 2,315 | | | | | Time Warner, Inc. | | | 229,810 | |
| | 3,100 | | | | | Walt Disney Company | | | 358,360 | |
| | | | | | | | | | |
| | | | | | | | | 4,135,334 | |
| | | | | | | | | | |
| | | | | | Consumer Staples (8.9%) | |
| | 3,395 | | | | | Altria Group, Inc. | | | 243,693 | |
| | 6,605 | | | | | Coca-Cola Company | | | 285,006 | |
| | 1,500 | | | | | Costco Wholesale Corp. | | | 266,280 | |
| | 1,105 | | | | | CVS Health Corp. | | | 91,096 | |
| | 4,675 | | | | | Mondelez International, Inc. - Class A | | | 210,515 | |
| | 3,675 | | | | | PepsiCo, Inc. | | | 416,304 | |
| | 2,340 | | | | | Philip Morris International, Inc. | | | 259,366 | |
| | 3,715 | | | | | Procter & Gamble Company | | | 324,431 | |
| | 1,470 | | | | | Reynolds American, Inc. | | | 94,815 | |
| | 2,060 | | | | | Wal-Mart Stores, Inc. | | | 154,871 | |
| | 3,460 | | | | | Walgreens Boots Alliance, Inc. | | | 299,428 | |
| | | | | | | | | | |
| | | | | | | | | 2,645,805 | |
| | | | | | | | | | |
| | | | | | Energy (6.5%) | |
| | 2,875 | | | | | Anadarko Petroleum Corp. | | | 163,933 | |
| | 2,745 | | | | | Chevron Corp. | | | 292,892 | |
| | 2,915 | | | | | ConocoPhillips | | | 139,658 | |
| | 1,520 | | | | | EOG Resources, Inc. | | | 140,600 | |
| | 5,445 | | | | | Exxon Mobil Corp. | | | 444,584 | |
| | 4,050 | | | | | Halliburton Company | | | 185,814 | |
| | 1,945 | | | | | Hess Corp. | | | 94,974 | |
| | 1,500 | | | | | Marathon Petroleum Corp. | | | 76,410 | |
| | 1,020 | | | | | Phillips 66 | | | 81,151 | |
| | 460 | | | | | Pioneer Natural Resources Company | | | 79,575 | |
| | 3,315 | | | | | Schlumberger, Ltd. | | | 240,636 | |
| | | | | | | | | | |
| | | | | | | | | 1,940,227 | |
| | | | | | | | | | |
| | | | | | | | | | |
NUMBER OF
SHARES | | | | | | | VALUE | |
| | | | | | Financials (14.0%) | |
| | 1,735 | | | | | American Express Company | | $ | 137,499 | |
| | 2,850 | | | | | American International Group, Inc. | | | 173,593 | |
| | 16,135 | | | | | Bank of America Corp. | | | 376,591 | |
| | 3,400 | | | | | Bank of New York Mellon Corp. | | | 160,004 | |
| | 4,780 | | | | | BB&T Corp. | | | 206,400 | |
| | 2,795 | | | | | Berkshire Hathaway, Inc. - Class B# | | | 461,762 | |
| | 4,290 | | | | | Charles Schwab Corp. | | | 166,667 | |
| | 4,905 | | | | | Citigroup, Inc. | | | 289,984 | |
| | 685 | | | | | Goldman Sachs Group, Inc. | | | 153,303 | |
| | 3,900 | | | | | Intercontinental Exchange, Inc. | | | 234,780 | |
| | 8,365 | | | | | JPMorgan Chase & Company | | | 727,755 | |
| | 3,690 | | | | | MetLife, Inc. | | | 191,179 | |
| | 4,525 | | | | | Morgan Stanley | | | 196,249 | |
| | 820 | | | | | PNC Financial Services Group, Inc. | | | 98,195 | |
| | 1,545 | | | | | Prudential Financial, Inc. | | | 165,361 | |
| | 685 | | | | | Travelers Companies, Inc. | | | 83,337 | |
| | 6,230 | | | | | Wells Fargo & Company~ | | | 335,423 | |
| | | | | | | | | | |
| | | | | | | | | 4,158,082 | |
| | | | | | | | | | |
| | | | | | Health Care (13.7%) | |
| | 2,100 | | | | | Abbott Laboratories | | | 91,644 | |
| | 2,745 | | | | | AbbVie, Inc. | | | 181,005 | |
| | 1,390 | | | | | Aetna, Inc. | | | 187,747 | |
| | 630 | | | | | Allergan, PLC | | | 153,632 | |
| | 1,400 | | | | | Amgen, Inc. | | | 228,648 | |
| | 675 | | | | | Anthem, Inc. | | | 120,076 | |
| | 1,900 | | | | | Baxter International, Inc. | | | 105,792 | |
| | 2,745 | | | | | Bristol-Myers Squibb Company | | | 153,857 | |
| | 1,865 | | | | | Celgene Corp.# | | | 231,353 | |
| | 1,200 | | | | | Gilead Sciences, Inc. | | | 82,260 | |
| | 480 | | | | | Illumina, Inc.# | | | 88,733 | |
| | 4,910 | | | | | Johnson & Johnson~ | | | 606,238 | |
| | 760 | | | | | Laboratory Corp. of America Holdings# | | | 106,514 | |
| | 2,170 | | | | | Medtronic, PLC | | | 180,305 | |
| | 5,450 | | | | | Merck & Company, Inc. | | | 339,699 | |
| | 8,700 | | | | | Pfizer, Inc. | | | 295,104 | |
| | 1,265 | | | | | Stryker Corp. | | | 172,508 | |
| | 875 | | | | | Thermo Fisher Scientific, Inc. | | | 144,664 | |
| | 2,465 | | | | | UnitedHealth Group, Inc. | | | 431,079 | |
| | 1,500 | | | | | Zimmer Biomet Holdings, Inc. | | | 179,475 | |
| | | | | | | | | | |
| | | | | | | | | 4,080,333 | |
| | | | | | | | | | |
| | | | | | Industrials (10.5%) | |
| | 1,260 | | | | | Boeing Company | | | 232,886 | |
| | 1,550 | | | | | Caterpillar, Inc. | | | 158,503 | |
| | 3,800 | | | | | CSX Corp. | | | 193,192 | |
| | 5,950 | | | | | Delta Air Lines, Inc. | | | 270,368 | |
| | 4,340 | | | | | Eaton Corp., PLC | | | 328,278 | |
| | | | | | |
| See accompanying Notes to Schedule of Investments | | www.calamos.com | | | 71 | |
Dividend Growth Fund Schedule of Investments April 30, 2017 (Unaudited)
| | | | | | | | | | |
NUMBER OF
SHARES | | | | | | | VALUE | |
| | 12,000 | | | | | General Electric Company | | $ | 347,880 | |
| | 3,080 | | | | | Honeywell International, Inc. | | | 403,911 | |
| | 2,000 | | | | | Ingersoll-Rand, PLC | | | 177,500 | |
| | 705 | | | | | Lockheed Martin Corp. | | | 189,962 | |
| | 3,875 | | | | | Southwest Airlines Company | | | 217,852 | |
| | 1,600 | | | | | Union Pacific Corp. | | | 179,136 | |
| | 975 | | | | | United Parcel Service, Inc. - Class B | | | 104,774 | |
| | 2,600 | | | | | United Technologies Corp. | | | 309,374 | |
| | | | | | | | | | |
| | | | | | | | | 3,113,616 | |
| | | | | | | | | | |
| | | | | | Information Technology (22.4%) | |
| | 950 | | | | | Accenture, PLC - Class A | | | 115,235 | |
| | 150 | | | | | Alphabet, Inc. - Class A# | | | 138,678 | |
| | 860 | | | | | Alphabet, Inc. - Class C# | | | 779,126 | |
| | 8,110 | | | | | Apple, Inc. | | | 1,165,001 | |
| | 5,650 | | | | | Applied Materials, Inc. | | | 229,446 | |
| | 10,300 | | | | | Cisco Systems, Inc. | | | 350,921 | |
| | 2,100 | | | | | Electronic Arts, Inc.# | | | 199,122 | |
| | 4,335 | | | | | Facebook, Inc. - Class A# | | | 651,334 | |
| | 8,905 | | | | | Intel Corp. | | | 321,916 | |
| | 1,455 | | | | | International Business Machines Corp. | | | 233,222 | |
| | 2,060 | | | | | Lam Research Corp. | | | 298,391 | |
| | 1,315 | | | | | MasterCard, Inc. - Class A | | | 152,961 | |
| | 1,250 | | | | | Microchip Technology, Inc. | | | 94,475 | |
| | 12,050 | | | | | Microsoft Corp. | | | 824,943 | |
| | 1,115 | | | | | Red Hat, Inc.# | | | 98,209 | |
| | 2,830 | | | | | Salesforce.com, Inc.# | | | 243,720 | |
| | 2,575 | | | | | Texas Instruments, Inc. | | | 203,888 | |
| | 3,990 | | | | | Visa, Inc. - Class A | | | 363,968 | |
| | 3,220 | | | | | Xilinx, Inc. | | | 203,214 | |
| | | | | | | | | | |
| | | | | | | | | 6,667,770 | |
| | | | | | | | | | |
| | | | | | Materials (2.6%) | |
| | 1,700 | | | | | Avery Dennison Corp. | | | 141,457 | |
| | 5,350 | | | | | Dow Chemical Company | | | 335,980 | |
| | 1,860 | | | | | E.I. du Pont de Nemours and Company | | | 148,335 | |
| | 1,200 | | | | | LyondellBasell Industries, NV - Class A | | | 101,712 | |
| | 975 | | | | | Nucor Corp. | | | 59,797 | |
| | | | | | | | | | |
| | | | | | | | | 787,281 | |
| | | | | | | | | | |
| | | | | | Real Estate (2.0%) | |
| | 2,170 | | | | | American Tower Corp. | | | 273,290 | |
| | 1,050 | | | | | Crown Castle International Corp. | | | 99,330 | |
| | 3,300 | | | | | Welltower, Inc. | | | 235,752 | |
| | | | | | | | | | |
| | | | | | | | | 608,372 | |
| | | | | | | | | | |
| | | | | | Telecommunication Services (2.3%) | |
| | 8,555 | | | | | AT&T, Inc. | | | 339,034 | |
| | 7,825 | | | | | Verizon Communications, Inc. | | | 359,246 | |
| | | | | | | | | | |
| | | | | | | | | 698,280 | |
| | | | | | | | | | |
| | | | | | | | | | |
NUMBER OF
SHARES | | | | | | | VALUE | |
| | | | | | Utilities (2.2%) | |
| | 1,800 | | | | | Duke Energy Corp. | | $ | 148,500 | |
| | 5,825 | | | | | Exelon Corp. | | | 201,720 | |
| | 2,315 | | | | | NextEra Energy, Inc. | | | 309,191 | |
| | | | | | | | | | |
| | | | | | | | | 659,411 | |
| | | | | | | | | | |
| | | | | | TOTAL COMMON STOCKS
(Cost $24,812,647) | | | 29,494,511 | |
| | | | | | | | | | |
| | | | | | | | | | |
| | SHORT TERM INVESTMENTS (0.2%) | |
| | 27,474 | | | | | Fidelity Prime Money Market Fund - Institutional Class | | | 27,485 | |
| | 27,479 | | | | | Morgan Stanley Institutional Liquidity Funds - Government Portfolio | | | 27,479 | |
| | | | | | | | | | |
| | | | | | TOTAL SHORT TERM INVESTMENTS
(Cost $54,964) | | | 54,964 | |
| | | | | | | | | | |
| TOTAL INVESTMENTS (99.2%)
(Cost $24,867,611) | | | 29,549,475 | |
| | | | | | | | | | |
| |
| | OTHER ASSETS, LESS LIABILITIES (0.8%) | | | 243,409 | |
| | | | | | | | | | |
| |
| | NET ASSETS (100.0%) | | $ | 29,792,884 | |
| | | | | | | | | | |
NOTES TO SCHEDULE OF INVESTMENTS
| # | Non-income producing security. |
| ~ | Security, or portion of security, is segregated as collateral (or potential collateral for future transactions) for written options. The aggregate value of such securities is $260,596. |
| | | | |
| 72 | | CALAMOS OPEN-END FAMILY OF FUNDS SEMIANNUAL REPORT | | See accompanying Notes to Financial Statements |
International Growth Fund Schedule of Investments April 30, 2017 (Unaudited)
| | | | | | | | | | |
NUMBER OF
SHARES | | | | | | | VALUE | |
| | COMMON STOCKS (98.9%) | | | | |
| | | | | | Consumer Discretionary (12.2%) | |
| | 54,100 | | | GBP | | ASOS, PLC# | | $ | 4,077,472 | |
| | 76,400 | | | | | Ctrip.com International, Ltd.# | | | 3,858,964 | |
| | 30,100 | | | EUR | | Daimler, AG | | | 2,242,882 | |
| | 33,000 | | | SEK | | Evolution Gaming Group, AB* | | | 1,456,114 | |
| | 416,300 | | | HKD | | Galaxy Entertainment Group, Ltd. | | | 2,312,737 | |
| | 61,000 | | | | | JD.com, Inc.# | | | 2,139,270 | |
| | 17,000 | | | EUR | | Kering | | | 5,269,289 | |
| | 8,700 | | | EUR | | LVMH Moet Hennessy Louis Vuitton, SE | | | 2,147,759 | |
| | 17,000 | | | INR | | Maruti Suzuki India, Ltd. | | | 1,723,039 | |
| | 60,900 | | | EUR | | Moncler S.p.A. | | | 1,502,099 | |
| | 430,000 | | | GBP | | SSP Group, PLC | | | 2,477,807 | |
| | 157,300 | | | JPY | | Start Today Company, Ltd. | | | 3,356,513 | |
| | 38,200 | | | JPY | | Toyota Motor Corp. | | | 2,067,414 | |
| | | | | | | | | | |
| | | | | | | | | 34,631,359 | |
| | | | | | | | | | |
| | | | | | Consumer Staples (11.2%) | |
| | 26,400 | | | EUR | | Anheuser-Busch InBev, SA | | | 2,977,137 | |
| | 53,600 | | | GBP | | British American Tobacco, PLC | | | 3,621,394 | |
| | 117,700 | | | GBP | | Diageo, PLC | | | 3,425,915 | |
| | 26,300 | | | EUR | | Kerry Group, PLC | | | 2,154,660 | |
| | 63,600 | | | CHF | | Nestlé, SA | | | 4,898,504 | |
| | 33,400 | | | CAD | | Premium Brands Holdings Corp. | | | 2,090,543 | |
| | 48,600 | | | GBP | | Reckitt Benckiser Group, PLC | | | 4,477,882 | |
| | 613,500 | | | AUD | | Treasury Wine Estates, Ltd. | | | 5,508,224 | |
| | 52,260 | | | EUR | | Unilever, NV | | | 2,737,665 | |
| | | | | | | | | | |
| | | | | | | | | 31,891,924 | |
| | | | | | | | | | |
| | | | | | Energy (3.4%) | |
| | 98,400 | | | CAD | | Canadian Natural Resources, Ltd. | | | 3,134,267 | |
| | 36,500 | | | | | Schlumberger, Ltd. | | | 2,649,535 | |
| | 42,500 | | | EUR | | TOTAL, SA | | | 2,181,662 | |
| | 75,000 | | | AUD | | Woodside Petroleum, Ltd. | | | 1,805,361 | |
| | | | | | | | | | |
| | | | | | | | | 9,770,825 | |
| | | | | | | | | | |
| | | | | | Financials (13.7%) | |
| | 579,000 | | | HKD | | AIA Group, Ltd. | | | 4,007,511 | |
| | 38,600 | | | EUR | | BNP Paribas, SA | | | 2,724,279 | |
| | 285,000 | | | CHF | | Credit Suisse Group, AG# | | | 4,346,525 | |
| | 145,800 | | | INR | | HDFC Bank, Ltd. | | | 3,498,955 | |
| | 229,000 | | | INR | | Indiabulls Housing Finance, Ltd. | | | 3,616,607 | |
| | 227,400 | | | | | Itau Unibanco Holding, SA | | | 2,797,020 | |
| | 30,900 | | | AUD | | Macquarie Group, Ltd. | | | 2,146,525 | |
| | 676,900 | | | JPY | | Mitsubishi UFJ Financial Group, Inc. | | | 4,289,242 | |
| | 378,000 | | | HKD | | Ping An Insurance Group Company of China, Ltd. | | | 2,125,212 | |
| | 195,100 | | | GBP | | Prudential, PLC | | | 4,330,020 | |
| | 244,700 | | | | | Sberbank of Russia PJSC | | | 2,909,483 | |
| | 136,300 | | | EUR | | UniCredit S.p.A# | | | 2,219,303 | |
| | | | | | | | | | |
| | | | | | | | | 39,010,682 | |
| | | | | | | | | | |
| | | | | | Health Care (10.6%) | |
| | 75,000 | | | JPY | | Chugai Pharmaceutical Company, Ltd. | | | 2,665,059 | |
| | 222,000 | | | GBP | | Clinigen Healthcare, Ltd.# | | | 2,515,924 | |
| | 19,900 | | | EUR | | DBV Technologies, SA# | | | 1,422,118 | |
| | 45,000 | | | EUR | | Fresenius, SE & Company KGaA | | | 3,650,865 | |
| | 7,900 | | | DKK | | Genmab, A/S# | | | 1,571,901 | |
| | 105,710 | | | DKK | | H Lundbeck, A/S | | | 5,422,396 | |
| | 26,900 | | | | | Neuroderm, Ltd.# | | | 776,738 | |
| | | | | | | | | | |
NUMBER OF
SHARES | | | | | | | VALUE | |
| | 37,500 | | | CHF | | Novartis, AG | | $ | 2,886,940 | |
| | 34,560 | | | CHF | | Roche Holding, AG | | | 9,043,125 | |
| | | | | | | | | | |
| | | | | | | | | 29,955,066 | |
| | | | | | | | | | |
| | | | | | Industrials (16.7%) | |
| | 4,000 | | | CHF | | dormakaba Holding AG# | | | 3,427,288 | |
| | 8,200 | | | INR | | Eicher Motors, Ltd. | | | 3,318,854 | |
| | 34,100 | | | JPY | | FANUC Corp. | | | 6,942,627 | |
| | 41,000 | | | DKK | | FLSmidth & Company, A/S | | | 2,464,801 | |
| | 47,760 | | | EUR | | KION Group, AG | | | 3,235,520 | |
| | 138,000 | | | JPY | | Komatsu, Ltd. | | | 3,687,573 | |
| | 155,000 | | | INR | | Larsen & Toubro, Ltd. | | | 4,214,433 | |
| | 88,900 | | | JPY | | LIXIL Group Corp. | | | 2,221,861 | |
| | 158,600 | | | JPY | | MISUMI Group, Inc. | | | 3,004,686 | |
| | 60,500 | | | EUR | | Randstad Holding, NV | | | 3,606,888 | |
| | 80,700 | | | EUR | | Schneider Electric, SE | | | 6,391,902 | |
| | 46,135 | | | EUR | | Thales, SA | | | 4,849,086 | |
| | | | | | | | | | |
| | | | | | | | | 47,365,519 | |
| | | | | | | | | | |
| | | | | | Information Technology (23.8%) | |
| | 200,000 | | | HKD | | AAC Technologies Holdings, Inc. | | | 2,931,799 | |
| | 55,802 | | | | | Alibaba Group Holding, Ltd.# | | | 6,445,131 | |
| | 101,100 | | | JPY | | Alps Electric Company, Ltd. | | | 2,971,603 | |
| | 21,500 | | | EUR | | ASML Holding, NV | | | 2,842,929 | |
| | 26,000 | | | | | Broadcom, Ltd. | | | 5,741,060 | |
| | 10,000 | | | JPY | | Keyence Corp. | | | 4,020,140 | |
| | 7,800 | | | | | NetEase, Inc. | | | 2,070,042 | |
| | 85,477 | | | | | Orbotech, Ltd.# | | | 2,814,758 | |
| | 2,000 | | | KRW | | Samsung Electronics Company, Ltd. | | | 3,920,858 | |
| | 35,000 | | | EUR | | SAP, SE | | | 3,505,811 | |
| | 1,136,000 | | | TWD | | Taiwan Semiconductor Manufacturing Company, Ltd. | | | 7,317,992 | |
| | 70,700 | | | CHF | | Temenos Group, AG# | | | 6,119,497 | |
| | 342,700 | | | HKD | | Tencent Holdings, Ltd. | | | 10,737,935 | |
| | 32,400 | | | JPY | | Tokyo Electron, Ltd. | | | 3,768,253 | |
| | 421,625 | | | INR | | Vakrangee, Ltd. | | | 2,240,786 | |
| | | | | | | | | | |
| | | | | | | | | 67,448,594 | |
| | | | | | | | | | |
| | | | | | Materials (5.6%) | |
| | 160,000 | | | | | Cemex, SAB de CV# | | | 1,475,200 | |
| | 123,000 | | | EUR | | CRH, PLC | | | 4,480,164 | |
| | 1,045,000 | | | GBP | | Glencore, PLC# | | | 4,106,998 | |
| | 230,000 | | | | | Vale, SA | | | 1,973,400 | |
| | 150,600 | | | GBP | | Victrex, PLC | | | 3,735,571 | |
| | | | | | | | | | |
| | | | | | | | | 15,771,333 | |
| | | | | | | | | | |
| | | | | | Real Estate (0.7%) | |
| | 50,400 | | | JPY | | Investors Cloud Company, Ltd.^ | | | 1,880,626 | |
| | | | | | | | | | |
| | | | | | Telecommunication Services (1.0%) | |
| | 38,800 | | | JPY | | SoftBank Group Corp. | | | 2,943,086 | |
| | | | | | | | | | |
| | | | | | TOTAL COMMON STOCKS
(Cost $238,947,773) | | | 280,669,014 | |
| | | | | | | | | | |
| | | | | | |
| See accompanying Notes to Schedule of Investments | | www.calamos.com | | | 73 | |
International Growth Fund Schedule of Investments April 30, 2017 (Unaudited)
| | | | | | | | | | |
NUMBER OF
CONTRACTS/
NOTIONAL
AMOUNT | | | | | | | VALUE | |
| | PURCHASED OPTIONS (0.2%) # | | | | |
| | | | | | Consumer Staples (0.1%) | |
| 565
56,500 |
| | EUR | | Unilever, NV
Call, 12/15/17, Strike 45.00 | | $ | 237,873 | |
| | | | | | | | | | |
| | | | | | Financials (0.0%) | |
| 2,400
240,000 |
| | | | Sberbank Of Russia PJSC
Put, 05/19/17, Strike $11.00 | | | 25,200 | |
| | | | | | | | | | |
| | | | | | Other (0.1%) | |
| 960
96,000 |
| | | | CurrencyShares British Pound
Call, 06/16/17, Strike $123.00 | | | 355,200 | |
| | | | | | | | | | |
| | | | | | TOTAL PURCHASED OPTIONS
(Cost $431,352) | | | 618,273 | |
| | | | | | | | | | |
NUMBER OF
SHARES | | | | | | | VALUE | |
| | SHORT TERM INVESTMENTS (0.8%) | |
| | 1,136,298 | | | | | Fidelity Prime Money Market Fund - Institutional Class | | | 1,136,752 | |
| | 1,136,068 | | | | | Morgan Stanley Institutional Liquidity Funds - Government Portfolio | | | 1,136,068 | |
| | | | | | | | | | |
| | | | | | TOTAL SHORT TERM INVESTMENTS
(Cost $2,272,820) | | | 2,272,820 | |
| | | | | | | | | | |
NUMBER OF
SHARES/
PRINCIPAL
AMOUNT | | | | | | | VALUE | |
| INVESTMENT OF CASH COLLATERAL FOR SECURITIES
LOANED (0.3%) |
|
| | 513,022 | | | | | Deutsche Bank Securities, Inc.† 0.830%, 05/01/17 | | | 513,022 | |
| | 278,817 | | | | | Goldman Sachs Financial Square Government Fund | | | 278,817 | |
| | | | | | | | | | |
| | | | | | TOTAL INVESTMENT OF
CASH COLLATERAL FOR SECURITIES LOANED
(Cost $791,839) | | | 791,839 | |
| | | | | | | | | | |
| TOTAL INVESTMENTS (100.2%)
(Cost $242,443,784) | | | 284,351,946 | |
| | | | | | | | | | |
| |
| | PAYABLE UPON RETURN OF SECURITIES ON LOAN (-0.3%) | | | (791,839 | ) |
| | | | | | | | | | |
| |
| | OTHER ASSETS, LESS LIABILITIES (0.1%) | | | 272,413 | |
| | | | | | | | | | |
| |
| | NET ASSETS (100.0%) | | $ | 283,832,520 | |
| | | | | | | | | | |
NOTES TO SCHEDULE OF INVESTMENTS
| # | Non-income producing security. |
| * | Securities issued and sold pursuant to a Rule 144A transaction are excepted from the registration requirement of the Securities Act of 1933, |
| | as amended. These securities may only be sold to qualified institutional buyers (“QIBs”), such as the Fund. Any resale of these securities must generally be effected through a sale that is registered under the Act or otherwise exempted from such registration requirements. |
| ^ | Security, or portion of security, is on loan. |
| † | Repurchase agreement collateralized by the following security: 523,261 United States Treasury Note, 3.625%, 02/15/20. |
FOREIGN CURRENCY ABBREVIATIONS
| | |
| AUD | | Australian Dollar |
| CAD | | Canadian Dollar |
| CHF | | Swiss Franc |
| DKK | | Danish Krone |
| EUR | | European Monetary Unit |
| GBP | | British Pound Sterling |
| HKD | | Hong Kong Dollar |
| INR | | Indian Rupee |
| JPY | | Japanese Yen |
| KRW | | South Korean Won |
| SEK | | Swedish Krona |
| TWD | | New Taiwan Dollar |
Note: Value for securities denominated in foreign currencies is shown in U.S. dollars. The date on options represents the expiration date of the option contract. The option contract may be exercised at any date on or before the date shown.
CURRENCY EXPOSURE APRIL 30, 2017
| | | | | | | | |
| | | VALUE | | | % OF TOTAL
INVESTMENTS | |
| European Monetary Unit | | $ | 60,379,891 | | | | 21.2% | |
| Japanese Yen | | | 43,818,683 | | | | 15.4% | |
| US Dollar | | | 39,095,660 | | | | 13.8% | |
| British Pound Sterling | | | 32,768,983 | | | | 11.5% | |
| Swiss Franc | | | 30,721,879 | | | | 10.8% | |
| Hong Kong Dollar | | | 22,115,194 | | | | 7.8% | |
| Indian Rupee | | | 18,612,674 | | | | 6.6% | |
| Australian Dollar | | | 9,460,110 | | | | 3.3% | |
| Danish Krone | | | 9,459,098 | | | | 3.3% | |
| New Taiwan Dollar | | | 7,317,992 | | | | 2.6% | |
| Canadian Dollar | | | 5,224,810 | | | | 1.8% | |
| South Korean Won | | | 3,920,858 | | | | 1.4% | |
| Swedish Krona | | | 1,456,114 | | | | 0.5% | |
| Total Investments | | $ | 284,351,946 | | | | 100.0% | |
Currency exposure may vary over time.
| | | | |
| 74 | | CALAMOS OPEN-END FAMILY OF FUNDS SEMIANNUAL REPORT | | See accompanying Notes to Financial Statements |
Evolving World Growth Fund Schedule of Investments April 30, 2017 (Unaudited)
| | | | | | | | | | |
PRINCIPAL
AMOUNT | | | | | | | VALUE | |
| | CONVERTIBLE BONDS (13.2%) | |
| | | | | | Consumer Discretionary (4.2%) | |
| | 6,225,000 | | | | | Ctrip.com International, Ltd.
1.250%, 10/15/18 | | $ | 8,311,838 | |
| | 855,000 | | | | | LVMH Moet Hennessy Louis Vuitton, SE
0.000%, 02/16/21 | | | 2,509,160 | |
| | 1,850,000 | | | | | Weatherford International, Ltd.
5.875%, 07/01/21 | | | 2,211,684 | |
| | | | | | | | | | |
| | | | | | | | | 13,032,682 | |
| | | | | | | | | | |
| | | | | | Energy (0.7%) | |
| | 1,800,000 | | | | | Tullow Oil Jersey, Ltd.
6.625%, 07/12/21 | | | 2,186,576 | |
| | | | | | | | | | |
| | | | | | Financials (1.0%) | |
| | 24,000,000 | | | HKD | | Haitong International Securities
Group, Ltd.
0.000%, 10/25/21 | | | 3,095,784 | |
| | | | | | | | | | |
| | | | | | Health Care (0.6%) | |
| | 1,300,000 | | | EUR | | Magyar Nemzeti Vagyonkezelo Zrt
3.375%, 04/02/19 | | | 1,759,791 | |
| | | | | | | | | | |
| | | | | | Industrials (1.8%) | |
| | 2,123,000 | | | | | Gran Tierra Energy, Inc.*
5.000%, 04/01/21 | | | 2,336,892 | |
| | 3,110,000 | | | | | Larsen & Toubro, Ltd.
0.675%, 10/22/19 | | | 3,162,656 | |
| | | | | | | | | | |
| | | | | | | | | 5,499,548 | |
| | | | | | | | | | |
| | | | | | Information Technology (0.5%) | |
| | 1,620,000 | | | | | Lumentum Holdings, Inc.*
0.250%, 03/15/24 | | | 1,621,272 | |
| | | | | | | | | | |
| | | | | | Materials (1.5%) | |
| | 4,140,000 | | | | | Cemex, SAB de CV
3.750%, 03/15/18 | | | 4,836,265 | |
| | | | | | | | | | |
| | | | | | Real Estate (0.8%) | |
| | 2,380,000 | | | | | AYC Finance, Ltd.
0.500%, 05/02/19 | | | 2,466,394 | |
| | | | | | | | | | |
| | | | | | Telecommunication Services (2.1%) | | | | |
| | 5,800,000 | | | | | Telenor East Holding II AS
0.250%, 09/20/19 | | | 6,608,578 | |
| | | | | | | | | | |
| | | | | | TOTAL CONVERTIBLE BONDS
(Cost $40,373,688) | | | 41,106,890 | |
| | | | | | | | | | |
| | | | | | | | | | |
| | SOVEREIGN BOND (0.7%) | |
| | 44,700,000 | | | MXN | | Mexican Bonos
6.500%, 06/10/21
(Cost $2,230,930) | | | 2,330,685 | |
| | | | | | | | | | |
| | | | | | | | | | |
NUMBER
OF SHARES | | | | | | | VALUE | |
| | CONVERTIBLE PREFERRED STOCK (4.0%) | |
| | | | | | Telecommunication Services (4.0%) | |
| | 91,600 | | | | | Alibaba Exchangeable (Softbank)*§
5.750%, 06/03/19
(Cost $10,189,587) | | | 12,591,941 | |
| | | | | | | | | | |
| | | | | | | | | | |
NUMBER OF
SHARES | | | | | | | VALUE | |
| | COMMON STOCKS (82.1%) | |
| | | | | | Consumer Discretionary (10.7%) | |
| | 846,000 | | | HKD | | ANTA Sports Products, Ltd. | | $ | 2,374,484 | |
| | 5,155,800 | | | IDR | | Astra International, Tbk PT | | | 3,455,376 | |
| | 930,000 | | | HKD | | Brilliance China Automotive
Holdings, Ltd. | | | 1,557,937 | |
| | 360,000 | | | BRL | | CVC Brasil Operadora e Agencia de Viagens, SA | | | 3,511,476 | |
| | 570,100 | | | HKD | | Galaxy Entertainment Group, Ltd. | | | 3,167,167 | |
| | 712,000 | | | HKD | | Haier Electronics Group Company, Ltd. | | | 1,650,998 | |
| | 28,500 | | | KRW | | Hyundai Motor Company | | | 3,604,595 | |
| | 70,000 | | | | | JD.com, Inc.# | | | 2,454,900 | |
| | 26,500 | | | INR | | Maruti Suzuki India, Ltd. | | | 2,685,914 | |
| | 560,000 | | | BRL | | MRV Engenharia e Participacoes, SA | | | 2,812,306 | |
| | 19,640 | | | ZAR | | Naspers, Ltd. - Class N | | | 3,734,575 | |
| | 282,440 | | | INR | | Zee Entertainment Enterprises, Ltd. | | | 2,312,709 | |
| | | | | | | | | | |
| | | | | | | | | 33,322,437 | |
| | | | | | | | | | |
| | | | | | Consumer Staples (3.5%) | |
| | 693,000 | | | INR | | ITC, Ltd. | | | 2,992,254 | |
| | 123,000 | | | BRL | | M Dias Branco, SA | | | 1,888,373 | |
| | 166,000 | | | ZAR | | Shoprite Holdings, Ltd. | | | 2,604,223 | |
| | 99,000 | | | | | X5 Retail Group, NV# | | | 3,489,750 | |
| | | | | | | | | | |
| | | | | | | | | 10,974,600 | |
| | | | | | | | | | |
| | | | | | Energy (5.7%) | | | | |
| | 232,012 | | | INR | | Bharat Petroleum Corp, Ltd. | | | 2,594,203 | |
| | 60,700 | | | | | Lukoil PJSC | | | 3,014,666 | |
| | 4,200,000 | | | HKD | | PetroChina Company, Ltd. - Class H | | | 2,950,842 | |
| | 323,300 | | | | | Petróleo Brasileiro, SA# | | | 2,912,933 | |
| | 170,000 | | | THB | | PTT PCL | | | 1,911,824 | |
| | 82,200 | | | INR | | Reliance Industries, Ltd.# | | | 1,781,412 | |
| | 82,100 | | | ZAR | | Sasol, Ltd. | | | 2,515,943 | |
| | | | | | | | | | |
| | | | | | | | | 17,681,823 | |
| | | | | | | | | | |
| | | | | | Financials (20.9%) | |
| | 377,400 | | | HKD | | AIA Group, Ltd. | | | 2,612,150 | |
| | 276,300 | | | BRL | | Banco do Brasil, SA | | | 2,859,582 | |
| | 2,440,000 | | | IDR | | Bank Central Asia Tbk PT | | | 3,245,057 | |
| | 64,751 | | | INR | | BSE, Ltd. | | | 1,011,577 | |
| | 6,150,000 | | | HKD | | China Construction Bank Corp. - Class H | | | 4,991,732 | |
| | 43,600 | | | | | Citigroup, Inc. | | | 2,577,632 | |
| | 15,000 | | | | | Credicorp, Ltd. | | | 2,304,900 | |
| �� | 697,900 | | | ZAR | | FirstRand, Ltd. | | | 2,603,740 | |
| | 436,700 | | | MXN | | Grupo Financiero Banorte, SAB de CV | | | 2,520,184 | |
| | 167,000 | | | INR | | HDFC Bank, Ltd. | | | 4,007,720 | |
| | 416,400 | | | INR | | Indiabulls Housing Finance, Ltd. | | | 6,576,223 | |
| | 110,700 | | | INR | | IndusInd Bank, Ltd. | | | 2,485,778 | |
| | 529,200 | | | | | Itau Unibanco Holding, SA | | | 6,509,160 | |
| | 29,550 | | | PLN | | KRUK, SA | | | 2,178,619 | |
| | 440,400 | | | THB | | Krungthai Card PCL | | | 1,725,187 | |
| | | | | | |
| See accompanying Notes to Schedule of Investments | | www.calamos.com | | | 75 | |
Evolving World Growth Fund Schedule of Investments April 30, 2017 (Unaudited)
| | | | | | | | | | |
PRINCIPAL
AMOUNT | | | | | | | VALUE | |
| | 720,000 | | | HKD | | Ping An Insurance Group Company of China, Ltd. | | $ | 4,048,022 | |
| | 27,100 | | | KRW | | Samsung Life Insurance Company, Ltd. | | | 2,605,381 | |
| | 416,200 | | | | | Sberbank of Russia PJSC | | | 4,948,618 | |
| | 388,000 | | | PHP | | Security Bank Corp. | | | 1,655,591 | |
| | 93,600 | | | KRW | | Shinhan Financial Group Company, Ltd. | | | 3,907,933 | |
| | | | | | | | | | |
| | | | | | | | | 65,374,786 | |
| | | | | | | | | | |
| | | | | | Health Care (1.6%) | | | | |
| | 1,450,000 | | | HKD | | CSPC Pharmaceutical Group, Ltd. | | | 2,011,173 | |
| | 7,174 | | | KRW | | Hugel, Inc.# | | | 2,937,242 | |
| | | | | | | | | | |
| | | | | | | | | 4,948,415 | |
| | | | | | | | | | |
| | | | | | Industrials (8.6%) | | | | |
| | 341,000 | | | TRY | | Aselsan Elektronik Sanayi Ve Ticaret AS | | | 1,874,837 | |
| | 874,800 | | | INR | | Bharat Electronics, Ltd. | | | 2,487,547 | |
| | 11,600 | | | INR | | Eicher Motors, Ltd. | | | 4,694,965 | |
| | 424,000 | | | TWD | | Hiwin Technologies Corp. | | | 2,701,765 | |
| | 100,600 | | | JPY | | Komatsu, Ltd. | | | 2,688,187 | |
| | 235,000 | | | INR | | Larsen & Toubro, Ltd. | | | 6,389,623 | |
| | 7,760,000 | | | HKD | | Lonking Holdings, Ltd. | | | 2,160,713 | |
| | 1,358,000 | | | HKD | | Weichai Power Company, Ltd. | | | 2,200,440 | |
| | 9,313,698 | | | IDR | | Wijaya Karya Persero, Tbk PT | | | 1,652,199 | |
| | | | | | | | | | |
| | | | | | | | | 26,850,276 | |
| | | | | | | | | | |
| | | | | | Information Technology (24.4%) | | | | |
| | 204,000 | | | HKD | | AAC Technologies Holdings, Inc. | | | 2,990,435 | |
| | 13,980 | | | | | Baidu, Inc.# | | | 2,519,615 | |
| | 752,000 | | | TWD | | Hon Hai Precision Industry
Company, Ltd. | | | 2,461,419 | |
| | 579,000 | | | HKD | | Kingsoft Corp, Ltd. | | | 1,650,286 | |
| | 16,000 | | | TWD | | Largan Precision Company, Ltd. | | | 2,657,114 | |
| | 6,109,000 | | | MYR | | My EG Services Bhd | | | 2,994,755 | |
| | 2,200 | | | KRW | | NAVER Corp. | | | 1,546,213 | |
| | 11,500 | | | | | NetEase, Inc. | | | 3,051,985 | |
| | 7,224 | | | KRW | | Samsung Electronics Company, Ltd. | | | 14,162,139 | |
| | 169,000 | | | TWD | | Silergy Corp. | | | 3,056,033 | |
| | 53,700 | | | KRW | | SK Hynix, Inc. | | | 2,543,952 | |
| | 221,318 | | | HKD | | Sunny Optical Technology Group Company, Ltd. | | | 1,818,499 | |
| | 2,035,649 | | | TWD | | Taiwan Semiconductor Manufacturing Company, Ltd. | | | 13,113,436 | |
| | 485,100 | | | HKD | | Tencent Holdings, Ltd. | | | 15,199,803 | |
| | 665,836 | | | INR | | Vakrangee, Ltd. | | | 3,538,679 | |
| | 101,800 | | | | | Yandex, NV - Class A# | | | 2,775,068 | |
| | | | | | | | | | |
| | | | | | | | | 76,079,431 | |
| | | | | | | | | | |
| | | | | | Materials (4.4%) | | | | |
| | 600,000 | | | GBP | | Glencore, PLC# | | | 2,358,085 | |
| | 725,700 | | | INR | | Hindustan Zinc, Ltd. | | | 3,020,409 | |
| | 146,500 | | | THB | | Siam Cement PCL | | | 2,260,690 | |
| | 248,276 | | | INR | | UPL, Ltd. | | | 3,110,915 | |
| | | | | | | | | | |
PRINCIPAL
AMOUNT | | | | | | | VALUE | |
| | 366,600 | | | | | Vale, SA | | $ | 3,145,428 | |
| | | | | | | | | | |
| | | | | | | | | 13,895,527 | |
| | | | | | | | | | |
| | | | | | Real Estate (0.8%) | | | | |
| | 1,201,000 | | | AED | | Emaar Properties PJSC | | | 2,347,721 | |
| | | | | | | | | | |
| | | | | | Telecommunication Services (1.5%) | |
| | 449,000 | | | HKD | | China Mobile, Ltd. | | | 4,780,334 | |
| | | | | | | | | | |
| | | | | | TOTAL COMMON STOCKS
(Cost $210,934,740) | | | 256,255,350 | |
| | | | | | | | | | |
NUMBER OF
CONTRACTS/
NOTIONAL
AMOUNT | | | | | | | VALUE | |
| | PURCHASED OPTIONS (0.1%) # | | | | |
| | | | | | Financials (0.0%) | |
| 3,200
320,000 |
| | | | China Life Insurance Company, Ltd.
Call, 07/21/17, Strike $17.50 | | | 48,000 | |
| 2,800
280,000 |
| | | | Sberbank Of Russia PJSC
Put, 05/19/17, Strike $11.00 | | | 29,400 | |
| | | | | | | | | | |
| | | | | | | | | 77,400 | |
| | | | | | | | | | |
| | | | | | Materials (0.0%) | | | | |
| 3,300
330,000 |
| | | | Vale, SA
Call, 06/16/17, Strike $12.00 | | | 4,950 | |
| | | | | | | | | | |
| | | | | | Other (0.1%) | | | | |
| 2,000
200,000 |
| | | | Deutsche X-trackers Harvest CSI
Call, 07/21/17, Strike $26.00 | | | 49,000 | |
| 5,350
535,000 |
| | | | iShares China Large-Cap ETF
Call, 05/19/17, Strike $40.00 | | | 40,125 | |
| 8,000
800,000 |
| | | | iShares MSCI Emerging Markets
Put, 05/19/17, Strike $38.00 | | | 56,000 | |
| | | | | | | | | | |
| | | | | | | | | 145,125 | |
| | | | | | | | | | |
| | | | | | TOTAL PURCHASED OPTIONS
(Cost $1,510,706) | | | 227,475 | |
| | | | | | | | | | |
NUMBER OF
SHARES | | | | | | | VALUE | |
| | SHORT TERM INVESTMENTS (0.0%) | |
| | 1,217 | | | | | Fidelity Prime Money Market Fund - Institutional Class | | | 1,217 | |
| | 756 | | | | | Morgan Stanley Institutional Liquidity Funds - Government Portfolio | | | 756 | |
| | | | | | | | | | |
| | | | | | TOTAL SHORT TERM INVESTMENTS
(Cost $1,973) | | | 1,973 | |
| | | | | | | | | | |
| TOTAL INVESTMENTS (100.1%)
(Cost $265,241,624) | | | 312,514,314 | |
| | | | | | | | | | |
| |
| | LIABILITIES, LESS OTHER ASSETS (-0.1%) | | | (191,618 | ) |
| | | | | | | | | | |
| |
| | NET ASSETS (100.0%) | | $ | 312,322,696 | |
| | | | | | | | | | |
| | | | |
| 76 | | CALAMOS OPEN-END FAMILY OF FUNDS SEMIANNUAL REPORT | | See accompanying Notes to Schedule of Investments |
Evolving World Growth Fund Schedule of Investments April 30, 2017 (Unaudited)
NOTES TO SCHEDULE OF INVESTMENTS
| * | Securities issued and sold pursuant to a Rule 144A transaction are excepted from the registration requirement of the Securities Act of 1933, as amended. These securities may only be sold to qualified institutional buyers (“QIBs”), such as the Fund. Any resale of these securities must generally be effected through a sale that is registered under the Act or otherwise exempted from such registration requirements. |
| § | Securities exchangeable or convertible into securities of one or more entities that are different than the issuer. Each entity is identified in the parenthetical. |
| # | Non-income producing security. |
FOREIGN CURRENCY ABBREVIATIONS
| | |
| AED | | UAE Dirham |
| BRL | | Brazilian Real |
| EUR | | European Monetary Unit |
| GBP | | British Pound Sterling |
| HKD | | Hong Kong Dollar |
| IDR | | Indonesian Rupiah |
| INR | | Indian Rupee |
| JPY | | Japanese Yen |
| KRW | | South Korean Won |
| MXN | | Mexican Peso |
| MYR | | Malaysian Ringgit |
| PHP | | Philippine Peso |
| PLN | | Polish Zloty |
| THB | | Thai Baht |
| TRY | | Turkish Lira |
| TWD | | New Taiwan Dollar |
| ZAR | | South African Rand |
Note: Value for securities denominated in foreign currencies is shown in U.S. dollars. The principal amount for such securities is shown in the respective foreign currency. The date on options represents the expiration date of the option contract. The option contract may be exercised at any date on or before the date shown.
CURRENCY EXPOSURE
APRIL 30, 2017
| | | | | | | | |
| | | VALUE | | | % OF TOTAL
INVESTMENTS | |
| US Dollar | | $ | 88,777,359 | | | | 28.4% | |
| Hong Kong Dollar | | | 59,260,799 | | | | 19.0% | |
| Indian Rupee | | | 49,689,928 | | | | 15.9% | |
| South Korean Won | | | 31,307,455 | | | | 10.0% | |
| New Taiwan Dollar | | | 23,989,767 | | | | 7.7% | |
| South African Rand | | | 11,458,481 | | | | 3.7% | |
| Brazilian Real | | | 11,071,737 | | | | 3.5% | |
| Indonesian Rupiah | | | 8,352,632 | | | | 2.7% | |
| Thai Baht | | | 5,897,701 | | | | 1.9% | |
| Mexican Peso | | | 4,850,869 | | | | 1.5% | |
| Malaysian Ringgit | | | 2,994,755 | | | | 1.0% | |
| Japanese Yen | | | 2,688,187 | | | | 0.9% | |
| British Pound Sterling | | | 2,358,085 | | | | 0.7% | |
| UAE Dirham | | | 2,347,721 | | | | 0.7% | |
| Polish Zloty | | | 2,178,619 | | | | 0.7% | |
| Turkish Lira | | | 1,874,837 | | | | 0.6% | |
| European Monetary Unit | | | 1,759,791 | | | | 0.6% | |
| Philippine Peso | | | 1,655,591 | | | | 0.5% | |
| Total Investments | | $ | 312,514,314 | | | | 100.0% | |
Currency exposure may vary over time.
| | | | | | |
| See accompanying Notes to Financial Statements | | www.calamos.com | | | 77 | |
Emerging Market Equity Fund Schedule of Investments April 30, 2017 (Unaudited)
| | | | | | | | | | |
NUMBER OF
SHARES | | | | | | | VALUE | |
| | COMMON STOCKS (94.1%) | |
| | | | | | Consumer Discretionary (13.1%) | |
| | 38,000 | | | HKD | | ANTA Sports Products, Ltd. | | $ | 106,655 | |
| | 224,000 | | | IDR | | Astra International, Tbk PT | | | 150,123 | |
| | 42,000 | | | HKD | | Brilliance China Automotive
Holdings, Ltd. | | | 70,359 | |
| | 6,960 | | | | | Ctrip.com International, Ltd.# | | | 351,550 | |
| | 17,500 | | | BRL | | CVC Brasil Operadora e Agencia de Viagens, SA | | | 170,697 | |
| | 27,800 | | | HKD | | Galaxy Entertainment Group, Ltd. | | | 154,442 | |
| | 45,000 | | | HKD | | Geely Automobile Holdings, Ltd. | | | 60,631 | |
| | 31,000 | | | HKD | | Haier Electronics Group Company, Ltd. | | | 71,883 | |
| | 1,780 | | | KRW | | Hyundai Motor Company | | | 225,129 | |
| | 4,200 | | | | | JD.com, Inc.# | | | 147,294 | |
| | 5,000 | | | | | Mahindra & Mahindra, Ltd. | | | 104,750 | |
| | 25,000 | | | BRL | | MRV Engenharia e Participacoes, SA | | | 125,549 | |
| | 1,043 | | | ZAR | | Naspers, Ltd. - Class N | | | 198,328 | |
| | | | | | | | | | |
| | | | | | | | | 1,937,390 | |
| | | | | | | | | | |
| | | | | | Consumer Staples (6.2%) | |
| | 390 | | | KRW | | Amorepacific Corp. | | | 100,017 | |
| | 6,900 | | | TRY | | BIM Birlesik Magazalar AS | | | 112,710 | |
| | 9,000 | | | MXN | | Fomento Economico Mexicano, SAB
de CV | | | 80,958 | |
| | 35,900 | | | | | ITC, Ltd.# | | | 155,555 | |
| | 5,100 | | | BRL | | M Dias Branco, SA | | | 78,298 | |
| | 7,200 | | | ZAR | | Shoprite Holdings, Ltd. | | | 112,954 | |
| | 41,400 | | | MXN | | Wal-Mart de Mexico SAB de CV | | | 93,245 | |
| | 5,100 | | | | | X5 Retail Group, NV# | | | 179,775 | |
| | | | | | | | | | |
| | | | | | | | | 913,512 | |
| | | | | | | | | | |
| | | | | | Energy (5.7%) | |
| | 84,000 | | | HKD | | CNOOC, Ltd. | | | 97,994 | |
| | 3,310 | | | | | Lukoil PJSC | | | 164,391 | |
| | 221,000 | | | HKD | | PetroChina Company, Ltd. - Class H | | | 155,271 | |
| | 15,100 | | | | | Petróleo Brasileiro, SA# | | | 136,051 | |
| | 6,900 | | | THB | | PTT PCL | | | 77,598 | |
| | 2,500 | | | | | Reliance Industries, Ltd.#* | | | 108,125 | |
| | 3,400 | | | ZAR | | Sasol, Ltd. | | | 104,192 | |
| | | | | | | | | | |
| | | | | | | | | 843,622 | |
| | | | | | | | | | |
| | | | | | Financials (25.7%) | |
| | 17,000 | | | HKD | | AIA Group, Ltd. | | | 117,664 | |
| | 137,100 | | | PHP | | Ayala Land, Inc. | | | 96,860 | |
| | 15,000 | | | BRL | | Banco do Brasil, SA | | | 155,243 | |
| | 117,000 | | | IDR | | Bank Central Asia Tbk PT | | | 155,603 | |
| | 1,850 | | | GBP | | BGEO Group, PLC | | | 86,098 | |
| | 346,000 | | | HKD | | China Construction Bank Corp. - Class H | | | 280,836 | |
| | 33,000 | | | HKD | | China Life Insurance Company, Ltd. - Class H | | | 100,395 | |
| | | | | | | | | | |
NUMBER OF
SHARES | | | | | | | VALUE | |
| | 34,000 | | | HKD | | China Overseas Land & Investment, Ltd. | | $ | 98,620 | |
| | 600 | | | | | Credicorp, Ltd. | | | 92,196 | |
| | 42,000 | | | ZAR | | FirstRand, Ltd. | | | 156,695 | |
| | 19,800 | | | MXN | | Grupo Financiero Banorte, SAB de CV | | | 114,265 | |
| | 3,325 | | | PHP | | GT Capital Holdings, Inc. | | | 83,849 | |
| | 166,000 | | | HKD | | Haitong International Securities
Group, Ltd. | | | 89,904 | |
| | 17,125 | | | | | ICICI Bank, Ltd. | | | 146,761 | |
| | 23,500 | | | | | Indiabulls Housing Finance, Ltd. | | | 371,535 | |
| | 335,000 | | | HKD | | Industrial & Commercial Bank of China, Ltd. - Class H | | | 218,375 | |
| | 26,900 | | | | | Itau Unibanco Holding, SA | | | 330,870 | |
| | 1,800 | | | PLN | | KRUK, SA | | | 132,708 | |
| | 15,969 | | | THB | | Krungthai Card PCL | | | 62,556 | |
| | 123,000 | | | EUR | | National Bank of Greece, SA# | | | 38,298 | |
| | 38,100 | | | HKD | | Ping An Insurance Group Company of China, Ltd. | | | 214,208 | |
| | 1,540 | | | QAR | | Qatar National Bank QPSC | | | 60,817 | |
| | 1,070 | | | KRW | | Samsung Life Insurance Company, Ltd. | | | 102,869 | |
| | 24,650 | | | | | Sberbank of Russia PJSC | | | 293,088 | |
| | 5,160 | | | KRW | | Shinhan Financial Group Company, Ltd. | | | 215,437 | |
| | | | | | | | | | |
| | | | | | | | | 3,815,750 | |
| | | | | | | | | | |
| | | | | | Health Care (1.5%) | |
| | 60,000 | | | HKD | | CSPC Pharmaceutical Group, Ltd. | | | 83,221 | |
| | 340 | | | KRW | | Hugel, Inc.# | | | 139,206 | |
| | | | | | | | | | |
| | | | | | | | | 222,427 | |
| | | | | | | | | | |
| | | | | | Industrials (6.2%) | |
| | 19,810 | | | TRY | | Aselsan Elektronik Sanayi Ve Ticaret AS | | | 108,916 | |
| | 22,300 | | | TWD | | Hiwin Technologies Corp. | | | 142,098 | |
| | 14,500 | | | | | Larsen & Toubro, Ltd. | | | 393,675 | |
| | 343,021 | | | HKD | | Lonking Holdings, Ltd. | | | 95,512 | |
| | 57,000 | | | HKD | | Weichai Power Company, Ltd. - Class H | | | 92,360 | |
| | 530,500 | | | IDR | | Wijaya Karya Persero, Tbk PT | | | 94,108 | |
| | | | | | | | | | |
| | | | | | | | | 926,669 | |
| | | | | | | | | | |
| | | | | | Information Technology (27.9%) | |
| | 13,000 | | | HKD | | AAC Technologies Holdings, Inc. | | | 190,567 | |
| | 4,760 | | | | | Alibaba Group Holding, Ltd.# | | | 549,780 | |
| | 605 | | | | | Baidu, Inc.# | | | 109,039 | |
| | 184,000 | | | HKD | | Chinasoft International, Ltd.# | | | 110,498 | |
| | 6,700 | | | CNY | | Hangzhou Hikvision Digital Technology Company, Ltd. - Class A | | | 35,538 | |
| | 34,000 | | | TWD | | Hon Hai Precision Industry
Company, Ltd. | | | 111,288 | |
| | 26,000 | | | HKD | | Kingsoft Corp., Ltd. | | | 74,106 | |
| | 1,000 | | | TWD | | Largan Precision Company, Ltd. | | | 166,070 | |
| | 265,500 | | | MYR | | My EG Services Bhd | | | 130,154 | |
| | 145 | | | KRW | | NAVER Corp. | | | 101,909 | |
| | 490 | | | | | NetEase, Inc. | | | 130,041 | |
| | | | |
| 78 | | CALAMOS OPEN-END FAMILY OF FUNDS SEMIANNUAL REPORT | | See accompanying Notes to Schedule of Investments |
Emerging Market Equity Fund Schedule of Investments April 30, 2017 (Unaudited)
| | | | | | | | | | |
NUMBER OF
SHARES | | | | | | | VALUE | |
| | 360 | | | KRW | | Samsung Electronics Company, Ltd. | | $ | 705,754 | |
| | 7,000 | | | TWD | | Silergy Corp. | | | 126,581 | |
| | 3,000 | | | KRW | | SK Hynix, Inc. | | | 142,120 | |
| | 9,783 | | | HKD | | Sunny Optical Technology Group Company, Ltd. | | | 80,384 | |
| | 90,000 | | | TWD | | Taiwan Semiconductor Manufacturing Company, Ltd. | | | 579,771 | |
| | 21,400 | | | HKD | | Tencent Holdings, Ltd. | | | 670,533 | |
| | 4,470 | | | | | Yandex, NV - Class A# | | | 121,852 | |
| | | | | | | | | | |
| | | | | | | | | 4,135,985 | |
| | | | | | | | | | |
| | | | | | Materials (5.1%) | |
| | 22,700 | | | | | Cemex, SAB de CV# | | | 209,294 | |
| | 320 | | | KRW | | POSCO | | | 75,547 | |
| | 4,600 | | | THB | | Siam Cement PCL | | | 70,984 | |
| | 2,750 | | | | | Southern Copper Corp. | | | 97,267 | |
| | 19,800 | | | | | Vale, SA | | | 169,884 | |
| | 9,200 | | | | | Vedanta, Ltd. | | | 139,840 | |
| | | | | | | | | | |
| | | | | | | | | 762,816 | |
| | | | | | | | | | |
| | | | | | Real Estate (0.6%) | | | | |
| | 48,500 | | | AED | | Emaar Properties PJSC | | | 94,808 | |
| | | | | | | | | | |
| | | | | | Telecommunication Services (2.1%) | |
| | 21,500 | | | HKD | | China Mobile, Ltd. | | | 228,903 | |
| | 234,800 | | | IDR | | Telekomunikasi Indonesia Persero Tbk PT | | | 77,457 | |
| | | | | | | | | | |
| | | | | | | | | 306,360 | |
| | | | | | | | | | |
| | | | | | TOTAL COMMON STOCKS
(Cost $12,169,111) | | | 13,959,339 | |
| | | | | | | | | | |
| | EXCHANGE-TRADED FUNDS (3.7%) | | | | |
| | | | | | Other (3.7%) | |
| | 4,250 | | | | | Deutsche X-trackers Harvest CSI 300 China A-Shares ETF^ | | | 105,485 | |
| | 13,950 | | | | | iShares MSCI India ETF | | | 447,516 | |
| | | | | | | | | | |
| | | | | | | | | 553,001 | |
| | | | | | | | | | |
| | | | | | TOTAL EXCHANGE-TRADED FUNDS
(Cost $506,696) | | | 553,001 | |
| | | | | | | | | | |
NUMBER OF
CONTRACTS/
NOTIONAL
AMOUNT | | | | | | | VALUE | |
| | PURCHASED OPTION (0.0%) # | | | | |
| | | | | | Financials (0.0%) | |
| 130
13,000 |
| | | | Sberbank Of Russia PJSC Put, 05/19/17, Strike $11.00 (Cost $7,263) | | | 1,365 | |
| | | | | | | | | | |
| | | | | | | | | | |
NUMBER OF
SHARES | | | | | | | VALUE | |
| | SHORT TERM INVESTMENTS (2.7%) | | | | |
| | 197,844 | | | | | Fidelity Prime Money Market Fund -Institutional Class | | $ | 197,922 | |
| | 197,812 | | | | | Morgan Stanley Institutional Liquidity Funds - Government Portfolio | | | 197,812 | |
| | | | | | | | | | |
| | | | | | TOTAL SHORT TERM
INVESTMENTS
(Cost $395,734) | | | 395,734 | |
| | | | | | | | | | |
NUMBER OF
SHARES/
PRINCIPAL
AMOUNT | | | | | | | VALUE | |
| INVESTMENT OF CASH COLLATERAL FOR SECURITIES
LOANED (0.3%) |
|
| | 34,714 | | | | | Deutsche Bank Securities, Inc.†
0.830%, 05/01/17 | | | 34,714 | |
| | 18,867 | | | | | Goldman Sachs Financial Square Government Fund | | | 18,867 | |
| | | | | | | | | | |
| | | | | | TOTAL INVESTMENT OF
CASH COLLATERAL FOR
SECURITIES LOANED
(Cost $53,581) | | | 53,581 | |
| | | | | | | | | | |
| TOTAL INVESTMENTS (100.8%)
(Cost $13,132,385) | | | 14,963,020 | |
| | | | | | | | | | |
| |
| | PAYABLE UPON RETURN OF SECURITIES ON LOAN (-0.3%) | | | (53,581 | ) |
| | | | | | | | | | |
| |
| | LIABILITIES, LESS OTHER ASSETS (-0.5%) | | | (69,325 | ) |
| | | | | | | | | | |
| |
| | NET ASSETS (100.0%) | | $ | 14,840,114 | |
| | | | | | | | | | |
NOTES TO SCHEDULE OF INVESTMENTS
| # | Non-income producing security. |
| * | Securities issued and sold pursuant to a Rule 144A transaction are excepted from the registration requirement of the Securities Act of 1933, as amended. These securities may only be sold to qualified institutional buyers (“QIBs”), such as the Fund. Any resale of these securities must generally be effected through a sale that is registered under the Act or otherwise exempted from such registration requirements. |
| ^ | Security, or portion of security, is on loan. |
| † | Repurchase agreement collateralized by the following security: 35,407 United States Treasury Note, 3.625%, 02/15/20. |
| | | | | | |
| See accompanying Notes to Financial Statements | | www.calamos.com | | | 79 | |
Emerging Market Equity Fund Schedule of Investments April 30, 2017 (Unaudited)
FOREIGN CURRENCY ABBREVIATIONS
| | |
| AED | | UAE dirham |
| BRL | | Brazilian Real |
| CNY | | Chinese Yuan Renminbi |
| EUR | | European Monetary Unit |
| GBP | | British Pound Sterling |
| HKD | | Hong Kong Dollar |
| IDR | | Indonesian Rupiah |
| KRW | | South Korean Won |
| MXN | | Mexican Peso |
| MYR | | Malaysian Ringgit |
| PHP | | Philippine Peso |
| PLN | | Polish Zloty |
| QAR | | Qatari rial |
| THB | | Thai Baht |
| TRY | | Turkish Lira |
| TWD | | New Taiwan Dollar |
| ZAR | | South African Rand |
Note: Value for securities denominated in foreign currencies is shown in U.S. dollars. The date on options represents the expiration date of the option contract. The option contract may be exercised at any date on or before the date shown.
CURRENCY EXPOSURE
APRIL 30, 2017
| | | | | | | | |
| | | VALUE | | | % OF TOTAL
INVESTMENTS | |
| US Dollar | | $ | 5,506,294 | | | | 36.8% | |
| Hong Kong Dollar | | | 3,463,321 | | | | 23.2% | |
| South Korean Won | | | 1,807,988 | | | | 12.1% | |
| New Taiwan Dollar | | | 1,125,808 | | | | 7.5% | |
| South African Rand | | | 572,169 | | | | 3.8% | |
| Brazilian Real | | | 529,787 | | | | 3.5% | |
| Indonesian Rupiah | | | 477,291 | | | | 3.2% | |
| Mexican Peso | | | 288,468 | | | | 1.9% | |
| Turkish Lira | | | 221,626 | | | | 1.5% | |
| Thai Baht | | | 211,138 | | | | 1.4% | |
| Philippine Peso | | | 180,709 | | | | 1.2% | |
| Polish Zloty | | | 132,708 | | | | 0.9% | |
| Malaysian Ringgit | | | 130,154 | | | | 0.9% | |
| UAE Dirham | | | 94,808 | | | | 0.6% | |
| British Pound Sterling | | | 86,098 | | | | 0.6% | |
| Qatari Rial | | | 60,817 | | | | 0.4% | |
| European Monetary Unit | | | 38,298 | | | | 0.3% | |
| Chinese Yuan Renminbi | | | 35,538 | | | | 0.2% | |
| Total Investments | | $ | 14,963,020 | | | | 100.0% | |
Currency exposure may vary over time.
| | | | |
| 80 | | CALAMOS OPEN-END FAMILY OF FUNDS SEMIANNUAL REPORT | | See accompanying Notes to Financial Statements |
Global Equity Fund Schedule of Investments April 30, 2017 (Unaudited)
| | | | | | | | | | |
NUMBER OF
SHARES | | | | | | | VALUE | |
| | COMMON STOCKS (97.6%) | |
| | | | | | Consumer Discretionary (10.9%) | |
| | 1,620 | | | | | Amazon.com, Inc.# | | $ | 1,498,484 | |
| | 30,600 | | | | | Ctrip.com International, Ltd.# | | | 1,545,606 | |
| | 72,500 | | | | | D.R. Horton, Inc. | | | 2,384,525 | |
| | 12,700 | | | EUR | | Daimler, AG | | | 946,332 | |
| | 148,000 | | | HKD | | Galaxy Entertainment Group, Ltd. | | | 822,208 | |
| | 8,400 | | | | | Netflix, Inc.# | | | 1,278,480 | |
| | 20,750 | | | | | Nike, Inc. - Class B | | | 1,149,757 | |
| | 1,035 | | | | | Priceline Group, Inc.# | | | 1,911,459 | |
| | 67,500 | | | | | PulteGroup, Inc. | | | 1,530,225 | |
| | | | | | | | | | |
| | | | | | | | | 13,067,076 | |
| | | | | | | | | | |
| | | | | | Consumer Staples (9.4%) | |
| | 9,355 | | | EUR | | Anheuser-Busch InBev, SA | | | 1,054,967 | |
| | 9,400 | | | GBP | | British American Tobacco, PLC | | | 635,095 | |
| | 49,083 | | | GBP | | Diageo, PLC | | | 1,428,667 | |
| | 7,430 | | | EUR | | Kerry Group, PLC | | | 608,712 | |
| | 12,700 | | | CHF | | Nestlé, SA | | | 978,160 | |
| | 7,500 | | | | | Philip Morris International, Inc. | | | 831,300 | |
| | 7,500 | | | GBP | | Reckitt Benckiser Group, PLC | | | 691,031 | |
| | 257,000 | | | AUD | | Treasury Wine Estates, Ltd. | | | 2,307,438 | |
| | 25,300 | | | EUR | | Unilever, NV | | | 1,325,353 | |
| | 16,640 | | | | | Walgreens Boots Alliance, Inc. | | | 1,440,026 | |
| | | | | | | | | | |
| | | | | | | | | 11,300,749 | |
| | | | | | | | | | |
| | | | | | Energy (3.9%) | |
| | 19,200 | | | | | Anadarko Petroleum Corp. | | | 1,094,784 | |
| | 37,000 | | | EUR | | ENI, S.p.A. | | | 573,907 | |
| | 6,150 | | | | | EOG Resources, Inc. | | | 568,875 | |
| | 47,600 | | | EUR | | Royal Dutch Shell, PLC - Class A | | | 1,241,162 | |
| | 16,800 | | | | | Schlumberger, Ltd. | | | 1,219,512 | |
| | | | | | | | | | |
| | | | | | | | | 4,698,240 | |
| | | | | | | | | | |
| | | | | | Financials (12.9%) | |
| | 189,600 | | | HKD | | AIA Group, Ltd. | | | 1,312,304 | |
| | 60,000 | | | | | Bank of America Corp. | | | 1,400,400 | |
| | 10,500 | | | EUR | | BNP Paribas, SA | | | 741,060 | |
| | 24,900 | | | | | Citigroup, Inc. | | | 1,472,088 | |
| | 122,000 | | | CHF | | Credit Suisse Group, AG# | | | 1,860,618 | |
| | 64,000 | | | INR | | HDFC Bank, Ltd. | | | 1,535,893 | |
| | 77,000 | | | INR | | Indiabulls Housing Finance, Ltd. | | | 1,216,064 | |
| | 26,800 | | | | | JPMorgan Chase & Company | | | 2,331,600 | |
| | 177,000 | | | JPY | | Mitsubishi UFJ Financial Group, Inc. | | | 1,121,578 | |
| | 57,000 | | | GBP | | Prudential, PLC | | | 1,265,049 | |
| | 46,000 | | | | | SLM Corp.# | | | 576,840 | |
| | 38,000 | | | EUR | | UniCredit S.p.A# | | | 618,735 | |
| | | | | | | | | | |
| | | | | | | | | 15,452,229 | |
| | | | | | | | | | |
| | | | | | Health Care (9.5%) | |
| | 32,610 | | | | | Baxter International, Inc. | | | 1,815,725 | |
| | | | | | | | | | |
NUMBER OF
SHARES | | | | | | | VALUE | |
| | 14,200 | | | | | Celgene Corp.# | | $ | 1,761,510 | |
| | 63,000 | | | GBP | | Clinigen Healthcare, Ltd.# | | | 713,979 | |
| | 4,800 | | | EUR | | DBV Technologies, SA# | | | 343,023 | |
| | 3,350 | | | DKK | | Genmab, A/S# | | | 666,566 | |
| | 29,138 | | | DKK | | H Lundbeck, A/S | | | 1,494,634 | |
| | 4,300 | | | | | Incyte Corp.# | | | 534,404 | |
| | 8,900 | | | CHF | | Novartis, AG | | | 685,167 | |
| | 2,600 | | | | | Regeneron Pharmaceuticals, Inc.# | | | 1,010,074 | |
| | 4,900 | | | CHF | | Roche Holding, AG | | | 1,282,156 | |
| | 5,900 | | | | | UnitedHealth Group, Inc. | | | 1,031,792 | |
| | | | | | | | | | |
| | | | | | | | | 11,339,030 | |
| | | | | | | | | | |
| | | | | | Industrials (13.6%) | |
| | 19,800 | | | | | CSX Corp. | | | 1,006,632 | |
| | 1,440 | | | CHF | | dormakaba Holding AG# | | | 1,233,824 | |
| | 2,750 | | | INR | | Eicher Motors, Ltd. | | | 1,113,030 | |
| | 13,100 | | | JPY | | FANUC Corp. | | | 2,667,109 | |
| | 17,400 | | | DKK | | FLSmidth & Company, A/S | | | 1,046,037 | |
| | 14,809 | | | EUR | | KION Group, AG | | | 1,003,241 | |
| | 64,000 | | | JPY | | Komatsu, Ltd. | | | 1,710,179 | |
| | 70,750 | | | INR | | Larsen & Toubro, Ltd. | | | 1,923,685 | |
| | 23,630 | | | EUR | | Schneider Electric, SE | | | 1,871,631 | |
| | 16,600 | | | EUR | | Thales, SA | | | 1,744,767 | |
| | 30,600 | | | | | TriNet Group, Inc.# | | | 899,640 | |
| | | | | | | | | | |
| | | | | | | | | 16,219,775 | |
| | | | | | | | | | |
| | | | | | Information Technology (29.8%) | |
| | 24,100 | | | | | Alibaba Group Holding, Ltd.# | | | 2,783,550 | |
| | 5,725 | | | | | Alphabet, Inc. - Class A# | | | 5,292,877 | |
| | 33,000 | | | JPY | | Alps Electric Company, Ltd. | | | 969,960 | |
| | 29,918 | | | | | Apple, Inc. | | | 4,297,721 | |
| | 5,300 | | | | | Broadcom, Ltd. | | | 1,170,293 | |
| | 18,700 | | | | | Facebook, Inc. - Class A# | | | 2,809,675 | |
| | 9,500 | | | | | Lam Research Corp. | | | 1,376,075 | |
| | 10,100 | | | | | MasterCard, Inc. - Class A | | | 1,174,832 | |
| | 78,000 | | | | | ON Semiconductor Corp.# | | | 1,106,040 | |
| | 37,000 | | | | | Orbotech, Ltd.# | | | 1,218,410 | |
| | 20,500 | | | | | PayPal Holdings, Inc.# | | | 978,260 | |
| | 373 | | | KRW | | Samsung Electronics Company, Ltd. | | | 731,240 | |
| | 10,500 | | | EUR | | SAP, SE | | | 1,051,743 | |
| | 382,000 | | | TWD | | Taiwan Semiconductor Manufacturing Company, Ltd. | | | 2,460,804 | |
| | 29,700 | | | CHF | | Temenos Group, AG# | | | 2,570,708 | |
| | 98,900 | | | HKD | | Tencent Holdings, Ltd. | | | 3,098,867 | |
| | 49,600 | | | | | Trimble, Inc.# | | | 1,757,328 | |
| | 164,792 | | | INR | | Vakrangee, Ltd. | | | 875,810 | |
| | | | | | | | | | |
| | | | | | | | | 35,724,193 | |
| | | | | | | | | | |
| | | | | | Materials (7.1%) | |
| | 70,000 | | | | | Cemex, SAB de CV# | | | 645,400 | |
| | 40,100 | | | EUR | | CRH, PLC | | | 1,460,606 | |
| | 14,000 | | | | | Eagle Materials, Inc. | | | 1,343,580 | |
| | 465,500 | | | GBP | | Glencore, PLC# | | | 1,829,481 | |
| | | | | | |
| See accompanying Notes to Schedule of Investments | | www.calamos.com | | | 81 | |
Global Equity Fund Schedule of Investments April 30, 2017 (Unaudited)
| | | | | | | | | | |
NUMBER OF
SHARES | | | | | | | VALUE | |
| | 31,950 | | | | | Newmont Mining Corp. | | $ | 1,080,230 | |
| | 63,600 | | | | | Vale, SA | | | 545,688 | |
| | 65,000 | | | GBP | | Victrex, PLC | | | 1,612,298 | |
| | | | | | | | | | |
| | | | | | | | | 8,517,283 | |
| | | | | | | | | | |
| | | | | | Real Estate (0.5%) | |
| | 17,200 | | | JPY | | Investors Cloud Company, Ltd.^ | | | 641,801 | |
| | | | | | | | | | |
| | | | | | TOTAL COMMON STOCKS (Cost $90,499,557) | | | 116,960,376 | |
| | | | | | | | | | |
| | SHORT TERM INVESTMENTS (2.0%) | | | | |
| | 1,202,429 | | | | | Fidelity Prime Money Market Fund - Institutional Class | | | 1,202,910 | |
| | 1,202,287 | | | | | Morgan Stanley Institutional Liquidity Funds - Government Portfolio | | | 1,202,287 | |
| | | | | | | | | | |
| | | | | | TOTAL SHORT TERM INVESTMENTS
(Cost $2,405,197) | | | 2,405,197 | |
| | | | | | | | | | |
NUMBER OF SHARES/ PRINCIPAL AMOUNT | | | | | | | VALUE | |
| INVESTMENT OF CASH COLLATERAL FOR SECURITIES
LOANED (0.3%) |
|
| | 216,908 | | | | | Deutsche Bank Securities, Inc.† 0.830%, 05/01/17 | | | 216,908 | |
| | 117,885 | | | | | Goldman Sachs Financial Square Government Fund | | | 117,885 | |
| | | | | | | | | | |
| | | | | | TOTAL INVESTMENT OF CASH COLLATERAL FOR SECURITIES LOANED
(Cost $334,793) | | | 334,793 | |
| | | | | | | | | | |
| TOTAL INVESTMENTS (99.9%)
(Cost $93,239,547) | | | 119,700,366 | |
| | | | | | | | | | |
| |
| | PAYABLE UPON RETURN OF SECURITIES ON LOAN (-0.3%) | | | (334,793 | ) |
| | | | | | | | | | |
| |
| | OTHER ASSETS, LESS LIABILITIES (0.4%) | | | 433,872 | |
| | | | | | | | | | |
| |
| | NET ASSETS (100.0%) | | $ | 119,799,445 | |
| | | | | | | | | | |
FORWARD FOREIGN CURRENCY CONTRACTS
| | | | | | | | | | | | | | | | |
| COUNTERPARTY | | SHORT CONTRACTS | | SETTLEMENT DATE | | LOCAL CURRENCY | | | CURRENT VALUE | | | UNREALIZED GAIN/LOSS | |
| State Street Bank and Trust Company | | European Monetary Unit | | 05/31/17 | | | 3,188,000 | | | $ | 3,477,342 | | | $ | (37,149 | ) |
| | | | | | | | | | | | | | | | |
| | | | | | | | | | | | | | $ | (37,149 | ) |
| | | | | | | | | | | | | | | | |
NOTES TO SCHEDULE OF INVESTMENTS
| # | Non-income producing security. |
| ^ | Security, or portion of security, is on loan. |
| † | Repurchase agreement collateralized by the following security: 221,237 United States Treasury Note, 3.625%, 02/15/20. |
FOREIGN CURRENCY ABBREVIATIONS
| | |
| AUD | | Australian Dollar |
| CHF | | Swiss Franc |
| DKK | | Danish Krone |
| EUR | | European Monetary Unit |
| GBP | | British Pound Sterling |
| HKD | | Hong Kong Dollar |
| INR | | Indian Rupee |
| JPY | | Japanese Yen |
| KRW | | South Korean Won |
| TWD | | New Taiwan Dollar |
Note: Value for securities denominated in foreign currencies is shown in U.S. dollars.
CURRENCY EXPOSURE
APRIL 30, 2017
| | | | | | | | |
| | | VALUE | | | % OF TOTAL
INVESTMENTS | |
| US Dollar | | $ | 60,613,687 | | | | 50.6% | |
| European Monetary Unit | | | 14,585,239 | | | | 12.2% | |
| Swiss Franc | | | 8,610,633 | | | | 7.2% | |
| British Pound Sterling | | | 8,175,600 | | | | 6.8% | |
| Japanese Yen | | | 7,110,627 | | | | 5.9% | |
| Indian Rupee | | | 6,664,482 | | | | 5.6% | |
| Hong Kong Dollar | | | 5,233,379 | | | | 4.4% | |
| Danish Krone | | | 3,207,237 | | | | 2.7% | |
| New Taiwan Dollar | | | 2,460,804 | | | | 2.1% | |
| Australian Dollar | | | 2,307,438 | | | | 1.9% | |
| South Korean Won | | | 731,240 | | | | 0.6% | |
| | | | |
| Total Investments | | $ | 119,700,366 | | | | 100.0% | |
Currency exposure may vary over time.
| | | | |
| 82 | | CALAMOS OPEN-END FAMILY OF FUNDS SEMIANNUAL REPORT | | See accompanying Notes to Financial Statements |
Growth and Income Fund Schedule of Investments April 30, 2017 (Unaudited)
| | | | | | | | | | |
PRINCIPAL
AMOUNT | | | | | | | VALUE | |
| | CONVERTIBLE BONDS (16.0%) | |
| | | | | | Consumer Discretionary (5.6%) | |
| | 3,250,000 | | | | | Ctrip.com International, Ltd.*
1.250%, 09/15/22 | | $ | 3,405,415 | |
| | 7,000,000 | | | | | DISH Network Corp.*
3.375%, 08/15/26 | | | 8,579,270 | |
| | 25,970,000 | | | | | Liberty Interactive, LLC*
1.750%, 09/30/46 | | | 30,555,783 | |
| | | | | | Liberty Media Corp. | | | | |
| | 15,335,000 | | | | | 2.250%, 09/30/46* | | | 16,709,629 | |
| | 13,063,000 | | | | | 1.375%, 10/15/23 | | | 14,796,787 | |
| | 4,450,000 | | | | | Macquarie Infrastructure Corp.
2.000%, 10/01/23 | | | 4,402,830 | |
| | 24,225,000 | | | | | Priceline Group, Inc.^
0.900%, 09/15/21 | | | 27,718,851 | |
| | 9,465,000 | | | | | Tesla, Inc.
1.250%, 03/01/21 | | | 9,800,723 | |
| | | | | | | | | | |
| | | | | | | | | 115,969,288 | |
| | | | | | | | | | |
| | | | | | Energy (0.6%) | |
| | 8,750,000 | | | | | Nabors Industries, Inc.*^
0.750%, 01/15/24 | | | 7,544,250 | |
| | 5,300,000 | | | | | PDC Energy, Inc.
1.125%, 09/15/21 | | | 5,161,060 | |
| | | | | | | | | | |
| | | | | | | | | 12,705,310 | |
| | | | | | | | | | |
| | | | | | Health Care (0.2%) | |
| | 3,925,000 | | | | | NuVasive, Inc.
2.250%, 03/15/21 | | | 5,246,822 | |
| | | | | | | | | | |
| | | | | | Industrials (1.0%) | |
| | 10,050,000 | | | | | Air Lease Corp.
3.875%, 12/01/18 | | | 14,375,118 | |
| | 6,400,000 | | | | | Pacira Pharmaceuticals, Inc.*
2.375%, 04/01/22 | | | 6,841,184 | |
| | | | | | | | | | |
| | | | | | | | | 21,216,302 | |
| | | | | | | | | | |
| | | | | | Information Technology (7.0%) | |
| | 1,237,000 | | | | | Advanced Micro Devices, Inc.
2.125%, 09/01/26 | | | 2,274,323 | |
| | 8,250,000 | | | | | Citrix Systems, Inc.
0.500%, 04/15/19 | | | 10,099,238 | |
| | 5,735,000 | | | | | Inphi Corp.*
0.750%, 09/01/21 | | | 5,886,547 | |
| | 12,500,000 | | | | | Intel Corp.
3.250%, 08/01/39 | | | 21,858,437 | |
| | 6,420,000 | | | | | Lumentum Holdings, Inc.*
0.250%, 03/15/24 | | | 6,425,040 | |
| | 14,526,000 | | | | | Microchip Technology, Inc.*
1.625%, 02/15/27 | | | 14,948,198 | |
| | 13,860,000 | | | | | ON Semiconductor Corp.^
1.000%, 12/01/20 | | | 14,657,089 | |
| | 4,000,000 | | | | | Pandora Media, Inc.
1.750%, 12/01/20 | | | 3,885,300 | |
| | 16,625,000 | | | | | Salesforce.com, Inc.
0.250%, 04/01/18 | | | 22,061,874 | |
| | | | | | | | | | |
PRINCIPAL
AMOUNT | | | | | | | VALUE | |
| | 6,325,000 | | | | | Silicon Laboratories, Inc.*
1.375%, 03/01/22 | | $ | 6,642,926 | |
| | 8,540,000 | | | | | Square, Inc.*
0.375%, 03/01/22 | | | 9,047,105 | |
| | 4,250,000 | | | | | Viavi Solutions, Inc.*
1.000%, 03/01/24 | | | 4,320,826 | |
| | 7,150,000 | | | | | Workday, Inc.
0.750%, 07/15/18 | | | 8,327,534 | |
| | 14,700,000 | | | | | Yahoo!, Inc.
0.000%, 12/01/18 | | | 15,486,083 | |
| | | | | | | | | | |
| | | | | | | | | 145,920,520 | |
| | | | | | | | | | |
| | | | | | Materials (0.8%) | |
| | 5,150,000 | | | | | Royal Gold, Inc.
2.875%, 06/15/19 | | | 5,480,527 | |
| | 8,721,000 | | | | | RTI International Metals, Inc.
1.625%, 10/15/19 | | | 10,379,298 | |
| | | | | | | | | | |
| | | | | | | | | 15,859,825 | |
| | | | | | | | | | |
| | | | | | Real Estate (0.8%) | |
| | 3,440,000 | | | | | Colony Starwood Homes*
3.500%, 01/15/22 | | | 3,705,654 | |
| | 5,000,000 | | | | | Empire State Realty OP, LP*
2.625%, 08/15/19 | | | 5,733,325 | |
| | 6,385,000 | | | | | Spirit Realty Capital, Inc.
2.875%, 05/15/19 | | | 6,426,822 | |
| | | | | | | | | | |
| | | | | | | | | 15,865,801 | |
| | | | | | | | | | |
| | | | | | TOTAL CONVERTIBLE BONDS
(Cost $320,243,857) | | | 332,783,868 | |
| | | | | | | | | | |
| | | | | | | | | | |
| | CORPORATE BONDS (6.1%) | |
| | | | | | Consumer Discretionary (3.4%) | |
| | 5,153,000 | | | | | Dana, Inc.
5.500%, 12/15/24 | | | 5,262,115 | |
| | | | | | DISH DBS Corp. | |
| | 12,500,000 | | | | | 5.875%, 07/15/22 | | | 13,265,000 | |
| | 10,030,000 | | | | | 5.125%, 05/01/20 | | | 10,490,628 | |
| | 9,800,000 | | | | | Expedia, Inc.
5.950%, 08/15/20 | | | 10,732,078 | |
| | 4,235,000 | | | | | GameStop Corp.*^
6.750%, 03/15/21 | | | 4,364,803 | |
| | 9,900,000 | | | | | Home Depot, Inc.
2.700%, 04/01/23 | | | 10,067,360 | |
| | 10,000,000 | | | | | L Brands, Inc.
5.625%, 02/15/22 | | | 10,582,650 | |
| | 2,429,000 | | | | | Lowe’s Companies, Inc.
3.875%, 09/15/23 | | | 2,607,859 | |
| | 3,040,000 | | | | | PVH Corp.
4.500%, 12/15/22 | | | 3,124,010 | |
| | | | | | | | | | |
| | | | | | | | | 70,496,503 | |
| | | | | | | | | | |
| | | | | | Consumer Staples (0.5%) | |
| | 9,865,000 | | | | | Wal-Mart Stores, Inc.
3.300%, 04/22/24 | | | 10,338,323 | |
| | | | | | | | | | |
| | | | | | |
| See accompanying Notes to Schedule of Investments | | www.calamos.com | | | 83 | |
Growth and Income Fund Schedule of Investments April 30, 2017 (Unaudited)
| | | | | | | | | | |
PRINCIPAL
AMOUNT | | | | | | | VALUE | |
| | | | | | | | | | |
| | | | | | Financials (0.2%) | |
| | 4,950,000 | | | | | Berkshire Hathaway, Inc.
2.750%, 03/15/23 | | $ | 5,007,742 | |
| | | | | | | | | | |
| | | | | | Health Care (0.1%) | |
| | 3,000,000 | | | | | Universal Health Services, Inc.*
4.750%, 08/01/22 | | | 3,095,235 | |
| | | | | | | | | | |
| | | | | | Industrials (0.1%) | |
| | 1,020,000 | | | | | Icahn Enterprises, LP
4.875%, 03/15/19 | | | 1,036,667 | |
| | | | | | | | | | |
| | | Information Technology (1.4%) | |
| | 2,230,000 | | | | | ACI Worldwide, Inc.*
6.375%, 08/15/20 | | | 2,288,314 | |
| | 9,865,000 | | | | | Alphabet, Inc.
3.375%, 02/25/24 | | | 10,378,473 | |
| | 4,935,000 | | | | | Apple, Inc.
3.450%, 05/06/24 | | | 5,167,118 | |
| | 11,415,000 | | | | | Brocade Communications Systems, Inc.
4.625%, 01/15/23 | | | 11,725,488 | |
| | | | | | | | | | |
| | | | | | | | | 29,559,393 | |
| | | | | | | | | | |
| | | | | | Materials (0.4%) | |
| | 7,135,000 | | | | | Arconic, Inc.^
5.125%, 10/01/24 | | | 7,491,036 | |
| | | | | | | | | | |
| | | | | | TOTAL CORPORATE BONDS
(Cost $123,752,586) | | | 127,024,899 | |
| | | | | | | | | | |
| | | | | | | | | | |
| | U.S. GOVERNMENT AND AGENCY SECURITIES (1.1%) | |
| | | | | | United States Treasury Note | |
| | 11,600,000 | | | | | 1.125%, 06/30/21 | | | 11,325,984 | |
| | 5,800,000 | | | | | 1.625%, 05/15/26 | | | 5,497,038 | |
| | 5,500,000 | | | | | 2.000%, 11/15/26 | | | 5,368,021 | |
| | | | | | | | | | |
| | | | | | TOTAL U.S. GOVERNMENT AND AGENCY SECURITIES
(Cost $22,578,650) | | | 22,191,043 | |
| | | | | | | | | | |
| | | | | | | | | | |
NUMBER OF
SHARES | | | | | | | VALUE | |
| | | | | | | | | | |
| | CONVERTIBLE PREFERRED STOCKS (9.2%) | |
| | | | | | Energy (0.9%) | |
| | 80,675 | | | | | CenterPoint Energy, Inc. (Time Warner, Inc., Charter Communications, Time, Inc.)§**
4.184%, 09/15/29 | | | 5,809,447 | |
| | 211,030 | | | | | Hess Corp.
8.000%, 02/01/19 | | | 12,587,940 | |
| | | | | | | | | | |
| | | | | | | | | 18,397,387 | |
| | | | | | | | | | |
| | | | | | Financials (1.0%) | |
| | 380,500 | | | | | Affiliated Managers Group, Inc.^
5.150%, 10/15/37 | | | 21,831,187 | |
| | | | | | | | | | |
| | | | | | | | | | |
NUMBER OF
SHARES | | | | | | | VALUE | |
| | | | | | | | | | |
| | | | | | Health Care (1.1%) | |
| | 14,733 | | | | | Allergan, PLC
5.500%, 03/01/18 | | $ | 12,755,537 | |
| | 211,075 | | | | | Anthem, Inc.
5.250%, 05/01/18 | | | 10,845,033 | |
| | | | | | | | | | |
| | | | | | | | | 23,600,570 | |
| | | | | | | | | | |
| | | | | | Industrials (0.3%) | |
| | 110,000 | | | | | Rexnord Corp.
5.750%, 11/15/19 | | | 6,198,500 | |
| | | | | | | | | | |
| | | | | | Real Estate (1.3%) | |
| | | | | | American Tower Corp. | | | | |
| | 145,011 | | | | | 5.500%, 02/15/18 | | | 16,785,023 | |
| | 81,428 | | | | | 5.250%, 05/15/17 | | | 9,571,047 | |
| | | | | | | | | | |
| | | | | | | | | 26,356,070 | |
| | | | | | | | | | |
| | | | | | Telecommunication Services (1.1%) | |
| | 58,980 | | | | | Alibaba Exchangeable (Softbank)*§
5.750%, 06/03/19 | | | 8,107,780 | |
| | 141,890 | | | | | T-Mobile USA, Inc.
5.500%, 12/15/17 | | | 15,568,171 | |
| | | | | | | | | | |
| | | | | | | | | 23,675,951 | |
| | | | | | | | | | |
| | | | | | Utilities (3.5%) | |
| | 39,953 | | | | | Dominion Resources, Inc.
6.750%, 08/15/19 | | | 2,022,421 | |
| | 134,000 | | | | | DTE Energy Company
6.500%, 10/01/19 | | | 7,250,258 | |
| | 445,750 | | | | | Exelon Corp.
6.500%, 06/01/17 | | | 22,015,592 | |
| | 115,800 | | | | | Great Plains Energy, Inc.
7.000%, 09/15/19 | | | 6,264,780 | |
| | 575,000 | | | | | NextEra Energy, Inc.
6.371%, 09/01/18 | | | 35,460,250 | |
| | | | | | | | | | |
| | | | | | | | | 73,013,301 | |
| | | | | | | | | | |
| | | | | | TOTAL CONVERTIBLE PREFERRED STOCKS
(Cost $166,607,281) | | | 193,072,966 | |
| | | | | | | | | | |
| | | | | | | | | | |
| | COMMON STOCKS (65.5%) | |
| | | | | | Consumer Discretionary (8.4%) | |
| | 24,550 | | | | | Advance Auto Parts, Inc.~ | | | 3,489,537 | |
| | 39,100 | | | | | Amazon.com, Inc.# | | | 36,167,109 | |
| | 584,400 | | | | | Comcast Corp. - Class A | | | 22,902,636 | |
| | 154,885 | | | | | Home Depot, Inc. | | | 24,177,549 | |
| | 155,600 | | | | | Lowe’s Companies, Inc. | | | 13,207,328 | |
| | 58,875 | | | | | Netflix, Inc.# | | | 8,960,775 | |
| | 332,200 | | | | | Newell Rubbermaid, Inc.~ | | | 15,859,228 | |
| | 214,100 | | | | | Nike, Inc. - Class B | | | 11,863,281 | |
| | 267,450 | | | | | Starbucks Corp. | | | 16,063,047 | |
| | 200,000 | | | | | Walt Disney Company | | | 23,120,000 | |
| | | | | | | | | | |
| | | | | | | | | 175,810,490 | |
| | | | | | | | | | |
| | | | | | Consumer Staples (8.0%) | |
| | 530,000 | | | | | Coca-Cola Company | | | 22,869,500 | |
| | 124,625 | | | | | Costco Wholesale Corp. | | | 22,123,430 | |
| | | | |
| 84 | | CALAMOS OPEN-END FAMILY OF FUNDS SEMIANNUAL REPORT | | See accompanying Notes to Schedule of Investments |
Growth and Income Fund Schedule of Investments April 30, 2017 (Unaudited)
| | | | | | | | | | |
NUMBER OF
SHARES | | | | | | | VALUE | |
| | 361,035 | | | | | Mondelez International, Inc. - Class A~ | | $ | 16,257,406 | |
| | 215,000 | | | | | PepsiCo, Inc.~ | | | 24,355,200 | |
| | 200,000 | | | | | Philip Morris International, Inc. | | | 22,168,000 | |
| | 311,993 | | | | | Procter & Gamble Company | | | 27,246,349 | |
| | 161,275 | | | | | Wal-Mart Stores, Inc. | | | 12,124,654 | |
| | 231,800 | | | | | Walgreens Boots Alliance, Inc. | | | 20,059,972 | |
| | | | | | | | | | |
| | | | | | | | | 167,204,511 | |
| | | | | | | | | | |
| | | | | | Energy (4.8%) | |
| | 153,900 | | | | | Anadarko Petroleum Corp. | | | 8,775,378 | |
| | 130,600 | | | | | Chevron Corp. | | | 13,935,020 | |
| | 140,000 | | | | | EOG Resources, Inc. | | | 12,950,000 | |
| | 409,000 | | | | | Exxon Mobil Corp. | | | 33,394,850 | |
| | 265,000 | | | | | Halliburton Company | | | 12,158,200 | |
| | 37,275 | | | | | Pioneer Natural Resources Company | | | 6,448,202 | |
| | 179,000 | | | | | Schlumberger, Ltd. | | | 12,993,610 | |
| | | | | | | | | | |
| | | | | | | | | 100,655,260 | |
| | | | | | | | | | |
| | | | | | | | | | |
| | | | | | Financials (10.0%) | | | | |
| | 160,675 | | | | | American International Group, Inc. | | | 9,786,714 | |
| | 826,025 | | | | | Bank of America Corp.~ | | | 19,279,424 | |
| | 183,625 | | | | | Bank of New York Mellon Corp.~ | | | 8,641,393 | |
| | 153,250 | | | | | BB&T Corp. | | | 6,617,335 | |
| | 558,000 | | | | | Citigroup, Inc. | | | 32,988,960 | |
| | 35,000 | | | | | Goldman Sachs Group, Inc. | | | 7,833,000 | |
| | 322,250 | | | | | Intercontinental Exchange, Inc. | | | 19,399,450 | |
| | 625,330 | | | | | JPMorgan Chase & Company | | | 54,403,710 | |
| | 191,205 | | | | | MetLife, Inc. | | | 9,906,331 | |
| | 163,500 | | | | | Morgan Stanley | | | 7,090,995 | |
| | 63,575 | | | | | PNC Financial Services Group, Inc. | | | 7,613,106 | |
| | 458,585 | | | | | Wells Fargo & Company | | | 24,690,216 | |
| | | | | | | | | | |
| | | | | | | | | 208,250,634 | |
| | | | | | | | | | |
| | | | | | Health Care (9.6%) | |
| | 236,885 | | | | | Baxter International, Inc.~ | | | 13,189,757 | |
| | 75,750 | | | | | Bristol-Myers Squibb Company | | | 4,245,787 | |
| | 177,000 | | | | | Celgene Corp.# | | | 21,956,850 | |
| | 87,700 | | | | | Gilead Sciences, Inc. | | | 6,011,835 | |
| | 358,375 | | | | | Johnson & Johnson | | | 44,248,561 | |
| | 106,350 | | | | | Medtronic, PLC | | | 8,836,621 | |
| | 402,975 | | | | | Merck & Company, Inc. | | | 25,117,432 | |
| | 610,500 | | | | | Pfizer, Inc. | | | 20,708,160 | |
| | 80,835 | | | | | Stryker Corp. | | | 11,023,469 | |
| | 36,935 | | | | | Thermo Fisher Scientific, Inc. | | | 6,106,464 | |
| | 180,750 | | | | | UnitedHealth Group, Inc. | | | 31,609,560 | |
| | 61,375 | | | | | Zimmer Biomet Holdings, Inc. | | | 7,343,519 | |
| | | | | | | | | | |
| | | | | | | | | 200,398,015 | |
| | | | | | | | | | |
| | | | | | Industrials (8.9%) | | | | |
| | 60,650 | | | | | Boeing Company~ | | | 11,209,939 | |
| | 110,000 | | | | | Caterpillar, Inc. | | | 11,248,600 | |
| | | | | | | | | | |
NUMBER OF
SHARES | | | | | | | VALUE | |
| | 267,975 | | | | | CSX Corp. | | $ | 13,623,849 | |
| | 416,000 | | | | | Delta Air Lines, Inc. | | | 18,903,040 | |
| | 208,450 | | | | | Eaton Corp., PLC | | | 15,767,158 | |
| | 637,145 | | | | | General Electric Company | | | 18,470,834 | |
| | 138,300 | | | | | Honeywell International, Inc. | | | 18,136,662 | |
| | 34,300 | | | | | Lockheed Martin Corp. | | | 9,242,135 | |
| | 54,500 | | | | | Northrop Grumman Corp. | | | 13,404,820 | |
| | 156,600 | | | | | Southwest Airlines Company | | | 8,804,052 | |
| | 103,100 | | | | | Union Pacific Corp. | | | 11,543,076 | |
| | 140,550 | | | | | United Parcel Service, Inc. - Class B | | | 15,103,503 | |
| | 168,437 | | | | | United Technologies Corp. | | | 20,042,319 | |
| | | | | | | | | | |
| | | | | | | | | 185,499,987 | |
| | | | | | | | | | |
| | | | | | Information Technology (13.1%) | | | | |
| | 67,175 | | | | | Accenture, PLC - Class A | | | 8,148,328 | |
| | 59,835 | | | | | Alphabet, Inc. - Class A#~ | | | 55,318,654 | |
| | 580,100 | | | | | Apple, Inc. | | | 83,331,365 | |
| | 42,275 | | | | | Broadcom, Ltd. | | | 9,334,743 | |
| | 205,800 | | | | | Facebook, Inc. - Class A# | | | 30,921,450 | |
| | 81,891 | | | | | Lam Research Corp. | | | 11,861,911 | |
| | 92,375 | | | | | MasterCard, Inc. - Class A | | | 10,745,060 | |
| | 755,050 | | | | | Microsoft Corp. | | | 51,690,723 | |
| | 116,850 | | | | | Visa, Inc. - Class A | | | 10,659,057 | |
| | | | | | | | | | |
| | | | | | | | | 272,011,291 | |
| | | | | | | | | | |
| | | | | | Materials (0.7%) | | | | |
| | 176,400 | | | | | Dow Chemical Company | | | 11,077,920 | |
| | 70,000 | | | | | Nucor Corp. | | | 4,293,100 | |
| | | | | | | | | | |
| | | | | | | | | 15,371,020 | |
| | | | | | | | | | |
| | | | | | Real Estate (0.8%) | | | | |
| | 128,925 | | | | | Crown Castle International Corp. | | | 12,196,305 | |
| | 49,000 | | | | | Welltower, Inc. | | | 3,500,560 | |
| | | | | | | | | | |
| | | | | | | | | 15,696,865 | |
| | | | | | | | | | |
| | | | | | Telecommunication Services (1.2%) | | | | |
| | 271,175 | | | | | AT&T, Inc. | | | 10,746,665 | |
| | 319,000 | | | | | Verizon Communications, Inc. | | | 14,645,290 | |
| | | | | | | | | | |
| | | | | | | | | 25,391,955 | |
| | | | | | | | | | |
| | | | | | TOTAL COMMON STOCKS
(Cost $1,015,347,986) | | | 1,366,290,028 | |
| | | | | | | | | | |
| | | | | | | | | | |
| | EXCHANGE-TRADED FUND (0.3%) | |
| | | | | | Other (0.3%) | | | | |
| | 18,700 | | | | | iShares NASDAQ Biotechnology ETF^ (Cost $ 5,245,917) | | | 5,565,868 | |
| | | | | | | | | | |
| | | | | | |
| See accompanying Notes to Schedule of Investments | | www.calamos.com | | | 85 | |
Growth and Income Fund Schedule of Investments April 30, 2017 (Unaudited)
| | | | | | | | | | |
NUMBER OF
CONTRACTS/
NOTIONAL
AMOUNT | | | | | | | VALUE | |
| | PURCHASED OPTIONS (0.0%) # | |
| | | | | | Information Technology (0.0%) | | | | |
| 1,233
123,300 |
| | | | Microsoft Corp. Put, 05/05/17, Strike $65.50 | | $ | 3,699 | |
| | | | | | | | | | |
| | | | | | | | | | |
| | | | | | Other (0.0%) | | | | |
| 811
81,100 |
| | | | S&P 500 Index Put, 05/19/17, Strike $2,300.00 | | | 360,895 | |
| | | | | | | | | | |
| | | | | | TOTAL PURCHASED OPTIONS
(Cost $2,253,127) | | | 364,594 | |
| | | | | | | | | | |
NUMBER OF
SHARES | | | | | | | VALUE | |
| | SHORT TERM INVESTMENTS (1.5%) | |
| | 15,509,190 | | | | | Fidelity Prime Money Market Fund - Institutional Class | | | 15,515,394 | |
| | 15,495,644 | | | | | Morgan Stanley Institutional Liquidity Funds - Government Portfolio | | | 15,495,644 | |
| | | | | | | | | | |
| | | | | | TOTAL SHORT TERM INVESTMENTS
(Cost $31,011,038) | | | 31,011,038 | |
| | | | | | | | | | |
NUMBER OF
SHARES/
PRINCIPAL
AMOUNT | | | | | | | VALUE | |
| INVESTMENT OF CASH COLLATERAL FOR SECURITIES
LOANED (1.1%) |
|
| | 14,822,415 | | | | | Deutsche Bank Securities, Inc.† 0.830%, 05/01/17 | | | 14,822,415 | |
| | 8,055,660 | | | | | Goldman Sachs Financial Square Government Fund | | | 8,055,660 | |
| | | | | | | | | | |
| | | | | | TOTAL INVESTMENT OF CASH COLLATERAL FOR SECURITIES LOANED (Cost $22,878,075) | | | 22,878,075 | |
| | | | | | | | | | |
| TOTAL INVESTMENTS (100.8%)
(Cost $1,709,918,517) | | | 2,101,182,379 | |
| | | | | | | | | | |
| PAYABLE UPON RETURN OF SECURITIES ON LOAN
(-1.1%) | | | (22,878,075 | ) |
| | | | | | | | | | |
| | OTHER ASSETS, LESS LIABILITIES (0.3%) | | | 5,767,191 | |
| | | | | | | | | | |
| | NET ASSETS (100.0%) | | | 2,084,071,495 | |
| | | | | | | | | | |
NUMBER OF
CONTRACTS/
NOTIONAL
AMOUNT | | | | | | | VALUE | |
| | WRITTEN OPTIONS (0.0%) # | |
| | | | | | Health Care (0.0%) | | | | |
| 760
76,000 |
| | | | Amgen, Inc. Put, 05/19/17, Strike $155.00 | | | (36,480 | ) |
| | | | | | | | | | |
| | | | | | | | | | |
NUMBER OF
CONTRACTS/
NOTIONAL
AMOUNT | | | | | | | VALUE | |
| | | | | | | | | | |
| | | | | | Information Technology (0.0%) | | | | |
| | 1,233 | | | | | Microsoft Corp. | | | | |
| | 123,300 | | | | | Call, 05/05/17, Strike $71.00 | | $ | (1,233 | ) |
| 1,233
123,300 |
| | | | Put, 05/05/17, Strike $63.00 | | | (1,233 | ) |
| | | | | | | | | | |
| | | | (2,466 | ) |
| | | | | | | | | | |
| | | | | | TOTAL WRITTEN OPTIONS (Premium $119,143) | | | (38,946 | ) |
| | | | | | | | | | |
NOTES TO SCHEDULE OF INVESTMENTS
| * | Securities issued and sold pursuant to a Rule 144A transaction are excepted from the registration requirement of the Securities Act of 1933, as amended. These securities may only be sold to qualified institutional buyers (“QIBs”), such as the Fund. Any resale of these securities must generally be effected through a sale that is registered under the Act or otherwise exempted from such registration requirements. |
| ^ | Security, or portion of security, is on loan. |
| # | Non-income producing security. |
| § | Securities exchangeable or convertible into securities of one or more entities that are different than the issuer. Each entity is identified in the parenthetical. |
| ** | Step Coupon security. Coupon changes periodically based upon a predetermined schedule. The rate shown is the rate in effect at April 30, 2017. |
| ~ | Security, or portion of security, is segregated as collateral (or potential collateral for future transactions) for written options. The aggregate value of such securities is $13,702,505. |
| † | Repurchase agreement collateralized by the following security: 15,118,240 United States Treasury Note, 3.625%, 02/15/20. |
| | | | |
| 86 | | CALAMOS OPEN-END FAMILY OF FUNDS SEMIANNUAL REPORT | | See accompanying Notes to Financial Statements |
Global Growth and Income Fund Schedule of Investments April 30, 2017 (Unaudited)
| | | | | | | | | | |
PRINCIPAL AMOUNT | | | | | | | VALUE | |
| | CONVERTIBLE BONDS (32.2%) | |
| | | | | | Consumer Discretionary (10.8%) | | | | |
| | 1,200,000 | | | EUR | | Bayer Capital Corp., BV*
5.625%, 11/22/19 | | $ | 1,585,258 | |
| | 5,098,000 | | | | | Ctrip.com International, Ltd.
1.000%, 07/01/20 | | | 5,687,660 | |
| | 1,365,000 | | | | | DISH Network Corp.*
3.375%, 08/15/26 | | | 1,672,958 | |
| | 1,740,000 | | | | | Liberty Interactive, LLC*
1.750%, 09/30/46 | | | 2,047,249 | |
| | 1,030,000 | | | | | LVMH Moet Hennessy Louis Vuitton, SE
0.000%, 02/16/21 | | | 3,022,731 | |
| | 5,935,000 | | | | | Priceline Group, Inc.^
0.900%, 09/15/21 | | | 6,790,975 | |
| | 1,320,000 | | | | | Tesla, Inc.
1.250%, 03/01/21 | | | 1,366,821 | |
| | 1,765,000 | | | | | Weatherford International, Ltd.
5.875%, 07/01/21 | | | 2,110,066 | |
| | | | | | | | | | |
| | | | | | | | | 24,283,718 | |
| | | | | | | | | | |
| | | | | | Energy (2.5%) | | | | |
| | 1,000,000 | | | EUR | | ENI, S.p.A
0.000%, 04/13/22 | | | 1,158,995 | |
| | 2,070,000 | | | | | PDC Energy, Inc.
1.125%, 09/15/21 | | | 2,015,735 | |
| | 2,000,000 | | | | | Tullow Oil Jersey, Ltd.
6.625%, 07/12/21 | | | 2,429,528 | |
| | | | | | | | | | |
| | | | | | | | | 5,604,258 | |
| | | | | | | | | | |
| | | | | | Financials (1.7%) | | | | |
| | 1,100,000 | | | EUR | | AURELIUS Equity Opportunities
SE & Co. KGaA
1.000%, 12/01/20 | | | 1,243,948 | |
| | 1,715,000 | | | CAD | | Element Fleet Management Corp.* 4.250%, 06/30/20 | | | 1,274,971 | |
| | 10,000,000 | | | HKD | | Haitong International Securities Group, Ltd.
0.000%, 10/25/21 | | | 1,289,910 | |
| | | | | | | | | | |
| | | | | | | | | 3,808,829 | |
| | | | | | | | | | |
| | | | | | Health Care (1.7%) | | | | |
| | 900,000 | | | EUR | | Magyar Nemzeti Vagyonkezelo Zrt
3.375%, 04/02/19 | | | 1,218,317 | |
| | 2,155,000 | | | | | Medidata Solutions, Inc.
1.000%, 08/01/18 | | | 2,660,046 | |
| | | | | | | | | | |
| | | | | | | | | 3,878,363 | |
| | | | | | | | | | |
| | | | | | Industrials (5.6%) | | | | |
| | 1,390,000 | | | | | Air Lease Corp.
3.875%, 12/01/18 | | | 1,988,200 | |
| | 1,070,000 | | | | | Dycom Industries, Inc.
0.750%, 09/15/21 | | | 1,355,851 | |
| | 240,000,000 | | | JPY | | Kandenko Company, Ltd.
0.000%, 03/31/21 | | | 2,439,813 | |
| | | | | | | | | | |
PRINCIPAL AMOUNT | | | | | | | VALUE | |
| | 2,425,000 | | | | | Larsen & Toubro, Ltd.
0.675%, 10/22/19 | | $ | 2,466,058 | |
| | 1,200,000 | | | | | MISUMI Group, Inc.
0.000%, 10/22/18 | | | 1,870,749 | |
| | 1,900,000 | | | EUR | | Prysmian S.p.A.
1.250%, 03/08/18 | | | 2,530,727 | |
| | | | | | | | | | |
| | | | | | | | | 12,651,398 | |
| | | | | | | | | | |
| | | | | | Information Technology (6.5%) | | | | |
| | 900,000 | | | EUR | | BE Semiconductor Industries, NV 2.500%, 12/02/23 | | | 1,290,595 | |
| | 925,000 | | | | | Cypress Semiconductor Corp.* 4.500%, 01/15/22 | | | 1,146,491 | |
| | 2,195,000 | | | | | Finisar Corp.*
0.500%, 12/15/36 | | | 2,044,785 | |
| | 1,160,000 | | | | | Lumentum Holdings, Inc.*
0.250%, 03/15/24 | | | 1,160,911 | |
| | 1,185,000 | | | | | Nice Systems, Inc.*
1.250%, 01/15/24 | | | 1,230,101 | |
| | 3,155,000 | | | | | ON Semiconductor Corp.^
1.000%, 12/01/20 | | | 3,336,444 | |
| | 1,150,000 | | | | | Silicon Laboratories, Inc.*
1.375%, 03/01/22 | | | 1,207,805 | |
| | 1,730,000 | | | | | Square, Inc.*
0.375%, 03/01/22 | | | 1,832,727 | |
| | 1,115,000 | | | | | Workday, Inc.
0.750%, 07/15/18 | | | 1,298,629 | |
| | | | | | | | | | |
| | | | | | | | | 14,548,488 | |
| | | | | | | | | | |
| | | | | | Materials (0.5%) | | | | |
| | 965,000 | | | | | Cemex, SAB de CV
3.750%, 03/15/18 | | | 1,127,294 | |
| | | | | | | | | | |
| | | | | | Real Estate (0.5%) | | | | |
| | 1,145,000 | | | | | Spirit Realty Capital, Inc.
3.750%, 05/15/21 | | | 1,176,499 | |
| | | | | | | | | | |
| | | | | | Telecommunication Services (2.4%) | | | | |
| | 4,800,000 | | | | | Telenor East Holding II AS
0.250%, 09/20/19 | | | 5,469,168 | |
| | | | | | | | | | |
| | | | | | TOTAL CONVERTIBLE BONDS (Cost $69,996,753) | | | 72,548,015 | |
| | | | | | | | | | |
| | | | | | | | | | |
| | SYNTHETIC CONVERTIBLE SECURITIES (1.9%) ¤ | |
| | Corporate Bonds (1.6%) | |
| | | | | | Consumer Discretionary (1.0%) | | | | |
| | 1,130,000 | | | | | L Brands, Inc.
5.625%, 02/15/22 | | | 1,195,840 | |
| | 1,115,000 | | | | | Toll Brothers Finance Corp.
4.000%, 12/31/18 | | | 1,147,474 | |
| | | | | | | | | | |
| | | | | | | | | 2,343,314 | |
| | | | | | | | | | |
| | | | | | |
| See accompanying Notes to Schedule of Investments | | www.calamos.com | | | 87 | |
Global Growth and Income Fund Schedule of Investments April 30, 2017 (Unaudited)
| | | | | | | | | | |
PRINCIPAL AMOUNT | | | | | | | VALUE | |
| | | | | | | | | | |
| | | | | | Industrials (0.6%) | | | | |
| | 1,240,000 | | | | | Icahn Enterprises, LP
4.875%, 03/15/19 | | $ | 1,260,262 | |
| | | | | | | | | | |
| | | | | | TOTAL CORPORATE BONDS | | | 3,603,576 | |
| | | | | | | | | | |
NUMBER OF CONTRACTS/ NOTIONAL AMOUNT | | | | | | | VALUE | |
| | Purchased Options (0.3%) # | |
| | | | | | Financials (0.2%) | |
| | 1,420 | | | EUR | | Estx Banks | | | | |
| | 71,000 | | | | | Call, 06/16/17, Strike 127.50 | | | 508,512 | |
| | | | | | | | | | |
| | | | | | Information Technology (0.1%) | |
| | 135 | | | | | Lam Research Corp. | | | | |
| | 13,500 | | | | | Call, 09/15/17, Strike $130.00 | | | 240,300 | |
| | | | | | | | | | |
| | | | | | Materials (0.0%) | | | | |
| | 2,350 | | | | | Vale, SA | | | | |
| | 235,000 | | | | | Call, 06/16/17, Strike $12.00 | | | 3,525 | |
| | | | | | | | | | |
| | | | | | TOTAL PURCHASED OPTIONS | | | 752,337 | |
| | | | | | | | | | |
| | | | | | TOTAL SYNTHETIC
CONVERTIBLE SECURITIES
(Cost $4,161,404) | | | 4,355,913 | |
| | | | | | | | | | |
NUMBER OF SHARES | | | | | | | VALUE | |
| | CONVERTIBLE PREFERRED STOCKS (6.8%) | |
| | | | | | Health Care (2.6%) | |
| | 5,200 | | | | | Allergan, PLC
5.500%, 03/01/18 | | | 4,502,056 | |
| | 26,700 | | | | | Anthem, Inc.
5.250%, 05/01/18 | | | 1,371,846 | |
| | | | | | | | | | |
| | | | | | | | | 5,873,902 | |
| | | | | | | | | | |
| | | | | | Real Estate (0.6%) | |
| | | | | | American Tower Corp. | | | | |
| | 5,984 | | | | | 5.250%, 05/15/17 | | | 703,359 | |
| | 5,113 | | | | | 5.500%, 02/15/18 | | | 591,830 | |
| | | | | | | | | | |
| | | | | | | | | 1,295,189 | |
| | | | | | | | | | |
| | | | | | Telecommunication Services (2.7%) | |
| | 30,000 | | | | | Alibaba Exchangeable (Softbank)*§
5.750%, 06/03/19 | | | 4,123,998 | |
| | 16,900 | | | | | T-Mobile USA, Inc.
5.500%, 12/15/17 | | | 1,854,268 | |
| | | | | | | | | | |
| | | | | | | | | 5,978,266 | |
| | | | | | | | | | |
| | | | | | Utilities (0.9%) | |
| | | | | | NextEra Energy, Inc. | | | | |
| | 21,900 | | | | | 6.371%, 09/01/18 | | | 1,350,573 | |
| | 14,000 | | | | | 6.123%, 09/01/19 | | | 733,600 | |
| | | | | | | | | | |
| | | | | | | | | 2,084,173 | |
| | | | | | | | | | |
| | | | | | TOTAL CONVERTIBLE PREFERRED STOCKS
(Cost $12,967,872) | | | 15,231,530 | |
| | | | | | | | | | |
| | | | | | | | | | |
NUMBER OF SHARES | | | | | | | VALUE | |
| | COMMON STOCKS (58.1%) | |
| | | | | | Consumer Discretionary (4.0%) | | | | |
| | 89,100 | | | | | D.R. Horton, Inc. | | $ | 2,930,499 | |
| | 38,000 | | | EUR | | Daimler, AG | | | 2,831,545 | |
| | 30,200 | | | | | Nike, Inc. - Class B | | | 1,673,382 | |
| | 30,600 | | | JPY | | Toyota Motor Corp. | | | 1,656,096 | |
| | | | | | | | | | |
| | | | | | | | | 9,091,522 | |
| | | | | | | | | | |
| | | | | | Consumer Staples (6.7%) | |
| | 17,500 | | | EUR | | Anheuser-Busch InBev, SA | | | 1,973,481 | |
| | 23,300 | | | GBP | | British American Tobacco, PLC | | | 1,574,225 | |
| | 30,100 | | | | | Coca-Cola Company | | | 1,298,815 | |
| | 82,500 | | | GBP | | Diageo, PLC | | | 2,401,342 | |
| | 17,600 | | | CHF | | Nestlé, SA | | | 1,355,561 | |
| | 40,300 | | | EUR | | Unilever, NV | | | 2,111,135 | |
| | 27,200 | | | | | Wal-Mart Stores, Inc. | | | 2,044,896 | |
| | 27,800 | | | | | Walgreens Boots Alliance, Inc. | | | 2,405,812 | |
| | | | | | | | | | |
| | | | | | | | | 15,165,267 | |
| | | | | | | | | | |
| | | | | | Energy (3.3%) | |
| | 17,401 | | | | | Anadarko Petroleum Corp. | | | 992,205 | |
| | 12,600 | | | | | Exxon Mobil Corp. | | | 1,028,790 | |
| | 81,800 | | | EUR | | Royal Dutch Shell, PLC - Class A | | | 2,132,921 | |
| | 20,700 | | | | | Schlumberger, Ltd. | | | 1,502,613 | |
| | 33,290 | | | EUR | | TOTAL, SA | | | 1,708,883 | |
| | | | | | | | | | |
| | | | | | | | | 7,365,412 | |
| | | | | | | | | | |
| | | | | | Financials (13.3%) | |
| | 231,800 | | | HKD | | AIA Group, Ltd. | | | 1,604,389 | |
| | 123,500 | | | | | Bank of America Corp. | | | 2,882,490 | |
| | 20,000 | | | EUR | | BNP Paribas, SA | | | 1,411,544 | |
| | 46,100 | | | | | Citigroup, Inc. | | | 2,725,432 | |
| | 151,700 | | | CHF | | Credit Suisse Group, AG# | | | 2,313,571 | |
| | 271,000 | | | JPY | | Daiwa Securities Group, Inc. | | | 1,648,594 | |
| | 98,200 | | | | | Fifth Third Bancorp | | | 2,399,026 | |
| | 117,000 | | | INR | | HDFC Bank, Ltd. | | | 2,807,804 | |
| | 43,600 | | | | | JPMorgan Chase & Company | | | 3,793,200 | |
| | 345,100 | | | JPY | | Mitsubishi UFJ Financial Group, Inc. | | | 2,186,759 | |
| | 17,700 | | | | | PNC Financial Services Group, Inc. | | | 2,119,575 | |
| | 82,475 | | | GBP | | Prudential, PLC | | | 1,830,438 | |
| | 41,000 | | | | | Wells Fargo & Company | | | 2,207,440 | |
| | | | | | | | | | |
| | | | | | | | | 29,930,262 | |
| | | | | | | | | | |
| | | | | | Health Care (5.5%) | |
| | 35,600 | | | | | Baxter International, Inc. | | | 1,982,208 | |
| | 20,700 | | | | | Celgene Corp.# | | | 2,567,835 | |
| | 21,400 | | | | | Johnson & Johnson | | | 2,642,258 | |
| | 31,400 | | | | | Merck & Company, Inc. | | | 1,957,162 | |
| | 7,150 | | | CHF | | Roche Holding, AG | | | 1,870,901 | |
| | 7,400 | | | | | UnitedHealth Group, Inc. | | | 1,294,112 | |
| | | | | | | | | | |
| | | | | | | | | 12,314,476 | |
| | | | | | | | | | |
| | | | |
| 88 | | CALAMOS OPEN-END FAMILY OF FUNDS SEMIANNUAL REPORT | | See accompanying Notes to Schedule of Investments |
Global Growth and Income Fund Schedule of Investments April 30, 2017 (Unaudited)
| | | | | | | | | | |
NUMBER OF SHARES | | | | | | | VALUE | |
| | | | | | | | | | |
| | | | | | Industrials (5.6%) | |
| | 19,100 | | | JPY | | FANUC Corp. | | $ | 3,888,686 | |
| | 175,000 | | | GBP | | International Consolidated Airlines Group, SA | | | 1,268,777 | |
| | 70,500 | | | JPY | | Komatsu, Ltd. | | | 1,883,869 | |
| | 106,700 | | | INR | | Larsen & Toubro, Ltd. | | | 2,901,161 | |
| | 17,300 | | | EUR | | Schneider Electric, SE | | | 1,370,259 | |
| | 10,600 | | | | | United Technologies Corp. | | | 1,261,294 | |
| | | | | | | | | | |
| | | | | | | | | 12,574,046 | |
| | | | | | | | | | |
| | | | | | Information Technology (16.8%) | |
| | 10,300 | | | | | Accenture, PLC - Class A | | | 1,249,390 | |
| | 8,700 | | | | | Alphabet, Inc. - Class A# | | | 8,043,324 | |
| | 35,300 | | | | | Apple, Inc. | | | 5,070,845 | |
| | 12,500 | | | | | Automatic Data Processing, Inc. | | | 1,306,125 | |
| | 7,800 | | | | | Broadcom, Ltd. | | | 1,722,318 | |
| | 15,600 | | | | | Facebook, Inc. - Class A# | | | 2,343,900 | |
| | 14,300 | | | | | MasterCard, Inc. - Class A | | | 1,663,376 | |
| | 56,800 | | | | | Microsoft Corp. | | | 3,888,528 | |
| | 675 | | | KRW | | Samsung Electronics Company, Ltd. | | | 1,323,290 | |
| | 20,000 | | | EUR | | SAP, SE | | | 2,003,320 | |
| | 532,000 | | | TWD | | Taiwan Semiconductor Manufacturing Company, Ltd. | | | 3,427,088 | |
| | 29,300 | | | CHF | | Temenos Group, AG# | | | 2,536,086 | |
| | 108,000 | | | HKD | | Tencent Holdings, Ltd. | | | 3,384,000 | |
| | | | | | | | | | |
| | | | | | | | | 37,961,590 | |
| | | | | | | | | | |
| | | | | | Materials (2.4%) | | | | |
| | 52,600 | | | EUR | | CRH, PLC | | | 1,915,908 | |
| | 430,000 | | | GBP | | Glencore, PLC# | | | 1,689,961 | |
| | 53,400 | | | | | Newmont Mining Corp. | | | 1,805,454 | |
| | | | | | | | | | |
| | | | | | | | | 5,411,323 | |
| | | | | | | | | | |
| | | | | | Telecommunication Services (0.5%) | | | | |
| | 27,700 | | | | | AT&T, Inc. | | | 1,097,751 | |
| | | | | | | | | | |
| | | | | | TOTAL COMMON STOCKS
(Cost $107,248,144) | | | 130,911,649 | |
| | | | | | | | | | |
PRINCIPAL
AMOUNT | | | | | | | VALUE | |
| | SOVEREIGN BOND (0.6%) | |
| | 25,265,000 | | | MXN | | Mexican Bonos 6.500%, 06/10/21 (Cost $1,235,921) | | | 1,317,333 | |
| | | | | | | | | | |
| | | | | | | | | | |
NUMBER OF
CONTRACTS/
NOTIONAL
AMOUNT | | | | | | | VALUE | |
| | PURCHASED OPTIONS (0.1%) # | |
| | | | | | Other (0.1%) | | | | |
| 300
3,000 |
| | EUR | | Euro Stoxx 50
Put, 05/19/17, Strike 3,450.00 | | | 89,214 | |
| | | | | | | | | | |
NUMBER OF
CONTRACTS/
NOTIONAL
AMOUNT | | | | | | | VALUE | |
| 3,340
334,000 |
| | | | Financial Select Sector SPDR
Fund Put, 05/19/17, Strike $23.00 | | $ | 45,090 | |
| 475
47,500 |
| | | | SPDR S&P 500 ETF Trust
Put, 05/19/17, Strike $235.00 | | | 45,362 | |
| | | | | | | | | | |
| | | | | | TOTAL PURCHASED OPTIONS (Cost $624,124) | | | 179,666 | |
| | | | | | | | | | |
NUMBER OF
SHARES | | | | | | | VALUE | |
| | SHORT TERM INVESTMENTS (0.5%) | |
| | 557,051 | | | | | Fidelity Prime Money Market Fund - Institutional Class | | | 557,273 | |
| | 556,489 | | | | | Morgan Stanley Institutional Liquidity Funds - Government Portfolio | | | 556,489 | |
| | | | | | | | | | |
| | | | | | TOTAL SHORT TERM INVESTMENTS
(Cost $1,113,762) | | | 1,113,762 | |
| | | | | | | | | | |
NUMBER OF
SHARES/
PRINCIPAL
AMOUNT | | | | | | | VALUE | |
| INVESTMENT OF CASH COLLATERAL FOR SECURITIES
LOANED (2.0%) |
|
| | 2,936,773 | | | | | Deutsche Bank Securities, Inc.† 0.830%, 05/01/17 | | | 2,936,773 | |
| | 1,596,072 | | | | | Goldman Sachs Financial Square Government Fund | | | 1,596,072 | |
| | | | | | | | | | |
| | | | | | TOTAL INVESTMENT OF CASH COLLATERAL FOR SECURITIES LOANED (Cost $4,532,845) | | | 4,532,845 | |
| | | | | | | | | | |
| TOTAL INVESTMENTS (102.2%)
(Cost $201,880,825) | | | 230,190,713 | |
| | | | | | | | | | |
| |
| PAYABLE UPON RETURN OF SECURITIES ON LOAN
(-2.0%) | | | (4,532,845 | ) |
| | | | | | | | | | |
| |
| | LIABILITIES, LESS OTHER ASSETS (-0.2%) | | | (489,461 | ) |
| | | | | | | | | | |
| |
| | NET ASSETS (100.0%) | | $ | 225,168,407 | |
| | | | | | | | | | |
FORWARD FOREIGN CURRENCY CONTRACTS
| | | | | | | | | | | | | | |
| COUNTERPARTY | | SHORT CONTRACTS | | SETTLEMENT
DATE | | LOCAL
CURRENCY | | | CURRENT VALUE | | | UNREALIZED GAIN/LOSS |
State Street Bank and Trust Company | | European Monetary Unit | | 05/31/17 | | | 2,441,000 | | | $ | 2,662,545 | | | $(28,444) |
| | | | | | | | | | | | | | |
| | | | | | |
| See accompanying Notes to Schedule of Investments | | www.calamos.com | | | 89 | |
Global Growth and Income Fund Schedule of Investments April 30, 2017 (Unaudited)
NOTES TO SCHEDULE OF INVESTMENTS
| * | Securities issued and sold pursuant to a Rule 144A transaction are excepted from the registration requirement of the Securities Act of 1933, as amended. These securities may only be sold to qualified institutional buyers (“QIBs”), such as the Fund. Any resale of these securities must generally be effected through a sale that is registered under the Act or otherwise exempted from such registration requirements. |
| ^ | Security, or portion of security, is on loan. |
| ¤ | The synthetic convertible securities strategy combines separate securities that together possess the economic characteristics similar to a convertible security. |
| § | Securities exchangeable or convertible into securities of one or more entities that are different than the issuer. Each entity is identified in the parenthetical. |
| # | Non-income producing security. |
| † | Repurchase agreement collateralized by the following security: 2,995,385 United States Treasury Note, 3.625%, 02/15/20. |
FOREIGN CURRENCY ABBREVIATIONS
| | |
| CAD | | Canadian Dollar |
| CHF | | Swiss Franc |
| EUR | | European Monetary Unit |
| GBP | | British Pound Sterling |
| HKD | | Hong Kong Dollar |
| INR | | Indian Rupee |
| JPY | | Japanese Yen |
| KRW | | South Korean Won |
| MXN | | Mexican Peso |
| TWD | | New Taiwan Dollar |
Note: Value for securities denominated in foreign currencies is shown in U.S. dollars. The principal amount for such securities is shown in the respective foreign currency. The date on options represents the expiration date of the option contract. The option contract may be exercised at any date on or before the date shown.
CURRENCY EXPOSURE
APRIL 30, 2017
| | | | | | | | |
| | | VALUE | | | % OF TOTAL
INVESTMENTS | |
| US Dollar | | $ | 153,231,526 | | | | 66.6% | |
| European Monetary Unit | | | 27,084,562 | | | | 11.8% | |
| Japanese Yen | | | 13,703,817 | | | | 5.9% | |
| British Pound Sterling | | | 8,764,743 | | | | 3.8% | |
| Swiss Franc | | | 8,076,119 | | | | 3.5% | |
| Hong Kong Dollar | | | 6,278,299 | | | | 2.7% | |
| Indian Rupee | | | 5,708,965 | | | | 2.5% | |
| New Taiwan Dollar | | | 3,427,088 | | | | 1.5% | |
| South Korean Won | | | 1,323,290 | | | | 0.6% | |
| Mexican Peso | | | 1,317,333 | | | | 0.6% | |
| Canadian Dollar | | | 1,274,971 | | | | 0.5% | |
| Total Investments | | $ | 230,190,713 | | | | 100.0% | |
Currency exposure may vary over time.
| | | | |
| 90 | | CALAMOS OPEN-END FAMILY OF FUNDS SEMIANNUAL REPORT | | See accompanying Notes to Financial Statements |
Convertible Fund Schedule of Investments April 30, 2017 (Unaudited)
| | | | | | | | | | |
PRINCIPAL
AMOUNT | | | | | | | VALUE | |
| | CONVERTIBLE BONDS (73.0%) | |
| | | | | | Consumer Discretionary (19.5%) | | | | |
| | 7,500,000 | | | | | CalAtlantic Group, Inc.
1.625%, 05/15/18 | | $ | 9,161,625 | |
| | 5,500,000 | | | | | Ctrip.com International, Ltd.
1.000%, 07/01/20 | | | 6,136,158 | |
| | 11,000,000 | | | | | DISH Network Corp.*
3.375%, 08/15/26 | | | 13,481,710 | |
| | 7,250,000 | | | | | Liberty Interactive, LLC*
1.750%, 09/30/46 | | | 8,530,205 | |
| | | | | | Liberty Media Corp. | | | | |
| | 8,380,000 | | | | | 1.375%, 10/15/23 | | | 9,492,235 | |
| | 7,200,000 | | | | | 2.250%, 09/30/46* | | | 7,845,408 | |
| | 3,000,000 | | | | | Liberty Media Corp./Liberty Formula One*
1.000%, 01/30/23 | | | 3,376,035 | |
| | 3,500,000 | | | | | Macquarie Infrastructure Corp.
2.000%, 10/01/23 | | | 3,462,900 | |
| | 18,005,000 | | | | | Priceline Group, Inc.^
0.900%, 09/15/21 | | | 20,601,771 | |
| | | | | | Tesla, Inc. | | | | |
| | 27,300,000 | | | | | 1.250%, 03/01/21 | | | 28,268,331 | |
| | 1,600,000 | | | | | 2.375%, 03/15/22 | | | 1,789,728 | |
| | 4,000,000 | | | | | Weatherford International, Ltd.
5.875%, 07/01/21 | | | 4,782,020 | |
| | 825,000 | | | | | World Wrestling Entertainment, Inc.*
3.375%, 12/15/23 | | | 897,097 | |
| | | | | | | | | | |
| | | | | | | | | 117,825,223 | |
| | | | | | | | | | |
| | | | | | Energy (2.6%) | |
| | 6,250,000 | | | | | Nabors Industries, Inc.*^
0.750%, 01/15/24 | | | 5,388,750 | |
| | 1,650,000 | | | | | Newpark Resources, Inc.*^ 4.000%, 12/01/21 | | | 1,822,615 | |
| | 4,850,000 | | | | | PDC Energy, Inc.
1.125%, 09/15/21 | | | 4,722,857 | |
| | 4,165,000 | | | | | SM Energy Company^
1.500%, 07/01/21 | | | 4,114,541 | |
| | | | | | | | | | |
| | | | | | | | | 16,048,763 | |
| | | | | | | | | | |
| | | | | | Financials (1.0%) | |
| | 6,250,000 | | | | | Ares Capital Corp.*
3.750%, 02/01/22 | | | 6,334,188 | |
| | | | | | | | | | |
| | | | | | Health Care (10.8%) | |
| | 1,400,000 | | | | | Acorda Therapeutics, Inc.
1.750%, 06/15/21 | | | 1,102,402 | |
| | 7,790,000 | | | | | BioMarin Pharmaceutical, Inc. 0.750%, 10/15/18 | | | 9,142,578 | |
| | 7,000,000 | | | | | Emergent Biosolutions, Inc. 2.875%, 01/15/21 | | | 8,495,305 | |
| | 3,275,000 | | | | | Evolent Health, Inc.*^
2.000%, 12/01/21 | | | 4,037,535 | |
| | 2,000,000 | | | | | Flexion Therapeutics, Inc.*
3.375%, 05/01/24 | | | 2,077,500 | |
| | | | | | | | | | |
PRINCIPAL
AMOUNT | | | | | | | VALUE | |
| | 3,550,000 | | | | | Insulet Corp.*
1.250%, 09/15/21 | | $ | 3,606,569 | |
| | 4,200,000 | | | | | Ironwood Pharmaceuticals, Inc.
2.250%, 06/15/22 | | | 5,108,397 | |
| | 4,040,000 | | | | | Jazz Investments I, Ltd.
1.875%, 08/15/21 | | | 4,489,106 | |
| | 1,250,000 | | | | | Medicines Company*
2.750%, 07/15/23 | | | 1,518,412 | |
| | 9,733,000 | | | | | Medidata Solutions, Inc.
1.000%, 08/01/18 | | | 12,014,026 | |
| | 5,475,000 | | | | | Molina Healthcare, Inc.
1.625%, 08/15/44 | | | 6,005,035 | |
| | 847,000 | | | | | Neurocrine Biosciences, Inc.*
2.250%, 05/15/24 | | | 885,644 | |
| | 4,975,000 | | | | | NuVasive, Inc.
2.250%, 03/15/21 | | | 6,650,431 | |
| | | | | | | | | | |
| | | | | | | | | 65,132,940 | |
| | | | | | | | | | |
| | | | | | Industrials (5.5%) | |
| | 3,200,000 | | | | | Aerojet Rocketdyne Holdings, Inc.*
2.250%, 12/15/23 | | | 3,545,616 | |
| | 2,455,000 | | | | | Air Lease Corp.
3.875%, 12/01/18 | | | 3,511,534 | |
| | 3,250,000 | | | | | Atlas Air Worldwide Holdings, Inc.
2.250%, 06/01/22 | | | 3,584,961 | |
| | 4,750,000 | | | | | Dycom Industries, Inc.
0.750%, 09/15/21 | | | 6,018,962 | |
| | 4,500,000 | | | | | Greenbrier Companies, Inc.*
2.875%, 02/01/24 | | | 4,773,870 | |
| | 6,250,000 | | | | | Pacira Pharmaceuticals, Inc.*
2.375%, 04/01/22 | | | 6,680,844 | |
| | 4,100,000 | | | | | Tutor Perini Corp.*
2.875%, 06/15/21 | | | 5,073,935 | |
| | | | | | | | | | |
| | | | | | | | | 33,189,722 | |
| | | | | | | | | | |
| | | | | | Information Technology (28.4%) | |
| | 1,810,000 | | | | | Advanced Micro Devices, Inc.
2.125%, 09/01/26 | | | 3,327,830 | |
| | 4,943,000 | | | | | Citrix Systems, Inc.
0.500%, 04/15/19 | | | 6,050,973 | |
| | 4,750,000 | | | | | Finisar Corp.*
0.500%, 12/15/36 | | | 4,424,934 | |
| | 3,600,000 | | | | | Inphi Corp.*
0.750%, 09/01/21 | | | 3,695,130 | |
| | 11,600,000 | | | | | Intel Corp.
3.250%, 08/01/39 | | | 20,284,630 | |
| | 3,100,000 | | | | | Knowles Corp.*
3.250%, 11/01/21 | | | 3,758,115 | |
| | 6,250,000 | | | | | Lumentum Holdings, Inc.*
0.250%, 03/15/24 | | | 6,254,906 | |
| | 13,750,000 | | | | | Microchip Technology, Inc.*
1.625%, 02/15/27 | | | 14,149,644 | |
| | 5,150,000 | | | | | Micron Technology, Inc.
1.625%, 02/15/33 | | | 13,032,230 | |
| | | | | | |
| See accompanying Notes to Schedule of Investments | | www.calamos.com | | | 91 | |
Convertible Fund Schedule of Investments April 30, 2017 (Unaudited)
| | | | | | | | | | |
PRINCIPAL
AMOUNT | | | | | | | VALUE | |
| | | | | | | | | | |
| | 3,000,000 | | | | | Nice Systems, Inc.*
1.250%, 01/15/24 | | $ | 3,114,180 | |
| | | | | | ON Semiconductor Corp.^ | | | | |
| | 5,800,000 | | | | | 1.000%, 12/01/20 | | | 6,133,558 | |
| | 3,000,000 | | | | | 1.625%, 10/15/23* | | | 3,001,125 | |
| | 3,250,000 | | | | | OSI Systems, Inc.*
1.250%, 09/01/22 | | | 3,228,745 | |
| | 2,600,000 | | | | | Palo Alto Networks, Inc.
0.000%, 07/01/19 | | | 3,029,702 | |
| | 3,300,000 | | | | | Pandora Media, Inc.
1.750%, 12/01/20 | | | 3,205,373 | |
| | 8,853,000 | | | | | Proofpoint, Inc.
0.750%, 06/15/20 | | | 10,152,532 | |
| | 2,525,000 | | | | | Red Hat, Inc.^
0.250%, 10/01/19 | | | 3,323,872 | |
| | 3,225,000 | | | | | Rovi Corp.^
0.500%, 03/01/20 | | | 3,190,073 | |
| | 12,100,000 | | | | | Salesforce.com, Inc.
0.250%, 04/01/18 | | | 16,057,063 | |
| | 2,300,000 | | | | | ServiceNow, Inc.
0.000%, 11/01/18 | | | 3,104,379 | |
| | 6,250,000 | | | | | Silicon Laboratories, Inc.*
1.375%, 03/01/22 | | | 6,564,156 | |
| | 6,250,000 | | | | | Square, Inc.*
0.375%, 03/01/22 | | | 6,621,125 | |
| | 3,200,000 | | | | | Teradyne, Inc.*
1.250%, 12/15/23 | | | 4,027,552 | |
| | 3,000,000 | | | | | Veeco Instruments, Inc.
2.700%, 01/15/23 | | | 3,298,905 | |
| | 3,250,000 | | | | | Viavi Solutions, Inc.*
1.000%, 03/01/24 | | | 3,304,161 | |
| | 3,075,000 | | | | | WebMD Health Corp.*
2.625%, 06/15/23 | | | 2,979,198 | |
| | | | | | Workday, Inc. | | | | |
| | 7,500,000 | | | | | 0.750%, 07/15/18 | | | 8,735,175 | |
| | 2,900,000 | | | | | 1.500%, 07/15/20 | | | 3,641,385 | |
| | | | | | | | | | |
| | | | | | | | | 171,690,651 | |
| | | | | | | | | | |
| | | | | | Materials (1.4%) | |
| | 3,450,000 | | | | | Royal Gold, Inc.
2.875%, 06/15/19 | | | 3,671,421 | |
| | 4,000,000 | | | | | RTI International Metals, Inc.
1.625%, 10/15/19 | | | 4,760,600 | |
| | | | | | | | | | |
| | | | | | | | | 8,432,021 | |
| | | | | | | | | | |
| | | | | | Real Estate (3.8%) | |
| | 10,100,000 | | | | | Colony Starwood Homes
3.000%, 07/01/19 | | | 12,077,024 | |
| | 3,100,000 | | | | | Empire State Realty OP, LP*
2.625%, 08/15/19 | | | 3,554,662 | |
| | 4,195,000 | | | | | Spirit Realty Capital, Inc.
3.750%, 05/15/21 | | | 4,310,404 | |
| | | | | | | | | | |
PRINCIPAL
AMOUNT | | | | | | | VALUE | |
| | 3,000,000 | | | | | Starwood Property Trust, Inc.
4.375%, 04/01/23 | | $ | 2,999,535 | |
| | | | | | | | | | |
| | | | | | | | | 22,941,625 | |
| | | | | | | | | | |
| | | | | | TOTAL CONVERTIBLE BONDS
(Cost $422,665,707) | | | 441,595,133 | |
| | | | | | | | | | |
| | SYNTHETIC CONVERTIBLE SECURITIES (0.4%) ¤ | |
NUMBER OF
CONTRACTS/
NOTIONAL
AMOUNT | | | | | | | VALUE | |
| | | | | | | | | | |
| | Purchased Options (0.4%) # | |
| | | | | | Financials (0.1%) | |
| 3,000
300,000 |
| | | | Bank Of America Corp. Call, 01/18/19, Strike $25.00 | | | 730,500 | |
| | | | | | | | | | |
| | | | | | Information Technology (0.3%) | |
| 1,865
186,500 |
| | | | Xilinx, Inc. Call, 06/16/17, Strike $55.00 | | | 1,529,300 | |
| | | | | | | | | | |
| | | | | | TOTAL PURCHASED OPTIONS | | | 2,259,800 | |
| | | | | | | | | | |
| | | | | | TOTAL SYNTHETIC CONVERTIBLE SECURITIES
(Cost $1,669,953) | | | 2,259,800 | |
| | | | | | | | | | |
| | | | | | | | | | |
NUMBER OF
SHARES | | | | | | | VALUE | |
| | CONVERTIBLE PREFERRED STOCKS (19.9%) | |
| | | | | | Energy (2.6%) | |
| | 113,000 | | | | | Hess Corp. 8.000%, 02/01/19 | | | 6,740,450 | |
| | 183,000 | | | | | Southwestern Energy Company
6.250%, 01/15/18 | | | 3,381,840 | |
| | 98,250 | | | | | WPX Energy, Inc.
6.250%, 07/31/18 | | | 5,383,117 | |
| | | | | | | | | | |
| | | | | | | | | 15,505,407 | |
| | | | | | | | | | |
| | | | | | Financials (6.0%) | |
| | 54,750 | | | | | Affiliated Managers Group, Inc.
5.150%, 10/15/37 | | | 3,141,281 | |
| | 10,300 | | | | | Bank of America Corp.
7.250%, 12/31/49 | | | 12,498,226 | |
| | 15,570 | | | | | Virtus Investment Partners, Inc.
7.250%, 02/01/20 | | | 1,525,082 | |
| | 15,000 | | | | | Wells Fargo & Company
7.500%, 12/31/49 | | | 19,050,000 | |
| | | | | | | | | | |
| | | | | | | | | 36,214,589 | |
| | | | | | | | | | |
| | | | | | Health Care (3.7%) | |
| | 17,740 | | | | | Allergan, PLC
5.500%, 03/01/18 | | | 15,358,937 | |
| | 139,000 | | | | | Anthem, Inc.
5.250%, 05/01/18 | | | 7,141,820 | |
| | | | | | | | | | |
| | | | | | | | | 22,500,757 | |
| | | | | | | | | | |
| | | | |
| 92 | | CALAMOS OPEN-END FAMILY OF FUNDS SEMIANNUAL REPORT | | See accompanying Notes to Schedule of Investments |
Convertible Fund Schedule of Investments April 30, 2017 (Unaudited)
| | | | | | | | | | |
NUMBER OF
SHARES | | | | | | | VALUE | |
| | | | | | | | | | |
| | | | | | Industrials (0.6%) | |
| | 65,400 | | | | | Rexnord Corp.
5.750%, 11/15/19 | | $ | 3,685,290 | |
| | | | | | | | | | |
| | | | | | Materials (0.7%) | |
| | 100,000 | | | | | Arconic, Inc.
5.375%, 10/01/17 | | | 4,246,000 | |
| | | | | | | | | | |
| | | | | | Real Estate (1.6%) | |
| | | | | | American Tower Corp. | | | | |
| | 30,172 | | | | | 5.250%, 05/15/17 | | | 3,546,417 | |
| | 27,610 | | | | | 5.500%, 02/15/18 | | | 3,195,857 | |
| | 52,200 | | | | | Welltower, Inc.
6.500%, 12/31/49 | | | 3,299,562 | |
| | | | | | | | | | |
| | | | | | | | | 10,041,836 | |
| | | | | | | | | | |
| | | | | | Telecommunication Services (1.8%) | |
| | 42,970 | | | | | Alibaba Exchangeable
(Softbank)*§
5.750%, 06/03/19 | | | 5,906,940 | |
| | 45,000 | | | | | T-Mobile USA, Inc.
5.500%, 12/15/17 | | | 4,937,400 | |
| | | | | | | | | | |
| | | | | | | | | 10,844,340 | |
| | | | | | | | | | |
| | | | | | Utilities (2.9%) | |
| | 69,000 | | | | | DTE Energy Company
6.500%, 10/01/19 | | | 3,733,342 | |
| | 69,000 | | | | | Great Plains Energy, Inc.
7.000%, 09/15/19 | | | 3,732,900 | |
| | | | | | NextEra Energy, Inc. | | | | |
| | 116,000 | | | | | 6.123%, 09/01/19 | | | 6,078,400 | |
| | | | | | | | | | |
| | 62,000 | | | | | 6.371%, 09/01/18 | | | 3,823,540 | |
| | | | | | | | | | |
| | | | | | | | | 17,368,182 | |
| | | | | | | | | | |
| | | | | | TOTAL CONVERTIBLE PREFERRED STOCKS (Cost $116,326,597) | | | 120,406,401 | |
| | | | | | | | | | |
| | COMMON STOCKS (3.1%) | |
| | | | | | Information Technology (3.1%) | |
| | 93,500 | | | | | Lam Research Corp. | | | 13,543,475 | |
| | 85,500 | | | | | Take-Two Interactive Software, Inc.# | | | 5,373,675 | |
| | | | | | | | | | |
| | | | | | TOTAL COMMON STOCKS (Cost $9,828,856) | | | 18,917,150 | |
| | | | | | | | | | |
NUMBER OF
CONTRACTS/
NOTIONAL
AMOUNT | | | | | | | VALUE | |
| | PURCHASED OPTION (0.1%) # | |
| | | | | | Other (0.1%) | |
| 210
21,000 |
| | | | S&P 500 Index Put, 05/19/17, Strike $2,350.00 (Cost $609,744) | | | 200,550 | |
| | | | | | | | | | |
| | | | | | | | | | |
| | | | | | | | | | |
NUMBER OF
SHARES | | | | | | | VALUE | |
| | SHORT TERM INVESTMENTS (3.2%) | |
| | 9,661,398 | | | | | Fidelity Prime Money Market Fund - Institutional Class | | $ | 9,665,263 | |
| | 9,643,606 | | | | | Morgan Stanley Institutional Liquidity Funds - Government Portfolio | | | 9,643,606 | |
| | | | | | | | | | |
| | | | | | TOTAL SHORT TERM INVESTMENTS (Cost $19,308,869) | | | 19,308,869 | |
| | | | | | | | | | |
| | | | | | | | | | |
NUMBER OF
SHARES/
PRINCIPAL
AMOUNT | | | | | | | VALUE | |
| INVESTMENT OF CASH COLLATERAL FOR SECURITIES
LOANED (3.0%) |
|
| | 11,844,495 | | | | | Deutsche Bank Securities, Inc.† 0.830%, 05/01/17 | | | 11,844,495 | |
| | 6,437,225 | | | | | Goldman Sachs Financial Square Government Fund | | | 6,437,225 | |
| | | | | | | | | | |
| | | | | | TOTAL INVESTMENT OF
CASH COLLATERAL FOR
SECURITIES LOANED
(Cost $18,281,720) | | | 18,281,720 | |
| | | | | | | | | | |
| TOTAL INVESTMENTS (102.7%)
(Cost $588,691,446) | | | 620,969,623 | |
| | | | | | | | | | |
| |
| | PAYABLE UPON RETURN OF SECURITIES ON LOAN (-3.0%) | | | (18,281,720 | ) |
| | | | | | | | | | |
| |
| | OTHER ASSETS, LESS LIABILITIES (0.3%) | | | 2,196,601 | |
| | | | | | | | | | |
| |
| | NET ASSETS (100.0%) | | $ | 604,884,504 | |
| | | | | | | | | | |
NOTES TO SCHEDULE OF INVESTMENTS
| * | Securities issued and sold pursuant to a Rule 144A transaction are excepted from the registration requirement of the Securities Act of 1933, as amended. These securities may only be sold to qualified institutional buyers (“QIBs”), such as the Fund. Any resale of these securities must generally be effected through a sale that is registered under the Act or otherwise exempted from such registration requirements. |
| ^ | Security, or portion of security, is on loan. |
| ¤ | The synthetic convertible securities strategy combines separate securities that together possess the economic characteristics similar to a convertible security. |
| # | Non-income producing security. |
| § | Securities exchangeable or convertible into securities of one or more entities that are different than the issuer. Each entity is identified in the parenthetical. |
| † | Repurchase agreement collateralized by the following security: 12,080,886 United States Treasury Note, 3.625%, 02/15/20. |
Note: The date on options represents the expiration date of the option contract. The option contract may be exercised at any date on or before the date shown.
| | | | | | |
| See accompanying Notes to Financial Statements | | www.calamos.com | | | 93 | |
Global Convertible Fund Schedule of Investments April 30, 2017 (Unaudited)
| | | | | | | | | | |
PRINCIPAL
AMOUNT | | | | | | | VALUE | |
| | | | | | | | | | |
| | CONVERTIBLE BONDS (72.8%) | |
| | | | | | Consumer Discretionary (14.6%) | |
| | 300,000 | | | EUR | | Bayer Capital Corp., BV*
5.625%, 11/22/19 | | $ | 396,314 | |
| | 400,000 | | | | | Cie Generale des Etablissements Michelin 0.000%, 01/10/22 | | | 419,157 | |
| | | | | | Ctrip.com International, Ltd. | | | | |
| | 600,000 | | | | | 1.000%, 07/01/20 | | | 669,399 | |
| | 495,000 | | | | | 1.250%, 09/15/22* | | | 518,671 | |
| | 735,000 | | | | | DISH Network Corp.*
3.375%, 08/15/26 | | | 900,823 | |
| | 50,000,000 | | | JPY | | Iida Group Holdings Company, Ltd. 0.000%, 06/18/20 | | | 459,833 | |
| | 405,000 | | | | | Liberty Interactive, LLC*
1.750%, 09/30/46 | | | 476,515 | |
| | 745,000 | | | | | Liberty Media Corp.
1.375%, 10/15/23 | | | 843,880 | |
| | 1,610,000 | | | | | Priceline Group, Inc.
0.900%, 09/15/21 | | | 1,842,202 | |
| | 393,000 | | | EUR | | SEB, SA
0.000%, 11/17/21 | | | 834,633 | |
| | 75,000,000 | | | JPY | | Sony Corp.
0.000%, 09/30/22 | | | 746,807 | |
| | 1,000,000 | | | EUR | | Steinhoff Finance Holding Company 1.250%, 10/21/23 | | | 1,061,858 | |
| | | | | | Tesla, Inc. | | | | |
| | 1,540,000 | | | | | 1.250%, 03/01/21 | | | 1,594,624 | |
| | 365,000 | | | | | 2.375%, 03/15/22 | | | 408,282 | |
| | | | | | | | | | |
| | | | | | | | | 11,172,998 | |
| | | | | | | | | | |
| | | | | | Energy (2.2%) | |
| | 405,000 | | | | | Nabors Industries, Inc.*
0.750%, 01/15/24 | | | 349,191 | |
| | 210,000 | | | | | SM Energy Company^
1.500%, 07/01/21 | | | 207,456 | |
| | 600,000 | | | | | Tullow Oil Jersey, Ltd.
6.625%, 07/12/21 | | | 728,858 | |
| | 480,000 | | | | | Whiting Petroleum Corp.
1.250%, 04/01/20 | | | 423,838 | |
| | | | | | | | | | |
| | | | | | | | | 1,709,343 | |
| | | | | | | | | | |
| | | | | | Financials (8.1%) | |
| | 800,000 | | | EUR | | AURELIUS Equity Opportunities SE & Co. KGaA 1.000%, 12/01/20 | | | 904,690 | |
| | 500,000 | | | GBP | | British Land White 2015, Ltd.
0.000%, 06/09/20 | | | 621,273 | |
| | 2,357,500 | | | EUR | | Credit Agricole, SA
0.000%, 10/03/19 | | | 1,848,946 | |
| | 700,000 | | | EUR | | Cromwell SPV Finance Pty, Ltd.
2.000%, 02/04/20 | | | 762,567 | |
| | 505,000 | | | CAD | | Element Fleet Management Corp.*
4.250%, 06/30/20 | | | 375,429 | |
| | | | | | | | | | |
PRINCIPAL
AMOUNT | | | | | | | VALUE | |
| | 2,000,000 | | | HKD | | Haitong International Securities Group,
Ltd. 0.000%, 10/25/21 | | $ | 257,982 | |
| | 200,000 | | | EUR | | LEG Immobilien, AG
0.500%, 07/01/21 | | | 327,571 | |
| | 40,000,000 | | | JPY | | Mitsubishi Chemical Holdings Corp.
0.000%, 03/29/24 | | | 369,757 | |
| | 94,000 | | | EUR | | Unibail-Rodamco, SE
0.000%, 01/01/22 | | | 348,698 | |
| | 400,000 | | | | | Yamaguchi Financial Group, Inc.‡
0.653%, 03/26/20 3 mo. USD LIBOR - 0.50% | | | 415,513 | |
| | | | | | | | | | |
| | | | | | | | | 6,232,426 | |
| | | | | | | | | | |
| | | | | | Health Care (8.5%) | |
| | | | | | BioMarin Pharmaceutical, Inc. | | | | |
| | 330,000 | | | | | 0.750%, 10/15/18 | | | 387,298 | |
| | 240,000 | | | | | 1.500%, 10/15/20 | | | 299,530 | |
| | 671,000 | | | | | Emergent Biosolutions, Inc.
2.875%, 01/15/21 | | | 814,336 | |
| | 590,000 | | | | | Hologic, Inc.***
0.000%, 12/15/43 | | | 747,244 | |
| | 235,000 | | | | | Illumina, Inc.
0.000%, 06/15/19 | | | 242,133 | |
| | 370,000 | | | | | Insulet Corp.*
1.250%, 09/15/21 | | | 375,896 | |
| | 600,000 | | | EUR | | Magyar Nemzeti Vagyonkezelo Zrt
3.375%, 04/02/19 | | | 812,211 | |
| | 360,000 | | | | | Medidata Solutions, Inc.
1.000%, 08/01/18 | | | 444,370 | |
| | 700,000 | | | | | Molina Healthcare, Inc.
1.625%, 08/15/44 | | | 767,767 | |
| | 485,000 | | | | | NuVasive, Inc.
2.250%, 03/15/21 | | | 648,333 | |
| | 800,000 | | | | | QIAGEN, NV
0.875%, 03/19/21 | | | 961,216 | |
| | | | | | | | | | |
| | | | | | | | | 6,500,334 | |
| | | | | | | | | | |
| | | | | | Industrials (10.6%) | |
| | 400,000 | | | | | Aerojet Rocketdyne Holdings, Inc.*
2.250%, 12/15/23 | | | 443,202 | |
| | 500,000 | | | GBP | | Carillion Finance Jersey, Ltd.
2.500%, 12/19/19 | | | 627,177 | |
| | 405,000 | | | | | Greenbrier Companies, Inc.*
2.875%, 02/01/24 | | | 429,648 | |
| | 70,000,000 | | | JPY | | Japan Airport Terminal Company, Ltd.
0.000%, 03/06/20 | | | 626,871 | |
| | 40,000,000 | | | JPY | | Kandenko Company, Ltd.
0.000%, 03/31/21 | | | 406,636 | |
| | 200,000 | | | | | Larsen & Toubro, Ltd.
0.675%, 10/22/19 | | | 203,386 | |
| | 40,000,000 | | | JPY | | Lixil Group Corp.
0.000%, 03/04/22 | | | 374,035 | |
| | 900,000 | | | | | MISUMI Group, Inc.
0.000%, 10/22/18 | | | 1,403,062 | |
| | | | |
| 94 | | CALAMOS OPEN-END FAMILY OF FUNDS SEMIANNUAL REPORT | | See accompanying Notes to Schedule of Investments |
Global Convertible Fund Schedule of Investments April 30, 2017 (Unaudited)
| | | | | | | | | | |
PRINCIPAL
AMOUNT | | | | | | | VALUE | |
| | 360,000 | | | | | Pacira Pharmaceuticals, Inc.*
2.375%, 04/01/22 | | $ | 384,817 | |
| | 800,000 | | | EUR | | Prysmian S.p.A.
1.250%, 03/08/18 | | | 1,065,569 | |
| | 1,676,000 | | | EUR | | Safran, SA
0.000%, 12/31/20 | | | 1,763,002 | |
| | 335,000 | | | | | Trinity Industries, Inc.
3.875%, 06/01/36 | | | 413,658 | |
| | | | | | | | | | |
| | | | | | | | | 8,141,063 | |
| | | | | | | | | | |
| | | | | | Information Technology (19.8%) | |
| | 1,194,000 | | | | | Citrix Systems, Inc.
0.500%, 04/15/19 | | | 1,461,635 | |
| | 348,000 | | | | | Euronet Worldwide, Inc.
1.500%, 10/01/44 | | | 430,977 | |
| | | | | | FireEye, Inc. | | | | |
| | 330,000 | | | | | 1.625%, 06/01/35 | | | 297,002 | |
| | 183,000 | | | | | 1.000%, 06/01/35^ | | | 173,032 | |
| | 400,000 | | | | | Inphi Corp.*
0.750%, 09/01/21 | | | 410,570 | |
| | | | | | Intel Corp. | | | | |
| | 330,000 | | | | | 3.479%, 12/15/35 | | | 449,194 | |
| | 240,000 | | | | | 3.250%, 08/01/39 | | | 419,682 | |
| | 365,000 | | | | | Lumentum Holdings, Inc.*
0.250%, 03/15/24 | | | 365,287 | |
| | 1,140,000 | | | | | Microchip Technology, Inc.*
1.625%, 02/15/27 | | | 1,173,134 | |
| | 305,000 | | | | | Micron Technology, Inc.
2.125%, 02/15/33 | | | 779,969 | |
| | 405,000 | | | | | Nice Systems, Inc.*
1.250%, 01/15/24 | | | 420,414 | |
| | 70,000 | | | | | NVIDIA Corp.
1.000%, 12/01/18 | | | 361,974 | |
| | 600,000 | | | | | NXP Semiconductors, NV
1.000%, 12/01/19 | | | 700,071 | |
| | 395,000 | | | | | ON Semiconductor Corp.
1.000%, 12/01/20 | | | 417,716 | |
| | 390,000 | | | | | Red Hat, Inc.^
0.250%, 10/01/19 | | | 513,390 | |
| | 700,000 | | | EUR | | Rocket Internet, SE
3.000%, 07/22/22 | | | 709,411 | |
| | 1,350,000 | | | | | Salesforce.com, Inc.
0.250%, 04/01/18 | | | 1,791,491 | |
| | 360,000 | | | | | Silicon Laboratories, Inc.*
1.375%, 03/01/22 | | | 378,095 | |
| | 360,000 | | | | | Square, Inc.*
0.375%, 03/01/22 | | | 381,377 | |
| | 415,000 | | | | | Synchronoss Technologies, Inc.
0.750%, 08/15/19 | | | 356,190 | |
| | 310,000 | | | | | Take-Two Interactive Software, Inc.
1.000%, 07/01/18 | | | 905,186 | |
| | 400,000 | | | | | Teradyne, Inc.*
1.250%, 12/15/23 | | | 503,444 | |
| | | | | | | | | | |
PRINCIPAL
AMOUNT | | | | | | | VALUE | |
| | 630,000 | | | EUR | | Ubisoft Entertainment, SA
0.000%, 09/27/21 | | $ | 456,841 | |
| | 405,000 | | | | | Veeco Instruments, Inc.
2.700%, 01/15/23 | | | 445,352 | |
| | 650,000 | | | | | Workday, Inc.
1.500%, 07/15/20 | | | 816,173 | |
| | | | | | | | | | |
| | | | | | | | | 15,117,607 | |
| | | | | | | | | | |
| | | | | | Materials (0.6%) | |
| | 300,000 | | | EUR | | Buzzi Unicem, S.p.A.
1.375%, 07/17/19 | | | 490,490 | |
| | | | | | | | | | |
| | | | | | Real Estate (4.8%) | |
| | 800,000 | | | | | AYC Finance, Ltd.
0.500%, 05/02/19 | | | 829,040 | |
| | 1,220,000 | | | | | Colony Starwood Homes
3.000%, 07/01/19 | | | 1,458,809 | |
| | 800,000 | | | EUR | | Grand City Properties, SA
0.250%, 03/02/22 | | | 878,367 | |
| | 443,000 | | | | | Starwood Property Trust, Inc.
4.550%, 03/01/18 | | | 482,720 | |
| | | | | | | | | | |
| | | | | | | | | 3,648,936 | |
| | | | | | | | | | |
| | | | | | Telecommunication Services (3.6%) | |
| | 1,500,000 | | | EUR | | América Móvil, SAB de CV
0.000%, 05/28/20 | | | 1,596,623 | |
| | 1,000,000 | | | | | Telenor East Holding II AS
0.250%, 09/20/19 | | | 1,139,410 | |
| | | | | | | | | | |
| | | | | | | | | 2,736,033 | |
| | | | | | | | | | |
| | | | | | TOTAL CONVERTIBLE BONDS
(Cost $53,538,417) | | | 55,749,230 | |
| | | | | | | | | | |
| | SYNTHETIC CONVERTIBLE SECURITIES (8.1%) ¤ | |
| | Corporate Bonds (7.0%) | |
| | | | | | Consumer Discretionary (2.4%) | |
| | 625,000 | | | | | CalAtlantic Group, Inc.
6.625%, 05/01/20 | | | 690,547 | |
| | 625,000 | | | | | D.R. Horton, Inc.
3.750%, 03/01/19 | | | 640,934 | |
| | 479,000 | | | | | Mediacom Broadband, LLC / Mediacom Broadband Corp.
5.500%, 04/15/21 | | | 490,374 | |
| | | | | | | | | | |
| | | | | | | | | 1,821,855 | |
| | | | | | | | | | |
| | | | | | Health Care (0.9%) | |
| | 630,000 | | | | | HCA Holdings, Inc.
6.250%, 02/15/21 | | | 684,810 | |
| | | | | | | | | | |
| | | | | | Industrials (2.4%) | |
| | 450,000 | | | | | AerCap Ireland Capital, Ltd. / AerCap Global Aviation Trust
5.000%, 10/01/21 | | | 486,959 | |
| | 695,000 | | | | | Icahn Enterprises, LP
4.875%, 03/15/19 | | | 706,356 | |
| | 645,000 | | | | | United Continental Holdings, Inc.
6.375%, 06/01/18 | | | 674,422 | |
| | | | | | | | | | |
| | | | | | | | | 1,867,737 | |
| | | | | | | | | | |
| | | | | | |
| See accompanying Notes to Schedule of Investments | | www.calamos.com | | | 95 | |
Global Convertible Fund Schedule of Investments April 30, 2017 (Unaudited)
| | | | | | | | | | |
PRINCIPAL
AMOUNT | | | | | | | VALUE | |
| | | | | | | | | | |
| | | | | | Materials (0.9%) | |
| | 305,000 | | | | | Chemtura Corp.
5.750%, 07/15/21 | | $ | 315,913 | |
| | 300,000 | | | EUR | | Huntsman International, LLC
5.125%, 04/15/21 | | | 364,601 | |
| | | | | | | | | | |
| | | | | | | | | 680,514 | |
| | | | | | | | | | |
| | | | | | Telecommunication Services (0.4%) | |
| | 283,000 | | | | | Sprint Corp.
7.250%, 09/15/21 | | | 309,848 | |
| | | | | | | | | | |
| | | | | | TOTAL CORPORATE BONDS | | | 5,364,764 | |
| | | | | | | | | | |
NUMBER OF
CONTRACTS/
NOTIONAL
AMOUNT | | | | | | | VALUE | |
| | | | | | | | | | |
| | PURCHASED OPTIONS (1.1%) # | |
| | | | | | Consumer Discretionary (0.4%) | |
| 290
29,000 |
| | | | Lennar Corp.
Call, 08/18/17, Strike $52.50 | | | 51,330 | |
| 100
10,000 |
| | EUR | | LVMH Moet Hennessy Louis Vuitton, SE Call, 09/15/17, Strike 210.00 | | | 247,162 | |
| | | | | | | | | | |
| | | | | | | | | 298,492 | |
| | | | | | | | | | |
| | | | | | Industrials (0.5%) | | | | |
| 235
23,500 |
| | EUR | | Airbus, SE Call, 09/15/17, Strike 72.00 | | | 138,104 | |
| 160
160,000 |
| | GBP | | International Consolidated Airlines Group, SA Call, 09/15/17, Strike 5.50 | | | 84,447 | |
| 275
27,500 |
| | EUR | | Siemens, AG Call, 06/16/17, Strike 135.00 | | | 69,498 | |
| 240
24,000 |
| | EUR | | Vinci, SA Call, 09/15/17, Strike 80.00 | | | 78,691 | |
| | | | | | | | | | |
| | | | | | | | | 370,740 | |
| | | | | | | | | | |
| | | | | | Information Technology (0.2%) | |
| 110
11,000 |
| | | | Lam Research Corp. Call, 09/15/17, Strike $140.00 | | | 119,350 | |
| | | | | | | | | | |
| | | | | | Telecommunication Services (0.0%) | | | | |
| 750
750,000 |
| | GBP | | Vodafone Group, PLC Call, 06/16/17, Strike 2.00 | | | 35,213 | |
| | | | | | | | | | |
| | | | | | TOTAL PURCHASED OPTIONS | | | 823,795 | |
| | | | | | | | | | |
| | | | | | TOTAL SYNTHETIC CONVERTIBLE SECURITIES (Cost $5,923,465) | | | 6,188,559 | |
| | | | | | | | | | |
NUMBER OF
SHARES | | | | | | | VALUE | |
| | CONVERTIBLE PREFERRED STOCKS (13.8%) | |
| | | | | | Energy (3.2%) | |
| | 15,220 | | | | | Hess Corp. 8.000%, 02/01/19 | | | 907,873 | |
| | 34,540 | | | | | Southwestern Energy Company 6.250%, 01/15/18 | | | 638,299 | |
| | | | | | | | | | |
NUMBER OF
SHARES | | | | | | | VALUE | |
| | 16,565 | | | | | WPX Energy, Inc. 6.250%, 07/31/18 | | $ | 907,597 | |
| | | | | | | | | | |
| | | | | | | | | 2,453,769 | |
| | | | | | | | | | |
| | | | | | Financials (5.6%) | |
| | 1,785 | | | | | Bank of America Corp. 7.250%, 05/29/49 | | | 2,165,955 | |
| | 1,655 | | | | | Wells Fargo & Company 7.500%, 12/31/49 | | | 2,101,850 | |
| | | | | | | | | | |
| | | | | | | | | 4,267,805 | |
| | | | | | | | | | |
| | | | | | Health Care (1.2%) | |
| | 1,115 | | | | | Allergan, PLC 5.500%, 03/01/18 | | | 965,345 | |
| | | | | | | | | | |
| | | | | | Industrials (0.6%) | |
| | 7,935 | | | | | Rexnord Corp. 5.750%, 11/15/19 | | | 447,137 | |
| | | | | | | | | | |
| | | | | | Real Estate (1.0%) | |
| | | | | | American Tower Corp. | | | | |
| | 3,297 | | | | | 5.500%, 02/15/18 | | | 381,628 | |
| | 3,175 | | | | | 5.250%, 05/15/17 | | | 373,189 | |
| | | | | | | | | | |
| | | | | | | | | 754,817 | |
| | | | | | | | | | |
| | | | | | Telecommunication Services (0.7%) | |
| | 3,850 | | | | | Alibaba Exchangeable (Softbank)*§ 5.750%, 06/03/19 | | | 529,246 | |
| | | | | | | | | | |
| | | | | | Utilities (1.5%) | |
| | 8,095 | | | | | Great Plains Energy, Inc. 7.000%, 09/15/19 | | | 437,939 | |
| | 11,180 | | | | | NextEra Energy, Inc. 6.371%, 09/01/18 | | | 689,471 | |
| | | | | | | | | | |
| | | | | | | | | 1,127,410 | |
| | | | | | | | | | |
| | | | | | TOTAL CONVERTIBLE PREFERRED STOCKS (Cost $10,328,021) | | | 10,545,529 | |
| | | | | | | | | | |
NUMBER OF
CONTRACTS/
NOTIONAL
AMOUNT | | | | | | | VALUE | |
| | PURCHASED OPTION (0.1%) # | |
| | | | | | Other (0.1%) | |
| 44
4,400 |
| | | | S&P 500 Index Put, 05/19/17, Strike $2,350.00 (Cost $127,756) | | | 42,020 | |
| | | | | | | | | | |
NUMBER OF
SHARES | | | | | | | VALUE | |
| | SHORT TERM INVESTMENTS (3.1%) | |
| | 1,209,209 | | | | | Fidelity Prime Money Market Fund - Institutional Class | | | 1,209,692 | |
| | 1,209,039 | | | | | Morgan Stanley Institutional Liquidity Funds - Government Portfolio | | | 1,209,039 | |
| | | | | | | | | | |
| | | | | | TOTAL SHORT TERM INVESTMENTS (Cost $2,418,731) | | | 2,418,731 | |
| | | | | | | | | | |
| | | | |
| 96 | | CALAMOS OPEN-END FAMILY OF FUNDS SEMIANNUAL REPORT | | See accompanying Notes to Schedule of Investments |
Global Convertible Fund Schedule of Investments April 30, 2017 (Unaudited)
| | | | | | | | | | |
NUMBER OF
SHARES/
PRINCIPAL
AMOUNT | | | | | | | VALUE | |
| INVESTMENT OF CASH COLLATERAL FOR SECURITIES LOANED
(0.5%) |
|
| | 233,858 | | | | | Deutsche Bank Securities, Inc.† 0.830%, 05/01/17 | | $ | 233,858 | |
| | 127,097 | | | | | Goldman Sachs Financial Square Government Fund | | | 127,097 | |
| | | | | | | | | | |
| | | | | | TOTAL INVESTMENT OF CASH COLLATERAL FOR SECURITIES LOANED (Cost $360,955) | | | 360,955 | |
| | | | | | | | | | |
| TOTAL INVESTMENTS (98.4%)
(Cost $72,697,345) | | | 75,305,024 | |
| | | | | | | | | | |
| |
| | PAYABLE UPON RETURN OF SECURITIES ON LOAN (-0.5%) | | | (360,955 | ) |
| | | | | | | | | | |
| |
| | OTHER ASSETS, LESS LIABILITIES (2.1%) | | | 1,608,157 | |
| | | | | | | | | | |
| |
| | NET ASSETS (100.0%) | | $ | 76,552,226 | |
| | | | | | | | | | |
NOTES TO SCHEDULE OF INVESTMENTS
| * | Securities issued and sold pursuant to a Rule 144A transaction are excepted from the registration requirement of the Securities Act of 1933, as amended. These securities may only be sold to qualified institutional buyers (“QIBs”), such as the Fund. Any resale of these securities must generally be effected through a sale that is registered under the Act or otherwise exempted from such registration requirements. |
| ^ | Security, or portion of security, is on loan. |
| ‡ | Variable rate security. The rate shown is the rate in effect at April 30, 2017. |
| ** | Step Coupon security. Coupon changes periodically based upon a predetermined schedule. The rate shown is the rate in effect at April 30, 2017. |
| ¤ | The synthetic convertible securities strategy combines separate securities that together possess the economic characteristics similar to a convertible security. |
| # | Non-income producing security. |
| § | Securities exchangeable or convertible into securities of one or more entities that are different than the issuer. Each entity is identified in the parenthetical. |
| † | Repurchase agreement collateralized by the following security: 238,525 United States Treasury Note, 3.625%, 02/15/20. |
FOREIGN CURRENCY ABBREVIATIONS
| | |
| CAD | | Canadian Dollar |
| EUR | | European Monetary Unit |
| GBP | | British Pound Sterling |
| HKD | | Hong Kong Dollar |
| JPY | | Japanese Yen |
Note: Value for securities denominated in foreign currencies is shown in U.S. dollars. The principal amount for such securities is shown in the respective foreign currency. The date on options represents the expiration date of the option contract. The option contract may be exercised at any date on or before the date shown.
CURRENCY EXPOSURE
APRIL 30, 2017
| | | | | | | | |
| | | VALUE | | | % OF TOTAL
INVESTMENTS | |
| US Dollar | | $ | 55,163,717 | | | | 73.3 | % |
| European Monetary Unit | | | 15,155,847 | | | | 20.1 | % |
| Japanese Yen | | | 2,983,939 | | | | 4.0 | % |
| British Pound Sterling | | | 1,368,110 | | | | 1.8 | % |
| Canadian Dollar | | | 375,429 | | | | 0.5 | % |
| Hong Kong Dollar | | | 257,982 | | | | 0.3 | % |
| | | | |
| Total Investments | | $ | 75,305,024 | | | | 100.0 | % |
Currency exposure may vary over time.
| | | | | | |
| See accompanying Notes to Financial Statements | | www.calamos.com | | | 97 | |
Total Return Bond Fund Schedule of Investments April 30, 2017 (Unaudited)
| | | | | | | | | | |
PRINCIPAL
AMOUNT | | | | | | | VALUE | |
| | CORPORATE BONDS (69.4%) | |
| | | | | | Consumer Discretionary (15.5%) | | | | |
| | 500,000 | | | | | American Airlines Group, Inc.
6.125%, 06/01/18 | | $ | 519,040 | |
| | 500,000 | | | | | American Honda Finance Corp.
1.650%, 07/12/21 | | | 487,660 | |
| | 500,000 | | | | | Carnival Corp.
3.950%, 10/15/20 | | | 529,207 | |
| | 500,000 | | | | | Charter Communications Operating, LLC / Charter Communications Operating Capital
4.464%, 07/23/22 | | | 531,985 | |
| | 500,000 | | | | | Comcast Corp.
2.750%, 03/01/23 | | | 502,575 | |
| | 500,000 | | | | | Continental Airlines 2012-3 Class C Pass Thru Trust
6.125%, 04/29/18 | | | 515,430 | |
| | 500,000 | | | | | DISH DBS Corp.
4.250%, 04/01/18 | | | 509,380 | |
| | 250,000 | | | | | DR Horton, Inc.
4.750%, 02/15/23 | | | 270,371 | |
| | 500,000 | | | | | Expedia, Inc.
5.950%, 08/15/20 | | | 547,555 | |
| | 500,000 | | | | | Ford Motor Credit Company, LLC
5.875%, 08/02/21 | | | 557,262 | |
| | 500,000 | | | | | General Motors Company, Inc.
3.700%, 05/09/23 | | | 503,170 | |
| | 445,000 | | | | | Goodyear Tire & Rubber Company
8.750%, 08/15/20 | | | 528,217 | |
| | 750,000 | | | | | Harley-Davidson Financial Services, Inc.*
2.150%, 02/26/20 | | | 748,530 | |
| | 750,000 | | | | | Hasbro, Inc.
3.150%, 05/15/21 | | | 767,790 | |
| | 750,000 | | | | | Interpublic Group of Companies, Inc.
2.250%, 11/15/17 | | | 752,122 | |
| | 250,000 | | | | | L Brands, Inc.
5.625%, 02/15/22 | | | 264,566 | |
| | 500,000 | | | | | Lennar Corp.
4.500%, 06/15/19 | | | 519,410 | |
| | 750,000 | | | | | Mattel, Inc.
2.350%, 05/06/19 | | | 752,419 | |
| | 500,000 | | | | | Ralph Lauren Corp.
2.125%, 09/26/18 | | | 503,988 | |
| | 750,000 | | | | | Time Warner, Inc.
3.600%, 07/15/25 | | | 748,399 | |
| | 500,000 | | | | | TJX Companies, Inc.
2.750%, 06/15/21 | | | 511,593 | |
| | 500,000 | | | | | Toll Brothers Finance Corp.
5.625%, 01/15/24 | | | 537,702 | |
| | 500,000 | | | | | ZF North America Capital, Inc.*
4.500%, 04/29/22 | | | 525,053 | |
| | | | | | | | | | |
| | | | | | | | | 12,633,424 | |
| | | | | | | | | | |
| | | | | | | | | | |
PRINCIPAL
AMOUNT | | | | | | | VALUE | |
| | | | | | | | | | |
| | | | | | Consumer Staples (4.2%) | | | | |
| | 500,000 | | | | | Anheuser-Busch InBev Finance, Inc.
3.650%, 02/01/26 | | $ | 511,120 | |
| | 500,000 | | | | | Coca-Cola Company
2.450%, 11/01/20 | | | 510,070 | |
| | 750,000 | | | | | General Mills, Inc.
2.200%, 10/21/19 | | | 754,980 | |
| | 550,000 | | | | | Land O’Lakes, Inc.*
6.000%, 11/15/22 | | | 610,987 | |
| | 500,000 | | | | | Mondelez International Holdings Netherlands, BV*
2.000%, 10/28/21 | | | 484,883 | |
| | 500,000 | | | | | WM Wrigley Jr. Company*
3.375%, 10/21/20 | | | 517,077 | |
| | | | | | | | | | |
| | | | | | | | | 3,389,117 | |
| | | | | | | | | | |
| | | | | | Energy (2.2%) | | | | |
| | 500,000 | | | | | Chevron Corp.
1.961%, 03/03/20 | | | 501,405 | |
| | 250,000 | | | | | Cimarex Energy Company
3.900%, 05/15/27 | | | 252,880 | |
| | 500,000 | | | | | Exxon Mobil Corp.
2.709%, 03/06/25 | | | 496,888 | |
| | 500,000 | | | | | Shell International Finance, BV
3.250%, 05/11/25 | | | 509,642 | |
| | | | | | | | | | |
| | | | | | | | | 1,760,815 | |
| | | | | | | | | | |
| | | | | | Financials (18.6%) | | | | |
| | 500,000 | | | | | Ally Financial, Inc.
3.250%, 09/29/17 | | | 503,195 | |
| | 500,000 | | | | | American Express Company
2.600%, 09/14/20 | | | 507,585 | |
| | 500,000 | | | | | Ameriprise Financial, Inc.
2.875%, 09/15/26 | | | 486,480 | |
| | 500,000 | | | | | AON Corp.
5.000%, 09/30/20 | | | 540,732 | |
| | 500,000 | | | | | Bank of America Corp.
4.125%, 01/22/24 | | | 525,765 | |
| | 500,000 | | | | | Bank of Montreal
1.900%, 08/27/21 | | | 491,985 | |
| | 500,000 | | | | | Bank of New York Mellon Corp.
3.000%, 10/30/28 | | | 482,075 | |
| | 500,000 | | | | | Berkshire Hathaway, Inc.
2.750%, 03/15/23 | | | 505,833 | |
| | 500,000 | | | | | Capital One NA
2.950%, 07/23/21 | | | 504,915 | |
| | 500,000 | | | | | Charles Schwab Corp.
3.200%, 03/02/27 | | | 503,443 | |
| | 400,000 | | | | | Chubb Corp.‡
3.408%, 03/29/67
3 mo. USD LIBOR + 2.25% | | | 396,326 | |
| | 500,000 | | | | | Citigroup, Inc.
4.125%, 07/25/28 | | | 500,528 | |
| | 250,000 | | | | | Cullen/Frost Bankers, Inc.
4.500%, 03/17/27 | | | 258,305 | |
| | | | |
| 98 | | CALAMOS OPEN-END FAMILY OF FUNDS SEMIANNUAL REPORT | | See accompanying Notes to Schedule of Investments |
Total Return Bond Fund Schedule of Investments April 30, 2017 (Unaudited)
| | | | | | | | | | |
PRINCIPAL
AMOUNT | | | | | | | VALUE | |
| | 338,000 | | | | | Equinix, Inc.
4.875%, 04/01/20 | | $ | 347,922 | |
| | 750,000 | | | | | Fifth Third Bancorp
2.300%, 03/01/19 | | | 754,984 | |
| | 500,000 | | | | | First Republic Bank
4.625%, 02/13/47 | | | 506,767 | |
| | 500,000 | | | | | Franklin Resources, Inc.
2.850%, 03/30/25 | | | 493,363 | |
| | 250,000 | | | | | GLP Capital, LP / GLP Financing II, Inc.^
4.375%, 04/15/21 | | | 262,341 | |
| | 750,000 | | | | | Goldman Sachs Group, Inc.
4.250%, 10/21/25 | | | 772,342 | |
| | 750,000 | | | | | JPMorgan Chase & Company
3.875%, 09/10/24 | | | 767,692 | |
| | 750,000 | | | | | Metropolitan Life Global Funding I*
2.300%, 04/10/19 | | | 755,959 | |
| | 750,000 | | | | | Morgan Stanley
2.500%, 04/21/21 | | | 748,695 | |
| | 250,000 | | | | | Prudential Financial, Inc.‡
5.625%, 06/15/43
3 mo. USD LIBOR + 3.92% | | | 272,656 | |
| | 500,000 | | | | | Royal Bank Of Canada
2.350%, 10/30/20 | | | 503,443 | |
| | 500,000 | | | | | State Street Corp.
1.950%, 05/19/21 | | | 494,290 | |
| | 500,000 | | | | | SunTrust Banks, Inc.
3.300%, 05/15/26 | | | 490,255 | |
| | 500,000 | | | | | Toronto-Dominion Bank
2.125%, 04/07/21 | | | 498,105 | |
| | 750,000 | | | | | US Bancorp
3.600%, 09/11/24 | | | 777,442 | |
| | 500,000 | | | | | Wells Fargo & Company
4.125%, 08/15/23 | | | 527,950 | |
| | | | | | | | | | |
| | | | | | | | | 15,181,373 | |
| | | | | | | | | | |
| | | | | | Health Care (3.7%) | | | | |
| | 500,000 | | | | | AbbVie, Inc.
2.850%, 05/14/23 | | | 496,250 | |
| | 500,000 | | | | | Actavis, PLC
1.875%, 10/01/17 | | | 500,475 | |
| | 500,000 | | | | | Edwards Lifesciences Corp.
2.875%, 10/15/18 | | | 506,490 | |
| | 500,000 | | | | | Gilead Sciences, Inc.
3.650%, 03/01/26 | | | 509,512 | |
| | 500,000 | | | | | HCA, Inc.
3.750%, 03/15/19 | | | 511,737 | |
| | 500,000 | | | | | Johnson & Johnson
2.450%, 03/01/26 | | | 486,233 | |
| | | | | | | | | | |
| | | | | | | | | 3,010,697 | |
| | | | | | | | | | |
| | | | | | Industrials (7.6%) | | | | |
| | 250,000 | | | | | AerCap Ireland Capital, Ltd. / AerCap Global Aviation Trust
5.000%, 10/01/21 | | | 270,533 | |
| | | | | | | | | | |
PRINCIPAL
AMOUNT | | | | | | | VALUE | |
| | 400,000 | | | | | Delta Air Lines, Inc.
3.625%, 03/15/22 | | $ | 411,532 | |
| | 500,000 | | | | | Eaton Corp.
1.500%, 11/02/17 | | | 500,040 | |
| | 500,000 | | | | | Honeywell International, Inc.
1.850%, 11/01/21 | | | 492,710 | |
| | 447,000 | | | | | Huntington Ingalls Industries, Inc.*
5.000%, 12/15/21 | | | 464,091 | |
| | 200,000 | | | | | IHO Verwaltungs GmbH*
4.125%, 09/15/21
4.875% PIK rate | | | 202,976 | |
| | 400,000 | | | | | Kaiser Aluminum Corp.
5.875%, 05/15/24 | | | 424,160 | |
| | 1,000,000 | | | | | Parker-Hannifin Corp.
5.500%, 05/15/18 | | | 1,040,975 | |
| | 400,000 | | | | | Rockwell Collins, Inc.
2.800%, 03/15/22 | | | 404,488 | |
| | 500,000 | | | | | Southwest Airlines Company
2.750%, 11/06/19 | | | 508,242 | |
| | 500,000 | | | | | Textron, Inc.
3.650%, 03/15/27 | | | 499,788 | |
| | 500,000 | | | | | United Technologies Corp.
2.650%, 11/01/26 | | | 487,995 | |
| | 500,000 | | | | | Verisk Analytics, Inc.
4.125%, 09/12/22 | | | 525,127 | |
| | | | | | | | | | |
| | | | | | | | | 6,232,657 | |
| | | | | | | | | | |
| | | | | | Information Technology (9.1%) | | | | |
| | 500,000 | | | | | Alliance Data Systems Corp.*
5.375%, 08/01/22 | | | 505,790 | |
| | 750,000 | | | | | Amphenol Corp.
4.000%, 02/01/22 | | | 797,989 | |
| | 500,000 | | | | | Apple, Inc.
4.375%, 05/13/45 | | | 522,820 | |
| | 250,000 | | | | | Cardtronics, Inc.
5.125%, 08/01/22 | | | 256,091 | |
| | 500,000 | | | | | CDW, LLC / CDW Finance Corp.
5.000%, 09/01/23 | | | 514,918 | |
| | 500,000 | | | | | Cisco Systems, Inc.
1.850%, 09/20/21 | | | 494,378 | |
| | 750,000 | | | | | Electronic Arts, Inc.
4.800%, 03/01/26 | | | 820,639 | |
| | 500,000 | | | | | Fiserv, Inc.
3.500%, 10/01/22 | | | 517,218 | |
| | 500,000 | | | | | Flextronics International, Ltd.
4.750%, 06/15/25 | | | 531,950 | |
| | 500,000 | | | | | Hewlett Packard Enterprise Company
4.900%, 10/15/25 | | | 524,447 | |
| | 500,000 | | | | | Microsoft Corp.
4.100%, 02/06/37 | | | 522,302 | |
| | | | | | Nuance Communications, Inc.* | | | | |
| | 185,000 | | | | | 6.000%, 07/01/24 | | | 195,072 | |
| | 114,000 | | | | | 5.375%, 08/15/20 | | | 116,729 | |
| | | | | | |
| See accompanying Notes to Schedule of Investments | | www.calamos.com | | | 99 | |
Total Return Bond Fund Schedule of Investments April 30, 2017 (Unaudited)
| | | | | | | | | | |
PRINCIPAL
AMOUNT | | | | | | | VALUE | |
| | 550,000 | | | | | NXP Semiconductors, NV*
4.125%, 06/01/21 | | $ | 577,670 | |
| | 500,000 | | | | | Visa, Inc.
2.200%, 12/14/20 | | | 504,448 | |
| | | | | | | | | | |
| | | | | | | | | 7,402,461 | |
| | | | | | | | | | |
| | | | | | | | | | |
| | | | | | Materials (1.4%) | | | | |
| | 217,000 | | | | | Barrick Gold Corp.
6.950%, 04/01/19 | | | 237,247 | |
| | 500,000 | | | | | Georgia-Pacific, LLC*
3.600%, 03/01/25 | | | 515,975 | |
| | 350,000 | | | | | Steel Dynamics, Inc.*
5.000%, 12/15/26 | | | 360,586 | |
| | | | | | | | | | |
| | | | | | | | | 1,113,808 | |
| | | | | | | | | | |
| | | | | | Real Estate (1.9%) | | | | |
| | 500,000 | | | | | American Tower Corp.
5.900%, 11/01/21 | | | 563,180 | |
| | 453,000 | | | | | DuPont Fabros Technology, LP
5.875%, 09/15/21 | | | 473,222 | |
| | 500,000 | | | | | Simon Property Group, LP
3.375%, 10/01/24 | | | 506,660 | |
| | | | | | | | | | |
| | | | | | | | | 1,543,062 | |
| | | | | | | | | | |
| | | | | | Telecommunication Services (2.4%) | | | | |
| | 500,000 | | | | | AT&T, Inc.
3.000%, 06/30/22 | | | 500,710 | |
| | 750,000 | | | | | British Telecommunications, PLC
2.350%, 02/14/19 | | | 755,302 | |
| | 200,000 | | | | | CSC Holdings, LLC*
5.500%, 04/15/27 | | | 206,983 | |
| | 250,000 | | | | | Sprint Corp.
7.250%, 09/15/21 | | | 273,718 | |
| | 250,000 | | | | | Verizon Communications, Inc.
3.500%, 11/01/24 | | | 250,284 | |
| | | | | | | | | | |
| | | | | | | | | 1,986,997 | |
| | | | | | | | | | |
| | | | | | Utilities (2.8%) | | | | |
| | 500,000 | | | | | Alabama Power Company
2.450%, 03/30/22 | | | 499,382 | |
| | 500,000 | | | | | Exelon Corp.
2.450%, 04/15/21 | | | 497,588 | |
| | 750,000 | | | | | NextEra Energy, Inc.
2.700%, 09/15/19 | | | 761,329 | |
| | 500,000 | | | | | Southern Company
2.150%, 09/01/19 | | | 500,467 | |
| | | | | | | | | | |
| | | | | | | | | 2,258,766 | |
| | | | | | | | | | |
| | | | | | TOTAL CORPORATE BONDS
(Cost $55,312,183) | | | 56,513,177 | |
| | | | | | | | | | |
| | | | | | | | | | |
| | U.S. GOVERNMENT AND AGENCY SECURITIES (26.5%) | |
| | | | | | Other (26.5%) | | | | |
| | | | | | Federal National Mortgage Association | | | | |
| | 1,000,000 | | | | | 1.875%, 04/05/22 | | | 997,610 | |
| | 450,000 | | | | | 1.500%, 02/28/20 | | | 449,851 | |
| | | | | | | | | | |
PRINCIPAL
AMOUNT | | | | | | | VALUE | |
| | 1,500,000 | | | | | United States Treasury Bond
2.875%, 11/15/46 | | $ | 1,474,182 | |
| | | | | | United States Treasury Note | | | | |
| | 4,150,000 | | | | | 2.250%, 02/15/27 | | | 4,138,142 | |
| | 3,000,000 | | | | | 1.875%, 01/31/22 | | | 3,010,195 | |
| | 2,000,000 | | | | | 1.500%, 08/15/26 | | | 1,871,059 | |
| | 1,500,000 | | | | | 2.000%, 02/15/25 | | | 1,480,671 | |
| | 1,500,000 | | | | | 2.000%, 11/15/26 | | | 1,464,006 | |
| | 1,500,000 | | | | | 1.625%, 05/15/26 | | | 1,421,648 | |
| | 1,500,000 | | | | | 1.375%, 02/15/20 | | | 1,498,512 | |
| | 1,000,000 | | | | | 2.125%, 11/30/23 | | | 1,004,423 | |
| | 1,000,000 | | | | | 1.875%, 03/31/22 | | | 1,002,856 | |
| | 750,000 | | | | | 1.125%, 01/31/19 | | | 748,637 | |
| | 500,000 | | | | | 1.875%, 02/28/22 | | | 501,785 | |
| | 250,000 | | | | | 2.250%, 01/31/24 | | | 252,731 | |
| | 250,000 | | | | | 2.125%, 03/31/24 | | | 250,515 | |
| | | | | | | | | | |
| | | | | | TOTAL U.S. GOVERNMENT AND AGENCY SECURITIES
(Cost $21,607,741) | | | 21,566,823 | |
| | | | | | | | | | |
| | | | | | | | | | |
NUMBER OF
SHARES | | | | | | | VALUE | |
| | SHORT TERM INVESTMENTS (3.4%) | |
| | 1,380,162 | | | | | Fidelity Prime Money Market Fund - Institutional Class | | | 1,380,714 | |
| | 1,380,179 | | | | | Morgan Stanley Institutional Liquidity Funds - Government Portfolio | | | 1,380,179 | |
| | | | | | | | | | |
| | | | | | TOTAL SHORT TERM INVESTMENTS
(Cost $2,760,893) | | | 2,760,893 | |
| | | | | | | | | | |
| | | | | | | | | | |
NUMBER OF SHARES/ PRINCIPAL
AMOUNT | | | | | | | VALUE | |
| INVESTMENT OF CASH COLLATERAL FOR SECURITIES
LOANED (0.2%) |
|
| | 85,664 | | | | | Deutsche Bank Securities, Inc.†
0.830%, 05/01/17 | | | 85,664 | |
| | 46,557 | | | | | Goldman Sachs Financial Square Government Fund | | | 46,557 | |
| | | | | | | | | | |
| | | | | | TOTAL INVESTMENT OF CASH COLLATERAL FOR SECURITIES LOANED
(Cost $132,221) | | | 132,221 | |
| | | | | | | | | | |
| TOTAL INVESTMENTS (99.5%)
(Cost $79,813,038) | | | 80,973,114 | |
| | | | | | | | | | |
| |
| | PAYABLE UPON RETURN OF SECURITIES ON LOAN (-0.2%) | | | (132,221 | ) |
| | | | | | | | | | |
| |
| | OTHER ASSETS, LESS LIABILITIES (0.7%) | | | 537,435 | |
| | | | | | | | | | |
| |
| | NET ASSETS (100.0%) | | $ | 81,378,328 | |
| | | | | | | | | | |
| | | | |
| 100 | | CALAMOS OPEN-END FAMILY OF FUNDS SEMIANNUAL REPORT | | See accompanying Notes to Schedule of Investments |
Total Return Bond Fund Schedule of Investments April 30, 2017 (Unaudited)
NOTES TO SCHEDULE OF INVESTMENTS
| * | Securities issued and sold pursuant to a Rule 144A transaction are excepted from the registration requirement of the Securities Act of 1933, as amended. These securities may only be sold to qualified institutional buyers (“QIBs”), such as the Fund. Any resale of these securities must generally be effected through a sale that is registered under the Act or otherwise exempted from such registration requirements. |
| ‡ | Variable rate security. The rate shown is the rate in effect at April 30, 2017. |
| ^ | Security, or portion of security, is on loan. |
| † | Repurchase agreement collateralized by the following security: 87,374 United States Treasury Note, 3.625%, 02/15/20. |
| | | | | | |
| See accompanying Notes to Financial Statements | | www.calamos.com | | | 101 | |
High Income Fund Schedule of Investments April 30, 2017 (Unaudited)
| | | | | | | | | | |
PRINCIPAL
AMOUNT | | | | | | | VALUE | |
| | CORPORATE BONDS (95.8%) | |
| | | | | | Consumer Discretionary (22.1%) | |
| | 350,000 | | | | | Altice Luxembourg, SA* 7.750%, 05/15/22 | | $ | 372,241 | |
| | 375,000 | | | | | CalAtlantic Group, Inc. 6.625%, 05/01/20 | | | 414,328 | |
| | 620,000 | | | | | Cedar Fair, LP 5.375%, 06/01/24 | | | 644,496 | |
| | 469,000 | | | | | Century Communities, Inc. 6.875%, 05/15/22 | | | 493,836 | |
| | 500,000 | | | | | Cooper Tire & Rubber Company 8.000%, 12/15/19 | | | 561,047 | |
| | 450,000 | | | | | Cumberland Farms, Inc.* 6.750%, 05/01/25 | | | 467,118 | |
| | 460,000 | | | | | Dana, Inc. 5.500%, 12/15/24 | | | 469,740 | |
| | 805,000 | | | | | DISH DBS Corp. 5.125%, 05/01/20 | | | 841,970 | |
| | 85,000 | | | | | Eagle II Acquisition Company, LLC* 6.000%, 04/01/25 | | | 87,913 | |
| | 375,000 | | | | | ESH Hospitality, Inc.* 5.250%, 05/01/25 | | | 380,681 | |
| | 300,000 | | | | | GameStop Corp.* 5.500%, 10/01/19 | | | 307,991 | |
| | 515,000 | | | | | Golden Nugget, Inc.* 8.500%, 12/01/21 | | | 550,033 | |
| | 600,000 | | | | | L Brands, Inc. 6.875%, 11/01/35 | | | 594,360 | |
| | 575,000 | | | | | Mediacom Broadband, LLC / Mediacom Broadband Corp. 5.500%, 04/15/21 | | | 588,653 | |
| | 445,000 | | | | | Meritage Homes Corp. 7.000%, 04/01/22 | | | 506,219 | |
| | 720,000 | | | | | NCL Corp., Ltd. - Class C* 4.625%, 11/15/20 | | | 740,898 | |
| | 250,000 | | | | | Netflix, Inc. 5.375%, 02/01/21 | | | 269,479 | |
| | 770,000 | | | | | Nexstar Escrow Corp.* 5.625%, 08/01/24 | | | 790,721 | |
| | 560,000 | | | | | Penske Automotive Group, Inc. 5.375%, 12/01/24 | | | 566,737 | |
| | 515,000 | | | | | Reliance Intermediate Holdings, LP* 6.500%, 04/01/23 | | | 557,737 | |
| | 365,000 | | | | | Service Corp. International 5.375%, 05/15/24 | | | 386,008 | |
| | | | | | SFR Group, SA* | |
| | 675,000 | | | | | 6.000%, 05/15/22 | | | 704,940 | |
| | 150,000 | | | | | 7.375%, 05/01/26 | | | 158,090 | |
| | 315,000 | | | | | Sirius XM Radio, Inc.* 6.000%, 07/15/24 | | | 337,324 | |
| | 575,000 | | | | | Speedway Motorsports, Inc. 5.125%, 02/01/23 | | | 582,650 | |
| | | | | | | | | | |
| | | | | | | | | | |
| | 775,000 | | | | | Time, Inc.* 5.750%, 04/15/22 | | | 794,487 | |
| | | | | | | | | | |
PRINCIPAL
AMOUNT | | | | | | | VALUE | |
| | 350,000 | | | | | Toll Brothers Finance Corp. 5.625%, 01/15/24 | | $ | 376,392 | |
| | 500,000 | | | | | ZF North America Capital, Inc.* 4.500%, 04/29/22 | | | 525,052 | |
| | | | | | | | | | |
| | | | | | | | | 14,071,141 | |
| | | | | | | | | | |
| | | | | | Consumer Staples (4.5%) | |
| | 43,000 | | | | | B&G Foods, Inc. 5.250%, 04/01/25 | | | 44,052 | |
| | 485,000 | | | | | Fresh Market, Inc.* 9.750%, 05/01/23 | | | 403,382 | |
| | 765,000 | | | | | JBS USA, LLC* 7.250%, 06/01/21 | | | 788,539 | |
| | 500,000 | | | | | Land O’Lakes, Inc.* 6.000%, 11/15/22 | | | 555,442 | |
| | 329,000 | | | | | Post Holdings, Inc.* 7.750%, 03/15/24 | | | 366,200 | |
| | 650,000 | | | | | The Nature’s Bounty Company* 7.625%, 05/15/21 | | | 692,068 | |
| | | | | | | | | | |
| | | | | | | | | 2,849,683 | |
| | | | | | | | | | |
| | | | | | Energy (8.7%) | |
| | 545,000 | | | | | Antero Midstream Partners, LP / Antero Midstream Finance Corp.* 5.375%, 09/15/24 | | | 559,325 | |
| | 250,000 | | | | | Blue Racer Midstream, LLC / Blue Racer Finance Corp.* 6.125%, 11/15/22 | | | 257,105 | |
| | | | | | Carrizo Oil & Gas, Inc. | |
| | 375,000 | | | | | 6.250%, 04/15/23^ | | | 378,234 | |
| | 250,000 | | | | | 7.500%, 09/15/20 | | | 258,180 | |
| | 981,000 | | | | | Drill Rigs Holdings, Inc.*@ 6.500%, 10/01/17 | | | 291,848 | |
| | | | | | Energy Transfer Equity, LP | |
| | 555,000 | | | | | 4.187%, 11/01/66 3 mo. USD LIBOR + 3.02%‡ | | | 477,647 | |
| | 535,000 | | | | | 5.500%, 06/01/27 | | | 575,526 | |
| | 175,000 | | | | | EP Energy, LLC / Everest Acquisition Finance, Inc.* 8.000%, 02/15/25 | | | 156,818 | |
| | 507,000 | | | | | Gulfmark Offshore, Inc. 6.375%, 03/15/22 | | | 267,443 | |
| | | | | | Gulfport Energy Corp.* | | | | |
| | 185,000 | | | | | 6.000%, 10/15/24 | | | 182,026 | |
| | 130,000 | | | | | 6.375%, 05/15/25 | | | 129,781 | |
| | 320,000 | | | | | Laredo Petroleum, Inc. 6.250%, 03/15/23 | | | 324,861 | |
| | 300,000 | | | | | Oasis Petroleum, Inc.^ 6.875%, 01/15/23 | | | 304,105 | |
| | 250,000 | | | | | Petroleum Geo Services Company*^ 7.375%, 12/15/20 | | | 232,500 | |
| | 250,000 | | | | | QEP Resources, Inc. 6.875%, 03/01/21 | | | 265,351 | |
| | 219,000 | | | | | Rice Energy, Inc. 7.250%, 05/01/23 | | | 236,691 | |
| | | | |
| 102 | | CALAMOS OPEN-END FAMILY OF FUNDS SEMIANNUAL REPORT | | See accompanying Notes to Schedule of Investments |
High Income Fund Schedule of Investments April 30, 2017 (Unaudited)
| | | | | | | | | | |
PRINCIPAL
AMOUNT | | | | | | | VALUE | |
| | 250,000 | | | | | SemGroup Corp.* 6.375%, 03/15/25 | | $ | 250,779 | |
| | 155,000 | | | | | Southwestern Energy Company 6.700%, 01/23/25 | | | 154,712 | |
| | 271,401 | | | | | W&T Offshore, Inc.* 9.000%, 05/15/20 10.750% PIK rate | | | 238,833 | |
| | | | | | | | | | |
| | | | | | | | | 5,541,765 | |
| | | | | | | | | | |
| | | | | | Financials (6.1%) | |
| | 260,000 | | | | | Ally Financial, Inc. 8.000%, 11/01/31 | | | 309,933 | |
| | | | | | | | | | |
| | | | | | CyrusOne, LP / CyrusOne Finance Corp.* | | | | |
| | 175,000 | | | | | 5.375%, 03/15/27 | | | 180,441 | |
| | 50,000 | | | | | 5.000%, 03/15/24 | | | 51,502 | |
| | | | | | Dell International, LLC / EMC Corp.* | | | | |
| | 170,000 | | | | | 7.125%, 06/15/24 | | | 187,860 | |
| | 170,000 | | | | | 5.875%, 06/15/21 | | | 180,236 | |
| | 650,000 | | | | | Equinix, Inc. 5.375%, 04/01/23 | | | 680,001 | |
| | 845,000 | | | | | GLP Capital, LP / GLP Financing II, Inc. 5.375%, 04/15/26 | | | 891,475 | |
| | 195,000 | | | | | Lions Gate Entertainment Corp.* 5.875%, 11/01/24 | | | 202,582 | |
| | 89,000 | | | | | Navient Corp. 6.500%, 06/15/22 | | | 92,073 | |
| | 500,000 | | | | | Park Aerospace Holdings, Ltd.* 5.250%, 08/15/22 | | | 528,550 | |
| | 550,000 | | | | | Quicken Loans, Inc.* 5.750%, 05/01/25 | | | 557,562 | |
| | | | | | | | | | |
| | | | | | | | | 3,862,215 | |
| | | | | | | | | | |
| | | | | | Health Care (9.3%) | |
| | | | | | Acadia Healthcare Company, Inc. | | | | |
| | 185,000 | | | | | 5.625%, 02/15/23 | | | 192,184 | |
| | 180,000 | | | | | 6.500%, 03/01/24 | | | 190,947 | |
| | | | | | Community Health Systems, Inc. | | | | |
| | 375,000 | | | | | 8.000%, 11/15/19 | | | 365,949 | |
| | 250,000 | | | | | 6.250%, 03/31/23 | | | 255,105 | |
| | 500,000 | | | | | DaVita, Inc. 5.125%, 07/15/24 | | | 515,400 | |
| | 325,000 | | | | | Endo, Ltd.* 6.000%, 07/15/23 | | | 285,366 | |
| | 335,000 | | | | | HCA, Inc. 5.000%, 03/15/24 | | | 355,986 | |
| | 255,000 | | | | | Hologic, Inc.* 5.250%, 07/15/22 | | | 268,858 | |
| | 575,000 | | | | | Mallinckrodt International Finance, SA / Mallinckrodt CB, LLC*^ 5.625%, 10/15/23 | | | 545,974 | |
| | 423,000 | | | | | MPH Acquisition Holdings, LLC* 7.125%, 06/01/24 | | | 455,116 | |
| | 500,000 | | | | | Surgical Care Affiliates, Inc.* 6.000%, 04/01/23 | | | 542,050 | |
| | 558,000 | | | | | Teleflex, Inc. 5.250%, 06/15/24 | | | 574,400 | |
| | | | | | | | | | |
| | | | | | | | | | |
PRINCIPAL
AMOUNT | | | | | | | VALUE | |
| | 775,000 | | | | | Tenet Healthcare Corp. 6.750%, 02/01/20 | | $ | 786,299 | |
| | | | | | Valeant Pharmaceuticals International, Inc.* | | | | |
| | 630,000 | | | | | 5.875%, 05/15/23 | | | 467,224 | |
| | 70,000 | | | | | 7.000%, 03/15/24 | | | 71,493 | |
| | 59,000 | | | | | VPII Escrow Corp.* 6.750%, 08/15/18 | | | 59,033 | |
| | | | | | | | | | |
| | | | | | | | | 5,931,384 | |
| | | | | | | | | | |
| | | | | | Industrials (15.2%) | |
| | 200,000 | | | | | ACCO Brands Corp.* 5.250%, 12/15/24 | | | 205,872 | |
| | 70,000 | | | | | American Greetings Corp.* 7.875%, 02/15/25 | | | 74,746 | |
| | 500,000 | | | | | ARD Finance, SA* 7.125%, 09/15/23 7.875% PIK rate | | | 521,012 | |
| | 250,000 | | | | | BWAY Holding Company* 5.500%, 04/15/24 | | | 252,974 | |
| | 45,000 | | | | | Covanta Holding Corp. 5.875%, 07/01/25 | | | 45,044 | |
| | 557,000 | | | | | Garda World Security Corp.* 7.250%, 11/15/21 | | | 563,124 | |
| | 375,000 | | | | | GrafTech International, Ltd. 6.375%, 11/15/20 | | | 324,844 | |
| | 365,000 | | | | | Huntington Ingalls Industries, Inc.* 5.000%, 11/15/25 | | | 388,626 | |
| | 200,000 | | | | | IHO Verwaltungs GmbH* 4.500%, 09/15/23 5.250% PIK rate | | | 200,710 | |
| | 700,000 | | | | | James Hardie International Finance, Ltd.* 5.875%, 02/15/23 | | | 734,055 | |
| | 220,000 | | | | | Kaiser Aluminum Corp. 5.875%, 05/15/24 | | | 233,288 | |
| | 340,000 | | | | | Lamar Media Corp. 5.750%, 02/01/26 | | | 369,976 | |
| | 595,000 | | | | | Match Group, Inc. 6.375%, 06/01/24 | | | 648,544 | |
| | 475,000 | | | | | Meritor, Inc. 6.750%, 06/15/21 | | | 494,437 | |
| | | | | | Michael Baker International, LLC* | | | | |
| | 459,000 | | | | | 8.250%, 10/15/18 | | | 478,996 | |
| | 385,800 | | | | | 8.875%, 04/15/19 9.625% PIK rate | | | 389,077 | |
| | 295,000 | | | | | Multi-Color Corp.* 6.125%, 12/01/22 | | | 308,608 | |
| | 415,000 | | | | | Navistar International Corp. 8.250%, 11/01/21 | | | 421,074 | |
| | 460,000 | | | | | Oshkosh Corp. 5.375%, 03/01/25 | | | 482,048 | |
| | 315,000 | | | | | Park-Ohio Industries, Inc.* 6.625%, 04/15/27 | | | 326,709 | |
| | 450,000 | | | | | Tennant Company* 5.625%, 05/01/25 | | | 466,760 | |
| | | | | | |
| See accompanying Notes to Schedule of Investments | | www.calamos.com | | | 103 | |
High Income Fund Schedule of Investments April 30, 2017 (Unaudited)
| | | | | | | | | | |
PRINCIPAL
AMOUNT | | | | | | | VALUE | |
| | 160,000 | | | | | Titan International, Inc. 6.875%, 10/01/20 | | $ | 164,576 | |
| | 450,000 | | | | | TransDigm, Inc.* 6.500%, 05/15/25 | | | 460,771 | |
| | | | | | United Rentals North America, Inc. | | | | |
| | 785,000 | | | | | 6.125%, 06/15/23 | | | 822,335 | |
| | 269,000 | | | | | 7.625%, 04/15/22 | | | 281,702 | |
| | | | | | | | | | |
| | | | | | | | | 9,659,908 | |
| | | | | | | | | | |
| | | | | | Information Technology (8.5%) | |
| | 600,000 | | | | | Alliance Data Systems Corp.* 5.375%, 08/01/22 | | | 606,948 | |
| | 160,000 | | | | | Amkor Technology, Inc. 6.625%, 06/01/21 | | | 163,204 | |
| | 700,000 | | | | | Belden, Inc.* 5.500%, 09/01/22 | | | 721,199 | |
| | | | | | Cardtronics, Inc. | | | | |
| | 225,000 | | | | | 5.500%, 05/01/25* | | | 230,141 | |
| | 100,000 | | | | | 5.125%, 08/01/22 | | | 102,437 | |
| | 45,000 | | | | | CBS Radio, Inc.* 7.250%, 11/01/24 | | | 48,960 | |
| | 325,000 | | | | | CDW, LLC / CDW Finance Corp. 5.000%, 09/01/23 | | | 334,696 | |
| | 195,000 | | | | | Clear Channel Worldwide Holdings, Inc. 7.625%, 03/15/20 | | | 194,245 | |
| | 780,000 | | | | | CommScope Technologies, LLC* 6.000%, 06/15/25 | | | 834,604 | |
| | 907,000 | | | | | First Data Corp.* 7.000%, 12/01/23 | | | 973,828 | |
| | | | | | Nuance Communications, Inc.* | | | | |
| | 310,000 | | | | | 6.000%, 07/01/24 | | | 326,878 | |
| | 200,000 | | | | | 5.625%, 12/15/26 | | | 207,027 | |
| | 141,000 | | | | | 5.375%, 08/15/20 | | | 144,376 | |
| | 500,000 | | | | | Symantec Corp.* 5.000%, 04/15/25 | | | 516,710 | |
| | | | | | | | | | |
| | | | | | | | | 5,405,253 | |
| | | | | | | | | | |
| | | | | | Materials (8.2%) | |
| | 335,000 | | | | | Ardagh Packaging Finance, PLC / Ardagh Holdings USA, Inc.* 6.000%, 02/15/25 | | | 346,573 | |
| | 695,000 | | | | | Cascades, Inc.* 5.750%, 07/15/23 | | | 705,182 | |
| | 413,000 | | | | | Chemtura Corp. 5.750%, 07/15/21 | | | 427,777 | |
| | 615,000 | | | | | Constellium, NV* 8.000%, 01/15/23 | | | 638,868 | |
| | | | | | First Quantum Minerals, Ltd.* | | | | |
| | 200,000 | | | | | 7.250%, 04/01/23 | | | 203,509 | |
| | 160,000 | | | | | 7.000%, 02/15/21 | | | 165,725 | |
| | | | | | Freeport-McMoRan, Inc. | | | | |
| | 140,000 | | | | | 4.550%, 11/14/24^ | | | 132,172 | |
| | 90,000 | | | | | 3.550%, 03/01/22 | | | 84,958 | |
| | 350,000 | | | | | Huntsman International, LLC
5.125%, 11/15/22 | | | 369,358 | |
| | | | | | | | | | |
PRINCIPAL
AMOUNT | | | | | | | VALUE | |
| | 150,000 | | | | | IAMGOLD Corp.*
7.000%, 04/15/25 | | $ | 150,551 | |
| | 535,000 | | | | | INEOS Group Holdings, SA*^
5.625%, 08/01/24 | | | 544,272 | |
| | 220,000 | | | | | Koppers, Inc.*
6.000%, 02/15/25 | | | 230,724 | |
| | 400,000 | | | | | New Gold, Inc.*
7.000%, 04/15/20 | | | 404,852 | |
| | 157,000 | | | | | Steel Dynamics, Inc.*
5.000%, 12/15/26 | | | 161,748 | |
| | 625,000 | | | | | Trinseo Materials Operating, SCA*
6.750%, 05/01/22 | | | 662,309 | |
| | | | | | | | | | |
| | | | | | | | | 5,228,578 | |
| | | | | | | | | | |
| | | | | | Real Estate (2.1%) | |
| | 180,000 | | | | | Crescent Communities, LLC/Crescent Ventures, Inc.*
8.875%, 10/15/21 | | | 189,214 | |
| | 460,000 | | | | | DuPont Fabros Technology, LP
5.875%, 09/15/21 | | | 480,535 | |
| | 510,000 | | | | | Iron Mountain, Inc.
6.000%, 08/15/23 | | | 543,887 | |
| | 125,000 | | | | | iStar, Inc.
6.000%, 04/01/22 | | | 128,582 | |
| | | | | | | | | | |
| | | | | | | | | 1,342,218 | |
| | | | | | | | | | |
| | | | | | Telecommunication Services (10.5%) | |
| | 35,000 | | | | | Block Communications, Inc.*
6.875%, 02/15/25 | | | 37,713 | |
| | 292,000 | | | | | CenturyLink, Inc.
6.750%, 12/01/23 | | | 313,557 | |
| | | | | | CSC Holdings, LLC | | | | |
| | 390,000 | | | | | 5.250%, 06/01/24 | | | 395,714 | |
| | 200,000 | | | | | 10.875%, 10/15/25* | | | 240,772 | |
| | 200,000 | | | | | 5.500%, 04/15/27* | | | 206,983 | |
| | 310,000 | | | | | Embarq Corp.
7.995%, 06/01/36 | | | 316,034 | |
| | | | | | Frontier Communications Corp. | | | | |
| | 745,000 | | | | | 7.625%, 04/15/24 | | | 649,253 | |
| | 275,000 | | | | | 10.500%, 09/15/22 | | | 276,856 | |
| | 850,000 | | | | | Inmarsat Finance, PLC*
4.875%, 05/15/22 | | | 857,947 | |
| | 625,000 | | | | | Intelsat Jackson Holdings, SA*^
8.000%, 02/15/24 | | | 675,587 | |
| | 450,000 | | | | | SBA Communications Corp.
4.875%, 07/15/22 | | | 466,196 | |
| | 1,220,000 | | | | | Sprint Corp.
7.875%, 09/15/23 | | | 1,370,859 | |
| | 820,000 | | | | | T-Mobile USA, Inc.
6.625%, 04/01/23 | | | 876,961 | |
| | | | | | | | | | |
| | | | | | | | | 6,684,432 | |
| | | | | | | | | | |
| | | | |
| 104 | | CALAMOS OPEN-END FAMILY OF FUNDS SEMIANNUAL REPORT | | See accompanying Notes to Schedule of Investments |
High Income Fund Schedule of Investments April 30, 2017 (Unaudited)
| | | | | | | | | | |
PRINCIPAL
AMOUNT | | | | | | | VALUE | |
| | | | | | | | | | |
| | | | | | Utilities (0.6%) | |
| | | | | | NRG Energy, Inc. | | | | |
| | 240,000 | | | | | 6.625%, 01/15/27 | | $ | 238,447 | |
| | 116,000 | | | | | 7.875%, 05/15/21 | | | 119,603 | |
| | | | | | | | | | |
| | | | | | | | | 358,050 | |
| | | | | | | | | | |
| | | | | | TOTAL CORPORATE BONDS
(Cost $60,352,189) | | | 60,934,627 | |
| | | | | | | | | | |
NUMBER OF
SHARES | | | | | | | VALUE | |
| | CONVERTIBLE PREFERRED STOCKS (2.0%) | |
| | | | | | Energy (1.3%) | |
| | | | | | NuStar Energy, LP‡ | | | | |
| | 25,350 | | | | | 7.625%, 12/31/49
3 mo. USD LIBOR + 5.64% | | | 642,622 | |
| | 8,552 | | | | | 8.500%, 12/31/49
3 mo. USD LIBOR + 6.77% | | | 229,023 | |
| | | | | | | | | | |
| | | | | | | | | 871,645 | |
| | | | | | | | | | |
| | | | | | Health Care (0.7%) | | | | |
| | 500 | | | | | Allergan, PLC
5.500%, 03/01/18 | | | 432,890 | |
| | | | | | | | | | |
| | | | | | TOTAL CONVERTIBLE
PREFERRED STOCKS
(Cost $1,365,821) | | | 1,304,535 | |
| | | | | | | | | | |
| | | | | | | | | | |
| | SHORT TERM INVESTMENTS (0.5%) | |
| | 154,724 | | | | | Fidelity Prime Money Market Fund - Institutional Class | | | 154,785 | |
| | 154,427 | | | | | Morgan Stanley Institutional Liquidity Funds - Government Portfolio | | | 154,427 | |
| | | | | | | | | | |
| | | | | | TOTAL SHORT TERM INVESTMENTS
(Cost $309,212) | | | 309,212 | |
| | | | | | | | | | |
| | | | | | | | | | |
NUMBER OF SHARES/ PRINCIPAL
AMOUNT | | | | | | | VALUE | |
| INVESTMENT OF CASH COLLATERAL FOR SECURITIES
LOANED (1.8%) |
|
| | 738,592 | | | | | Deutsche Bank Securities, Inc.† | | | 738,592 | |
| | 401,408 | | | | | Goldman Sachs Financial Square Government Fund | | | 401,408 | |
| | | | | | | | | | |
| | | | | | TOTAL INVESTMENT OF CASH COLLATERAL FOR SECURITIES LOANED
(Cost $1,140,000) | | | 1,140,000 | |
| | | | | | | | | | |
| TOTAL INVESTMENTS (100.1%)
(Cost $63,167,222) | | | 63,688,374 | |
| | | | | | | | | | |
| |
| | PAYABLE UPON RETURN OF SECURITIES ON LOAN (-1.8%) | | | (1,140,000 | ) |
| | | | | | | | | | |
| |
| | OTHER ASSETS, LESS LIABILITIES (1.7%) | | | 1,062,202 | |
| | | | | | | | | | |
| |
| | NET ASSETS (100.0%) | | $ | 63,610,576 | |
| | | | | | | | | | |
NOTES TO SCHEDULE OF INVESTMENTS
| * | Securities issued and sold pursuant to a Rule 144A transaction are excepted from the registration requirement of the Securities Act of 1933, as amended. These securities may only be sold to qualified institutional buyers (“QIBs”), such as the Fund. Any resale of these securities must generally be effected through a sale that is registered under the Act or otherwise exempted from such registration requirements. |
| ^ | Security, or portion of security, is on loan. |
| @ | In default status and considered non-income producing. |
| ‡ | Variable rate security. The rate shown is the rate in effect at April 30, 2017. |
| † | Repurchase agreement collateralized by the following security: 753,332 United States Treasury Note, 3.625%, 02/15/20. |
| | | | | | |
| See accompanying Notes to Financial Statements | | www.calamos.com | | | 105 | |
Market Neutral Income Fund Schedule of Investments April 30, 2017 (Unaudited)
| | | | | | | | | | |
PRINCIPAL
AMOUNT | | | | | | | VALUE | |
| | CONVERTIBLE BONDS (43.3%) | |
| | | | | | Consumer Discretionary (9.1%) | |
| | 20,000,000 | | | EUR | | Bayer Capital Corp., BV*
5.625%, 11/22/19 | | $ | 26,420,964 | |
| | | | | | CalAtlantic Group, Inc.~ | | | | |
| | 12,000,000 | | | | | 1.625%, 05/15/18 | | | 14,658,600 | |
| | 6,500,000 | | | | | 1.250%, 08/01/32 | | | 6,617,097 | |
| | | | | | Ctrip.com International, Ltd. | | | | |
| | 26,000,000 | | | | | 1.250%, 10/15/18~ | | | 34,716,110 | |
| | 10,000,000 | | | | | 1.990%, 07/01/25 | | | 11,788,200 | |
| | 30,417,000 | | | | | DISH Network Corp.*
3.375%, 08/15/26 | | | 37,279,379 | |
| | 4,000,000 | | | | | GNC Holdings, Inc.^
1.500%, 08/15/20 | | | 2,793,820 | |
| | 5,000,000 | | | | | Horizon Global Corp.~
2.750%, 07/01/22 | | | 4,667,625 | |
| | 6,918,000 | | | | | Liberty Interactive, LLC*
1.750%, 09/30/46 | | | 8,139,580 | |
| | 5,000,000 | | | | | Liberty Media Corp./Liberty Formula One*
1.000%, 01/30/23 | | | 5,626,725 | |
| | 10,000,000 | | | | | Live Nation Entertainment, Inc.
2.500%, 05/15/19 | | | 11,183,150 | |
| | 4,000,000 | | | | | M/I Homes, Inc.~
3.000%, 03/01/18 | | | 4,162,740 | |
| | 11,635,000 | | | | | Meritage Homes Corp.~
1.875%, 09/15/32 | | | 11,597,652 | |
| | | | | | Priceline Group, Inc.~ | | | | |
| | 25,000,000 | | | | | 1.000%, 03/15/18 | | | 48,769,625 | |
| | 15,000,000 | | | | | 0.900%, 09/15/21^ | | | 17,163,375 | |
| | 6,500,000 | | | | | Restoration Hardware Holdings, Inc.*
0.000%, 06/15/19 | | | 5,813,535 | |
| | 14,000,000 | | | | | Shutterfly, Inc.^
0.250%, 05/15/18 | | | 14,224,000 | |
| | 5,250,000 | | | | | TAL Education Group
2.500%, 05/15/19 | | | 23,727,454 | |
| | | | | | Tesla, Inc. | | | | |
| | 32,500,000 | | | | | 1.250%, 03/01/21~ | | | 33,652,775 | |
| | 30,000,000 | | | | | 2.375%, 03/15/22 | | | 33,557,400 | |
| | 10,000,000 | | | | | 1.500%, 06/01/18~ | | | 25,077,950 | |
| | 15,000,000 | | | | | Vipshop Holdings, Ltd.
1.500%, 03/15/19 | | | 15,326,025 | |
| | | | | | | | | | |
| | | | | | | | | 396,963,781 | |
| | | | | | | | | | |
| | | | | | Consumer Staples (0.3%) | |
| | 15,000,000 | | | | | Herbalife, Ltd.^
2.000%, 08/15/19 | | | 14,826,750 | |
| | | | | | | | | | |
| | | | | | Energy (1.2%) | |
| | 20,000,000 | | | | | Chesapeake Energy Corp.*
5.500%, 09/15/26 | | | 19,678,200 | |
| | 5,000,000 | | | | | Golar LNG, Ltd.*
2.750%, 02/15/22 | | | 4,903,625 | |
| | 5,000,000 | | | | | Oasis Petroleum, Inc.~^
2.625%, 09/15/23 | | | 6,058,275 | |
| | | | | | | | | | |
PRINCIPAL
AMOUNT | | | | | | | VALUE | |
| | 7,500,000 | | | | | Renewable Energy Group, Inc.*
4.000%, 06/15/36 | | $ | 8,553,225 | |
| | 4,000,000 | | | | | SEACOR Holdings, Inc.~
3.000%, 11/15/28 | | | 3,606,600 | |
| | 10,000,000 | | | | | Whiting Petroleum Corp.~
1.250%, 04/01/20 | | | 8,829,950 | |
| | | | | | | | | | |
| | | | | | | | | 51,629,875 | |
| | | | | | | | | | |
| | | | | | Financials (0.6%) | |
| | | | | | AmTrust Financial Services, Inc. | | | | |
| | 4,821,000 | | | | | 2.750%, 12/15/44 | | | 3,453,258 | |
| | 3,000,000 | | | | | 2.750%, 12/15/44* | | | 2,358,060 | |
| | 3,500,000 | | | | | Cowen Group, Inc.~
3.000%, 03/15/19 | | | 3,651,357 | |
| | 15,000,000 | | | EUR | | Credit Agricole, SA
0.000%, 10/03/19 | | | 11,764,240 | |
| | 5,000,000 | | | | | Goldman Sachs BDC, Inc.*~
4.500%, 04/01/22 | | | 5,196,075 | |
| | | | | | | | | | |
| | | | | | | | | 26,422,990 | |
| | | | | | | | | | |
| | | | | | Health Care (5.7%) | |
| | 7,500,000 | | | | | Aceto Corp.^
2.000%, 11/01/20 | | | 6,922,538 | |
| | 5,000,000 | | | | | Allscripts Healthcare Solutions, Inc.~
1.250%, 07/01/20 | | | 4,966,025 | |
| | 10,000,000 | | | | | AMAG Pharmaceuticals, Inc.~
2.500%, 02/15/19 | | | 11,370,750 | |
| | 15,000,000 | | | | | BioMarin Pharmaceutical, Inc.~
0.750%, 10/15/18 | | | 17,604,450 | |
| | 7,500,000 | | | | | Depomed, Inc.~
2.500%, 09/01/21 | | | 7,006,575 | |
| | 7,500,000 | | | | | Emergent Biosolutions, Inc.~
2.875%, 01/15/21 | | | 9,102,113 | |
| | 4,245,000 | | | | | Evolent Health, Inc.*
2.000%, 12/01/21 | | | 5,233,385 | |
| | 5,000,000 | | | | | Flexion Therapeutics, Inc.*
3.375%, 05/01/24 | | | 5,193,750 | |
| | 12,500,000 | | | | | Horizon Pharma Investment, Ltd.
2.500%, 03/15/22 | | | 11,748,438 | |
| | | | | | Insulet Corp. | | | | |
| | 10,000,000 | | | | | 1.250%, 09/15/21* | | | 10,159,350 | |
| | 804,000 | | | | | 2.000%, 06/15/19~ | | | 916,242 | |
| | 5,000,000 | | | | | Intercept Pharmaceuticals, Inc.
3.250%, 07/01/23 | | | 4,694,475 | |
| | 8,000,000 | | | | | Ironwood Pharmaceuticals, Inc.
2.250%, 06/15/22 | | | 9,730,280 | |
| | 12,500,000 | | | | | Ligand Pharmaceuticals, Inc.~^
0.750%, 08/15/19 | | | 19,460,062 | |
| | | | | | Medicines Company | | | | |
| | 12,500,000 | | | | | 2.750%, 07/15/23* | | | 15,184,125 | |
| | 7,500,000 | | | | | 2.500%, 01/15/22~ | | | 11,958,262 | |
| | | | | | Molina Healthcare, Inc.~ | | | | |
| | 10,500,000 | | | | | 1.625%, 08/15/44 | | | 11,516,505 | |
| | 10,000,000 | | | | | 1.125%, 01/15/20 | | | 13,556,050 | |
| | | | |
| 106 | | CALAMOS OPEN-END FAMILY OF FUNDS SEMIANNUAL REPORT | | See accompanying Notes to Schedule of Investments |
Market Neutral Income Fund Schedule of Investments April 30, 2017 (Unaudited)
| | | | | | | | | | |
PRINCIPAL
AMOUNT | | | | | | | VALUE | |
| | 14,000,000 | | | | | Neurocrine Biosciences, Inc.*
2.250%, 05/15/24 | | $ | 14,638,750 | |
| | 12,500,000 | | | | | NuVasive, Inc.
2.250%, 03/15/21 | | | 16,709,625 | |
| | 5,000,000 | | | | | Quidel Corp.~
3.250%, 12/15/20 | | | 5,265,600 | |
| | 8,000,000 | | | | | Spectranetics Corp.
2.625%, 06/01/34 | | | 9,138,480 | |
| | 4,000,000 | | | | | Teligent, Inc.
3.750%, 12/15/19 | | | 4,040,900 | |
| | 10,000,000 | | | | | Wright Medical Group, Inc.
2.000%, 02/15/20 | | | 11,729,900 | |
| | 7,500,000 | | | | | Wright Medical Group, NV*
2.250%, 11/15/21 | | | 11,514,975 | |
| | | | | | | | | | |
| | | | | | | | | 249,361,605 | |
| | | | | | | | | | |
| | | | | | Industrials (1.2%) | |
| | 5,000,000 | | | | | Aerojet Rocketdyne Holdings, Inc.*
2.250%, 12/15/23 | | | 5,540,025 | |
| | 9,400,000 | | | | | Greenbrier Companies, Inc.
3.500%, 04/01/18 | | | 12,246,743 | |
| | | | | | Navistar International Corp. | | | | |
| | 2,500,000 | | | | | 4.750%, 04/15/19 | | | 2,441,538 | |
| | 2,500,000 | | | | | 4.500%, 10/15/18 | | | 2,468,012 | |
| | 3,000,000 | | | | | SolarCity Corp.^
1.625%, 11/01/19 | | | 2,731,500 | |
| | 10,000,000 | | | | | SunPower Corp.^
4.000%, 01/15/23 | | | 8,059,050 | |
| | 10,000,000 | | | | | Trinity Industries, Inc.~
3.875%, 06/01/36 | | | 12,348,000 | |
| | 5,000,000 | | | | | Tutor Perini Corp.*~
2.875%, 06/15/21 | | | 6,187,725 | |
| | | | | | | | | | |
| | | | | | | | | 52,022,593 | |
| | | | | | | | | | |
| | | | | | Information Technology (22.1%) | |
| | 20,000,000 | | | | | Advanced Micro Devices, Inc.
2.125%, 09/01/26 | | | 36,771,600 | |
| | 8,000,000 | | | | | Blackhawk Network Holdings, Inc.*
1.500%, 01/15/22 | | | 8,717,120 | |
| | 7,750,000 | | | | | Bottomline Technologies, Inc.
1.500%, 12/01/17 | | | 7,804,792 | |
| | 2,500,000 | | | | | Brocade Communications Systems, Inc.~
1.375%, 01/01/20 | | | 2,531,163 | |
| | 2,500,000 | | | | | CalAmp Corp.
1.625%, 05/15/20 | | | 2,508,963 | |
| | 8,800,000 | | | | | Cardtronics, Inc.~
1.000%, 12/01/20 | | | 9,090,752 | |
| | 18,900,000 | | | | | Ciena Corp.*~
3.750%, 10/15/18 | | | 24,286,594 | |
| | 10,000,000 | | | | | Citrix Systems, Inc.~
0.500%, 04/15/19 | | | 12,241,500 | |
| | 12,000,000 | | | | | Cornerstone OnDemand, Inc.~
1.500%, 07/01/18 | | | 12,317,280 | |
| | 11,000,000 | | | | | CSG Systems International, Inc.^
4.250%, 03/15/36 | | | 11,428,835 | |
| | | | | | | | | | |
PRINCIPAL
AMOUNT | | | | | | | VALUE | |
| | 5,000,000 | | | | | Cypress Semiconductor Corp.*~
4.500%, 01/15/22 | | $ | 6,197,250 | |
| | 10,500,000 | | | | | Electronics For Imaging, Inc.~
0.750%, 09/01/19 | | | 11,204,077 | |
| | 5,000,000 | | | | | Envestnet, Inc.^
1.750%, 12/15/19 | | | 4,755,825 | |
| | 5,000,000 | | | | | Euronet Worldwide, Inc.~
1.500%, 10/01/44 | | | 6,192,200 | |
| | 17,500,000 | | | | | Finisar Corp.
0.500%, 12/15/33 | | | 18,502,137 | |
| | | | | | FireEye, Inc. | | | | |
| | 5,000,000 | | | | | 1.625%, 06/01/35 | | | 4,500,025 | |
| | 5,000,000 | | | | | 1.000%, 06/01/35^ | | | 4,727,650 | |
| | 9,500,000 | | | | | Infinera Corp.
1.750%, 06/01/18 | | | 10,105,435 | |
| | | | | | Inphi Corp. | | | | |
| | 5,000,000 | | | | | 1.125%, 12/01/20 | | | 6,182,825 | |
| | 3,975,000 | | | | | 0.750%, 09/01/21* | | | 4,080,039 | |
| | 10,000,000 | | | | | Integrated Device Technology, Inc.
0.875%, 11/15/22 | | | 10,213,700 | |
| | 30,000,000 | | | | | Intel Corp.~
3.250%, 08/01/39 | | | 52,460,250 | |
| | 15,000,000 | | | | | Lumentum Holdings, Inc.*
0.250%, 03/15/24 | | | 15,011,775 | |
| | 10,000,000 | | | | | MercadoLibre, Inc.~
2.250%, 07/01/19 | | | 18,631,700 | |
| | | | | | Microchip Technology, Inc. | | | | |
| | 20,000,000 | | | | | 1.625%, 02/15/25~ | | | 29,414,700 | |
| | 19,903,000 | | | | | 1.625%, 02/15/27* | | | 20,481,481 | |
| | 7,500,000 | | | | | 2.250%, 02/15/37* | | | 7,775,250 | |
| | 20,000,000 | | | | | Micron Technology, Inc.~
1.625%, 02/15/33 | | | 50,610,600 | |
| | 5,000,000 | | | | | Nice Systems, Inc.*
1.250%, 01/15/24 | | | 5,190,300 | |
| | 15,000,000 | | | | | Nuance Communications, Inc.
1.000%, 12/15/35 | | | 14,562,300 | |
| | 25,000,000 | | | | | NVIDIA Corp.~
1.000%, 12/01/18 | | | 129,276,500 | |
| | 10,000,000 | | | | | NXP Semiconductors, NV~
1.000%, 12/01/19 | | | 11,667,850 | |
| | 20,000,000 | | | | | ON Semiconductor Corp.*^
1.625%, 10/15/23 | | | 20,007,500 | |
| | 10,000,000 | | | | | OSI Systems, Inc.*
1.250%, 09/01/22 | | | 9,934,600 | |
| | 10,600,000 | | | | | Palo Alto Networks, Inc.~
0.000%, 07/01/19 | | | 12,351,862 | |
| | 7,500,000 | | | | | Pandora Media, Inc.
1.750%, 12/01/20 | | | 7,284,938 | |
| | 15,000,000 | | | | | Proofpoint, Inc.
1.250%, 12/15/18 | | | 29,148,000 | |
| | 10,000,000 | | | | | Rambus, Inc.~
1.125%, 08/15/18 | | | 11,609,900 | |
| | 7,500,000 | | | EUR | | Rocket Internet, SE
3.000%, 07/22/22 | | | 7,600,826 | |
| | | | | | |
| See accompanying Notes to Schedule of Investments | | www.calamos.com | | | 107 | |
Market Neutral Income Fund Schedule of Investments April 30, 2017 (Unaudited)
| | | | | | | | | | |
PRINCIPAL
AMOUNT | | | | | | | VALUE | |
| | 7,500,000 | | | | | Rovi Corp.
0.500%, 03/01/20 | | $ | 7,418,775 | |
| | 25,000,000 | | | | | Salesforce.com, Inc.~
0.250%, 04/01/18 | | | 33,175,750 | |
| | 20,000,000 | | | | | ServiceNow, Inc.
0.000%, 11/01/18 | | | 26,994,600 | |
| | 15,000,000 | | | | | Silicon Laboratories, Inc.*
1.375%, 03/01/22 | | | 15,753,975 | |
| | 5,000,000 | | | | | SINA Corp.
1.000%, 12/01/18 | | | 5,025,375 | |
| | 15,000,000 | | | | | Square, Inc.*
0.375%, 03/01/22 | | | 15,890,700 | |
| | | | | | SunEdison, Inc.@ | | | | |
| | 14,500,000 | | | | | 2.375%, 04/15/22 | | | 146,668 | |
| | 6,250,000 | | | | | 2.000%, 10/01/18 | | | 57,000 | |
| | 4,651,000 | | | | | Synchronoss Technologies, Inc.
0.750%, 08/15/19 | | | 3,991,907 | |
| | 10,000,000 | | | | | Take-Two Interactive Software, Inc.~
1.000%, 07/01/18 | | | 29,199,550 | |
| | 5,000,000 | | | | | Teradyne, Inc.*
1.250%, 12/15/23 | | | 6,293,050 | |
| | 10,000,000 | | | | | TTM Technologies, Inc.~
1.750%, 12/15/20 | | | 18,222,800 | |
| | 10,000,000 | | | | | Twitter, Inc.~
1.000%, 09/15/21 | | | 9,196,850 | |
| | 7,400,000 | | | | | Veeco Instruments, Inc.
2.700%, 01/15/23 | | | 8,137,299 | |
| | | | | | Viavi Solutions, Inc. | | | | |
| | 15,000,000 | | | | | 0.625%, 08/15/33~^ | | | 16,301,925 | |
| | 5,000,000 | | | | | 1.000%, 03/01/24* | | | 5,083,325 | |
| | 10,000,000 | | | | | WebMD Health Corp.
2.500%, 01/31/18 | | | 10,210,900 | |
| | | | | | Workday, Inc. | | | | |
| | 19,500,000 | | | | | 0.750%, 07/15/18~ | | | 22,711,455 | |
| | 7,500,000 | | | | | 1.500%, 07/15/20 | | | 9,417,375 | |
| | 20,000,000 | | | | | Xilinx, Inc.~ 2.625%, 06/15/17 | | | 43,944,200 | |
| | 5,000,000 | | | | | Yahoo!, Inc.~ 0.000%, 12/01/18 | | | 5,267,375 | |
| | 5,000,000 | | | | | Zillow Group, Inc.*
2.000%, 12/01/21 | | | 5,235,725 | |
| | | | | | | | | | |
| | | | | | | | | 965,056,673 | |
| | | | | | | | | | |
| | | | | | Materials (1.4%) | |
| | 10,000,000 | | | | | Allegheny Technologies, Inc.
4.750%, 07/01/22 | | | 15,162,450 | |
| | 4,000,000 | | | | | B2Gold Corp.~ 3.250%, 10/01/18 | | | 4,161,080 | |
| | 17,500,000 | | | | | Cemex, SAB de CV~ 3.750%, 03/15/18 | | | 20,443,150 | |
| | 3,000,000 | | | | | Pretium Resources, Inc.*
2.250%, 03/15/22 | | | 2,957,430 | |
| | 10,000,000 | | | | | RTI International Metals, Inc.
1.625%, 10/15/19 | | | 11,901,500 | |
| | | | | | | | | | |
PRINCIPAL
AMOUNT | | | | | | | VALUE | |
| | 5,000,000 | | | | | TimkenSteel Corp.
6.000%, 06/01/21 | | $ | 7,364,600 | |
| | | | | | | | | | |
| | | | | | | | | 61,990,210 | |
| | | | | | | | | | |
| | | | | | Real Estate (1.4%) | |
| | 4,000,000 | | | | | American Residential Properties OP, LP*
3.250%, 11/15/18 | | | 5,341,640 | |
| | | | | | Colony Starwood Homes | | | | |
| | 7,700,000 | | | | | 3.500%, 01/15/22* | | | 8,294,633 | |
| | 6,000,000 | | | | | 3.000%, 07/01/19 | | | 7,174,470 | |
| | 8,200,000 | | | | | Extra Space Storage, LP*
3.125%, 10/01/35 | | | 8,573,551 | |
| | 6,000,000 | | | | | Forestar Group, Inc.
3.750%, 03/01/20 | | | 6,028,800 | |
| | 15,000,000 | | | | | SL Green Operating Partnership, LP* 3.000%, 10/15/17 | | | 20,309,925 | |
| | 5,000,000 | | | | | Starwood Property Trust, Inc.~ 3.750%, 10/15/17 | | | 5,076,600 | |
| | | | | | | | | | |
| | | | | | | | | 60,799,619 | |
| | | | | | | | | | |
| | | | | | Telecommunication Services (0.3%) | |
| | 10,000,000 | | | EUR | | América Móvil, SAB de CV
0.000%, 05/28/20 | | | 10,644,151 | |
| | | | | | | | | | |
| | | | | | TOTAL CONVERTIBLE BONDS
(Cost $1,675,214,297) | | | 1,889,718,247 | |
| | | | | | | | | | |
| | SYNTHETIC CONVERTIBLE SECURITIES (4.3%) ¤ | |
| | Corporate Bonds (4.0%) | | | | |
| | | | | | Consumer Discretionary (1.7%) | |
| | 5,000,000 | | | | | American Airlines Group, Inc.~ 6.125%, 06/01/18 | | | 5,190,400 | |
| | 4,575,000 | | | | | Continental Airlines 2012-3 Class C Pass Thru Trust
6.125%, 04/29/18 | | | 4,716,184 | |
| | 6,820,000 | | | | | D.R. Horton, Inc.~ 3.750%, 03/01/19 | | | 6,993,876 | |
| | 10,000,000 | | | | | DISH DBS Corp.~ 4.250%, 04/01/18 | | | 10,187,600 | |
| | 1,000,000 | | | | | Ford Motor Credit Company, LLC~ 2.943%, 01/08/19 | | | 1,013,350 | |
| | | | | | General Motors Company, Inc.~ | | | | |
| | 3,000,000 | | | | | 3.250%, 05/15/18 | | | 3,040,140 | |
| | 2,500,000 | | | | | 3.500%, 10/02/18 | | | 2,550,750 | |
| | 2,000,000 | | | | | 2.400%, 05/09/19 | | | 2,007,040 | |
| | 500,000 | | | | | 2.625%, 07/10/17 | | | 501,028 | |
| | | | | | Lennar Corp. | | | | |
| | 8,760,000 | | | | | 4.500%, 06/15/19 | | | 9,100,063 | |
| | 7,000,000 | | | | | 4.125%, 12/01/18~ | | | 7,183,365 | |
| | 5,745,000 | | | | | Meritage Homes Corp.~ 4.500%, 03/01/18 | | | 5,867,254 | |
| | 4,170,000 | | | | | NCL Corp., Ltd. - Class C*~ 4.625%, 11/15/20 | | | 4,291,034 | |
| | 13,760,000 | | | | | Toll Brothers Finance Corp.~ 4.000%, 12/31/18 | | | 14,160,760 | |
| | | | | | | | | | |
| | | | | | | | | 76,802,844 | |
| | | | | | | | | | |
| | | | |
| 108 | | CALAMOS OPEN-END FAMILY OF FUNDS SEMIANNUAL REPORT | | See accompanying Notes to Schedule of Investments |
Market Neutral Income Fund Schedule of Investments April 30, 2017 (Unaudited)
| | | | | | | | | | |
PRINCIPAL
AMOUNT | | | | | | | VALUE | |
| | | | | | Consumer Staples (0.1%) | |
| | 6,000,000 | | | | | Constellation Brands, Inc.~ 7.250%, 05/15/17 | | $ | 6,011,790 | |
| | | | | | | | | | |
| | | | | | Energy (0.1%) | |
| | 500,000 | | | | | Exxon Mobil Corp.~ 1.708%, 03/01/19 | | | 501,440 | |
| | 2,000,000 | | | | | Shell International Finance, BV~ 1.375%, 09/12/19 | | | 1,981,580 | |
| | | | | | | | | | |
| | | | | | | | | 2,483,020 | |
| | | | | | | | | | |
| | | | | | Financials (0.5%) | |
| | | | | | Ally Financial, Inc.~ | | | | |
| | 6,000,000 | | | | | 3.250%, 09/29/17 | | | 6,038,340 | |
| | 2,500,000 | | | | | 3.250%, 11/05/18 | | | 2,529,562 | |
| | 1,000,000 | | | | | Berkshire Hathaway Finance Corp.~ 1.700%, 03/15/19 | | | 1,002,775 | |
| | 2,000,000 | | | | | Capital One NA~ 1.850%, 09/13/19 | | | 1,983,760 | |
| | 3,000,000 | | | | | Fifth Third Bancorp~ 1.625%, 09/27/19 | | | 2,973,705 | |
| | 1,500,000 | | | | | Goldman Sachs Group, Inc.~ 2.000%, 04/25/19 | | | 1,500,165 | |
| | | | | | Hyundai Capital America*~ | | | | |
| | 1,000,000 | | | | | 2.500%, 03/18/19 | | | 1,003,905 | |
| | 500,000 | | | | | 2.000%, 07/01/19 | | | 496,055 | |
| | 2,000,000 | | | | | Metropolitan Life Global Funding I*~ 1.550%, 09/13/19 | | | 1,980,650 | |
| | | | | | PNC Bank NA~ | | | | |
| | 1,000,000 | | | | | 1.950%, 03/04/19 | | | 1,002,910 | |
| | 1,000,000 | | | | | 1.800%, 11/05/18 | | | 1,001,470 | |
| | | | | | | | | | |
| | | | | | | | | 21,513,297 | |
| | | | | | | | | | |
| | | | | | Health Care (0.1%) | |
| | 2,703,000 | | | | | HCA, Inc.~ 3.750%, 03/15/19 | | | 2,766,453 | |
| | 500,000 | | | | | Teva Pharmaceutical Finance Netherlands III, BV
1.700%, 07/19/19 | | | 495,650 | |
| | 2,500,000 | | | | | UnitedHealth Group, Inc.~ 1.700%, 02/15/19 | | | 2,498,575 | |
| | | | | | | | | | |
| | | | | | | | | 5,760,678 | |
| | | | | | | | | | |
| | | | | | Industrials (0.3%) | |
| | 12,000,000 | | | | | AerCap Ireland Capital, Ltd. / AerCap Global Aviation Trust~ 2.750%, 05/15/17 | | | 12,005,040 | |
| | | | | | | | | | |
| | | | | | Information Technology (1.0%) | |
| | 14,700,000 | | | | | Alliance Data Systems Corp.*
5.250%, 12/01/17 | | | 14,911,900 | |
| | 2,000,000 | | | | | eBay, Inc.~ 2.500%, 03/09/18 | | | 2,015,430 | |
| | 10,000,000 | | | | | Hewlett Packard Enterprise Company~ 2.850%, 10/05/18 | | | 10,119,200 | |
| | 1,000,000 | | | | | Juniper Networks, Inc.~ 3.125%, 02/26/19 | | | 1,018,645 | |
| | 2,725,000 | | | | | NXP Semiconductors, NV*~ 3.750%, 06/01/18 | | | 2,781,517 | |
| | 7,000,000 | | | | | Sanmina Corp.*~ 4.375%, 06/01/19 | | | 7,198,905 | |
| | | | | | | | | | |
PRINCIPAL
AMOUNT | | | | | | | VALUE | |
| | 5,000,000 | | | | | Seagate Technology, PLC~ 3.750%, 11/15/18 | | $ | 5,131,350 | |
| | | | | | | | | | |
| | | | | | | | | 43,176,947 | |
| | | | | | | | | | |
| | | | | | Real Estate (0.2%) | |
| | | | | | iStar, Inc. | | | | |
| | 6,000,000 | | | | | 4.875%, 07/01/18~ | | | 6,067,200 | |
| | 2,000,000 | | | | | 4.000%, 11/01/17 | | | 2,008,280 | |
| | | | | | | | | | |
| | | | | | | | | 8,075,480 | |
| | | | | | | | | | |
| | | | | | TOTAL CORPORATE BONDS | | | 175,829,096 | |
| | | | | | | | | | |
NUMBER OF
CONTRACTS/
NOTIONAL
AMOUNT | | | | | | | VALUE | |
| | Purchased Options (0.3%) # | |
| | | | | | Consumer Discretionary (0.0%) | |
| 200
20,000 |
| | | | Amazon.com, Inc.
Call, 07/21/17, Strike $925.00 | | | 694,000 | |
| 500
250,000 |
| | EUR | | Moncler S.p.A
Call, 09/15/17, Strike 22.00 | | | 360,967 | |
| 488
48,800 |
| | | | Netflix, Inc.
Call, 05/19/17, Strike $155.00 | | | 112,240 | |
| | | | | | | | | | |
| | | | | | | | | 1,167,207 | |
| | | | | | | | | | |
| | | | | | Energy (0.0%) | |
| 1,600
160,000 |
| | | | Southwestern Energy Company
Call, 06/16/17, Strike $9.00 | | | 25,600 | |
| | | | | | | | | | |
| | | | | | Health Care (0.0%) | |
| 900
90,000 |
| | | | Allergan, PLC
Call, 01/19/18, Strike $290.00 | | | 441,000 | |
| | | | | | | | | | |
| | | | | | Information Technology (0.1%) | |
| 300
30,000 |
| | | | Alphabet, Inc.
Call, 07/21/17, Strike $890.00 | | | 1,530,000 | |
| 2,000
200,000 |
| | | | Apple, Inc.
Call, 05/19/17, Strike $125.00 | | | 3,750,000 | |
| 230
23,000 |
| | | | Skyworks Solutions, Inc.
Call, 06/16/17, Strike $105.00 | | | 33,925 | |
| | | | | | | | | | |
| | | | | | | | | 5,313,925 | |
| | | | | | | | | | |
| | | | | | Other (0.2%) | |
| | | | | | S&P 500 Index | | | | |
| 5,500
550,000 |
| | | | Call, 05/31/17, Strike $2,425.00 | | | 2,722,500 | |
| 2,000
200,000 |
| | | | Call, 05/01/17, Strike $2,400.00 | | | 45,000 | |
| 1,000
100,000 |
| | | | Call, 05/08/17, Strike $2,410.00 | | | 240,000 | |
| 1,000
100,000 |
| | | | Call, 05/08/17, Strike $2,355.00 | | | 3,505,000 | |
| 1,000
100,000 |
| | | | Call, 05/19/17, Strike $2,450.00 | | | 47,500 | |
| | | | | | | | | | |
| | | | | | | | | 6,560,000 | |
| | | | | | | | | | |
| | | | | | TOTAL PURCHASED OPTIONS | | | 13,507,732 | |
| | | | | | | | | | |
| | | | | | TOTAL SYNTHETIC
CONVERTIBLE SECURITIES
(Cost $184,954,157) | | | 189,336,828 | |
| | | | | | | | | | |
| | | | | | |
| See accompanying Notes to Schedule of Investments | | www.calamos.com | | | 109 | |
Market Neutral Income Fund Schedule of Investments April 30, 2017 (Unaudited)
| | | | | | | | | | |
NUMBER OF
SHARES | | | | | | | VALUE | |
| | CONVERTIBLE PREFERRED STOCKS (4.8%) | |
| | | | | | Consumer Staples (0.2%) | |
| | 40,000 | | | | | Post Holdings, Inc.
5.250%, 06/01/17 | | $ | 5,814,208 | |
| | | | | | | | | | |
| | | | | | Energy (0.4%) | | | | |
| | 800,000 | | | | | Southwestern Energy Company
6.250%, 01/15/18 | | | 14,784,000 | |
| | | | | | | | | | |
| | | | | | Financials (0.1%) | | | | |
| | 50,000 | | | | | Virtus Investment Partners, Inc.
7.250%, 02/01/20 | | | 4,897,500 | |
| | | | | | | | | | |
| | | | | | Health Care (0.8%) | | | | |
| | 25,000 | | | | | Allergan, PLC~ 5.500%, 03/01/18 | | | 21,644,500 | |
| | 25,000 | | | | | Teva Pharmaceutical Industries, Ltd.~ 7.000%, 12/15/18 | | | 14,275,000 | |
| | | | | | | | | | |
| | | | | | | | | 35,919,500 | |
| | | | | | | | | | |
| | | | | | Industrials (0.4%) | |
| | 300,000 | | | | | Rexnord Corp.
5.750%, 11/15/19 | | | 16,905,000 | |
| | | | | | | | | | |
| | | | | | Information Technology (0.4%) | |
| | 65,000 | | | | | Belden, Inc.
6.750%, 07/15/19 | | | 6,400,550 | |
| | 100,000 | | | | | MTS Systems Corp.
8.750%, 07/01/19 | | | 11,086,690 | |
| | | | | | | | | | |
| | | | | | | | | 17,487,240 | |
| | | | | | | | | | |
| | | | | | Real Estate (0.4%) | | | | |
| | 150,000 | | | | | American Tower Corp.
5.500%, 02/15/18 | | | 17,362,500 | |
| | | | | | | | | | |
| | | | | | Telecommunication Services (1.7%) | |
| | 500,000 | | | | | Alibaba Exchangeable (Softbank)*§
5.750%, 06/03/19 | | | 68,733,300 | |
| | 150,000 | | | | | Frontier Communications Corp.
11.125%, 06/29/18 | | | 6,651,000 | |
| | | | | | | | | | |
| | | | | | | | | 75,384,300 | |
| | | | | | | | | | |
| | | | | | Utilities (0.4%) | |
| | 60,597 | | | | | Dominion Resources, Inc.
6.750%, 08/15/19 | | | 3,067,420 | |
| | 130,000 | | | | | DTE Energy Company
6.500%, 10/01/19 | | | 7,033,832 | |
| | 50,000 | | | | | Dynegy, Inc.
7.000%, 07/01/19 | | | 2,564,750 | |
| | 100,000 | | | | | NextEra Energy, Inc.~
6.371%, 09/01/18 | | | 6,167,000 | |
| | | | | | | | | | |
| | | | | | | | | 18,833,002 | |
| | | | | | | | | | |
| | | | | | TOTAL CONVERTIBLE
PREFERRED STOCKS
(Cost $221,867,865) | | | 207,387,250 | |
| | | | | | | | | | |
| | | | | | | | | | |
NUMBER OF
SHARES | | | | | | | VALUE | |
| | COMMON STOCKS (47.9%) | | | | |
| | | | | | Consumer Discretionary (6.3%) | |
| | 29,115 | | | | | Amazon.com, Inc.~# | | $ | 26,931,084 | |
| | 51,967 | | | | | CarMax, Inc.~# | | | 3,040,070 | |
| | 61,284 | | | | | Carnival Corp.~ | | | 3,785,513 | |
| | 14,586 | | | | | Charter Communications, Inc.# | | | 5,034,504 | |
| | 5,568 | | | | | Chipotle Mexican Grill, Inc.# | | | 2,641,849 | |
| | 101,900 | | | | | Coach, Inc.~ | | | 4,013,841 | |
| | 616,313 | | | | | Comcast Corp. - Class A~ | | | 24,153,306 | |
| | 116,597 | | | | | D.R. Horton, Inc.~ | | | 3,834,875 | |
| | 38,097 | | | | | Darden Restaurants, Inc.~ | | | 3,245,483 | |
| | 73,949 | | | | | Delphi Automotive, PLC | | | 5,945,500 | |
| | 43,014 | | | | | Dollar General Corp.~ | | | 3,127,548 | |
| | 44,443 | | | | | Foot Locker, Inc. | | | 3,437,222 | |
| | 412,571 | | | | | Ford Motor Company~ | | | 4,732,189 | |
| | 52,627 | | | | | Garmin, Ltd.^ | | | 2,675,557 | |
| | 289,996 | | | | | General Motors Company, Inc. | | | 10,045,461 | |
| | 237,328 | | | | | Home Depot, Inc.~ | | | 37,046,901 | |
| | 103,225 | | | | | Johnson Controls International plc | | | 4,291,063 | |
| | 97,888 | | | | | LKQ Corp.# | | | 3,058,021 | |
| | 93,245 | | | | | Lowe’s Companies, Inc.~ | | | 7,914,636 | |
| | 87,696 | | | | | Macy’s, Inc.~ | | | 2,562,477 | |
| | 92,248 | | | | | McDonald’s Corp.~ | | | 12,908,263 | |
| | 18,404 | | | | | Mohawk Industries, Inc.~# | | | 4,321,075 | |
| | 58,470 | | | | | Netflix, Inc.# | | | 8,899,134 | |
| | 175,706 | | | | | Nike, Inc. - Class B~ | | | 9,735,869 | |
| | 5,371 | | | | | Priceline Group, Inc.~# | | | 9,919,270 | |
| | 27,544 | | | | | PVH Corp.~ | | | 2,782,770 | |
| | 47,209 | | | | | Ross Stores, Inc.~ | | | 3,068,585 | |
| | 35,742 | | | | | Royal Caribbean Cruises, Ltd. | | | 3,810,097 | |
| | 121,115 | | | | | Starbucks Corp.~ | | | 7,274,167 | |
| | 79,543 | | | | | Target Corp.~ | | | 4,442,477 | |
| | 75,487 | | | | | Time Warner, Inc.~ | | | 7,493,595 | |
| | 44,486 | | | | | TJX Companies, Inc.~ | | | 3,498,379 | |
| | 212,452 | | | | | Twenty-First Century Fox, Inc.~ | | | 6,488,284 | |
| | 12,283 | | | | | Ulta Salon Cosmetics & Fragrance, Inc.# | | | 3,456,928 | |
| | 212,717 | | | | | Walt Disney Company~ | | | 24,590,085 | |
| | 15,274 | | | | | Whirlpool Corp.~ | | | 2,836,076 | |
| | | | | | | | | | |
| | | | | | | | | 277,042,154 | |
| | | | | | | | | | |
| | | | | | Consumer Staples (4.2%) | |
| | 220,404 | | | | | Altria Group, Inc.~ | | | 15,820,599 | |
| | 62,220 | | | | | Archer-Daniels-Midland Company~ | | | 2,846,565 | |
| | 68,295 | | | | | Church & Dwight Company, Inc. | | | 3,382,651 | |
| | 382,955 | | | | | Coca-Cola Company | | | 16,524,508 | |
| | 77,000 | | | | | Colgate-Palmolive Company~ | | | 5,547,080 | |
| | 18,393 | | | | | Constellation Brands, Inc. - Class A | | | 3,173,528 | |
| | 44,182 | | | | | Costco Wholesale Corp.~ | | | 7,843,189 | |
| | | | |
| 110 | | CALAMOS OPEN-END FAMILY OF FUNDS SEMIANNUAL REPORT | | See accompanying Notes to Schedule of Investments |
Market Neutral Income Fund Schedule of Investments April 30, 2017 (Unaudited)
| | | | | | | | | | |
NUMBER OF
SHARES | | | | | | | VALUE | |
| | 140,311 | | | | | CVS Health Corp.~ | | $ | 11,567,239 | |
| | 65,970 | | | | | General Mills, Inc. | | | 3,793,935 | |
| | 35,742 | | | | | Kellogg Company~ | | | 2,537,682 | |
| | 32,986 | | | | | Kimberly-Clark Corp. | | | 4,279,934 | |
| | 64,167 | | | | | Kraft Heinz Company | | | 5,800,055 | |
| | 122,703 | | | | | Kroger Company | | | 3,638,144 | |
| | 30,817 | | | | | Mead Johnson Nutrition Company~ | | | 2,734,084 | |
| | 170,636 | | | | | Mondelez International, Inc. - Class A | | | 7,683,739 | |
| | 60,159 | | | | | Monster Beverage Corp.# | | | 2,730,015 | |
| | 204,446 | | | | | PepsiCo, Inc.~ | | | 23,159,643 | |
| | 167,825 | | | | | Philip Morris International, Inc.~ | | | 18,601,723 | |
| | 257,159 | | | | | Procter & Gamble Company | | | 22,457,695 | |
| | 36,480 | | | | | Reynolds American, Inc. | | | 2,352,960 | |
| | 141,559 | | | | | Wal-Mart Stores, Inc.~ | | | 10,642,406 | |
| | 86,375 | | | | | Walgreens Boots Alliance, Inc. | | | 7,474,893 | |
| | | | | | | | | | |
| | | | | | | | | 184,592,267 | |
| | | | | | | | | | |
| | | | | | Energy (3.3%) | |
| | 56,092 | | | | | Anadarko Petroleum Corp.~ | | | 3,198,366 | |
| | 49,481 | | | | | Apache Corp.~ | | | 2,406,756 | |
| | 49,529 | | | | | Baker Hughes, Inc.~ | | | 2,940,537 | |
| | 211,799 | | | | | Chevron Corp.~ | | | 22,598,953 | |
| | 23,281 | | | | | Cimarex Energy Company | | | 2,716,427 | |
| | 23,139 | | | | | Concho Resources, Inc.~# | | | 2,930,786 | |
| | 126,526 | | | | | ConocoPhillips~ | | | 6,061,861 | |
| | 91,718 | | | | | Devon Energy Corp. | | | 3,621,944 | |
| | 75,489 | | | | | EOG Resources, Inc.~ | | | 6,982,732 | |
| | 556,856 | | | | | Exxon Mobil Corp.~ | | | 45,467,292 | |
| | 97,936 | | | | | Halliburton Company | | | 4,493,304 | |
| | 225,432 | | | | | Kinder Morgan, Inc. | | | 4,650,662 | |
| | 80,353 | | | | | Marathon Petroleum Corp. | | | 4,093,182 | |
| | 74,913 | | | | | National Oilwell Varco, Inc.~ | | | 2,619,708 | |
| | 71,488 | | | | | Noble Energy, Inc. | | | 2,311,207 | |
| | 82,514 | | | | | Occidental Petroleum Corp. | | | 5,077,912 | |
| | 35,155 | | | | | Phillips 66~ | | | 2,796,932 | |
| | 15,731 | | | | | Pioneer Natural Resources Company | | | 2,721,306 | |
| | 134,706 | | | | | Schlumberger, Ltd. | | | 9,778,308 | |
| | 47,392 | | | | | Southwestern Energy Company~# | | | 355,914 | |
| | 50,355 | | | | | Valero Energy Corp.~ | | | 3,253,436 | |
| | 90,391 | | | | | Williams Companies, Inc. | | | 2,768,676 | |
| | | | | | | | | | |
| | | | | | | | | 143,846,201 | |
| | | | | | | | | | |
| | | | | | Financials (6.5%) | |
| | 37,785 | | | | | Aflac, Inc.~ | | | 2,829,341 | |
| | 58,957 | | | | | Allstate Corp.~ | | | 4,792,615 | |
| | 140,844 | | | | | American Express Company~ | | | 11,161,887 | |
| | 97,291 | | | | | American International Group, Inc.~ | | | 5,925,995 | |
| | 101,550 | | | | | Arthur J. Gallagher & Company | | | 5,667,505 | |
| | 1,123,331 | | | | | Bank of America Corp.~ | | | 26,218,546 | |
| | | | | | | | | | |
NUMBER OF
SHARES | | | | | | | VALUE | |
| | 146,531 | | | | | Bank of New York Mellon Corp. | | $ | 6,895,749 | |
| | 93,545 | | | | | BB&T Corp.~ | | | 4,039,273 | |
| | 220,070 | | | | | Berkshire Hathaway, Inc. - Class B# | | | 36,357,765 | |
| | 13,173 | | | | | BlackRock, Inc.~ | | | 5,065,941 | |
| | 71,487 | | | | | Capital One Financial Corp.~ | | | 5,746,125 | |
| | 178,713 | | | | | Charles Schwab Corp.~ | | | 6,943,000 | |
| | 41,906 | | | | | Chubb Corp.~ | | | 5,751,598 | |
| | 289,278 | | | | | Citigroup, Inc.~ | | | 17,102,115 | |
| | 52,116 | | | | | Discover Financial Services | | | 3,261,940 | |
| | 7,923 | | | | | Equinix, Inc. | | | 3,309,437 | |
| | 134,685 | | | | | Fifth Third Bancorp~ | | | 3,290,355 | |
| | 33,263 | | | | | Goldman Sachs Group, Inc.~ | | | 7,444,259 | |
| | 45,985 | | | | | Hartford Financial Services Group, Inc.~ | | | 2,223,835 | |
| | 476,228 | | | | | JPMorgan Chase & Company~ | | | 41,431,836 | |
| | 139,056 | | | | | MetLife, Inc.~ | | | 7,204,491 | |
| | 204,341 | | | | | Morgan Stanley~ | | | 8,862,269 | |
| | 58,974 | | | | | PNC Financial Services Group, Inc.~ | | | 7,062,136 | |
| | 84,114 | | | | | Prudential Financial, Inc.~ | | | 9,002,721 | |
| | 248,210 | | | | | Regions Financial Corp.~ | | | 3,412,888 | |
| | 44,423 | | | | | State Street Corp.~ | | | 3,727,090 | |
| | 61,311 | | | | | SunTrust Banks, Inc.~ | | | 3,483,078 | |
| | 113,878 | | | | | Synchrony Financial | | | 3,165,808 | |
| | 28,389 | | | | | Travelers Companies, Inc.~ | | | 3,453,806 | |
| | 519,182 | | | | | Wells Fargo & Company~ | | | 27,952,759 | |
| | | | | | | | | | |
| | | | | | | | | 282,786,163 | |
| | | | | | | | | | |
| | | | | | Health Care (6.8%) | | | | |
| | 175,364 | | | | | Abbott Laboratories~ | | | 7,652,885 | |
| | 168,562 | | | | | AbbVie, Inc.~ | | | 11,114,978 | |
| | 60,763 | | | | | Aetna, Inc.~ | | | 8,207,258 | |
| | 27,129 | | | | | Alexion Pharmaceuticals, Inc.~# | | | 3,466,544 | |
| | 38,038 | | | | | Allergan, PLC~ | | | 9,275,947 | |
| | 78,031 | | | | | Amgen, Inc.~ | | | 12,744,023 | |
| | 41,361 | | | | | Anthem, Inc.~ | | | 7,357,708 | |
| | 63,584 | | | | | Baxter International, Inc. | | | 3,540,357 | |
| | 26,727 | | | | | Biogen, Inc.~# | | | 7,248,630 | |
| | 147,252 | | | | | Bristol-Myers Squibb Company~ | | | 8,253,475 | |
| | 33,995 | | | | | Cardinal Health, Inc. | | | 2,467,697 | |
| | 83,317 | | | | | Celgene Corp.# | | | 10,335,474 | |
| | 53,615 | | | | | Cerner Corp.~# | | | 3,471,571 | |
| | 40,696 | | | | | Cigna Corp. | | | 6,363,633 | |
| | 37,150 | | | | | DaVita, Inc.~# | | | 2,563,721 | |
| | 38,945 | | | | | Edwards Lifesciences Corp.~# | | | 4,271,098 | |
| | 91,017 | | | | | Eli Lilly and Company~ | | | 7,468,855 | |
| | 102,013 | | | | | Express Scripts Holding Company~# | | | 6,257,477 | |
| | 142,694 | | | | | Gilead Sciences, Inc. | | | 9,781,674 | |
| | 22,561 | | | | | IDEXX Laboratories, Inc.# | | | 3,784,157 | |
| | 23,125 | | | | | Illumina, Inc.# | | | 4,274,887 | |
| | | | | | |
| See accompanying Notes to Schedule of Investments | | www.calamos.com | | | 111 | |
Market Neutral Income Fund Schedule of Investments April 30, 2017 (Unaudited)
| | | | | | | | | | |
NUMBER OF
SHARES | | | | | | | VALUE | |
| | 21,442 | | | | | Incyte Corp.# | | $ | 2,664,812 | |
| | 308,864 | | | | | Johnson & Johnson~ | | | 38,135,438 | |
| | 28,141 | | | | | Laboratory Corp. of America Holdings~# | | | 3,943,961 | |
| | 23,423 | | | | | McKesson Corp. | | | 3,239,167 | |
| | 125,471 | | | | | Medtronic, PLC | | | 10,425,385 | |
| | 378,662 | | | | | Merck & Company, Inc. | | | 23,602,002 | |
| | 69,344 | | | | | Patterson Companies, Inc. | | | 3,085,115 | |
| | 713,624 | | | | | Pfizer, Inc.~ | | | 24,206,126 | |
| | 35,921 | | | | | Quest Diagnostics, Inc.~ | | | 3,790,025 | |
| | 7,807 | | | | | Regeneron Pharmaceuticals, Inc.~# | | | 3,032,941 | |
| | 45,956 | | | | | Stryker Corp.~ | | | 6,267,020 | |
| | 59,318 | | | | | Thermo Fisher Scientific, Inc.~ | | | 9,807,045 | |
| | 93,545 | | | | | UnitedHealth Group, Inc. | | | 16,359,150 | |
| | 37,032 | | | | | Varian Medical Systems, Inc.# | | | 3,360,284 | |
| | 27,954 | | | | | Vertex Pharmaceuticals, Inc.# | | | 3,306,958 | |
| | 28,144 | | | | | Zimmer Biomet Holdings, Inc. | | | 3,367,430 | |
| | | | | | | | | | |
| | | | | | | | | 298,494,908 | |
| | | | | | | | | | |
| | | | | | Industrials (4.9%) | | | | |
| | 49,985 | | | | | 3M Company | | | 9,788,563 | |
| | 80,418 | | | | | Allegion, PLC | | | 6,324,071 | |
| | 79,578 | | | | | Boeing Company~ | | | 14,708,402 | |
| | 67,094 | | | | | Caterpillar, Inc.~ | | | 6,861,032 | |
| | 102,122 | | | | | CSX Corp.~ | | | 5,191,882 | |
| | 22,515 | | | | | Cummins, Inc.~ | | | 3,398,414 | |
| | 65,969 | | | | | Danaher Corp. | | | 5,497,197 | |
| | 63,701 | | | | | Deere & Company | | | 7,109,669 | |
| | 153,998 | | | | | Delta Air Lines, Inc.~ | | | 6,997,669 | |
| | 45,240 | | | | | Eaton Corp., PLC | | | 3,421,954 | |
| | 65,970 | | | | | Emerson Electric Company~ | | | 3,976,672 | |
| | 38,499 | | | | | FedEx Corp. | | | 7,303,260 | |
| | 54,918 | | | | | Fluor Corp. | | | 2,818,392 | |
| | 80,842 | | | | | Fortune Brands Home & Security, Inc. | | | 5,152,869 | |
| | 33,284 | | | | | General Dynamics Corp. | | | 6,450,106 | |
| | 1,016,846 | | | | | General Electric Company~ | | | 29,478,366 | |
| | 119,023 | | | | | Honeywell International, Inc. | | | 15,608,676 | |
| | 44,015 | | | | | Illinois Tool Works, Inc.~ | | | 6,078,031 | |
| | 54,143 | | | | | Jacobs Engineering Group, Inc.~ | | | 2,973,534 | |
| | 21,546 | | | | | Lockheed Martin Corp. | | | 5,805,570 | |
| | 144,656 | | | | | Masco Corp.~ | | | 5,355,165 | |
| | 33,027 | | | | | Norfolk Southern Corp. | | | 3,880,342 | |
| | 77,750 | | | | | Pentair, PLC | | | 5,015,652 | |
| | 45,023 | | | | | Rockwell Collins, Inc. | | | 4,686,444 | |
| | 122,485 | | | | | Southwest Airlines Company~ | | | 6,886,107 | |
| | 14,129 | | | | | TransDigm Group, Inc. | | | 3,486,048 | |
| | 88,031 | | | | | Union Pacific Corp.~ | | | 9,855,951 | |
| | 44,026 | | | | | United Parcel Service, Inc. - Class B | | | 4,731,034 | |
| | 88,633 | | | | | United Technologies Corp.~ | | | 10,546,441 | |
| | | | | | | | | | |
NUMBER OF
SHARES | | | | | | | VALUE | |
| | 14,613 | | | | | WW Grainger, Inc. | | $ | 2,815,925 | |
| | 79,274 | | | | | Xylem, Inc. | | | 4,075,476 | |
| | | | | | | | | | |
| | | | | | | | | 216,278,914 | |
| | | | | | | | | | |
| | | | | | Information Technology (10.7%) | | | | |
| | 41,419 | | | | | Accenture, PLC - Class A~ | | | 5,024,125 | |
| | 68,711 | | | | | Activision Blizzard, Inc. | | | 3,590,150 | |
| | 118,028 | | | | | Advanced Micro Devices, Inc.# | | | 1,569,772 | |
| | 40,876 | | | | | Akamai Technologies, Inc.~# | | | 2,490,983 | |
| | 9,967 | | | | | Alphabet, Inc. - Class A~# | | | 9,214,691 | |
| | 31,499 | | | | | Alphabet, Inc. - Class C~# | | | 28,536,834 | |
| | 57,565 | | | | | Amphenol Corp. - Class A~ | | | 4,162,525 | |
| | 497,715 | | | | | Apple, Inc.~ | | $ | 71,496,760 | |
| | 81,423 | | | | | Applied Materials, Inc.~ | | | 3,306,588 | |
| | 38,818 | | | | | Autodesk, Inc.# | | | 3,496,337 | |
| | 48,466 | | | | | Broadcom, Ltd. | | | 10,701,777 | |
| | 542,111 | | | | | Cisco Systems, Inc.~ | | | 18,469,722 | |
| | 77,102 | | | | | Cognizant Technology Solutions Corp. - Class A~# | | | 4,643,853 | |
| | 41,284 | | | | | DXC Technology Company# | | | 3,110,337 | |
| | 117,098 | | | | | eBay, Inc.# | | | 3,912,244 | |
| | 21,472 | | | | | F5 Networks, Inc.# | | | 2,772,679 | |
| | 271,822 | | | | | Facebook, Inc. - Class A~# | | | 40,841,256 | |
| | 61,368 | | | | | Fiserv, Inc.# | | | 7,311,384 | |
| | 77,902 | | | | | FLIR Systems, Inc. | | | 2,861,340 | |
| | 177,033 | | | | | Hewlett Packard Enterprise Company | | | 3,298,125 | |
| | 247,135 | | | | | HP, Inc. | | | 4,651,081 | |
| | 631,926 | | | | | Intel Corp.~ | | | 22,844,125 | |
| | 87,415 | | | | | International Business Machines Corp. | | | 14,011,750 | |
| | 90,834 | | | | | Juniper Networks, Inc.~ | | | 2,731,378 | |
| | 23,212 | | | | | Lam Research Corp. | | | 3,362,258 | |
| | 107,179 | | | | | MasterCard, Inc. - Class A | | | 12,467,061 | |
| | 51,207 | | | | | Microchip Technology, Inc. | | | 3,870,225 | |
| | 139,312 | | | | | Micron Technology, Inc.~# | | | 3,854,763 | |
| | 1,012,325 | | | | | Microsoft Corp.~ | | | 69,303,770 | |
| | 69,297 | | | | | NVIDIA Corp. | | | 7,227,677 | |
| | 322,488 | | | | | Oracle Corp. | | | 14,499,060 | |
| | 117,097 | | | | | PayPal Holdings, Inc.# | | | 5,587,869 | |
| | 186,047 | | | | | QUALCOMM, Inc. | | | 9,998,166 | |
| | 39,763 | | | | | Red Hat, Inc.~# | | | 3,502,325 | |
| | 67,209 | | | | | Salesforce.com, Inc.# | | | 5,788,039 | |
| | 15,984 | | | | | Skyworks Solutions, Inc. | | | 1,594,244 | |
| | 86,805 | | | | | Symantec Corp.~ | | | 2,745,642 | |
| | 56,650 | | | | | TE Connectivity, Ltd. | | | 4,383,011 | |
| | 53,989 | | | | | Texas Instruments, Inc.~ | | | 4,274,849 | |
| | 311,000 | | | | | Visa, Inc. - Class A~ | | | 28,369,420 | |
| | 44,980 | | | | | Western Digital Corp. | | | 4,006,369 | |
| | 41,106 | | | | | Xilinx, Inc. | | | 2,594,200 | |
| | | | |
| 112 | | CALAMOS OPEN-END FAMILY OF FUNDS SEMIANNUAL REPORT | | See accompanying Notes to Schedule of Investments |
Market Neutral Income Fund Schedule of Investments April 30, 2017 (Unaudited)
| | | | | | | | | | |
NUMBER OF
SHARES | | | | | | | VALUE | |
| | 79,146 | | | | | Yahoo!, Inc.# | | $ | 3,815,629 | |
| | | | | | | | | | |
| | | | | | | | | 466,294,393 | |
| | | | | | | | | | |
| | | | | | Materials (1.2%) | | | | |
| | 28,596 | | | | | Air Products & Chemicals, Inc.~ | | | 4,017,738 | |
| | 31,279 | | | | | Avery Dennison Corp. | | | 2,602,726 | |
| | 52,344 | | | | | Ball Corp. | | | 4,024,730 | |
| | 102,390 | | | | | Dow Chemical Company~ | | | 6,430,092 | |
| | 100,622 | | | | | E.I. du Pont de Nemours and Company | | | 8,024,604 | |
| | 214,366 | | | | | Freeport-McMoRan, Inc.# | | | 2,733,167 | |
| | 55,045 | | | | | LyondellBasell Industries, NV - Class A | | | 4,665,614 | |
| | 52,895 | | | | | Monsanto Company | | | 6,168,086 | |
| | 77,001 | | | | | Mosaic Company~ | | | 2,073,637 | |
| | 76,656 | | | | | Newmont Mining Corp.~ | | | 2,591,739 | |
| | 35,130 | | | | | PPG Industries, Inc. | | | 3,858,679 | |
| | 38,499 | | | | | Praxair, Inc. | | | 4,811,605 | |
| | | | | | | | | | |
| | | | | | | | | 52,002,417 | |
| | | | | | | | | | |
| | | | | | Real Estate (1.4%) | | | | |
| | 36,262 | | | | | Alexandria Real Estate Equities, Inc. | | | 4,079,838 | |
| | 41,361 | | | | | American Tower Corp.~ | | | 5,209,004 | |
| | 75,993 | | | | | Apartment Investment & Management Company | | | 3,323,934 | |
| | 12,261 | | | | | AvalonBay Communities, Inc.~ | | | 2,327,628 | |
| | 33,906 | | | | | Crown Castle International Corp. | | | 3,207,507 | |
| | 32,720 | | | | | Digital Realty Trust, Inc. | | | 3,757,565 | |
| | 37,401 | | | | | Equity Residential | | | 2,415,356 | |
| | 34,926 | | | | | Federal Realty Investment Trust | | | 4,571,464 | |
| | 62,279 | | | | | Maceri ch Company | | | 3,888,078 | |
| | 56,166 | | | | | Prologis, Inc.~ | | | 3,055,992 | |
| | 15,165 | | | | | Public Storage~ | | | 3,175,248 | |
| | 41,144 | | | | | Realty Income Corp. | | | 2,400,752 | |
| | 45,139 | | | | | Simon Property Group, Inc. | | | 7,459,671 | |
| | 68,291 | | | | | UDR, Inc. | | | 2,549,986 | |
| | 18,474 | | | | | Vornado Realty Trust | | | 1,777,938 | |
| | 33,881 | | | | | Welltower, Inc. | | | 2,420,459 | |
| | 99,572 | | | | | Weyerhaeuser Company | | | 3,372,504 | |
| | | | | | | | | | |
| | | | | | | | | 58,992,924 | |
| | | | | | | | | | |
| | | | | | Telecommunication Services (1.2%) | | | | |
| | 759,702 | | | | | AT&T, Inc.~ | | | 30,106,990 | |
| | 103,449 | | | | | CenturyLink, Inc.~^ | | | 2,655,536 | |
| | 429,113 | | | | | Verizon Communications, Inc.~ | | | 19,700,578 | |
| | | | | | | | | | |
| | | | | | | | | 52,463,104 | |
| | | | | | | | | | |
| | | | | | Utilities (1.4%) | | | | |
| | 322,210 | | | | | AES Corp.~ | | | 3,644,195 | |
| | 69,342 | | | | | American Electric Power Company, Inc.~ | | | 4,703,468 | |
| | 56,166 | | | | | CMS Energy Corp.~ | | | 2,549,936 | |
| | 40,875 | | | | | Consolidated Edison, Inc. | | | 3,240,570 | |
| | 34,840 | | | | | Dominion Resources, Inc.~ | | | 2,697,661 | |
| | | | | | | | | | |
NUMBER OF
SHARES | | | | | | | VALUE | |
| | 137,557 | | | | | Duke Energy Corp.~ | | $ | 11,348,452 | |
| | 51,063 | | | | | Edison International | | | 4,083,508 | |
| | 71,488 | | | | | Exelon Corp.~ | | | 2,475,629 | |
| | 126,771 | | | | | FirstEnergy Corp.~ | | | 3,795,524 | |
| | 84,150 | | | | | NextEra Energy, Inc. | | | 11,239,074 | |
| | 169,370 | | | | | NiSource, Inc. | | | 4,107,223 | |
| | 61,311 | | | | | PG&E Corp. | | | 4,110,903 | |
| | 61,311 | | | | | Public Service Enterprise Group, Inc.~ | | | 2,700,750 | |
| | | | | | | | | | |
| | | | | | | | | 60,696,893 | |
| | | | | | | | | | |
| | | | | | TOTAL COMMON STOCKS
(Cost $1,767,617,387) | | | 2,093,490,338 | |
| | | | | | | | | | |
| | EXCHANGE-TRADED FUND (0.5%) | | | | |
| | | | | | Other (0.5%) | | | | |
| | 90,162 | | | | | SPDR S&P 500 ETF Trust
(Cost $ 20,958,113) | | | 21,465,769 | |
| | | | | | | | | | |
| | | | | | | | | | |
NUMBER OF
CONTRACTS/
NOTIONAL
AMOUNT | | | | | | | VALUE | |
| | PURCHASED OPTIONS (0.1%) # | | | | |
| | | | | | Consumer Discretionary (0.0%) | | | | |
| | | | | | Tesla Motors, Inc. | | | | |
| 3,734
373,400 |
| | | | Put, 01/19/18, Strike $20.00 | | | 7,468 | |
| 2,500
250,000 |
| | | | Put, 01/19/18, Strike $30.00 | | | 17,500 | |
| | | | | | | | | | |
| | | | | | | | | 24,968 | |
| | | | | | | | | | |
| | | | | | Financials (0.0%) | | | | |
| 1,000
100,000 |
| | | | Amtrust Financial Services, Inc.
Put, 09/15/17, Strike $10.00 | | | 65,000 | |
| | | | | | | | | | |
| | | | | | Other (0.1%) | | | | |
| | | | | | S&P 500 Index | | | | |
| 3,500
350,000 |
| | | | Put, 05/31/17, Strike $2,325.00 | | | 3,517,500 | |
| 1,000
100,000 |
| | | | Put, 06/30/17, Strike $2,310.00 | | | 1,875,000 | |
| | | | | | | | | | |
| | | | | | | | | 5,392,500 | |
| | | | | | | | | | |
| | | | | | TOTAL PURCHASED OPTIONS
(Cost $11,412,030) | | | 5,482,468 | |
| | | | | | | | | | |
NUMBER OF
SHARES | | | | | | | VALUE | |
| | SHORT TERM INVESTMENTS (0.6%) | |
| | 13,533,866 | | | | | Fidelity Prime Money Market Fund - Institutional Class | | | 13,539,279 | |
| | 13,518,059 | | | | | Morgan Stanley Institutional Liquidity Funds - Government Portfolio | | | 13,518,059 | |
| | | | | | | | | | |
| | | | | | TOTAL SHORT TERM INVESTMENTS
(Cost $27,057,338) | | | 27,057,338 | |
| | | | | | | | | | |
| | | | | | |
| See accompanying Notes to Schedule of Investments | | www.calamos.com | | | 113 | |
Market Neutral Income Fund Schedule of Investments April 30, 2017 (Unaudited)
| | | | | | | | | | |
NUMBER OF
SHARES/
PRINCIPAL
AMOUNT | | | | | | | VALUE | |
| INVESTMENT OF CASH COLLATERAL FOR SECURITIES
LOANED (0.3%) |
|
| | 9,255,561 | | | | | Deutsche Bank Securities, Inc.†
0.830%, 05/01/17 | | $ | 9,255,561 | |
| | 5,030,196 | | | | | Goldman Sachs Financial Square Government Fund | | | 5,030,196 | |
| | | | | | | | | | |
| | | | | | TOTAL INVESTMENT OF
CASH COLLATERAL FOR SECURITIES LOANED
(Cost $14,285,757) | | | 14,285,757 | |
| | | | | | | | | | |
| TOTAL INVESTMENTS (101.8%)
(Cost $3,923,366,944) | | | 4,448,223,995 | |
| | | | | | | | | | |
| |
| PAYABLE UPON RETURN OF SECURITIES ON
LOAN (-0.3%) | | | (14,285,757 | ) |
| | | | | | | | | | |
| |
| | LIABILITIES, LESS OTHER ASSETS (-1.5%) | | | (64,849,693 | ) |
| | | | | | | | | | |
| |
| | NET ASSETS (100.0%) | | $ | 4,369,088,545 | |
| | | | | | | | | | |
NUMBER OF
SHARES | | | | | | | VALUE | |
| | COMMON STOCKS SOLD SHORT (-31.8%) # | |
| | | | | | Consumer Discretionary (-5.9%) | |
| | (387,001 | ) | | | | CalAtlantic Group, Inc. | | | (14,017,176 | ) |
| | (16,500 | ) | | | | Charter Communications, Inc. | | | (5,695,140 | ) |
| | (716,500 | ) | | | | Ctrip.com International, Ltd. | | | (36,190,415 | ) |
| | (416,677 | ) | | | | DISH Network Corp. | | | (26,850,666 | ) |
| | (116,783 | ) | | | | Horizon Global Corp. | | | (1,645,472 | ) |
| | (95,500 | ) | | | | Liberty Media Corp./Liberty Formula One | | | (3,344,410 | ) |
| | (145,800 | ) | | | | Live Nation Entertainment, Inc. | | | (4,688,928 | ) |
| | (70,500 | ) | | | | M/I Homes, Inc. | | | (1,914,780 | ) |
| | (66,150 | ) | | | | Meritage Homes Corp. | | | (2,576,543 | ) |
| | (137,500 | ) | | EUR | | Moncler S.p.A | | | (3,391,439 | ) |
| | (30,110 | ) | | | | Priceline Group, Inc. | | | (55,607,750 | ) |
| | (10,000 | ) | | | | RH | | | (479,700 | ) |
| | (113,045 | ) | | | | Shutterfly, Inc. | | | (5,867,036 | ) |
| | (197,100 | ) | | | | TAL Education Group | | | (23,476,581 | ) |
| | (222,400 | ) | | | | Tesla Motors, Inc. | | | (69,849,168 | ) |
| | (191,000 | ) | | | | Vipshop Holdings, Ltd. | | | (2,649,170 | ) |
| | | | | | | | | | |
| | | | | | | | | (258,244,374 | ) |
| | | | | | | | | | |
| | | | | | Consumer Staples (-0.3%) | |
| | (96,200 | ) | | | | Herbalife, Ltd. | | | (6,085,612 | ) |
| | (68,456 | ) | | | | Post Holdings, Inc. | | | (5,763,311 | ) |
| | | | | | | | | | |
| | | | | | | | | (11,848,923 | ) |
| | | | | | | | | | |
| | | | | | Energy (-0.6%) | |
| | (1,189,000 | ) | | | | Chesapeake Energy Corp. | | | (6,254,140 | ) |
| | (95,000 | ) | | | | Golar LNG, Ltd. | | | (2,423,450 | ) |
| | | | | | | | | | |
NUMBER OF
SHARES | | | | | | | VALUE | |
| | (560,000 | ) | | | | Renewable Energy Group, Inc. | | $ | (5,852,000 | ) |
| | (10,550 | ) | | | | SEACOR Holdings, Inc. | | | (692,713 | ) |
| | (1,099,065 | ) | | | | Southwestern Energy Company | | | (8,253,978 | ) |
| | (67,000 | ) | | | | Whiting Petroleum Corp. | | | (556,100 | ) |
| | | | | | | | | | |
| | | | | | | | | (24,032,381 | ) |
| | | | | | | | | | |
| | | | | | Financials (-0.3%) | |
| | (120,400 | ) | | | | AmTrust Financial Services, Inc. | | | (1,932,420 | ) |
| | (89,475 | ) | | | | Cowen Group, Inc. | | | (1,422,653 | ) |
| | (60,000 | ) | | EUR | | Eurazeo, SA | | | (4,066,848 | ) |
| | (34,000 | ) | | | | Virtus Investment Partners, Inc. | | | (3,617,600 | ) |
| | | | | | | | | | |
| | | | | | | | | (11,039,521 | ) |
| | | | | | | | | | |
| | | | | | Health Care (-4.4%) | | | | |
| | (125,000 | ) | | | | Aceto Corp. | | | (1,981,250 | ) |
| | (83,100 | ) | | | | Allergan, PLC | | | (20,264,766 | ) |
| | (185,000 | ) | | | | Allscripts Healthcare Solutions, Inc. | | | (2,214,450 | ) |
| | (191,000 | ) | | | | AMAG Pharmaceuticals, Inc. | | | (4,660,400 | ) |
| | (169,000 | ) | | EUR | | Bayer, AG | | | (20,910,898 | ) |
| | (105,000 | ) | | | | BioMarin Pharmaceutical, Inc. | | | (10,063,200 | ) |
| | (201,000 | ) | | | | Depomed, Inc. | | | (2,409,990 | ) |
| | (170,000 | ) | | | | Emergent Biosolutions, Inc. | | | (5,084,700 | ) |
| | (140,000 | ) | | | | Flexion Therapeutics, Inc. | | | (2,857,400 | ) |
| | (260,000 | ) | | | | Horizon Pharma, PLC | | | (3,998,800 | ) |
| | (121,800 | ) | | | | Insulet Corp. | | | (5,287,338 | ) |
| | (17,050 | ) | | | | Intercept Pharmaceuticals, Inc. | | | (1,915,567 | ) |
| | (402,000 | ) | | | | Ironwood Pharmaceuticals, Inc. | | | (6,560,640 | ) |
| | (144,700 | ) | | | | Ligand Pharmaceuticals, Inc. | | | (16,086,299 | ) |
| | (427,000 | ) | | | | Medicines Company | | | (21,059,640 | ) |
| | (291,100 | ) | | | | Molina Healthcare, Inc. | | | (14,493,869 | ) |
| | (127,871 | ) | | | | Neurocrine Biosciences, Inc. | | | (6,828,311 | ) |
| | (177,952 | ) | | | | NuVasive, Inc. | | | (12,903,300 | ) |
| | (109,973 | ) | | | | Quidel Corp. | | | (2,658,047 | ) |
| | (176,600 | ) | | | | Spectranetics Corp. | | | (5,050,760 | ) |
| | (160,000 | ) | | | | Teligent, Inc. | | | (1,262,400 | ) |
| | (286,300 | ) | | | | Teva Pharmaceutical Industries, Ltd. | | | (9,041,354 | ) |
| | (535,717 | ) | | | | Wright Medical Group, NV | | | (16,280,440 | ) |
| | | | | | | | | | |
| | | | | | | | | (193,873,819 | ) |
| | | | | | | | | | |
| | | | | | Industrials (-0.9%) | |
| | (135,659 | ) | | | | Aerojet Rocketdyne Holdings, Inc. | | | (3,040,118 | ) |
| | (213,677 | ) | | | | Greenbrier Companies, Inc. | | | (9,284,266 | ) |
| | (40,450 | ) | | | | Navistar International Corp. | | | (1,088,509 | ) |
| | (535,000 | ) | | | | Rexnord Corp. | | | (13,054,000 | ) |
| | (255,000 | ) | | | | Trinity Industries, Inc. | | | (6,859,500 | ) |
| | (122,000 | ) | | | | Tutor Perini Corp. | | | (3,763,700 | ) |
| | | | | | | | | | |
| | | | | | | | | (37,090,093 | ) |
| | | | | | | | | | |
| | | | | | Information Technology (-17.1%) | |
| | (2,212,100 | ) | | | | Advanced Micro Devices, Inc. | | | (29,420,930 | ) |
| | (510,000 | ) | | | | Alibaba Group Holding, Ltd. | | | (58,905,000 | ) |
| | | | |
| 114 | | CALAMOS OPEN-END FAMILY OF FUNDS SEMIANNUAL REPORT | | See accompanying Notes to Schedule of Investments |
Market Neutral Income Fund Schedule of Investments April 30, 2017 (Unaudited)
| | | | | | | | | | |
NUMBER OF
SHARES | | | | | | | VALUE | |
| | (75,000 | ) | | | | Belden, Inc. | | $ | (5,227,500 | ) |
| | (104,000 | ) | | | | Blackhawk Network Holdings, Inc. | | | (4,206,800 | ) |
| | (117,500 | ) | | | | Bottomline Technologies, Inc. | | | (2,737,750 | ) |
| | (45,076 | ) | | | | Brocade Communications Systems, Inc. | | | (566,605 | ) |
| | (50,000 | ) | | | | CalAmp Corp. | | | (897,000 | ) |
| | (103,999 | ) | | | | Cardtronics, PLC | | | (4,324,279 | ) |
| | (662,400 | ) | | | | Ciena Corp. | | | (15,175,584 | ) |
| | (83,866 | ) | | | | Citrix Systems, Inc. | | | (6,788,114 | ) |
| | (59,400 | ) | | | | Cornerstone OnDemand, Inc. | | | (2,333,232 | ) |
| | (95,000 | ) | | | | CSG Systems International, Inc. | | | (3,563,450 | ) |
| | (250,000 | ) | | | | Cypress Semiconductor Corp. | | | (3,502,500 | ) |
| | (130,000 | ) | | | | Electronics For Imaging, Inc. | | | (5,951,400 | ) |
| | (40,900 | ) | | | | Envestnet, Inc. | | | (1,423,320 | ) |
| | (43,700 | ) | | | | Euronet Worldwide, Inc. | | | (3,610,494 | ) |
| | (262,600 | ) | | | | Finisar Corp. | | | (5,997,784 | ) |
| | (39,000 | ) | | | | FireEye, Inc. | | | (487,890 | ) |
| | (341,750 | ) | | | | Infinera Corp. | | | (3,390,160 | ) |
| | (144,100 | ) | | | | Inphi Corp. | | | (5,968,622 | ) |
| | (164,699 | ) | | | | Integrated Device Technology, Inc. | | | (3,951,129 | ) |
| | (1,205,500 | ) | | | | Intel Corp. | | | (43,578,825 | ) |
| | (170,000 | ) | | | | Lumentum Holdings, Inc. | | | (7,267,500 | ) |
| | (77,700 | ) | | | | MercadoLibre, Inc. | | | (17,786,307 | ) |
| | (723,000 | ) | | | | Microchip Technology, Inc. | | | (54,644,340 | ) |
| | (1,769,800 | ) | | | | Micron Technology, Inc. | | | (48,970,366 | ) |
| | (190,500 | ) | | | | MTS Systems Corp. | | | (8,848,725 | ) |
| | (40,000 | ) | | | | Nice, Ltd. | | | (2,698,000 | ) |
| | (339,700 | ) | | | | Nuance Communications, Inc. | | | (6,077,233 | ) |
| | (1,236,600 | ) | | | | NVIDIA Corp. | | | (128,977,380 | ) |
| | (48,773 | ) | | | | NXP Semiconductors, NV | | | (5,157,745 | ) |
| | (605,000 | ) | | | | ON Semiconductor Corp. | | | (8,578,900 | ) |
| | (54,800 | ) | | | | OSI Systems, Inc. | | | (4,241,520 | ) |
| | (72,100 | ) | | | | Palo Alto Networks, Inc. | | | (7,816,361 | ) |
| | (300,000 | ) | | | | Pandora Media, Inc. | | | (3,255,000 | ) |
| | (372,300 | ) | | | | Proofpoint, Inc. | | | (28,060,251 | ) |
| | (599,000 | ) | | | | Rambus, Inc. | | | (7,499,480 | ) |
| | (334,700 | ) | | | | Salesforce.com, Inc. | | | (28,824,364 | ) |
| | (216,000 | ) | | | | ServiceNow, Inc. | | | (20,407,680 | ) |
| | (94,600 | ) | | | | Silicon Laboratories, Inc. | | | (6,730,790 | ) |
| | (15,000 | ) | | | | SINA Corp. | | | (1,152,150 | ) |
| | (417,200 | ) | | | | Square, Inc. | | | (7,609,728 | ) |
| | (455,500 | ) | | | | Take-Two Interactive Software, Inc. | | | (28,628,175 | ) |
| | (127,300 | ) | | | | Teradyne, Inc. | | | (4,489,871 | ) |
| | (130,000 | ) | | | | TiVo Corp. | | | (2,567,500 | ) |
| | (951,000 | ) | | | | TTM Technologies, Inc. | | | (15,910,230 | ) |
| | (130,000 | ) | | | | Veeco Instruments, Inc. | | | (4,290,000 | ) |
| | (619,600 | ) | | | | Viavi Solutions, Inc. | | | (6,196,000 | ) |
| | (55,978 | ) | | | | WebMD Health Corp. | | | (3,035,687 | ) |
| | | | | | | | | | |
NUMBER OF
SHARES | | | | | | | VALUE | |
| | (211,700 | ) | | | | Workday, Inc. - Class A | | $ | (18,502,580 | ) |
| | (692,990 | ) | | | | Xilinx, Inc. | | | (43,734,599 | ) |
| | (43,000 | ) | | | | Yahoo!, Inc. | | | (2,073,030 | ) |
| | (53,300 | ) | | | | Zillow Group, Inc. - Class C | | | (2,078,700 | ) |
| | | | | | | | | | |
| | | | | | | | | (748,118,560 | ) |
| | | | | | | | | | |
| | | | | | Materials (-0.8%) | |
| | (602,000 | ) | | | | Allegheny Technologies, Inc. | | | (11,046,700 | ) |
| | (191,615 | ) | | | | Arconic, Inc. | | | (5,236,838 | ) |
| | (378,000 | ) | | | | B2Gold Corp. | | | (960,120 | ) |
| | (1,224,691 | ) | | | | Cemex, SAB de CV | | | (11,291,651 | ) |
| | (125,500 | ) | | | | Pretium Resources, Inc. | | | (1,243,705 | ) |
| | (340,000 | ) | | | | TimkenSteel Corp. | | | (5,127,200 | ) |
| | | | | | | | | | |
| | | | | | | | | (34,906,214 | ) |
| | | | | | | | | | |
| | | | | | Real Estate (-1.1%) | |
| | (175,000 | ) | | | | American Homes 4 Rent | | | (4,033,750 | ) |
| | (115,000 | ) | | | | American Tower Corp. | | | (14,483,100 | ) |
| | (218,500 | ) | | | | Colony Starwood Homes | | | (7,553,545 | ) |
| | (30,000 | ) | | | | Extra Space Storage, LP | | | (2,265,900 | ) |
| | (99,200 | ) | | | | Forestar Group, Inc. | | | (1,403,680 | ) |
| | (181,500 | ) | | | | SL Green Realty Corp. | | | (19,044,795 | ) |
| | (40,000 | ) | | | | Starwood Property Trust, Inc. | | | (907,600 | ) |
| | | | | | | | | | |
| | | | | | | | | (49,692,370 | ) |
| | | | | | | | | | |
| | | | | | Telecommunication Services (-0.1%) | |
| | (2,345,000 | ) | | | | Frontier Communications Corp. | | | (4,408,600 | ) |
| | (306,000 | ) | | EUR | | Koninklijke KPN, NV | | | (884,652 | ) |
| | | | | | | | | | |
| | | | | | | | | (5,293,252 | ) |
| | | | | | | | | | |
| | | | | | Utilities (-0.3%) | |
| | (30,000 | ) | | | | Dominion Resources, Inc. | | | (2,322,900 | ) |
| | (42,000 | ) | | | | DTE Energy Company | | | (4,392,780 | ) |
| | (240,000 | ) | | | | Dynegy, Inc. | | | (1,540,800 | ) |
| | (39,000 | ) | | | | NextEra Energy, Inc. | | | (5,208,840 | ) |
| | | | | | | | | | |
| | | | | | | | | (13,465,320 | ) |
| | | | | | | | | | |
| | | | | | TOTAL COMMON STOCKS
SOLD SHORT
(Proceeds $1,084,666,680) | | | (1,387,604,827 | ) |
| | | | | | | | | | |
| | | | | | | | | | |
NUMBER OF
CONTRACTS/
NOTIONAL
AMOUNT | | | | | | | VALUE | |
| | WRITTEN OPTIONS (-2.3%) # | |
| | | | | | Energy (0.0%) | |
| | | | | | Chesapeake Energy Corp. | | | | |
| 3,000
300,000 |
| | | | Call, 01/19/18, Strike $7.00 | | | (151,500 | ) |
| 2,000
200,000 |
| | | | Call, 01/18/19, Strike $10.00 | | | (104,000 | ) |
| 3,000
300,000 |
| | | | Oasis Petroleum, Inc.
Call, 01/19/18, Strike $12.00 | | | (652,500 | ) |
| | | | | | |
| See accompanying Notes to Schedule of Investments | | www.calamos.com | | | 115 | |
Market Neutral Income Fund Schedule of Investments April 30, 2017 (Unaudited)
| | | | | | | | | | |
NUMBER OF
CONTRACTS/
NOTIONAL
AMOUNT | | | | | | | VALUE | |
| 3,200
320,000 |
| | | | Southwestern Energy Company
Call, 06/16/17, Strike $12.00 | | $ | (9,600 | ) |
| | | | | | | | | | |
| | | | | | | | | (917,600 | ) |
| | | | | | | | | | |
| | | | | | Health Care (0.0%) | |
| 600
60,000 |
| | | | Allergan, PLC
Call, 01/19/18, Strike $350.00 | | | (25,800 | ) |
| 1,250
125,000 |
| | | | Evolent Health, Inc.
Call, 06/16/17, Strike $17.50 | | | (706,250 | ) |
| | | | | | | | | | |
| | | | | | | | | (732,050 | ) |
| | | | | | | | | | |
| | | | | | Information Technology (-0.1%) | | | | |
| | | | | | Advanced Micro Devices, Inc. | | | | |
| 3,453
345,300 |
| | | | Put, 01/18/19, Strike $10.00 | | | (704,412 | ) |
| 2,000
200,000 |
| | | | Call, 01/18/19, Strike $7.00 | | | (1,490,000 | ) |
| | | | | | | | | | |
| | | | | | | | | (2,194,412 | ) |
| | | | | | | | | | |
| | | | | | Other (-2.2%) | | | | |
| | | | | | S&P 500 Index | | | | |
| 2,500
250,000 |
| | | | Call, 06/30/17, Strike $2,410.00 | | | (5,437,500 | ) |
| 2,000
200,000 |
| | | | Call, 12/15/17, Strike $2,300.00 | | | (28,570,000 | ) |
| 2,000
200,000 |
| | | | Call, 12/15/17, Strike $2,200.00 | | | (43,890,000 | ) |
| 1,500
150,000 |
| | | | Call, 05/05/17, Strike $2,355.00 | | | (4,702,500 | ) |
| 1,300
130,000 |
| | | | Call, 12/15/17, Strike $2,375.00 | | | (12,122,500 | ) |
| | | | | | | | | | |
| | | | | | | | | (94,722,500 | ) |
| | | | | | | | | | |
| | | | | | TOTAL WRITTEN OPTIONS
(Premium $65,747,463) | | $ | (98,566,562 | ) |
| | | | | | | | | | |
FORWARD FOREIGN CURRENCY CONTRACTS
| | | | | | | | | | | | | | | | |
| COUNTERPARTY | | SHORT CONTRACTS | | SETTLEMENT DATE | | LOCAL CURRENCY | | | CURRENT
VALUE | | | UNREALIZED
GAIN/LOSS | |
JPMorgan Chase
Bank, N.A. | | European Monetary Unit | | 07/27/17 | | | 48,424,000 | | | $ | 52,978,208 | | | $ | (77,114 | ) |
| | | | | | | | | | | | | | | | |
| | | | | | | | | | | | | | $ | (77,114 | ) |
| | | | | | | | | | | | | | | | |
NOTES TO SCHEDULE OF INVESTMENTS
| * | Securities issued and sold pursuant to a Rule 144A transaction are excepted from the registration requirement of the Securities Act of 1933, as amended. These securities may only be sold to qualified institutional buyers (“QIBs”), such as the Fund. Any resale of these securities must generally be effected through a sale that is registered under the Act or otherwise exempted from such registration requirements. |
| ~ | Security, or portion of security, is segregated as collateral (or potential collateral for future transactions) for written options and securities sold short. The aggregate value of such securities is $912,110,028. |
| ^ | Security, or portion of security, is on loan. |
| @ | In default status and considered non-income producing. |
| ¤ | The synthetic convertible securities strategy combines separate securities that together possess the economic characteristics similar to a convertible security. |
| # | Non-income producing security. |
| § | Securities exchangeable or convertible into securities of one or more entities that are different than the issuer. Each entity is identified in the parenthetical. |
| † | Repurchase agreement collateralized by the following security: 9,440,283 United States Treasury Note, 3.625%, 02/15/20. |
FOREIGN CURRENCY ABBREVIATION
| | |
| EUR | | European Monetary Unit |
Note: Value for securities denominated in foreign currencies is shown in U.S. dollars. The principal amount for such securities is shown in the respective foreign currency. The date on options represents the expiration date of the option contract. The option contract may be exercised at any date on or before the date shown.
| | | | |
| 116 | | CALAMOS OPEN-END FAMILY OF FUNDS SEMIANNUAL REPORT | | See accompanying Notes to Financial Statements |
Hedged Equity Income Fund Schedule of Investments April 30, 2017 (Unaudited)
| | | | | | | | | | |
NUMBER OF
SHARES | | | | | | | VALUE | |
| | COMMON STOCKS (100.3%) | |
| | | | | | Consumer Discretionary (13.1%) | |
| | 178 | | | | | Amazon.com, Inc.# | | $ | 164,648 | |
| | 378 | | | | | CarMax, Inc.# | | | 22,113 | |
| | 489 | | | | | Carnival Corp. | | | 30,205 | |
| | 105 | | | | | Charter Communications, Inc.# | | | 36,242 | |
| | 41 | | | | | Chipotle Mexican Grill, Inc.# | | | 19,453 | |
| | 737 | | | | | Coach, Inc.~ | | | 29,030 | |
| | 4,501 | | | | | Comcast Corp. - Class A~ | | | 176,394 | |
| | 849 | | | | | D.R. Horton, Inc. | | | 27,924 | |
| | 281 | | | | | Darden Restaurants, Inc. | | | 23,938 | |
| | 540 | | | | | Delphi Automotive, PLC | | | 43,416 | |
| | 318 | | | | | Dollar General Corp. | | | 23,122 | |
| | 314 | | | | | Foot Locker, Inc. | | | 24,285 | |
| | 3,155 | | | | | Ford Motor Company~ | | | 36,188 | |
| | 375 | | | | | Garmin, Ltd. | | | 19,065 | |
| | 2,103 | | | | | General Motors Company, Inc. | | | 72,848 | |
| | 1,734 | | | | | Home Depot, Inc.~ | | | 270,677 | |
| | 749 | | | | | Johnson Controls International plc | | | 31,136 | |
| | 699 | | | | | LKQ Corp.# | | | 21,837 | |
| | 720 | | | | | Lowe’s Companies, Inc.~ | | | 61,114 | |
| | 638 | | | | | Macy’s, Inc. | | | 18,642 | |
| | 675 | | | | | McDonald’s Corp.~ | | | 94,453 | |
| | 134 | | | | | Mohawk Industries, Inc.# | | | 31,462 | |
| | 421 | | | | | Netflix, Inc.# | | | 64,076 | |
| | 1,211 | | | | | Nike, Inc. - Class B | | | 67,101 | |
| | 39 | | | | | Priceline Group, Inc.# | | | 72,026 | |
| | 201 | | | | | PVH Corp. | | | 20,307 | |
| | 345 | | | | | Ross Stores, Inc. | | | 22,425 | |
| | 283 | | | | | Royal Caribbean Cruises, Ltd. | | | 30,168 | |
| | 882 | | | | | Starbucks Corp. | | | 52,973 | |
| | 600 | | | | | Target Corp. | | | 33,510 | |
| | 552 | | | | | Time Warner, Inc. | | | 54,797 | |
| | 304 | | | | | TJX Companies, Inc. | | | 23,907 | |
| | 1,552 | | | | | Twenty-First Century Fox, Inc. | | | 47,398 | |
| | 87 | | | | | Ulta Salon Cosmetics & Fragrance, Inc.# | | | 24,485 | |
| | 1,555 | | | | | Walt Disney Company~ | | | 179,758 | |
| | 117 | | | | | Whirlpool Corp. | | | 21,725 | |
| | | | | | | | | | |
| | | | | | | | | 1,992,848 | |
| | | | | | | | | | |
| | | | | | Consumer Staples (8.9%) | |
| | 1,608 | | | | | Altria Group, Inc. | | | 115,422 | |
| | 457 | | | | | Archer-Daniels-Midland Company~ | | | 20,908 | |
| | 496 | | | | | Church & Dwight Company, Inc. | | | 24,567 | |
| | 2,795 | | | | | Coca-Cola Company~ | | | 120,604 | |
| | 560 | | | | | Colgate-Palmolive Company | | | 40,342 | |
| | 133 | | | | | Constellation Brands, Inc. - Class A | | | 22,948 | |
| | 332 | | | | | Costco Wholesale Corp. | | | 58,937 | |
| | | | | | | | | | |
NUMBER OF
SHARES | | | | | | | VALUE | |
| | 1,023 | | | | | CVS Health Corp. | | $ | 84,336 | |
| | 480 | | | | | General Mills, Inc. | | | 27,605 | |
| | 260 | | | | | Kellogg Company | | | 18,460 | |
| | 242 | | | | | Kimberly-Clark Corp. | | | 31,399 | |
| | 468 | | | | | Kraft Heinz Company | | | 42,303 | |
| | 895 | | | | | Kroger Company | | | 26,537 | |
| | 222 | | | | | Mead Johnson Nutrition Company | | | 19,696 | |
| | 1,239 | | | | | Mondelez International, Inc. - Class A | | | 55,792 | |
| | 436 | | | | | Monster Beverage Corp.# | | | 19,786 | |
| | 1,493 | | | | | PepsiCo, Inc.~ | | | 169,127 | |
| | 1,226 | | | | | Philip Morris International, Inc.~ | | | 135,890 | |
| | 1,877 | | | | | Procter & Gamble Company | | | 163,918 | |
| | 264 | | | | | Reynolds American, Inc. | | | 17,028 | |
| | 1,033 | | | | | Wal-Mart Stores, Inc.~ | | | 77,661 | |
| | 632 | | | | | Walgreens Boots Alliance, Inc. | | | 54,693 | |
| | | | | | | | | | |
| | | | | | | | | 1,347,959 | |
| | | | | | | | | | |
| | | | | | Energy (6.8%) | |
| | 409 | | | | | Anadarko Petroleum Corp. | | | 23,321 | |
| | 362 | | | | | Apache Corp. | | | 17,608 | |
| | 361 | | | | | Baker Hughes, Inc. | | | 21,433 | |
| | 1,546 | | | | | Chevron Corp.~ | | | 164,958 | |
| | 165 | | | | | Cimarex Energy Company | | | 19,252 | |
| | 164 | | | | | Concho Resources, Inc.# | | | 20,772 | |
| | 923 | | | | | ConocoPhillips | | | 44,221 | |
| | 670 | | | | | Devon Energy Corp. | | | 26,458 | |
| | 551 | | | | | EOG Resources, Inc. | | | 50,968 | |
| | 4,105 | | | | | Exxon Mobil Corp.~ | | | 335,173 | |
| | 713 | | | | | Halliburton Company | | | 32,712 | |
| | 1,165 | | | | | Kinder Morgan, Inc. | | | 24,034 | |
| | 585 | | | | | Marathon Petroleum Corp. | | | 29,800 | |
| | 532 | | | | | National Oilwell Varco, Inc. | | | 18,604 | |
| | 518 | | | | | Noble Energy, Inc. | | | 16,747 | |
| | 601 | | | | | Occidental Petroleum Corp. | | | 36,986 | |
| | 254 | | | | | Phillips 66 | | | 20,208 | |
| | 112 | | | | | Pioneer Natural Resources Company | | | 19,375 | |
| | 985 | | | | | Schlumberger, Ltd. | | | 71,501 | |
| | 360 | | | | | Valero Energy Corp. | | | 23,260 | |
| | 671 | | | | | Williams Companies, Inc. | | | 20,553 | |
| | | | | | | | | | |
| | | | | | | | | 1,037,944 | |
| | | | | | | | | | |
| | | | | | Financials (13.5%) | |
| | 243 | | | | | Aflac, Inc. | | | 18,196 | |
| | 375 | | | | | Allstate Corp. | | | 30,484 | |
| | 1,033 | | | | | American Express Company | | | 81,865 | |
| | 688 | | | | | American International Group, Inc. | | | 41,906 | |
| | 737 | | | | | Arthur J. Gallagher & Company | | | 41,132 | |
| | 8,342 | | | | | Bank of America Corp.~ | | | 194,702 | |
| | 1,069 | | | | | Bank of New York Mellon Corp.~ | | | 50,307 | |
| | 680 | | | | | BB&T Corp. | | | 29,362 | |
| | | | | | |
| See accompanying Notes to Schedule of Investments | | www.calamos.com | | | 117 | |
Hedged Equity Income Fund Schedule of Investments April 30, 2017 (Unaudited)
| | | | | | | | | | |
NUMBER OF
SHARES | | | | | | | VALUE | |
| | 1,604 | | | | | Berkshire Hathaway, Inc. - Class B#~ | | $ | 264,997 | |
| | 95 | | | | | BlackRock, Inc. | | | 36,534 | |
| | 518 | | | | | Capital One Financial Corp. | | | 41,637 | |
| | 1,303 | | | | | Charles Schwab Corp. | | | 50,621 | |
| | 307 | | | | | Chubb Corp. | | | 42,136 | |
| | 2,115 | | | | | Citigroup, Inc.~ | | | 125,039 | |
| | 376 | | | | | Discover Financial Services | | | 23,534 | |
| | 56 | | | | | Equinix, Inc. | | | 23,391 | |
| | 982 | | | | | Fifth Third Bancorp | | | 23,990 | |
| | 242 | | | | | Goldman Sachs Group, Inc. | | | 54,160 | |
| | 335 | | | | | Hartford Financial Services Group, Inc. | | | 16,201 | |
| | 3,464 | | | | | JPMorgan Chase & Company~ | | | 301,368 | |
| | 1,017 | | | | | MetLife, Inc. | | | 52,691 | |
| | 1,472 | | | | | Morgan Stanley | | | 63,841 | |
| | 424 | | | | | PNC Financial Services Group, Inc. | | | 50,774 | |
| | 612 | | | | | Prudential Financial, Inc. | | | 65,502 | |
| | 1,808 | | | | | Regions Financial Corp. | | | 24,860 | |
| | 324 | | | | | State Street Corp. | | | 27,184 | |
| | 444 | | | | | SunTrust Banks, Inc. | | | 25,224 | |
| | 909 | | | | | Synchrony Financial | | | 25,270 | |
| | 205 | | | | | Travelers Companies, Inc. | | | 24,940 | |
| | 3,803 | | | | | Wells Fargo & Company~ | | | 204,753 | |
| | | | | | | | | | |
| | | | | | | | | 2,056,601 | |
| | | | | | | | | | |
| | | | | | Health Care (14.3%) | |
| | 1,279 | | | | | Abbott Laboratories | | | 55,816 | |
| | 1,229 | | | | | AbbVie, Inc. | | | 81,040 | |
| | 440 | | | | | Aetna, Inc. | | | 59,431 | |
| | 200 | | | | | Alexion Pharmaceuticals, Inc.# | | | 25,556 | |
| | 281 | | | | | Allergan, PLC | | | 68,525 | |
| | 566 | | | | | Amgen, Inc. | | | 92,439 | |
| | 298 | | | | | Anthem, Inc. | | | 53,011 | |
| | 461 | | | | | Baxter International, Inc. | | | 25,668 | |
| | 193 | | | | | Biogen, Inc.#~ | | | 52,343 | |
| | 1,063 | | | | | Bristol-Myers Squibb Company~ | | | 59,581 | |
| | 256 | | | | | Cardinal Health, Inc. | | | 18,583 | |
| | 597 | | | | | Celgene Corp.# | | | 74,058 | |
| | 388 | | | | | Cerner Corp.# | | | 25,123 | |
| | 299 | | | | | Cigna Corp. | | | 46,755 | |
| | 274 | | | | | DaVita, Inc.# | | | 18,909 | |
| | 280 | | | | | Edwards Lifesciences Corp.# | | | 30,708 | |
| | 664 | | | | | Eli Lilly and Company | | | 54,488 | |
| | 744 | | | | | Express Scripts Holding Company# | | | 45,637 | |
| | 1,042 | | | | | Gilead Sciences, Inc.~ | | | 71,429 | |
| | 162 | | | | | IDEXX Laboratories, Inc.# | | | 27,172 | |
| | 165 | | | | | Illumina, Inc.# | | | 30,502 | |
| | 155 | | | | | Incyte Corp.# | | | 19,263 | |
| | 2,256 | | | | | Johnson & Johnson~ | | | 278,548 | |
| | | | | | | | | | |
NUMBER OF
SHARES | | | | | | | VALUE | |
| | 205 | | | | | Laboratory Corp. of America Holdings# | | $ | 28,731 | |
| | 170 | | | | | McKesson Corp. | | | 23,509 | |
| | 859 | | | | | Medtronic, PLC | | | 71,374 | |
| | 2,766 | | | | | Merck & Company, Inc. | | | 172,405 | |
| | 493 | | | | | Patterson Companies, Inc. | | | 21,934 | |
| | 5,350 | | | | | Pfizer, Inc. | | | 181,472 | |
| | 263 | | | | | Quest Diagnostics, Inc. | | | 27,749 | |
| | 57 | | | | | Regeneron Pharmaceuticals, Inc.# | | | 22,144 | |
| | 333 | | | | | Stryker Corp. | | | 45,411 | |
| | 432 | | | | | Thermo Fisher Scientific, Inc.~ | | | 71,423 | |
| | 680 | | | | | UnitedHealth Group, Inc.~ | | | 118,918 | |
| | 263 | | | | | Varian Medical Systems, Inc.# | | | 23,865 | |
| | 203 | | | | | Vertex Pharmaceuticals, Inc.# | | | 24,015 | |
| | 205 | | | | | Zimmer Biomet Holdings, Inc. | | | 24,528 | |
| | | | | | | | | | |
| | | | | | | | | 2,172,063 | |
| | | | | | | | | | |
| | | | | | Industrials (10.4%) | |
| | 361 | | | | | 3M Company | | | 70,695 | |
| | 573 | | | | | Allegion, PLC | | | 45,061 | |
| | 578 | | | | | Boeing Company~ | | | 106,832 | |
| | 489 | | | | | Caterpillar, Inc. | | | 50,005 | |
| | 744 | | | | | CSX Corp. | | | 37,825 | |
| | 163 | | | | | Cummins, Inc. | | | 24,603 | |
| | 480 | | | | | Danaher Corp. | | | 39,998 | |
| | 467 | | | | | Deere & Company | | | 52,122 | |
| | 1,125 | | | | | Delta Air Lines, Inc. | | | 51,120 | |
| | 326 | | | | | Eaton Corp., PLC | | | 24,659 | |
| | 480 | | | | | Emerson Electric Company | | | 28,934 | |
| | 283 | | | | | FedEx Corp. | | | 53,685 | |
| | 400 | | | | | Fluor Corp. | | | 20,528 | |
| | 575 | | | | | Fortune Brands Home & Security, Inc. | | | 36,650 | |
| | 245 | | | | | General Dynamics Corp. | | | 47,479 | |
| | 7,490 | | | | | General Electric Company~ | | | 217,135 | |
| | 868 | | | | | Honeywell International, Inc.~ | | | 113,829 | |
| | 320 | | | | | Illinois Tool Works, Inc. | | | 44,189 | |
| | 400 | | | | | Jacobs Engineering Group, Inc. | | | 21,968 | |
| | 160 | | | | | Lockheed Martin Corp. | | | 43,112 | |
| | 1,050 | | | | | Masco Corp. | | | 38,871 | |
| | 248 | | | | | Norfolk Southern Corp. | | | 29,138 | |
| | 570 | | | | | Pentair, PLC | | | 36,771 | |
| | 327 | | | | | Rockwell Collins, Inc. | | | 34,037 | |
| | 897 | | | | | Southwest Airlines Company | | | 50,429 | |
| | 102 | | | | | TransDigm Group, Inc. | | | 25,166 | |
| | 642 | | | | | Union Pacific Corp. | | | 71,878 | |
| | 319 | | | | | United Parcel Service, Inc. - Class B | | | 34,280 | |
| | 648 | | | | | United Technologies Corp. | | | 77,106 | |
| | 107 | | | | | WW Grainger, Inc. | | | 20,619 | |
| | 563 | | | | | Xylem, Inc. | | | 28,944 | |
| | | | | | | | | | |
| | | | | | | | | 1,577,668 | |
| | | | | | | | | | |
| | | | |
| 118 | | CALAMOS OPEN-END FAMILY OF FUNDS SEMIANNUAL REPORT | | See accompanying Notes to Schedule of Investments |
Hedged Equity Income Fund Schedule of Investments April 30, 2017 (Unaudited)
| | | | | | | | | | |
NUMBER OF
SHARES | | | | | | | VALUE | |
| | | | | | Information Technology (22.5%) | |
| | 301 | | | | | Accenture, PLC - Class A | | $ | 36,511 | |
| | 499 | | | | | Activision Blizzard, Inc. | | | 26,073 | |
| | 857 | | | | | Advanced Micro Devices, Inc.# | | | 11,398 | |
| | 296 | | | | | Akamai Technologies, Inc.# | | | 18,038 | |
| | 85 | | | | | Alphabet, Inc. - Class A# | | | 78,584 | |
| | 228 | | | | | Alphabet, Inc. - Class C# | | | 206,559 | |
| | 418 | | | | | Amphenol Corp. - Class A | | | 30,226 | |
| | 3,616 | | | | | Apple, Inc. | | | 519,438 | |
| | 717 | | | | | Applied Materials, Inc. | | | 29,117 | |
| | 282 | | | | | Autodesk, Inc.# | | | 25,400 | |
| | 335 | | | | | Broadcom, Ltd. | | | 73,971 | |
| | 3,859 | | | | | Cisco Systems, Inc.~ | | | 131,476 | |
| | 563 | | | | | Cognizant Technology Solutions Corp. - Class A# | | | 33,910 | |
| | 271 | | | | | DXC Technology Company# | | | 20,417 | |
| | 852 | | | | | eBay, Inc.# | | | 28,465 | |
| | 156 | | | | | F5 Networks, Inc.# | | | 20,144 | |
| | 2,002 | | | | | Facebook, Inc. - Class A#~ | | | 300,801 | |
| | 446 | | | | | Fiserv, Inc.# | | | 53,136 | |
| | 565 | | | | | FLIR Systems, Inc. | | | 20,753 | |
| | 1,170 | | | | | Hewlett Packard Enterprise Company | | | 21,797 | |
| | 1,813 | | | | | HP, Inc.~ | | | 34,121 | |
| | 4,637 | | | | | Intel Corp.~ | | | 167,628 | |
| | 639 | | | | | International Business Machines Corp.~ | | | 102,425 | |
| | 658 | | | | | Juniper Networks, Inc. | | | 19,786 | |
| | 169 | | | | | Lam Research Corp. | | | 24,480 | |
| | 781 | | | | | MasterCard, Inc. - Class A~ | | | 90,846 | |
| | 371 | | | | | Microchip Technology, Inc. | | | 28,040 | |
| | 1,024 | | | | | Micron Technology, Inc.# | | | 28,334 | |
| | 7,525 | | | | | Microsoft Corp. | | | 515,162 | |
| | 490 | | | | | NVIDIA Corp. | | | 51,107 | |
| | 2,355 | | | | | Oracle Corp.~ | | | 105,881 | |
| | 852 | | | | | PayPal Holdings, Inc.# | | | 40,657 | |
| | 1,376 | | | | | QUALCOMM, Inc.~ | | | 73,946 | |
| | 295 | | | | | Red Hat, Inc.# | | | 25,984 | |
| | 483 | | | | | Salesforce.com, Inc.# | | | 41,596 | |
| | 138 | | | | | Skyworks Solutions, Inc. | | | 13,764 | |
| | 632 | | | | | Symantec Corp. | | | 19,990 | |
| | 417 | | | | | TE Connectivity, Ltd. | | | 32,263 | |
| | 457 | | | | | Texas Instruments, Inc. | | | 36,185 | |
| | 2,275 | | | | | Visa, Inc. - Class A | | | 207,526 | |
| | 337 | | | | | Western Digital Corp. | | | 30,017 | |
| | 298 | | | | | Xilinx, Inc. | | | 18,807 | |
| | 597 | | | | | Yahoo!, Inc.# | | | 28,781 | |
| | | | | | | | | | |
| | | | | | | | | 3,423,540 | |
| | | | | | | | | | |
| | | | | | | | | | |
NUMBER OF
SHARES | | | | | | | VALUE | |
| | | | | | Materials (2.5%) | |
| | 207 | | | | | Air Products & Chemicals, Inc. | | $ | 29,083 | |
| | 222 | | | | | Avery Dennison Corp. | | | 18,473 | |
| | 379 | | | | | Ball Corp. | | | 29,141 | |
| | 747 | | | | | Dow Chemical Company | | | 46,912 | |
| | 734 | | | | | E.I. du Pont de Nemours and Company | | | 58,536 | |
| | 1,548 | | | | | Freeport-McMoRan, Inc.# | | | 19,737 | |
| | 400 | | | | | LyondellBasell Industries, NV - Class A | | | 33,904 | |
| | 382 | | | | | Monsanto Company | | | 44,545 | |
| | 560 | | | | | Mosaic Company | | | 15,081 | |
| | 555 | | | | | Newmont Mining Corp. | | | 18,765 | |
| | 259 | | | | | PPG Industries, Inc. | | | 28,449 | |
| | 283 | | | | | Praxair, Inc. | | | 35,369 | |
| | | | | | | | | | |
| | | | | | | | | 377,995 | |
| | | | | | | | | | |
| | | | | | Real Estate (2.8%) | |
| | 264 | | | | | Alexandria Real Estate Equities, Inc. | | | 29,703 | |
| | 298 | | | | | American Tower Corp. | | | 37,530 | |
| | 541 | | | | | Apartment Investment & Management Company | | | 23,663 | |
| | 92 | | | | | AvalonBay Communities, Inc. | | | 17,465 | |
| | 249 | | | | | Crown Castle International Corp. | | | 23,555 | |
| | 234 | | | | | Digital Realty Trust, Inc. | | | 26,873 | |
| | 269 | | | | | Equity Residential | | | 17,372 | |
| | 246 | | | | | Federal Realty Investment Trust | | | 32,199 | |
| | 471 | | | | | Macerich Company | | | 29,404 | |
| | 405 | | | | | Prologis, Inc. | | | 22,036 | |
| | 114 | | | | | Public Storage | | | 23,869 | |
| | 293 | | | | | Realty Income Corp. | | | 17,097 | |
| | 331 | | | | | Simon Property Group, Inc. | | | 54,701 | |
| | 487 | | | | | UDR, Inc. | | | 18,185 | |
| | 139 | | | | | Vornado Realty Trust | | | 13,377 | |
| | 249 | | | | | Welltower, Inc. | | | 17,789 | |
| | 723 | | | | | Weyerhaeuser Company | | | 24,488 | |
| | | | | | | | | | |
| | | | | | | | | 429,306 | |
| | | | | | | | | | |
| | | | | | Telecommunication Services (2.6%) | |
| | 5,689 | | | | | AT&T, Inc. | | | 225,455 | |
| | 756 | | | | | CenturyLink, Inc. | | | 19,407 | |
| | 3,132 | | | | | Verizon Communications, Inc. | | | 143,790 | |
| | | | | | | | | | |
| | | | | | | | | 388,652 | |
| | | | | | | | | | |
| | | | | | Utilities (2.9%) | |
| | 2,343 | | | | | AES Corp. | | | 26,499 | |
| | 505 | | | | | American Electric Power Company, Inc. | | | 34,254 | |
| | 405 | | | | | CMS Energy Corp. | | | 18,387 | |
| | 297 | | | | | Consolidated Edison, Inc. | | | 23,546 | |
| | 252 | | | | | Dominion Resources, Inc. | | | 19,513 | |
| | 1,004 | | | | | Duke Energy Corp.~ | | | 82,830 | |
| | 372 | | | | | Edison International | | | 29,749 | |
| | | | | | |
| See accompanying Notes to Schedule of Investments | | www.calamos.com | | | 119 | |
Hedged Equity Income Fund Schedule of Investments April 30, 2017 (Unaudited)
| | | | | | | | | | |
NUMBER OF
SHARES | | | | | | | VALUE | |
| | 518 | | | | | Exelon Corp. | | $ | 17,938 | |
| | 924 | | | | | FirstEnergy Corp. | | | 27,665 | |
| | 612 | | | | | NextEra Energy, Inc.~ | | | 81,739 | |
| | 1,229 | | | | | NiSource, Inc. | | | 29,803 | |
| | 444 | | | | | PG&E Corp. | | | 29,770 | |
| | 445 | | | | | Public Service Enterprise Group, Inc. | | | 19,602 | |
| | | | | | | | | | |
| | | | | | | | | 441,295 | |
| | | | | | | | | | |
| | | | | | TOTAL COMMON STOCKS
(Cost $13,287,535) | | | 15,245,871 | |
| | | | | | | | | | |
| | EXCHANGE-TRADED FUND (1.0%) | |
| | | | | | Other (1.0%) | |
| | 663 | | | | | SPDR S&P 500 ETF Trust
(Cost $ 155,569) | | | 157,847 | |
| | | | | | | | | | |
NUMBER OF
CONTRACTS/
NOTIONAL
AMOUNT | | | | | | | VALUE | |
| | PURCHASED OPTIONS (0.7%) # | |
| | | | | | Information Technology (0.2%) | | | | |
| 2
200 |
| | | | Alphabet, Inc.
Call, 07/21/17, Strike $890.00 | | | 10,200 | |
| 14
1,400 |
| | | | Apple, Inc.
Call, 05/19/17, Strike $125.00 | | | 26,250 | |
| 1
100 |
| | | | Skyworks Solutions, Inc.
Call, 06/16/17, Strike $105.00 | | | 148 | |
| | | | | | | | | | |
| | | | | | | | | 36,598 | |
| | | | | | | | | | |
| | | | | | Consumer Discretionary (0.1%) | |
| 2
200 |
| | | | Amazon.com, Inc.
Call, 07/21/17, Strike $925.00 | | | 6,940 | |
| 3
300 |
| | | | Netflix, Inc.
Call, 05/19/17, Strike $155.00 | | | 690 | |
| | | | | | | | | | |
| | | | | | | | | 7,630 | |
| | | | | | | | | | |
| | | | | | Other (0.4%) | |
| | | | | | S&P 500 Index | | | | |
| 40
4,000 |
| | | | Call, 05/31/17, Strike $2,425.00 | | | 19,800 | |
| 25
2,500 |
| | | | Put, 05/31/17, Strike $2,325.00 | | | 25,125 | |
| 15
1,500 |
| | | | Call, 05/01/17, Strike $2,400.00 | | | 337 | |
| 8
800 |
| | | | Call, 05/19/17, Strike $2,450.00 | | | 380 | |
| 7
700 |
| | | | Call, 05/08/17, Strike $2,410.00 | | | 1,680 | |
| 7
700 |
| | | | Put, 06/30/17, Strike $2,310.00 | | | 13,125 | |
| | | | | | | | | | |
| | | | | | | | | 60,447 | |
| | | | | | | | | | |
| | | | | | TOTAL PURCHASED OPTIONS
(Cost $132,671) | | | 104,675 | |
| | | | | | | | | | |
| | | | | | | | | | |
NUMBER OF
SHARES | | | | | | | VALUE | |
| | SHORT TERM INVESTMENTS (0.3%) | |
| | 24,124 | | | | | Fidelity Prime Money Market Fund - Institutional Class | | $ | 24,134 | |
| | 24,008 | | | | | Morgan Stanley Institutional Liquidity Funds - Government Portfolio | | | 24,008 | |
| | | | | | | | | | |
| | | | | | TOTAL SHORT TERM
INVESTMENTS
(Cost $48,142) | | | 48,142 | |
| | | | | | | | | | |
| |
| TOTAL INVESTMENTS (102.3%)
(Cost $13,623,917) | | | 15,556,535 | |
| | | | | | | | | | |
| |
| | LIABILITIES, LESS OTHER ASSETS (-2.3%) | | | (347,957 | ) |
| | | | | | | | | | |
| |
| | NET ASSETS (100.0%) | | $ | 15,208,578 | |
| | | | | | | | | | |
NUMBER OF
CONTRACTS/
NOTIONAL
AMOUNT | | | | | | | VALUE | |
| | WRITTEN OPTIONS (-4.2%) # | |
| | | | | | Other (-4.2%) | |
| | | | | | S&P 500 Index | | | | |
| 18
1,800 |
| | | | Call, 06/30/17, Strike $2,410.00 | | $ | (39,150 | ) |
| 14
1,400 |
| | | | Call, 12/15/17, Strike $2,300.00 | | | (199,990 | ) |
| 14
1,400 |
| | | | Call, 12/15/17, Strike $2,200.00 | | | (307,230 | ) |
| 9
900 |
| | | | Call, 12/15/17, Strike $2,375.00 | | | (83,925 | ) |
| 4
400 |
| | | | Call, 05/05/17, Strike $2,355.00 | | | (12,540 | ) |
| | | | | | | | | | |
| | | | | | TOTAL WRITTEN OPTIONS
(Premium $430,343) | | $ | (642,835 | ) |
| | | | | | | | | | |
NOTES TO SCHEDULE OF INVESTMENTS
| # | Non-income producing security. |
| ~ | Security, or portion of security, is segregated as collateral (or potential collateral for future transactions) for written options. The aggregate value of such securities is $3,924,931. |
Note: The date on options represents the expiration date of the option contract. The option contract may be exercised at any date on or before the date shown.
| | | | |
| 120 | | CALAMOS OPEN-END FAMILY OF FUNDS SEMIANNUAL REPORT | | See accompanying Notes to Financial Statements |
Phineus Long/Short Fund Schedule of Investments April 30, 2017 (Unaudited)
| | | | | | | | | | |
NUMBER OF
SHARES | | | | | | | VALUE | |
| | COMMON STOCKS (72.7%) | |
| | | | | | Consumer Discretionary (12.3%) | |
| | 166,500 | | | | | D.R. Horton, Inc.~ | | $ | 5,476,185 | |
| | 67,000 | | | | | DeVry Education Group, Inc. | | | 2,535,950 | |
| | 35,300 | | | | | Expedia, Inc.~ | | | 4,720,316 | |
| | 176,084 | | | | | General Motors Company, Inc.~ | | | 6,099,550 | |
| | 147,000 | | | | | MGM Resorts International~ | | | 4,514,370 | |
| | 4,200 | | | | | Priceline Group, Inc.~# | | | 7,756,644 | |
| | | | | | | | | | |
| | | | | | | | | 31,103,015 | |
| | | | | | | | | | |
| | | | | | Energy (0.1%) | |
| | 83,309 | | | GBP | | Gulf Keystone Petroleum, Ltd.# | | | 120,041 | |
| | | | | | | | | | |
| | | | | | Financials (30.4%) | |
| | 274,000 | | | | | Bank of America Corp.~ | | | 6,395,160 | |
| | 121,000 | | | | | Citigroup, Inc.~ | | | 7,153,520 | |
| | 147,500 | | | EUR | | Credit Agricole, SA | | | 2,193,892 | |
| | 106,000 | | | | | Discover Financial Services~ | | | 6,634,540 | |
| | 115,000 | | | | | E*TRADE Financial Corp.# | | | 3,973,250 | |
| | 32,100 | | | | | Goldman Sachs Group, Inc.~ | | | 7,183,980 | |
| | 116,500 | | | | | Intercontinental Exchange, Inc.~ | | | 7,013,300 | |
| | 118,000 | | | | | JPMorgan Chase & Company~ | | | 10,266,000 | |
| | 123,000 | | | | | Legg Mason, Inc.~ | | | 4,597,740 | |
| | 91,500 | | | | | Morgan Stanley~ | | | 3,968,355 | |
| | 303,000 | | | | | Radian Group, Inc.~ | | | 5,114,640 | |
| | 332,500 | | | | | SLM Corp.~# | | | 4,169,550 | |
| | 366,000 | | | | | UBS Group, AG# | | | 6,225,660 | |
| | 115,000 | | | EUR | | UniCredit S.p.A# | | | 1,872,486 | |
| | | | | | | | | | |
| | | | | | | | | 76,762,073 | |
| | | | | | | | | | |
| | | | | | Health Care (3.9%) | |
| | 19,500 | | | | | Alexion Pharmaceuticals, Inc.# | | | 2,491,710 | |
| | 10,100 | | | | | Allergan, PLC | | | 2,462,986 | |
| | 40,000 | | | | | Celgene Corp.~# | | | 4,962,000 | |
| | | | | | | | | | |
| | | | | | | | | 9,916,696 | |
| | | | | | | | | | |
| | | | | | Industrials (7.5%) | |
| | 184,000 | | | | | Air Lease Corp.~^ | | | 7,017,760 | |
| | 142,900 | | | | | Delta Air Lines, Inc.~ | | | 6,493,376 | |
| | 78,500 | | | | | United Continental Holdings, Inc.~# | | | 5,511,485 | |
| | | | | | | | | | |
| | | | | | | | | 19,022,621 | |
| | | | | | | | | | |
| | | | | | Information Technology (15.7%) | |
| | 8,500 | | | | | Alphabet, Inc. - Class A~# | | | 7,858,420 | |
| | 37,700 | | | | | Apple, Inc.~ | | | 5,415,605 | |
| | 87,000 | | | | | Canadian Solar, Inc.# | | | 1,157,100 | |
| | 113,000 | | | | | JinkoSolar Holding Company, Ltd.#^ | | | 1,959,420 | |
| | 116,500 | | | | | NCR Corp.~# | | | 4,805,625 | |
| | 131,500 | | | | | Pandora Media, Inc.#^ | | | 1,426,775 | |
| | 197,500 | | | | | PayPal Holdings, Inc.~# | | | 9,424,700 | |
| | 55,500 | | | | | Workday, Inc. - Class A~# | | | 4,850,700 | |
| | | | | | | | | | |
NUMBER OF
SHARES | | | | | | | VALUE | |
| | 98,549 | | | | | Zendesk, Inc.~# | | $ | 2,833,284 | |
| | | | | | | | | | |
| | | | | | | | | 39,731,629 | |
| | | | | | | | | | |
| | | | | | Materials (0.5%) | |
| | 11,100 | | | EUR | | Wacker Chemie, AG | | | 1,174,886 | |
| | | | | | | | | | |
| | | | | | Real Estate (2.3%) | |
| | 165,316 | | | | | CBRE Group, Inc.~# | | | 5,919,966 | |
| | | | | | | | | | |
| | | | | | TOTAL COMMON STOCKS
(Cost $169,178,616) | | | 183,750,927 | |
| | | | | | | | | | |
| | EXCHANGE-TRADED FUNDS (14.5%) | |
| | | | | | Other (14.5%) | |
| | 990,000 | | | | | Global X MSCI Greece ETF~^ | | | 8,484,300 | |
| | 142,300 | | | | | iShares MSCI India ETF | | | 4,564,984 | |
| | 195,000 | | | | | VanEck Vectors Vietnam ETF~ | | | 2,737,800 | |
| | 390,500 | | | | | Vanguard FTSE Europe ETF~ | | | 20,922,990 | |
| | | | | | | | | | |
| | | | | | | | | 36,710,074 | |
| | | | | | | | | | |
| | | | | | TOTAL EXCHANGE-TRADED FUNDS
(Cost $33,626,594) | | | 36,710,074 | |
| | | | | | | | | | |
NUMBER OF
CONTRACTS/
NOTIONAL
AMOUNT | | | | | | | VALUE | |
| | PURCHASED OPTIONS (0.6%) # | |
| | | | | | Consumer Discretionary (0.3%) | |
| 115
11,500 |
| | | | Tesla, Inc.
Call, 11/17/17, Strike $270.00 | | | 697,762 | |
| | | | | | | | | | |
| | | | | | Health Care (0.0%) | |
| 195
19,500 |
| | | | Alexion Pharmaceuticals, Inc.
Put, 05/19/17, Strike $115.00 | | | 10,725 | |
| | | | | | | | | | |
| | | | | | Information Technology (0.0%) | |
| 377
37,700 |
| | | | Apple, Inc.
Put, 05/05/17, Strike $140.00 | | | 41,847 | |
| | | | | | | �� | | | |
| | | | | | Other (0.3%) | |
| 1,900
190,000 |
| | | | CurrencyShares Euro Trust
Put, 05/19/17, Strike $104.00 | | | 68,400 | |
| 1,770
177,000 |
| | | | iShares Russell 2000 ETF
Call, 05/19/17, Strike $142.00 | | | 105,315 | |
| | | | | | SPDR S&P 500 ETF Trust | | | | |
| 4,000
400,000 |
| | | | Put, 05/19/17, Strike $235.00 | | | 382,000 | |
| 2,500
250,000 |
| | | | Put, 05/19/17, Strike $233.00 | | | 172,500 | |
| | | | | | | | | | |
| | | | | | | | | 728,215 | |
| | | | | | | | | | |
| | | | | | TOTAL PURCHASED OPTIONS
(Cost $2,967,283) | | | 1,478,549 | |
| | | | | | | | | | |
NUMBER OF
SHARES | | | | | | | VALUE | |
| | SHORT TERM INVESTMENTS (7.4%) | |
| | 9,319,794 | | | | | Fidelity Prime Money Market Fund - Institutional Class | | | 9,323,522 | |
| | | | | | |
| See accompanying Notes to Schedule of Investments | | www.calamos.com | | | 121 | |
Phineus Long/Short Fund Schedule of Investments April 30, 2017 (Unaudited)
| | | | | | | | | | |
NUMBER OF
SHARES | | | | | | | VALUE | |
| | 9,318,488 | | | | | Morgan Stanley Institutional Liquidity Funds - Government Portfolio | | $ | 9,318,488 | |
| | | | | | | | | | |
| | | | | | TOTAL SHORT TERM
INVESTMENTS
(Cost $18,642,010) | | | 18,642,010 | |
| | | | | | | | | | |
NUMBER OF
SHARES/ PRINCIPAL
AMOUNT | | | | | | | VALUE | |
| INVESTMENT OF CASH COLLATERAL FOR SECURITIES
LOANED (0.7%) |
|
| | 1,092,030 | | | | | Deutsche Bank Securities, Inc.† 0.830%, 05/01/17 | | | 1,092,030 | |
| | 593,495 | | | | | Goldman Sachs Financial Square Government Fund | | | 593,495 | |
| | | | | | | | | | |
| | | | | | TOTAL INVESTMENT OF
CASH COLLATERAL FOR SECURITIES LOANED
(Cost $1,685,525) | | | 1,685,525 | |
| | | | | | | | | | |
| |
| TOTAL INVESTMENTS (95.9%)
(Cost $226,100,028) | | | 242,267,085 | |
| | | | | | | | | | |
| |
| | PAYABLE UPON RETURN OF SECURITIES ON LOAN (-0.7%) | | | (1,685,525 | ) |
| | | | | | | | | | |
| |
| | OTHER ASSETS, LESS LIABILITIES (4.8%) | | | 12,106,494 | |
| | | | | | | | | | |
| |
| | NET ASSETS (100.0%) | | $ | 252,688,054 | |
| | | | | | | | | | |
NUMBER OF
SHARES | | | | | | | VALUE | |
| | COMMON STOCKS SOLD SHORT (-3.7%) # | |
| | | | | | Consumer Staples (-1.9%) | |
| | (37,000 | ) | | | | Colgate-Palmolive Company | | | (2,665,480 | ) |
| | (22,500 | ) | | | | Procter & Gamble Company | | | (1,964,925 | ) |
| | | | | | | | | | |
| | | | | | | | | (4,630,405 | ) |
| | | | | | | | | | |
| | | | | | Health Care (-0.7%) | |
| | (53,600 | ) | | | | Pfizer, Inc. | | | (1,818,112 | ) |
| | | | | | | | | | |
| | | | | | Telecommunication Services (-1.1%) | |
| | (70,000 | ) | | | | AT&T, Inc. | | | (2,774,100 | ) |
| | | | | | | | | | |
| | | | | | TOTAL COMMON STOCKS SOLD SHORT
(Proceeds $9,258,066) | | | (9,222,617 | ) |
| | | | | | | | | | |
| | EXCHANGE-TRADED FUNDS SOLD SHORT (-38.8%) # | |
| | | | | | Other (-38.8%) | |
| | (136,500 | ) | | | | Consumer Staples Select Sector SPDR Fund | | | (7,532,070 | ) |
| | (124,000 | ) | | | | Health Care Select Sector SPDR Fund | | | (9,362,000 | ) |
| | (312,000 | ) | | | | iShares Edge MSCI Min Vol USA ETF | | | (15,097,680 | ) |
| | (23,700 | ) | | | | iShares NASDAQ Biotechnology ETF | | | (7,054,068 | ) |
| | (248,000 | ) | | | | SPDR S&P 500 ETF Trust | | | (59,043,840 | ) |
| | | | | | | | | | |
| | | | | | TOTAL EXCHANGE-TRADED FUNDS SOLD SHORT
(Proceeds $93,219,061) | | | (98,089,658 | ) |
| | | | | | | | | | |
| | | | | | | | | | |
NUMBER OF
CONTRACTS/
NOTIONAL
AMOUNT | | | | | | | VALUE | |
| | WRITTEN OPTIONS (-0.2%) # | |
| | | | | | Consumer Discretionary (0.0%) | | | | |
| 115
11,500 |
| | | | Tesla, Inc.
Put, 05/05/17, Strike $290.00 | | $ | (19,895 | ) |
| | | | | | | | | | |
| | | | | | Financials (0.0%) | |
| 770
77,000 |
| | | | Citigroup, Inc.
Put, 05/19/17, Strike $52.50 | | | (2,310 | ) |
| 50
5,000 |
| | | | Goldman Sachs Group, Inc.
Put, 05/19/17, Strike $225.00 | | | (21,625 | ) |
| 1,100
110,000 |
| | | | Morgan Stanley
Put, 05/19/17, Strike $37.00 | | | (1,650 | ) |
| | | | | | | | | | |
| | | | | | | | | (25,585 | ) |
| | | | | | | | | | |
| | | | | | Health Care (0.0%) | | | | |
| 390
39,000 |
| | | | Alexion Pharmaceuticals, Inc.
Put, 05/19/17, Strike $100.00 | | | (2,925 | ) |
| 185
18,500 |
| | | | Incyte Corp.
Put, 05/19/17, Strike $125.00 | | | (103,600 | ) |
| | | | | | | | | | |
| | | | | | | | | (106,525 | ) |
| | | | | | | | | | |
| | | | | | Information Technology (0.0%) | |
| 575
57,500 |
| | | | NCR Corp.
Put, 05/19/17, Strike $40.00 | | | (28,750 | ) |
| | | | | | | | | | |
| | | | | | Other (-0.2%) | |
| 1,900
190,000 |
| | | | CurrencyShares Euro Trust
Call, 05/19/17, Strike $108.00 | | | (24,700 | ) |
| 20,000
2,000,000 |
| | | | Financial Select Sector SPDR Fund
Put, 06/16/17, Strike $20.00 | | | (70,000 | ) |
| 2,650
265,000 |
| | | | iShares Russell 2000 ETF
Put, 05/19/17, Strike $137.00 | | | (265,000 | ) |
| 2,500
250,000 |
| | | | SPDR S&P 500 ETF Trust
Put, 05/19/17, Strike $223.00 | | | (48,750 | ) |
| | | | | | | | | | |
| | | | | | | | | (408,450 | ) |
| | | | | | | | | | |
| | | | | | TOTAL WRITTEN OPTIONS
(Premium $1,193,813) | | $ | (589,205 | ) |
| | | | | | | | | | |
NOTES TO SCHEDULE OF INVESTMENTS
| ~ | Security, or portion of security, is segregated as collateral (or potential collateral for future transactions) for written options. The aggregate value of such securities is $94,628,571. |
| # | Non-income producing security. |
| ^ | Security, or portion of security, is on loan. |
| † | Repurchase agreement collateralized by the following security: 1,113,825 United States Treasury Note, 3.625%, 02/15/20. |
FOREIGN CURRENCY ABBREVIATIONS
| | |
| EUR | | European Monetary Unit |
| GBP | | British Pound Sterling |
Note: Value for securities denominated in foreign currencies is shown in U.S. dollars. The date on options represents the expiration date of the option contract. The option contract may be exercised at any date on or before the date shown.
| | | | |
| 122 | | CALAMOS OPEN-END FAMILY OF FUNDS SEMIANNUAL REPORT | | See accompanying Notes to Financial Statements |
Statements of Assets and Liabilities April 30, 2017 (Unaudited)
| | | | | | | | | | | | | | | | | | | | |
| | | GROWTH
FUND | | | OPPORTUNISTIC
VALUE FUND | | | DIVIDEND
GROWTH FUND | | | INTERNATIONAL
GROWTH FUND | | | EVOLVING WORLD
GROWTH FUND | |
ASSETS | | | | | | | | | | | | | | | | | | | | |
Investments in securities, at cost | | $ | 1,370,683,657 | | | $ | 49,649,098 | | | $ | 24,867,611 | | | $ | 242,443,784 | | | $ | 265,241,624 | |
Investment in securities, at value | | $ | 1,739,549,224 | | | $ | 55,153,103 | | | $ | 29,549,475 | | | $ | 284,351,946 | | | $ | 312,514,314 | |
Cash with custodian (interest bearing) | | | — | | | | — | | | | — | | | | — | | | | — | |
Restricted cash for short positions (interest bearing) | | | — | | | | — | | | | — | | | | — | | | | — | |
Restricted cash for collateral on securities loaned | | | 6,332,109 | | | | 110,624 | | | | — | | | | 790,929 | | | | — | |
Restricted foreign currency for short positions (cost $-) | | | — | | | | — | | | | — | | | | — | | | | — | |
Foreign currency (cost $165,896 and $845,650) | | | — | | | | — | | | | — | | | | 165,568 | | | | 844,156 | |
Receivables: | | | | | | | | | | | | | | | | | | | | |
Accrued interest and dividends | | | 456,435 | | | | 55,203 | | | | 29,184 | | | | 1,353,053 | | | | 875,420 | |
Investments sold | | | 18,895,381 | | | | 2,492,565 | | | | 191,887 | | | | 1,504,724 | | | | 1,233,019 | |
Fund shares sold | | | 681,808 | | | | 3,873 | | | | 11,917 | | | | 67,599 | | | | 803,870 | |
Due from investment advisor | | | — | | | | 34,045 | | | | 21,626 | | | | 23,600 | | | | 221 | |
Prepaid expenses | | | 177,385 | | | | 50,488 | | | | 33,973 | | | | 68,721 | | | | 57,434 | |
Other assets | | | 714,570 | | | | 105,100 | | | | 12,845 | | | | 104,808 | | | | 74,484 | |
Total assets | | | 1,766,806,912 | | | | 58,005,001 | | | | 29,850,907 | | | | 288,430,948 | | | | 316,402,918 | |
LIABILITIES | | | | | | | | | | | | | | | | | | | | |
Due to custodian bank | | | — | | | | — | | | | — | | | | — | | | | 1,499,684 | |
Collateral for securities loaned | | | 12,671,505 | | | | 221,375 | | | | — | | | | 1,582,768 | | | | — | |
Securities sold short, at value (proceeds $-) | | | — | | | | — | | | | — | | | | — | | | | — | |
Options written, at value (premium $904,713) | | | 519,355 | | | | — | | | | — | | | | — | | | | — | |
Unrealized depreciation on forward foreign currency contracts | | | — | | | | — | | | | — | | | | — | | | | — | |
Payables: | | | | | | | | | | | | | | | | | | | | |
Investments purchased | | | 2,954,837 | | | | 1,681,277 | | | | — | | | | 1,464,047 | | | | — | |
Fund shares redeemed | | | 5,690,738 | | | | 48,503 | | | | 87 | | | | 528,684 | | | | 569,348 | |
Dividends payable | | | — | | | | — | | | | — | | | | — | | | | — | |
Affiliates: | | | | | | | | | | | | | | | | | | | | |
Investment advisory fees | | | 1,264,463 | | | | 45,763 | | | | 24,292 | | | | 200,289 | | | | 285,148 | |
Distribution fees | | | 80,105 | | | | 1,487 | | | | 763 | | | | 5,655 | | | | 4,755 | |
Deferred compensation to trustees | | | 716,053 | | | | 105,100 | | | | 12,845 | | | | 104,808 | | | | 74,484 | |
Financial accounting fees | | | 16,589 | | | | 533 | | | | 282 | | | | 2,672 | | | | 3,015 | |
Trustees’ fees and officer compensation | | | 23,835 | | | | 2,918 | | | | 2,683 | | | | 6,661 | | | | 6,730 | |
Other accounts payable and accrued liabilities | | | 944,598 | | | | 25,029 | | | | 17,071 | | | | 702,844 | | | | 1,637,058 | |
Total liabilities | | | 24,882,078 | | | | 2,131,985 | | | | 58,023 | | | | 4,598,428 | | | | 4,080,222 | |
NET ASSETS | | $ | 1,741,924,834 | | | $ | 55,873,016 | | | $ | 29,792,884 | | | $ | 283,832,520 | | | $ | 312,322,696 | |
COMPOSITION OF NET ASSETS | | | | | | | | | | | | | | | | | | | | |
Paid in capital | | $ | 1,189,584,180 | | | $ | 50,257,446 | | | $ | 24,022,188 | | | $ | 247,262,967 | | | $ | 336,278,101 | |
Undistributed net investment income (loss) | | | (6,702,983 | ) | | | 130,725 | | | | 9,104 | | | | 552,918 | | | | 125,766 | |
Accumulated net realized gain (loss) on investments, foreign currency transactions, written options and short positions | | | 189,795,596 | | | | (19,160 | ) | | | 1,079,728 | | | | (5,404,213 | ) | | | (70,047,237 | ) |
Unrealized appreciation (depreciation) of investments, foreign currency translations, written options and short positions | | | 369,248,041 | | | | 5,504,005 | | | | 4,681,864 | | | | 41,420,848 | * | | | 45,966,066 | * |
NET ASSETS | | $ | 1,741,924,834 | | | $ | 55,873,016 | | | $ | 29,792,884 | | | $ | 283,832,520 | | | $ | 312,322,696 | |
CLASS A SHARES† | | | | | | | | | | | | | | | | | | | | |
Net assets applicable to shares outstanding | | $ | 937,859,483 | | | $ | 32,110,285 | | | $ | 23,828,197 | | | $ | 81,625,124 | | | $ | 65,429,065 | |
Shares outstanding | | | 28,871,796 | | | | 2,314,772 | | | | 2,034,328 | | | | 4,517,317 | | | | 5,140,774 | |
Net asset value and redemption price per share | | $ | 32.48 | | | $ | 13.87 | | | $ | 11.71 | | | $ | 18.07 | | | $ | 12.73 | |
Maximum offering price per share (Net asset value, plus 4.75% of offering price) | | $ | 34.10 | | | $ | 14.56 | | | $ | 12.29 | | | $ | 18.97 | | | $ | 13.36 | |
CLASS B SHARES†** | | | | | | | | | | | | | | | | | | | | |
Net assets applicable to shares outstanding | | $ | 2,069,693 | | | $ | 40,762 | | | $ | — | | | $ | 113,801 | | | $ | 37,767 | |
Shares outstanding | | | 70,967 | | | | 3,176 | | | | — | | | | 6,847 | | | | 3,122 | |
Net asset value and redemption price per share | | $ | 29.16 | | | $ | 12.83 | | | $ | — | | | $ | 16.62 | | | $ | 12.10 | |
CLASS C SHARES†** | | | | | | | | | | | | | | | | | | | | |
Net assets applicable to shares outstanding | | $ | 488,273,884 | | | $ | 5,364,341 | | | $ | 1,002,876 | | | $ | 28,065,591 | | | $ | 25,715,430 | |
Shares outstanding | | | 21,942,398 | | | | 426,492 | | | | 86,805 | | | | 1,690,953 | | | | 2,127,828 | |
Net asset value and redemption price per share | | $ | 22.25 | | | $ | 12.58 | | | $ | 11.55 | | | $ | 16.60 | | | $ | 12.09 | |
CLASS I SHARES† | | | | | | | | | | | | | | | | | | | | |
Net assets applicable to shares outstanding | | $ | 307,434,667 | | | $ | 18,192,559 | | | $ | 4,936,522 | | | $ | 168,013,302 | | | $ | 218,535,011 | |
Shares outstanding | | | 7,454,065 | | | | 1,277,874 | | | | 420,977 | | | | 9,116,112 | | | | 17,039,909 | |
Net asset value and redemption price per share | | $ | 41.24 | | | $ | 14.24 | | | $ | 11.73 | | | $ | 18.43 | | | $ | 12.82 | |
CLASS R SHARES† | | | | | | | | | | | | | | | | | | | | |
Net assets applicable to shares outstanding | | $ | 6,261,389 | | | $ | 140,348 | | | $ | — | | | $ | 5,988,096 | | | $ | 2,579,030 | |
Shares outstanding | | | 204,121 | | | | 10,244 | | | | — | | | | 338,824 | | | | 205,057 | |
Net asset value and redemption price per share | | $ | 30.67 | | | $ | 13.70 | | | $ | — | | | $ | 17.67 | | | $ | 12.58 | |
CLASS T SHARES†(a) | | | | | | | | | | | | | | | | | | | | |
Net assets applicable to shares outstanding | | $ | 25,718 | | | $ | 24,721 | | | $ | 25,289 | | | $ | 26,606 | | | $ | 26,393 | |
Shares outstanding | | | 792 | | | | 1,782 | | | | 2,161 | | | | 1,472 | | | | 2,073 | |
Net asset value and redemption price per share | | $ | 32.49 | | | $ | 13.87 | | | $ | 11.70 | | | $ | 18.07 | | | $ | 12.73 | |
| † | No par value; unlimited number of shares authorized. |
| ** | Redemption price may be reduced by contingent deferred sales charge. |
| * | Net of deferred foreign capital gains tax of $(479,415) and $(1,306,748). |
| (a) | Class T commenced operations on February 28, 2017. |
| | | | | | |
| See accompanying Notes to Financial Statements | | www.calamos.com | | | 123 | |
Statements of Assets and Liabilities April 30, 2017 (Unaudited)
| | | | | | | | | | | | | | | | | | | | |
| | | EMERGING MARKET
EQUITY FUND | | | GLOBAL
EQUITY FUND | | | GROWTH AND
INCOME FUND | | | GLOBAL
GROWTH AND
INCOME FUND | | | CONVERTIBLE
FUND | |
ASSETS | | | | | | | | | | | | | | | | | | | | |
Investments in securities, at cost | | $ | 13,132,385 | | | $ | 93,239,547 | | | $ | 1,709,918,517 | | | $ | 201,880,825 | | | $ | 588,691,446 | |
Investment in securities, at value | | $ | 14,963,020 | | | $ | 119,700,366 | | | $ | 2,101,182,379 | | | $ | 230,190,713 | | | $ | 620,969,623 | |
Cash with custodian (interest bearing) | | | — | | | | — | | | | — | | | | — | | | | 263 | |
Restricted cash for short positions (interest bearing) | | | — | | | | — | | | | — | | | | — | | | | — | |
Restricted cash for collateral on securities loaned | | | 53,519 | | | | 334,408 | | | | 22,851,778 | | | | 4,527,635 | | | | 18,260,705 | |
Restricted foreign currency for short positions (cost $-) | | | — | | | | — | | | | — | | | | — | | | | — | |
Foreign currency (cost $1,843 and $15,350) | | | 1,842 | | | | 15,351 | | | | — | | | | — | | | | — | |
Receivables: | | | | | | | | | | | | | | | | | | | | |
Accrued interest and dividends | | | 16,988 | | | | 298,617 | | | | 4,519,210 | | | | 845,694 | | | | 2,261,001 | |
Investments sold | | | — | | | | 520,514 | | | | 10,523,923 | | | | 254,886 | | | | 4,080,543 | |
Fund shares sold | | | 581 | | | | 49,043 | | | | 2,264,084 | | | | 24,521 | | | | 2,080,286 | |
Due from investment advisor | | | 22,425 | | | | 16,100 | | | | 14,348 | | | | — | | | | — | |
Prepaid expenses | | | 44,736 | | | | 56,642 | | | | 172,265 | | | | 55,129 | | | | 87,078 | |
Other assets | | | 12,842 | | | | 79,296 | | | | 337,976 | | | | 151,006 | | | | 192,398 | |
Total assets | | | 15,115,953 | | | | 121,070,337 | | | | 2,141,865,963 | | | | 236,049,584 | | | | 647,931,897 | |
LIABILITIES | | | | | | | | | | | | | | | | | | | | |
Due to custodian bank | | | — | | | | — | | | | — | | | | — | | | | — | |
Collateral for securities loaned | | | 107,100 | | | | 669,201 | | | | 45,729,853 | | | | 9,060,480 | | | | 36,542,425 | |
Securities sold short, at value (proceeds $-) | | | — | | | | — | | | | — | | | | — | | | | — | |
Options written, at value (premium $119,143) | | | — | | | | — | | | | 38,946 | | | | — | | | | — | |
Unrealized depreciation on forward foreign currency contracts | | | — | | | | 37,149 | | | | — | | | | 28,444 | | | | — | |
Payables: | | | | | | | | | | | | | | | | | | | | |
Investments purchased | | | 117,777 | | | | — | | | | 4,544,257 | | | | 251,691 | | | | 4,219,656 | |
Fund shares redeemed | | | — | | | | 155,526 | | | | 5,197,726 | | | | 1,029,279 | | | | 1,493,468 | |
Dividends payable | | | — | | | | — | | | | — | | | | — | | | | — | |
Affiliates: | | | | | | | | | | | | | | | | | | | | |
Investment advisory fees | | | 13,080 | | | | 92,164 | | | | 1,169,762 | | | | 183,565 | | | | 366,523 | |
Distribution fees | | | 164 | | | | 2,427 | | | | 99,570 | | | | 10,854 | | | | 25,032 | |
Deferred compensation to trustees | | | 12,842 | | | | 79,296 | | | | 337,976 | | | | 151,006 | | | | 192,398 | |
Financial accounting fees | | | 138 | | | | 1,126 | | | | 19,826 | | | | 2,135 | | | | 5,748 | |
Trustees’ fees and officer compensation | | | 2,421 | | | | 3,838 | | | | 27,135 | | | | 5,782 | | | | 9,994 | |
Other accounts payable and accrued liabilities | | | 22,317 | | | | 230,165 | | | | 629,417 | | | | 157,941 | | | | 192,149 | |
Total liabilities | | | 275,839 | | | | 1,270,892 | | | | 57,794,468 | | | | 10,881,177 | | | | 43,047,393 | |
NET ASSETS | | $ | 14,840,114 | | | $ | 119,799,445 | | | $ | 2,084,071,495 | | | $ | 225,168,407 | | | $ | 604,884,504 | |
COMPOSITION OF NET ASSETS | | | | | | | | | | | | | | | | | | | | |
Paid in capital | | $ | 16,298,377 | | | $ | 84,011,753 | | | $ | 1,625,925,843 | | | $ | 190,844,251 | | | $ | 547,184,712 | |
Undistributed net investment income (loss) | | | (25,769 | ) | | | (31,356 | ) | | | (24,487,560 | ) | | | 727,121 | | | | (3,405,526 | ) |
Accumulated net realized gain (loss) on investments, foreign currency transactions, written options and short positions | | | (3,263,081 | ) | | | 9,558,476 | | | | 91,289,153 | | | | 5,369,101 | | | | 28,828,178 | |
Unrealized appreciation (depreciation) of investments, foreign currency translations, written options and short positions | | | 1,830,587 | | | | 26,260,572 | * | | | 391,344,059 | | | | 28,227,934 | * | | | 32,277,140 | |
NET ASSETS | | $ | 14,840,114 | | | $ | 119,799,445 | | | $ | 2,084,071,495 | | | $ | 225,168,407 | | | $ | 604,884,504 | |
CLASS A SHARES† | | | | | | | | | | | | | | | | | | | | |
Net assets applicable to shares outstanding | | $ | 4,641,678 | | | $ | 24,298,689 | | | $ | 875,703,404 | | | $ | 72,791,067 | | | $ | 220,034,879 | |
Shares outstanding | | | 518,063 | | | | 1,808,906 | | | | 28,019,881 | | | | 8,086,845 | | | | 12,876,597 | |
Net asset value and redemption price per share | | $ | 8.96 | | | $ | 13.43 | | | $ | 31.25 | | | $ | 9.00 | | | $ | 17.09 | |
Maximum offering price per share (Net asset value, plus 4.75% of offering price) | | $ | 9.41 | | | $ | 14.10 | | | $ | 32.81 | | | $ | 9.45 | | | $ | 17.48 | # |
CLASS B SHARES†** | | | | | | | | | | | | | | | | | | | | |
Net assets applicable to shares outstanding | | $ | — | | | $ | 79,905 | | | $ | 1,610,846 | | | $ | 179,470 | | | $ | 1,252,283 | |
Shares outstanding | | | — | | | | 6,417 | | | | 42,200 | | | | 19,874 | | | | 56,419 | |
Net asset value and redemption price per share | | $ | — | | | $ | 12.45 | | | $ | 38.17 | | | $ | 9.03 | | | $ | 22.20 | |
CLASS C SHARES†** | | | | | | | | | | | | | | | | | | | | |
Net assets applicable to shares outstanding | | $ | 337,734 | | | $ | 13,965,068 | | | $ | 679,045,387 | | | $ | 79,836,273 | | | $ | 170,416,369 | |
Shares outstanding | | | 38,367 | | | | 1,124,605 | | | | 21,636,743 | | | | 9,853,330 | | | | 10,063,610 | |
Net asset value and redemption price per share | | $ | 8.80 | | | $ | 12.42 | | | $ | 31.38 | | | $ | 8.10 | | | $ | 16.93 | |
CLASS I SHARES† | | | | | | | | | | | | | | | | | | | | |
Net assets applicable to shares outstanding | | $ | 9,834,375 | | | $ | 77,300,709 | | | $ | 514,978,699 | | | $ | 71,086,022 | | | $ | 211,518,074 | |
Shares outstanding | | | 1,094,542 | | | | 5,646,346 | | | | 17,086,586 | | | | 7,697,057 | | | | 13,735,803 | |
Net asset value and redemption price per share | | $ | 8.98 | | | $ | 13.69 | | | $ | 30.14 | | | $ | 9.24 | | | $ | 15.40 | |
CLASS R SHARES† | | | | | | | | | | | | | | | | | | | | |
Net assets applicable to shares outstanding | | $ | — | | | $ | 4,128,846 | | | $ | 12,708,006 | | | $ | 1,249,763 | | | $ | 1,637,555 | |
Shares outstanding | | | — | | | | 316,123 | | | | 409,848 | | | | 141,114 | | | | 96,188 | |
Net asset value and redemption price per share | | $ | — | | | $ | 13.06 | | | $ | 31.01 | | | $ | 8.86 | | | $ | 17.02 | |
CLASS T SHARES†(a) | | | | | | | | | | | | | | | | | | | | |
Net assets applicable to shares outstanding | | $ | 26,327 | | | $ | 26,228 | | | $ | 25,153 | | | $ | 25,812 | | | $ | 25,344 | |
Shares outstanding | | | 2,938 | | | | 1,953 | | | | 805 | | | | 2,867 | | | | 1,484 | |
Net asset value and redemption price per share | | $ | 8.96 | | | $ | 13.43 | | | $ | 31.24 | | | $ | 9.00 | | | $ | 17.08 | |
| † | No par value; unlimited number of shares authorized. |
| ** | Redemption price may be reduced by contingent deferred sales charge. |
| * | Net of deferred foreign capital gains tax of $(161,145) and $(54,219). |
| # | For Convertible Fund, maximum offering price per share is Net asset value plus 2.25% of offering price. |
| (a) | Class T commenced operations on February 28, 2017. |
| | | | |
| 124 | | CALAMOS OPEN-END FAMILY OF FUNDS SEMIANNUAL REPORT | | See accompanying Notes to Financial Statements |
Statements of Assets and Liabilities April 30, 2017 (Unaudited)
| | | | | | | | | | | | | | | | | | | | |
| | | GLOBAL
CONVERTIBLE
FUND | | | TOTAL RETURN
BOND FUND | | | HIGH INCOME
FUND | | | MARKET NEUTRAL
INCOME FUND | | | HEDGED EQUITY
INCOME FUND | |
ASSETS | | | | | | | | | | | | | | | | | | | | |
Investments in securities, at cost | | $ | 72,697,345 | | | $ | 79,813,038 | | | $ | 63,167,222 | | | $ | 3,923,366,944 | | | $ | 13,623,917 | |
Investment in securities, at value | | $ | 75,305,024 | | | $ | 80,973,114 | | | $ | 63,688,374 | | | $ | 4,448,223,995 | | | $ | 15,556,535 | |
Cash with custodian (interest bearing) | | | 50 | | | | — | | | | — | | | | 9,720,135 | | | | — | |
Restricted cash for short positions (interest bearing) | | | — | | | | — | | | | — | | | | 1,336,822,814 | | | | — | |
Restricted cash for collateral on securities loaned | | | 360,540 | | | | 132,069 | | | | 1,138,690 | | | | 14,269,336 | | | | — | |
Restricted foreign currency for short positions (cost $28,196,866) | | | — | | | | — | | | | — | | | | 28,838,784 | | | | — | |
Foreign currency (cost $205 and $56,452) | | | 205 | | | | — | | | | — | | | | 56,442 | | | | — | |
Receivables: | | | | | | | | | | | | | | | | | | | | |
Accrued interest and dividends | | | 299,578 | | | | 613,328 | | | | 1,052,640 | | | | 11,612,653 | | | | 15,463 | |
Investments sold | | | 135,277 | | | | — | | | | 471,900 | | | | 60,864,801 | | | | 260,526 | |
Fund shares sold | | | 1,430,517 | | | | 35,020 | | | | 217,313 | | | | 18,210,643 | | | | 3,425 | |
Due from investment advisor | | | 11,441 | | | | 21,774 | | | | — | | | | — | | | | 21,493 | |
Prepaid expenses | | | 51,833 | | | | 36,276 | | | | 48,875 | | | | 337,745 | | | | 45,709 | |
Other assets | | | 5,900 | | | | 80,481 | | | | 113,483 | | | | 207,647 | | | | 5,743 | |
Total assets | | | 77,600,365 | | | | 81,892,062 | | | | 66,731,275 | | | | 5,929,164,995 | | | | 15,908,894 | |
LIABILITIES | | | | | | | | | | | | | | | | | | | | |
Due to custodian bank | | | — | | | | — | | | | — | | | | — | | | | — | |
Collateral for securities loaned | | | 721,495 | | | | 264,290 | | | | 2,278,690 | | | | 28,555,093 | | | | — | |
Securities sold short, at value (proceeds $1,084,666,680) | | | — | | | | — | | | | — | | | | 1,387,604,827 | | | | — | |
Options written, at value (premium $65,747,463 and $430,343) | | | — | | | | — | | | | — | | | | 98,566,562 | | | | 642,835 | |
Unrealized depreciation on forward foreign currency contracts | | | — | | | | — | | | | — | | | | 77,114 | | | | — | |
Payables: | | | | | | | | | | | | | | | | | | | | |
Investments purchased | | | 162,229 | | | | — | | | | 474,727 | | | | 35,140,453 | | | | 17,474 | |
Fund shares redeemed | | | 70,608 | | | | 80,909 | | | | 146,525 | | | | 6,426,373 | | | | 30 | |
Dividends payable | | | — | | | | 13,469 | | | | 25,422 | | | | — | | | | — | |
Affiliates: | | | | | | | | | | | | | | | | | | | | |
Investment advisory fees | | | 52,068 | | | | 36,844 | | | | 38,852 | | | | 2,382,143 | | | | 9,267 | |
Distribution fees | | | 1,234 | | | | 2,790 | | | | 2,798 | | | | 58,835 | | | | 199 | |
Deferred compensation to trustees | | | 5,900 | | | | 80,481 | | | | 113,483 | | | | 207,647 | | | | 5,743 | |
Financial accounting fees | | | 712 | | | | 779 | | | | 603 | | | | 41,519 | | | | 144 | |
Trustees’ fees and officer compensation | | | 3,172 | | | | 3,355 | | | | 3,088 | | | | 44,041 | | | | 2,077 | |
Other accounts payable and accrued liabilities | | | 30,721 | | | | 30,817 | | | | 36,511 | | | | 971,843 | | | | 22,547 | |
Total liabilities | | | 1,048,139 | | | | 513,734 | | | | 3,120,699 | | | | 1,560,076,450 | | | | 700,316 | |
NET ASSETS | | $ | 76,552,226 | | | $ | 81,378,328 | | | $ | 63,610,576 | | | $ | 4,369,088,545 | | | $ | 15,208,578 | |
COMPOSITION OF NET ASSETS | | | | | | | | | | | | | | | | | | | | |
Paid in capital | | $ | 72,953,214 | | | $ | 80,528,045 | | | $ | 72,286,365 | | | $ | 4,231,576,731 | | | $ | 13,986,981 | |
Undistributed net investment income (loss) | | | 271,221 | | | | (230,019 | ) | | | (258,753 | ) | | | 9,057,715 | | | | 8,775 | |
Accumulated net realized gain (loss) on investments, foreign currency transactions, written options and short positions | | | 719,320 | | | | (79,774 | ) | | | (8,938,188 | ) | | | (61,225,339 | ) | | | (507,304 | ) |
Unrealized appreciation (depreciation) of investments, foreign currency translations, written options and short positions | | | 2,608,471 | | | | 1,160,076 | | | | 521,152 | | | | 189,679,438 | | | | 1,720,126 | |
NET ASSETS | | $ | 76,552,226 | | | $ | 81,378,328 | | | $ | 63,610,576 | | | $ | 4,369,088,545 | | | $ | 15,208,578 | |
CLASS A SHARES† | | | | | | | | | | | | | | | | | | | | |
Net assets applicable to shares outstanding | | $ | 34,553,726 | | | $ | 48,915,468 | | | $ | 38,289,748 | | | $ | 898,847,819 | | | $ | 6,588,610 | |
Shares outstanding | | | 3,285,966 | | | | 4,711,798 | | | | 4,337,978 | | | | 67,926,796 | | | | 624,405 | |
Net asset value and redemption price per share | | $ | 10.52 | | | $ | 10.38 | | | $ | 8.83 | | | $ | 13.23 | | | $ | 10.55 | |
Maximum offering price per share (Net asset value, plus 4.75% of offering price) | | $ | 10.76 | # | | $ | 10.62 | # | | $ | 9.03 | # | | $ | 13.53 | # | | $ | 11.08 | |
CLASS B SHARES†** | | | | | | | | | | | | | | | | | | | | |
Net assets applicable to shares outstanding | | $ | — | | | $ | 105,777 | | | $ | 71,261 | | | $ | 251,861 | | | $ | — | |
Shares outstanding | | | — | | | | 10,184 | | | | 7,601 | | | | 17,847 | | | | — | |
Net asset value and redemption price per share | | $ | — | | | $ | 10.39 | | | $ | 9.38 | | | $ | 14.11 | | | $ | — | |
CLASS C SHARES†** | | | | | | | | | | | | | | | | | | | | |
Net assets applicable to shares outstanding | | $ | 2,337,141 | | | $ | 12,947,916 | | | $ | 15,841,139 | | | $ | 307,335,408 | | | $ | 160,939 | |
Shares outstanding | | | 223,639 | | | | 1,247,611 | | | | 1,710,750 | | | | 22,866,560 | | | | 15,317 | |
Net asset value and redemption price per share | | $ | 10.45 | | | $ | 10.38 | | | $ | 9.26 | | | $ | 13.44 | | | $ | 10.51 | |
CLASS I SHARES† | | | | | | | | | | | | | | | | | | | | |
Net assets applicable to shares outstanding | | $ | 39,073,284 | | | $ | 19,025,404 | | | $ | 9,233,511 | | | $ | 3,154,302,098 | | | $ | 8,433,981 | |
Shares outstanding | | | 3,707,906 | | | | 1,832,956 | | | | 1,046,388 | | | | 241,027,591 | | | | 798,776 | |
Net asset value and redemption price per share | | $ | 10.54 | | | $ | 10.38 | | | $ | 8.82 | | | $ | 13.09 | | | $ | 10.56 | |
CLASS R SHARES† | | | | | | | | | | | | | | | | | | | | |
Net assets applicable to shares outstanding | | $ | 562,256 | | | $ | 358,656 | | | $ | 149,934 | | | $ | 8,326,353 | | | $ | — | |
Shares outstanding | | | 53,575 | | | | 34,623 | | | | 17,033 | | | | 631,775 | | | | — | |
Net asset value and redemption price per share | | $ | 10.49 | | | $ | 10.36 | | | $ | 8.80 | | | $ | 13.18 | | | $ | — | |
CLASS T SHARES†(a) | | | | | | | | | | | | | | | | | | | | |
Net assets applicable to shares outstanding | | $ | 25,819 | | | $ | 25,107 | | | $ | 24,983 | | | $ | 25,006 | | | $ | 25,048 | |
Shares outstanding | | | 2,456 | | | | 2,418 | | | | 2,818 | | | | 1,891 | | | | 2,376 | |
Net asset value and redemption price per share | | $ | 10.51 | | | $ | 10.38 | | | $ | 8.86 | | | $ | 13.22 | | | $ | 10.54 | |
| † | No par value; unlimited number of shares authorized. |
| ** | Redemption price may be reduced by contingent deferred sales charge. |
| # | For Global Convertible Fund, Total Return Bond Fund, High Income Fund, and Market Neutral Income Fund, maximum offering price per share is Net asset value plus 2.25% of offering price. |
| (a) | Class T commenced operations on February 28, 2017. |
| | | | | | |
| See accompanying Notes to Financial Statements | | www.calamos.com | | | 125 | |
Statements of Assets and Liabilities April 30, 2017 (Unaudited)
| | | | |
| | | PHINEUS
LONG/SHORT
FUND | |
ASSETS | | | | |
Investments in securities, at cost | | $ | 226,100,028 | |
Investment in securities, at value | | $ | 242,267,085 | |
Cash with custodian (interest bearing) | | | — | |
Restricted cash for short positions (interest bearing) | | | 107,708,072 | |
Restricted cash for collateral on securities loaned | | | 1,683,587 | |
Restricted foreign currency for short positions (cost $-) | | | — | |
Foreign currency (cost $-) | | | — | |
Receivables: | | | | |
Accrued interest and dividends | | | 80,122 | |
Investments sold | | | 10,923,845 | |
Fund shares sold | | | 10,008,615 | |
Due from investment advisor | | | 1,986 | |
Prepaid expenses | | | 85,005 | |
Other assets | | | 30,560 | |
Total assets | | | 372,788,877 | |
LIABILITIES | | | | |
Due to custodian bank | | | — | |
Collateral for securities loaned | | | 3,369,112 | |
Securities sold short, at value (proceeds $102,477,127) | | | 107,312,275 | |
Options written, at value (premium $1,193,813) | | | 589,205 | |
Unrealized depreciation on forward foreign currency contracts | | | — | |
Payables: | | | | |
Investments purchased | | | 8,236,627 | |
Fund shares redeemed | | | 123,042 | |
Dividends payable | | | — | |
Affiliates: | | | | |
Investment advisory fees | | | 237,474 | |
Distribution fees | | | 2,691 | |
Deferred compensation to trustees | | | 30,560 | |
Financial accounting fees | | | 2,209 | |
Trustees’ fees and officer compensation | | | 2,728 | |
Other accounts payable and accrued liabilities | | | 194,900 | |
Total liabilities | | | 120,100,823 | |
NET ASSETS | | $ | 252,688,054 | |
COMPOSITION OF NET ASSETS | | | | |
Paid in capital | | $ | 238,772,522 | |
Undistributed net investment income (loss) | | | (575,240 | ) |
Accumulated net realized gain (loss) on investments, foreign currency transactions, written options and short positions | | | 2,554,249 | |
Unrealized appreciation (depreciation) of investments, foreign currency translations, written options and short positions | | | 11,936,523 | |
NET ASSETS | | $ | 252,688,054 | |
CLASS A SHARES† | | | | |
Net assets applicable to shares outstanding | | $ | 37,614,033 | |
Shares outstanding | | | 3,128,102 | |
Net asset value and redemption price per share | | $ | 12.02 | |
Maximum offering price per share (Net asset value, plus 4.75% of offering price) | | $ | 12.62 | |
CLASS B SHARES | | | | |
Net assets applicable to shares outstanding | | $ | — | |
Shares outstanding | | | — | |
Net asset value and redemption price per share | | $ | — | |
CLASS C SHARES†** | | | | |
Net assets applicable to shares outstanding | | $ | 15,248,261 | |
Shares outstanding | | | 1,277,891 | |
Net asset value and redemption price per share | | $ | 11.93 | |
CLASS I SHARES† | | | | |
Net assets applicable to shares outstanding | | $ | 199,800,288 | |
Shares outstanding | | | 16,561,804 | |
Net asset value and redemption price per share | | $ | 12.06 | |
CLASS R SHARES | | | | |
Net assets applicable to shares outstanding | | $ | — | |
Shares outstanding | | | — | |
Net asset value and redemption price per share | | $ | — | |
CLASS T SHARES†(a) | | | | |
Net assets applicable to shares outstanding | | $ | 25,472 | |
Shares outstanding | | | 2,119 | |
Net asset value and redemption price per share | | $ | 12.02 | |
| † | No par value; unlimited number of shares authorized. |
| ** | Redemption price may be reduced by contingent deferred sales charge. |
| (a) | Class T commenced operations on February 28, 2017. |
| | | | |
| 126 | | CALAMOS OPEN-END FAMILY OF FUNDS SEMIANNUAL REPORT | | See accompanying Notes to Financial Statements |
Statements of Operations Six Months Ended April 30, 2017 (Unaudited)
| | | | | | | | | | | | | | | | | | | | |
| | | GROWTH FUND | | | OPPORTUNISTIC
VALUE FUND | | | DIVIDEND
GROWTH FUND | | | INTERNATIONAL
GROWTH FUND | | | EVOLVING WORLD
GROWTH FUND | |
INVESTMENT INCOME | | | | | | | | | | | | | | | | | | | | |
Interest | | $ | — | | | $ | 204 | | | $ | 934 | | | $ | — | | | $ | 825,921 | |
Dividends | | | 7,998,242 | | | | 655,666 | | | | 341,520 | | | | 2,720,528 | | | | 2,707,007 | |
Securities lending income | | | 18,600 | | | | 1,246 | | | | 20 | | | | 26,759 | | | | 15,519 | |
Dividend taxes withheld | | | (22,823 | ) | | | (129 | ) | | | — | | | | (264,798 | ) | | | (175,249 | ) |
Total investment income | | | 7,994,019 | | | | 656,987 | | | | 342,474 | | | | 2,482,489 | | | | 3,373,198 | |
| | | | | |
EXPENSES | | | | | | | | | | | | | | | | | | | | |
Investment advisory fees | | | 7,866,972 | | | | 285,657 | | | | 159,631 | | | | 1,338,473 | | | | 1,816,688 | |
Distribution fees | | | | | | | | | | | | | | | | | | | | |
Class A | | | 1,197,810 | | | | 41,657 | | | | 30,795 | | | | 110,190 | | | | 104,169 | |
Class B | | | 18,837 | | | | 373 | | | | — | | | | 939 | | | | 357 | |
Class C | | | 2,515,632 | | | | 27,257 | | | | 5,284 | | | | 148,628 | | | | 130,672 | |
Class R | | | 17,697 | | | | 330 | | | | 133 | (a) | | | 13,192 | | | | 5,957 | |
Class T(b) | | | 11 | | | | 11 | | | | 11 | | | | 11 | | | | 11 | |
Transfer agent fees | | | 1,427,551 | | | | 24,284 | | | | 9,334 | | | | 216,421 | | | | 246,855 | |
Legal fees | | | 205,792 | | | | 14,959 | | | | 10,458 | | | | 40,322 | | | | 25,392 | |
Printing and mailing fees | | | 192,821 | | | | 3,538 | | | | 3,752 | | | | 18,091 | | | | 25,221 | |
Financial accounting fees | | | 103,391 | | | | 3,325 | | | | 1,857 | | | | 17,537 | | | | 19,223 | |
Accounting fees | | | 65,924 | | | | 16,052 | | | | 13,281 | | | | 19,903 | | | | 20,724 | |
Trustees’ fees and officer compensation | | | 57,024 | | | | 8,746 | | | | 8,070 | | | | 15,747 | | | | 17,289 | |
Registration fees | | | 56,422 | | | | 29,000 | | | | 31,743 | | | | 40,722 | | | | 40,126 | |
Custodian fees | | | 34,454 | | | | 2,764 | | | | 1,327 | | | | 61,648 | | | | 138,675 | |
Audit fees | | | 28,533 | | | | 5,248 | | | | 4,881 | | | | 8,489 | | | | 8,835 | |
Dividend or interest expense on short positions | | | — | | | | — | | | | — | | | | — | | | | — | |
Offering costs | | | — | | | | — | | | | — | | | | — | | | | — | |
Other | | | 93,736 | | | | 9,106 | | | | 10,334 | | | | 57,266 | | | | 43,875 | |
Total expenses | | | 13,882,607 | | | | 472,307 | | | | 290,891 | | | | 2,107,579 | | | | 2,644,069 | |
Less expense reductions | | | — | | | | (146,593 | ) | | | (78,938 | ) | | | (143,325 | ) | | | — | |
Net expenses | | | 13,882,607 | | | | 325,714 | | | | 211,953 | | | | 1,964,254 | | | | 2,644,069 | |
NET INVESTMENT INCOME (LOSS) | | | (5,888,588 | ) | | | 331,273 | | | | 130,521 | | | | 518,235 | | | | 729,129 | |
| | | | | |
REALIZED AND UNREALIZED GAIN (LOSS) | | | | | | | | | | | | | | | | | | | | |
Net realized gain (loss) from: | | | | | | | | | | | | | | | | | | | | |
Investments, excluding purchased options | | | 190,016,580 | | | | 1,966,621 | | | | 1,114,837 | | | | 7,383,280 | (c) | | | (6,178,102 | )(c) |
Purchased options | | | (972,105 | ) | | | — | | | | — | | | | 313,199 | | | | 78,753 | |
Foreign currency transactions | | | (83 | ) | | | (18 | ) | | | — | | | | 211,512 | | | | (193,743 | ) |
Written options | | | 2,667,099 | | | | — | | | | — | | | | — | | | | 31,308 | |
Short positions | | | — | | | | — | | | | — | | | | — | | | | — | |
Change in net unrealized appreciation/(depreciation) on: | | | | | | | | | | | | | | | | | | | | |
Investments, excluding purchased options | | | 16,679,819 | | | | 3,575,116 | | | | 2,810,559 | | | | 12,167,898 | (d) | | | 18,405,082 | (d) |
Purchased options | | | 1,589,574 | | | | — | | | | — | | | | 186,921 | | | | (1,044,906 | ) |
Foreign currency translations | | | (213 | ) | | | — | | | | — | | | | 167,315 | | | | 35,040 | |
Written options | | | 385,358 | | | | — | | | | — | | | | — | | | | — | |
Short positions | | | — | | | | — | | | | — | | | | — | | | | — | |
NET GAIN (LOSS) | | | 210,366,029 | | | | 5,541,719 | | | | 3,925,396 | | | | 20,430,125 | | | | 11,133,432 | |
NET INCREASE (DECREASE) IN NET ASSETS RESULTING FROM OPERATIONS | | $ | 204,477,441 | | | $ | 5,872,992 | | | $ | 4,055,917 | | | $ | 20,948,360 | | | $ | 11,862,561 | |
| (a) | Class R shares were liquidated on January 23, 2017. |
| (b) | Class T commenced operations on February 28, 2017. |
| (c) | Net of foreign capital gains tax of $181,359 and $682,700, respectively. |
| (d) | Net of change of $(423,973) and (455,027), respectively in deferred capital gains tax. |
| | | | | | |
| See accompanying Notes to Financial Statements | | www.calamos.com | | | 127 | |
Statements of Operations Six Months Ended April 30, 2017 (Unaudited)
| | | | | | | | | | | | | | | | | | | | |
| | | EMERGING MARKET
EQUITY FUND | | | GLOBAL
EQUITY FUND | | | GROWTH AND
INCOME FUND | | | GLOBAL
GROWTH AND
INCOME FUND | | | CONVERTIBLE FUND | |
INVESTMENT INCOME | | | | | | | | | | | | | | | | | | | | |
Interest | | $ | — | | | $ | — | | | $ | 8,843,473 | | | $ | 1,403,741 | | | $ | 8,475,295 | |
Dividends | | | 105,334 | | | | 859,686 | | | | 19,953,076 | | | | 1,969,487 | | | | 4,226,537 | |
Securities lending income | | | 172 | | | | 13,678 | | | | 105,540 | | | | 19,046 | | | | 86,846 | |
Dividend taxes withheld | | | (9,299 | ) | | | (52,438 | ) | | | — | | | | (86,998 | ) | | | — | |
Total investment income | | | 96,207 | | | | 820,926 | | | | 28,902,089 | | | | 3,305,276 | | | | 12,788,678 | |
| | | | | |
EXPENSES | | | | | | | | | | | | | | | | | | | | |
Investment advisory fees | | | 74,545 | | | | 572,506 | | | | 7,267,557 | | | | 1,235,487 | | | | 2,282,974 | |
Distribution fees | | | | | | | | | | | | | | | | | | | | |
Class A | | | 5,342 | | | | 32,158 | | | | 1,127,214 | | | | 95,330 | | | | 274,439 | |
Class B | | | — | | | | 608 | | | | 12,293 | | | | 1,789 | | | | 11,716 | |
Class C | | | 1,501 | | | | 73,214 | | | | 3,516,579 | | | | 414,430 | | | | 890,366 | |
Class R | | | 92 | (a) | | | 10,250 | | | | 32,475 | | | | 3,009 | | | | 3,952 | |
Class T(b) | | | 11 | | | | 11 | | | | 11 | | | | 11 | | | | 11 | |
Transfer agent fees | | | 5,360 | | | | 76,607 | | | | 1,237,102 | | | | 168,163 | | | | 345,153 | |
Legal fees | | | 9,541 | | | | 16,808 | | | | 98,054 | | | | 25,946 | | | | 34,697 | |
Printing and mailing fees | | | 2,576 | | | | — | | | | 140,182 | | | | 18,726 | | | | 35,893 | |
Financial accounting fees | | | 788 | | | | 7,228 | | | | 123,473 | | | | 14,381 | | | | 35,898 | |
Accounting fees | | | 10,154 | | | | 14,683 | | | | 75,367 | | | | 19,794 | | | | 29,534 | |
Trustees’ fees and officer compensation | | | 7,585 | | | | 10,873 | | | | 71,897 | | | | 14,937 | | | | 24,126 | |
Registration fees | | | 36,432 | | | | 23,352 | | | | 40,720 | | | | 35,911 | | | | 40,854 | |
Custodian fees | | | 18,253 | | | | 18,680 | | | | 28,544 | | | | 18,268 | | | | 4,371 | |
Audit fees | | | 4,617 | | | | 6,275 | | | | 36,053 | | | | 8,094 | | | | 13,712 | |
Dividend or interest expense on short positions | | | — | | | | — | | | | — | | | | — | | | | — | |
Offering costs | | | — | | | | — | | | | — | | | | — | | | | — | |
Other | | | 11,615 | | | | 14,346 | | | | 98,471 | | | | 36,352 | | | | 37,241 | |
Total expenses | | | 188,412 | | | | 877,599 | | | | 13,905,992 | | | | 2,110,628 | | | | 4,064,937 | |
Less expense reductions | | | (79,711 | ) | | | (65,060 | ) | | | — | | | | — | | | | — | |
Net expenses | | | 108,701 | | | | 812,539 | | | | 13,905,992 | | | | 2,110,628 | | | | 4,064,937 | |
NET INVESTMENT INCOME (LOSS) | | | (12,494 | ) | | | 8,387 | | | | 14,996,097 | | | | 1,194,648 | | | | 8,723,741 | |
| | | | | |
REALIZED AND UNREALIZED GAIN (LOSS) | | | | | | | | | | | | | | | | | | | | |
Net realized gain (loss) from: | | | | | | | | | | | | | | | | | | | | |
Investments, excluding purchased options | | | (325,100 | ) | | | 9,397,710 | (c) | | | 89,561,296 | | | | 3,361,433 | | | | 25,055,135 | (c) |
Purchased options | | | 923 | | | | (24,058 | ) | | | (10,984,928 | ) | | | (855,295 | ) | | | 727,853 | |
Foreign currency transactions | | | (6,522 | ) | | | 267,135 | | | | — | | | | 247,528 | | | | (19,987 | ) |
Written options | | | — | | | | — | | | | 2,733,656 | | | | 471,666 | | | | — | |
Short positions | | | — | | | | — | | | | — | | | | — | | | | — | |
Change in net unrealized appreciation/(depreciation) on: | | | | | | | | | | | | | | | | | | | | |
Investments, excluding purchased options | | | 982,211 | | | | 2,366,113 | (d) | | | 105,129,110 | | | | 10,614,329 | (d) | | | 18,124,641 | |
Purchased options | | | (5,898 | ) | | | — | | | | (1,260,877 | ) | | | 52,411 | | | | (443,029 | ) |
Foreign currency translations | | | 828 | | | | 1,535 | | | | — | | | | 119,260 | | | | (151 | ) |
Written options | | | — | | | | — | | | | (779,322 | ) | | | — | | | | — | |
Short positions | | | — | | | | — | | | | — | | | | — | | | | — | |
NET GAIN (LOSS) | | | 646,442 | | | | 12,008,435 | | | | 184,398,935 | | | | 14,011,332 | | | | 43,444,462 | |
NET INCREASE (DECREASE) IN NET ASSETS RESULTING FROM OPERATIONS | | $ | 633,948 | | | $ | 12,016,822 | | | $ | 199,395,032 | | | $ | 15,205,980 | | | $ | 52,168,203 | |
| (a) | Class R shares were liquidated on January 23, 2017. |
| (b) | Class T commenced operations on February 28, 2017. |
| (c) | Net of foreign capital gains tax of $41,708 and $(3), respectively. |
| (d) | Net of change of $(147,975) and (24,949), respectively in deferred capital gains tax. |
| | | | |
| 128 | | CALAMOS OPEN-END FAMILY OF FUNDS SEMIANNUAL REPORT | | See accompanying Notes to Financial Statements |
Statements of Operations Six Months Ended April 30, 2017 (Unaudited)
| | | | | | | | | | | | | | | | | | | | |
| | | GLOBAL
CONVERTIBLE FUND | | | TOTAL RETURN
BOND FUND | | | HIGH
INCOME FUND | | | MARKET NEUTRAL
INCOME FUND | | | HEDGED EQUITY
INCOME FUND | |
INVESTMENT INCOME | | | | | | | | | | | | | | | | | | | | |
Interest | | $ | 1,118,487 | | | $ | 1,354,302 | | | $ | 1,854,144 | | | $ | 34,998,075 | | | $ | — | |
Dividends | | | 386,387 | | | | 3,330 | | | | 18,976 | | | | 29,499,724 | | | | 180,109 | |
Securities lending income | | | 4,647 | | | | 541 | | | | 13,928 | | | | 94,845 | | | | — | |
Dividend Taxes Withheld | | | (3,285 | ) | | | — | | | | — | | | | (131,250 | ) | | | — | |
Total investment income | | | 1,506,236 | | | | 1,358,173 | | | | 1,887,048 | | | | 64,461,394 | | | | 180,109 | |
| | | | | |
EXPENSES | | | | | | | | | | | | | | | | | | | | |
Investment advisory fees | | | 326,602 | | | | 239,411 | | | | 244,634 | | | | 13,731,548 | | | | 60,319 | |
Distribution fees | | | | | | | | | | | | | | | | | | | | |
Class A | | | 38,790 | | | | 64,475 | | | | 49,075 | | | | 1,162,841 | | | | 9,753 | |
Class B | | | — | | | | 1,637 | | | | 932 | | | | 1,506 | | | | — | |
Class C | | | 11,142 | | | | 71,548 | | | | 82,770 | | | | 1,561,386 | | | | 795 | |
Class R | | | 1,223 | | | | 903 | | | | 510 | | | | 21,099 | | | | 120 | (a) |
Class T(b) | | | 11 | | | | 11 | | | | 11 | | | | 11 | | | | 11 | |
Transfer agent fees | | | 45,003 | | | | 43,882 | | | | 42,757 | | | | 2,011,179 | | | | 6,246 | |
Legal fees | | | 12,256 | | | | 12,682 | | | | 11,624 | | | | 171,858 | | | | 9,700 | |
Printing and mailing fees | | | 9,042 | | | | 7,686 | | | | 8,787 | | | | 223,340 | | | | 2,743 | |
Financial accounting fees | | | 4,472 | | | | 5,067 | | | | 3,797 | | | | 239,207 | | | | 937 | |
Accounting fees | | | 12,693 | | | | 14,223 | | | | 13,885 | | | | 162,586 | | | | 19,362 | |
Trustees’ fees and officer compensation | | | 9,764 | | | | 9,993 | | | | 8,913 | | | | 131,976 | | | | 7,267 | |
Registration fees | | | 28,121 | | | | 31,450 | | | | 34,966 | | | | 85,658 | | | | 25,911 | |
Custodian fees | | | 3,970 | | | | 2,115 | | | | 2,109 | | | | 67,081 | | | | 8,699 | |
Audit fees | | | 5,621 | | | | 5,732 | | | | 5,564 | | | | 66,124 | | | | 4,690 | |
Dividend or interest expense on short positions | | | — | | | | — | | | | — | | | | 3,826,917 | | | | — | |
Offering costs | | | — | | | | — | | | | — | | | | — | | | | — | |
Other | | | 8,707 | | | | 11,782 | | | | 10,376 | | | | 155,588 | | | | 4,828 | |
Total expenses | | | 517,417 | | | | 522,597 | | | | 520,710 | | | | 23,619,905 | | | | 161,381 | |
Less expense reductions | | | (43,286 | ) | | | (100,631 | ) | | | — | | | | — | | | | (72,680 | ) |
Net expenses | | | 474,131 | | | | 421,966 | | | | 520,710 | | | | 23,619,905 | | | | 88,701 | |
NET INVESTMENT INCOME (LOSS) | | | 1,032,105 | | | | 936,207 | | | | 1,366,338 | | | | 40,841,489 | | | | 91,408 | |
| | | | | |
REALIZED AND UNREALIZED GAIN (LOSS) | | | | | | | | | | | | | | | | | | | | |
Net realized gain (loss) from: | | | | | | | | | | | | | | | | | | | | |
Investments, excluding purchased options | | | 798,990 | | | | 195,086 | | | | (583,670 | ) | | | 57,706,590 | | | | 476,137 | |
Purchased options | | | 1,197,531 | | | | — | | | | — | | | | (62,947,752 | ) | | | (544,243 | ) |
Foreign currency transactions | | | (9,290 | ) | | | — | | | | — | | | | 112,162 | | | | — | |
Written options | | | 46,725 | | | | — | | | | — | | | | (16,446,122 | ) | | | (202,043 | ) |
Short positions | | | — | | | | — | | | | — | | | | (43,359,408 | ) | | | — | |
Change in net unrealized appreciation/(depreciation) on: | | | | | | | | | | | | | | | | | | | | |
Investments, excluding purchased options | | | 2,211,558 | | | | (1,567,602 | ) | | | 2,256,106 | | | | 359,591,567 | | | | 1,509,838 | |
Purchased options | | | 128,992 | | | | — | | | | — | | | | 6,578,230 | | | | (15,232 | ) |
Foreign currency translations | | | 2,345 | | | | — | | | | — | | | | 609,856 | | | | — | |
Written options | | | — | | | | — | | | | — | | | | (62,627,662 | ) | | | (389,357 | ) |
Short positions | | | — | | | | — | | | | — | | | | (157,166,093 | ) | | | — | |
NET GAIN (LOSS) | | | 4,376,851 | | | | (1,372,516 | ) | | | 1,672,436 | | | | 82,051,368 | | | | 835,100 | |
NET INCREASE (DECREASE) IN NET ASSETS RESULTING FROM OPERATIONS | | $ | 5,408,956 | | | $ | (436,309 | ) | | $ | 3,038,774 | | | $ | 122,892,857 | | | $ | 926,508 | |
| (a) | Class R shares were liquidated on January 23, 2017. |
| (a) | Class T commenced operations on February 28, 2017. |
| | | | | | |
| See accompanying Notes to Financial Statements | | www.calamos.com | | | 129 | |
Statements of Operations Six Months Ended April 30, 2017 (Unaudited)
| | | | |
| | | PHINEUS
LONG/SHORT
FUND | |
INVESTMENT INCOME | | | | |
Interest | | $ | 13,238 | |
Dividends | | | 1,031,526 | |
Securities lending income | | | 25,348 | |
Dividend taxes withheld | | | — | |
Total investment income | | | 1,070,112 | |
| |
EXPENSES | | | | |
Investment advisory fees | | | 947,811 | |
Distribution fees | | | | |
Class A | | | 32,943 | |
Class B | | | — | |
Class C | | | 46,291 | |
Class R | | | — | |
Class T(a) | | | 11 | |
Transfer agent fees | | | 56,312 | |
Legal fees | | | 3,865 | |
Printing and mailing fees | | | — | |
Financial accounting fees | | | 8,628 | |
Accounting fees | | | 14,669 | |
Trustees’ fees and officer compensation | | | 10,810 | |
Registration fees | | | 22,165 | |
Custodian fees | | | 15,839 | |
Audit fees | | | 4,192 | |
Dividend or interest expense on short positions | | | 737,439 | |
Offering costs and organizational fees | | | 91,884 | |
Other | | | 5,868 | |
Total expenses | | | 1,998,727 | |
Less expense reductions | | | (1,986 | ) |
Net expenses | | | 1,996,741 | |
NET INVESTMENT INCOME (LOSS) | | | (926,629 | ) |
| |
REALIZED AND UNREALIZED GAIN (LOSS) | | | | |
Net realized gain (loss) from: | | | | |
Investments, excluding purchased options | | | 6,509,596 | |
Purchased options | | | (5,057,654 | ) |
Foreign currency transactions | | | (8,323 | ) |
Written options | | | 5,141,800 | |
Short positions | | | (2,965,456 | ) |
Change in net unrealized appreciation/(depreciation) on: | | | | |
Investments, excluding purchased options | | | 16,479,825 | |
Purchased options | | | (1,578,787 | ) |
Foreign currency translations | | | (486 | ) |
Written options | | | 623,379 | |
Short positions | | | (4,974,378 | ) |
NET GAIN (LOSS) | | | 14,169,516 | |
NET INCREASE (DECREASE) IN NET ASSETS RESULTING FROM OPERATIONS | | $ | 13,242,887 | |
| (a) | Class T commenced operations on February 28, 2017. |
| | | | |
| 130 | | CALAMOS OPEN-END FAMILY OF FUNDS SEMIANNUAL REPORT | | See accompanying Notes to Financial Statements |
Statements of Changes in Net Assets
| | | | | | | | | | | | | | | | | | | | | | | | |
| | | GROWTH FUND | | | OPPORTUNISTIC VALUE FUND | | | DIVIDEND GROWTH FUND | |
| | | (UNAUDITED) SIX MONTHS ENDED APRIL 30, 2017 | | | YEAR ENDED
OCTOBER 31,
2016 | | | (UNAUDITED)
SIX MONTHS ENDED APRIL 30,
2017 | | | YEAR ENDED
OCTOBER 31,
2016 | | | (UNAUDITED)
SIX MONTHS ENDED APRIL 30,
2017 | | | YEAR ENDED
OCTOBER 31,
2016 | |
OPERATIONS | | | | | | | | | | | | | | | | | | | | | | | | |
Net investment income (loss) | | $ | (5,888,588 | ) | | $ | (8,582,049 | ) | | $ | 331,273 | | | $ | 994,790 | | | $ | 130,521 | | | $ | 345,823 | |
Net realized gain (loss) | | | 191,711,491 | | | | 79,273,971 | | | | 1,966,603 | | | | (2,021,304 | ) | | | 1,114,837 | | | | (46,563 | ) |
Change in unrealized appreciation/(depreciation) | | | 18,654,538 | | | | (198,113,940 | ) | | | 3,575,116 | | | | 1,493,336 | | | | 2,810,559 | | | | 434,952 | |
Net increase (decrease) in net assets resulting from operations | | | 204,477,441 | | | | (127,422,018 | ) | | | 5,872,992 | | | | 466,822 | | | | 4,055,917 | | | | 734,212 | |
| | | | | | |
DISTRIBUTIONS TO SHAREHOLDERS | | | | | | | | | | | | | | | | | | | | | | | | |
Net investment income | | | | | | | | | | | | | | | | | | | | | | | | |
Class A | | | — | | | | — | | | | (242,435 | ) | | | (461,754 | ) | | | (77,009 | ) | | | (216,496 | ) |
Class B | | | — | | | | — | | | | — | | | | — | | | | — | | | | — | |
Class C | | | — | | | | — | | | | (3,013 | ) | | | (21,633 | ) | | | (1,452 | ) | | | (1,501 | ) |
Class I | | | — | | | | — | | | | (176,657 | ) | | | (262,284 | ) | | | (29,327 | ) | | | (97,516 | ) |
Class R | | | — | | | | — | | | | (637 | ) | | | (1,573 | ) | | | (231 | )(a) | | | (568 | ) |
Class T(b) | | | — | | | | — | | | | — | | | | — | | | | (20 | ) | | | — | |
Net realized gains | | | | | | | | | | | | | | | | | | | | | | | | |
Class A | | | (38,507,349 | ) | | | (348,035,713 | ) | | | — | | | | (2,547,648 | ) | | | — | | | | (740,530 | ) |
Class B | | | (202,787 | ) | | | (4,805,396 | ) | | | — | | | | (10,092 | ) | | | — | | | | — | |
Class C | | | (28,962,503 | ) | | | (243,604,217 | ) | | | — | | | | (403,800 | ) | | | — | | | | (18,239 | ) |
Class I | | | (9,770,431 | ) | | | (91,511,948 | ) | | | — | | | | (1,163,377 | ) | | | — | | | | (186,792 | ) |
Class R | | | (308,256 | ) | | | (2,356,702 | ) | | | — | | | | (10,292 | ) | | | — | (a) | | | (2,828 | ) |
Return of capital | | | | | | | | | | | | | | | | | | | | | | | | |
Class A | | | — | | | | — | | | | — | | | | — | | | | — | | | | — | |
Class C | | | — | | | | — | | | | — | | | | — | | | | — | | | | — | |
Class I | | | — | | | | — | | | | — | | | | — | | | | — | | | | — | |
Class R | | | — | | | | — | | | | — | | | | — | | | | — | (a) | | | — | |
Total distributions | | | (77,751,326 | ) | | | (690,313,976 | ) | | | (422,742 | ) | | | (4,882,453 | ) | | | (108,039 | ) | | | (1,264,470 | ) |
| | | | | | |
CAPITAL SHARE TRANSACTIONS | | | (284,056,534 | ) | | | (9,134,141 | ) | | | (3,727,761 | ) | | | (11,875,283 | ) | | | (6,381,439 | ) | | | (3,459,187 | ) |
TOTAL INCREASE (DECREASE) IN NET ASSETS | | | (157,330,419 | ) | | | (826,870,135 | ) | | | 1,722,489 | | | | (16,290,914 | ) | | | (2,433,561 | ) | | | (3,989,445 | ) |
| | | | | | |
NET ASSETS | | | | | | | | | | | | | | | | | | | | | | | | |
Beginning of period | | $ | 1,899,255,253 | | | $ | 2,726,125,388 | | | $ | 54,150,527 | | | $ | 70,441,441 | | | $ | 32,226,445 | | | $ | 36,215,890 | |
End of period | | | 1,741,924,834 | | | | 1,899,255,253 | | | | 55,873,016 | | | | 54,150,527 | | | | 29,792,884 | | | | 32,226,445 | |
Undistributed net investment income (loss) | | $ | (6,702,983 | ) | | $ | (814,395 | ) | | $ | 130,725 | | | $ | 222,194 | | | $ | 9,104 | | | $ | (13,378 | ) |
| (a) | Class R shares were liquidated on January 23, 2017. |
| (b) | Class T commenced operations on February 28, 2017. |
| | | | | | |
| See accompanying Notes to Financial Statements | | www.calamos.com | | | 131 | |
Statements of Changes in Net Assets
| | | | | | | | | | | | | | | | | | | | | | | | |
| | | INTERNATIONAL GROWTH FUND | | | EVOLVING WORLD GROWTH FUND | | | EMERGING MARKET EQUITY FUND | |
| | | (UNAUDITED) SIX MONTHS ENDED
APRIL 30,
2017 | | | YEAR ENDED OCTOBER 31,
2016 | | | (UNAUDITED) SIX MONTHS ENDED APRIL 30,
2017 | | | YEAR ENDED OCTOBER 31,
2016 | | | (UNAUDITED) SIX MONTHS ENDED APRIL 30
, 2017 | | | YEAR ENDED OCTOBER 31,
2016 | |
OPERATIONS | | | | | | | | | | | | | | | | | | | | | | | | |
Net investment income (loss) | | $ | 518,235 | | | $ | 1,744,029 | | | $ | 729,129 | | | $ | 1,588,700 | | | $ | (12,494 | ) | | $ | (11,044 | ) |
Net realized gain (loss) | | | 7,907,991 | | | | (14,871,567 | ) | | | (6,261,784 | ) | | | (55,914,683 | ) | | | (330,699 | ) | | | (1,864,042 | ) |
Change in unrealized appreciation/(depreciation) | | | 12,522,134 | | | | (11,755,074 | ) | | | 17,395,216 | | | | 59,616,104 | | | | 977,141 | | | | 2,192,046 | |
Net increase (decrease) in net assets resulting from operations | | | 20,948,360 | | | | (24,882,612 | ) | | | 11,862,561 | | | | 5,290,121 | | | | 633,948 | | | | 316,960 | |
| | | | | | |
DISTRIBUTIONS TO SHAREHOLDERS | | | | | | | | | | | | | | | | | | | | | | | | |
Net investment income | | | | | | | | | | | | | | | | | | | | | | | | |
Class A | | | — | | | | — | | | | — | | | | (92,298 | ) | | | — | | | | (4,645 | ) |
Class B | | | — | | | | — | | | | — | | | | — | | | | — | | | | — | |
Class C | | | — | | | | — | | | | — | | | | — | | �� | | — | | | | — | |
Class I | | | — | | | | — | | | | — | | | | (1,118,827 | ) | | | — | | | | (40,284 | ) |
Class R | | | — | | | | — | | | | — | | | | — | | | | — | (a) | | | — | |
Class T(b) | | | — | | | | — | | | | — | | | | — | | | | — | | | | — | |
Net realized gains | | | | | | | | | | | | | | | | | | | | | | | | |
Class A | | | — | | | | (265,527 | ) | | | — | | | | — | | | | — | | | | — | |
Class B | | | — | | | | (1,374 | ) | | | — | | | | — | | | | — | | | | — | |
Class C | | | — | | | | (71,981 | ) | | | — | | | | — | | | | — | | | | — | |
Class I | | | — | | | | (432,402 | ) | | | — | | | | — | | | | — | | | | — | |
Class R | | | — | | | | (11,458 | ) | | | — | | | | — | | | | — | (a) | | | — | |
Return of capital | | | | | | | | | | | | | | | | | | | | | | | | |
Class A | | | — | | | | (67 | ) | | | — | | | | (31 | ) | | | — | | | | — | |
Class C | | | — | | | | (18 | ) | | | — | | | | — | | | | — | | | | — | |
Class I | | | — | | | | (112 | ) | | | — | | | | (371 | ) | | | — | | | | (3 | ) |
Class R | | | — | | | | (3 | ) | | | — | | | | — | | | | — | (a) | | | — | |
Total distributions | | | — | | | | (782,942 | ) | | | — | | | | (1,211,527 | ) | | | — | | | | (44,932 | ) |
| | | | | | |
CAPITAL SHARE TRANSACTIONS | | | (102,765,423 | ) | | | (216,101,232 | ) | | | (91,887,336 | ) | | | (124,245,652 | ) | | | 318,165 | | | | 62,537 | |
TOTAL INCREASE (DECREASE) IN NET ASSETS | | | (81,817,063 | ) | | | (241,766,786 | ) | | | (80,024,775 | ) | | | (120,167,058 | ) | | | 952,113 | | | | 334,565 | |
| | | | | | |
NET ASSETS | | | | | | | | | | | | | | | | | | | | | | | | |
Beginning of period | | $ | 365,649,583 | | | $ | 607,416,369 | | | $ | 392,347,471 | | | $ | 512,514,529 | | | $ | 13,888,001 | | | $ | 13,553,436 | |
End of period | | | 283,832,520 | | | | 365,649,583 | | | | 312,322,696 | | | | 392,347,471 | | | | 14,840,114 | | | | 13,888,001 | |
Undistributed net investment income (loss) | | $ | 552,918 | | | $ | 34,683 | | | $ | 125,766 | | | $ | (603,363 | ) | | $ | (25,769 | ) | | $ | (13,275 | ) |
| (a) | Class R shares were liquidated on January 23, 2017. |
| (b) | Class T commenced operations on February 28, 2017. |
| | | | |
| 132 | | CALAMOS OPEN-END FAMILY OF FUNDS SEMIANNUAL REPORT | | See accompanying Notes to Financial Statements |
Statements of Changes in Net Assets
| | | | | | | | | | | | | | | | | | | | | | | | |
| | | GLOBAL EQUITY FUND | | | GROWTH AND INCOME FUND | | | GLOBAL GROWTH AND INCOME FUND | |
| | | (UNAUDITED)
SIX MONTHS
ENDED
APRIL 30,
2017 | | | YEAR ENDED OCTOBER 31,
2016 | | | (UNAUDITED)
SIX MONTHS
ENDED
APRIL 30,
2017 | | | YEAR ENDED OCTOBER 31,
2016 | | | (UNAUDITED)
SIX MONTHS
ENDED
APRIL 30,
2017 | | | YEAR ENDED OCTOBER 31,
2016 | |
OPERATIONS | | | | | | | | | | | | | | | | | | | | | | | | |
Net investment income (loss) | | $ | 8,387 | | | $ | 181,674 | | | $ | 14,996,097 | | | $ | 32,784,544 | | | $ | 1,194,648 | | | $ | 3,194,524 | |
Net realized gain (loss) | | | 9,640,787 | | | | 6,342,034 | | | | 81,310,024 | | | | 114,585,596 | | | | 3,225,332 | | | | (181,198 | ) |
Change in unrealized appreciation/(depreciation) | | | 2,367,648 | | | | (9,422,746 | ) | | | 103,088,911 | | | | (107,736,059 | ) | | | 10,786,000 | | | | (7,327,493 | ) |
Net increase (decrease) in net assets resulting from operations | | | 12,016,822 | | | | (2,899,038 | ) | | | 199,395,032 | | | | 39,634,081 | | | | 15,205,980 | | | | (4,314,167 | ) |
| | | | | | |
DISTRIBUTIONS TO SHAREHOLDERS | | | | | | | | | | | | | | | | | | | | | | | | |
Net investment income | | | | | | | | | | | | | | | | | | | | | | | | |
Class A | | | — | | | | — | | | | (17,254,823 | ) | | | (28,075,203 | ) | | | (5,246 | ) | | | — | |
Class B | | | — | | | | — | | | | (30,366 | ) | | | (82,983 | ) | | | — | | | | — | |
Class C | | | — | | | | — | | | | (10,731,735 | ) | | | (16,342,606 | ) | | | — | | | | — | |
Class I | | | — | | | | — | | | | (10,516,252 | ) | | | (16,557,645 | ) | | | (397,329 | ) | | | — | |
Class R | | | — | | | | — | | | | (233,539 | ) | | | (350,668 | ) | | | — | | | | — | |
Class T(a) | | | — | | | | — | | | | (142 | ) | | | — | | | | — | | | | — | |
Net realized gains | | | | | | | | | | | | | | | | | | | | | | | | |
Class A | | | (1,256,480 | ) | | | (769,768 | ) | | | (35,891,598 | ) | | | (45,158,073 | ) | | | (525,290 | ) | | | (1,349,284 | ) |
Class B | | | (6,812 | ) | | | (9,659 | ) | | | (97,445 | ) | | | (299,943 | ) | | | (3,262 | ) | | | (21,251 | ) |
Class C | | | (732,328 | ) | | | (434,202 | ) | | | (27,943,580 | ) | | | (36,267,311 | ) | | | (631,481 | ) | | | (1,583,129 | ) |
Class I | | | (3,617,965 | ) | | | (1,809,046 | ) | | | (20,242,117 | ) | | | (24,093,672 | ) | | | (768,618 | ) | | | (1,753,280 | ) |
Class R | | | (195,399 | ) | | | (111,823 | ) | | | (512,365 | ) | | | (617,691 | ) | | | (8,127 | ) | | | (16,132 | ) |
Return of capital | | | | | | | | | | | | | | | | | | | | | | | | |
Class A | | | — | | | | — | | | | — | | | | — | | | | — | | | | — | |
Class C | | | — | | | | — | | | | — | | | | — | | | | — | | | | — | |
Class I | | | — | | | | — | | | | — | | | | — | | | | — | | | | — | |
Class R | | | — | | | | — | | | | — | | | | — | | | | — | | | | — | |
Total distributions | | | (5,808,984 | ) | | | (3,134,498 | ) | | | (123,453,962 | ) | | | (167,845,795 | ) | | | (2,339,353 | ) | | | (4,723,076 | ) |
| | | | | | |
CAPITAL SHARE TRANSACTIONS | | | (24,187,479 | ) | | | (48,577,383 | ) | | | (192,656,076 | ) | | | (268,022,968 | ) | | | (88,947,774 | ) | | | (70,576,416 | ) |
TOTAL INCREASE (DECREASE) IN NET ASSETS | | | (17,979,641 | ) | | | (54,610,919 | ) | | | (116,715,006 | ) | | | (396,234,682 | ) | | | (76,081,147 | ) | | | (79,613,659 | ) |
| | | | | | |
NET ASSETS | | | | | | | | | | | | | | | | | | | | | | | | |
Beginning of period | | $ | 137,779,086 | | | $ | 192,390,005 | | | $ | 2,200,786,501 | | | $ | 2,597,021,183 | | | $ | 301,249,554 | | | $ | 380,863,213 | |
End of period | | | 119,799,445 | | | | 137,779,086 | | | | 2,084,071,495 | | | | 2,200,786,501 | | | | 225,168,407 | | | | 301,249,554 | |
Undistributed net investment income (loss) | | $ | (31,356 | ) | | $ | (39,743 | ) | | $ | (24,487,560 | ) | | $ | (716,800 | ) | | $ | 727,121 | | | $ | (64,952 | ) |
| (a) | Class T commenced operations on February 28, 2017. |
| | | | | | |
| See accompanying Notes to Financial Statements | | www.calamos.com | | | 133 | |
Statements of Changes in Net Assets
| | | | | | | | | | | | | | | | | | | | | | | | |
| | | CONVERTIBLE FUND | | | GLOBAL CONVERTIBLE FUND | | | TOTAL RETURN BOND FUND | |
| | | (UNAUDITED)
SIX MONTHS
ENDED
APRIL 30,
2017 | | | YEAR ENDED
OCTOBER 31,
2016 | | | (UNAUDITED)
SIX MONTHS
ENDED
APRIL 30,
2017 | | | YEAR ENDED
OCTOBER 31,
2016 | | | (UNAUDITED)
SIX MONTHS
ENDED
APRIL 30,
2017 | | | YEAR ENDED OCTOBER 31,
2016 | |
OPERATIONS | | | | | | | | | | | | | | | | | | | | | | | | |
Net investment income (loss) | | $ | 8,723,741 | | | $ | 25,530,300 | | | $ | 1,032,105 | | | $ | 2,020,816 | | | $ | 936,207 | | | $ | 2,101,928 | |
Net realized gain (loss) | | | 25,763,001 | | | | (12,221,709 | ) | | | 2,033,956 | | | | (1,605,553 | ) | | | 195,086 | | | | 584,521 | |
Change in unrealized appreciation/(depreciation) | | | 17,681,461 | | | | (11,762,686 | ) | | | 2,342,895 | | | | 846,289 | | | | (1,567,602 | ) | | | 1,591,782 | |
Net increase (decrease) in net assets resulting from operations | | | 52,168,203 | | | | 1,545,905 | | | | 5,408,956 | | | | 1,261,552 | | | | (436,309 | ) | | | 4,278,231 | |
| | | | | | |
DISTRIBUTIONS TO SHAREHOLDERS | | | | | | | | | | | | | | | | | | | | | | | | |
Net investment income | | | | | | | | | | | | | | | | | | | | | | | | |
Class A | | | (3,244,812 | ) | | | (9,968,030 | ) | | | (228,622 | ) | | | (471,747 | ) | | | (656,334 | ) | | | (1,538,080 | ) |
Class B | | | (15,118 | ) | | | (88,985 | ) | | | — | | | | — | | | | (3,298 | ) | | | (15,757 | ) |
Class C | | | (1,991,352 | ) | | | (6,260,029 | ) | | | (13,744 | ) | | | (22,952 | ) | | | (129,554 | ) | | | (314,236 | ) |
Class I | | | (3,859,460 | ) | | | (13,436,331 | ) | | | (414,558 | ) | | | (843,326 | ) | | | (286,914 | ) | | | (598,981 | ) |
Class R | | | (21,804 | ) | | | (62,952 | ) | | | (3,233 | ) | | | (3,926 | ) | | | (4,083 | ) | | | (8,971 | ) |
Class T(a) | | | (139 | ) | | | — | | | | (16 | ) | | | — | | | | (90 | ) | | | — | |
Net realized gains | | | | | | | | | | | | | | | | | | | | | | | | |
Class A | | | — | | | | (5,609,807 | ) | | | — | | | | — | | | | (47,020 | ) | | | (664,826 | ) |
Class B | | | — | | | | (66,643 | ) | | | — | | | | — | | | | (495 | ) | | | (11,396 | ) |
Class C | | | — | | | | (4,198,102 | ) | | | — | | | | — | | | | (13,285 | ) | | | (203,238 | ) |
Class I | | | — | | | | (6,966,433 | ) | | | — | | | | — | | | | (18,245 | ) | | | (230,880 | ) |
Class R | | | — | | | | (34,207 | ) | | | — | | | | — | | | | (311 | ) | | | (3,487 | ) |
Return of capital | | | | | | | | | | | | | | | | | | | | | | | | |
Class A | | | — | | | | — | | | | — | | | | — | | | | — | | | | — | |
Class C | | | — | | | | — | | | | — | | | | — | | | | — | | | | — | |
Class I | | | — | | | | — | | | | — | | | | — | | | | — | | | | — | |
Class R | | | — | | | | — | | | | — | | | | — | | | | — | | | | — | |
Total distributions | | | (9,132,685 | ) | | | (46,691,519 | ) | | | (660,173 | ) | | | (1,341,951 | ) | | | (1,159,629 | ) | | | (3,589,852 | ) |
| | | | | | |
CAPITAL SHARE TRANSACTIONS | | | (103,769,740 | ) | | | (404,034,664 | ) | | | (7,760,922 | ) | | | 34,591,298 | | | | (13,902,803 | ) | | | 10,963,762 | |
TOTAL INCREASE (DECREASE) IN NET ASSETS | | | (60,734,222 | ) | | | (449,180,278 | ) | | | (3,012,139 | ) | | | 34,510,899 | | | | (15,498,741 | ) | | | 11,652,141 | |
| | | | | | |
NET ASSETS | | | | | | | | | | | | | | | | | | | | | | | | |
Beginning of period | | $ | 665,618,726 | | | $ | 1,114,799,004 | | | $ | 79,564,365 | | | $ | 45,053,466 | | | $ | 96,877,069 | | | $ | 85,224,928 | |
End of period | | | 604,884,504 | | | | 665,618,726 | | | | 76,552,226 | | | | 79,564,365 | | | | 81,378,328 | | | | 96,877,069 | |
Undistributed net investment income (loss) | | $ | (3,405,526 | ) | | $ | (2,996,582 | ) | | $ | 271,221 | | | $ | (100,711 | ) | | $ | (230,019 | ) | | $ | (85,953 | ) |
| (a) | Class T commenced operations on February 28, 2017. |
| | | | |
| 134 | | CALAMOS OPEN-END FAMILY OF FUNDS SEMIANNUAL REPORT | | See accompanying Notes to Financial Statements |
Statements of Changes in Net Assets
| | | | | | | | | | | | | | | | | | | | | | | | |
| | | HIGH INCOME FUND | | | MARKET NEUTRAL INCOME FUND | | | HEDGED EQUITY INCOME FUND | |
| | | (UNAUDITED)
SIX MONTHS
ENDED APRIL 30,
2017 | | | YEAR ENDED
OCTOBER 31,
2016 | | | (UNAUDITED)
SIX MONTHS
ENDED
APRIL 30,
2017 | | | YEAR ENDED
OCTOBER 31,
2016 | | | (UNAUDITED)
SIX MONTHS
ENDED
APRIL 30,
2017 | | | YEAR ENDED
OCTOBER 31,
2016 | |
OPERATIONS | | | | | | | | | | | | | | | | | | | | | | | | |
Net investment income (loss) | | $ | 1,366,338 | | | $ | 3,951,449 | | | $ | 40,841,489 | | | $ | 75,644,461 | | | $ | 91,408 | | | $ | 166,302 | |
Net realized gain (loss) | | | (583,670 | ) | | | (5,078,931 | ) | | | (64,934,530 | ) | | | (17,809,051 | ) | | | (270,149 | ) | | | (451,298 | ) |
Change in unrealized appreciation/(depreciation) | | | 2,256,106 | | | | 4,641,429 | | | | 146,985,898 | | | | 62,758,252 | | | | 1,105,249 | | | | 899,250 | |
Net increase (decrease) in net assets resulting from operations | | | 3,038,774 | | | | 3,513,947 | | | | 122,892,857 | | | | 120,593,662 | | | | 926,508 | | | | 614,254 | |
| | | | | | |
DISTRIBUTIONS TO SHAREHOLDERS | | | | | | | | | | | | | | | | | | | | | | | | |
Net investment income | | | | | | | | | | | | | | | | | | | | | | | | |
Class A | | | (965,660 | ) | | | (2,566,700 | ) | | | (5,592,582 | ) | | | (12,315,287 | ) | | | (42,079 | ) | | | (116,799 | ) |
Class B | | | (3,301 | ) | | | (16,605 | ) | | | (178 | ) | | | (339 | ) | | | — | | | | — | |
Class C | | | (327,583 | ) | | | (789,624 | ) | | | (707,387 | ) | | | (1,441,834 | ) | | | (293 | ) | | | (912 | ) |
Class I | | | (232,086 | ) | | | (778,240 | ) | | | (21,211,798 | ) | | | (36,128,886 | ) | | | (44,877 | ) | | | (104,488 | ) |
Class R | | | (4,433 | ) | | | (8,297 | ) | | | (41,145 | ) | | | (80,343 | ) | | | (322 | )(a) | | | (1,295 | ) |
Class T(b) | | | (215 | ) | | | — | | | | (81 | ) | | | — | | | | (32 | ) | | | — | |
Net realized gains | | | | | | | | | | | | | | | | | | | | | | | | |
Class A | | | — | | | | — | | | | (14,401,508 | ) | | | (15,743,390 | ) | | | — | | | | (49,274 | ) |
Class B | | | — | | | | — | | | | (4,668 | ) | | | (20,890 | ) | | | — | | | | — | |
Class C | | | — | | | | — | | | | (4,704,234 | ) | | | (4,999,398 | ) | | | — | | | | (941 | ) |
Class I | | | — | | | | — | | | | (41,369,190 | ) | | | (35,916,097 | ) | | | — | | | | (48,109 | ) |
Class R | | | — | | | | — | | | | (128,066 | ) | | | (130,687 | ) | | | — | (a) | | | (877 | ) |
Return of capital | | | | | | | | | | | | | | | | | | | | | | | | |
Class A | | | — | | | | — | | | | — | | | | — | | | | — | | | | — | |
Class C | | | — | | | | — | | | | — | | | | — | | | | — | | | | — | |
Class I | | | — | | | | — | | | | — | | | | — | | | | — | | | | — | |
Class R | | | — | | | | — | | | | — | | | | — | | | | — | (a) | | | — | |
Total distributions | | | (1,533,278 | ) | | | (4,159,466 | ) | | | (88,160,837 | ) | | | (106,777,151 | ) | | | (87,603 | ) | | | (322,695 | ) |
| | | | | | |
CAPITAL SHARE TRANSACTIONS | | | (12,134,784 | ) | | | (36,059,312 | ) | | | 447,829,639 | | | | 94,143,472 | | | | (4,198,662 | ) | | | 6,888,865 | |
TOTAL INCREASE (DECREASE) IN NET ASSETS | | | (10,629,288 | ) | | | (36,704,831 | ) | | | 482,561,659 | | | | 107,959,983 | | | | (3,359,757 | ) | | | 7,180,424 | |
| | | | | | |
NET ASSETS | | | | | | | | | | | | | | | | | | | | | | | | |
Beginning of period | | $ | 74,239,864 | | | $ | 110,944,695 | | | $ | 3,886,526,886 | | | $ | 3,778,566,903 | | | $ | 18,568,335 | | | $ | 11,387,911 | |
End of period | | | 63,610,576 | | | | 74,239,864 | | | | 4,369,088,545 | | | | 3,886,526,886 | | | | 15,208,578 | | | | 18,568,335 | |
Undistributed net investment income (loss) | | $ | (258,753 | ) | | $ | (91,813 | ) | | $ | 9,057,715 | | | $ | (4,230,603 | ) | | $ | 8,775 | | | $ | 4,970 | |
| (a) | Class R shares were liquidated on January 23, 2017. |
| (b) | Class T commenced operations on February 28, 2017. |
| | | | | | |
| See accompanying Notes to Financial Statements | | www.calamos.com | | | 135 | |
Statements of Changes in Net Assets
| | | | | | | | |
| | | PHINEUS LONG/SHORT FUND | |
| | | (UNAUDITED)
SIX MONTHS ENDED
APRIL 30,
2017 | | | PERIOD ENDED
OCTOBER 31,
2016(b) | |
OPERATIONS | | | | | | | | |
Net investment income (loss) | | $ | (926,629 | ) | | $ | (197,595 | ) |
Net realized gain (loss) | | | 3,619,963 | | | | 666,458 | |
Change in unrealized appreciation/(depreciation) | | | 10,549,553 | | | | 1,864,058 | |
Net increase (decrease) in net assets resulting from operations | | | 13,242,887 | | | | 2,332,921 | |
| | |
DISTRIBUTIONS TO SHAREHOLDERS | | | | | | | | |
Net investment income | | | | | | | | |
Class A | | | — | | | | — | |
Class B | | | — | | | | — | |
Class C | | | — | | | | — | |
Class I | | | — | | | | — | |
Class R | | | — | | | | — | |
Class T(a) | | | — | | | | — | |
Net realized gains | | | | | | | | |
Class A | | | (181,954 | ) | | | — | |
Class B | | | — | | | | — | |
Class C | | | (55,519 | ) | | | — | |
Class I | | | (623,172 | ) | | | — | |
Class R | | | — | | | | — | |
Return of capital | | | | | | | | |
Class A | | | — | | | | — | |
Class C | | | — | | | | — | |
Class I | | | — | | | | — | |
Class R | | | — | | | | — | |
Total distributions | | | (860,645 | ) | | | — | |
| | |
CAPITAL SHARE TRANSACTIONS | | | 164,342,929 | | | | 73,629,962 | |
TOTAL INCREASE (DECREASE) IN NET ASSETS | | | 176,725,171 | | | | 75,962,883 | |
| | |
NET ASSETS | | | | | | | | |
Beginning of period | | $ | 75,962,883 | | | $ | — | |
End of period | | | 252,688,054 | | | | 75,962,883 | |
Undistributed net investment income (loss) | | $ | (575,240 | ) | | $ | 351,389 | |
| (a) | Class T commenced operations on February 28, 2017. |
| (b) | Phineus Long/Short Fund commenced operations April 5, 2016. |
| | | | |
| 136 | | CALAMOS OPEN-END FAMILY OF FUNDS SEMIANNUAL REPORT | | See accompanying Notes to Financial Statements |
Notes to Financial Statements (Unaudited)
Note 1 – Organization and Significant Accounting Policies
Organization. CALAMOS INVESTMENT TRUST, a Massachusetts business trust organized December 21, 1987 (the “Trust”), consists of sixteen series, Growth Fund, Opportunistic Value Fund, Dividend Growth Fund, International Growth Fund, Evolving World Growth Fund, Emerging Market Equity Fund, Global Equity Fund, Growth and Income Fund, Global Growth and Income Fund, Convertible Fund, Global Convertible Fund, Total Return Bond Fund, High Income Fund, Market Neutral Income Fund, Hedged Equity Income Fund, and Phineus Long/Short Fund (commenced operations on April 5, 2016), (each a “Fund” and collectively the “Funds”). The Trust is registered under the Investment Company Act of 1940 as amended (the “1940 Act”) as an open-end management investment company. The Fund is considered an investment company under U.S. GAAP and follows the accounting and reporting guidance applicable to investment companies. The Trust currently offers Class A, Class C, Class I, Class R and Class T shares of each of the Funds. Class B shares continue to be outstanding, but are no longer an offered class of shares. Class T shares continue to be outstanding, but are not available for purchase.
Fund Reorganizations. Pursuant to separate Agreement and Plan of Reorganizations (each, a “Reorganization” and collectively, the “Reorganizations”) approved by the Board of Trustees (“The Board”), the Acquiring Funds (as defined in the table below), acquired all of the assets and assumed all of the liabilities on October 14, 2016, of the Target Funds (as defined in the table below), each of which is a series of the Trust.
| | |
| TARGET FUND | | ACQUIRING FUND |
| Calamos Focus Growth Fund | | Calamos Growth Fund |
| Calamos Long/Short Fund | | Calamos Phineus Long/Short Fund |
Shareholders approved the Reorganization on October 11, 2016.
The Reorganizations were accomplished by an exchange of shares of the Acquiring Funds for corresponding shares then outstanding of the Target Funds at their net asset value on October 14, 2016. The Reorganization of each Target Fund into the corresponding Acquiring Fund will enable shareholders of each Target Fund to invest in a larger, potentially more efficient portfolio while continuing to pursue a similar but more flexible investment strategy.
The Reorganizations qualified as a tax-free reorganization for federal income tax purposes with no gain or loss recognized to the Target Funds or their shareholders.
For accounting and performance reporting purposes, the Acquiring Fund is the survivor.
As of October 14, 2016, the Target Funds’ and Acquiring Funds’ net assets were as follows:
| | | | | | | | |
| | | FOCUS GROWTH
FUND | | | LONG/SHORT
FUND | |
| Target Funds - Prior to Reorganizations: | | | | | | | | |
Net Assets | | $ | 47,038,894 | | | $ | 39,593,142 | |
Investment in securities, at value | | | 47,030,643 | | | | 37,813,424 | |
Securities sold short and Written options, at value | | | — | | | | (17,005,204 | ) |
Unrealized appreciation (depreciation) | | | 6,497,236 | | | | (477,088 | ) |
Shares outstanding | | | 3,327,166 | | | | 3,758,987 | |
| Acquiring Fund - Prior to Reorganizations: | | | | | | | | |
Net assets | | | 1,901,455,042 | | | | 32,869,376 | |
Shares Outstanding | | | 68,243,698 | | | | 3,119,350 | |
| Acquiring Fund - Post Reorganizations: | | | | | | | | |
Net assets | | | 1,948,493,936 | | | | 72,462,518 | |
Shares Outstanding | | | 69,714,744 | | | | 6,879,587 | |
|
| Pro forma results of operations of the combined entities for the entire period ended October 31, 2016, as though the acquisition had occurred as of the beginning of the fiscal year (rather than on the actual acquisition date), are as follows: | |
| | |
| Net investment income (loss) | | | (8,605,760 | ) | | | (749,208 | ) |
| Net realized gain (loss) | | | 77,965,288 | | | | (466,149 | ) |
| Change in unrealized appreciation/(depreciation) | | | (198,215,847 | ) | | | (1,005,834 | ) |
| | | | |
| Net increase (decrease) in net assets resulting from operations | | $ | (128,856,319 | ) | | $ | (2,221,191 | ) |
| | | | |
Notes to Financial Statements (Unaudited)
Because each combined fund has been managed as a single portfolio since the acquisitions were completed, it is not practicable to separate the amounts of revenue and earnings of the Acquired Funds that have been included in the Acquired Funds’ Statement of Operations since October 14, 2016.
Significant Accounting Policies. The financial statements have been prepared in conformity with accounting principles generally accepted in the United States of America (U.S. GAAP), and the Funds are considered an investment company under U.S. GAAP and follows the accounting and reporting guidance applicable to investment companies. Under U.S. GAAP, management is required to make certain estimates and assumptions at the date of the financial statements and actual results may differ from those estimates. Subsequent events, if any, through the date that the financial statements were issued, have been evaluated in the preparation of the financial statements. The following summarizes the significant accounting policies of the Funds:
Fund Valuation. The valuation of the Funds’ investments is in accordance with policies and procedures adopted by and under the ultimate supervision of the board of trustees.
Fund securities that are traded on U.S. securities exchanges, except option securities, are valued at the official closing price, which is the last current reported sales price on its principal exchange at the time each Fund determines its net asset value (“NAV”). Securities traded in the over-the-counter market and quoted on The NASDAQ Stock Market are valued at the NASDAQ Official Closing Price, as determined by NASDAQ, or lacking a NASDAQ Official Closing Price, the last current reported sale price on NASDAQ at the time a Fund determines its NAV. When a last sale or closing price is not available, equity securities, other than option securities, that are traded on a U.S. securities exchange and other equity securities traded in the over-the-counter market are valued at the mean between the most recent bid and asked quotations on its principal exchange in accordance with guidelines adopted by the board of trustees. Each option security traded on a U.S. securities exchange is valued at the mid-point of the consolidated bid/ask quote for the option security, also in accordance with guidelines adopted by the board of trustees. Each over-the-counter option that is not traded through the Options Clearing Corporation is valued based on a quotation provided by the counterparty to such option under the ultimate supervision of the board of trustees.
Fixed income securities, certain convertible preferred securities, and non-exchange traded derivatives are normally valued by independent pricing services or by dealers or brokers who make markets in such securities. Valuations of such fixed income securities, certain convertible preferred securities and non-exchange traded derivatives consider yield or price of equivalent securities of comparable quality, coupon rate, maturity, type of issue, trading characteristics and other market data and do not rely exclusively upon exchange or over-the-counter prices.
Trading on European and Far Eastern exchanges and over-the-counter markets is typically completed at various times before the close of business on each day on which the New York Stock Exchange (“NYSE”) is open. Each security trading on these exchanges or in over-the-counter markets may be valued utilizing a systematic fair valuation model provided by an independent pricing service approved by the board of trustees. The valuation of each security that meets certain criteria in relation to the valuation model is systematically adjusted to reflect the impact of movement in the U.S. market after the foreign markets close. Securities that do not meet the criteria, or that are principally traded in other foreign markets, are valued as of the last reported sale price at the time the respective Fund determines its NAV, or when reliable market prices or quotations are not readily available, at the mean between the most recent bid and asked quotations as of the close of the appropriate exchange or other designated time. Trading of foreign securities may not take place on every NYSE business day. In addition, trading may take place in various foreign markets on Saturdays or on other days when the NYSE is not open and on which the respective Fund’s NAV is not calculated.
If the pricing committee determines that the valuation of a security in accordance with the methods described above is not reflective of a fair value for such security, the security is valued at a fair value by the pricing committee, under the ultimate supervision of the board of trustees, following the guidelines and/or procedures adopted by the board of trustees.
Each Fund also may use fair value pricing, pursuant to guidelines adopted by the board of trustees and under the ultimate supervision of the board of trustees, if trading in the security is halted or if the value of a security it holds is materially affected by events occurring before the Fund’s pricing time but after the close of the primary market or exchange on which the security is listed. Those procedures may utilize valuations furnished by pricing services approved by the board of trustees, which may be based on market transactions for comparable securities and various relationships between securities that are generally recognized by institutional traders, a computerized matrix system, or appraisals derived from information concerning the securities or similar securities received from recognized dealers in those securities.
| | | | |
| 138 | | CALAMOS OPEN-END FAMILY OF FUNDS SEMIANNUAL REPORT | | |
Notes to Financial Statements (Unaudited)
When fair value pricing of securities is employed, the prices of securities used by the Fund to calculate its NAV may differ from market quotations or official closing prices. In light of the judgment involved in fair valuations, there can be no assurance that a fair value assigned to a particular security is accurate.
Investment Transactions. Investment transactions are recorded on a trade date basis as of April 30, 2017. Net realized gains and losses from investment transactions are reported on an identified cost basis. Interest income is recognized using the accrual method and includes accretion of original issue and market discount and amortization of premium. Dividend income is recognized on the ex-dividend date, except that certain dividends from foreign securities are recorded as soon as the information becomes available after the ex-dividend date.
Foreign Currency Translation. Values of investments and other assets and liabilities denominated in foreign currencies are translated into U.S. dollars using a rate quoted by a major bank or dealer in the particular currency market, as reported by a recognized quotation dissemination service.
The Funds do not isolate that portion of the results of operations resulting from changes in foreign exchange rates on investments from the fluctuations arising from changes in market prices of securities held. Such fluctuations are included with the net realized and unrealized gain or loss from investments.
Reported net realized foreign currency gains or losses arise from disposition of foreign currency, the difference in the foreign exchange rates between the trade and settlement dates on securities transactions, and the difference between the amounts of dividends, interest and foreign withholding taxes recorded on the ex-date or accrual date and the U.S. dollar equivalent of the amounts actually received or paid. Net unrealized foreign exchange gains and losses arise from changes (due to the changes in the exchange rate) in the value of foreign currency and other assets and liabilities denominated in foreign currencies held at period end.
Allocation of Expenses Among Funds and Classes. Expenses directly attributable to a Fund are charged to that Fund; certain other common expenses of the Trust, Calamos Advisors Trust, Calamos Convertible Opportunities and Income Fund, Calamos Convertible and High Income Fund, Calamos Strategic Total Return Fund, Calamos Global Total Return Fund, Calamos Global Dynamic Income Fund and Calamos Dynamic Convertible and Income Fund are allocated proportionately among each Fund to which the expenses relate in relation to the net assets of each Fund or on another reasonable basis. Expenses directly attributable to a particular class of a fund in the Trust are charged directly to such class. In calculating the net asset value per share of each class, investment income, realized and unrealized gains and losses and expenses other than class specific expenses are allocated daily to each class of shares based upon the proportion of net assets of each class at the beginning of each day plus current day fund share activity.
Income Taxes. No provision has been made for U.S. income taxes because the Trust’s policy is to continue to qualify as a regulated investment company under the Internal Revenue Code of 1986, as amended, and distribute to shareholders substantially all of the Funds’ taxable income and net realized gains.
Dividends and distributions paid to shareholders are recorded on the ex-dividend date. The amount of dividends and distributions from net investment income and net realized capital gains is determined in accordance with federal income tax regulations, which may differ from U.S. generally accepted accounting principles. To the extent these “book/tax” differences are permanent in nature, such amounts are reclassified within the capital accounts based on their federal tax-basis treatment. These differences are primarily due to differing treatments for foreign currency transactions, contingent payment debt instruments and methods of amortizing and accreting for fixed income securities. The financial statements are not adjusted for temporary differences.
The Funds recognized no liability for uncertain tax positions. A reconciliation is not provided as the beginning and ending amounts of unrecognized benefits are zero, with no interim additions, reductions or settlements. Tax years 2013 – 2016 remain subject to examination by the U.S. and the State of Illinois tax jurisdictions for those Funds that have been in existence during that time, and for all years since inception for those Funds created subsequent to October 31, 2011.
Indemnifications. Under the Trust’s organizational documents, the Trust is obligated to indemnify its officers and trustees against certain liabilities incurred by them by reason of having been an officer or trustee of the Trust. In addition, in the normal course of business, the Trust may enter into contracts that provide general indemnifications to other parties. Each Fund’s maximum exposure under these arrangements is unknown as this would involve future claims that may be made against the Fund that have not yet occurred. Currently, the Funds’ management expects the risk of material loss in connection to a potential claim to be remote.
Notes to Financial Statements (Unaudited)
Note 2 – Investment Adviser and Transactions With Affiliates Or Certain Other Parties
Pursuant to an investment advisory agreement with Calamos Advisors LLC (“Calamos Advisors”), each Fund pays a monthly investment advisory fee based on the average daily net assets of the Fund, as shown below:
| | | | | | | | | | | | | | | | |
| AVERAGE DAILY NET ASSETS | | GROWTH FUND
ANNUAL RATE | | | EVOLVING WORLD
GROWTH FUND,
EMERGING MARKET
GROWTH FUND
ANNUAL RATE | | | TOTAL RETURN
BOND FUND
ANNUAL RATE | | | OPPORTUNISTIC VALUE FUND,
DIVIDEND GROWTH FUND,
INTERNATIONAL GROWTH FUND*,
GLOBAL EQUITY FUND*,
GLOBAL GROWTH AND INCOME FUND
ANNUAL RATE | |
| First $500 million | | | 1.00% | | | | 1.10% | | | | 0.55% | | | | 1.00% | |
| | | | |
| Next $500 million | | | 0.90% | | | | 1.05% | | | | 0.53% | | | | 0.95% | |
| | | | |
| Next $5 billion | | | 0.80% | | | | 1.00% | | | | 0.51% | | | | 0.90% | |
| | | | |
| Next $5 billion | | | 0.78% | | | | 0.98% | | | | 0.49% | | | | 0.88% | |
| | | | |
| Next $5 billion | | | 0.76% | | | | 0.96% | | | | 0.48% | | | | 0.86% | |
| | | | |
| Next $5 billion | | | 0.74% | | | | 0.94% | | | | 0.47% | | | | 0.84% | |
| | | | |
| Next $5 billion | | | 0.72% | | | | 0.92% | | | | 0.46% | | | | 0.82% | |
| | | | |
| Over $26 billion | | | 0.70% | | | | 0.90% | | | | 0.45% | | | | 0.80% | |
| | | | |
| * | International Growth Fund and Global Equity Fund are subject to a possible adjustment based on performance as described below. |
| | | | | | | | | | | | |
| AVERAGE DAILY NET ASSETS | | GLOBAL
CONVERTIBLE
FUND
ANNUAL RATE | | | GROWTH AND INCOME FUND,
CONVERTIBLE FUND, HIGH
INCOME FUND, MARKET
NEUTRAL INCOME FUND,
HEDGED EQUTIY INCOME FUND
ANNUAL RATE | | | PHINEUS
LONG/SHORT FUND
ANNUAL RATE | |
| First $500 million | | | 0.85% | | | | 0.75% | | | | 1.25% | |
| | | | |
| Next $500 million | | | 0.80% | | | | 0.70% | | | | 1.20% | |
| | | | |
| Over $1 billion | | | 0.75% | | | | 0.65% | | | | 1.15% | |
| | | | |
The average investment advisory fee as of the period ended April 30, 2017 was as follows:
| | | | |
| FUND | | PERCENTAGE | |
| Growth Fund | | | 0.88 | % |
| Opportunistic Value Fund | | | 1.00 | |
| Dividend Growth Fund | | | 1.00 | |
| International Growth Fund | | | 0.89 | |
| Evolving World Growth Fund | | | 1.10 | |
| Emerging Market Equity Fund | | | 1.10 | |
| Global Equity Fund | | | 0.92 | |
| Growth and Income Fund | | | 0.69 | |
| Global Growth and Income Fund | | | 1.00 | |
| Convertible Fund | | | 0.74 | |
| Global Convertible Fund | | | 0.85 | |
| Total Return Bond Fund | | | 0.55 | |
| High Income Fund | | | 0.75 | |
| Market Neutral Income Fund | | | 0.67 | |
| Hedged Equity Income Fund | | | 0.75 | |
| Phineus Long/Short Fund | | | 1.25 | |
Each of the International Growth and Global Equity Funds pays a fee based on average daily net assets of the Fund that is accrued daily and paid on a monthly basis, subject to possible adjustment based on the Fund’s investment performance (since March 2006 for International Growth Fund and since February 2008 for Global Equity Fund). The performance adjustment increases or decreases the management fee, on a monthly basis, by 1/12 of 0.03% of a Fund’s average daily net assets over the performance period for each full 1% increment amount by which a Fund outperforms or underperforms the benchmark index (“Index”), on an annualized basis,
| | | | |
| 140 | | CALAMOS OPEN-END FAMILY OF FUNDS SEMIANNUAL REPORT | | |
Notes to Financial Statements (Unaudited)
over the performance measurement period. The benchmark indexes are the MSCI EAFE Growth Index and the MSCI World Index for the International Growth Fund and Global Equity Fund, respectively.
The base fee is shown in the table above. The performance adjustment rate is calculated by comparing over the performance measurement period the Fund’s Class A share performance to that of the respective Index. The performance measurement period commenced at the beginning of each Fund’s first full month of operation (April 2005 and March 2007 for the International Growth Fund and Global Equity Fund, respectively). The first performance adjustment was applied to the advisory fee at the end of the twelfth month. Each month subsequent to the twelfth month, a new month is added to the performance measurement period until the performance measurement period includes 36 months. Thereafter, the performance measurement period consists of the most recent month plus the previous 35 months.
The performance comparison is made at the end of each month. The maximum annualized performance adjustment rate is +/-0.30% of the Fund’s average daily net assets over the performance measurement period. The performance adjustment rate is divided by twelve and multiplied by the Fund’s average daily net assets over the performance measurement period, and the resulting dollar amount is then added to or subtracted from the base fee. Calamos Advisors may receive a positive performance adjustment even if the Fund has a negative return over a performance measurement period if it otherwise outperforms the Index during that period.
Pursuant to a financial accounting services agreement, during the period the Fund paid Calamos Advisors a fee for financial accounting services payable monthly at the annual rate of 0.0175% on the first $1 billion of combined assets, 0.0150% on the next $1 billion of combined assets and 0.0110% on combined assets above $2 billion (for purposes of this calculation “combined assets” means the sum of the total average daily net assets of Calamos Investment Trust and Calamos Advisors Trust and the total average weekly managed assets of Calamos Convertible and High Income Fund, Calamos Strategic Total Return Fund, Calamos Convertible Opportunities and Income Fund, Calamos Global Total Return Fund, Calamos Global Dynamic Income Fund and Calamos Dynamic Convertible and Income Fund). Financial accounting services include, but are not limited to, the following: managing expenses and expense payment processing; monitoring the calculation of expense accrual amounts; calculating, tracking and reporting tax adjustments on all assets; and monitoring trustee deferred compensation plan accruals and valuations. The Funds pay their pro rata share of the financial accounting services fee payable to Calamos Advisors based on their relative portion of combined assets used in calculating the fee.
The Funds reimburses Calamos Advisors for a portion of compensation paid to the Trust’s Chief Compliance Officer. This compensation is reported as part of the “Trustees’ fees and officer compensation” expense on the Statements of Operations.
Calamos Advisors has contractually agreed to limit the annual ordinary operating expenses of each Fund as a percentage of the average daily net assets as follows:
| | | | | | | | | | | | | | | | | | | | | | | | |
| FUND | | CLASS A
SHARES | | | CLASS B
SHARES | | | CLASS C
SHARES | | | CLASS I
SHARES | | | CLASS R
SHARES | | | CLASS T
SHARES | |
| Growth Fund | | | 1.75% | | | | 2.50% | | | | 2.50% | | | | 1.50% | | | | 2.00% | | | | 1.75% | |
| Opportunistic Value Fund | | | 1.15% | | | | 1.90% | | | | 1.90% | | | | 0.90% | | | | 1.40% | | | | 1.15% | |
| Dividend Growth Fund | | | 1.35% | | | | — | | | | 2.10% | | | | 1.10% | | | | — | | | | 1.35% | |
| International Growth Fund | | | 1.40% | | | | 2.15% | | | | 2.15% | | | | 1.15% | | | | 1.65% | | | | 1.40% | |
| Evolving World Growth Fund | | | 1.75% | | | | 2.50% | | | | 2.50% | | | | 1.50% | | | | 2.00% | | | | 1.75% | |
| Emerging Market Equity Fund | | | 1.75% | | | | — | | | | 2.50% | | | | 1.50% | | | | — | | | | 1.75% | |
| Global Equity Fund | | | 1.40% | | | | 2.15% | | | | 2.15% | | | | 1.15% | | | | 1.65% | | | | 1.40% | |
| Growth and Income Fund | | | 1.75% | | | | 2.50% | | | | 2.50% | | | | 1.50% | | | | 2.00% | | | | 1.75% | |
| Global Growth and Income Fund | | | 1.75% | | | | 2.50% | | | | 2.50% | | | | 1.50% | | | | 2.00% | | | | 1.75% | |
| Convertible Fund | | | 1.75% | | | | 2.50% | | | | 2.50% | | | | 1.50% | | | | 2.00% | | | | 1.75% | |
| Global Convertible Fund | | | 1.35% | | | | — | | | | 2.10% | | | | 1.10% | | | | 1.60% | | | | 1.35% | |
| Total Return Bond Fund | | | 0.90% | | | | 1.65% | | | | 1.65% | | | | 0.65% | | | | 1.15% | | | | 0.90% | |
| High Income Fund | | | 1.75% | | | | 2.50% | | | | 2.50% | | | | 1.50% | | | | 2.00% | | | | 1.75% | |
| Market Neutral Income Fund | | | 1.75% | | | | 2.50% | | | | 2.50% | | | | 1.50% | | | | 2.00% | | | | 1.75% | |
| Hedged Equity Income Fund | | | 1.25% | | | | — | | | | 2.00% | | | | 1.00% | | | | — | | | | 1.25% | |
| Phineus Long/Short Fund | | | 2.00% | | | | — | | | | 2.75% | | | | 1.75% | | | | — | | | | 2.00% | |
Notes to Financial Statements (Unaudited)
These agreements are binding on Calamos Advisors through April 30, 2017.
For the period ended April 30, 2017, Calamos Advisors waived or absorbed the following expenses:
| | | | |
| FUND | | AMOUNT | |
| Opportunistic Value Fund | | $ | 146,593 | |
| Dividend Growth Fund | | | 78,938 | |
| International Growth Fund | | | 143,325 | |
| Emerging Market Equity Fund | | | 79,711 | |
| Global Equity Fund | | | 65,060 | |
| Global Convertible Fund | | | 43,286 | |
| Total Return Bond Fund | | | 100,631 | |
| Hedged Equity Income Fund | | | 72,680 | |
| Phineus Long/Short Fund | | | 1,986 | |
These amounts are included in the Statements of Operations under the caption “Expense reductions”.
As Distributor, Calamos Financial Services LLC (“CFS”) assumed all expenses of personnel, office space, office facilities and equipment incidental to such service. Each Fund has adopted a Distribution Plan pursuant to Rule 12b-1 under the 1940 Act whereby the Fund pays to CFS a distribution and/or service fee at the annual rate of 0.25% of the average daily net assets of the Fund’s Class A shares; a service fee at the annual rate of 0.25% and a distribution fee at the rate of 0.75% of the average daily net assets of the Fund’s Class B and Class C shares; a service fee at the annual rate of 0.25% and a distribution fee of 0.25% of the average daily net assets of the Fund’s Class R shares; and a distribution fee at the annual rate of 0.25% of the average daily net assets of the Fund’s Class T shares. No such fees are paid on each Fund’s Class I shares.
CFS also receives a sales commission and/or an underwriting fee on certain sales of each Fund’s Class A shares. During the period ended April 30, 2017, CFS received commissions and underwriting fees as follows:
| | | | |
| FUND | | AMOUNT | |
| Growth Fund | | $ | 20,635 | |
| Opportunistic Value Fund | | | 620 | |
| Dividend Growth Fund | | | 260 | |
| International Growth Fund | | | 1,372 | |
| Evolving World Growth Fund | | | 1,341 | |
| Emerging Market Equity Fund | | | 1 | |
| Global Equity Fund | | | 401 | |
| Growth and Income Fund | | | 31,455 | |
| Global Growth and Income Fund | | | 1,057 | |
| Convertible Fund | | | 10,288 | |
| Global Convertible Fund | | | 1,014 | |
| Total Return Bond Fund | | | 447 | |
| High Income Fund | | | 887 | |
| Market Neutral Income Fund | | | 39,236 | |
| Hedged Equity Income Fund | | | 1,006 | |
| Phineus Long/Short Fund | | | 59,012 | |
Pursuant to an agreement with US Bancorp Fund Services, LLC, the Funds’ transfer agent (“US Bancorp”), CFS provides certain shareholder administrative services to US Bancorp. CFS receives from US Bancorp an annual aggregate fee of $175,000, paid in monthly installments, for providing these services which relate to Calamos Investment Trust and Calamos Advisors Trust. Also, US Bancorp pays license fees to unaffiliated third parties for CFS’ utilization of certain transfer agent and phone systems in providing the shareholder administrative services. The fees paid to CFS and the payment of license fees to third parties are borne by US Bancorp.
The Funds have not assumed or incurred any additional expenses in connection with CFS providing these services to US Bancorp, and the transfer agency fees payable by the Funds to US Bancorp have not increased as a result thereof.
| | | | |
| 142 | | CALAMOS OPEN-END FAMILY OF FUNDS SEMIANNUAL REPORT | | |
Notes to Financial Statements (Unaudited)
A trustee and certain officers of the Trust are also officers and directors of CFS and Calamos Advisors. Such trustee and officers serve without direct compensation from the Trust. The Trust’s Statement of Additional Information contains additional information about the Trust’s Trustees and Officers and is available without charge, upon request, at www.calamos.com or by calling 800.582.6959.
Certain affiliates of Calamos Advisors hold material investments in the Funds. As of April 30, 2017, certain affiliates of Calamos Advisors hold material investments in the Funds as follows:
| | | | |
| FUND | | PERCENTAGE | |
| Opportunistic Value Fund | | | 29 | % |
| Emerging Market Equity Fund | | | 87 | |
| Hedged Equity Income Fund | | | 36 | |
The Trust has adopted a deferred compensation plan (the “Plan”). Under the Plan, a trustee who is not an “interested person” (as defined in the 1940 Act) and has elected to participate in the Plan (a “participating trustee”) may defer receipt of all or a portion of his compensation from the Trust. The deferred compensation payable to the participating trustee is credited to the trustee’s deferral account as of the business day such compensation would have been paid to the participating trustee. The value of amounts deferred for a participating trustee is determined by reference to the change in value of Class I shares of one or more funds of the Trust designated by the participant. The value of the account increases with contributions to the account or with increases in the value of the measuring shares, and the value of the account decreases with withdrawals from the account or with declines in the value of the measuring shares.
At April 30, 2017, the Funds had deferred compensation balances, which are included in “Other assets” on the Statements of Assets and Liabilities, as follows:
| | | | |
| FUND | | AMOUNT | |
| Growth Fund | | $ | 716,053 | |
| Opportunistic Value Fund | | | 105,100 | |
| Dividend Growth Fund | | | 12,845 | |
| International Growth Fund | | | 104,808 | |
| Evolving World Growth Fund | | | 74,484 | |
| Emerging Market Equity Fund | | | 12,842 | |
| Global Equity Fund | | | 79,296 | |
| Growth and Income Fund | | | 337,976 | |
| Global Growth and Income Fund | | | 151,006 | |
| Convertible Fund | | | 192,398 | |
| Global Convertible Fund | | | 5,900 | |
| Total Return Bond Fund | | | 80,481 | |
| High Income Fund | | | 113,483 | |
| Market Neutral Income Fund | | | 207,647 | |
| Hedged Equity Income Fund | | | 5,743 | |
| Phineus Long/Short Fund | | | 30,560 | |
Each Fund’s obligation to make payments under the Plan is a general obligation of the Fund and is included in “Payable for deferred compensation to trustees” on the Statements of Assets and Liabilities at April 30, 2017.
Notes to Financial Statements (Unaudited)
Note 3 – Investments
The cost of purchases and proceeds from sales of long-term investments for the period ended April 30, 2017 were as follows:
| | | | | | | | | | | | | | | | |
| | | COST OF PURCHASES | | | PROCEEDS FROM SALES | |
| FUND | | U.S. GOV’T
SECURITIES | | | OTHER | | | U.S. GOV’T
SECURITIES | | | OTHER | |
| Growth Fund | | $ | — | | | $ | 1,114,049,760 | | | $ | — | | | $ | 1,418,503,104 | |
| Opportunistic Value Fund | | | — | | | | 24,969,025 | | | | — | | | | 29,664,975 | |
| Dividend Growth Fund | | | — | | | | 2,683,460 | | | | — | | | | 9,177,888 | |
| International Growth Fund | | | — | | | | 168,503,856 | | | | — | | | | 263,374,396 | |
| Evolving World Growth Fund | | | — | | | | 185,344,842 | | | | — | | | | 277,469,189 | |
| Emerging Market Equity Fund | | | — | | | | 7,584,888 | | | | — | | | | 7,304,606 | |
| Global Equity Fund | | | — | | | | 67,195,483 | | | | — | | | | 96,714,830 | |
| Growth and Income Fund | | | — | | | | 240,254,849 | | | | — | | | | 564,714,621 | |
| Global Growth and Income Fund | | | — | | | | 114,687,524 | | | | — | | | | 201,632,523 | |
| Convertible Fund | | | — | | | | 169,510,192 | | | | — | | | | 290,099,055 | |
| Global Convertible Fund | | | — | | | | 15,630,890 | | | | — | | | | 22,863,910 | |
| Total Return Bond Fund | | | 18,357,050 | | | | 6,077,068 | | | | 2,171,553 | | | | 38,105,491 | |
| High Income Fund | | | — | | | | 13,427,945 | | | | — | | | | 25,016,021 | |
| Market Neutral Income Fund | | | — | | | | 1,177,804,907 | | | | — | | | | 1,210,421,785 | |
| Hedged Equity Income Fund | | | — | | | | 4,576,761 | | | | — | | | | 9,896,175 | |
| Phineus Long/Short Fund | | | — | | | | 287,231,166 | | | | — | | | | 212,531,626 | |
The cost basis of investments for federal income tax purposes at April 30, 2017 was as follows*:
| | | | | | | | | | | | | | | | |
| FUND | | COST BASIS OF
INVESTMENTS | | | GROSS UNREALIZED
APPRECIATION | | | GROSS UNREALIZED
DEPRECIATION | | | NET UNREALIZED
APPRECIATION
(DEPRECIATION) | |
| Growth Fund | | $ | 1,369,778,944 | | | $ | 394,080,430 | | | $ | (24,829,505 | ) | | $ | 369,250,925 | |
| Opportunistic Value Fund | | | 49,649,098 | | | | 6,121,262 | | | | (617,257 | ) | | | 5,504,005 | |
| Dividend Growth Fund | | | 24,867,611 | | | | 5,077,812 | | | | (395,948 | ) | | | 4,681,864 | |
| International Growth Fund | | | 242,443,784 | | | | 43,731,631 | | | | (1,823,469 | ) | | | 41,908,162 | |
| Evolving World Growth Fund | | | 265,241,624 | | | | 52,345,962 | | | | (5,073,272 | ) | | | 47,272,690 | |
| Emerging Market Equity Fund | | | 13,132,385 | | | | 2,149,149 | | | | (318,514 | ) | | | 1,830,635 | |
| Global Equity Fund | | | 93,239,547 | | | | 27,239,614 | | | | (815,944 | ) | | | 26,423,670 | |
| Growth and Income Fund | | | 1,709,799,374 | | | | 427,508,370 | | | | (36,164,310 | ) | | | 391,344,060 | |
| Global Growth and Income Fund | | | 201,880,825 | | | | 30,862,360 | | | | (2,580,916 | ) | | | 28,281,444 | |
| Convertible Fund | | | 588,691,446 | | | | 55,171,986 | | | | (22,893,809 | ) | | | 32,278,177 | |
| Global Convertible Fund | | | 72,697,345 | | | | 5,164,302 | | | | (2,556,623 | ) | | | 2,607,679 | |
| Total Return Bond Fund | | | 79,813,038 | | | | 1,486,771 | | | | (326,695 | ) | | | 1,160,076 | |
| High Income Fund | | | 63,167,222 | | | | 2,113,088 | | | | (1,591,936 | ) | | | 521,152 | |
| Market Neutral Income Fund | | | 2,772,952,801 | | | | 799,533,785 | | | | (610,511,094 | ) | | | 189,022,691 | |
| Hedged Equity Income Fund | | | 13,193,574 | | | | 2,161,169 | | | | (441,043 | ) | | | 1,720,126 | |
| Phineus Long/Short Fund | | | 122,429,088 | | | | 20,615,400 | | | | (8,678,883 | ) | | | 11,936,517 | |
| * | Because tax adjustments are calculated annually, the above table does not reflect tax adjustments. For the previous fiscal year’s federal income tax information, please refer to the Notes to Financial Statements section in the Fund’s most recent annual report. |
| | | | |
| 144 | | CALAMOS OPEN-END FAMILY OF FUNDS SEMIANNUAL REPORT | | |
Notes to Financial Statements (Unaudited)
Note 4 – Income Taxes
The tax character of distributions for the period ended April 30, 2017 will be determined at the end of each Fund’s current fiscal year. Distributions during the fiscal period ended October 31, 2016 were characterized for federal income tax purposes as follows:
| | | | | | | | | | | | |
| | | YEAR ENDED
OCTOBER 31, 2016 | |
| FUND | | ORDINARY
INCOME | | | LONG-TERM
CAPITAL GAIN | | | RETURN OF
CAPITAL | |
| Growth Fund | | $ | 78,141,894 | | | $ | 613,056,464 | | | $ | — | |
| Opportunistic Value Fund | | | 2,273,657 | | | | 3,132,506 | | | | — | |
| Dividend Growth Fund | | | 327,729 | | | | 936,771 | | | | — | |
| International Growth Fund | | | 1,190,650 | | | | 782,942 | | | | 200 | |
| Evolving World Growth Fund | | | 1,211,125 | | | | — | | | | 402 | |
| Emerging Market Equity Fund | | | 53,213 | | | | — | | | | 3 | |
| Global Equity Fund | | | — | | | | 3,999,530 | | | | — | |
| Growth and Income Fund | | | 61,409,105 | | | | 115,266,934 | | | | — | |
| Global Growth and Income Fund | | | — | | | | 4,723,076 | | | | — | |
| Convertible Fund | | | 29,538,637 | | | | 17,152,882 | | | | — | |
| Global Convertible Fund | | | 1,341,951 | | | | — | | | | — | |
| Total Return Bond Fund | | | 2,541,945 | | | | 1,214,004 | | | | — | |
| High Income Fund | | | 4,131,910 | | | | — | | | | — | |
| Market Neutral Income Fund | | | 67,681,873 | | | | 39,095,278 | | | | — | |
| Hedged Equity Income Fund | | | 222,822 | | | | 99,873 | | | | — | |
| Phineus Long/Short Fund | | | 358,400 | | | | — | | | | — | |
As of October 31, 2016, the components of accumulated earnings/(loss) on a tax basis were as follows:
| | | | | | | | | | | | | | | | | | | | |
| | | GROWTH
FUND | | | OPPORTUNISTIC
VALUE FUND | | | DIVIDEND
GROWTH FUND | | | INTERNATIONAL
GROWTH FUND | | | EVOLVING WORLD
GROWTH FUND | |
| Undistributed ordinary income | | $ | — | | | $ | 313,756 | | | $ | — | | | $ | — | | | $ | — | |
| Undistributed capital gains | | | 77,748,045 | | | | — | | | | — | | | | — | | | | — | |
| | | | |
| Total undistributed earnings | | | 77,748,045 | | | | 313,756 | | | | — | | | | — | | | | — | |
| Accumulated capital and other losses | | | — | | | | (1,947,401 | ) | | | (30,189 | ) | | | (12,949,448 | ) | | | (64,410,447 | ) |
| Net unrealized gains/(losses) | | | 348,680,889 | | | | 1,891,917 | | | | 1,866,385 | | | | 28,532,563 | | | | 28,752,879 | |
| | | | |
| Total accumulated earnings/(losses) | | | 426,428,934 | | | | 258,272 | | | | 1,836,196 | | | | 15,583,115 | | | | (35,657,568 | ) |
| Other | | | (814,395 | ) | | | (92,952 | ) | | | (13,378 | ) | | | 38,078 | | | | (160,398 | ) |
| Paid-in-capital | | | 1,473,640,714 | | | | 53,985,207 | | | | 30,403,627 | | | | 350,028,390 | | | | 428,165,437 | |
| | | | |
| Net assets applicable to common shareholders | | $ | 1,899,255,253 | | | $ | 54,150,527 | | | $ | 32,226,445 | | | $ | 365,649,583 | | | $ | 392,347,471 | |
| | | | |
| | | | | |
| | | EMERGING
MARKET EQUITY
FUND | | | GLOBAL EQUITY
FUND | | | GROWTH AND
INCOME FUND | | | GLOBAL GROWTH
AND INCOME
FUND | | | CONVERTIBLE
FUND | |
| Undistributed ordinary income | | $ | — | | | $ | — | | | $ | 18,565,964 | | | $ | 402,521 | | | $ | 3,932,386 | |
| Undistributed capital gains | | | — | | | | 5,808,927 | | | | 84,686,867 | | | | 1,936,630 | | | | — | |
| | | | |
| Total undistributed earnings | | | — | | | | 5,808,927 | | | | 103,252,831 | | | | 2,339,151 | | | | 3,932,386 | |
| Accumulated capital and other losses | | | (2,919,343 | ) | | | — | | | | — | | | | — | | | | (11,255,046 | ) |
| Net unrealized gains/(losses) | | | 840,619 | | | | 23,812,640 | | | | 279,293,010 | | | | 19,184,567 | | | | 22,197,245 | |
| | | | |
| Total accumulated earnings/(losses) | | | (2,078,724 | ) | | | 29,621,567 | | | | 382,545,841 | | | | 21,523,718 | | | | 14,874,585 | |
| Other | | | (13,487 | ) | | | (41,713 | ) | | | (341,259 | ) | | | (66,189 | ) | | | (210,311 | ) |
| Paid-in-capital | | | 15,980,212 | | | | 108,199,232 | | | | 1,818,581,919 | | | | 279,792,025 | | | | 650,954,452 | |
| | | | |
| Net assets applicable to common shareholders | | $ | 13,888,001 | | | $ | 137,779,086 | | | $ | 2,200,786,501 | | | $ | 301,249,554 | | | $ | 665,618,726 | |
| | | | |
Notes to Financial Statements (Unaudited)
| | | | | | | | | | | | | | | | | | | | |
| | | GLOBAL
CONVERTIBLE FUND | | | TOTAL RETURN
BOND FUND | | | HIGH INCOME
FUND | | | MARKET NEUTRAL
INCOME FUND | | | HEDGED EQUITY
INCOME FUND | |
| Undistributed ordinary income | | $ | 301,154 | | | $ | — | | | $ | 37,820 | | | $ | 27,623,615 | | | $ | 11,591 | |
| Undistributed capital gains | | | — | | | | 79,300 | | | | — | | | | 36,761,736 | | | | — | |
| | | | |
| Total undistributed earnings | | | 301,154 | | | | 79,300 | | | | 37,820 | | | | 64,385,351 | | | | 11,591 | |
| Accumulated capital and other losses | | | (2,081,349 | ) | | | — | | | | (8,128,926 | ) | | | — | | | | (48,436 | ) |
| Net unrealized gains/(losses) | | | 637,215 | | | | 2,452,874 | | | | (1,960,546 | ) | | | 61,341,052 | | | | 426,429 | |
| | | | |
| Total accumulated earnings/(losses) | | | (1,142,980 | ) | | | 2,532,174 | | | | (10,051,652 | ) | | | 125,726,403 | | | | 389,584 | |
| Other | | | (6,791 | ) | | | (85,953 | ) | | | (129,633 | ) | | | (22,946,609 | ) | | | (6,892 | ) |
| Paid-in-capital | | | 80,714,136 | | | | 94,430,848 | | | | 84,421,149 | | | | 3,783,747,092 | | | | 18,185,643 | |
| | | | |
| Net assets applicable to common shareholders | | $ | 79,564,365 | | | $ | 96,877,069 | | | $ | 74,239,864 | | | $ | 3,886,526,886 | | | $ | 18,568,335 | |
| | | | |
| | | | | |
| | | | | | | | | | | | | | | PHINEUS
LONG/SHORT
FUND | |
| Undistributed ordinary income | | | | | | | | | | | | | | | | | | $ | 706,897 | |
| Undistributed capital gains | | | | | | | | | | | | | | | | | | | 153,699 | |
| | | | | | | | | | | | | | | | | | | | |
| Total undistributed earnings | | | | | | | | | | | | | | | | | | | 860,596 | |
| Accumulated capital and other losses | | | | | | | | | | | | | | | | | | | — | |
| Net unrealized gains/(losses) | | | | | | | | | | | | | | | | | | | 685,150 | |
| | | | | | | | | | | | | | | | | | | | |
| Total accumulated earnings/(losses) | | | | | | | | | | | | | | | | | | | 1,545,746 | |
| Other | | | | | | | | | | | | | | | | | | | (12,456 | ) |
| Paid-in-capital | | | | | | | | | | | | | | | | | | | 74,429,593 | |
| | | | | | | | | | | | | | | | | | | | |
| Net assets applicable to common shareholders | | | | | | | | | | | | | | | | | | $ | 75,962,883 | |
| | | | | | | | | | | | | | | | | | | | |
The following Funds had capital loss carryforwards for the year ended October 31, 2016, with no expiration date, available to offset future realized capital gains:
| | | | | | | | |
| FUND | | SHORT-TERM | | | LONG-TERM | |
| Opportunistic Value Fund | | $ | (1,668,012 | ) | | $ | (279,389 | ) |
| Dividend Growth Fund | | | (30,189 | ) | | | — | |
| International Growth Fund | | | (12,949,448 | ) | | | — | |
| Evolving World Growth Fund | | | (24,804,912 | ) | | | (39,605,535 | ) |
| Emerging Market Equity Fund | | | (1,701,172 | ) | | | (1,218,171 | ) |
| Convertible Fund | | | (11,255,046 | ) | | | — | |
| Global Convertible Fund | | | (2,081,349 | ) | | | — | |
| High Income Fund | | | (1,587,355 | ) | | | (6,541,571 | ) |
| Hedged Equity Income Fund | | | (48,436 | ) | | | — | |
Note 5 – Short Sales
Securities sold short represent obligations to deliver the securities at a future date. A Fund may sell a security it does not own in anticipation of a decline in the value of that security before the delivery date. When the Fund sells a security short, it must borrow the security sold short and deliver it to the broker-dealer through which it made the short sale. Dividends paid on securities sold short are disclosed as an expense on the Statements of Operations. A gain, limited to the price at which the Fund sold the security short, or a loss, unlimited in size, will be realized upon the termination of a short sale.
To secure its obligation to deliver to the broker-dealer the securities sold short, the Fund must segregate an amount of cash or liquid securities with its custodian equal to any excess of the current market value of the securities sold short over any cash or liquid securities deposited as collateral with the broker in connection with the short sale (not including the proceeds of the short sale). As a result of that requirement, the Fund will not gain any leverage merely by selling short, except to the extent that it earns interest or other income or gains on the segregated cash or liquid securities while also being subject to the possibility of gain or loss from the securities sold short.
| | | | |
| 146 | | CALAMOS OPEN-END FAMILY OF FUNDS SEMIANNUAL REPORT | | |
Notes to Financial Statements (Unaudited)
Note 6 – Derivative Investments
Foreign Currency Risk. Each Fund may engage in portfolio hedging with respect to changes in currency exchange rates by entering into forward foreign currency contracts to purchase or sell currencies. A forward foreign currency contract is a commitment to purchase or sell a foreign currency at a future date at a negotiated forward rate. Risks associated with such contracts include, among other things, movement in the value of the foreign currency relative to the U.S. dollar and the ability of the counterparty to perform.
To mitigate the counterparty risk, the Fund may enter into an International Swaps and Derivatives Association, Inc. Master Agreement (“ISDA Master Agreement”) or similar agreement with its derivative contract counterparties. An ISDA Master Agreement is a bilateral agreement between the Fund and a counterparty that governs over-the-counter derivatives and foreign exchange contracts and typically contains, among other things, collateral posting terms and netting provisions in the event of a default and/or termination event. Under an ISDA Master Agreement, the Fund may, under certain circumstances, offset with the counterparty certain derivative financial instrument’s payables and/or receivables with collateral held and/or posted and create one single net payment. The provisions of the ISDA Master Agreement typically permit a single net payment in the event of default (close-out netting) including the bankruptcy or insolvency of the counterparty. Generally, collateral is exchanged between the Fund and the counterparty and the amount of collateral due from the Fund or to a counterparty has to exceed a minimum transfer amount threshold before a transfer has to be made. To the extent amounts due to the Fund from its counterparties are not fully collateralized, contractually or otherwise, the Fund bears the risk of loss from counterparty nonperformance. When a Fund is required to post collateral under the terms of a derivatives transaction and master netting agreement, the Fund’s custodian holds the collateral in a segregated account, subject to the terms of a tri-party agreement among the Fund, the custodian and the counterparty. The master netting agreement and tri-party agreement provide, in relevant part, that the counterparty may have rights to the amounts in the segregated account in the event that the Fund defaults in its obligation with respect to the derivative instrument that is subject to the collateral requirement. When a counterparty is required to post collateral under the terms of a derivatives transaction and master netting agreement, the counterparty delivers such amount to the Fund’s custodian. The master netting agreement provides, in relevant part, that the Fund may have rights to such collateral in the event that the counterparty defaults in its obligation with respect to the derivative instrument that is subject to the collateral requirement.
For financial reporting purposes, the Funds do not offset derivative assets and derivative liabilities that are subject to netting arrangements in the Statements of Assets and Liabilities. The Fund’s net counterparty exposure is reflected in the counterparty table below. The net unrealized gain, if any, represents the credit risk to the respective Fund on a forward foreign currency contract. The contracts are valued daily at forward foreign exchange rates. The Funds realize a gain or loss when a position is closed or upon settlement of the contracts. Please see the disclosure regarding ISDA Master Agreements under Foreign Currency Risk within this note.
As of April 30, 2017, the Funds had outstanding forward foreign currency contracts listed on the Schedules of Investments.
Equity Risk. Each Fund may engage in option transactions and in doing so achieves similar objectives to what it would achieve through the sale or purchase of individual securities. A call option, upon payment of a premium, gives the purchaser of the option the right to buy, and the seller of the option the obligation to sell, the underlying security, index or other instrument at the exercise price. A put option gives the purchaser of the option, upon payment of a premium, the right to sell, and the seller the obligation to buy, the underlying security, index, or other instrument at the exercise price.
To seek to offset some of the risk of a potential decline in value of certain long positions, each Fund may also purchase put options on individual securities, broad-based securities indexes or certain exchange-traded funds (“ETFs”). Each Fund may also seek to generate income from option premiums by writing (selling) options on a portion of the equity securities (including securities that are convertible into equity securities) in the Fund’s portfolio, on broad-based securities indexes, or certain ETFs.
When the Fund purchases an option, it pays a premium and an amount equal to that premium is recorded as an asset. When the Fund writes an option, it receives a premium and an amount equal to that premium is recorded as a liability. The asset or liability is adjusted daily to reflect the current market value of the option. If an option expires unexercised, the Fund realizes a gain or loss to the extent of the premium received or paid. If an option is exercised, the premium received or paid is recorded as an adjustment to the proceeds from the sale or the cost basis of the purchase. The difference between the premium and the amount received or paid on a closing purchase or sale transaction is also treated as a realized gain or loss. The cost of securities acquired through the exercise of call options is increased by premiums paid. The proceeds from securities sold through the exercise of put options are decreased by the
Notes to Financial Statements (Unaudited)
premiums paid. Gain or loss on written options and purchased options is presented separately as net realized gain or loss on written options and net realized gain or loss on purchased options, respectively.
Options written by each Fund do not typically give rise to counterparty credit risk since options written obligate each Fund and not the counterparty to perform. Exchange traded purchased options have minimal counterparty credit risk to each Fund since the exchange’s clearinghouse, as counterparty to such instruments, guarantees against a possible default.
As of April 30, 2017, the Fund had outstanding purchased options and/or written options as listed on the Schedules of Investments. For the period ended April 30, 2017, the Fund had the following transactions in options written:
| | | | | | | | | | | | | | | | |
| | | GROWTH FUND | | | EVOLVING WORLD GROWTH FUND | |
| | | NUMBER OF
CONTRACTS | | | PREMIUMS
RECEIVED | | | NUMBER OF
CONTRACTS | | | PREMIUMS
RECEIVED | |
| Options outstanding at October 31, 2016 | | | — | | | $ | — | | | | — | | | $ | — | |
| Options written | | | 21,627 | | | | 4,659,338 | | | | 8,000 | | | | 83,653 | |
| Options closed | | | (3,936 | ) | | | (1,419,471 | ) | | | (8,000 | ) | | | (83,653 | ) |
| Options exercised | | | (5,180 | ) | | | (1,035,146 | ) | | | — | | | | — | |
| Options expired | | | (7,556 | ) | | | (1,300,008 | ) | | | — | | | | — | |
| | | | |
| Options outstanding at April 30, 2017 | | | 4,955 | | | $ | 904,713 | | | | — | | | $ | — | |
| | |
| | | GROWTH AND INCOME FUND | | | GLOBAL GROWTH AND INCOME FUND | |
| | | NUMBER OF
CONTRACTS | | | PREMIUMS
RECEIVED | | | NUMBER OF
CONTRACTS | | | PREMIUMS
RECEIVED | |
| Options outstanding at October 31, 2016 | | | 753 | | | $ | 2,753,314 | | | | — | | | $ | — | |
| Options written | | | 27,100 | | | | 3,788,940 | | | | 7,010 | | | | 581,006 | |
| Options closed | | | (9,984 | ) | | | (4,317,827 | ) | | | (5,825 | ) | | | (364,217 | ) |
| Options exercised | | | — | | | | — | | | | — | | | | — | |
| Options expired | | | (14,643 | ) | | | (2,105,284 | ) | | | (1,185 | ) | | | (216,789 | ) |
| | | | |
| Options outstanding at April 30, 2017 | | | 3,226 | | | $ | 119,143 | | | | — | | | $ | — | |
| | |
| | | GLOBAL CONVERTIBLE FUND | | | MARKET NEUTRAL INCOME FUND | |
| | | NUMBER OF
CONTRACTS | | | PREMIUMS
RECEIVED | | | NUMBER OF
CONTRACTS | | | PREMIUMS
RECEIVED | |
| Options outstanding at October 31, 2016 | | | — | | | $ | — | | | | 59,444 | | | $ | 103,569,513 | |
| Options written | | | 44 | | | | 76,361 | | | | 66,523 | | | | 109,104,442 | |
| Options closed | | | (44 | ) | | | (76,361 | ) | | | (39,244 | ) | | | (49,137,813 | ) |
| Options exercised | | | — | | | | — | | | | (14,610 | ) | | | (56,377,610 | ) |
| Options expired | | | — | | | | — | | | | (44,310 | ) | | | (41,411,069 | ) |
| | | | |
| Options outstanding at April 30, 2017 | | | — | | | $ | — | | | | 27,803 | | | $ | 65,747,463 | |
| | |
| | | HEDGED EQUITY INCOME FUND | | | PHINEUS LONG/SHORT FUND | |
| | | NUMBER OF
CONTRACTS | | | PREMIUMS
RECEIVED | | | NUMBER OF
CONTRACTS | | | PREMIUMS
RECEIVED | |
| Options outstanding at October 31, 2016 | | | 205 | | | $ | 778,751 | | | | 2,614 | | | $ | 242,600 | |
| Options written | | | 414 | | | | 878,182 | | | | 135,710 | | | | 8,719,196 | |
| Options closed | | | (237 | ) | | | (479,673 | ) | | | (41,883 | ) | | | (3,368,968 | ) |
| Options exercised | | | (100 | ) | | | (431,737 | ) | | | (17,859 | ) | | | (1,259,430 | ) |
| Options expired | | | (223 | ) | | | (315,180 | ) | | | (48,347 | ) | | | (3,139,585 | ) |
| | | | |
| Options outstanding at April 30, 2017 | | | 59 | | | $ | 430,343 | | | | 30,235 | | | $ | 1,193,813 | |
| | | | |
| 148 | | CALAMOS OPEN-END FAMILY OF FUNDS SEMIANNUAL REPORT | | |
Notes to Financial Statements (Unaudited)
As of April 30, 2017, the Funds had outstanding derivative contracts which are reflected on the Statements of Assets and Liabilities as follows:
| | | | | | | | |
| | | ASSET
DERIVATIVES | | | LIABILITY
DERIVATIVES | |
| |
| | | GROWTH FUND | |
| Gross amounts at fair value: | | | | | | | | |
| Purchased Options(2) | | $ | 3,832,488 | | | $ | — | |
| Written Options(3) | | | — | | | | 519,355 | |
| | | | |
| | $ | 3,832,488 | | | $ | 519,355 | |
| | | | |
| |
| | | INTERNATIONAL GROWTH FUND | |
| Gross amounts at fair value: | | | | | | | | |
| Purchased Options(2) | | $ | 618,273 | | | $ | — | |
| | | | |
| | $ | 618,273 | | | $ | — | |
| | | | |
| |
| | | EVOLVING WORLD GROWTH FUND | |
| Gross amounts at fair value: | | | | | | | | |
| Purchased Options(2) | | $ | 227,475 | | | $ | — | |
| | | | |
| | $ | 227,475 | | | $ | — | |
| | | | |
| |
| | | EMERGING MARKETS EQUITY FUND | |
| Gross amounts at fair value: | | | | | | | | |
| Purchased Options(2) | | $ | 1,365 | | | $ | — | |
| | | | |
| | $ | 1,365 | | | $ | — | |
| | | | |
| |
| | | GLOBAL EQUITY FUND | |
| Gross amounts at fair value: | | | | | | | | |
| Forward foreign currency contracts(1) | | $ | — | | | $ | 37,149 | |
| | | | |
| | $ | — | | | $ | 37,149 | |
| | | | |
| |
| | | GROWTH AND INCOME FUND | |
| Gross amounts at fair value: | | | | | | | | |
| Purchased Options(2) | | $ | 364,594 | | | $ | — | |
| Written Options(3) | | | — | | | | 38,946 | |
| | | | |
| | $ | 364,594 | | | $ | 38,946 | |
| | | | |
| |
| | | GLOBAL GROWTH AND INCOME FUND | |
| Gross amounts at fair value: | | | | | | | | |
| Forward foreign currency contracts(1) | | $ | — | | | $ | 28,444 | |
| Purchased Options(2) | | | 932,003 | | | | — | |
| | | | |
| | $ | 932,003 | | | $ | 28,444 | |
| | | | |
| |
| | | CONVERTIBLE FUND | |
| Gross amounts at fair value: | | | | | | | | |
| Purchased Options(2) | | $ | 2,460,350 | | | $ | — | |
| | | | |
| | $ | 2,460,350 | | | $ | — | |
| | | | |
Notes to Financial Statements (Unaudited)
| | | | | | | | |
| | | ASSET
DERIVATIVES | | | LIABILITY
DERIVATIVES | |
| |
| | | GLOBAL CONVERTIBLE FUND | |
| Gross amounts at fair value: | | | | | | | | |
| Purchased Options(2) | | $ | 865,815 | | | $ | — | |
| | | | |
| | $ | 865,815 | | | $ | — | |
| | | | |
| |
| | | MARKET NEUTRAL INCOME FUND | |
| Gross amounts at fair value: | | | | | | | | |
| Forward foreign currency contracts(1) | | $ | — | | | $ | 77,114 | |
| Purchased Options(2) | | | 18,990,200 | | | | — | |
| Written Options(3) | | | — | | | | 98,566,562 | |
| | | | |
| | $ | 18,990,200 | | | $ | 98,643,676 | |
| | | | |
| |
| | | HEDGED EQUITY INCOME FUND | |
| Gross amounts at fair value: | | | | | | | | |
| Purchased Options(2) | | $ | 104,675 | | | $ | — | |
| Written Options(3) | | | — | | | | 642,835 | |
| | | | |
| | $ | 104,675 | | | $ | 642,835 | |
| | | | |
| |
| | | PHINEUS LONG/SHORT FUND | |
| Gross amounts at fair value: | | | | | | | | |
| Purchased Options(2) | | $ | 1,478,549 | | | $ | — | |
| Written Options(3) | | | — | | | | 589,205 | |
| | | | |
| | $ | 1,478,549 | | | $ | 589,205 | |
| | | | |
The following table presents the outstanding derivative contracts, organized by counterparty, that are subject to enforceable master netting agreements as of April 30, 2017:
| | | | | | | | | | | | | | | | | | | | | | | | |
| | | GROSS AMOUNTS NOT OFFSET
IN THE STATEMENT OF ASSETS AND LIABILITIES | |
| GLOBAL EQUITY FUND | | GROSS AMOUNTS PRESENTED IN THE
STATEMENT OF ASSETS AND LIABILITIES | | | COLLATERAL
PLEDGED | | | NET AMOUNT
RECEIVABLE IN
THE EVENT
OF DEFAULT | | | NET AMOUNT
PAYABLE IN
THE EVENT
OF DEFAULT | |
| Counterparty | | | | | ASSETS | | | LIABILITIES | | | | |
| State Street Bank and Trust Company | | | ISDA | | | $ | — | | | $ | 37,149 | | | $ | — | | | $ | — | | | $ | 37,149 | |
| | | | |
| | | $ | — | | | $ | 37,149 | | | $ | — | | | $ | — | | | $ | 37,149 | |
| | | | |
| | | | |
| GLOBAL GROWTH AND INCOME FUND | | GROSS AMOUNTS PRESENTED IN THE
STATEMENT OF ASSETS AND LIABILITIES | | | COLLATERAL
PLEDGED | | | NET AMOUNT
RECEIVABLE IN
THE EVENT
OF DEFAULT | | | NET AMOUNT
PAYABLE IN
THE EVENT
OF DEFAULT | |
| Counterparty | | | | | ASSETS | | | LIABILITIES | | | | |
| State Street Bank and Trust Company | | | ISDA | | | $ | — | | | $ | 28,444 | | | $ | — | | | $ | — | | | $ | 28,444 | |
| | | | |
| | | $ | — | | | $ | 28,444 | | | $ | — | | | $ | — | | | $ | 28,444 | |
| | | | |
| | | | |
| MARKET NEUTRAL INCOME FUND | | GROSS AMOUNTS PRESENTED IN THE
STATEMENT OF ASSETS AND LIABILITIES | | | COLLATERAL
PLEDGED | | | NET AMOUNT
RECEIVABLE IN
THE EVENT
OF DEFAULT | | | NET AMOUNT
PAYABLE IN
THE EVENT
OF DEFAULT | |
| Counterparty | | | | | ASSETS | | | LIABILITIES | | | | |
| JPMorgan Chase Bank, N.A. | | | ISDA | | | $ | — | | | $ | 77,114 | | | $ | — | | | $ | — | | | $ | 77,114 | |
| | | | |
| | | $ | — | | | $ | 77,114 | | | $ | — | | | $ | — | | | $ | 77,114 | |
| | | | |
| (1) | Generally, the Statement of Assets and Liabilities location for Forward foreign currency contracts is Unrealized appreciation on forward foreign currency contracts for asset derivatives and Unrealized depreciation on forward foreign currency contracts for liability derivatives. |
| (2) | Generally, the Statement of Assets and Liabilities location for Options purchased is Investments in securities, at value. |
| (3) | Generally, the Statement of Assets and Liabilities location for Options written is Options written, at value. |
| | | | |
| 150 | | CALAMOS OPEN-END FAMILY OF FUNDS SEMIANNUAL REPORT | | |
Notes to Financial Statements (Unaudited)
For the period ended April 30, 2017, the volume of derivative activity for the Fund is reflected below:*
| | | | | | | | | | | | |
| FUND | | FORWARD CONTRACTS | | | OPTIONS PURCHASED | | | OPTIONS WRITTEN | |
| Growth Fund | | | — | | | | 11,032 | | | | 21,627 | |
| Opportunistic Value Fund | | | — | | | | — | | | | — | |
| Dividend Growth Fund | | | — | | | | — | | | | — | |
| International Growth Fund | | | 43,632,944 | | | | 6,780 | | | | — | |
| Evolving World Growth Fund | | | — | | | | 41,752 | | | | 8,000 | |
| Emerging Market Equity Fund | | | — | | | | 133 | | | | — | |
| Global Equity Fund | | | 30,578,665 | | | | 1,930 | | | | — | |
| Growth and Income Fund | | | — | | | | 26,872 | | | | 27,100 | |
| Global Growth and Income Fund | | | 41,043,066 | | | | 19,127 | | | | 7,010 | |
| Convertible Fund | | | 1,936,420 | | | | 7,025 | | | | — | |
| Global Convertible Fund | | | — | | | | 4,238 | | | | 44 | |
| Total Return Bond Fund | | | — | | | | — | | | | — | |
| High Income Fund | | | — | | | | — | | | | — | |
| Market Neutral Income Fund | | | — | | | | 111,918 | | | | 66,523 | |
| Hedged Equity Income Fund | | | — | | | | 810 | | | | 414 | |
| Phineus Long/Short Fund | | | — | | | | 116,822 | | | | 135,710 | |
| * | Activity during the period is measured by opened number of contracts for options purchased or written and opened foreign currency contracts (measured in notional). |
Note 7 – Securities Lending
The Funds may loan one or more of their securities to broker-dealers and banks. Any such loan must be secured by collateral in cash or cash equivalents maintained on a current basis in an amount at least equal to the value of the securities loaned by the Funds. The Funds continue to receive the equivalent of the interest or dividends paid by the issuer on the securities loaned and also receive an additional return that may be in the form of a fixed fee or a percentage of the collateral. The additional return is disclosed on a net basis as Securities lending income in the Statement of Operations. Upon receipt of cash or cash equivalent collateral, the Funds’ securities lending agent invests the collateral into short term investments following investment guidelines approved by Calamos Advisors. The Funds record the investment of collateral as an asset and the value of the collateral as a liability on the Statements of Assets and Liabilities. If the value of the invested collateral declines below the value of the collateral deposited by the borrower, the Funds will record unrealized depreciation equal to the decline in value of the invested collateral. The Funds will pay reasonable fees to persons unaffiliated with the Funds for services in arranging these loans. The Funds have the right to call a loan and obtain the securities loaned at any time. The Funds do not have the right to vote the securities during the existence of the loan but could call the loan in an attempt to permit voting of the securities in certain circumstances. Upon return of the securities loaned, the cash or cash equivalent collateral will be returned to the borrower. In the event of bankruptcy or other default of the borrower, the Funds could experience both delays in liquidating the loan collateral or recovering the loaned securities and losses, including (a) possible decline in the value of the collateral or in the value of the securities loaned during the period while the Funds seek to enforce its rights thereto, (b) possible subnormal levels of income and lack of access to income during this period, and (c) the expenses of enforcing their rights. In an effort to reduce these risks, the Funds’ security lending agent monitors and reports to Calamos Advisors on the creditworthiness of the firms to which a Fund lends securities.
Notes to Financial Statements (Unaudited)
At April 30, 2017, securities were on loan for the Funds below:
| | | | | | | | | | | | | | | | | | | | |
| | | VALUE OF SECURITIES
ON LOAN TO
BROKERS-DEALERS
AND BANKS | | | AMOUNT OF COLLATERAL HELD IN SHORT TERM INVESTMENTS
AND RESTRICTED CASH BY ASSET CLASS ON LOAN | | | EXCESS AMOUNT
DUE TO
COUNTERPARTY | |
| FUND | | | EQUITY | | | FIXED INCOME | | | TOTAL | | |
| Growth Fund | | $ | 12,007,109 | | | $ | 12,671,505 | | | $ | — | | | $ | 12,671,505 | | | $ | 664,396 | |
| Opportunistic Value Fund | | | 216,476 | | | | 221,375 | | | | — | | | | 221,375 | | | | 4,899 | |
| Dividend Growth Fund | | | — | | | | — | | | | — | | | | — | | | | — | |
| International Growth Fund | | | 1,502,784 | | | | 1,582,768 | | | | — | | | | 1,582,768 | | | | 79,984 | |
| Evolving World Growth Fund | | | — | | | | — | | | | — | | | | — | | | | — | |
| Emerging Market Equity Fund | | | 104,244 | | | | 107,100 | | | | — | | | | 107,100 | | | | 2,856 | |
| Global Equity Fund | | | 635,383 | | | | 669,201 | | | | — | | | | 669,201 | | | | 33,818 | |
| Growth and Income Fund | | | 44,876,101 | | | | 107,442 | | | | 45,622,411 | | | | 45,729,853 | | | | 853,752 | |
| Global Growth and Income Fund | | | 8,889,314 | | | | — | | | | 9,060,480 | | | | 9,060,480 | | | | 171,166 | |
| Convertible Fund | | | 35,765,580 | | | | — | | | | 36,542,425 | | | | 36,542,425 | | | | 776,845 | |
| Global Convertible Fund | | | 705,955 | | | | — | | | | 721,495 | | | | 721,495 | | | | 15,540 | |
| Total Return Bond Fund | | | 259,193 | | | | — | | | | 264,290 | | | | 264,290 | | | | 5,097 | |
| High Income Fund | | | 2,208,572 | | | | 2,278,690 | | | | — | | | | 2,278,690 | | | | 70,118 | |
| Market Neutral Income Fund | | | 27,647,635 | | | | 125,820 | | | | 28,429,273 | | | | 28,555,093 | | | | 907,458 | |
| Hedged Equity Income Fund | | | — | | | | — | | | | — | | | | — | | | | — | |
| Phineus Long/Short Fund | | | 3,192,187 | | | | 3,369,112 | | | | — | | | | 3,369,112 | | | | 176,925 | |
Note 8 – Fair Value Measurements
Various inputs are used to determine the value of the Funds’ investments. These inputs are categorized into three broad levels as follows:
| | • | | Level 1 – Prices are determined using inputs from unadjusted quoted prices from active markets (including securities actively traded on a securities exchange) for identical assets. |
| | • | | Level 2 – Prices are determined using significant observable market inputs other than unadjusted quoted prices, including quoted prices of similar securities, fair value adjustments to quoted foreign securities, interest rates, credit risk, prepayment speeds, and other relevant data. |
| | • | | Level 3 – Prices reflect unobservable market inputs (including the Funds’ own judgments about assumptions market participants would use in determining fair value) when observable inputs are unavailable. |
Debt securities are valued based upon evaluated prices received from an independent pricing service or from a dealer or broker who makes markets in such securities. Pricing services utilize various observable market data and as such, debt securities are generally categorized as Level 2. The levels are not necessarily an indication of the risk or liquidity of the Fund’s investments. Transfers between the levels for investment securities or other financial instruments are measured at the end of the reporting period.
| | | | |
| 152 | | CALAMOS OPEN-END FAMILY OF FUNDS SEMIANNUAL REPORT | | |
Notes to Financial Statements (Unaudited)
The following is a summary of the inputs used in valuing the Funds’ holdings at fair value:
| | | | | | | | | | | | | | | | |
| | | GROWTH FUND | |
| | | LEVEL 1 | | | LEVEL 2 | | | LEVEL 3 | | | TOTAL | |
| Assets: | | | | | | | | | | | | | | | | |
Common Stocks U.S. | | $ | 1,722,890,664 | | | $ | — | | | $ | — | | | $ | 1,722,890,664 | |
Purchased Options | | | 3,832,488 | | | | — | | | | — | | | | 3,832,488 | |
Short Term Investments | | | 6,486,676 | | | | — | | | | — | | | | 6,486,676 | |
Investment of Cash Collateral For Securities Loaned | | | 2,232,182 | | | | 4,107,214 | | | | — | | | | 6,339,396 | |
| | | | |
Total | | | 1,735,442,010 | | | $ | 4,107,214 | | | $ | — | | | $ | 1,739,549,224 | |
| | | | |
| Liabilities: | | | | | | | | | | | | | | | | |
Written Options | | $ | 519,355 | | | $ | — | | | $ | — | | | $ | 519,355 | |
| | | | |
Total | | $ | 519,355 | | | $ | — | | | $ | — | | | $ | 519,355 | |
| | | | |
| |
| | | OPPORTUNISTIC VALUE FUND | |
| | | LEVEL 1 | | | LEVEL 2 | | | LEVEL 3 | | | TOTAL | |
| Assets: | | | | | | | | | | | | | | | | |
Common Stocks U.S. | | $ | 54,827,308 | | | $ | — | | | $ | — | | | $ | 54,827,308 | |
Short Term Investments | | | 215,044 | | | | — | | | | — | | | | 215,044 | |
Investment of Cash Collateral For Securities Loaned | | | 38,997 | | | | 71,754 | | | | — | | | | 110,751 | |
| | | | |
Total | | $ | 55,081,349 | | | $ | 71,754 | | | $ | — | | | $ | 55,153,103 | |
| | | | |
| |
| | | DIVIDEND GROWTH FUND | |
| | | LEVEL 1 | | | LEVEL 2 | | | LEVEL 3 | | | TOTAL | |
| Assets: | | | | | | | | | | | | | | | | |
Common Stocks U.S. | | $ | 29,494,511 | | | $ | — | | | $ | — | | | $ | 29,494,511 | |
Short Term Investments | | | 54,964 | | | | — | | | | — | | | | 54,964 | |
| | | | |
Total | | $ | 29,549,475 | | | $ | — | | | $ | — | | | $ | 29,549,475 | |
| | | | |
| |
| | | INTERNATIONAL GROWTH FUND | |
| | | LEVEL 1 | | | LEVEL 2 | | | LEVEL 3 | | | TOTAL | |
| Assets: | | | | | | | | | | | | | | | | |
Common Stocks Foreign | | $ | 16,141,454 | | | $ | 228,876,959 | | | $ | — | | | $ | 245,018,413 | |
Common Stocks U.S. | | | 35,650,601 | | | | — | | | | — | | | | 35,650,601 | |
Purchased Options | | | 618,273 | | | | — | | | | — | | | | 618,273 | |
Short Term Investments | | | 2,272,820 | | | | — | | | | — | | | | 2,272,820 | |
Investment of Cash Collateral For Securities Loaned | | | 278,817 | | | | 513,022 | | | | — | | | | 791,839 | |
| | | | |
Total | | $ | 54,961,965 | | | $ | 229,389,981 | | | $ | — | | | $ | 284,351,946 | |
| | | | |
| | | | |
| | | TRANSFERS IN
TO LEVEL 1 | | | TRANSFERS OUT
OF LEVEL 1* | | | TRANSFERS IN
TO LEVEL 2* | | | TRANSFERS OUT
OF LEVEL 2 | |
| Investments at Value: | | | | | | | | | | | | | | | | |
Common Stock Foreign | | $ | — | | | $ | 16,374,982 | | | $ | 16,374,982 | | | $ | — | |
| | | | |
Total | | $ | — | | | $ | 16,374,982 | | | $ | 16,374,982 | | | $ | — | |
| | | | |
| * | Transfers from Level 1 to Level 2 were due to the availability of an applied factor utilizing a systematic fair valuation model on securities that trade on European and Far Eastern exchanges. |
Notes to Financial Statements (Unaudited)
| | | | | | | | | | | | | | | | |
| | | EVOLVING WORLD GROWTH FUND | |
| | | LEVEL 1 | | | LEVEL 2 | | | LEVEL 3 | | | TOTAL | |
| Assets: | | | | | | | | | | | | | | | | |
Convertible Bonds | | $ | — | | | $ | 41,106,890 | | | $ | — | | | $ | 41,106,890 | |
Sovereign Bonds | | | — | | | | 2,330,685 | | | | — | | | | 2,330,685 | |
Convertible Preferred Stocks | | | — | | | | 12,591,941 | | | | — | | | | 12,591,941 | |
Common Stocks Foreign | | | 24,422,439 | | | | 192,128,256 | | | | — | | | | 216,550,695 | |
Common Stocks U.S. | | | 39,704,655 | | | | — | | | | — | | | | 39,704,655 | |
Purchased Options | | | 227,475 | | | | — | | | | — | | | | 227,475 | |
Short Term Investments | | | 1,973 | | | | — | | | | — | | | | 1,973 | |
| | | | |
Total | | $ | 64,356,542 | | | $ | 248,157,772 | | | $ | — | | | $ | 312,514,314 | |
| | | | |
| | | | |
| | | TRANSFERS IN
TO LEVEL 1* | | | TRANSFERS OUT
OF LEVEL 1 | | | TRANSFERS IN
TO LEVEL 2 | | | TRANSFERS OUT
OF LEVEL 2* | |
| Investments at Value: | | | | | | | | | | | | | | | | |
Common Stock Foreign | | $ | — | | | $ | 30,535,017 | | | $ | 30,535,017 | | | $ | — | |
| | | | |
Total | | $ | — | | | $ | 30,535,017 | | | $ | 30,535,017 | | | $ | — | |
| | | | |
| * | Transfers from Level 1 to Level 2 were due to the availability of an applied factor utilizing a systematic fair valuation model on securities that trade on European and Far Eastern exchanges. |
| | | | | | | | | | | | | | | | |
| | | EMERGING MARKET EQUITY FUND | |
| | | LEVEL 1 | | | LEVEL 2 | | | LEVEL 3 | | | TOTAL | |
| Assets: | | | | | | | | | | | | | | | | |
Common Stocks Foreign | | $ | 1,427,451 | | | $ | 8,029,275 | | | $ | — | | | $ | 9,456,726 | |
Common Stocks U.S. | | | 4,502,613 | | | | — | | | | — | | | | 4,502,613 | |
Exchange-Traded Funds | | | 553,001 | | | | — | | | | — | | | | 553,001 | |
Purchased Options | | | 1,365 | | | | — | | | | — | | | | 1,365 | |
Short Term Investments | | | 395,734 | | | | — | | | | — | | | | 395,734 | |
Investment of Cash Collateral For Securities Loaned | | | 18,867 | | | | 34,714 | | | | — | | | | 53,581 | |
| | | | |
Total | | $ | 6,899,031 | | | $ | 8,063,989 | | | $ | — | | | $ | 14,963,020 | |
| | | | |
| | | | |
| | | TRANSFERS IN
TO LEVEL 1* | | | TRANSFERS OUT
OF LEVEL 1 | | | TRANSFERS IN
TO LEVEL 2 | | | TRANSFERS OUT
OF LEVEL 2* | |
| Investments at Value: | | | | | | | | | | | | | | | | |
Common Stock Foreign | | $ | — | | | $ | 86,098 | | | $ | 86,098 | | | $ | — | |
| | | | |
Total | | $ | — | | | $ | 86,098 | | | $ | 86,098 | | | $ | — | |
| | | | |
| * | Transfers from Level 1 to Level 2 were due to the availability of an applied factor utilizing a systematic fair valuation model on securities that trade on European and Far Eastern exchanges. |
| | | | |
| 154 | | CALAMOS OPEN-END FAMILY OF FUNDS SEMIANNUAL REPORT | | |
Notes to Financial Statements (Unaudited)
| | | | | | | | | | | | | | | | |
| | | GLOBAL EQUITY FUND | |
| | | LEVEL 1 | | | LEVEL 2 | | | LEVEL 3 | | | TOTAL | |
| Assets: | | | | | | | | | | | | | | | | |
Common Stocks U.S. | | $ | 57,873,697 | | | $ | — | | | $ | — | | | $ | 57,873,697 | |
Common Stocks Foreign | | | 1,322,691 | | | | 57,763,988 | | | | — | | | | 59,086,679 | |
Short Term Investments | | | 2,405,197 | | | | — | | | | — | | | | 2,405,197 | |
Investment of Cash Collateral For Securities Loaned | | | 117,885 | | | | 216,908 | | | | — | | | | 334,793 | |
| | | | |
Total | | $ | 61,719,470 | | | $ | 57,980,896 | | | $ | — | | | $ | 119,700,366 | |
| | | | |
| Liabilities: | | | | | | | | | | | | | | | | |
Forward Foreign Currency Contracts | | $ | — | | | $ | 37,149 | | | $ | — | | | $ | 37,149 | |
| | | | |
Total | | $ | — | | | $ | 37,149 | | | $ | — | | | $ | 37,149 | |
| | | | |
| | | | |
| | | TRANSFERS IN
TO LEVEL 1 | | | TRANSFERS OUT
OF LEVEL 1* | | | TRANSFERS IN
TO LEVEL 2* | | | TRANSFERS OUT
OF LEVEL 2 | |
| Investments at Value: | | | | | | | | | | | | | | | | |
Common Stock Foreign | | $ | — | | | $ | 6,521,570 | | | $ | 6,521,570 | | | $ | — | |
| | | | |
Total | | $ | — | | | $ | 6,521,570 | | | $ | 6,521,570 | | | $ | — | |
| | | | |
| * | Transfers from Level 1 to Level 2 were due to the availability of an applied factor utilizing a systematic fair valuation model on securities that trade on European and Far Eastern exchanges. |
| | | | | | | | | | | | | | | | |
| | | GROWTH AND INCOME FUND | |
| | | LEVEL 1 | | | LEVEL 2 | | | LEVEL 3 | | | TOTAL | |
| Assets: | | | | | | | | | | | | | | | | |
Convertible Bonds | | $ | — | | | $ | 332,783,868 | | | $ | — | | | $ | 332,783,868 | |
Corporate Bonds | | | — | | | | 127,024,899 | | | | — | | | | 127,024,899 | |
U.S. Government and Agency Securities | | | — | | | | 22,191,043 | | | | — | | | | 22,191,043 | |
Convertible Preferred Stocks | | | 150,074,294 | | | | 42,998,672 | | | | — | | | | 193,072,966 | |
Common Stocks U.S. | | | 1,366,290,028 | | | | — | | | | — | | | | 1,366,290,028 | |
Exchange-Traded Funds | | | 5,565,868 | | | | — | | | | — | | | | 5,565,868 | |
Purchased Options | | | 364,594 | | | | — | | | | — | | | | 364,594 | |
Short Term Investments | | | 31,011,038 | | | | — | | | | — | | | | 31,011,038 | |
Investment of Cash Collateral For Securities Loaned | | | 8,055,660 | | | | 14,822,415 | | | | — | | | | 22,878,075 | |
| | | | |
Total | | $ | 1,561,361,482 | | | $ | 539,820,897 | | | $ | — | | | $ | 2,101,182,379 | |
| | | | |
| Liabilities: | | | | | | | | | | | | | | | | |
Written Options | | $ | 38,946 | | | $ | — | | | $ | — | | | $ | 38,946 | |
| | | | |
Total | | $ | 38,946 | | | $ | — | | | $ | — | | | $ | 38,946 | |
| | | | |
Notes to Financial Statements (Unaudited)
| | | | | | | | | | | | | | | | |
| | | GLOBAL GROWTH AND INCOME FUND | |
| | | LEVEL 1 | | | LEVEL 2 | | | LEVEL 3 | | | TOTAL | |
| Assets: | | | | | | | | | | | | | | | | |
Convertible Bonds | | $ | — | | | $ | 72,548,015 | | | $ | — | | | $ | 72,548,015 | |
Synthetic Convertible Securities (Corporate Bonds) | | | — | | | | 3,603,576 | | | | — | | | | 3,603,576 | |
Synthetic Convertible Securities (Purchased Options) | | | 752,337 | | | | — | | | | — | | | | 752,337 | |
Convertible Preferred Stocks | | | 11,107,532 | | | | 4,123,998 | | | | — | | | | 15,231,530 | |
Common Stocks U.S. | | | 69,900,055 | | | | — | | | | — | | | | 69,900,055 | |
Common Stocks Foreign | | | — | | | | 61,011,594 | | | | — | | | | 61,011,594 | |
Sovereign Bonds | | | — | | | | 1,317,333 | | | | — | | | | 1,317,333 | |
Purchased Options | | | 179,666 | | | | — | | | | — | | | | 179,666 | |
Short Term Investments | | | 1,113,762 | | | | — | | | | — | | | | 1,113,762 | |
Investment of Cash Collateral For Securities Loaned | | | 1,596,072 | | | | 2,936,773 | | | | — | | | | 4,532,845 | |
| | | | |
Total | | $ | 84,649,424 | | | $ | 145,541,289 | | | $ | — | | | $ | 230,190,713 | |
| | | | |
| Liabilities: | | | | | | | | | | | | | | | | |
Forward Foreign Currency Contracts | | $ | — | | | $ | 28,444 | | | $ | — | | | $ | 28,444 | |
| | | | |
Total | | $ | — | | | $ | 28,444 | | | $ | — | | | $ | 28,444 | |
| | | | |
| | | | |
| | | TRANSFERS IN
TO LEVEL 1 | | | TRANSFERS OUT
OF LEVEL 1* | | | TRANSFERS IN
TO LEVEL 2* | | | TRANSFERS OUT
OF LEVEL 2 | |
| Investments at Value: | | | | | | | | | | | | | | | | |
Common Stock Foreign | | $ | — | | | $ | 8,763,327 | | | $ | 8,763,327 | | | $ | — | |
| | | | |
Total | | $ | — | | | $ | 8,763,327 | | | $ | 8,763,327 | | | $ | — | |
| | | | |
| * | Transfers from Level 1 to Level 2 were due to the availability of an applied factor utilizing a systematic fair valuation model on securities that trade on European and Far Eastern exchanges. |
| | | | | | | | | | | | | | | | |
| | | CONVERTIBLE FUND | |
| | | LEVEL 1 | | | LEVEL 2 | | | LEVEL 3 | | | TOTAL | |
| Assets: | | | | | | | | | | | | | | | | |
Convertible Bonds | | $ | — | | | $ | 441,595,133 | | | $ | — | | | $ | 441,595,133 | |
Synthetic Convertible Securities (Purchased Options) | | | 2,259,800 | | | | — | | | | — | | | | 2,259,800 | |
Convertible Preferred Stocks | | | 107,624,838 | | | | 12,781,563 | | | | — | | | | 120,406,401 | |
Common Stocks U.S. | | | 18,917,150 | | | | — | | | | — | | | | 18,917,150 | |
Purchased Options | | | 200,550 | | | | — | | | | — | | | | 200,550 | |
Short Term Investments | | | 19,308,869 | | | | — | | | | — | | | | 19,308,869 | |
Investment of Cash Collateral For Securities Loaned | | | 6,437,225 | | | | 11,844,495 | | | | — | | | | 18,281,720 | |
| | | | |
Total | | $ | 154,748,432 | | | $ | 466,221,191 | | | $ | — | | | $ | 620,969,623 | |
| | | | |
| |
| | | GLOBAL CONVERTIBLE FUND | |
| | | LEVEL 1 | | | LEVEL 2 | | | LEVEL 3 | | | TOTAL | |
| Assets: | | | | | | | | | | | | | | | | |
Convertible Bonds | | $ | — | | | $ | 55,749,230 | | | $ | — | | | $ | 55,749,230 | |
Synthetic Convertible Securities (Corporate Bonds) | | | — | | | | 5,364,764 | | | | — | | | | 5,364,764 | |
Synthetic Convertible Securities (Purchased Options) | | | 823,795 | | | | — | | | | — | | | | 823,795 | |
Convertible Preferred Stocks | | | 10,016,283 | | | | 529,246 | | | | — | | | | 10,545,529 | |
Purchased Options | | | 42,020 | | | | — | | | | — | | | | 42,020 | |
Short Term Investments | | | 2,418,731 | | | | — | | | | — | | | | 2,418,731 | |
Investment of Cash Collateral For Securities Loaned | | | 127,097 | | | | 233,858 | | | | — | | | | 360,955 | |
| | | | |
Total | | $ | 13,427,926 | | | $ | 61,877,098 | | | $ | — | | | $ | 75,305,024 | |
| | | | |
| | | | |
| 156 | | CALAMOS OPEN-END FAMILY OF FUNDS SEMIANNUAL REPORT | | |
Notes to Financial Statements (Unaudited)
| | | | | | | | | | | | | | | | |
| | | TOTAL RETURN BOND FUND | |
| | | LEVEL 1 | | | LEVEL 2 | | | LEVEL 3 | | | TOTAL | |
| Assets: | | | | | | | | | | | | | | | | |
Corporate Bonds | | $ | — | | | $ | 56,513,177 | | | $ | — | | | $ | 56,513,177 | |
U.S. Government and Agency Securities | | | — | | | | 21,566,823 | | | | — | | | | 21,566,823 | |
Short Term Investments | | | 2,760,893 | | | | — | | | | — | | | | 2,760,893 | |
Investment of Cash Collateral For Securities Loaned | | | 46,557 | | | | 85,664 | | | | — | | | | 132,221 | |
| | | | |
Total | | $ | 2,807,450 | | | $ | 78,165,664 | | | $ | — | | | $ | 80,973,114 | |
| | | | |
| |
| | | HIGH INCOME FUND | |
| | | LEVEL 1 | | | LEVEL 2 | | | LEVEL 3 | | | TOTAL | |
| Assets: | | | | | | | | | | | | | | | | |
Corporate Bonds | | $ | — | | | $ | 60,934,627 | | | $ | — | | | $ | 60,934,627 | |
Convertible Preferred Stocks | | | 1,304,535 | | | | — | | | | — | | | | 1,304,535 | |
Short Term Investments | | | 309,212 | | | | — | | | | — | | | | 309,212 | |
Investment of Cash Collateral For Securities Loaned | | | 401,408 | | | | 738,592 | | | | — | | | | 1,140,000 | |
| | | | |
Total | | $ | 2,015,155 | | | $ | 61,673,219 | | | $ | — | | | $ | 63,688,374 | |
| | | | |
| |
| | | MARKET NEUTRAL INCOME FUND | |
| | | LEVEL 1 | | | LEVEL 2 | | | LEVEL 3 | | | TOTAL | |
| Assets: | | | | | | | | | | | | | | | | |
Convertible Bonds | | $ | — | | | $ | 1,889,718,247 | | | $ | — | | | $ | 1,889,718,247 | |
Synthetic Convertible Securities (Corporate Bonds) | | | — | | | | 175,829,096 | | | | — | | | | 175,829,096 | |
Synthetic Convertible Securities (Purchased Options) | | | 13,507,732 | | | | — | | | | — | | | | 13,507,732 | |
Convertible Preferred Stocks | | | 114,719,220 | | | | 92,668,030 | | | | — | | | | 207,387,250 | |
Common Stocks U.S. | | | 2,093,490,338 | | | | — | | | | — | | | | 2,093,490,338 | |
Exchange-Traded Funds | | | 21,465,769 | | | | — | | | | — | | | | 21,465,769 | |
Purchased Options | | | 5,482,468 | | | | — | | | | — | | | | 5,482,468 | |
Short Term Investments | | | 27,057,338 | | | | — | | | | — | | | | 27,057,338 | |
Investment of Cash Collateral For Securities Loaned | | | 5,030,196 | | | | 9,255,561 | | | | — | | | | 14,285,757 | |
| | | | |
Total | | $ | 2,280,753,061 | | | $ | 2,158,215,373 | | | $ | — | | | $ | 4,448,223,995 | |
| | | | |
| Liabilities: | | | | | | | | | | | | | | | | |
Common Stocks Sold Short U.S. | | $ | 1,358,350,990 | | | $ | — | | | $ | — | | | $ | 1,358,350,990 | |
Common Stocks Sold Short Foreign | | | — | | | | 29,253,837 | | | | — | | | | 29,253,837 | |
Written Options | | | 98,566,562 | | | | — | | | | — | | | | 98,566,562 | |
Forward Foreign Currency Contracts | | | — | | | | 77,114 | | | | — | | | | 77,114 | |
| | | | |
Total | | $ | 1,456,917,552 | | | $ | 29,330,951 | | | $ | — | | | $ | 1,486,248,503 | |
| | | | |
| |
| | | HEDGED EQUITY INCOME FUND | |
| | | LEVEL 1 | | | LEVEL 2 | | | LEVEL 3 | | | TOTAL | |
| Assets: | | | | | | | | | | | | | | | | |
Common Stocks U.S. | | $ | 15,245,871 | | | $ | — | | | $ | — | | | $ | 15,245,871 | |
Exchange-Traded Funds | | | 157,847 | | | | — | | | | — | | | | 157,847 | |
Purchased Options | | | 104,675 | | | | — | | | | — | | | | 104,675 | |
Short Term Investments | | | 48,142 | | | | — | | | | — | | | | 48,142 | |
| | | | |
Total | | $ | 15,556,535 | | | $ | — | | | $ | — | | | $ | 15,556,535 | |
| | | | |
| Liabilities: | | | | | | | | | | | | | | | | |
Written Options | | $ | 642,835 | | | $ | — | | | $ | — | | | $ | 642,835 | |
| | | | |
Total | | $ | 642,835 | | | $ | — | | | $ | — | | | $ | 642,835 | |
| | | | |
Notes to Financial Statements (Unaudited)
| | | | | | | | | | | | | | | | |
| | | PHINEUS LONG/SHORT FUND | |
| | | LEVEL 1 | | | LEVEL 2 | | | LEVEL 3 | | | TOTAL | |
| Assets: | | | | | | | | | | | | | | | | |
Common Stocks U.S. | | $ | 178,389,622 | | | $ | — | | | $ | — | | | $ | 178,389,622 | |
Common Stocks Foreign | | | 120,041 | | | | 5,241,264 | | | | — | | | | 5,361,305 | |
Exchange-Traded Funds | | | 36,710,074 | | | | — | | | | — | | | | 36,710,074 | |
Purchased Options | | | 1,478,549 | | | | — | | | | — | | | | 1,478,549 | |
Short Term Investments | | | 18,642,010 | | | | — | | | | — | | | | 18,642,010 | |
Investment of Cash Collateral For Securities Loaned | | | 593,495 | | | | 1,092,030 | | | | — | | | | 1,685,525 | |
| | | | |
Total | | $ | 235,933,791 | | | $ | 6,333,294 | | | $ | — | | | $ | 242,267,085 | |
| | | | |
| Liabilities: | | | | | | | | | | | | | | | | |
Common Stocks Sold Short U.S. | | $ | 9,222,617 | | | $ | — | | | $ | — | | | $ | 9,222,617 | |
Exchange-Traded Funds Sold Short | | | 98,089,658 | | | | — | | | | — | | | | 98,089,658 | |
Written Options | | | 589,205 | | | | — | | | | — | | | | 589,205 | |
| | | | |
Total | | $ | 107,901,480 | | | $ | — | | | $ | — | | | $ | 107,901,480 | |
| | | | |
| | | | |
| 158 | | CALAMOS OPEN-END FAMILY OF FUNDS SEMIANNUAL REPORT | | |
Notes to Financial Statements (Unaudited)
Note 9 – Capital Share Transactions
The following table summarizes the activity in capital shares of the Funds for the six months ended April 30, 2017:
| | | | | | | | | | | | | | | | | | | | | | | | |
| | | GROWTH FUND | | | OPPORTUNISTIC
VALUE FUND | | | DIVIDEND
GROWTH FUND(a) | |
| Class A | | Shares | | | Dollars | | | Shares | | | Dollars | | | Shares | | | Dollars | |
| Shares sold | | | 536,125 | | | $ | 16,399,748 | | | | 200,248 | | | $ | 2,693,000 | | | | 501,842 | | | $ | 5,426,923 | |
| Shares issued as reinvestment of distributions | | | 1,224,344 | | | | 36,216,101 | | | | 17,447 | | | | 238,151 | | | | 6,948 | | | | 77,009 | |
| Less shares redeemed | | | (6,667,779 | ) | | | (204,813,072 | ) | | | (470,861 | ) | | | (6,414,931 | ) | | | (705,441 | ) | | | (7,833,180 | ) |
| | | | |
| Net increase (decrease) | | | (4,907,310 | ) | | $ | (152,197,223 | ) | | | (253,166 | ) | | $ | (3,483,780 | ) | | | (196,651 | ) | | $ | (2,329,248 | ) |
| | | | |
| | | | | | |
| Class B | | Shares | | | Dollars | | | Shares | | | Dollars | | | Shares | | | Dollars | |
| Shares sold* | | | 234 | | | $ | 6,234 | | | | — | | | $ | — | | | | | | | | | |
| Shares issued as reinvestment of distributions | | | 7,229 | | | | 192,505 | | | | — | | | | — | | | | | | | | | |
| Less shares redeemed | | | (156,722 | ) | | | (4,312,657 | ) | | | (4,785 | ) | | | (60,451 | ) | | | | | | | | |
| | | | |
| Net increase (decrease) | | | (149,259 | ) | | $ | (4,113,918 | ) | | | (4,785 | ) | | $ | (60,451 | ) | | | | | | | | |
| | | | |
| | | | | | |
| Class C | | Shares | | | Dollars | | | Shares | | | Dollars | | | Shares | | | Dollars | |
| Shares sold | | | 511,625 | | | $ | 10,510,920 | | | | 68,031 | | | $ | 833,715 | | | | 24,859 | | | $ | 263,623 | |
| Shares issued as reinvestment of distributions | | | 1,177,543 | | | | 23,927,671 | | | | 212 | | | | 2,636 | | | | 133 | | | | 1,452 | |
| Less shares redeemed | | | (5,381,774 | ) | | | (113,822,963 | ) | | | (73,183 | ) | | | (902,745 | ) | | | (32,581 | ) | | | (359,769 | ) |
| | | | |
| Net increase (decrease) | | | (3,692,606 | ) | | $ | (79,384,372 | ) | | | (4,940 | ) | | $ | (66,394 | ) | | | (7,589 | ) | | $ | (94,694 | ) |
| | | | |
| | | | | | |
| Class I | | Shares | | | Dollars | | | Shares | | | Dollars | | | Shares | | | Dollars | |
| Shares sold | | | 998,184 | | | $ | 38,975,325 | | | | 136,404 | | | $ | 1,909,515 | | | | 26,051 | | | $ | 289,177 | |
| Shares issued as reinvestment of distributions | | | 240,851 | | | | 9,039,128 | | | | 11,927 | | | | 166,853 | | | | 2,634 | | | | 29,327 | |
| Less shares redeemed | | | (2,439,672 | ) | | | (94,736,620 | ) | | | (158,562 | ) | | | (2,225,211 | ) | | | (376,543 | ) | | | (4,182,906 | ) |
| | | | |
| Net increase (decrease) | | | (1,200,637 | ) | | $ | (46,722,167 | ) | | | (10,231 | ) | | $ | (148,843 | ) | | | (347,858 | ) | | $ | (3,864,402 | ) |
| | | | |
| | | | | | |
| Class R | | Shares | | | Dollars | | | Shares | | | Dollars | | | Shares | | | Dollars | |
| Shares sold | | | 29,952 | | | $ | 867,828 | | | | 489 | | | $ | 6,645 | | | | — | | | $ | — | |
| Shares issued as reinvestment of distributions | | | 9,051 | | | | 253,058 | | | | 6 | | | | 86 | | | | — | | | | — | |
| Less shares redeemed | | | (94,717 | ) | | | (2,784,740 | ) | | | (2 | ) | | | (24 | ) | | | (10,725 | ) | | | (118,095 | ) |
| | | | |
| Net increase (decrease) | | | (55,714 | ) | | $ | (1,663,854 | ) | | | 493 | | | $ | 6,707 | | | | (10,725 | ) | | $ | (118,095 | ) |
| | | | |
| | | | | | |
| Class T(b) | | Shares | | | Dollars | | | Shares | | | Dollars | | | Shares | | | Dollars | |
| Shares sold | | | 792 | | | $ | 25,000 | | | | 1,782 | | | $ | 25,000 | | | | 2,161 | | | $ | 25,000 | |
| | | | |
| Net increase (decrease) | | | 792 | | | $ | 25,000 | | | | 1,782 | | | $ | 25,000 | | | | 2,161 | | | $ | 25,000 | |
| | | | |
| * | Class B shares continue to be outstanding but are no longer an offered class of shares. |
| (a) | Class R shares were liquidated on January 23, 2017. |
| (b) | Class T commenced operations on February 27, 2017. |
Notes to Financial Statements (Unaudited)
| | | | | | | | | | | | | | | | | | | | | | | | |
| | | INTERNATIONAL
GROWTH FUND | | | EVOLVING WORLD
GROWTH FUND | | | EMERGING MARKET
EQUITY FUND(a) | |
| Class A | | Shares | | | Dollars | | | Shares | | | Dollars | | | Shares | | | Dollars | |
| Shares sold | | | 267,949 | | | $ | 4,400,748 | | | | 1,063,397 | | | $ | 12,466,861 | | | | 2,271 | | | $ | 19,843 | |
| Shares issued as reinvestment of distributions | | | — | | | | — | | | | — | | | | — | | | | — | | | | — | |
| Less shares redeemed | | | (2,418,812 | ) | | | (39,779,459 | ) | | | (4,386,910 | ) | | | (52,430,476 | ) | | | (5,111 | ) | | | (40,135 | ) |
| | | | |
| Net increase (decrease) | | | (2,150,863 | ) | | $ | (35,378,711 | ) | | | (3,323,513 | ) | | $ | (39,963,615 | ) | | | (2,840 | ) | | $ | (20,292 | ) |
| | | | |
| | | | | | |
| Class B | | Shares | | | Dollars | | | Shares | | | Dollars | | | Shares | | | Dollars | |
| Shares sold* | | | — | | | $ | — | | | | — | | | $ | — | | | | | | | | | |
| Shares issued as reinvestment of distributions | | | — | | | | — | | | | — | | | | — | | | | | | | | | |
| Less shares redeemed | | | (10,724 | ) | | | (165,758 | ) | | | (5,589 | ) | | | (63,679 | ) | | | | | | | | |
| | | | |
| Net increase (decrease) | | | (10,724 | ) | | $ | (165,758 | ) | | | (5,589 | ) | | $ | (63,679 | ) | | | | | | | | |
| | | | |
| | | | | | |
| Class C | | Shares | | | Dollars | | | Shares | | | Dollars | | | Shares | | | Dollars | |
| Shares sold | | | 77,298 | | | $ | 1,156,868 | | | | 138,199 | | | $ | 1,562,303 | | | | 13,503 | | | $ | 107,809 | |
| Shares issued as reinvestment of distributions | | | — | | | | — | | | | — | | | | — | | | | — | | | | — | |
| Less shares redeemed | | | (701,130 | ) | | | (10,654,909 | ) | | | (715,079 | ) | | | (7,917,723 | ) | | | (8,165 | ) | | | (63,540 | ) |
| | | | |
| Net increase (decrease) | | | (623,832 | ) | | $ | (9,498,041 | ) | | | (576,880 | ) | | $ | (6,355,420 | ) | | | 5,338 | | | $ | 44,269 | |
| | | | |
| | | | | | |
| Class I | | Shares | | | Dollars | | | Shares | | | Dollars | | | Shares | | | Dollars | |
| Shares sold | | | 1,089,200 | | | $ | 18,547,988 | | | | 3,569,921 | | | $ | 42,415,358 | | | | 91,506 | | | $ | 727,853 | |
| Shares issued as reinvestment of distributions | | | — | | | | — | | | | — | | | | — | | | | — | | | | — | |
| Less shares redeemed | | | (4,539,694 | ) | | | (76,225,411 | ) | | | (7,523,203 | ) | | | (87,899,936 | ) | | | (45,532 | ) | | | (376,267 | ) |
| | | | |
| Net increase (decrease) | | | (3,450,494 | ) | | $ | (57,677,423 | ) | | | (3,953,282 | ) | | $ | (45,484,578 | ) | | | 45,974 | | | $ | 351,586 | |
| | | | |
| | | | | | |
| Class R | | Shares | | | Dollars | | | Shares | | | Dollars | | | Shares | | | Dollars | |
| Shares sold | | | 79,317 | | | $ | 1,325,996 | | | | 41,488 | | | $ | 486,743 | | | | — | | | $ | — | |
| Shares issued as reinvestment of distributions | | | — | | | | — | | | | — | | | | — | | | | — | | | | — | |
| Less shares redeemed | | | (86,400 | ) | | | (1,396,486 | ) | | | (45,487 | ) | | | (531,787 | ) | | | (10,017 | ) | | | (82,398 | ) |
| | | | |
| Net increase (decrease) | | | (7,083 | ) | | $ | (70,490 | ) | | | (3,999 | ) | | $ | (45,044 | ) | | | (10,017 | ) | | $ | (82,398 | ) |
| | | | |
| | | | | | |
| Class T(b) | | Shares | | | Dollars | | | Shares | | | Dollars | | | Shares | | | Dollars | |
| Shares sold | | | 1,472 | | | $ | 25,000 | | | | 2,073 | | | $ | 25,000 | | | | 2,938 | | | $ | 25,000 | |
| | | | |
| Net increase (decrease) | | | 1,472 | | | $ | 25,000 | | | | 2,073 | | | $ | 25,000 | | | | 2,938 | | | $ | 25,000 | |
| | | | |
| * | Class B shares continue to be outstanding but are no longer an offered class of shares. |
| (a) | Class R shares were liquidated on January 23, 2017. |
| (b) | Class T commenced operations on February 27, 2017. |
| | | | |
| 160 | | CALAMOS OPEN-END FAMILY OF FUNDS SEMIANNUAL REPORT | | |
Notes to Financial Statements (Unaudited)
| | | | | | | | | | | | | | | | | | | | | | | | |
| | | GLOBAL EQUITY FUND | | | GROWTH AND
INCOME FUND | | | GLOBAL GROWTH
AND INCOME FUND | |
| Class A | | Shares | | | Dollars | | | Shares | | | Dollars | | | Shares | | | Dollars | |
| Shares sold | | | 112,687 | | | $ | 1,411,449 | | | | 877,807 | | | $ | 26,697,053 | | | | 283,159 | | | $ | 2,417,420 | |
| Shares issued as reinvestment of distributions | | | 82,310 | | | | 994,304 | | | | 1,606,136 | | | | 48,142,976 | | | | 57,665 | | | | 485,542 | |
| Less shares redeemed | | | (687,673 | ) | | | (8,610,726 | ) | | | (5,313,993 | ) | | | (162,185,027 | ) | | | (2,253,561 | ) | | | (19,301,560 | ) |
| | | | |
| Net increase (decrease) | | | (492,676 | ) | | $ | (6,204,973 | ) | | | (2,830,050 | ) | | $ | (87,344,998 | ) | | | (1,912,737 | ) | | $ | (16,398,598 | ) |
| | | | |
| | | | | | |
| Class B | | Shares | | | Dollars | | | Shares | | | Dollars | | | Shares | | | Dollars | |
| Shares sold* | | | 88 | | | $ | 1,043 | | | | 1,234 | | | $ | 46,381 | | | | 32 | | | $ | 276 | |
| Shares issued as reinvestment of distributions | | | 607 | | | | 6,812 | | | | 3,305 | | | | 120,711 | | | | 353 | | | | 2,986 | |
| Less shares redeemed | | | (8,515 | ) | | | (100,299 | ) | | | (58,804 | ) | | | (2,173,545 | ) | | | (43,467 | ) | | | (374,627 | ) |
| | | | |
| Net increase (decrease) | | | (7,820 | ) | | $ | (92,444 | ) | | | (54,265 | ) | | $ | (2,006,453 | ) | | | (43,082 | ) | | $ | (371,365 | ) |
| | | | |
| | | | | | |
| Class C | | Shares | | | Dollars | | | Shares | | | Dollars | | | Shares | | | Dollars | |
| Shares sold | | | 28,424 | | | $ | 323,331 | | | | 514,317 | | | $ | 15,607,675 | | | | 290,108 | | | $ | 2,237,527 | |
| Shares issued as reinvestment of distributions | | | 52,717 | | | | 590,436 | | | | 1,026,199 | | | | 30,883,758 | | | | 69,000 | | | | 524,399 | |
| Less shares redeemed | | | (337,330 | ) | | | (3,944,468 | ) | | | (4,332,570 | ) | | | (132,758,086 | ) | | | (2,348,718 | ) | | | (18,159,154 | ) |
| | | | |
| Net increase (decrease) | | | (256,189 | ) | | $ | (3,030,701 | ) | | | (2,792,054 | ) | | $ | (86,266,653 | ) | | | (1,989,610 | ) | | $ | (15,397,228 | ) |
| | | | |
| | | | | | |
| Class I | | Shares | | | Dollars | | | Shares | | | Dollars | | | Shares | | | Dollars | |
| Shares sold | | | 504,241 | | | $ | 6,470,906 | | | | 3,982,524 | | | $ | 117,282,529 | | | | 973,767 | | | $ | 8,589,581 | |
| Shares issued as reinvestment of distributions | | | 290,431 | | | | 3,572,303 | | | | 943,136 | | | | 27,274,319 | | | | 126,086 | | | | 1,086,857 | |
| Less shares redeemed | | | (1,911,004 | ) | | | (24,535,909 | ) | | | (5,455,678 | ) | | | (160,598,337 | ) | | | (7,677,491 | ) | | | (66,410,170 | ) |
| | | | |
| Net increase (decrease) | | | (1,116,332 | ) | | $ | (14,492,700 | ) | | | (530,018 | ) | | $ | (16,041,489 | ) | | | (6,577,638 | ) | | $ | (56,733,732 | ) |
| | | | |
| | | | | | |
| Class R | | Shares | | | Dollars | | | Shares | | | Dollars | | | Shares | | | Dollars | |
| Shares sold | | | 21,830 | | | $ | 265,089 | | | | 36,186 | | | $ | 1,097,619 | | | | 9,578 | | | $ | 80,922 | |
| Shares issued as reinvestment of distributions | | | 13,200 | | | | 155,230 | | | | 22,051 | | | | 655,929 | | | | 698 | | | | 5,785 | |
| Less shares redeemed | | | (66,528 | ) | | | (811,980 | ) | | | (91,289 | ) | | | (2,775,031 | ) | | | (18,905 | ) | | | (158,558 | ) |
| | | | |
| Net increase (decrease) | | | (31,498 | ) | | $ | (391,661 | ) | | | (33,052 | ) | | $ | (1,021,483 | ) | | | (8,629 | ) | | $ | (71,851 | ) |
| | | | |
| | | | | | |
| Class T(b) | | Shares | | | Dollars | | | Shares | | | Dollars | | | Shares | | | Dollars | |
| Shares sold | | | 1,953 | | | $ | 25,000 | | | | 805 | | | $ | 25,000 | | | | 2,867 | | | $ | 25,000 | |
| | | | |
| Net increase (decrease) | | | 1,953 | | | $ | 25,000 | | | | 805 | | | $ | 25,000 | | | | 2,867 | | | $ | 25,000 | |
| | | | |
| * | Class B shares continue to be outstanding but are no longer an offered class of shares. |
| (a) | Class R shares were liquidated on January 23, 2017. |
| (b) | Class T commenced operations on February 27, 2017. |
Notes to Financial Statements (Unaudited)
| | | | | | | | | | | | | | | | | | | | | | | | |
| | | CONVERTIBLE FUND | | | GLOBAL CONVERTIBLE
FUND | | | TOTAL RETURN
BOND FUND | |
| Class A | | Shares | | | Dollars | | | Shares | | | Dollars | | | Shares | | | Dollars | |
| Shares sold | | | 2,080,649 | | | $ | 34,532,536 | | | | 910,164 | | | $ | 9,194,691 | | | | 274,268 | | | $ | 2,836,658 | |
| Shares issued as reinvestment of distributions | | | 180,376 | | | | 2,944,893 | | | | 23,113 | | | | 227,842 | | | | 62,980 | | | | 648,836 | |
| Less shares redeemed | | | (3,715,219 | ) | | | (61,217,310 | ) | | | (581,832 | ) | | | (5,874,712 | ) | | | (1,064,864 | ) | | | (10,972,217 | ) |
| | | | |
| Net increase (decrease) | | | (1,454,194 | ) | | $ | (23,739,881 | ) | | | 351,445 | | | $ | 3,547,821 | | | | (727,616 | ) | | $ | (7,486,723 | ) |
| | | | |
| | | | | | |
| Class B | | Shares | | | Dollars | | | Shares | | | Dollars | | | Shares | | | Dollars | |
| Shares sold* | | | 67 | | | $ | 1,413 | | | | | | | | | | | | — | | | $ | — | |
| Shares issued as reinvestment of distributions | | | 613 | | | | 12,855 | | | | | | | | | | | | 358 | | | | 3,684 | |
| Less shares redeemed | | | (134,984 | ) | | | (2,855,273 | ) | | | | | | | | | | | (47,462 | ) | | | (488,698 | ) |
| | | | |
| Net increase (decrease) | | | (134,304 | ) | | $ | (2,841,005 | ) | | | | | | | | | | | (47,104 | ) | | $ | (485,014 | ) |
| | | | |
| | | | | | |
| Class C | | Shares | | | Dollars | | | Shares | | | Dollars | | | Shares | | | Dollars | |
| Shares sold | | | 165,519 | | | $ | 2,693,097 | | | | 43,870 | | | $ | 444,014 | | | | 58,033 | | | $ | 597,592 | |
| Shares issued as reinvestment of distributions | | | 97,617 | | | | 1,576,896 | | | | 1,354 | | | | 13,280 | | | | 9,508 | | | | 97,846 | |
| Less shares redeemed | | | (2,444,711 | ) | | | (39,756,800 | ) | | | (69,254 | ) | | | (690,484 | ) | | | (370,554 | ) | | | (3,812,410 | ) |
| | | | |
| Net increase (decrease) | | | (2,181,575 | ) | | $ | (35,486,807 | ) | | | (24,030 | ) | | $ | (233,190 | ) | | | (303,013 | ) | | $ | (3,116,972 | ) |
| | | | |
| | | | | | |
| Class I | | Shares | | | Dollars | | | Shares | | | Dollars | | | Shares | | | Dollars | |
| Shares sold | | | 3,183,358 | | | $ | 47,521,633 | | | | 858,448 | | | $ | 8,686,521 | | | | 145,046 | | | $ | 1,493,558 | |
| Shares issued as reinvestment of distributions | | | 237,280 | | | | 3,492,925 | | | | 41,744 | | | | 413,090 | | | | 28,009 | | | | 288,461 | |
| Less shares redeemed | | | (6,252,849 | ) | | | (92,557,492 | ) | | | (1,996,764 | ) | | | (20,281,209 | ) | | | (433,770 | ) | | | (4,460,184 | ) |
| | | | |
| Net increase (decrease) | | | (2,832,211 | ) | | $ | (41,542,934 | ) | | | (1,096,572 | ) | | $ | (11,181,598 | ) | | | (260,715 | ) | | $ | (2,678,165 | ) |
| | | | |
| | | | | | |
| Class R | | Shares | | | Dollars | | | Shares | | | Dollars | | | Shares | | | Dollars | |
| Shares sold | | | 10,993 | | | $ | 183,705 | | | | 12,369 | | | $ | 125,757 | | | | 2,171 | | | $ | 22,325 | |
| Shares issued as reinvestment of distributions | | | 1,019 | | | | 16,567 | | | | 325 | | | | 3,196 | | | | 119 | | | | 1,220 | |
| Less shares redeemed | | | (23,684 | ) | | | (384,385 | ) | | | (4,699 | ) | | | (47,908 | ) | | | (17,850 | ) | | | (184,474 | ) |
| | | | |
| Net increase (decrease) | | | (11,672 | ) | | $ | (184,113 | ) | | | 7,995 | | | $ | 81,045 | | | | (15,560 | ) | | $ | (160,929 | ) |
| | | | |
| | | | | | |
| Class T(b) | | Shares | | | Dollars | | | Shares | | | Dollars | | | Shares | | | Dollars | |
| Shares sold | | | 1,484 | | | $ | 25,000 | | | | 2,456 | | | $ | 25,000 | | | | 2,418 | | | $ | 25,000 | |
| | | | |
| Net increase (decrease) | | | 1,484 | | | $ | 25,000 | | | | 2,456 | | | $ | 25,000 | | | | 2,418 | | | $ | 25,000 | |
| | | | |
| * | Class B shares continue to be outstanding but are no longer an offered class of shares. |
| (a) | Class R shares were liquidated on January 23, 2017. |
| (b) | Class T commenced operations on February 27, 2017. |
| | | | |
| 162 | | CALAMOS OPEN-END FAMILY OF FUNDS SEMIANNUAL REPORT | | |
Notes to Financial Statements (Unaudited)
| | | | | | | | | | | | | | | | | | | | | | | | |
| | | HIGH INCOME FUND | | | MARKET NEUTRAL
INCOME FUND | | | HEDGED EQUITY
INCOME FUND(a) | |
| Class A | | Shares | | | Dollars | | | Shares | | | Dollars | | | Shares | | | Dollars | |
| Shares sold | | | 740,932 | | | $ | 6,445,771 | | | | 12,130,077 | | | $ | 159,327,796 | | | | 209,816 | | | $ | 2,167,972 | |
| Shares issued as reinvestment of distributions | | | 103,650 | | | | 905,441 | | | | 1,462,010 | | | | 19,078,159 | | | | 4,092 | | | | 42,079 | |
| Less shares redeemed | | | (1,268,946 | ) | | | (11,022,654 | ) | | | (19,622,557 | ) | | | (258,054,886 | ) | | | (614,288 | ) | | | (6,314,648 | ) |
| | | | |
| Net increase (decrease) | | | (424,364 | ) | | $ | (3,671,442 | ) | | | (6,030,470 | ) | | $ | (79,648,931 | ) | | | (400,380 | ) | | $ | (4,104,597 | ) |
| | | | |
| | | | | | |
| Class B | | Shares | | | Dollars | | | Shares | | | Dollars | | | Shares | | | Dollars | |
| Shares sold* | | | 10 | | | $ | 93 | | | | 34 | | | $ | 472 | | | | | | | | | |
| Shares issued as reinvestment of distributions | | | 315 | | | | 2,908 | | | | 313 | | | | 4,353 | | | | | | | | | |
| Less shares redeemed | | | (21,190 | ) | | | (196,081 | ) | | | (18,513 | ) | | | (258,174 | ) | | | | | | | | |
| | | | |
| Net increase (decrease) | | | (20,865 | ) | | $ | (193,080 | ) | | | (18,166 | ) | | $ | (253,349 | ) | | | | | | | | |
| | | | |
| | | | | | |
| Class C | | Shares | | | Dollars | | | Shares | | | Dollars | | | Shares | | | Dollars | |
| Shares sold | | | 79,881 | | | $ | 730,754 | | | | 2,083,509 | | | $ | 27,809,192 | | | | 476 | | | $ | 5,000 | |
| Shares issued as reinvestment of distributions | | | 30,147 | | | | 275,949 | | | | 337,151 | | | | 4,469,902 | | | | 29 | | | | 293 | |
| Less shares redeemed | | | (334,455 | ) | | | (3,052,823 | ) | | | (3,478,506 | ) | | | (46,466,099 | ) | | | (757 | ) | | | (7,897 | ) |
| | | | |
| Net increase (decrease) | | | (224,427 | ) | | $ | (2,046,120 | ) | | | (1,057,846 | ) | | $ | (14,187,005 | ) | | | (252 | ) | | $ | (2,604 | ) |
| | | | |
| | | | | | |
| Class I | | Shares | | | Dollars | | | Shares | | | Dollars | | | Shares | | | Dollars | |
| Shares sold | | | 224,196 | | | $ | 1,952,062 | | | | 69,557,684 | | | $ | 904,615,113 | | | | 50,493 | | | $ | 525,108 | |
| Shares issued as reinvestment of distributions | | | 23,200 | | | | 202,612 | | | | 4,204,638 | | | | 54,299,800 | | | | 4,342 | | | | 44,877 | |
| Less shares redeemed | | | (963,611 | ) | | | (8,276,155 | ) | | | (32,039,832 | ) | | | (416,765,751 | ) | | | (56,494 | ) | | | (581,828 | ) |
| | | | |
| Net increase (decrease) | | | (716,215 | ) | | $ | (6,121,481 | ) | | | 41,722,490 | | | $ | 542,149,162 | | | | (1,659 | ) | | $ | (11,843 | ) |
| | | | |
| | | | | | |
| Class R | | Shares | | | Dollars | | | Shares | | | Dollars | | | Shares | | | Dollars | |
| Shares sold | | | 460 | | | $ | 3,987 | | | | 122,018 | | | $ | 1,598,933 | | | | — | | | $ | — | |
| Shares issued as reinvestment of distributions | | | 358 | | | | 3,117 | | | | 9,196 | | | | 119,602 | | | | — | | | | — | |
| Less shares redeemed | | | (15,431 | ) | | | (134,765 | ) | | | (150,460 | ) | | | (1,973,773 | ) | | | (10,223 | ) | | | (104,618 | ) |
| | | | |
| Net increase (decrease) | | | (14,613 | ) | | $ | (127,661 | ) | | | (19,246 | ) | | $ | (255,238 | ) | | | (10,223 | ) | | $ | (104,618 | ) |
| | | | |
| | | | | | |
| Class T(b) | | Shares | | | Dollars | | | Shares | | | Dollars | | | Shares | | | Dollars | |
| Shares sold | | | 2,818 | | | $ | 25,000 | | | | 1,891 | | | $ | 25,000 | | | | 2,376 | | | $ | 25,000 | |
| | | | |
| Net increase (decrease) | | | 2,818 | | | $ | 25,000 | | | | 1,891 | | | $ | 25,000 | | | | 2,376 | | | $ | 25,000 | |
| | | | |
| * | Class B shares continue to be outstanding but are no longer an offered class of shares. |
| (a) | Class R shares were liquidated on January 23, 2017. |
| (b) | Class T commenced operations on February 27, 2017. |
Notes to Financial Statements (Unaudited)
| | | | | | | | |
| | | PHINEUS LONG/SHORT
FUND | |
| Class A | | Shares | | | Dollars | |
| Shares sold | | | 2,804,904 | | | $ | 32,997,197 | |
| Shares issued as reinvestment of distributions | | | 15,592 | | | | 181,954 | |
| Less shares redeemed | | | (1,057,461 | ) | | | (12,477,034 | ) |
| | | | |
| Net increase (decrease) | | | 1,763,035 | | | $ | 20,702,117 | |
| | | | |
| | |
| Class B | | Shares | | | Dollars | |
| Shares sold | | | | | | | | |
| Shares issued as reinvestment of distributions | | | | | | | | |
| Less shares redeemed | | | | | | | | |
| | | | |
| Net increase (decrease) | | | | | | | | |
| | | | |
| | |
| Class C | | Shares | | | Dollars | |
| Shares sold | | | 875,557 | | | $ | 10,256,980 | |
| Shares issued as reinvestment of distributions | | | 4,605 | | | | 53,460 | |
| Less shares redeemed | | | (62,277 | ) | | | (709,578 | ) |
| | | | |
| Net increase (decrease) | | | 817,885 | | | $ | 9,600,862 | |
| | | | |
| | |
| Class I | | Shares | | | Dollars | |
| Shares sold | | | 12,027,337 | | | $ | 142,101,498 | |
| Shares issued as reinvestment of distributions | | | 50,070 | | | | 585,816 | |
| Less shares redeemed | | | (732,311 | ) | | | (8,672,364 | ) |
| | | | |
| Net increase (decrease) | | | 11,345,096 | | | $ | 134,014,950 | |
| | | | |
| | |
| Class R | | Shares | | | Dollars | |
| Shares sold | | | | | | | | |
| Shares issued as reinvestment of distributions | | | | | | | | |
| Less shares redeemed | | | | | | | | |
| | | | |
| Net increase (decrease) | | | | | | | | |
| | | | |
| | |
| Class T(b) | | Shares | | | Dollars | |
| Shares sold | | | 2,119 | | | $ | 25,000 | |
| | | | |
| Net increase (decrease) | | | 2,119 | | | $ | 25,000 | |
| | | | |
| * | Class B shares continue to be outstanding but are no longer an offered class of shares. |
| (a) | Class R shares were liquidated on January 23, 2017. |
| (b) | Class T commenced operations on February 27, 2017. |
| | | | |
| 164 | | CALAMOS OPEN-END FAMILY OF FUNDS SEMIANNUAL REPORT | | |
Notes to Financial Statements (Unaudited)
The following table summarizes the activity in capital shares of the Funds:
| | | | | | | | | | | | | | | | | | | | | | | | |
| For the Fiscal Year October 31, 2016 | |
| | | GROWTH FUND | | | OPPORTUNISTIC VALUE FUND | | | DIVIDEND GROWTH FUND | |
| Class A | | Shares | | | Dollars | | | Shares | | | Dollars | | | Shares | | | Dollars | |
| Shares sold | | | 2,420,759 | | | $ | 74,951,705 | | | | 441,188 | | | $ | 5,220,392 | | | | 963,729 | | | $ | 9,644,883 | |
| Shares issued through acquisition(a) | | | 329,778 | | | | 10,030,638 | | | | — | | | | — | | | | — | | | | — | |
| Shares issued as reinvestment of distributions | | | 10,531,182 | | | | 326,045,403 | | | | 243,389 | | | | 2,959,618 | | | | 94,948 | | | | 957,026 | |
| Less shares redeemed | | | (12,800,087 | ) | | | (405,118,814 | ) | | | (1,408,907 | ) | | | (17,906,621 | ) | | | (1,493,096 | ) | | | (14,972,520 | ) |
| | | | |
| Net increase (decrease) | | | 481,632 | | | $ | 5,908,932 | | | | (724,330 | ) | | $ | (9,726,611 | ) | | | (434,419 | ) | | $ | (4,370,611 | ) |
| | | | |
| | | | | | |
| Class B | | Shares | | | Dollars | | | Shares | | | Dollars | | | Shares | | | Dollars | |
| Shares sold* | | | 13,626 | | | $ | 380,392 | | | | 2,903 | | | $ | 33,401 | | | | — | | | $ | — | |
| Shares issued through acquisition(a) | | | 4,472 | | | | 123,134 | | | | — | | | | — | | | | — | | | | — | |
| Shares issued as reinvestment of distributions | | | 155,686 | | | | 4,390,329 | | | | 857 | | | | 9,671 | | | | — | | | | — | |
| Less shares redeemed | | | (456,318 | ) | | | (13,187,661 | ) | | | (9,910 | ) | | | (116,242 | ) | | | — | | | | — | |
| | | | |
| Net increase (decrease) | | | (282,534 | ) | | $ | (8,293,806 | ) | | | (6,150 | ) | | $ | (73,170 | ) | | | — | | | $ | — | |
| | | | |
| | | | | | |
| Class C | | Shares | | | Dollars | | | Shares | | | Dollars | | | Shares | | | Dollars | |
| Shares sold | | | 2,556,241 | | | $ | 55,425,267 | | | | 107,453 | | | $ | 1,172,496 | | | | 43,502 | | | $ | 434,825 | |
| Shares issued through acquisition(a) | | | 380,620 | | | | 8,104,562 | | | | — | | | | — | | | | — | | | | — | |
| Shares issued as reinvestment of distributions | | | 9,087,699 | | | | 198,202,721 | | | | 34,609 | | | | 383,118 | | | | 1,980 | | | | 19,740 | |
| Less shares redeemed | | | (10,046,516 | ) | | | (229,784,621 | ) | | | (174,272 | ) | | | (1,963,620 | ) | | | (18,485 | ) | | | (184,466 | ) |
| | | | |
| Net increase (decrease) | | | 1,978,044 | | | $ | 31,947,929 | | | | (32,210 | ) | | $ | (408,006 | ) | | | 26,997 | | | $ | 270,099 | |
| | | | |
| | | | | | |
| Class I | | Shares | | | Dollars | | | Shares | | | Dollars | | | Shares | | | Dollars | |
| Shares sold | | | 1,877,142 | | | $ | 71,940,657 | | | | 196,980 | | | $ | 2,447,896 | | | | 256,690 | | | $ | 2,562,852 | |
| Shares issued through acquisition(a) | | | 741,130 | | | | 28,346,829 | | | | — | | | | — | | | | — | | | | — | |
| Shares issued as reinvestment of distributions | | | 2,054,942 | | | | 79,834,503 | | | | 106,209 | | | | 1,324,421 | | | | 28,148 | | | | 284,308 | |
| Less shares redeemed | | | (5,460,694 | ) | | | (220,107,991 | ) | | | (418,192 | ) | | | (5,423,063 | ) | | | (215,321 | ) | | | (2,208,434 | ) |
| | | | |
| Net increase (decrease) | | | (787,480 | ) | | $ | (39,986,002 | ) | | | (115,003 | ) | | $ | (1,650,746 | ) | | | 69,517 | | | $ | 638,726 | |
| | | | |
| | | | | | |
| Class R | | Shares | | | Dollars | | | Shares | | | Dollars | | | Shares | | | Dollars | |
| Shares sold | | | 65,053 | | | $ | 1,876,435 | | | | 432 | | | $ | 5,516 | | | | 412 | | | $ | 4,093 | |
| Shares issued through acquisition(a) | | | 15,046 | | | | 433,731 | | | | — | | | | — | | | | — | �� | | | — | |
| Shares issued as reinvestment of distributions | | | 76,092 | | | | 2,237,107 | | | | 986 | | | | 11,865 | | | | 283 | | | | 2,839 | |
| Less shares redeemed | | | (113,875 | ) | | | (3,258,467 | ) | | | (2,823 | ) | | | (34,131 | ) | | | (414 | ) | | | (4,333 | ) |
| | | | |
| Net increase (decrease) | | | 42,316 | | | $ | 1,288,806 | | | | (1,405 | ) | | $ | (16,750 | ) | | | 281 | | | $ | 2,599 | |
| | | | |
| * | Class B shares continue to be outstanding but are no longer an offered class of shares. |
| (a) | See Note 1 of Notes to Financial Statements. |
Notes to Financial Statements (Unaudited)
| | | | | | | | | | | | | | | | | | | | | | | | |
| | | INTERNATIONAL GROWTH FUND | | | EVOLVING WORLD GROWTH FUND | | | EMERGING MARKET
EQUITY FUND | |
| Class A | | Shares | | | Dollars | | | Shares | | | Dollars | | | Shares | | | Dollars | |
| Shares sold | | | 1,640,700 | | | $ | 26,899,466 | | | | 3,929,920 | | | $ | 45,257,335 | | | | 44,047 | | | $ | 385,396 | |
| Shares issued through acquisition(a) | | | — | | | | — | | | | — | | | | — | | | | — | | | | — | |
| Shares issued as reinvestment of distributions | | | 13,538 | | | | 230,151 | | | | 7,428 | | | | 87,352 | | | | 578 | | | | 4,645 | |
| Less shares redeemed | | | (7,122,292 | ) | | | (117,266,399 | ) | | | (5,546,773 | ) | | | (64,934,230 | ) | | | (54,690 | ) | | | (466,093 | ) |
| | | | |
| Net increase (decrease) | | | (5,468,054 | ) | | $ | (90,136,782 | ) | | | (1,609,425 | ) | | $ | (19,589,543 | ) | | | (10,065 | ) | | $ | (76,052 | ) |
| | | | |
| | | | | | |
| Class B | | Shares | | | Dollars | | | Shares | | | Dollars | | | Shares | | | Dollars | |
| Shares sold* | | | 1,333 | | | $ | 20,067 | | | | 673 | | | $ | 7,666 | | | | — | | | $ | — | |
| Shares issued through acquisition(a) | | | — | | | | — | | | | — | | | | — | | | | — | | | | — | |
| Shares issued as reinvestment of distributions | | | 82 | | | | 1,299 | | | | — | | | | — | | | | — | | | | — | |
| Less shares redeemed | | | (52,535 | ) | | | (798,851 | ) | | | (33,513 | ) | | | (371,646 | ) | | | — | | | | — | |
| | | | |
| Net increase (decrease) | | | (51,120 | ) | | $ | (777,485 | ) | | | (32,840 | ) | | $ | (363,980 | ) | | | — | | | $ | — | |
| | | | |
| | | | | | |
| Class C | | Shares | | | Dollars | | | Shares | | | Dollars | | | Shares | | | Dollars | |
| Shares sold | | | 488,827 | | | $ | 7,688,870 | | | | 704,001 | | | $ | 7,902,010 | | | | 21,297 | | | $ | 176,713 | |
| Shares issued through acquisition(a) | | | — | | | | — | | | | — | | | | — | | | | — | | | | — | |
| Shares issued as reinvestment of distributions | | | 3,680 | | | | 58,077 | | | | — | | | | — | | | | — | | | | — | |
| Less shares redeemed | | | (1,169,882 | ) | | | (17,691,360 | ) | | | (1,144,566 | ) | | | (12,826,063 | ) | | | (17,144 | ) | | | (138,968 | ) |
| | | | |
| Net increase (decrease) | | | (677,375 | ) | | $ | (9,944,413 | ) | | | (440,565 | ) | | $ | (4,924,053 | ) | | | 4,153 | | | $ | 37,745 | |
| | | | |
| | | | | | |
| Class I | | Shares | | | Dollars | | | Shares | | | Dollars | | | Shares | | | Dollars | |
| Shares sold | | | 2,579,771 | | | $ | 42,885,953 | | | | 12,424,794 | | | $ | 143,960,959 | | | | 82,690 | | | $ | 682,108 | |
| Shares issued through acquisition(a) | | | — | | | | — | | | | — | | | | — | | | | — | | | | — | |
| Shares issued as reinvestment of distributions | | | 22,879 | | | | 395,348 | | | | 88,404 | | | | 1,044,052 | | | | 5,011 | | | | 40,287 | |
| Less shares redeemed | | | (9,409,618 | ) | | | (155,568,489 | ) | | | (20,364,420 | ) | | | (244,871,727 | ) | | | (78,388 | ) | | | (621,551 | ) |
| | | | |
| Net increase (decrease) | | | (6,806,968 | ) | | $ | (112,287,188 | ) | | | (7,851,222 | ) | | $ | (99,866,716 | ) | | | 9,313 | | | $ | 100,844 | |
| | | | |
| | | | | | |
| Class R | | Shares | | | Dollars | | | Shares | | | Dollars | | | Shares | | | Dollars | |
| Shares sold | | | 108,356 | | | $ | 1,732,641 | | | | 113,899 | | | $ | 1,314,194 | | | | — | | | $ | — | |
| Shares issued through acquisition(a) | | | — | | | | — | | | | — | | | | — | | | | — | | | | — | |
| Shares issued as reinvestment of distributions | | | 459 | | | | 7,651 | | | | — | | | | — | | | | — | | | | — | |
| Less shares redeemed | | | (285,661 | ) | | | (4,695,656 | ) | | | (70,029 | ) | | | (815,554 | ) | | | — | | | | — | |
| | | | |
| Net increase (decrease) | | | (176,846 | ) | | $ | (2,955,364 | ) | | | 43,870 | | | $ | 498,640 | | | | — | | | $ | — | |
| | | | |
| * | Class B shares continue to be outstanding but are no longer an offered class of shares. |
| (a) | See Note 1 of Notes to Financial Statements. |
| | | | |
| 166 | | CALAMOS OPEN-END FAMILY OF FUNDS SEMIANNUAL REPORT | | |
Notes to Financial Statements (Unaudited)
| | | | | | | | | | | | | | | | | | | | | | | | |
| | | GLOBAL EQUITY FUND | | | GROWTH AND INCOME FUND | | | GLOBAL GROWTH AND INCOME FUND | |
| Class A | | Shares | | | Dollars | | | Shares | | | Dollars | | | Shares | | | Dollars | |
| Shares sold | | | 377,489 | | | $ | 4,699,884 | | | | 2,480,018 | | | $ | 74,362,024 | | | | 1,035,690 | | | $ | 8,614,912 | |
| Shares issued through acquisition(a) | | | — | | | | — | | | | — | | | | — | | | | — | | | | — | |
| Shares issued as reinvestment of distributions | | | 49,667 | | | | 630,271 | | | | 2,233,101 | | | | 66,285,591 | | | | 148,082 | | | | 1,237,967 | |
| Less shares redeemed | | | (3,216,087 | ) | | | (41,405,507 | ) | | | (8,747,543 | ) | | | (261,100,904 | ) | | | (4,116,639 | ) | | | (34,354,947 | ) |
| | | | |
| Net increase (decrease) | | | (2,788,931 | ) | | $ | (36,075,352 | ) | | | (4,034,424 | ) | | $ | (120,453,289 | ) | | | (2,932,867 | ) | | $ | (24,502,068 | ) |
| | | | |
| | | | | | |
| Class B | | Shares | | | Dollars | | | Shares | | | Dollars | | | Shares | | | Dollars | |
| Shares sold* | | | 5,373 | | | $ | 64,245 | | | | 4,924 | | | $ | 178,691 | | | | 3,592 | | | $ | 30,546 | |
| Shares issued through acquisition(a) | | | — | | | | — | | | | — | | | | — | | | | — | | | | — | |
| Shares issued as reinvestment of distributions | | | 756 | | | | 9,020 | | | | 9,662 | | | | 345,382 | | | | 2,344 | | | | 19,852 | |
| Less shares redeemed | | | (31,339 | ) | | | (362,306 | ) | | | (173,581 | ) | | | (6,212,529 | ) | | | (182,393 | ) | | | (1,526,415 | ) |
| | | | |
| Net increase (decrease) | | | (25,210 | ) | | $ | (289,041 | ) | | | (158,995 | ) | | $ | (5,688,456 | ) | | | (176,457 | ) | | $ | (1,476,017 | ) |
| | | | |
| | | | | | |
| Class C | | Shares | | | Dollars | | | Shares | | | Dollars | | | Shares | | | Dollars | |
| Shares sold | | | 159,916 | | | $ | 1,908,414 | | | | 1,506,178 | | | $ | 45,187,177 | | | | 750,225 | | | $ | 5,681,730 | |
| Shares issued through acquisition(a) | | | — | | | | — | | | | — | | | | — | | | | — | | | | — | |
| Shares issued as reinvestment of distributions | | | 28,225 | | | | 335,880 | | | | 1,399,422 | | | | 41,763,903 | | | | 171,112 | | | | 1,302,161 | |
| Less shares redeemed | | | (520,612 | ) | | | (5,997,229 | ) | | | (6,440,748 | ) | | | (193,120,351 | ) | | | (4,274,795 | ) | | | (32,288,686 | ) |
| | | | |
| Net increase (decrease) | | | (332,471 | ) | | $ | (3,752,935 | ) | | | (3,535,148 | ) | | $ | (106,169,271 | ) | | | (3,353,458 | ) | | $ | (25,304,795 | ) |
| | | | |
| | | | | | |
| Class I | | Shares | | | Dollars | | | Shares | | | Dollars | | | Shares | | | Dollars | |
| Shares sold | | | 1,200,151 | | | $ | 14,837,384 | | | | 4,127,618 | | | $ | 118,854,068 | | | | 2,902,459 | | | $ | 24,722,955 | |
| Shares issued through acquisition(a) | | | — | | | | — | | | | — | | | | — | | | | — | | | | — | |
| Shares issued as reinvestment of distributions | | | 117,373 | | | | 1,511,766 | | | | 1,177,314 | | | | 33,795,829 | | | | 185,762 | | | | 1,593,836 | |
| Less shares redeemed | | | (1,760,042 | ) | | | (22,206,273 | ) | | | (6,494,362 | ) | | | (187,077,299 | ) | | | (5,349,199 | ) | | | (45,602,646 | ) |
| | | | |
| Net increase (decrease) | | | (442,518 | ) | | $ | (5,857,123 | ) | | | (1,189,430 | ) | | $ | (34,427,402 | ) | | | (2,260,978 | ) | | $ | (19,285,855 | ) |
| | | | |
| | | | | | |
| Class R | | Shares | | | Dollars | | | Shares | | | Dollars | | | Shares | | | Dollars | |
| Shares sold | | | 56,326 | | | $ | 675,684 | | | | 97,296 | | | $ | 2,890,251 | | | | 36,269 | | | $ | 300,392 | |
| Shares issued through acquisition(a) | | | — | | | | — | | | | — | | | | — | | | | — | | | | — | |
| Shares issued as reinvestment of distributions | | | 7,619 | | | | 94,478 | | | | 29,671 | | | | 874,507 | | | | 1,522 | | | | 12,576 | |
| Less shares redeemed | | | (270,225 | ) | | | (3,373,094 | ) | | | (170,807 | ) | | | (5,049,308 | ) | | | (39,542 | ) | | | (320,649 | ) |
| | | | |
| Net increase (decrease) | | | (206,280 | ) | | $ | (2,602,932 | ) | | | (43,840 | ) | | $ | (1,284,550 | ) | | | (1,751 | ) | | $ | (7,681 | ) |
| | | | |
| * | Class B shares continue to be outstanding but are no longer an offered class of shares. |
| (a) | See Note 1 of Notes to Financial Statements. |
Notes to Financial Statements (Unaudited)
| | | | | | | | | | | | | | | | | | | | | | | | |
| | | CONVERTIBLE FUND | | | GLOBAL CONVERTIBLE FUND | | | TOTAL RETURN BOND FUND | |
| Class A | | Shares | | | Dollars | | | Shares | | | Dollars | | | Shares | | | Dollars | |
| Shares sold | | | 2,564,606 | | | $ | 39,872,931 | | | | 2,445,639 | | | $ | 23,498,208 | | | | 2,763,470 | | | $ | 28,740,503 | |
| Shares issued through acquisition(a) | | | — | | | | — | | | | — | | | | — | | | | — | | | | — | |
| Shares issued as reinvestment of distributions | | | 889,576 | | | | 14,005,378 | | | | 48,255 | | | | 470,462 | | | | 200,116 | | | | 2,074,586 | |
| Less shares redeemed | | | (12,429,348 | ) | | | (194,748,065 | ) | | | (1,628,397 | ) | | | (15,896,032 | ) | | | (2,419,485 | ) | | | (25,415,647 | ) |
| | | | |
| Net increase (decrease) | | | (8,975,166 | ) | | $ | (140,869,756 | ) | | | 865,497 | | | $ | 8,072,638 | | | | 544,101 | | | $ | 5,399,442 | |
| | | | |
| | | | | | |
| Class B | | Shares | | | Dollars | | | Shares | | | Dollars | | | Shares | | | Dollars | |
| Shares sold* | | | 2,695 | | | $ | 53,973 | | | | — | | | $ | — | | | | 6,335 | | | $ | 64,753 | |
| Shares issued through acquisition(a) | | | — | | | | — | | | | — | | | | — | | | | — | | | | — | |
| Shares issued as reinvestment of distributions | | | 5,571 | | | | 113,235 | | | | — | | | | — | | | | 2,336 | | | | 24,120 | |
| Less shares redeemed | | | (74,089 | ) | | | (1,492,159 | ) | | | — | | | | — | | | | (49,475 | ) | | | (517,576 | ) |
| | | | |
| Net increase (decrease) | | | (65,823 | ) | | $ | (1,324,951 | ) | | | — | | | $ | — | | | | (40,804 | ) | | $ | (428,703 | ) |
| | | | |
| | | | | | |
| Class C | | Shares | | | Dollars | | | Shares | | | Dollars | | | Shares | | | Dollars | |
| Shares sold | | | 757,503 | | | $ | 11,817,695 | | | | 206,973 | | | $ | 2,004,076 | | | | 403,497 | | | $ | 4,193,883 | |
| Shares issued through acquisition(a) | | | — | | | | — | | | | — | | | | — | | | | — | | | | — | |
| Shares issued as reinvestment of distributions | | | 512,741 | | | | 8,021,905 | | | | 2,198 | | | | 21,373 | | | | 34,431 | | | | 355,839 | |
| Less shares redeemed | | | (5,216,413 | ) | | | (81,297,003 | ) | | | (88,763 | ) | | | (850,056 | ) | | | (400,129 | ) | | | (4,167,958 | ) |
| | | | |
| Net increase (decrease) | | | (3,946,169 | ) | | $ | (61,457,403 | ) | | | 120,408 | | | $ | 1,175,393 | | | | 37,799 | | | $ | 381,764 | |
| | | | |
| | | | | | |
| Class I | | Shares | | | Dollars | | | Shares | | | Dollars | | | Shares | | | Dollars | |
| Shares sold | | | 7,193,890 | | | $ | 100,545,540 | | | | 5,309,374 | | | $ | 51,876,737 | | | | 1,094,099 | | | $ | 11,405,878 | |
| Shares issued through acquisition(a) | | | — | | | | — | | | | — | | | | — | | | | — | | | | — | |
| Shares issued as reinvestment of distributions | | | 1,189,379 | | | | 16,914,327 | | | | 86,141 | | | | 841,676 | | | | 74,536 | | | | 773,327 | |
| Less shares redeemed | | | (22,125,125 | ) | | | (317,496,580 | ) | | | (2,908,351 | ) | | | (27,637,252 | ) | | | (650,630 | ) | | | (6,818,618 | ) |
| | | | |
| Net increase (decrease) | | | (13,741,856 | ) | | $ | (200,036,713 | ) | | | 2,487,164 | | | $ | 25,081,161 | | | | 518,005 | | | $ | 5,360,587 | |
| | | | |
| | | | | | |
| Class R | | Shares | | | Dollars | | | Shares | | | Dollars | | | Shares | | | Dollars | |
| Shares sold | | | 23,845 | | | $ | 380,047 | | | | 37,281 | | | $ | 367,130 | | | | 29,115 | | | $ | 303,196 | |
| Shares issued through acquisition(a) | | | — | | | | — | | | | — | | | | — | | | | — | | | | — | |
| Shares issued as reinvestment of distributions | | | 4,504 | | | | 70,747 | | | | 394 | | | | 3,869 | | | | 968 | | | | 10,020 | |
| Less shares redeemed | | | (50,603 | ) | | | (796,635 | ) | | | (11,278 | ) | | | (108,893 | ) | | | (5,930 | ) | | | (62,544 | ) |
| | | | |
| Net increase (decrease) | | | (22,254 | ) | | $ | (345,841 | ) | | | 26,397 | | | $ | 262,106 | | | | 24,153 | | | $ | 250,672 | |
| | | | |
| * | Class B shares continue to be outstanding but are no longer an offered class of shares. |
| (a) | See Note 1 of Notes to Financial Statements. |
| | | | |
| 168 | | CALAMOS OPEN-END FAMILY OF FUNDS SEMIANNUAL REPORT | | |
Notes to Financial Statements (Unaudited)
| | | | | | | | | | | | | | | | | | | | | | | | |
| | | HIGH INCOME FUND | | | MARKET NEUTRAL INCOME FUND | | | HEDGED EQUITY INCOME FUND | |
| Class A | | Shares | | | Dollars | | | Shares | | | Dollars | | | Shares | | | Dollars | |
| Shares sold | | | 3,446,493 | | | $ | 27,783,023 | | | | 27,443,580 | | | $ | 353,177,966 | | | | 506,183 | | | $ | 4,845,501 | |
| Shares issued through acquisition(a) | | | — | | | | — | | | | — | | | | — | | | | — | | | | — | |
| Shares issued as reinvestment of distributions | | | 287,497 | | | | 2,388,494 | | | | 2,107,983 | | | | 26,948,663 | | | | 14,365 | | | | 141,262 | |
| Less shares redeemed | | | (7,254,152 | ) | | | (60,344,606 | ) | | | (36,002,859 | ) | | | (462,540,471 | ) | | | (61,573 | ) | | | (609,256 | ) |
| | | | |
| Net increase (decrease) | | | (3,520,162 | ) | | $ | (30,173,089 | ) | | | (6,451,296 | ) | | $ | (82,413,842 | ) | | | 458,975 | | | $ | 4,377,507 | |
| | | | |
| | | | | | |
| Class B | | Shares | | | Dollars | | | Shares | | | Dollars | | | Shares | | | Dollars | |
| Shares sold* | | | 244 | | | $ | 2,224 | | | | 2,012 | | | $ | 27,674 | | | | — | | | $ | — | |
| Shares issued through acquisition(a) | | | — | | | | — | | | | — | | | | — | | | | — | | | | — | |
| Shares issued as reinvestment of distributions | | | 1,629 | | | | 14,283 | | | | 1,270 | | | | 17,182 | | | | — | | | | — | |
| Less shares redeemed | | | (47,522 | ) | | | (418,625 | ) | | | (99,633 | ) | | | (1,356,816 | ) | | | — | | | | — | |
| | | | |
| Net increase (decrease) | | | (45,649 | ) | | $ | (402,118 | ) | | | (96,351 | ) | | $ | (1,311,960 | ) | | | — | | | $ | — | |
| | | | |
| | | | | | |
| Class C | | Shares | | | Dollars | | | Shares | | | Dollars | | | Shares | | | Dollars | |
| Shares sold | | | 143,103 | | | $ | 1,245,569 | | | | 4,046,535 | | | $ | 52,816,487 | | | | 12,645 | | | $ | 124,255 | |
| Shares issued through acquisition(a) | | | — | | | | — | | | | — | | | | — | | | | — | | | | — | |
| Shares issued as reinvestment of distributions | | | 73,448 | | | | 640,117 | | | | 406,477 | | | | 5,267,812 | | | | 177 | | | | 1,738 | |
| Less shares redeemed | | | (623,449 | ) | | | (5,452,124 | ) | | | (6,074,802 | ) | | | (79,484,389 | ) | | | (7,282 | ) | | | (69,040 | ) |
| | | | |
| Net increase (decrease) | | | (406,898 | ) | | $ | (3,566,438 | ) | | | (1,621,790 | ) | | $ | (21,400,090 | ) | | | 5,540 | | | $ | 56,953 | |
| | | | |
| | | | | | |
| Class I | | Shares | | | Dollars | | | Shares | | | Dollars | | | Shares | | | Dollars | |
| Shares sold | | | 1,056,848 | | | $ | 8,908,057 | | | | 89,038,895 | | | $ | 1,133,090,575 | | | | 298,658 | | | $ | 2,948,467 | |
| Shares issued through acquisition(a) | | | — | | | | — | | | | — | | | | — | | | | — | | | | — | |
| Shares issued as reinvestment of distributions | | | 82,940 | | | | 689,265 | | | | 4,913,513 | | | | 62,172,168 | | | | 12,608 | | | | 124,161 | |
| Less shares redeemed | | | (1,398,571 | ) | | | (11,634,261 | ) | | | (78,359,381 | ) | | | (996,033,683 | ) | | | (62,817 | ) | | | (619,609 | ) |
| | | | |
| Net increase (decrease) | | | (258,783 | ) | | $ | (2,036,939 | ) | | | 15,593,027 | | | $ | 199,229,060 | | | | 248,449 | | | $ | 2,453,019 | |
| | | | |
| | | | | | |
| Class R | | Shares | | | Dollars | | | Shares | | | Dollars | | | Shares | | | Dollars | |
| Shares sold | | | 18,857 | | | $ | 161,935 | | | | 254,948 | | | $ | 3,284,885 | | | | 1,060 | | | $ | 10,005 | |
| Shares issued through acquisition(a) | | | — | | | | — | | | | — | | | | — | | | | — | | | | — | |
| Shares issued as reinvestment of distributions | | | 416 | | | | 3,438 | | | | 12,251 | | | | 155,932 | | | | 169 | | | | 1,657 | |
| Less shares redeemed | | | (5,508 | ) | | | (46,101 | ) | | | (265,902 | ) | | | (3,400,513 | ) | | | (1,060 | ) | | | (10,276 | ) |
| | | | |
| Net increase (decrease) | | | 13,765 | | | $ | 119,272 | | | | 1,297 | | | $ | 40,304 | | | | 169 | | | $ | 1,386 | |
| | | | |
| * | Class B shares continue to be outstanding but are no longer an offered class of shares. |
| (a) | See Note 1 of Notes to Financial Statements. |
Notes to Financial Statements (Unaudited)
| | | | | | | | |
| | | PHINEUS LONG/SHORT
FUND(a) | |
| Class A | | Shares | | | Dollars | |
| Shares sold | | | 500,212 | | | $ | 5,129,262 | |
| Shares issued through acquisition(b) | | | 915,240 | | | | 9,628,330 | |
| Shares issued as reinvestment of distributions | | | — | | | | — | |
| Less shares redeemed | | | (50,385 | ) | | | (522,055 | ) |
| | | | |
| Net increase (decrease) | | | 1,365,067 | | | $ | 14,235,537 | |
| | | | |
| | |
| Class C | | Shares | | | Dollars | |
| Shares sold | | | 104,245 | | | $ | 1,075,355 | |
| Shares issued through acquisition(b) | | | 357,494 | | | | 3,746,574 | |
| Shares issued as reinvestment of distributions | | | — | | | | — | |
| Less shares redeemed | | | (1,733 | ) | | | (17,449 | ) |
| | | | |
| Net increase (decrease) | | | 460,006 | | | $ | 4,804,480 | |
| | | | |
| | |
| Class I | | Shares | | | Dollars | |
| Shares sold | | | 2,782,557 | | | $ | 28,931,545 | |
| Shares issued through acquisition(b) | | | 2,487,499 | | | | 26,218,239 | |
| Shares issued as reinvestment of distributions | | | — | | | | — | |
| Less shares redeemed | | | (53,348 | ) | | | (559,839 | ) |
| | | | |
| Net increase (decrease) | | | 5,216,708 | | | $ | 54,589,945 | |
| | | | |
| (a) | Phineus Long/Short Fund commenced operations April 5, 2016. |
| (b) | See Note 1 of Notes to Financial Statements. |
| | | | |
| 170 | | CALAMOS OPEN-END FAMILY OF FUNDS SEMIANNUAL REPORT | | |
Calamos Growth Fund Financial Highlights
Selected data for a share outstanding throughout each period were as follows:
| | | | | | | | | | | | | | | | | | | | | | | | |
| | | CLASS A | |
| | | (Unaudited)
Six Months
Ended
April 30, | | | Year Ended October 31, | |
| | | 2017 | | | 2016 | | | 2015 | | | 2014 | | | 2013 | | | 2012 | |
Net asset value, beginning of period | | | $30.12 | | | | $42.80 | | | | $50.16 | | | | $58.75 | | | | $49.90 | | | | $51.06 | |
Income from investment operations: | | | | | | | | | | | | | | | | | | | | | | | | |
Net investment income (loss)(a) | | | (0.07 | ) | | | (0.07 | ) | | | (0.07 | ) | | | (0.20 | ) | | | (0.05 | ) | | | (0.22 | ) |
Net realized and unrealized gain (loss) | | | 3.63 | | | | (1.67 | ) | | | 2.84 | | | | 6.90 | | | | 12.63 | | | | 1.21 | |
Total from investment operations | | | 3.56 | | | | (1.74 | ) | | | 2.77 | | | | 6.70 | | | | 12.58 | | | | 0.99 | |
Distributions: | | | | | | | | | | | | | | | | | | | | | | | | |
Dividends from net investment income | | | — | | | | — | | | | — | | | | — | | | | — | | | | — | |
Dividends from net realized gains | | | (1.20 | ) | | | (10.94 | ) | | | (10.13 | ) | | | (15.29 | ) | | | (3.73 | ) | | | (2.15 | ) |
Total distributions | | | (1.20 | ) | | | (10.94 | ) | | | (10.13 | ) | | | (15.29 | ) | | | (3.73 | ) | | | (2.15 | ) |
Net asset value, end of period | | | $32.48 | | | | $30.12 | | | | $42.80 | | | | $50.16 | | | | $58.75 | | | | $49.90 | |
Ratios and supplemental data: | | | | | | | | | | | | | | | | | | | | | | | | |
Total return(b) | | | 12.22% | | | | (4.76% | ) | | | 6.55% | | | | 13.84% | | | | 26.95% | | | | 2.26% | |
Net assets, end of period (000) | | | $937,859 | | | | $1,017,541 | | | | $1,424,967 | | | | $1,718,674 | | | | $2,237,328 | | | | $3,241,595 | |
Ratio of net expenses to average net assets | | | 1.39% | (c) | | | 1.34% | | | | 1.31% | | | | 1.26% | | | | 1.26% | | | | 1.29% | |
Ratio of gross expenses to average net assets prior to expense reductions | | | 1.39% | (c) | | | 1.34% | | | | 1.31% | | | | 1.26% | | | | 1.26% | | | | 1.29% | |
Ratio of net investment income (loss) to average net assets | | | (0.49% | )(c) | | | (0.21% | ) | | | (0.17% | ) | | | (0.42% | ) | | | (0.10% | ) | | | (0.44% | ) |
| | |
| | | (Unaudited)
Six Months
Ended
April 30, | | | Year Ended October 31, | |
| | | 2017 | | | 2016 | | | 2015 | | | 2014 | | | 2013 | | | 2012 | |
Portfolio turnover rate | �� | | 64.7% | | | | 90.0% | | | | 60.0% | | | | 41.8% | | | | 67.1% | | | | 57.0% | |
| (a) | Net investment income (loss) allocated based on average shares method. |
| (b) | Total return measures net investment income (loss) and capital gain or loss from portfolio investments assuming reinvestment of dividends and capital gains distributions. Total return is not annualized for periods that are less than a full year, does not reflect the effect of sales charge for Class A shares nor the contingent deferred sales charge for Class B and C shares and does not reflect the deduction of taxes that a shareholder would pay on fund distributions or the redemption of fund shares. |
Calamos Growth Fund Financial Highlights
| | | | | | | | | | | | | | | | | | | | | | | | |
| | | CLASS B | |
| | | (Unaudited)
Six Months
Ended
April 30, | | | Year Ended October 31, | |
| | | 2017 | | | 2016 | | | 2015 | | | 2014 | | | 2013 | | | 2012 | |
Net asset value, beginning of period | | | $27.26 | | | | $40.02 | | | | $47.84 | | | | $57.05 | | | | $48.90 | | | | $50.44 | |
Income from investment operations: | | | | | | | | | | | | | | | | | | | | | | | | |
Net investment income (loss)(a) | | | (0.16 | ) | | | (0.28 | ) | | | (0.37 | ) | | | (0.56 | ) | | | (0.43 | ) | | | (0.59 | ) |
Net realized and unrealized gain (loss) | | | 3.26 | | | | (1.54 | ) | | | 2.68 | | | | 6.64 | | | | 12.31 | | | | 1.20 | |
Total from investment operations | | | 3.10 | | | | (1.82 | ) | | | 2.31 | | | | 6.08 | | | | 11.88 | | | | 0.61 | |
Distributions: | | | | | | | | | | | | | | | | | | | | | | | | |
Dividends from net investment income | | | — | | | | — | | | | — | | | | — | | | | — | | | | — | |
Dividends from net realized gains | | | (1.20 | ) | | | (10.94 | ) | | | (10.13 | ) | | | (15.29 | ) | | | (3.73 | ) | | | (2.15 | ) |
Total distributions | | | (1.20 | ) | | | (10.94 | ) | | | (10.13 | ) | | | (15.29 | ) | | | (3.73 | ) | | | (2.15 | ) |
Net asset value, end of period | | | $29.16 | | | | $27.26 | | | | $40.02 | | | | $47.84 | | | | $57.05 | | | | $48.90 | |
Ratios and supplemental data: | | | | | | | | | | | | | | | | | | | | | | | | |
Total return(b) | | | 11.80% | | | | (5.46% | ) | | | 5.76% | | | | 12.97% | | | | 26.00% | | | | 1.50% | |
Net assets, end of period (000) | | | $2,070 | | | | $6,003 | | | | $20,119 | | | | $36,835 | | | | $84,895 | | | | $171,357 | |
Ratio of net expenses to average net assets | | | 2.14% | (c) | | | 2.09% | | | | 2.06% | | | | 2.00% | | | | 2.02% | | | | 2.03% | |
Ratio of gross expenses to average net assets prior to expense reductions | | | 2.14% | (c) | | | 2.09% | | | | 2.06% | | | | 2.00% | | | | 2.02% | | | | 2.03% | |
Ratio of net investment income (loss) to average net assets | | | (1.16% | )(c) | | | (0.97% | ) | | | (0.91% | ) | | | (1.17% | ) | | | (0.86% | ) | | | (1.18% | ) |
| |
| | | CLASS C | |
| | | (Unaudited)
Six Months
Ended
April 30, | | | Year Ended October 31, | |
| | | 2017 | | | 2016 | | | 2015 | | | 2014 | | | 2013 | | | 2012 | |
Net asset value, beginning of period | | | $21.08 | | | | $33.48 | | | | $41.66 | | | | $51.58 | | | | $44.56 | | | | $46.16 | |
Income from investment operations: | | | | | | | | | | | | | | | | | | | | | | | | |
Net investment income (loss)(a) | | | (0.13 | ) | | | (0.21 | ) | | | (0.32 | ) | | | (0.48 | ) | | | (0.38 | ) | | | (0.54 | ) |
Net realized and unrealized gain (loss) | | | 2.50 | | | | (1.25 | ) | | | 2.27 | | | | 5.85 | | | | 11.13 | | | | 1.09 | |
Total from investment operations | | | 2.37 | | | | (1.46 | ) | | | 1.95 | | | | 5.37 | | | | 10.75 | | | | 0.55 | |
Distributions: | | | | | | | | | | | | | | | | | | | | | | | | |
Dividends from net investment income | | | — | | | | — | | | | — | | | | — | | | | — | | | | — | |
Dividends from net realized gains | | | (1.20 | ) | | | (10.94 | ) | | | (10.13 | ) | | | (15.29 | ) | | | (3.73 | ) | | | (2.15 | ) |
Total distributions | | | (1.20 | ) | | | (10.94 | ) | | | (10.13 | ) | | | (15.29 | ) | | | (3.73 | ) | | | (2.15 | ) |
Net asset value, end of period | | | $22.25 | | | | $21.08 | | | | $33.48 | | | | $41.66 | | | | $51.58 | | | | $44.56 | |
Ratios and supplemental data: | | | | | | | | | | | | | | | | | | | | | | | | |
Total return(b) | | | 11.80% | | | | (5.45% | ) | | | 5.75% | | | | 12.97% | | | | 26.00% | | | | 1.51% | |
Net assets, end of period (000) | | | $488,274 | | | | $540,422 | | | | $792,046 | | | | $959,445 | | | | $1,096,492 | | | | $1,272,104 | |
Ratio of net expenses to average net assets | | | 2.14% | (c) | | | 2.09% | | | | 2.06% | | | | 2.01% | | | | 2.01% | | | | 2.04% | |
Ratio of gross expenses to average net assets prior to expense reductions | | | 2.14% | (c) | | | 2.09% | | | | 2.06% | | | | 2.01% | | | | 2.01% | | | | 2.04% | |
Ratio of net investment income (loss) to average net assets | | | (1.24% | )(c) | | | (0.96% | ) | | | (0.92% | ) | | | (1.17% | ) | | | (0.85% | ) | | | (1.19% | ) |
| (a) | Net investment income (loss) allocated based on average shares method. |
| (b) | Total return measures net investment income (loss) and capital gain or loss from portfolio investments assuming reinvestment of dividends and capital gains distributions. Total return is not annualized for periods that are less than a full year, does not reflect the effect of sales charge for Class A shares nor the contingent deferred sales charge for Class B and C shares and does not reflect the deduction of taxes that a shareholder would pay on fund distributions or the redemption of fund shares. |
| | | | |
| 172 | | CALAMOS OPEN-END FAMILY OF FUNDS SEMIANNUAL REPORT | | |
Calamos Growth Fund Financial Highlights
| | | | | | | | | | | | | | | | | | | | | | | | |
| | | CLASS I | |
| | | (Unaudited)
Six Months
Ended
April 30, | | | Year Ended October 31, | |
| | | 2017 | | | 2016 | | | 2015 | | | 2014 | | | 2013 | | | 2012 | |
Net asset value, beginning of period | | | $37.88 | | | | $50.84 | | | | $57.59 | | | | $65.15 | | | | $54.81 | | | | $55.72 | |
Income from investment operations: | | | | | | | | | | | | | | | | | | | | | | | | |
Net investment income (loss)(a) | | | (0.05 | ) | | | 0.02 | | | | 0.05 | | | | (0.10 | ) | | | 0.08 | | | | (0.10 | ) |
Net realized and unrealized gain (loss) | | | 4.61 | | | | (2.04 | ) | | | 3.33 | | | | 7.83 | | | | 13.99 | | | | 1.34 | |
Total from investment operations | | | 4.56 | | | | (2.02 | ) | | | 3.38 | | | | 7.73 | | | | 14.07 | | | | 1.24 | |
Distributions: | | | | | | | | | | | | | | | | | | | | | | | | |
Dividends from net investment income | | | — | | | | — | | | | — | | | | — | | | | — | | | | — | |
Dividends from net realized gains | | | (1.20 | ) | | | (10.94 | ) | | | (10.13 | ) | | | (15.29 | ) | | | (3.73 | ) | | | (2.15 | ) |
Total distributions | | | (1.20 | ) | | | (10.94 | ) | | | (10.13 | ) | | | (15.29 | ) | | | (3.73 | ) | | | (2.15 | ) |
Net asset value, end of period | | | $41.24 | | | | $37.88 | | | | $50.84 | | | | $57.59 | | | | $65.15 | | | | $54.81 | |
Ratios and supplemental data: | | | | | | | | | | | | | | | | | | | | | | | | |
Total return(b) | | | 12.36% | | | | (4.51% | ) | | | 6.80% | | | | 14.12% | | | | 27.27% | | | | 2.53% | |
Net assets, end of period (000) | | | $307,435 | | | | $327,872 | | | | $480,028 | | | | $759,432 | | | | $1,010,805 | | | | $1,690,739 | |
Ratio of net expenses to average net assets | | | 1.14% | (c) | | | 1.09% | | | | 1.06% | | | | 1.01% | | | | 1.02% | | | | 1.04% | |
Ratio of gross expenses to average net assets prior to expense reductions | | | 1.14% | (c) | | | 1.09% | | | | 1.06% | | | | 1.01% | | | | 1.02% | | | | 1.04% | |
Ratio of net investment income (loss) to average net assets | | | (0.24% | )(c) | | | 0.04% | | | | 0.09% | | | | (0.18% | ) | | | 0.15% | | | | (0.19% | ) |
| |
| | | CLASS R | |
| | | (Unaudited)
Six Months
Ended
April 30, | | | Year Ended October 31, | |
| | | 2017 | | | 2016 | | | 2015 | | | 2014 | | | 2013 | | | 2012 | |
Net asset value, beginning of period | | | $28.55 | | | | $41.22 | | | | $48.78 | | | | $57.65 | | | | $49.15 | | | | $50.44 | |
Income from investment operations: | | | | | | | | | | | | | | | | | | | | | | | | |
Net investment income (loss)(a) | | | (0.11 | ) | | | (0.14 | ) | | | (0.18 | ) | | | (0.32 | ) | | | (0.18 | ) | | | (0.34 | ) |
Net realized and unrealized gain (loss) | | | 3.43 | | | | (1.59 | ) | | | 2.75 | | | | 6.74 | | | | 12.41 | | | | 1.20 | |
Total from investment operations | | | 3.32 | | | | (1.73 | ) | | | 2.57 | | | | 6.42 | | | | 12.23 | | | | 0.86 | |
Distributions: | | | | | | | | | | | | | | | | | | | | | | | | |
Dividends from net investment income | | | — | | | | — | | | | — | | | | — | | | | — | | | | — | |
Dividends from net realized gains | | | (1.20 | ) | | | (10.94 | ) | | | (10.13 | ) | | | (15.29 | ) | | | (3.73 | ) | | | (2.15 | ) |
Total distributions | | | (1.20 | ) | | | (10.94 | ) | | | (10.13 | ) | | | (15.29 | ) | | | (3.73 | ) | | | (2.15 | ) |
Net asset value, end of period | | | $30.67 | | | | $28.55 | | | | $41.22 | | | | $48.78 | | | | $57.65 | | | | $49.15 | |
Ratios and supplemental data: | | | | | | | | | | | | | | | | | | | | | | | | |
Total return(b) | | | 12.08% | | | | (4.96% | ) | | | 6.28% | | | | 13.56% | | | | 26.62% | | | | 2.02% | |
Net assets, end of period (000) | | | $6,261 | | | | $7,417 | | | | $8,966 | | | | $10,089 | | | | $11,634 | | | | $15,879 | |
Ratio of net expenses to average net assets | | | 1.64% | (c) | | | 1.59% | | | | 1.56% | | | | 1.51% | | | | 1.51% | | | | 1.54% | |
Ratio of gross expenses to average net assets prior to expense reductions | | | 1.64% | (c) | | | 1.59% | | | | 1.56% | | | | 1.51% | | | | 1.51% | | | | 1.54% | |
Ratio of net investment income (loss) to average net assets | | | (0.74% | )(c) | | | (0.46% | ) | | | (0.43% | ) | | | (0.67% | ) | | | (0.35% | ) | | | (0.68% | ) |
| (a) | Net investment income (loss) allocated based on average shares method. |
| (b) | Total return measures net investment income (loss) and capital gain or loss from portfolio investments assuming reinvestment of dividends and capital gains distributions. Total return is not annualized for periods that are less than a full year, does not reflect the effect of sales charge for Class A shares nor the contingent deferred sales charge for Class B and C shares and does not reflect the deduction of taxes that a shareholder would pay on fund distributions or the redemption of fund shares. |
Calamos Growth Fund Financial Highlights
| | | | |
| | | CLASS T | |
| | | (Unaudited)
February 28, 2017*
through
April 30, | |
| | | 2017 | |
Net asset value, beginning of period | | | $31.58 | |
Income from investment operations: | | | | |
Net investment income (loss)(a) | | | (0.04 | ) |
Net realized and unrealized gain (loss) | | | 0.95 | |
Total from investment operations | | | 0.91 | |
Distributions: | | | | |
Dividends from net investment income | | | — | |
Net asset value, end of period | | | $32.49 | |
Ratios and supplemental data: | | | | |
Total return(b) | | | 2.88% | |
Net assets, end of period (000) | | | $26 | |
Ratio of net expenses to average net assets | | | 1.37% | (c) |
Ratio of gross expenses to average net assets prior to expense reductions | | | 1.37% | (c) |
Ratio of net investment income (loss) to average net assets | | | (0.74% | )(c) |
| * | Commencement of operations. |
| (a) | Net investment income (loss) allocated based on average shares method. |
| (b) | Total return measures net investment income (loss) and capital gain or loss from portfolio investments assuming reinvestment of dividends and capital gains distributions. Total return is not annualized for periods that are less than a full year, does not reflect the effect of sales charge for Class A shares nor the contingent deferred sales charge for Class B and C shares and does not reflect the deduction of taxes that a shareholder would pay on fund distributions or the redemption of fund shares. |
| | | | |
| 174 | | CALAMOS OPEN-END FAMILY OF FUNDS SEMIANNUAL REPORT | | |
Calamos Opportunistic Value Fund Financial Highlights
Selected data for a share outstanding throughout each period were as follows:
| | | | | | | | | | | | | | | | | | | | | | | | |
| | | CLASS A | |
| | | (Unaudited)
Six Months
Ended
April 30, | | | Year Ended October 31, | |
| | | 2017 | | | 2016 | | | 2015 | | | 2014 | | | 2013 | | | 2012 | |
Net asset value, beginning of period | | | $12.60 | | | | $13.61 | | | | $15.07 | | | | $15.22 | | | | $12.15 | | | | $11.25 | |
Income from investment operations: | | | | | | | | | | | | | | | | | | | | | | | | |
Net investment income (loss)(a) | | | 0.08 | | | | 0.21 | | | | 0.19 | | | | 0.18 | | | | 0.18 | | | | 0.10 | |
Net realized and unrealized gain (loss) | | | 1.29 | | | | (0.15 | ) | | | (0.52 | ) | | | 0.92 | | | | 3.07 | | | | 0.80 | |
Total from investment operations | | | 1.37 | | | | 0.06 | | | | (0.33 | ) | | | 1.10 | | | | 3.25 | | | | 0.90 | |
Distributions: | | | | | | | | | | | | | | | | | | | | | | | | |
Dividends from net investment income | | | (0.10 | ) | | | (0.16 | ) | | | (0.14 | ) | | | (0.14 | ) | | | (0.18 | ) | | | — | |
Dividends from net realized gains | | | — | | | | (0.91 | ) | | | (0.99 | ) | | | (1.11 | ) | | | — | | | | — | |
Total distributions | | | (0.10 | ) | | | (1.07 | ) | | | (1.13 | ) | | | (1.25 | ) | | | (0.18 | ) | | | — | |
Net asset value, end of period | | | $13.87 | | | | $12.60 | | | | $13.61 | | | | $15.07 | | | | $15.22 | | | | $12.15 | |
Ratios and supplemental data: | | | | | | | | | | | | | | | | | | | | | | | | |
Total return(b) | | | 10.85% | | | | 0.76% | | | | (2.32% | ) | | | 7.67% | | | | 27.12% | | | | 8.00% | |
Net assets, end of period (000) | | | $32,110 | | | | $32,350 | | | | $44,792 | | | | $58,419 | | | | $78,843 | | | | $38,992 | |
Ratio of net expenses to average net assets | | | 1.15% | (c) | | | 1.12% | | | | 1.15% | | | | 1.15% | | | | 1.15% | | | | 1.15% | |
Ratio of gross expenses to average net assets prior to expense reductions | | | 1.66% | (c) | | | 1.57% | | | | 1.61% | | | | 1.50% | | | | 1.53% | | | | 1.72% | |
Ratio of net investment income (loss) to average net assets | | | 1.16% | (c) | | | 1.67% | | | | 1.38% | | | | 1.19% | | | | 1.31% | | | | 0.84% | |
| | |
| | | (Unaudited)
Six Months
Ended
April 30, | | | Year Ended October 31, | |
| | | 2017 | | | 2016 | | | 2015 | | | 2014 | | | 2013 | | | 2012 | |
Portfolio turnover rate | | | 44.3% | | | | 40.7% | | | | 139.8% | | | | 165.4% | | | | 250.3% | | | | 204.9% | |
| (a) | Net investment income (loss) allocated based on average shares method. |
| (b) | Total return measures net investment income (loss) and capital gain or loss from portfolio investments assuming reinvestment of dividends and capital gains distributions. Total return is not annualized for periods that are less than a full year, does not reflect the effect of sales charge for Class A shares nor the contingent deferred sales charge for Class B and C shares and does not reflect the deduction of taxes that a shareholder would pay on fund distributions or the redemption of fund shares. |
Calamos Opportunistic Value Fund Financial Highlights
| | | | | | | | | | | | | | | | | | | | | | | | |
| | | CLASS B | |
| | | (Unaudited)
Six Months
Ended
April 30, | | | Year Ended October 31, | |
| | | 2017 | | | 2016 | | | 2015 | | | 2014 | | | 2013 | | | 2012 | |
Net asset value, beginning of period | | | $11.62 | | | | $12.55 | | | | $13.94 | | | | $14.17 | | | | $11.24 | | | | $10.49 | |
Income from investment operations: | | | | | | | | | | | | | | | | | | | | | | | | |
Net investment income (loss)(a) | | | 0.03 | | | | 0.11 | | | | 0.08 | | | | 0.06 | | | | 0.07 | | | | 0.02 | |
Net realized and unrealized gain (loss) | | | 1.18 | | | | (0.13 | ) | | | (0.48 | ) | | | 0.85 | | | | 2.88 | | | | 0.73 | |
Total from investment operations | | | 1.21 | | | | (0.02 | ) | | | (0.40 | ) | | | 0.91 | | | | 2.95 | | | | 0.75 | |
Distributions: | | | | | | | | | | | | | | | | | | | | | | | | |
Dividends from net investment income | | | — | | | | — | | | | — | | | | (0.03 | ) | | | (0.02 | ) | | | — | |
Dividends from net realized gains | | | — | | | | (0.91 | ) | | | (0.99 | ) | | | (1.11 | ) | | | — | | | | — | |
Total distributions | | | — | | | | (0.91 | ) | | | (0.99 | ) | | | (1.14 | ) | | | (0.02 | ) | | | — | |
Net asset value, end of period | | | $12.83 | | | | $11.62 | | | | $12.55 | | | | $13.94 | | | | $14.17 | | | | $11.24 | |
Ratios and supplemental data: | | | | | | | | | | | | | | | | | | | | | | | | |
Total return(b) | | | 10.41% | | | | 0.05% | | | | (3.04% | ) | | | 6.74% | | | | 26.28% | | | | 7.15% | |
Net assets, end of period (000) | | | $41 | | | | $92 | | | | $177 | | | | $348 | | | | $1,103 | | | | $1,195 | |
Ratio of net expenses to average net assets | | | 1.90% | (c) | | | 1.88% | | | | 1.90% | | | | 1.90% | | | | 1.90% | | | | 1.90% | |
Ratio of gross expenses to average net assets prior to expense reductions | | | 2.39% | (c) | | | 2.33% | | | | 2.35% | | | | 2.24% | | | | 2.28% | | | | 2.47% | |
Ratio of net investment income (loss) to average net assets | | | 0.49% | (c) | | | 0.92% | | | | 0.63% | | | | 0.42% | | | | 0.59% | | | | 0.20% | |
| |
| | | CLASS C | |
| | | (Unaudited)
Six Months
Ended
April 30, | | | Year Ended October 31, | |
| | | 2017 | | | 2016 | | | 2015 | | | 2014 | | | 2013 | | | 2012 | |
Net asset value, beginning of period | | | $11.39 | | | | $12.38 | | | | $13.79 | | | | $14.09 | | | | $11.23 | | | | $10.48 | |
Income from investment operations: | | | | | | | | | | | | | | | | | | | | | | | | |
Net investment income (loss)(a) | | | 0.02 | | | | 0.10 | | | | 0.08 | | | | 0.06 | | | | 0.08 | | | | 0.02 | |
Net realized and unrealized gain (loss) | | | 1.18 | | | | (0.13 | ) | | | (0.47 | ) | | | 0.85 | | | | 2.85 | | | | 0.73 | |
Total from investment operations | | | 1.20 | | | | (0.03 | ) | | | (0.39 | ) | | | 0.91 | | | | 2.93 | | | | 0.75 | |
Distributions: | | | | | | | | | | | | | | | | | | | | | | | | |
Dividends from net investment income | | | (0.01 | ) | | | (0.05 | ) | | | (0.03 | ) | | | (0.10 | ) | | | (0.07 | ) | | | — | |
Dividends from net realized gains | | | — | | | | (0.91 | ) | | | (0.99 | ) | | | (1.11 | ) | | | — | | | | — | |
Total distributions | | | (0.01 | ) | | | (0.96 | ) | | | (1.02 | ) | | | (1.21 | ) | | | (0.07 | ) | | | — | |
Net asset value, end of period | | | $12.58 | | | | $11.39 | | | | $12.38 | | | | $13.79 | | | | $14.09 | | | | $11.23 | |
Ratios and supplemental data: | | | | | | | | | | | | | | | | | | | | | | | | |
Total return(b) | | | 10.51% | | | | (0.04% | ) | | | (3.01% | ) | | | 6.82% | | | | 26.27% | | | | 7.16% | |
Net assets, end of period (000) | | | $5,364 | | | | $4,915 | | | | $5,738 | | | | $9,964 | | | | $8,641 | | | | $3,753 | |
Ratio of net expenses to average net assets | | | 1.90% | (c) | | | 1.87% | | | | 1.90% | | | | 1.90% | | | | 1.90% | | | | 1.90% | |
Ratio of gross expenses to average net assets prior to expense reductions | | | 2.41% | (c) | | | 2.32% | | | | 2.35% | | | | 2.25% | | | | 2.28% | | | | 2.47% | |
Ratio of net investment income (loss) to average net assets | | | 0.38% | (c) | | | 0.91% | | | | 0.64% | | | | 0.44% | | | | 0.59% | | | | 0.16% | |
| (a) | Net investment income (loss) allocated based on average shares method. |
| (b) | Total return measures net investment income (loss) and capital gain or loss from portfolio investments assuming reinvestment of dividends and capital gains distributions. Total return is not annualized for periods that are less than a full year, does not reflect the effect of sales charge for Class A shares nor the contingent deferred sales charge for Class B and C shares and does not reflect the deduction of taxes that a shareholder would pay on fund distributions or the redemption of fund shares. |
| | | | |
| 176 | | CALAMOS OPEN-END FAMILY OF FUNDS SEMIANNUAL REPORT | | |
Calamos Opportunistic Value Fund Financial Highlights
| | | | | | | | | | | | | | | | | | | | | | | | |
| | | CLASS I | |
| | | (Unaudited)
Six Months
Ended
April 30, | | | Year Ended October 31, | |
| | | 2017 | | | 2016 | | | 2015 | | | 2014 | | | 2013 | | | 2012 | |
Net asset value, beginning of period | | | $12.94 | | | | $13.96 | | | | $15.44 | | | | $15.57 | | | | $12.41 | | | | $11.46 | |
Income from investment operations: | | | | | | | | | | | | | | | | | | | | | | | | |
Net investment income (loss)(a) | | | 0.10 | | | | 0.24 | | | | 0.23 | | | | 0.22 | | | | 0.22 | | | | 0.14 | |
Net realized and unrealized gain (loss) | | | 1.33 | | | | (0.14 | ) | | | (0.53 | ) | | | 0.94 | | | | 3.14 | | | | 0.81 | |
Total from investment operations | | | 1.43 | | | | 0.10 | | | | (0.30 | ) | | | 1.16 | | | | 3.36 | | | | 0.95 | |
Distributions: | | | | | | | | | | | | | | | | | | | | | | | | |
Dividends from net investment income | | | (0.13 | ) | | | (0.21 | ) | | | (0.19 | ) | | | (0.18 | ) | | | (0.20 | ) | | | — | |
Dividends from net realized gains | | | — | | | | (0.91 | ) | | | (0.99 | ) | | | (1.11 | ) | | | — | | | | — | |
Total distributions | | | (0.13 | ) | | | (1.12 | ) | | | (1.18 | ) | | | (1.29 | ) | | | (0.20 | ) | | | — | |
Net asset value, end of period | | | $14.24 | | | | $12.94 | | | | $13.96 | | | | $15.44 | | | | $15.57 | | | | $12.41 | |
Ratios and supplemental data: | | | | | | | | | | | | | | | | | | | | | | | | |
Total return(b) | | | 11.08% | | | | 0.98% | | | | (2.08% | ) | | | 7.87% | | | | 27.47% | | | | 8.29% | |
Net assets, end of period (000) | | | $18,193 | | | | $16,672 | | | | $19,583 | | | | $32,147 | | | | $20,857 | | | | $9,671 | |
Ratio of net expenses to average net assets | | | 0.90% | (c) | | | 0.87% | | | | 0.90% | | | | 0.90% | | | | 0.90% | | | | 0.90% | |
Ratio of gross expenses to average net assets prior to expense reductions | | | 1.41% | (c) | | | 1.32% | | | | 1.36% | | | | 1.25% | | | | 1.28% | | | | 1.48% | |
Ratio of net investment income (loss) to average net assets | | | 1.39% | (c) | | | 1.91% | | | | 1.63% | | | | 1.45% | | | | 1.56% | | | | 1.15% | |
| |
| | | CLASS R | |
| | | (Unaudited)
Six Months
Ended
April 30, | | | Year Ended October 31, | |
| | | 2017 | | | 2016 | | | 2015 | | | 2014 | | | 2013 | | | 2012 | |
Net asset value, beginning of period | | | $12.43 | | | | $13.44 | | | | $14.91 | | | | $15.09 | | | | $12.02 | | | | $11.16 | |
Income from investment operations: | | | | | | | | | | | | | | | | | | | | | | | | |
Net investment income (loss)(a) | | | 0.06 | | | | 0.18 | | | | 0.15 | | | | 0.14 | | | | 0.14 | | | | 0.07 | |
Net realized and unrealized gain (loss) | | | 1.28 | | | | (0.14 | ) | | | (0.51 | ) | | | 0.90 | | | | 3.07 | | | | 0.79 | |
Total from investment operations | | | 1.34 | | | | 0.04 | | | | (0.36 | ) | | | 1.04 | | | | 3.21 | | | | 0.86 | |
Distributions: | | | | | | | | | | | | | | | | | | | | | | | | |
Dividends from net investment income | | | (0.07 | ) | | | (0.14 | ) | | | (0.12 | ) | | | (0.11 | ) | | | (0.14 | ) | | | — | |
Dividends from net realized gains | | | — | | | | (0.91 | ) | | | (0.99 | ) | | | (1.11 | ) | | | — | | | | — | |
Total distributions | | | (0.07 | ) | | | (1.05 | ) | | | (1.11 | ) | | | (1.22 | ) | | | (0.14 | ) | | | — | |
Net asset value, end of period | | | $13.70 | | | | $12.43 | | | | $13.44 | | | | $14.91 | | | | $15.09 | | | | $12.02 | |
Ratios and supplemental data: | | | | | | | | | | | | | | | | | | | | | | | | |
Total return(b) | | | 10.75% | | | | 0.54% | | | | (2.57% | ) | | | 7.28% | | | | 26.94% | | | | 7.71% | |
Net assets, end of period (000) | | | $140 | | | | $121 | | | | $150 | | | | $144 | | | | $128 | | | | $98 | |
Ratio of net expenses to average net assets | | | 1.40% | (c) | | | 1.37% | | | | 1.40% | | | | 1.40% | | | | 1.40% | | | | 1.40% | |
Ratio of gross expenses to average net assets prior to expense reductions | | | 1.91% | (c) | | | 1.83% | | | | 1.86% | | | | 1.75% | | | | 1.78% | | | | 1.97% | |
Ratio of net investment income (loss) to average net assets | | | 0.89% | (c) | | | 1.43% | | | | 1.11% | | | | 0.95% | | | | 1.08% | | | | 0.65% | |
| (a) | Net investment income (loss) allocated based on average shares method. |
| (b) | Total return measures net investment income (loss) and capital gain or loss from portfolio investments assuming reinvestment of dividends and capital gains distributions. Total return is not annualized for periods that are less than a full year, does not reflect the effect of sales charge for Class A shares nor the contingent deferred sales charge for Class B and C shares and does not reflect the deduction of taxes that a shareholder would pay on fund distributions or the redemption of fund shares. |
Calamos Opportunistic Value Fund Financial Highlights
| | | | |
| | | CLASS T | |
| | | (Unaudited)
February 28, 2017*
through
April 30, | |
| | | 2017 | |
Net asset value, beginning of period | | | $14.03 | |
Income from investment operations: | | | | |
Net investment income (loss)(a) | | | 0.01 | |
Net realized and unrealized gain (loss) | | | (0.17 | ) |
Total from investment operations | | | (0.16 | ) |
Distributions: | | | | |
Dividends from net investment income | | | — | |
Net asset value, end of period | | | $13.87 | |
Ratios and supplemental data: | | | | |
Total return(b) | | | (1.14% | ) |
Net assets, end of period (000) | | | $25 | |
Ratio of net expenses to average net assets | | | 1.15% | (c) |
Ratio of gross expenses to average net assets prior to expense reductions | | | 1.75% | (c) |
Ratio of net investment income (loss) to average net assets | | | 0.59% | (c) |
| * | Commencement of operations. |
| (a) | Net investment income (loss) allocated based on average shares method. |
| (b) | Total return measures net investment income (loss) and capital gain or loss from portfolio investments assuming reinvestment of dividends and capital gains distributions. Total return is not annualized for periods that are less than a full year, does not reflect the effect of sales charge for Class A shares nor the contingent deferred sales charge for Class B and C shares and does not reflect the deduction of taxes that a shareholder would pay on fund distributions or the redemption of fund shares. |
| | | | |
| 178 | | CALAMOS OPEN-END FAMILY OF FUNDS SEMIANNUAL REPORT | | |
Calamos Dividend Growth Fund Financial Highlights
Selected data for a share outstanding throughout each period were as follows:
| | | | | | | | | | | | | | | | | | | | |
| | | CLASS A | |
| | | (Unaudited)
Six Months
Ended
April 30, | | | Year Ended October 31, | | | August 5, 2013*
through
October 31, | |
| | | 2017 | | | 2016 | | | 2015 | | | 2014 | | | 2013 | |
Net asset value, beginning of period | | | $10.38 | | | | $10.52 | | | | $10.78 | | | | $10.36 | | | | $10.00 | |
Income from investment operations: | | | | | | | | | | | | | | | | | | | | |
Net investment income (loss)(a) | | | 0.04 | | | | 0.10 | | | | 0.17 | | | | 0.39 | | | | 0.05 | |
Net realized and unrealized gain (loss) | | | 1.32 | | | | 0.11 | | | | (0.15 | ) | | | 0.24 | | | | 0.31 | |
Total from investment operations | | | 1.36 | | | | 0.21 | | | | 0.02 | | | | 0.63 | | | | 0.36 | |
Distributions: | | | | | | | | | | | | | | | | | | | | |
Dividends from net investment income | | | (0.03 | ) | | | (0.08 | ) | | | (0.15 | ) | | | (0.18 | ) | | | — | |
Dividends from net realized gains | | | — | | | | (0.27 | ) | | | (0.13 | ) | | | (0.03 | ) | | | — | |
Total distributions | | | (0.03 | ) | | | (0.35 | ) | | | (0.28 | ) | | | (0.21 | ) | | | — | |
Net asset value, end of period | | | $11.71 | | | | $10.38 | | | | $10.52 | | | | $10.78 | | | | $10.36 | |
Ratios and supplemental data: | | | | | | | | | | | | | | | | | | | | |
Total return(b) | | | 13.13% | | | | 2.17% | | | | 0.21% | | | | 6.12% | | | | 3.60% | |
Net assets, end of period (000) | | | $23,828 | | | | $23,157 | | | | $28,030 | | | | $28,365 | | | | $25,922 | |
Ratio of net expenses to average net assets | | | 1.35% | (c) | | | 1.33% | | | | 1.35% | | | | 1.35% | | | | 1.35% | (c) |
Ratio of gross expenses to average net assets prior to expense reductions | | | 1.85% | (c) | | | 1.73% | | | | 1.74% | | | | 1.73% | | | | 2.14% | (c) |
Ratio of net investment income (loss) to average net assets | | | 0.77% | (c) | | | 0.95% | | | | 1.66% | | | | 3.68% | | | | 1.99% | (c) |
| | | |
| | | (Unaudited)
Six Months
Ended
April 30, | | | Year Ended October 31, | | | August 5, 2013*
through
October 31, | |
| | | 2017 | | | 2016 | | | 2015 | | | 2014 | | | 2013 | |
Portfolio turnover rate | | | 8.6% | | | | 11.5% | | | | 107.6% | | | | 130.0% | | | | 20.7% | |
| * | Commencement of operations. |
| (a) | Net investment income (loss) allocated based on average shares method. |
| (b) | Total return measures net investment income (loss) and capital gain or loss from portfolio investments assuming reinvestment of dividends and capital gains distributions. Total return is not annualized for periods that are less than a full year, does not reflect the effect of sales charge for Class A shares nor the contingent deferred sales charge for Class B and C shares and does not reflect the deduction of taxes that a shareholder would pay on fund distributions or the redemption of fund shares. |
Calamos Dividend Growth Fund Financial Highlights
| | | | | | | | | | | | | | | | | | | | |
| | | CLASS C | |
| | | (Unaudited)
Six Months
Ended
April 30, | | | Year Ended October 31, | | | August 5, 2013*
through
October 31, | |
| | | 2017 | | | 2016 | | | 2015 | | | 2014 | | | 2013 | |
Net asset value, beginning of period | | | $10.26 | | | | $10.41 | | | | $10.74 | | | | $10.34 | | | | $10.00 | |
Income from investment operations: | | | | | | | | | | | | | | | | | | | | |
Net investment income (loss)(a) | | | 0.00 | ** | | | 0.02 | | | | 0.08 | | | | 0.31 | | | | 0.03 | |
Net realized and unrealized gain (loss) | | | 1.30 | | | | 0.12 | | | | (0.15 | ) | | | 0.25 | | | | 0.31 | |
Total from investment operations | | | 1.30 | | | | 0.14 | | | | (0.07 | ) | | | 0.56 | | | | 0.34 | |
Distributions: | | | | | | | | | | | | | | | | | | | | |
Dividends from net investment income | | | (0.01 | ) | | | (0.02 | ) | | | (0.13 | ) | | | (0.13 | ) | | | — | |
Dividends from net realized gains | | | — | | | | (0.27 | ) | | | (0.13 | ) | | | (0.03 | ) | | | — | |
Total distributions | | | (0.01 | ) | | | (0.29 | ) | | | (0.26 | ) | | | (0.16 | ) | | | — | |
Net asset value, end of period | | | $11.55 | | | | $10.26 | | | | $10.41 | | | | $10.74 | | | | $10.34 | |
Ratios and supplemental data: | | | | | | | | | | | | | | | | | | | | |
Total return(b) | | | 12.70% | | | | 1.42% | | | | (0.63% | ) | | | 5.40% | | | | 3.40% | |
Net assets, end of period (000) | | | $1,003 | | | | $969 | | | | $702 | | | | $418 | | | | $253 | |
Ratio of net expenses to average net assets | | | 2.10% | (c) | | | 2.08% | | | | 2.10% | | | | 2.10% | | | | 2.10% | (c) |
Ratio of gross expenses to average net assets prior to expense reductions | | | 2.60% | (c) | | | 2.48% | | | | 2.51% | | | | 2.44% | | | | 3.35% | (c) |
Ratio of net investment income (loss) to average net assets | | | 0.02% | (c) | | | 0.17% | | | | 0.77% | | | | 2.90% | | | | 1.39% | (c) |
| |
| | | CLASS I | |
| | | (Unaudited)
Six Months
Ended
April 30, | | | Year Ended October 31, | | | August 5, 2013*
through
October 31, | |
| | | 2017 | | | 2016 | | | 2015 | | | 2014 | | | 2013 | |
Net asset value, beginning of period | | | $10.39 | | | | $10.55 | | | | $10.79 | | | | $10.37 | | | | $10.00 | |
Income from investment operations: | | | | | | | | | | | | | | | | | | | | |
Net investment income (loss)(a) | | | 0.06 | | | | 0.12 | | | | 0.20 | | | | 0.42 | | | | 0.05 | |
Net realized and unrealized gain (loss) | | | 1.32 | | | | 0.12 | | | | (0.16 | ) | | | 0.23 | | | | 0.32 | |
Total from investment operations | | | 1.38 | | | | 0.24 | | | | 0.04 | | | | 0.65 | | | | 0.37 | |
Distributions: | | | | | | | | | | | | | | | | | | | | |
Dividends from net investment income | | | (0.04 | ) | | | (0.13 | ) | | | (0.15 | ) | | | (0.20 | ) | | | — | |
Dividends from net realized gains | | | — | | | | (0.27 | ) | | | (0.13 | ) | | | (0.03 | ) | | | — | |
Total distributions | | | (0.04 | ) | | | (0.40 | ) | | | (0.28 | ) | | | (0.23 | ) | | | — | |
Net asset value, end of period | | | $11.73 | | | | $10.39 | | | | $10.55 | | | | $10.79 | | | | $10.37 | |
Ratios and supplemental data: | | | | | | | | | | | | | | | | | | | | |
Total return(b) | | | 13.35% | | | | 2.39% | | | | 0.47% | | | | 6.33% | | | | 3.70% | |
Net assets, end of period (000) | | | $4,937 | | | | $7,989 | | | | $7,375 | | | | $8,020 | | | | $7,586 | |
Ratio of net expenses to average net assets | | | 1.10% | (c) | | | 1.08% | | | | 1.10% | | | | 1.10% | | | | 1.10% | (c) |
Ratio of gross expenses to average net assets prior to expense reductions | | | 1.58% | (c) | | | 1.48% | | | | 1.49% | | | | 1.48% | | | | 2.13% | (c) |
Ratio of net investment income (loss) to average net assets | | | 1.13% | (c) | | | 1.17% | | | | 1.91% | | | | 3.97% | | | | 2.13% | (c) |
| * | Commencement of operations. |
| ** | Amounts are less than $0.005. |
| (a) | Net investment income (loss) allocated based on average shares method. |
| (b) | Total return measures net investment income (loss) and capital gain or loss from portfolio investments assuming reinvestment of dividends and capital gains distributions. Total return is not annualized for periods that are less than a full year, does not reflect the effect of sales charge for Class A shares nor the contingent deferred sales charge for Class B and C shares and does not reflect the deduction of taxes that a shareholder would pay on fund distributions or the redemption of fund shares. |
| | | | |
| 180 | | CALAMOS OPEN-END FAMILY OF FUNDS SEMIANNUAL REPORT | | |
Calamos Dividend Growth Fund Financial Highlights
| | | | |
| | | CLASS T | |
| | | (Unaudited)
February 28, 2017*
through
April 30, | |
| | | 2017 | |
Net asset value, beginning of period | | | $11.57 | |
Income from investment operations: | | | | |
Net investment income (loss)(a) | | | — | ** |
Net realized and unrealized gain (loss) | | | 0.14 | |
Total from investment operations | | | 0.14 | |
Distributions: | | | | |
Dividends from net investment income | | | (0.01 | ) |
Total distributions | | | (0.01 | ) |
Net asset value, end of period | | | $11.70 | |
Ratios and supplemental data: | | | | |
Total return(b) | | | 1.20% | |
Net assets, end of period (000) | | | $25 | |
Ratio of net expenses to average net assets | | | 1.35% | (c) |
Ratio of gross expenses to average net assets prior to expense reductions | | | 1.98% | (c) |
Ratio of net investment income (loss) to average net assets | | | 0.14% | (c) |
| * | Commencement of operations. |
| ** | Amounts are less than $0.005. |
| (a) | Net investment income (loss) allocated based on average shares method. |
| (b) | Total return measures net investment income (loss) and capital gain or loss from portfolio investments assuming reinvestment of dividends and capital gains distributions. Total return is not annualized for periods that are less than a full year, does not reflect the effect of sales charge for Class A shares nor the contingent deferred sales charge for Class B and C shares and does not reflect the deduction of taxes that a shareholder would pay on fund distributions or the redemption of fund shares. |
Calamos International Growth Fund Financial Highlights
Selected data for a share outstanding throughout each period were as follows:
| | | | | | | | | | | | | | | | | | | | | | | | |
| | | CLASS A | |
| | | (Unaudited)
Six Months
Ended
April 30, | | | Year Ended October 31, | |
| | | 2017 | | | 2016 | | | 2015 | | | 2014 | | | 2013 | | | 2012 | |
Net asset value, beginning of period | | | $16.65 | | | | $17.27 | | | | $19.27 | | | | $19.24 | | | | $17.27 | | | | $16.32 | |
Income from investment operations: | | | | | | | | | | | | | | | | | | | | | | | | |
Net investment income (loss)(a) | | | 0.02 | | | | 0.05 | | | | 0.09 | | | | 0.09 | | | | 0.09 | | | | 0.06 | |
Net realized and unrealized gain (loss) | | | 1.40 | | | | (0.65 | ) | | | 0.02 | | | | 0.02 | | | | 1.92 | | | | 0.89 | |
Total from investment operations | | | 1.42 | | | | (0.60 | ) | | | 0.11 | | | | 0.11 | | | | 2.01 | | | | 0.95 | |
Distributions: | | | | | | | | | | | | | | | | | | | | | | | | |
Dividends from net investment income | | | — | | | | — | | | | — | | | | (0.08 | ) | | | (0.04 | ) | | | — | |
Dividends from net realized gains | | | — | | | | (0.02 | ) | | | (2.11 | ) | | | — | | | | — | | | | — | |
Return of capital | | | — | | | | (0.00 | )* | | | — | | | | — | | | | — | | | | — | |
Total distributions | | | — | | | | (0.02 | ) | | | (2.11 | ) | | | (0.08 | ) | | | (0.04 | ) | | | — | |
Net asset value, end of period | | | $18.07 | | | | $16.65 | | | | $17.27 | | | | $19.27 | | | | $19.24 | | | | $17.27 | |
Ratios and supplemental data: | | | | | | | | | | | | | | | | | | | | | | | | |
Total return(b) | | | 8.53% | | | | (3.46% | ) | | | 0.94% | | | | 0.57% | | | | 11.64% | | | | 5.82% | |
Net assets, end of period (000) | | | $81,625 | | | | $111,036 | | | | $209,548 | | | | $254,400 | | | | $368,964 | | | | $459,516 | |
Ratio of net expenses to average net assets | | | 1.37% | (c) | | | 1.38% | | | | 1.31% | | | | 1.39% | | | | 1.40% | | | | 1.40% | |
Ratio of gross expenses to average net assets prior to expense reductions | | | 1.47% | (c) | | | 1.39% | | | | 1.31% | | | | 1.39% | | | | 1.48% | | | | 1.59% | |
Ratio of net investment income (loss) to average net assets | | | 0.26% | (c) | | | 0.32% | | | | 0.52% | | | | 0.43% | | | | 0.50% | | | | 0.36% | |
| | |
| | | (Unaudited)
Six Months
Ended
April 30, | | | Year Ended October 31, | |
| | | 2017 | | | 2016 | | | 2015 | | | 2014 | | | 2013 | | | 2012 | |
Portfolio turnover rate | | | 55.6% | | | | 69.0% | | | | 65.0% | | | | 81.6% | | | | 73.4% | | | | 55.7% | |
| * | Amounts are less than $0.005. |
| (a) | Net investment income (loss) allocated based on average shares method. |
| (b) | Total return measures net investment income (loss) and capital gain or loss from portfolio investments assuming reinvestment of dividends and capital gains distributions. Total return is not annualized for periods that are less than a full year, does not reflect the effect of sales charge for Class A shares nor the contingent deferred sales charge for Class B and C shares and does not reflect the deduction of taxes that a shareholder would pay on fund distributions or the redemption of fund shares. |
| | | | |
| 182 | | CALAMOS OPEN-END FAMILY OF FUNDS SEMIANNUAL REPORT | | |
Calamos International Growth Fund Financial Highlights
| | | | | | | | | | | | | | | | | | | | | | | | |
| | | CLASS B | |
| | | (Unaudited)
Six Months
Ended
April 30, | | | Year Ended October 31, | |
| | | 2017 | | | 2016 | | | 2015 | | | 2014 | | | 2013 | | | 2012 | |
Net asset value, beginning of period | | | $15.37 | | | | $16.06 | | | | $18.20 | | | | $18.24 | | | | $16.45 | | | | $15.67 | |
Income from investment operations: | | | | | | | | | | | | | | | | | | | | | | | | |
Net investment income (loss)(a) | | | (0.04 | ) | | | (0.09 | ) | | | (0.05 | ) | | | (0.09 | ) | | | (0.05 | ) | | | (0.07 | ) |
Net realized and unrealized gain (loss) | | | 1.29 | | | | (0.58 | ) | | | 0.02 | | | | 0.05 | | | | 1.84 | | | | 0.85 | |
Total from investment operations | | | 1.25 | | | | (0.67 | ) | | | (0.03 | ) | | | (0.04 | ) | | | 1.79 | | | | 0.78 | |
Distributions: | | | | | | | | | | | | | | | | | | | | | | | | |
Dividends from net investment income | | | — | | | | — | | | | — | | | | — | | | | — | | | | — | |
Dividends from net realized gains | | | — | | | | (0.02 | ) | | | (2.11 | ) | | | — | | | | — | | | | — | |
Return of capital | | | — | | | | (0.00 | )* | | | — | | | | — | | | | — | | | | — | |
Total distributions | | | — | | | | (0.02 | ) | | | (2.11 | ) | | | — | | | | — | | | | — | |
Net asset value, end of period | | | $16.62 | | | | $15.37 | | | | $16.06 | | | | $18.20 | | | | $18.24 | | | | $16.45 | |
Ratios and supplemental data: | | | | | | | | | | | | | | | | | | | | | | | | |
Total return(b) | | | 8.13% | | | | (4.16% | ) | | | 0.15% | | | | (0.22% | ) | | | 10.88% | | | | 4.98% | |
Net assets, end of period (000) | | | $114 | | | | $270 | | | | $1,103 | | | | $2,302 | | | | $5,995 | | | | $9,542 | |
Ratio of net expenses to average net assets | | | 2.13% | (c) | | | 2.12% | | | | 2.06% | | | | 2.15% | | | | 2.15% | | | | 2.15% | |
Ratio of gross expenses to average net assets prior to expense reductions | | | 2.23% | (c) | | | 2.13% | | | | 2.06% | | | | 2.15% | | | | 2.23% | | | | 2.34% | |
Ratio of net investment income (loss) to average net assets | | | (0.58% | )(c) | | | (0.56% | ) | | | (0.29% | ) | | | (0.46% | ) | | | (0.26% | ) | | | (0.45% | ) |
| |
| | | CLASS C | |
| | | (Unaudited)
Six Months
Ended
April 30, | | | Year Ended October 31, | |
| | | 2017 | | | 2016 | | | 2015 | | | 2014 | | | 2013 | | | 2012 | |
Net asset value, beginning of period | | | $15.35 | | | | $16.04 | | | | $18.18 | | | | $18.21 | | | | $16.43 | | | | $15.65 | |
Income from investment operations: | | | | | | | | | | | | | | | | | | | | | | | | |
Net investment income (loss)(a) | | | (0.04 | ) | | | (0.07 | ) | | | (0.04 | ) | | | (0.06 | ) | | | (0.04 | ) | | | (0.06 | ) |
Net realized and unrealized gain (loss) | | | 1.29 | | | | (0.60 | ) | | | 0.01 | | | | 0.03 | | | | 1.82 | | | | 0.84 | |
Total from investment operations | | | 1.25 | | | | (0.67 | ) | | | (0.03 | ) | | | (0.03 | ) | | | 1.78 | | | | 0.78 | |
Distributions: | | | | | | | | | | | | | | | | | | | | | | | | |
Dividends from net investment income | | | — | | | | — | | | | — | | | | — | | | | — | | | | — | |
Dividends from net realized gains | | | — | | | | (0.02 | ) | | | (2.11 | ) | | | — | | | | — | | | | — | |
Return of capital | | | — | | | | (0.00 | )* | | | — | | | | — | | | | — | | | | — | |
Total distributions | | | — | | | | (0.02 | ) | | | (2.11 | ) | | | — | | | | — | | | | — | |
Net asset value, end of period | | | $16.60 | | | | $15.35 | | | | $16.04 | | | | $18.18 | | | | $18.21 | | | | $16.43 | |
Ratios and supplemental data: | | | | | | | | | | | | | | | | | | | | | | | | |
Total return(b) | | | 8.14% | | | | (4.16% | ) | | | 0.15% | | | | (0.16% | ) | | | 10.83% | | | | 4.98% | |
Net assets, end of period (000) | | | $28,066 | | | | $35,537 | | | | $47,996 | | | | $59,756 | | | | $65,622 | | | | $65,621 | |
Ratio of net expenses to average net assets | | | 2.12% | (c) | | | 2.13% | | | | 2.06% | | | | 2.13% | | | | 2.15% | | | | 2.15% | |
Ratio of gross expenses to average net assets prior to expense reductions | | | 2.22% | (c) | | | 2.14% | | | | 2.06% | | | | 2.13% | | | | 2.23% | | | | 2.34% | |
Ratio of net investment income (loss) to average net assets | | | (0.47% | )(c) | | | (0.46% | ) | | | (0.23% | ) | | | (0.32% | ) | | | (0.23% | ) | | | (0.41% | ) |
| * | Amounts are less than $0.005. |
| (a) | Net investment income (loss) allocated based on average shares method. |
| (b) | Total return measures net investment income (loss) and capital gain or loss from portfolio investments assuming reinvestment of dividends and capital gains distributions. Total return is not annualized for periods that are less than a full year, does not reflect the effect of sales charge for Class A shares nor the contingent deferred sales charge for Class B and C shares and does not reflect the deduction of taxes that a shareholder would pay on fund distributions or the redemption of fund shares. |
Calamos International Growth Fund Financial Highlights
| | | | | | | | | | | | | | | | | | | | | | | | |
| | | CLASS I | |
| | | (Unaudited)
Six Months
Ended
April 30, | | | Year Ended October 31, | |
| | | 2017 | | | 2016 | | | 2015 | | | 2014 | | | 2013 | | | 2012 | |
Net asset value, beginning of period | | | $16.96 | | | | $17.54 | | | | $19.50 | | | | $19.48 | | | | $17.47 | | | | $16.47 | |
Income from investment operations: | | | | | | | | | | | | | | | | | | | | | | | | |
Net investment income (loss)(a) | | | 0.04 | | | | 0.09 | | | | 0.14 | | | | 0.13 | | | | 0.14 | | | | 0.10 | |
Net realized and unrealized gain (loss) | | | 1.43 | | | | (0.65 | ) | | | 0.01 | | | | 0.03 | | | | 1.94 | | | | 0.90 | |
Total from investment operations | | | 1.47 | | | | (0.56 | ) | | | 0.15 | | | | 0.16 | | | | 2.08 | | | | 1.00 | |
Distributions: | | | | | | | | | | | | | | | | | | | | | | | | |
Dividends from net investment income | | | — | | | | — | | | | — | | | | (0.14 | ) | | | (0.07 | ) | | | — | |
Dividends from net realized gains | | | — | | | | (0.02 | ) | | | (2.11 | ) | | | — | | | | — | | | | — | |
Return of capital | | | — | | | | (0.00 | )* | | | — | | | | — | | | | — | | | | — | |
Total distributions | | | — | | | | (0.02 | ) | | | (2.11 | ) | | | (0.14 | ) | | | (0.07 | ) | | | — | |
Net asset value, end of period | | | $18.43 | | | | $16.96 | | | | $17.54 | | | | $19.50 | | | | $19.48 | | | | $17.47 | |
Ratios and supplemental data: | | | | | | | | | | | | | | | | | | | | | | | | |
Total return(b) | | | 8.67% | | | | (3.18% | ) | | | 1.16% | | | | 0.80% | | | | 11.97% | | | | 6.07% | |
Net assets, end of period (000) | | | $168,013 | | | | $213,166 | | | | $339,909 | | | | $410,485 | | | | $460,587 | | | | $415,463 | |
Ratio of net expenses to average net assets | | | 1.12% | (c) | | | 1.13% | | | | 1.06% | | | | 1.14% | | | | 1.15% | | | | 1.15% | |
Ratio of gross expenses to average net assets prior to expense reductions | | | 1.22% | (c) | | | 1.14% | | | | 1.06% | | | | 1.14% | | | | 1.23% | | | | 1.34% | |
Ratio of net investment income (loss) to average net assets | | | 0.53% | (c) | | | 0.53% | | | | 0.78% | | | | 0.66% | | | | 0.79% | | | | 0.61% | |
| |
| | | CLASS R | |
| | | (Unaudited)
Six Months
Ended
April 30, | | | Year Ended October 31, | |
| | | 2017 | | | 2016 | | | 2015 | | | 2014 | | | 2013 | | | 2012 | |
Net asset value, beginning of period | | | $16.31 | | | | $16.95 | | | | $19.00 | | | | $18.98 | | | | $17.06 | | | | $16.16 | |
Income from investment operations: | | | | | | | | | | | | | | | | | | | | | | | | |
Net investment income (loss)(a) | | | 0.01 | | | | 0.02 | | | | 0.05 | | | | 0.03 | | | | 0.06 | | | | 0.02 | |
Net realized and unrealized gain (loss) | | | 1.35 | | | | (0.64 | ) | | | 0.01 | | | | 0.03 | | | | 1.88 | | | | 0.88 | |
Total from investment operations | | | 1.36 | | | | (0.62 | ) | | | 0.06 | | | | 0.06 | | | | 1.94 | | | | 0.90 | |
Distributions: | | | | | | | | | | | | | | | | | | | | | | | | |
Dividends from net investment income | | | — | | | | — | | | | — | | | | (0.04 | ) | | | (0.02 | ) | | | — | |
Dividends from net realized gains | | | — | | | | (0.02 | ) | | | (2.11 | ) | | | — | | | | — | | | | — | |
Return of capital | | | — | | | | (0.00 | )* | | | — | | | | — | | | | — | | | | — | |
Total distributions | | | — | | | | (0.02 | ) | | | (2.11 | ) | | | (0.04 | ) | | | (0.02 | ) | | | — | |
Net asset value, end of period | | | $17.67 | | | | $16.31 | | | | $16.95 | | | | $19.00 | | | | $18.98 | | | | $17.06 | |
Ratios and supplemental data: | | | | | | | | | | | | | | | | | | | | | | | | |
Total return(b) | | | 8.34% | | | | (3.64% | ) | | | 0.66% | | | | 0.33% | | | | 11.36% | | | | 5.57% | |
Net assets, end of period (000) | | | $5,988 | | | | $5,641 | | | | $8,861 | | | | $14,650 | | | | $19,550 | | | | $12,016 | |
Ratio of net expenses to average net assets | | | 1.62% | (c) | | | 1.63% | | | | 1.56% | | | | 1.64% | | | | 1.65% | | | | 1.65% | |
Ratio of gross expenses to average net assets prior to expense reductions | | | 1.71% | (c) | | | 1.64% | | | | 1.56% | | | | 1.64% | | | | 1.73% | | | | 1.84% | |
Ratio of net investment income (loss) to average net assets | | | 0.13% | (c) | | | 0.09% | | | | 0.29% | | | | 0.14% | | | | 0.33% | | | | 0.11% | |
| * | Amounts are less than $0.005. |
| (a) | Net investment income (loss) allocated based on average shares method. |
| (b) | Total return measures net investment income (loss) and capital gain or loss from portfolio investments assuming reinvestment of dividends and capital gains distributions. Total return is not annualized for periods that are less than a full year, does not reflect the effect of sales charge for Class A shares nor the contingent deferred sales charge for Class B and C shares and does not reflect the deduction of taxes that a shareholder would pay on fund distributions or the redemption of fund shares. |
| | | | |
| 184 | | CALAMOS OPEN-END FAMILY OF FUNDS SEMIANNUAL REPORT | | |
Calamos International Growth Fund Financial Highlights
| | | | |
| | | CLASS T | |
| | | (Unaudited)
February 28, 2017*
through
April 30, | |
| | | 2017 | |
Net asset value, beginning of period | | | $16.98 | |
Income from investment operations: | | | | |
Net investment income (loss)(a) | | | 0.06 | |
Net realized and unrealized gain (loss) | | | 1.03 | |
Total from investment operations | | | 1.09 | |
Distributions: | | | | |
Dividends from net investment income | | | — | |
Net asset value, end of period | | | $18.07 | |
Ratios and supplemental data: | | | | |
Total return(b) | | | 6.42% | |
Net assets, end of period (000) | | | $27 | |
Ratio of net expenses to average net assets | | | 1.34% | (c) |
Ratio of gross expenses to average net assets prior to expense reductions | | | 1.38% | (c) |
Ratio of net investment income (loss) to average net assets | | | 2.10% | (c) |
| * | Commencement of operations. |
| (a) | Net investment income (loss) allocated based on average shares method. |
| (b) | Total return measures net investment income (loss) and capital gain or loss from portfolio investments assuming reinvestment of dividends and capital gains distributions. Total return is not annualized for periods that are less than a full year, does not reflect the effect of sales charge for Class A shares nor the contingent deferred sales charge for Class B and C shares and does not reflect the deduction of taxes that a shareholder would pay on fund distributions or the redemption of fund shares. |
Calamos Evolving World Growth Fund Financial Highlights
Selected data for a share outstanding throughout each period were as follows:
| | | | | | | | | | | | | | | | | | | | | | | | |
| | | CLASS A | |
| | | (Unaudited)
Six Months
Ended
April 30, | | | Year Ended October 31, | |
| | | 2017 | | | 2016 | | | 2015 | | | 2014 | | | 2013 | | | 2012 | |
Net asset value, beginning of period | | | $12.11 | | | | $12.11 | | | | $13.73 | | | | $13.97 | | | | $12.83 | | | | $12.47 | |
Income from investment operations: | | | | | | | | | | | | | | | | | | | | | | | | |
Net investment income (loss)(a) | | | 0.02 | | | | 0.03 | | | | 0.02 | | | | 0.06 | | | | 0.03 | | | | 0.04 | |
Net realized and unrealized gain (loss) | | | 0.60 | | | | (0.02 | ) | | | (1.31 | ) | | | (0.18 | ) | | | 1.11 | | | | 0.32 | |
Total from investment operations | | | 0.62 | | | | 0.01 | | | | (1.29 | ) | | | (0.12 | ) | | | 1.14 | | | | 0.36 | |
Distributions: | | | | | | | | | | | | | | | | | | | | | | | | |
Dividends from net investment income | | | — | | | | (0.01 | ) | | | (0.03 | ) | | | (0.01 | ) | | | — | | | | — | |
Dividends from net realized gains | | | — | | | | — | | | | (0.30 | ) | | | (0.11 | ) | | | — | | | | — | |
Return of capital | | | — | | | | (0.00 | )* | | | (0.00 | )* | | | — | | | | — | | | | — | |
Total distributions | | | — | | | | (0.01 | ) | | | (0.33 | ) | | | (0.12 | ) | | | — | | | | — | |
Net asset value, end of period | | | $12.73 | | | | $12.11 | | | | $12.11 | | | | $13.73 | | | | $13.97 | | | | $12.83 | |
Ratios and supplemental data: | | | | | | | | | | | | | | | | | | | | | | | | |
Total return(b) | | | 5.12% | | | | 0.08% | | | | (9.56% | ) | | | (0.84% | ) | | | 8.89% | | | | 2.89% | |
Net assets, end of period (000) | | | $65,429 | | | | $102,545 | | | | $121,946 | | | | $168,332 | | | | $164,273 | | | | $138,718 | |
Ratio of net expenses to average net assets | | | 1.72% | (c) | | | 1.64% | | | | 1.65% | | | | 1.61% | | | | 1.63% | | | | 1.60% | |
Ratio of gross expenses to average net assets prior to expense reductions | | | 1.72% | (c) | | | 1.64% | | | | 1.65% | | | | 1.61% | | | | 1.63% | | | | 1.60% | |
Ratio of net investment income (loss) to average net assets | | | 0.30% | (c) | | | 0.23% | | | | 0.14% | | | | 0.45% | | | | 0.23% | | | | 0.32% | |
| | |
| | | (Unaudited)
Six Months
Ended
April 30, | | | Year Ended October 31, | |
| | | 2017 | | | 2016 | | | 2015 | | | 2014 | | | 2013 | | | 2012 | |
Portfolio turnover rate | | | 56.1% | | | | 87.4% | | | | 58.8% | | | | 99.9% | | | | 85.8% | | | | 50.1% | |
| * | Amounts are less than $0.005. |
| (a) | Net investment income (loss) allocated based on average shares method. |
| (b) | Total return measures net investment income (loss) and capital gain or loss from portfolio investments assuming reinvestment of dividends and capital gains distributions. Total return is not annualized for periods that are less than a full year, does not reflect the effect of sales charge for Class A shares nor the contingent deferred sales charge for Class B and C shares and does not reflect the deduction of taxes that a shareholder would pay on fund distributions or the redemption of fund shares. |
| | | | |
| 186 | | CALAMOS OPEN-END FAMILY OF FUNDS SEMIANNUAL REPORT | | |
Calamos Evolving World Growth Fund Financial Highlights
| | | | | | | | | | | | | | | | | | | | | | | | |
| | | CLASS B | |
| | | (Unaudited)
Six Months
Ended
April 30, | | | Year Ended October 31, | |
| | | 2017 | | | 2016 | | | 2015 | | | 2014 | | | 2013 | | | 2012 | |
Net asset value, beginning of period | | | $11.56 | | | | $11.62 | | | | $13.26 | | | | $13.59 | | | | $12.58 | | | | $12.32 | |
Income from investment operations: | | | | | | | | | | | | | | | | | | | | | | | | |
Net investment income (loss)(a) | | | (0.03 | ) | | | (0.09 | ) | | | (0.08 | ) | | | (0.03 | ) | | | (0.07 | ) | | | (0.06 | ) |
Net realized and unrealized gain (loss) | | | 0.57 | | | | 0.03 | | | | (1.26 | ) | | | (0.19 | ) | | | 1.08 | | | | 0.32 | |
Total from investment operations | | | 0.54 | | | | (0.06 | ) | | | (1.34 | ) | | | (0.22 | ) | | | 1.01 | | | | 0.26 | |
Distributions: | | | | | | | | | | | | | | | | | | | | | | | | |
Dividends from net investment income | | | — | | | | — | | | | — | | | | — | | | | — | | | | — | |
Dividends from net realized gains | | | — | | | | — | | | | (0.30 | ) | | | (0.11 | ) | | | — | | | | — | |
Return of capital | | | — | | | | (0.00 | )* | | | (0.00 | )* | | | — | | | | — | | | | — | |
Total distributions | | | — | | | | — | | | | (0.30 | ) | | | (0.11 | ) | | | — | | | | — | |
Net asset value, end of period | | | $12.10 | | | | $11.56 | | | | $11.62 | | | | $13.26 | | | | $13.59 | | | | $12.58 | |
Ratios and supplemental data: | | | | | | | | | | | | | | | | | | | | | | | | |
Total return(b) | | | 4.67% | | | | (0.52% | ) | | | (10.25% | ) | | | (1.59% | ) | | | 8.03% | | | | 2.11% | |
Net assets, end of period (000) | | | $38 | | | | $101 | | | | $483 | | | | $713 | | | | $1,788 | | | | $1,595 | |
Ratio of net expenses to average net assets | | | 2.46% | (c) | | | 2.41% | | | | 2.40% | | | | 2.35% | | | | 2.38% | | | | 2.34% | |
Ratio of gross expenses to average net assets prior to expense reductions | | | 2.46% | (c) | | | 2.41% | | | | 2.40% | | | | 2.35% | | | | 2.38% | | | | 2.34% | |
Ratio of net investment income (loss) to average net assets | | | (0.62% | )(c) | | | (0.86% | ) | | | (0.60% | ) | | | (0.23% | ) | | | (0.52% | ) | | | (0.46% | ) |
| |
| | | CLASS C | |
| | | (Unaudited)
Six Months
Ended
April 30, | | | Year Ended October 31, | |
| | | 2017 | | | 2016 | | | 2015 | | | 2014 | | | 2013 | | | 2012 | |
Net asset value, beginning of period | | | $11.55 | | | | $11.62 | | | | $13.26 | | | | $13.59 | | | | $12.57 | | | | $12.31 | |
Income from investment operations: | | | | | | | | | | | | | | | | | | | | | | | | |
Net investment income (loss)(a) | | | (0.02 | ) | | | (0.06 | ) | | | (0.07 | ) | | | (0.04 | ) | | | (0.06 | ) | | | (0.05 | ) |
Net realized and unrealized gain (loss) | | | 0.56 | | | | (0.01 | ) | | | (1.27 | ) | | | (0.18 | ) | | | 1.08 | | | | 0.31 | |
Total from investment operations | | | 0.54 | | | | (0.07 | ) | | | (1.34 | ) | | | (0.22 | ) | | | 1.02 | | | | 0.26 | |
Distributions: | | | | | | | | | | | | | | | | | | | | | | | | |
Dividends from net investment income | | | — | | | | — | | | | — | | | | — | | | | — | | | | — | |
Dividends from net realized gains | | | — | | | | — | | | | (0.30 | ) | | | (0.11 | ) | | | — | | | | — | |
Return of capital | | | — | | | | (0.00 | )* | | | (0.00 | )* | | | — | | | | — | | | | — | |
Total distributions | | | — | | | | — | | | | (0.30 | ) | | | (0.11 | ) | | | — | | | | — | |
Net asset value, end of period | | | $12.09 | | | | $11.55 | | | | $11.62 | | | | $13.26 | | | | $13.59 | | | | $12.57 | |
Ratios and supplemental data: | | | | | | | | | | | | | | | | | | | | | | | | |
Total return(b) | | | 4.68% | | | | (0.60% | ) | | | (10.25% | ) | | | (1.59% | ) | | | 8.11% | | | | 2.11% | |
Net assets, end of period (000) | | | $25,715 | | | | $31,231 | | | | $36,532 | | | | $44,611 | | | | $34,022 | | | | $21,527 | |
Ratio of net expenses to average net assets | | | 2.45% | (c) | | | 2.39% | | | | 2.40% | | | | 2.37% | | | | 2.39% | | | | 2.35% | |
Ratio of gross expenses to average net assets prior to expense reductions | | | 2.45% | (c) | | | 2.39% | | | | 2.40% | | | | 2.37% | | | | 2.39% | | | | 2.35% | |
Ratio of net investment income (loss) to average net assets | | | (0.41% | )(c) | | | (0.54% | ) | | | (0.59% | ) | | | (0.33% | ) | | | (0.50% | ) | | | (0.41% | ) |
| * | Amounts are less than $0.005. |
| (a) | Net investment income (loss) allocated based on average shares method. |
| (b) | Total return measures net investment income (loss) and capital gain or loss from portfolio investments assuming reinvestment of dividends and capital gains distributions. Total return is not annualized for periods that are less than a full year, does not reflect the effect of sales charge for Class A shares nor the contingent deferred sales charge for Class B and C shares and does not reflect the deduction of taxes that a shareholder would pay on fund distributions or the redemption of fund shares. |
Calamos Evolving World Growth Fund Financial Highlights
| | | | | | | | | | | | | | | | | | | | | | | | |
| | | CLASS I | |
| | | (Unaudited)
Six Months
Ended
April 30, | | | Year Ended October 31, | |
| | | 2017 | | | 2016 | | | 2015 | | | 2014 | | | 2013 | | | 2012 | |
Net asset value, beginning of period | | | $12.19 | | | | $12.19 | | | | $13.83 | | | | $14.07 | | | | $12.92 | | | | $12.54 | |
Income from investment operations: | | | | | | | | | | | | | | | | | | | | | | | | |
Net investment income (loss)(a) | | | 0.04 | | | | 0.06 | | | | 0.05 | | | | 0.09 | | | | 0.07 | | | | 0.07 | |
Net realized and unrealized gain (loss) | | | 0.59 | | | | (0.01 | ) | | | (1.32 | ) | | | (0.18 | ) | | | 1.11 | | | | 0.32 | |
Total from investment operations | | | 0.63 | | | | 0.05 | | | | (1.27 | ) | | | (0.09 | ) | | | 1.18 | | | | 0.39 | |
Distributions: | | | | | | | | | | | | | | | | | | | | | | | | |
Dividends from net investment income | | | — | | | | (0.05 | ) | | | (0.07 | ) | | | (0.04 | ) | | | (0.03 | ) | | | (0.01 | ) |
Dividends from net realized gains | | | — | | | | — | | | | (0.30 | ) | | | (0.11 | ) | | | — | | | | — | |
Return of capital | | | — | | | | (0.00 | )* | | | (0.00 | )* | | | — | | | | — | | | | — | |
Total distributions | | | — | | | | (0.05 | ) | | | (0.37 | ) | | | (0.15 | ) | | | (0.03 | ) | | | (0.01 | ) |
Net asset value, end of period | | | $12.82 | | | | $12.19 | | | | $12.19 | | | | $13.83 | | | | $14.07 | | | | $12.92 | |
Ratios and supplemental data: | | | | | | | | | | | | | | | | | | | | | | | | |
Total return(b) | | | 5.17% | | | | 0.38% | | | | (9.35% | ) | | | (0.60% | ) | | | 9.16% | | | | 3.11% | |
Net assets, end of period (000) | | | $218,535 | | | | $255,965 | | | | $351,571 | | | | $436,546 | | | | $311,823 | | | | $175,572 | |
Ratio of net expenses to average net assets | | | 1.45% | (c) | | | 1.39% | | | | 1.40% | | | | 1.37% | | | | 1.39% | | | | 1.35% | |
Ratio of gross expenses to average net assets prior to expense reductions | | | 1.45% | (c) | | | 1.39% | | | | 1.40% | | | | 1.37% | | | | 1.39% | | | | 1.35% | |
Ratio of net investment income (loss) to average net assets | | | 0.60% | (c) | | | 0.50% | | | | 0.42% | | | | 0.65% | | | | 0.53% | | | | 0.59% | |
| |
| | | CLASS R | |
| | | (Unaudited)
Six Months
Ended
April 30, | | | Year Ended October 31, | |
| | | 2017 | | | 2016 | | | 2015 | | | 2014 | | | 2013 | | | 2012 | |
Net asset value, beginning of period | | | $11.99 | | | | $12.00 | | | | $13.62 | | | | $13.88 | | | | $12.78 | | | | $12.45 | |
Income from investment operations: | | | | | | | | | | | | | | | | | | | | | | | | |
Net investment income (loss)(a) | | | 0.01 | | | | 0.00 | | | | (0.01 | ) | | | 0.04 | | | | 0.00 | | | | 0.01 | |
Net realized and unrealized gain (loss) | | | 0.58 | | | | (0.01 | ) | | | (1.31 | ) | | | (0.19 | ) | | | 1.10 | | | | 0.32 | |
Total from investment operations | | | 0.59 | | | | (0.01 | ) | | | (1.32 | ) | | | (0.15 | ) | | | 1.10 | | | | 0.33 | |
Distributions: | | | | | | | | | | | | | | | | | | | | | | | | |
Dividends from net investment income | | | — | | | | — | | | | — | | | | — | | | | — | | | | — | |
Dividends from net realized gains | | | — | | | | — | | | | (0.30 | ) | | | (0.11 | ) | | | — | | | | — | |
Return of capital | | | — | | | | (0.00 | ) | | | (0.00 | )* | | | — | | | | — | | | | — | |
Total distributions | | | — | | | | — | | | | (0.30 | ) | | | (0.11 | ) | | | — | | | | — | |
Net asset value, end of period | | | $12.58 | | | | $11.99 | | | | $12.00 | | | | $13.62 | | | | $13.88 | | | | $12.78 | |
Ratios and supplemental data: | | | | | | | | | | | | | | | | | | | | | | | | |
Total return(b) | | | 4.92% | | | | (0.08% | ) | | | (9.83% | ) | | | (1.05% | ) | | | 8.61% | | | | 2.65% | |
Net assets, end of period (000) | | | $2,579 | | | | $2,506 | | | | $1,982 | | | | $1,361 | | | | $1,908 | | | | $1,555 | |
Ratio of net expenses to average net assets | | | 1.95% | (c) | | | 1.89% | | | | 1.91% | | | | 1.86% | | | | 1.88% | | | | 1.84% | |
Ratio of gross expenses to average net assets prior to expense reductions | | | 1.95% | (c) | | | 1.89% | | | | 1.91% | | | | 1.86% | | | | 1.88% | | | | 1.84% | |
Ratio of net investment income (loss) to average net assets | | | 0.13% | (c) | | | (0.01% | ) | | | (0.04% | ) | | | 0.28% | | | | (0.04% | ) | | | 0.05% | |
| * | Amounts are less than $0.005. |
| (a) | Net investment income (loss) allocated based on average shares method. |
| (b) | Total return measures net investment income (loss) and capital gain or loss from portfolio investments assuming reinvestment of dividends and capital gains distributions. Total return is not annualized for periods that are less than a full year, does not reflect the effect of sales charge for Class A shares nor the contingent deferred sales charge for Class B and C shares and does not reflect the deduction of taxes that a shareholder would pay on fund distributions or the redemption of fund shares. |
| | | | |
| 188 | | CALAMOS OPEN-END FAMILY OF FUNDS SEMIANNUAL REPORT | | |
Calamos Evolving World Growth Fund Financial Highlights
| | | | |
| | | CLASS T | |
| | | (Unaudited)
February 28, 2017*
through
April 30, | |
| | | 2017 | |
Net asset value, beginning of period | | | $12.06 | |
Income from investment operations: | | | | |
Net investment income (loss)(a) | | | 0.03 | |
Net realized and unrealized gain (loss) | | | 0.64 | |
Total from investment operations | | | 0.67 | |
Distributions: | | | | |
Dividends from net investment income | | | — | |
Net asset value, end of period | | | $12.73 | |
Ratios and supplemental data: | | | | |
Total return(b) | | | 5.56% | |
Net assets, end of period (000) | | | $26 | |
Ratio of net expenses to average net assets | | | 1.65% | (c) |
Ratio of gross expenses to average net assets prior to expense reductions | | | 1.65% | (c) |
Ratio of net investment income (loss) to average net assets | | | 1.38% | (c) |
| * | Commencement of operations. |
| (a) | Net investment income (loss) allocated based on average shares method. |
| (b) | Total return measures net investment income (loss) and capital gain or loss from portfolio investments assuming reinvestment of dividends and capital gains distributions. Total return is not annualized for periods that are less than a full year, does not reflect the effect of sales charge for Class A shares nor the contingent deferred sales charge for Class B and C shares and does not reflect the deduction of taxes that a shareholder would pay on fund distributions or the redemption of fund shares. |
Calamos Emerging Market Equity Fund Financial Highlights
Selected data for a share outstanding throughout each period were as follows:
| | | | | | | | | | | | | | | | |
| | | CLASS A | |
| | | (Unaudited)
Six Months
Ended
April 30, | | | Year Ended October 31, | | | December 31, 2013*
through
October 31, | |
| | | 2017 | | | 2016 | | | 2015 | | | 2014 | |
Net asset value, beginning of period | | | $8.61 | | | | $8.41 | | | | $9.84 | | | | $10.00 | |
Income from investment operations: | | | | | | | | | | | | | | | | |
Net investment income (loss)(a) | | | (0.01 | ) | | | (0.02 | ) | | | (0.01 | ) | | | 0.02 | |
Net realized and unrealized gain (loss) | | | 0.36 | | | | 0.23 | | | | (1.37 | ) | | | (0.18 | ) |
Total from investment operations | | | 0.35 | | | | 0.21 | | | | (1.38 | ) | | | (0.16 | ) |
Distributions: | | | | | | | | | | | | | | | | |
Dividends from net investment income | | | — | | | | (0.01 | ) | | | (0.05 | ) | | | — | |
Dividends from net realized gains | | | — | | | | — | | | | — | | | | — | |
Total distributions | | | — | | | | (0.01 | ) | | | (0.05 | ) | | | — | |
Net asset value, end of period | | | $8.96 | | | | $8.61 | | | | $8.41 | | | | $9.84 | |
Ratios and supplemental data: | | | | | | | | | | | | | | | | |
Total return(b) | | | 4.07% | | | | 2.49% | | | | (14.09% | ) | | | (1.60% | ) |
Net assets, end of period (000) | | | $4,642 | | | | $4,483 | | | | $4,465 | | | | $5,360 | |
Ratio of net expenses to average net assets | | | 1.75% | (c) | | | 1.67% | | | | 1.75% | | | | 1.75% | (c) |
Ratio of gross expenses to average net assets prior to expense reductions | | | 2.93% | (c) | | | 2.49% | | | | 2.43% | | | | 3.45% | (c) |
Ratio of net investment income (loss) to average net assets | | | (0.34% | )(c) | | | (0.23% | ) | | | (0.14% | ) | | | 0.24% | (c) |
| | | |
| | | (Unaudited)
Six Months
Ended
April 30, | | | Year Ended October 31, | | | December 31, 2013*
through
October 31, | |
| | | 2017 | | | 2016 | | | 2015 | | | 2014 | |
Portfolio turnover rate | | | 54.3% | | | | 74.8% | | | | 68.0% | | | | 109.2% | |
| * | Commencement of operations. |
| (a) | Net investment income (loss) allocated based on average shares method. |
| (b) | Total return measures net investment income (loss) and capital gain or loss from portfolio investments assuming reinvestment of dividends and capital gains distributions. Total return is not annualized for periods that are less than a full year, does not reflect the effect of sales charge for Class A shares nor the contingent deferred sales charge for Class B and C shares and does not reflect the deduction of taxes that a shareholder would pay on fund distributions or the redemption of fund shares. |
| | | | |
| 190 | | CALAMOS OPEN-END FAMILY OF FUNDS SEMIANNUAL REPORT | | |
Calamos Emerging Market Equity Fund Financial Highlights
| | | | | | | | | | | | | | | | |
| | | CLASS C | |
| | | (Unaudited)
Six Months
Ended
April 30, | | | Year Ended October 31, | | | December 31, 2013*
through
October 31, | |
| | | 2017 | | | 2016 | | | 2015 | | | 2014 | |
Net asset value, beginning of period | | | $8.49 | | | | $8.34 | | | | $9.78 | | | | $10.00 | |
Income from investment operations: | | | | | | | | | | | | | | | | |
Net investment income (loss)(a) | | | (0.04 | ) | | | (0.08 | ) | | | (0.07 | ) | | | (0.04 | ) |
Net realized and unrealized gain (loss) | | | 0.35 | | | | 0.23 | | | | (1.37 | ) | | | (0.18 | ) |
Total from investment operations | | | 0.31 | | | | 0.15 | | | | (1.44 | ) | | | (0.22 | ) |
Distributions: | | | | | | | | | | | | | | | | |
Dividends from net investment income | | | — | | | | — | | | | — | | | | — | |
Dividends from net realized gains | | | — | | | | — | | | | — | | | | — | |
Total distributions | | | — | | | | — | | | | — | | | | — | |
Net asset value, end of period | | | $8.80 | | | | $8.49 | | | | $8.34 | | | | $9.78 | |
Ratios and supplemental data: | | | | | | | | | | | | | | | | |
Total return(b) | | | 3.65% | | | | 1.80% | | | | (14.72% | ) | | | (2.20% | ) |
Net assets, end of period (000) | | | $338 | | | | $280 | | | | $241 | | | | $288 | |
Ratio of net expenses to average net assets | | | 2.50% | (c) | | | 2.43% | | | | 2.50% | | | | 2.50% | (c) |
Ratio of gross expenses to average net assets prior to expense reductions | | | 3.68% | (c) | | | 3.24% | | | | 3.22% | | | | 4.08% | (c) |
Ratio of net investment income (loss) to average net assets | | | (1.05% | )(c) | | | (0.98% | ) | | | (0.80% | ) | | | (0.45% | )(c) |
| |
| | | CLASS I | |
| | | (Unaudited)
Six Months
Ended
April 30, | | | Year Ended October 31, | | | December 31, 2013*
through
October 31, | |
| | | 2017 | | | 2016 | | | 2015 | | | 2014 | |
Net asset value, beginning of period | | | $8.62 | | | | $8.43 | | | | $9.86 | | | | $10.00 | |
Income from investment operations: | | | | | | | | | | | | | | | | |
Net investment income (loss)(a) | | | 0.00 | ** | | | 0.00 | ** | | | 0.02 | | | | 0.04 | |
Net realized and unrealized gain (loss) | | | 0.36 | | | | 0.23 | | | | (1.39 | ) | | | (0.18 | ) |
Total from investment operations | | | 0.36 | | | | 0.23 | | | | (1.37 | ) | | | (0.14 | ) |
Distributions: | | | | | | | | | | | | | | | | |
Dividends from net investment income | | | — | | | | (0.04 | ) | | | (0.06 | ) | | | — | |
Dividends from net realized gains | | | — | | | | — | | | | — | | | | — | |
Return of capital | | | — | | | | 0.00 | ** | | | — | | | | — | |
Total distributions | | | — | | | | (0.04 | ) | | | (0.06 | ) | | | — | |
Net asset value, end of period | | | $8.98 | | | | $8.62 | | | | $8.43 | | | | $9.86 | |
Ratios and supplemental data: | | | | | | | | | | | | | | | | |
Total return | | | 4.18% | | | | 2.75% | | | | (13.92% | ) | | | (1.40% | ) |
Net assets, end of period (000)(b) | | | $9,834 | | | | $9,039 | | | | $8,763 | | | | $9,701 | |
Ratio of net expenses to average net assets | | | 1.50% | (c) | | | 1.42% | | | | 1.50% | | | | 1.50% | (c) |
Ratio of gross expenses to average net assets prior to expense reductions | | | 2.68% | (c) | | | 2.24% | | | | 2.23% | | | | 3.04% | (c) |
Ratio of net investment income (loss) to average net assets | | | (0.08% | )(c) | | | 0.02% | | | | 0.21% | | | | 0.50% | (c) |
| * | Commencement of operations. |
| ** | Amounts are less than $0.005. |
| (a) | Net investment income (loss) allocated based on average shares method. |
| (b) | Total return measures net investment income (loss) and capital gain or loss from portfolio investments assuming reinvestment of dividends and capital gains distributions. Total return is not annualized for periods that are less than a full year, does not reflect the effect of sales charge for Class A shares nor the contingent deferred sales charge for Class B and C shares and does not reflect the deduction of taxes that a shareholder would pay on fund distributions or the redemption of fund shares. |
Calamos Emerging Market Equity Fund Financial Highlights
| | | | |
| | | CLASS T | |
| | | (Unaudited)
February 28, 2017*
through
April 30, | |
| | | 2017 | |
Net asset value, beginning of period | | | $8.51 | |
Income from investment operations: | | | | |
Net investment income (loss)(a) | | | — | ** |
Net realized and unrealized gain (loss) | | | 0.45 | |
Total from investment operations | | | 0.45 | |
Distributions: | | | | |
Dividends from net investment income | | | — | |
Net asset value, end of period | | | $8.96 | |
Ratios and supplemental data: | | | | |
Total return(b) | | | 5.29% | |
Net assets, end of period (000) | | | $26 | |
Ratio of net expenses to average net assets | | | 1.75% | (c) |
Ratio of gross expenses to average net assets prior to expense reductions | | | 3.12% | (c) |
Ratio of net investment income (loss) to average net assets | | | 0.05% | (c) |
| * | Commencement of operations. |
| ** | Amounts are less than $0.005. |
| (a) | Net investment income (loss) allocated based on average shares method. |
| (b) | Total return measures net investment income (loss) and capital gain or loss from portfolio investments assuming reinvestment of dividends and capital gains distributions. Total return is not annualized for periods that are less than a full year, does not reflect the effect of sales charge for Class A shares nor the contingent deferred sales charge for Class B and C shares and does not reflect the deduction of taxes that a shareholder would pay on fund distributions or the redemption of fund shares. |
| | | | |
| 192 | | CALAMOS OPEN-END FAMILY OF FUNDS SEMIANNUAL REPORT | | |
Calamos Global Equity Fund Financial Highlights
Selected data for a share outstanding throughout each period were as follows:
| | | | | | | | | | | | | | | | | | | | | | | | |
| | | CLASS A | |
| | | (Unaudited)
Six Months
Ended
April 30, | | | Year Ended October 31, | |
| | | 2017 | | | 2016 | | | 2015 | | | 2014 | | | 2013 | | | 2012 | |
Net asset value, beginning of period | | | $12.74 | | | | $13.19 | | | | $15.67 | | | | $14.97 | | | | $13.00 | | | | $12.14 | |
Income from investment operations: | | | | | | | | | | | | | | | | | | | | | | | | |
Net investment income (loss)(a) | | | 0.00 | * | | | 0.01 | | | | 0.00 | * | | | (0.01 | ) | | | 0.03 | | | | (0.02 | ) |
Net realized and unrealized gain (loss) | | | 1.25 | | | | (0.21 | ) | | | 0.62 | | | | 1.08 | | | | 1.96 | | | | 0.88 | |
Total from investment operations | | | 1.25 | | | | (0.20 | ) | | | 0.62 | | | | 1.07 | | | | 1.99 | | | | 0.86 | |
Distributions: | | | | | | | | | | | | | | | | | | | | | | | | |
Dividends from net investment income | | | — | | | | — | | | | — | | | | (0.10 | ) | | | (0.02 | ) | | | — | |
Dividends from net realized gains | | | (0.56 | ) | | | (0.25 | ) | | | (3.10 | ) | | | (0.27 | ) | | | — | | | | — | |
Total distributions | | | (0.56 | ) | | | (0.25 | ) | | | (3.10 | ) | | | (0.37 | ) | | | (0.02 | ) | | | — | |
Net asset value, end of period | | | $13.43 | | | | $12.74 | | | | $13.19 | | | | $15.67 | | | | $14.97 | | | | $13.00 | |
Ratios and supplemental data: | | | | | | | | | | | | | | | | | | | | | | | | |
Total return(b) | | | 10.34% | | | | (1.47% | ) | | | 5.33% | | | | 7.25% | | | | 15.35% | | | | 7.08% | |
Net assets, end of period (000) | | | $24,299 | | | | $29,314 | | | | $67,141 | | | | $87,989 | | | | $152,068 | | | | $113,260 | |
Ratio of net expenses to average net assets | | | 1.37% | (c) | | | 1.38% | | | | 1.34% | | | | 1.40% | | | | 1.40% | | | | 1.40% | |
Ratio of gross expenses to average net assets prior to expense reductions | | | 1.48% | (c) | | | 1.50% | | | | 1.34% | | | | 1.40% | | | | 1.44% | | | | 1.52% | |
Ratio of net investment income (loss) to average net assets | | | (0.05% | )(c) | | | 0.06% | | | | 0.00% | ** | | | (0.10% | ) | | | 0.22% | | | | (0.14% | ) |
| | |
| | | (Unaudited)
Six Months
Ended
April 30, | | | Year Ended October 31, | |
| | | 2017 | | | 2016 | | | 2015 | | | 2014 | | | 2013 | | | 2012 | |
Portfolio turnover rate | | | 54.4% | | | | 64.6% | | | | 43.0% | | | | 53.3% | | | | 75.3% | | | | 44.5% | |
| * | Amounts are less than $0.005. |
| ** | Amounts are less than 0.005%. |
| (a) | Net investment income (loss) allocated based on average shares method. |
| (b) | Total return measures net investment income (loss) and capital gain or loss from portfolio investments assuming reinvestment of dividends and capital gains distributions. Total return is not annualized for periods that are less than a full year, does not reflect the effect of sales charge for Class A shares nor the contingent deferred sales charge for Class B and C shares and does not reflect the deduction of taxes that a shareholder would pay on fund distributions or the redemption of fund shares. |
Calamos Global Equity Fund Financial Highlights
| | | | | | | | | | | | | | | | | | | | | | | | |
| | | CLASS B | |
| | | (Unaudited)
Six Months
Ended
April 30, | | | Year Ended October 31, | |
| | | 2017 | | | 2016 | | | 2015 | | | 2014 | | | 2013 | | | 2012 | |
Net asset value, beginning of period | | | $11.89 | | | | $12.42 | | | | $15.03 | | | | $14.38 | | | | $12.56 | | | | $11.82 | |
Income from investment operations: | | | | | | | | | | | | | | | | | | | | | | | | |
Net investment income (loss)(a) | | | (0.05 | ) | | | (0.09 | ) | | | (0.10 | ) | | | (0.12 | ) | | | (0.07 | ) | | | (0.11 | ) |
Net realized and unrealized gain (loss) | | | 1.17 | | | | (0.19 | ) | | | 0.59 | | | | 1.04 | | | | 1.89 | | | | 0.85 | |
Total from investment operations | | | 1.12 | | | | (0.28 | ) | | | 0.49 | | | | 0.92 | | | | 1.82 | | | | 0.74 | |
Distributions: | | | | | | | | | | | | | | | | | | | | | | | | |
Dividends from net investment income | | | — | | | | — | | | | — | | | | — | | | | — | | | | — | |
Dividends from net realized gains | | | (0.56 | ) | | | (0.25 | ) | | | (3.10 | ) | | | (0.27 | ) | | | — | | | | — | |
Total distributions | | | (0.56 | ) | | | (0.25 | ) | | | (3.10 | ) | | | (0.27 | ) | | | — | | | | — | |
Net asset value, end of period | | | $12.45 | | | | $11.89 | | | | $12.42 | | | | $15.03 | | | | $14.38 | | | | $12.56 | |
Ratios and supplemental data: | | | | | | | | | | | | | | | | | | | | | | | | |
Total return(b) | | | 9.97% | | | | (2.22% | ) | | | 4.54% | | | | 6.49% | | | | 14.49% | | | | 6.26% | |
Net assets, end of period (000) | | | $80 | | | | $169 | | | | $490 | | | | $1,171 | | | | $2,751 | | | | $2,519 | |
Ratio of net expenses to average net assets | | | 2.12% | (c) | | | 2.14% | | | | 2.09% | | | | 2.16% | | | | 2.15% | | | | 2.15% | |
Ratio of gross expenses to average net assets prior to expense reductions | | | 2.23% | (c) | | | 2.26% | | | | 2.09% | | | | 2.16% | | | | 2.19% | | | | 2.28% | |
Ratio of net investment income (loss) to average net assets | | | (0.85% | )(c) | | | (0.77% | ) | | | (0.76% | ) | | | (0.81% | ) | | | (0.53% | ) | | | (0.90% | ) |
| |
| | | CLASS C | |
| | | (Unaudited)
Six Months
Ended
April 30, | | | Year Ended October 31, | | | | |
| | | 2017 | | | 2016 | | | 2015 | | | 2014 | | | 2013 | | | 2012 | |
Net asset value, beginning of period | | | $11.86 | | | | $12.39 | | | | $15.00 | | | | $14.36 | | | | $12.54 | | | | $11.80 | |
Income from investment operations: | | | | | | | | | | | | | | | | | | | | | | | | |
Net investment income (loss)(a) | | | (0.05 | ) | | | (0.08 | ) | | | (0.09 | ) | | | (0.12 | ) | | | (0.07 | ) | | | (0.11 | ) |
Net realized and unrealized gain (loss) | | | 1.17 | | | | (0.20 | ) | | | 0.58 | | | | 1.03 | | | | 1.89 | | | | 0.85 | |
Total from investment operations | | | 1.12 | | | | (0.28 | ) | | | 0.49 | | | | 0.91 | | | | 1.82 | | | | 0.74 | |
Distributions: | | | | | | | | | | | | | | | | | | | | | | | | |
Dividends from net investment income | | | — | | | | — | | | | — | | | | — | | | | — | | | | — | |
Dividends from net realized gains | | | (0.56 | ) | | | (0.25 | ) | | | (3.10 | ) | | | (0.27 | ) | | | — | | | | — | |
Total distributions | | | (0.56 | ) | | | (0.25 | ) | | | (3.10 | ) | | | (0.27 | ) | | | — | | | | — | |
Net asset value, end of period | | | $12.42 | | | | $11.86 | | | | $12.39 | | | | $15.00 | | | | $14.36 | | | | $12.54 | |
Ratios and supplemental data: | | | | | | | | | | | | | | | | | | | | | | | | |
Total return(b) | | | 10.00% | | | | (2.23% | ) | | | 4.55% | | | | 6.43% | | | | 14.51% | | | | 6.27% | |
Net assets, end of period (000) | | | $13,965 | | | | $16,375 | | | | $21,227 | | | | $28,811 | | | | $32,975 | | | | $25,749 | |
Ratio of net expenses to average net assets | | | 2.12% | (c) | | | 2.13% | | | | 2.09% | | | | 2.14% | | | | 2.15% | | | | 2.15% | |
Ratio of gross expenses to average net assets prior to expense reductions | | | 2.23% | (c) | | | 2.25% | | | | 2.09% | | | | 2.14% | | | | 2.19% | | | | 2.27% | |
Ratio of net investment income (loss) to average net assets | | | (0.80% | )(c) | | | (0.68% | ) | | | (0.76% | ) | | | (0.82% | ) | | | (0.51% | ) | | | (0.89% | ) |
| (a) | Net investment income (loss) allocated based on average shares method. |
| (b) | Total return measures net investment income (loss) and capital gain or loss from portfolio investments assuming reinvestment of dividends and capital gains distributions. Total return is not annualized for periods that are less than a full year, does not reflect the effect of sales charge for Class A shares nor the contingent deferred sales charge for Class B and C shares and does not reflect the deduction of taxes that a shareholder would pay on fund distributions or the redemption of fund shares. |
| | | | |
| 194 | | CALAMOS OPEN-END FAMILY OF FUNDS SEMIANNUAL REPORT | | |
Calamos Global Equity Fund Financial Highlights
| | | | | | | | | | | | | | | | | | | | | | | | |
| | | CLASS I | |
| | | (Unaudited)
Six Months
Ended
April 30, | | | Year Ended October 31, | |
| | | 2017 | | | 2016 | | | 2015 | | | 2014 | | | 2013 | | | 2012 | |
Net asset value, beginning of period | | | $12.95 | | | | $13.38 | | | | $15.81 | | | | $15.11 | | | | $13.11 | | | | $12.22 | |
Income from investment operations: | | | | | | | | | | | | | | | | | | | | | | | | |
Net investment income (loss)(a) | | | 0.01 | | | | 0.04 | | | | 0.04 | | | | 0.02 | | | | 0.06 | | | | 0.02 | |
Net realized and unrealized gain (loss) | | | 1.29 | | | | (0.22 | ) | | | 0.63 | | | | 1.09 | | | | 1.99 | | | | 0.87 | |
Total from investment operations | | | 1.30 | | | | (0.18 | ) | | | 0.67 | | | | 1.11 | | | | 2.05 | | | | 0.89 | |
Distributions: | | | | | | | | | | | | | | | | | | | | | | | | |
Dividends from net investment income | | | — | | | | — | | | | — | | | | (0.14 | ) | | | (0.05 | ) | | | — | |
Dividends from net realized gains | | | (0.56 | ) | | | (0.25 | ) | | | (3.10 | ) | | | (0.27 | ) | | | — | | | | — | |
Total distributions | | | (0.56 | ) | | | (0.25 | ) | | | (3.10 | ) | | | (0.41 | ) | | | (0.05 | ) | | | — | |
Net asset value, end of period | | | $13.69 | | | | $12.95 | | | | $13.38 | | | | $15.81 | | | | $15.11 | | | | $13.11 | |
Ratios and supplemental data: | | | | | | | | | | | | | | | | | | | | | | | | |
Total return(b) | | | 10.56% | | | | (1.30% | ) | | | 5.64% | | | | 7.48% | | | | 15.65% | | | | 7.28% | |
Net assets, end of period (000) | | | $77,301 | | | | $87,605 | | | | $96,390 | | | | $101,511 | | | | $212,913 | | | | $220,364 | |
Ratio of net expenses to average net assets | | | 1.12% | (c) | | | 1.13% | | | | 1.09% | | | | 1.15% | | | | 1.15% | | | | 1.15% | |
Ratio of gross expenses to average net assets prior to expense reductions | | | 1.23% | (c) | | | 1.25% | | | | 1.09% | | | | 1.15% | | | | 1.19% | | | | 1.27% | |
Ratio of net investment income (loss) to average net assets | | | 0.20% | (c) | | | 0.33% | | | | 0.26% | | | | 0.15% | | | | 0.46% | | | | 0.13% | |
| |
| | | CLASS R | |
| | | (Unaudited)
Six Months
Ended
April 30, | | | Year Ended October 31, | | | | |
| | | 2017 | | | 2016 | | | 2015 | | | 2014 | | | 2013 | | | 2012 | |
Net asset value, beginning of period | | | $12.41 | | | | $12.89 | | | | $15.42 | | | | $14.75 | | | | $12.83 | | | | $12.02 | |
Income from investment operations: | | | | | | | | | | | | | | | | | | | | | | | | |
Net investment income (loss)(a) | | | (0.02 | ) | | | (0.02 | ) | | | (0.03 | ) | | | (0.04 | ) | | | 0.00 | * | | | (0.06 | ) |
Net realized and unrealized gain (loss) | | | 1.23 | | | | (0.21 | ) | | | 0.60 | | | | 1.05 | | | | 1.93 | | | | 0.87 | |
Total from investment operations | | | 1.21 | | | | (0.23 | ) | | | 0.57 | | | | 1.01 | | | | 1.93 | | | | 0.81 | |
Distributions: | | | | | | | | | | | | | | | | | | | | | | | | |
Dividends from net investment income | | | — | | | | — | | | | — | | | | (0.07 | ) | | | (0.01 | ) | | | — | |
Dividends from net realized gains | | | (0.56 | ) | | | (0.25 | ) | | | (3.10 | ) | | | (0.27 | ) | | | — | | | | — | |
Total distributions | | | (0.56 | ) | | | (0.25 | ) | | | (3.10 | ) | | | (0.34 | ) | | | (0.01 | ) | | | — | |
Net asset value, end of period | | | $13.06 | | | | $12.41 | | | | $12.89 | | | | $15.42 | | | | $14.75 | | | | $12.83 | |
Ratios and supplemental data: | | | | | | | | | | | | | | | | | | | | | | | | |
Total return(b) | | | 10.29% | | | | (1.74% | ) | | | 5.03% | | | | 6.97% | | | | 15.07% | | | | 6.74% | |
Net assets, end of period (000) | | | $4,129 | | | | $4,315 | | | | $7,142 | | | | $8,314 | | | | $9,369 | | | | $4,693 | |
Ratio of net expenses to average net assets | | | 1.62% | (c) | | | 1.63% | | | | 1.59% | | | | 1.64% | | | | 1.65% | | | | 1.65% | |
Ratio of gross expenses to average net assets prior to expense reductions | | | 1.73% | (c) | | | 1.75% | | | | 1.59% | | | | 1.64% | | | | 1.69% | | | | 1.78% | |
Ratio of net investment income (loss) to average net assets | | | (0.30% | )(c) | | | (0.19% | ) | | | (0.25% | ) | | | (0.29% | ) | | | 0.00% | | | | (0.45% | ) |
| * | Amounts are less than $0.005. |
| (a) | Net investment income (loss) allocated based on average shares method. |
| (b) | Total return measures net investment income (loss) and capital gain or loss from portfolio investments assuming reinvestment of dividends and capital gains distributions. Total return is not annualized for periods that are less than a full year, does not reflect the effect of sales charge for Class A shares nor the contingent deferred sales charge for Class B and C shares and does not reflect the deduction of taxes that a shareholder would pay on fund distributions or the redemption of fund shares. |
Calamos Global Equity Fund Financial Highlights
| | | | |
| | | CLASS T | |
| | | (Unaudited)
February 28, 2017*
through
April 30, | |
| | | 2017 | |
Net asset value, beginning of period | | | $12.80 | |
Income from investment operations: | | | | |
Net investment income (loss)(a) | | | 0.01 | |
Net realized and unrealized gain (loss) | | | 0.62 | |
Total from investment operations | | | 0.63 | |
Distributions: | | | | |
Dividends from net investment income | | | — | |
Net asset value, end of period | | | $13.43 | |
Ratios and supplemental data: | | | | |
Total return(b) | | | 4.92% | |
Net assets, end of period (000) | | | $26 | |
Ratio of net expenses to average net assets | | | 1.34% | (c) |
Ratio of gross expenses to average net assets prior to expense reductions | | | 1.46% | (c) |
Ratio of net investment income (loss) to average net assets | | | 0.65% | (c) |
| * | Commencement of operations. |
| (a) | Net investment income (loss) allocated based on average shares method. |
| (b) | Total return measures net investment income (loss) and capital gain or loss from portfolio investments assuming reinvestment of dividends and capital gains distributions. Total return is not annualized for periods that are less than a full year, does not reflect the effect of sales charge for Class A shares nor the contingent deferred sales charge for Class B and C shares and does not reflect the deduction of taxes that a shareholder would pay on fund distributions or the redemption of fund shares. |
| | | | |
| 196 | | CALAMOS OPEN-END FAMILY OF FUNDS SEMIANNUAL REPORT | | |
Calamos Growth and Income Fund Financial Highlights
Selected data for a share outstanding throughout each period were as follows:
| | | | | | | | | | | | | | | | | | | | | | | | |
| | | CLASS A | |
| | | (Unaudited)
Six Months
Ended
April 30, | | | Year Ended October 31, | |
| | | 2017 | | | 2016 | | | 2015 | | | 2014 | | | 2013 | | | 2012 | |
Net asset value, beginning of period | | | $30.17 | | | | $31.68 | | | | $35.22 | | | | $35.84 | | | | $32.64 | | | | $32.12 | |
Income from investment operations: | | | | | | | | | | | | | | | | | | | | | | | | |
Net investment income (loss)(a) | | | 0.24 | | | | 0.48 | | | | 0.60 | | | | 0.60 | | | | 0.64 | | | | 0.52 | |
Net realized and unrealized gain (loss) | | | 2.62 | | | | 0.16 | | | | 0.51 | | | | 2.78 | | | | 3.70 | | | | 0.66 | |
Total from investment operations | | | 2.86 | | | | 0.64 | | | | 1.11 | | | | 3.38 | | | | 4.34 | | | | 1.18 | |
Distributions: | | | | | | | | | | | | | | | | | | | | | | | | |
Dividends from net investment income | | | (0.58 | ) | | | (0.84 | ) | | | (0.89 | ) | | | (0.80 | ) | | | (0.27 | ) | | | (0.66 | ) |
Dividends from net realized gains | | | (1.20 | ) | | | (1.31 | ) | | | (3.76 | ) | | | (3.20 | ) | | | (0.87 | ) | | | — | |
Total distributions | | | (1.78 | ) | | | (2.15 | ) | | | (4.65 | ) | | | (4.00 | ) | | | (1.14 | ) | | | (0.66 | ) |
Net asset value, end of period | | | $31.25 | | | | $30.17 | | | | $31.68 | | | | $35.22 | | | | $35.84 | | | | $32.64 | |
Ratios and supplemental data: | | | | | | | | | | | | | | | | | | | | | | | | |
Total return(b) | | | 9.78% | | | | 2.26% | | | | 3.50% | | | | 10.33% | | | | 13.72% | | | | 3.73% | |
Net assets, end of period (000) | | | $875,703 | | | | $930,625 | | | | $1,105,102 | | | | $1,316,498 | | | | $1,614,236 | | | | $1,974,535 | |
Ratio of net expenses to average net assets | | | 1.12% | (c) | | | 1.11% | | | | 1.10% | | | | 1.09% | | | | 1.09% | | | | 1.09% | |
Ratio of gross expenses to average net assets prior to expense reductions | | | 1.12% | (c) | | | 1.11% | | | | 1.10% | | | | 1.09% | | | | 1.09% | | | | 1.09% | |
Ratio of net investment income (loss) to average net assets | | | 1.60% | (c) | | | 1.59% | | | | 1.86% | | | | 1.76% | | | | 1.92% | | | | 1.62% | |
| | |
| | | (Unaudited)
Six Months
Ended
April 30, | | | Year Ended October 31, | |
| | | 2017 | | | 2016 | | | 2015 | | | 2014 | | | 2013 | | | 2012 | |
Portfolio turnover rate | | | 11.5% | | | | 23.5% | | | | 23.8% | | | | 32.8% | | | | 59.5% | | | | 42.8% | |
| (a) | Net investment income (loss) allocated based on average shares method. |
| (b) | Total return measures net investment income (loss) and capital gain or loss from portfolio investments assuming reinvestment of dividends and capital gains distributions. Total return is not annualized for periods that are less than a full year, does not reflect the effect of sales charge for Class A shares nor the contingent deferred sales charge for Class B and C shares and does not reflect the deduction of taxes that a shareholder would pay on fund distributions or the redemption of fund shares. |
Calamos Growth and Income Fund Financial Highlights
| | | | | | | | | | | | | | | | | | | | | | | | |
| | | CLASS B | |
| | | (Unaudited)
Six Months
Ended
April 30, | | | Year Ended October 31, | |
| | | 2017 | | | 2016 | | | 2015 | | | 2014 | | | 2013 | | | 2012 | |
Net asset value, beginning of period | | | $36.44 | | | | $37.76 | | | | $41.04 | | | | $41.04 | | | | $37.26 | | | | $36.47 | |
Income from investment operations: | | | | | | | | | | | | | | | | | | | | | | | | |
Net investment income (loss)(a) | | | 0.17 | | | | 0.35 | | | | 0.42 | | | | 0.54 | | | | 0.70 | | | | 0.36 | |
Net realized and unrealized gain (loss) | | | 3.15 | | | | 0.14 | | | | 0.61 | | | | 3.21 | | | | 4.23 | | | | 0.77 | |
Total from investment operations | | | 3.32 | | | | 0.49 | | | | 1.03 | | | | 3.75 | | | | 4.93 | | | | 1.13 | |
Distributions: | | | | | | | | | | | | | | | | | | | | | | | | |
Dividends from net investment income | | | (0.39 | ) | | | (0.50 | ) | | | (0.55 | ) | | | (0.55 | ) | | | (0.28 | ) | | | (0.34 | ) |
Dividends from net realized gains | | | (1.20 | ) | | | (1.31 | ) | | | (3.76 | ) | | | (3.20 | ) | | | (0.87 | ) | | | — | |
Total distributions | | | (1.59 | ) | | | (1.81 | ) | | | (4.31 | ) | | | (3.75 | ) | | | (1.15 | ) | | | (0.34 | ) |
Net asset value, end of period | | | $38.17 | | | | $36.44 | | | | $37.76 | | | | $41.04 | | | | $41.04 | | | | $37.26 | |
Ratios and supplemental data: | | | | | | | | | | | | | | | | | | | | | | | | |
Total return(b) | | | 9.33% | | | | 1.43% | | | | 2.72% | | | | 9.88% | | | | 13.59% | | | | 3.12% | |
Net assets, end of period (000) | | | $1,611 | | | | $3,516 | | | | $9,647 | | | | $19,972 | | | | $49,769 | | | | $92,658 | |
Ratio of net expenses to average net assets | | | 1.87% | (c) | | | 1.86% | | | | 1.85% | | | | 1.44% | | | | 1.18% | | | | 1.73% | |
Ratio of gross expenses to average net assets prior to expense reductions | | | 1.87% | (c) | | | 1.86% | | | | 1.85% | | | | 1.44% | | | | 1.18% | | | | 1.73% | |
Ratio of net investment income (loss) to average net assets | | | 0.94% | (c) | | | 0.98% | | | | 1.09% | | | | 1.37% | | | | 1.85% | | | | 0.97% | |
| |
| | | CLASS C | |
| | | (Unaudited)
Six Months
Ended
April 30, | | | Year Ended October 31, | |
| | | 2017 | | | 2016 | | | 2015 | | | 2014 | | | 2013 | | | 2012 | |
Net asset value, beginning of period | | | $30.28 | | | | $31.81 | | | | $35.34 | | | | $35.78 | | | | $32.76 | | | | $32.23 | |
Income from investment operations: | | | | | | | | | | | | | | | | | | | | | | | | |
Net investment income (loss)(a) | | | 0.13 | | | | 0.25 | | | | 0.36 | | | | 0.35 | | | | 0.39 | | | | 0.28 | |
Net realized and unrealized gain (loss) | | | 2.64 | | | | 0.14 | | | | 0.51 | | | | 2.77 | | | | 3.71 | | | | 0.67 | |
Total from investment operations | | | 2.77 | | | | 0.39 | | | | 0.87 | | | | 3.12 | | | | 4.10 | | | | 0.95 | |
Distributions: | | | | | | | | | | | | | | | | | | | | | | | | |
Dividends from net investment income | | | (0.47 | ) | | | (0.61 | ) | | | (0.64 | ) | | | (0.36 | ) | | | (0.21 | ) | | | (0.42 | ) |
Dividends from net realized gains | | | (1.20 | ) | | | (1.31 | ) | | | (3.76 | ) | | | (3.20 | ) | | | (0.87 | ) | | | — | |
Total distributions | | | (1.67 | ) | | | (1.92 | ) | | | (4.40 | ) | | | (3.56 | ) | | | (1.08 | ) | | | (0.42 | ) |
Net asset value, end of period | | | $31.38 | | | | $30.28 | | | | $31.81 | | | | $35.34 | | | | $35.78 | | | | $32.76 | |
Ratios and supplemental data: | | | | | | | | | | | | | | | | | | | | | | | | |
Total return(b) | | | 9.39% | | | | 1.39% | | | | 2.73% | | | | 9.48% | | | | 12.88% | | | | 2.97% | |
Net assets, end of period (000) | | | $679,045 | | | | $739,780 | | | | $889,516 | | | | $1,009,029 | | | | $1,093,074 | | | | $1,255,629 | |
Ratio of net expenses to average net assets | | | 1.87% | (c) | | | 1.86% | | | | 1.85% | | | | 1.84% | | | | 1.84% | | | | 1.84% | |
Ratio of gross expenses to average net assets prior to expense reductions | | | 1.87% | (c) | | | 1.86% | | | | 1.85% | | | | 1.84% | | | | 1.84% | | | | 1.84% | |
Ratio of net investment income (loss) to average net assets | | | 0.86% | (c) | | | 0.84% | | | | 1.11% | | | | 1.02% | | | | 1.17% | | | | 0.87% | |
| (a) | Net investment income (loss) allocated based on average shares method. |
| (b) | Total return measures net investment income (loss) and capital gain or loss from portfolio investments assuming reinvestment of dividends and capital gains distributions. Total return is not annualized for periods that are less than a full year, does not reflect the effect of sales charge for Class A shares nor the contingent deferred sales charge for Class B and C shares and does not reflect the deduction of taxes that a shareholder would pay on fund distributions or the redemption of fund shares. |
| | | | |
| 198 | | CALAMOS OPEN-END FAMILY OF FUNDS SEMIANNUAL REPORT | | |
Calamos Growth and Income Fund Financial Highlights
| | | | | | | | | | | | | | | | | | | | | | | | |
| | | CLASS I | |
| | | (Unaudited)
Six Months
Ended
April 30, | | | Year Ended October 31, | |
| | | 2017 | | | 2016 | | | 2015 | | | 2014 | | | 2013 | | | 2012 | |
Net asset value, beginning of period | | | $29.15 | | | | $30.71 | | | | $34.28 | | | | $35.07 | | | | $31.91 | | | | $31.41 | |
Income from investment operations: | | | | | | | | | | | | | | | | | | | | | | | | |
Net investment income (loss)(a) | | | 0.27 | | | | 0.53 | | | | 0.66 | | | | 0.68 | | | | 0.71 | | | | 0.59 | |
Net realized and unrealized gain (loss) | | | 2.54 | | | | 0.14 | | | | 0.50 | | | | 2.69 | | | | 3.62 | | | | 0.65 | |
Total from investment operations | | | 2.81 | | | | 0.67 | | | | 1.16 | | | | 3.37 | | | | 4.33 | | | | 1.24 | |
Distributions: | | | | | | | | | | | | | | | | | | | | | | | | |
Dividends from net investment income | | | (0.62 | ) | | | (0.92 | ) | | | (0.97 | ) | | | (0.96 | ) | | | (0.30 | ) | | | (0.74 | ) |
Dividends from net realized gains | | | (1.20 | ) | | | (1.31 | ) | | | (3.76 | ) | | | (3.20 | ) | | | (0.87 | ) | | | — | |
Total distributions | | | (1.82 | ) | | | (2.23 | ) | | | (4.73 | ) | | | (4.16 | ) | | | (1.17 | ) | | | (0.74 | ) |
Net asset value, end of period | | | $30.14 | | | | $29.15 | | | | $30.71 | | | | $34.28 | | | | $35.07 | | | | $31.91 | |
Ratios and supplemental data: | | | | | | | | | | | | | | | | | | | | | | | | |
Total return(b) | | | 9.95% | | | | 2.43% | | | | 3.79% | | | | 10.60% | | | | 13.99% | | | | 4.01% | |
Net assets, end of period (000) | | | $514,979 | | | | $513,604 | | | | $577,449 | | | | $688,258 | | | | $668,124 | | | | $915,394 | |
Ratio of net expenses to average net assets | | | 0.87% | (c) | | | 0.86% | | | | 0.85% | | | | 0.84% | | | | 0.84% | | | | 0.84% | |
Ratio of gross expenses to average net assets prior to expense reductions | | | 0.87% | (c) | | | 0.86% | | | | 0.85% | | | | 0.84% | | | | 0.84% | | | | 0.84% | |
Ratio of net investment income (loss) to average net assets | | | 1.86% | (c) | | | 1.84% | | | | 2.11% | | | | 2.04% | | | | 2.18% | | | | 1.87% | |
| |
| | | CLASS R | |
| | | (Unaudited)
Six Months
Ended
April 30, | | | Year Ended October 31, | | | | |
| | | 2017 | | | 2016 | | | 2015 | | | 2014 | | | 2013 | | | 2012 | |
Net asset value, beginning of period | | | $29.94 | | | | $31.45 | | | | $34.99 | | | | $35.57 | | | | $32.46 | | | | $31.95 | |
Income from investment operations: | | | | | | | | | | | | | | | | | | | | | | | | |
Net investment income (loss)(a) | | | 0.20 | | | | 0.39 | | | | 0.51 | | | | 0.51 | | | | 0.55 | | | | 0.44 | |
Net realized and unrealized gain (loss) | | | 2.62 | | | | 0.18 | | | | 0.52 | | | | 2.75 | | | | 3.69 | | | | 0.66 | |
Total from investment operations | | | 2.82 | | | | 0.57 | | | | 1.03 | | | | 3.26 | | | | 4.24 | | | | 1.10 | |
Distributions: | | | | | | | | | | | | | | | | | | | | | | | | |
Dividends from net investment income | | | (0.55 | ) | | | (0.77 | ) | | | (0.81 | ) | | | (0.64 | ) | | | (0.26 | ) | | | (0.59 | ) |
Dividends from net realized gains | | | (1.20 | ) | | | (1.31 | ) | | | (3.76 | ) | | | (3.20 | ) | | | (0.87 | ) | | | — | |
Total distributions | | | (1.75 | ) | | | (2.08 | ) | | | (4.57 | ) | | | (3.84 | ) | | | (1.13 | ) | | | (0.59 | ) |
Net asset value, end of period | | | $31.01 | | | | $29.94 | | | | $31.45 | | | | $34.99 | | | | $35.57 | | | | $32.46 | |
Ratios and supplemental data: | | | | | | | | | | | | | | | | | | | | | | | | |
Total return(b) | | | 9.69% | | | | 2.01% | | | | 3.26% | | | | 10.04% | | | | 13.44% | | | | 3.49% | |
Net assets, end of period (000) | | | $12,708 | | | | $13,262 | | | | $15,307 | | | | $18,547 | | | | $22,181 | | | | $22,265 | |
Ratio of net expenses to average net assets | | | 1.37% | (c) | | | 1.36% | | | | 1.35% | | | | 1.34% | | | | 1.34% | | | | 1.34% | |
Ratio of gross expenses to average net assets prior to expense reductions | | | 1.37% | (c) | | | 1.36% | | | | 1.35% | | | | 1.34% | | | | 1.34% | | | | 1.34% | |
Ratio of net investment income (loss) to average net assets | | | 1.35% | (c) | | | 1.32% | | | | 1.61% | | | | 1.52% | | | | 1.66% | | | | 1.37% | |
| (a) | Net investment income (loss) allocated based on average shares method. |
| (b) | Total return measures net investment income (loss) and capital gain or loss from portfolio investments assuming reinvestment of dividends and capital gains distributions. Total return is not annualized for periods that are less than a full year, does not reflect the effect of sales charge for Class A shares nor the contingent deferred sales charge for Class B and C shares and does not reflect the deduction of taxes that a shareholder would pay on fund distributions or the redemption of fund shares. |
Calamos Growth and Income Fund Financial Highlights
| | | | |
| | | CLASS T | |
| | | (Unaudited)
February 28, 2017*
through
April 30, | |
| | | 2017 | |
Net asset value, beginning of period | | | $31.05 | |
Income from investment operations: | | | | |
Net investment income (loss)(a) | | | 0.05 | |
Net realized and unrealized gain (loss) | | | 1.52 | |
Total from investment operations | | | 1.57 | |
Distributions: | | | | |
Dividends from net investment income | | | (0.18 | ) |
Dividends from net realized gains | | | (1.20 | ) |
Total distributions | | | (1.38 | ) |
Net asset value, end of period | | | $31.24 | |
Ratios and supplemental data: | | | | |
Total return(b) | | | 1.19% | |
Net assets, end of period (000) | | | $25 | |
Ratio of net expenses to average net assets | | | 1.11% | (c) |
Ratio of gross expenses to average net assets prior to expense reductions | | | 1.11% | (c) |
Ratio of net investment income (loss) to average net assets | | | 0.94% | (c) |
| * | Commencement of operations. |
| (a) | Net investment income (loss) allocated based on average shares method. |
| (b) | Total return measures net investment income (loss) and capital gain or loss from portfolio investments assuming reinvestment of dividends and capital gains distributions. Total return is not annualized for periods that are less than a full year, does not reflect the effect of sales charge for Class A shares nor the contingent deferred sales charge for Class B and C shares and does not reflect the deduction of taxes that a shareholder would pay on fund distributions or the redemption of fund shares. |
| | | | |
| 200 | | CALAMOS OPEN-END FAMILY OF FUNDS SEMIANNUAL REPORT | | |
Calamos Global Growth and Income Fund Financial Highlights
Selected data for a share outstanding throughout each period were as follows:
| | | | | | | | | | | | | | | | | | | | | | | | |
| | | CLASS A | |
| | | (Unaudited) Six Months
Ended
April 30, | | | Year Ended October 31, | |
| | | 2017 | | | 2016 | | | 2015 | | | 2014 | | | 2013 | | | 2012 | |
Net asset value, beginning of period | | | $8.47 | | | | $8.63 | | | | $10.22 | | | | $11.78 | | | | $10.88 | | | | $10.77 | |
Income from investment operations: | | | | | | | | | | | | | | | | | | | | | | | | |
Net investment income (loss)(a) | | | 0.05 | | | | 0.09 | | | | 0.10 | | | | 0.11 | | | | 0.10 | | | | 0.11 | |
Net realized and unrealized gain (loss) | | | 0.54 | | | | (0.14 | ) | | | 0.06 | | | | 0.36 | | | | 1.13 | | | | 0.21 | |
Total from investment operations | | | 0.59 | | | | (0.05 | ) | | | 0.16 | | | | 0.47 | | | | 1.23 | | | | 0.32 | |
Distributions: | | | | | | | | | | | | | | | | | | | | | | | | |
Dividends from net investment income | | | — | * | | | — | | | | (0.04 | ) | | | (0.29 | ) | | | (0.09 | ) | | | (0.21 | ) |
Dividends from net realized gains | | | (0.06 | ) | | | (0.11 | ) | | | (1.71 | ) | | | (1.74 | ) | | | (0.24 | ) | | | — | |
Total distributions | | | (0.06 | ) | | | (0.11 | ) | | | (1.75 | ) | | | (2.03 | ) | | | (0.33 | ) | | | (0.21 | ) |
Net asset value, end of period | | | $9.00 | | | | $8.47 | | | | $8.63 | | | | $10.22 | | | | $11.78 | | | | $10.88 | |
Ratios and supplemental data: | | | | | | | | | | | | | | | | | | | | | | | | |
Total return(b) | | | 6.97% | | | | (0.59% | ) | | | 2.02% | | | | 4.77% | | | | 11.60% | | | | 3.03% | |
Net assets, end of period (000) | | | $72,791 | | | | $84,648 | | | | $111,615 | | | | $146,431 | | | | $210,537 | | | | $304,914 | |
Ratio of net expenses to average net assets | | | 1.54% | (c) | | | 1.46% | | | | 1.49% | | | | 1.44% | | | | 1.41% | | | | 1.32% | |
Ratio of gross expenses to average net assets prior to expense reductions | | | 1.54% | (c) | | | 1.46% | | | | 1.49% | | | | 1.44% | | | | 1.41% | | | | 1.32% | |
Ratio of net investment income (loss) to average net assets | | | 1.12% | (c) | | | 1.09% | | | | 1.18% | | | | 1.01% | | | | 0.92% | | | | 1.06% | |
| | |
| | | (Unaudited) Six Months
Ended
April 30, | | | Year Ended October 31, | |
| | | 2017 | | | 2016 | | | 2015 | | | 2014 | | | 2013 | | | 2012 | |
Portfolio turnover rate | | | 46.9% | | | | 58.0% | | | | 54.7% | | | | 72.6% | | | | 48.2% | | | | 55.1% | |
| * | Amounts are less than $0.005. |
| (a) | Net investment income (loss) allocated based on average shares method. |
| (b) | Total return measures net investment income (loss) and capital gain or loss from portfolio investments assuming reinvestment of dividends and capital gains distributions. Total return is not annualized for periods that are less than a full year, does not reflect the effect of sales charge for Class A shares nor the contingent deferred sales charge for Class B and C shares and does not reflect the deduction of taxes that a shareholder would pay on fund distributions or the redemption of fund shares. |
Calamos Global Growth and Income Fund Financial Highlights
| | | | | | | | | | | | | | | | | | | | | | | | |
| | | CLASS B | |
| | | (Unaudited) Six Months
Ended
April 30, | | | Year Ended October 31, | |
| | | 2017 | | | 2016 | | | 2015 | | | 2014 | | | 2013 | | | 2012 | |
Net asset value, beginning of period | | | $8.52 | | | | $8.75 | | | | $10.37 | | | | $11.86 | | | | $10.97 | | | | $10.85 | |
Income from investment operations: | | | | | | | | | | | | | | | | | | | | | | | | |
Net investment income (loss)(a) | | | 0.01 | | | | 0.02 | | | | 0.04 | | | | 0.02 | | | | 0.02 | | | | 0.03 | |
Net realized and unrealized gain (loss) | | | 0.56 | | | | (0.14 | ) | | | 0.05 | | | | 0.38 | | | | 1.14 | | | | 0.21 | |
Total from investment operations | | | 0.57 | | | | (0.12 | ) | | | 0.09 | | | | 0.40 | | | | 1.16 | | | | 0.24 | |
Distributions: | | | | | | | | | | | | | | | | | | | | | | | | |
Dividends from net investment income | | | — | | | | — | | | | — | | | | (0.15 | ) | | | (0.03 | ) | | | (0.12 | ) |
Dividends from net realized gains | | | (0.06 | ) | | | (0.11 | ) | | | (1.71 | ) | | | (1.74 | ) | | | (0.24 | ) | | | — | |
Total distributions | | | (0.06 | ) | | | (0.11 | ) | | | (1.71 | ) | | | (1.89 | ) | | | (0.27 | ) | | | (0.12 | ) |
Net asset value, end of period | | | $9.03 | | | | $8.52 | | | | $8.75 | | | | $10.37 | | | | $11.86 | | | | $10.97 | |
Ratios and supplemental data: | | | | | | | | | | | | | | | | | | | | | | | | |
Total return(b) | | | 6.69% | | | | (1.39% | ) | | | 1.18% | | | | 4.04% | | | | 10.77% | | | | 2.25% | |
Net assets, end of period (000) | | | $179 | | | | $537 | | | | $2,096 | | | | $4,937 | | | | $10,884 | | | | $16,654 | |
Ratio of net expenses to average net assets | | | 2.29% | (c) | | | 2.22% | | | | 2.23% | | | | 2.19% | | | | 2.16% | | | | 2.07% | |
Ratio of gross expenses to average net assets prior to expense reductions | | | 2.29% | (c) | | | 2.22% | | | | 2.23% | | | | 2.19% | | | | 2.16% | | | | 2.07% | |
Ratio of net investment income (loss) to average net assets | | | 0.35% | (c) | | | 0.24% | | | | 0.42% | | | | 0.22% | | | | 0.17% | | | | 0.30% | |
| |
| | | CLASS C | |
| | | (Unaudited) Six Months
Ended
April 30, | | | Year Ended October 31, | |
| | | 2017 | | | 2016 | | | 2015 | | | 2014 | | | 2013 | | | 2012 | |
Net asset value, beginning of period | | | $7.65 | | | | $7.87 | | | | $9.50 | | | | $11.06 | | | | $10.25 | | | | $10.15 | |
Income from investment operations: | | | | | | | | | | | | | | | | | | | | | | | | |
Net investment income (loss)(a) | | | 0.01 | | | | 0.03 | | | | 0.03 | | | | 0.03 | | | | 0.02 | | | | 0.03 | |
Net realized and unrealized gain (loss) | | | 0.50 | | | | (0.14 | ) | | | 0.05 | | | | 0.33 | | | | 1.06 | | | | 0.20 | |
Total from investment operations | | | 0.51 | | | | (0.11 | ) | | | 0.08 | | | | 0.36 | | | | 1.08 | | | | 0.23 | |
Distributions: | | | | | | | | | | | | | | | | | | | | | | | | |
Dividends from net investment income | | | — | | | | — | | | | — | | | | (0.18 | ) | | | (0.03 | ) | | | (0.13 | ) |
Dividends from net realized gains | | | (0.06 | ) | | | (0.11 | ) | | | (1.71 | ) | | | (1.74 | ) | | | (0.24 | ) | | | — | |
Total distributions | | | (0.06 | ) | | | (0.11 | ) | | | (1.71 | ) | | | (1.92 | ) | | | (0.27 | ) | | | (0.13 | ) |
Net asset value, end of period | | | $8.10 | | | | $7.65 | | | | $7.87 | | | | $9.50 | | | | $11.06 | | | | $10.25 | |
Ratios and supplemental data: | | | | | | | | | | | | | | | | | | | | | | | | |
Total return(b) | | | 6.66% | | | | (1.42% | ) | | | 1.19% | | | | 3.98% | | | | 10.82% | | | | 2.29% | |
Net assets, end of period (000) | | | $79,836 | | | | $90,640 | | | | $119,620 | | | | $151,091 | | | | $185,577 | | | | $235,194 | |
Ratio of net expenses to average net assets | | | 2.29% | (c) | | | 2.21% | | | | 2.24% | | | | 2.19% | | | | 2.16% | | | | 2.07% | |
Ratio of gross expenses to average net assets prior to expense reductions | | | 2.29% | (c) | | | 2.21% | | | | 2.24% | | | | 2.19% | | | | 2.16% | | | | 2.07% | |
Ratio of net investment income (loss) to average net assets | | | 0.37% | (c) | | | 0.34% | | | | 0.43% | | | | 0.27% | | | | 0.17% | | | | 0.31% | |
| (a) | Net investment income (loss) allocated based on average shares method. |
| (b) | Total return measures net investment income (loss) and capital gain or loss from portfolio investments assuming reinvestment of dividends and capital gains distributions. Total return is not annualized for periods that are less than a full year, does not reflect the effect of sales charge for Class A shares nor the contingent deferred sales charge for Class B and C shares and does not reflect the deduction of taxes that a shareholder would pay on fund distributions or the redemption of fund shares. |
| | | | |
| 202 | | CALAMOS OPEN-END FAMILY OF FUNDS SEMIANNUAL REPORT | | |
Calamos Global Growth and Income Fund Financial Highlights
| | | | | | | | | | | | | | | | | | | | | | | | |
| | | CLASS I | |
| | | (Unaudited) Six Months
Ended
April 30, | | | Year Ended October 31, | |
| | | 2017 | | | 2016 | | | 2015 | | | 2014 | | | 2013 | | | 2012 | |
Net asset value, beginning of period | | | $8.70 | | | | $8.84 | | | | $10.43 | | | | $11.99 | | | | $11.06 | | | | $10.96 | |
Income from investment operations: | | | | | | | | | | | | | | | | | | | | | | | | |
Net investment income (loss)(a) | | | 0.06 | | | | 0.11 | | | | 0.13 | | | | 0.14 | | | | 0.13 | | | | 0.14 | |
Net realized and unrealized gain (loss) | | | 0.57 | | | | (0.14 | ) | | | 0.05 | | | | 0.36 | | | | 1.15 | | | | 0.22 | |
Total from investment operations | | | 0.63 | | | | (0.03 | ) | | | 0.18 | | | | 0.50 | | | | 1.28 | | | | 0.36 | |
Distributions: | | | | | | | | | | | | | | | | | | | | | | | | |
Dividends from net investment income | | | (0.03 | ) | | | — | | | | (0.06 | ) | | | (0.32 | ) | | | (0.11 | ) | | | (0.26 | ) |
Dividends from net realized gains | | | (0.06 | ) | | | (0.11 | ) | | | (1.71 | ) | | | (1.74 | ) | | | (0.24 | ) | | | — | |
Total distributions | | | (0.09 | ) | | | (0.11 | ) | | | (1.77 | ) | | | (2.06 | ) | | | (0.35 | ) | | | (0.26 | ) |
Net asset value, end of period | | | $9.24 | | | | $8.70 | | | | $8.84 | | | | $10.43 | | | | $11.99 | | | | $11.06 | |
Ratios and supplemental data: | | | | | | | | | | | | | | | | | | | | | | | | |
Total return(b) | | | 7.26% | | | | (0.35% | ) | | | 2.23% | | | | 4.99% | | | | 11.90% | | | | 3.32% | |
Net assets, end of period (000) | | | $71,086 | | | | $124,175 | | | | $146,241 | | | | $182,064 | | | | $232,583 | | | | $986,986 | |
Ratio of net expenses to average net assets | | | 1.29% | (c) | | | 1.21% | | | | 1.24% | | | | 1.19% | | | | 1.14% | | | | 1.07% | |
Ratio of gross expenses to average net assets prior to expense reductions | | | 1.29% | (c) | | | 1.21% | | | | 1.24% | | | | 1.19% | | | | 1.14% | | | | 1.07% | |
Ratio of net investment income (loss) to average net assets | | | 1.41% | (c) | | | 1.34% | | | | 1.43% | | | | 1.29% | | | | 1.16% | | | | 1.31% | |
| |
| | | CLASS R | |
| | | (Unaudited) Six Months
Ended
April 30, | | | Year Ended October 31, | |
| | | 2017 | | | 2016 | | | 2015 | | | 2014 | | | 2013 | | | 2012 | |
Net asset value, beginning of period | | | $8.34 | | | | $8.53 | | | | $10.13 | | | | $11.67 | | | | $10.79 | | | | $10.67 | |
Income from investment operations: | | | | | | | | | | | | | | | | | | | | | | | | |
Net investment income (loss)(a) | | | 0.04 | | | | 0.07 | | | | 0.08 | | | | 0.08 | | | | 0.07 | | | | 0.08 | |
Net realized and unrealized gain (loss) | | | 0.54 | | | | (0.15 | ) | | | 0.05 | | | | 0.37 | | | | 1.12 | | | | 0.21 | |
Total from investment operations | | | 0.58 | | | | (0.08 | ) | | | 0.13 | | | | 0.45 | | | | 1.19 | | | | 0.29 | |
Distributions: | | | | | | | | | | | | | | | | | | | | | | | | |
Dividends from net investment income | | | — | | | | — | | | | (0.02 | ) | | | (0.25 | ) | | | (0.07 | ) | | | (0.17 | ) |
Dividends from net realized gains | | | (0.06 | ) | | | (0.11 | ) | | | (1.71 | ) | | | (1.74 | ) | | | (0.24 | ) | | | — | |
Total distributions | | | (0.06 | ) | | | (0.11 | ) | | | (1.73 | ) | | | (1.99 | ) | | | (0.31 | ) | | | (0.17 | ) |
Net asset value, end of period | | | $8.86 | | | | $8.34 | | | | $8.53 | | | | $10.13 | | | | $11.67 | | | | $10.79 | |
Ratios and supplemental data: | | | | | | | | | | | | | | | | | | | | | | | | |
Total return(b) | | | 6.95% | | | | (0.96% | ) | | | 1.74% | | | | 4.62% | | | | 11.27% | | | | 2.77% | |
Net assets, end of period (000) | | | $1,250 | | | | $1,249 | | | | $1,292 | | | | $1,741 | | | | $1,674 | | | | $3,045 | |
Ratio of net expenses to average net assets | | | 1.79% | (c) | | | 1.71% | | | | 1.73% | | | | 1.69% | | | | 1.66% | | | | 1.58% | |
Ratio of gross expenses to average net assets prior to expense reductions | | | 1.79% | (c) | | | 1.71% | | | | 1.73% | | | | 1.69% | | | | 1.66% | | | | 1.58% | |
Ratio of net investment income (loss) to average net assets | | | 0.87% | (c) | | | 0.81% | | | | 0.94% | | | | 0.77% | | | | 0.68% | | | | 0.75% | |
| (a) | Net investment income (loss) allocated based on average shares method. |
| (b) | Total return measures net investment income (loss) and capital gain or loss from portfolio investments assuming reinvestment of dividends and capital gains distributions. Total return is not annualized for periods that are less than a full year, does not reflect the effect of sales charge for Class A shares nor the contingent deferred sales charge for Class B and C shares and does not reflect the deduction of taxes that a shareholder would pay on fund distributions or the redemption of fund shares. |
Calamos Global Growth and Income Fund Financial Highlights
| | | | |
| | | CLASS T | |
| | | (Unaudited)
February 28, 2017*
through
April 30, | |
| | | 2017 | |
Net asset value, beginning of period | | | $8.72 | |
Income from investment operations: | | | | |
Net investment income (loss)(a) | | | 0.02 | |
Net realized and unrealized gain (loss) | | | 0.26 | |
Total from investment operations | | | 0.28 | |
Distributions: | | | | |
Dividends from net investment income | | | — | |
Net asset value, end of period | | | $9.00 | |
Ratios and supplemental data: | | | | |
Total return(b) | | | 3.21% | |
Net assets, end of period (000) | | | $26 | |
Ratio of net expenses to average net assets | | | 1.55% | (c) |
Ratio of gross expenses to average net assets prior to expense reductions | | | 1.55% | (c) |
Ratio of net investment income (loss) to average net assets | | | 1.44% | (c) |
| * | Commencement of operations. |
| (a) | Net investment income (loss) allocated based on average shares method. |
| (b) | Total return measures net investment income (loss) and capital gain or loss from portfolio investments assuming reinvestment of dividends and capital gains distributions. Total return is not annualized for periods that are less than a full year, does not reflect the effect of sales charge for Class A shares nor the contingent deferred sales charge for Class B and C shares and does not reflect the deduction of taxes that a shareholder would pay on fund distributions or the redemption of fund shares. |
| | | | |
| 204 | | CALAMOS OPEN-END FAMILY OF FUNDS SEMIANNUAL REPORT | | |
Calamos Convertible Fund Financial Highlights
Selected data for a share outstanding throughout each period were as follows:
| | | | | | | | | | | | | | | | | | | | | | | | |
| | | CLASS A | |
| | | (Unaudited) Six Months
Ended
April 30, | | | Year Ended October 31, | |
| | | 2017 | | | 2016 | | | 2015 | | | 2014 | | | 2013 | | | 2012 | |
Net asset value, beginning of period | | | $15.93 | | | | $16.56 | | | | $18.59 | | | | $19.14 | | | | $17.70 | | | | $19.28 | |
Income from investment operations: | | | | | | | | | | | | | | | | | | | | | | | | |
Net investment income (loss)(a) | | | 0.24 | | | | 0.50 | | | | 0.44 | | | | 0.40 | | | | 0.39 | | | | 0.37 | |
Net realized and unrealized gain (loss) | | | 1.16 | | | | (0.30 | ) | | | (1.01 | ) | | | 1.14 | | | | 2.63 | | | | (0.33 | ) |
Total from investment operations | | | 1.40 | | | | 0.20 | | | | (0.57 | ) | | | 1.54 | | | | 3.02 | | | | 0.04 | |
Distributions: | | | | | | | | | | | | | | | | | | | | | | | | |
Dividends from net investment income | | | (0.24 | ) | | | (0.56 | ) | | | (0.58 | ) | | | (0.76 | ) | | | (0.02 | ) | | | (0.14 | ) |
Dividends from net realized gains | | | — | | | | (0.27 | ) | | | (0.88 | ) | | | (1.33 | ) | | | (1.56 | ) | | | (1.48 | ) |
Total distributions | | | (0.24 | ) | | | (0.83 | ) | | | (1.46 | ) | | | (2.09 | ) | | | (1.58 | ) | | | (1.62 | ) |
Net asset value, end of period | | | $17.09 | | | | $15.93 | | | | $16.56 | | | | $18.59 | | | | $19.14 | | | | $17.70 | |
Ratios and supplemental data: | | | | | | | | | | | | | | | | | | | | | | | | |
Total return(b) | | | 8.88% | | | | 1.33% | | | | (3.31% | ) | | | 8.74% | | | | 18.50% | | | | 0.51% | |
Net assets, end of period (000) | | | $220,035 | | | | $228,334 | | | | $385,844 | | | | $488,842 | | | | $514,593 | | | | $650,100 | |
Ratio of net expenses to average net assets | | | 1.18% | (c) | | | 1.15% | | | | 1.13% | | | | 1.10% | | | | 1.11% | | | | 1.10% | |
Ratio of gross expenses to average net assets prior to expense reductions | | | 1.18% | (c) | | | 1.15% | | | | 1.13% | | | | 1.10% | | | | 1.11% | | | | 1.10% | |
Ratio of net investment income (loss) to average net assets | | | 2.96% | (c) | | | 3.17% | | | | 2.53% | | | | 2.18% | | | | 2.18% | | | | 2.07% | |
| | |
| | | (Unaudited) Six Months
Ended
April 30, | | | Year Ended October 31, | |
| | | 2017 | | | 2016 | | | 2015 | | | 2014 | | | 2013 | | | 2012 | |
Portfolio turnover rate | | | 28.0% | | | | 43.8% | | | | 63.0% | | | | 68.1% | | | | 73.1% | | | | 56.6% | |
| (a) | Net investment income (loss) allocated based on average shares method. |
| (b) | Total return measures net investment income (loss) and capital gain or loss from portfolio investments assuming reinvestment of dividends and capital gains distributions. Total return is not annualized for periods that are less than a full year, does not reflect the effect of sales charge for Class A shares nor the contingent deferred sales charge for Class B and C shares and does not reflect the deduction of taxes that a shareholder would pay on fund distributions or the redemption of fund shares. |
Calamos Convertible Fund Financial Highlights
| | | | | | | | | | | | | | | | | | | | | | | | |
| | | CLASS B | |
| | | (Unaudited) Six Months
Ended
April 30, | | | Year Ended October 31, | |
| | | 2017 | | | 2016 | | | 2015 | | | 2014 | | | 2013 | | | 2012 | |
Net asset value, beginning of period | | | $20.58 | | | | $21.13 | | | | $23.29 | | | | $23.27 | | | | $21.31 | | | | $22.89 | |
Income from investment operations: | | | | | | | | | | | | | | | | | | | | | | | | |
Net investment income (loss)(a) | | | 0.23 | | | | 0.48 | | | | 0.39 | | | | 0.32 | | | | 0.31 | | | | 0.28 | |
Net realized and unrealized gain (loss) | | | 1.51 | | | | (0.37 | ) | | | (1.29 | ) | | | 1.41 | | | | 3.21 | | | | (0.38 | ) |
Total from investment operations | | | 1.74 | | | | 0.11 | | | | (0.90 | ) | | | 1.73 | | | | 3.52 | | | | (0.10 | ) |
Distributions: | | | | | | | | | | | | | | | | | | | | | | | | |
Dividends from net investment income | | | (0.12 | ) | | | (0.39 | ) | | | (0.38 | ) | | | (0.38 | ) | | | — | | | | (0.00 | )* |
Dividends from net realized gains | | | — | | | | (0.27 | ) | | | (0.88 | ) | | | (1.33 | ) | | | (1.56 | ) | | | (1.48 | ) |
Total distributions | | | (0.12 | ) | | | (0.66 | ) | | | (1.26 | ) | | | (1.71 | ) | | | (1.56 | ) | | | (1.48 | ) |
Net asset value, end of period | | | $22.20 | | | | $20.58 | | | | $21.13 | | | | $23.29 | | | | $23.27 | | | | $21.31 | |
Ratios and supplemental data: | | | | | | | | | | | | | | | | | | | | | | | | |
Total return(b) | | | 8.47% | | | | 0.60% | | | | (4.03% | ) | | | 7.89% | | | | 17.63% | | | | (0.25% | ) |
Net assets, end of period (000) | | | $1,252 | | | | $3,926 | | | | $5,420 | | | | $9,879 | | | | $11,391 | | | | $14,256 | |
Ratio of net expenses to average net assets | | | 1.94% | (c) | | | 1.90% | | | | 1.88% | | | | 1.86% | | | | 1.86% | | | | 1.85% | |
Ratio of gross expenses to average net assets prior to expense reductions | | | 1.94% | (c) | | | 1.90% | | | | 1.88% | | | | 1.86% | | | | 1.86% | | | | 1.85% | |
Ratio of net investment income (loss) to average net assets | | | 2.24% | (c) | | | 2.39% | | | | 1.74% | | | | 1.42% | | | | 1.43% | | | | 1.32% | |
| |
| | | CLASS C | |
| | | (Unaudited) Six Months
Ended
April 30, | | | Year Ended October 31, | |
| | | 2017 | | | 2016 | | | 2015 | | | 2014 | | | 2013 | | | 2012 | |
Net asset value, beginning of period | | | $15.79 | | | | $16.41 | | | | $18.43 | | | | $18.87 | | | | $17.57 | | | | $19.15 | |
Income from investment operations: | | | | | | | | | | | | | | | | | | | | | | | | |
Net investment income (loss)(a) | | | 0.18 | | | | 0.37 | | | | 0.31 | | | | 0.26 | | | | 0.25 | | | | 0.23 | |
Net realized and unrealized gain (loss) | | | 1.14 | | | | (0.28 | ) | | | (1.00 | ) | | | 1.11 | | | | 2.61 | | | | (0.32 | ) |
Total from investment operations | | | 1.32 | | | | 0.09 | | | | (0.69 | ) | | | 1.37 | | | | 2.86 | | | | (0.09 | ) |
Distributions: | | | | | | | | | | | | | | | | | | | | | | | | |
Dividends from net investment income | | | (0.18 | ) | | | (0.44 | ) | | | (0.45 | ) | | | (0.48 | ) | | | — | | | | (0.01 | ) |
Dividends from net realized gains | | | — | | | | (0.27 | ) | | | (0.88 | ) | | | (1.33 | ) | | | (1.56 | ) | | | (1.48 | ) |
Total distributions | | | (0.18 | ) | | | (0.71 | ) | | | (1.33 | ) | | | (1.81 | ) | | | (1.56 | ) | | | (1.49 | ) |
Net asset value, end of period | | | $16.93 | | | | $15.79 | | | | $16.41 | | | | $18.43 | | | | $18.87 | | | | $17.57 | |
Ratios and supplemental data: | | | | | | | | | | | | | | | | | | | | | | | | |
Total return(b) | | | 8.41% | | | | 0.62% | | | | (4.01% | ) | | | 7.86% | | | | 17.62% | | | | (0.24% | ) |
Net assets, end of period (000) | | | $170,416 | | | | $193,339 | | | | $265,686 | | | | $319,654 | | | | $325,823 | | | | $390,649 | |
Ratio of net expenses to average net assets | | | 1.94% | (c) | | | 1.90% | | | | 1.88% | | | | 1.86% | | | | 1.86% | | | | 1.85% | |
Ratio of gross expenses to average net assets prior to expense reductions | | | 1.94% | (c) | | | 1.90% | | | | 1.88% | | | | 1.86% | | | | 1.86% | | | | 1.85% | |
Ratio of net investment income (loss) to average net assets | | | 2.21% | (c) | | | 2.40% | | | | 1.78% | | | | 1.43% | | | | 1.43% | | | | 1.32% | |
| * | Amounts are less than $0.005. |
| (a) | Net investment income (loss) allocated based on average shares method. |
| (b) | Total return measures net investment income (loss) and capital gain or loss from portfolio investments assuming reinvestment of dividends and capital gains distributions. Total return is not annualized for periods that are less than a full year, does not reflect the effect of sales charge for Class A shares nor the contingent deferred sales charge for Class B and C shares and does not reflect the deduction of taxes that a shareholder would pay on fund distributions or the redemption of fund shares. |
| | | | |
| 206 | | CALAMOS OPEN-END FAMILY OF FUNDS SEMIANNUAL REPORT | | |
Calamos Convertible Fund Financial Highlights
| | | | | | | | | | | | | | | | | | | | | | | | |
| | | CLASS I | |
| | | (Unaudited) Six Months
Ended
April 30, | | | Year Ended October 31, | |
| | | 2017 | | | 2016 | | | 2015 | | | 2014 | | | 2013 | | | 2012 | |
Net asset value, beginning of period | | | $14.38 | | | | $15.03 | | | | $17.02 | | | | $17.74 | | | | $16.51 | | | | $18.10 | |
Income from investment operations: | | | | | | | | | | | | | | | | | | | | | | | | |
Net investment income (loss)(a) | | | 0.24 | | | | 0.49 | | | | 0.44 | | | | 0.41 | | | | 0.40 | | | | 0.39 | |
Net realized and unrealized gain (loss) | | | 1.04 | | | | (0.27 | ) | | | (0.93 | ) | | | 1.04 | | | | 2.44 | | | | (0.30 | ) |
Total from investment operations | | | 1.28 | | | | 0.22 | | | | (0.49 | ) | | | 1.45 | | | | 2.84 | | | | 0.09 | |
Distributions: | | | | | | | | | | | | | | | | | | | | | | | | |
Dividends from net investment income | | | (0.26 | ) | | | (0.60 | ) | | | (0.62 | ) | | | (0.84 | ) | | | (0.05 | ) | | | (0.20 | ) |
Dividends from net realized gains | | | — | | | | (0.27 | ) | | | (0.88 | ) | | | (1.33 | ) | | | (1.56 | ) | | | (1.48 | ) |
Total distributions | | | (0.26 | ) | | | (0.87 | ) | | | (1.50 | ) | | | (2.17 | ) | | | (1.61 | ) | | | (1.68 | ) |
Net asset value, end of period | | | $15.40 | | | | $14.38 | | | | $15.03 | | | | $17.02 | | | | $17.74 | | | | $16.51 | |
Ratios and supplemental data: | | | | | | | | | | | | | | | | | | | | | | | | |
Total return(b) | | | 9.01% | | | | 1.64% | | | | (3.11% | ) | | | 8.99% | | | | 18.78% | | | | 0.81% | |
Net assets, end of period (000) | | | $211,518 | | | | $238,309 | | | | $455,702 | | | | $553,594 | | | | $349,512 | | | | $475,526 | |
Ratio of net expenses to average net assets | | | 0.94% | (c) | | | 0.90% | | | | 0.88% | | | | 0.85% | | | | 0.86% | | | | 0.85% | |
Ratio of gross expenses to average net assets prior to expense reductions | | | 0.94% | (c) | | | 0.90% | | | | 0.88% | | | | 0.85% | | | | 0.86% | | | | 0.85% | |
Ratio of net investment income (loss) to average net assets | | | 3.21% | (c) | | | 3.48% | | | | 2.77% | | | | 2.46% | | | | 2.43% | | | | 2.33% | |
| |
| | | CLASS R | |
| | | (Unaudited) Six Months
Ended
April 30, | | | Year Ended October 31, | |
| | | 2017 | | | 2016 | | | 2015 | | | 2014 | | | 2013 | | | 2012 | |
Net asset value, beginning of period | | | $15.87 | | | | $16.50 | | | | $18.52 | | | | $19.03 | | | | $17.63 | | | | $19.21 | |
Income from investment operations: | | | | | | | | | | | | | | | | | | | | | | | | |
Net investment income (loss)(a) | | | 0.22 | | | | 0.45 | | | | 0.40 | | | | 0.35 | | | | 0.34 | | | | 0.32 | |
Net realized and unrealized gain (loss) | | | 1.15 | | | | (0.29 | ) | | | (1.01 | ) | | | 1.13 | | | | 2.62 | | | | (0.32 | ) |
Total from investment operations | | | 1.37 | | | | 0.16 | | | | (0.61 | ) | | | 1.48 | | | | 2.96 | | | | — | |
Distributions: | | | | | | | | | | | | | | | | | | | | | | | | |
Dividends from net investment income | | | (0.22 | ) | | | (0.52 | ) | | | (0.53 | ) | | | (0.66 | ) | | | (0.00 | )* | | | (0.10 | ) |
Dividends from net realized gains | | | — | | | | (0.27 | ) | | | (0.88 | ) | | | (1.33 | ) | | | (1.56 | ) | | | (1.48 | ) |
Total distributions | | | (0.22 | ) | | | (0.79 | ) | | | (1.41 | ) | | | (1.99 | ) | | | (1.56 | ) | | | (1.58 | ) |
Net asset value, end of period | | | $17.02 | | | | $15.87 | | | | $16.50 | | | | $18.52 | | | | $19.03 | | | | $17.63 | |
Ratios and supplemental data: | | | | | | | | | | | | | | | | | | | | | | | | |
Total return(b) | | | 8.71% | | | | 1.10% | | | | (3.53% | ) | | | 8.44% | | | | 18.18% | | | | 0.29% | |
Net assets, end of period (000) | | | $1,638 | | | | $1,712 | | | | $2,147 | | | | $2,988 | | | | $3,074 | | | | $3,253 | |
Ratio of net expenses to average net assets | | | 1.43% | (c) | | | 1.40% | | | | 1.38% | | | | 1.36% | | | | 1.36% | | | | 1.35% | |
Ratio of gross expenses to average net assets prior to expense reductions | | | 1.43% | (c) | | | 1.40% | | | | 1.38% | | | | 1.36% | | | | 1.36% | | | | 1.35% | |
Ratio of net investment income (loss) to average net assets | | | 2.70% | (c) | | | 2.87% | | | | 2.26% | | | | 1.92% | | | | 1.93% | | | | 1.82% | |
| * | Amounts are less than $0.005. |
| (a) | Net investment income (loss) allocated based on average shares method. |
| (b) | Total return measures net investment income (loss) and capital gain or loss from portfolio investments assuming reinvestment of dividends and capital gains distributions. Total return is not annualized for periods that are less than a full year, does not reflect the effect of sales charge for Class A shares nor the contingent deferred sales charge for Class B and C shares and does not reflect the deduction of taxes that a shareholder would pay on fund distributions or the redemption of fund shares. |
Calamos Convertible Fund Financial Highlights
| | | | |
| | | CLASS T | |
| | | (Unaudited)
February 28, 2017*
through
April 30, | |
| | | 2017 | |
Net asset value, beginning of period | | | $16.85 | |
Income from investment operations: | | | | |
Net investment income (loss)(a) | | | 0.07 | |
Net realized and unrealized gain (loss) | | | 0.25 | |
Total from investment operations | | | 0.32 | |
Distributions: | | | | |
Dividends from net investment income | | | (0.09 | ) |
Total distributions | | | (0.09 | ) |
Net asset value, end of period | | | $17.08 | |
Ratios and supplemental data: | | | | |
Total return(b) | | | 1.93% | |
Net assets, end of period (000) | | | $25 | |
Ratio of net expenses to average net assets | | | 1.16% | (c) |
Ratio of gross expenses to average net assets prior to expense reductions | | | 1.16% | (c) |
Ratio of net investment income (loss) to average net assets | | | 2.51% | (c) |
| * | Commencement of operations. |
| (a) | Net investment income (loss) allocated based on average shares method. |
| (b) | Total return measures net investment income (loss) and capital gain or loss from portfolio investments assuming reinvestment of dividends and capital gains distributions. Total return is not annualized for periods that are less than a full year, does not reflect the effect of sales charge for Class A shares nor the contingent deferred sales charge for Class B and C shares and does not reflect the deduction of taxes that a shareholder would pay on fund distributions or the redemption of fund shares. |
| | | | |
| 208 | | CALAMOS OPEN-END FAMILY OF FUNDS SEMIANNUAL REPORT | | |
Calamos Global Convertible Fund Financial Highlights
Selected data for a share outstanding throughout each period were as follows:
| | | | | | | | | | | | |
| | | CLASS A | |
| | | (Unaudited)
Six Months
Ended
April 30, | | | Year Ended
October 31, | | | December 31, 2014*
through
October 31, | |
| | | 2017 | | | 2016 | | | 2015 | |
Net asset value, beginning of period | | | $9.89 | | | | $9.93 | | | | $10.00 | |
Income from investment operations: | | | | | | | | | | | | |
Net investment income (loss)(a) | | | 0.13 | | | | 0.26 | | | | 0.13 | |
Net realized and unrealized gain (loss) | | | 0.58 | | | | (0.14 | ) | | | (0.13 | ) |
Total from investment operations | | | 0.71 | | | | 0.12 | | | | — | |
Distributions: | | | | | | | | | | | | |
Dividends from net investment income | | | (0.08 | ) | | | (0.16 | ) | | | (0.07 | ) |
Dividends from net realized gains | | | — | | | | — | | | | — | |
Total distributions | | | (0.08 | ) | | | (0.16 | ) | | | (0.07 | ) |
Net asset value, end of period | | | $10.52 | | | | $9.89 | | | | $9.93 | |
Ratios and supplemental data: | | | | | | | | | | | | |
Total return(b) | | | 7.20% | | | | 1.27% | | | | —% | |
Net assets, end of period (000) | | | $34,554 | | | | $29,037 | | | | $20,550 | |
Ratio of net expenses to average net assets | | | 1.35% | (c) | | | 1.35% | | | | 1.35% | (c) |
Ratio of gross expenses to average net assets prior to expense reductions | | | 1.47% | (c) | | | 1.46% | | | | 2.30% | (c) |
Ratio of net investment income (loss) to average net assets | | | 2.58% | (c) | | | 2.64% | | | | 1.56% | (c) |
| | | |
| | | (Unaudited)
Six Months
Ended
April 30, | | | Year Ended
October 31, | | | December 31, 2014*
through
October 31, | |
| | | 2017 | | | 2016 | | | 2015 | |
Portfolio turnover rate | | | 21.1% | | | | 38.4% | | | | 28.2% | |
| * | Commencement of operations. |
| (a) | Net investment income (loss) allocated based on average shares method. |
| (b) | Total return measures net investment income (loss) and capital gain or loss from portfolio investments assuming reinvestment of dividends and capital gains distributions. Total return is not annualized for periods that are less than a full year, does not reflect the effect of sales charge for Class A shares nor the contingent deferred sales charge for Class B and C shares and does not reflect the deduction of taxes that a shareholder would pay on fund distributions or the redemption of fund shares. |
Calamos Global Convertible Fund Financial Highlights
| | | | | | | | | | | | |
| | | CLASS C | |
| | | (Unaudited)
Six Months
Ended
April 30, | | | Year Ended
October 31, | | | December 31, 2014*
through
October 31, | |
| | | 2017 | | | 2016 | | | 2015 | |
Net asset value, beginning of period | | | $9.85 | | | | $9.90 | | | | $10.00 | |
Income from investment operations: | | | | | | | | | | | | |
Net investment income (loss)(a) | | | 0.09 | | | | 0.18 | | | | 0.07 | |
Net realized and unrealized gain (loss) | | | 0.57 | | | | (0.13 | ) | | | (0.12 | ) |
Total from investment operations | | | 0.66 | | | | 0.05 | | | | (0.05 | ) |
Distributions: | | | | | | | | | | | | |
Dividends from net investment income | | | (0.06 | ) | | | (0.10 | ) | | | (0.05 | ) |
Dividends from net realized gains | | | — | | | | — | | | | — | |
Total distributions | | | (0.06 | ) | | | (0.10 | ) | | | (0.05 | ) |
Net asset value, end of period | | | $10.45 | | | | $9.85 | | | | $9.90 | |
Ratios and supplemental data: | | | | | | | | | | | | |
Total return(b) | | | 6.70% | | | | 0.50% | | | | (0.52% | ) |
Net assets, end of period (000) | | | $2,337 | | | | $2,440 | | | | $1,259 | |
Ratio of net expenses to average net assets | | | 2.10% | (c) | | | 2.10% | | | | 2.10% | (c) |
Ratio of gross expenses to average net assets prior to expense reductions | | | 2.21% | (c) | | | 2.21% | | | | 2.88% | (c) |
Ratio of net investment income (loss) to average net assets | | | 1.82% | (c) | | | 1.89% | | | | 0.84% | (c) |
| |
| | | CLASS I | |
| | | (Unaudited)
Six Months
Ended
April 30, | | | Year Ended
October 31, | | | December 31, 2014*
through
October 31, | |
| | | 2017 | | | 2016 | | | 2015 | |
Net asset value, beginning of period | | | $9.92 | | | | $9.95 | | | | $10.00 | |
Income from investment operations: | | | | | | | | | | | | |
Net investment income (loss)(a) | | | 0.14 | | | | 0.28 | | | | 0.15 | |
Net realized and unrealized gain (loss) | | | 0.57 | | | | (0.13 | ) | | | (0.12 | ) |
Total from investment operations | | | 0.71 | | | | 0.15 | | | | 0.03 | |
Distributions: | | | | | | | | | | | | |
Dividends from net investment income | | | (0.09 | ) | | | (0.18 | ) | | | (0.08 | ) |
Dividends from net realized gains | | | — | | | | — | | | | — | |
Total distributions | | | (0.09 | ) | | | (0.18 | ) | | | (0.08 | ) |
Net asset value, end of period | | | $10.54 | | | | $9.92 | | | | $9.95 | |
Ratios and supplemental data: | | | | | | | | | | | | |
Total return(b) | | | 7.20% | | | | 1.60% | | | | 0.29% | |
Net assets, end of period (000) | | | $39,073 | | | | $47,637 | | | | $23,054 | |
Ratio of net expenses to average net assets | | | 1.10% | (c) | | | 1.10% | | | | 1.10% | (c) |
Ratio of gross expenses to average net assets prior to expense reductions | | | 1.21% | (c) | | | 1.21% | | | | 1.80% | (c) |
Ratio of net investment income (loss) to average net assets | | | 2.81% | (c) | | | 2.88% | | | | 1.81% | (c) |
| * | Commencement of operations. |
| (a) | Net investment income (loss) allocated based on average shares method. |
| (b) | Total return measures net investment income (loss) and capital gain or loss from portfolio investments assuming reinvestment of dividends and capital gains distributions. Total return is not annualized for periods that are less than a full year, does not reflect the effect of sales charge for Class A shares nor the contingent deferred sales charge for Class B and C shares and does not reflect the deduction of taxes that a shareholder would pay on fund distributions or the redemption of fund shares. |
| | | | |
| 210 | | CALAMOS OPEN-END FAMILY OF FUNDS SEMIANNUAL REPORT | | |
Calamos Global Convertible Fund Financial Highlights
| | | | | | | | | | | | |
| | | CLASS R | |
| | | (Unaudited)
Six Months
Ended
April 30, | | | Year Ended
October 31, | | | December 31, 2014*
through
October 31, | |
| | | 2017 | | | 2016 | | | 2015 | |
Net asset value, beginning of period | | | $9.88 | | | | $9.92 | | | | $10.00 | |
Income from investment operations: | | | | | | | | | | | | |
Net investment income (loss)(a) | | | 0.12 | | | | 0.23 | | | | 0.11 | |
Net realized and unrealized gain (loss) | | | 0.56 | | | | (0.13 | ) | | | (0.13 | ) |
Total from investment operations | | | 0.68 | | | | 0.10 | | | | (0.02 | ) |
Distributions: | | | | | | | | | | | | |
Dividends from net investment income | | | (0.07 | ) | | | (0.14 | ) | | | (0.06 | ) |
Dividends from net realized gains | | | — | | | | — | | | | — | |
Total distributions | | | (0.07 | ) | | | (0.14 | ) | | | (0.06 | ) |
Net asset value, end of period | | | $10.49 | | | | $9.88 | | | | $9.92 | |
Ratios and supplemental data: | | | | | | | | | | | | |
Total return(b) | | | 6.93% | | | | 1.08% | | | | (0.20% | ) |
Net assets, end of period (000) | | | $562 | | | | $450 | | | | $190 | |
Ratio of net expenses to average net assets | | | 1.60% | (c) | | | 1.59% | | | | 1.60% | (c) |
Ratio of gross expenses to average net assets prior to expense reductions | | | 1.72% | (c) | | | 1.71% | | | | 2.93% | (c) |
Ratio of net investment income (loss) to average net assets | | | 2.33% | (c) | | | 2.30% | | | | 1.35% | (c) |
| | | | |
| | | CLASS T | |
| | | (Unaudited)
February 28, 2017*
through
April 30, | |
| | | 2017 | |
Net asset value, beginning of period | | | $10.18 | |
Income from investment operations: | | | | |
Net investment income (loss)(a) | | | 0.04 | |
Net realized and unrealized gain (loss) | | | 0.30 | |
Total from investment operations | | | 0.34 | |
Distributions: | | | | |
Dividends from net investment income | | | (0.01 | ) |
Total distributions | | | (0.01 | ) |
Net asset value, end of period | | | $10.51 | |
Ratios and supplemental data: | | | | |
Total return(b) | | | 3.31% | |
Net assets, end of period (000) | | | $26 | |
Ratio of net expenses to average net assets | | | 1.35% | (c) |
Ratio of gross expenses to average net assets prior to expense reductions | | | 1.48% | (c) |
Ratio of net investment income (loss) to average net assets | | | 2.38% | (c) |
| * | Commencement of operations. |
| (a) | Net investment income (loss) allocated based on average shares method. |
| (b) | Total return measures net investment income (loss) and capital gain or loss from portfolio investments assuming reinvestment of dividends and capital gains distributions. Total return is not annualized for periods that are less than a full year, does not reflect the effect of sales charge for Class A shares nor the contingent deferred sales charge for Class B and C shares and does not reflect the deduction of taxes that a shareholder would pay on fund distributions or the redemption of fund shares. |
Calamos Total Return Bond Fund Financial Highlights
Selected data for a share outstanding throughout each period were as follows:
| | | | | | | | | | | | | | | | | | | | | | | | |
| | | CLASS A | |
| | | (Unaudited) Six Months
Ended
April 30, | | | Year Ended October 31, | |
| | | 2017 | | | 2016 | | | 2015 | | | 2014 | | | 2013 | | | 2012 | |
Net asset value, beginning of period | | | $10.54 | | | | $10.51 | | | | $10.70 | | | | $10.89 | | | | $11.15 | | | | $11.14 | |
Income from investment operations: | | | | | | | | | | | | | | | | | | | | | | | | |
Net investment income (loss)(a) | | | 0.11 | | | | 0.24 | | | | 0.26 | | | | 0.26 | | | | 0.22 | | | | 0.22 | |
Net realized and unrealized gain (loss) | | | (0.13 | ) | | | 0.20 | | | | (0.05 | ) | | | 0.12 | | | | (0.17 | ) | | | 0.15 | |
Total from investment operations | | | (0.02 | ) | | | 0.44 | | | | 0.21 | | | | 0.38 | | | | 0.05 | | | | 0.37 | |
Distributions: | | | | | | | | | | | | | | | | | | | | | | | | |
Dividends from net investment income | | | (0.13 | ) | | | (0.28 | ) | | | (0.28 | ) | | | (0.53 | ) | | | (0.26 | ) | | | (0.32 | ) |
Dividends from net realized gains | | | (0.01 | ) | | | (0.13 | ) | | | (0.12 | ) | | | (0.04 | ) | | | (0.05 | ) | | | (0.04 | ) |
Total distributions | | | (0.14 | ) | | | (0.41 | ) | | | (0.40 | ) | | | (0.57 | ) | | | (0.31 | ) | | | (0.36 | ) |
Net asset value, end of period | | | $10.38 | | | | $10.54 | | | | $10.51 | | | | $10.70 | | | | $10.89 | | | | $11.15 | |
Ratios and supplemental data: | | | | | | | | | | | | | | | | | | | | | | | | |
Total return(b) | | | (0.18% | ) | | | 4.35% | | | | 2.04% | | | | 3.71% | | | | 0.48% | | | | 3.35% | |
Net assets, end of period (000) | | | $48,915 | | | | $57,339 | | | | $51,462 | | | | $67,287 | | | | $93,691 | | | | $137,672 | |
Ratio of net expenses to average net assets | | | 0.90% | (c) | | | 0.88% | | | | 0.90% | | | | 0.90% | | | | 0.90% | | | | 0.90% | |
Ratio of gross expenses to average net assets prior to expense reductions | | | 1.13% | (c) | | | 1.07% | | | | 1.13% | | | | 1.05% | | | | 0.99% | | | | 0.98% | |
Ratio of net investment income (loss) to average net assets | | | 2.22% | (c) | | | 2.25% | | | | 2.49% | | | | 2.47% | | | | 1.97% | | | | 1.98% | |
| | |
| | | (Unaudited) Six Months
Ended
April 30, | | | Year Ended October 31, | |
| | | 2017 | | | 2016 | | | 2015 | | | 2014 | | | 2013 | | | 2012 | |
Portfolio turnover rate | | | 28.3% | | | | 54.0% | | | | 80.0% | | | | 35.3% | | | | 32.5% | | | | 34.4% | |
| (a) | Net investment income (loss) allocated based on average shares method. |
| (b) | Total return measures net investment income (loss) and capital gain or loss from portfolio investments assuming reinvestment of dividends and capital gains distributions. Total return is not annualized for periods that are less than a full year, does not reflect the effect of sales charge for Class A shares nor the contingent deferred sales charge for Class B and C shares and does not reflect the deduction of taxes that a shareholder would pay on fund distributions or the redemption of fund shares. |
| | | | |
| 212 | | CALAMOS OPEN-END FAMILY OF FUNDS SEMIANNUAL REPORT | | |
Calamos Total Return Bond Fund Financial Highlights
| | | | | | | | | | | | | | | | | | | | | | | | |
| | | CLASS B | |
| | | (Unaudited) Six Months
Ended
April 30, | | | Year Ended October 31, | |
| | | 2017 | | | 2016 | | | 2015 | | | 2014 | | | 2013 | | | 2012 | |
Net asset value, beginning of period | | | $10.54 | | | | $10.51 | | | | $10.70 | | | | $10.89 | | | | $11.15 | | | | $11.14 | |
Income from investment operations: | | | | | | | | | | | | | | | | | | | | | | | | |
Net investment income (loss)(a) | | | 0.07 | | | | 0.16 | | | | 0.19 | | | | 0.18 | | | | 0.13 | | | | 0.14 | |
Net realized and unrealized gain (loss) | | | (0.12 | ) | | | 0.20 | | | | (0.06 | ) | | | 0.12 | | | | (0.16 | ) | | | 0.14 | |
Total from investment operations | | | (0.05 | ) | | | 0.36 | | | | 0.13 | | | | 0.30 | | | | (0.03 | ) | | | 0.28 | |
Distributions: | | | | | | | | | | | | | | | | | | | | | | | | |
Dividends from net investment income | | | (0.09 | ) | | | (0.20 | ) | | | (0.20 | ) | | | (0.45 | ) | | | (0.18 | ) | | | (0.23 | ) |
Dividends from net realized gains | | | (0.01 | ) | | | (0.13 | ) | | | (0.12 | ) | | | (0.04 | ) | | | (0.05 | ) | | | (0.04 | ) |
Total distributions | | | (0.10 | ) | | | (0.33 | ) | | | (0.32 | ) | | | (0.49 | ) | | | (0.23 | ) | | | (0.27 | ) |
Net asset value, end of period | | | $10.39 | | | | $10.54 | | | | $10.51 | | | | $10.70 | | | | $10.89 | | | | $11.15 | |
Ratios and supplemental data: | | | | | | | | | | | | | | | | | | | | | | | | |
Total return(b) | | | (0.46% | ) | | | 3.57% | | | | 1.29% | | | | 2.94% | | | | (0.27% | ) | | | 2.59% | |
Net assets, end of period (000) | | | $106 | | | | $604 | | | | $1,031 | | | | $1,879 | | | | $5,319 | | | | $9,108 | |
Ratio of net expenses to average net assets | | | 1.65% | (c) | | | 1.64% | | | | 1.65% | | | | 1.65% | | | | 1.65% | | | | 1.65% | |
Ratio of gross expenses to average net assets prior to expense reductions | | | 1.87% | (c) | | | 1.83% | | | | 1.88% | | | | 1.80% | | | | 1.74% | | | | 1.73% | |
Ratio of net investment income (loss) to average net assets | | | 1.45% | (c) | | | 1.53% | | | | 1.76% | | | | 1.72% | | | | 1.22% | | | | 1.25% | |
| |
| | | CLASS C | |
| | | (Unaudited) Six Months
Ended
April 30, | | | Year Ended October 31, | |
| | | 2017 | | | 2016 | | | 2015 | | | 2014 | | | 2013 | | | 2012 | |
Net asset value, beginning of period | | | $10.54 | | | | $10.51 | | | | $10.70 | | | | $10.89 | | | | $11.15 | | | | $11.13 | |
Income from investment operations: | | | | | | | | | | | | | | | | | | | | | | | | |
Net investment income (loss)(a) | | | 0.08 | | | | 0.16 | | | | 0.18 | | | | 0.18 | | | | 0.13 | | | | 0.14 | |
Net realized and unrealized gain (loss) | | | (0.14 | ) | | | 0.20 | | | | (0.05 | ) | | | 0.12 | | | | (0.16 | ) | | | 0.15 | |
Total from investment operations | | | (0.06 | ) | | | 0.36 | | | | 0.13 | | | | 0.30 | | | | (0.03 | ) | | | 0.29 | |
Distributions: | | | | | | | | | | | | | | | | | | | | | | | | |
Dividends from net investment income | | | (0.09 | ) | | | (0.20 | ) | | | (0.20 | ) | | | (0.45 | ) | | | (0.18 | ) | | | (0.23 | ) |
Dividends from net realized gains | | | (0.01 | ) | | | (0.13 | ) | | | (0.12 | ) | | | (0.04 | ) | | | (0.05 | ) | | | (0.04 | ) |
Total distributions | | | (0.10 | ) | | | (0.33 | ) | | | (0.32 | ) | | | (0.49 | ) | | | (0.23 | ) | | | (0.27 | ) |
Net asset value, end of period | | | $10.38 | | | | $10.54 | | | | $10.51 | | | | $10.70 | | | | $10.89 | | | | $11.15 | |
Ratios and supplemental data: | | | | | | | | | | | | | | | | | | | | | | | | |
Total return(b) | | | (0.55% | ) | | | 3.57% | | | | 1.28% | | | | 2.94% | | | | (0.27% | ) | | | 2.68% | |
Net assets, end of period (000) | | | $12,948 | | | | $16,340 | | | | $15,898 | | | | $17,818 | | | | $25,964 | | | | $43,823 | |
Ratio of net expenses to average net assets | | | 1.65% | (c) | | | 1.63% | | | | 1.65% | | | | 1.65% | | | | 1.65% | | | | 1.65% | |
Ratio of gross expenses to average net assets prior to expense reductions | | | 1.88% | (c) | | | 1.82% | | | | 1.88% | | | | 1.80% | | | | 1.74% | | | | 1.73% | |
Ratio of net investment income (loss) to average net assets | | | 1.47% | (c) | | | 1.51% | | | | 1.74% | | | | 1.73% | | | | 1.23% | | | | 1.25% | |
| (a) | Net investment income (loss) allocated based on average shares method. |
| (b) | Total return measures net investment income (loss) and capital gain or loss from portfolio investments assuming reinvestment of dividends and capital gains distributions. Total return is not annualized for periods that are less than a full year, does not reflect the effect of sales charge for Class A shares nor the contingent deferred sales charge for Class B and C shares and does not reflect the deduction of taxes that a shareholder would pay on fund distributions or the redemption of fund shares. |
Calamos Total Return Bond Fund Financial Highlights
| | | | | | | | | | | | | | | | | | | | | | | | |
| | | CLASS I | |
| | | (Unaudited) Six Months
Ended
April 30, | | | Year Ended October 31, | |
| | | 2017 | | | 2016 | | | 2015 | | | 2014 | | | 2013 | | | 2012 | |
Net asset value, beginning of period | | | $10.54 | | | | $10.51 | | | | $10.70 | | | | $10.89 | | | | $11.15 | | | | $11.13 | |
Income from investment operations: | | | | | | | | | | | | | | | | | | | | | | | | |
Net investment income (loss)(a) | | | 0.13 | | | | 0.26 | | | | 0.29 | | | | 0.29 | | | | 0.24 | | | | 0.25 | |
Net realized and unrealized gain (loss) | | | (0.14 | ) | | | 0.21 | | | | (0.05 | ) | | | 0.12 | | | | (0.16 | ) | | | 0.15 | |
Total from investment operations | | | (0.01 | ) | | | 0.47 | | | | 0.24 | | | | 0.41 | | | | 0.08 | | | | 0.40 | |
Distributions: | | | | | | | | | | | | | | | | | | | | | | | | |
Dividends from net investment income | | | (0.14 | ) | | | (0.31 | ) | | | (0.31 | ) | | | (0.56 | ) | | | (0.29 | ) | | | (0.34 | ) |
Dividends from net realized gains | | | (0.01 | ) | | | (0.13 | ) | | | (0.12 | ) | | | (0.04 | ) | | | (0.05 | ) | | | (0.04 | ) |
Total distributions | | | (0.15 | ) | | | (0.44 | ) | | | (0.43 | ) | | | (0.60 | ) | | | (0.34 | ) | | | (0.38 | ) |
Net asset value, end of period | | | $10.38 | | | | $10.54 | | | | $10.51 | | | | $10.70 | | | | $10.89 | | | | $11.15 | |
Ratios and supplemental data: | | | | | | | | | | | | | | | | | | | | | | | | |
Total return(b) | | | (0.06% | ) | | | 4.60% | | | | 2.30% | | | | 3.97% | | | | 0.73% | | | | 3.70% | |
Net assets, end of period (000) | | | $19,025 | | | | $22,067 | | | | $16,561 | | | | $13,347 | | | | $41,109 | | | | $43,464 | |
Ratio of net expenses to average net assets | | | 0.65% | (c) | | | 0.63% | | | | 0.65% | | | | 0.65% | | | | 0.65% | | | | 0.65% | |
Ratio of gross expenses to average net assets prior to expense reductions | | | 0.88% | (c) | | | 0.82% | | | | 0.88% | | | | 0.80% | | | | 0.74% | | | | 0.73% | |
Ratio of net investment income (loss) to average net assets | | | 2.47% | (c) | | | 2.49% | | | | 2.73% | | | | 2.70% | | | | 2.22% | | | | 2.24% | |
| |
| | | CLASS R | |
| | | (Unaudited) Six Months
Ended
April 30, | | | Year Ended October 31, | |
| | | 2017 | | | 2016 | | | 2015 | | | 2014 | | | 2013 | | | 2012 | |
Net asset value, beginning of period | | | $10.52 | | | | $10.51 | | | | $10.70 | | | | $10.89 | | | | $11.15 | | | | $11.14 | |
Income from investment operations: | | | | | | | | | | | | | | | | | | | | | | | | |
Net investment income (loss)(a) | | | 0.10 | | | | 0.21 | | | | 0.23 | | | | 0.23 | | | | 0.19 | | | | 0.19 | |
Net realized and unrealized gain (loss) | | | (0.13 | ) | | | 0.18 | | | | (0.04 | ) | | | 0.13 | | | | (0.17 | ) | | | 0.15 | |
Total from investment operations | | | (0.03 | ) | | | 0.39 | | | | 0.19 | | | | 0.36 | | | | 0.02 | | | | 0.34 | |
Distributions: | | | | | | | | | | | | | | | | | | | | | | | | |
Dividends from net investment income | | | (0.12 | ) | | | (0.25 | ) | | | (0.26 | ) | | | (0.51 | ) | | | (0.23 | ) | | | (0.29 | ) |
Dividends from net realized gains | | | (0.01 | ) | | | (0.13 | ) | | | (0.12 | ) | | | (0.04 | ) | | | (0.05 | ) | | | (0.04 | ) |
Total distributions | | | (0.13 | ) | | | (0.38 | ) | | | (0.38 | ) | | | (0.55 | ) | | | (0.28 | ) | | | (0.33 | ) |
Net asset value, end of period | | | $10.36 | | | | $10.52 | | | | $10.51 | | | | $10.70 | | | | $10.89 | | | | $11.15 | |
Ratios and supplemental data: | | | | | | | | | | | | | | | | | | | | | | | | |
Total return(b) | | | (0.31% | ) | | | 3.89% | | | | 1.79% | | | | 3.45% | | | | 0.22% | | | | 3.09% | |
Net assets, end of period (000) | | | $359 | | | | $528 | | | | $274 | | | | $234 | | | | $2,248 | | | | $1,756 | |
Ratio of net expenses to average net assets | | | 1.15% | (c) | | | 1.12% | | | | 1.15% | | | | 1.15% | | | | 1.15% | | | | 1.15% | |
Ratio of gross expenses to average net assets prior to expense reductions | | | 1.38% | (c) | | | 1.31% | | | | 1.38% | | | | 1.28% | | | | 1.24% | | | | 1.23% | |
Ratio of net investment income (loss) to average net assets | | | 1.96% | (c) | | | 1.99% | | | | 2.23% | | | | 2.14% | | | | 1.72% | | | | 1.74% | |
| (a) | Net investment income (loss) allocated based on average shares method. |
| (b) | Total return measures net investment income (loss) and capital gain or loss from portfolio investments assuming reinvestment of dividends and capital gains distributions. Total return is not annualized for periods that are less than a full year, does not reflect the effect of sales charge for Class A shares nor the contingent deferred sales charge for Class B and C shares and does not reflect the deduction of taxes that a shareholder would pay on fund distributions or the redemption of fund shares. |
| | | | |
| 214 | | CALAMOS OPEN-END FAMILY OF FUNDS SEMIANNUAL REPORT | | |
Calamos Total Return Bond Fund Financial Highlights
| | | | |
| | | CLASS T | |
| | | (Unaudited)
February 28, 2017*
through
April 30, | |
| | | 2017 | |
Net asset value, beginning of period | | | $10.34 | |
Income from investment operations: | | | | |
Net investment income (loss)(a) | | | 0.04 | |
Net realized and unrealized gain (loss) | | | 0.04 | |
Total from investment operations | | | 0.08 | |
Distributions: | | | | |
Dividends from net investment income | | | (0.04 | ) |
Dividends from net realized gains | | | — | |
Total distributions | | | (0.04 | ) |
Net asset value, end of period | | | $10.38 | |
Ratios and supplemental data: | | | | |
Total return(b) | | | 0.75% | |
Net assets, end of period (000) | | | $25 | |
Ratio of net expenses to average net assets | | | 0.90% | (c) |
Ratio of gross expenses to average net assets prior to expense reductions | | | 1.16% | (c) |
Ratio of net investment income (loss) to average net assets | | | 2.14% | (c) |
| * | Commencement of operations. |
| (a) | Net investment income (loss) allocated based on average shares method. |
| (b) | Total return measures net investment income (loss) and capital gain or loss from portfolio investments assuming reinvestment of dividends and capital gains distributions. Total return is not annualized for periods that are less than a full year, does not reflect the effect of sales charge for Class A shares nor the contingent deferred sales charge for Class B and C shares and does not reflect the deduction of taxes that a shareholder would pay on fund distributions or the redemption of fund shares. |
Calamos High Income Fund Financial Highlights
Selected data for a share outstanding throughout each period were as follows:
| | | | | | | | | | | | | | | | | | | | | | | | |
| | | CLASS A | |
| | | (Unaudited) Six Months
Ended
April 30, | | | Year Ended October 31, | |
| | | 2017 | | | 2016 | | | 2015 | | | 2014 | | | 2013 | | | 2012 | |
Net asset value, beginning of period | | | $8.62 | | | | $8.63 | | | | $9.65 | | | | $9.90 | | | | $9.92 | | | | $9.68 | |
Income from investment operations: | | | | | | | | | | | | | | | | | | | | | | | | |
Net investment income (loss)(a) | | | 0.19 | | | | 0.40 | | | | 0.43 | | | | 0.48 | | | | 0.51 | | | | 0.53 | |
Net realized and unrealized gain (loss) | | | 0.24 | | | | 0.03 | | | | (0.74 | ) | | | 0.01 | | | | 0.18 | | | | 0.35 | |
Total from investment operations | | | 0.43 | | | | 0.43 | | | | (0.31 | ) | | | 0.49 | | | | 0.69 | | | | 0.88 | |
Distributions: | | | | | | | | | | | | | | | | | | | | | | | | |
Dividends from net investment income | | | (0.22 | ) | | | (0.44 | ) | | | (0.47 | ) | | | (0.55 | ) | | | (0.58 | ) | | | (0.51 | ) |
Dividends from net realized gains | | | — | | | | — | | | | (0.24 | ) | | | (0.19 | ) | | | (0.13 | ) | | | (0.13 | ) |
Return of capital | | | — | | | | — | | | | (0.00 | )* | | | — | | | | — | | | | — | |
Total distributions | | | (0.22 | ) | | | (0.44 | ) | | | (0.71 | ) | | | (0.74 | ) | | | (0.71 | ) | | | (0.64 | ) |
Net asset value, end of period | | | $8.83 | | | | $8.62 | | | | $8.63 | | | | $9.65 | | | | $9.90 | | | | $9.92 | |
Ratios and supplemental data: | | | | | | | | | | | | | | | | | | | | | | | | |
Total return(b) | | | 4.99% | | | | 5.26% | | | | (3.25% | ) | | | 5.11% | | | | 7.21% | | | | 9.39% | |
Net assets, end of period (000) | | | $38,290 | | | | $41,046 | | | | $71,513 | | | | $132,756 | | | | $201,791 | | | | $215,299 | |
Ratio of net expenses to average net assets | | | 1.44% | (c) | | | 1.33% | | | | 1.28% | | | | 1.18% | | | | 1.18% | | | | 1.19% | |
Ratio of gross expenses to average net assets prior to expense reductions | | | 1.44% | (c) | | | 1.33% | | | | 1.28% | | | | 1.18% | | | | 1.18% | | | | 1.19% | |
Ratio of net investment income (loss) to average net assets | | | 4.35% | (c) | | | 4.81% | | | | 4.73% | | | | 4.84% | | | | 5.11% | | | | 5.46% | |
| | |
| | | (Unaudited) Six Months
Ended
April 30, | | | Year Ended October 31, | |
| | | 2017 | | | 2016 | | | 2015 | | | 2014 | | | 2013 | | | 2012 | |
Portfolio turnover rate | | | 20.8% | | | | 44.4% | | | | 65.3% | | | | 51.2% | | | | 55.1% | | | | 73.9% | |
| * | Amounts are less than $0.005. |
| (a) | Net investment income (loss) allocated based on average shares method. |
| (b) | Total return measures net investment income (loss) and capital gain or loss from portfolio investments assuming reinvestment of dividends and capital gains distributions. Total return is not annualized for periods that are less than a full year, does not reflect the effect of sales charge for Class A shares nor the contingent deferred sales charge for Class B and C shares and does not reflect the deduction of taxes that a shareholder would pay on fund distributions or the redemption of fund shares. |
| | | | |
| 216 | | CALAMOS OPEN-END FAMILY OF FUNDS SEMIANNUAL REPORT | | |
Calamos High Income Fund Financial Highlights
| | | | | | | | | | | | | | | | | | | | | | | | |
| | | CLASS B | |
| | | (Unaudited) Six Months
Ended
April 30, | | | Year Ended October 31, | |
| | | 2017 | | | 2016 | | | 2015 | | | 2014 | | | 2013 | | | 2012 | |
Net asset value, beginning of period | | | $9.14 | | | | $9.13 | | | | $10.16 | | | | $10.38 | | | | $10.36 | | | | $10.09 | |
Income from investment operations: | | | | | | | | | | | | | | | | | | | | | | | | |
Net investment income (loss)(a) | | | 0.17 | | | | 0.36 | | | | 0.38 | | | | 0.42 | | | | 0.46 | | | | 0.48 | |
Net realized and unrealized gain (loss) | | | 0.24 | | | | 0.02 | | | | (0.78 | ) | | | 0.02 | | | | 0.18 | | | | 0.36 | |
Total from investment operations | | | 0.41 | | | | 0.38 | | | | (0.40 | ) | | | 0.44 | | | | 0.64 | | | | 0.84 | |
Distributions: | | | | | | | | | | | | | | | | | | | | | | | | |
Dividends from net investment income | | | (0.17 | ) | | | (0.37 | ) | | | (0.39 | ) | | | (0.47 | ) | | | (0.49 | ) | | | (0.44 | ) |
Dividends from net realized gains | | | — | | | | — | | | | (0.24 | ) | | | (0.19 | ) | | | (0.13 | ) | | | (0.13 | ) |
Return of capital | | | — | | | | — | | | | (0.00 | )* | | | — | | | | — | | | | — | |
Total distributions | | | (0.17 | ) | | | (0.37 | ) | | | (0.63 | ) | | | (0.66 | ) | | | (0.62 | ) | | | (0.57 | ) |
Net asset value, end of period | | | $9.38 | | | | $9.14 | | | | $9.13 | | | | $10.16 | | | | $10.38 | | | | $10.36 | |
Ratios and supplemental data: | | | | | | | | | | | | | | | | | | | | | | | | |
Total return(b) | | | 4.55% | | | | 4.38% | | | | (3.93% | ) | | | 4.37% | | | | 6.40% | | | | 8.55% | |
Net assets, end of period (000) | | | $71 | | | | $260 | | | | $677 | | | | $2,098 | | | | $3,340 | | | | $5,973 | |
Ratio of net expenses to average net assets | | | 2.19% | (c) | | | 2.09% | | | | 2.03% | | | | 1.93% | | | | 1.93% | | | | 1.95% | |
Ratio of gross expenses to average net assets prior to expense reductions | | | 2.19% | (c) | | | 2.09% | | | | 2.03% | | | | 1.93% | | | | 1.93% | | | | 1.95% | |
Ratio of net investment income (loss) to average net assets | | | 3.67% | (c) | | | 4.12% | | | | 4.00% | | | | 4.10% | | | | 4.39% | | | | 4.73% | |
| |
| | | CLASS C | |
| | | (Unaudited) Six Months
Ended
April 30, | | | Year Ended October 31, | |
| | | 2017 | | | 2016 | | | 2015 | | | 2014 | | | 2013 | | | 2012 | |
Net asset value, beginning of period | | | $9.03 | | | | $9.03 | | | | $10.06 | | | | $10.29 | | | | $10.28 | | | | $10.01 | |
Income from investment operations: | | | | | | | | | | | | | | | | | | | | | | | | |
Net investment income (loss)(a) | | | 0.16 | | | | 0.36 | | | | 0.38 | | | | 0.42 | | | | 0.45 | | | | 0.48 | |
Net realized and unrealized gain (loss) | | | 0.25 | | | | 0.01 | | | | (0.78 | ) | | | 0.01 | | | | 0.19 | | | | 0.36 | |
Total from investment operations | | | 0.41 | | | | 0.37 | | | | (0.40 | ) | | | 0.43 | | | | 0.64 | | | | 0.84 | |
Distributions: | | | | | | | | | | | | | | | | | | | | | | | | |
Dividends from net investment income | | | (0.18 | ) | | | (0.37 | ) | | | (0.39 | ) | | | (0.47 | ) | | | (0.50 | ) | | | (0.44 | ) |
Dividends from net realized gains | | | — | | | | — | | | | (0.24 | ) | | | (0.19 | ) | | | (0.13 | ) | | | (0.13 | ) |
Return of capital | | | — | | | | — | | | | (0.00 | )* | | | — | | | | — | | | | — | |
Total distributions | | | (0.18 | ) | | | (0.37 | ) | | | (0.63 | ) | | | (0.66 | ) | | | (0.63 | ) | | | (0.57 | ) |
Net asset value, end of period | | | $9.26 | | | | $9.03 | | | | $9.03 | | | | $10.06 | | | | $10.29 | | | | $10.28 | |
Ratios and supplemental data: | | | | | | | | | | | | | | | | | | | | | | | | |
Total return(b) | | | 4.60% | | | | 4.35% | | | | (3.94% | ) | | | 4.32% | | | | 6.37% | | | | 8.65% | |
Net assets, end of period (000) | | | $15,841 | | | | $17,479 | | | | $21,149 | | | | $29,333 | | | | $34,146 | | | | $43,141 | |
Ratio of net expenses to average net assets | | | 2.19% | (c) | | | 2.08% | | | | 2.04% | | | | 1.93% | | | | 1.93% | | | | 1.94% | |
Ratio of gross expenses to average net assets prior to expense reductions | | | 2.19% | (c) | | | 2.08% | | | | 2.04% | | | | 1.93% | | | | 1.93% | | | | 1.94% | |
Ratio of net investment income (loss) to average net assets | | | 3.60% | (c) | | | 4.07% | | | | 3.98% | | | | 4.10% | | | | 4.37% | | | | 4.72% | |
| * | Amounts are less than $0.005. |
| (a) | Net investment income (loss) allocated based on average shares method. |
| (b) | Total return measures net investment income (loss) and capital gain or loss from portfolio investments assuming reinvestment of dividends and capital gains distributions. Total return is not annualized for periods that are less than a full year, does not reflect the effect of sales charge for Class A shares nor the contingent deferred sales charge for Class B and C shares and does not reflect the deduction of taxes that a shareholder would pay on fund distributions or the redemption of fund shares. |
Calamos High Income Fund Financial Highlights
| | | | | | | | | | | | | | | | | | | | | | | | |
| | | CLASS I | |
| | | (Unaudited) Six Months
Ended
April 30, | | | Year Ended October 31, | |
| | | 2017 | | | 2016 | | | 2015 | | | 2014 | | | 2013 | | | 2012 | |
Net asset value, beginning of period | | | $8.61 | | | | $8.63 | | | | $9.65 | | | | $9.90 | | | | $9.92 | | | | $9.68 | |
Income from investment operations: | | | | | | | | | | | | | | | | | | | | | | | | |
Net investment income (loss)(a) | | | 0.20 | | | | 0.42 | | | | 0.45 | | | | 0.50 | | | | 0.53 | | | | 0.56 | |
Net realized and unrealized gain (loss) | | | 0.24 | | | | 0.02 | | | | (0.74 | ) | | | 0.02 | | | | 0.19 | | | | 0.34 | |
Total from investment operations | | | 0.44 | | | | 0.44 | | | | (0.29 | ) | | | 0.52 | | | | 0.72 | | | | 0.90 | |
Distributions: | | | | | | | | | | | | | | | | | | | | | | | | |
Dividends from net investment income | | | (0.23 | ) | | | (0.46 | ) | | | (0.49 | ) | | | (0.58 | ) | | | (0.61 | ) | | | (0.53 | ) |
Dividends from net realized gains | | | — | | | | — | | | | (0.24 | ) | | | (0.19 | ) | | | (0.13 | ) | | | (0.13 | ) |
Return of capital | | | — | | | | — | | | | (0.00 | )* | | | — | | | | — | | | | — | |
Total distributions | | | (0.23 | ) | | | (0.46 | ) | | | (0.73 | ) | | | (0.77 | ) | | | (0.74 | ) | | | (0.66 | ) |
Net asset value, end of period | | | $8.82 | | | | $8.61 | | | | $8.63 | | | | $9.65 | | | | $9.90 | | | | $9.92 | |
Ratios and supplemental data: | | | | | | | | | | | | | | | | | | | | | | | | |
Total return(b) | | | 5.12% | | | | 5.41% | | | | (3.00% | ) | | | 5.37% | | | | 7.50% | | | | 9.63% | |
Net assets, end of period (000) | | | $9,234 | | | | $15,183 | | | | $17,452 | | | | $24,342 | | | | $25,103 | | | | $33,271 | |
Ratio of net expenses to average net assets | | | 1.19% | (c) | | | 1.08% | | | | 1.04% | | | | 0.93% | | | | 0.93% | | | | 0.94% | |
Ratio of gross expenses to average net assets prior to expense reductions | | | 1.19% | (c) | | | 1.08% | | | | 1.04% | | | | 0.93% | | | | 0.93% | | | | 0.94% | |
Ratio of net investment income (loss) to average net assets | | | 4.60% | (c) | | | 5.07% | | | | 4.98% | | | | 5.10% | | | | 5.37% | | | | 5.71% | |
| |
| | | CLASS R | |
| | | (Unaudited) Six Months
Ended
April 30, | | | Year Ended October 31, | |
| | | 2017 | | | 2016 | | | 2015 | | | 2014 | | | 2013 | | | 2012 | |
Net asset value, beginning of period | | | $8.60 | | | | $8.62 | | | | $9.64 | | | | $9.89 | | | | $9.91 | | | | $9.67 | |
Income from investment operations: | | | | | | | | | | | | | | | | | | | | | | | | |
Net investment income (loss)(a) | | | 0.18 | | | | 0.38 | | | | 0.41 | | | | 0.45 | | | | 0.48 | | | | 0.51 | |
Net realized and unrealized gain (loss) | | | 0.22 | | | | 0.02 | | | | (0.75 | ) | | | 0.02 | | | | 0.18 | | | | 0.34 | |
Total from investment operations | | | 0.40 | | | | 0.40 | | | | (0.34 | ) | | | 0.47 | | | | 0.66 | | | | 0.85 | |
Distributions: | | | | | | | | | | | | | | | | | | | | | | | | |
Dividends from net investment income | | | (0.20 | ) | | | (0.42 | ) | | | (0.44 | ) | | | (0.53 | ) | | | (0.55 | ) | | | (0.48 | ) |
Dividends from net realized gains | | | — | | | | — | | | | (0.24 | ) | | | (0.19 | ) | | | (0.13 | ) | | | (0.13 | ) |
Return of capital | | | — | | | | — | | | | (0.00 | )* | | | — | | | | — | | | | — | |
Total distributions | | | (0.20 | ) | | | (0.42 | ) | | | (0.68 | ) | | | (0.72 | ) | | | (0.68 | ) | | | (0.61 | ) |
Net asset value, end of period | | | $8.80 | | | | $8.60 | | | | $8.62 | | | | $9.64 | | | | $9.89 | | | | $9.91 | |
Ratios and supplemental data: | | | | | | | | | | | | | | | | | | | | | | | | |
Total return(b) | | | 4.72% | | | | 4.90% | | | | (3.48% | ) | | | 4.87% | | | | 6.92% | | | | 9.17% | |
Net assets, end of period (000) | | | $150 | | | | $272 | | | | $154 | | | | $209 | | | | $192 | | | | $373 | |
Ratio of net expenses to average net assets | | | 1.69% | (c) | | | 1.57% | | | | 1.54% | | | | 1.43% | | | | 1.43% | | | | 1.44% | |
Ratio of gross expenses to average net assets prior to expense reductions | | | 1.69% | (c) | | | 1.57% | | | | 1.54% | | | | 1.43% | | | | 1.43% | | | | 1.44% | |
Ratio of net investment income (loss) to average net assets | | | 4.12% | (c) | | | 4.55% | | | | 4.49% | | | | 4.60% | | | | 4.89% | | | | 5.21% | |
| * | Amounts are less than $0.005. |
| (a) | Net investment income (loss) allocated based on average shares method. |
| (b) | Total return measures net investment income (loss) and capital gain or loss from portfolio investments assuming reinvestment of dividends and capital gains distributions. Total return is not annualized for periods that are less than a full year, does not reflect the effect of sales charge for Class A shares nor the contingent deferred sales charge for Class B and C shares and does not reflect the deduction of taxes that a shareholder would pay on fund distributions or the redemption of fund shares. |
| | | | |
| 218 | | CALAMOS OPEN-END FAMILY OF FUNDS SEMIANNUAL REPORT | | |
Calamos High Income Fund Financial Highlights
| | | | |
| | | CLASS T | |
| | | (Unaudited)
February 28, 2017*
through
April 30, | |
| | | 2017 | |
Net asset value, beginning of period | | | $8.87 | |
Income from investment operations: | | | | |
Net investment income (loss)(a) | | | 0.06 | |
Net realized and unrealized gain (loss) | | | 0.01 | |
Total from investment operations | | | 0.07 | |
Distributions: | | | | |
Dividends from net investment income | | | (0.08 | ) |
Total distributions | | | (0.08 | ) |
Net asset value, end of period | | | $8.86 | |
Ratios and supplemental data: | | | | |
Total return(b) | | | 0.75% | |
Net assets, end of period (000) | | | $25 | |
Ratio of net expenses to average net assets | | | 1.42% | (c) |
Ratio of gross expenses to average net assets prior to expense reductions | | | 1.42% | (c) |
Ratio of net investment income (loss) to average net assets | | | 4.01% | (c) |
| * | Commencement of operations. |
| (a) | Net investment income (loss) allocated based on average shares method. |
| (b) | Total return measures net investment income (loss) and capital gain or loss from portfolio investments assuming reinvestment of dividends and capital gains distributions. Total return is not annualized for periods that are less than a full year, does not reflect the effect of sales charge for Class A shares nor the contingent deferred sales charge for Class B and C shares and does not reflect the deduction of taxes that a shareholder would pay on fund distributions or the redemption of fund shares. |
Calamos Market Neutral Income Fund Financial Highlights
Selected data for a share outstanding throughout each period were as follows:
| | | | | | | | | | | | | | | | | | | | | | | | |
| | | CLASS A | |
| | | (Unaudited) Six Months
Ended
April 30, | | | Year Ended October 31, | |
| | | 2017 | | | 2016 | | | 2015 | | | 2014 | | | 2013 | | | 2012 | |
Net asset value, beginning of period | | | $13.13 | | | | $13.08 | | | | $13.13 | | | | $13.09 | | | | $12.68 | | | | $12.11 | |
Income from investment operations: | | | | | | | | | | | | | | | | | | | | | | | | |
Net investment income (loss)(a) | | | 0.12 | | | | 0.25 | | | | 0.21 | | | | 0.15 | | | | 0.17 | | | | 0.21 | |
Net realized and unrealized gain (loss) | | | 0.26 | | | | 0.16 | | | | — | | | | 0.27 | | | | 0.42 | | | | 0.51 | |
Total from investment operations | | | 0.38 | | | | 0.41 | | | | 0.21 | | | | 0.42 | | | | 0.59 | | | | 0.72 | |
Distributions: | | | | | | | | | | | | | | | | | | | | | | | | |
Dividends from net investment income | | | (0.08 | ) | | | (0.16 | ) | | | (0.12 | ) | | | (0.12 | ) | | | (0.18 | ) | | | (0.15 | ) |
Dividends from net realized gains | | | (0.20 | ) | | | (0.20 | ) | | | (0.14 | ) | | | (0.26 | ) | | | — | | | | — | |
Total distributions | | | (0.28 | ) | | | (0.36 | ) | | | (0.26 | ) | | | (0.38 | ) | | | (0.18 | ) | | | (0.15 | ) |
Net asset value, end of period | | | $13.23 | | | | $13.13 | | | | $13.08 | | | | $13.13 | | | | $13.09 | | | | $12.68 | |
Ratios and supplemental data: | | | | | | | | | | | | | | | | | | | | | | | | |
Total return(b) | | | 2.92% | | | | 3.16% | | | | 1.60% | | | | 3.27% | | | | 4.71% | | | | 6.01% | |
Net assets, end of period (000) | | | $898,848 | | | | $970,737 | | | | $1,051,576 | | | | $1,351,641 | | | | $1,354,180 | | | | $1,155,161 | |
Ratio of net expenses to average net assets | | | 1.27% | (d)(c) | | | 1.22% | (c) | | | 1.23% | | | | 1.20% | | | | 1.26% | | | | 1.17% | |
Ratio of gross expenses to average net assets prior to expense reductions | | | 1.27% | (d) | | | 1.22% | | | | 1.23% | | | | 1.20% | | | | 1.26% | | | | 1.17% | |
Ratio of net investment income (loss) to average net assets | | | 1.88% | (d) | | | 1.91% | | | | 1.58% | | | | 1.17% | | | | 1.33% | | | | 1.65% | |
| | |
| | | (Unaudited) Six Months
Ended
April 30, | | | Year Ended October 31, | |
| | | 2017 | | | 2016 | | | 2015 | | | 2014 | | | 2013 | | | 2012 | |
Portfolio turnover rate | | | 21.9% | | | | 37.5% | | | | 37.6% | | | | 70.5% | | | | 110.6% | | | | 82.8% | |
| (a) | Net investment income (loss) allocated based on average shares method. |
| (b) | Total return measures net investment income (loss) and capital gain or loss from portfolio investments assuming reinvestment of dividends and capital gains distributions. Total return is not annualized for periods that are less than a full year, does not reflect the effect of sales charge for Class A shares nor the contingent deferred sales charge for Class B and C shares and does not reflect the deduction of taxes that a shareholder would pay on fund distributions or the redemption of fund shares. |
| (c) | Ratio of net expenses, excluding dividend expense on short positions, to average net assets was 1.08% for the period ended April 30, 2017 and 1.08% for the year ended October 31, 2016. |
| | | | |
| 220 | | CALAMOS OPEN-END FAMILY OF FUNDS SEMIANNUAL REPORT | | |
Calamos Market Neutral Income Fund Financial Highlights
| | | | | | | | | | | | | | | | | | | | | | | | |
| | | CLASS B | |
| | | (Unaudited) Six Months
Ended
April 30, | | | Year Ended October 31, | |
| | | 2017 | | | 2016 | | | 2015 | | | 2014 | | | 2013 | | | 2012 | |
Net asset value, beginning of period | | | $13.96 | | | | $13.84 | | | | $13.87 | | | | $13.82 | | | | $13.36 | | | | $12.75 | |
Income from investment operations: | | | | | | | | | | | | | | | | | | | | | | | | |
Net investment income (loss)(a) | | | 0.08 | | | | 0.17 | | | | 0.12 | | | | 0.06 | | | | 0.08 | | | | 0.12 | |
Net realized and unrealized gain (loss) | | | 0.28 | | | | 0.16 | | | | — | | | | 0.27 | | | | 0.45 | | | | 0.54 | |
Total from investment operations | | | 0.36 | | | | 0.33 | | | | 0.12 | | | | 0.33 | | | | 0.53 | | | | 0.66 | |
Distributions: | | | | | | | | | | | | | | | | | | | | | | | | |
Dividends from net investment income | | | (0.01 | ) | | | (0.01 | ) | | | (0.01 | ) | | | (0.02 | ) | | | (0.07 | ) | | | (0.05 | ) |
Dividends from net realized gains | | | (0.20 | ) | | | (0.20 | ) | | | (0.14 | ) | | | (0.26 | ) | | | — | | | | — | |
Total distributions | | | (0.21 | ) | | | (0.21 | ) | | | (0.15 | ) | | | (0.28 | ) | | | (0.07 | ) | | | (0.05 | ) |
Net asset value, end of period | | | $14.11 | | | | $13.96 | | | | $13.84 | | | | $13.87 | | | | $13.82 | | | | $13.36 | |
Ratios and supplemental data: | | | | | | | | | | | | | | | | | | | | | | | | |
Total return(b) | | | 2.59% | | | | 2.38% | | | | 0.84% | | | | 2.43% | | | | 3.98% | | | | 5.18% | |
Net assets, end of period (000) | | | $252 | | | | $503 | | | | $1,832 | | | | $4,436 | | | | $9,117 | | | | $12,940 | |
Ratio of net expenses to average net assets | | | 2.02% | (d) (c) | | | 1.97% | (c) | | | 1.98% | | | | 1.95% | | | | 2.03% | | | | 1.92% | |
Ratio of gross expenses to average net assets prior to expense reductions | | | 2.02% | (d) | | | 1.97% | | | | 1.98% | | | | 1.95% | | | | 2.03% | | | | 1.92% | |
Ratio of net investment income (loss) to average net assets | | | 1.17% | (d) | | | 1.22% | | | | 0.83% | | | | 0.44% | | | | 0.60% | | | | 0.91% | |
| |
| | | CLASS C | |
| | | (Unaudited) Six Months
Ended
April 30, | | | Year Ended October 31, | |
| | | 2017 | | | 2016 | | | 2015 | | | 2014 | | | 2013 | | | 2012 | |
Net asset value, beginning of period | | | $13.33 | | | | $13.27 | | | | $13.32 | | | | $13.30 | | | | $12.88 | | | | $12.29 | |
Income from investment operations: | | | | | | | | | | | | | | | | | | | | | | | | |
Net investment income (loss)(a) | | | 0.07 | | | | 0.15 | | | | 0.11 | | | | 0.06 | | | | 0.08 | | | | 0.11 | |
Net realized and unrealized gain (loss) | | | 0.27 | | | | 0.17 | | | | 0.01 | | | | 0.26 | | | | 0.42 | | | | 0.54 | |
Total from investment operations | | | 0.34 | | | | 0.32 | | | | 0.12 | | | | 0.32 | | | | 0.50 | | | | 0.65 | |
Distributions: | | | | | | | | | | | | | | | | | | | | | | | | |
Dividends from net investment income | | | (0.03 | ) | | | (0.06 | ) | | | (0.03 | ) | | | (0.04 | ) | | | (0.08 | ) | | | (0.06 | ) |
Dividends from net realized gains | | | (0.20 | ) | | | (0.20 | ) | | | (0.14 | ) | | | (0.26 | ) | | | — | | | | — | |
Total distributions | | | (0.23 | ) | | | (0.26 | ) | | | (0.17 | ) | | | (0.30 | ) | | | (0.08 | ) | | | (0.06 | ) |
Net asset value, end of period | | | $13.44 | | | | $13.33 | | | | $13.27 | | | | $13.32 | | | | $13.30 | | | | $12.88 | |
Ratios and supplemental data: | | | | | | | | | | | | | | | | | | | | | | | | |
Total return(b) | | | 2.57% | | | | 2.41% | | | | 0.86% | | | | 2.40% | | | | 3.93% | | | | 5.28% | |
Net assets, end of period (000) | | | $307,335 | | | | $318,853 | | | | $339,054 | | | | $349,791 | | | | $289,520 | | | | $267,646 | |
Ratio of net expenses to average net assets | | | 2.02% | (d)(c) | | | 1.97% | (c) | | | 1.98% | | | | 1.95% | | | | 2.02% | | | | 1.92% | |
Ratio of gross expenses to average net assets prior to expense reductions | | | 2.02% | (d) | | | 1.97% | | | | 1.98% | | | | 1.95% | | | | 2.02% | | | | 1.92% | |
Ratio of net investment income (loss) to average net assets | | | 1.13% | (d) | | | 1.16% | | | | 0.83% | | | | 0.42% | | | | 0.58% | | | | 0.90% | |
| (a) | Net investment income (loss) allocated based on average shares method. |
| (b) | Total return measures net investment income (loss) and capital gain or loss from portfolio investments assuming reinvestment of dividends and capital gains distributions. Total return is not annualized for periods that are less than a full year, does not reflect the effect of sales charge for Class A shares nor the contingent deferred sales charge for Class B and C shares and does not reflect the deduction of taxes that a shareholder would pay on fund distributions or the redemption of fund shares. |
| (c) | Ratio of net expenses, excluding dividend expense on short positions, to average net assets was 1.83% for the period ended April 30, 2017 and 1.84% for the year ended October 31, 2016. |
Calamos Market Neutral Income Fund Financial Highlights
| | | | | | | | | | | | | | | | | | | | | | | | |
| | | CLASS I | |
| | | (Unaudited) Six Months
Ended
April 30, | | | Year Ended October 31, | |
| | | 2017 | | | 2016 | | | 2015 | | | 2014 | | | 2013 | | | 2012 | |
Net asset value, beginning of period | | | $12.98 | | | | $12.94 | | | | $12.99 | | | | $12.97 | | | | $12.56 | | | | $12.00 | |
Income from investment operations: | | | | | | | | | | | | | | | | | | | | | | | | |
Net investment income (loss)(a) | | | 0.14 | | | | 0.27 | | | | 0.24 | | | | 0.18 | | | | 0.20 | | | | 0.23 | |
Net realized and unrealized gain (loss) | | | 0.27 | | | | 0.16 | | | | — | | | | 0.25 | | | | 0.42 | | | | 0.51 | |
Total from investment operations | | | 0.41 | | | | 0.43 | | | | 0.24 | | | | 0.43 | | | | 0.62 | | | | 0.74 | |
Distributions: | | | | | | | | | | | | | | | | | | | | | | | | |
Dividends from net investment income | | | (0.10 | ) | | | (0.19 | ) | | | (0.15 | ) | | | (0.15 | ) | | | (0.21 | ) | | | (0.18 | ) |
Dividends from net realized gains | | | (0.20 | ) | | | (0.20 | ) | | | (0.14 | ) | | | (0.26 | ) | | | — | | | | — | |
Total distributions | | | (0.30 | ) | | | (0.39 | ) | | | (0.29 | ) | | | (0.41 | ) | | | (0.21 | ) | | | (0.18 | ) |
Net asset value, end of period | | | $13.09 | | | | $12.98 | | | | $12.94 | | | | $12.99 | | | | $12.97 | | | | $12.56 | |
Ratios and supplemental data: | | | | | | | | | | | | | | | | | | | | | | | | |
Total return(b) | | | 3.17% | | | | 3.38% | | | | 1.89% | | | | 3.40% | | | | 5.01% | | | | 6.25% | |
Net assets, end of period (000) | | | $3,154,302 | | | | $2,587,922 | | | | $2,377,641 | | | | $2,470,829 | | | | $1,574,197 | | | | $1,040,722 | |
Ratio of net expenses to average net assets | | | 1.01% | (d)(c) | | | 0.97% | (c) | | | 0.98% | | | | 0.95% | | | | 1.01% | | | | 0.92% | |
Ratio of gross expenses to average net assets prior to expense reductions | | | 1.01% | (d) | | | 0.97% | | | | 0.98% | | | | 0.95% | | | | 1.01% | | | | 0.92% | |
Ratio of net investment income (loss) to average net assets | | | 2.12% | (d) | | | 2.15% | | | | 1.83% | | | | 1.41% | | | | 1.57% | | | | 1.88% | |
| |
| | | CLASS R | |
| | | (Unaudited) Six Months
Ended
April 30, | | | Year Ended October 31, | |
| | | 2017 | | | 2016 | | | 2015 | | | 2014 | | | 2013 | | | 2012 | |
Net asset value, beginning of period | | | $13.07 | | | | $13.03 | | | | $13.08 | | | | $13.05 | | | | $12.64 | | | | $12.08 | |
Income from investment operations: | | | | | | | | | | | | | | | | | | | | | | | | |
Net investment income (loss)(a) | | | 0.11 | | | | 0.21 | | | | 0.17 | | | | 0.12 | | | | 0.14 | | | | 0.17 | |
Net realized and unrealized gain (loss) | | | 0.26 | | | | 0.15 | | | | 0.01 | | | | 0.26 | | | | 0.42 | | | | 0.52 | |
Total from investment operations | | | 0.37 | | | | 0.36 | | | | 0.18 | | | | 0.38 | | | | 0.56 | | | | 0.69 | |
Distributions: | | | | | | | | | | | | | | | | | | | | | | | | |
Dividends from net investment income | | | (0.06 | ) | | | (0.12 | ) | | | (0.09 | ) | | | (0.09 | ) | | | (0.15 | ) | | | (0.13 | ) |
Dividends from net realized gains | | | (0.20 | ) | | | (0.20 | ) | | | (0.14 | ) | | | (0.26 | ) | | | — | | | | — | |
Total distributions | | | (0.26 | ) | | | (0.32 | ) | | | (0.23 | ) | | | (0.35 | ) | | | (0.15 | ) | | | (0.13 | ) |
Net asset value, end of period | | | $13.18 | | | | $13.07 | | | | $13.03 | | | | $13.08 | | | | $13.05 | | | | $12.64 | |
Ratios and supplemental data: | | | | | | | | | | | | | | | | | | | | | | | | |
Total return(b) | | | 2.89% | | | | 2.84% | | | | 1.36% | | | | 2.97% | | | | 4.47% | | | | 5.72% | |
Net assets, end of period (000) | | | $8,326 | | | | $8,512 | | | | $8,464 | | | | $9,099 | | | | $5,408 | | | | $5,199 | |
Ratio of net expenses to average net assets | | | 1.52% | (d)(c) | | | 1.47% | (c) | | | 1.48% | | | | 1.45% | | | | 1.52% | | | | 1.42% | |
Ratio of gross expenses to average net assets prior to expense reductions | | | 1.52% | (d) | | | 1.47% | | | | 1.48% | | | | 1.45% | | | | 1.52% | | | | 1.42% | |
Ratio of net investment income (loss) to average net assets | | | 1.63% | (d) | | | 1.66% | | | | 1.33% | | | | 0.91% | | | | 1.08% | | | | 1.37% | |
| (a) | Net investment income (loss) allocated based on average shares method. |
| (b) | Total return measures net investment income (loss) and capital gain or loss from portfolio investments assuming reinvestment of dividends and capital gains distributions. Total return is not annualized for periods that are less than a full year, does not reflect the effect of sales charge for Class A shares nor the contingent deferred sales charge for Class B and C shares and does not reflect the deduction of taxes that a shareholder would pay on fund distributions or the redemption of fund shares. |
| (c) | Ratio of net expenses, excluding dividend expense on short positions, to average net assets was 0.83% and 1.33% for the period ended April 30, 2017 and 0.84% and 1.314% for the year ended October 31, 2016. |
| | | | |
| 222 | | CALAMOS OPEN-END FAMILY OF FUNDS SEMIANNUAL REPORT | | |
Calamos Market Neutral Income Fund Financial Highlights
| | | | |
| | | CLASS T | |
| | | (Unaudited)
February 28, 2017*
through
April 30, | |
| | | 2017 | |
Net asset value, beginning of period | | | $13.22 | |
Income from investment operations: | | | | |
Net investment income (loss)(a) | | | 0.04 | |
Total from investment operations | | | 0.04 | |
Distributions: | | | | |
Dividends from net investment income | | | (0.04 | ) |
Total distributions | | | (0.04 | ) |
Net asset value, end of period | | | $13.22 | |
Ratios and supplemental data: | | | | |
Total return(b) | | | 0.33% | |
Net assets, end of period (000) | | | $25 | |
Ratio of net expenses to average net assets | | | 1.22% | (c)(d) |
Ratio of gross expenses to average net assets prior to expense reductions | | | 1.22% | (c) |
Ratio of net investment income (loss) to average net assets | | | 1.72% | (c) |
| * | Commencement of operations. |
| (a) | Net investment income (loss) allocated based on average shares method. |
| (b) | Total return measures net investment income (loss) and capital gain or loss from portfolio investments assuming reinvestment of dividends and capital gains distributions. Total return is not annualized for periods that are less than a full year, does not reflect the effect of sales charge for Class A shares nor the contingent deferred sales charge for Class B and C shares and does not reflect the deduction of taxes that a shareholder would pay on fund distributions or the redemption of fund shares. |
| (d) | Ratio of net expenses, excluding dividend expense on short positions, to average net assets was 1.08% for the period ended April 30, 2017. |
Calamos Hedged Equity Income Fund Financial Highlights
Selected data for a share outstanding throughout each period were as follows:
| | | | | | | | | | | | |
| | | CLASS A | |
| | | (Unaudited)
Six Months
Ended
April 30, | | | Year Ended
October 31, | | | December 31, 2014*
through
October 31, | |
| | | 2017 | | | 2016 | | | 2015 | |
Net asset value, beginning of period | | | $10.03 | | | | $10.00 | | | | $10.00 | |
Income from investment operations: | | | | | | | | | | | | |
Net investment income (loss)(a) | | | 0.05 | | | | 0.10 | | | | 0.06 | |
Net realized and unrealized gain (loss) | | | 0.51 | | | | 0.17 | | | | 0.01 | |
Total from investment operations | | | 0.56 | | | | 0.27 | | | | 0.07 | |
Distributions: | | | | | | | | | | | | |
Dividends from net investment income | | | (0.04 | ) | | | (0.15 | ) | | | (0.07 | ) |
Dividends from net realized gains | | | — | | | | (0.09 | ) | | | — | |
Total distributions | | | (0.04 | ) | | | (0.24 | ) | | | (0.07 | ) |
Net asset value, end of period | | | $10.55 | | | | $10.03 | | | | $10.00 | |
Ratios and supplemental data: | | | | | | | | | | | | |
Total return(b) | | | 5.64% | | | | 2.79% | | | | 0.67% | |
Net assets, end of period (000) | | | $6,589 | | | | $10,275 | | | | $5,661 | |
Ratio of net expenses to average net assets | | | 1.22% | (c) | | | 1.22% | | | | 1.25% | (c) |
Ratio of gross expenses to average net assets prior to expense reductions | | | 2.08% | (c) | | | 2.03% | | | | 3.05% | (c) |
Ratio of net investment income (loss) to average net assets | | | 1.06% | (c) | | | 1.01% | | | | 0.78% | (c) |
| | | |
| | | (Unaudited)
Six Months
Ended
April 30, | | | Year Ended
October 31, | | | December 31, 2014*
through
October 31, | |
| | | 2017 | | | 2016 | | | 2015 | |
Portfolio turnover rate | | | 26.9% | | | | 19.6% | | | | 29.4% | |
| * | Commencement of operations. |
| (a) | Net investment income (loss) allocated based on average shares method. |
| (b) | Total return measures net investment income (loss) and capital gain or loss from portfolio investments assuming reinvestment of dividends and capital gains distributions. Total return is not annualized for periods that are less than a full year, does not reflect the effect of sales charge for Class A shares nor the contingent deferred sales charge for Class B and C shares and does not reflect the deduction of taxes that a shareholder would pay on fund distributions or the redemption of fund shares. |
| | | | |
| 224 | | CALAMOS OPEN-END FAMILY OF FUNDS SEMIANNUAL REPORT | | |
Calamos Hedged Equity Income Fund Financial Highlights
| | | | | | | | | | | | |
| | | CLASS C | |
| | | (Unaudited) Six Months
Ended
April 30, | | | Year Ended
October 31, | | | December 31, 2014*
through
October 31, | |
| | | 2017 | | | 2016 | | | 2015 | |
Net asset value, beginning of period | | | $10.00 | | | | $9.98 | | | | $10.00 | |
Income from investment operations: | | | | | | | | | | | | |
Net investment income (loss)(a) | | | 0.01 | | | | 0.03 | | | | (0.00 | )** |
Net realized and unrealized gain (loss) | | | 0.52 | | | | 0.16 | | | | 0.01 | |
Total from investment operations | | | 0.53 | | | | 0.19 | | | | 0.01 | |
Distributions: | | | | | | | | | | | | |
Dividends from net investment income | | | (0.02 | ) | | | (0.08 | ) | | | (0.03 | ) |
Dividends from net realized gains | | | — | | | | (0.09 | ) | | | — | |
Total distributions | | | (0.02 | ) | | | (0.17 | ) | | | (0.03 | ) |
Net asset value, end of period | | | $10.51 | | | | $10.00 | | | | $9.98 | |
Ratios and supplemental data: | | | | | | | | | | | | |
Total return(b) | | | 5.29% | | | | 1.92% | | | | 0.09% | |
Net assets, end of period (000) | | | $161 | | | | $156 | | | | $100 | |
Ratio of net expenses to average net assets | | | 1.97% | (c) | | | 1.97% | | | | 2.00% | (c) |
Ratio of gross expenses to average net assets prior to expense reductions | | | 2.91% | (c) | | | 2.79% | | | | 3.79% | (c) |
Ratio of net investment income (loss) to average net assets | | | 0.24% | (c) | | | 0.26% | | | | 0.03% | (c) |
| |
| | | CLASS I | |
| | | (Unaudited) Six Months
Ended
April 30, | | | Year Ended
October 31, | | | December 31, 2014*
through
October 31, | |
| | | 2017 | | | 2016 | | | 2015 | |
Net asset value, beginning of period | | | $10.04 | | | | $10.01 | | | | $10.00 | |
Income from investment operations: | | | | | | | | | | | | |
Net investment income (loss)(a) | | | 0.06 | | | | 0.13 | | | | 0.09 | |
Net realized and unrealized gain (loss) | | | 0.52 | | | | 0.17 | | | | — | |
Total from investment operations | | | 0.58 | | | | 0.30 | | | | 0.09 | |
Distributions: | | | | | | | | | | | | |
Dividends from net investment income | | | (0.06 | ) | | | (0.18 | ) | | | (0.08 | ) |
Dividends from net realized gains | | | — | | | | (0.09 | ) | | | — | |
Total distributions | | | (0.06 | ) | | | (0.27 | ) | | | (0.08 | ) |
Net asset value, end of period | | | $10.56 | | | | $10.04 | | | | $10.01 | |
Ratios and supplemental data: | | | | | | | | | | | | |
Total return(b) | | | 5.77% | | | | 3.02% | | | | 0.89% | |
Net assets, end of period (000) | | | $8,434 | | | | $8,035 | | | | $5,527 | |
Ratio of net expenses to average net assets | | | 0.97% | (c) | | | 0.97% | | | | 1.00% | (c) |
Ratio of gross expenses to average net assets prior to expense reductions | | | 1.91% | (c) | | | 1.81% | | | | 2.80% | (c) |
Ratio of net investment income (loss) to average net assets | | | 1.23% | (c) | | | 1.27% | | | | 1.03% | (c) |
| * | Commencement of operations. |
| ** | Amounts are less than $0.005. |
| (a) | Net investment income (loss) allocated based on average shares method. |
| (b) | Total return measures net investment income (loss) and capital gain or loss from portfolio investments assuming reinvestment of dividends and capital gains distributions. Total return is not annualized for periods that are less than a full year, does not reflect the effect of sales charge for Class A shares nor the contingent deferred sales charge for Class B and C shares and does not reflect the deduction of taxes that a shareholder would pay on fund distributions or the redemption of fund shares. |
Calamos Hedged Equity Income Fund Financial Highlights
| | | | |
| | | CLASS T | |
| | | (Unaudited)
February 28, 2017*
through
April 30, | |
| | | 2017 | |
Net asset value, beginning of period | | | $10.52 | |
Income from investment operations: | | | | |
Net investment income (loss)(a) | | | 0.01 | |
Net realized and unrealized gain (loss) | | | 0.02 | |
Total from investment operations | | | 0.03 | |
Distributions: | | | | |
Dividends from net investment income | | | (0.01 | ) |
Total distributions | | | (0.01 | ) |
Net asset value, end of period | | | $10.54 | |
Ratios and supplemental data: | | | | |
Total return(b) | | | 0.32% | |
Net assets, end of period (000) | | | $25 | |
Ratio of net expenses to average net assets | | | 1.15% | (c) |
Ratio of gross expenses to average net assets prior to expense reductions | | | 2.42% | (c) |
Ratio of net investment income (loss) to average net assets | | | 0.53% | (c) |
| * | Commencement of operations. |
| (a) | Net investment income (loss) allocated based on average shares method. |
| (b) | Total return measures net investment income (loss) and capital gain or loss from portfolio investments assuming reinvestment of dividends and capital gains distributions. Total return is not annualized for periods that are less than a full year, does not reflect the effect of sales charge for Class A shares nor the contingent deferred sales charge for Class B and C shares and does not reflect the deduction of taxes that a shareholder would pay on fund distributions or the redemption of fund shares. |
| | | | |
| 226 | | CALAMOS OPEN-END FAMILY OF FUNDS SEMIANNUAL REPORT | | |
Calamos Phineus Long/Short Fund Financial Highlights
Selected data for a share outstanding throughout each period were as follows:
| | | | | | | | |
| | | CLASS A | |
| | | (Unaudited)
Six Months
Ended
April 30, | | | April 5, 2016*
through
October 31, | |
| | | 2017 | | | 2016 | |
Net asset value, beginning of period | | | $10.77 | | | | $10.00 | |
Income from investment operations: | | | | | | | | |
Net investment income (loss)(a) | | | (0.08 | ) | | | (0.10 | ) |
Net realized and unrealized gain (loss) | | | 1.43 | | | | 0.87 | |
Total from investment operations | | | 1.35 | | | | 0.77 | |
Distributions: | | | | | | | | |
Dividends from net investment income | | | — | | | | — | |
Dividends from net realized gains | | | (0.10 | ) | | | — | |
Total distributions | | | (0.10 | ) | | | — | |
Net asset value, end of period | | | $12.02 | | | | $10.77 | |
Ratios and supplemental data: | | | | | | | | |
Total return(b) | | | 12.56% | | | | 7.70% | |
Net assets, end of period (000) | | | $37,614 | | | | $14,708 | |
Ratio of net expenses to average net assets | | | 2.82% | (c)(d) | | | 2.99% | (c)(d) |
Ratio of gross expenses to average net assets prior to expense reductions | | | 2.82% | (c) | | | 4.04% | (c) |
Ratio of net investment income (loss) to average net assets | | | (1.35% | )(c) | | | (1.77% | )(c) |
| | |
| | | (Unaudited)
Six Months
Ended
April 30, | | | April 5, 2016*
through
October 31, | |
| | | 2017 | | | 2016 | |
Portfolio turnover rate | | | 98.2% | | | | 177.6% | |
| * | Commencement of operations. |
| (a) | Net investment income (loss) allocated based on average shares method. |
| (b) | Total return measures net investment income (loss) and capital gain or loss from portfolio investments assuming reinvestment of dividends and capital gains distributions. Total return is not annualized for periods that are less than a full year, does not reflect the effect of sales charge for Class A shares nor the contingent deferred sales charge for Class B and C shares and does not reflect the deduction of taxes that a shareholder would pay on fund distributions or the redemption of fund shares. |
| (d) | Ratio of net expenses, excluding dividend expense on short positions, to average net assets was 1.82% for the period ended April 30, 2017 and 2.01% for the period ended October 31, 2016. |
Calamos Phineus Long/Short Fund Financial Highlights
| | | | | | | | |
| | | CLASS C | |
| | | (Unaudited)
Six Months
Ended
April 30, | | | April 5, 2016*
through
October 31, | |
| | | 2017 | | | 2016 | |
Net asset value, beginning of period | | | $10.73 | | | | $10.00 | |
Income from investment operations: | | | | | | | | |
Net investment income (loss)(a) | | | (0.12 | ) | | | (0.15 | ) |
Net realized and unrealized gain (loss) | | | 1.42 | | | | 0.88 | |
Total from investment operations | | | 1.30 | | | | 0.73 | |
Distributions: | | | | | | | | |
Dividends from net investment income | | | — | | | | — | |
Dividends from net realized gains | | | (0.10 | ) | | | — | |
Total distributions | | | (0.10 | ) | | | — | |
Net asset value, end of period | | | $11.93 | | | | $10.73 | |
Ratios and supplemental data: | | | | | | | | |
Total return(b) | | | 12.14% | | | | 7.30% | |
Net assets, end of period (000) | | | $15,248 | | | | $4,936 | |
Ratio of net expenses to average net assets | | | 3.54% | (c)(d) | | | 3.69% | (c)(d) |
Ratio of gross expenses to average net assets prior to expense reductions | | | 3.55% | (c) | | | 4.82% | (c) |
Ratio of net investment income (loss) to average net assets | | | (2.13% | )(c) | | | (2.54% | )(c) |
| |
| | | CLASS I | |
| | | (Unaudited)
Six Months
Ended
April 30, | | | April 5, 2016*
through
October 31, | |
| | | 2017 | | | 2016 | |
Net asset value, beginning of period | | | $10.80 | | | | $10.00 | |
Income from investment operations: | | | | | | | | |
Net investment income (loss)(a) | | | (0.07 | ) | | | (0.08 | ) |
Net realized and unrealized gain (loss) | | | 1.43 | | | | 0.88 | |
Total from investment operations | | | 1.36 | | | | 0.80 | |
Distributions: | | | | | | | | |
Dividends from net investment income | | | — | | | | — | |
Dividends from net realized gains | | | (0.10 | ) | | | — | |
Total distributions | | | (0.10 | ) | | | — | |
Net asset value, end of period | | | $12.06 | | | | $10.80 | |
Ratios and supplemental data: | | | | | | | | |
Total return(b) | | | 12.61% | | | | 8.00% | |
Net assets, end of period (000) | | | $199,800 | | | | $56,319 | |
Ratio of net expenses to average net assets | | | 2.52% | (c)(d) | | | 2.77% | (c)(d) |
Ratio of gross expenses to average net assets prior to expense reductions | | | 2.52% | (c) | | | 4.04% | (c) |
Ratio of net investment income (loss) to average net assets | | | (1.12% | )(c) | | | (1.33% | )(c) |
| * | Commencement of operations. |
| (a) | Net investment income (loss) allocated based on average shares method. |
| (b) | Total return measures net investment income (loss) and capital gain or loss from portfolio investments assuming reinvestment of dividends and capital gains distributions. Total return is not annualized for periods that are less than a full year, does not reflect the effect of sales charge for Class A shares nor the contingent deferred sales charge for Class B and C shares and does not reflect the deduction of taxes that a shareholder would pay on fund distributions or the redemption of fund shares. |
| (d) | Ratio of net expenses, excluding dividend expense on short positions, to average net assets was 2.56% and 1.55% for the period ended April 30, 2017 and 2.76% and 1.76% for the period ended October 31, 2016. |
| | | | |
| 228 | | CALAMOS OPEN-END FAMILY OF FUNDS SEMIANNUAL REPORT | | |
Calamos Phineus Long/Short Fund Financial Highlights
| | | | |
| | | CLASS T | |
| | | (Unaudited)
February 28, 2017*
through
April 30, | |
| | | 2017 | |
Net asset value, beginning of period | | | $11.80 | |
Income from investment operations: | | | | |
Net investment income (loss)(a) | | | (0.04 | ) |
Net realized and unrealized gain (loss) | | | 0.26 | |
Total from investment operations | | | 0.22 | |
Distributions: | | | | |
Dividends from net investment income | | | — | |
Net asset value, end of period | | | $12.02 | |
Ratios and supplemental data: | | | | |
Total return(b) | | | 1.86% | |
Net assets, end of period (000) | | | $25 | |
Ratio of net expenses to average net assets | | | 3.08% | (c)(d) |
Ratio of gross expenses to average net assets prior to expense reductions | | | 3.08% | (c) |
Ratio of net investment income (loss) to average net assets | | | (1.92% | )(c) |
| * | Commencement of operations. |
| (a) | Net investment income (loss) allocated based on average shares method. |
| (b) | Total return measures net investment income (loss) and capital gain or loss from portfolio investments assuming reinvestment of dividends and capital gains distributions. Total return is not annualized for periods that are less than a full year, does not reflect the effect of sales charge for Class A shares nor the contingent deferred sales charge for Class B and C shares and does not reflect the deduction of taxes that a shareholder would pay on fund distributions or the redemption of fund shares. |
| (d) | Ratio of net expenses, excluding dividend expense on short positions, to average net assets was 1.74% for the period ended April 30, 2017. |
Report of Independent Registered Public Accounting Firm
To the Board of Trustees and Shareholders of Calamos Investment Trust
We have reviewed the accompanying statements of assets and liabilities, including the schedules of investments, of Calamos Investment Trust (the “Trust”), including Calamos Growth Fund, Calamos Opportunistic Value Fund, Calamos Dividend Growth Fund, Calamos International Growth Fund, Calamos Evolving World Growth Fund, Calamos Emerging Market Equity Fund, Calamos Global Equity Fund, Calamos Growth and Income Fund, Calamos Global Growth and Income Fund, Calamos Convertible Fund, Calamos Global Convertible Fund, Calamos Total Return Bond Fund, Calamos High Income Fund, Calamos Market Neutral Income Fund, Calamos Hedged Equity Income Fund, and Calamos Phineus Long/Short Fund (the “Funds”), as of April 30, 2017, and the related statements of operations and changes in net assets, and the financial highlights for the six month period then ended. These financial statements and financial highlights are the responsibility of the Trust’s management.
We conducted our reviews in accordance with standards of the Public Company Accounting Oversight Board (United States). A review of financial information consists principally of applying analytical procedures and making inquiries of persons responsible for financial and accounting matters. It is substantially less in scope than an audit conducted in accordance with standards of the Public Company Accounting Oversight Board (United States), the objective of which is the expression of an opinion regarding the financial statements and financial highlights taken as a whole. Accordingly, we do not express such an opinion.
Based on our reviews, we are not aware of any material modifications that should be made to such financial statements and financial highlights for them to be in conformity with accounting principles generally accepted in the United States of America.
We have previously audited, in accordance with the standards of the Public Company Accounting Oversight Board (United States), the statements of changes in net assets of the Funds for the year or period ended October 31, 2016 and the financial highlights for each of the periods presented in the period then ended; and in our report dated December 15, 2016, we expressed an unqualified opinion on such statements of changes in net assets and financial highlights.

Chicago, Illinois
June 14, 2017
| | | | |
| 230 | | CALAMOS OPEN-END FAMILY OF FUNDS SEMIANNUAL REPORT | | |
MANAGING YOUR CALAMOS FUNDS INVESTMENTS
Calamos Investments offers several convenient means to monitor, manage and feel confident about your Calamos investment choice.
24-HOUR AUTOMATED SHAREHOLDER ASSISTANCE: 800.823.7386
Through a single toll-free number, Calamos 24-Hour Shareholder Assistance is fast and easy. Get fund prices and account balances, review recent transactions, order statements, literature and more.
PERSONAL ASSISTANCE: 800.582.6959
Dial this toll-free number to speak with a knowledgeable Client Services Representative who can help answer questions or address issues concerning your Calamos Fund.
ONLINE ACCOUNT MANAGEMENT: www.calamos.com
Manage your personal account of Calamos Funds online at www.calamos.com. On your account access page, you can view account history and download data.
YOUR FINANCIAL ADVISOR
We encourage you to talk to your financial advisor to determine how the Calamos Funds can benefit your investment portfolio based on your financial goals, risk tolerance, time horizon and income needs.
This report, including the audited financial statements contained herein, is submitted for general information for the shareholders of the Funds. The report is not authorized for distribution to prospective investors in the Funds unless accompanied by a currently effective prospectus of the Funds and, after July 31, 2017, updated performance data for the most recently completed fiscal quarter. The views expressed in this report reflect those of Calamos Advisors LLC only through April 30, 2017. The managers’ views are subject to change at any time based on market and other conditions.
A description of the Calamos Proxy Voting Policies and Procedures and the Funds’ proxy voting record for the 12-month period ended June 30, 2016 are available free of charge upon request by calling 800.582.6959, by visiting the Calamos Web site at www.calamos.com, or by writing Calamos at: Calamos Investments, Attn: Client Services, 2020 Calamos Court, Naperville, IL 60563. The Funds’ proxy voting record is also available free of charge by visiting the SEC Web site at www.sec.gov.
The Funds file a complete list of their portfolio holdings with the SEC for the first and third quarters each fiscal year on Form N-Q. The Forms N-Q are available free of charge, upon request, by calling or writing Calamos Investments at the phone number or address provided above or by visiting the SEC Web site at www.sec.gov. You may also review or, for a fee, copy the forms at the SEC’s Public Reference Room in Washington, D.C. Information on the operation of the Public Reference Room may be obtained by calling 800.732.0330.
FOR 24-HOUR AUTOMATED SHAREHOLDER ASSISTANCE: 800.823.7386
TO OBTAIN INFORMATION ABOUT YOUR INVESTMENTS: 800.582.6959
VISIT OUR WEB SITE: www.calamos.com
INVESTMENT ADVISER:
Calamos Advisors LLC
2020 Calamos Court
Naperville, IL 60563-2787
CUSTODIAN AND FUND ACCOUNTING AGENT:
State Street Bank and Trust Company
Boston, MA
TRANSFER AGENT:
U.S. Bancorp Fund Services, LLC
615 E. Michigan St., 3rd Floor
Milwaukee, WI 53202
INDEPENDENT REGISTERED PUBLIC ACCOUNTING FIRM:
Deloitte & Touche LLP
Chicago, IL
LEGAL COUNSEL:
Ropes & Gray LLP
Chicago, IL
| | |

| | STAY CONNECTED www.calamos.com/connect |
|
Visit our Web site for timely fund performance, detailed fund profiles, fund news and insightful market commentary. |

2020 Calamos Court
Naperville, IL 60563-2787
800.582.6959
www.calamos.com
© 2017 Calamos Investments LLC. All Rights Reserved.
Calamos® and Calamos Investments® are registered
trademarks of Calamos Investments LLC.
MFSAN 1631 2017
ITEM 2. CODE OF ETHICS.
Not applicable.
ITEM 3. AUDIT COMMITTEE FINANCIAL EXPERT.
Not applicable.
ITEM 4. PRINCIPAL ACCOUNTANT FEES AND SERVICES.
Not applicable.
ITEM 5. AUDIT COMMITTEE OF LISTED REGISTRANTS.
Not applicable.
ITEM 6. SCHEDULE OF INVESTMENTS
Included in the Report to Shareholders in Item 1.
ITEM 7. DISCLOSURE OF PROXY VOTING POLICIES AND PROCEDURES FOR CLOSED-END MANAGEMENT INVESTMENT COMPANIES.
Not applicable.
ITEM 8. PORTFOLIO MANAGERS OF CLOSED-END MANAGEMENT INVESTMENT COMPANIES.
Not applicable.
ITEM 9. PURCHASES OF EQUITY SECURITIES BY CLOSED-END MANAGEMENT INVESTMENT COMPANY AND AFFILIATED PURCHASERS.
Not applicable.
ITEM 10. SUBMISSION OF MATTERS TO A VOTE OF SECURITY HOLDERS.
No material changes.
ITEM 11. CONTROLS AND PROCEDURES.
a) The registrant’s principal executive officer and principal financial officer have evaluated the registrant’s disclosure controls and procedures within 90 days of this filing and have concluded that the registrant’s disclosure controls and procedures were effective, as of that date, in ensuring that information required to be disclosed by the registrant in this Form N-CSR was recorded, processed, summarized, and timely reported.
b) There were no changes in the registrant’s internal controls over financial reporting (as defined in Rule 30a-3(d) under the Investment Company Act of 1940) that occurred during the second fiscal quarter of the period covered by this report that has materially affected, or is reasonably likely to materially affect, the registrant’s internal control over financial reporting.
ITEM 12. EXHIBITS.
(a)(1) Code of Ethics - Not applicable.
(a)(2)(i) Certification of Principal Executive Officer.
(a)(2)(ii) Certification of Principal Financial Officer.
SIGNATURES
Pursuant to the requirements of the Securities Exchange Act of 1934 and the Investment Company Act of 1940, the registrant has duly caused this report to be signed on its behalf by the undersigned, thereunto duly authorized.
Calamos Investment Trust
| | |
| |
| By: | | /s/ John P. Calamos, Sr. |
| Name: | | John P. Calamos, Sr. |
| Title: | | Principal Executive Officer |
| Date: | | June 14, 2017 |
| | |
| |
| By: | | /s/ Curtis Holloway |
| Name: | | Curtis Holloway |
| Title: | | Principal Financial Officer |
| Date: | | June 14, 2017 |
Pursuant to the requirements of the Securities Exchange Act of 1934 and the Investment Company Act of 1940, this report has been signed by the following persons on behalf of the registrant and in the capacities and on the dates indicated.
| | |
| |
| By: | | /s/ John P. Calamos, Sr. |
| Name: | | John P. Calamos, Sr. |
| Title: | | Principal Executive Officer |
| Date: | | June 14, 2017 |
| | |
| |
| By: | | /s/ Curtis Holloway |
| Name: | | Curtis Holloway |
| Title: | | Principal Financial Officer |
| Date: | | June 14, 2017 |