UNITED STATES
SECURITIES AND EXCHANGE COMMISSION
Washington, D.C. 20549
FORMN-CSR
CERTIFIED SHAREHOLDER REPORT OF REGISTERED
MANAGEMENT INVESTMENT COMPANIES
| | |
INVESTMENT COMPANY ACT FILE NUMBER: | | 811-05443 |
| |
| EXACT NAME OF REGISTRANT AS SPECIFIED IN CHARTER: | | Calamos Investment Trust |
| |
ADDRESS OF PRINCIPAL EXECUTIVE OFFICES: | | 2020 Calamos Court, Naperville Illinois 60563-2787 |
| |
NAME AND ADDRESS OF AGENT FOR SERVICE: | | John P Calamos, Sr., Founder, Chairman and Global Chief Investment Officer Calamos Advisors LLC 2020 Calamos Court, Naperville, Illinois 60563-2787 |
REGISTRANT’S TELEPHONE NUMBER, INCLUDING AREA CODE: (630) 245-7200
DATE OF FISCAL YEAR END: October 31, 2019
DATE OF REPORTING PERIOD: November 1, 2018 through April 30, 2019

Experience and Foresight
About Calamos Investments
For over 40 years, we have helped investors like you manage and build wealth to meet long-term objectives. Because investors have different time horizons, risk tolerances and goals, we offer funds to suit a variety of asset allocation needs. Our 17 mutual funds include equity, fixed income, convertible and alternative funds. We offer U.S. funds as well as global and international choices.
We are dedicated to helping our clients build and protect wealth. We understand when you entrust us with your assets, you also entrust us with your achievements, goals and aspirations. We believe we best honor this trust by making investment decisions guided by integrity, discipline and our conscientious research.
We believe an active, risk-conscious approach is essential for wealth creation. In our early years, we pioneered the use of convertible securities as a means to control risk in volatile markets. We followed with strategies that combine convertibles and stocks, with the aim of participating in equity market upside with potentially less volatility than anall-stock portfolio. In the 1990s, we introduced our first stock fund, which invests in growth companies both large and small. Across our funds, our investment process seeks to manage risk at multiple levels and draws upon our experience investing through many market cycles. In a rapidly changing environment, we believe that this active management is essential.
We are global in our perspective. We believe globalization offers tremendous opportunities for countries and companies all over the world. In our U.S., global and international portfolios, we are seeking to capitalize on the potential growth of the global economy.
We believe there are opportunities in all markets. Our history traces back to the 1970s, a period of significant volatility and economic concerns. Since then, we have invested through multiple market cycles, each with its own challenges. Out of this experience comes our belief that the flipside of volatility is opportunity.
Letter to Shareholders

JOHN P. CALAMOS, SR.
Founder, Chairman and Global Chief Investment Officer
Dear Fellow Shareholder:
Welcome to your semiannual report for the six-month period ended April 30, 2019. In this report, you will find commentary from the Calamos portfolio management teams, as well as a listing of portfolio holdings, financial statements and highlights, and detailed information about the performance and positioning of the Calamos Funds.
Market Review
During the semiannual period, broad stock market barometers posted strong results, both in the U.S. and globally.1 Convertible securities rose briskly,2 and high yield corporate and investment-grade bond markets advanced at a more measured but still healthy pace.3
However, the six-month period was extremely volatile, with Federal Reserve policy, trade disputes, and growth concerns driving sharp swings in investor sentiment. During the final months of 2018, markets sold off steeply. Investors worried the Federal Reserve would derail the U.S. economic recovery and hinder global growth by raising short-term rates too quickly. Trade uncertainty and global economic data further unsettled market participants.
The tide of negative sentiment quickly turned in late December as comments from the Federal Reserve alleviated concerns about additional tightening. U.S. economic data continued to be healthy and financial conditions improved. The global growth outlook brightened, helped by a contained U.S. dollar, optimism about an eventual resolution to global trade disputes, and data supporting the view that China’s economy could achieve a soft landing. Against this backdrop, stocks, convertible securities and high yield bonds rallied dramatically through the end of the reporting period.
Outlook
There is still real fundamental strength in the U.S. economy, as fiscal policy provides a wind in the sails for businesses. Unemployment is low, inflation is contained and corporate earnings are healthy. Consumers can continue to fuel growth, as they benefit from wage growth, manageable debt levels and employment gains. The Federal Reserve has affirmed its commitment to maintaining a patient approach to short-term interest rates.
Letter to Shareholders
Outside the U.S., economic data looks more encouraging than it did at the start of 2019, We may well see a pickup in the second half of the year, with accommodative global monetary policy, a contained dollar and U.S. growth providing tailwinds. Of course, the path of U.S.-China trade policy will influence what we see next, but a resolution is not out of reach.
Ongoing economic growth sets the stage for additional upside in stocks, convertible securities and high yield bonds. Yet, despite the favorable economic backdrop, we believe investors should be prepared for persistent volatility and episodic selloffs, such as the downturn that occurred in May of 2019 in the stock and high yield markets. A variety of political and geopolitical uncertainties—including tensions in the Middle East, election unknowns, and trade—are likely to stoke turbulence.
Asset allocation for long-term goals
Elevated volatility can be an unwelcomed prospect for investors. However, the flipside of volatility is opportunity. I have invested through many periods of market turmoil: the 1973–1974 crash, Black Monday in 1987, and the collapse of the dot.com bubble, to name just a few. In all of these markets, there were opportunities—to sell into strength or to pick up an attractive position at a lower price. Our investment teams are following just such an approach, drawing on Calamos Investments’ decades of proprietary research and risk-management strategies.
As I’ve discussed in past letters to shareholders, repositioning your portfolio quickly in response to short-term market changes can be a dangerous strategy. Far too often, investors catch the downside in the market, only to be on the sidelines when markets rally. Instead, I encourage you to work with your financial advisor to ensure that your investment portfolio reflects your risk tolerance and investment goals. With the right funds at the core of an allocation, it may be easier to stay invested through short-term volatility.
Expanding our suite of asset allocation solutions
Throughout our history, we have been dedicated to selectively expanding our investment capabilities to meet the needs of our clients. Over recent years, this has included an expansion of our liquid alternative funds, including Calamos Phineus Long/Short Fund and Calamos Hedged Equity Fund. In 2018, we introduced Calamos Short-Term Bond Fund to provide current income through an approach with less interest-rate sensitivity than longer-duration fixed income strategies.
Continuing this tradition, I am pleased to announce Calamos Timpani Small Cap Growth Fund. The fund offers atime-tested track record under the leadership of Brandon Nelson, CFA, who has managed the fund since its inception in 2011. Brandon and his team follow a highly active approach, seeking companies with a sustained, underestimated growth profile and applying a value-added sell discipline. We look forward to providing you
| | | | |
| 2 | | CALAMOS OPEN-END FAMILY OF FUNDS SEMIANNUAL REPORT | | |
Letter to Shareholders
with additional information about the fund in upcoming reports. To find out more about Calamos Timpani Small Cap Growth Fund—or any of our investment offerings—please visit www.calamos.com.
Conclusion
Thank you for your continued trust in Calamos Investments. We look forward to helping you pursue your financial objectives in the years to come.
Sincerely,

John P. Calamos, Sr.
Founder, Chairman and Global Chief Investment Officer
Before investing, carefully consider a fund’s investment objectives, risks, charges and expenses. Please see the prospectus containing this and other information or call 800.582.6959. Please read the prospectus carefully. Performance data represents past performance, which is no guarantee of future results. Current performance may be lower or higher than the performance quoted. Opinions are as of the publication date, subject to change and may not come to pass. Information is for informational purposes only and shouldn’t be considered investment advice.
Diversification and asset allocation do not guarantee a profit or protection against a loss.
| 1 | The MSCI All Country World Index is a measure of global stock market performance, which returned 9.67% for the six-month period ending April 30, 2019. The S&P 500 Index is an unmanaged index generally considered representative of the U.S. stock market. For the six-month period, the index returned 9.76%. |
| 2 | The ICE BofAML All U.S. Convertibles Ex-Mandatory Index represents the U.S. convertible securities market excluding mandatory convertibles. The index returned 9.44% for the six-month period. The Thomson Reuters Global Convertible Bond Index is designed to broadly represent the global convertible bond market. The index returned 7.58% for the six-month period. |
| 3 | The Bloomberg Barclays U.S. Aggregate Bond Index is considered generally representative of the investment-grade bond market. For the six-month period ending April 30, 2019, the index returned 5.49%. The Bloomberg Barclays U.S. High Yield 2% Issuer Capped Index measures the performance of high yield corporate bonds with a maximum allocation of 2% to any one issuer. The index returned 5.54% for the six-month period. The Bloomberg Barclays U.S. Government/Credit1-3 Years Index includes all medium and larger issues of U.S. government, investment-grade corporate, and investment-grade international dollar-denominated bonds that have maturities of between 1 and 3 years and are publicly issued. The index returned 2.52% for thesix-month period. |
Duration is a measure of interest rate risk, with higher duration indicative of increased sensitivity to changes in interest rates.
Source: Lipper, Inc and Mellon Analytical Solutions, LLC. Unmanaged index returns assume reinvestment of any and all distributions and, unlike fund returns, do not reflect fees, expenses or sales charges. Investors cannot invest directly in an index. Investments in overseas markets pose special risks, including currency fluctuation and political risks. These risks are generally intensified for investments in emerging markets. Countries, regions, and sectors mentioned are presented to illustrate countries, regions, and sectors in which a fund may invest. Fund holdings are subject to change daily. The Funds are actively managed. The information contained herein is based on internal research derived from various sources and does not purport to be statements of all material facts relating to the securities mentioned. The information contained herein, while not guaranteed as to accuracy or completeness, has been obtained from sources we believe to be reliable. There are certain risks involved with investing in convertible securities in addition to market risk, such as call risk, dividend risk, liquidity risk and default risk, which should be carefully considered prior to investing.
This information is being provided for informational purposes only and should not be considered investment advice or an offer to buy or sell any security in the portfolio. Investments in alternative strategies may not be suitable for all investors.
Calamos Market Neutral Income Fund
OVERVIEW
The Fund combines two complementary strategies with different responses to volatility: convertible arbitrage (long volatility strategy) seeks alpha and uncorrelated returns, while hedged equity (short volatility strategy) provides income from options writing and upside participation.
KEY FEATURES
| | ◾ | | Generates returns not dependent on interest rates, a key differentiator from traditional bond strategies. | |
| | ◾ | | Employs an absolute-return strategy with historically lower beta to fixed income and equity markets as well as lower volatility and limited drawdowns. | |
| | ◾ | | As one of the first alternative mutual funds, capitalizes on more than four decades of experience in the convertible space. | |
PORTFOLIO FIT
The fund may provide potential diversification, particularly in a low-interest-rate environment.
| | |
| FUND NASDAQ SYMBOLS |
| |
A Shares | | CVSIX |
C Shares | | CVSCX |
| |
I Shares | | CMNIX |
| |
|
| FUND CUSIP NUMBERS |
| |
A Shares | | 128119203 |
C Shares | | 128119849 |
| |
I Shares | | 128119880 |
| |
CALAMOS MARKET NEUTRAL INCOME FUND
INVESTMENT TEAM DISCUSSION
Please discuss the Fund’s strategy and role within an asset allocation.
Launched more than 25 years ago, the strategy is one of the first liquid alternative mutual funds and blends two main strategies—convertible arbitrage and covered call writing—with the aim of monetizing volatility. In addition to offering an attractive historical risk/reward profile, the Fund may enhance long-term portfolio diversification potential, especially in relation to fixed income securities.
Recently, stubbornly low interest rates have created challenges for traditional fixed income strategies, while bouts of elevated equity volatility underscore the value of diversification. Calamos Market Neutral Income Fund is designed to:
| • | | Potentially enhance an investor’s fixed income allocation. |
| • | | Actively pursue equity market upside while hedging downside risk. |
The end goal is consistent absolute total return over varying market cycles.
How has the Fund performed?
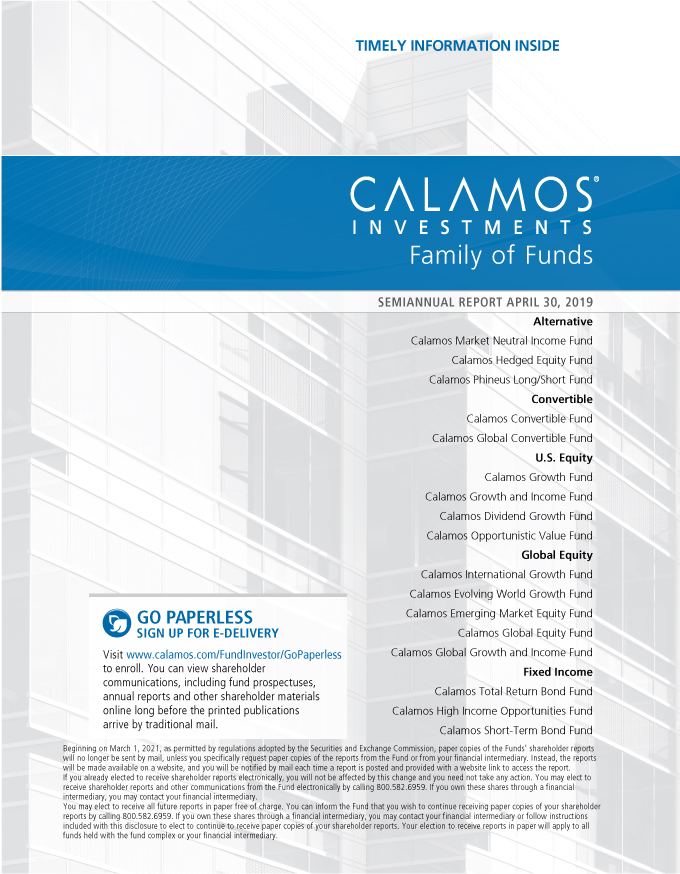
For thesix-month period ended April 30, 2019, Calamos Market Neutral Income Fund returned 2.06% (Class A Shares at net asset value) versus a 5.74% return for the Bloomberg Barclays U.S. Government/Credit Bond Index and the 1.19% increase for the FTSE30-Day U.S. Treasury Bill Index.
For the3-year,5-year and10-year periods ended April 30, 2019, the Fund’s A Shares (at net asset value) return ranked in the 14th, 8th and 10th percentiles, respectively, in the Morningstar Market Neutral category peer group.*
Both strategies utilized in the Fund, convertible arbitrage and covered call writing, contributed positively to performance during a period. Since its inception on September 4, 1990, the Fund gained 6.20% on an annualized basis (Class A Shares at net asset value). For the same period, the Bloomberg Barclays U.S. Government/Credit Bond Index gained 5.96%, while the FTSE30-Day U.S. Treasury Bill Index returned 2.50%.
What factors influenced performance?
The reporting period began with a jump in volatility, as investors grappled with Federal Reserve policy changes, global growth deceleration and heightened geopolitical risks. However, sentiment improved as the Federal Reserve became increasingly dovish, there seemed to be intermittent progress regarding U.S.-China trade talks, and economic data was trending in the right direction.
The CBOE Volatility Index (VIX) declined from 22.23 at the beginning of the period to 13.11 at the end. It reached a high of 36.07 on December 24, 2018. The volatility was beneficial to the Fund by affording increased opportunities for rebalancing in both the convertible arbitrage and hedged equity strategies. The convertible arbitrage portion
| * | Data is as of 4/30/19. Morningstar category percentile ranking is based on annualized total return for the1-year,3-year,5-year and10-year periods. Calamos Market Neutral Income Fund Class A Shares were in the 37th, 14th, 8th, and 10th percentiles of 150, 126, 100 and 33 funds for the1-year,3-year,5-year and10-year periods, respectively, for the Morningstar Market Neutral category. |
| | | | |
| 4 | | CALAMOS OPEN-END FAMILY OF FUNDS SEMIANNUAL REPORT | | |
Calamos Market Neutral Income Fund
of the Fund contributed positive results even when the marked dropped dramatically in December.
Elevated option skew* was present during the majority of the reporting period though it declined as volatility spiked in December. The Credit Suisse “Fear Barometer” Index, which compares the relative value of calls versus puts, had begun the period at 21.99 and ended at 28.22—well above the historical long-term average near 20. This reflected that calls were priced relatively inexpensive compared to puts. The elevated option skew provided an opportunity for the Fund to take advantage of call and put spreads while the option markets had steep skew. It also provided an affordable opportunity to create a favorable upside/downside risk/reward profile.
After hiking interest rates four times during the previous fiscal year, the Federal Reserve hiked interest rates once in December before pausing. As investors grew wary of overtightening, the Fed announced that it had changed its expectation to zero additional 2019 rate increases, and it would reduce the amount of balance sheet normalization. In this environment, the3-year Treasury yield declined from 2.93% to 2.24%, while the5-year treasury yield moved from 2.98% to 2.28%. The10-year U.S. Treasury yield declined from 3.15% to 2.51%. While the Fund doesn’t have significant interest rate exposure, this also means that we may not have interest rate opportunity. Declining interest rates over the reporting period supported the Bloomberg Barclay’s U.S. Government/Credit Bond Index outperformance relative to the Fund. It should be noted, however, that the Fund has outperformed the index over the past five years while providing a lower standard deviation of 2.99% versus 3.23% for the index and a-0.08 correlation to bonds.
How is the Fund positioned?
At the end of the reporting period, the Fund had a roughly equal allocation between the convertible arbitrage (52.6%) and covered call writing (47.4%) strategies. Our outlook projects similar though complementary risk-adjusted returns for both strategies going forward. Within convertible arbitrage, robust new convertible issuance has provided opportunities to invest in many new convertibles with favorable terms and valuations.
With regard to our call positioning, skew in the options market presented an attractive opportunity to utilize call and put spreads, which was beneficial to the portfolio’s risk/reward. By using slightlycloser-to-the-money calls, buyingout-of-the-money calls, and addingnear-the-money put spreads we have been able to construct a more effective hedge that still offers equity participation and a risk/reward profile similar to our historical baseline positioning. When volatility and flatter option skew becomes more prevalent in the market, our typical baseline positioning looks more appealing. We continue to monitor the options market for the best opportunities available and will actively adjust our positioning as conditions warrant.
Do you have any closing thoughts for shareholders?
The latter stages of the economic cycle are generally accompanied by increased bouts of volatility, and this certainly appears to have been the case at this point highlighted by the 13.5% fourth quarter of 2018 decline followed by the 13.7% rebound in the first quarter of 2019. The Fund derives benefits from “volatility in volatility,” and heightened periods of volatility can come from any variety of potential sources. Trade disputes, global growth concerns, geopolitical tensions, and speculation surrounding an inverted yield curve are just a few examples of items that may stoke volatility.
| * | Skew describes asymmetry from the normal distribution in a set of statistical data. |
| | | | |
SECTOR WEIGHTINGS
as of April 30, 2019 | |
| |
Information Technology | | | 32.3 | % |
Health Care | | | 14.0 | |
| |
Consumer Discretionary | | | 11.6 | |
Financials | | | 9.8 | |
| |
Communication Services | | | 9.2 | |
Industrials | | | 6.0 | |
| |
Consumer Staples | | | 4.6 | |
Energy | | | 3.4 | |
| |
Utilities | | | 3.3 | |
Other | | | 2.8 | |
| |
Real Estate | | | 2.8 | |
Materials | | | 2.3 | |
Sector weightings are subject to change daily and are calculated as a percentage of net assets. The table excludes cash or cash equivalents, any government/sovereign bonds or broad based index hedging securities the Fund may hold.
Calamos Market Neutral Income Fund
A backdrop of rising interest rates has somewhat diminished, given the Federal Reserve’s recent dovish policy pivot, but we continue to see diversification benefits of including the Fund within a fixed income allocation. Investors likely are not owning bonds based on the amount of yield provided. Rather, investors look to the stability of bonds during increased market volatility. With uncertainty over global central bank interest rate policies, including the Fund in an investment portfolio should provide a means of reducing equity sensitivity. We believe an allocation to the Fund may also provide stability in a market environment that turns increasingly volatile for both stocks and bonds. Investors are facing the dilemma of how to reduce equity sensitivity without embracing the interest-rate sensitivity of the bond market. The Market Neutral Income Fund has historically provided bond-like returns with bond-like risk without bond-like interest-rate sensitivity. The Fund also has demonstrated lower correlations to other asset classes.
ANNUALIZED RETURN: SINCE INCEPTION (9/4/90) THROUGH 4/30/19
Performance data quoted represents past performance, which is no guarantee of future results. Current performance may be lower or higher than the performance quoted.
The principal value and investment return of an investment will fluctuate so that your shares, when redeemed, may be worth more or less than their original cost. You can obtain performance data current to the most recent month end by visiting www.calamos.com. Average annual total return measures net investment income and capital gain or loss from portfolio investments as an annualized average. All performance shown assumes reinvestment of dividends and capital gains distributions. Performance is for the Fund’s Class A shares at net asset value and does not include the Fund’s maximum front-end sales charge of 2.25%. Had it been included, the Fund’s return would have been lower. The Fund also offers Class C and Class I shares, the performance of which may vary. Source: State Street Corporation, Lipper, Inc., and Mellon Analytical Solutions, LLC.
| | | | |
| 6 | | CALAMOS OPEN-END FAMILY OF FUNDS SEMIANNUAL REPORT | | |
Calamos Market Neutral Income Fund
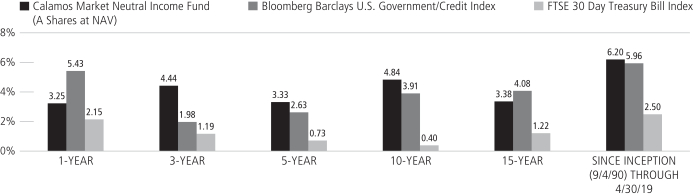
GROWTH OF $10,000: FOR THE 10-YEAR PERIOD ENDED 4/30/19
AVERAGE ANNUAL TOTAL RETURN† AS OF 4/30/19
| | | | | | | | | | | | | | | | | | | | |
| | | 6
MONTHS | | 1
YEAR | | 5
YEARS | | 10
YEARS |
Class A Shares – Inception 9/4/90 | | | | | | | | | | | | | | | | | | | | |
Without Sales Charge | | | | 2.06 | % | | | | 3.25 | % | | | | 3.33 | % | | | | 4.84 | % |
With Sales Charge | | | | -0.23 | | | | | 0.92 | | | | | 2.33 | | | | | 4.33 | |
Class C Shares – Inception 2/16/00 | | | | | | | | | | | | | | | | | | | | |
Without Sales Charge | | | | 1.67 | | | | | 2.47 | | | | | 2.57 | | | | | 4.05 | |
With Sales Charge | | | | 0.69 | | | | | 1.48 | | | | | 2.57 | | | | | 4.05 | |
Class I Shares – Inception 5/10/00 | | | | 2.20 | | | | | 3.45 | | | | | 3.58 | | | | | 5.09 | |
Performance data quoted represents past performance, which is no guarantee of future results. Current performance may be loweror higher than the performance quoted. The principal value and investment return of an investment will fluctuate so that your shares, when redeemed, may be worth more or less than their original cost.
As of the prospectus dated 3/1/19, the Fund’s gross expense ratio for Class A shares is 1.26%; C shares is 2.01% and Class I shares is 1.00%. The expense ratios shown above may differ from the more recent expense ratios reported in the Financial Highlights section of this report.
| † | Average annual total return measures net investment income and capital gain or loss from portfolio investments as an annualized average assuming reinvestment of dividends and capital gains distributions. Load-adjusted returns are adjusted for the maximumfront-end sales load of 2.25% for Class A shares and returns for Class C shares have been adjusted for the contingent deferred sales charge (CDSC). |
NOTES:
The graphs do not reflect the income taxes that you would pay on fund distributions or the redemption of fund shares. Fund performance includes reinvestment of dividends and adjustment for the maximum sales charge for Class A shares. The performance of other classes will vary from the performance of the class shown based on the difference in sales charges and fees paid by shareholders investing in different share classes.
The Bloomberg Barclays U.S. Government/Credit Index is comprised of long-term government and investment-grade corporate debt securities and is generally considered representative of the performance of the broad U.S. bond market. Index data shown for the Annualized Returns Since Inception graph is from 8/31/90, since comparative index data is only available for full monthly periods. Source: Lipper, Inc.
The FTSE 30 Day Treasury Bill Index is an unmanaged index generally considered representative of the performance of short-term money instruments. U.S. Treasury Bills are backed by the full faith and credit of the U.S. government and offer a guarantee as to the repayment of principal and interest at maturity. Index data shown for the Annualized Returns Since Inception graph is from 8/31/90, since comparative index data is only available for full monthly periods. Source: Mellon Analytical Solutions, LLC
The CBOE Volatility Index (VIX) is a leading measure of market expectations of near-term volatility conveyed by S&P 500 Index (SPX) option prices.
The Morningstar Market Neutral Category represents funds that attempt to eliminate the risks of the market by holding 50% of assets in long positions in stocks and 50% of assets in short positions.
The Credit Suisse Fear Barometer essentially tracks the willingness of investors to pay up for downside protection with collar trades on the S&P 500 Index.
Index returns assume reinvestment of dividends and do not reflect deduction of fees and expenses. It is not possible to invest directly in an index.
The Fund’s use of derivative instruments involves investment risks and transaction costs to which the Fund would not be subject absent the use of these instruments and, accordingly, may result in losses greater than if they had not been used. Derivative instruments can be illiquid, may disproportionately increase losses and may have a potentially large impact on Fund performance.
Calamos Hedged Equity Fund
OVERVIEW
The Fund blends a core long-equity portfolio with an actively managed option overlay. Tactical management creates opportunities to add alpha from option market dynamics and equity market volatility.
KEY FEATURES
| | ◾ | | Our investment approach is highly responsive to dynamic market conditions, unlike many less active option-based strategies. | |
| | ◾ | | The investment team seeks to take advantage of opportunities the market presents, with a focus on being favorably positioned for as many outcomes as possible. | |
PORTFOLIO FIT
The Fund’s option-based risk management strategy can provide upside participation in equity markets while limiting downside exposure, thereby improving the quality of the ride.
| | |
| FUND NASDAQ SYMBOLS |
| |
A Shares | | CAHEX |
C Shares | | CCHEX |
| |
I Shares | | CIHEX |
| | | |
|
| FUND CUSIP NUMBERS |
| |
A Shares | | 128120698 |
C Shares | | 128120680 |
| |
I Shares | | 128120672 |
| | | |
CALAMOS HEDGED EQUITY FUND*
INVESTMENT TEAM DISCUSSION
Please discuss the Fund’s strategy and role within an asset allocation.
Calamos Hedged Equity Fund is designed to serve as a volatility dampener for an equity allocation.
| • | | The Fund’s investment approach is highly responsive to dynamic market conditions, a key differentiator versus many less active option-based strategies. |
| • | | The Fund’s strategy blends a core long equity portfolio with an actively managed option overlay. Tactical management creates opportunities to add alpha from option market dynamics and equity market volatility. |
| • | | As an equity substitute, the strategy seeks to provide better upside/downside asymmetry than long-only equities. |
| • | | The Fund seeks to take advantage of opportunities the market presents, with a focus on being as favorably positioned for as many outcomes as possible. |
How has the Fund performed?
True to its risk-managed design, Calamos Hedged Equity Fund participated in the upside of the equity market during the period with significantly less risk thanks to its hedging strategy. The Fund had a since inception beta of 0.50 versus the S&P 500 Index as of April 30, 2019.
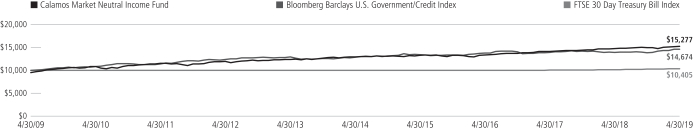
For thesix-month period ended April 30, 2019, Calamos Hedged Equity Fund gained 4.07% (Class A Shares at net asset value) versus the S&P 500 Index gain of 9.76% and the Bloomberg Barclays U.S. Aggregate Bond Index return of 5.49%. Since its inception on December 31, 2014, the Fund gained 5.14% on an annualized basis (Class A Shares at net asset value) versus 10.87%% for the S&P 500 Index and 2.24% for the Bloomberg Barclays U.S. Aggregate Bond Index.
What factors influenced performance during the reporting period?
The U.S. equity market, as measured by the S&P 500 Index, struggled mightily during fourth calendar quarter 2018, dropping-13.52%. Investors have not been accustomed to recent large declines in U.S. equites, as 4Q 2018 marked the first calendar quarter with a drop of more than 1% since 3Q 2015. During the period, third quarter 2018 corporate results were reported, with 77% and 62% of S&P 500 companies beating earnings and sales expectations, respectively. Despite these positive fundamentals, investors focused on monetary conditions and the Fed’s path for interest rates. It was in early October when Fed Chairman Powell voiced his view that rates were still “a long way” from neutral, and the market began its decline, falling-19.8% from its September 20 close through Christmas Eve’s closing bell. Volatility spiked, with the VIX climbing 110% during 4Q 2018. In adding trade tensions, soft global data, a government shutdown, and staff turnover at the White House to the mix, it is understandable that investors turned defensive.
All told, the Fund held up well relative to the S&P 500 Index during the downturn in the final months of 2018, participating in only half of the market’s downside in December 2018. However, the S&P 500 Index’s drop of-13.52% during the fourth calendar quarter did challenge the Fund’s portfolio, as the value of our equity basket declined more than the positive option returns.
| * | Effective March 1, 2019, Calamos Hedged Equity Income Fund was renamed Calamos Hedged Equity Fund. |
| | | | |
| 8 | | CALAMOS OPEN-END FAMILY OF FUNDS SEMIANNUAL REPORT | | |
Calamos Hedged Equity Fund
After a sharp decline in the equity markets through much of December 2018, and market pundits calling an end to the longest bull market in history (3,709 days), equities roared back to finish out the period challengingall-time highs. The catalysts were plenty: better-than-expected earnings results, a neutral Fed, Brexit on hold, a robust Jobs market, low inflation, and productivity that is finally improving; all contributed to the S&P 500 Index nearing its apex.
Likewise, the latter portion of the period in early 2019 witnessed a significant drop in market volatility as fears regarding increasing inflation and the trade conflict—for the time being—subsided. The VIX saw about a 61% decline from 28.53 (January 2) to 11.03 (April 17).
How is the Fund positioned?
Option Positioning. The recent landscape in the options market continued to allow us to structure our hedge with an emphasis on performing better on the tails. This positioning provided additional protection over and above our average 40% to 50% put notional minimum, while also adding upside participation potential. The tradeoff was a reduction in net income we received from selling calls above the cost of our puts. With the funds defensive mandate, and given the low volatility and high skew* in the options market, we felt thistrade-off was warranted and opportunistic for the Fund.
More recently, higher volatility (the VIX at 17.5) and flatter option skew have made our “North Star” baseline trade look appealing. With the resurgence of market volatility, options pricing now allows us to sell call options at approximately 3% to 5% out of the money, which represents more attractive price levels compared to the protective puts being purchased at about 5% out of the money. This aligns with our traditional “North Star” trade mechanics of selling OTM calls versus buying OTM puts. We used the first half rally to replace some of our put hedge with long put spreads, which appeared to be attractive during this move. The Fund’s net put protection at the end of the period was 74%, with an average strike of 2,705 (6% OTM). At the end of the period, our call positioning included a call write of 71% and a gross long call of 56%. Gross long calls were lower than in the past.
Sector Positioning. At the end of the reporting period and relative to the S&P 500, the equity basket was very slightly overweight to the consumer discretionary and information technology sectors. The portfolio had slight underweight positioning to the materials, financials, consumer staples, real estate and materials sectors.
Market Cap Positioning. Relative to the S&P 500 Index, the portfolio maintained a heavier relative weight to larger capitalization (>$25b) holdings and lighter weight to small and mid capitalization ($1 to $25 billion).
What closing thoughts do you have for Fund shareholders?
As the Equity markets challengeall-time highs, we have to be cognizant of the fact that markets don’t go straight up without a healthy decline now and then. Sometimes these downturns can enter correction territory (declines >10%) as we saw in Q4 of 2018, and sometimes they are less scary pullbacks (declines <10%). Since the end of the correction December 24, the S&P 500 Index gained about 25% through period end; the most significant decline during that time has been less than 2%. With earnings season winding down, and few upside catalysts on the horizon, we expect volatility in the equity markets to return, which makes us enthusiastic about our current positioning in Hedged Equity Fund (CIHEX). Should equity markets advance, the Fund is poised to participate in its upside while also providing an enhanced income stream from the equity dividends. Conversely, should the markets retreat, the dividend income stream and the put protection used in the Fund will serve to provide potential downside protection.
| * | Skew describes asymmetry from the normal distribution in a set of statistical data. |
| | | | |
SECTOR WEIGHTINGS
as of April 30, 2019 | | | |
| |
Information Technology | | | 21.8 | % |
Health Care | | | 13.9 | |
| |
Financials | | | 13.2 | |
Consumer Discretionary | | | 10.7 | |
| |
Communication Services | | | 10.4 | |
Industrials | | | 9.7 | |
| |
Consumer Staples | | | 7.3 | |
Energy | | | 5.6 | |
| |
Other | | | 5.3 | |
Utilities | | | 3.1 | |
| |
Real Estate | | | 3.0 | |
Materials | | | 2.4 | |
Sector weightings are subject to change daily and are calculated as a percentage of net assets. The table excludes cash or cash equivalents, any government/sovereign bonds or broad based index hedging securities the Fund may hold.
Calamos Hedged Equity Fund
GROWTH OF $10,000: SINCE INCEPTION (12/31/14) THROUGH 4/30/19
AVERAGE ANNUAL TOTAL RETURN† AS OF 4/30/19
| | | | | | | | | | | | | | | |
| | | 6
MONTHS | | 1
YEAR | | SINCE
INCEPTION |
Class A Shares – Inception 12/31/2014 | | | | | | | | | | | | | | | |
Without Sales Charge | | | | 4.07 | % | | | | 5.14 | % | | | | 5.14 | % |
With Sales Charge | | | | -0.86 | | | | | 0.12 | | | | | 3.96 | |
Class C Shares – Inception 12/31/2014 | | | | | | | | | | | | | | | |
Without Sales Charge | | | | 3.72 | | | | | 4.38 | | | | | 4.38 | |
With Sales Charge | | | | 2.72 | | | | | 3.38 | | | | | 4.38 | |
Class I Shares – Inception 12/31/2014 | | | | 4.32 | | | | | 5.52 | | | | | 5.45 | |
Performance data quoted represents past performance, which is no guarantee of future results. Current performance may be lower or higher than the performance quoted. The principal value and investment return of an investment will fluctuate so that your shares, when redeemed, may be worth more or less than their original cost.
As of the prospectus dated 3/1/19, the Fund’s gross expense ratio for Class A shares is 1.48%; Class C is 2.31% and Class I is 1.27%. The Fund’s Investment Adviser has contractually agreed to reimburse the Fund expenses through 3/1/22 to the extent necessary so that Total Annual Fund Operating Expenses (excluding taxes, interest, short interest, short dividend expenses, brokerage commissions, acquired fund fees and expenses, and extraordinary expenses, if any) of Class A, Class C, and Class I are limited to 1.25%, 2.00%, 1.00% of average net assets, respectively. Calamos Advisors may recapture previously waived expense amounts within the same fiscal year for any day where the respective Fund’s expense ratio falls below the contractual expense limit up to the expense limit for that day. This undertaking is binding on CALAMOS ADVISORS and any of its successors and assigns. This agreement is not terminable by either party. The expense ratios shown above may differ from the more recent expense ratios reported in the Financial Highlights section of this report.
| † | Average annual total return measures net investment income and capital gain or loss from portfolio investments as an annualized average assuming reinvestment of dividends and capital gains distributions. Performance shown includes the effects of an expense reimbursement that improved results. Load-adjusted returns are adjusted for the maximum front-end sales load of 4.75% for Class A shares and returns for Class C shares have been adjusted for the contingent deferred sales charge (CDSC). |
NOTES:
The S&P 500 Index is an unmanaged index generally considered representative of the U.S. stock market.
The Bloomberg Barclays U.S. Aggregate Bond Index is considered generally representative of the investment-grade bond market. Index data shown for the Since Inception Growth of $10,000 graph is from 12/31/14, since comparative index data is only available for full monthly periods. Source: Lipper, Inc.
The CBOE Volatility Index (VIX) is a leading measure of market expectations of near-term volatility conveyed by S&P 500 Index (SPX) option prices.
The Credit Suisse Fear Barometer essentially tracks the willingness of investors to pay up for downside protection with collar trades on the S&P 500 Index.
Index returns assume reinvestment of dividends and do not reflect deduction of fees and expenses. It is not possible to invest directly in an index.
The Fund’s use of derivative instruments involves investment risks and transaction costs to which the Fund would not be subject absent the use of these instruments and, accordingly, may result in losses greater than if they had not been used. Derivative instruments can be illiquid, may disproportionately increase losses and may have a potentially large impact on Fund performance.
| | | | |
| 10 | | CALAMOS OPEN-END FAMILY OF FUNDS SEMIANNUAL REPORT | | |
Calamos Phineus Long/Short Fund
CALAMOS PHINEUS LONG/SHORT FUND
INVESTMENT TEAM DISCUSSION
What is the essence of the investment approach?
Through a global long/short structure, the Fund invests in publicly listed equity securities. Components of the strategy include:
| • | | A fundamental global approach that blendstop-down andbottom-up considerations. Company analysis is integrated with industry, thematic and macro research. |
| • | | An inclusive framework for identifying potential returns and associated risks. The framework accounts for company, industry, style, country and market factors. |
| • | | Flexible capital allocation allowing for all investment styles, market caps and geographic regions. The investment universe is global, liquid and scalable. Exposure levels and investment styles depend upon market conditions and the economic cycle. |
How has the Fund performed?
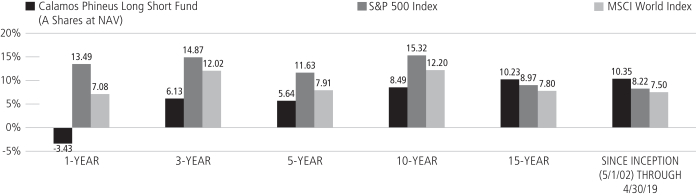
For thesix-month period, ended April 30, 2019, Calamos Phineus Long/Short Fund increased 1.18% (Class A Shares at net asset value). The MSCI World Index rose 9.16% and the S&P 500 Index rose 9.76% over the comparable period.
The message of the past six months, as exhibited by the schizophrenic swing between recession fear and recovery optimism, is that the behavior of risk assets virtually defines financial conditions and confidence across the U.S. economy. In effect, the Fed has committed itself to be the manager of global risk assets.
Our approach over the pastsix-months has been one of capital preservation, as we weathered the extreme market volatility experienced in Q4 2018, and maintained gains offered in early 2019. In April 2019, the market hitall-time highs, and it more than recovered relative to the steepsell-off that culminated in late December. Global equities have rebounded sharply in Q1 as financial markets have celebrated the Fed’s suspension of monetary normalization. That said, outside of recent employment data, the economic picture remains mixed. Most business surveys and capex intentions have stalled from 2018. Hence, the recovery in Q1 after thesell-off in Q4 may be more akin to a rebound, as opposed to a revival. The Fed faces the conundrum of desiring rate normalizationvis-a-vis market forces, but may need to resort back to easing to accommodate low inflation and a softening economy.
We have trimmed several of the growth-oriented names that have experienced the highest volatility over the past six months. In general, those companies are trading at high valuations that may be more vulnerable to an economic slowdown. We have also mostly avoided Europe and emerging markets during the period, as we see geopolitical turmoil being a deterrent in the former, with high debt and a retreating global supply chain being cause for concern with the latter.
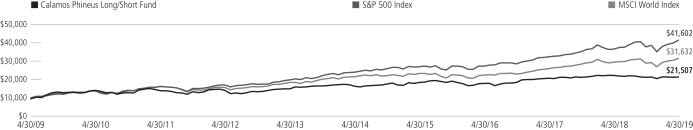
Since its inception on May 1, 2002, the Fund has returned 10.35% on an annualized basis (Class A shares at net asset value) and, thus, markedly outperformed both the MSCI World and S&P 500 Indexes, which returned 7.50% and 8.22%, respectively.
FUND OVERVIEW
The Fund seeks strong risk-adjusted and absolute returns across the global equity universe. The Fund uses a global long/short strategy to invest in publicly listed equity securities.
KEY FEATURES
| | ◾ | | Fundamental global approach blends top-down and bottom-up considerations | |
| | ◾ | | Flexible asset allocation allows for all investment styles, market caps and geographic regions depending on the market environment | |
| | ◾ | | Comprehensive approach assesses stock, industry, style, country and market factors | |
| | ◾ | | Knowledge-based industry concentration includes technology, communications, media, financials and health care | |
PORTFOLIO FIT
The Fund seeks to provide strong risk-adjusted returns via an alternative solution that complements and diversifies a global or U.S. equity allocation.
| | |
| FUND NASDAQ SYMBOLS |
| |
A Shares | | CPLSX |
C Shares | | CPCLX |
| |
I Shares | | CPLIX |
| | | |
|
| FUND CUSIP NUMBERS |
| |
A Shares | | 128120656 |
C Shares | | 128120649 |
| |
I Shares | | 128120631 |
| | | |
Calamos Phineus Long/Short Fund
| | | | |
SECTOR WEIGHTINGS
as of April 30, 2019 | | | |
| |
Financials | | | 32.8 | % |
Industrials | | | 15.1 | |
| |
Health Care | | | 12.4 | |
Communication Services | | | 9.9 | |
| |
Consumer Discretionary | | | 7.2 | |
Other | | | 4.0 | |
| |
Information Technology | | | 3.7 | |
Materials | | | 2.3 | |
| |
Energy | | | 2.2 | |
Consumer Staples | | | 2.2 | |
Sector weightings are subject to change daily and are calculated as a percentage of net assets. The table excludes cash or cash equivalents, any government/sovereign bonds or broad based index hedging securities the Fund may hold.
What contributed to performance over thesix-month period under review?
The largest contributors were from long investments in the communication services and information technology sectors, while short position hedges on the SPY, a general market ETF, and USMV, alow-volatility ETF, hindered performance. Notable contributors during the period included long positions in Facebook Inc. (Communication Services), First Solar Inc. and Applied Materials Inc. (Information Technology). Detractors included a short position in SMH, a semiconductor ETF, as well as a long position in Cboe Global Markets, Inc. and a short position in financial select sector SPDR (financials sector hedge).
How is the Fund positioned in the context of the global economic cycle?
In our view, the 2018 to 2020 period represents a liquidity-driven deflation of financial prices in the context of a global cyclical slowdown. While the Fed’s pivot represents insurance against the more deleterious risks, we believe the economic slowdown is still underestimated by investors and will be more apparent in corporate releases through the middle quarters of 2019.
The Fund’s long and short exposure is roughly balanced; positioning shifts are largely occurring at the industry and stock level. Although still the largest overall sector weighting, the Fund has modestly reduced its exposure to U.S. financials where the group’s beta implies some vulnerability to “late-cycle” perception. That said, valuations are compelling and credit and loan growth remain solid, underpinning the group’s recovery from the December lows.
Technology has been a tactical source of alpha in recent months, but crowded positioning is a concern; according to data that we monitor, investor positioning in software is near multi-year highs. Equally worrisome, much of the industry is near peak profitability, which leaves downside risk to capital spending. Among tech names, we prefer those whoseend-markets are less driven by corporate spending and more dependent upon the health of the consumer.
The Fund added modestly to its health care positioning. We prefer diversified companies rather than traditional pharmaceuticals. Drug pricing remains vulnerable to a variety of political clouds and little of the health care food chain will emerge unscathed from the secular spending pressures arising from hard demographic realities. We view the group as a defensive rather than a genuine growth class.
We remain highly selective in other defensive areas, such as consumer staples, where valuations are high relative to their underlying fundamentals. We are focused on discretionary names with staples-like attributes and company-specific growth drivers, especially those which are less reliant on emerging markets. With regard to our Industrials positions, we also emphasize businesses less exposed to the different economic landscape abroad.
Emerging markets remain uncompelling despite relatively more attractive valuations. The rise of “global growth led by China” has been inextricably linked to the Pacific supply chains which are being unwound, as Trump favors more regional economic blocs in order to boost long-term investment in the U.S. manufacturing. China’s debt cycle is extreme, and the confrontation with the U.S. is substantial. If the impending trade resolution occurs, it should be viewed more as a truce than a full conclusion of the issues at stake. Recent fiscal initiatives have been more modest than prior episodes, and we continue to avoid the region.
| | | | |
| 12 | | CALAMOS OPEN-END FAMILY OF FUNDS SEMIANNUAL REPORT | | |
Calamos Phineus Long/Short Fund
In Europe, there is no political visibility and equities are virtually uninvestible until these markets become much cheaper. Sponsors of European integration are paralyzed by a defensive and doctrinaire mentality, taking refuge in the culture wars against liberalism. Europe’s combination of budgetary austerity coupled with monetary subsidization is following a Japan-like trajectory. Europe has been reduced to the protector of a stagnant status quo. Currently, our holdings are both highly selective and predicated largely on exposure to the U.S. consumer.
What are your closing thoughts for the coming six months?
What explains the uncommon reversal of fortunes into 2019? More than anything, it reflects the comprehensive capitulation by the U.S. Federal Reserve and the message that central banks have the back of investors. Through the course of 2018, investors came to realize that central bank policy was no longer aligned with the post-2008 cycle of financial asset price inflation. In other words, credit pricing was no longer going to be subsidized by easy Fed policy, but rather driven by market forces.
In 2019, the performance of equities has been remarkable. Naturally, we should ask whether these gains foreshadow an improving economic cycle and the revival of the bull market in risk assets. Our interpretation is more nuanced.
The post-2008 bull market ended in October of last year. Our definition of “end” is not based upon the price behavior of the major equity benchmarks, but upon the driving logic of financial asset price inflation spurred by central bank policies of the past decade. This era is climaxing now: 2018 – 2020 should be viewed as one phase of a more extended transition from an investment environment marked by capital subsidization.
The challenge for investors is that this transition period is unlikely to correspond to the conventional perception of a bull or bear market. Instead, we expect a climate of rising financial instability, social and political fragmentation, and gathering evidence of late cycle exhaustion. We see the S&P 500 Index range bound between the December lows of 2400 and the former highs around 3000. Slower U.S. growth has been welcomed because it may be met with stimulus by the Fed, which is committed to avoiding the turmoil of late 2018. This persistence limits the downside for risk assets, as does the absence of the familiarend-cycle factors of rising inflation and monetary restriction. As long as U.S. recession is avoided, we do not anticipate a severe bear move because the Powell “fear threshold” has been demarked.
Equally, we see the upside for equities limited by the potential disruption that stronger U.S. growth would cause in credit markets. In our view, the lesson of 2018 is that the 3% threshold for U.S. dollar rates is the ceiling, regardless of Fed projections. With the10-year Treasury around 2.5% and the yield curve stubbornly flat, the credit markets are discounting a prolonged period of slower growth, though they are agnostic about recession. If credit markets are correct, equities have limited upside. If credit markets are wrong, the implication is renewed upward pressure on U.S. interest rates, an increase in the corporate cost of capital, and the return of financial asset price deflation.
Business investment is generally slowing, while U.S. corporate profitability is peaking. More generally, in our view, equities are grappling with a future of less capital subsidization, higher labor costs, higher interest rates and a diminished contribution of globalization to corporate profitability. We believe that investors should expect multiple reversals of trend perception in coming years. 2018 was the downward reversal of trend—it was not sustained. Similarly, today’s gathering perception of an upward trend
Calamos Phineus Long/Short Fund
in risk assets is unlikely to be sustained. This framework of “neither bull nor bear” implies a tactical approach to equity exposure. When corrections occur, they are likely to be rapid as investors again fear trend reversal. Low liquidity also plays a part, as investors attempt to digest a shift from thelow-volatility environment of Q1 2019.
Our assumption is that global growth will remain sluggish through this year and into 2020, but avoid any traumatic debacles. This is good news for parts of the global landscape that are priced for mediocre growth but creates challenges for components of the U.S. equity world that are priced for superior profitability. U.S. earnings are unlikely to grow in 2019, which implies that equity prices are sanguine relative to the downside risks. We do not believe thewait-and-see neutrality of the Federal Reserve is sufficient to restore the bull market in risk assets. The challenge is not just the cyclical slowdown in global growth, but the declining effectiveness of monetary stimulus in terms of prolonging the economic cycle. Markets will add their opinion to this debate between now and early autumn. The dispersion of views among investors is wide, but conviction attached to these views appears low.
Reflecting all of this, we are cautious about adding risk with U.S. markets back nearall-time highs. We aim for healthy absolute returns in 2019 without forcing our clients to assume either the bullish or bearish side of these arguments.
ANNUALIZED RETURN: SINCE INCEPTION (5/1/02) THROUGH 4/30/19
Performance data quoted represents past performance, which is no guarantee of future results. Current performance may be lower or higher than the performance quoted.
The principal value and investment return of an investment will fluctuate so that your shares, when redeemed, may be worth more or less than their original cost. You can obtain performance data current to the most recent month end by visiting www.calamos.com. Average annual total return measures net investment income and capital gain or loss from portfolio investments as an annualized average. All performance shown assumes reinvestment of dividends and capital gains distributions. Performance is for the Fund’s Class A shares at net asset value and does not include the Fund’s maximum front-end sales charge of 4.75%. Had it been included, the Fund’s return would have been lower. The Fund also offers Class C and Class I shares, the performance of which may vary. Source: Morningstar, Inc.
The performance shown for periods prior to April 6, 2016 is the performance of a predecessor investment vehicle (the “Predecessor Fund”). The Predecessor Fund was reorganized into the Fund on April 6, 2016, the date upon which the Fund commenced operations. On October 1, 2015, the parent company of Calamos Advisors, purchased Phineus Partners LP, the prior investment adviser to the Predecessor Fund (“Phineus”), and Calamos Advisors served as the Predecessor Fund’s investment adviser between October 1, 2015 until it was reorganized into the Fund. Phineus and Calamos Advisors managed the Predecessor Fund using investment policies, objectives, guidelines and restrictions that were in all material respects equivalent to those of the Fund. Phineus and Calamos Advisors managed the Predecessor Fund in this manner either directly or indirectly by investing all of the Predecessor Fund’s assets in a master fund structure. The Predecessor Fund performance information has been adjusted to reflect Class A, Class C and Class I shares, expenses. However, the Predecessor Fund was not a registered mutual fund and thus was not subject to the same investment and tax restrictions as the Fund. If it had been, the Predecessor Fund’s performance may have been lower.
| | | | |
| 14 | | CALAMOS OPEN-END FAMILY OF FUNDS SEMIANNUAL REPORT | | |
Calamos Phineus Long/Short Fund
GROWTH OF $10,000: FOR THE 10-YEAR PERIOD ENDED 4/30/19
AVERAGE ANNUAL TOTAL RETURN† AS OF 4/30/19
| | | | | | | | | | | | | | | | | | | | |
| | | 6
MONTHS | | 1
YEAR | | 5
YEAR | | 10
YEARS |
Class A Shares (With Predecessor) – Inception 5/1/2002 | | | | | | | | | | | | | | | | | | | | |
Without Sales Charge | | | | 1.18 | % | | | | -3.43 | % | | | | 5.64 | % | | | | 8.49 | % |
With Sales Charge | | | | -3.66 | | | | | -7.99 | | | | | 4.61 | | | | | 7.96 | |
Class C Shares (With Predecessor) – Inception 5/1/2002 | | | | | | | | | | | | | | | | | | | | |
Without Sales Charge | | | | 0.77 | | | | | -4.21 | | | | | 4.85 | | | | | 7.69 | |
With Sales Charge | | | | -0.20 | | | | | -5.13 | | | | | 4.85 | | | | | 7.69 | |
Class I Shares (With Predecessor) – Inception 5/1/2002 | | | | 1.28 | | | | | -3.15 | | | | | 5.91 | | | | | 8.77 | |
Performance data quoted represents past performance, which is no guarantee of future results. Current performance may be loweror higher than the performance quoted. The principal value and investment return of an investment will fluctuate so that your shares, when redeemed, may be worth more or less than their original cost.
As of the prospectus dated 3/1/19, the Fund’s gross expense ratio for Class A shares is 2.32%; Class C shares is 3.07% and Class I shares is 2.04%. The expense ratios shown above may differ from the more recent expense ratios reported in the Financial Highlights section of this report.
| † | Average annual total return measures net investment income and capital gain or loss from portfolio investments as an annualized average assuming reinvestment of dividends and capital gains distributions. Performance shown reflects the effects of an expense reimbursement that improved results and was in effect until October 31, 2016. Load-adjusted returns are adjusted for the maximum front-end sales load of 4.75% for Class A shares. Returns for Class C shares have been adjusted for the contingent deferred sales charge (CDSC). |
NOTES:
The graph does not reflect the income taxes that you would pay on fund distributions or the redemption of fund shares. Fund performance includes reinvestment of dividends and adjustment for the maximum sales charge for Class A shares. The performance of other classes will vary from the performance of the class shown based on the difference in sales charges and fees paid by shareholders investing in different share classes.
The MSCI World Index (U.S. Dollars) is a market-capitalization weighted index composed of companies representative of
the market structure of developed market countries in North America, Europe and the Asia/Pacific region. Since inception data for the index is shown from 4/30/02 since data is only available for full monthly periods. Source: Lipper, Inc.
The S&P 500 Index is an unmanaged index generally considered representative of the U.S. stock market. Source: Lipper, Inc.
Index returns assume reinvestment of dividends and do not reflect deduction of fees and expenses. It is not possible to invest directly in an index.
Calamos Convertible Fund
OVERVIEW
The Fund invests primarily in convertible securities of U.S. companies that are diversified across market sector and credit quality.
KEY FEATURES
| | ◾ | | Leverages more than four decades of research and experience in convertible security investing. | |
| | ◾ | | Provides diversification across market sectors and credit quality, emphasizing midsize companies with higher-quality balance sheets. | |
| | ◾ | | Seeks to provide upside participation in equity markets with less exposure to downside than an equity-only portfolio over a full market cycle. | |
| | ◾ | | Takes environmental, social and governance (ESG) factors into account, evaluating whether they impact a company’s cash flow, risk profile and long-term returns. | |
PORTFOLIO FIT
When used in conjunction with an equity allocation, the Fund offers a way potentially to manage risk by employing securities that engage in upside equity movements with limited downside participation.
| | |
| FUND NASDAQ SYMBOLS |
| |
A Shares | | CCVIX |
C Shares | | CCVCX |
| |
I Shares | | CICVX |
| |
|
| FUND CUSIP NUMBERS |
| |
A Shares | | 128119401 |
C Shares | | 128119823 |
| |
I Shares | | 128119864 |
| |
CALAMOS CONVERTIBLE FUND
INVESTMENT TEAM DISCUSSION
How has the Fund performed?
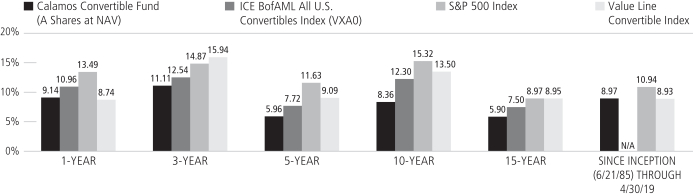
For thesix-month period ended April 30, 2019, Calamos Convertible Fund had a positive return of 8.20% (Class A Shares at NAV) versus the ICE BofAML All U.S. Convertibles Index increase of 9.29%. Given our focus on convertibles displaying balanced risk/reward attributes, the Fund was significantly underweight to convertibles displaying the most equity sensitivity, which outperformed during the period. For the same period, the Value Line Convertible Index rose 6.21% and the S&P 500 Index gained 9.76%.
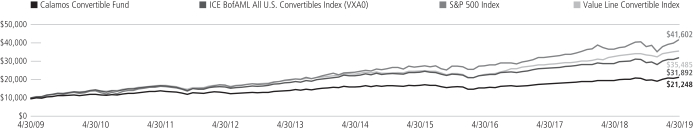
Since its inception on June 21, 1985, the Fund returned 8.97% on an annualized basis (Class A Shares at NAV) compared with an annualized gain of 8.93% for the Value Line Convertible Index and 10.94% annualized return for the S&P 500 Index.
What factors influenced performance during the reporting period?
The beginning of the reporting period (November 1 to December 24) witnessed increased volatility as investors worried over Fed policy changes, heightened geopolitical risks, and global growth deceleration. From Christmas day forward, however, these concerns largely subsided thanks to increasingly dovish Fed policy, a temporary cessation to the U.S.-Chinese trade conflict and economic data that pointed toward sustained economic expansion. The Federal Reserve changed its expectation to zero rate increases in 2019 and announced it would reduce the amount of balance sheet normalization, which emboldened risk appetite across markets. While the Fund captured 84% of the S&P 500 Indexsix-month return, it also demonstrated attractive risk/reward attributes during the market’s drawdown and recovery. From the market peak on December 3 to its trough on December 24, the S&P 500 Index dropped-14.72%, while the Fund held up well and declined-7.02% (only 48% downside participation). The recovery which followed in 2019 saw the S&P 500 Index post a positive 22.72% result, while the Fund increased 13.97% (61% upside participation).
Our preference for balanced convertibles led us to underweight the most equity-sensitive convertibles in the market. Equity-sensitive convertibles as measured by the ICE BofAML Equity Alternative U.S. Convertible Index (VEQU), which represents convertibles that can serve as equity alternatives, returned 15.5% and strongly outperformed convertibles with more balanced risk/reward attributes (+11.1%) and those with the most credit sensitivity (+4.5%). Given the strong outperformance of equity-sensitive convertibles, our portfolio’ssix-month result slightly lagged the ICE BofAML All U.S. Convertibles Index.
Economic Sector Contributors
Financials. An underweight allocation and selection in the financials sector provided support to performance. Selection within the asset management and custody banks and multi-line insurance industries were notably strong.
Consumer Staples. A lack of exposure to the consumer staples sector also contributed positively to the portfolio result. The sector is relatively small within the U.S. convertible market (just 1.4% of the index on average during the period) and securities in the sector lagged.
| | | | |
| 16 | | CALAMOS OPEN-END FAMILY OF FUNDS SEMIANNUAL REPORT | | |
Calamos Convertible Fund
Economic Sector Detractors
Consumer Discretionary. Security selection within the consumer discretionary sector held back results, as holdings within the automobile manufacturers and internet and direct marketing retail industries lagged.
Industrials. An overweight position and selection in industrials also detracted from the Fund’s return, especially in the industrial machinery, construction and engineering, and construction machinery and heavy trucks industries.
How is the Fund positioned?
Despite outsized returns in the equity alternative portion of the market during the latter part of the reporting period, we believe balanced convertibles offer the most attractive opportunity, given their combination of potential upside participation and downside protection. We currently look to actively rebalance positions by reducing those that become much more equity sensitive during the market rise, and use the proceeds to purchase convertibles expected to provide stronger risk/reward characteristics. We have used the recent market volatility to actively rebalance into both cyclical and secular opportunities that we have identified in technology, health care and select consumer sectors.
Technology is our largest sector allocation and largest relative overweight at 34.9% of the portfolio (vs. 32.3% for the VXA0 Index). We believe some of the best opportunities exist in the internet security, cloud computing, software and big data areas of the sector. Our second largest sector is Health Care (17.0% of the portfolio vs. 17.3% for the index) as we see favorable opportunities in health care equipment and health care technology.
The portfolio is underweight to the financials sector, as many of the convertible offerings in the sector are very interest rate sensitive and offer little upside opportunity relative to the underlying stock. The portfolio is also underweight real estate (3.0% vs. 4.3%) and consumer staples (0.0% vs. 1.2%) as the U.S. convertible market has a relatively small exposure to these areas and their convertibles offer less attractive risk/reward profiles.
What are your closing thoughts for Fund shareholders?
We favor convertibles as a way to gain equity market exposure while managing downside risk. While the Fed’s dovish pivot may support risk assets, continued macro and geopolitical uncertainty may result in heightened volatility. We are constructive on the longer term, given expectations that geopolitical tensions will calm, Fed policy will be flexible, global growth will stabilize and the near-term volatility could create favorable longer-term investment opportunities. The convertible market remains healthy in our view with compelling opportunities in sectors that we favor including technology, health care and consumer. Increased convertible issuance has expanded the opportunity set, while the existing convertible market continues to offer plenty of balanced convertible structures which we favor over the pure-equity or credit-sensitive portions of the market.
| | | | |
SECTOR WEIGHTINGS
as of April 30, 2019 | | | |
| |
Information Technology | | | 34.9 | % |
Health Care | | | 17.0 | |
| |
Financials | | | 10.1 | |
Consumer Discretionary | | | 8.5 | |
| |
Communication Services | | | 7.7 | |
Utilities | | | 5.0 | |
| |
Industrials | | | 4.8 | |
Energy | | | 4.2 | |
| |
Real Estate | | | 2.9 | |
Materials | | | 0.9 | |
Sector weightings are subject to change daily and are calculated as a percentage of net assets. The table excludes cash or cash equivalents, any government/sovereign bonds or broad based index hedging securities the Fund may hold.
Calamos Convertible Fund
ANNUALIZED RETURN: SINCE INCEPTION (6/21/85) THROUGH 4/30/19
Performance data quoted represents past performance, which is no guarantee of future results. Current performance may be lower or higher than the performance quoted.
The principal value and investment return of an investment will fluctuate so that your shares, when redeemed, may be worth more or less than their original cost. You can obtain performance data current to the most recent month end by visiting www.calamos.com. Average annual total return measures net investment income and capital gain or loss from portfolio investments as an annualized average. All performance shown assumes reinvestment of dividends and capital gains distributions. Performance is for the Fund’s Class A shares at net asset value and does not include the Fund’s maximum front-end sales charge of 2.25%. Had it been included, the Fund’s return would have been lower. The Fund also offers Class C and Class I shares, the performance of which may vary. Source: State Street Corporation, Lipper, Inc., and Mellon Analytical Solutions, LLC.
| | | | |
| 18 | | CALAMOS OPEN-END FAMILY OF FUNDS SEMIANNUAL REPORT | | |
Calamos Convertible Fund
GROWTH OF $10,000: FOR THE 10-YEAR PERIOD ENDED 4/30/19
AVERAGE ANNUAL TOTAL RETURN† AS OF 4/30/19
| | | | | | | | | | | | | | | | | | | | |
| | | 6
MONTHS | | 1
YEAR | | 5
YEARS | | 10
YEARS |
Class A Shares – Inception 6/21/85 | | | | | | | | | | | | | | | | | | | | |
Without Sales Charge | | | | 8.20 | % | | | | 9.14 | % | | | | 5.96 | % | | | | 8.36 | % |
With Sales Charge | | | | 5.74 | | | | | 6.66 | | | | | 4.93 | | | | | 7.83 | |
Class C Shares – Inception 7/5/96 | | | | | | | | | | | | | | | | | | | | |
Without Sales Charge | | | | 7.80 | | | | | 8.34 | | | | | 5.18 | | | | | 7.54 | |
With Sales Charge | | | | 6.85 | | | | | 7.39 | | | | | 5.18 | | | | | 7.54 | |
Class I Shares – Inception 6/25/97 | | | | 8.30 | | | | | 9.44 | | | | | 6.23 | | | | | 8.62 | |
Performance data quoted represents past performance, which is no guarantee of future results. Current performance may be lower or higher than the performance quoted. The principal value and investment return of an investment will fluctuate so that your shares, when redeemed, may be worth more or less than their original cost.
As of the prospectus dated 3/1/19, the Fund’s gross expense ratio for Class A shares is 1.17%; Class C is 1.92% and Class I is 0.92%. The expense ratios shown above may differ from the more recent expense ratios reported in the Financial Highlights section of this report.
| † | Average annual total return measures net investment income and capital gain or loss from portfolio investments as an annualized average assuming reinvestment of dividends and capital gains distributions. Load-adjusted returns are adjusted for the maximumfront-end sales load of 2.25% for Class A shares and returns for Class C shares have been adjusted for the contingent deferred sales charge (CDSC). |
NOTES:
The graphs do not reflect the income of taxes that you would pay on fund distributions or the redemption of fund shares. Fund performance includes reinvestment of dividends and adjustment for the maximum sales charge for Class A shares. The performance of other classes will vary from the performance of the class shown based on the difference in sales charges and fees paid by shareholders investing in different share classes.
The ICE BofAML All U.S. Convertibles Index is comprised of approximately 700 issues of only convertible bonds and preferreds of all qualities.
The S&P 500 Index is an unmanaged index generally considered representative of the U.S. stock market.
The Value Line Convertible Index is an equally-weighted index of the larger convertibles, representing 90% of the U.S. convertible securities market. Index data shown for the Annualized Returns Since Inception graph is from 6/30/85, since comparative index data is only available for full monthly periods. Source: Mellon Analytical Solutions, LLC.
Due to their structural complexities, the attributes of convertibles may vary. Therefore, they are typically categorized as Yield Alternatives represented by the U.S. CV Index (VYLD), Total Return Alternatives represented by the U.S. CV Index (VTOT), or Equity Alternatives represented by the U.S. CV Index (VEQU).
The ICE BofAML Total Return U.S. Convertibles Index is a subset of ICE BofAML All U.S. Convertibles Index including securities with a delta greater than or equal to 0.4 and less than 0.8 (VTOT).
The ICE BofAML Yield Alternative U.S. Convertibles Index (VYLD) is a subset of ICE BofAML All U.S. Convertibles Index including securities with a delta less than 0.4 (exhibiting bond-like characteristics).
The ICE BofAML Equity Alternative U.S. Convertibles Index (VEQU) is a subset of ICE BofAML All U.S. Convertibles Index including securities with a delta of 0.8 and greater (exhibiting stock-like characteristics).
Index returns assume reinvestment of dividends and do not reflect deduction of fees and expenses. It is not possible to invest directly in an index.
Calamos Global Convertible Fund
OVERVIEW
The Fund invests in global convertible securities, striving to balance risk/reward while providing growth and income.
KEY FEATURES
| | ◾ | | Provides broadly diversified exposure to the global convertible bond universe. | |
| | ◾ | | Leverages more than 40 years of research in convertible security investing. | |
| | ◾ | | Seeks to provide upside participation in equity markets with less exposure to downside than an equity-only portfolio over a full market cycle. | |
| | ◾ | | Blends global investment themes and fundamental research via active management. | |
| | ◾ | | Takes environmental, social and governance (ESG) factors into account, evaluating whether they impact a company’s cash flow, risk profile and long-term returns. | |
PORTFOLIO FIT
Consisting of convertible securities that can participate in upside equity movements with potentially limited downside exposure, the Fund can provide a means to manage risk in conjunction with an equity allocation. The Fund can also serve a role within a fixed income allocation, as convertibles have performed well during periods of rising interest rates and inflation.
| | |
| FUND NASDAQ SYMBOLS |
| |
A Shares | | CAGCX |
C Shares | | CCGCX |
| |
I Shares | | CXGCX |
| |
|
| FUND CUSIP NUMBERS |
| |
A Shares | | 128120748 |
C Shares | | 128120730 |
| |
I Shares | | 128120722 |
| |
CALAMOS GLOBAL CONVERTIBLE FUND
INVESTMENT TEAM DISCUSSION
How has the Fund performed?
For thesix-month period ended April 30, 2019, Calamos Global Convertible Fund returned 5.81% (Class A Shares at net asset value) versus the Thomson Reuters Global Convertible Bond Index return of 7.58% and ICE BofAML Global 300 Convertible Index return of 6.28%. The portfolio’s result was hindered in part by its underweight to convertibles displaying the most equity sensitivity, which outperformed. We believe balanced convertibles offer the most attractive investment opportunity, given their combination of upside potential and downside protection. And we believe the Fund’s longer-term performance bears this out. Since its inception on December 31, 2014, the Fund increased 4.89% (Class A Shares at net asset value) annualized versus a 4.48% gain for the Thomson Reuters Global Convertible Bond Index and 7.24% increase for the ICE BofAML Global 300 Convertible Index.
What factors influenced performance during the reporting period?
The beginning of the reporting period saw heightened volatility stemming from investor worries regarding global growth deceleration, increasing geopolitical uncertainty, and U.S. Federal Reserve policy changes. The market quickly rebounded in late December as these concerns subsided thanks to a temporary cessation to the U.S.-Chinese trade conflict, improving economic data, and an increasingly dovish U.S. Federal Reserve. At the beginning of the period as volatility unfolded, the MSCI World Index, representing companies of developed market countries, fell 12.0% from December 3 to December 25, 2018. The Fund participated in just 42% of the downside(-4.98%) during this period. When the MSCI World Index rebounded 22.5% from that point to the end of the period, the Fund participated in 49% of the market upside (+8.85%).
Over the period, the market environment favored the most equity-sensitive convertibles. Convertibles with the most equity sensitivity were up 16.0% and strongly outperformed those with balanced risk/reward attributes (+9.6%) and those with most credit sensitivity (+3.3%). Our approach led us to be underweight the most equity-sensitive convertibles and favor those with balanced risk/reward attributes, and this strategy slightly held back the Fund’s relative performance during the period.
Economic Contributors
Information Technology. An overweight allocation and security selection in the information technology sector was supportive to results. Selection in application software finished ahead and the portfolio benefited from a relatively heavy weight to the strong-performing internet services and infrastructure industry.
Industrials. An underweight allocation and security selection in the industrials sector also added value during the period. A significant underweight to names in the lagging aerospace & defense industry especially helped.
Economic Sector Detractors
Consumer Discretionary. Security selection in consumer discretionary detracted from the Fund’s return, as holdings in the automobile manufacturers, internet & direct marketing retail, and apparel, accessories and luxury goods industries lagged.
| | | | |
| 20 | | CALAMOS OPEN-END FAMILY OF FUNDS SEMIANNUAL REPORT | | |
Calamos Global Convertible Fund
Materials. An underweight position and selection in materials also detracted from the Fund’s return. A relatively light allocation to the strong-performing diversified metals & mining industry crimped results.
Geographic Influences
Regionally, the Fund realized its best performance in Canada, Emerging Europe & South Africa, Emerging Latin America and the United States. Conversely, Japan, Europe and Emerging Asia saw lackluster results. While having an overweight allocation in the United States added value during the reporting period, U.S. selection lagged. An underweight allocation and selection in emerging Latin America also hampered results. However, an underweight allocation to Europe added value during the period.
How is the Fund positioned?
The rapid advance that followed the late 2018 marketsell-off provided opportunities to rebalance the portfolio. We were able to reduce convertibles that had become overly equity sensitive with convertibles offering improved risk/reward attributes. While equity-sensitive convertibles performed strongest at the beginning of the reporting period, we continue to believe that balanced convertibles offer the most attractive opportunity given their combination of upside potential and downside protection, and we have positioned the portfolio accordingly.
From a sector standpoint, information technology and financials represent the largest weights, while utilities and consumer staples represent the smallest. Within the information technology sector, we are finding the best opportunities in application software, cloud-based technologies as well as semiconductors. In financials, we favor diversified banks and asset managers. Consumer staples and utilities represent small allocations within the convertible market. Relative to the Thomson Reuters Global Convertible index, the Fund’s largest overweight allocations are represented in information technology and financials, while communication services and materials are underweight.
From a regional standpoint, the Fund’s largest allocations are to the United States and Europe. Conversely, EMEA and Japan carry the smallest absolute weights. Relative to the Thomson Reuters Global Convertible index, the portfolio is overweight toward the United States, while the underweight in Europe and Japan.
Do you have any closing thoughts for shareholders?
Overall, global corporate and macroeconomic data has pointed toward moderate global growth conditions. Global central banks have adopted a more patient stance on future interest rate actions andlow-interest rate environment is expected to be conducive to continued expansion. At the same time, we expect that as we progress later into the economic cycle, spikes in volatility are likely to arise from geopolitical uncertainty and trade tensions. Against this backdrop, we favor convertibles as a way to gain equity market exposure while managing downside risk. We see opportunities in global equities and convertibles, reflective of moderate earnings growth, benign inflation and attractive valuations. The convertible market remains healthy in our view with compelling opportunities in sectors that we favor including technology and health care. Increased convertible issuance has expanded the opportunity set, while the existing convertible market continues to offer plenty of balanced convertible structures, which we continue to favor over the pure-equity or busted portions of the market. We
| | | | |
SECTOR WEIGHTINGS
as of April 30, 2019 | | | |
| |
Information Technology | | | 22.3 | % |
Financials | | | 14.2 | |
| |
Health Care | | | 10.1 | |
Consumer Discretionary | | | 9.8 | |
| |
Industrials | | | 6.5 | |
Energy | | | 6.4 | |
| |
Communication Services | | | 5.7 | |
Materials | | | 3.0 | |
| |
Real Estate | | | 3.0 | |
Consumer Staples | | | 2.7 | |
| |
Utilities | | | 2.5 | |
| | | | | |
Sector weightings are subject to change daily and are calculated as a percentage of net assets. The table excludes cash or cash equivalents, any government/sovereign bonds or broad based index hedging securities the Fund may hold.
Calamos Global Convertible Fund
favor investments in companies with earnings growth catalysts, solid cash-flow generation and healthy balance sheets. Our active, risk-managed investment approach and long-term perspective positions us to take advantage of the volatility and opportunities in global markets.
| | | | |
| 22 | | CALAMOS OPEN-END FAMILY OF FUNDS SEMIANNUAL REPORT | | |
Calamos Global Convertible Fund
GROWTH OF $10,000: SINCE INCEPTION (12/31/14) THROUGH 4/30/19
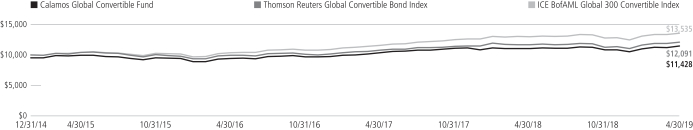
AVERAGE ANNUAL TOTAL RETURN† AS OF 4/30/19
| | | | | | | | | | | | | | | |
| | | 6
MONTHS | | 1
YEAR | | SINCE
INCEPTION |
Class A Shares – Inception 12/31/2014 | | | | | | | | | | | | | | | |
Without Sales Charge | | | | 5.81 | % | | | | 3.50 | % | | | | 4.89 | % |
With Sales Charge | | | | 3.42 | | | | | 1.14 | | | | | 3.71 | |
Class C Shares – Inception 12/31/2014 | | | | | | | | | | | | | | | |
Without Sales Charge | | | | 5.39 | | | | | 2.73 | | | | | 4.12 | |
With Sales Charge | | | | 4.39 | | | | | 1.75 | | | | | 4.12 | |
Class I Shares – Inception 12/31/2014 | | | | 5.95 | | | | | 3.77 | | | | | 5.18 | |
Performance data quoted represents past performance, which is no guarantee of future results. Current performance may be lower or higher than the performance quoted. The principal value and investment return of an investment will fluctuate so that your shares, when redeemed, may be worth more or less than their original cost.
As of the prospectus dated 3/1/19, the Fund’s gross expense ratio for Class A shares is 1.36%; Class C is 2.11% and Class I is 1.11%. The expense ratios shown above may differ from the more recent expense ratios reported in the Financial Highlights section of this report.
| † | Average annual total return measures net investment income and capital gain or loss from portfolio investments as an annualized average assuming reinvestment of dividends and capital gains distributions. Performance shown includes the effects of an expense reimbursement that improved results and was in effect until October 31, 2017. Load-adjusted returns are adjusted for the maximum frontend sales load of 2.25% for Class A shares and returns for Class C shares have been adjusted for the contingent deferred sales charge (CDSC). |
NOTES:
On July 1, 2018, the Thomson Reuters Global Convertible Bond Index (USD) replaced the ICE BofAML Global 300 Convertible Index as the Fund’s primary benchmark because it more closely aligns with the Fund’s investment universe. The Thomson Reuters Global Convertible Bond Index (USD) is designed to represent the global convertible market.
The ICE BofAML Global 300 Convertible Index is a global convertible index composed of companies representative of the market structure of countries in North America, Europe and the Asia/Pacific region.
Unmanaged index returns assume reinvestment of any and all distributions and, unlike fund returns, do not reflect fees, expenses or sales charges. Investors cannot invest directly in an index.
The Fund’s use of derivative instruments involves investment risks and transaction costs to which the Fund would not be subject absent the use of these instruments and, accordingly, may result in losses greater than if they had not been used. Derivative instruments can be illiquid, may disproportionately increase losses and may have a potentially large impact on Fund performance.
Calamos Growth Fund
OVERVIEW
The Fund invests in the equities of U.S. companies from a range of market capitalizations that we believe offer the best potential for growth.
KEY FEATURES
| | ◾ | | Utilizes more than two decades of extensive research experience in growth investing. | |
| | ◾ | | Active management focuses on top-down views and bottom-up fundamentals. | |
| | ◾ | | Research-driven approach identifies opportunities by combining top-down analysis with a focus on key growth characteristics. | |
PORTFOLIO FIT
This actively managed Fund seeks to provide attractive returns through its emphasis on higher growth companies primarily in large and mid cap arenas.
| | |
| FUND NASDAQ SYMBOLS |
| |
A Shares | | CVGRX |
C Shares | | CVGCX |
| |
I Shares | | CGRIX |
| |
|
| FUND CUSIP NUMBERS |
| |
A Shares | | 128119302 |
C Shares | | 128119856 |
| |
I Shares | | 128119807 |
| |
CALAMOS GROWTH FUND
INVESTMENT TEAM DISCUSSION
How has the Fund performed?
For thesix-month period ended April 30, 2019, Calamos Growth Fund gained 11.63% (Class A Shares at net asset value) versus the S&P 1500 Growth Index return of 10.58%. For the same period, the S&P 500 Index rose 9.76% and the Russell Midcap Growth Index increased 16.55%.
The Fund outperformed by means of a combination of strong security selection as well as beneficial sector positioning during an incredibly volatile period for the U.S. and global equity markets.
Since its inception on September 4, 1990, the Fund has returned 12.81% on an annualized basis (Class A Shares at net asset value). Over the same period, the S&P 500 Index returned 10.30%. The S&P 1500 Growth Index, the primary benchmark, returned 9.85% since its inception on July 31, 1995. We believe these comparisons demonstrate the Fund’s ability to outdistance the growth and broad indices over full market cycles.
What factors influenced performance over the period?
The full period witnessed a dramatic increase in equity market volatility accompanied by aV-shaped decline and recovery. At the start of the period, the U.S. and global equity markets were in the midst of a sharp decline that began in late September and early October 2018. In fact, the broad U.S. market, as measured by the S&P 500 Index, declined-19.37% from September 20, 2018 through the closing bell on December 24, 2018. Investors had become increasingly concerned that strength in the U.S. economy would prompt the Federal Reserve to continue raising interest rates, tightening financial conditions and creating a more difficult business environment going forward. In early October Fed Chairman Powell voiced his view that rates were still “a long way” from neutral, which precipitated the market decline. Then, in late December, Powell and the Fed indicated that short-term rates were closer to a more neutral level. In January, the Fed changed/reduced their expectation to zero rate increases for 2019 and announced they would also reduce the amount of balance sheet normalization, a series of actions that emboldened risk-appetite across markets. From Christmas Eve forward through the end of the reporting period, the U.S. market rallied 26.13% (a pace that would annualize to 95% returns).
The Fund outperformed the S&P 1500 Growth Index and the broad market with strong contributions from stock selection in addition to beneficial sector allocations. Our positioning favored a combination of secular and cyclical growth business, as we believed that the scarcity of growth would place a higher premium on these businesses. For the full reporting period, information technology, consumer discretionary and communication services were the sectors that contributed most to the growth benchmark’s gains, and the Fund added value in all three sectors.
The Fund realized a substantial benefit from the information technology sector, via both sector allocation and individual stock selection. The Fund entered the reporting period with a significant underweight to the much loved sector based on our concerns around crowded trades. As information technology was an underperformer within the growth
| | | | |
| 24 | | CALAMOS OPEN-END FAMILY OF FUNDS SEMIANNUAL REPORT | | |
Calamos Growth Fund
benchmark during the market’ssell-off, the Fund benefitted and opportunistically improved its positioning, as we reduced the underweight on relative weakness. The sector was a leader during the market’s subsequent rally, benefitting the portfolio’s return. Stock selection was also a strong positive as Fund holdings not only outperformed during the marketsell-off, but also during the latter portion of the period when the market rose strongly. Holdings within application software and internet services were the biggest contributors.
Communication services is another sector that was strongly additive to relative performance. The Fund’s slight overweight positioning was additive during the reporting period, as the communication services sector outperformed the S&P 1500 Growth Index benchmark for the period. But just as importantly, active management helped as individual stocks within the portfolio outperformed those of the benchmark during the market’s downturn as well as during the rebound for the reporting period. Strong selection within interactive media and services, as well as avoiding crowded trades in interactive home entertainment and slower growth in integrated telecom services proved additive.
While the Fund outperformed for the period, the financials and industrials sectors were areas that caused a drag on relative performance. An overweight to the financials sector hindered relative performance, as the sector was a laggard during the period. Fund holdings in the financial exchanges & data as well as investment banking and brokerage industries struggled during the period. Selection within the industrial sector delivered strong performance but still trailed, most notably in the aerospace & defense and trading companies & distributors industries. The modest overweight to the cyclical growth-oriented industrial sector did provide some relative value.
How is the Fund positioned?
We seek to invest in U.S. companies that we believe have the best prospects for sustainable and high relative growth. The Fund offers a diversified approach and participates in long-term growth trends by focusing on companies with solid fundamentals, and strong growth catalysts, while being mindful of valuations.
The portfolio remains broadly diversified with a focus on a mix of secular and cyclical growth holdings. Information technology remains the largest overall sector allocation, but was reduced to an underweight at the end of the period, as we felt it was time to capitalize on the strong rally that our tech names enjoyed. Consumer discretionary names remain a large sector weight and represent an overweight relative the growth benchmark. We believe the consumer is still in good standing, and leading businesses in the sector may provide superior growth rates in key markets. In health care, we have reduced our underweight on recent weakness. Sectors such as real estate, utilities, materials, energy and consumer staples remain very low weights in an absolute sense, as we do not see sustainable growth dynamics to support larger inclusion.
What closing thoughts do you have for Fund shareholders?
We maintain our concern that an upcoming change in the monetary tide could be disruptive to equity markets globally. The Fed has wisely squelched their previously hawkish tone from earlier in the period, but the market’s reaction to these changes has given us pause. Certainly the U.S. is in good shape, and we do not currently foresee recession risk
| | | | |
SECTOR WEIGHTINGS
as of April 30, 2019 | | | |
| |
Information Technology | | | 20.4 | % |
Health Care | | | 15.8 | |
| |
Consumer Discretionary | | | 15.1 | |
Communication Services | | | 14.7 | |
| |
Industrials | | | 13.2 | |
Financials | | | 7.0 | |
| |
Consumer Staples | | | 2.6 | |
Materials | | | 1.6 | |
| |
Energy | | | 1.0 | |
Other | | | 0.6 | |
Sector weightings are subject to change daily and are calculated as a percentage of net assets. The table excludes cash or cash equivalents, any government/sovereign bonds or broad based index hedging securities the Fund may hold.
Calamos Growth Fund
in the near future. The U.S. market presents an amazingly long list of stocks in businesses that are delivering strong growth in a lower-growth world, and many of these stocks are trading at what we would consider to be fair valuations. That said, we will be cautious when it comes to crowded trades and careful around valuation, as the stakes seem higher regarding the effects of market sentiment related to monetary policy changes.
ANNUALIZED RETURN: SINCE INCEPTION (9/4/90) THROUGH 4/30/19
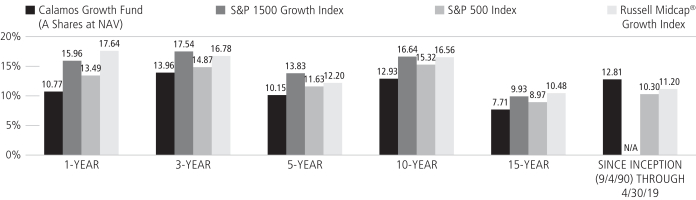
Performance data quoted represents past performance, which is no guarantee of future results. Current performance may be lower or higher than the performance quoted.
The principal value and investment return of an investment will fluctuate so that your shares, when redeemed, may be worth more or less than their original cost. You can obtain performance data current to the most recent month end by visiting www.calamos.com. Average annual total return measures net investment income and capital gain or loss from portfolio investments as an annualized average. All performance shown assumes reinvestment of dividends and capital gains distributions. Performance is for the Fund’s Class A shares at net asset value and does not include the Fund’s maximum front-end sales charge of 4.75%. Had it been included, the Fund’s return would have been lower. The Fund also offers Class C and Class I shares, the performance of which may vary. Source: State Street Corporation and Lipper, Inc.
| | | | |
| 26 | | CALAMOS OPEN-END FAMILY OF FUNDS SEMIANNUAL REPORT | | |
Calamos Growth Fund
GROWTH OF $10,000: FOR THE 10-YEAR PERIOD ENDED 4/30/19
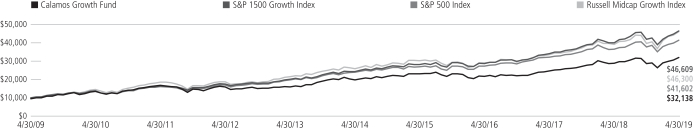
AVERAGE ANNUAL TOTAL RETURN† AS OF 4/30/19
| | | | | | | | | | | | | | | | | | | | |
| | | 6
MONTHS | | 1
YEAR | | 5
YEARS | | 10
YEARS |
Class A Shares – Inception 9/4/90 | | | | | | | | | | | | | | | | | | | | |
Without Sales Charge | | | | 11.63 | % | | | | 10.77 | % | | | | 10.15 | % | | | | 12.93 | % |
With Sales Charge | | | | 6.34 | | | | | 5.49 | | | | | 9.08 | | | | | 12.38 | |
Class C Shares – Inception 9/3/96 | | | | | | | | | | | | | | | | | | | | |
Without Sales Charge | | | | 11.26 | | | | | 9.95 | | | | | 9.34 | | | | | 12.09 | |
With Sales Charge | | | | 10.41 | | | | | 9.11 | | | | | 9.34 | | | | | 12.09 | |
Class I Shares – Inception 9/18/97 | | | | 11.75 | | | | | 11.06 | | | | | 10.43 | | | | | 13.22 | |
Performance data quoted represents past performance, which is no guarantee of future results. Current performance may be lower or higher than the performance quoted. The principal value and investment return of an investment will fluctuate so that your shares, when redeemed, may be worth more or less than their original cost.
As of the prospectus dated 3/1/19, the Fund’s gross expense ratio for Class A shares is 1.29%; Class C is 2.04% and Class I is 1.04%. The expense ratios shown above may differ from the more recent expense ratios reported in the Financial Highlights section of this report.
On October 1, 2018, the S&P 1500 Growth Index replaced the Russell Midcap® Growth Index as the Fund’s primary benchmark because the Fund’s portfolio managers believe the S&P 1500 Growth Index more closely represents the Fund’s investment universe. The S&P 1500 Growth Index is designed to provide investors with a measure of the performance of U.S. growth equities.
| † | Average annual total return measures net investment income and capital gain or loss from portfolio investments as an annualized average assuming reinvestment of dividends and capital gains distributions. Load-adjusted returns are adjusted for the maximumfront-end sales load of 4.75% for Class A shares and returns for Class C have been adjusted for the contingent deferred sales charge (CDSC). |
NOTES:
The graphs do not reflect the income taxes that you would pay on fund distributions or the redemption of fund shares. Fund performance includes reinvestment of dividends and adjustment for the maximum sales charge for Class A shares. The performance of other classes will vary from the performance of the class shown based on the difference in sales charges and fees paid by shareholders investing in different share classes.
The S&P 1500 Growth Index consists of the growth segment of the securities found in the S&P 1500 Index. The S&P 1500 combines the S&P 500, S&P MidCap 400 and the S&P SmallCap 600.
The S&P 500 Index is an unmanaged index generally considered representative of the U.S. stock market. Index data shown for the Annualized Return Since Inception graph is from 8/31/90, since comparative index data is only available for full monthly periods. Source: Lipper, Inc.
The Russell Midcap® Growth Index measures the performance ofmid-sized companies with growth characteristics. Index data shown for the Annualized Return Since Inception graph is from 8/31/90, since comparative index data is only available for full monthly periods. Source: Lipper, Inc.
Index returns assume reinvestment of dividends and do not reflect deduction of fees and expenses. It is not possible to invest directly in an index.
Calamos Growth and Income Fund
OVERVIEW
The Fund invests primarily in U.S. equity and convertible securities in an attempt to balance risk/reward while providing growth and income.
KEY FEATURES
| | ◾ | | Leverages more than four decades of research experience combining equities and convertible holdings to provide equity-like participation. | |
| | ◾ | | Provides a core holding option that aims to maintain a consistent risk posture throughout the market cycle. | |
| | ◾ | | Research-driven approach identifies opportunities by combining top-down analysis with a focus on key growth characteristics. | |
PORTFOLIO FIT
The Fund can provide a long-term core equity allocation with the potential for lower volatility.
| | |
| FUND NASDAQ SYMBOLS |
| |
A Shares | | CVTRX |
C Shares | | CVTCX |
| |
I Shares | | CGIIX |
| |
|
| FUND CUSIP NUMBERS |
| |
A Shares | | 128119104 |
C Shares | | 128119831 |
| |
I Shares | | 128119872 |
| |
CALAMOS GROWTH AND INCOME FUND
INVESTMENT TEAM DISCUSSION
How has the Fund performed?
For thesix-month period ended April 30, 2019, Calamos Growth and Income Fund gained 8.51% (Class A Shares at net asset value) versus a return of 9.76% for the S&P 500 Index and increase of 9.44% for the ICE BofAML All U.S. Convertibles ex Mandatory Index. We manage this Fund with the goal of achieving upside equity participation and potential downside protection over full market cycles. Since its inception on September 22, 1988, the Fund returned 10.93% on an annualized basis (Class A Shares at net asset value) versus a 10.51% gain for the S&P 500 Index and a 9.48% return for the ICE BofAML All U.S. Convertibles Ex Mandatory Index.
Please discuss the Fund’s lower-volatility characteristics.
We believe the Fund’s historical lower-volatility characteristics are a byproduct of our investment style and focus on participating in equity market upside with less volatility than the market as a whole. Beta is one popular statistic for measuring volatility. Beta considers a fund’s historic volatility versus the market, which is assigned a beta of 1.0. A fund with half the volatility of the market would have a beta of 0.5, while a fund with a beta of 2.0 would have been twice as volatile as the market. Since its inception, the Fund has had a beta of 0.73 (Class A shares) versus the S&P 500 Index. The Fund, therefore, outperformed the broader equity market, as measured by the S&P 500 Index, with less volatility than the equity market. Please note that past performance does not indicate future results and that beta is one of many measures of risk.
What factors influenced performance during the reporting period?
The volatile, yet upward moving equity market proved a great opportunity for the risk conscious equity portfolio, which held value better than the equity market in the downturn but delivered strong performance for the full period. Overall, the full period witnessed a dramatic increase in equity market volatility accompanied by aV-shaped decline and recovery. At the start of the period, the U.S. and global equity markets were in the midst of a sharp decline that began in late September and early October 2018. In fact, the broad U.S. market, as measured by the S&P 500 Index, declined-19.37% from September 20, 2018 through the closing bell on December 24, 2018. Investors had become increasingly concerned that strength in the U.S. economy would prompt the Federal Reserve to continue raising interest rates, tightening financial conditions and creating a more difficult business environment going forward. In early October Fed Chairman Powell voiced his view that rates were still “a long way” from neutral, which precipitated the market decline. Then, in late December, Powell and the Fed indicated that short-term rates were closer to a more neutral level. In January, the Fed changed/reduced their expectation to zero rate increases for 2019 and announced they would also reduce the amount of balance sheet normalization, a series of actions that emboldened risk-appetite across markets. From Christmas Eve forward through the end of the reporting period, the U.S. market rallied 26.13% (a pace that would annualize to 95% returns).
For the full reporting period, the well-diversified portfolio was able to provide significant equity market capture by managing risks during the sharp pullback and then
| | | | |
| 28 | | CALAMOS OPEN-END FAMILY OF FUNDS SEMIANNUAL REPORT | | |
Calamos Growth and Income Fund
went on to participate strongly in the subsequent equity market rebound. The portfolio held an underweight in the health care sector throughout the period based on our concern that political risks threatened the sector’s recent strength. In the end, our wariness was justified, as health care turned out to be a laggard for the full reporting period. Though health care stocks outperformed during the market’s downturn, the sector significantly lagged during the rebound. Strong individual security selection was even more important to the Fund’s relative performance, most notably within biotechnology. The portfolio held outperforming biotech common stocks and avoided some problematic names during the period. Additionally, the Fund benefitted from strong selection and an underweight to the consumer staples sector for the reporting period. Portfolio holdings in consumer staples held their value much better than those of the equity index, as the Fund avoided the difficulties in tobacco stocks, and benefitted from diversifying away from only common stocks when consumer staples declined in sync with the broad market early in the period.
The consumer discretionary sector hindered the Fund’s relative performance over the reporting period. Fund holdings fared much better overall than the sector during the market’s downturn, but holdings lagged during the subsequent surge in consumer discretionary stocks. Fund holdings turned in performance similar to the overall market with strong absolute returns during the market’s upswing, but trailed the consumer discretionary sector’s performance most notably in internet marketing and autos. Financials holdings also detracted from relative performance when compared to theall-equity S&P 500 Index benchmark. The underweight to the financials sector provided a small contribution to relative performance, but our holdings slightly underperformed for the period, as selection in financial exchanges and asset management lagged.
How is the Fund positioned?
Believing that the U.S. equity market may be volatile but upward trending, we continue to position the portfolio with the goal of participating in the U.S. equity market’s upside, while providing resilience during market declines and downside volatility. We believe that actively managing equity market risks by blending equity and convertible securities allows us to construct a portfolio that can provide equity-like returns with significantly less volatility and equity beta over full market cycles. The Fund is broadly diversified with holdings in each of the eleven sectors. From a sector standpoint, information technology and health care represent the largest weights on an absolute basis, similar to the broad equity market. Information technology represents a broad range of high growth businesses that, in many cases, have strong balance sheets and cash flows. The portfolio takes an overweight stance in communication services versus the S&P 500 Index, where higher growth potential in a slower-growth world may continue to offer attractive investment opportunities. The portfolio holds a modest overweight position in consumer discretionary, but is underweight to consumer staples. We believe this stance gives us considerable opportunities in secular and cyclical growth areas of the economy.
What closing thoughts do you have for Fund shareholders?
The rapid changes in sentiment and dramatic moves in asset prices certainly provide a good reason for adopting a risk-managed approach to the equity markets. In the span of just a few months’ time, the likelihood of Fed rate hikes went from near certainty of a hike to near certainty of no hike. Volatility, as measured the VIX Index, spiked dramatically in December 2018 but has returned to a more benign level and tranquil path.
| | | | |
SECTOR WEIGHTINGS
as of April 30, 2019 | | | |
| |
Information Technology | | | 21.0 | % |
Health Care | | | 12.5 | |
| |
Financials | | | 12.2 | |
Communication Services | | | 11.0 | |
| |
Consumer Discretionary | | | 10.1 | |
Industrials | | | 9.0 | |
| |
Consumer Staples | | | 6.2 | |
Energy | | | 4.7 | |
| |
Utilities | | | 4.0 | |
Real Estate | | | 2.7 | |
| |
Other | | | 1.9 | |
Materials | | | 1.2 | |
Sector weightings are subject to change daily and are calculated as a percentage of net assets. The table excludes cash or cash equivalents, any government/sovereign bonds or broad based index hedging securities the Fund may hold.
Calamos Growth and Income Fund
Economic conditions are indicating a slowdown from the rapid growth of 2018, but in our view this was expected and is likely priced into the market. The Fed has indicated a more dovish and supportive stance for liquidity, and despite strong returns to U.S. equities, money flows do not point to a crowded trade. We maintain our view that the U.S. economy does not appear to have near-term risk of recession and there exist favorable opportunities within the equity market. We will focus on businesses we believe to have higher quality of earnings, which may offer more compelling growth in a positive, but lower-growth environment.
ANNUALIZED RETURN: SINCE INCEPTION (9/22/88) THROUGH 4/30/19
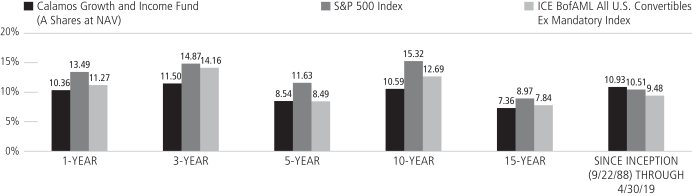
Performance data quoted represents past performance, which is no guarantee of future results. Current performance may be lower or higher than the performance quoted.
The principal value and investment return of an investment will fluctuate so that your shares, when redeemed, may be worth more or less than their original cost. You can obtain performance data current to the most recent month end by visiting www.calamos.com. Average annual total return measures net investment income and capital gain or loss from portfolio investments as an annualized average. All performance shown assumes reinvestment of dividends and capital gains distributions. Performance is for the Fund’s Class A shares at net asset value and does not include the Fund’s maximum front-end sales charge of 4.75%. Had it been included, the Fund’s return would have been lower. The Fund also offers Class C and Class I shares, the performance of which may vary. Source: State Street Corporation and Lipper, Inc.
| | | | |
| 30 | | CALAMOS OPEN-END FAMILY OF FUNDS SEMIANNUAL REPORT | | |
Calamos Growth and Income Fund
GROWTH OF $10,000: FOR 10-YEAR PERIOD ENDED 4/30/19
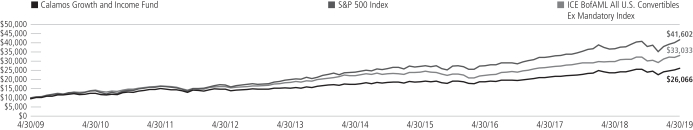
AVERAGE ANNUAL TOTAL RETURN† AS OF 4/30/19
| | | | | | | | | | | | | | | | | | | | |
| | | 6
MONTHS | | 1
YEAR | | 5
YEARS | | 10
YEARS |
Class A Shares – Inception 9/22/88 | | | | | | | | | | | | | | | | | | | | |
Without Sales Charge | | | | 8.51 | % | | | | 10.36 | % | | | | 8.54 | % | | | | 10.59 | % |
With Sales Charge | | | | 3.36 | | | | | 5.11 | | | | | 7.49 | | | | | 10.05 | |
Class C Shares – Inception 8/5/96 | | | | | | | | | | | | | | | | | | | | |
Without Sales Charge | | | | 8.13 | | | | | 9.56 | | | | | 7.72 | | | | | 9.76 | |
With Sales Charge | | | | 7.13 | | | | | 8.56 | | | | | 7.72 | | | | | 9.76 | |
Class I Shares – Inception 9/18/97 | | | | 8.67 | | | | | 10.63 | | | | | 8.80 | | | | | 10.86 | |
Performance data quoted represents past performance, which is no guarantee of future results. Current performance may be lower or higher than the performance quoted. The principal value and investment return of an investment will fluctuate so that your shares, when redeemed, may be worth more or less than their original cost.
As of the prospectus dated 3/1/19, the Fund’s gross expense ratio for Class A shares is 1.10%; Class C is 1.85% and Class I is 0.85%. The expense ratios shown above may differ from the more recent expense ratios reported in the Financial Highlights section of this report.
| † | Average annual total return measures net investment income and capital gain or loss from portfolio investments as an annualized average assuming reinvestment of dividends and capital gains distributions. Load-adjusted returns are adjusted for the maximumfront-end sales load of 4.75% for Class A shares and returns for Class C shares have been adjusted for the contingent deferred sales charge (CDSC). |
NOTES:
The graphs do not reflect the income taxes that you would pay on fund distributions or the redemption of fund shares. Fund performance includes reinvestment of dividends and adjustment for the maximum sales charge for Class A shares. The performance of other classes will vary from the performance of the class shown based on the difference in sales charges and fees paid by shareholders investing in different share classes.
The S&P 500 Index is an unmanaged index generally considered representative of the U.S. stock market. Source: Lipper, Inc.
The ICE BofAML All U.S. Convertibles Ex Mandatory Index represents the U.S. convertibles securities market excluding mandatory convertibles. Index data shown for the Annualized Return Since Inception graph is from 9/30/88, since comparative index data is only available for full monthly periods. Source: Lipper, Inc.
Index returns assume reinvestment of dividends and do not reflect deduction of fees and expenses. It is not possible to invest directly in an index.
Calamos Dividend Growth Fund
OVERVIEW
The Fund invests in companies that we believe have the ability to increase dividends over time, either through increasing profits or more efficient use of capital.
KEY FEATURES
| | ◾ | | Employs bottom-up stock picking and a benchmark-agnostic approach. | |
| | ◾ | | Focuses on good businesses with solid cash flows and value prices. | |
PORTFOLIO FIT
The Fund may be suitable for investors seeking a regular stream of income and dividend-paying equity investments that tend to be less volatile than non-dividend payers.
| | |
| FUND NASDAQ SYMBOLS |
| |
A Shares | | CADVX |
C Shares | | CCDVX |
| |
I Shares | | CIDVX |
| | | |
|
| FUND CUSIP NUMBERS |
| |
A Shares | | 128120839 |
C Shares | | 128120821 |
| |
I Shares | | 128120813 |
| | | |
CALAMOS DIVIDEND GROWTH FUND
INVESTMENT TEAM DISCUSSION
How has the Fund performed?
For thesix-month period ended April 30, 2019, Calamos Dividend Growth Fund gained 9.88% (Class A Shares at net asset value), performing broadly in line with the 9.76% rise of the S&P 500 Index, the Fund’s benchmark. The Fund benefited nearly equally from sector and individual stock decisions.
What factors influenced performance during the reporting period?
In our last report, we had said: “The U.S. economic recovery has been lengthy, but growth has also been more gradual than typical economic expansions of the past. In our view, this gives us reason to believe that the economy may continue to grow, as expansions are not time constrained, but are subject to booms and busts. We will keep a watchful eye on financial conditions and seek to tailor the portfolio’s risk/reward profile in accordance with changes in market and economic conditions. Volatility has increased over recent years, and we saw a correction within the equity market during the period, which goes to show that the potential benefits of managing risk and volatility may be timelier today than in the recent past.”
Those words rang true over this reporting period, as we saw a dramatic increase in equity market volatility with aV-shaped decline and recovery. The period began with the U.S. and global equity markets in the midst of a sharp decline that had begun in late September/early October 2018. In fact, the broad U.S. market, as measured by the S&P 500 Index, declined-19.37% from September 20, 2018 through the closing bell on December 24, 2018. Investors had become increasingly concerned that strength in the U.S. economy would prompt the Federal Reserve to continue raising interest rates, tightening financial conditions and creating a more difficult business environment going forward. In early October Fed Chairman Powell voiced his view that rates were still “a long way” from neutral, which precipitated the market decline. Then, in late December, Powell and the Fed indicated that short-term rates were closer to a more neutral level. In January, the Fed changed/reduced their expectation to zero rate increases for 2019 and announced they would also reduce the amount of balance sheet normalization, a series of actions that emboldened risk-appetite across markets. From Christmas Eve forward through the end of the reporting period, the U.S. market rallied 26.13% (a pace that would annualize to 95% returns).
While only modestly overweight, the Fund benefitted from its view and selection within the information technology sector. Information technology was one of thetop-performing sectors within the equity market for the period, as investors preferred the higher-growth businesses during the market’s rebound. Strong performance within the data processing & outsourced services boosted the Fund’s absolute and relative performance, as did wisely underweighting and sidestepping underperformers among the hardware industry that struggled mightily. Communication services stocks also performed well during the period, as the sector’s higher growth potential was favored by the broad market. Strong performance and a modest overweight in movies & entertainment was favorable to performance. Additionally, the Fund’s strong selection within interactive home entertainment helped.
| | | | |
| 32 | | CALAMOS OPEN-END FAMILY OF FUNDS SEMIANNUAL REPORT | | |
Calamos Dividend Growth Fund
Holdings within the financials sector detracted from relative performance. The sector was a laggard among the broad market and has struggled relative to the broad market for several quarters. The Fund’s holdings in financial exchanges and data acted as a drag on relative performance. The energy sector was also a detractor as a modest overweight (on average less than one half of one percent) impeded return. Broadly speaking, the energy sector significantly underperformed the market during the period. Holdings within the exploration & production industry also lagged, crimping results.
How is the Fund positioned?
The Fund’s investments reflect our positive long-term outlook for equities and our preference for dividend-paying companies with sound fundamentals and attractive valuations. Furthermore, we seek companies that have an ability to increase dividends over time, either by increasing profits or using capital more efficiently.
The Fund, as typical, is broadly diversified with investments in all eleven sectors. In seeking to diversify in light of market conditions, we typically do not have significant overweights or underweights. The real estate and materials sectors represent our largest underweights. While the cash flows within real estate may be favorable in many cases, valuations and growth potential have tempered our enthusiasm on a relative basis. The cyclical nature of materials businesses has similarly given us pause. Our largest allocation is to information technology, which is also the market’s largest sector weight. We have favored investments within software and data processing & services areas and have a modest overweight to the sector overall. We also have a modest overweight to communication services, where we find a dynamic set of opportunities amongst a variety of service providers.
What closing thoughts do you have for Fund shareholders?
As mentioned previously, we anticipate a more volatile market than what we had experienced in prior years, although the sharp and sudden activity in this reporting period was even greater than what we had been considering. We favor what we believe to be higher-quality growth opportunities, looking for businesses operating efficiently with strong balance sheets andstable-to-growing cash flow. We are not believers that a market or economic cycle has an age associatedend-date, but instead should ebb and flow according to financial conditions and economic strength. Overall, the underpinnings for a continued expansion remain in place, in our view, and we must continue to be mindful of valuation associated with crowded trades.
| | | | |
SECTOR WEIGHTINGS
as of April 30, 2019 | | | |
| |
Information Technology | | | 22.1 | % |
Health Care | | | 13.2 | |
| |
Financials | | | 13.0 | |
Communication Services | | | 10.9 | |
| |
Consumer Discretionary | | | 10.3 | |
Industrials | | | 9.0 | |
| |
Consumer Staples | | | 7.3 | |
Energy | | | 5.5 | |
| |
Utilities | | | 2.9 | |
Real Estate | | | 1.9 | |
| |
Materials | | | 1.4 | |
Other | | | 0.8 | |
Sector weightings are subject to change daily and are calculated as a percentage of net assets. The table excludes cash or cash equivalents, any government/sovereign bonds or broad based index hedging securities the Fund may hold.
Calamos Dividend Growth Fund
GROWTH OF $10,000: SINCE INCEPTION (8/5/13) THROUGH 4/30/19
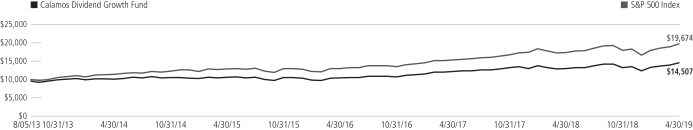
AVERAGE ANNUAL TOTAL RETURN† AS OF 4/30/19
| | | | | | | | | | | | | | | | | | | | |
| | | 6
MONTHS | | 1
YEAR | | 5
YEARS | | SINCE
INCEPTION |
Class A Shares – Inception 8/5/2013 | | | | | | | | | | | | | | | | | | | | |
Without Sales Charge | | | | 9.88 | % | | | | 12.26 | % | | | | 8.61 | % | | | | 8.58 | % |
With Sales Charge | | | | 4.63 | | | | | 6.96 | | | | | 7.56 | | | | | 7.66 | |
Class C Shares – Inception 8/5/2013 | | | | | | | | | | | | | | | | | | | | |
Without Sales Charge | | | | 9.46 | | | | | 11.40 | | | | | 7.81 | | | | | 7.78 | |
With Sales Charge | | | | 8.46 | | | | | 10.40 | | | | | 7.81 | | | | | 7.78 | |
Class I Shares – Inception 8/5/2013 | | | | 10.03 | | | | | 12.55 | | | | | 8.90 | | | | | 8.86 | |
Performance data quoted represents past performance, which is no guarantee of future results. Current performance may be loweror higher than the performance quoted. The principal value and investment return of an investment will fluctuate so that your shares, when redeemed, may be worth more or less than their original cost.
As of the prospectus dated 3/1/19, the Fund’s gross expense ratio for Class A shares is 1.84%; Class C shares is 2.60% and Class I shares is 1.61%. The Fund’s Investment Adviser has contractually agreed to reimburse Fund expenses through 3/1/22 to the extent necessary so that Total Annual Fund Operating Expenses (excluding taxes, interest, short interest, short dividend expenses, brokerage commissions, acquired fund fees and expenses and extraordinary expenses, if any) of Class A, Class C and Class I shares are limited to 1.35%, 2.10%,1.10% of average net assets, respectively. Calamos Advisors may recapture previously waived expense amounts within the same fiscal year for any day where the respective Fund’s expense ratio falls below the contractual expense limit up to the expense limit for that day. This undertaking is binding on CALAMOS ADVISORS and any of its successors and assigns. This agreement is not terminable by either party. The expense ratios shown above may differ from the more recent expense ratios reported in the Financial Highlights section of this report.
| † | Average annual total return measures net investment income and capital gain or loss from portfolio investments as an annualized average assuming reinvestment of dividends and capital gains distributions. Performance shown reflects the effects of an expense reimbursement that improved results. Load-adjusted returns are adjusted for the maximum frontend sales load of 4.75% for Class A shares. Returns for Class C shares have been adjusted for the contingent deferred sales charge (CDSC). |
NOTES:
The graph does not reflect the income taxes that you would pay on fund distributions or the redemption of fund shares. Fund performance includes reinvestment of dividends and adjustment for the maximum sales charge for Class A shares. The performance of other classes will vary from the performance of the class shown based on the difference in sales charges and fees paid by shareholders investing in different share classes.
The S&P 500 Index is an unmanaged index generally considered representative of the U.S. stock market. Index data shown for the Since Inception Growth of $10,000 chart is from 7/31/13, since comparative index data is only available for full monthly periods. Source: Lipper, Inc.
Index returns assume reinvestment of dividends and do not reflect deduction of fees and expenses. It is not possible to invest directly in an index.
| | | | |
| 34 | | CALAMOS OPEN-END FAMILY OF FUNDS SEMIANNUAL REPORT | | |
Calamos Opportunistic Value Fund
CALAMOS OPPORTUNISTIC VALUE FUND
INVESTMENT TEAM DISCUSSION
How has the Fund performed?
For thesix-month period ended April 30, 2019, Calamos Opportunistic Value Fund gained 6.65% (Class A Shares at net asset value) versus a gain of 8.38% for the S&P 1500 Value Index and increase of 7.90% for the Russell 1000 Value Index.
The Fund delivered strong absolute performance over the full reporting period, benefitting as it was better able to protect value during the market’ssell-off in the beginning of the period. As the market rallied beginning in January, Fund performance lagged slightly as deep cyclical names, which had not performed well, bounced significantly.
What factors influenced performance?
Overall, the full period witnessed a dramatic increase in equity market volatility accompanied by aV-shaped decline and recovery. At the start of the period, the U.S. and global equity markets were in the midst of a sharp decline that began in late September and early October 2018. In fact, the broad U.S. market, as measured by the S&P 500 Index, declined-19.37% from September 20, 2018, through the closing bell on December 24, 2018. Investors had become increasingly concerned that strength in the U.S. economy would prompt the Federal Reserve to continue raising interest rates, tightening financial conditions, and creating a more difficult business environment going forward. In early October Fed Chairman Powell voiced his view that rates were still “a long way” from neutral, which precipitated the market decline. Then, in late December, Powell and the Fed indicated that short-term rates were closer to a more neutral level. In January, the Fed changed/reduced their expectation to zero rate increases for 2019 and announced they would also reduce the amount of balance sheet normalization, a series of actions that emboldened risk-appetite across markets. From Christmas Eve forward through the end of the reporting period, the U.S. market rallied 26.13% (a pace that would annualize to 95% returns).
The market’s relief that the Fed would not tighten further led not only to a broad-based rally, but a strong rally among companies that have operated with poor capital-efficiency metrics, based on our analysis. While we believe those types of businesses to be much shorter-term investment opportunities, they can offer bouts of strong performance as they did for a few months in the period.
Health care holdings lagged those of the value-oriented benchmark. The Fund held an overweight to the sector during the period, believing that companies in selected industries might offer better overall growth than the broad market. The health care sector broadly struggled during the period as the politics and economics of health care were again headline news. Fund holdings in managed health care and life science tools detracted from relative performance. Consumer discretionary names also hindered relative performance. Specifically, holdings in department stores and home furnishing retail underperformed.
On the other side of the ledger, the Fund benefitted from investments in the industrials and materials sectors. Within industrials, investments in railroads and industrial conglomerates proved additive during the period, as the combination of valuation and growth rates in selected businesses translated to strong performance. The materials sector was an
OVERVIEW
The Fund invests in the equities of small, midsize and large U.S. companies that we believe are undervalued according to certain financial measurements of their intrinsic values.
KEY FEATURES
| | ◾ | | Employs bottom-up stock picking and a benchmark-agnostic approach. | |
| | ◾ | | Focuses on good businesses with solid cash flows and value prices. | |
PORTFOLIO FIT
The Fund is a core equity option that may balance a growth allocation and complement other value strategies. Our flexibility in analyzing all companies regardless of sector helps us avoid the cyclicality inherent in a deep value strategy or momentum growth strategy.
| | |
| FUND NASDAQ SYMBOLS |
| |
A Shares | | CVAAX |
C Shares | | CVACX |
| |
I Shares | | CVAIX |
| |
|
| FUND CUSIP NUMBERS |
| |
A Shares | | 128119666 |
C Shares | | 128119641 |
| |
I Shares | | 128119633 |
| |
Calamos Opportunistic Value Fund
| | | | |
SECTOR WEIGHTINGS
as of April 30, 2019 | | | |
| |
Financials | | | 20.2 | % |
Information Technology | | | 18.9 | |
| |
Industrials | | | 11.6 | |
Health Care | | | 9.3 | |
| |
Consumer Staples | | | 8.7 | |
Energy | | | 6.4 | |
| |
Communication Services | | | 5.9 | |
Consumer Discretionary | | | 5.8 | |
| |
Utilities | | | 4.8 | |
Real Estate | | | 3.7 | |
| |
Other | | | 2.3 | |
Materials | | | 1.9 | |
Sector weightings are subject to change daily and are calculated as a percentage of net assets. The table excludes cash or cash equivalents, any government/sovereign bonds or broad based index hedging securities the Fund may hold.
underperformer within the S&P 1500 Value Index benchmark, validating the Fund’s underweight during the period. But additionally, the Fund’s holdings in materials collectively outperformed those of the index, most notably within the specialty chemicals space.
How is the Fund positioned?
The Fund continues to be positioned in holdings that exhibit a combination of compelling valuations, opportunities for strong growth, and high capital efficiency management.
At the end of the reporting period, the Fund was overweight information technology, with more modest overweights to communication services and industrials. Information technology was thetop-performing sector within the value index for the period, so we will continue to be mindful of valuation. Over the course of the reporting period, the Fund’s overweight was reduced, but we still see strong business growth in companies with compelling balance sheets and robust free-cash-flow growth. For example, the Fund still holds overweights in software and IT services at the end of the period. Communication services is a much smaller sector within the value market, but still offers businesses with compelling growth rates in areas such as media, services and entertainment.
The Fund is underweight the consumer discretionary, financial and materials sectors. Within the consumer discretionary sector, the Fund is most notably underweight the automobile industry and household durables, favoring consumption trends in areas such as internet and direct retail where consumers are finding easier shopping as well as cost savings. Financials represent the largest sector within the S&P 1500 Value Index benchmark and, as such, are a sizable investment for the Fund overall. The Fund holds a slight overweight to consumer finance, but remains underweight within the insurance and capital markets industries.
What closing thoughts do you have for Fund shareholders?
The recent volatility in U.S. and global equity markets highlights the angst and uncertainty among investors worldwide. In our view, the US economy continues to demonstrate that the underpinnings of a continued, albeit slower growth environment may continue for a longer timeframe than past expansions. On the heels of strong growth that was in part boosted by favorable fiscal and monetary policy, we should not be shocked to see episodes of slower growth. Overall, fiscal and monetary conditions are still quite simulative, though less so than a few quarters ago. If growth is scarce, then typically investors will seek growth and be willing to pay for what is most difficult to find. We believe the U.S. equity market continues to be at the forefront of opportunities, offering companies that have attractive valuations and superior growth potential.
| | | | |
| 36 | | CALAMOS OPEN-END FAMILY OF FUNDS SEMIANNUAL REPORT | | |
Calamos Opportunistic Value Fund
ANNUALIZED RETURN: SINCE INCEPTION (1/2/02) THROUGH 4/30/19
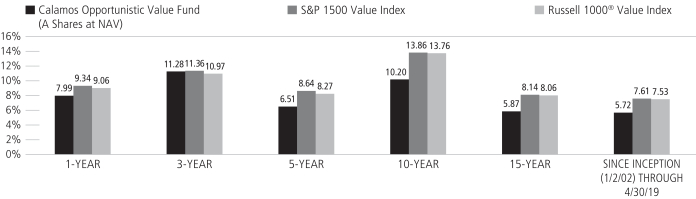
Performance data quoted represents past performance, which is no guarantee of future results. Current performance may be lower or higher than the performance quoted.
The principal value and investment return of an investment will fluctuate so that your shares, when redeemed, may be worth more or less than their original cost. You can obtain performance data current to the most recent month end by visiting www.calamos.com. Average annual total return measures net investment income and capital gain or loss from portfolio investments as an annualized average. All performance shown assumes reinvestment of dividends and capital gains distributions. Performance is for the Fund’s Class A shares at net asset value and does not include the Fund’s maximumfront-end sales charge of 4.75%. Had it been included, the Fund’s return would have been lower. The Fund also offers Class C and Class I shares, the performance of which may vary. Performance shown reflects an expense reimbursement that improved results. Source: State Street Corporation and Lipper, Inc.
Calamos Opportunistic Value Fund
GROWTH OF $10,000: FOR THE 10-YEAR PERIOD ENDED 4/30/19
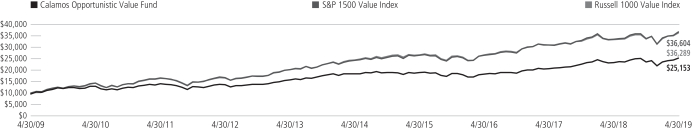
AVERAGE ANNUAL TOTAL RETURN† AS OF 4/30/19
| | | | | | | | | | | | | | | | | | | | |
| | | 6
MONTHS | | 1
YEAR | | 5
YEARS | | 10
YEARS |
Class A Shares – Inception 1/2/02 | | | | | | | | | | | | | | | | | | | | |
Without Sales Charge | | | | 6.65 | % | | | | 7.99 | % | | | | 6.51 | % | | | | 10.20 | % |
With Sales Charge | | | | 1.56 | | | | | 2.84 | | | | | 5.48 | | | | | 9.66 | |
Class C Shares – Inception 1/2/02 | | | | | | | | | | | | | | | | | | | | |
Without Sales Charge | | | | 6.23 | | | | | 7.17 | | | | | 5.72 | | | | | 9.38 | |
With Sales Charge | | | | 5.36 | | | | | 6.29 | | | | | 5.72 | | | | | 9.38 | |
Class I Shares – Inception 3/1/02 | | | | 6.73 | | | | | 8.16 | | | | | 6.76 | | | | | 10.47 | |
Performance data quoted represents past performance, which is no guarantee of future results. Current performance may be lower or higher than the performance quoted. The principal value and investment return of an investment will fluctuate so that your shares, when redeemed, may be worth more or less than their original cost.
As of the prospectus dated 3/1/19, the Fund’s gross expense ratio for Class A shares is 1.61%; Class C is 2.36% and Class I is 1.37%. The Fund’s Investment Adviser has contractually agreed to reimburse the Fund expenses through 3/1/22 to the extent necessary so that Total Annual Fund Operating Expenses (excluding taxes, interest, short interest, short dividend expenses, brokerage commissions, acquired fund fees and expenses, and extraordinary expenses, if any) of Class A, Class C, and Class I are limited to 1.15%, 1.90% and 0.90% of average net assets, respectively. Calamos Advisors may recapture previously waived expense amounts within the same fiscal year for any day where the respective Fund’s expense ratio falls below the contractual expense limit up to the expense limit for that day. This undertaking is binding on CALAMOS ADVISORS and any of its successors and assigns. This agreement is not terminable by either party. The expense ratios shown above may differ from the more recent expense ratios reported in the Financial Highlights section of this report.
| † | Average annual total return measures net investment income and capital gain or loss from portfolio investments as an annualized average assuming reinvestment of dividends and capital gains distributions. Performance shown reflects the effects of an expense reimbursement that improved results. Load-adjusted returns are adjusted for the maximumfront-end sales load of 4.75% for Class A shares and returns for Class C shares have been adjusted for the contingent deferred sales charge (CDSC). |
NOTES:
The graphs do not reflect the income taxes that you would pay on fund distributions or the redemption of fund shares. Fund performance includes reinvestment of dividends and adjustment for the maximum sales charge for Class A shares. The performance of other classes will vary from the performance of the class shown based on the difference in sales charges and fees paid by shareholders investing in different share classes.
On October 1, 2018, the S&P 1500 Value Index replaced the Russell 1000 Value Index as the Fund’s primary benchmark because it more closely aligns with the Fund’s investment strategy. The S&P 1500 Value Index is designed to provide investors with a measure of the performance of U.S. value equities.
The Russell 1000® Value Index measures the performance of those companies in the Russell 1000® Index with lowerprice-to-book ratios and lower forecasted growth values. Index data shown for the Annualized Return Since Inception graph is from 12/31/01, since comparative index data is only available for full monthly periods. Source: Lipper, Inc.
Index returns assume reinvestment of dividends and do not reflect deduction of fees and expenses. It is not possible to invest directly in an index.
| | | | |
| 38 | | CALAMOS OPEN-END FAMILY OF FUNDS SEMIANNUAL REPORT | | |
Calamos International Growth Fund
CALAMOS INTERNATIONAL GROWTH FUND
INVESTMENT TEAM DISCUSSION
How has the Fund performed?
For thesix-month period ended April 30, 2019, Calamos International Growth Fund returned 9.48% (Class A Shares at net asset value) versus a 10.74% gain for the MSCI EAFE Growth Index and 12.46% return for the MSCI ACWI Ex U.S. Growth Index.
Since its inception on March 17, 2005 the Fund has returned 6.58% on an annualized basis (Class A shares at net asset value) compared to a 5.89% return in the MSCI ACWI Ex U.S. Growth Index and 5.68% increase in the MSCI EAFE Growth Index. We believe this demonstrates the Fund’s ability to generate long-term excess returns over complete market cycles.
What factors influenced performance during the reporting period?
A combination of moderate economic growth, low inflation and generally accommodative central bank policies supported international stocks, though the period was marked by two highly distinct market environments. During the first half of the period, international markets battled multiple headwinds including slowing global growth, and uncertainty regarding Brexit and global trade. The second half of the period ushered in a significant move higher in international equities as investors responded to targeted stimulus in China, positive corporate earnings and signs of progress on key geopolitical risks.
The Fund delivered a solid double-digit return over the period but trailed the stronger gain of the index due to relative security selection in certain sectors.
Positive Influences on Performance
Consumer Discretionary. The Fund’s security selection and an overweight position in consumer discretionary boosted results relative to the MSCI ACWI Ex U.S. Growth Index. Specifically, positions in the household appliances industry and names in the internet & direct marketing retail industry boosted relative performance.
Information Technology. Security selection and an overweight allocation in information technology added to the Fund’s return, especially via the systems software and electronic equipment & instruments industries.
Negative Influences on Performance
Industrials. Over the period, trailing selection within the industrials sector curbed return, as holdings in the aerospace & defense and industrial machinery industries lagged.
Consumer Staples. Security selection and an underweight position in consumer staples hampered relative results. Holdings in the tobacco and personal products industries notably landed short.
Geographic Performance
From a regional standpoint, the Fund benefitted from security selection and an overweight position in Emerging Asia where our holdings in China and Hong Kong were leading contributors. Additionally, favorable security selection and an underweight position in Japan added value.
OVERVIEW
The Fund employs a unique blend of quantitative and qualitative processes to build a portfolio characterized by quality businesses with durable growth, competitive advantages and healthy, flexible balance sheets.
KEY FEATURES
| | ◾ | | Identifies companies that possess competitive advantages and financial strength as defined by our proprietary data analysis of ROIC and near-term quantitative catalysts. | |
| | ◾ | | Employs deep and targeted qualitative analysis to scrutinize a company’s business model, competitive landscape and growth drivers, factors important in weighing a company’s durability over time. | |
| | ◾ | | Invests in a universe that spans geographies and market caps, providing a wide breadth of unique opportunities to investors. | |
| | ◾ | | Emphasizes alignment with key secular themes, such as investing in economies that promote structural reforms and economic freedoms. | |
PORTFOLIO FIT
As an active, true growth offering with a differentiated return profile, the Fund can potentially help investors optimize capital appreciation within their international allocation.
| | |
| FUND NASDAQ SYMBOLS |
| |
A Shares | | CIGRX |
C Shares | | CIGCX |
| |
I Shares | | CIGIX |
R6 Shares | | CIGOX |
| |
| FUND CUSIP NUMBERS | | |
| |
A Shares | | 128119575 |
C Shares | | 128119559 |
| |
I Shares | | 128119542 |
R6 Shares | | 128120425 |
Calamos International Growth Fund
| | | | |
SECTOR WEIGHTINGS
as of April 30, 2019 | | | |
| |
Information Technology | | | 19.0 | % |
Consumer Discretionary | | | 17.2 | |
| |
Financials | | | 13.3 | |
Health Care | | | 12.3 | |
| |
Industrials | | | 11.4 | |
Consumer Staples | | | 9.1 | |
| |
Communication Services | | | 8.6 | |
Energy | | | 3.8 | |
| |
Materials | | | 2.8 | |
| | | | | |
Sector weightings are subject to change daily and are calculated as a percentage of net assets. The table excludes cash or cash equivalents, any government/sovereign bonds or broad based index hedging securities the Fund may hold.
Conversely, the Fund’s trailing selection in Europe curbed return. In particular, positions in the United Kingdom and Sweden held back relative performance.
How is the Fund positioned?
The Fund’s regional and country positioning reflects the combined inputs of ourtop-down global framework and ourbottom-up security analysis. Our investment team evaluates macroeconomic factors and growth opportunities and actively integrates these into the investment decision-making process.
We hold a well-diversified set of positions in Europe, with a range of end markets spanning areas of domestic demand and exporters. We are sensitive to developing political risks and persistent slow growth that has beset Europe. Our positions are largely in global secular growth opportunities and, in some cases, more regionally exposed businesses with stable, less-cyclical characteristics.
We have a relatively positive stance in emerging markets and favor positions in communication services, discretionary, technology and select financials. We prefer businesses in interactive media & services, internet retail, insurance and higher quality banks given their positive fundamentals, large addressable markets and alignment with key secular themes.
We have an underweight stance in Japan. Although valuations are reasonable and monetary conditions remain highly accommodative, global growth and trade, which the Japanese economy heavily depends upon, have been relatively weak and sap activity in the country.
From a sector perspective, the Fund is currently positioned as follows:
| • | | We positioned the Fund to hold a combination of core and secular growth companies, in addition to select cyclical opportunities. |
| • | | Technology, consumer discretionary, health care and communication services are the among largest sector weights in the Fund, owing to our view of secular growth potential and attractive demand segments. We have assigned key positions in interactive media & services, internet retail, pharmaceuticals, semiconductors, apparel and luxury goods. |
| • | | We hold an overweight in financials, with higher-quality positioning in companies benefiting from improving business fundamentals, less onerous regulations in some regions, and attractive valuations. |
| • | | We own limited positions in energy and materials that are benefiting from relatively bettersupply-and-demand fundamentals and earnings growth potential. |
| • | | We have an underweight stance in more defensive areas including utilities, real estate and traditional telecoms, given their questionable valuations and better relative opportunities elsewhere. |
What closing thoughts do you have for Fund shareholders?
Global corporate and macroeconomic data has been mixed versus expectations and reflects moderate growth conditions. Global monetary policy remains generally accommodative and multiple central banks have adopted a more patient stance on future actions. Markets continue to confront a set of headwinds and tailwinds, though
| | | | |
| 40 | | CALAMOS OPEN-END FAMILY OF FUNDS SEMIANNUAL REPORT | | |
Calamos International Growth Fund
we have seen developments with respect to earnings and global policy that may be incrementally more positive. We continue to identify international stock opportunities that are reaping the benefits of moderate earnings growth, benign inflation and attractive valuations.
In terms of Fund positioning, we currently favor a blend of investments in secular growth and select defensive growth businesses. This positioning reflects our anticipation of moderate economic growth but also the potential for a pickup in demand conditions in the coming quarters. We currently favor investments in companies with earnings growth catalysts, solid cash flow generation and healthy balance sheets. From a thematic and sector perspective, we see opportunities in communications services, technology, consumer and health care companies with targeted areas of demand. We also favor a set of more cyclical companies with sound fundamentals and multiple catalysts. Our active investment approach and long-term perspective positions us to take advantage of the volatility and opportunities in international equities.
ANNUALIZED RETURN: SINCE INCEPTION (3/16/05) THROUGH 4/30/19
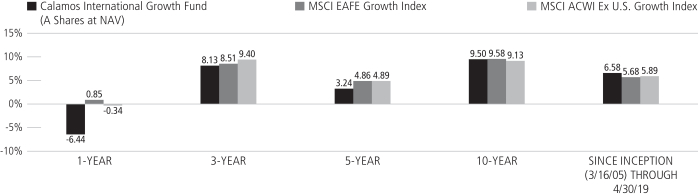
Performance data quoted represents past performance, which is no guarantee of future results. Current performance may be lower or higher than the performance quoted.
The principal value and investment return of an investment will fluctuate so that your shares, when redeemed, may be worth more or less than their original cost. You can obtain performance data current to the most recent month end by visiting www.calamos.com. Average annual total return measures net investment income and capital gain or loss from portfolio investments as an annualized average. All performance shown assumes reinvestment of dividends and capital gains distributions. Performance is for the Fund’s Class A shares at net asset value and does not include the Fund’s maximum front-end sales charge of 4.75%. Had it been included, the Fund’s return would have been lower. The Fund also offers Class C and Class I shares, the performance of which may vary. Source: State Street Corporation and Lipper, Inc.
Calamos International Growth Fund
GROWTH OF $10,000: FOR THE 10-YEAR PERIOD ENDED 4/30/19
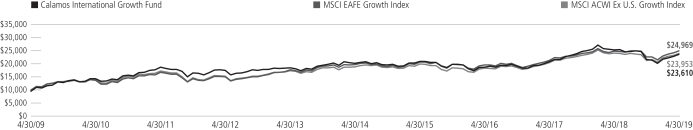
AVERAGE ANNUAL TOTAL RETURN† AS OF 4/30/19
| | | | | | | | | | | | | | | | | | | | |
| | | 6
MONTHS | | 1
YEAR | | 5
YEARS | | 10 YEARS
OR ^SINCE
INCEPTION |
Class A Shares – Inception 3/16/05 | | | | | | | | | | | | | | | | | | | | |
Without Sales Charge | | | | 9.48 | % | | | | -6.44 | % | | | | 3.24 | % | | | | 9.50 | % |
With Sales Charge | | | | 4.30 | | | | | -10.90 | | | | | 2.23 | | | | | 8.97 | |
Class C Shares – Inception 3/16/05 | | | | | | | | | | | | | | | | | | | | |
Without Sales Charge | | | | 9.10 | | | | | -7.12 | | | | | 2.47 | | | | | 8.69 | |
With Sales Charge | | | | 8.16 | | | | | -7.92 | | | | | 2.47 | | | | | 8.69 | |
Class I Shares – Inception 3/16/05 | | | | 9.65 | | | | | -6.18 | | | | | 3.51 | | | | | 9.79 | |
Class R6 Shares – Inception 9/17/18^ | | | | 9.70 | | | | | | | | | | | | | | | -2.01 | |
Performance data quoted represents past performance, which is no guarantee of future results. Current performance may be lower or higher than the performance quoted. The principal value and investment return of an investment will fluctuate so that your shares, when redeemed, may be worth more or less than their original cost.
As of the prospectus dated 3/1/19, the Fund’s gross expense ratio for Class A shares is 1.51%; Class C is 2.26%; Class I is 1.26% and Class R6 is 1.21%. The Fund’s investment advisor has contractually agreed to reimburse Fund expenses through 3/1/22 to the extent necessary so that Total Annual Fund Operating Expenses (excluding taxes, interest, short interest, short dividend expenses, brokerage commissions, acquired fund fees and expenses, and extraordinary expenses, if any) of Class A, Class C and Class I are limited to 1.10%, 1.85% and 0.85% of average net assets, respectively. The Fund’s investment adviser has contractually agreed to limit the Fund’s annual ordinary operating expenses for Class R6 shares (as a percentage of average net assets) to 0.85% less the annual sub-transfer agency ratio for the Fund. The annual sub-transfer agency ratio is equal to the aggregate sub-transfer agency expenses common to the other share classes of the Fund divided by the aggregate average annual net assets of the Fund’s other share classes. For purposes of these expense limitations, operating expenses do not include taxes, interest, short interest, short dividend expenses, all commissions and other normal charges incident to the purchase and sale of portfolio securities, and extraordinary expenses, if any. Calamos Advisors may recapture previously waived expense amounts within the same fiscal year for any day where the respective Fund’s expense ratio falls below the contractual expense limit up to the expense limit for that day. This undertaking is binding on CALAMOS ADVISORS and any of its successors and assigns. This agreement is not terminable by either party. The expense ratios shown above may differ from the more recent expense ratios reported in the Financial Highlights section of this report.
| † | Average annual total return measures net investment income and capital gain or loss from portfolio investments as an annualized average assuming reinvestment of dividends and capital gains distributions. Performance shown reflects the effects of an expense reimbursement that improved results. Load-adjusted returns are adjusted for the maximumfront-end sales load of 4.75% for Class A shares and returns for Class C shares have been adjusted for the contingent deferred sales charge (CDSC). |
NOTES:
The graphs do not reflect the income taxes that you would pay on fund distributions or the redemption of fund shares. Fund performance includes reinvestment of dividends and adjustment for the maximum sales charge for Class A shares. The performance of other classes will vary from the performance of the class shown based on the difference in sales charges and fees paid by shareholders investing in different share classes.
The MSCI EAFE Growth Index measures developed market growth equity performance (excluding the U.S. and Canada). Source: Lipper, Inc.
The MSCI ACWI Ex U.S. Growth Index measures equity market performance of companies outside of the United States with higher-growth values in developed and emerging markets.
Index returns assume reinvestment of dividends and do not reflect deduction of fees and expenses. It is not possible to invest directly in an index.
| | | | |
| 42 | | CALAMOS OPEN-END FAMILY OF FUNDS SEMIANNUAL REPORT | | |
Calamos Evolving World Growth Fund
CALAMOS EVOLVING WORLD GROWTH FUND
INVESTMENT TEAM DISCUSSION
How has the Fund performed?
For thesix-month period ended April 30, 2019, Calamos Evolving World Growth Fund returned 12.44% (Class A Shares at net asset value) versus a 13.90% return for the MSCI Emerging Market Index. During the period, the Fund pursued our risk-managed investment approach and generated strong absolute returns, while also capturing most of the advance in theall-equity MSCI Emerging Market index. We position the Fund to capture most of the equity market upside over complete market cycles, with a keen attention to mitigating downside risk. We believe that our focus on potential downside resilience can provide advantages in a more rotational and higher volatility environment in global and emerging market equities.
Since its inception on August 15, 2008, the Fund has returned 3.78% on an annualized basis (Class A Shares at net asset value) compared to a 3.73% return for the MSCI Emerging Markets Index. We believe this demonstrates the Fund’s ability to generate competitive long-term returns while pursuing a risk-managed investment approach over complete market cycles.
What factors influenced performance during the reporting period?
Emerging markets navigated two distinct environments over thesix-month period. During the first half of the period, markets battled multiple headwinds including slowing growth, tighter Fed monetary policy and global trade uncertainty. The second half of thesix-month period ushered in a recovery in emerging markets as investors responded to China’s targeted stimulus, a more dovish Fed policy outlook, and corporate earnings growth.
Positive Influences on Performance
Consumer Staples. The Fund’s leading security selection in consumer staples added to relative results. Holdings in the distillers & vintners and food retail industries performed particularly well.
Communication Services. Favorable security selection in communication services added to the Fund’s performance, especially in the interactive media & services and interactive home entertainment industries.
Negative Influences on Performance
Industrials. Over the period, trailing selection within the industrials sector curbed relative results, as holdings in the construction & engineering and aerospace & defense industries hurt return.
Information Technology. Security selection and an overweight position in information technology negatively affected performance, as holdings in the electronic components and semiconductors industries made a poor showing.
Geographic Performance
From a regional standpoint, the Fund benefitted from security selection in Emerging Asia. In particular, our holdings in Hong Kong and South Korea drove relative performance. Similarly, the Fund benefitted from favorable security selection in EMEA. Positions in Turkey helped relative performance. Additionally, our lack of exposure in Russia buoyed return.
OVERVIEW
The fund globally invests in growth companies, emphasizing businesses with revenue streams derived within or from emerging markets. The fund is designed to actively manage risk over a full market cycle.
KEY FEATURES
| | ◾ | | Active risk management aims to generate alpha with less downside risk than the benchmark and peers | |
| | ◾ | | Company fundamentals emphasis stresses strong or accelerated earnings growth and solid returns on invested capital | |
| | ◾ | | Targets well-positioned global growth companies that may benefit from long-term secular themes in emerging markets such as the rise of the emerging-market consumer | |
PORTFOLIO FIT
Given its focus on risk management, the fund can serve as a long-term emerging market allocation.
| | |
| FUND NASDAQ SYMBOLS |
| |
A Shares | | CNWGX |
C Shares | | CNWDX |
| |
I Shares | | CNWIX |
| |
|
| FUND CUSIP NUMBERS |
| |
A Shares | | 128119161 |
C Shares | | 128119146 |
| |
I Shares | | 128119138 |
| |
Calamos Evolving World Growth Fund
| | | | |
SECTOR WEIGHTINGS
as of April 30, 2019 | | | |
| |
Financials | | | 21.9 | % |
Communication Services | | | 19.5 | |
| |
Information Technology | | | 16.9 | |
Consumer Discretionary | | | 12.0 | |
| |
Energy | | | 8.4 | |
Consumer Staples | | | 6.7 | |
| |
Industrials | | | 5.7 | |
Materials | | | 4.2 | |
| |
Real Estate | | | 2.3 | |
Health Care | | | 1.8 | |
| |
Other | | | 0.4 | |
| | | | | |
Sector weightings are subject to change daily and are calculated as a percentage of net assets. The table excludes cash or cash equivalents, any government/sovereign bonds or broad based index hedging securities the Fund may hold.
Contrarily, an overweight position in Europe hampered relative results. Select developed market holdings in France and the UK with significant revenue ties to EM underperformed due to slowing global growth and trade policy uncertainty. The same factors hurt the Fund’s U.S. selection.
How is the Fund positioned?
| • | | Our positioning favors economies benefiting from domestic demand trends,pro-growth fiscal reforms, and a blend of secular growth and more cyclical opportunities. |
| • | | We have a positive view of the investment opportunities in EM and own significant positions in the consumer discretionary, technology, communication services and financials sectors. We favor businesses in internet retail, interactive media & services, diversified banks and insurance, and select semiconductor areas given their leading growth fundamentals, large addressable markets and alignment with our key secular themes. |
| • | | We hold a significant weight in financials, with a preference for higher-quality banks that are the beneficiaries of expanding opportunities and reasonable valuations. |
| • | | We hold a moderate weight in energy and materials opportunities that are tapping into attractive global supply and demand fundamentals and earnings growth potential. |
| • | | We have an underweight stance in more defensive, highly regulated areas including utilities, real estate and traditional telecoms, while we favor diversified growth opportunities in consumer staples. |
| • | | From a geographic perspective, we own significant stakes in Emerging Asia and Latin America based on improved fundamentals and macro developments. We favor investments in China, India, Brazil, and Taiwan. |
What are your closing thoughts for Fund shareholders?
We have a favorable view of investment opportunities in emerging markets. Global corporate and macroeconomic data have been mixed versus expectations and reflect moderate global growth conditions. Global monetary policy remains accommodative and multiple central banks have adopted a more patient stance regarding future actions. We are actively monitoring key macro issues for emerging markets including global trade negotiations, the path of central bank policy, and data on Chinese consumption and the industrial economy. Markets continue to navigate a set of headwinds and tailwinds, though we have seen developments with respect to earnings and policy that are incrementally more positive for emerging market equities.
Emerging market earnings growth is positive, equity valuations are attractive, and capital flows are turning more favorable. Many companies with higher-quality fundamentals and sustainable growth characteristics are benefiting as these attributes are being rewarded in markets, though investors are also closely following global trade and policy issues. From a thematic and sector perspective, we see opportunities in consumer sectors, communication services, and technology, in addition to higher quality financials and a set of more cyclical companies in multiple sectors. We believe our active and risk-managed investment approach positions us well to navigate the risks and opportunities in emerging markets.
| | | | |
| 44 | | CALAMOS OPEN-END FAMILY OF FUNDS SEMIANNUAL REPORT | | |
Calamos Evolving World Growth Fund
ANNUALIZED RETURN: SINCE INCEPTION (8/15/08) THROUGH 4/30/19
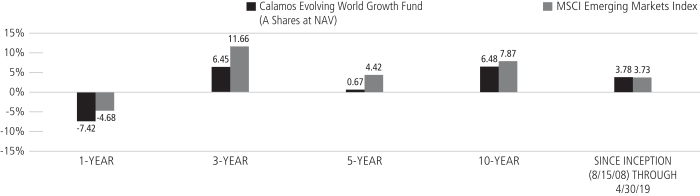
Performance data quoted represents past performance, which is no guarantee of future results. Current performance may be lower or higher than the performance quoted.
The principal value and investment return of an investment will fluctuate so that your shares, when redeemed, may be worth more or less than their original cost. You can obtain performance data current to the most recent month end by visiting www.calamos.com. Average annual total return measures net investment income and capital gain or loss from portfolio investments as an annualized average. All performance shown assumes reinvestment of dividends and capital gains distributions. Performance is for the Fund’s Class A shares at net asset value and does not include the Fund’s maximum front-end sales charge of 4.75%. Had it been included, the Fund’s return would have been lower. The Fund also offers Class C and Class I shares, the performance of which may vary. Source: State Street Corporation and Lipper, Inc.
Calamos Evolving World Growth Fund
GROWTH OF $10,000: FOR THE 10-YEAR PERIOD ENDED 4/30/19
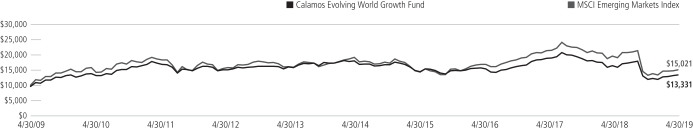
AVERAGE ANNUAL TOTAL RETURN† AS OF 4/30/19
| | | | | | | | | | | | | | | | | | | | |
| | | 6
MONTHS | | 1
YEAR | | 5
YEARS | | 10
YEARS |
Class A Shares – Inception 8/15/08 | | | | | | | | | | | | | | | | | | | | |
Without Sales Charge | | | | 12.44 | % | | | | -7.42 | % | | | | 0.67 | % | | | | 6.48 | % |
With Sales Charge | | | | 7.06 | | | | | -11.82 | | | | | -0.31 | | | | | 5.96 | |
Class C Shares – Inception 8/15/08 | | | | | | | | | | | | | | | | | | | | |
Without Sales Charge | | | | 11.97 | | | | | -8.15 | | | | | -0.09 | | | | | 5.69 | |
With Sales Charge | | | | 10.97 | | | | | -9.07 | | | | | -0.09 | | | | | 5.69 | |
Class I Shares – Inception 8/15/08 | | | | 12.59 | | | | | -7.18 | | | | | 0.91 | | | | | 6.76 | |
Performance data quoted represents past performance, which is no guarantee of future results. Current performance may be loweror higher than the performance quoted. The principal value and investment return of an investment will fluctuate so that your shares, when redeemed, may be worth more or less than their original cost.
As of the prospectus dated 3/1/19, the Fund’s gross expense ratio for Class A shares is 1.63%; Class C is 2.38% and Class I is 1.38%. The expense ratios shown above may differ from the more recent expense ratios reported in the Financial Highlights section of this report.
| † | Average annual total return measures net investment income and capital gain or loss from portfolio investments as an annualized average assuming reinvestment of dividends and capital gains distributions. Performance shown reflects the effects of an expense reimbursement that improved results and was in effect until October 31, 2009. Load-adjusted returns are adjusted for the maximumfront-end sales load of 4.75% for Class A shares and returns for Class C shares have been adjusted for the contingent deferred sales charge (CDSC). |
NOTES:
The graph does not reflect the income taxes that you would pay on fund distributions or the redemption of fund shares. Fund performance includes reinvestment of dividends and adjustment for the maximum sales charge for Class A shares. The performance of other classes will vary from the performance of the class shown based on the difference in sales charges and fees paid by shareholders investing in different share classes.
The MSCI Emerging Markets Index is a free float-adjusted market capitalization index considered broadly representative of emerging market equity performance. The index represents companies within the constituent emerging markets that are available to investors worldwide. Index data shown for the Since Inception Growth of $10,000 graph is from 8/31/08, since comparative index data is only available for full monthly periods. Source: Lipper, Inc.
Index returns assume reinvestment of dividends and do not reflect deduction of fees and expenses. It is not possible to invest directly in an index.
| | | | |
| 46 | | CALAMOS OPEN-END FAMILY OF FUNDS SEMIANNUAL REPORT | | |
Calamos Emerging Market Equity Fund
CALAMOS EMERGING MARKET
EQUITY FUND
INVESTMENT TEAM DISCUSSION
How has the Fund performed?
For thesix-month period ended April 30, 2019, Calamos Emerging Market Equity Fund returned 15.11% (Class A Shares at net asset value) versus a 13.90% return for the MSCI Emerging Markets Index. The Fund participated in the advance of emerging markets over the period and outperformed due to strong returns in many of our higher-quality EM businesses.
What factors influenced performance during the reporting period?
Emerging markets navigated two distinct environments over thesix-month period. During the first half of the period, markets battled multiple headwinds including slowing growth, tighter Fed monetary policy and global trade uncertainty. The second half of the period ushered in a recovery in emerging markets, as investors responded to China’s targeted stimulus, a more dovish Fed policy outlook and corporate earnings growth.
The Fund delivered a strong double-digit return over thesix-month period and outperformed its benchmark index due to leading relative security selection.
Positive Influences on Performance
Financials. The Fund’s security selection in financials helped drive relative returns. In particular, our holdings in diversified banks and life & health insurance positively contributed to results.
Consumer Staples. Security selection in consumer staples also added to the Fund performance. The main contributors within this sector were in the distillers & vintners and food retail industries.
Negative Influences on Performance
Industrials. Over the period, trailing selection and an underweight stance within the industrials sector weighed on results, as holdings in the airlines and industrial machinery industries lagged.
Information Technology. An overweight stance and security selection within the semiconductors and IT consulting & other services industries of the information technology sector also lost ground on a relative basis.
Geographic Performance
From a regional standpoint, leading security selection and an underweight position in Emerging Asia added value to Fund performance. Leading exposure to key industries in China and Hong Kong made a notable contribution. Also, the Fund benefitted from favorable security selection in EMEA. Specifically, Russia and our lack of participation in Turkey promoted return.
OVERVIEW
The Fund globally invests in growth companies, whose principal activities are in a developing market or are economically tied to a developing market country that we believe offers the best opportunities for emerging market growth.
KEY FEATURES
| | ◾ | | Stresses company fundamentals, including global presence, strong revenue and earnings growth, solid returns on invested capital, and lower debt-to-capital levels | |
| | ◾ | | Actively seeks growth opportunities by investing in equities with at least 80% emerging-market exposure | |
| | ◾ | | Draws upon decades of Calamos experience investing globally through multiple economic, market and credit cycles | |
PORTFOLIO FIT
This actively managed Fund complements emerging-market strategies with a less-pronounced growth orientation, such as those that more closely track the broad EM equity market.
| | |
| FUND NASDAQ SYMBOLS |
| |
A Shares | | CEGAX |
C Shares | | CEGCX |
| |
I Shares | | CIEIX |
| | | |
|
| FUND CUSIP NUMBERS |
| |
A Shares | | 128120789 |
C Shares | | 128120771 |
| |
I Shares | | 128120763 |
| | | |
Calamos Emerging Market Equity Fund
| | | | |
SECTOR WEIGHTINGS
as of April 30, 2019 | | | |
| |
Financials | | | 22.5 | % |
Information Technology | | | 17.8 | |
| |
Consumer Discretionary | | | 16.6 | |
Communication Services | | | 13.0 | |
| |
Consumer Staples | | | 6.1 | |
Industrials | | | 5.4 | |
| |
Energy | | | 4.3 | |
Materials | | | 4.1 | |
| |
Other | | | 3.6 | |
Real Estate | | | 3.3 | |
| |
Health Care | | | 2.3 | |
| | | | | |
Sector weightings are subject to change daily and are calculated as a percentage of net assets. The table excludes cash or cash equivalents, any government/sovereign bonds or broad based index hedging securities the Fund may hold.
Conversely, U.S.-listed equities and select protective put options, as did an overweight stance in Emerging Latin America. In particular, Brazil and Colombia were sources of disappointment.
How is the Fund positioned?
Our positioning favors economies benefiting from domestic demand trends,pro-growth fiscal reforms, and a blend of secular growth and more cyclical opportunities. We favor investments in Emerging Asia with China and India representing our two largest country weights. We also see select opportunities in Brazil, Taiwan, Korea, South Africa and Indonesia among other markets.
From a sector perspective, we own significant positions in the consumer discretionary, technology, communication services and financials sectors. We favor businesses in internet retail, interactive media & services, diversified banks and insurance, and select semiconductor areas based on leading growth fundamentals, large addressable markets and alignment with our key secular themes.
We have an underweight stance in more defensive, highly regulated areas including utilities and traditional telecom.
We are underweight in energy and materials, though we own select opportunities that offer attractive globalsupply-and-demand fundamentals and earnings growth potential.
What are your closing thoughts for Fund shareholders?
We have a favorable view of investment opportunities in emerging markets. Global corporate and macroeconomic data have been mixed versus expectations and reflects moderate global growth conditions. Global monetary policy remains accommodative and multiple central banks have adopted a more patient stance regarding future actions. We are actively monitoring key macro issues for emerging markets including global trade negotiations, the path of central bank policy, and data on Chinese consumption and the industrial economy. Markets continue to navigate a set of headwinds and tailwinds, though we have seen developments with respect to earnings and policy that are incrementally more positive for emerging market equities.
Emerging market earnings growth is positive, equity valuations are attractive, and capital flows are turning more favorable. Many companies with higher-quality fundamentals and sustainable growth characteristics are benefiting as these attributes are being rewarded in markets, though investors are also closely following global trade and policy issues. From a thematic and sector perspective, we see opportunities in consumer sectors, communication services, and technology, in addition to higher quality financials and a set of more cyclical companies in multiple sectors. We believe our active, growth-oriented investment approach will position us to take advantage of the opportunities in emerging markets.
| | | | |
| 48 | | CALAMOS OPEN-END FAMILY OF FUNDS SEMIANNUAL REPORT | | |
Calamos Emerging Market Equity Fund
GROWTH OF $10,000: SINCE INCEPTION (12/31/13) THROUGH 4/30/19
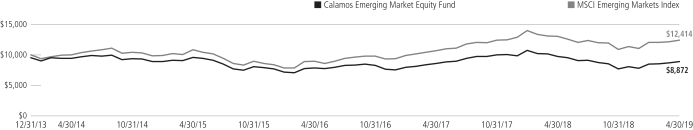
AVERAGE ANNUAL TOTAL RETURN† AS OF 4/30/19
| | | | | | | | | | | | | | | | | | | | |
| | | 6
MONTHS | | 1
YEAR | | 5
YEAR | | SINCE
INCEPTION |
Class A Shares – Inception 12/31/2013 | | | | | | | | | | | | | | | | | | | | |
Without Sales Charge | | | | 15.11 | % | | | | -8.98 | % | | | | 0.06 | % | | | | -0.17 | % |
With Sales Charge | | | | 9.59 | | | | | -13.32 | | | | | -0.91 | | | | | -1.08 | |
Class C Shares – Inception 12/31/2013 | | | | | | | | | | | | | | | | | | | | |
Without Sales Charge | | | | 14.68 | | | | | -9.67 | | | | | -0.66 | | | | | -0.90 | |
With Sales Charge | | | | 13.68 | | | | | -10.57 | | | | | -0.66 | | | | | -0.90 | |
Class I Shares – Inception 12/31/2013 | | | | 15.22 | | | | | -8.72 | | | | | 0.32 | | | | | 0.08 | |
Performance data quoted represents past performance, which is no guarantee of future results. Current performance may be lower or higher than the performance quoted. The principal value and investment return of an investment will fluctuate so that your shares, when redeemed, may be worth more or less than their original cost.
As of the prospectus dated 3/1/19, the Fund’s gross expense ratio for Class A shares is 2.30%; Class C shares is 3.05% and Class I shares is 2.05%. The Fund’s Investment Adviser has contractually agreed to reimburse the Fund expenses through 3/1/22, to the extent necessary so that Total annual Fund Operating Expenses (excluding taxes, interest, short interest, short dividend expenses, brokerage commissions, acquired funds fees and expenses and extraordinary expenses, if any) of Class A, Class C and Class I shares are limited to 1.75%, 2.50%, and 1.50% of average net assets, respectively. Calamos Advisors may recapture previously waived expense amounts within the same fiscal year for any day where the respective Fund’s expense ratio falls below the contractual expense limit up to the expense limit for that day. This undertaking is binding on CALAMOS ADVISORS and any of its successors and assigns. This agreement is not terminable by either party. The expense ratios shown above may differ from the more recent expense ratios reported in the Financial Highlights section of this report.
| † | Average annual total return measures net investment income and capital gain or loss from portfolio investments as an annualized average assuming reinvestment of dividends and capital gains distributions. Performance shown reflects the effects of an expense reimbursement that improved results. Load-adjusted returns are adjusted for the maximum front-end sales load of 4.75% for Class A shares and returns for Class C shares have been adjusted for the contingent deferred sales charge (CDSC). |
NOTES:
The graph does not reflect the income taxes that you would pay on fund distributions or the redemption of fund shares. Fund performance includes reinvestment of dividends and adjustment for the maximum sales charge for Class A shares. The performance of other classes will vary from the performance of the class shown based on the difference in sales charges and fees paid by shareholders investing in different share classes.
The MSCI Emerging Markets Index is a free float-adjusted market capitalization index considered broadly representative of emerging market equity performance. The index represents companies within the constituent emerging markets that are available to investors worldwide. Index data shown for the Since Inception Growth of $10,000 graph is from 12/31/13, since comparative index data is only available for full monthly periods. Source: Lipper, Inc.
Index returns assume reinvestment of dividends and do not reflect deduction of fees and expenses. It is not possible to invest directly in an index.
Calamos Global Equity Fund
OVERVIEW
The Fund invests in equities of companies around the globe. We focus on those firms that we believe demonstrate key growth characteristics, including increasing profit margins and high returns on invested capital.
KEY FEATURES
| | ◾ | | Flexibly seeks growth globally, searching for the best risk/reward opportunities across countries, market capitalizations and sectors | |
| | ◾ | | Seeks global growth companies that may benefit from long-term secular themes, including a burgeoning global middle class and increasing demand for information and entertainment | |
PORTFOLIO FIT
The Fund can serve as a growth-oriented addition to a strategic global equity allocation and may complement or provide an alternative to value or blended styles.
| | |
| FUND NASDAQ SYMBOLS |
| |
A Shares | | CAGEX |
C Shares | | CCGEX |
| |
I Shares | | CIGEX |
| |
|
| FUND CUSIP NUMBERS |
| |
A Shares | | 128119484 |
C Shares | | 128119468 |
| |
I Shares | | 128119450 |
| |
CALAMOS GLOBAL EQUITY FUND
INVESTMENT TEAM DISCUSSION
How has the Fund performed?
For thesix-month period ended April 30, 2019, Calamos Global Equity Fund returned 10.18% (Class A Shares at net asset value) versus a 9.16% gain for the MSCI World Index and 12.33% return for the MSCI ACWI Growth Index.
Since its inception on March 2, 2007, the Fund has returned 7.37% on an annualized basis (Class A Shares at net asset value) compared to a 7.12% return for the MSCI ACWI Growth Index and 5.99% increase in the MSCI World Index. We believe this demonstrates the Fund’s ability to generate long-term excess returns over complete market cycles and investment environments.
What factors influenced performance during the reporting period?
Global equities navigated two distinct market environments over thesix-month period. During the first half of the period, markets battled multiple headwinds including slowing global growth, tighter Fed monetary policy and uncertainty regarding meaningful progress on trade disputes. The second half of the period ushered in a significant market recovery, as investors responded to the Federal Reserve’s more dovish policy outlook, targeted stimulus in China, and positive corporate earnings.
The Fund delivered a solid double-digit return over the period due to relative security selection in certain sectors.
Positive Influences on Performance
Consumer Discretionary. The Fund’s leading security selection and an overweight stance in consumer discretionary outperformed relative to the MSCI ACWI Growth Index. Specifically, our holdings in internet & direct marketing retail and household appliances represented major contributors.
Communication Services. Leading security selection and an overweight position in communication services added to Fund performance. The main contributors fell within the interactive media & services and movies & entertainment industries.
Negative Influences on Performance
Industrials. Over the period, security selection within the industrials sector curbed relative results, as holdings in the aerospace & defense and industrial machinery industries lagged.
Financials. Trailing selection within the financial exchanges & data and investment banking & brokerage industries of the financials sector also held back relative results.
Geographic Performance
The Fund benefited from leading security selection and an overweight stance in Emerging Asia. Holdings in China and India performed well in particular. In addition, security selection in EMEA also added to Fund performance. Specifically, Israel and our nonparticipation in Turkey promoted return.
| | | | |
| 50 | | CALAMOS OPEN-END FAMILY OF FUNDS SEMIANNUAL REPORT | | |
Calamos Global Equity Fund
Conversely, security selection in the U.S. curbed relative performance. Also, trailing selection in Europe weighed on relative return. The Fund’s securities fell short of benchmark constituents, especially those in Switzerland and Sweden.
How is the Fund positioned?
The Fund’s holdings reflect a combination of core growth and more cyclical opportunities in key sectors, including consumer discretionary, technology, communication services, health care and financials. We mostly made modest adjustments to sector weights during thesix-month period. We added to investments in consumer discretionary and communication services, given the attractive fundamentals of many companies within the sectors. We offset these moves by culling positions in materials, real estate and technology due mainly to security-specific factors.
| • | | We have an underweight position in the U.S., which reflects our view of decelerating growth, external geopolitical issues and relatively less-attractive valuation risk/reward. Our U.S. positions emphasize secular growth and higher-quality businesses with defensible business models. |
| • | | We hold a diversified set of positions in Europe, with a range of end markets spanning domestic demand and exporters. We are sensitive to developing political risks and the persistent slow growth that has beset Europe. Our positions are largely in global secular growth opportunities and, in some cases, more regionally exposed businesses with stable, less-cyclical characteristics. |
| • | | We have an overweight position in emerging markets relative to the benchmark and are encouraged as markets have been rewarding companies with stronger fundamentals. We especially favor select investments in China, India, Taiwan and Brazil. |
| • | | We hold a modest underweight in Japan. Although valuations are reasonable and monetary conditions remain highly accommodative, diminished global growth and export volumes have been challenging. |
| • | | Consumer discretionary, technology, health care and communication services are the largest sector weights in the Fund, owing to thematic growth opportunities and attractive demand segments. Key industries include interactive media & services, internet retail, entertainment, travel & leisure, luxury goods, and biotechnology. |
| • | | We see select opportunities in financials, with companies benefiting from improving business fundamentals, less onerous regulations in certain regions, and attractive valuations. |
| • | | We have an underweight stance in more defensive areas including utilities, traditional telecoms, real estate and slower-growth consumer staples. We own a significant weight in health care, which offers an attractive combination of growth and defensive characteristics. |
| • | | We own limited positions in energy and materials, specifically companies benefiting from bettersupply-and-demand fundamentals and earnings growth potential. |
What closing thoughts do you have for Fund shareholders?
Global corporate and macroeconomic data has been mixed versus expectations and reflects moderate global growth conditions. Global monetary policy remains generally accommodative and multiple central banks have adopted a more patient stance on future
| | | | |
SECTOR WEIGHTINGS
as of April 30, 2019 | | | |
| |
Information Technology | | | 17.7 | % |
Consumer Discretionary | | | 17.7 | |
| |
Health Care | | | 14.3 | |
Financials | | | 13.9 | |
| |
Communication Services | | | 13.3 | |
Industrials | | | 7.9 | |
| |
Consumer Staples | | | 7.5 | |
Energy | | | 4.0 | |
Sector weightings are subject to change daily and are calculated as a percentage of net assets. The table excludes cash or cash equivalents, any government/sovereign bonds or broad based index hedging securities the Fund may hold.
Calamos Global Equity Fund
actions. Markets continue to confront a set of headwinds and tailwinds, though we have seen developments with respect to earnings and global policy that may be incrementally more positive. We continue to identify opportunities in equities that are reaping the benefits of moderate earnings growth, benign inflation and attractive valuations.
In terms of Fund positioning, we currently favor a blend of investments in secular growth and select defensive growth businesses. This positioning reflects our anticipation of moderate economic growth but also the potential for a pickup in demand conditions in the coming quarters. We currently favor investments in companies with earnings growth catalysts, solid cash flow generation and healthy balance sheets. From a thematic and sector perspective, we see opportunities in communications services, technology, consumer and health care companies with targeted areas of demand. We also favor a set of more cyclical companies with sound fundamentals and multiple catalysts. Our active investment approach and long-term perspective positions us to take advantage of the volatility and opportunities in global equities.
ANNUALIZED RETURN: SINCE INCEPTION (3/1/07) THROUGH 4/30/19
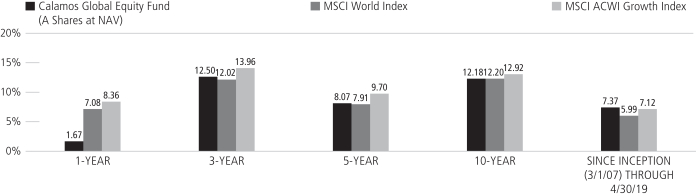
Performance data quoted represents past performance, which is no guarantee of future results. Current performance may be lower or higher than the performance quoted.
The principal value and investment return of an investment will fluctuate so that your shares, when redeemed, may be worth more or less than their original cost. You can obtain performance data current to the most recent month end by visiting www.calamos.com. Average annual total return measures net investment income and capital gain or loss from portfolio investments as an annualized average. All performance shown assumes reinvestment of dividends and capital gains distributions. Performance is for the Fund’s Class A shares at net asset value and does not include the Fund’s maximum front-end sales charge of 4.75%. Had it been included, the Fund’s return would have been lower. The Fund also offers Class C and Class I shares, the performance of which may vary. Source: State Street Corporation and Lipper, Inc.
| | | | |
| 52 | | CALAMOS OPEN-END FAMILY OF FUNDS SEMIANNUAL REPORT | | |
Calamos Global Equity Fund
GROWTH OF $10,000: FOR THE 10-YEAR PERIOD ENDED 4/30/19
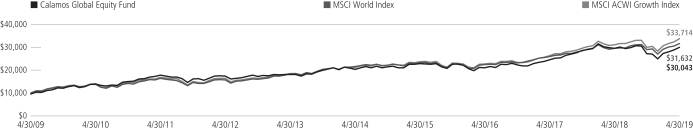
AVERAGE ANNUAL TOTAL RETURN† AS OF 4/30/19
| | | | | | | | | | | | | | | | | | | | |
| | | 6
MONTHS | | 1
YEAR | | 5
YEARS | | 10
YEARS |
Class A Shares – Inception 3/1/07 | | | | | | | | | | | | | | | | | | | | |
Without Sales Charge | | | | 10.18 | % | | | | 1.67 | % | | | | 8.07 | % | | | | 12.18 | % |
With Sales Charge | | | | 4.94 | | | | | -3.19 | | | | | 7.03 | | | | | 11.63 | |
Class C Shares – Inception 3/1/07 | | | | | | | | | | | | | | | | | | | | |
Without Sales Charge | | | | 9.79 | | | | | 0.88 | | | | | 7.28 | | | | | 11.35 | |
With Sales Charge | | | | 8.97 | | | | | 0.12 | | | | | 7.28 | | | | | 11.35 | |
Class I Shares – Inception 3/1/07 | | | | 10.34 | | | | | 1.86 | | | | | 8.34 | | | | | 12.45 | |
Performance data quoted represents past performance, which is no guarantee of future results. Current performance may be lower or higher than the performance quoted. The principal value and investment return of an investment will fluctuate so that your shares, when redeemed, may be worth more or less than their original cost.
As of the prospectus dated 3/1/19, the Fund’s gross expense ratio for Class A shares is 1.56%; Class C is 2.32% and Class I is 1.31%. The Fund’s Investment Adviser has contractually agreed to reimburse the Fund expenses through 3/1/22 to the extent necessary so that Total Annual Fund Operating Expenses (excluding taxes, interest, short interest, short dividend expenses, brokerage commissions, acquired fund fees and expenses, and extraordinary expenses, if any) of Class A, Class C, and Class I are limited to 1.40%, 2.15% and 1.15% of average net assets, respectively. Calamos Advisors may recapture previously waived expense amounts within the same fiscal year for any day where the respective Fund’s expense ratio falls below the contractual expense limit up to the expense limit for that day. This undertaking is binding on CALAMOS ADVISORS and any of its successors and assigns. This agreement is not terminable by either party. The expense ratios shown above may differ from the more recent expense ratios reported in the Financial Highlights section of this report.
| † | Average annual total return measures net investment income and capital gain or loss from portfolio investments as an annualized average assuming reinvestment of dividends and capital gains distributions. Performance shown reflects the effects of an expense reimbursement that improved results. Load-adjusted returns are adjusted for the maximumfront-end sales load of 4.75% for Class A shares and returns for Class C shares have been adjusted for the contingent deferred sales charge (CDSC). |
NOTES:
The graph does not reflect the income taxes that you would pay on fund distributions or the redemption of fund shares. Fund performance includes reinvestment of dividends and adjustment for the maximum sales charge for Class A shares. The performance of other classes will vary from the performance of the class shown based on the difference in sales charges and fees paid by shareholders investing in different share classes.
The MSCI World Index (U.S. Dollars) is a market-capitalization weighted index composed of companies representative of the market structure of developed market countries in North America, Europe and the Asia/Pacific region. Since inception data for the index is shown from 2/28/07 since data is only available for full monthly periods. Source: Lipper, Inc.
The MSCI ACWI Growth Index is designed to measure the equity performance of companies with higher growth values in developed and emerging markets.
Index returns assume reinvestment of dividends and do not reflect deduction of fees and expenses. It is not possible to invest directly in an index.
The Fund’s use of derivative instruments involves investment risks and transaction costs to which the Fund would not be subject absent the use of these instruments and, accordingly, may result in losses greater than if they had not been used. Derivative instruments can be illiquid, may disproportionately increase losses and may have a potentially large impact on Fund performance.
Calamos Global Growth and Income Fund
OVERVIEW
The Fund invests primarily in global equity and convertible securities in an attempt to balance risk/reward while providing growth and income.
KEY FEATURES
| | ◾ | | Combines equity and convertible holdings in order to limit downside risk while potentially capturing upside equity participation | |
| | ◾ | | Provides a core holding option that seeks to maintain a consistent risk posture throughout the market cycle | |
| | ◾ | | Seeks to participate in the upside movements of the global equity market while lessening the impact of down periods | |
PORTFOLIO FIT
The Fund can provide a long-term core allocation to global equities with the potential for lower volatility over a full market cycle.
| | |
| FUND NASDAQ SYMBOLS |
| |
A Shares | | CVLOX |
C Shares | | CVLCX |
| |
I Shares | | CGCIX |
| |
|
| FUND CUSIP NUMBERS |
| |
A Shares | | 128119500 |
C Shares | | 128119708 |
| |
I Shares | | 128119609 |
| |
CALAMOS GLOBAL GROWTH AND INCOME FUND
INVESTMENT TEAM DISCUSSION
How has the Fund performed?
For thesix-month period ended April 30, 2019, Calamos Global Growth and Income Fund returned 7.23% (Class A Shares at net asset value) versus a 9.67% return for the MSCI ACWI Index and 9.16% for the MSCI World Index. During the period, the Fund pursued its risk-managed investment approach and generated solid absolute returns, while also capturing most of the advance in theall-equity MSCI ACWI index. We position the Fund to capture a majority of equity market upside over complete market cycles, paying keen attention to mitigating downside risk. We believe that our focus on potential downside resilience can provide advantages in a rotational and higher-volatility market environment.
Since its inception on September 9, 1996, the Fund has returned 7.70% on an annualized basis (Class A Shares at net asset value) compared to a 7.06% return for the MSCI ACWI Index and 7.17% gain for the MSCI World Index. We believe these results demonstrate the Fund’s ability to generate a long-term return while pursuing a risk-managed investment approach over complete market cycles.
What factors influenced performance during the reporting period?
Global markets navigated two distinct environments over thesix-month period. During the first half of the period, markets battled multiple headwinds including slowing global growth, tighter Fed monetary policy and uncertainty regarding meaningful progress on trade disputes. The second half of the period ushered in a significant equity market recovery, as investors responded to the Federal Reserve’s more dovish policy outlook, China’s targeted stimulus, and positive corporate earnings results.
Positive Influences on Performance
Communication Services. The Fund’s security selection and an overweight stance in communication services promoted performance relative to the MSCI ACWI Index. Specifically, our holdings in interactive media & services and movies & entertainment were leading contributors.
Consumer Discretionary. Security selection in consumer discretionary added to the Fund’s performance. The main contributors within this sector resided in the internet & direct marketing retail and apparel, accessories & luxury goods industries.
Negative Influences on Performance
Energy. Over the period, an overweight position and security selection within the energy sector weakened return, as holdings in the oil & gas equipment & services and integrated oil & gas industries lagged on a relative basis.
Industrials. Trailing selection and an underweight allocation in industrials hindered relative returns, especially in the construction & engineering and railroads industries.
| | | | |
| 54 | | CALAMOS OPEN-END FAMILY OF FUNDS SEMIANNUAL REPORT | | |
Calamos Global Growth and Income Fund
Geographic Performance
Favorable security selection and an overweight stance in Emerging Asia delivered gains, with investments in China and New Zealand adding significant value. Moreover, the Fund benefitted from an underweight allocation and strong selection in Japan.
Conversely, the Fund’s security selection in the U.S. hampered return. Moreover, security selection and an overweight position in Europe dampened relative performance. Specifically, positions in France and in Switzerland detracted from relative return.
How is the Fund positioned?
The Fund’s regional and country positioning reflects the combined inputs of ourtop-down global framework andbottom-up security analysis. Our investment team continually evaluates macroeconomic factors and growth opportunities and actively integrates these into investment decision making.
| • | | We have an underweight position in the U.S., which reflects our view of decelerating growth, external geopolitical issues and relatively less-attractive valuation risk/reward. Our U.S. positions emphasize secular growth and higher-quality businesses with defensible business models. |
| • | | We hold a diversified set of positions in Europe, with a range of end markets spanning domestic demand and exporters. We are sensitive to developing political risks and the persistent slow growth that has beset Europe. Our positions are largely in global secular growth opportunities and, in some cases, more regionally exposed businesses with stable, less-cyclical characteristics. |
| • | | We have a positive stance on emerging markets and see a widening set of opportunities. We favor investments within demand areas such as interactive media & services, internet retail, and insurance. |
| • | | We have an underweight stance in Japan. Although valuations are reasonable and monetary conditions remain highly accommodative, global growth and trade, which the Japanese economy heavily depends on, have been relatively weak and sap activity in the country. |
| • | | Technology, consumer discretionary, health care and communication services are the among largest sector weights in the Fund, owing to our view of secular growth potential and attractive demand segments. We hold key positions in interactive media & services, internet retail, pharmaceuticals, semiconductors, apparel and luxury goods. |
| • | | We hold an overweight in financials, with higher-quality positioning in companies benefiting from improving business fundamentals, less onerous regulations in some regions, and attractive valuations. |
| • | | We have limited weight in more defensive areas including utilities and real estate, while we favor exposure to opportunities in consumer staples with more consistent growth and key demand verticals. |
| • | | We are modestly overweight in energy and materials, with a blend of opportunities that we believe offer attractive globalsupply-and-demand fundamentals and earnings growth potential. |
| | | | |
SECTOR WEIGHTINGS
as of April 30, 2019 | | | |
| |
Information Technology | | | 15.9 | % |
Financials | | | 15.5 | |
| |
Communication Services | | | 14.4 | |
Health Care | | | 10.5 | |
| |
Energy | | | 9.0 | |
Consumer Staples | | | 8.9 | |
| |
Consumer Discretionary | | | 7.5 | |
Industrials | | | 3.2 | |
| |
Utilities | | | 3.0 | |
Real Estate | | | 1.6 | |
| |
Materials | | | 1.5 | |
Other | | | 0.1 | |
Sector weightings are subject to change daily and are calculated as a percentage of net assets. The table excludes cash or cash equivalents, any government/sovereign bonds or broad based index hedging securities the Fund may hold.
Calamos Global Growth and Income Fund
What closing thoughts do you have for Fund shareholders?
Global corporate and macroeconomic data has been mixed versus expectations and reflects moderate global growth conditions. Global monetary policy remains generally accommodative and multiple central banks have adopted a more patient stance on future actions. Markets continue to confront a set of headwinds and tailwinds, though we have seen developments with respect to earnings and global policy that may be incrementally more positive. We continue to identify opportunities in equities that are reaping the benefits of moderate earnings growth, benign inflation and attractive valuations.
In terms of Fund positioning, we currently favor a blend of investments in secular growth and select defensive growth businesses. This positioning reflects our anticipation of moderate economic growth but also the potential for a pickup in demand conditions in the coming quarters. We currently favor investments in companies with earnings growth catalysts, solid cash flow generation and healthy balance sheets. From a thematic and sector perspective, we see opportunities in communications services, technology, consumer and health care companies with targeted areas of demand. We also favor a set of more cyclical companies with sound fundamentals and multiple catalysts. Our active, risk-managed investment approach and long-term perspective positions us to take advantage of the opportunities in global equities and convertible securities.
ANNUALIZED RETURN: SINCE INCEPTION (9/9/96) THROUGH 4/30/19
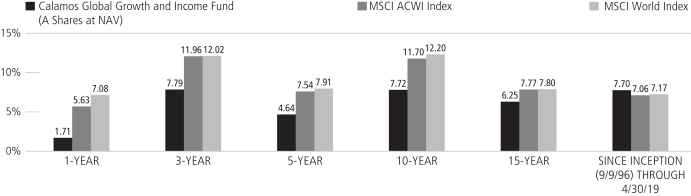
Performance data quoted represents past performance, which is no guarantee of future results. Current performance may be lower or higher than the performance quoted.
The principal value and investment return of an investment will fluctuate so that your shares, when redeemed, may be worth more or less than their original cost. You can obtain performance data current to the most recent month end by visiting www.calamos.com. Average annual total return measures net investment income and capital gain or loss from portfolio investments as an annualized average. All performance shown assumes reinvestment of dividends and capital gains distributions. Performance is for the Fund’s Class A shares at net asset value and does not include the Fund’s maximum front-end sales charge of 4.75%. Had it been included, the Fund’s return would have been lower. The Fund also offers Class C and Class I shares, the performance of which may vary. Source: State Street Corporation and Lipper, Inc.
| | | | |
| 56 | | CALAMOS OPEN-END FAMILY OF FUNDS SEMIANNUAL REPORT | | |
Calamos Global Growth and Income Fund
GROWTH OF $10,000: FOR THE 10-YEAR PERIOD ENDED 4/30/19
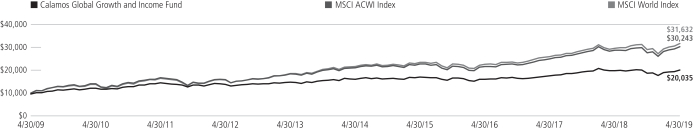
AVERAGE ANNUAL TOTAL RETURN† AS OF 4/30/19
| | | | | | | | | | | | | | | | | | | | |
| | | 6
MONTHS | | 1
YEAR | | 5
YEARS | | 10
YEARS |
Class A Shares – Inception 9/9/96 | | | | | | | | | | | | | | | | | | | | |
Without Sales Charge | | | | 7.23 | % | | | | 1.71 | % | | | | 4.64 | % | | | | 7.72 | % |
With Sales Charge | | | | 2.12 | | | | | -3.08 | | | | | 3.63 | | | | | 7.20 | |
Class C Shares – Inception 9/24/96 | | | | | | | | | | | | | | | | | | | | |
Without Sales Charge | | | | 6.86 | | | | | 1.04 | | | | | 3.86 | | | | | 6.93 | |
With Sales Charge | | | | 5.92 | | | | | 0.15 | | | | | 3.86 | | | | | 6.93 | |
Class I Shares – Inception 9/18/97 | | | | 7.37 | | | | | 2.01 | | | | | 4.89 | | | | | 7.99 | |
Performance data quoted represents past performance, which is no guarantee of future results. Current performance may be lower or higher than the performance quoted. The principal value and investment return of an investment will fluctuate so that your shares, when redeemed, may be worth more or less than their original cost.
As of the prospectus dated 3/1/19, the Fund’s gross expense ratio for Class A shares is 1.50%; Class C shares is 2.25% and Class I shares is 1.25%. The expense ratios shown above may differ from the more recent expense ratios reported in the Financial Highlight section of this report.
| † | Average annual total return measures net investment income and capital gain or loss from portfolio investments as an annualized average assuming reinvestment of dividends and capital gains distributions. Load-adjusted returns are adjusted for the maximumfront-end sales load of 4.75% for Class A shares and returns for Class C shares have been adjusted for the contingent deferred sales charge (CDSC). |
NOTES:
The graphs do not reflect the income taxes that you would pay on fund distributions or the redemption of fund shares. Fund performance includes reinvestment of dividends and adjustment for the maximum sales charge for Class A shares. The performance of other classes will vary from the performance of the class shown based on the difference in sales charges and fees paid by shareholders investing in different share classes.
The MSCI ACWI Index is a free float-adjusted market capitalization weighted index that is designed to measure the equity market performance of developed and emerging markets.
The MSCI World Index (U.S. Dollars) is a market-capitalization weighted index composed of companies representative of the market structure of developed market countries in North America, Europe and the Asia/Pacific region. Since inception data for the index is shown from 9/30/96 since data is only available for full monthly periods. Source: Lipper, Inc.
Index returns assume reinvestment of dividends and do not reflect deduction of fees and expenses. It is not possible to invest directly in an index.
The Fund’s use of derivative instruments involves investment risks and transaction costs to which the Fund would not be subject absent the use of these instruments and, accordingly, may result in losses greater than if they had not been used. Derivative instruments can be illiquid, may disproportionately increase losses and may have a potentially large impact on Fund performance.
Calamos Total Return Bond Fund
OVERVIEW
Through its multi-sector fixed income strategy, the Fund invests predominantly in U.S. issuers with the goal of generating a high level of both current income and total return that provides consistent excess returns above the benchmark over full market cycles.
KEY FEATURES
| | ◾ | | Employsbond-by-bond portfolio construction with a focus on being well compensated for risks taken. We believe a disciplined process, grounded in fundamental research, enables us to achieve higher total returns with less volatility. | |
| | ◾ | | Draws on a broader investable universe to enhance portfolio construction and risk management. The inclusion of high yield bonds, bank loans and preferreds provides additional opportunities. | |
| | ◾ | | Utilizes robust, independent credit research. Our fixed income investment process unites quantitative and qualitative analyses into historical and forward-looking models. The result is a credit rating reflective of where a company is heading. | |
| | ◾ | | Applies a macro overlay to capitalize on misunderstood industries and sectors. The overlay acts as a risk control that also considers the business cycle, geopolitical factors, inflation and real rate expectations. | |
PORTFOLIO FIT
The Fund may be suitable as the cornerstone of a fixed income allocation, with investments diversified across the major sectors of the U.S. bond market. Allocations to specialized fixed income strategies seek to enhance return potential and better manage risk.
| | |
| FUND NASDAQ SYMBOLS |
| |
A Shares | | CTRAX |
C Shares | | CTRCX |
| |
I Shares | | CTRIX |
| |
|
| FUND CUSIP NUMBERS |
| |
A Shares | | 128119310 |
C Shares | | 128119286 |
| |
I Shares | | 128119278 |
| |
CALAMOS TOTAL RETURN BOND FUND
INVESTMENT TEAM DISCUSSION
How has the Fund performed?
For the semiannual period ending April 30, 2019, the Fund returned 5.01% (Class A Shares at net asset value), performing in line with the 5.49% return of the Bloomberg Barclays U.S. Aggregate Bond Index.
Since its inception on June 27, 2007, the Fund gained 3.96% on an annualized basis (Class A Shares at net asset value) versus a 4.15% return for the Bloomberg Barclays U.S. Aggregate Bond Index.
What factors influenced performance?
The semiannual period was marked by two distinct phases in the fixed income markets. November and December witnessed a continuation of market conditions that began early in the fourth quarter, which we would characterize asrisk-off. Treasury yields betweentwo-year and30-year maturities moved lower by more than 40 basis points (see yield curve chart below), as prices rallied significantly. This was primarily driven by a flight to quality assets, spurred by asell-off in both equity and credit markets. Coupled with evaporating liquidity for corporate bonds, many investors worried that the Fed would tighten financial conditions too much in raising its overnight rate and reducing its balance sheet. As a result, option-adjusted spreads for investment-grade corporate debt widened by 35 basis points to ayear-end level of 153 basis points.
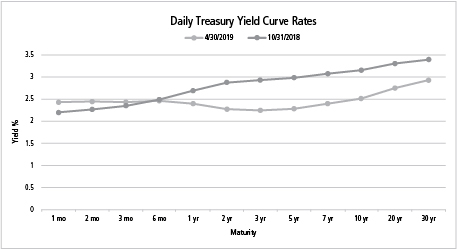
The balance of the period in 2019 saw a large reversal of the price pressure felt in risk markets. Option-adjusted spreads for the investment-grade market shifted from 153 basis points to 111 basis points, a tighter level than at the beginning of the period. Given the market’s changing expectations of the Fed’s stance on interest rates, Treasury prices rallied the first four months of the year, as intermediate maturity rates fell another 20 basis points on average. Both Treasury yield and credit spread factors helped drive positive returns across all major sectors of the Bloomberg Barclays U.S. Aggregate Bond Index.
| | | | |
| 58 | | CALAMOS OPEN-END FAMILY OF FUNDS SEMIANNUAL REPORT | | |
Calamos Total Return Bond Fund
With a 7.1% return, corporate bonds were the best-performing sector within the index. The Fund held an overweight in corporate debt over the last six months, but the Fund’s duration was shorter than the corporate component of the benchmark. As a result, the overweight allocation to corporate bonds across financial, industrial and utility sectors contributed positively to performance, while security selection in each sector detracted from performance. We continue to favor an overweight to corporate bonds held primarily in shorter-than-benchmark duration issues as a means of delivering more income while mitigating the impact of credit-spread volatility.
Within the investment-grade universe,AAA-rated bonds were the weakest among the ratings categories, and the Fund’s underweight toAAA-rated securities buoyed performance, as did security selection within the category thanks to the Fund’s longer duration than the AAA universe. Our allocation to less-interest-rate-sensitive, high yield bonds and bank loans in both the BB and B categories had a negative impact on performance.
How is the Fund positioned?
As of April 30, 2019, the Fund has a duration of 5.7 years versus the 5.9 years duration of the Bloomberg Barclays U.S. Aggregate Bond Index.
The Fund continues to hold an overweight in corporate bonds in both the investment-grade andout-of-benchmark high yield ratings categories. These overweights led to a lower overall credit quality of A compared to the AA quality of the benchmark. The strong rebound in credit spreads across investment-grade ratings categories, coupled with marked declines in Treasury yields, led to strong positive returns during the reporting period. While the Fund maintains an overweight in corporate bonds and asset-backed securities, the weighting of each was reduced during thesix-month period, as the team sought to capture returns associated with recent spread tightening. In turn, allocations to Treasuries and mortgage-backed securities both increased, although each of these sector allocations remains underweight to the benchmark.
Within the corporate bond allocation, our largest overweight allocations are found in the consumernon-cyclical and insurance sectors because we want to express the corporate bond overweight in less-cyclical businesses. Underweight allocations include the capital goods and natural gas utility sectors.
What are your closing thoughts for Fund shareholders?
While we expect the rate of domestic economic growth to slow, Calamos views the risk of an imminent recession as low. We see mixed indications regarding where we may actually be in the economic cycle, with “covenant lite” issuance signaling a nearing of the cycle peak contrasted with healthy convertible bond issuance which often indicates an economy that is through a cycle trough. We would characterize the economy as being in the late innings of expansion, but corporate credit fundamentals are broadly stable. We are not yet seeing material deterioration in fundamental measures of corporate balance sheet health, though we are closely measuring changes in credit metrics among lower rated issuers. The Fed’s pivot to a more dovish stance at its March 2019 meeting leads us to believe that the Fed intends to freeze its benchmark overnight lending rate for the balance of the year. In our view, active management and rigorous fundamental analysis is crucial to picking spots wisely to appropriately balance risk/reward in the current environment.
| | | | |
| ASSET ALLOCATION | | | |
| |
Corporate Bonds | | | 49.1 | % |
U.S. Government and Agency Securities | | | 37.9 | |
| |
Asset Backed Securities | | | 8.2 | |
Bank Loans | | | 3.8 | |
Fund asset allocations are calculated as a percentage of net assets and may vary over time. The table excludes cash or cash equivalents.
Calamos Total Return Bond Fund
ANNUALIZED RETURN: SINCE INCEPTION (6/27/07) THROUGH 4/30/19
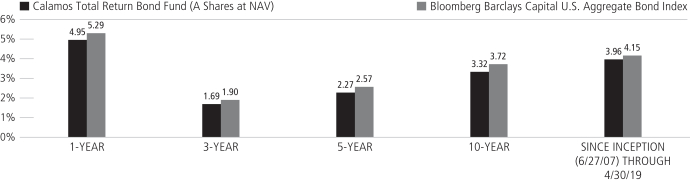
Performance data quoted represents past performance, which is no guarantee of future results. Current performance may be lower or higher than the performance quoted.
The principal value and investment return of an investment will fluctuate so that your shares, when redeemed, may be worth more or less than their original cost. You can obtain performance data current to the most recent month end by visiting www.calamos.com. Average annual total return measures net investment income and capital gain or loss from portfolio investments as an annualized average. All performance shown assumes reinvestment of dividends and capital gains distributions. Performance is for the Fund’s Class A shares at net asset value and does not include the Fund’s maximum front end sales charge of 2.25%. Had it been included, the Fund’s return would have been lower. The Fund also offers Class C and Class I shares, the performance of which may vary. Source: State Street Corporation and Mellon Analytical Solutions, LLC.
Duration is useful in measuring a bond fund’s sensitivity to changes in interest rates. The longer the duration, the more a bond fund’s price will fluctuate when interest rates change.
| | | | |
| 60 | | CALAMOS OPEN-END FAMILY OF FUNDS SEMIANNUAL REPORT | | |
Calamos Total Return Bond Fund
GROWTH OF $10,000: FOR THE 10-YEAR PERIOD ENDED 4/30/19
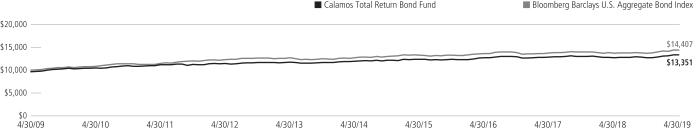
AVERAGE ANNUAL TOTAL RETURN�� AS OF 4/30/19
| | | | | | | | | | | | | | | | | | | | |
| | | 6
MONTHS | | 1
YEAR | | 5
YEARS | | 10
YEARS |
Class A Shares – Inception 6/27/07 | | | | | | | | | | | | | | | | | | | | |
Without Sales Charge | | | | 5.01 | % | | | | 4.95 | % | | | | 2.27 | % | | | | 3.32 | % |
With Sales Charge | | | | 2.61 | | | | | 2.58 | | | | | 1.48 | | | | | 2.93 | |
Class C Shares – Inception 6/27/07 | | | | | | | | | | | | | | | | | | | | |
Without Sales Charge | | | | 4.62 | | | | | 4.07 | | | | | 1.52 | | | | | 2.56 | |
With Sales Charge | | | | 3.62 | | | | | 3.07 | | | | | 1.52 | | | | | 2.56 | |
Class I Shares – Inception 6/27/07 | | | | 5.14 | | | | | 5.10 | | | | | 2.54 | | | | | 3.59 | |
Performance data quoted represents past performance, which is no guarantee of future results. Current performance may be lower or higher than the performance quoted. The principal value and investment return of an investment will fluctuate so that your shares, when redeemed, may be worth more or less than their original cost.
As of the prospectus dated 3/1/19, the Fund’s gross expense ratio for Class A shares is 1.05%; Class C shares is 1.80% and Class I shares is 0.80%. The Fund’s investment advisor has contractually agreed to reimburse Fund expenses through 3/1/22, to the extent necessary so that Total Annual Fund Operating Expenses (excluding taxes, interest, short interest, short dividend expenses, brokerage commissions, acquired fund fees and expenses, and extraordinary expenses, if any) of Class A, Class C and Class I are limited to 0.90%, 1.65% and 0.65% of average net assets, respectively. Calamos Advisors may recapture previously waived expense amounts within the same fiscal year for any day where the respective Fund’s expense ratio falls below the contractual expense limit up to the expense limit for that day. This undertaking is binding on CALAMOS ADVISORS and any of its successors and assigns. This agreement is not terminable by either party. The expense ratios shown above may differ from the more recent expense ratios reported in the Financial Highlights section of this report.
| † | Average annual total return measures net investment income and capital gain or loss from portfolio investments as an annualized average assuming reinvestment of dividends and capital gains distributions. Performance shown reflects the effects of an expense reimbursement that improved results. Load-adjusted returns are adjusted for the maximumfront-end sales load of 2.25% for Class A shares and returns for Class C shares have been adjusted for the contingent deferred sales charge (CDSC). |
NOTES:
The graph does not reflect the income taxes that you would pay on fund distributions or the redemption of fund shares. Fund performance includes reinvestment of dividends and adjustment for the maximum sales charge for Class A shares. The performance of other classes will vary from the performance of the class shown based on the difference in sales charges and fees paid by shareholders investing in different share classes.
The Bloomberg Barclays U.S. Aggregate Bond Index is considered generally representative of the investment-grade bond market. Source: Lipper, Inc.
Index returns assume reinvestment of dividends and do not reflect deduction of fees and expenses. It is not possible to invest directly in an index.
Calamos High Income Opportunities Fund
OVERVIEW
Through its multi-sector fixed income strategy, the Fund invests mainly in high yield securities from U.S. issuers with the goal of generating a high level of current income and total return that provides consistent excess returns over full market cycles.
KEY FEATURES
| | ◾ | | Employsbond-by-bond portfolio construction with a focus on being well compensated for risks taken. We believe a disciplined process, grounded in fundamental research, enables us to achieve higher total returns with less volatility. | |
| | ◾ | | Draws on broader investable universe to enhance portfolio construction and risk management. Expanding the universe to include bank loans and preferred securities provides additional opportunities. | |
| | ◾ | | Utilizes robust, independent credit research. Our fixed income investment process unites quantitative and qualitative analyses into historical and forward-looking models. The result is a credit rating that reflects where a company is heading. | |
| | ◾ | | Applies a macro overlay to capitalize on opportunities in misunderstood industries and sectors. The overlay acts as a risk control that also considers the business cycle, geopolitics, inflation and real rate expectations. | |
PORTFOLIO FIT
The Fund can complement investment-grade credit exposure, providing attractive income and total return potential for more risk-tolerant investors.
| | |
| FUND NASDAQ SYMBOLS |
| |
A Shares | | CHYDX |
C Shares | | CCHYX |
| |
I Shares | | CIHYX |
| |
|
| FUND CUSIP NUMBERS |
| |
A Shares | | 128119815 |
C Shares | | 128119799 |
| |
I Shares | | 128119781 |
| |
CALAMOS HIGH INCOME OPPORTUNITIES FUND
INVESTMENT TEAM DISCUSSION
How has the Fund performed?
For the annual period ended April 30, 2019, Calamos High Income Opportunities Fund returned 4.65% (Class A Shares at net asset value) versus a gain of 5.54% for the Bloomberg Barclays U.S. Corporate High Yield 2% Issuer Capped Index.
Since its inception on August 2, 1999, the Fund gained 5.96% on an annualized basis (Class A Shares at net asset value) versus a 7.02% return for the Bloomberg Barclays U.S. Corporate High Yield 2% Issuer Capped Index.
What factors influenced performance?
The semiannual period witnessed two distinct phases in the fixed income market. November and December marked a continuation of market conditions that began early in the fourth quarter, which we would characterize asrisk-off. Treasury yields betweentwo-year and30-year maturities moved lower by more than 40 basis points (see yield curve chart below), as prices rallied significantly. This was primarily driven by a flight to quality assets, spurred by asell-off in both equity and credit markets. High yield spreads during that same period moved wider, as investors demanded more compensation for taking on higher levels of credit risk towardyear-end 2018. Specifically, option-adjusted spreads for the high yield market moved from 372 basis points to 526 basis points during November and December 2018.
The balance of the period in 2019 saw a large reversal of the price pressure felt in risk markets. Option-adjusted spreads for the high yield market shifted from the 526 basis points mentioned earlier back below their level at the start of the semiannual period to close at 358 basis points as the S&P 500 Index rallied to anall-time high. Given the market’s changing expectations of the Fed’s direction on interest rates, Treasury prices rallied the first four months of the year, as intermediate maturity rates fell another 20 basis points on average. Both factors led to strong price returns in the high yield market, which when coupled with coupon income led the Bloomberg Barclays U.S. Corporate
| | | | |
| 62 | | CALAMOS OPEN-END FAMILY OF FUNDS SEMIANNUAL REPORT | | |
Calamos High Income Opportunities Fund
High Yield 2% Issuer Capped Index to a gain of 8.78% through the first four months of the year and 5.54% for the semiannual period.
Despite the risk rally for the balance of the review period, there was a limitation to the generic level of credit risk that attracted investors. As such, higher-quality, below-investment-grade bonds rated BB delivered returns of 6.7%, whereasCCC-rated issuers delivered only 1.7%. Some of this differential was driven by the respective depths of thesell-off during November and December 2018. As a result, our underweight toBB-rated bonds hurt performance, while our overweight toout-of-benchmark,BBB-rated credits was a positive.
From a sector perspective, the team’s security selection within basic industry and capital goods sectors contributed to return. Conversely, our selection within the consumernon-cyclical sector detracted from performance, as did the Fund’s overweight allocation to the energy sector.
How is the Fund positioned?
The Fund is currently overweight in the pharmaceuticals, midstream, and property and casualty insurance industries. The pharmaceutical overweight is a result of idiosyncratic opportunities in three companies, in particular. It is an illustration of our investment process, which is grounded in company level fundamental analysis. Our largest underweights are in the technology, chemicals, and packaging industries. The Fund’s technology positioning is a function of limited relative value within the industry. The underweight to chemical companies is a function of increased raw material costs and the pressure it is creating on operating margins. We continue to expect challenges for chemical companies as they look to pass along price increases to customers, which we expect will result in weakened credit metrics.
From a credit-quality perspective, the Fund is positioned with a relative underweight in the BB category, while currently overweight toward both BBB and B issuers. The Fund is positioned with a neutral duration (3.4 years) in the portfolio relative to the Bloomberg Barclays US High Yield 2% Issuer Capped Index (3.4 years).
Over the semiannual period, the team has added to positions in the communications and consumer cyclical sectors, most notably the home construction industry. Also, we reduced exposure to midstream energy credit, though it remains an overweight allocation.
What are your closing thoughts for shareholders?
While we expect the rate of domestic economic growth to slow, Calamos views the risk of an imminent recession as low, and we expect the default environment to continue to trend below the long-term historical average of 3% until domestic economic activity softens. We see mixed indications regarding where we may actually be in the economic cycle, with “covenant lite” issuance signaling a nearing of the cycle peak contrasted with healthy convertible bond issuance which often indicates an economy that is through a cycle trough. We would characterize the economy as being in the late innings of expansion, but corporate credit fundamentals are broadly stable. Given the strength of returns for the high yield market in the semiannual period, we believe the asset class can produce low double-digit returns for the annual period, delivering a coupon-like return over the balance of the year. We continue to adhere to our discipline as active management and rigorous fundamental analysis are crucial to picking spots wisely to appropriately balance risk/reward.
| | | | |
SECTOR WEIGHTINGS
as of April 30, 2019 | | | |
| |
Energy | | | 14.8 | % |
Communication Services | | | 14.4 | |
| |
Consumer Discretionary | | | 13.5 | |
Financials | | | 13.5 | |
| |
Health Care | | | 12.0 | |
Industrials | | | 11.8 | |
| |
Materials | | | 5.4 | |
Consumer Staples | | | 5.1 | |
| |
Information Technology | | | 2.4 | |
Utilities | | | 1.2 | |
| |
Real Estate | | | 0.5 | |
| | | | | |
Sector weightings are subject to change daily and are calculated as a percentage of net assets. The table excludes cash or cash equivalents, any government/sovereign bonds or broad based index hedging securities the Fund may hold.
Calamos High Income Opportunities Fund
ANNUALIZED RETURN: SINCE INCEPTION (8/2/99) THROUGH 4/30/19
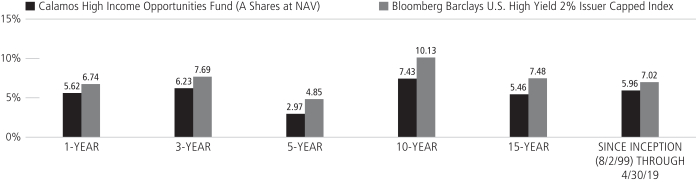
Performance data quoted represents past performance, which is no guarantee of future results.Current performance may be lower or higher than the performance quoted.
The principal value and investment return of an investment will fluctuate so that your shares, when redeemed, may be worth more or less than their original cost. You can obtain performance data current to the most recent month end by visiting www.calamos.com. Average annual total return measures net investment income and capital gain or loss from portfolio investments as an annualized average. All performance shown assumes reinvestment of dividends and capital gains distributions. Performance is for the Fund’s Class A shares at net asset value and does not include the Fund’s maximum front-end sales charge of 2.25%. Had it been included, the Fund’s return would have been lower. The Fund also offers Class C and Class I shares, the performance of which may vary. Source: State Street Corporation and Mellon Analytical Solutions, LLC.
| | | | |
| 64 | | CALAMOS OPEN-END FAMILY OF FUNDS SEMIANNUAL REPORT | | |
Calamos High Income Opportunities Fund
GROWTH OF $10,000: FOR THE 10-YEAR PERIOD ENDED 4/30/19
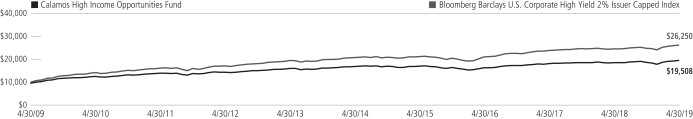
AVERAGE ANNUAL TOTAL RETURN† AS OF 4/30/19
| | | | | | | | | | | | | | | | | | | | |
| | | 6
MONTHS | | 1
YEAR | | 5
YEARS | | 10
YEARS |
Class A Shares – Inception 8/2/99 | | | | | | | | | | | | | | | | | | | | |
Without Sales Charge | | | | 4.65 | % | | | | 5.62 | % | | | | 2.97 | % | | | | 7.43 | % |
With Sales Charge | | | | 2.32 | | | | | 3.20 | | | | | 1.98 | | | | | 6.91 | |
Class C Shares – Inception 12/21/00 | | | | | | | | | | | | | | | | | | | | |
Without Sales Charge | | | | 4.33 | | | | | 4.83 | | | | | 2.20 | | | | | 6.63 | |
With Sales Charge | | | | 3.33 | | | | | 3.83 | | | | | 2.20 | | | | | 6.63 | |
Class I Shares – Inception 3/1/02 | | | | 4.77 | | | | | 5.88 | | | | | 3.23 | | | | | 7.70 | |
Performance data quoted represents past performance, which is no guarantee of future results. Current performance may be lower or higher than the performance quoted. The principal value and investment return of an investment will fluctuate so that your shares, when redeemed, may be worth more or less than their original cost.
As of the prospectus dated 3/1/19, the Fund’s gross expense ratio for Class A shares is 1.46%; Class C is 2.22% and Class I is 1.21%. The Fund’s Investment Adviser has contractually agreed to reimburse the Fund expenses through 3/1/22, to the extent necessary so that Total Annual Fund Operating Expenses (excluding taxes, interest, short interest, short dividend expenses, brokerage commissions, acquired fund fees and expenses, and extraordinary expenses, if any) of Class A, Class C, and Class I are limited to 1.00%, 1.75% and 0.75% of average net assets, respectively. Calamos Advisors may recapture previously waived expense amounts within the same fiscal year for any day where the respective Fund’s expense ratio falls below the contractual expenses limit up to the expense limit for that day. This undertaking is binding on CALAMOS ADVISORS and any of its successors and assigns. This agreement is not terminable by either party. The expense ratios shown above may differ from the more recent expense ratios reported in the Financial Highlights section of this report.
| † | Average annual total return measures net investment income and capital gain or loss from portfolio investments as an annualized average assuming reinvestment of dividends and capital gains distributions. Performance shown reflects the effects of an expense reimbursement that improved results. Load-adjusted returns are adjusted for the maximum front-end sales load of 2.25% for Class A shares and returns for Class C shares have been adjusted for the contingent deferred sales charge (CDSC). |
NOTES:
The graphs do not reflect the income taxes that you would pay on fund distributions or the redemption of fund shares. Fund performance includes reinvestment of dividends and adjustment for the maximum sales charge for Class A shares. The performance of other classes will vary from the performance of the class shown based on the difference in sales charges and fees paid by shareholders investing in different share classes.
The Bloomberg Barclays U.S. Corporate High Yield 2% Issuer Capped Index measures the performance of high yield corporate bonds with a maximum allocation of 2% to any one issuer.
Index returns assume reinvestment of dividends and do not reflect deduction of fees and expenses. It is not possible to invest directly in an index.
Calamos Short-Term Bond Fund
OVERVIEW
Through its multi-sector fixed income strategy, the fund invests predominantly in U.S. issuers with the goal of generating a high level of current income consistent with preservation of principal.
KEY FEATURES
| | ◾ | | Employsbond-by-bond portfolio construction with a focus on being well compensated for risks taken. We believe a disciplined process, grounded in fundamental research, enables us to achieve higher total returns with less volatility. | |
| | ◾ | | Draws on a broader investable universe to enhance portfolio construction and risk management. Expanding the universe to include high yield bonds, bank loans and preferreds provides additional opportunities. | |
| | ◾ | | Utilizes robust, independent credit research. Our fixed income investment process unites quantitative and qualitative analyses into historical and forward-looking models. The result is a credit rating reflective of where a company is heading. | |
| | ◾ | | Applies a macro overlay to capitalize on misunderstood industries and sectors. The overlay acts as a risk control that also considers the business cycle, geopolitics, inflation and real rate expectations. | |
PORTFOLIO FIT
The Fund may be suitable for investors seeking current income accompanied by lower volatility over a one-year to two-year time horizon.
| | |
| FUND NASDAQ SYMBOLS |
| |
A Shares | | CSTBX |
I Shares | | CSTIX |
|
| FUND CUSIP NUMBERS |
| |
A Shares | | 128120441 |
I Shares | | 128120433 |
CALAMOS SHORT-TERM BOND FUND
INVESTMENT TEAM DISCUSSION
How has the Fund performed?
For the semi-annual period ended April 30, 2019, Calamos Short-Term Bond Fund returned 2.34% (Class A Shares at net asset value) performing in line with the 2.52% return for the Bloomberg Barclays Government/Credit 1-3 Year Index and slightly trailing the 2.85% gain of the Bloomberg Barclays U.S. Credit1-3 Year Index.
Since its inception on September 19, 2018, the Fund gained 2.46% on an annualized basis (Class A Shares at net asset value) versus a 2.74% return for the Bloomberg Barclays Government/Credit 1-3 Year Index and 3.01% increase for the Bloomberg Barclays U.S. Credit 1-3 Year Index.
What factors influenced performance?
The semiannual period witnessed two distinct phases in the fixed income markets. November and December marked a continuation of market conditions that began early in the fourth quarter, which we would characterize asrisk-off. Short duration Treasury yields moved substantially lower with one, two and three year maturities falling by 28, 60 and 69 basis points, respectively. This was primarily driven by a flight to quality assets, spurred by asell-off in both equity and credit markets. Coupled with evaporating liquidity for corporate bonds, many investors worried that the Fed would tighten financial conditions too much by raising its overnight rate and reducing its balance sheet. As a result, option-adjusted spreads for short-term investment-grade corporate debt widened by 27 basis points to ayear-end level of 86 basis points.
The balance of the period in 2019 saw a large reversal of the price pressure felt in risk markets. Option-adjusted spreads for the short-term investment-grade market shifted from 86 basis points to 53 basis points, a tighter level than at the beginning of the period. Given the market’s changing expectations of the Fed’s stance on interest rates, Treasury prices rallied the first four months of the year, as intermediate maturity rates fell another 20 basis points on average. Both Treasury yield and credit spread factors helped drive positive returns across all major sectors of the Bloomberg Barclays U.S. Aggregate Bond Index.
With a 2.9% return, corporate bonds were the best-performing sector within the index. As a result, the Fund’s overweight allocation to corporate bonds across financial, industrial and utility related sectors contributed positively to performance, while security selection in each sector detracted from performance. We continue to favor an overweight to corporate bonds and asset-backed securities in the Fund, as the visibility of company operations and consumer credit performance are high for the securities in the Fund’s portfolio.
How is the Fund positioned?
The Fund has a duration of 1.9 years versus the 1.8 years duration of the Bloomberg Barclays U.S.1-3 Year Government/Credit Index.
The Fund continues to hold an overweight in corporate bonds in both the investment-grade andout-of-benchmark high yield ratings categories. These overweights led to a lower overall credit quality of A+ compared to the AA+ quality of the benchmark. The
| | | | |
| 66 | | CALAMOS OPEN-END FAMILY OF FUNDS SEMIANNUAL REPORT | | |
Calamos Short-Term Bond Fund
strong rebound in credit spreads across investment-grade ratings categories, coupled with marked declines in Treasury yields, led to strong positive returns during the reporting period. While the Fund maintains an overweight in corporate bonds and asset-backed securities, the weighting of corporate bonds was reduced during thesix-month period, with a corresponding increase in the allocation to Treasuries. The Fund continues to hold overweight positions in corporate and asset-backed securities and underweight positions in Treasuries and Agencies.
Within the corporate bond allocation, our largest overweight allocations are found in the consumer cyclical and consumernon-cyclical sectors. The only corporate underweight allocation is in the banking sector.
What are your closing thoughts for Fund shareholders?
While we expect the rate of domestic economic growth to slow, Calamos views the risk of an imminent recession as low. We see mixed indications regarding where we may be in the economic cycle, with “covenant lite” issuance signaling a nearing of the cycle peak contrasted with healthy convertible bond issuance which often indicates an economy that is through a cycle trough. We would characterize the economy as being in the late innings of expansion, but corporate credit fundamentals are broadly stable. We are not yet seeing material deterioration in fundamental measures of corporate balance sheet health, though we are closely measuring changes in credit metrics among lower-rated issuers. The Fed’s pivot to a more dovish stance at its March 2019 meeting leads us to believe that the Fed intends to freeze its benchmark overnight lending rate for the balance of the year. In the current environment, active management and rigorous fundamental analysis is crucial to picking spots wisely to appropriately balance risk/reward.
| | | | |
| ASSET ALLOCATION | | | |
| |
Corporate Bonds | | | 62.1 | % |
U.S. Government and Agency Securities | | | 18.2 | |
| |
Asset Backed Securities | | | 11.9 | |
Bank Loans | | | 4.4 | |
| |
Residential Mortgage Backed Securities | | | 1.7 | |
Municipal Obligations | | | 0.3 | |
| |
Convertible Bonds | | | 0.2 | |
| | | | | |
Fund asset allocations are calculated as a percentage of net assets and may vary over time. The table excludes cash or cash equivalents.
Calamos Short-Term Bond Fund
AVERAGE ANNUAL TOTAL RETURN† AS OF 4/30/19
| | | | | | | | | | |
| | | 6
MONTHS | | SINCE
INCEPTION |
Class A Shares – Inception 9/19/18 | | | | | | | | | | |
Without Sales Charge | | | | 2.34 | % | | | | 2.46 | % |
With Sales Charge | | | | 0.03 | | | | | 0.16 | |
Class I Shares – Inception 9/19/18 | | | | 2.46 | | | | | 2.62 | |
Performance data quoted represents past performance, which is no guarantee of future results. Current performance may be lower or higher than the performance quoted. The principal value and investment return of an investment will fluctuate so that your shares, when redeemed, may be worth more or less than their original cost.
As of the prospectus dated 3/1/19, the Fund’s gross expense ratio for Class A shares is 0.95% and Class I is 0.70%. The Fund’s investment advisor has contractually agreed to reimburse Fund expenses through 3/1/22 to the extent necessary so that Total Annual Fund Operating Expenses (excluding taxes, interest, short interest, short dividend expenses, brokerage commissions, acquired fund fees and expenses, and extraordinary expenses, if any) of Class A and Class I are limited to 0.65% and 0.40% of average net assets, respectively. Calamos Advisors may recapture previously waived expense amounts within the same fiscal year for any day where the respective Fund’s expense ratio falls below the contractual expense limit up to the expense limit for that day. This undertaking is binding on CALAMOS ADVISORS and any of its successors and assigns. This agreement is not terminable by either party. The expense ratios shown above may differ from the more recent expense ratios reported in the Financial Highlights section of this report.
| † | Average annual total return measures net investment income and capital gain or loss from portfolio investments as an annualized average assuming reinvestment of dividends and capital gains distributions. Performance shown reflects the effects of an expense reimbursement that improved results. Load-adjusted returns are adjusted for the maximum front-end sales load of 2.25% for Class A shares. |
NOTES:
The Bloomberg Barclays Government/Credit 1-3 Year Index includes all medium and larger issues of U.S. government, investment-grade corporate, and investment-grade international dollar-denominated bonds that have maturities of between 1 and 3 years and are publicly issued.
The Bloomberg Barclays U.S. 1-3 Year Credit Index measures the investment-grade, U.S. dollar-denominated, fixed-rate, taxable corporate and government-related bond markets. It is composed of the U.S. Corporate Index and a non-corporate component that includes foreign agencies, sovereigns, supranationals and local authorities that have maturities of between 1 and 3 years.
Index returns assume reinvestment of dividends and do not reflect deduction of fees and expenses. It is not possible to invest directly in an index.
| | | | |
| 68 | | CALAMOS OPEN-END FAMILY OF FUNDS SEMIANNUAL REPORT | | |
Expense Overview
EXPENSE OVERVIEW
As a shareholder of a mutual fund, you incur two types of costs. You incur:
1) Transaction costs, including sales charges, or loads, on purchase payment and redemption fees.
2) Ongoing costs, including management fees, distribution and/or service(12b-1) fees and other fund expenses.
The examples in this report are based on an investment of $1,000 made at the beginning of the period and held for the entire period from November 1, 2018 to April 30, 2019. It is intended to help you understand the ongoing costs associated with investing in each mutual fund and to compare these costs with the ongoing costs of investing in other mutual funds.
There are two parts of each Fund’s chart:
Actual
In this part of the chart, you’ll see the actual expenses you would have paid on a $1,000 investment made at the beginning of the period and held for the entire period in each fund from November 1, 2018 to April 30, 2019, the period covered by this report. This chart also shows the actual returns, after expenses, you would have earned during that time. This chart can help you estimate your own expenses. For example, if you invested $8,600 in Class A shares of the fund, simply divide $8,600 by $1,000, then multiply that result by the figure in the Actual Expenses per $1,000 row. In this example, you would multiply 8.6 times the figure.
Hypothetical
In this part of the chart, you’ll see the hypothetical expenses you would have paid on a $1,000 investment from November 1, 2018 to April 30, 2019, and the hypothetical returns, after expenses, you would have earned during that time. The Securities and Exchange Commission (SEC) has established the guidelines for this chart, including the assumed 5% annual rate of return before expenses, which is what you’ll see in the chart. Note that this chart will not help you determine your own expenses, but will help you compare expenses of the fund you own to the expenses of another fund since the information for that fund should be calculated using the same assumptions.
Please note that the expenses shown in the chart are meant to highlight your ongoing costs only and do not include any transactional costs, such as sales charges (loads), redemption fees or exchange fees. Therefore, the second line of the chart is useful in comparing ongoing costs only and will not help you determine the relative total costs of owning different funds. In addition, if these transaction costs were included, your costs would have been higher.
Expense Example
The actual and hypothetical examples shown assume a $1,000 investment at the beginning of the period, November 1, 2018 and held through April 30, 2019.
| | | | | | | | | | | | | | | | |
| | | CLASS A
SHARES | | | CLASS C
SHARES | | | CLASS I
SHARES | | | CLASS R6
SHARES | |
| CALAMOS MARKET NEUTRAL INCOME FUND | | | | | | | | | | | | | | | | |
Actual Expenses per $1,000* | | $ | 6.21 | | | $ | 9.95 | | | $ | 4.96 | | | $ | — | |
Actual – Ending Balance | | $ | 1,020.60 | | | $ | 1,016.70 | | | $ | 1,022.00 | | | $ | — | |
| | | | |
Hypothetical Expenses per $1,000* | | $ | 6.21 | | | $ | 9.94 | | | $ | 4.96 | | | $ | — | |
Hypothetical – Ending Value | | $ | 1,018.65 | | | $ | 1,014.93 | | | $ | 1,019.89 | | | $ | — | |
| | | | |
Annualized expense ratio(1)(2) | | | 1.24% | | | | 1.99% | | | | 0.99% | | | | — | |
| CALAMOS HEDGED EQUITY FUND | | | | | | | | | | | | | | | | |
Actual Expenses per $1,000* | | $ | 6.22 | | | $ | 9.95 | | | $ | 4.91 | | | $ | — | |
Actual – Ending Balance | | $ | 1,040.70 | | | $ | 1,037.20 | | | $ | 1,043.20 | | | $ | — | |
| | | | |
Hypothetical Expenses per $1,000* | | $ | 6.16 | | | $ | 9.84 | | | $ | 4.86 | | | $ | — | |
Hypothetical – Ending Value | | $ | 1,018.70 | | | $ | 1,015.03 | | | $ | 1,019.98 | | | $ | — | |
| | | | |
Annualized expense ratio | | | 1.23% | | | | 1.97% | | | | 0.97% | | | | — | |
| CALAMOS PHINEUS LONG/SHORT FUND | | | | | | | | | | | | | | | | |
Actual Expenses per $1,000* | | $ | 13.17 | | | $ | 16.88 | | | $ | 11.88 | | | $ | — | |
Actual – Ending Balance | | $ | 1,011.80 | | | $ | 1,007.70 | | | $ | 1,012.80 | | | $ | — | |
| | | | |
Hypothetical Expenses per $1,000* | | $ | 13.17 | | | $ | 16.88 | | | $ | 11.88 | | | $ | — | |
Hypothetical – Ending Value | | $ | 1,011.70 | | | $ | 1,007.98 | | | $ | 1,012.99 | | | $ | — | |
| | | | |
Annualized expense ratio(1)(2) | | | 2.64% | | | | 3.39% | | | | 2.38% | | | | — | |
| CALAMOS CONVERTIBLE FUND | | | | | | | | | | | | | | | | |
Actual Expenses per $1,000* | | $ | 5.94 | | | $ | 9.79 | | | $ | 4.65 | | | $ | — | |
Actual – Ending Balance | | $ | 1,082.00 | | | $ | 1,078.00 | | | $ | 1,083.00 | | | $ | — | |
| | | | |
Hypothetical Expenses per $1,000* | | $ | 5.76 | | | $ | 9.49 | | | $ | 4.51 | | | $ | — | |
Hypothetical – Ending Value | | $ | 1,019.09 | | | $ | 1,015.37 | | | $ | 1,020.33 | | | $ | — | |
| | | | |
Annualized expense ratio | | | 1.15% | | | | 1.90% | | | | 0.90% | | | | — | |
| CALAMOS GLOBAL CONVERTIBLE FUND | | | | | | | | | | | | | | | | |
Actual Expenses per $1,000* | | $ | 6.79 | | | $ | 10.59 | | | $ | 5.51 | | | $ | — | |
Actual – Ending Balance | | $ | 1,058.10 | | | $ | 1,053.90 | | | $ | 1,059.50 | | | $ | — | |
| | | | |
Hypothetical Expenses per $1,000* | | $ | 6.66 | | | $ | 10.39 | | | $ | 5.41 | | | $ | — | |
Hypothetical – Ending Value | | $ | 1,018.20 | | | $ | 1,014.48 | | | $ | 1,019.44 | | | $ | — | |
| | | | |
Annualized expense ratio | | | 1.33% | | | | 2.08% | | | | 1.08% | | | | — | |
| CALAMOS GROWTH FUND | | | | | | | | | | | | | | | | |
Actual Expenses per $1,000* | | $ | 7.08 | | | $ | 11.10 | | | $ | 5.78 | | | $ | — | |
Actual – Ending Balance | | $ | 1,116.30 | | | $ | 1,112.60 | | | $ | 1,117.50 | | | $ | — | |
| | | | |
Hypothetical Expenses per $1,000* | | $ | 6.76 | | | $ | 10.59 | | | $ | 5.51 | | | $ | — | |
Hypothetical – Ending Value | | $ | 1,018.10 | | | $ | 1,014.28 | | | $ | 1,019.34 | | | $ | — | |
| | | | |
Annualized expense ratio(2) | | | 1.35% | | | | 2.12% | | | | 1.10% | | | | — | |
| CALAMOS GROWTH AND INCOME FUND | | | | | | | | | | | | | | | | |
Actual Expenses per $1,000* | | $ | 5.69 | | | $ | 9.55 | | | $ | 4.40 | | | $ | — | |
Actual – Ending Balance | | $ | 1,085.10 | | | $ | 1,081.30 | | | $ | 1,086.70 | | | $ | — | |
| | | | |
Hypothetical Expenses per $1,000* | | $ | 5.51 | | | $ | 9.25 | | | $ | 4.26 | | | $ | — | |
Hypothetical – Ending Value | | $ | 1,019.34 | | | $ | 1,015.62 | | | $ | 1,020.58 | | | $ | — | |
| | | | |
Annualized expense ratio | | | 1.10% | | | | 1.85% | | | | 0.85% | | | | — | |
| CALAMOS DIVIDEND GROWTH FUND | | | | | | | | | | | | | | | | |
Actual Expenses per $1,000* | | $ | 7.03 | | | $ | 10.91 | | | $ | 5.73 | | | $ | — | |
Actual – Ending Balance | | $ | 1,098.80 | | | $ | 1,094.60 | | | $ | 1,100.30 | | | $ | — | |
| | | | |
Hypothetical Expenses per $1,000* | | $ | 6.76 | | | $ | 10.49 | | | $ | 5.51 | | | $ | — | |
Hypothetical – Ending Value | | $ | 1,018.10 | | | $ | 1,014.38 | | | $ | 1,019.34 | | | $ | — | |
| | | | |
Annualized expense ratio(2) | | | 1.35% | | | | 2.10% | | | | 1.10% | | | | — | |
| * | Expenses for all Fund Classes A, C, and I are equal to the Fund’s annualized expense ratio, multiplied by the average account value over the period, multiplied by 181/365. |
| (1) | Includes 0.20% and 0.99% related to dividend expense on short positions for Market Neutral Income Fund and Phineus Long/Short Fund, respectively. |
| (2) | Annualized Expense Ratios for Market Neutral Income Fund, Phineus Long/Short Fund, Growth Fund, and Dividend Growth Fund are adjusted to reflect fee waiver. |
| | | | |
| 70 | | CALAMOS OPEN-END FAMILY OF FUNDS SEMIANNUAL REPORT | | |
Expense Example
The actual and hypothetical examples shown assume a $1,000 investment at the beginning of the period, November 1, 2018 and held through April 30, 2019.
| | | | | | | | | | | | | | | | |
| | | CLASS A
SHARES | | | CLASS C
SHARES | | | CLASS I
SHARES | | | CLASS R6
SHARES | |
| CALAMOS OPPORTUNISTIC VALUE FUND | | | | | | | | | | | | | | | | |
Actual Expenses per $1,000* | | $ | 5.89 | | | $ | 9.72 | | | $ | 4.61 | | | $ | — | |
Actual – Ending Balance | | $ | 1,066.50 | | | $ | 1,062.30 | | | $ | 1,067.30 | | | $ | — | |
| | | | |
Hypothetical Expenses per $1,000* | | $ | 5.76 | | | $ | 9.49 | | | $ | 4.51 | | | $ | — | |
Hypothetical – Ending Value | | $ | 1,019.09 | | | $ | 1,015.37 | | | $ | 1,020.33 | | | $ | — | |
| | | | |
Annualized expense ratio(2) | | | 1.15% | | | | 1.90% | | | | 0.90% | | | | — | |
| CALAMOS INTERNATIONAL GROWTH FUND | | | | | | | | | | | | | | | | |
Actual Expenses per $1,000* | | $ | 5.71 | | | $ | 9.59 | | | $ | 4.42 | | | $ | 3.69 | |
Actual – Ending Balance | | $ | 1,094.80 | | | $ | 1,091.00 | | | $ | 1,096.50 | | | $ | 1,097.00 | |
| | | | |
Hypothetical Expenses per $1,000* | | $ | 5.51 | | | $ | 9.25 | | | $ | 4.26 | | | $ | 3.56 | |
Hypothetical – Ending Value | | $ | 1,019.34 | | | $ | 1,015.62 | | | $ | 1,020.58 | | | $ | 1,021.30 | |
| | | | |
Annualized expense ratio(2) | | | 1.10% | | | | 1.85% | | | | 0.85% | | | | 0.71% | |
| CALAMOS EVOLVING WORLD GROWTH FUND | | | | | | | | | | | | | | | | |
Actual Expenses per $1,000* | | $ | 8.90 | | | $ | 12.82 | | | $ | 7.59 | | | $ | — | |
Actual – Ending Balance | | $ | 1,124.40 | | | $ | 1,119.70 | | | $ | 1,125.90 | | | $ | — | |
| | | | |
Hypothetical Expenses per $1,000* | | $ | 8.45 | | | $ | 12.18 | | | $ | 7.20 | | | $ | — | |
Hypothetical – Ending Value | | $ | 1,016.41 | | | $ | 1,012.69 | | | $ | 1,017.65 | | | $ | — | |
| | | | |
Annualized expense ratio | | | 1.69% | | | | 2.44% | | | | 1.44% | | | | — | |
| CALAMOS EMERGING MARKET EQUITY FUND | | | | | | | | | | | | | | | | |
Actual Expenses per $1,000* | | $ | 9.33 | | | $ | 13.31 | | | $ | 8.00 | | | $ | — | |
Actual – Ending Balance | | $ | 1,151.10 | | | $ | 1,146.80 | | | $ | 1,152.20 | | | $ | — | |
| | | | |
Hypothetical Expenses per $1,000* | | $ | 8.75 | | | $ | 12.47 | | | $ | 7.50 | | | $ | — | |
Hypothetical – Ending Value | | $ | 1,016.12 | | | $ | 1,012.40 | | | $ | 1,017.36 | | | $ | — | |
| | | | |
Annualized expense ratio(2) | | | 1.75% | | | | 2.50% | | | | 1.50% | | | | — | |
| CALAMOS GLOBAL EQUITY FUND | | | | | | | | | | | | | | | | |
Actual Expenses per $1,000* | | $ | 7.30 | | | $ | 11.18 | | | $ | 6.00 | | | $ | — | |
Actual – Ending Balance | | $ | 1,101.80 | | | $ | 1,097.90 | | | $ | 1,103.40 | | | $ | — | |
| | | | |
Hypothetical Expenses per $1,000* | | $ | 7.00 | | | $ | 10.74 | | | $ | 5.76 | | | $ | — | |
Hypothetical – Ending Value | | $ | 1,017.85 | | | $ | 1,014.13 | | | $ | 1,019.09 | | | $ | — | |
| | | | |
Annualized expense ratio(2) | | | 1.40% | | | | 2.15% | | | | 1.15% | | | | — | |
| CALAMOS GLOBAL GROWTH AND INCOME FUND | | | | | | | | | | | | | | | | |
Actual Expenses per $1,000* | | $ | 7.86 | | | $ | 11.80 | | | $ | 6.63 | | | $ | — | |
Actual – Ending Balance | | $ | 1,072.30 | | | $ | 1,068.60 | | | $ | 1,073.70 | | | $ | — | |
| | | | |
Hypothetical Expenses per $1,000* | | $ | 7.65 | | | $ | 11.48 | | | $ | 6.46 | | | $ | — | |
Hypothetical – Ending Value | | $ | 1,017.21 | | | $ | 1,013.39 | | | $ | 1,018.40 | | | $ | — | |
| | | | |
Annualized expense ratio | | | 1.53% | | | | 2.30% | | | | 1.29% | | | | — | |
| * | Expenses for all Fund Classes A, C, and I (and R6 for International Growth Fund) are equal to the Fund’s annualized expense ratio, multiplied by the average account value over the period, multiplied by 181/365. |
| (2) | Annualized Expense Ratios for Opportunistic Value Fund, International Growth Fund, Emerging Market Equity Fund, and Global Equity Fund are adjusted to reflect fee waiver. |
Expense Example
The actual and hypothetical examples shown assume a $1,000 investment at the beginning of the period, November 1, 2018 and held through April 30, 2019.
| | | | | | | | | | | | | | | | |
| | | CLASS A
SHARES | | | CLASS C
SHARES | | | CLASS I
SHARES | | | CLASS R6
SHARES | |
| CALAMOS TOTAL RETURN BOND FUND | | | | | | | | | | | | | | | | |
Actual Expenses per $1,000* | | $ | 4.57 | | | $ | 8.37 | | | $ | 3.31 | | | $ | — | |
Actual – Ending Balance | | $ | 1,050.10 | | | $ | 1,046.20 | | | $ | 1,051.40 | | | $ | — | |
| | | | |
Hypothetical Expenses per $1,000* | | $ | 4.51 | | | $ | 8.25 | | | $ | 3.26 | | | $ | — | |
Hypothetical – Ending Value | | $ | 1,020.33 | | | $ | 1,016.61 | | | $ | 1,021.57 | | | $ | — | |
| | | | |
Annualized expense ratio(2) | | | 0.90% | | | | 1.65% | | | | 0.65% | | | | — | |
| CALAMOS HIGH INCOME OPPORTUNITIES FUND | | | | | | | | | | | | | | | | |
Actual Expenses per $1,000* | | $ | 5.07 | | | $ | 8.87 | | | $ | 3.81 | | | $ | — | |
Actual – Ending Balance | | $ | 1,046.50 | | | $ | 1,043.30 | | | $ | 1,047.70 | | | $ | — | |
| | | | |
Hypothetical Expenses per $1,000* | | $ | 5.01 | | | $ | 8.75 | | | $ | 3.76 | | | $ | — | |
Hypothetical – Ending Value | | $ | 1,019.84 | | | $ | 1,016.12 | | | $ | 1,021.08 | | | $ | — | |
| | | | |
Annualized expense ratio(2) | | | 1.00% | | | | 1.75% | | | | 0.75% | | | | — | |
| CALAMOS SHORT-TERM BOND FUND | | | | | | | | | | | | | | | | |
Actual Expenses per $1,000* | | $ | 3.26 | | | $ | — | | | $ | 2.01 | | | $ | — | |
Actual – Ending Balance | | $ | 1,023.40 | | | $ | — | | | $ | 1,024.60 | | | $ | — | |
| | | | |
Hypothetical Expenses per $1,000* | | $ | 3.26 | | | $ | — | | | $ | 2.01 | | | $ | — | |
Hypothetical – Ending Value | | $ | 1,021.57 | | | $ | — | | | $ | 1,022.81 | | | $ | — | |
| | | | |
Annualized expense ratio(2) | | | 0.65% | | | | — | | | | 0.40% | | | | — | |
| * | Expenses for all Fund Classes A, C, and I are equal to the Fund’s annualized expense ratio, multiplied by the average account value over the period, multiplied by 181/365. |
| (2) | Annualized Expense Ratios for Total Return Bond Fund, High Income Opportunities Fund, and Short-Term Bond Fund are adjusted to reflect fee waiver. |
| | | | |
| 72 | | CALAMOS OPEN-END FAMILY OF FUNDS SEMIANNUAL REPORT | | |
Market Neutral Income Fund Schedule of Investments April 30, 2019 (Unaudited)
| | | | | | | | | | |
PRINCIPAL
AMOUNT | | | | | | | VALUE | |
|
| | CONVERTIBLE BONDS (42.9%) | |
| | | | | | Communication Services (2.6%) | | | | |
| | 12,000,000 | | | | | Bilibili, Inc.*^
1.375%, 04/01/26 | | $ | 11,825,700 | |
| | | |
| | 7,000,000 | | | | | Boingo Wireless, Inc.*
1.000%, 10/01/23 | | | 6,301,820 | |
| | | |
| | 1,000,000,000 | | | JPY | | CyberAgent, Inc.
0.000%, 02/19/25 | | | 9,647,471 | |
| | | |
| | 11,000,000 | | | | | Gannett Company, Inc.
4.750%, 04/15/24 | | | 11,386,760 | |
| | | |
| | | | | | iQIYI, Inc.*^ | | | | |
| | 20,000,000 | | | | | 2.000%, 04/01/25 | | | 20,278,600 | |
| | 10,000,000 | | | | | 3.750%, 12/01/23 | | | 11,452,350 | |
| | | |
| | 5,000,000 | | | | | Liberty Media Corp.*
2.250%, 12/01/48 | | | 5,647,275 | |
| | | |
| | 5,000,000 | | | | | Liberty Media Corp. / Liberty Formula One
1.000%, 01/30/23 | | | 6,001,000 | |
| | | |
| | 10,000,000 | | | | | Momo, Inc.*
1.250%, 07/01/25 | | | 9,366,150 | |
| | | |
| | 5,833,000 | | | | | Sea, Ltd.*
2.250%, 07/01/23 | | | 8,473,570 | |
| | | |
| | | | | | Twitter, Inc.~ | | | | |
| | 34,000,000 | | | | | 0.250%, 06/15/24* | | | 34,301,240 | |
| | 15,000,000 | | | | | 1.000%, 09/15/21 | | | 14,469,450 | |
| | | |
| | 13,000,000 | | | | | World Wrestling Entertainment, Inc.^~
3.375%, 12/15/23 | | | 44,785,260 | |
| | | |
| | 8,500,000 | | | | | Zillow Group, Inc.
2.000%, 12/01/21 | | | 8,624,737 | |
| | | | | | | | | | |
| | | | | | | | | 202,561,383 | |
| | | | | | | | | | |
| | | | | | Consumer Discretionary (6.3%) | | | | |
| | 30,000,000 | | | | | Booking Holdings, Inc.~
0.350%, 06/15/20 | | | 42,895,050 | |
| | | |
| | | | | | Chegg, Inc. | | | | |
| | 15,000,000 | | | | | 0.250%, 05/15/23~ | | | 21,557,550 | |
| | 12,500,000 | | | | | 0.125%, 03/15/25* | | | 11,976,000 | |
| | | |
| | 35,327,000 | | | | | Ctrip.com International, Ltd.^~
1.990%, 07/01/25 | | | 39,633,361 | |
| | | |
| | 16,000,000 | | | | | Etsy, Inc.^
0.000%, 03/01/23 | | | 31,931,440 | |
| | | |
| | 4,000,000 | | | | | GNC Holdings, Inc.
1.500%, 08/15/20 | | | 3,308,160 | |
| | | |
| | 12,500,000 | | | | | Guess, Inc.*^
2.000%, 04/15/24 | | | 13,072,312 | |
| | | |
| | 14,050,000 | | | | | LGI Homes, Inc.~
4.250%, 11/15/19 | | | 45,444,795 | |
| | | |
| | 25,000,000 | | | | | MercadoLibre, Inc.*^~
2.000%, 08/15/28 | | | 32,284,750 | |
| | | |
| | | | | | NIO, Inc. | | | | |
| | 25,000,000 | | | | | 4.500%, 02/01/24 | | | 19,968,750 | |
| | 5,000,000 | | | | | 4.500%, 02/01/24*~ | | | 3,843,750 | |
| | | |
| | 9,000,000 | | | | | Quotient Technology, Inc.
1.750%, 12/01/22 | | | 8,382,555 | |
| | | | | | | | | | |
PRINCIPAL
AMOUNT | | | | | | | VALUE | |
| | | |
| | 7,500,000 | | | | | RH
0.000%, 06/15/19 | | $ | 7,487,438 | |
| | | |
| | 5,250,000 | | | | | TAL Education Group~
2.500%, 05/15/19 | | | 46,282,294 | |
| | | |
| | | | | | Tesla, Inc.~ | | | | |
| | 45,000,000 | | | | | 2.375%, 03/15/22^ | | | 46,264,950 | |
| | 32,500,000 | | | | | 1.250%, 03/01/21 | | | 31,964,237 | |
| | | |
| | | | | | Wayfair, Inc.~ | | | | |
| | 25,000,000 | | | | | 1.125%, 11/01/24* | | | 38,967,125 | |
| | 12,500,000 | | | | | 0.375%, 09/01/22^ | | | 20,600,750 | |
| | | |
| | 2,000,000,000 | | | JPY | | Yamada Denki Company, Ltd.
0.000%, 06/28/19 | | | 18,485,839 | |
| | | | | | | | | | |
| | | | | | | | | 484,351,106 | |
| | | | | | | | | | |
| | | | | | Consumer Staples (0.8%) | | | | |
| | | |
| | 30,000,000 | | | | | Herbalife Nutrition, Ltd.^~
2.000%, 08/15/19 | | | 37,481,250 | |
| | | |
| | 15,000,000 | | | GBP | | J Sainsbury, PLC
1.250%, 11/21/19 | | | 19,555,505 | |
| | | | | | | | | | |
| | | | | | | | | 57,036,755 | |
| | | | | | | | | | |
| | | | | | Energy (0.6%) | | | | |
| | 15,000,000 | | | | | Chesapeake Energy Corp.^
5.500%, 09/15/26 | | | 13,659,375 | |
| | | |
| | 5,000,000 | | | | | Nabors Industries, Inc.
0.750%, 01/15/24 | | | 3,645,925 | |
| | | |
| | 5,000,000 | | | | | Oasis Petroleum, Inc.^~
2.625%, 09/15/23 | | | 4,781,500 | |
| | | |
| | 4,000,000 | | | | | Renewable Energy Group, Inc.
4.000%, 06/15/36 | | | 9,195,020 | |
| | | |
| | 4,000,000 | | | | | SEACOR Holdings, Inc.
3.250%, 05/15/30 | | | 3,691,400 | |
| | | |
| | 10,000,000 | | | | | Whiting Petroleum Corp.
1.250%, 04/01/20 | | | 9,723,300 | |
| | | | | | | | | | |
| | | | | | | | | 44,696,520 | |
| | | | | | | | | | |
| | | | | | Financials (2.3%) | | | | |
| | 5,000,000 | | | | | Apollo Commercial Real Estate Finance, Inc.
4.750%, 08/23/22 | | | 4,952,800 | |
| | | |
| | 21,120,000 | | | | | AXA, SA*~
7.250%, 05/15/21 | | | 23,111,194 | |
| | | |
| | 15,000,000 | | | EUR | | Credit Agricole, SA
0.000%, 10/03/19 | | | 12,821,072 | |
| | | |
| | 10,000,000 | | | | | Goldman Sachs BDC, Inc.
4.500%, 04/01/22 | | | 9,940,000 | |
| | | |
| | 5,000,000 | | | | | Heritage Insurance Holdings, Inc.
5.875%, 08/01/37 | | | 5,803,075 | |
| | | |
| | 5,000,000 | | | | | Hope Bancorp, Inc.*
2.000%, 05/15/38 | | | 4,529,000 | |
| | | |
| | 22,500,000 | | | | | IAC FinanceCo, Inc.*~
0.875%, 10/01/22 | | | 34,935,188 | |
| | | |
| | 25,000,000 | | | | | LendingTree, Inc.~
0.625%, 06/01/22 | | | 47,703,625 | |
| | | | | | |
| See accompanying Notes to Schedule of Investments | | www.calamos.com | | | 73 | |
Market Neutral Income Fund Schedule of Investments April 30, 2019 (Unaudited)
| | | | | | | | | | |
PRINCIPAL
AMOUNT | | | | | | | VALUE | |
| | | |
| | 5,000,000 | | | | | PRA Group, Inc.
3.500%, 06/01/23 | | $ | 4,620,625 | |
| | | |
| | | | | | Redwood Trust, Inc. | | | | |
| | 5,000,000 | | | | | 5.625%, 07/15/24 | | | 4,914,325 | |
| | 5,000,000 | | | | | 4.750%, 08/15/23 | | | 4,825,200 | |
| | | |
| | 1,500,000,000 | | | JPY | | SBI Holdings, Inc.
0.000%, 09/14/20 | | | 19,315,117 | |
| | | | | | | | | | |
| | | | | | | | | 177,471,221 | |
| | | | | | | | | | |
| | | | | | Health Care (6.6%) | | | | |
| | 5,000,000 | | | | | Allscripts Healthcare Solutions, Inc.~
1.250%, 07/01/20 | | | 4,913,850 | |
| | | |
| | 10,000,000 | | | | | AMAG Pharmaceuticals, Inc.~
3.250%, 06/01/22 | | | 8,462,800 | |
| | | |
| | 20,000,000 | | | EUR | | Bayer Capital Corp., BV
5.625%, 11/22/19 | | | 17,142,543 | |
| | | |
| | 10,000,000 | | | EUR | | Bayer, AG
0.050%, 06/15/20 | | | 11,190,433 | |
| | | |
| | 5,000,000 | | | | | CONMED Corp.*
2.625%, 02/01/24 | | | 5,500,775 | |
| | | |
| | 22,953,000 | | | | | DexCom, Inc.^~
0.750%, 05/15/22 | | | 31,358,618 | |
| | | |
| | 5,000,000 | | | | | Evolent Health, Inc.*~
1.500%, 10/15/25 | | | 4,097,500 | |
| | | |
| | 5,000,000 | | | | | Flexion Therapeutics, Inc.
3.375%, 05/01/24 | | | 4,228,675 | |
| | | |
| | 45,000,000 | | | | | Illumina, Inc.~
0.000%, 06/15/19 | | | 55,103,175 | |
| | | |
| | 2,500,000 | | | | | Immunomedics, Inc.
4.750%, 02/15/20 | | | 7,959,725 | |
| | | |
| | 17,000,000 | | | | | Innoviva, Inc.~
2.500%, 08/15/25 | | | 18,251,370 | |
| | | |
| | 13,333,000 | | | | | Insmed, Inc.
1.750%, 01/15/25 | | | 13,886,520 | |
| | | |
| | 25,000,000 | | | | | Insulet Corp.~
1.250%, 09/15/21 | | | 37,600,250 | |
| | | |
| | 5,000,000 | | | | | Intercept Pharmaceuticals, Inc.^
3.250%, 07/01/23 | | | 4,682,525 | |
| | | |
| | 3,000,000 | | | | | Invacare Corp.
4.500%, 06/01/22 | | | 2,502,015 | |
| | | |
| | 25,000,000 | | | | | Ionis Pharmaceuticals, Inc.~
1.000%, 11/15/21 | | | 32,147,875 | |
| | | |
| | 8,000,000 | | | | | Ironwood Pharmaceuticals, Inc.
2.250%, 06/15/22 | | | 8,887,040 | |
| | | |
| | 15,000,000 | | | | | Ligand Pharmaceuticals, Inc.*~
0.750%, 05/15/23 | | | 13,065,750 | |
| | | |
| | | | | | Medicines Company | | | | |
| | 12,500,000 | | | | | 2.750%, 07/15/23^ | | | 11,426,125 | |
| | 7,500,000 | | | | | 2.500%, 01/15/22~ | | | 8,170,350 | |
| | 4,000,000 | | | | | 3.500%, 01/15/24* | | | 5,736,220 | |
| | | |
| | 6,855,000 | | | | | Molina Healthcare, Inc.~
1.125%, 01/15/20 | | | 21,721,336 | |
| | | | | | | | | | |
PRINCIPAL
AMOUNT | | | | | | | VALUE | |
| | | |
| | 15,000,000 | | | | | Neurocrine Biosciences, Inc.~
2.250%, 05/15/24 | | $ | 18,168,900 | |
| | | |
| | 20,000,000 | | | | | NuVasive, Inc.
2.250%, 03/15/21 | | | 22,912,700 | |
| | | |
| | 5,000,000 | | | | | OPKO Health, Inc.
4.500%, 02/15/25 | | | 4,606,825 | |
| | | |
| | 5,000,000 | | | | | Pacira BioSciences, Inc.
2.375%, 04/01/22 | | | 5,009,675 | |
| | | |
| | 6,661,000 | | | | | Quidel Corp.~
3.250%, 12/15/20 | | | 13,763,424 | |
| | | |
| | 5,000,000 | | | | | Radius Health, Inc.
3.000%, 09/01/24 | | | 4,373,425 | |
| | | |
| | 3,500,000 | | | | | Retrophin, Inc.
2.500%, 09/15/25 | | | 3,123,295 | |
| | | |
| | 20,000,000 | | | | | Sarepta Therapeutics, Inc.~
1.500%, 11/15/24 | | | 35,183,200 | |
| | | |
| | 10,000,000 | | | | | Supernus Pharmaceuticals, Inc.^
0.625%, 04/01/23 | | | 10,103,600 | |
| | | |
| | 2,276,000 | | �� | | | Tabula Rasa HealthCare, Inc.*
1.750%, 02/15/26 | | | 2,374,221 | |
| | | |
| | | | | | Teladoc Health, Inc. | | | | |
| | 8,050,000 | | | | | 1.375%, 05/15/25*^ | | | 10,787,805 | |
| | 8,000,000 | | | | | 3.000%, 12/15/22~ | | | 12,163,280 | |
| | | |
| | 5,000,000 | | | | | Theravance Biopharma, Inc.~
3.250%, 11/01/23 | | | 4,985,475 | |
| | | |
| | 5,000,000 | | | | | Tilray, Inc.*^
5.000%, 10/01/23 | | | 4,145,000 | |
| | | |
| | 11,461,000 | | | | | Wright Medical Group, Inc.*^~
1.625%, 06/15/23 | | | 12,476,273 | |
| | | |
| | 10,000,000 | | | | | Wright Medical Group, NV~
2.250%, 11/15/21 | | | 14,786,900 | |
| | | | | | | | | | |
| | | | | | | | | 506,999,468 | |
| | | | | | | | | | |
| | | | | | Industrials (0.4%) | | | | |
| | 5,000,000 | | | | | Aerojet Rocketdyne Holdings, Inc.^~
2.250%, 12/15/23 | | | 7,167,350 | |
| | | |
| | 10,000,000 | | | | | Arconic, Inc.
1.625%, 10/15/19 | | | 9,963,350 | |
| | | |
| | 11,250,000 | | | | | FTI Consulting, Inc.*
2.000%, 08/15/23 | | | 12,090,825 | |
| | | | | | | | | | |
| | | | | | | | | 29,221,525 | |
| | | | | | | | | | |
| | | | | | Information Technology (21.2%) | | | | |
| | 2,500,000 | | | | | 8x8, Inc.*
0.500%, 02/01/24 | | | 2,816,675 | |
| | | |
| | 38,500,000 | | | | | Advanced Micro Devices, Inc.~
2.125%, 09/01/26 | | | 136,010,297 | |
| | | |
| | 12,500,000 | | | | | Alteryx, Inc.*^~
0.500%, 06/01/23 | | | 26,101,250 | |
| | | |
| | 36,000,000 | | | | | Atlassian, Inc.*^~
0.625%, 05/01/23 | | | 53,307,180 | |
| | | |
| | 5,000,000 | | | | | Avaya Holdings Corp.*
2.250%, 06/15/23 | | | 4,894,450 | |
| | | | |
| 74 | | CALAMOS OPEN-END FAMILY OF FUNDS SEMIANNUAL REPORT | | See accompanying Notes to Schedule of Investments |
Market Neutral Income Fund Schedule of Investments April 30, 2019 (Unaudited)
| | | | | | | | | | |
PRINCIPAL
AMOUNT | | | | | | | VALUE | |
| | | |
| | 7,500,000 | | | | | Benefitfocus, Inc.*
1.250%, 12/15/23 | | $ | 7,785,750 | |
| | | |
| | 3,000,000 | | | | | CalAmp Corp.*
2.000%, 08/01/25 | | | 2,501,520 | |
| | | |
| | 7,000,000 | | | | | Carbonite, Inc.
2.500%, 04/01/22 | | | 8,180,865 | |
| | | |
| | 8,800,000 | | | | | Cardtronics, Inc.~
1.000%, 12/01/20 | | | 8,833,748 | |
| | | |
| | 11,000,000 | | | | | CSG Systems International, Inc.^
4.250%, 03/15/36 | | | 11,742,445 | |
| | | |
| | 20,000,000 | | | | | Cypress Semiconductor Corp.^~
4.500%, 01/15/22 | | | 27,910,900 | |
| | | |
| | 6,500,000 | | | | | DocuSign, Inc.*^
0.500%, 09/15/23 | | | 6,990,003 | |
| | | |
| | | | | | Electronics For Imaging, Inc. | | | | |
| | 10,500,000 | | | | | 0.750%, 09/01/19~ | | | 10,424,295 | |
| | 5,000,000 | | | | | 2.250%, 11/15/23* | | | 5,958,650 | |
| | | |
| | 10,000,000 | | | | | Envestnet, Inc.
1.750%, 12/15/19 | | | 11,766,100 | |
| | | |
| | 5,000,000 | | | | | Euronet Worldwide, Inc.~
1.500%, 10/01/44 | | | 10,225,550 | |
| | | |
| | | | | | FireEye, Inc. | | | | |
| | 15,000,000 | | | | | 0.875%, 06/01/24*^ | | | 15,113,025 | |
| | 5,000,000 | | | | | 1.000%, 06/01/35~ | | | 4,874,500 | |
| | | |
| | 17,000,000 | | | | | Five9, Inc.*~
0.125%, 05/01/23 | | | 24,066,305 | |
| | | |
| | 5,000,000 | | | | | GDS Holdings, Ltd.*^
2.000%, 06/01/25 | | | 5,056,575 | |
| | | |
| | 4,999,000 | | | | | Guidewire Software, Inc.
1.250%, 03/15/25 | | | 5,717,756 | |
| | | |
| | 26,500,000 | | | | | HubSpot, Inc.~
0.250%, 06/01/22 | | | 52,409,315 | |
| | | |
| | 5,000,000 | | | | | II-VI, Inc.
0.250%, 09/01/22 | | | 5,470,000 | |
| | | |
| | 15,000,000 | | | | | Infinera Corp.
2.125%, 09/01/24 | | | 11,795,625 | |
| | | |
| | 8,000,000 | | | | | Inphi Corp.
1.125%, 12/01/20 | | | 10,096,360 | |
| | | |
| | 15,000,000 | | | | | Intel Corp.~
3.250%, 08/01/39 | | | 37,510,125 | |
| | | |
| | 25,000,000 | | | | | j2 Global, Inc.^~
3.250%, 06/15/29 | | | 33,950,375 | |
| | | |
| | 7,500,000 | | | | | LivePerson, Inc.*
0.750%, 03/01/24 | | | 7,765,463 | |
| | | |
| | 13,500,000 | | | | | Lumentum Holdings, Inc.^
0.250%, 03/15/24 | | | 16,838,347 | |
| | | |
| | | | | | Microchip Technology, Inc. | | | | |
| | 20,000,000 | | | | | 1.625%, 02/15/25~ | | | 39,752,100 | |
| | 19,903,000 | | | | | 1.625%, 02/15/27^~ | | | 25,814,689 | |
| | 7,500,000 | | | | | 2.250%, 02/15/37 | | | 9,888,712 | |
| | | |
| | 23,975,000 | | | | | Micron Technology, Inc.~
3.125%, 05/01/32 | | | 101,373,492 | |
| | | |
| | 15,000,000 | | | | | MongoDB, Inc.*~
0.750%, 06/15/24 | | | 31,947,000 | |
| | | | | | | | | | |
PRINCIPAL
AMOUNT | | | | | | | VALUE | |
| | | |
| | 20,000,000 | | | | | New Relic, Inc.*^
0.500%, 05/01/23 | | $ | 23,322,200 | |
| | | |
| | 15,000,000 | | | | | Nice Systems, Inc.^~
1.250%, 01/15/24 | | | 25,450,800 | |
| | | |
| | 12,229,000 | | | | | Nuance Communications, Inc.~
1.000%, 12/15/35 | | | 11,408,679 | |
| | | |
| | 11,500,000 | | | | | Nutanix, Inc.^
0.000%, 01/15/23 | | | 13,145,995 | |
| | | |
| | 15,000,000 | | | | | NXP Semiconductors, NV^~
1.000%, 12/01/19 | | | 16,589,250 | |
| | | |
| | 17,500,000 | | | | | Okta, Inc.^
0.250%, 02/15/23 | | | 38,813,075 | |
| | | |
| | 25,000,000 | | | | | ON Semiconductor Corp.~
1.625%, 10/15/23 | | | 32,903,000 | |
| | | |
| | 10,000,000 | | | | | OSI Systems, Inc.^
1.250%, 09/01/22 | | | 10,375,300 | |
| | | |
| | | | | | Palo Alto Networks, Inc.~ | | | | |
| | 30,000,000 | | | | | 0.750%, 07/01/23* | | | 34,011,300 | |
| | 23,425,000 | | | | | 0.000%, 07/01/19 | | | 52,793,040 | |
| | | |
| | 7,148,000 | | | | | Pluralsight, Inc.*
0.375%, 03/01/24 | | | 8,172,130 | |
| | | |
| | 10,000,000 | | | | | Pure Storage, Inc.^
0.125%, 04/15/23 | | | 11,073,700 | |
| | | |
| | 15,000,000 | | | | | Q2 Holdings, Inc.
0.750%, 02/15/23 | | | 21,058,350 | |
| | | |
| | 20,000,000 | | | | | RealPage, Inc.~
1.500%, 11/15/22 | | | 32,694,700 | |
| | | |
| | 10,000,000 | | | | | Red Hat, Inc.~
0.250%, 10/01/19 | | | 24,753,550 | |
| | | |
| | 23,000,000 | | | | | RingCentral, Inc.^~
0.000%, 03/15/23 | | | 34,814,295 | |
| | | |
| | 7,500,000 | | | | | Rovi Corp.
0.500%, 03/01/20 | | | 7,294,350 | |
| | | |
| | 40,000,000 | | | | | ServiceNow, Inc.^~
0.000%, 06/01/22 | | | 80,996,800 | |
| | | |
| | 15,000,000 | | | | | Silicon Laboratories, Inc.~
1.375%, 03/01/22 | | | 19,107,825 | |
| | | |
| | | | | | Splunk, Inc.*~ | | | | |
| | 25,000,000 | | | | | 1.125%, 09/15/25 | | | 29,021,000 | |
| | 25,000,000 | | | | | 0.500%, 09/15/23 | | | 28,443,750 | |
| | | |
| | | | | | Square, Inc.~ | | | | |
| | 25,000,000 | | | | | 0.375%, 03/01/22 | | | 79,753,000 | |
| | 20,000,000 | | | | | 0.500%, 05/15/23*^ | | | 23,798,900 | |
| | | |
| | 12,500,000 | | | | | Synaptics, Inc.
0.500%, 06/15/22 | | | 11,419,062 | |
| | | |
| | 5,000,000 | | | | | Teradyne, Inc.^
1.250%, 12/15/23 | | | 8,187,900 | |
| | | |
| | 15,000,000 | | | | | TTM Technologies, Inc.~
1.750%, 12/15/20 | | | 21,588,075 | |
| | | |
| | 15,000,000 | | | | | Twilio, Inc.*^~
0.250%, 06/01/23 | | | 30,262,950 | |
| | | |
| | 6,000,000 | | | | | Viavi Solutions, Inc.^~
1.000%, 03/01/24 | | | 7,023,000 | |
| | | | | | |
| See accompanying Notes to Schedule of Investments | | www.calamos.com | | | 75 | |
Market Neutral Income Fund Schedule of Investments April 30, 2019 (Unaudited)
| | | | | | | | | | |
PRINCIPAL
AMOUNT | | | | | | | VALUE | |
| | | |
| | 10,000,000 | | | | | Vishay Intertechnology, Inc.*^
2.250%, 06/15/25 | | $ | 9,596,300 | |
| | | |
| | 20,000,000 | | | | | Weibo Corp.^
1.250%, 11/15/22 | | | 19,076,900 | |
| | | |
| | 9,500,000 | | | | | Wix.com, Ltd.*^
0.000%, 07/01/23 | | | 11,161,930 | |
| | | |
| | | | | | Workday, Inc.~ | | | | |
| | 20,000,000 | | | | | 0.250%, 10/01/22 | | | 29,695,700 | |
| | 12,500,000 | | | | | 1.500%, 07/15/20^ | | | 31,584,000 | |
| | | |
| | 10,000,000 | | | | | Zendesk, Inc.
0.250%, 03/15/23 | | | 15,110,000 | |
| | | | | | | | | | |
| | | | | | | | | 1,629,390,248 | |
| | | | | | | | | | |
| | | | | | Materials (0.9%) | |
| | 20,000,000 | | | | | Allegheny Technologies, Inc.~
4.750%, 07/01/22 | | | 37,726,800 | |
| | | |
| | 3,000,000 | | | | | Pretium Resources, Inc.
2.250%, 03/15/22 | | | 2,768,715 | |
| | | |
| | 5,000,000 | | | | | SSR Mining, Inc.*
2.500%, 04/01/39 | | | 4,826,425 | |
| | | |
| | 5,000,000 | | | | | TimkenSteel Corp.
6.000%, 06/01/21 | | | 5,723,300 | |
| | | |
| | 10,000,000 | | | GBP | | Volcan Holdings, PLC
4.125%, 04/11/20 | | | 19,610,665 | |
| | | | | | | | | | |
| | | | | | | | | 70,655,905 | |
| | | | | | | | | | |
| | | | | | Real Estate (1.1%) | |
| | 40,000,000 | | | | | Extra Space Storage, LP*^~
3.125%, 10/01/35 | | | 46,803,800 | |
| | | |
| | 6,000,000 | | | | | Forestar Group, Inc.
3.750%, 03/01/20 | | | 6,018,420 | |
| | | |
| | | | | | IH Merger Sub, LLC | | | | |
| | 13,500,000 | | | | | 3.000%, 07/01/19~ | | | 18,216,967 | |
| | 7,700,000 | | | | | 3.500%, 01/15/22 | | | 8,943,358 | |
| | | |
| | 5,000,000 | | | | | iStar, Inc.
3.125%, 09/15/22 | | | 4,640,225 | |
| | | | | | | | | | |
| | | | | | | | | 84,622,770 | |
| | | | | | | | | | |
| | | | | | Utilities (0.1%) | |
| | | | | | Chugoku Electric Power Company, Inc. | | | | |
| | 500,000,000 | | | JPY | | 0.000%, 01/24/20 | | | 4,548,207 | |
| | 500,000,000 | | | JPY | | 0.000%, 01/25/22 | | | 4,748,866 | |
| | | | | | | | | | |
| | | | | | | | | 9,297,073 | |
| | | | | | | | | | |
| | | |
| | | | | | TOTAL CONVERTIBLE BONDS
(Cost $2,854,740,785) | | | 3,296,303,974 | |
| | | | | | | | | | |
| | | | | | | | | | |
|
| | U.S. GOVERNMENT AND AGENCY SECURITIES (0.6%) | |
| | | | | | United States Treasury Note | | | | |
| | 25,000,000 | | | | | 2.875%, 10/31/20 | | | 25,205,442 | |
| | 25,000,000 | | | | | 2.375%, 04/30/20 | | | 24,995,705 | |
| | | | | | | | | | |
| | | |
| | | | | | TOTAL U.S. GOVERNMENT AND AGENCY SECURITIES
(Cost $49,883,496) | | | 50,201,147 | |
| | | | | | | | | | |
| | | | | | | | | | |
NUMBER OF SHARES | | | | | | | VALUE | |
|
| | CONVERTIBLE PREFERRED STOCKS (5.6%) | |
| | | | | | Communication Services (1.3%) | |
| | 500,000 | | | | | Alibaba Exchangeable (Softbank)*§
5.750%, 06/01/19 | | $ | 103,789,500 | |
| | | | | | | | | | |
| | | | | | Consumer Staples (0.1%) | |
| | 100,000 | | | | | Energizer Holdings, Inc.
7.500%, 01/15/22 | | | 10,250,000 | |
| | | | | | | | | | |
| | | | | | Financials (0.8%) | |
| | 250,000 | | | | | 2017 Mandatory Exchangeable Trust*
5.188%, 12/01/20 | | | 40,440,000 | |
| | | |
| | 122,820 | | | | | Assurant, Inc.
6.500%, 03/15/21 | | | 12,774,508 | |
| | | |
| | 50,000 | | | | | Virtus Investment Partners, Inc.
7.250%, 02/01/20 | | | 5,160,500 | |
| | | | | | | | | | |
| | | | | | | | | 58,375,008 | |
| | | | | | | | | | |
| | | | | | Health Care (0.4%) | |
| | 514,735 | | | | | Becton Dickinson and Company~
6.125%, 05/01/20 | | | 30,631,880 | |
| | | | | | | | | | |
| | | | | | Industrials (0.8%) | |
| | 230,000 | | | | | Colfax Corp.
5.750%, 01/15/22 | | | 30,833,800 | |
| | | |
| | 10,500 | | | | | Fortive Corp.
5.000%, 07/01/21 | | | 11,334,120 | |
| | | |
| | 300,000 | | | | | Rexnord Corp.
5.750%, 11/15/19 | | | 17,595,000 | |
| | | | | | | | | | |
| | | | | | | | | 59,762,920 | |
| | | | | | | | | | |
| | | | | | Information Technology (0.2%) | |
| | 65,000 | | | | | Belden, Inc.^~
6.750%, 07/15/19 | | | 4,880,850 | |
| | | |
| | 100,000 | | | | | MTS Systems Corp.
8.750%, 07/01/19 | | | 11,623,900 | |
| | | | | | | | | | |
| | | | | | | | | 16,504,750 | |
| | | | | | | | | | |
| | | | | | Materials (0.2%) | |
| | 242,647 | | | | | International Flavors & Fragrances, Inc.
6.000%, 09/15/21 | | | 12,721,982 | |
| | | | | | | | | | |
| | | | | | Real Estate (0.2%) | |
| | 12,856 | | | | | Crown Castle International Corp.
6.875%, 08/01/20 | | | 14,835,696 | |
| | | | | | | | | | |
| | | | | | Utilities (1.6%) | |
| | 99,780 | | | | | American Electric Power Company, Inc.
6.125%, 03/15/22 | | | 5,186,564 | |
| | | |
| | 308,881 | | | | | Aqua America, Inc.
6.000% | | | 16,858,725 | |
| | | | |
| 76 | | CALAMOS OPEN-END FAMILY OF FUNDS SEMIANNUAL REPORT | | See accompanying Notes to Schedule of Investments |
Market Neutral Income Fund Schedule of Investments April 30, 2019 (Unaudited)
| | | | | | | | | | |
NUMBER OF SHARES | | | | | | | VALUE | |
| | | |
| | 400,000 | | | | | CenterPoint Energy, Inc.^
7.000%, 09/01/21 | | $ | 21,296,000 | |
| | | |
| | 60,597 | | | | | Dominion Energy, Inc.
6.750%, 08/15/19 | | | 3,043,787 | |
| | | |
| | 330,000 | | | | | DTE Energy Company
6.500%, 10/01/19 | | | 18,417,300 | |
| | | |
| | | | | | Sempra Energy | | | | |
| | 147,059 | | | | | 6.000%, 01/15/21 | | | 15,719,137 | |
| | 135,000 | | | | | 6.750%, 07/15/21 | | | 14,516,550 | |
| | | |
| | 88,235 | | | | | South Jersey Industries, Inc.
7.250%, 04/15/21 | | | 4,555,573 | |
| | | |
| | 250,000 | | | | | Vistra Energy Corp.~
7.000%, 07/01/19 | | | 25,160,000 | |
| | | | | | | | | | |
| | | | | | | | | 124,753,636 | |
| | | | | | | | | | |
| | | |
| | | | | | TOTAL CONVERTIBLE PREFERRED STOCKS
(Cost $340,985,480) | | | 431,625,372 | |
| | | | | | | | | | |
| | | | | | | | | | |
|
| | COMMON STOCKS (50.7%) | |
| | | | | | Communication Services (5.2%) | |
| | 107,449 | | | | | Activision Blizzard, Inc. | | | 5,180,116 | |
| | | |
| | 45,744 | | | | | Alphabet, Inc. - Class A~# | | | 54,845,226 | |
| | | |
| | 47,349 | | | | | Alphabet, Inc. - Class C~# | | | 56,273,340 | |
| | | |
| | 1,153,941 | | | | | AT&T, Inc.~ | | | 35,726,013 | |
| | | |
| | 30,922 | | | | | Charter Communications, Inc. - Class A# | | | 11,477,937 | |
| | | |
| | 762,792 | | | | | Comcast Corp. - Class A~ | | | 33,204,336 | |
| | | |
| | 459,416 | | | | | Facebook, Inc. - Class A~# | | | 88,851,055 | |
| | | |
| | 131,815 | | | | | Fox Corp. - Class A# | | | 5,139,467 | |
| | | |
| | 67,193 | | | | | Netflix, Inc.# | | | 24,897,694 | |
| | | |
| | 126,045 | | | | | Twitter, Inc.# | | | 5,030,456 | |
| | | |
| | 678,822 | | | | | Verizon Communications, Inc.~ | | | 38,821,830 | |
| | | |
| | 297,955 | | | | | Walt Disney Company~ | | | 40,810,896 | |
| | | | | | | | | | |
| | | | | | | | | 400,258,366 | |
| | | | | | | | | | |
| | | | | | Consumer Discretionary (5.3%) | |
| | 67,562 | | | | | Amazon.com, Inc.~# | | | 130,159,544 | |
| | | |
| | 106,686 | | | | | Aptiv, PLC | | | 9,142,990 | |
| | | |
| | 6,106 | | | | | Booking Holdings, Inc.~# | | | 11,326,569 | |
| | | |
| | 91,087 | | | | | Carnival Corp.^~ | | | 4,997,033 | |
| | | |
| | 141,565 | | | | | D.R. Horton, Inc.~ | | | 6,272,745 | |
| | | |
| | 46,600 | | | | | Darden Restaurants, Inc.~ | | | 5,480,160 | |
| | | |
| | 69,709 | | | | | Dollar General Corp.~ | | | 8,789,608 | |
| | | |
| | 162,960 | | | | | eBay, Inc. | | | 6,314,700 | |
| | | |
| | 64,237 | | | | | Expedia Group, Inc. | | | 8,340,532 | |
| | | |
| | 632,914 | | | | | Ford Motor Company~ | | | 6,613,951 | |
| | | |
| | 168,595 | | | | | General Motors Company | | | 6,566,775 | |
| | | |
| | 194,685 | | | | | Home Depot, Inc.~ | | | 39,657,335 | |
| | | |
| | 95,586 | | | | | Leggett & Platt, Inc.^ | | | 3,762,265 | |
| | | |
| | 160,211 | | | | | Lowe’s Companies, Inc.~ | | | 18,126,273 | |
| | | | | | | | | | |
NUMBER OF SHARES | | | | | | | VALUE | |
| | | |
| | 157,571 | | | | | McDonald’s Corp. | | $ | 31,131,302 | |
| | | |
| | 276,674 | | | | | MGM Resorts International | | | 7,367,829 | |
| | | |
| | 38,602 | | | | | Mohawk Industries, Inc.~# | | | 5,259,523 | |
| | | |
| | 210,694 | | | | | Nike, Inc. - Class B~ | | | 18,505,254 | |
| | | |
| | 19,163 | | | | | O’Reilly Automotive, Inc.# | | | 7,254,537 | |
| | | |
| | 38,515 | | | | | PVH Corp.~ | | | 4,968,050 | |
| | | |
| | 80,468 | | | | | Ross Stores, Inc.~ | | | 7,858,505 | |
| | | |
| | 83,859 | | | | | Royal Caribbean Cruises, Ltd. | | | 10,141,907 | |
| | | |
| | 195,435 | | | | | Starbucks Corp.~ | | | 15,181,391 | |
| | | |
| | 120,867 | | | | | Target Corp.~ | | | 9,357,523 | |
| | | |
| | 251,543 | | | | | TJX Companies, Inc.~ | | | 13,804,680 | |
| | | |
| | 14,432 | | | | | Ulta Salon Cosmetics & Fragrance, Inc.# | | | 5,036,479 | |
| | | |
| | 84,902 | | | | | VF Corp. | | | 8,015,598 | |
| | | | | | | | | | |
| | | | | | | | | 409,433,058 | |
| | | | | | | | | | |
| | | | | | Consumer Staples (3.7%) | |
| | 327,591 | | | | | Altria Group, Inc.~ | | | 17,798,019 | |
| | | |
| | 133,247 | | | | | Archer-Daniels-Midland Company~ | | | 5,942,816 | |
| | | |
| | 85,635 | | | | | Church & Dwight Company, Inc. | | | 6,418,343 | |
| | | |
| | 585,881 | | | | | Coca-Cola Company | | | 28,743,322 | |
| | | |
| | 132,038 | | | | | Colgate-Palmolive Company~ | | | 9,611,046 | |
| | | |
| | 27,337 | | | | | Constellation Brands, Inc. - Class A^ | | | 5,786,423 | |
| | | |
| | 52,438 | | | | | Costco Wholesale Corp.~ | | | 12,875,102 | |
| | | |
| | 144,418 | | | | | General Mills, Inc. | | | 7,433,195 | |
| | | |
| | 106,444 | | | | | Kellogg Company^~ | | | 6,418,573 | |
| | | |
| | 79,334 | | | | | Kimberly-Clark Corp. | | | 10,184,899 | |
| | | |
| | 183,470 | | | | | Kraft Heinz Company^ | | | 6,098,543 | |
| | | |
| | 190,162 | | | | | Kroger Company | | | 4,902,376 | |
| | | |
| | 306,416 | | | | | Mondelez International, Inc. - Class A | | | 15,581,254 | |
| | | |
| | 82,437 | | | | | Monster Beverage Corp.# | | | 4,913,245 | |
| | | |
| | 221,136 | | | | | PepsiCo, Inc.~ | | | 28,316,465 | |
| | | |
| | 328,047 | | | | | Philip Morris International, Inc.~ | | | 28,395,748 | |
| | | |
| | 394,982 | | | | | Procter & Gamble Company | | | 42,057,683 | |
| | | |
| | 110,169 | | | | | Sysco Corp. | | | 7,752,593 | |
| | | |
| | 133,974 | | | | | Walgreens Boots Alliance, Inc. | | | 7,176,987 | |
| | | |
| | 290,729 | | | | | Walmart, Inc.~ | | | 29,898,570 | |
| | | | | | | | | | |
| | | | | | | | | 286,305,202 | |
| | | | | | | | | | |
| | | | | | Energy (2.8%) | | | | |
| | 60,000 | | | | | Anadarko Petroleum Corp.~ | | | 4,371,000 | |
| | | |
| | 331,818 | | | | | Chevron Corp.~ | | | 39,838,069 | |
| | | |
| | 71,610 | | | | | Concho Resources, Inc.~ | | | 8,262,362 | |
| | | |
| | 237,600 | | | | | ConocoPhillips~ | | | 14,997,312 | |
| | | |
| | 65,294 | | | | | EOG Resources, Inc.~ | | | 6,271,489 | |
| | | |
| | 575,125 | | | | | Exxon Mobil Corp.~ | | | 46,171,035 | |
| | | |
| | 324,627 | | | | | Halliburton Company | | | 9,196,683 | |
| | | | | | |
| See accompanying Notes to Schedule of Investments | | www.calamos.com | | | 77 | |
Market Neutral Income Fund Schedule of Investments April 30, 2019 (Unaudited)
| | | | | | | | | | |
NUMBER OF SHARES | | | | | | | VALUE | |
| | | |
| | 101,109 | | | | | Hess Corp.^ | | $ | 6,483,109 | |
| | | |
| | 451,894 | | | | | Kinder Morgan, Inc.^ | | | 8,979,134 | |
| | | |
| | 167,359 | | | | | Marathon Petroleum Corp. | | | 10,187,142 | |
| | | |
| | 122,645 | | | | | Occidental Petroleum Corp. | | | 7,221,337 | |
| | | |
| | 90,588 | | | | | ONEOK, Inc. | | | 6,153,643 | |
| | | |
| | 63,581 | | | | | Phillips 66~ | | | 5,993,781 | |
| | | |
| | 81,484 | | | | | Pioneer Natural Resources Company | | | 13,563,827 | |
| | | |
| | 307,151 | | | | | Schlumberger, Ltd. | | | 13,109,205 | |
| | | |
| | 61,513 | | | | | Valero Energy Corp.~ | | | 5,576,768 | |
| | | |
| | 228,007 | | | | | Williams Companies, Inc. | | | 6,459,438 | |
| | | | | | | | | | |
| | | | | | | | | 212,835,334 | |
| | | | | | | | | | |
| | | | | | Financials (6.7%) | | | | |
| | 37,797 | | | | | Affiliated Managers Group, Inc. | | | 4,192,443 | |
| | | |
| | 112,322 | | | | | Aflac, Inc.~ | | | 5,658,782 | |
| | | |
| | 87,629 | | | | | Allstate Corp.~ | | | 8,680,529 | |
| | | |
| | 101,259 | | | | | American Express Company~ | | | 11,870,593 | |
| | | |
| | 320,406 | | | | | American International Group, Inc.~ | | | 15,241,713 | |
| | | |
| | 78,334 | | | | | Arthur J. Gallagher & Company | | | 6,550,289 | |
| | | |
| | 65,862 | | | | | Assurant, Inc. | | | 6,256,890 | |
| | | |
| | 1,780,807 | | | | | Bank of America Corp.~ | | | 54,457,078 | |
| | | |
| | 163,522 | | | | | Bank of New York Mellon Corp. | | | 8,120,503 | |
| | | |
| | 139,039 | | | | | BB&T Corp.^~ | | | 7,118,797 | |
| | | |
| | 289,619 | | | | | Berkshire Hathaway, Inc. - Class B~# | | | 62,763,333 | |
| | | |
| | 16,966 | | | | | BlackRock, Inc.~ | | | 8,232,582 | |
| | | |
| | 227,045 | | | | | Capital One Financial Corp.~ | | | 21,076,587 | |
| | | |
| | 112,700 | | | | | Cboe Global Markets, Inc. | | | 11,451,447 | |
| | | |
| | 123,819 | | | | | Charles Schwab Corp.~ | | | 5,668,434 | |
| | | |
| | 73,140 | | | | | Chubb, Ltd.~ | | | 10,619,928 | |
| | | |
| | 305,620 | | | | | Citigroup, Inc.~ | | | 21,607,334 | |
| | | |
| | 35,285 | | | | | CME Group, Inc. | | | 6,312,487 | |
| | | |
| | 77,460 | | | | | Discover Financial Services | | | 6,312,215 | |
| | | |
| | 204,120 | | | | | E*TRADE Financial Corp. | | | 10,340,719 | |
| | | |
| | 81,243 | | | | | First Republic Bank | | | 8,580,886 | |
| | | |
| | 95,121 | | | | | Goldman Sachs Group, Inc.~ | | | 19,587,316 | |
| | | |
| | 581,890 | | | | | JPMorgan Chase & Company~ | | | 67,528,335 | |
| | | |
| | 121,090 | | | | | Marsh & McLennan Companies, Inc. | | | 11,417,576 | |
| | | |
| | 131,934 | | | | | MetLife, Inc.~ | | | 6,086,115 | |
| | | |
| | 101,937 | | | | | Morgan Stanley~ | | | 4,918,460 | |
| | | |
| | 71,847 | | | | | PNC Financial Services Group, Inc.~ | | | 9,838,010 | |
| | | |
| | 52,539 | | | | | Prudential Financial, Inc.~ | | | 5,553,898 | |
| | | |
| | 45,607 | | | | | S&P Global, Inc. | | | 10,063,641 | |
| | | |
| | 66,028 | | | | | State Street Corp.~ | | | 4,467,454 | |
| | | |
| | 91,127 | | | | | SunTrust Banks, Inc.~ | | | 5,966,996 | |
| | | | | | | | | | |
NUMBER OF SHARES | | | | | | | VALUE | |
| | | |
| | 58,563 | | | | | Travelers Companies, Inc.~ | | $ | 8,418,431 | |
| | | |
| | 353,973 | | | | | US Bancorp | | | 18,873,840 | |
| | | |
| | 581,402 | | | | | Wells Fargo & Company~ | | | 28,145,671 | |
| | | |
| | 210,736 | | | | | Zions Bancorporation, N.A. ^ | | | 10,395,607 | |
| | | | | | | | | | |
| | | | | | | | | 512,374,919 | |
| | | | | | | | | | |
| | | | | | Health Care (7.0%) | | | | |
| | 227,201 | | | | | Abbott Laboratories~ | | | 18,076,112 | |
| | | |
| | 236,248 | | | | | AbbVie, Inc.~ | | | 18,755,729 | |
| | | |
| | 192,796 | | | | | Agilent Technologies, Inc. | | | 15,134,486 | |
| | | |
| | 115,711 | | | | | Alexion Pharmaceuticals, Inc.~# | | | 15,751,738 | |
| | | |
| | 54,223 | | | | | Allergan, PLC | | | 7,970,781 | |
| | | |
| | 63,887 | | | | | Amgen, Inc.~ | | | 11,456,217 | |
| | | |
| | 205,809 | | | | | Baxter International, Inc. | | | 15,703,227 | |
| | | |
| | 29,603 | | | | | Becton Dickinson and Company | | | 7,126,626 | |
| | | |
| | 33,253 | | | | | Biogen, Inc.~# | | | 7,622,918 | |
| | | |
| | 231,845 | | | | | Bristol-Myers Squibb Company~ | | | 10,764,563 | |
| | | |
| | 186,283 | | | | | Celgene Corp.# | | | 17,633,549 | |
| | | |
| | 44,024 | | | | | Cigna Corp. | | | 6,992,772 | |
| | | |
| | 194,467 | | | | | CVS Health Corp.~ | | | 10,575,115 | |
| | | |
| | 83,617 | | | | | Danaher Corp. | | | 11,074,235 | |
| | | |
| | 99,372 | | | | | Edwards Lifesciences Corp.~# | | | 17,496,428 | |
| | | |
| | 131,647 | | | | | Eli Lilly and Company | | | 15,407,965 | |
| | | |
| | 223,956 | | | | | Gilead Sciences, Inc. | | | 14,566,098 | |
| | | |
| | 44,485 | | | | | HCA Healthcare, Inc. | | | 5,659,827 | |
| | | |
| | 52,185 | | | | | Humana, Inc. | | | 13,328,571 | |
| | | |
| | 24,531 | | | | | Illumina, Inc.# | | | 7,653,672 | |
| | | |
| | 24,794 | | | | | Intuitive Surgical, Inc.# | | | 12,660,560 | |
| | | |
| | 418,135 | | | | | Johnson & Johnson~ | | | 59,040,662 | |
| | | |
| | 56,482 | | | | | Laboratory Corp. of America Holdings~# | | | 9,032,601 | |
| | | |
| | 41,016 | | | | | McKesson Corp. | | | 4,891,158 | |
| | | |
| | 341,147 | | | | | Medtronic, PLC | | | 30,297,265 | |
| | | |
| | 419,597 | | | | | Merck & Company, Inc. | | | 33,026,480 | |
| | | |
| | 883,175 | | | | | Pfizer, Inc.~ | | | 35,865,737 | |
| | | |
| | 53,389 | | | | | Quest Diagnostics, Inc.~ | | | 5,145,632 | |
| | | |
| | 10,844 | | | | | Regeneron Pharmaceuticals, Inc.~# | | | 3,721,010 | |
| | | |
| | 38,678 | | | | | Stryker Corp.~ | | | 7,306,661 | |
| | | |
| | 26,240 | | | | | Teleflex, Inc. | | | 7,509,363 | |
| | | |
| | 49,162 | | | | | Thermo Fisher Scientific, Inc.~ | | | 13,639,997 | |
| | | |
| | 186,951 | | | | | UnitedHealth Group, Inc.~ | | | 43,572,670 | |
| | | |
| | 35,269 | | | | | Vertex Pharmaceuticals, Inc.# | | | 5,959,756 | |
| | | |
| | 30,608 | | | | | WellCare Health Plans, Inc.# | | | 7,907,577 | |
| | | |
| | 41,821 | | | | | Zimmer Biomet Holdings, Inc. | | | 5,150,674 | |
| | | |
| | 53,924 | | | | | Zoetis, Inc. | | | 5,491,620 | |
| | | | | | | | | | |
| | | | | | | | | 538,970,052 | |
| | | | | | | | | | |
| | | | |
| 78 | | CALAMOS OPEN-END FAMILY OF FUNDS SEMIANNUAL REPORT | | See accompanying Notes to Schedule of Investments |
Market Neutral Income Fund Schedule of Investments April 30, 2019 (Unaudited)
| | | | | | | | | | |
NUMBER OF SHARES | | | | | | | VALUE | |
| | | | | | Industrials (4.8%) | | | | |
| | 88,154 | | | | | 3M Company | | $ | 16,706,065 | |
| | | |
| | 46,213 | | | | | Allegion, PLC | | | 4,585,716 | |
| | | |
| | 85,412 | | | | | Boeing Company~ | | | 32,259,258 | |
| | | |
| | 134,697 | | | | | Caterpillar, Inc.~ | | | 18,779,456 | |
| | | |
| | 221,527 | | | | | CSX Corp.~ | | | 17,640,195 | |
| | | |
| | 90,599 | | | | | Deere & Company | | | 15,005,912 | |
| | | |
| | 200,272 | | | | | Delta Air Lines, Inc.~ | | | 11,673,855 | |
| | | |
| | 67,239 | | | | | Eaton Corp., PLC | | | 5,568,734 | |
| | | |
| | 178,206 | | | | | Emerson Electric Company~ | | | 12,650,844 | |
| | | |
| | 33,692 | | | | | FedEx Corp. | | | 6,383,286 | |
| | | |
| | 97,129 | | | | | Fortune Brands Home & Security, Inc. | | | 5,126,469 | |
| | | |
| | 39,168 | | | | | General Dynamics Corp. | | | 7,000,105 | |
| | | |
| | 1,353,483 | | | | | General Electric Company | | | 13,764,922 | |
| | | |
| | 42,072 | | | | | Harris Corp.^ | | | 7,089,132 | |
| | | |
| | 139,354 | | | | | Honeywell International, Inc. | | | 24,196,035 | |
| | | |
| | 55,878 | | | | | Illinois Tool Works, Inc.~ | | | 8,696,293 | |
| | | |
| | 153,425 | | | | | Johnson Controls International, PLC | | | 5,753,438 | |
| | | |
| | 32,023 | | | | | Lockheed Martin Corp. | | | 10,674,227 | |
| | | |
| | 35,151 | | | | | Norfolk Southern Corp. | | | 7,171,507 | |
| | | |
| | 50,628 | | | | | Northrop Grumman Corp. | | | 14,677,564 | |
| | | |
| | 92,784 | | | | | PACCAR, Inc. | | | 6,649,829 | |
| | | |
| | 109,631 | | | | | Pentair, PLC | | | 4,274,513 | |
| | | |
| | 189,713 | | | | | Quanta Services, Inc. | | | 7,702,348 | |
| | | |
| | 79,983 | | | | | Raytheon Company | | | 14,204,181 | |
| | | |
| | 116,274 | | | | | Southwest Airlines Company~ | | | 6,305,539 | |
| | | |
| | 65,020 | | | | | Stanley Black & Decker, Inc. | | | 9,531,932 | |
| | | |
| | 124,135 | | | | | Union Pacific Corp.~ | | | 21,976,860 | |
| | | |
| | 106,378 | | | | | United Parcel Service, Inc. - Class B | | | 11,299,471 | |
| | | |
| | 117,945 | | | | | United Technologies Corp.~ | | | 16,820,136 | |
| | | |
| | 52,022 | | | | | Verisk Analytics, Inc. | | | 7,342,385 | |
| | | |
| | 22,501 | | | | | Wabtec Corp.^ | | | 1,666,649 | |
| | | |
| | 99,393 | | | | | Waste Management, Inc. | | | 10,668,845 | |
| | | |
| | 73,186 | | | | | Xylem, Inc.^ | | | 6,103,712 | |
| | | | | | | | | | |
| | | | | | | | | 369,949,413 | |
| | | | | | | | | | |
| | | | | | Information Technology (10.9%) | | | | |
| | 94,630 | | | | | Accenture, PLC - Class A~ | | | 17,286,062 | |
| | | |
| | 76,117 | | | | | Adobe, Inc.# | | | 22,016,842 | |
| | | |
| | 391,719 | | | | | Advanced Micro Devices, Inc.^# | | | 10,823,196 | |
| | | |
| | 67,739 | | | | | Amphenol Corp. - Class A~ | | | 6,744,095 | |
| | | |
| | 766,593 | | | | | Apple, Inc.~ | | | 153,832,217 | |
| | | |
| | 380,183 | | | | | Applied Materials, Inc.~ | | | 16,754,665 | |
| | | |
| | 44,654 | | | | | Autodesk, Inc.# | | | 7,957,789 | |
| | | |
| | 88,127 | | | | | Automatic Data Processing, Inc. | | | 14,487,198 | |
| | | |
| | 49,496 | | | | | Broadcom, Inc. | | | 15,759,526 | |
| | | | | | | | | | |
NUMBER OF SHARES | | | | | | | VALUE | |
| | | |
| | 870,606 | | | | | Cisco Systems, Inc.~ | | $ | 48,710,406 | |
| | | |
| | 57,803 | | | | | Citrix Systems, Inc. | | | 5,835,791 | |
| | | |
| | 114,599 | | | | | Cognizant Technology Solutions Corp. - Class A~ | | | 8,361,143 | |
| | | |
| | 104,106 | | | | | Fiserv, Inc.^# | | | 9,082,207 | |
| | | |
| | 89,640 | | | | | FLIR Systems, Inc. | | | 4,745,542 | |
| | | |
| | 38,699 | | | | | Gartner, Inc.# | | | 6,151,980 | |
| | | |
| | 223,008 | | | | | HP, Inc. | | | 4,449,010 | |
| | | |
| | 641,988 | | | | | Intel Corp.~ | | | 32,767,068 | |
| | | |
| | 105,934 | | | | | International Business Machines Corp. | | | 14,859,362 | |
| | | |
| | 44,371 | | | | | Intuit, Inc. | | | 11,139,783 | |
| | | |
| | 39,337 | | | | | Jack Henry & Associates, Inc. | | | 5,863,573 | |
| | | |
| | 44,002 | | | | | Lam Research Corp. | | | 9,127,335 | |
| | | |
| | 143,001 | | | | | MasterCard, Inc. - Class A | | | 36,356,574 | |
| | | |
| | 290,462 | | | | | Micron Technology, Inc.~# | | | 12,216,832 | |
| | | |
| | 1,207,894 | | | | | Microsoft Corp.~ | | | 157,750,956 | |
| | | |
| | 115,582 | | | | | NVIDIA Corp. | | | 20,920,342 | |
| | | |
| | 303,342 | | | | | Oracle Corp. | | | 16,783,913 | |
| | | |
| | 82,711 | | | | | Paychex, Inc. | | | 6,973,364 | |
| | | |
| | 165,623 | | | | | PayPal Holdings, Inc.# | | | 18,677,306 | |
| | | |
| | 190,779 | | | | | QUALCOMM, Inc. | | | 16,431,795 | |
| | | |
| | 40,299 | | | | | Red Hat, Inc.^~# | | | 7,355,776 | |
| | | |
| | 147,699 | | | | | Salesforce.com, Inc.# | | | 24,422,030 | |
| | | |
| | 57,428 | | | | | TE Connectivity, Ltd. | | | 5,492,988 | |
| | | |
| | 103,201 | | | | | Texas Instruments, Inc.~ | | | 12,160,174 | |
| | | |
| | 319,878 | | | | | Visa, Inc. - Class A^~ | | | 52,597,540 | |
| | | |
| | 265,765 | | | | | Western Union Company^ | | | 5,166,472 | |
| | | |
| | 116,758 | | | | | Xilinx, Inc. | | | 14,027,306 | |
| | | | | | | | | | |
| | | | | | | | | 834,088,158 | |
| | | | | | | | | | |
| | | | | | Materials (1.2%) | | | | |
| | 91,867 | | | | | Air Products & Chemicals, Inc.~ | | | 18,905,310 | |
| | | |
| | 42,841 | | | | | Avery Dennison Corp. | | | 4,740,357 | |
| | | |
| | 118,864 | | | | | Ball Corp. | | | 7,124,708 | |
| | | |
| | 149,327 | | | | | Dow, Inc.# | | | 8,471,321 | |
| | | |
| | 447,982 | | | | | DowDuPont, Inc. | | | 17,224,908 | |
| | | |
| | 409,175 | | | | | Freeport-McMoRan, Inc. | | | 5,036,944 | |
| | | |
| | 78,380 | | | | | Linde, PLC | | | 14,128,779 | |
| | | |
| | 64,522 | | | | | PPG Industries, Inc. | | | 7,581,335 | |
| | | |
| | 24,351 | | | | | Sherwin-Williams Company | | | 11,075,565 | |
| | | | | | | | | | |
| | | | | | | | | 94,289,227 | |
| | | | | | | | | | |
| | | | | | Real Estate (1.5%) | | | | |
| | 44,554 | | | | | Alexandria Real Estate Equities, Inc. | | | 6,344,044 | |
| | | |
| | 61,477 | | | | | American Tower Corp.~ | | | 12,006,458 | |
| | | |
| | 100,275 | | | | | Apartment Investment & Management Company - Class A | | | 4,949,574 | |
| | | | | | |
| See accompanying Notes to Schedule of Investments | | www.calamos.com | | | 79 | |
Market Neutral Income Fund Schedule of Investments April 30, 2019 (Unaudited)
| | | | | | | | | | |
NUMBER OF SHARES | | | | | | | VALUE | |
| | | |
| | 40,988 | | | | | AvalonBay Communities, Inc.~ | | $ | 8,235,719 | |
| | | |
| | 56,797 | | | | | Crown Castle International Corp. | | | 7,143,927 | |
| | | |
| | 48,631 | | | | | Digital Realty Trust, Inc.^ | | | 5,724,355 | |
| | | |
| | 11,778 | | | | | Equinix, Inc. | | | 5,355,457 | |
| | | |
| | 39,571 | | | | | Federal Realty Investment Trust | | | 5,296,578 | |
| | | |
| | 53,118 | | | | | Mid-America Apartment Communities, Inc. | | | 5,811,640 | |
| | | |
| | 83,482 | | | | | Prologis, Inc.~ | | | 6,400,565 | |
| | | |
| | 29,249 | | | | | Public Storage~ | | | 6,469,294 | |
| | | |
| | 101,405 | | | | | Realty Income Corp. | | | 7,099,364 | |
| | | |
| | 82,711 | | | | | Regency Centers Corp. | | | 5,555,698 | |
| | | |
| | 67,092 | | | | | Simon Property Group, Inc. | | | 11,653,881 | |
| | | |
| | 128,673 | | | | | UDR, Inc. | | | 5,783,851 | |
| | | |
| | 104,068 | | | | | Welltower, Inc. | | | 7,756,188 | |
| | | |
| | 198,753 | | | | | Weyerhaeuser Company | | | 5,326,580 | |
| | | | | | | | | | |
| | | | | | | | | 116,913,173 | |
| | | | | | | | | | |
| | | | | | Utilities (1.6%) | | | | |
| | 317,982 | | | | | AES Corp.~ | | | 5,443,852 | |
| | | |
| | 124,351 | | | | | American Electric Power Company, Inc.~ | | | 10,638,228 | |
| | | |
| | 115,453 | | | | | CMS Energy Corp.~ | | | 6,413,414 | |
| | | |
| | 96,665 | | | | | Consolidated Edison, Inc. | | | 8,328,656 | |
| | | |
| | 114,257 | | | | | Dominion Energy, Inc.~ | | | 8,897,193 | |
| | | |
| | 157,892 | | | | | Duke Energy Corp.~ | | | 14,387,119 | |
| | | |
| | 75,893 | | | | | Edison International | | | 4,839,697 | |
| | | |
| | 70,682 | | | | | Entergy Corp. | | | 6,849,086 | |
| | | |
| | 106,253 | | | | | Exelon Corp.~ | | | 5,413,590 | |
| | | |
| | 160,001 | | | | | FirstEnergy Corp.^~ | | | 6,724,842 | |
| | | |
| | 65,234 | | | | | NextEra Energy, Inc. | | | 12,684,099 | |
| | | |
| | 195,837 | | | | | NiSource, Inc.^ | | | 5,440,352 | |
| | | |
| | 122,939 | | | | | Public Service Enterprise Group, Inc.~ | | | 7,333,311 | |
| | | |
| | 175,739 | | | | | Southern Company | | | 9,352,830 | |
| | | |
| | 140,661 | | | | | Xcel Energy, Inc. | | | 7,947,346 | |
| | | | | | | | | | |
| | | | | | | | | 120,693,615 | |
| | | | | | | | | | |
| | | |
| | | | | | TOTAL COMMON STOCKS
(Cost $3,395,485,611) | | | 3,896,110,517 | |
| | | | | | | | | | |
| | | | | | | | | | |
|
| | EXCHANGE-TRADED FUND (1.0%) | |
| | | | | | Other (1.0%) | | | | |
| | 257,000 | | | | | SPDR S&P 500 ETF Trust^
(Cost $74,957,287) | | | 75,563,140 | |
| | | | | | | | | | |
| | | | | | | | | | |
|
| | INVESTMENTS IN AFFILIATED FUND (1.6%) | |
| | | | | | Other (1.6%) | | | | |
| | 11,969,156 | | | | | Calamos Short-Term Bond Fund - Class I
(Cost $120,000,000) | | | 120,649,094 | |
| | | | | | | | | | |
| | | | | | | | | | |
NUMBER OF
CONTRACTS/
NOTIONAL
AMOUNT | | | | | | | VALUE | |
|
| | PURCHASED OPTIONS (0.4%)# | |
| | | | | | Communication Services (0.0%) | | | | |
| 50
500,000,000 |
| | JPY | | CyberAgent, Inc.
Call, 02/17/23, Strike 95.44 | | $ | 455,586 | |
| | | |
| 1,430
13,534,950 |
| | | | Electronic Arts, Inc.
Call, 06/21/19, Strike $105.00 | | | 301,730 | |
| | | |
| 1,000
19,340,000 |
| | | | Facebook, Inc.
Put, 06/21/19, Strike $150.00 | | | 21,000 | |
| | | |
| 375
13,895,250 |
| | | | Netflix, Inc.
Call, 06/21/19, Strike $370.00 | | | 680,625 | |
| | | | | | | | | | |
| | | | | | | | | 1,458,941 | |
| | | | | | | | | | |
| | | | | | Consumer Discretionary (0.0%) | | | | |
| 50
3,440,200 |
| | | | Chipotle Mexican Grill, Inc.
Put, 06/21/19, Strike $450.00 | | | 1,000 | |
| | | |
| 500
9,142,500 |
| | EUR | | Moncler, S.p.A.
Call, 09/20/19, Strike 36.00 | | | 806,627 | |
| | | |
| 1,200
582,000 |
| | | | NIO, Inc.
Call, 08/16/19, Strike $11.00 | | | 6,000 | |
| | | |
| | | | | | Takashimaya Company, Ltd. | | | | |
| 100
1,000,000,000 |
| | JPY | | Call, 12/06/23, Strike 97.28 | | | 147,224 | |
| 50
500,000,000 |
| | JPY | | Call, 12/06/23, Strike 97.29 | | | 73,612 | |
| 50
500,000,000 |
| | JPY | | Call, 12/06/23, Strike 97.18 | | | 73,612 | |
| | | | | | | | | | |
| | | | | | | | | 1,108,075 | |
| | | | | | | | | | |
| | | | | | Consumer Staples (0.0%) | | | | |
| | | | | | Ezaki Glico Company, Ltd. | | | | |
| 100
1,000,000,000 |
| | JPY | | Call, 01/30/24, Strike 97.57 | | | 478,478 | |
| 50
500,000,000 |
| | JPY | | Call, 01/30/24, Strike 96.89 | | | 250,011 | |
| | | | | | | | | | |
| | | | | | | | | 728,489 | |
| | | | | | | | | | |
| | | | | | Health Care (0.0%) | | | | |
| 250
3,675,000 |
| | | | Allergan, PLC
Put, 05/17/19, Strike $135.00 | | | 25,375 | |
| | | |
| 100
1,000,000,000 |
| | JPY | | Nipro Corp.
Call, 01/29/21, Strike 98.68 | | | 877,059 | |
| | | |
| 50
256,650 |
| | | | Tilray, Inc.
Call, 01/17/20, Strike $170.00 | | | 1,700 | |
| | | | | | | | | | |
| | | | | | | | | 904,134 | |
| | | | | | | | | | |
| | | | | | Industrials (0.1%) | | | | |
| 100
1,000,000,000 |
| | JPY | | ANA Holdings, Inc.
Call, 09/19/24, Strike 96.53 | | | 373,446 | |
| | | |
| 250
9,442,250 |
| | | | Boeing Company
Call, 05/17/19, Strike $365.00 | | | 372,500 | |
| | | |
| | | | | | Nagoya Railroad Company, Ltd. | | | | |
| 100
1,000,000,000 |
| | JPY | | Call, 12/09/22, Strike 97.53 | | | 1,430,046 | |
| 50
500,000,000 |
| | JPY | | Call, 12/09/22, Strike 98.07 | | | 699,313 | |
| | | | |
| 80 | | CALAMOS OPEN-END FAMILY OF FUNDS SEMIANNUAL REPORT | | See accompanying Notes to Schedule of Investments |
Market Neutral Income Fund Schedule of Investments April 30, 2019 (Unaudited)
| | | | | | | | | | |
NUMBER OF
CONTRACTS/
NOTIONAL
AMOUNT | | | | | | | VALUE | |
| | | |
| 1,050
14,796,600 |
| | | | United Rentals, Inc.
Call, 09/20/19, Strike $130.00 | | $ | 1,963,500 | |
| | | | | | | | | | |
| | | | | | | | | 4,838,805 | |
| | | | | | | | | | |
| | | | | | Information Technology (0.0%) | | | | |
| 1,000
20,067,000 |
| | | | Apple, Inc.
Call, 07/19/19, Strike $190.00 | | | 1,535,000 | |
| | | |
| 150
1,500,000,000 |
| | JPY | | Digital Garage, Inc.
Call, 09/14/23, Strike 94.68 | | | 774,272 | |
| | | |
| 1,500
6,309,000 |
| | | | Micron Technology, Inc.
Put, 06/21/19, Strike $35.00 | | | 69,750 | |
| | | |
| 1,000
18,100,000 |
| | | | NVIDIA Corp.
Call, 09/20/19, Strike $200.00 | | | 1,005,000 | |
| | | | | | | | | | |
| | | | | | | | | 3,384,022 | |
| | | | | | | | | | |
| | | | | | Other (0.3%) | | | | |
| | | | | | S&P 500 Index | | | | |
| 3,200
942,665,600 |
| | | | Put, 06/28/19, Strike $2,700.00 | | | 3,856,000 | |
| 2,500
736,457,500 |
| | | | Call, 05/31/19, Strike $3,000.00 | | | 2,712,500 | |
| 2,000
589,166,000 |
| | | | Call, 05/13/19, Strike $2,985.00 | | | 1,070,000 | |
| 2,000
589,166,000 |
| | | | Put, 05/31/19, Strike $2,850.00 | | | 2,710,000 | |
| 1,500
441,874,500 |
| | | | Put, 05/31/19, Strike $2,600.00 | | | 405,000 | |
| 1,000
294,583,000 |
| | | | Call, 05/20/19, Strike $2,950.00 | | | 2,445,000 | |
| 1,000
294,583,000 |
| | | | Put, 05/31/19, Strike $2,700.00 | | | 475,000 | |
| 1,000
294,583,000 |
| | | | Put, 09/30/19, Strike $2,700.00 | | | 3,900,000 | |
| 500
147,291,500 |
| | | | Put, 12/31/19, Strike $2,700.00 | | | 3,152,500 | |
| | | | | | | | | | |
| | | | | | | | | 20,726,000 | |
| | | | | | | | | | |
| | | | | | Utilities (0.0%) | | | | |
| 100
1,000,000,000 |
| | JPY | | Kyushu Electric Power Company, Inc.
Call, 03/31/22, Strike 98.05 | | | 142,735 | |
| | | | | | | | | | |
| | | |
| | | | | | TOTAL PURCHASED OPTIONS
(Cost $50,058,253) | | | 33,291,201 | |
| | | | | | | | | | |
| | | | | | | | | | |
NUMBER OF
SHARES | | | | | | | VALUE | |
|
| | SHORT TERM INVESTMENTS (2.6%) | |
| | 100,876,487 | | | | | Fidelity Prime Money Market Fund - Institutional Class, 2.500%*** | | | 100,906,750 | |
| | | |
| | 101,207,412 | | | | | Morgan Stanley Institutional Liquidity Funds - Government Portfolio, 2.350%*** | | | 101,207,412 | |
| | | | | | | | | | |
| | | |
| | | | | | TOTAL SHORT TERM INVESTMENTS
(Cost $202,114,162) | | | 202,114,162 | |
| | | | | | | | | | |
| | | | | | | | | | |
| | | | | | | | | | |
NUMBER OF
SHARES/
PRINCIPAL
AMOUNT | | | | | | | VALUE | |
|
| INVESTMENT OF CASH COLLATERAL FOR SECURITIES
LOANED (4.1%) |
|
| | 145,172,436 | | | | | Fidelity Prime Money Market Fund - Institutional Class, 2.500%***† | | $ | 145,172,436 | |
| | | |
| | 166,889,874 | | | | | State Street Navigator Securities Lending Government Money Market Portfolio† | | | 166,889,874 | |
| | | | | | | | | | |
| | | |
| | | | | | TOTAL INVESTMENT OF CASH COLLATERAL FOR SECURITIES LOANED
(Cost $312,062,310) | | | 312,062,310 | |
| | | | | | | | | | |
| |
| TOTAL INVESTMENTS (109.5%)
(Cost $7,400,287,384) | | | 8,417,920,917 | |
| | | | | | | | | | |
| |
| | PAYABLE UPON RETURN OF SECURITIES ON LOAN(-4.1%) | | | (312,062,310 | ) |
| | | | | |
| |
| | LIABILITIES, LESS OTHER ASSETS(-5.4%) | | | (418,864,143 | ) |
| | | | | |
| |
| | NET ASSETS (100.0%) | | $ | 7,686,994,464 | |
| | | | | |
| | | | | | | | | | |
NUMBER OF
SHARES | | | | | | | VALUE | |
|
| | COMMON STOCKS SOLD SHORT(-35.5%)# | |
| | | | | | Communication Services(-2.2%) | |
| | (349,000 | ) | | | | Bilibili, Inc. | | | (6,212,200 | ) |
| | | |
| | (95,000 | ) | | | | Boingo Wireless, Inc. | | | (2,160,300 | ) |
| | | |
| | (99,700 | ) | | JPY | | CyberAgent, Inc. | | | (3,996,394 | ) |
| | | |
| | (500,000 | ) | | | | Gannett Company, Inc. | | | (4,665,000 | ) |
| | | |
| | (131,900 | ) | | | | IAC/InterActive Corp. | | | (29,656,396 | ) |
| | | |
| | (245,000 | ) | | | | iQIYI, Inc. | | | (5,416,950 | ) |
| | | |
| | (88,000 | ) | | | | Liberty Media Corp. / Liberty Formula One | | | (3,415,280 | ) |
| | | |
| | (40,000 | ) | | | | Live Nation Entertainment, Inc. | | | (2,613,600 | ) |
| | | |
| | (68,700 | ) | | | | Momo, Inc. | | | (2,409,309 | ) |
| | | |
| | (1,179,000 | ) | | | | New York Times Company - Class A | | | (39,083,850 | ) |
| | | |
| | (251,000 | ) | | | | Sea, Ltd. | | | (6,247,390 | ) |
| | | |
| | (380,175 | ) | | | | Twitter, Inc. | | | (15,172,784 | ) |
| | | |
| | (53,300 | ) | | | | Weibo Corp. | | | (3,651,050 | ) |
| | | |
| | (507,009 | ) | | | | World Wrestling Entertainment, Inc. - Class A | | | (42,512,705 | ) |
| | | |
| | (82,900 | ) | | | | Zillow Group, Inc. - Class C | | | (2,768,860 | ) |
| | | | | | | | | | |
| | | | | | | | | (169,982,068 | ) |
| | | | | | | | | | |
| | | | | | Consumer Discretionary(-5.6%) | |
| | (554,850 | ) | | | | Alibaba Group Holding, Ltd. | | | (102,963,514 | ) |
| | | |
| | (20,100 | ) | | | | Booking Holdings, Inc. | | | (37,285,299 | ) |
| | | |
| | (654,850 | ) | | | | Chegg, Inc. | | | (23,345,402 | ) |
| | | |
| | (337,000 | ) | | | | Ctrip.com International, Ltd. | | | (14,844,850 | ) |
| | | |
| | (402,100 | ) | | | | Etsy, Inc. | | | (27,157,834 | ) |
| | | |
| | (290,880 | ) | | | | Guess, Inc. | | | (5,925,226 | ) |
| | | | | | |
| See accompanying Notes to Schedule of Investments | | www.calamos.com | | | 81 | |
Market Neutral Income Fund Schedule of Investments April 30, 2019 (Unaudited)
| | | | | | | | | | |
NUMBER OF
SHARES | | | | | | | VALUE | |
| | | |
| | (653,061 | ) | | | | LGI Homes, Inc. | | $ | (45,263,658 | ) |
| | | |
| | (51,204 | ) | | | | MercadoLibre, Inc. | | | (24,789,905 | ) |
| | | |
| | (145,000 | ) | | EUR | | Moncler, S.p.A. | | | (5,961,568 | ) |
| | | |
| | (68,000 | ) | | | | NIO, Inc. | | | (329,800 | ) |
| | | |
| | (240,500 | ) | | | | Quotient Technology, Inc. | | | (2,234,245 | ) |
| | | |
| | (185,800 | ) | | JPY | | Takashimaya Company, Ltd. | | | (2,089,172 | ) |
| | | |
| | (1,203,222 | ) | | | | TAL Education Group | | | (46,287,950 | ) |
| | | |
| | (132,300 | ) | | | | Tesla, Inc. | | | (31,578,687 | ) |
| | | |
| | (294,400 | ) | | | | Wayfair, Inc. - Class A | | | (47,736,960 | ) |
| | | |
| | (2,595,800 | ) | | JPY | | Yamada Denki Company, Ltd. | | | (12,305,199 | ) |
| | | | | | | | | | |
| | | | | | | | | (430,099,269 | ) |
| | | | | | | | | | |
| | | | | | Consumer Staples(-0.6%) | |
| | (170,108 | ) | | | | Energizer Holdings, Inc. | | | (8,146,472 | ) |
| | | |
| | (58,800 | ) | | JPY | | Ezaki Glico Company, Ltd. | | | (3,103,163 | ) |
| | | |
| | (661,300 | ) | | | | Herbalife Nutrition, Ltd. | | | (34,949,705 | ) |
| | | | | | | | | | |
| | | | | | | | | (46,199,340 | ) |
| | | | | | | | | | |
| | | | | | Energy(-0.1%) | |
| | (526,400 | ) | | | | Chesapeake Energy Corp. | | | (1,531,824 | ) |
| | | |
| | (364,400 | ) | | | | Renewable Energy Group, Inc. | | | (8,789,328 | ) |
| | | |
| | (25,000 | ) | | | | SEACOR Holdings, Inc. | | | (1,113,500 | ) |
| | | | | | | | | | |
| | | | | | | | | (11,434,652 | ) |
| | | | | | | | | | |
| | | | | | Financials(-1.4%) | |
| | (109,397 | ) | | | | Assurant, Inc. | | | (10,392,715 | ) |
| | | |
| | (816,000 | ) | | | | AXA Equitable Holdings, Inc. | | | (18,515,040 | ) |
| | | |
| | (128,650 | ) | | EUR | | Eurazeo, SE | | | (10,097,063 | ) |
| | | |
| | (276,300 | ) | | | | Heritage Insurance Holdings, Inc. | | | (3,768,732 | ) |
| | | |
| | (59,000 | ) | | | | Hope Bancorp, Inc. | | | (829,540 | ) |
| | | |
| | (113,929 | ) | | | | LendingTree, Inc. | | | (43,842,158 | ) |
| | | |
| | (50,000 | ) | | | | PRA Group, Inc. | | | (1,406,000 | ) |
| | | |
| | (744,300 | ) | | JPY | | SBI Holdings, Inc. | | | (15,958,819 | ) |
| | | |
| | (34,000 | ) | | | | Virtus Investment Partners, Inc. | | | (4,168,740 | ) |
| | | | | | | | | | |
| | | | | | | | | (108,978,807 | ) |
| | | | | | | | | | |
| | | | | | Health Care(-4.6%) | |
| | (100,000 | ) | | | | Allscripts Healthcare Solutions, Inc. | | | (987,000 | ) |
| | | |
| | (126,000 | ) | | | | AMAG Pharmaceuticals, Inc. | | | (1,406,160 | ) |
| | | |
| | (169,000 | ) | | EUR | | Bayer, AG | | | (11,244,383 | ) |
| | | |
| | (114,500 | ) | | | | Becton Dickinson and Company | | | (27,564,730 | ) |
| | | |
| | (38,500 | ) | | | | CONMED Corp. | | | (3,081,155 | ) |
| | | |
| | (180,750 | ) | | | | DexCom, Inc. | | | (21,883,402 | ) |
| | | |
| | (89,700 | ) | | | | Evolent Health, Inc. - Class A | | | (1,215,435 | ) |
| | | |
| | (110,000 | ) | | | | Flexion Therapeutics, Inc. | | | (1,166,000 | ) |
| | | |
| | (176,931 | ) | | | | Illumina, Inc. | | | (55,202,472 | ) |
| | | |
| | (182,500 | ) | | | | Immunomedics, Inc. | | | (2,923,650 | ) |
| | | |
| | (94,500 | ) | | | | Innoviva, Inc. | | | (2,253,825 | ) |
| | | |
| | (788,600 | ) | | | | Innoviva, Inc. | | | (11,064,058 | ) |
| | | |
| | (230,431 | ) | | | | Insmed, Inc. | | | (7,014,320 | ) |
| | | | | | | | | | |
NUMBER OF
SHARES | | | | | | | VALUE | |
| | | |
| | (370,600 | ) | | | | Insulet Corp. | | $ | (31,964,250 | ) |
| | | |
| | (12,000 | ) | | | | Intercept Pharmaceuticals, Inc. | | | (1,034,160 | ) |
| | | |
| | (50,000 | ) | | | | Invacare Corp. | | | (370,000 | ) |
| | | |
| | (282,100 | ) | | | | Ionis Pharmaceuticals, Inc. | | | (20,968,493 | ) |
| | | |
| | (367,587 | ) | | | | Ironwood Pharmaceuticals, Inc. | | | (4,370,609 | ) |
| | | |
| | (19,600 | ) | | | | Ligand Pharmaceuticals, Inc. | | | (2,466,660 | ) |
| | | |
| | (424,000 | ) | | | | Medicines Company | | | (13,546,800 | ) |
| | | |
| | (168,040 | ) | | | | Molina Healthcare, Inc. | | | (21,783,025 | ) |
| | | |
| | (150,371 | ) | | | | Neurocrine Biosciences, Inc. | | | (10,862,801 | ) |
| | | |
| | (333,500 | ) | | JPY | | Nipro Corp. | | | (4,142,725 | ) |
| | | |
| | (177,000 | ) | | | | NuVasive, Inc. | | | (10,726,200 | ) |
| | | |
| | (650,000 | ) | | | | OPKO Health, Inc. | | | (1,553,500 | ) |
| | | |
| | (33,500 | ) | | | | Pacira BioSciences, Inc. | | | (1,333,970 | ) |
| | | |
| | (194,773 | ) | | | | Quidel Corp. | | | (12,453,786 | ) |
| | | |
| | (53,137 | ) | | | | Retrophin, Inc. | | | (1,013,854 | ) |
| | | |
| | (245,000 | ) | | | | Sarepta Therapeutics, Inc. | | | (28,650,300 | ) |
| | | |
| | (90,000 | ) | | | | Supernus Pharmaceuticals, Inc. | | | (3,305,700 | ) |
| | | |
| | (23,000 | ) | | | | Tabula Rasa HealthCare, Inc. | | | (1,224,980 | ) |
| | | |
| | (270,200 | ) | | | | Teladoc Health, Inc. | | | (15,368,976 | ) |
| | | |
| | (640,217 | ) | | | | Wright Medical Group, NV | | | (18,931,217 | ) |
| | | | | | | | | | |
| | | | | | | | | (353,078,596 | ) |
| | | | | | | | | | |
| | | | | | Industrials(-1.0%) | |
| | (162,159 | ) | | | | Aerojet Rocketdyne Holdings, Inc. | | | (5,490,704 | ) |
| | | |
| | (68,600 | ) | | JPY | | ANA Holdings, Inc. | | | (2,400,775 | ) |
| | | |
| | (26,615 | ) | | | | Arconic, Inc. | | | (571,690 | ) |
| | | |
| | (905,000 | ) | | | | Colfax Corp. | | | (27,303,850 | ) |
| | | |
| | (101,500 | ) | | | | Fortive Corp. | | | (8,763,510 | ) |
| | | |
| | (71,050 | ) | | | | FTI Consulting, Inc. | | | (6,037,829 | ) |
| | | |
| | (316,000 | ) | | JPY | | Nagoya Railroad Company, Ltd. | | | (8,565,170 | ) |
| | | |
| | (535,000 | ) | | | | Rexnord Corp. | | | (15,301,000 | ) |
| | | | | | | | | | |
| | | | | | | | | (74,434,528 | ) |
| | | | | | | | | | |
| | | | | | Information Technology(-16.8%) | |
| | (63,500 | ) | | | | 8x8, Inc. | | | (1,518,920 | ) |
| | | |
| | (4,720,600 | ) | | | | Advanced Micro Devices, Inc. | | | (130,430,178 | ) |
| | | |
| | (257,500 | ) | | | | Alteryx, Inc. - Class A | | | (22,824,800 | ) |
| | | |
| | (366,650 | ) | | | | Atlassian Corp., PLC - Class A | | | (40,386,498 | ) |
| | | |
| | (100,000 | ) | | | | Avaya Holdings Corp. | | | (1,908,000 | ) |
| | | |
| | (75,000 | ) | | | | Belden, Inc. | | | (4,166,250 | ) |
| | | |
| | (99,200 | ) | | | | Benefitfocus, Inc. | | | (4,040,416 | ) |
| | | |
| | (45,131 | ) | | | | CalAmp Corp. | | | (659,364 | ) |
| | | |
| | (198,400 | ) | | | | Carbonite, Inc. | | | (4,866,752 | ) |
| | | |
| | (48,999 | ) | | | | Cardtronics, PLC - Class A | | | (1,752,204 | ) |
| | | |
| | (75,000 | ) | | | | CSG Systems International, Inc. | | | (3,348,750 | ) |
| | | |
| | (1,119,000 | ) | | | | Cypress Semiconductor Corp. | | | (19,224,420 | ) |
| | | |
| | (67,500 | ) | | JPY | | Digital Garage, Inc. | | | (1,972,085 | ) |
| | | |
| | (58,000 | ) | | | | DocuSign, Inc. | | | (3,286,860 | ) |
| | | |
| | (89,800 | ) | | | | Electronics For Imaging, Inc. | | | (3,339,662 | ) |
| | | | |
| 82 | | CALAMOS OPEN-END FAMILY OF FUNDS SEMIANNUAL REPORT | | See accompanying Notes to Schedule of Investments |
Market Neutral Income Fund Schedule of Investments April 30, 2019 (Unaudited)
| | | | | | | | | | |
NUMBER OF
SHARES | | | | | | | VALUE | |
| | | |
| | (125,050 | ) | | | | Envestnet, Inc. | | $ | (8,877,299 | ) |
| | | |
| | (48,498 | ) | | | | Euronet Worldwide, Inc. | | | (7,269,365 | ) |
| | | |
| | (401,000 | ) | | | | FireEye, Inc. | | | (6,424,020 | ) |
| | | |
| | (320,200 | ) | | | | Five9, Inc. | | | (16,993,014 | ) |
| | | |
| | (73,000 | ) | | | | GDS Holdings, Ltd. | | | (2,856,490 | ) |
| | | |
| | (32,000 | ) | | | | Guidewire Software, Inc. | | | (3,408,000 | ) |
| | | |
| | (263,000 | ) | | | | HubSpot, Inc. | | | (48,520,870 | ) |
| | | |
| | (71,500 | ) | | | | II-VI, Inc. | | | (2,848,560 | ) |
| | | |
| | (838,000 | ) | | | | Infinera Corp. | | | (3,636,920 | ) |
| | | |
| | (146,000 | ) | | | | Inphi Corp. | | | (6,666,360 | ) |
| | | |
| | (730,350 | ) | | | | Intel Corp. | | | (37,277,064 | ) |
| | | |
| | (309,200 | ) | | | | j2 Global, Inc. | | | (27,092,104 | ) |
| | | |
| | (130,400 | ) | | | | LivePerson, Inc. | | | (3,824,632 | ) |
| | | |
| | (170,600 | ) | | | | Lumentum Holdings, Inc. | | | (10,572,082 | ) |
| | | |
| | (748,000 | ) | | | | Microchip Technology, Inc. | | | (74,717,720 | ) |
| | | |
| | (2,394,615 | ) | | | | Micron Technology, Inc. | | | (100,717,507 | ) |
| | | |
| | (206,350 | ) | | | | MongoDB, Inc. | | | (29,078,842 | ) |
| | | |
| | (190,500 | ) | | | | MTS Systems Corp. | | | (10,473,690 | ) |
| | | |
| | (124,700 | ) | | | | New Relic, Inc. | | | (13,123,428 | ) |
| | | |
| | (171,400 | ) | | | | Nice, Ltd. | | | (23,629,204 | ) |
| | | |
| | (226,570 | ) | | | | Nuance Communications, Inc. | | | (3,813,173 | ) |
| | | |
| | (141,400 | ) | | | | Nutanix, Inc. - Class A | | | (6,107,066 | ) |
| | | |
| | (80,773 | ) | | | | NXP Semiconductors, NV | | | (8,531,244 | ) |
| | | |
| | (348,300 | ) | | | | Okta, Inc. | | | (36,233,649 | ) |
| | | |
| | (988,000 | ) | | | | ON Semiconductor Corp. | | | (22,783,280 | ) |
| | | |
| | (50,100 | ) | | | | OSI Systems, Inc. | | | (4,515,513 | ) |
| | | |
| | (287,200 | ) | | | | Palo Alto Networks, Inc. | | | (71,463,976 | ) |
| | | |
| | (130,000 | ) | | | | Pluralsight, Inc. | | | (4,613,700 | ) |
| | | |
| | (259,973 | ) | | | | Pure Storage, Inc. - Class A | | | (5,942,983 | ) |
| | | |
| | (220,300 | ) | | | | Q2 Holdings, Inc. | | | (16,615,026 | ) |
| | | |
| | (438,729 | ) | | | | RealPage, Inc. | | | (28,609,518 | ) |
| | | |
| | (132,500 | ) | | | | Red Hat, Inc.^ | | | (24,185,225 | ) |
| | | |
| | (232,900 | ) | | | | RingCentral, Inc. - Class A | | | (27,102,573 | ) |
| | | |
| | (278,950 | ) | | | | ServiceNow, Inc. | | | (75,737,715 | ) |
| | | |
| | (118,600 | ) | | | | Silicon Laboratories, Inc. | | | (12,768,476 | ) |
| | | |
| | (253,000 | ) | | | | Splunk, Inc. | | | (34,924,120 | ) |
| | | |
| | (1,233,500 | ) | | | | Square, Inc. - Class A | | | (89,823,470 | ) |
| | | |
| | (69,500 | ) | | | | Synaptics, Inc. | | | (2,618,065 | ) |
| | | |
| | (127,300 | ) | | | | Teradyne, Inc. | | | (6,237,700 | ) |
| | | |
| | (17,500 | ) | | | | TiVo Corp. | | | (163,975 | ) |
| | | |
| | (1,373,100 | ) | | | | TTM Technologies, Inc. | | | (18,179,844 | ) |
| | | |
| | (196,500 | ) | | | | Twilio, Inc. - Class A | | | (26,948,010 | ) |
| | | |
| | (332,400 | ) | | | | Viavi Solutions, Inc. | | | (4,420,920 | ) |
| | | |
| | (161,000 | ) | | | | Vishay Intertechnology, Inc. | | | (3,189,410 | ) |
| | | |
| | (45,750 | ) | | | | Wix.com, Ltd. | | | (6,137,820 | ) |
| | | |
| | (255,997 | ) | | | | Workday, Inc. - Class A | | | (52,640,663 | ) |
| | | |
| | (137,000 | ) | | | | Zendesk, Inc. | | | (12,025,860 | ) |
| | | | | | | | | | |
| | | | | | | | | (1,288,065,304 | ) |
| | | | | | | | | | |
| | | | | | | | | | |
NUMBER OF
SHARES | | | | | | | VALUE | |
| | | | | | | | | | |
| | | | | | Materials(-0.9%) | |
| | (1,325,800 | ) | | | | Allegheny Technologies, Inc. | | $ | (33,038,936 | ) |
| | | |
| | (730,000 | ) | | GBP | | Anglo American, PLC | | | (18,943,281 | ) |
| | | |
| | (71,000 | ) | | | | International Flavors & Fragrances, Inc. | | | (9,783,090 | ) |
| | | |
| | (85,500 | ) | | | | Pretium Resources, Inc. | | | (650,655 | ) |
| | | |
| | (164,000 | ) | | | | SSR Mining, Inc. | | | (1,892,560 | ) |
| | | |
| | (275,000 | ) | | | | TimkenSteel Corp. | | | (2,788,500 | ) |
| | | | | | | | | | |
| | | | | | | | | (67,097,022 | ) |
| | | | | | | | | | |
| | | | | | Real Estate(-0.9%) | |
| | (90,000 | ) | | | | Crown Castle International Corp. | | | (11,320,200 | ) |
| | | |
| | (293,200 | ) | | | | Extra Space Storage, Inc. | | | (30,401,908 | ) |
| | | |
| | (938,999 | ) | | | | Invitation Homes, Inc. | | | (23,343,515 | ) |
| | | |
| | (76,900 | ) | | | | iStar, Inc. | | | (666,723 | ) |
| | | | | | | | | | |
| | | | | | | | | (65,732,346 | ) |
| | | | | | | | | | |
| | | | | | Utilities(-1.4%) | |
| | (44,000 | ) | | | | American Electric Power Company, Inc. | | | (3,764,200 | ) |
| | | |
| | (330,733 | ) | | | | Aqua America, Inc. | | | (12,918,431 | ) |
| | | |
| | (575,000 | ) | | | | CenterPoint Energy, Inc. | | | (17,825,000 | ) |
| | | |
| | (385,000 | ) | | JPY | | Chugoku Electric Power Company, Inc. | | | (4,596,748 | ) |
| | | |
| | (30,000 | ) | | | | Dominion Energy, Inc. | | | (2,336,100 | ) |
| | | |
| | (139,000 | ) | | | | DTE Energy Company | | | (17,473,690 | ) |
| | | |
| | (147,600 | ) | | JPY | | Kyushu Electric Power Company, Inc. | | | (1,429,388 | ) |
| | | |
| | (188,000 | ) | | | | Sempra Energy | | | (24,054,600 | ) |
| | | |
| | (114,706 | ) | | | | South Jersey Industries, Inc. | | | (3,684,357 | ) |
| | | |
| | (808,480 | ) | | | | Vistra Energy Corp. | | | (22,031,080 | ) |
| | | | | | | | | | |
| | | | | | | | | (110,113,594 | ) |
| | | | | | | | | | |
| | | |
| | | | | | TOTAL COMMON STOCKS SOLD SHORT
(Proceeds $2,026,497,663) | | | (2,725,215,526 | ) |
| | | | | | | | | | |
| | | | | | | | | | |
NUMBER OF
CONTRACTS/
NOTIONAL
AMOUNT | | | | | | | VALUE | |
|
| | WRITTEN OPTIONS(-6.3%)# | |
| | | | | | Communication Services (0.0%) | |
| 600
2,892,600 |
| | | | Activision Blizzard, Inc.
Put, 05/17/19, Strike $35.00 | | | (1,800 | ) |
| | | |
| | | | | | Electronic Arts, Inc. | | | | |
| 1,430
13,534,950 |
| | | | Call, 06/21/19, Strike $110.00 | | | (170,885 | ) |
| 715
6,767,475 |
| | | | Put, 06/21/19, Strike $85.00 | | | (142,643 | ) |
| | | |
| 2,200
42,548,000 |
| | | | Facebook, Inc.
Put, 06/21/19, Strike $135.00 | | | (16,500 | ) |
| | | | | | |
| See accompanying Notes to Schedule of Investments | | www.calamos.com | | | 83 | |
Market Neutral Income Fund Schedule of Investments April 30, 2019 (Unaudited)
| | | | | | | | | | |
NUMBER OF
CONTRACTS/
NOTIONAL
AMOUNT | | | | | | | VALUE | |
| | | |
| 750
27,790,500 |
| | | | Netflix, Inc.
Call, 06/21/19, Strike $400.00 | | $ | (476,250 | ) |
| | | | | | | | | | |
| | | | | | | | | (808,078 | ) |
| | | | | | | | | | |
| | | | | | Consumer Discretionary (0.0%) | |
| 150
10,320,600 |
| | | | Chipotle Mexican Grill, Inc.
Put, 06/21/19, Strike $410.00 | | | (4,500 | ) |
| | | |
| 500
2,860,500 |
| | | | Foot Locker, Inc.
Put, 05/17/19, Strike $45.00 | | | (3,750 | ) |
| | | |
| | | | | | NIO, Inc. | | | | |
| 1,646
798,310 |
| | | | Call, 08/16/19, Strike $9.00 | | | (18,106 | ) |
| 1,200
582,000 |
| | | | Call, 08/16/19, Strike $12.00 | | | (4,800 | ) |
| | | |
| 305
7,280,045 |
| | | | Tesla, Inc.
Call, 01/17/20, Strike $325.00 | | | (458,262 | ) |
| | | |
| 500
7,222,500 |
| | | | Wynn Resorts, Ltd.
Put, 06/21/19, Strike $100.00 | | | (9,500 | ) |
| | | | | | | | | | |
| | | | | | | | | (498,918 | ) |
| | | | | | | | | | |
| | | | | | Energy (0.0%) | | | | |
| 3,000
1,830,000 |
| | | | Oasis Petroleum, Inc.
Call, 01/17/20, Strike $12.00 | | | (30,000 | ) |
| | | | | | | | | | |
| | | | | | Health Care (0.0%) | | | | |
| 500
7,350,000 |
| | | | Allergan, PLC
Put, 05/17/19, Strike $125.00 | | | (21,000 | ) |
| | | |
| 3,000
4,806,000 |
| | | | Immunomedics, Inc.
Call, 01/17/20, Strike $10.00 | | | (2,175,000 | ) |
| | | |
| 50
256,650 |
| | | | Tilray, Inc.
Call, 01/17/20, Strike $175.00 | | | (1,575 | ) |
| | | | | | | | | | |
| | | | | | | | | (2,197,575 | ) |
| | | | | | | | | | |
| | | | | | Industrials (0.0%) | | | | |
| 500
18,884,500 |
| | | | Boeing Company
Call, 05/17/19, Strike $390.00 | | | (117,250 | ) |
| | | |
| | | | | | United Rentals, Inc. | | | | |
| 1,050
14,796,600 |
| | | | Call, 09/20/19, Strike $135.00 | | | (1,648,500 | ) |
| 350
4,932,200 |
| | | | Put, 09/20/19, Strike $115.00 | | | (106,750 | ) |
| | | | | | | | | | |
| | | | | | | | | (1,872,500 | ) |
| | | | | | | | | | |
| | | | | | Information Technology(-0.1%) | |
| 3,500
9,670,500 |
| | | | Advanced Micro Devices, Inc.
Put, 01/17/20, Strike $10.00 | | | (47,250 | ) |
| | | |
| 2,000
40,134,000 |
| | | | Apple, Inc.
Call, 07/19/19, Strike $200.00 | | | (1,835,000 | ) |
| | | |
| 3,000
12,618,000 |
| | | | Micron Technology, Inc.
Put, 06/21/19, Strike $31.00 | | | (45,000 | ) |
| | | |
| | | | | | NVIDIA Corp. | | | | |
| 1,000
18,100,000 |
| | | | Call, 09/20/19, Strike $210.00 | | | (717,500 | ) |
| 500
9,050,000 |
| | | | Put, 09/20/19, Strike $160.00 | | | (393,750 | ) |
| | | | | | | | | | |
| | | | | | | | | (3,038,500 | ) |
| | | | | | | | | | |
| | | | | | | | | | |
NUMBER OF
CONTRACTS/
NOTIONAL
AMOUNT | | | | | | | VALUE | |
| | | | | | | | | | |
| | | | | | Other(-6.2%) | | | | |
| | | | | | S&P 500 Index | | | | |
| 7,000
2,062,081,000 |
| | | | Call, 12/31/19, Strike $2,500.00 | | $ | (342,440,000 | ) |
| 4,000
1,178,332,000 |
| | | | Call, 06/28/19, Strike $2,675.00 | | | (113,480,000 | ) |
| 1,000
294,583,000 |
| | | | Put, 09/30/19, Strike $2,000.00 | | | (400,000 | ) |
| 750
220,937,250 |
| | | | Call, 12/31/19, Strike $3,000.00 | | | (7,822,500 | ) |
| 500
147,291,500 |
| | | | Call, 09/30/19, Strike $2,900.00 | | | (6,642,500 | ) |
| 500
147,291,500 |
| | | | Put, 12/31/19, Strike $2,500.00 | | | (1,820,000 | ) |
| | | | | | | | | | |
| | | | | | | | | (472,605,000 | ) |
| | | | | | | | | | |
| | | |
| | | | | | TOTAL WRITTEN OPTIONS
(Premium $253,552,577) | | $ | (481,050,571 | ) |
| | | | | | | | | | |
FORWARD FOREIGN CURRENCY CONTRACTS
| | | | | | | | | | | | | | | | |
COUNTER
PARTY | | SHORT CONTRACTS | | SETTLEMENT DATE | | LOCAL CURRENCY | | | CURRENT VALUE | | | UNREALIZED GAIN/LOSS | |
| | | | | |
| Northern Trust Company | | British Pound Sterling | | 07/25/19 | | | 28,701,000 | | | $ | 37,589,451 | | | $ | 255,458 | |
| | | | | |
| Northern Trust Company | | European Monetary Unit | | 07/25/19 | | | 35,793,000 | | | | 40,432,918 | | | | 414,376 | |
| | | | | |
| State Street Bank and Trust | | Japanese Yen | | 07/25/19 | | | 6,687,815,000 | | | | 60,444,778 | | | | (183,932 | ) |
| | | | | | | | | | | | | | | | |
| | | $ | 485,902 | |
| | | | | |
NOTES TO SCHEDULE OF INVESTMENTS
| * | Securities issued and sold pursuant to a Rule 144A transaction are excepted from the registration requirement of the Securities Act of 1933, as amended. These securities may only be sold to qualified institutional buyers (“QIBs”), such as the Fund. Any resale of these securities must generally be effected through a sale that is registered under the Act or otherwise exempted from such registration requirements. |
| ^ | Security, or portion of security, is on loan. |
| ~ | Security, or portion of security, is segregated as collateral (or collateral for potential future transactions) for written options, swaps, or securities sold short. The aggregate value of such securities is $1,812,538,239. |
| § | Securities exchangeable or convertible into securities of one or more entities that are different than the issuer. Each entity is identified in the parenthetical. |
| # | Non-income producing security. |
| *** | The rate disclosed is the 7 day net yield as of April 30, 2019. |
| † | Represents investment of cash collateral received from securities on loan as of April 30, 2019. |
| | | | |
| 84 | | CALAMOS OPEN-END FAMILY OF FUNDS SEMIANNUAL REPORT | | See accompanying Notes to Financial Statements |
Market Neutral Income Fund Schedule of Investments April 30, 2019 (Unaudited)
FOREIGN CURRENCY ABBREVIATION
| | |
| |
| EUR | | European Monetary Unit |
| |
| GBP | | British Pound Sterling |
| |
| JPY | | Japanese Yen |
TOTAL RETURN SWAPS
| | | | | | | | | | | | | | | | | | | | | | | | | | | | | | |
| COUNTERPARTY | | UNDERLYING
REFERENCE
INSTRUMENT | | FIXED RATE
(FUND PAYS) | | FLOATING RATE
(FUND RECEIVES) | | TERMINATION
DATE | | | PERIODIC
PAYMENT
FREQUENCY | | | NOTIONAL
AMOUNT | | | UPFRONT
PAYMENTS
(PAID)/
RECEIVED | | | MARKET
VALUE | | | UNREALIZED
APPRECIATION/
(DEPRECIATION) | |
| | | | | | | | | |
| Goldman Sachs & Co. | | iQIYI, Inc. | | Equity returns on 156,200 shares of iQIYI, Inc. | | FED Funds less 1.000% | | | 06/07/19 | | | | Monthly | | | $ | 3,000,602 | | | $ | — | | | $ | (424,028 | ) | | $ | (424,028 | ) |
| | | | | | | | | |
| Goldman Sachs & Co. | | NIO, Inc. | | Equity returns on 507,500 shares of NIO, Inc. | | OBFR less 1.000% | | | 08/08/19 | | | | Monthly | | | | 2,461,375 | | | | — | | | | 4,583 | | | | 4,583 | |
| | | | | | | | | |
| Goldman Sachs & Co. | | iQIYI, Inc. | | Equity returns on 264,000 shares of iQIYI, Inc. | | OBFR less 1.000% | | | 10/03/19 | | | | Monthly | | | | 5,802,720 | | | | — | | | | (26,035 | ) | | | (26,035 | ) |
| | | | | | | | | |
| Goldman Sachs & Co. | | NIO, Inc. | | Equity returns on 1,232,800 shares of NIO, Inc. | | OBFR less 1.500% | | | 01/31/22 | | | | Monthly | | | | 5,979,080 | | | | — | | | | 11,133 | | | | 11,133 | |
| | | | | | | | | | | | | | | | | | | | | | | | | | | | | | |
| | | $ | — | | | $ | (434,347 | ) | | $ | (434,347 | ) |
| | | | | | | | | | | | | | | | | | | | | | | | | | | | | | |
ABBREVIATION
| | |
| |
| OBFR | | Overnight Bank Funding Rate |
Note: Value for securities denominated in foreign currencies is shown in U.S. dollars. The principal amount for such securities is shown in the respective foreign currency. The date on options represents the expiration date of the option contract. The option contract may be exercised at any date on or before the date shown. For purchased options denominated in JPY, the strike price shown is a percentage of the par value of the underlying bond.
| | | | | | |
| See accompanying Notes to Financial Statements | | www.calamos.com | | | 85 | |
Hedged Equity Fund Schedule of Investments April 30, 2019 (Unaudited)
| | | | | | | | | | |
NUMBER OF
SHARES | | | | | | | VALUE | |
|
| | COMMON STOCKS (100.9%) | |
| | | | | | Communication Services (10.4%) | |
| | 4,837 | | | | | Activision Blizzard, Inc. | | $ | 233,192 | |
| | | |
| | 2,095 | | | | | Alphabet, Inc. - Class A#~ | | | 2,511,821 | |
| | | |
| | 2,130 | | | | | Alphabet, Inc. - Class C#~ | | | 2,531,462 | |
| | | |
| | 51,930 | | | | | AT&T, Inc.~ | | | 1,607,753 | |
| | | |
| | 1,392 | | | | | Charter Communications, Inc. - Class A# | | | 516,697 | |
| | | |
| | 34,522 | | | | | Comcast Corp. - Class A~ | | | 1,502,743 | |
| | | |
| | 20,896 | | | | | Facebook, Inc. - Class A#~ | | | 4,041,287 | |
| | | |
| | 6,078 | | | | | Fox Corp. - Class A# | | | 236,981 | |
| | | |
| | 3,041 | | | | | Netflix, Inc.#~ | | | 1,126,812 | |
| | | |
| | 5,819 | | | | | Twitter, Inc.# | | | 232,236 | |
| | | |
| | 31,381 | | | | | Verizon Communications, Inc.~ | | | 1,794,679 | |
| | | |
| | 13,772 | | | | | Walt Disney Company~ | | | 1,886,351 | |
| | | | | | | | | | |
| | | | | | | | | 18,222,014 | |
| | | | | | | | | | |
| | | | | | Consumer Discretionary (10.7%) | |
| | 3,116 | | | | | Amazon.com, Inc.#~ | | | 6,003,036 | |
| | | |
| | 4,790 | | | | | Aptiv, PLC | | | 410,503 | |
| | | |
| | 273 | | | | | Booking Holdings, Inc.# | | | 506,412 | |
| | | |
| | 4,243 | | | | | Carnival Corp. | | | 232,771 | |
| | | |
| | 6,535 | | | | | D.R. Horton, Inc. | | | 289,566 | |
| | | |
| | 2,103 | | | | | Darden Restaurants, Inc. | | | 247,313 | |
| | | |
| | 3,225 | | | | | Dollar General Corp. | | | 406,640 | |
| | | |
| | 7,339 | | | | | eBay, Inc. | | | 284,386 | |
| | | |
| | 2,915 | | | | | Expedia Group, Inc. | | | 378,484 | |
| | | |
| | 28,545 | | | | | Ford Motor Company | | | 298,295 | |
| | | |
| | 7,598 | | | | | General Motors Company | | | 295,942 | |
| | | |
| | 8,756 | | | | | Home Depot, Inc.~ | | | 1,783,597 | |
| | | |
| | 4,432 | | | | | Leggett & Platt, Inc.^ | | | 174,444 | |
| | | |
| | 7,408 | | | | | Lowe’s Companies, Inc. | | | 838,141 | |
| | | |
| | 7,127 | | | | | McDonald’s Corp.~ | | | 1,408,081 | |
| | | |
| | 12,432 | | | | | MGM Resorts International | | | 331,064 | |
| | | |
| | 1,790 | | | | | Mohawk Industries, Inc.# | | | 243,887 | |
| | | |
| | 9,471 | | | | | Nike, Inc. - Class B | | | 831,838 | |
| | | |
| | 861 | | | | | O’Reilly Automotive, Inc.# | | | 325,949 | |
| | | |
| | 1,745 | | | | | PVH Corp. | | | 225,088 | |
| | | |
| | 3,624 | | | | | Ross Stores, Inc. | | | 353,920 | |
| | | |
| | 3,883 | | | | | Royal Caribbean Cruises, Ltd. | | | 469,610 | |
| | | |
| | 8,787 | | | | | Starbucks Corp. | | | 682,574 | |
| | | |
| | 5,592 | | | | | Target Corp. | | | 432,933 | |
| | | |
| | 11,324 | | | | | TJX Companies, Inc. | | | 621,461 | |
| | | |
| | 666 | | | | | Ulta Salon Cosmetics & Fragrance, Inc.# | | | 232,421 | |
| | | |
| | 3,926 | | | | | VF Corp. | | | 370,654 | |
| | | | | | | | | | |
| | | | | | | | | 18,679,010 | |
| | | | | | | | | | |
| | | | | | | | | | |
NUMBER OF
SHARES | | | | | | | VALUE | |
| | | | | | | | | | |
| | | | | | Consumer Staples (7.3%) | |
| | 13,964 | | | | | Altria Group, Inc.~ | | $ | 758,664 | |
| | | |
| | 6,155 | | | | | Archer-Daniels-Midland Company | | | 274,513 | |
| | | |
| | 3,950 | | | | | Church & Dwight Company, Inc. | | | 296,053 | |
| | | |
| | 26,375 | | | | | Coca-Cola Company~ | | | 1,293,958 | |
| | | |
| | 5,948 | | | | | Colgate-Palmolive Company | | | 432,955 | |
| | | |
| | 1,188 | | | | | Constellation Brands, Inc. - Class A | | | 251,464 | |
| | | |
| | 2,427 | | | | | Costco Wholesale Corp. | | | 595,901 | |
| | | |
| | 6,495 | | | | | General Mills, Inc. | | | 334,298 | |
| | | |
| | 4,927 | | | | | Kellogg Company | | | 297,098 | |
| | | |
| | 3,671 | | | | | Kimberly-Clark Corp. | | | 471,283 | |
| | | |
| | 8,483 | | | | | Kraft Heinz Company | | | 281,975 | |
| | | |
| | 8,544 | | | | | Kroger Company | | | 220,264 | |
| | | |
| | 14,185 | | | | | Mondelez International, Inc. - Class A | | | 721,307 | |
| | | |
| | 3,708 | | | | | Monster Beverage Corp.# | | | 220,997 | |
| | | |
| | 9,944 | | | | | PepsiCo, Inc.~ | | | 1,273,329 | |
| | | |
| | 14,849 | | | | | Philip Morris International, Inc.~ | | | 1,285,329 | |
| | | |
| | 17,773 | | | | | Procter & Gamble Company~ | | | 1,892,469 | |
| | | |
| | 5,084 | | | | | Sysco Corp. | | | 357,761 | |
| | | |
| | 6,027 | | | | | Walgreens Boots Alliance, Inc.~ | | | 322,866 | |
| | | |
| | 12,081 | | | | | Walmart, Inc.~ | | | 1,242,410 | |
| | | | | | | | | | |
| | | | | | | | | 12,824,894 | |
| | | | | | | | | | |
| | | | | | Energy (5.6%) | |
| | 2,860 | | | | | Anadarko Petroleum Corp. | | | 208,351 | |
| | | |
| | 15,304 | | | | | Chevron Corp.~ | | | 1,837,398 | |
| | | |
| | 3,222 | | | | | Concho Resources, Inc. | | | 371,754 | |
| | | |
| | 10,982 | | | | | ConocoPhillips | | | 693,184 | |
| | | |
| | 3,024 | | | | | EOG Resources, Inc. | | | 290,455 | |
| | | |
| | 26,596 | | | | | Exxon Mobil Corp.~ | | | 2,135,127 | |
| | | |
| | 14,697 | | | | | Halliburton Company | | | 416,366 | |
| | | |
| | 4,670 | | | | | Hess Corp. | | | 299,440 | |
| | | |
| | 20,355 | | | | | Kinder Morgan, Inc. | | | 404,454 | |
| | | |
| | 7,727 | | | | | Marathon Petroleum Corp. | | | 470,343 | |
| | | |
| | 5,205 | | | | | Occidental Petroleum Corp. | | | 306,471 | |
| | | |
| | 4,080 | | | | | ONEOK, Inc. | | | 277,154 | |
| | | |
| | 2,860 | | | | | Phillips 66 | | | 269,612 | |
| | | |
| | 3,669 | | | | | Pioneer Natural Resources Company | | | 610,742 | |
| | | |
| | 13,827 | | | | | Schlumberger, Ltd. | | | 590,136 | |
| | | |
| | 2,843 | | | | | Valero Energy Corp.~ | | | 257,746 | |
| | | |
| | 10,272 | | | | | Williams Companies, Inc. | | | 291,006 | |
| | | | | | | | | | |
| | | | | | | | | 9,729,739 | |
| | | | | | | | | | |
| | | | | | Financials (13.2%) | |
| | 1,736 | | | | | Affiliated Managers Group, Inc. | | | 192,557 | |
| | | |
| | 4,219 | | | | | Aflac, Inc. | | | 212,553 | |
| | | |
| | 3,239 | | | | | Allstate Corp. | | | 320,855 | |
| | | |
| | 4,669 | | | | | American Express Company | | | 547,347 | |
| | | |
| | 14,426 | | | | | American International Group, Inc. | | | 686,245 | |
| | | | |
| 86 | | CALAMOS OPEN-END FAMILY OF FUNDS SEMIANNUAL REPORT | | See accompanying Notes to Schedule of Investments |
Hedged Equity Fund Schedule of Investments April 30, 2019 (Unaudited)
| | | | | | | | | | |
NUMBER OF
SHARES | | | | | | | VALUE | |
| | | |
| | 3,614 | | | | | Arthur J. Gallagher & Company | | $ | 302,203 | |
| | | |
| | 2,981 | | | | | Assurant, Inc.~ | | | 283,195 | |
| | | |
| | 80,141 | | | | | Bank of America Corp.~ | | | 2,450,712 | |
| | | |
| | 7,353 | | | | | Bank of New York Mellon Corp. | | | 365,150 | |
| | | |
| | 5,907 | | | | | BB&T Corp. | | | 302,438 | |
| | | |
| | 13,357 | | | | | Berkshire Hathaway, Inc. - Class B#~ | | | 2,894,596 | |
| | | |
| | 763 | | | | | BlackRock, Inc. | | | 370,238 | |
| | | |
| | 10,241 | | | | | Capital One Financial Corp. | | | 950,672 | |
| | | |
| | 5,071 | | | | | Cboe Global Markets, Inc. | | | 515,264 | |
| | | |
| | 5,701 | | | | | Charles Schwab Corp. | | | 260,992 | |
| | | |
| | 3,289 | | | | | Chubb, Ltd. | | | 477,563 | |
| | | |
| | 14,142 | | | | | Citigroup, Inc.~ | | | 999,839 | |
| | | |
| | 1,589 | | | | | CME Group, Inc. | | | 284,272 | |
| | | |
| | 3,239 | | | | | Discover Financial Services | | | 263,946 | |
| | | |
| | 9,198 | | | | | E*TRADE Financial Corp. | | | 465,971 | |
| | | |
| | 3,753 | | | | | First Republic Bank | | | 396,392 | |
| | | |
| | 4,281 | | | | | Goldman Sachs Group, Inc.~ | | | 881,544 | |
| | | |
| | 26,343 | | | | | JPMorgan Chase & Company~ | | | 3,057,105 | |
| | | |
| | 5,605 | | | | | Marsh & McLennan Companies, Inc. | | | 528,495 | |
| | | |
| | 6,112 | | | | | MetLife, Inc. | | | 281,947 | |
| | | |
| | 4,605 | | | | | Morgan Stanley | | | 222,191 | |
| | | |
| | 3,252 | | | | | PNC Financial Services Group, Inc. | | | 445,296 | |
| | | |
| | 2,366 | | | | | Prudential Financial, Inc. | | | 250,110 | |
| | | |
| | 2,053 | | | | | S&P Global, Inc. | | | 453,015 | |
| | | |
| | 2,785 | | | | | State Street Corp. | | | 188,433 | |
| | | |
| | 3,870 | | | | | SunTrust Banks, Inc. | | | 253,408 | |
| | | |
| | 2,636 | | | | | Travelers Companies, Inc. | | | 378,925 | |
| | | |
| | 16,372 | | | | | US Bancorp | | | 872,955 | |
| | | |
| | 26,144 | | | | | Wells Fargo & Company~ | | | 1,265,631 | |
| | | |
| | 9,470 | | | | | Zions Bancorporation, N.A.^ | | | 467,155 | |
| | | | | | | | | | |
| | | | | | | | | 23,089,210 | |
| | | | | | | | | | |
| | | | | | Health Care (13.9%) | |
| | 10,473 | | | | | Abbott Laboratories~ | | | 833,232 | |
| | | |
| | 10,891 | | | | | AbbVie, Inc.~ | | | 864,637 | |
| | | |
| | 8,723 | | | | | Agilent Technologies, Inc. | | | 684,756 | |
| | | |
| | 4,656 | | | | | Alexion Pharmaceuticals, Inc.# | | | 633,821 | |
| | | |
| | 2,443 | | | | | Allergan, PLC | | | 359,121 | |
| | | |
| | 2,945 | | | | | Amgen, Inc. | | | 528,097 | |
| | | |
| | 9,264 | | | | | Baxter International, Inc. | | | 706,843 | |
| | | |
| | 1,330 | | | | | Becton Dickinson and Company | | | 320,184 | |
| | | |
| | 1,531 | | | | | Biogen, Inc.#~ | | | 350,966 | |
| | | |
| | 10,421 | | | | | Bristol-Myers Squibb Company~ | | | 483,847 | |
| | | |
| | 8,436 | | | | | Celgene Corp.# | | | 798,552 | |
| | | |
| | 2,032 | | | | | Cigna Corp. | | | 322,763 | |
| | | |
| | 8,988 | | | | | CVS Health Corp.~ | | | 488,767 | |
| | | |
| | 3,770 | | | | | Danaher Corp. | | | 499,299 | |
| | | |
| | 4,465 | | | | | Edwards Lifesciences Corp.# | | | 786,153 | |
| | | | | | | | | | |
NUMBER OF
SHARES | | | | | | | VALUE | |
| | | |
| | 5,756 | | | | | Eli Lilly and Company | | $ | 673,682 | |
| | | |
| | 10,347 | | | | | Gilead Sciences, Inc. | | | 672,969 | |
| | | |
| | 2,005 | | | | | HCA Healthcare, Inc. | | | 255,096 | |
| | | |
| | 2,366 | | | | | Humana, Inc. | | | 604,300 | |
| | | |
| | 1,104 | | | | | Illumina, Inc.# | | | 344,448 | |
| | | |
| | 1,146 | | | | | Intuitive Surgical, Inc.# | | | 585,182 | |
| | | |
| | 19,338 | | | | | Johnson & Johnson~ | | | 2,730,526 | |
| | | |
| | 2,613 | | | | | Laboratory Corp. of America Holdings# | | | 417,871 | |
| | | |
| | 1,845 | | | | | McKesson Corp. | | | 220,016 | |
| | | |
| | 14,167 | | | | | Medtronic, PLC | | | 1,258,171 | |
| | | |
| | 18,880 | | | | | Merck & Company, Inc.~ | | | 1,486,045 | |
| | | |
| | 40,835 | | | | | Pfizer, Inc.~ | | | 1,658,309 | |
| | | |
| | 2,289 | | | | | Quest Diagnostics, Inc. | | | 220,614 | |
| | | |
| | 489 | | | | | Regeneron Pharmaceuticals, Inc.# | | | 167,796 | |
| | | |
| | 1,788 | | | | | Stryker Corp. | | | 337,771 | |
| | | |
| | 1,212 | | | | | Teleflex, Inc. | | | 346,850 | |
| | | |
| | 2,214 | | | | | Thermo Fisher Scientific, Inc. | | | 614,274 | |
| | | |
| | 8,466 | | | | | UnitedHealth Group, Inc.~ | | | 1,973,171 | |
| | | |
| | 1,584 | | | | | Vertex Pharmaceuticals, Inc.#~ | | | 267,664 | |
| | | |
| | 1,415 | | | | | WellCare Health Plans, Inc.# | | | 365,565 | |
| | | |
| | 1,778 | | | | | Zimmer Biomet Holdings, Inc. | | | 218,979 | |
| | | |
| | 2,419 | | | | | Zoetis, Inc. | | | 246,351 | |
| | | | | | | | | | |
| | | | | | | | | 24,326,688 | |
| | | | | | | | | | |
| | | | | | Industrials (9.6%) | |
| | 4,068 | | | | | 3M Company | | | 770,927 | |
| | | |
| | 2,133 | | | | | Allegion, PLC | | | 211,658 | |
| | | |
| | 3,837 | | | | | Boeing Company~ | | | 1,449,197 | |
| | | |
| | 6,063 | | | | | Caterpillar, Inc. | | | 845,303 | |
| | | |
| | 10,024 | | | | | CSX Corp. | | | 798,211 | |
| | | |
| | 4,074 | | | | | Deere & Company | | | 674,777 | |
| | | |
| | 9,082 | | | | | Delta Air Lines, Inc. | | | 529,390 | |
| | | |
| | 2,806 | | | | | Eaton Corp., PLC | | | 232,393 | |
| | | |
| | 8,025 | | | | | Emerson Electric Company | | | 569,695 | |
| | | |
| | 1,527 | | | | | FedEx Corp. | | | 289,305 | |
| | | |
| | 4,358 | | | | | Fortune Brands Home & Security, Inc. | | | 230,015 | |
| | | |
| | 1,775 | | | | | General Dynamics Corp. | | | 317,228 | |
| | | |
| | 60,499 | | | | | General Electric Company | | | 615,275 | |
| | | |
| | 1,949 | | | | | Harris Corp. | | | 328,406 | |
| | | |
| | 6,446 | | | | | Honeywell International, Inc.~ | | | 1,119,219 | |
| | | |
| | 2,529 | | | | | Illinois Tool Works, Inc. | | | 393,588 | |
| | | |
| | 6,523 | | | | | Johnson Controls International, PLC | | | 244,613 | |
| | | |
| | 1,424 | | | | | Lockheed Martin Corp. | | | 474,662 | |
| | | |
| | 1,622 | | | | | Norfolk Southern Corp. | | | 330,920 | |
| | | |
| | 2,343 | | | | | Northrop Grumman Corp. | | | 679,259 | |
| | | |
| | 4,174 | | | | | PACCAR, Inc. | | | 299,151 | |
| | | |
| | 5,056 | | | | | Pentair, PLC | | | 197,133 | |
| | | |
| | 8,543 | | | | | Quanta Services, Inc. | | | 346,846 | |
| | | | | | |
| See accompanying Notes to Schedule of Investments | | www.calamos.com | | | 87 | |
Hedged Equity Fund Schedule of Investments April 30, 2019 (Unaudited)
| | | | | | | | | | |
NUMBER OF
SHARES | | | | | | | VALUE | |
| | | |
| | 3,699 | | | | | Raytheon Company | | $ | 656,905 | |
| | | |
| | 5,276 | | | | | Southwest Airlines Company | | | 286,117 | |
| | | |
| | 2,931 | | | | | Stanley Black & Decker, Inc. | | | 429,685 | |
| | | |
| | 5,744 | | | | | Union Pacific Corp.~ | | | 1,016,918 | |
| | | |
| | 4,783 | | | | | United Parcel Service, Inc. - Class B~ | | | 508,050 | |
| | | |
| | 5,341 | | | | | United Technologies Corp.~ | | | 761,680 | |
| | | |
| | 2,400 | | | | | Verisk Analytics, Inc. | | | 338,736 | |
| | | |
| | 1,043 | | | | | Wabtec Corp. | | | 77,255 | |
| | | |
| | 4,594 | | | | | Waste Management, Inc. | | | 493,120 | |
| | | |
| | 3,303 | | | | | Xylem, Inc.~ | | | 275,470 | |
| | | | | | | | | | |
| | | | | | | | | 16,791,107 | |
| | | | | | | | | | |
| | | | | | Information Technology (21.7%) | |
| | 4,363 | | | | | Accenture, PLC - Class A | | | 796,989 | |
| | | |
| | 3,435 | | | | | Adobe, Inc.# | | | 993,574 | |
| | | |
| | 17,629 | | | | | Advanced Micro Devices, Inc.#^ | | | 487,089 | |
| | | |
| | 3,119 | | | | | Amphenol Corp. - Class A | | | 310,528 | |
| | | |
| | 34,485 | | | | | Apple, Inc.~ | | | 6,920,105 | |
| | | |
| | 17,099 | | | | | Applied Materials, Inc. | | | 753,553 | |
| | | |
| | 2,023 | | | | | Autodesk, Inc.# | | | 360,519 | |
| | | |
| | 4,064 | | | | | Automatic Data Processing, Inc. | | | 668,081 | |
| | | |
| | 2,285 | | | | | Broadcom, Inc.~ | | | 727,544 | |
| | | |
| | 39,416 | | | | | Cisco Systems, Inc.~ | | | 2,205,325 | |
| | | |
| | 2,674 | | | | | Citrix Systems, Inc. | | | 269,967 | |
| | | |
| | 4,871 | | | | | Cognizant Technology Solutions Corp. - Class A | | | 355,388 | |
| | | |
| | 4,817 | | | | | Fiserv, Inc.#^ | | | 420,235 | |
| | | |
| | 4,025 | | | | | FLIR Systems, Inc. | | | 213,083 | |
| | | |
| | 1,794 | | | | | Gartner, Inc.# | | | 285,192 | |
| | | |
| | 10,007 | | | | | HP, Inc. | | | 199,640 | |
| | | |
| | 29,697 | | | | | Intel Corp.~ | | | 1,515,735 | |
| | | |
| | 4,899 | | | | | International Business Machines Corp. | | | 687,183 | |
| | | |
| | 2,050 | | | | | Intuit, Inc. | | | 514,673 | |
| | | |
| | 1,821 | | | | | Jack Henry & Associates, Inc. | | | 271,438 | |
| | | |
| | 2,036 | | | | | Lam Research Corp. | | | 422,327 | |
| | | |
| | 6,432 | | | | | MasterCard, Inc. - Class A~ | | | 1,635,272 | |
| | | |
| | 13,056 | | | | | Micron Technology, Inc.# | | | 549,135 | |
| | | |
| | 55,853 | | | | | Microsoft Corp.~ | | | 7,294,402 | |
| | | |
| | 5,199 | | | | | NVIDIA Corp.~ | | | 941,019 | |
| | | |
| | 14,017 | | | | | Oracle Corp.~ | | | 775,561 | |
| | | |
| | 3,822 | | | | | Paychex, Inc. | | | 322,233 | |
| | | |
| | 7,401 | | | | | PayPal Holdings, Inc.# | | | 834,611 | |
| | | |
| | 8,576 | | | | | QUALCOMM, Inc. | | | 738,651 | |
| | | |
| | 1,849 | | | | | Red Hat, Inc.# | | | 337,498 | |
| | | |
| | 6,642 | | | | | Salesforce.com, Inc.#~ | | | 1,098,255 | |
| | | |
| | 2,605 | | | | | TE Connectivity, Ltd. | | | 249,168 | |
| | | |
| | 4,775 | | | | | Texas Instruments, Inc. | | | 562,638 | |
| | | |
| | 14,473 | | | | | Visa, Inc. - Class A~ | | | 2,379,795 | |
| | | | | | | | | | |
NUMBER OF
SHARES | | | | | | | VALUE | |
| | | |
| | 12,248 | | | | | Western Union Company | | $ | 238,101 | |
| | | |
| | 5,292 | | | | | Xilinx, Inc. | | | 635,781 | |
| | | | | | | | | | |
| | | | | | | | | 37,970,288 | |
| | | | | | | | | | |
| | | | | | Materials (2.4%) | |
| | 4,136 | | | | | Air Products & Chemicals, Inc. | | | 851,147 | |
| | | |
| | 1,924 | | | | | Avery Dennison Corp. | | | 212,891 | |
| | | |
| | 5,479 | | | | | Ball Corp. | | | 328,411 | |
| | | |
| | 6,715 | | | | | Dow, Inc.# | | | 380,942 | |
| | | |
| | 20,144 | | | | | DowDuPont, Inc.~ | | | 774,537 | |
| | | |
| | 18,932 | | | | | Freeport-McMoRan, Inc. | | | 233,053 | |
| | | |
| | 3,621 | | | | | Linde, PLC | | | 652,722 | |
| | | |
| | 2,986 | | | | | PPG Industries, Inc. | | | 350,855 | |
| | | |
| | 1,128 | | | | | Sherwin-Williams Company | | | 513,048 | |
| | | | | | | | | | |
| | | | | | | | | 4,297,606 | |
| | | | | | | | | | |
| | | | | | Real Estate (3.0%) | |
| | 2,053 | | | | | Alexandria Real Estate Equities, Inc. | | | 292,327 | |
| | | |
| | 2,580 | | | | | American Tower Corp. | | | 503,874 | |
| | | |
| | 4,627 | | | | | Apartment Investment & Management Company - Class A | | | 228,389 | |
| | | |
| | 1,886 | | | | | AvalonBay Communities, Inc. | | | 378,954 | |
| | | |
| | 2,561 | | | | | Crown Castle International Corp. | | | 322,122 | |
| | | |
| | 2,041 | | | | | Digital Realty Trust, Inc. | | | 240,246 | |
| | | |
| | 474 | | | | | Equinix, Inc. | | | 215,528 | |
| | | |
| | 1,829 | | | | | Federal Realty Investment Trust | | | 244,812 | |
| | | |
| | 2,457 | | | | | Mid-America Apartment Communities, Inc. | | | 268,820 | |
| | | |
| | 3,537 | | | | | Prologis, Inc. | | | 271,182 | |
| | | |
| | 1,351 | | | | | Public Storage | | | 298,814 | |
| | | |
| | 4,699 | | | | | Realty Income Corp. | | | 328,977 | |
| | | |
| | 3,829 | | | | | Regency Centers Corp. | | | 257,194 | |
| | | |
| | 2,836 | | | | | Simon Property Group, Inc. | | | 492,613 | |
| | | |
| | 5,945 | | | | | UDR, Inc. | | | 267,228 | |
| | | |
| | 4,811 | | | | | Welltower, Inc. | | | 358,564 | |
| | | |
| | 8,950 | | | | | Weyerhaeuser Company | | | 239,860 | |
| | | | | | | | | | |
| | | | | | | | | 5,209,504 | |
| | | | | | | | | | |
| | | | | | Utilities (3.1%) | |
| | 14,649 | | | | | AES Corp. | | | 250,791 | |
| | | |
| | 5,737 | | | | | American Electric Power Company, Inc.~ | | | 490,800 | |
| | | |
| | 5,336 | | | | | CMS Energy Corp. | | | 296,415 | |
| | | |
| | 4,468 | | | | | Consolidated Edison, Inc. | | | 384,963 | |
| | | |
| | 5,284 | | | | | Dominion Energy, Inc. | | | 411,465 | |
| | | |
| | 7,309 | | | | | Duke Energy Corp. | | | 665,996 | |
| | | |
| | 3,233 | | | | | Edison International | | | 206,168 | |
| | | |
| | 3,270 | | | | | Entergy Corp. | | | 316,863 | |
| | | |
| | 4,505 | | | | | Exelon Corp. | | | 229,530 | |
| | | |
| | 7,400 | | | | | FirstEnergy Corp. | | | 311,022 | |
| | | | |
| 88 | | CALAMOS OPEN-END FAMILY OF FUNDS SEMIANNUAL REPORT | | See accompanying Notes to Schedule of Investments |
Hedged Equity Fund Schedule of Investments April 30, 2019 (Unaudited)
| | | | | | | | | | |
NUMBER OF
SHARES | | | | | | | VALUE | |
| | | |
| | 2,938 | | | | | NextEra Energy, Inc. | | $ | 571,265 | |
| | | |
| | 9,038 | | | | | NiSource, Inc. | | | 251,076 | |
| | | |
| | 5,681 | | | | | Public Service Enterprise Group, Inc. | | | 338,872 | |
| | | |
| | 8,112 | | | | | Southern Company | | | 431,720 | |
| | | |
| | 6,511 | | | | | Xcel Energy, Inc. | | | 367,871 | |
| | | | | | | | | | |
| | | | | | | | | 5,524,817 | |
| | | | | | | | | | |
| | | |
| | | | | | TOTAL COMMON STOCKS
(Cost $162,866,548) | | | 176,664,877 | |
| | | | | | | | | | |
| | | | | | | | | | |
|
| | EXCHANGE-TRADED FUND (4.4%) | |
| | | | | | Other (4.4%) | |
| | | |
| | 25,955 | | | | | SPDR S&P 500 ETF Trust^
(Cost $7,500,993) | | | 7,631,289 | |
| | | | | | | | | | |
| | | | | | | | | | |
NUMBER OF
CONTRACTS/
NOTIONAL
AMOUNT | | | | | | | VALUE | |
|
| | PURCHASED OPTIONS (1.1%)# | |
| | | | | | Communication Services (0.0%) | |
| 62
586,830 |
| | | | Electronic Arts, Inc.
Call, 06/21/19, Strike $105.00 | | | 13,082 | |
| | | |
| 32
618,880 |
| | | | Facebook, Inc.
Put, 06/21/19, Strike $150.00 | | | 672 | |
| | | |
| 14
518,756 |
| | | | Netflix, Inc.
Call, 06/21/19, Strike $370.00 | | | 25,410 | |
| | | | | | | | | | |
| | | | | | | | | 39,164 | |
| | | | | | | | | | |
| | | | | | Consumer Discretionary (0.0%) | |
| 2
137,608 |
| | | | Chipotle Mexican Grill, Inc.
Put, 06/21/19, Strike $450.00 | | | 40 | |
| | | | | | | | | | |
| | | | | | Health Care (0.0%) | |
| 8
117,600 |
| | | | Allergan, PLC
Put, 05/17/19, Strike $135.00 | | | 812 | |
| | | | | | | | | | |
| | | | | | Industrials (0.1%) | |
| 9
339,921 |
| | | | Boeing Company
Call, 05/17/19, Strike $365.00 | | | 13,410 | |
| | | |
| 51
718,692 |
| | | | United Rentals, Inc.
Call, 09/20/19, Strike $130.00 | | | 95,370 | |
| | | | | | | | | | |
| | | | | | | | | 108,780 | |
| | | | | | | | | | |
| | | | | | Information Technology (0.1%) | |
| 32
642,144 |
| | | | Apple, Inc.
Call, 07/19/19, Strike $190.00 | | | 49,120 | |
| | | |
| 65
273,390 |
| | | | Micron Technology, Inc.
Put, 06/21/19, Strike $35.00 | | | 3,023 | |
| | | |
| 48
868,800 |
| | | | NVIDIA Corp.
Call, 09/20/19, Strike $200.00 | | | 48,240 | |
| | | | | | | | | | |
| | | | | | | | | 100,383 | |
| | | | | | | | | | |
| | | | | | | | | | |
NUMBER OF
CONTRACTS/
NOTIONAL
AMOUNT | | | | | | | VALUE | |
| | | | | | | | | | |
| | | | | | Other (0.9%) | |
| | | | | | S&P 500 Index | | | | |
| 150
44,187,450 |
| | | | Call, 05/13/19, Strike $2,985.00 | | $ | 80,250 | |
| 150
44,187,450 |
| | | | Put, 06/28/19, Strike $2,700.00 | | | 180,750 | |
| 100
29,458,300 |
| | | | Call, 05/20/19, Strike $2,950.00 | | | 244,500 | |
| 100
29,458,300 |
| | | | Call, 05/31/19, Strike $3,000.00 | | | 108,500 | |
| 100
29,458,300 |
| | | | Put, 05/31/19, Strike $2,700.00 | | | 47,500 | |
| 75
22,093,725 |
| | | | Put, 07/31/19, Strike $2,750.00 | | | 196,875 | |
| 75
22,093,725 |
| | | | Put, 12/31/19, Strike $2,850.00 | | | 708,000 | |
| 50
14,729,150 |
| | | | Put, 05/31/19, Strike $2,850.00 | | | 67,750 | |
| 50
14,729,150 |
| | | | Put, 05/31/19, Strike $2,600.00 | | | 13,500 | |
| 20
5,891,660 |
| | | | Put, 12/31/19, Strike $2,700.00 | | | 126,100 | |
| | | | | | | | | | |
| | | | | | | | | 1,773,725 | |
| | | | | | | | | | |
| | | |
| | | | | | TOTAL PURCHASED OPTIONS
(Cost $2,827,929) | | | 2,022,904 | |
| | | | | | | | | | |
| | | | | | | | | | |
NUMBER OF
SHARES | | | | | | | VALUE | |
|
| | SHORT TERM INVESTMENTS (2.2%) | |
| | 1,972,869 | | | | | Fidelity Prime Money Market Fund - Institutional Class, 2.500%*** | | | 1,973,461 | |
| | | |
| | 1,972,478 | | | | | Morgan Stanley Institutional Liquidity Funds - Government Portfolio, 2.350%*** | | | 1,972,478 | |
| | | | | | | | | | |
| | | |
| | | | | | TOTAL SHORT TERM INVESTMENTS
(Cost $3,945,939) | | | 3,945,939 | |
| | | | | | | | | | |
| | | | | | | | | | |
NUMBER OF
SHARES/
PRINCIPAL
AMOUNT | | | | | | | VALUE | |
|
| INVESTMENT OF CASH COLLATERAL FOR SECURITIES
LOANED (3.6%) |
|
| | 6,379,104 | | | | | State Street Navigator Securities Lending Government Money Market Portfolio†
(Cost $6,379,104) | | | 6,379,104 | |
| | | | | | | | | | |
| |
| TOTAL INVESTMENTS (112.2%)
(Cost $183,520,513) | | | 196,644,113 | |
| | | | | |
| |
| | PAYABLE UPON RETURN OF SECURITIES ON LOAN(-3.6%) | | | (6,379,104 | ) |
| | | | | |
| |
| | LIABILITIES, LESS OTHER ASSETS(-8.6%) | | | (15,118,638 | ) |
| | | | | |
| |
| | NET ASSETS (100.0%) | | $ | 175,146,371 | |
| | | | | |
| | | | | | | | | | |
| | | | | | |
| See accompanying Notes to Schedule of Investments | | www.calamos.com | | | 89 | |
Hedged Equity Fund Schedule of Investments April 30, 2019 (Unaudited)
| | | | | | | | | | |
NUMBER OF
CONTRACTS/
NOTIONAL
AMOUNT | | | | | | | VALUE | |
|
| | WRITTEN OPTIONS(-8.9%)# | |
| | | | | | Communication Services (0.0%) | |
| 21
101,241 |
| | | | Activision Blizzard, Inc.
Put, 05/17/19, Strike $35.00 | | $ | (63 | ) |
| | | |
| | | | | | Electronic Arts, Inc. | | | | |
| 62
586,830 |
| | | | Call, 06/21/19, Strike $110.00 | | | (7,409 | ) |
| 31
293,415 |
| | | | Put, 06/21/19, Strike $85.00 | | | (6,185 | ) |
| | | |
| 70
1,353,800 |
| | | | Facebook, Inc.
Put, 06/21/19, Strike $135.00 | | | (525 | ) |
| | | |
| 28
1,037,512 |
| | | | Netflix, Inc.
Call, 06/21/19, Strike $400.00 | | | (17,780 | ) |
| | | | | | | | | | |
| | | | | | | | | (31,962 | ) |
| | | | | | | | | | |
| | | | | | Consumer Discretionary (0.0%) | |
| 6
412,824 |
| | | | Chipotle Mexican Grill, Inc.
Put, 06/21/19, Strike $410.00 | | | (180 | ) |
| | | |
| 15
85,815 |
| | | | Foot Locker, Inc.
Put, 05/17/19, Strike $45.00 | | | (112 | ) |
| | | |
| 24
346,680 |
| | | | Wynn Resorts, Ltd.
Put, 06/21/19, Strike $100.00 | | | (456 | ) |
| | | | | | | | | | |
| | | | | | | | | (748 | ) |
| | | | | | | | | | |
| | | | | | Health Care (0.0%) | |
| 16
235,200 |
| | | | Allergan, PLC
Put, 05/17/19, Strike $125.00 | | | (672 | ) |
| | | | | | | | | | |
| | | | | | Industrials(-0.1%) | |
| 18
679,842 |
| | | | Boeing Company
Call, 05/17/19, Strike $390.00 | | | (4,221 | ) |
| | | |
| | | | | | United Rentals, Inc. | | | | |
| 51
718,692 |
| | | | Call, 09/20/19, Strike $135.00 | | | (80,070 | ) |
| 17
239,564 |
| | | | Put, 09/20/19, Strike $115.00 | | | (5,185 | ) |
| | | | | | | | | | |
| | | | | | | | | (89,476 | ) |
| | | | | | | | | | |
| | | | | | Information Technology(-0.1%) | |
| 64
1,284,288 |
| | | | Apple, Inc.
Call, 07/19/19, Strike $200.00 | | | (58,720 | ) |
| | | |
| 130
546,780 |
| | | | Micron Technology, Inc.
Put, 06/21/19, Strike $31.00 | | | (1,950 | ) |
| | | |
| | | | | | NVIDIA Corp. | | | | |
| 48
868,800 |
| | | | Call, 09/20/19, Strike $210.00 | | | (34,440 | ) |
| 24
434,400 |
| | | | Put, 09/20/19, Strike $160.00 | | | (18,900 | ) |
| | | | | | | | | | |
| | | | | | | | | (114,010 | ) |
| | | | | | | | | | |
| | | | | | Other(-8.7%) | |
| | | | | | S&P 500 Index | | | | |
| 185
54,497,855 |
| | | | Call, 12/31/19, Strike $2,500.00 | | | (9,050,200 | ) |
| 170
50,079,110 |
| | | | Put, 12/31/19, Strike $2,500.00 | | | (618,800 | ) |
| | | | | | | | | | |
NUMBER OF
CONTRACTS/
NOTIONAL
AMOUNT | | | | | | | VALUE | |
| 160
47,133,280 |
| | | | Call, 06/28/19, Strike $2,675.00 | | $ | (4,539,200 | ) |
| 100
29,458,300 |
| | | | Call, 12/31/19, Strike $3,000.00 | | | (1,043,000 | ) |
| 75
22,093,725 |
| | | | Put, 07/31/19, Strike $2,500.00 | | | (70,875 | ) |
| | | | | | | | | | |
| | | | | | | | | (15,322,075 | ) |
| | | | | | | | | | |
| | | |
| | | | | | TOTAL WRITTEN OPTIONS
(Premium $9,172,336) | | $ | (15,558,943 | ) |
| | | | | | | | | | |
NOTES TO SCHEDULE OF INVESTMENTS
| # | Non-income producing security. |
| ~ | Security, or portion of security, is segregated as collateral (or collateral for potential future transactions) for written options. The aggregate value of such securities is $54,280,964. |
| ^ | Security, or portion of security, is on loan. |
| *** | The rate disclosed is the 7 day net yield as of April 30, 2019. |
| † | Represents investment of cash collateral received from securities on loan as of April 30, 2019. |
Note: The date on options represents the expiration date of the option contract. The option contract may be exercised at any date on or before the date shown.
| | | | |
| 90 | | CALAMOS OPEN-END FAMILY OF FUNDS SEMIANNUAL REPORT | | See accompanying Notes to Financial Statements |
Phineus Long/Short Fund Schedule of Investments April 30, 2019 (Unaudited)
| | | | | | | | | | |
NUMBER OF
SHARES | | | | | | | VALUE | |
| |
| | COMMON STOCKS (87.7%) | | | | |
| | | | | | Communication Services (9.8%) | |
| | 33,500 | | | | | Alphabet, Inc. - Class A#~ | | $ | 40,165,160 | |
| | | |
| | 221,000 | | | | | Facebook, Inc. - Class A#~ | | | 42,741,400 | |
| | | |
| | 240,000 | | | | | Twitter, Inc.# | | | 9,578,400 | |
| | | | | | | | | | |
| | | | | | | | | 92,484,960 | |
| | | | | | | | | | |
| | | | | | Consumer Discretionary (7.2%) | |
| | 5,500 | | | | | Booking Holdings, Inc.#~ | | | 10,202,445 | |
| | | |
| | 129,000 | | | | | Lowe’s Companies, Inc.~ | | | 14,595,060 | |
| | | |
| | 126,000 | | | | | McDonald’s Corp.~ | | | 24,893,820 | |
| | | |
| | 696,500 | | | | | MGM Resorts International~ | | | 18,547,795 | |
| | | | | | | | | | |
| | | | | | | | | 68,239,120 | |
| | | | | | | | | | |
| | | | | | Consumer Staples (2.2%) | |
| | 199,000 | | | | | Walmart, Inc. | | | 20,465,160 | |
| | | | | | | | | | |
| | | | | | Energy (2.2%) | |
| | 263,000 | | | | | Exxon Mobil Corp. | | | 21,113,640 | |
| | | | | | | | | | |
| | | | | | Financials (32.8%) | |
| | 1,132,000 | | | | | Bank of America Corp.~ | | | 34,616,560 | |
| | | |
| | 290,000 | | | | | Cboe Global Markets, Inc.~ | | | 29,466,900 | |
| | | |
| | 345,000 | | | | | Citigroup, Inc.~ | | | 24,391,500 | |
| | | |
| | 261,000 | | | | | E*TRADE Financial Corp.~ | | | 13,222,260 | |
| | | |
| | 211,000 | | | | | Goldman Sachs Group, Inc.~ | | | 43,449,120 | |
| | | |
| | 1,475,000 | | | EUR | | ING Groep, NV | | | 18,821,038 | |
| | | |
| | 265,000 | | | | | Intercontinental Exchange, Inc.~ | | | 21,557,750 | |
| | | |
| | 333,500 | | | | | JPMorgan Chase & Company~ | | | 38,702,675 | |
| | | |
| | 913,500 | | | | | Morgan Stanley~ | | | 44,076,375 | |
| | | |
| | 313,000 | | | | | SLM Corp.~ | | | 3,180,080 | |
| | | |
| | 1,981,000 | | | | | UBS Group, AG#~^ | | | 26,624,640 | |
| | | |
| | 277,500 | | | | | Unum Group~ | | | 10,245,300 | |
| | | | | | | | | | |
| | | | | | | | | 308,354,198 | |
| | | | | | | | | | |
| | | | | | Health Care (12.4%) | |
| | 205,000 | | | | | Alexion Pharmaceuticals, Inc.#~ | | | 27,906,650 | |
| | | |
| | 73,500 | | | | | Humana, Inc. | | | 18,772,635 | |
| | | |
| | 137,500 | | | | | Johnson & Johnson~ | | | 19,415,000 | |
| | | |
| | 200,000 | | | | | Laboratory Corp. of America Holdings#~ | | | 31,984,000 | |
| | | |
| | 211,500 | | | | | Medtronic, PLC | | | 18,783,315 | |
| | | | | | | | | | |
| | | | | | | | | 116,861,600 | |
| | | | | | | | | | |
| | | | | | Industrials (15.1%) | |
| | 316,000 | | | | | Air Lease Corp.~ | | | 12,184,960 | |
| | | |
| | 448,000 | | | | | Delta Air Lines, Inc.~ | | | 26,113,920 | |
| | | |
| | 290,500 | | | | | Emerson Electric Company~ | | | 20,622,595 | |
| | | |
| | 430,000 | | | | | Fluor Corp.~ | | | 17,083,900 | |
| | | |
| | 119,000 | | | | | Harris Corp.~ | | | 20,051,500 | |
| | | |
| | 73,500 | | | | | Honeywell International, Inc.~ | | | 12,761,805 | |
| | | |
| | 2,182 | | | | | Lyft, Inc. - Class A#^ | | | 130,484 | |
| | | | | | | | | | |
NUMBER OF
SHARES | | | | | | | VALUE | |
| | | |
| | 130,000 | | | | | Raytheon Company~ | | $ | 23,086,700 | |
| | | |
| | 108,500 | | | | | United Continental Holdings, Inc.# | | | 9,641,310 | |
| | | | | | | | | | |
| | | | | | | | | 141,677,174 | |
| | | | | | | | | | |
| | | | | | Information Technology (3.7%) | |
| | 86,000 | | | | | Fidelity National Information Services, Inc. | | | 9,969,980 | |
| | | |
| | 404,000 | | | | | First Solar, Inc.#~^ | | | 24,858,120 | |
| | | | | | | | | | |
| | | | | | | | | 34,828,100 | |
| | | | | | | | | | |
| | | | | | Materials (2.3%) | |
| | 106,000 | | | | | Air Products & Chemicals, Inc.~ | | | 21,813,740 | |
| | | | | | | | | | |
| | | |
| | | | | | TOTAL COMMON STOCKS
(Cost $799,087,388) | | | 825,837,692 | |
| | | | | | | | | | |
| | | | | | | | | | |
|
| | INVESTMENTS IN AFFILIATED FUND (3.8%) | |
| | | | | | Other (3.8%) | |
| | 3,535,359 | | | | | Calamos Short-Term Bond Fund - Class I
(Cost $35,250,728) | | | 35,636,415 | |
| | | | | | | | | | |
| | | | | | | | | | |
NUMBER OF
CONTRACTS/
NOTIONAL
AMOUNT | | | | | | | VALUE | |
| |
| | PURCHASED OPTIONS (0.3%)# | | | | |
| | | | | | Communication Services (0.1%) | |
| 2,400
9,578,400 |
| | | | Twitter, Inc.
Call, 06/21/19, Strike $40.00 | | | 504,000 | |
| | | | | | | | | | |
| | | | | | Consumer Discretionary (0.0%) | |
| 145
27,934,540 |
| | | | Amazon.com, Inc.
Call, 05/17/19, Strike $2,000.00 | | | 121,800 | |
| | | | | | | | | | |
| | | | | | Consumer Staples (0.0%) | |
| 1,825
18,768,300 |
| | | | Walmart, Inc.
Call, 05/31/19, Strike $105.00 | | | 260,063 | |
| | | | | | | | | | |
| | | | | | Health Care (0.0%) | |
| 9,200
37,361,200 |
| | | | Pfizer, Inc.
Call, 05/17/19, Strike $43.00 | | | 23,000 | |
| | | | | | | | | | |
| | | | | | Industrials (0.0%) | |
| 510
9,662,460 |
| | | | Fedex Corp.
Put, 05/17/19, Strike $170.00 | | | 12,495 | |
| | | | | | | | | | |
| | | | | | Information Technology (0.0%) | |
| 1,900
31,416,500 |
| | | | Salesforce.com, Inc.
Put, 05/17/19, Strike $155.00 | | | 130,150 | |
| | | | | | | | | | |
| | | | | | Other (0.2%) | |
| 36,500
102,273,000 |
| | | | Financial Select Sector SPDR Fund
Put, 05/17/19, Strike $26.00 | | | 146,000 | |
| | | |
| 6,200
15,921,600 |
| | | | iPath Series B S&P 500 VIX Short-Team Futures ETN
Call, 05/17/19, Strike $27.00 | | | 558,000 | |
| | | | | | |
| See accompanying Notes to Schedule of Investments | | www.calamos.com | | | 91 | |
Phineus Long/Short Fund Schedule of Investments April 30, 2019 (Unaudited)
| | | | | | | | | | |
NUMBER OF
CONTRACTS/
NOTIONAL
AMOUNT | | | | | | | VALUE | |
| | | |
| | | | | | SPDR S&P 500 ETF Trust | | | | |
| 3,500
102,907,000 |
| | | | Put, 05/03/19, Strike $286.00 | | $ | 33,250 | |
| 3,500
102,907,000 |
| | | | Put, 05/17/19, Strike $275.00 | | | 105,000 | |
| 3,500
102,907,000 |
| | | | Put, 05/28/19, Strike $290.00 | | | 640,500 | |
| | | | | | | | | | |
| | | | | | | | | 1,482,750 | |
| | | | | | | | | | |
| | | |
| | | | | | TOTAL PURCHASED OPTIONS
(Cost $8,219,237) | | | 2,534,258 | |
| | | | | | | | | | |
| | | | | | | | | | |
NUMBER OF
SHARES | | | | | | | VALUE | |
|
| | SHORT TERM INVESTMENTS (6.2%) | |
| | 29,049,003 | | | | | Fidelity Prime Money Market Fund - Institutional Class, 2.500%*** | | | 29,057,717 | |
| | | |
| | 29,031,498 | | | | | Morgan Stanley Institutional Liquidity Funds - Government Portfolio, 2.350%*** | | | 29,031,498 | |
| | | | | | | | | | |
| | | |
| | | | | | TOTAL SHORT TERM INVESTMENTS
(Cost $58,089,215) | | | 58,089,215 | |
| | | | | | | | | | |
| | | | | | | | | | |
NUMBER OF
SHARES/
PRINCIPAL
AMOUNT | | | | | | | VALUE | |
|
| INVESTMENT OF CASH COLLATERAL FOR SECURITIES
LOANED (2.3%) |
|
| | 5,878,622 | | | | | Fidelity Prime Money Market Fund - Institutional Class, 2.500%***† | | | 5,878,622 | |
| | | |
| | 15,795,733 | | | | | State Street Navigator Securities Lending Government Money Market Portfolio† | | | 15,795,733 | |
| | | | | | | | | | |
| | | |
| | | | | | TOTAL INVESTMENT OF
CASH COLLATERAL FOR
SECURITIES LOANED
(Cost $21,674,355) | | | 21,674,355 | |
| | | | | | | | | | |
| |
| TOTAL INVESTMENTS (100.3%)
(Cost $922,320,923) | | | 943,771,935 | |
| | | | | | | | | | |
| |
| | PAYABLE UPON RETURN OF SECURITIES ONLOAN (-2.3%) | | | (21,674,355 | ) |
| | | | | | | | | | |
| |
| | OTHER ASSETS, LESS LIABILITIES (2.0%) | | | 19,306,461 | |
| | | | | | | | | | |
| |
| | NET ASSETS (100.0%) | | $ | 941,404,041 | |
| | | | | | | | | | |
| | | | | | | | | | |
NUMBER OF
SHARES | | | | | | | VALUE | |
|
| | COMMON STOCK SOLD SHORT(-0.6%)# | |
| | | | | | Consumer Discretionary(-0.6%) | |
| | (70,000 | ) | | | | CarMax, Inc.
(Proceeds $(4,759,899)) | | | (5,450,200 | ) |
| | | | | | | | | | |
| | | | | | | | | | |
NUMBER OF
SHARES | | | | | | | VALUE | |
|
| | EXCHANGE-TRADED FUNDS SOLD SHORT(-88.9%)# | |
| | | | | | Other(-88.9%) | |
| | (450,000 | ) | | | | Financial Select Sector SPDR Fund | | $ | (12,609,000 | ) |
| | | |
| | (520,500 | ) | | | | Industrial Select Sector SPDR Fund | | | (40,604,205 | ) |
| | | |
| | (2,558,400 | ) | | | | SPDR S&P 500 ETF Trust | | | (752,220,768 | ) |
| | | |
| | (275,000 | ) | | | | VanEck Vectors Semiconductor ETF | | | (31,968,750 | ) |
| | | | | | | | | | |
| | | |
| | | | | | TOTAL EXCHANGE-TRADED FUNDS SOLD SHORT
(Proceeds $767,003,836) | | | (837,402,723 | ) |
| | | | | | | | | | |
| |
| TOTAL SECURITIES SOLD SHORT
(Proceeds $771,763,735) | | | (842,852,923 | ) |
| | | | | | | | | | |
| | | | | | | | | | |
NUMBER OF
CONTRACTS/
NOTIONAL
AMOUNT | | | | | | | VALUE | |
|
| | WRITTEN OPTIONS(-0.6%)# | |
| | | | | | Communication Services(-0.2%) | |
| | | | | | Facebook, Inc. | | | | |
| 2,210
42,741,400 |
| | | | Call, 06/21/19, Strike $195.00 | | | (1,419,925 | ) |
| 1,450
28,043,000 |
| | | | Put, 06/21/19, Strike $140.00 | | | (16,675 | ) |
| 690
13,344,600 |
| | | | Call, 07/19/19, Strike $215.00 | | | (130,755 | ) |
| | | | | | | | | | |
| | | | | | | | | (1,567,355 | ) |
| | | | | | | | | | |
| | | | | | Consumer Discretionary(-0.1%) | |
| | | | | | Amazon.com, Inc. | | | | |
| 145
27,934,540 |
| | | | Call, 06/21/19, Strike $2,000.00 | | | (467,262 | ) |
| 130
25,044,760 |
| | | | Call, 06/21/19, Strike $2,175.00 | | | (51,025 | ) |
| | | | | | | | | | |
| | | | | | | | | (518,287 | ) |
| | | | | | | | | | |
| | | | | | Financials(-0.1%) | |
| 3,450
24,391,500 |
| | | | Citigroup, Inc.
Call, 06/21/19, Strike $67.50 | | | (1,440,375 | ) |
| | | | | | | | | | |
| | | | | | Health Care(-0.1%) | |
| 4,600
18,680,600 |
| | | | Pfizer, Inc.
Put, 05/17/19, Strike $42.00 | | | (821,100 | ) |
| | | |
| 815
18,995,205 |
| | | | Unitedhealth Group, Inc.
Put, 06/21/19, Strike $210.00 | | | (162,185 | ) |
| | | | | | | | | | |
| | | | | | | | | (983,285 | ) |
| | | | | | | | | | |
| | | | | | Industrials (0.0%) | |
| 510
9,662,460 |
| | | | Fedex Corp.
Call, 06/21/19, Strike $190.00 | | | (334,050 | ) |
| | | | | | | | | | |
| | | | | | Information Technology (0.0%) | |
| 1,900
31,416,500 |
| | | | Salesforce.com, Inc.
Put, 06/21/19, Strike $135.00 | | | (134,900 | ) |
| | | | | | | | | | |
| | | | | | Other(-0.1%) | |
| 18,500
51,837,000 |
| | | | Financial Select Sector SPDR Fund
Put, 06/28/19, Strike $24.00 | | | (138,750 | ) |
| | | | |
| 92 | | CALAMOS OPEN-END FAMILY OF FUNDS SEMIANNUAL REPORT | | See accompanying Notes to Schedule of Investments |
Phineus Long/Short Fund Schedule of Investments April 30, 2019 (Unaudited)
| | | | | | | | | | |
NUMBER OF
CONTRACTS/
NOTIONAL
AMOUNT | | | | | | | VALUE | |
| | | | | | SPDR S&P 500 ETF Trust | | | | |
| 5,250
154,360,500 |
| | | | Put, 06/28/19, Strike $270.00 | | $ | (651,000 | ) |
| 3,500
102,907,000 |
| | | | Put, 05/03/19, Strike $270.00 | | | (5,250 | ) |
| 3,500
102,907,000 |
| | | | Put, 06/28/19, Strike $250.00 | | | (175,000 | ) |
| 3,500
102,907,000 |
| | | | Put, 06/28/19, Strike $240.00 | | | (119,000 | ) |
| | | | | | | | | | |
| | | | (1,089,000 | ) |
| | | | | | | | | | |
| | | |
| | | | | | TOTAL WRITTEN OPTIONS
(Premium $5,165,649) | | $ | (6,067,252 | ) |
| | | | | | | | | | |
NOTES TO SCHEDULE OF INVESTMENTS
| # | Non-income producing security. |
| ~ | Security, or portion of security, is segregated as collateral (or collateral for potential future transactions) for written options. The aggregate value of such securities is $390,102,217. |
| ^ | Security, or portion of security, is on loan. |
| *** | The rate disclosed is the 7 day net yield as of April 30, 2019. |
| † | Represents investment of cash collateral received from securities on loan as of April 30, 2019. |
FOREIGN CURRENCY ABBREVIATION
| | |
| |
| EUR | | European Monetary Unit |
Note: Value for securities denominated in foreign currencies is shown in U.S. dollars. The date on options represents the expiration date of the option contract. The option contract may be exercised at any date on or before the date shown.
| | | | | | |
| See accompanying Notes to Financial Statements | | www.calamos.com | | | 93 | |
Convertible Fund Schedule of Investments April 30, 2019 (Unaudited)
| | | | | | | | | | |
PRINCIPAL
AMOUNT | | | | | | | VALUE | |
|
| | CONVERTIBLE BONDS (79.5%) | |
| | | | | | Communication Services (7.2%) | |
| | 8,900,000 | | | | | GCI Liberty, Inc.*
1.750%, 09/30/46 | | $ | 10,058,869 | |
| | | |
| | | | | | Liberty Media Corp. | | | | |
| | 8,380,000 | | | | | 1.375%, 10/15/23 | | | 9,783,524 | |
| | 7,200,000 | | | | | 2.250%, 09/30/46 | | | 3,728,520 | |
| | 1,750,000 | | | | | 2.250%, 12/01/48*^ | | | 1,976,546 | |
| | | |
| | 3,250,000 | | | | | Liberty Media Corp. (Sirius XM Holdings, Inc.)*§
2.125%, 03/31/48 | | | 3,156,384 | |
| | | |
| | 6,250,000 | | | | | Liberty Media Corp. / Liberty Formula One
1.000%, 01/30/23 | | | 7,501,250 | |
| | | |
| | 13,935,000 | | | | | Twitter, Inc.*
0.250%, 06/15/24 | | | 14,058,464 | |
| | | | | | | | | | |
| | | | | | | | | 50,263,557 | |
| | | | | | | | | | |
| | | | | | Consumer Discretionary (8.3%) | |
| | 8,750,000 | | | | | Booking Holdings, Inc.
0.350%, 06/15/20 | | | 12,511,056 | |
| | | |
| | 4,250,000 | | | | | Caesars Entertainment Corp.
5.000%, 10/01/24 | | | 6,298,033 | |
| | | |
| | 2,343,000 | | | | | Chegg, Inc.*
0.125%, 03/15/25 | | | 2,244,781 | |
| | | |
| | 11,500,000 | | | | | DISH Network Corp.
3.375%, 08/15/26 | | | 10,557,862 | |
| | | |
| | 3,800,000 | | | | | Guess, Inc.*^
2.000%, 04/15/24 | | | 3,973,983 | |
| | | |
| | 5,250,000 | | | | | NIO, Inc.*
4.500%, 02/01/24 | | | 4,035,938 | |
| | | |
| | 3,150,000 | | | | | Quotient Technology, Inc.
1.750%, 12/01/22 | | | 2,933,894 | |
| | | |
| | 2,500,000 | | | | | RH
0.000%, 07/15/20 | | | 2,774,063 | |
| | | |
| | 13,000,000 | | | | | Tesla, Inc.^
1.250%, 03/01/21 | | | 12,785,695 | |
| | | | | | | | | | |
| | | | | | | | | 58,115,305 | |
| | | | | | | | | | |
| | | | | | Energy (4.2%) | |
| | 2,200,000 | | | | | Helix Energy Solutions Group, Inc.
4.125%, 09/15/23 | | | 2,504,579 | |
| | | |
| | 4,631,000 | | | | | Oil States International, Inc.
1.500%, 02/15/23 | | | 4,175,634 | |
| | | |
| | 5,750,000 | | | | | PDC Energy, Inc.
1.125%, 09/15/21 | | | 5,464,196 | |
| | | |
| | 5,750,000 | | | | | SM Energy Company
1.500%, 07/01/21 | | | 5,350,087 | |
| | | |
| | 5,600,000 | | | | | TOTAL, SA
0.500%, 12/02/22 | | | 5,965,848 | |
| | | |
| | 5,380,000 | | | | | Transocean, Inc.^
0.500%, 01/30/23 | | | 5,779,008 | |
| | | | | | | | | | |
| | | | | | | | | 29,239,352 | |
| | | | | | | | | | |
| | | | | | | | | | |
PRINCIPAL
AMOUNT | | | | | | | VALUE | |
| | | | | | | | | | |
| | | | | | Financials (4.7%) | |
| | 7,000,000 | | | | | Ares Capital Corp.^
4.625%, 03/01/24 | | $ | 7,094,605 | |
| | | |
| | 4,765,000 | | | | | Hope Bancorp, Inc.*
2.000%, 05/15/38 | | | 4,316,137 | |
| | | |
| | 2,982,000 | | | | | IAC FinanceCo, Inc.*
0.875%, 10/01/22 | | | 4,630,077 | |
| | | |
| | 6,300,000 | | | | | JPMorgan Chase Bank, N.A.
0.000%, 12/30/20 | | | 7,401,177 | |
| | | |
| | 6,250,000 | | | | | JPMorgan Chase Financial Company, LLC (Voya Financial, Inc.)*§
0.250%, 05/01/23 | | | 6,306,125 | |
| | | |
| | 3,000,000 | | | | | Starwood Property Trust, Inc.
4.375%, 04/01/23 | | | 3,005,460 | |
| | | | | | | | | | |
| | | | | | | | | 32,753,581 | |
| | | | | | | | | | |
| | | | | | Health Care (14.3%) | |
| | 9,500,000 | | | | | BioMarin Pharmaceutical, Inc.^
1.500%, 10/15/20 | | | 10,676,860 | |
| | | |
| | 6,250,000 | | | | | CONMED Corp.*
2.625%, 02/01/24 | | | 6,875,969 | |
| | | |
| | 7,631,000 | | | | | DexCom, Inc.*
0.750%, 12/01/23 | | | 7,964,818 | |
| | | |
| | 3,500,000 | | | | | Evolent Health, Inc.*
1.500%, 10/15/25 | | | 2,868,250 | |
| | | |
| | 6,750,000 | | | | | Exact Sciences Corp.^
0.375%, 03/15/27 | | | 7,579,507 | |
| | | |
| | 2,400,000 | | | | | Flexion Therapeutics, Inc.
3.375%, 05/01/24 | | | 2,029,764 | |
| | | |
| | 4,750,000 | | | | | Illumina, Inc.^
0.500%, 06/15/21 | | | 6,503,937 | |
| | | |
| | | | | | Innoviva, Inc. | | | | |
| | 3,250,000 | | | | | 2.125%, 01/15/23 | | | 3,344,315 | |
| | 477,000 | | | | | 2.500%, 08/15/25 | | | 512,112 | |
| | | |
| | 1,500,000 | | | | | Insmed, Inc.^
1.750%, 01/15/25 | | | 1,562,273 | |
| | | |
| | 6,000,000 | | | | | Insulet Corp.*
1.375%, 11/15/24 | | | 6,823,410 | |
| | | |
| | 5,250,000 | | | | | Ionis Pharmaceuticals, Inc.
1.000%, 11/15/21 | | | 6,751,054 | |
| | | |
| | 5,540,000 | | | | | Jazz Investments I, Ltd.
1.875%, 08/15/21 | | | 5,514,544 | |
| | | |
| | 1,100,000 | | | | | Medicines Company^
2.500%, 01/15/22 | | | 1,198,318 | |
| | | |
| | 2,740,000 | | | | | Neurocrine Biosciences, Inc.
2.250%, 05/15/24 | | | 3,318,852 | |
| | | |
| | 2,575,000 | | | | | NuVasive, Inc.
2.250%, 03/15/21 | | | 2,950,010 | |
| | | |
| | 3,000,000 | | | | | Pacira BioSciences, Inc.^
2.375%, 04/01/22 | | | 3,005,805 | |
| | | |
| | 2,000,000 | | | | | Sarepta Therapeutics, Inc.
1.500%, 11/15/24 | | | 3,518,320 | |
| | | |
| | 2,652,000 | | | | | Supernus Pharmaceuticals, Inc.^
0.625%, 04/01/23 | | | 2,679,475 | |
| | | | |
| 94 | | CALAMOS OPEN-END FAMILY OF FUNDS SEMIANNUAL REPORT | | See accompanying Notes to Schedule of Investments |
Convertible Fund Schedule of Investments April 30, 2019 (Unaudited)
| | | | | | | | | | |
PRINCIPAL
AMOUNT | | | | | | | VALUE | |
| | | |
| | 3,700,000 | | | | | Tabula Rasa HealthCare, Inc.*
1.750%, 02/15/26 | | $ | 3,859,674 | |
| | | |
| | 3,250,000 | | | | | Teladoc Health, Inc.*^
1.375%, 05/15/25 | | | 4,355,325 | |
| | | |
| | 6,000,000 | | | | | Wright Medical Group, Inc.*^
1.625%, 06/15/23 | | | 6,531,510 | |
| | | | | | | | | | |
| | | | | | | | | 100,424,102 | |
| | | | | | | | | | |
| | | | | | Industrials (3.2%) | |
| | 3,500,000 | | | | | Air Transport Services Group, Inc.
1.125%, 10/15/24 | | | 3,506,037 | |
| | | |
| | 3,250,000 | | | | | Atlas Air Worldwide Holdings, Inc.^
2.250%, 06/01/22 | | | 3,365,229 | |
| | | |
| | 5,652,000 | | | | | Fortive Corp.*^
0.875%, 02/15/22 | | | 5,983,914 | |
| | | |
| | 2,501,000 | | | | | FTI Consulting, Inc.*
2.000%, 08/15/23 | | | 2,687,925 | |
| | | |
| | 4,500,000 | | | | | Greenbrier Companies, Inc.^
2.875%, 02/01/24 | | | 4,519,530 | |
| | | |
| | 2,750,000 | | | | | Meritor, Inc.^
3.250%, 10/15/37 | | | 2,825,061 | |
| | | | | | | | | | |
| | | | | | | | | 22,887,696 | |
| | | | | | | | | | |
| | | | | | Information Technology (34.7%) | |
| | 6,350,000 | | | | | 8x8, Inc.*
0.500%, 02/01/24 | | | 7,154,354 | |
| | | |
| | 2,000,000 | | | | | Advanced Micro Devices, Inc.
2.125%, 09/01/26 | | | 7,065,470 | |
| | | |
| | 6,004,000 | | | | | Akamai Technologies, Inc.*^
0.125%, 05/01/25 | | | 6,354,333 | |
| | | |
| | 6,900,000 | | | | | DocuSign, Inc.*^
0.500%, 09/15/23 | | | 7,420,156 | |
| | | |
| | | | | | Envestnet, Inc. | | | | |
| | 3,285,000 | | | | | 1.750%, 06/01/23* | | | 3,959,394 | |
| | 2,750,000 | | | | | 1.750%, 12/15/19 | | | 3,235,678 | |
| | | |
| | 3,180,000 | | | | | Euronet Worldwide, Inc.*^
0.750%, 03/15/49 | | | 3,563,603 | |
| | | |
| | 3,250,000 | | | | | FireEye, Inc.*^
0.875%, 06/01/24 | | | 3,274,489 | |
| | | |
| | 6,000,000 | | | | | Guidewire Software, Inc.
1.250%, 03/15/25 | | | 6,862,680 | |
| | | |
| | 5,400,000 | | | | | II-VI, Inc.
0.250%, 09/01/22 | | | 5,907,600 | |
| | | |
| | 6,100,000 | | | | | Inphi Corp.
0.750%, 09/01/21 | | | 6,477,804 | |
| | | |
| | 4,250,000 | | | | | Intel Corp.
3.250%, 08/01/39 | | | 10,627,869 | |
| | | |
| | 3,750,000 | | | | | LivePerson, Inc.*
0.750%, 03/01/24 | | | 3,882,731 | |
| | | |
| | 3,750,000 | | | | | Lumentum Holdings, Inc.^
0.250%, 03/15/24 | | | 4,677,319 | |
| | | |
| | 15,250,000 | | | | | Microchip Technology, Inc.
1.625%, 02/15/27 | | | 19,779,631 | |
| | | |
| | 7,700,000 | | | | | New Relic, Inc.*^
0.500%, 05/01/23 | | | 8,979,047 | |
| | | | | | | | | | |
PRINCIPAL
AMOUNT | | | | | | | VALUE | |
| | | |
| | 9,150,000 | | | | | NXP Semiconductors, NV
1.000%, 12/01/19 | | $ | 10,119,442 | |
| | | |
| | | | | | ON Semiconductor Corp. | | | | |
| | 5,800,000 | | | | | 1.000%, 12/01/20 | | | 7,777,278 | |
| | 3,000,000 | | | | | 1.625%, 10/15/23^ | | | 3,948,360 | |
| | | |
| | 3,250,000 | | | | | OSI Systems, Inc.
1.250%, 09/01/22 | | | 3,371,973 | |
| | | |
| | 16,750,000 | | | | | Palo Alto Networks, Inc.*
0.750%, 07/01/23 | | | 18,989,642 | |
| | | |
| | 1,764,000 | | | | | Pluralsight, Inc.*
0.375%, 03/01/24 | | | 2,016,737 | |
| | | |
| | 3,350,000 | | | | | Pure Storage, Inc.
0.125%, 04/15/23 | | | 3,709,690 | |
| | | |
| | 1,654,000 | | | | | Q2 Holdings, Inc.
0.750%, 02/15/23 | | | 2,322,034 | |
| | | |
| | 1,906,000 | | | | | Rapid7, Inc.*
1.250%, 08/01/23 | | | 2,760,298 | |
| | | |
| | 2,000,000 | | | | | RealPage, Inc.
1.500%, 11/15/22 | | | 3,269,470 | |
| | | |
| | 2,500,000 | | | | | Silicon Laboratories, Inc.
1.375%, 03/01/22 | | | 3,184,638 | |
| | | |
| | 13,870,000 | | | | | Splunk, Inc.*^
1.125%, 09/15/25 | | | 16,100,851 | |
| | | |
| | 8,000,000 | | | | | Square, Inc.*^
0.500%, 05/15/23 | | | 9,519,560 | |
| | | |
| | 2,620,000 | | | | | Synaptics, Inc.
0.500%, 06/15/22 | | | 2,393,436 | |
| | | |
| | 2,500,000 | | | | | Twilio, Inc.*
0.250%, 06/01/23 | | | 5,043,825 | |
| | | |
| | 5,500,000 | | | | | Viavi Solutions, Inc.^
1.000%, 03/01/24 | | | 6,437,750 | |
| | | |
| | 6,700,000 | | | | | Wix.com, Ltd.*^
0.000%, 07/01/23 | | | 7,872,098 | |
| | | |
| | 9,500,000 | | | | | Workday, Inc.
0.250%, 10/01/22 | | | 14,105,457 | |
| | | |
| | 7,500,000 | | | | | Zendesk, Inc.
0.250%, 03/15/23 | | | 11,332,500 | |
| | | | | | | | | | |
| | | | | | | | | 243,497,197 | |
| | | | | | | | | | |
| | | | | | Materials (0.5%) | |
| | 3,450,000 | | | | | Royal Gold, Inc.
2.875%, 06/15/19 | | | 3,450,276 | |
| | | | | | | | | | |
| | | | | | Real Estate (1.9%) | |
| | 3,100,000 | | | | | Empire State Realty OP, LP*
2.625%, 08/15/19 | | | 3,092,095 | |
| | | |
| | 3,000,000 | | | | | Extra Space Storage, LP*
3.125%, 10/01/35 | | | 3,510,285 | |
| | | |
| | 6,000,000 | | | | | IH Merger Sub, LLC
3.500%, 01/15/22 | | | 6,968,850 | |
| | | | | | | | | | |
| | | | | | | | | 13,571,230 | |
| | | | | | | | | | |
| | | | | | |
| See accompanying Notes to Schedule of Investments | | www.calamos.com | | | 95 | |
Convertible Fund Schedule of Investments April 30, 2019 (Unaudited)
| | | | | | | | | | |
PRINCIPAL
AMOUNT | | | | | | | VALUE | |
| | | | | | | | | | |
| | | | | | Utilities (0.5%) | |
| | 3,250,000 | | | | | NRG Energy, Inc.*
2.750%, 06/01/48 | | $ | 3,655,161 | |
| | | | | | | | | | |
| | | |
| | | | | | TOTAL CONVERTIBLE BONDS
(Cost $520,364,557) | | | 557,857,457 | |
| | | | | | | | | | |
| | | | | | | | | | |
|
| | SYNTHETIC CONVERTIBLE SECURITIES (2.4%)¤ | |
| | U.S. Government and Agency Securities (1.8%) | |
| | | | | | United States Treasury Note | | | | |
| | 6,200,000 | | | | | 2.500%, 06/30/20 | | | 6,209,518 | |
| | 6,000,000 | | | | | 2.375%, 03/15/21 | | | 6,009,922 | |
| | | | | | | | | | |
| | | |
| | | | | | TOTAL U.S. GOVERNMENT AND AGENCY SECURITIES | | | 12,219,440 | |
| | | | | | | | | | |
NUMBER OF
CONTRACTS/
NOTIONAL
AMOUNT | | | | | | | VALUE | |
| | | | | | | | | | |
| | Purchased Options (0.6%)# | |
| | | | | | Consumer Discretionary (0.1%) | |
| 42
8,091,384 |
| | | | Amazon.com, Inc.
Call, 01/17/20, Strike $1,900.00 | | | 828,345 | |
| | | | | | | | | | |
| | | | | | Financials (0.2%) | |
| 4,400
20,930,800 |
| | | | American International Group, Inc.
Call, 06/21/19, Strike $45.00 | | | 1,496,000 | |
| | | | | | | | | | |
| | | | | | Industrials (0.1%) | |
| 690
10,115,400 |
| | | | Stanley Black & Decker, Inc.
Call, 01/17/20, Strike $145.00 | | | 931,500 | |
| | | | | | | | | | |
| | | | | | Information Technology (0.2%) | |
| 370
7,674,910 |
| | | | Lam Research Corp.
Call, 01/17/20, Strike $190.00 | | | 1,185,850 | |
| | | | | | | | | | |
| | | |
| | | | | | TOTAL PURCHASED OPTIONS | | | 4,441,695 | |
| | | | | | | | | | |
| | | |
| | | | | | TOTAL SYNTHETIC CONVERTIBLE SECURITIES
(Cost $15,126,665) | | | 16,661,135 | |
| | | | | | | | | | |
| | | | | | | | | | |
NUMBER OF
SHARES | | | | | | | VALUE | |
|
| | CONVERTIBLE PREFERRED STOCKS (14.9%) | |
| | | | | | Communication Services (0.5%) | |
| | 17,400 | | | | | Alibaba Exchangeable (Softbank)*§
5.750%, 06/01/19 | | | 3,611,875 | |
| | | | | | | | | | |
| | | | | | Financials (5.2%) | |
| | 30,400 | | | | | Assurant, Inc.
6.500%, 03/15/21 | | | 3,161,904 | |
| | | |
| | 10,300 | | | | | Bank of America Corp.
7.250%, 05/01/21 | | | 13,601,253 | |
| | | |
| | 15,570 | | | | | Virtus Investment Partners, Inc.
7.250%, 02/01/20 | | | 1,606,980 | |
| | | | | | | | | | |
NUMBER OF
SHARES | | | | | | | VALUE | |
| | | |
| | 13,900 | | | | | Wells Fargo & Company
7.500%, 11/01/24 | | $ | 18,173,416 | |
| | | | | | | | | | |
| | | | 36,543,553 | |
| | | | | |
| | | | | | Health Care (1.8%) | |
| | 90,500 | | | | | Becton Dickinson and Company
6.125%, 05/01/20 | | | 5,385,655 | |
| | | |
| | 6,755 | | | | | Danaher Corp.
4.750%, 04/15/22 | | | 7,116,392 | |
| | | | | | | | | | |
| | | | 12,502,047 | |
| | | | | |
| | | | | | Industrials (1.5%) | |
| | 6,050 | | | | | Fortive Corp.
5.000%, 07/01/21 | | | 6,530,612 | |
| | | |
| | 65,400 | | | | | Rexnord Corp.
5.750%, 11/15/19 | | | 3,835,710 | |
| | | | | | | | | | |
| | | | 10,366,322 | |
| | | | | |
| | | | | | Materials (0.4%) | |
| | 60,662 | | | | | International Flavors & Fragrances, Inc.
6.000%, 09/15/21 | | | 3,180,509 | |
| | | | | | | | | | |
| | | | | | Real Estate (1.0%) | |
| | 6,200 | | | | | Crown Castle International Corp.
6.875%, 08/01/20 | | | 7,154,738 | |
| | | | | | | | | | |
| | | | | | Utilities (4.5%) | |
| | 135,685 | | | | | American Electric Power Company, Inc.
6.125%, 03/15/22 | | | 7,052,906 | |
| | | |
| | 69,600 | | | | | Aqua America, Inc.
6.000%, 04/30/22 | | | 3,798,768 | |
| | | |
| | 120,925 | | | | | DTE Energy Company
6.500%, 10/01/19 | | | 6,748,824 | |
| | | |
| | 113,345 | | | | | NextEra Energy, Inc.
6.123%, 09/01/19 | | | 7,072,728 | |
| | | |
| | | | | | Sempra Energy | | | | |
| | 33,430 | | | | | 6.750%, 07/15/21 | | | 3,594,728 | |
| | 30,000 | | | | | 6.000%, 01/15/21 | | | 3,206,700 | |
| | | | | | | | | | |
| | | | 31,474,654 | |
| | | | | |
| | | |
| | | | | | TOTAL CONVERTIBLE PREFERRED STOCKS
(Cost $96,564,428) | | | 104,833,698 | |
| | | | | | | | | | |
| | | | | | | | | | |
|
| | COMMON STOCK (0.9%) | |
| | | | | | Health Care (0.9%) | |
| | 24,945 | | | | | Anthem, Inc.
(Cost $5,882,661) | | | 6,561,283 | |
| | | | | | | | | | |
| | | | | | | | | | |
NUMBER OF
CONTRACTS/
NOTIONAL
AMOUNT | | | | | | | VALUE | |
|
| | PURCHASED OPTION (0.1%)# | |
| | | | | | Consumer Discretionary (0.1%) | |
| 56
10,387,944 |
| | | | Booking Holdings, Inc.
Put, 06/21/19, Strike $1,870.00
(Cost $740,807) | | | 467,040 | |
| | | | | | | | | | |
| | | | |
| 96 | | CALAMOS OPEN-END FAMILY OF FUNDS SEMIANNUAL REPORT | | See accompanying Notes to Schedule of Investments |
Convertible Fund Schedule of Investments April 30, 2019 (Unaudited)
| | | | | | | | | | |
NUMBER OF
SHARES | | | | | | | VALUE | |
|
| | SHORT TERM INVESTMENTS (2.1%) | |
| | 7,357,656 | | | | | Fidelity Prime Money Market Fund - Institutional Class, 2.500%*** | | $ | 7,359,863 | |
| | | |
| | 7,309,470 | | | | | Morgan Stanley Institutional Liquidity Funds - Government Portfolio, 2.350%*** | | | 7,309,470 | |
| | | | | | | | | | |
| | | |
| | | | | | TOTAL SHORT TERM INVESTMENTS
(Cost $14,669,335) | | | 14,669,333 | |
| | | | | | | | | | |
| | | | | | | | | | |
NUMBER OF
SHARES/
PRINCIPAL
AMOUNT | | | | | | | VALUE | |
|
| INVESTMENT OF CASH COLLATERAL FOR SECURITIES
LOANED (9.3%) |
|
| | 26,430,753 | | | | | Fidelity Prime Money Market Fund - Institutional Class, 2.500%***† | | | 26,430,753 | |
| | | |
| | 38,997,010 | | | | | State Street Navigator Securities Lending Government Money Market Portfolio† | | | 38,997,010 | |
| | | | | | | | | | |
| | | |
| | | | | | TOTAL INVESTMENT OF CASH COLLATERAL FOR SECURITIES LOANED
(Cost $65,427,763) | | | 65,427,763 | |
| | | | | | | | | | |
| |
| TOTAL INVESTMENTS (109.2%)
(Cost $718,776,216) | | | 766,477,709 | |
| | | | | | | | | | |
| |
| | PAYABLE UPON RETURN OF SECURITIES ON LOAN(-9.3%) | | | (65,427,763 | ) |
| | | | | |
| |
| | OTHER ASSETS, LESS LIABILITIES (0.1%) | | | 860,220 | |
| | | | | |
| |
| | NET ASSETS (100.0%) | | $ | 701,910,166 | |
| | | | | |
| | | | | | | | | | |
NUMBER OF
CONTRACTS/
NOTIONAL
AMOUNT | | | | | | | VALUE | |
|
| | WRITTEN OPTION (0.0%)# | |
| | | | | | Consumer Discretionary (0.0%) | |
| 56
10,387,944 |
| | | | Booking Holdings, Inc.
Put, 06/21/19, Strike $1,650.00
(Premium $331,669) | | | (96,600 | ) |
| | | | | | | | | | |
FORWARD FOREIGN CURRENCY CONTRACTS
| | | | | | | | | | | | | | | | |
COUNTER
PARTY | | LONG CONTRACTS | | SETTLEMENT DATE | | LOCAL CURRENCY | | | CURRENT VALUE | | | UNREALIZED GAIN/LOSS | |
| | | | | |
| State Street Bank and Trust | | Hong Kong Dollar | | 07/25/19 | | | 2,295,000 | | | $ | 292,929 | | | $ | (74 | ) |
| | | | | |
| Bank of New York | | European Monetary Unit | | 07/25/19 | | | 114,000 | | | | 128,778 | | | | (401 | ) |
| | | | | | | | | | | | | | | | |
| | | $ | (475 | ) |
| | | | | |
| | | | | |
COUNTER
PARTY | | SHORT CONTRACTS | | SETTLEMENT DATE | | LOCAL CURRENCY | | | CURRENT VALUE | | | UNREALIZED GAIN/LOSS | |
| | | | | |
| State Street Bank and Trust | | Hong Kong Dollar | | 07/25/19 | | | 2,668,000 | | | $ | 340,538 | | | $ | 150 | |
| | | | | |
| Northern Trust Company | | European Monetary Unit | | 07/25/19 | | | 1,920,000 | | | | 2,168,893 | | | | 22,228 | |
| | | | | |
| Northern Trust Company | | Hong Kong Dollar | | 07/25/19 | | | 36,699,000 | | | | 4,684,185 | | | | 4,684 | |
| | | | | | | | | | | | | | | | |
| | | $ | 27,062 | |
| | | | | |
NOTES TO SCHEDULE OF INVESTMENTS
| * | Securities issued and sold pursuant to a Rule 144A transaction are excepted from the registration requirement of the Securities Act of 1933, as amended. These securities may only be sold to qualified institutional buyers (“QIBs”), such as the Fund. Any resale of these securities must generally be effected through a sale that is registered under the Act or otherwise exempted from such registration requirements. |
| ^ | Security, or portion of security, is on loan. |
| § | Securities exchangeable or convertible into securities of one or more entities that are different than the issuer. Each entity is identified in the parenthetical. |
| ¤ | The synthetic convertible securities strategy combines separate securities that together possess the economic characteristics similar to a convertible security. |
| # | Non-income producing security. |
| *** | The rate disclosed is the 7 day net yield as of April 30, 2019. |
| † | Represents investment of cash collateral received from securities on loan as of April 30, 2019. |
Note: The date on options represents the expiration date of the option contract. The option contract may be exercised at any date on or before the date shown.
| | | | | | |
| See accompanying Notes to Financial Statements | | www.calamos.com | | | 97 | |
Global Convertible Fund Schedule of Investments April 30, 2019 (Unaudited)
| | | | | | | | | | |
PRINCIPAL
AMOUNT | | | | | | | VALUE | |
|
| | CONVERTIBLE BONDS (70.7%) | |
| | | | | | Communication Services (4.9%) | |
| | 600,000 | | | EUR | | Cellnex Telecom, SA
1.500%, 01/16/26 | | $ | 738,207 | |
| | | |
| | | | | | CyberAgent, Inc. | | | | |
| | 50,000,000 | | | JPY | | 0.000%, 02/17/23 | | | 476,487 | |
| | 50,000,000 | | | JPY | | 0.000%, 02/19/25 | | | 482,373 | |
| | | |
| | 1,755,000 | | | | | GCI Liberty, Inc.*
1.750%, 09/30/46 | | | 1,983,519 | |
| | | |
| | 710,000 | | | | | Liberty Media Corp.
1.375%, 10/15/23 | | | 828,914 | |
| | | |
| | 665,000 | | | | | Liberty Media Corp. (Sirius XM Holdings, Inc.)*§
2.125%, 03/31/48 | | | 645,845 | |
| | | |
| | 750,000 | | | | | Momo, Inc.*
1.250%, 07/01/25 | | | 702,461 | |
| | | |
| | 680,000 | | | | | Twitter, Inc.*
0.250%, 06/15/24 | | | 686,025 | |
| | | | | | | | | | |
| | | | | | | | | 6,543,831 | |
| | | | | | | | | | |
| | | | | | Consumer Discretionary (8.7%) | |
| | | | | | Ctrip.com International, Ltd. | | | | |
| | 1,860,000 | | | | | 1.250%, 09/15/22^ | | | 1,901,664 | |
| | 660,000 | | | | | 1.000%, 07/01/20 | | | 678,562 | |
| | | |
| | 1,155,000 | | | | | DISH Network Corp.
3.375%, 08/15/26 | | | 1,060,377 | |
| | | |
| | 665,000 | | | | | Guess, Inc.*
2.000%, 04/15/24 | | | 695,447 | |
| | | |
| | 70,000,000 | | | JPY | | HIS Company, Ltd.
0.000%, 08/30/19 | | | 629,123 | |
| | | |
| | 50,000,000 | | | JPY | | Iida Group Holdings Company, Ltd.
0.000%, 06/18/20 | | | 445,399 | |
| | | |
| | 405,000 | | | | | Liberty Expedia Holdings, Inc.*^
1.000%, 06/30/47 | | | 407,383 | |
| | | |
| | 1,220,000 | | | | | NIO, Inc.*
4.500%, 02/01/24 | | | 937,875 | |
| | | |
| | 630,000 | | | | | Quotient Technology, Inc.
1.750%, 12/01/22 | | | 586,779 | |
| | | |
| | 650,000 | | | | | RH*
0.000%, 06/15/23 | | | 567,957 | |
| | | |
| | 416,000 | | | EUR | | SEB, SA
0.000%, 11/17/21 | | | 929,640 | |
| | | |
| | 270,000 | | | | | Shanghai Port Group BVI Holding Company, Ltd.
0.000%, 08/09/22 | | | 276,055 | |
| | | |
| | 900,000 | | | EUR | | Steinhoff Finance Holding GmbH@
1.250%, 10/21/23 | | | 455,253 | |
| | | |
| | | | | | Tesla, Inc. | | | | |
| | 1,278,000 | | | | | 1.250%, 03/01/21 | | | 1,256,932 | |
| | 934,000 | | | | | 2.375%, 03/15/22 | | | 960,255 | |
| | | | | | | | | | |
| | | | | | | | | 11,788,701 | |
| | | | | | | | | | |
| | | | | | | | | | |
PRINCIPAL
AMOUNT | | | | | | | VALUE | |
| | | | | | | | | | |
| | | | | | Consumer Staples (2.7%) | |
| | 3,800,000 | | | | | Carrefour, SA
0.000%, 03/27/24 | | $ | 3,668,216 | |
| | | | | | | | | | |
| | | | | | Energy (4.5%) | |
| | 390,000 | | | | | Nabors Industries, Inc.
0.750%, 01/15/24 | | | 284,382 | |
| | | |
| | 430,000 | | | | | SM Energy Company
1.500%, 07/01/21 | | | 400,094 | |
| | | |
| | 4,200,000 | | | | | TOTAL, SA
0.500%, 12/02/22 | | | 4,474,386 | |
| | | |
| | 800,000 | | | | | Tullow Oil Jersey, Ltd.
6.625%, 07/12/21 | | | 961,124 | |
| | | | | | | | | | |
| | | | | | | | | 6,119,986 | |
| | | | | | | | | | |
| | | | | | Financials (7.4%) | |
| | 92,000,000 | | | JPY | | AEON Financial Service Company, Ltd.
0.000%, 09/13/19 | | | 831,725 | |
| | | |
| | 2,300,000 | | | EUR | | AURELIUS Equity Opportunities SE & Co., KGaA
1.000%, 12/01/20 | | | 2,741,311 | |
| | | |
| | 2,400,000 | | | EUR | | Corestate Capital Holding, SA
1.375%, 11/28/22 | | | 2,554,436 | |
| | | |
| | 1,699,500 | | | EUR | | Credit Agricole, SA
0.000%, 10/03/19 | | | 1,452,627 | |
| | | |
| | 700,000 | | | EUR | | Cromwell SPV Finance Pty, Ltd.
2.000%, 02/04/20 | | | 787,857 | |
| | | |
| | 900,000 | | | EUR | | LEG Immobilien, AG
0.875%, 09/01/25 | | | 1,157,672 | |
| | | |
| | 50,000,000 | | | JPY | | Mitsubishi Chemical Holdings Corp.
0.000%, 03/29/24 | | | 452,251 | |
| | | | | | | | | | |
| | | | | | | | | 9,977,879 | |
| | | | | | | | | | |
| | | | | | Health Care (8.6%) | |
| | 1,100,000 | | | EUR | | Bayer Capital Corp., BV
5.625%, 11/22/19 | | | 942,840 | |
| | | |
| | 1,230,000 | | | | | BioMarin Pharmaceutical, Inc.
1.500%, 10/15/20 | | | 1,382,372 | |
| | | |
| | 651,000 | | | | | DexCom, Inc.*
0.750%, 12/01/23 | | | 679,478 | |
| | | |
| | 1,100,000 | | | EUR | | Fresenius, SE & Company KGaA
0.000%, 09/24/19 | | | 1,330,494 | |
| | | |
| | 500,000 | | | EUR | | GN Store Nord, A/S
0.000%, 05/31/22 | | | 760,134 | |
| | | |
| | 590,000 | | | | | Illumina, Inc.
0.000%, 06/15/19 | | | 722,464 | |
| | | |
| | 252,000 | | | | | Innoviva, Inc.
2.500%, 08/15/25 | | | 270,550 | |
| | | |
| | 515,000 | | | | | Insulet Corp.*
1.375%, 11/15/24 | | | 585,676 | |
| | | |
| | 525,000 | | | | | Neurocrine Biosciences, Inc.
2.250%, 05/15/24 | | | 635,911 | |
| | | |
| | 765,000 | | | | | NuVasive, Inc.
2.250%, 03/15/21 | | | 876,411 | |
| | | | |
| 98 | | CALAMOS OPEN-END FAMILY OF FUNDS SEMIANNUAL REPORT | | See accompanying Notes to Schedule of Investments |
Global Convertible Fund Schedule of Investments April 30, 2019 (Unaudited)
| | | | | | | | | | |
PRINCIPAL
AMOUNT | | | | | | | VALUE | |
| | | |
| | 595,000 | | | | | Pacira BioSciences, Inc.
2.375%, 04/01/22 | | $ | 596,151 | |
| | | |
| | 130,000,000 | | | JPY | | Ship Healthcare Holdings, Inc.
0.000%, 12/13/23 | | | 1,264,353 | |
| | | |
| | 630,000 | | | | | Tabula Rasa HealthCare, Inc.*
1.750%, 02/15/26 | | | 657,188 | |
| | | |
| | 627,000 | | | | | Teladoc Health, Inc.*^
1.375%, 05/15/25 | | | 840,243 | |
| | | | | | | | | | |
| | | | | | | | | 11,544,265 | |
| | | | | | | | | | |
| | | | | | Industrials (6.4%) | |
| | 130,000,000 | | | JPY | | ANA Holdings, Inc.
0.000%, 09/19/24 | | | 1,182,464 | |
| | | |
| | 546,000 | | | | | Fortive Corp.*^
0.875%, 02/15/22 | | | 578,064 | |
| | | |
| | 670,000 | | | | | Greenbrier Companies, Inc.
2.875%, 02/01/24 | | | 672,908 | |
| | | |
| | 60,000,000 | | | JPY | | Kandenko Company, Ltd.
0.000%, 03/31/21 | | | 551,273 | |
| | | |
| | 120,000,000 | | | JPY | | Kansai Paint Company, Ltd.
0.000%, 06/17/19 | | | 1,075,195 | |
| | | |
| | 1,915,000 | | | | | Larsen & Toubro, Ltd.
0.675%, 10/22/19 | | | 1,902,658 | |
| | | |
| | 60,000,000 | | | JPY | | Nippon Flour Mills Company, Ltd.
0.000%, 06/20/25 | | | 549,130 | |
| | | |
| | 400,000 | | | EUR | | Symrise, AG
0.238%, 06/20/24 | | | 519,075 | |
| | | |
| | 1,400,000 | | | | | Vinci, SA
0.375%, 02/16/22 | | | 1,591,646 | |
| | | | | | | | | | |
| | | | | | | | | 8,622,413 | |
| | | | | | | | | | |
| | | | | | Information Technology (21.9%) | | | | |
| | 1,205,000 | | | | | 8x8, Inc.*
0.500%, 02/01/24 | | | 1,357,637 | |
| | | |
| | 1,310,000 | | | | | Akamai Technologies, Inc.*
0.125%, 05/01/25 | | | 1,386,439 | |
| | | |
| | 274,000 | | | | | Coupa Software, Inc.*
0.375%, 01/15/23 | | | 644,980 | |
| | | |
| | 660,000 | | | | | DocuSign, Inc.*
0.500%, 09/15/23 | | | 709,754 | |
| | | |
| | 152,000 | | | | | Euronet Worldwide, Inc.*^
0.750%, 03/15/49 | | | 170,336 | |
| | | |
| | | | | | FireEye, Inc. | | | | |
| | 330,000 | | | | | 1.625%, 06/01/35 | | | 310,236 | |
| | 183,000 | | | | | 1.000%, 06/01/35 | | | 178,407 | |
| | | |
| | 455,000 | | | | | II-VI, Inc.
0.250%, 09/01/22 | | | 497,770 | |
| | | |
| | 385,000 | | | | | Inphi Corp.
0.750%, 09/01/21 | | | 408,845 | |
| | | |
| | 1,200,000 | | | | | Lenovo Group, Ltd.
3.375%, 01/24/24 | | | 1,407,828 | |
| | | |
| | 570,000 | | | | | Lumentum Holdings, Inc.^
0.250%, 03/15/24 | | | 710,952 | |
| | | | | | | | | | |
PRINCIPAL
AMOUNT | | | | | | | VALUE | |
| | | |
| | 1,410,000 | | | | | Microchip Technology, Inc.
1.625%, 02/15/27 | | $ | 1,828,805 | |
| | | |
| | 291,000 | | | | | Micron Technology, Inc.~
2.125%, 02/15/33 | | | 1,121,412 | |
| | | |
| | 619,000 | | | | | New Relic, Inc.*
0.500%, 05/01/23 | | | 721,822 | |
| | | |
| | 1,848,000 | | | | | NXP Semiconductors, NV
1.000%, 12/01/19 | | | 2,043,796 | |
| | | |
| | 351,000 | | | | | Okta, Inc.
0.250%, 02/15/23 | | | 778,479 | |
| | | |
| | 380,000 | | | | | ON Semiconductor Corp.
1.000%, 12/01/20 | | | 509,546 | |
| | | |
| | 650,000 | | | | | Palo Alto Networks, Inc.*
0.750%, 07/01/23 | | | 736,912 | |
| | | |
| | 305,000 | | | | | Pluralsight, Inc.*
0.375%, 03/01/24 | | | 348,699 | |
| | | |
| | 457,000 | | | | | Q2 Holdings, Inc.
0.750%, 02/15/23 | | | 641,578 | |
| | | |
| | 430,000 | | | | | Silicon Laboratories, Inc.
1.375%, 03/01/22 | | | 547,758 | |
| | | |
| | 550,000 | | | EUR | | SOITEC
0.000%, 06/28/23 | | | 719,659 | |
| | | |
| | 1,430,000 | | | | | Splunk, Inc.*
1.125%, 09/15/25 | | | 1,660,001 | |
| | | |
| | 1,270,000 | | | | | Square, Inc.*
0.500%, 05/15/23 | | | 1,511,230 | |
| | | |
| | 1,000,000 | | | | | STMicroelectronics, NV
0.000%, 07/03/22 | | | 1,136,825 | |
| | | |
| | 221,000 | | | | | Synaptics, Inc.
0.500%, 06/15/22 | | | 201,889 | |
| | | |
| | 359,000 | | | | | Twilio, Inc.*
0.250%, 06/01/23 | | | 724,293 | |
| | | |
| | 385,000 | | | | | Veeco Instruments, Inc.
2.700%, 01/15/23 | | | 334,684 | |
| | | |
| | 843,000 | | | | | Weibo Corp.
1.250%, 11/15/22 | | | 804,091 | |
| | | |
| | 650,000 | | | | | Wix.com, Ltd.*^
0.000%, 07/01/23 | | | 763,711 | |
| | | |
| | 1,645,000 | | | | | Workday, Inc.
0.250%, 10/01/22 | | | 2,442,471 | |
| | | |
| | 1,215,000 | | | | | Xero Investments, Ltd.
2.375%, 10/04/23 | | | 1,264,821 | |
| | | |
| | 610,000 | | | | | Zendesk, Inc.
0.250%, 03/15/23 | | | 921,710 | |
| | | | | | | | | | |
| | | | | | | | | 29,547,376 | |
| | | | | | | | | | |
| | | | | | Materials (3.0%) | | | | |
| | 3,250,000 | | | | | BASF, SE
0.925%, 03/09/23 | | | 3,055,049 | |
| | | |
| | 300,000 | | | EUR | | Buzzi Unicem, S.p.A.
1.375%, 07/17/19 | | | 413,394 | |
| | | |
| | 600,000 | | | | | LG Chem, Ltd.
0.000%, 04/16/21 | | | 599,526 | |
| | | | | | | | | | |
| | | | | | | | | 4,067,969 | |
| | | | | | | | | | |
| | | | | | |
| See accompanying Notes to Schedule of Investments | | www.calamos.com | | | 99 | |
Global Convertible Fund Schedule of Investments April 30, 2019 (Unaudited)
| | | | | | | | | | |
PRINCIPAL
AMOUNT | | | | | | | VALUE | |
| | | | | | | | | | |
| | | | | | Real Estate (2.6%) | | | | |
| | | |
| | 1,900,000 | | | EUR | | Grand City Properties, SA
0.250%, 03/02/22 | | $ | 2,272,329 | |
| | | |
| | 488,000 | | | | | IH Merger Sub, LLC
3.000%, 07/01/19 | | | 658,510 | |
| | | |
| | 60,000,000 | | | JPY | | Relo Group, Inc.
0.000%, 03/22/21 | | | 591,581 | |
| | | | | | | | | | |
| | | | | | | | | 3,522,420 | |
| | | | | | | | | | |
| | | |
| | | | | | TOTAL CONVERTIBLE BONDS
(Cost $97,180,435) | | | 95,403,056 | |
| | | | | | | | | | |
| | | | | | | | | | |
|
| | SYNTHETIC CONVERTIBLE SECURITIES (10.7%)¤ | |
| | Corporate Bonds (1.6%) | |
| | | | | | Communication Services (0.2%) | | | | |
| | 273,000 | | | | | Sprint Corp.
7.250%, 09/15/21 | | | 286,366 | |
| | | | | | | | | | |
| | | | | | Consumer Discretionary (0.5%) | | | | |
| | 595,000 | | | | | Lennar Corp.
6.625%, 05/01/20 | | | 616,977 | |
| | | |
| | 115,000 | | | | | Mediacom Broadband, LLC / Mediacom Broadband Corp.
5.500%, 04/15/21 | | | 115,270 | |
| | | | | | | | | | |
| | | | | | | | | 732,247 | |
| | | | | | | | | | |
| | | | | | Financials (0.4%) | | | | |
| | 450,000 | | | | | AerCap Ireland Capital DAC / AerCap Global Aviation Trust
5.000%, 10/01/21 | | | 467,975 | |
| | | | | | | | | | |
| | | | | | Health Care (0.5%) | | | | |
| | 600,000 | | | | | HCA Healthcare, Inc.
6.250%, 02/15/21 | | | 630,066 | |
| | | | | | | | | | |
| | | |
| | | | | | TOTAL CORPORATE BONDS | | | 2,116,654 | |
| | | | | | | | | | |
| | U.S. Government and Agency Securities (8.4%) | |
| | | | | | United States Treasury Note | | | | |
| | 4,441,000 | | | | | 1.875%, 05/31/22 | | | 4,393,114 | |
| | 3,549,000 | | | | | 1.000%, 06/30/19 | | | 3,540,504 | |
| | 3,505,000 | | | | | 1.750%, 10/31/20 | | | 3,476,232 | |
| | | | | | | | | | |
| | | |
| | | | | | TOTAL U.S. GOVERNMENT AND AGENCY SECURITIES | | | 11,409,850 | |
| | | | | | | | | | |
NUMBER OF
CONTRACTS/
NOTIONAL
AMOUNT | | | | | | | VALUE | |
| | | | | | | | | | |
| | Purchased Options (0.7%)# | |
| | | | | | Consumer Discretionary (0.6%) | |
| | | | | | Alibaba Group Holding, Ltd. | | | | |
| 166
3,080,462 |
| | | | Call, 06/21/19, Strike $185.00 | | | 149,400 | |
| 93
1,725,801 |
| | | | Call, 06/21/19, Strike $175.00 | | | 140,662 | |
| | | | | | | | | | |
NUMBER OF
CONTRACTS/
NOTIONAL
AMOUNT | | | | | | | VALUE | |
| | | | | | Booking Holdings, Inc. | | | | |
| 17
3,153,483 |
| | | | Call, 01/17/20, Strike $1,920.00 | | $ | 247,435 | |
| 16
2,967,984 |
| | | | Call, 06/21/19, Strike $1,750.00 | | | 236,720 | |
| | | | | | | | | | |
| | | | | | | | | 774,217 | |
| | | | | | | | | | |
| | | | | | Industrials (0.1%) | |
| | | |
| 187
2,279,156 |
| | EUR | | Airbus, SE
Call, 06/21/19, Strike 115.00 | | | 173,245 | |
| | | | | | | | | | |
| | | | | | TOTAL PURCHASED OPTIONS | | | 947,462 | |
| | | | | | | | | | |
| | | |
| | | | | | TOTAL SYNTHETIC CONVERTIBLE SECURITIES
(Cost $14,485,421) | | | 14,473,966 | |
| | | | | | | | | | |
| | | | | | | | | | |
NUMBER OF
SHARES | | | | | | | VALUE | |
|
| | CONVERTIBLE PREFERRED STOCKS (10.9%) | |
| | | | | | Communication Services (0.6%) | |
| | 3,926 | | | | | Alibaba Exchangeable (Softbank)*§
5.750%, 06/01/19 | | | 814,955 | |
| | | | | | | | | | |
| | | | | | Financials (6.4%) | |
| | 6,030 | | | | | Assurant, Inc.
6.500%, 03/15/21 | | | 627,180 | |
| | | |
| | 2,487 | | | | | Bank of America Corp.
7.250%, 12/31/49 | | | 3,284,108 | |
| | | |
| | 13,755 | | | | | Virtus Investment Partners, Inc.
7.250%, 02/01/20 | | | 1,419,654 | |
| | | |
| | 2,530 | | | | | Wells Fargo & Company
7.500%, 12/31/49 | | | 3,307,823 | |
| | | | | | | | | | |
| | | | | | | | | 8,638,765 | |
| | | | | | | | | | |
| | | | | | Health Care (1.0%) | |
| | 1,295 | | | | | Danaher Corp.
4.750%, 04/15/22 | | | 1,364,283 | |
| | | | | | | | | | |
| | | | | | Real Estate (0.4%) | |
| | 425 | | | | | Crown Castle International Corp.
6.875%, 08/01/20 | | | 490,446 | |
| | | | | | | | | | |
| | | | | | Utilities (2.5%) | |
| | 12,955 | | | | | American Electric Power Company, Inc. 6.125%, 03/15/22 | | | 673,401 | |
| | | |
| | 13,215 | | | | | Aqua America, Inc.
6.000%, 04/30/22 | | | 721,275 | |
| | | |
| | 10,385 | | | | | DTE Energy Company
6.500%, 10/01/19 | | | 579,587 | |
| | | |
| | | | | | Sempra Energy | | | | |
| | 6,535 | | | | | 6.750%, 07/15/21 | | | 702,708 | |
| | 6,415 | | | | | 6.000%, 01/15/21 | | | 685,699 | |
| | | | | | | | | | |
| | | | 3,362,670 | |
| | | | | |
| | | |
| | | | | | TOTAL CONVERTIBLE PREFERRED STOCKS
(Cost $13,573,325) | | | 14,671,119 | |
| | | | | | | | | | |
| | | | |
| 100 | | CALAMOS OPEN-END FAMILY OF FUNDS SEMIANNUAL REPORT | | See accompanying Notes to Schedule of Investments |
Global Convertible Fund Schedule of Investments April 30, 2019 (Unaudited)
| | | | | | | | | | |
NUMBER OF
SHARES | | | | | | | VALUE | |
|
| | COMMON STOCKS (2.3%) | |
| | | | | | Energy (1.9%) | |
| | 39,301 | | | | | Hess Corp. | | $ | 2,519,980 | |
| | | | | | | | | | |
| | | | | | Information Technology (0.4%) | |
| | 5,535 | | | | | Citrix Systems, Inc. | | | 558,814 | |
| | | | | | | | | | |
| | | |
| | | | | | TOTAL COMMON STOCKS
(Cost $2,794,675) | | | 3,078,794 | |
| | | | | | | | | | |
| | | | | | | | | | |
|
| | SHORT TERM INVESTMENTS (5.1%) | |
| | 3,414,450 | | | | | Fidelity Prime Money Market Fund - Institutional Class, 2.500%*** | | | 3,415,474 | |
| | | |
| | 3,414,172 | | | | | Morgan Stanley Institutional Liquidity Funds - Government Portfolio, 2.350%*** | | | 3,414,172 | |
| | | | | | | | | | |
| | | | | | TOTAL SHORT TERM INVESTMENTS
(Cost $6,829,646) | | | 6,829,646 | |
| | | | | | | | | | |
| | | | | | | | | | |
NUMBER OF
SHARES/
PRINCIPAL
AMOUNT | | | | | | | VALUE | |
|
| INVESTMENT OF CASH COLLATERAL FOR SECURITIES
LOANED (4.0%) |
|
| | 5,474,323 | | | | | State Street Navigator Securities Lending Government Money Market Portfolio†
(Cost $5,474,323) | | | 5,474,323 | |
| | | | | | | | | | |
| | | | | | TOTAL INVESTMENTS (103.7%)
(Cost $140,337,825) | | | 139,930,904 | |
| | | | | | | | | | |
| |
| | PAYABLE UPON RETURN OF SECURITIES ON LOAN(-4.0%) | | | (5,474,323 | ) |
| | | | | |
| |
| | OTHER ASSETS, LESS LIABILITIES (0.3%) | | | 520,722 | |
| | | | | | | | | | |
| |
| | NET ASSETS (100.0%) | | $ | 134,977,303 | |
| | | | | | | | | | |
NOTES TO SCHEDULE OF INVESTMENTS
| * | Securities issued and sold pursuant to a Rule 144A transaction are excepted from the registration requirement of the Securities Act of 1933, as amended. These securities may only be sold to qualified institutional buyers (“QIBs”), such as the Fund. Any resale of these securities must generally be effected through a sale that is registered under the Act or otherwise exempted from such registration requirements. |
| § | Securities exchangeable or convertible into securities of one or more entities that are different than the issuer. Each entity is identified in the parenthetical. |
| ^ | Security, or portion of security, is on loan. |
| ~ | Security, or portion of security, is segregated as collateral (or collateral for potential future transactions) for written options. The aggregate value of such securities is $15,415. |
| ¤ | The synthetic convertible securities strategy combines separate securities that together possess the economic characteristics similar to a convertible security. |
| # | Non-income producing security. |
| *** | The rate disclosed is the 7 day net yield as of April 30, 2019. |
| † | Represents investment of cash collateral received from securities on loan as of April 30, 2019. |
FOREIGN CURRENCY ABBREVIATIONS
| | |
| |
| EUR | | European Monetary Unit |
| |
| JPY | | Japanese Yen |
Note: Value for securities denominated in foreign currencies is shown in U.S. dollars. The principal amount for such securities is shown in the respective foreign currency. The date on options represents the expiration date of the option contract. The option contract may be exercised at any date on or before the date shown.
CURRENCY EXPOSURE
APRIL 30, 2019
| | | | | | | | |
| | | VALUE | | | % OF TOTAL
INVESTMENTS | |
| | |
| US Dollar | | $ | 113,451,377 | | | | 81.1% | |
| European Monetary Unit | | | 17,948,173 | | | | 12.8% | |
| | |
| Japanese Yen | | | 8,531,354 | | | | 6.1% | |
| Total Investments | | $ | 139,930,904 | | | | 100.0% | |
Currency exposure may vary over time.
| | | | | | |
| See accompanying Notes to Financial Statements | | www.calamos.com | | | 101 | |
Growth Fund Schedule of Investments April 30, 2019 (Unaudited)
| | | | | | | | | | |
NUMBER OF
SHARES | | | | | | | VALUE | |
|
| | COMMON STOCKS (91.4%) | |
| | | | | | Communication Services (14.7%) | |
| | 73,000 | | | | | Alphabet, Inc. - Class A#~ | | $ | 87,524,080 | |
| | | |
| | 22,000 | | | | | Altice USA, Inc. - Class A | | | 518,320 | |
| | | |
| | 415,000 | | | | | Comcast Corp. - Class A~ | | | 18,064,950 | |
| | | |
| | 368,000 | | | | | Facebook, Inc. - Class A#~ | | | 71,171,200 | |
| | | |
| | 36,000 | | | | | Gray Television, Inc.# | | | 843,480 | |
| | | |
| | 44,700 | | | | | Netflix, Inc.#~ | | | 16,563,138 | |
| | | |
| | 146,000 | | | | | Twitter, Inc.# | | | 5,826,860 | |
| | | |
| | 121,900 | | | | | Walt Disney Company | | | 16,696,643 | |
| | | | | | | | | | |
| | | | | | | | | 217,208,671 | |
| | | | | | | | | | |
| | | | | | Consumer Discretionary (15.1%) | |
| | 43,000 | | | | | Amazon.com, Inc.#~ | | | 82,840,360 | |
| | | |
| | 7,600 | | | | | Booking Holdings, Inc.# | | | 14,097,924 | |
| | | |
| | 17,000 | | | | | Boyd Gaming Corp. | | | 489,260 | |
| | | |
| | 119,500 | | | | | CarMax, Inc.#^ | | | 9,304,270 | |
| | | |
| | 5,640 | | | | | Etsy, Inc.# | | | 380,926 | |
| | | |
| | 74,000 | | | | | Home Depot, Inc. | | | 15,073,800 | |
| | | |
| | 195,500 | | | | | Lowe’s Companies, Inc. | | | 22,118,870 | |
| | | |
| | 120,500 | | | | | Lululemon Athletica, Inc.# | | | 21,250,175 | |
| | | |
| | 116,500 | | | | | McDonald’s Corp.~ | | | 23,016,905 | |
| | | |
| | 708,500 | | | | | MGM Resorts International~ | | | 18,867,355 | |
| | | |
| | 15,000 | | | | | Rent-A-Center, Inc.# | | | 373,950 | |
| | | |
| | 123,500 | | | | | Royal Caribbean Cruises, Ltd. | | | 14,936,090 | |
| | | | | | | | | | |
| | | | | | | | | 222,749,885 | |
| | | | | | | | | | |
| | | | | | Consumer Staples (2.6%) | |
| | 72,000 | | | | | Constellation Brands, Inc. - Class A | | | 15,240,240 | |
| | | |
| | 7,100 | | | | | Lamb Weston Holdings, Inc. | | | 497,355 | |
| | | |
| | 214,500 | | | | | Walmart, Inc. | | | 22,059,180 | |
| | | | | | | | | | |
| | | | | | | | | 37,796,775 | |
| | | | | | | | | | |
| | | | | | Energy (1.0%) | |
| | 182,500 | | | | | Exxon Mobil Corp.~ | | | 14,651,100 | |
| | | |
| | 10,000 | | | | | Hess Midstream Partners, LP | | | 221,000 | |
| | | |
| | 21,000 | | | | | ProPetro Holding Corp.# | | | 464,730 | |
| | | | | | | | | | |
| | | | | | | | | 15,336,830 | |
| | | | | | | | | | |
| | | | | | Financials (7.0%) | |
| | 20,700 | | | | | Arch Capital Group, Ltd.# | | | 699,246 | |
| | | |
| | 36,000 | | | | | Ares Capital Corp.^ | | | 648,000 | |
| | | |
| | 258,000 | | | | | Cboe Global Markets, Inc. | | | 26,215,380 | |
| | | |
| | 5,000 | | | | | Cincinnati Financial Corp. | | | 480,900 | |
| | | |
| | 18,500 | | | | | Citizens Financial Group, Inc. | | | 669,700 | |
| | | |
| | 1,280 | | | | | Credit Acceptance Corp.#^ | | | 635,162 | |
| | | |
| | 59,500 | | | | | E*TRADE Financial Corp.~ | | | 3,014,270 | |
| | | |
| | 13,900 | | | | | Essent Group, Ltd.# | | | 659,555 | |
| | | |
| | 47,000 | | | | | First BanCorp | | | 531,100 | |
| | | |
| | 6,000 | | | | | First Republic Bank | | | 633,720 | |
| | | | | | | | | | |
NUMBER OF
SHARES | | | | | | | VALUE | |
| | | |
| | 13,000 | | | | | Fulton Financial Corp. | | $ | 224,250 | |
| | | |
| | 86,500 | | | | | Goldman Sachs Group, Inc. | | | 17,812,080 | |
| | | |
| | 115,000 | | | | | Green Dot Corp. - Class A# | | | 7,333,550 | |
| | | |
| | 12,500 | | | | | Hartford Financial Services Group, Inc. | | | 653,875 | |
| | | |
| | 11,000 | | | | | Houlihan Lokey, Inc. | | | 542,520 | |
| | | |
| | 7,600 | | | | | IBERIABANK Corp. | | | 604,200 | |
| | | |
| | 277,000 | | | | | Intercontinental Exchange, Inc.~ | | | 22,533,950 | |
| | | |
| | 9,000 | | | | | Lincoln National Corp. | | | 600,480 | |
| | | |
| | 8,090 | | | | | LPL Financial Holdings, Inc. | | | 599,388 | |
| | | |
| | 46,200 | | | | | MGIC Investment Corp.# | | | 676,368 | |
| | 25,620 | | | | | NMI Holdings, Inc. - Class A# | | | 719,409 | |
| | | |
| | 54,300 | | | | | SLM Corp. | | | 551,688 | |
| | | |
| | 1,200 | | | | | SVB Financial Group# | | | 302,064 | |
| | | |
| | 12,500 | | | | | Synchrony Financial | | | 433,375 | |
| | | |
| | 7,000 | | | | | TriCo Bancshares | | | 279,370 | |
| | | |
| | 267,500 | | | | | US Bancorp~ | | | 14,263,100 | |
| | | |
| | 8,300 | | | | | Webster Financial Corp. | | | 440,979 | |
| | | | | | | | | | |
| | | | | | | | | 102,757,679 | |
| | | | | | | | | | |
| | | | | | Health Care (15.8%) | |
| | 205,500 | | | | | Alexion Pharmaceuticals, Inc.#~ | | | 27,974,715 | |
| | | |
| | 446,500 | | | | | Baxter International, Inc. | | | 34,067,950 | |
| | | |
| | 4,500 | | | | | BioTelemetry, Inc.# | | | 244,800 | |
| | | |
| | 11,500 | | | | | Bruker Corp. | | | 443,900 | |
| | | |
| | 900 | | | | | Chemed Corp. | | | 294,102 | |
| | | |
| | 2,000 | | | | | DexCom, Inc.# | | | 242,140 | |
| | | |
| | 37,500 | | | | | Edwards Lifesciences Corp.# | | | 6,602,625 | |
| | | |
| | 25,300 | | | | | Exelixis, Inc.# | | | 497,398 | |
| | | |
| | 5,840 | | | | | Genomic Health, Inc.#^ | | | 375,687 | |
| | | |
| | 10,500 | | | | | HMS Holdings Corp.# | | | 319,515 | |
| | | |
| | 13,000 | | | | | Horizon Pharma, PLC# | | | 331,890 | |
| | | |
| | 105,000 | | | | | Humana, Inc. | | | 26,818,050 | |
| | | |
| | 3,000 | | | | | Ionis Pharmaceuticals, Inc.# | | | 222,990 | |
| | | |
| | 152,500 | | | | | Johnson & Johnson~ | | | 21,533,000 | |
| | | |
| | 160,000 | | | | | Laboratory Corp. of America Holdings#~ | | | 25,587,200 | |
| | | |
| | 15,000 | | | | | Lantheus Holdings, Inc.# | | | 362,400 | |
| | | |
| | 278,500 | | | | | Medtronic, PLC | | | 24,733,585 | |
| | | |
| | 174,000 | | | | | Merck & Company, Inc. | | | 13,695,540 | |
| | | |
| | 8,000 | | | | | Pacira BioSciences, Inc.# | | | 318,560 | |
| | | |
| | 650,000 | | | | | Pfizer, Inc.~ | | | 26,396,500 | |
| | | |
| | 92,000 | | | | | UnitedHealth Group, Inc.~ | | | 21,442,440 | |
| | | |
| | 3,600 | | | | | Universal Health Services, Inc. - Class B | | | 456,732 | |
| | | |
| | 3,200 | | | | | Veeva Systems, Inc., Class A# | | | 447,584 | |
| | | | | | | | | | |
| | | | | | | | | 233,409,303 | |
| | | | | | | | | | |
| | | | | | Industrials (13.2%) | |
| | 15,000 | | | CAD | | Aecon Group, Inc. | | | 214,414 | |
| | | | |
| 102 | | CALAMOS OPEN-END FAMILY OF FUNDS SEMIANNUAL REPORT | | See accompanying Notes to Schedule of Investments |
Growth Fund Schedule of Investments April 30, 2019 (Unaudited)
| | | | | | | | | | |
NUMBER OF
SHARES | | | | | | | VALUE | |
| | | |
| | 404,000 | | | | | Air Lease Corp.~ | | $ | 15,578,240 | |
| | | |
| | 12,300 | | | | | Allison Transmission Holdings, Inc. | | | 576,378 | |
| | | |
| | 26,000 | | | | | Atkore International Group, Inc.# | | | 643,760 | |
| | | |
| | 56,500 | | | | | Boeing Company | | | 21,339,485 | |
| | | |
| | 366,500 | | | | | Delta Air Lines, Inc.~ | | | 21,363,285 | |
| | | |
| | 223,500 | | | | | Emerson Electric Company | | | 15,866,265 | |
| | | |
| | 10,730 | | | | | Generac Holdings, Inc.# | | | 590,043 | |
| | | |
| | 167,000 | | | | | Harris Corp. | | | 28,139,500 | |
| | | |
| | 8,000 | | | | | Herman Miller, Inc. | | | 310,560 | |
| | | |
| | 108,500 | | | | | Honeywell International, Inc. | | | 18,838,855 | |
| | | |
| | 5,000 | | | | | Hubbell, Inc. | | | 638,000 | |
| | | |
| | 59,500 | | | | | Lyft, Inc. - Class A#^ | | | 3,558,100 | |
| | | |
| | 7,600 | | | | | Oshkosh Corp. | | | 627,684 | |
| | | |
| | 146,500 | | | | | Raytheon Company~ | | | 26,016,935 | |
| | | |
| | 12,000 | | | | | Rush Enterprises Inc- Class A | | | 508,920 | |
| | | |
| | 246,500 | | | | | TransUnion~ | | | 17,168,725 | |
| | | |
| | 12,000 | | | | | Triton International Ltd/Bermuda | | | 395,400 | |
| | | |
| | 80,000 | | | | | United Continental Holdings, Inc.# | | | 7,108,800 | |
| | | |
| | 142,000 | | | | | Waste Management, Inc. | | | 15,242,280 | |
| | | |
| | 22,000 | | | | | ZTO Express Cayman, Inc. | | | 438,460 | |
| | | | | | | | | | |
| | | | | | | | | 195,164,089 | |
| | | | | | | | | | |
| | | | | | Information Technology (20.4%) | |
| | 8,030 | | | | | Akamai Technologies, Inc.# | | | 642,882 | |
| | | |
| | 3,600 | | | | | Ansys, Inc.# | | | 704,880 | |
| | | |
| | 11,180 | | | | | Booz Allen Hamilton Holding Corp. | | | 662,862 | |
| | | |
| | 2,600 | | | | | CACI International, Inc. - Class A# | | | 506,844 | |
| | | |
| | 12,500 | | | | | Cadence Design Systems, Inc.# | | | 867,250 | |
| | | |
| | 6,300 | | | | | CDW Corp. | | | 665,280 | |
| | | |
| | 600 | | | CAD | | Constellation Software, Inc. | | | 529,404 | |
| | | |
| | 3,710 | | | | | CyberArk Software, Ltd.# | | | 478,330 | |
| | | |
| | 2,800 | | | | | EPAM Systems, Inc.# | | | 502,208 | |
| | | |
| | 2,920 | | | | | Euronet Worldwide, Inc.#^ | | | 437,679 | |
| | | |
| | 25,000 | | | | | EVERTEC, Inc. | | | 782,750 | |
| | | |
| | 242,000 | | | | | Fidelity National Information Services, Inc. | | | 28,055,060 | |
| | | |
| | 269,500 | | | | | First Solar, Inc.#^ | | | 16,582,335 | |
| | | |
| | 3,180 | | | | | Fortinet, Inc.# | | | 297,076 | |
| | | |
| | 18,800 | | | | | Genpact, Ltd. | | | 682,440 | |
| | | |
| | 15,000 | | | | | KBR, Inc. | | | 333,300 | |
| | | |
| | 791,000 | | | | | Microsoft Corp.~ | | | 103,304,600 | |
| | | |
| | 38,000 | | | | | NVIDIA Corp. | | | 6,878,000 | |
| | | |
| | 29,600 | | | | | ON Semiconductor Corp.# | | | 682,576 | |
| | | |
| | 171,000 | | | | | PayPal Holdings, Inc.# | | | 19,283,670 | |
| | | |
| | 209,400 | | | | | RealPage, Inc.#^ | | | 13,654,974 | |
| | | |
| | 107,500 | | | | | Salesforce.com, Inc.#~ | | | 17,775,125 | |
| | | |
| | 3,500 | | | | | Tech Data Corp.# | | | 373,135 | |
| | | |
| | 15,000 | | | | | Teradyne, Inc. | | | 735,000 | |
| | | | | | | | | | |
NUMBER OF
SHARES | | | | | | | VALUE | |
| | | |
| | 112,500 | | | | | Twilio, Inc. - Class A#^ | | $ | 15,428,250 | |
| | | |
| | 7,000 | | | | | Verint Systems, Inc.# | | | 422,730 | |
| | | |
| | 273,000 | | | | | Visa, Inc. - Class A~ | | | 44,889,390 | |
| | | |
| | 42,000 | | | | | Worldpay, Inc. - Class A# | | | 4,922,820 | |
| | | |
| | 3,940 | | | | | Zebra Technologies Corp. - Class A# | | | 831,891 | |
| | | |
| | 218,000 | | | | | Zendesk, Inc.# | | | 19,136,040 | |
| | | | | | | | | | |
| | | | | | | | | 301,048,781 | |
| | | | | | | | | | |
| | | | | | Materials (1.6%) | | | | |
| | 113,000 | | | | | Air Products & Chemicals, Inc. | | | 23,254,270 | |
| | | |
| | 2,600 | | | | | Ingevity Corp.# | | | 299,026 | |
| | | | | | | | | | |
| | | | | | | | | 23,553,296 | |
| | | | | | | | | | |
| | | | | | Real Estate (0.0%) | | | | |
| | 5,600 | | | | | Marcus & Millichap, Inc.# | | | 241,360 | |
| | | | | | | | | | |
| | | |
| | | | | | TOTAL COMMON STOCKS
(Cost $986,181,584) | | | 1,349,266,669 | |
| | | | | | | | | | |
| | | | | | | | | | |
|
| | EXCHANGE-TRADED FUNDS (0.1%) | |
| | | | | | Other (0.1%) | | | | |
| | 7,000 | | | | | iShares RussellMid-Cap Growth ETF | | | 991,200 | |
| | | |
| | 16,270 | | | | | iShares U.S. Real Estate ETF^ | | | 1,415,490 | |
| | | | | | | | | | |
| | | |
| | | | | | TOTAL EXCHANGE-TRADED FUNDS
(Cost $2,268,306) | | | 2,406,690 | |
| | | | | | | | | | |
| | | | | | | | | | |
|
| | INVESTMENTS IN AFFILIATED FUND (0.4%) | |
| | | | | | Other (0.4%) | | | | |
| | 555,115 | | | | | Calamos Short-Term Bond Fund - Class I
(Cost $5,540,119) | | | 5,595,561 | |
| | | | | | | | | | |
| | | | | | | | | | |
NUMBER OF
CONTRACTS/
NOTIONAL
AMOUNT | | | | | | | VALUE | |
|
| | PURCHASED OPTIONS (0.1%)# | |
| | | | | | Consumer Discretionary (0.0%) | |
| | 165 | | | | | Amazon.com, Inc. | | | | |
| | 31,787,580 | | | | | Call, 05/17/19, Strike $2,000.00 | | | 138,600 | |
| | | | | | | | | | |
| | | | | | Consumer Staples (0.0%) | | | | |
| | 1,325 | | | | | Walmart, Inc. | | | | |
| | 13,626,300 | | | | | Call, 05/31/19, Strike $105.00 | | | 188,812 | |
| | | | | | | | | | |
| | | | | | Information Technology (0.0%) | |
| | 1,075 | | | | | Salesforce.com, Inc. | | | | |
| | 17,775,125 | | | | | Put, 05/17/19, Strike $155.00 | | | 73,638 | |
| | | | | | | | | | |
| | | | | | Other (0.1%) | | | | |
| | 5,000 | | | | | SPDR S&P 500 ETF Trust | | | | |
| | 147,010,000 | | | | | Put, 05/28/19, Strike $290.00 | | | 915,000 | |
| | | | | | | | | | |
| | | |
| | | | | | TOTAL PURCHASED OPTIONS
(Cost $2,127,397) | | | 1,316,050 | |
| | | | | | | | | | |
| | | | | | | | | | |
| | | | | | |
| See accompanying Notes to Schedule of Investments | | www.calamos.com | | | 103 | |
Growth Fund Schedule of Investments April 30, 2019 (Unaudited)
| | | | | | | | | | |
NUMBER OF
SHARES | | | | | | | VALUE | |
|
| | SHORT TERM INVESTMENTS (7.9%) | |
| | 58,068,845 | | | | | Fidelity Prime Money Market Fund - Institutional Class, 2.500%*** | | $ | 58,086,266 | |
| | | |
| | 58,056,952 | | | | | Morgan Stanley Institutional Liquidity Funds - Government Portfolio, 2.350%*** | | | 58,056,952 | |
| | | | | | | | | | |
| | | |
| | | | | | TOTAL SHORT TERM INVESTMENTS
(Cost $116,147,426) | | | 116,143,218 | |
| | | | | | | | | | |
| | | | | | | | | | |
NUMBER OF
SHARES/
PRINCIPAL
AMOUNT | | | | | | | VALUE | |
|
| INVESTMENT OF CASH COLLATERAL FOR SECURITIES
LOANED (2.2%) |
|
| | 8,440,660 | | | | | Fidelity Prime Money Market Fund - Institutional Class, 2.500%***† | | | 8,440,660 | |
| | | |
| | 24,518,050 | | | | | State Street Navigator Securities Lending Government Money Market Portfolio† | | | 24,518,050 | |
| | | | | | | | | | |
| | | |
| | | | | | TOTAL INVESTMENT OF CASH COLLATERAL FOR SECURITIES LOANED
(Cost $32,958,710) | | | 32,958,710 | |
| | | | | | | | | | |
| |
| TOTAL INVESTMENTS (102.1%)
(Cost $1,145,223,542) | | | 1,507,686,898 | |
| | | | | | | | | | |
| |
| | PAYABLE UPON RETURN OF SECURITIES ON LOAN(-2.2%) | | | (32,958,710 | ) |
| | | | | | | | | | |
| |
| | OTHER ASSETS, LESS LIABILITIES (0.1%) | | | 1,441,605 | |
| | | | | | | | | | |
| |
| | NET ASSETS (100.0%) | | $ | 1,476,169,793 | |
| | | | | | | | | | |
| | | | | | | | | | |
NUMBER OF
CONTRACTS/
NOTIONAL
AMOUNT | | | | | | | VALUE | |
|
| | WRITTEN OPTIONS(-0.2%)# | |
| | | | | | Communication Services(-0.1%) | | | | |
| | | | | | Facebook, Inc. | | | | |
| 1,467
28,371,780 |
| | | | Call, 06/21/19, Strike $200.00 | | | (619,808 | ) |
| 1,100
21,274,000 |
| | | | Put, 06/21/19, Strike $140.00 | | | (12,650 | ) |
| 733
14,176,220 |
| | | | Call, 07/19/19, Strike $215.00 | | | (138,903 | ) |
| | | | | | | | | | |
| | | | | | | | | (771,361 | ) |
| | | | | | | | | | |
| | | | | | Consumer Discretionary (0.0%) | |
| | | | | | Amazon.com, Inc. | | | | |
| 165
31,787,580 |
| | | | Call, 06/21/19, Strike $2,175.00 | | | (64,762 | ) |
| | | | | | | | | | |
NUMBER OF
CONTRACTS/
NOTIONAL
AMOUNT | | | | | | | VALUE | |
| 165
31,787,580 |
| | | | Call, 06/21/19, Strike $2,000.00 | | $ | (531,713 | ) |
| | | | | | | | | | |
| | | | | | | | | (596,475 | ) |
| | | | | | | | | | |
| | | | | | Information Technology (0.0%) | |
| 130
2,353,000 |
| | | | NVIDIA Corp. Call, 05/17/19, Strike $160.00 | | | (296,725 | ) |
| | | |
| 1,075
17,775,125 |
| | | | Salesforce.com, Inc. Put, 06/21/19, Strike $135.00 | | | (76,325 | ) |
| | | | | | | | | | |
| | | | | | | | | (373,050 | ) |
| | | | | | | | | | |
| | | | | | Other(-0.1%) | | | | |
| 9,000
70,209,000 |
| | | | Industrial Select Sector SPDR Fund Put, 06/21/19, Strike $65.00 | | | (90,000 | ) |
| | | |
| 7,500
220,515,000 |
| | | | SPDR S&P 500 ETF Trust Put, 06/28/19, Strike $270.00 | | | (930,000 | ) |
| | | | | | | | | | |
| | | | | | | | | (1,020,000 | ) |
| | | | | | | | | | |
| | | |
| | | | | | TOTAL WRITTEN OPTIONS
(Premium $2,839,473) | | $ | (2,760,886 | ) |
| | | | | | | | | | |
NOTES TO SCHEDULE OF INVESTMENTS
| # | Non-income producing security. |
| ~ | Security, or portion of security, is segregated as collateral (or potential collateral for future transactions) for written options. The aggregate value of such securities is $62,612,046. |
| ^ | Security, or portion of security, is on loan. |
| *** | The rate disclosed is the 7 day net yield as of April 30, 2019. |
| † | Represents investment of cash collateral received from securities on loan as of April 30, 2019. |
FOREIGN CURRENCY ABBREVIATION
Note: Value for securities denominated in foreign currencies is shown in U.S. dollars. The date on options represents the expiration date of the option contract. The option contract may be exercised at any date on or before the date shown.
| | | | |
| 104 | | CALAMOS OPEN-END FAMILY OF FUNDS SEMIANNUAL REPORT | | See accompanying Notes to Financial Statements |
Growth and Income Fund Schedule of Investments April 30, 2019 (Unaudited)
| | | | | | | | | | |
PRINCIPAL
AMOUNT | | | | | | | VALUE | |
|
| | CONVERTIBLE BONDS (14.8%) | |
| | | | | | Communication Services (2.1%) | | | | |
| | 6,600,000 | | | | | GCI Liberty, Inc.*
1.750%, 09/30/46 | | $ | 7,459,386 | |
| | | |
| | | | | | Liberty Media Corp. | | | | |
| | 9,685,000 | | | | | 2.250%, 09/30/46 | | | 5,015,377 | |
| | 6,963,000 | | | | | 1.375%, 10/15/23 | | | 8,129,198 | |
| | | |
| | 5,125,000 | | | | | Liberty Media Corp. (Sirius XM Holdings, Inc.)*§
2.125%, 03/31/48 | | | 4,977,374 | |
| | | |
| | 8,050,000 | | | | | Liberty Media Corp. / Liberty Formula One
1.000%, 01/30/23 | | | 9,661,610 | |
| | | |
| | 2,090,000 | | | | | Live Nation Entertainment, Inc.^
2.500%, 03/15/23 | | | 2,462,804 | |
| | | |
| | 5,150,000 | | | | | Twitter, Inc.*^
0.250%, 06/15/24 | | | 5,195,629 | |
| | | | | | | | | | |
| | | | | | | | | 42,901,378 | |
| | | | | | | | | | |
| | | | | | Consumer Discretionary (1.6%) | | | | |
| | 7,300,000 | | | | | Booking Holdings, Inc.
0.350%, 06/15/20 | | | 10,437,796 | |
| | | |
| | 1,856,000 | | | | | Chegg, Inc.*^
0.125%, 03/15/25 | | | 1,778,196 | |
| | | |
| | | | | | Ctrip.com International, Ltd. | | | | |
| | 2,130,000 | | | | | 1.000%, 07/01/20 | | | 2,189,906 | |
| | 2,010,000 | | | | | 1.990%, 07/01/25^ | | | 2,255,019 | |
| | | |
| | 2,150,000 | | | | | DISH Network Corp.
3.375%, 08/15/26 | | | 1,973,861 | |
| | | |
| | 3,025,000 | | | | | Guess, Inc.*^
2.000%, 04/15/24 | | | 3,163,500 | |
| | | |
| | 5,200,000 | | | | | RH*
0.000%, 06/15/23 | | | 4,543,656 | |
| | | |
| | 5,885,000 | | | | | Tesla, Inc.
1.250%, 03/01/21 | | | 5,787,986 | |
| | | | | | | | | | |
| | | | | | | | | 32,129,920 | |
| | | | | | | | | | |
| | | | | | Energy (0.3%) | | | | |
| | 1,593,000 | | | | | Oil States International, Inc.
1.500%, 02/15/23 | | | 1,436,360 | |
| | | |
| | 5,000,000 | | | | | TOTAL, SA
0.500%, 12/02/22 | | | 5,326,650 | |
| | | | | | | | | | |
| | | | | | | | | 6,763,010 | |
| | | | | | | | | | |
| | | | | | Financials (0.8%) | | | | |
| | 3,950,000 | | | | | Ares Capital Corp.^
4.625%, 03/01/24 | | | 4,003,384 | |
| | | |
| | 6,600,000 | | | | | JPMorgan Chase Bank, N.A.
0.000%, 12/30/20 | | | 7,753,614 | |
| | | |
| | 4,000,000 | | | | | JPMorgan Chase Financial Company, LLC (Voya Financial, Inc.)*§
0.250%, 05/01/23 | | | 4,035,920 | |
| | | | | | | | | | |
| | | | | | | | | 15,792,918 | |
| | | | | | | | | | |
| | | | | | | | | | |
PRINCIPAL
AMOUNT | | | | | | | VALUE | |
| | | | | | | | | | |
| | | | | | Health Care (2.2%) | | | | |
| | 1,750,000 | | | | | BioMarin Pharmaceutical, Inc.
1.500%, 10/15/20 | | $ | 1,966,790 | |
| | | |
| | 4,700,000 | | | | | CONMED Corp.*
2.625%, 02/01/24 | | | 5,170,728 | |
| | | |
| | 5,845,000 | | | | | DexCom, Inc.*
0.750%, 12/01/23 | | | 6,100,690 | |
| | | |
| | 2,045,000 | | | | | Evolent Health, Inc.*
1.500%, 10/15/25 | | | 1,675,878 | |
| | | |
| | 4,750,000 | | | | | Exact Sciences Corp.
0.375%, 03/15/27 | | | 5,333,727 | |
| | | |
| | | | | | Illumina, Inc. | | | | |
| | 7,172,000 | | | | | 0.000%, 08/15/23*^ | | | 7,723,455 | |
| | 4,149,000 | | | | | 0.000%, 06/15/19 | | | 5,080,513 | |
| | | |
| | 4,135,000 | | | | | Insulet Corp.*
1.375%, 11/15/24 | | | 4,702,467 | |
| | | |
| | 1,600,000 | | | | | Neurocrine Biosciences, Inc.
2.250%, 05/15/24 | | | 1,938,016 | |
| | | |
| | 1,325,000 | | | | | Teladoc Health, Inc.*^
1.375%, 05/15/25 | | | 1,775,632 | |
| | | |
| | 3,550,000 | | | | | Wright Medical Group, Inc.*^
1.625%, 06/15/23 | | | 3,864,477 | |
| | | | | | | | | | |
| | | | | | | | | 45,332,373 | |
| | | | | | | | | | |
| | | | | | Industrials (0.6%) | | | | |
| | 2,050,000 | | | | | Air Transport Services Group, Inc.
1.125%, 10/15/24 | | | 2,053,536 | |
| | | |
| | 7,145,000 | | | | | Fortive Corp.*^
0.875%, 02/15/22 | | | 7,564,590 | |
| | | |
| | 2,930,000 | | | | | Meritor, Inc.^
3.250%, 10/15/37 | | | 3,009,975 | |
| | | | | | | | | | |
| | | | | | | | | 12,628,101 | |
| | | | | | | | | | |
| | | | | | Information Technology (5.9%) | | | | |
| | 4,605,000 | | | | | 8x8, Inc.*
0.500%, 02/01/24 | | | 5,188,315 | |
| | | |
| | 1,727,000 | | | | | Akamai Technologies, Inc.*
0.125%, 05/01/25 | | | 1,827,770 | |
| | | |
| | 2,060,000 | | | | | Cypress Semiconductor Corp.
2.000%, 02/01/23 | | | 2,242,640 | |
| | | |
| | 5,250,000 | | | | | DocuSign, Inc.*^
0.500%, 09/15/23 | | | 5,645,771 | |
| | | |
| | 2,000,000 | | | | | Envestnet, Inc.
1.750%, 12/15/19 | | | 2,353,220 | |
| | | |
| | 2,316,000 | | | | | Euronet Worldwide, Inc.*^
0.750%, 03/15/49 | | | 2,595,379 | |
| | | |
| | 1,760,000 | | | | | II-VI, Inc.
0.250%, 09/01/22 | | | 1,925,440 | |
| | | |
| | 7,000,000 | | | | | Intel Corp.
3.250%, 08/01/39 | | | 17,504,725 | |
| | | |
| | 4,285,000 | | | | | Lumentum Holdings, Inc.^
0.250%, 03/15/24 | | | 5,344,616 | |
| | | |
| | 6,200,000 | | | | | Microchip Technology, Inc.
1.625%, 02/15/27 | | | 8,041,555 | |
| | | | | | |
| See accompanying Notes to Schedule of Investments | | www.calamos.com | | | 105 | |
Growth and Income Fund Schedule of Investments April 30, 2019 (Unaudited)
| | | | | | | | | | |
PRINCIPAL
AMOUNT | | | | | | | VALUE | |
| | | |
| | 3,998,000 | | | | | New Relic, Inc.*
0.500%, 05/01/23 | | $ | 4,662,108 | |
| | | |
| | 3,775,000 | | | | | NXP Semiconductors, NV
1.000%, 12/01/19 | | | 4,174,961 | |
| | | |
| | 6,184,000 | | | | | ON Semiconductor Corp.
1.000%, 12/01/20 | | | 8,292,187 | |
| | | |
| | 6,125,000 | | | | | Palo Alto Networks, Inc.*
0.750%, 07/01/23 | | | 6,943,974 | |
| | | |
| | 1,388,000 | | | | | Pluralsight, Inc.*
0.375%, 03/01/24 | | | 1,586,866 | |
| | | |
| | 2,000,000 | | | | | Pure Storage, Inc.
0.125%, 04/15/23 | | | 2,214,740 | |
| | | |
| | 4,375,000 | | | | | Silicon Laboratories, Inc.
1.375%, 03/01/22 | | | 5,573,116 | |
| | | |
| | 5,165,000 | | | | | Splunk, Inc.*
0.500%, 09/15/23 | | | 5,876,479 | |
| | | |
| | 1,025,000 | | | | | Twilio, Inc.*
0.250%, 06/01/23 | | | 2,067,968 | |
| | | |
| | 5,100,000 | | | | | Wix.com, Ltd.*^
0.000%, 07/01/23 | | | 5,992,194 | |
| | | |
| | 6,750,000 | | | | | Workday, Inc.
0.250%, 10/01/22 | | | 10,022,299 | |
| | | |
| | 7,320,000 | | | | | Zendesk, Inc.
0.250%, 03/15/23 | | | 11,060,520 | |
| | | | | | | | | | |
| | | | | | | | | 121,136,843 | |
| | | | | | | | | | |
| | | | | | Materials (0.2%) | |
| | 5,150,000 | | | | | Royal Gold, Inc.
2.875%, 06/15/19 | | | 5,150,412 | |
| | | | | | | | | | |
| | | | | | Real Estate (0.8%) | |
| | 7,345,000 | | | | | Empire State Realty OP, LP*
2.625%, 08/15/19 | | | 7,326,270 | |
| | | |
| | 1,750,000 | | | | | Extra Space Storage, LP*
3.125%, 10/01/35 | | | 2,047,666 | |
| | | |
| | 5,340,000 | | | | | IH Merger Sub, LLC
3.500%, 01/15/22 | | | 6,202,277 | |
| | | | | | | | | | |
| | | | | | | | | 15,576,213 | |
| | | | | | | | | | |
| | | | | | Utilities (0.3%) | |
| | 5,100,000 | | | | | NRG Energy, Inc.*
2.750%, 06/01/48 | | | 5,735,792 | |
| | | | | | | | | | |
| | | |
| | | | | | TOTAL CONVERTIBLE BONDS
(Cost $272,817,560) | | | 303,146,960 | |
| | | | | | | | | | |
| | | | | | | | | | |
|
| | SYNTHETIC CONVERTIBLE SECURITIES (4.8%)¤ | |
| | Corporate Bonds (3.0%) | |
| | | | | | Communication Services (0.5%) | |
| | 9,865,000 | | | | | Alphabet, Inc.
3.375%, 02/25/24 | | | 10,245,493 | |
| | | | | | | | | | |
| | | | | | Consumer Discretionary (1.4%) | |
| | 5,153,000 | | | | | Dana, Inc.
5.500%, 12/15/24 | | | 5,240,575 | |
| | | | | | | | | | |
PRINCIPAL
AMOUNT | | | | | | | VALUE | |
| | | |
| | 9,900,000 | | | | | Home Depot, Inc.
2.700%, 04/01/23 | | $ | 9,927,968 | |
| | | |
| | 10,000,000 | | | | | L Brands, Inc.
5.625%, 02/15/22 | | | 10,400,700 | |
| | | |
| | 2,429,000 | | | | | Lowe’s Companies, Inc.
3.875%, 09/15/23 | | | 2,522,747 | |
| | | | | | | | | | |
| | | | | | | | | 28,091,990 | |
| | | | | | | | | | |
| | | | | | Consumer Staples (0.5%) | |
| | 9,865,000 | | | | | Walmart, Inc.
3.300%, 04/22/24 | | | 10,126,669 | |
| | | | | | | | | | |
| | | | | | Financials (0.2%) | | | | |
| | 4,950,000 | | | | | Berkshire Hathaway, Inc.
2.750%, 03/15/23 | | | 4,968,761 | |
| | | | | | | | | | |
| | | | | | Health Care (0.1%) | | | | |
| | 3,000,000 | | | | | Universal Health Services, Inc.*^
4.750%, 08/01/22 | | | 3,033,960 | |
| | | | | | | | | | |
| | | | | | Information Technology (0.3%) | | | | |
| | 4,935,000 | | | | | Apple, Inc.^
3.450%, 05/06/24 | | | 5,092,106 | |
| | | | | | | | | | |
| | | |
| | | | | | TOTAL CORPORATE BONDS | | | 61,558,979 | |
| | | | | | | | | | |
| | U.S. Government and Agency Securities (1.6%) | |
| | | | | | United States Treasury Note | | | | |
| | | |
| | 11,600,000 | | | | | 1.125%, 06/30/21 | | | 11,328,368 | |
| | | |
| | 10,800,000 | | | | | 2.000%, 01/31/20 | | | 10,767,320 | |
| | | |
| | 5,800,000 | | | | | 1.625%, 05/15/26^ | | | 5,509,983 | |
| | | |
| | 5,500,000 | | | | | 2.000%, 11/15/26 | | | 5,340,599 | |
| | | | | | | | | | |
| | | |
| | | | | | TOTAL U.S. GOVERNMENT AND AGENCY SECURITIES | | | 32,946,270 | |
| | | | | | | | | | |
NUMBER OF
CONTRACTS/
NOTIONAL
AMOUNT | | | | | | | VALUE | |
|
| | Purchased Options (0.2%)# | |
| | | | | | Other (0.2%) | | | | |
| 5,105
22,712,145 |
| | | | iShares ChinaLarge-Cap ETF
Call, 06/21/19, Strike $44.00 | | | 750,435 | |
| | | |
| 7,125
47,566,500 |
| | | | iShares MSCI EAFE ETF
Call, 06/21/19, Strike $64.00 | | | 2,183,813 | |
| | | |
| 3,865
16,978,945 |
| | | | iShares MSCI Emerging Markets ETF
Call, 06/21/19, Strike $43.00 | | | 622,265 | |
| | | |
| 2,350
6,815,000 |
| | | | Xtrackers Harvest CSI 300 China A Shares ETF
Call, 10/18/19, Strike $30.00 | | | 399,500 | |
| | | | | | | | | | |
| | | |
| | | | | | TOTAL PURCHASED OPTIONS | | | 3,956,013 | |
| | | | | | | | | | |
| | | |
| | | | | | TOTAL SYNTHETIC CONVERTIBLE SECURITIES
(Cost $98,440,006) | | | 98,461,262 | |
| | | | | | | | | | |
| | | | |
| 106 | | CALAMOS OPEN-END FAMILY OF FUNDS SEMIANNUAL REPORT | | See accompanying Notes to Schedule of Investments |
Growth and Income Fund Schedule of Investments April 30, 2019 (Unaudited)
| | | | | | | | | | |
NUMBER OF
SHARES | | | | | | | VALUE | |
|
| | CONVERTIBLE PREFERRED STOCKS (7.4%) | |
| | | | | | Communication Services (0.4%) | | | | |
| | 35,185 | | | | | Alibaba Exchangeable (Softbank)*§
5.750%, 06/01/19 | | $ | 7,303,667 | |
| | | | | | | | | | |
| | | | | | Financials (0.5%) | | | | |
| | 80,250 | | | | | AMG Capital Trust II^
5.150%, 10/15/37 | | | 4,098,086 | |
| | | |
| | 46,665 | | | | | Assurant, Inc.
6.500%, 03/15/21 | | | 4,853,627 | |
| | | | | | | | | | |
| | | | | | | | | 8,951,713 | |
| | | | | | | | | | |
| | | | | | Health Care (0.8%) | | | | |
| | 104,250 | | | | | Becton Dickinson and Company
6.125%, 05/01/20 | | | 6,203,917 | |
| | | |
| | 9,890 | | | | | Danaher Corp.
4.750%, 04/15/22 | | | 10,419,115 | |
| | | | | | | | | | |
| | | | | | | | | 16,623,032 | |
| | | | | | | | | | |
| | | | | | Industrials (1.6%) | | | | |
| | 7,645 | | | | | Fortive Corp.
5.000%, 07/01/21 | | | 8,252,319 | |
| | | |
| | 204,910 | | | | | Rexnord Corp.
5.750%, 11/15/19 | | | 12,017,972 | |
| | | |
| | 122,025 | | | | | Stanley Black & Decker, Inc.^
5.375%, 05/15/20 | | | 12,496,580 | |
| | | | | | | | | | |
| | | | | | | | | 32,766,871 | |
| | | | | | | | | | |
| | | | | | Materials (0.2%) | | | | |
| | 83,500 | | | | | International Flavors & Fragrances, Inc.
6.000%, 09/15/21 | | | 4,377,905 | |
| | | | | | | | | | |
| | | | | | Real Estate (0.8%) | | | | |
| | 14,350 | | | | | Crown Castle International Corp.
6.875%, 08/01/20 | | | 16,559,757 | |
| | | | | | | | | | |
| | | | | | Utilities (3.1%) | | | | |
| | 197,565 | | | | | American Electric Power Company, Inc.
6.125%, 03/15/22 | | | 10,269,429 | |
| | | |
| | 121,500 | | | | | Aqua America, Inc.#
6.000%, 04/30/22 | | | 6,631,470 | |
| | | |
| | 80,675 | | | | | CenterPoint Energy, Inc. (Warner Media, LLC, Charter Communications Time, Inc.)§**
4.516%, 09/15/29 | | | 3,821,736 | |
| | | |
| | 262,305 | | | | | DTE Energy Company
6.500%, 10/01/19 | | | 14,639,242 | |
| | | |
| | 328,590 | | | | | NextEra Energy, Inc.
6.123%, 09/01/19 | | | 20,504,016 | |
| | | |
| | | | | | Sempra Energy | | | | |
| | 41,640 | | | | | 6.750%, 07/15/21 | | | 4,477,549 | |
| | 30,200 | | | | | 6.000%, 01/15/21 | | | 3,228,078 | |
| | | | | | | | | | |
| | | | | | | | | 63,571,520 | |
| | | | | | | | | | |
| | | |
| | | | | | TOTAL CONVERTIBLE PREFERRED STOCKS
(Cost $140,783,034) | | | 150,154,465 | |
| | | | | | | | | | |
| | | | | | | | | | |
NUMBER OF
SHARES | | | | | | | VALUE | |
|
| | COMMON STOCKS (69.4%) | |
| | | | | | Communication Services (8.0%) | | | | |
| | 45,055 | | | | | Alphabet, Inc. - Class A#~ | | $ | 54,019,143 | |
| | | |
| | 271,175 | | | | | AT&T, Inc. | | | 8,395,578 | |
| | | |
| | 321,635 | | | | | Comcast Corp. - Class A | | | 14,000,772 | |
| | | |
| | 170,250 | | | | | Facebook, Inc. - Class A# | | | 32,926,350 | |
| | | |
| | 33,630 | | | | | Netflix, Inc.# | | | 12,461,260 | |
| | | |
| | 319,000 | | | | | Verizon Communications, Inc. | | | 18,243,610 | |
| | | |
| | 173,000 | | | | | Walt Disney Company | | | 23,695,810 | |
| | | | | | | | | | |
| | | | | | | | | 163,742,523 | |
| | | | | | | | | | |
| | | | | | Consumer Discretionary (7.1%) | | | | |
| | 32,625 | | | | | Amazon.com, Inc.# | | | 62,852,715 | |
| | | |
| | 47,325 | | | | | Dollar Tree, Inc.# | | | 5,266,326 | |
| | | |
| | 16,650 | | | | | Expedia Group, Inc. | | | 2,161,836 | |
| | | |
| | 110,420 | | | | | General Motors Company | | | 4,300,859 | |
| | | |
| | 109,360 | | | | | Home Depot, Inc. | | | 22,276,632 | |
| | | |
| | 91,730 | | | | | Lowe’s Companies, Inc. | | | 10,378,332 | |
| | | |
| | 62,615 | | | | | McDonald’s Corp. | | | 12,370,846 | |
| | | |
| | 100,640 | | | | | Nike, Inc. - Class B | | | 8,839,211 | |
| | | |
| | 38,060 | | | | | Royal Caribbean Cruises, Ltd. | | | 4,602,976 | |
| | | |
| | 80,305 | | | | | Starbucks Corp. | | | 6,238,092 | |
| | | |
| | 100,120 | | | | | TJX Companies, Inc. | | | 5,494,586 | |
| | | | | | | | | | |
| | | | | | | | | 144,782,411 | |
| | | | | | | | | | |
| | | | | | Consumer Staples (5.7%) | | | | |
| | 438,800 | | | | | Coca-Cola Company | | | 21,527,528 | |
| | | |
| | 46,115 | | | | | Costco Wholesale Corp. | | | 11,322,616 | |
| | | |
| | 253,435 | | | | | Mondelez International, Inc. - Class A | | | 12,887,170 | |
| | | |
| | 138,150 | | | | | PepsiCo, Inc. | | | 17,690,107 | |
| | | |
| | 159,000 | | | | | Philip Morris International, Inc. | | | 13,763,040 | |
| | | |
| | 208,455 | | | | | Procter & Gamble Company | | | 22,196,288 | |
| | | |
| | 61,015 | | | | | Walgreens Boots Alliance, Inc. | | | 3,268,574 | |
| | | |
| | 131,200 | | | | | Walmart, Inc. | | | 13,492,608 | |
| | | | | | | | | | |
| | | | | | | | | 116,147,931 | |
| | | | | | | | | | |
| | | | | | Energy (4.4%) | | | | |
| | 192,360 | | | | | Chevron Corp. | | | 23,094,742 | |
| | | |
| | 114,035 | | | | | ConocoPhillips | | | 7,197,889 | |
| | | |
| | 110,600 | | | | | EOG Resources, Inc. | | | 10,623,130 | |
| | | |
| | 304,530 | | | | | Exxon Mobil Corp. | | | 24,447,668 | |
| | | |
| | 123,654 | | | | | Hess Corp.^ | | | 7,928,695 | |
| | | |
| | 92,435 | | | | | Marathon Petroleum Corp. | | | 5,626,518 | |
| | | |
| | 37,275 | | | | | Pioneer Natural Resources Company | | | 6,204,797 | |
| | | |
| | 124,000 | | | | | Schlumberger, Ltd. | | | 5,292,320 | |
| | | | | | | | | | |
| | | | | | | | | 90,415,759 | |
| | | | | | | | | | |
| | | | | | Financials (10.7%) | | | | |
| | 201,860 | | | | | American International Group, Inc. | | | 9,602,480 | |
| | | |
| | 986,970 | | | | | Bank of America Corp.~ | | | 30,181,543 | |
| | | | | | |
| See accompanying Notes to Schedule of Investments | | www.calamos.com | | | 107 | |
Growth and Income Fund Schedule of Investments April 30, 2019 (Unaudited)
| | | | | | | | | | |
NUMBER OF
SHARES | | | | | | | VALUE | |
| | | |
| | 44,530 | | | | | Berkshire Hathaway, Inc. - Class B# | | $ | 9,650,096 | |
| | | |
| | 101,675 | | | | | Capital One Financial Corp. | | | 9,438,490 | |
| | | |
| | 42,480 | | | | | Cboe Global Markets, Inc. | | | 4,316,393 | |
| | | |
| | 83,850 | | | | | Chubb, Ltd. | | | 12,175,020 | |
| | | |
| | 195,500 | | | | | Citigroup, Inc. | | | 13,821,850 | |
| | | |
| | 44,000 | | | | | Discover Financial Services | | | 3,585,560 | |
| | | |
| | 133,675 | | | | | E*TRADE Financial Corp. | | | 6,771,975 | |
| | | |
| | 22,055 | | | | | Goldman Sachs Group, Inc. | | | 4,541,566 | |
| | | |
| | 155,565 | | | | | Intercontinental Exchange, Inc. | | | 12,655,213 | |
| | | |
| | 249,625 | | | | | JPMorgan Chase & Company~ | | | 28,968,981 | |
| | | |
| | 299,725 | | | | | KeyCorp | | | 5,260,174 | |
| | | |
| | 122,180 | | | | | Marsh & McLennan Companies, Inc. | | | 11,520,352 | |
| | | |
| | 64,455 | | | | | MetLife, Inc. | | | 2,973,309 | |
| | | |
| | 157,145 | | | | | Morgan Stanley | | | 7,582,246 | |
| | | |
| | 82,600 | | | | | Northern Trust Corp. | | | 8,140,230 | |
| | | |
| | 72,989 | | | | | Prudential Financial, Inc. | | | 7,715,667 | |
| | | |
| | 183,130 | | | | | Starwood Property Trust, Inc.^ | | | 4,221,147 | |
| | | |
| | 217,565 | | | | | US Bancorp | | | 11,600,566 | |
| | | |
| | 167,345 | | | | | Wells Fargo & Company | | | 8,101,171 | |
| | | |
| | 119,275 | | | | | Zions Bancorporation, N.A. ^ | | | 5,883,836 | |
| | | | | | | | | | |
| | | | | | | | | 218,707,865 | |
| | | | | | | | | | |
| | | | | | Health Care (9.4%) | | | | |
| | 26,795 | | | | | Abbott Laboratories | | | 2,131,810 | |
| | | |
| | 119,860 | | | | | Agilent Technologies, Inc. | | | 9,409,010 | |
| | | |
| | 46,735 | | | | | Alexion Pharmaceuticals, Inc.# | | | 6,362,036 | |
| | | |
| | 26,095 | | | | | Anthem, Inc. | | | 6,863,768 | |
| | | |
| | 181,725 | | | | | Baxter International, Inc. | | | 13,865,617 | |
| | | |
| | 75,420 | | | | | Bristol-Myers Squibb Company | | | 3,501,751 | |
| | | |
| | 22,075 | | | | | Celgene Corp.# | | | 2,089,620 | |
| | | |
| | 24,100 | | | | | Edwards Lifesciences Corp.# | | | 4,243,287 | |
| | | |
| | 56,825 | | | | | Gilead Sciences, Inc. | | | 3,695,898 | |
| | | |
| | 26,750 | | | | | Humana, Inc. | | | 6,832,217 | |
| | | |
| | 10,955 | | | | | Intuitive Surgical, Inc.# | | | 5,593,952 | |
| | | |
| | 185,500 | | | | | Johnson & Johnson~ | | | 26,192,600 | |
| | | |
| | 48,210 | | | | | Laboratory Corp. of America Holdings# | | | 7,709,743 | |
| | | |
| | 156,780 | | | | | Medtronic, PLC | | | 13,923,632 | |
| | | |
| | 222,685 | | | | | Merck & Company, Inc. | | | 17,527,536 | |
| | | |
| | 487,630 | | | | | Pfizer, Inc. | | | 19,802,654 | |
| | | |
| | 17,665 | | | | | Stryker Corp. | | | 3,337,095 | |
| | | |
| | 7,500 | | | | | Teleflex, Inc. | | | 2,146,350 | |
| | | |
| | 36,935 | | | | | Thermo Fisher Scientific, Inc. | | | 10,247,616 | |
| | | |
| | 111,850 | | | | | UnitedHealth Group, Inc. | | | 26,068,879 | |
| | | | | | | | | | |
| | | | | | | | | 191,545,071 | |
| | | | | | | | | | |
| | | | | | Industrials (6.8%) | |
| | 47,150 | | | | | Boeing Company | | | 17,808,083 | |
| | | |
| | 84,075 | | | | | Caterpillar, Inc. | | | 11,721,737 | |
| | | |
| | 162,580 | | | | | CSX Corp. | | | 12,946,245 | |
| | | | | | | | | | |
NUMBER OF
SHARES | | | | | | | VALUE | |
| | | |
| | 328,720 | | | | | Delta Air Lines, Inc. | | $ | 19,161,089 | |
| | | |
| | 128,475 | | | | | Emerson Electric Company | | | 9,120,440 | |
| | | |
| | 472,245 | | | | | General Electric Company | | | 4,802,732 | |
| | | |
| | 138,300 | | | | | Honeywell International, Inc. | | | 24,013,029 | |
| | | |
| | 34,300 | | | | | Lockheed Martin Corp. | | | 11,433,219 | |
| | | |
| | 60,350 | | | | | Northrop Grumman Corp. | | | 17,496,069 | |
| | | |
| | 61,410 | | | | | Union Pacific Corp. | | | 10,872,026 | |
| | | | | | | | | | |
| | | | | | | | | 139,374,669 | |
| | | | | | | | | | |
| | | | | | Information Technology (14.8%) | |
| | 67,175 | | | | | Accenture, PLC - Class A | | | 12,270,857 | |
| | | |
| | 26,280 | | | | | Adobe, Inc.# | | | 7,601,490 | |
| | | |
| | 319,120 | | | | | Apple, Inc.~ | | | 64,037,810 | |
| | | |
| | 35,450 | | | | | Broadcom, Inc. | | | 11,287,280 | |
| | | |
| | 353,500 | | | | | Cisco Systems, Inc. | | | 19,778,325 | |
| | | |
| | 53,545 | | | | | Fidelity National Information Services, Inc. | | | 6,207,472 | |
| | | |
| | 47,891 | | | | | Lam Research Corp. | | | 9,934,030 | |
| | | |
| | 100,500 | | | | | Marvell Technology Group, Ltd.^ | | | 2,514,510 | |
| | | |
| | 77,215 | | | | | MasterCard, Inc. - Class A | | | 19,631,142 | |
| | | |
| | 624,710 | | | | | Microsoft Corp.~ | | | 81,587,126 | |
| | | |
| | 45,985 | | | | | NVIDIA Corp. | | | 8,323,285 | |
| | | |
| | 113,400 | | | | | Oracle Corp. | | | 6,274,422 | |
| | | |
| | 67,775 | | | | | PayPal Holdings, Inc.# | | | 7,642,987 | |
| | | |
| | 57,205 | | | | | QUALCOMM, Inc. | | | 4,927,067 | |
| | | |
| | 60,370 | | | | | Salesforce.com, Inc.# | | | 9,982,179 | |
| | | |
| | 179,460 | | | | | Visa, Inc. - Class A | | | 29,508,608 | |
| | | | | | | | | | |
| | | | | | | | | 301,508,590 | |
| | | | | | | | | | |
| | | | | | Materials (0.8%) | |
| | 67,185 | | | | | Dow, Inc.# | | | 3,811,405 | |
| | | |
| | 201,555 | | | | | DowDuPont, Inc. | | | 7,749,790 | |
| | | |
| | 70,000 | | | | | Nucor Corp. | | | 3,994,900 | |
| | | | | | | | | | |
| | | | | | | | | 15,556,095 | |
| | | | | | | | | | |
| | | | | | Real Estate (1.1%) | |
| | 96,520 | | | | | American Tower Corp. | | | 18,850,356 | |
| | | |
| | 49,000 | | | | | Welltower, Inc. | | | 3,651,970 | |
| | | | | | | | | | |
| | | | | | | | | 22,502,326 | |
| | | | | | | | | | |
| | | | | | Utilities (0.6%) | |
| | 260,278 | | | | | Exelon Corp. | | | 13,261,164 | |
| | | | | | | | | | |
| | | |
| | | | | | TOTAL COMMON STOCKS
(Cost $938,789,256) | | | 1,417,544,404 | |
| | | | | | | | | | |
| | | | | | | | | | |
|
| | EXCHANGE-TRADED FUNDS (1.6%) | |
| | | | | | Other (1.6%) | |
| | 281,135 | | | | | iShares MSCI EAFE ETF^ | | | 18,768,573 | |
| | | |
| | 108,250 | | | | | iShares MSCI Emerging Markets ETF | | | 4,755,422 | |
| | | |
| | 67,055 | | | | | iShares Russell 2000 Value ETF^ | | | 8,336,948 | |
| | | | | | | | | | |
| | | |
| | | | | | TOTAL EXCHANGE-TRADED FUNDS
(Cost $32,643,023) | | | 31,860,943 | |
| | | | | | | | | | |
| | | | |
| 108 | | CALAMOS OPEN-END FAMILY OF FUNDS SEMIANNUAL REPORT | | See accompanying Notes to Schedule of Investments |
Growth and Income Fund Schedule of Investments April 30, 2019 (Unaudited)
| | | | | | | | | | |
NUMBER OF
CONTRACTS/
NOTIONAL
AMOUNT | | | | | | | VALUE | |
|
| | PURCHASED OPTIONS (0.1%)# | |
| | | | | | Other (0.1%) | |
| 1,450
27,483,300 |
| | | | Invesco QQQ Trust Series
Put, 07/19/19, Strike $190.00 | | $ | 771,400 | |
| | | |
| | | | | | S&P 500 Index | | | | |
| 583
171,741,889 |
| | | | Put, 05/17/19, Strike $2,750.00 | | | 169,070 | |
| 420
123,724,860 |
| | | | Put, 06/28/19, Strike $2,850.00 | | | 1,146,600 | |
| | | | | | | | | | |
| | | |
| | | | | | TOTAL PURCHASED OPTIONS
(Cost $5,521,873) | | | 2,087,070 | |
| | | | | | | | | | |
| | | | | | | | | | |
NUMBER OF
SHARES | | | | | | | VALUE | |
|
| | SHORT TERM INVESTMENTS (1.9%) | |
| | 19,553,318 | | | | | Fidelity Prime Money Market Fund - Institutional Class, 2.500%*** | | | 19,559,183 | |
| | | |
| | 19,368,983 | | | | | Morgan Stanley Institutional Liquidity Funds - Government Portfolio, 2.350%*** | | | 19,368,983 | |
| | | | | | | | | | |
| | | |
| | | | | | TOTAL SHORT TERM INVESTMENTS
(Cost $38,928,700) | | | 38,928,166 | |
| | | | | | | | | | |
| | | | | | | | | | |
NUMBER OF
SHARES/
PRINCIPAL
AMOUNT | | | | | | | VALUE | |
|
| INVESTMENT OF CASH COLLATERAL FOR SECURITIES
LOANED (3.2%) |
|
| | 32,811,010 | | | | | Fidelity Prime Money Market Fund - Institutional Class, 2.500%***† | | | 32,811,010 | |
| | | |
| | 31,973,516 | | | | | State Street Navigator Securities Lending Government Money Market Portfolio† | | | 31,973,516 | |
| | | | | | | | | | |
| | | |
| | | | | | TOTAL INVESTMENT OF
CASH COLLATERAL FOR
SECURITIES LOANED
(Cost $64,784,526) | | | 64,784,526 | |
| | | | | | | | | | |
| |
| TOTAL INVESTMENTS (103.2%)
(Cost $1,592,707,978) | | | 2,106,967,796 | |
| | | | | | | | | | |
| |
| | PAYABLE UPON RETURN OF SECURITIES ONLOAN (-3.2%) | | | (64,784,526 | ) |
| | | | | |
| |
| | LIABILITIES, LESS OTHER ASSETS (0.0%) | | | (568,099 | ) |
| | | | | | | | | | |
| |
| | NET ASSETS (100.0%) | | $ | 2,041,615,171 | |
| | | | | | | | | | |
FORWARD FOREIGN CURRENCY CONTRACTS
| | | | | | | | | | | | | | | | |
COUNTER
PARTY | | LONG CONTRACTS | | SETTLEMENT DATE | | LOCAL CURRENCY | | | CURRENT VALUE | | | UNREALIZED GAIN/LOSS | |
| | | | | |
| State Street Bank and Trust | | Hong Kong Dollar | | 07/25/19 | | | 2,404,000 | | | $ | 306,842 | | | $ | (78 | ) |
| | | | | |
| Bank of New York | | European Monetary Unit | | 07/25/19 | | | 101,000 | | | | 114,093 | | | | (355 | ) |
| | | | | | | | | | | | | | | | |
| | | $ | (433 | ) |
| | | | | |
| | | | | |
COUNTER
PARTY | | SHORT CONTRACTS | | SETTLEMENT DATE | | LOCAL CURRENCY | | | CURRENT VALUE | | | UNREALIZED GAIN/LOSS | |
| | | | | |
| State Street Bank and Trust | | Hong Kong Dollar | | 07/25/19 | | | 2,794,000 | | | $ | 356,620 | | | $ | 157 | |
| | | | | |
| Northern Trust Company | | European Monetary Unit | | 07/25/19 | | | 1,714,000 | | | | 1,936,189 | | | | 19,843 | |
| | | | | |
| Northern Trust Company | | Hong Kong Dollar | | 07/25/19 | | | 38,447,000 | | | | 4,907,297 | | | | 4,907 | |
| | | | | | | | | | | | | | | | |
| | | $ | 24,907 | |
| | | | | |
NOTES TO SCHEDULE OF INVESTMENTS
| * | Securities issued and sold pursuant to a Rule 144A transaction are excepted from the registration requirement of the Securities Act of 1933, as amended. These securities may only be sold to qualified institutional buyers (“QIBs”), such as the Fund. Any resale of these securities must generally be effected through a sale that is registered under the Act or otherwise exempted from such registration requirements. |
| § | Securities exchangeable or convertible into securities of one or more entities that are different than the issuer. Each entity is identified in the parenthetical. |
| ^ | Security, or portion of security, is on loan. |
| ¤ | The synthetic convertible securities strategy combines separate securities that together possess the economic characteristics similar to a convertible security. |
| # | Non-income producing security. |
| ** | Step coupon security. Coupon changes periodically based upon a predetermined schedule. The rate shown is the rate in effect at April 30, 2019. |
| ~ | Security, or portion of security, is segregated as collateral (or collateral for potential future transactions) for written options. The aggregate value of such securities is $2,328,923. |
| *** | The rate disclosed is the 7 day net yield as of April 30, 2019. |
| † | Represents investment of cash collateral received from securities on loan as of April 30, 2019. |
Note: The principal amount for such securities is shown in the respective foreign currency. The date on options represents the expiration date of the option contract. The option contract may be exercised at any date on or before the date shown.
| | | | | | |
| See accompanying Notes to Financial Statements | | www.calamos.com | | | 109 | |
Dividend Growth Fund Schedule of Investments April 30, 2019 (Unaudited)
| | | | | | | | | | |
NUMBER OF
SHARES | | | | | | | VALUE | |
|
| | COMMON STOCKS (97.5%) | |
| | | | | | Communication Services (10.9%) | |
| | 60 | | | | | Alphabet, Inc. - Class A# | | $ | 71,937 | |
| | | |
| | 460 | | | | | Alphabet, Inc. - Class C# | | | 546,701 | |
| | | |
| | 6,121 | | | | | AT&T, Inc. | | | 189,506 | |
| | | |
| | 170 | | | | | Charter Communications, Inc. - Class A# | | | 63,102 | |
| | | |
| | 4,665 | | | | | Comcast Corp. - Class A | | | 203,067 | |
| | | |
| | 315 | | | | | Electronic Arts, Inc.# | | | 29,815 | |
| | | |
| | 1,965 | | | | | Facebook, Inc. - Class A# | | | 380,031 | |
| | | |
| | 370 | | | | | Netflix, Inc.# | | | 137,100 | |
| | | |
| | 3,330 | | | | | Verizon Communications, Inc. | | | 190,443 | |
| | | |
| | 1,810 | | | | | Walt Disney Company | | | 247,916 | |
| | | | | | | | | | |
| | | | | | | | | 2,059,618 | |
| | | | | | | | | | |
| | | | | | Consumer Discretionary (10.3%) | |
| | 375 | | | | | Amazon.com, Inc.# | | | 722,445 | |
| | | |
| | 55 | | | | | Booking Holdings, Inc.# | | | 102,024 | |
| | | |
| | 590 | | | | | Dollar Tree, Inc.# | | | 65,655 | |
| | | |
| | 235 | | | | | Expedia Group, Inc. | | | 30,512 | |
| | | |
| | 1,385 | | | | | General Motors Company | | | 53,946 | |
| | | |
| | 1,195 | | | | | Home Depot, Inc. | | | 243,421 | |
| | | |
| | 1,155 | | | | | Lowe’s Companies, Inc. | | | 130,677 | |
| | | |
| | 1,040 | | | | | McDonald’s Corp. | | | 205,473 | |
| | | |
| | 1,640 | | | | | Nike, Inc. - Class B | | | 144,041 | |
| | | |
| | 675 | | | | | Royal Caribbean Cruises, Ltd. | | | 81,635 | |
| | | |
| | 1,150 | | | | | Starbucks Corp. | | | 89,332 | |
| | | |
| | 1,650 | | | | | TJX Companies, Inc. | | | 90,552 | |
| | | | | | | | | | |
| | | | | | | | | 1,959,713 | |
| | | | | | | | | | |
| | | | | | Consumer Staples (7.3%) | |
| | 1,050 | | | | | Altria Group, Inc. | | | 57,047 | |
| | | |
| | 4,425 | | | | | Coca-Cola Company | | | 217,090 | |
| | | |
| | 365 | | | | | Costco Wholesale Corp. | | | 89,618 | |
| | | |
| | 2,380 | | | | | Mondelez International, Inc. - Class A | | | 121,023 | |
| | | |
| | 1,595 | | | | | PepsiCo, Inc. | | | 204,240 | |
| | | |
| | 1,815 | | | | | Philip Morris International, Inc. | | | 157,106 | |
| | | |
| | 2,595 | | | | | Procter & Gamble Company | | | 276,316 | |
| | | |
| | 535 | | | | | Walgreens Boots Alliance, Inc. | | | 28,660 | |
| | | |
| | 2,220 | | | | | Walmart, Inc. | | | 228,305 | |
| | | | | | | | | | |
| | | | | | | | | 1,379,405 | |
| | | | | | | | | | |
| | | | | | Energy (5.5%) | |
| | 2,405 | | | | | Chevron Corp. | | | 288,744 | |
| | | |
| | 2,710 | | | | | ConocoPhillips | | | 171,055 | |
| | | |
| | 610 | | | | | EOG Resources, Inc. | | | 58,590 | |
| | | |
| | 3,450 | | | | | Exxon Mobil Corp. | | | 276,966 | |
| | | |
| | 1,395 | | | | | Marathon Petroleum Corp. | | | 84,914 | |
| | | |
| | 440 | | | | | Phillips 66 | | | 41,479 | |
| | | |
| | 460 | | | | | Pioneer Natural Resources Company | | | 76,572 | |
| | | | | | | | | | |
NUMBER OF
SHARES | | | | | | | VALUE | |
| | | |
| | 885 | | | | | Schlumberger, Ltd. | | $ | 37,772 | |
| | | | | | | | | | |
| | | | | | | | | 1,036,092 | |
| | | | | | | | | | |
| | | | | | Financials (13.0%) | |
| | 650 | | | | | American Express Company | | | 76,200 | |
| | | |
| | 2,140 | | | | | American International Group, Inc. | | | 101,800 | |
| | | |
| | 10,715 | | | | | Bank of America Corp. | | | 327,665 | |
| | | |
| | 1,230 | | | | | Berkshire Hathaway, Inc. - Class B# | | | 266,553 | |
| | | |
| | 1,000 | | | | | Capital One Financial Corp. | | | 92,830 | |
| | | |
| | 810 | | | | | Cboe Global Markets, Inc. | | | 82,304 | |
| | | |
| | 815 | | | | | Chubb, Ltd. | | | 118,338 | |
| | | |
| | 1,510 | | | | | Citigroup, Inc. | | | 106,757 | |
| | | |
| | 550 | | | | | Discover Financial Services | | | 44,820 | |
| | | |
| | 1,020 | | | | | E*TRADE Financial Corp. | | | 51,673 | |
| | | |
| | 130 | | | | | Goldman Sachs Group, Inc. | | | 26,770 | |
| | | |
| | 1,270 | | | | | Intercontinental Exchange, Inc. | | | 103,314 | |
| | | |
| | 2,740 | | | | | JPMorgan Chase & Company | | | 317,977 | |
| | | |
| | 3,740 | | | | | KeyCorp | | | 65,637 | |
| | | |
| | 880 | | | | | Marsh & McLennan Companies, Inc. | | | 82,975 | |
| | | |
| | 710 | | | | | MetLife, Inc. | | | 32,752 | |
| | | |
| | 2,430 | | | | | Morgan Stanley | | | 117,247 | |
| | | |
| | 750 | | | | | Northern Trust Corp. | | | 73,913 | |
| | | |
| | 775 | | | | | Prudential Financial, Inc. | | | 81,925 | |
| | | |
| | 2,520 | | | | | US Bancorp | | | 134,366 | |
| | | |
| | 1,570 | | | | | Wells Fargo & Company | | | 76,004 | |
| | | |
| | 1,690 | | | | | Zions Bancorporation, N.A.^ | | | 83,368 | |
| | | | | | | | | | |
| | | | | | | | | 2,465,188 | |
| | | | | | | | | | |
| | | | | | Health Care (13.2%) | |
| | 1,690 | | | | | Abbott Laboratories | | | 134,456 | |
| | | |
| | 1,155 | | | | | Agilent Technologies, Inc. | | | 90,668 | |
| | | |
| | 425 | | | | | Alexion Pharmaceuticals, Inc.# | | | 57,855 | |
| | | |
| | 250 | | | | | Anthem, Inc. | | | 65,758 | |
| | | |
| | 1,700 | | | | | Baxter International, Inc. | | | 129,710 | |
| | | |
| | 1,410 | | | | | Bristol-Myers Squibb Company | | | 65,466 | |
| | | |
| | 305 | | | | | Edwards Lifesciences Corp.# | | | 53,701 | |
| | | |
| | 700 | | | | | Gilead Sciences, Inc. | | | 45,528 | |
| | | |
| | 350 | | | | | Humana, Inc. | | | 89,394 | |
| | | |
| | 220 | | | | | Illumina, Inc.# | | | 68,640 | |
| | | |
| | 185 | | | | | Intuitive Surgical, Inc.# | | | 94,467 | |
| | | |
| | 2,305 | | | | | Johnson & Johnson | | | 325,466 | |
| | | |
| | 590 | | | | | Laboratory Corp. of America Holdings# | | | 94,353 | |
| | | |
| | 2,245 | | | | | Medtronic, PLC | | | 199,378 | |
| | | |
| | 3,325 | | | | | Merck & Company, Inc. | | | 261,711 | |
| | | |
| | 7,435 | | | | | Pfizer, Inc. | | | 301,935 | |
| | | |
| | 265 | | | | | Stryker Corp. | | | 50,061 | |
| | | |
| | 95 | | | | | Teleflex, Inc. | | | 27,187 | |
| | | |
| | 370 | | | | | Thermo Fisher Scientific, Inc. | | | 102,656 | |
| | | | |
| 110 | | CALAMOS OPEN-END FAMILY OF FUNDS SEMIANNUAL REPORT | | See accompanying Notes to Schedule of Investments |
Dividend Growth Fund Schedule of Investments April 30, 2019 (Unaudited)
| | | | | | | | | | |
NUMBER OF
SHARES | | | | | | | VALUE | |
| | | |
| | 1,080 | | | | | UnitedHealth Group, Inc. | | $ | 251,716 | |
| | | | | | | | | | |
| | | | | | | | | 2,510,106 | |
| | | | | | | | | | |
| | | | | | Industrials (9.0%) | |
| | 605 | | | | | Boeing Company | | | 228,503 | |
| | | |
| | 885 | | | | | Caterpillar, Inc. | | | 123,387 | |
| | | |
| | 1,805 | | | | | CSX Corp. | | | 143,732 | |
| | | |
| | 3,580 | | | | | Delta Air Lines, Inc. | | | 208,678 | |
| | | |
| | 1,465 | | | | | Emerson Electric Company | | | 104,000 | |
| | | |
| | 7,760 | | | | | General Electric Company | | | 78,919 | |
| | | |
| | 1,575 | | | | | Honeywell International, Inc. | | | 273,467 | |
| | | |
| | 590 | | | | | Lockheed Martin Corp. | | | 196,665 | |
| | | |
| | 340 | | | | | Northrop Grumman Corp. | | | 98,569 | |
| | | |
| | 920 | | | | | Stanley Black & Decker, Inc. | | | 134,872 | |
| | | |
| | 620 | | | | | Union Pacific Corp. | | | 109,765 | |
| | | | | | | | | | |
| | | | | | | | | 1,700,557 | |
| | | | | | | | | | |
| | | | | | Information Technology (22.1%) | |
| | 740 | | | | | Accenture, PLC - Class A | | | 135,176 | |
| | | |
| | 480 | | | | | Adobe, Inc.# | | | 138,840 | |
| | | |
| | 3,560 | | | | | Apple, Inc. | | | 714,385 | |
| | | |
| | 1,280 | | | | | Applied Materials, Inc. | | | 56,410 | |
| | | |
| | 475 | | | | | Broadcom, Inc. | | | 151,240 | |
| | | |
| | 4,320 | | | | | Cisco Systems, Inc. | | | 241,704 | |
| | | |
| | 850 | | | | | Fidelity National Information Services, Inc. | | | 98,541 | |
| | | |
| | 3,640 | | | | | Intel Corp. | | | 185,786 | |
| | | |
| | 510 | | | | | International Business Machines Corp. | | | 71,538 | |
| | | |
| | 350 | | | | | Intuit, Inc. | | | 87,871 | |
| | | |
| | 330 | | | | | Lam Research Corp. | | | 68,452 | |
| | | |
| | 1,040 | | | | | Marvell Technology Group, Ltd.^ | | | 26,021 | |
| | | |
| | 710 | | | | | MasterCard, Inc. - Class A | | | 180,510 | |
| | | |
| | 635 | | | | | Microchip Technology, Inc.^ | | | 63,430 | |
| | | |
| | 6,695 | | | | | Microsoft Corp. | | | 874,367 | |
| | | |
| | 580 | | | | | NVIDIA Corp. | | | 104,980 | |
| | | |
| | 1,765 | | | | | Oracle Corp. | | | 97,657 | |
| | | |
| | 1,220 | | | | | PayPal Holdings, Inc.# | | | 137,579 | |
| | | |
| | 555 | | | | | QUALCOMM, Inc. | | | 47,802 | |
| | | |
| | 1,240 | | | | | Salesforce.com, Inc.# | | | 205,034 | |
| | | |
| | 645 | | | | | Texas Instruments, Inc. | | | 76,000 | |
| | | |
| | 2,165 | | | | | Visa, Inc. - Class A | | | 355,991 | |
| | | |
| | 655 | | | | | Xilinx, Inc. | | | 78,692 | |
| | | | | | | | | | |
| | | | | | | | | 4,198,006 | |
| | | | | | | | | | |
| | | | | | Materials (1.4%) | |
| | 778 | | | | | Dow, Inc.# | | | 44,136 | |
| | | |
| | 2,250 | | | | | DowDuPont, Inc. | | | 86,512 | |
| | | |
| | 490 | | | | | LyondellBasell Industries, NV - Class A | | | 43,233 | |
| | | |
| | 975 | | | | | Nucor Corp. | | | 55,643 | |
| | | | | | | | | | |
NUMBER OF
SHARES | | | | | | | VALUE | |
| | | |
| | 85 | | | | | Sherwin-Williams Company | | $ | 38,661 | |
| | | | | | | | | | |
| | | | | | | | | 268,185 | |
| | | | | | | | | | |
| | | | | | Real Estate (1.9%) | |
| | 935 | | | | | American Tower Corp. | | | 182,605 | |
| | | |
| | 850 | | | | | Crown Castle International Corp. | | | 106,913 | |
| | | |
| | 835 | | | | | Welltower, Inc. | | | 62,233 | |
| | | | | | | | | | |
| | | | | | | | | 351,751 | |
| | | | | | | | | | |
| | | | | | Utilities (2.9%) | |
| | 1,475 | | | | | Duke Energy Corp. | | | 134,402 | |
| | | |
| | 3,025 | | | | | Exelon Corp. | | | 154,124 | |
| | | |
| | 1,210 | | | | | NextEra Energy, Inc. | | | 235,272 | |
| | | |
| | 225 | | | | | Sempra Energy | | | 28,789 | |
| | | | | | | | | | |
| | | | | | | | | 552,587 | |
| | | | | | | | | | |
| | | |
| | | | | | TOTAL COMMON STOCKS
(Cost $13,271,807) | | | 18,481,208 | |
| | | | | | | | | | |
|
| | EXCHANGE-TRADED FUNDS (0.8%) | |
| | | | | | Other (0.8%) | |
| | 855 | | | | | iShares NASDAQ Biotechnology ETF | | | 90,989 | |
| | | |
| | 495 | | | | | iShares Russell 2000 Value ETF^ | | | 61,543 | |
| | | | | | | | | | |
| | | | | | | | | 152,532 | |
| | | | | | | | | | |
| | | |
| | | | | | TOTAL EXCHANGE-TRADED FUNDS
(Cost $153,731) | | | 152,532 | |
| | | | | | | | | | |
| | | | | | | | | | |
|
| | SHORT TERM INVESTMENTS (0.0%) | |
| | 32 | | | | | Fidelity Prime Money Market Fund - Institutional Class, 2.500%*** | | | 33 | |
| | | |
| | 30 | | | | | Morgan Stanley Institutional Liquidity Funds - Government Portfolio, 2.350%*** | | | 30 | |
| | | | | | | | | | |
| | | |
| | | | | | TOTAL SHORT TERM INVESTMENTS
(Cost $63) | | | 63 | |
| | | | | | | | | | |
| | | | | | | | | | |
NUMBER OF
SHARES/
PRINCIPAL
AMOUNT | | | | | | | VALUE | |
|
| INVESTMENT OF CASH COLLATERAL FOR SECURITIES
LOANED (0.5%) |
|
| | 89,769 | | | | | State Street Navigator Securities Lending Government Money Market Portfolio†
(Cost $89,769) | | | 89,769 | |
| | | | | | | | | | |
| |
| TOTAL INVESTMENTS (98.8%)
(Cost $13,515,370) | | | 18,723,572 | |
| | | | | | | | | | |
| |
| | PAYABLE UPON RETURN OF SECURITIES ON LOAN(-0.5%) | | | (89,769 | ) |
| | | | | | | | | | |
| |
| | OTHER ASSETS, LESS LIABILITIES (1.7%) | | | 324,256 | |
| | | | | | | | | | |
| |
| | NET ASSETS (100.0%) | | $ | 18,958,059 | |
| | | | | | | | | | |
| | | | | | |
| See accompanying Notes to Schedule of Investments | | www.calamos.com | | | 111 | |
Dividend Growth Fund Schedule of Investments April 30, 2019 (Unaudited)
NOTES TO SCHEDULE OF INVESTMENTS
| # | Non-income producing security. |
| ^ | Security, or portion of security, is on loan. |
| *** | The rate disclosed is the 7 day net yield as of April 30, 2019. |
| † | Represents investment of cash collateral received from securities on loan as of April 30, 2019. |
| | | | |
| 112 | | CALAMOS OPEN-END FAMILY OF FUNDS SEMIANNUAL REPORT | | See accompanying Notes to Financial Statements |
Opportunistic Value Fund Schedule of Investments April 30, 2019 (Unaudited)
| | | | | | | | | | |
NUMBER OF
SHARES | | | | | | | VALUE | |
|
| | COMMON STOCKS (97.2%) | |
| | | | | | Communication Services (5.9%) | |
| | 240 | | | | | Alphabet, Inc. - Class A# | | $ | 287,750 | |
| | | |
| | 7,625 | | | | | AT&T, Inc. | | | 236,070 | |
| | | |
| | 765 | | | | | Charter Communications, Inc. - Class A# | | | 283,960 | |
| | | |
| | 12,510 | | | | | Comcast Corp. - Class A | | | 544,560 | |
| | | |
| | 5,340 | | | | | Discovery, Inc. - Class A#^ | | | 165,006 | |
| | | |
| | 840 | | | | | Facebook, Inc. - Class A# | | | 162,456 | |
| | | |
| | 6,420 | | | | | Interpublic Group of Companies, Inc. | | | 147,660 | |
| | | |
| | 2,585 | | | | | Verizon Communications, Inc. | | | 147,836 | |
| | | |
| | 5,050 | | | | | Viacom, Inc. - Class B | | | 145,996 | |
| | | |
| | 4,440 | | | | | Walt Disney Company | | | 608,147 | |
| | | | | | | | | | |
| | | | | | | | | 2,729,441 | |
| | | | | | | | | | |
| | | | | | Consumer Discretionary (5.8%) | |
| | 175 | | | | | Amazon.com, Inc.# | | | 337,141 | |
| | | |
| | 1,800 | | | | | Best Buy Company, Inc. | | | 133,938 | |
| | | |
| | 2,020 | | | | | Dave & Buster’s Entertainment, Inc. | | | 114,817 | |
| | | |
| | 3,225 | | | | | eBay, Inc. | | | 124,969 | |
| | | |
| | 1,950 | | | | | Foot Locker, Inc. | | | 111,560 | |
| | | |
| | 1,075 | | | | | Home Depot, Inc. | | | 218,977 | |
| | | |
| | 2,055 | | | | | Kohl’s Corp. | | | 146,110 | |
| | | |
| | 2,050 | | | | | Lowe’s Companies, Inc. | | | 231,937 | |
| | | |
| | 1,865 | | | | | Nike, Inc. - Class B | | | 163,803 | |
| | | |
| | 2,385 | | | | | Norwegian Cruise Line Holdings, Ltd.# | | | 134,490 | |
| | | |
| | 450 | | | | | O’Reilly Automotive, Inc.# | | | 170,356 | |
| | | |
| | 3,525 | | | | | Starbucks Corp. | | | 273,822 | |
| | | |
| | 2,040 | | | | | Target Corp. | | | 157,937 | |
| | | |
| | 2,350 | | | | | TJX Companies, Inc. | | | 128,968 | |
| | | |
| | 3,100 | | | | | Toll Brothers, Inc. | | | 118,110 | |
| | | |
| | 1,400 | | | | | VF Corp. | | | 132,174 | |
| | | | | | | | | | |
| | | | | | | | | 2,699,109 | |
| | | | | | | | | | |
| | | | | | Consumer Staples (8.7%) | |
| | 7,775 | | | | | Altria Group, Inc. | | | 422,416 | |
| | | |
| | 935 | | | | | Casey’s General Stores, Inc. | | | 123,747 | |
| | | |
| | 1,740 | | | | | Church & Dwight Company, Inc. | | | 130,413 | |
| | | |
| | 800 | | | | | Clorox Company | | | 127,784 | |
| | | |
| | 5,100 | | | | | Coca-Cola Company | | | 250,206 | |
| | | |
| | 1,050 | | | | | Costco Wholesale Corp. | | | 257,807 | |
| | | |
| | 865 | | | | | Estee Lauder Companies, Inc. - Class A | | | 148,616 | |
| | | |
| | 2,700 | | | | | General Mills, Inc. | | | 138,969 | |
| | | |
| | 1,530 | | | | | Hershey Company | | | 191,021 | |
| | | |
| | 5,300 | | | | | Mondelez International, Inc. - Class A | | | 269,505 | |
| | | |
| | 2,190 | | | | | PepsiCo, Inc. | | | 280,429 | |
| | | |
| | 2,740 | | | | | Philip Morris International, Inc. | | | 237,174 | |
| | | |
| | 1,610 | | | | | Post Holdings, Inc.# | | | 181,576 | |
| | | |
| | 5,225 | | | | | Procter & Gamble Company | | | 556,358 | |
| | | |
| | 2,400 | | | | | Sysco Corp. | | | 168,888 | |
| | | | | | | | | | |
NUMBER OF
SHARES | | | | | | | VALUE | |
| | | |
| | 5,455 | | | | | Walmart, Inc. | | $ | 560,992 | |
| | | | | | | | | | |
| | | | | | | | | 4,045,901 | |
| | | | | | | | | | |
| | | | | | Energy (6.4%) | |
| | 7,900 | | | | | Cabot Oil & Gas Corp. | | | 204,531 | |
| | | |
| | 2,310 | | | | | Cheniere Energy, Inc.# | | | 148,649 | |
| | | |
| | 7,800 | | | | | Chevron Corp. | | | 936,468 | |
| | | |
| | 3,110 | | | | | ConocoPhillips | | | 196,303 | |
| | | |
| | 7,960 | | | | | Exxon Mobil Corp. | | | 639,029 | |
| | | |
| | 7,700 | | | | | Kinder Morgan, Inc. | | | 152,999 | |
| | | |
| | 2,350 | | | | | ONEOK, Inc. | | | 159,635 | |
| | | |
| | 2,475 | | | | | Phillips 66 | | | 233,318 | |
| | | |
| | 6,650 | | | | | ProPetro Holding Corp.# | | | 147,165 | |
| | | |
| | 4,700 | | | | | World Fuel Services Corp. | | | 144,995 | |
| | | | | | | | | | |
| | | | | | | | | 2,963,092 | |
| | | | | | | | | | |
| | | | | | Financials (20.2%) | |
| | 1,705 | | | | | Allstate Corp. | | | 168,897 | |
| | | |
| | 2,900 | | | | | American Express Company | | | 339,967 | |
| | | |
| | 5,000 | | | | | Arch Capital Group, Ltd.# | | | 168,900 | |
| | | |
| | 1,410 | | | | | Assurant, Inc. | | | 133,950 | |
| | | |
| | 35,150 | | | | | Bank of America Corp. | | | 1,074,887 | |
| | | |
| | 2,600 | | | | | Bank of New York Mellon Corp. | | | 129,116 | |
| | | |
| | 3,870 | | | | | Berkshire Hathaway, Inc. - Class B# | | | 838,668 | |
| | | |
| | 1,725 | | | | | Cincinnati Financial Corp. | | | 165,911 | |
| | | |
| | 10,350 | | | | | Citigroup, Inc. | | | 731,745 | |
| | | |
| | 2,085 | | | | | Comerica, Inc. | | | 163,860 | |
| | | |
| | 310 | | | | | Credit Acceptance Corp.#^ | | | 153,828 | |
| | | |
| | 2,400 | | | | | Discover Financial Services | | | 195,576 | |
| | | |
| | 4,630 | | | | | Federated Investors Inc- Class B | | | 142,280 | |
| | | |
| | 12,500 | | | | | First BanCorp | | | 141,250 | |
| | | |
| | 1,340 | | | | | First Republic Bank | | | 141,531 | |
| | | |
| | 1,010 | | | | | Goldman Sachs Group, Inc. | | | 207,979 | |
| | | |
| | 2,850 | | | | | Hartford Financial Services Group, Inc. | | | 149,084 | |
| | | |
| | 12,350 | | | | | JPMorgan Chase & Company | | | 1,433,217 | |
| | | |
| | 2,250 | | | | | LPL Financial Holdings, Inc. | | | 166,702 | |
| | | |
| | 820 | | | | | M&T Bank Corp. | | | 139,457 | |
| | | |
| | 1,650 | | | | | Marsh & McLennan Companies, Inc. | | | 155,579 | |
| | | |
| | 4,925 | | | | | Morgan Stanley | | | 237,631 | |
| | | |
| | 825 | | | | | MSCI, Inc. - Class A | | | 185,938 | |
| | | |
| | 7,050 | | | | | OFG Bancorp | | | 142,269 | |
| | | |
| | 2,985 | | | | | Popular, Inc. | | | 172,264 | |
| | | |
| | 1,230 | | | | | Primerica, Inc. | | | 160,257 | |
| | | |
| | 1,960 | | | | | Progressive Corp. | | | 153,174 | |
| | | |
| | 725 | | | | | S&P Global, Inc. | | | 159,979 | |
| | | |
| | 1,920 | | | | | SunTrust Banks, Inc. | | | 125,722 | |
| | | |
| | 500 | | | | | SVB Financial Group# | | | 125,860 | |
| | | |
| | 4,200 | | | | | Synchrony Financial | | | 145,614 | |
| | | |
| | 6,000 | | | | | TCF Financial Corp. | | | 132,780 | |
| | | | | | |
| See accompanying Notes to Schedule of Investments | | www.calamos.com | | | 113 | |
Opportunistic Value Fund Schedule of Investments April 30, 2019 (Unaudited)
| | | | | | | | | | |
NUMBER OF
SHARES | | | | | | | VALUE | |
| | | |
| | 2,350 | | | | | Webster Financial Corp. | | $ | 124,856 | |
| | | |
| | 11,550 | | | | | Wells Fargo & Company | | | 559,135 | |
| | | | | | | | | | |
| | | | | | | | | 9,367,863 | |
| | | | | | | | | | |
| | | | | | Health Care (9.3%) | |
| | 1,630 | | | | | Abbott Laboratories | | | 129,683 | |
| | | |
| | 1,450 | | | | | Agilent Technologies, Inc. | | | 113,825 | |
| | | |
| | 750 | | | | | Amgen, Inc. | | | 134,490 | |
| | | |
| | 545 | | | | | Anthem, Inc. | | | 143,351 | |
| | | |
| | 1,775 | | | | | Baxter International, Inc. | | | 135,433 | |
| | | |
| | 3,750 | | | | | Boston Scientific Corp.# | | | 139,200 | |
| | | |
| | 1,150 | | | | | Charles River Laboratories International, Inc.# | | | 161,540 | |
| | | |
| | 1,405 | | | | | Danaher Corp. | | | 186,078 | |
| | | |
| | 1,195 | | | | | Eli Lilly and Company | | | 139,863 | |
| | | |
| | 2,710 | | | | | Ensign Group, Inc. | | | 139,619 | |
| | | |
| | 6,050 | | | | | Exelixis, Inc.# | | | 118,943 | |
| | | |
| | 1,430 | | | | | HCA Healthcare, Inc. | | | 181,939 | |
| | | |
| | 1,125 | | | | | Hill-Rom Holdings, Inc. | | | 114,098 | |
| | | |
| | 3,175 | | | | | Hologic, Inc.# | | | 147,256 | |
| | | |
| | 3,490 | | | | | Johnson & Johnson | | | 492,788 | |
| | | |
| | 4,800 | | | | | Lantheus Holdings, Inc.# | | | 115,968 | |
| | | |
| | 1,884 | | | | | Merck & Company, Inc. | | | 148,290 | |
| | | |
| | 1,425 | | | | | PRA Health Sciences, Inc.# | | | 137,968 | |
| | | |
| | 345 | | | | | Regeneron Pharmaceuticals, Inc.# | | | 118,383 | |
| | | |
| | 760 | | | | | Stryker Corp. | | | 143,572 | |
| | | |
| | 560 | | | | | Thermo Fisher Scientific, Inc. | | | 155,372 | |
| | | |
| | 3,160 | | | | | UnitedHealth Group, Inc. | | | 736,501 | |
| | | |
| | 850 | | | | | Universal Health Services, Inc. - Class B | | | 107,840 | |
| | | |
| | 1,675 | | | | | Zoetis, Inc. | | | 170,582 | |
| | | | | | | | | | |
| | | | | | | | | 4,312,582 | |
| | | | | | | | | | |
| | | | | | Industrials (11.6%) | |
| | 3,315 | | | | | Aerojet Rocketdyne Holdings, Inc.# | | | 112,246 | |
| | | |
| | 2,155 | | | | | AGCO Corp. | | | 152,531 | |
| | | |
| | 2,630 | | | | | Allison Transmission Holdings, Inc. | | | 123,242 | |
| | | |
| | 1,785 | | | | | Ametek, Inc. | | | 157,383 | |
| | | |
| | 1,890 | | | | | Armstrong World Industries, Inc. | | | 163,806 | |
| | | |
| | 410 | | | | | Boeing Company | | | 154,853 | |
| | | |
| | 1,590 | | | | | C.H. Robinson Worldwide, Inc. | | | 128,790 | |
| | | |
| | 1,295 | | | | | Caterpillar, Inc. | | | 180,549 | |
| | | |
| | 2,410 | | | | | Clean Harbors, Inc.# | | | 183,160 | |
| | | |
| | 1,800 | | | | | CSX Corp. | | | 143,334 | |
| | | |
| | 920 | | | | | Cummins, Inc. | | | 152,987 | |
| | | |
| | 1,550 | | | | | Expeditors International of Washington, Inc. | | | 123,101 | |
| | | |
| | 4,450 | | | | | Harsco Corp.# | | | 100,748 | |
| | | |
| | 4,000 | | | | | HD Supply Holdings, Inc.# | | | 182,760 | |
| | | |
| | 1,565 | | | | | HEICO Corp. | | | 165,155 | |
| | | | | | | | | | |
NUMBER OF
SHARES | | | | | | | VALUE | |
| | | |
| | 1,330 | | | | | Honeywell International, Inc. | | $ | 230,928 | |
| | | |
| | 2,850 | | | | | IHS Markit, Ltd.# | | | 163,191 | |
| | | |
| | 1,230 | | | | | Ingersoll-Rand, PLC | | | 150,810 | |
| | | |
| | 1,120 | | | | | Insperity, Inc. | | | 133,907 | |
| | | |
| | 565 | | | | | Lockheed Martin Corp. | | | 188,332 | |
| | | |
| | 3,775 | | | | | Masco Corp. | | | 147,452 | |
| | | |
| | 1,070 | | | | | Norfolk Southern Corp. | | | 218,301 | |
| | | |
| | 1,760 | | | | | Oshkosh Corp. | | | 145,358 | |
| | | |
| | 975 | | | | | Parker-Hannifin Corp. | | | 176,553 | |
| | | |
| | 1,425 | | | | | Regal Beloit Corp. | | | 121,239 | |
| | | |
| | 480 | | | | | Roper Industries, Inc. | | | 172,656 | |
| | | |
| | 2,470 | | | | | Southwest Airlines Company | | | 133,948 | |
| | | |
| | 2,300 | | | | | TransUnion | | | 160,195 | |
| | | |
| | 1,330 | | | | | Union Pacific Corp. | | | 235,463 | |
| | | |
| | 2,250 | | | | | United Continental Holdings, Inc.# | | | 199,935 | |
| | | |
| | 1,330 | | | | | United Parcel Service, Inc. - Class B | | | 141,273 | |
| | | |
| | 2,035 | | | | | United Technologies Corp. | | | 290,211 | |
| | | |
| | 1,400 | | | | | Waste Management, Inc. | | | 150,276 | |
| | | | | | | | | | |
| | | | | | | | | 5,384,673 | |
| | | | | | | | | | |
| | | | | | Information Technology (18.9%) | |
| | 1,300 | | | | | Accenture, PLC - Class A | | | 237,471 | |
| | | |
| | 580 | | | | | Adobe, Inc.# | | | 167,765 | |
| | | |
| | 1,740 | | | | | Akamai Technologies, Inc.# | | | 139,304 | |
| | | |
| | 18,198 | | | | | Apple, Inc. | | | 3,651,793 | |
| | | |
| | 3,550 | | | | | Applied Materials, Inc. | | | 156,449 | |
| | | |
| | 1,070 | | | | | Automatic Data Processing, Inc. | | | 175,897 | |
| | | |
| | 3,055 | | | | | Booz Allen Hamilton Holding Corp. | | | 181,131 | |
| | | |
| | 520 | | | | | Broadcom, Inc. | | | 165,568 | |
| | | |
| | 800 | | | | | CACI International, Inc.# | | | 155,952 | |
| | | |
| | 1,900 | | | | | Cadence Design Systems, Inc.# | | | 131,822 | |
| | | |
| | 1,500 | | | | | CDW Corp. | | | 158,400 | |
| | | |
| | 4,340 | | | | | Cisco Systems, Inc. | | | 242,823 | |
| | | |
| | 1,505 | | | | | Fiserv, Inc.#^ | | | 131,296 | |
| | | |
| | 485 | | | | | FleetCor Technologies, Inc.# | | | 126,561 | |
| | | |
| | 1,485 | | | | | Fortinet, Inc.# | | | 138,729 | |
| | | |
| | 9,415 | | | | | Intel Corp. | | | 480,542 | |
| | | |
| | 530 | | | | | Intuit, Inc. | | | 133,062 | |
| | | |
| | 1,300 | | | | | KLA-Tencor Corp. | | | 165,724 | |
| | | |
| | 825 | | | | | Lam Research Corp. | | | 171,130 | |
| | | |
| | 710 | | | | | MasterCard, Inc. - Class A | | | 180,510 | |
| | | |
| | 3,600 | | | | | Micron Technology, Inc.# | | | 151,416 | |
| | | |
| | 1,800 | | | | | Microsoft Corp. | | | 235,080 | |
| | | |
| | 6,835 | | | | | Oracle Corp. | | | 378,181 | |
| | | |
| | 1,350 | | | | | Texas Instruments, Inc. | | | 159,070 | |
| | | |
| | 1,350 | | | | | Total System Services, Inc. | | | 138,024 | |
| | | |
| | 1,089 | | | | | Visa, Inc. - Class A | | | 179,064 | |
| | | |
| | 715 | | | | | VMware, Inc. - Class A | | | 145,953 | |
| | | | |
| 114 | | CALAMOS OPEN-END FAMILY OF FUNDS SEMIANNUAL REPORT | | See accompanying Notes to Schedule of Investments |
Opportunistic Value Fund Schedule of Investments April 30, 2019 (Unaudited)
| | | | | | | | | | |
NUMBER OF
SHARES | | | | | | | VALUE | |
| | | |
| | 930 | | | | | Xilinx, Inc. | | $ | 111,730 | |
| | | |
| | 1,025 | | | | | Zebra Technologies Corp. - Class A# | | | 216,418 | |
| | | | | | | | | | |
| | | | | | | | | 8,806,865 | |
| | | | | | | | | | |
| | | | | | Materials (1.9%) | |
| | 3,500 | | | | | DowDuPont, Inc. | | | 134,575 | |
| | | |
| | 1,600 | | | | | Ingevity Corp.# | | | 184,016 | |
| | | |
| | 2,050 | | | | | Nucor Corp. | | | 116,994 | |
| | | |
| | 4,900 | | | | | Silgan Holdings, Inc. | | | 146,706 | |
| | | |
| | 2,750 | | | | | Sonoco Products Company | | | 173,415 | |
| | | |
| | 1,150 | | | | | Vulcan Materials Company | | | 145,026 | |
| | | | | | | | | | |
| | | | | | | | | 900,732 | |
| | | | | | | | | | |
| | | | | | Real Estate (3.7%) | |
| | 690 | | | | | AvalonBay Communities, Inc. | | | 138,642 | |
| | | |
| | 2,350 | | | | | CBRE Group, Inc. - Class A# | | | 122,365 | |
| | | |
| | 1,310 | | | | | Crown Castle International Corp. | | | 164,772 | |
| | | |
| | 1,815 | | | | | Equity Residential | | | 138,702 | |
| | | |
| | 1,560 | | | | | Extra Space Storage, Inc. | | | 161,756 | |
| | | |
| | 1,800 | | | | | Lamar Advertising Company - Class A | | | 148,806 | |
| | | |
| | 3,280 | | | | | Marcus & Millichap, Inc.# | | | 141,368 | |
| | | |
| | 2,800 | | | | | National Retail Properties, Inc. | | | 147,336 | |
| | | |
| | 2,250 | | | | | Prologis, Inc. | | | 172,508 | |
| | | |
| | 700 | | | | | Simon Property Group, Inc. | | | 121,590 | |
| | | |
| | 3,870 | | | | | STORE Capital Corp. | | | 128,948 | |
| | | |
| | 2,775 | | | | | UDR, Inc. | | | 124,736 | |
| | | | | | | | | | |
| | | | | | | | | 1,711,529 | |
| | | | | | | | | | |
| | | | | | Utilities (4.8%) | |
| | 9,200 | | | | | AES Corp. | | | 157,504 | |
| | | |
| | 2,000 | | | | | Ameren Corp. | | | 145,540 | |
| | | |
| | 2,100 | | | | | American Electric Power Company, Inc. | | | 179,655 | |
| | | |
| | 5,070 | | | | | CenterPoint Energy, Inc. | | | 157,170 | |
| | | |
| | 2,600 | | | | | CMS Energy Corp. | | | 144,430 | |
| | | |
| | 1,930 | | | | | Dominion Energy, Inc. | | | 150,289 | |
| | | |
| | 1,150 | | | | | DTE Energy Company | | | 144,566 | |
| | | |
| | 2,650 | | | | | Duke Energy Corp. | | | 241,468 | |
| | | |
| | 1,550 | | | | | Entergy Corp. | | | 150,195 | |
| | | |
| | 3,950 | | | | | Exelon Corp. | | | 201,252 | |
| | | |
| | 3,430 | | | | | FirstEnergy Corp. | | | 144,163 | |
| | | |
| | 4,100 | | | | | NiSource, Inc. | | | 113,898 | |
| | | |
| | 1,450 | | | | | Pinnacle West Capital Corp. | | | 138,142 | |
| | | |
| | 3,300 | | | | | Southern Company | | | 175,626 | |
| | | | | | | | | | |
| | | | 2,243,898 | |
| | | | | |
| | | |
| | | | | | TOTAL COMMON STOCKS
(Cost $40,273,283) | | | 45,165,685 | |
| | | | | | | | | | |
| | | | | | | | | | |
| | | | | | | | | | |
NUMBER OF
SHARES | | | | | | | VALUE | |
|
| | EXCHANGE-TRADED FUNDS (2.3%) | |
| | | | | | Other (2.3%) | | | | |
| | 9,145 | | | | | Energy Select Sector SPDR Fund^
(Cost $610,936) | | $ | 604,576 | |
| | | |
| | 5,100 | | | | | iShares ChinaLarge-Cap ETF
(Cost $234,190) | | | 226,899 | |
| | | |
| | 1,190 | | | | | iShares PHLX Semiconductor ETF^
(Cost $233,936) | | | 251,756 | |
| | | | | | | | | | |
| | | |
| | | | | | TOTAL EXCHANGE-TRADED FUNDS
(Cost $1,079,062) | | | 1,083,231 | |
| | | | | | | | | | |
| | | | | | | | | | |
|
| | SHORT TERM INVESTMENTS (0.5%) | |
| | 120,572 | | | | | Fidelity Prime Money Market Fund - Institutional Class, 2.500%*** | | | 120,608 | |
| | | |
| | 120,589 | | | | | Morgan Stanley Institutional Liquidity Funds - Government Portfolio, 2.350%*** | | | 120,589 | |
| | | | | | | | | | |
| | | |
| | | | | | TOTAL SHORT TERM INVESTMENTS
(Cost $241,197) | | | 241,197 | |
| | | | | | | | | | |
| | | | | | | | | | |
NUMBER OF
SHARES/
PRINCIPAL
AMOUNT | | | | | | | VALUE | |
|
| INVESTMENT OF CASH COLLATERAL FOR SECURITIES
LOANED (1.2%) |
|
| | 536,508 | | | | | State Street Navigator Securities Lending Government Money Market Portfolio†
(Cost $536,508) | | | 536,508 | |
| | | | | | | | | | |
| |
| TOTAL INVESTMENTS (101.2%)
(Cost $42,130,050) | | | 47,026,621 | |
| | | | | | | | | | |
| |
| | PAYABLE UPON RETURN OF SECURITIES ON LOAN(-1.2%) | | | (536,508 | ) |
| | | | | |
| |
| | LIABILITIES, LESS OTHER ASSETS (0.0%) | | | (20,248 | ) |
| | | | | | | | | | |
| |
| | NET ASSETS (100.0%) | | $ | 46,469,865 | |
| | | | | | | | | | |
NOTES TO SCHEDULE OF INVESTMENTS
| # | Non-income producing security. |
| ^ | Security, or portion of security, is on loan. |
| *** | The rate disclosed is the 7 day net yield as of April 30, 2019. |
| † | Represents investment of cash collateral received from securities on loan as of April 30, 2019. |
| | | | | | |
| See accompanying Notes to Financial Statements | | www.calamos.com | | | 115 | |
International Growth Fund Schedule of Investments April 30, 2019 (Unaudited)
| | | | | | | | | | |
NUMBER OF
SHARES | | | | | | | VALUE | |
|
| | COMMON STOCKS (97.4%) | |
| | | | | | Communication Services (8.6%) | |
| | 6,000 | | | | | Baidu, Inc.# | | $ | 997,380 | |
| | | |
| | 92,000 | | | EUR | | Deutsche Telekom, AG | | | 1,541,451 | |
| | | |
| | 5,400 | | | JPY | | Nintendo Company, Ltd. | | | 1,859,844 | |
| | | |
| | 55,900 | | | | | SoftBank Group Corp. | | | 2,972,762 | |
| | | |
| | 228,700 | | | HKD | | Tencent Holdings, Ltd. | | | 11,272,084 | |
| | | | | | | | | | |
| | | | | | | | | 18,643,521 | |
| | | | | | | | | | |
| | | | | | Consumer Discretionary (17.2%) | |
| | 58,802 | | | | | Alibaba Group Holding, Ltd.#^ | | | 10,911,887 | |
| | | |
| | 230,000 | | | HKD | | ANTA Sports Products, Ltd. | | | 1,617,621 | |
| | | |
| | 30,300 | | | | | Aptiv, PLC | | | 2,596,710 | |
| | | |
| | 73,500 | | | GBP | | Compass Group, PLC | | | 1,672,409 | |
| | | |
| | 3,727 | | �� | EUR | | Kering, SA | | | 2,205,469 | |
| | | |
| | 46,000 | | | BRL | | Lojas Renner, SA | | | 549,968 | |
| | | |
| | 35,790 | | | | | Lululemon Athletica, Inc.#~ | | | 6,311,566 | |
| | | |
| | 25,300 | | | BRL | | Magazine Luiza, SA | | | 1,234,061 | |
| | | |
| | 17,300 | | | | | New Oriental Education & Technology Group, Inc.# | | | 1,651,458 | |
| | | |
| | 6,250 | | | EUR | | Puma, SE | | | 3,866,017 | |
| | | |
| | 32,100 | | | | | Sony Corp.^ | | | 1,616,877 | |
| | | |
| | 421,000 | | | HKD | | Techtronic Industries Company, Ltd. | | | 3,046,566 | |
| | | | | | | | | | |
| | | | | | | | | 37,280,609 | |
| | | | | | | | | | |
| | | | | | Consumer Staples (9.1%) | |
| | 75,100 | | | CAD | | Alimentation Couche-Tard, Inc. - Class B | | | 4,427,968 | |
| | | |
| | 52,700 | | | GBP | | Diageo, PLC | | | 2,221,712 | |
| | | |
| | 16,200 | | | GBP | | Fevertree Drinks, PLC | | | 666,089 | |
| | | |
| | 19,700 | | | EUR | | Kerry Group, PLC - Class A | | | 2,201,008 | |
| | | |
| | 19,454 | | | CNY | | Kweichow Moutai Company, Ltd. - Class A | | | 2,813,231 | |
| | | |
| | 56,900 | | | | | Nestle, SA | | | 5,492,557 | |
| | | |
| | 40,400 | | | SEK | | Swedish Match, AB | | | 1,969,887 | |
| | | | | | | | | | |
| | | | | | | | | 19,792,452 | |
| | | | | | | | | | |
| | | | | | Energy (3.8%) | |
| | 83,900 | | | | | BP, PLC | | | 3,668,947 | |
| | | |
| | 6,800 | | | | | CNOOC, Ltd. | | | 1,235,424 | |
| | | |
| | 33,000 | | | EUR | | Neste Oyj | | | 1,090,738 | |
| | | |
| | 780,000 | | | GBP | | Tullow Oil, PLC | | | 2,287,055 | |
| | | | | | | | | | |
| | | | | | | | | 8,282,164 | |
| | | | | | | | | | |
| | | | | | Financials (13.2%) | |
| | 439,600 | | | HKD | | AIA Group, Ltd. | | | 4,501,256 | |
| | | |
| | 11,000 | | | | | AON, PLC | | | 1,981,540 | |
| | | |
| | 811,000 | | | IDR | | Bank Central Asia, Tbk PT | | | 1,638,280 | |
| | | |
| | 457,200 | | | HKD | | China International Capital Corp., Ltd. - Class H* | | | 983,375 | |
| | | |
| | 6,400 | | | | | Credicorp, Ltd. | | | 1,516,160 | |
| | | | | | | | | | |
NUMBER OF
SHARES | | | | | | | VALUE | |
| | | |
| | 37,150 | | | EUR | | Deutsche Böerse, AG | | $ | 4,964,071 | |
| | | |
| | 145,800 | | | INR | | HDFC Bank, Ltd. | | | 4,846,737 | |
| | | |
| | 150,000 | | | | | Itau Unibanco Holding, SA | | | 1,297,500 | |
| | | |
| | 34,000 | | | GBP | | London Stock Exchange Group, PLC | | | 2,229,152 | |
| | | |
| | 2,525 | | | CHF | | Partners Group Holding, AG | | | 1,904,518 | |
| | | |
| | 227,500 | | | HKD | | Ping An Insurance Group Company of China, Ltd. - Class H | | | 2,753,809 | |
| | | | | | | | | | |
| | | | | | | | | 28,616,398 | |
| | | | | | | | | | |
| | | | | | Health Care (12.3%) | | | | |
| | 6,400 | | | CHF | | Alcon, Inc.# | | | 368,568 | |
| | | |
| | 69,000 | | | GBP | | AstraZeneca, PLC | | | 5,140,486 | |
| | | |
| | 29,500 | | | CAD | | Canopy Growth Corp.#^ | | | 1,490,084 | |
| | | |
| | 11,500 | | | EUR | | Carl Zeiss Meditec, AG | | | 1,131,137 | |
| | | |
| | 42,350 | | | AUD | | CSL, Ltd. | | | 5,940,086 | |
| | | |
| | 40,600 | | | JPY | | Hoya Corp. | | | 2,867,481 | |
| | | |
| | 9,000 | | | CHF | | Lonza Group, AG# | | | 2,779,462 | |
| | | |
| | 32,000 | | | CHF | | Novartis, AG | | | 2,622,082 | |
| | | |
| | 20,400 | | | | | Novo Nordisk, A/S | | | 999,804 | |
| | | |
| | 8,200 | | | CHF | | Roche Holding, AG | | | 2,163,679 | |
| | | |
| | 55,000 | | | SEK | | Vitrolife, AB# | | | 1,157,895 | |
| | | | | | | | | | |
| | | | | | | | | 26,660,764 | |
| | | | | | | | | | |
| | | | | | Industrials (11.4%) | |
| | 13,000 | | | EUR | | Airbus, SE | | | 1,780,085 | |
| | | |
| | 70,000 | | | CAD | | CAE, Inc. | | | 1,628,126 | |
| | | |
| | 16,700 | | | CAD | | Canadian Pacific Railway, Ltd. | | | 3,741,762 | |
| | | |
| | 74,900 | | | GBP | | Experian, PLC | | | 2,180,257 | |
| | | |
| | 10,800 | | | JPY | | FANUC Corp.^ | | | 2,029,054 | |
| | | |
| | 75,000 | | | GBP | | HomeServe, PLC | | | 1,062,992 | |
| | | |
| | 153,000 | | | BRL | | Localiza Rent a Car, SA | | | 1,412,512 | |
| | | |
| | 372,000 | | | TWD | | Rexon Industrial Corp., Ltd. | | | 863,444 | |
| | | |
| | 18,600 | | | EUR | | Safran, SA | | | 2,711,158 | |
| | | |
| | 797,914 | | | CNY | | Sany Heavy Industry Company, Ltd. - Class A | | | 1,452,747 | |
| | | |
| | 18,500 | | | EUR | | Schneider Electric, SE | | | 1,565,766 | |
| | | |
| | 20,000 | | | JPY | | Secom Company, Ltd. | | | 1,682,626 | |
| | | |
| | 8,900 | | | EUR | | Teleperformance | | | 1,710,942 | |
| | | |
| | 11,800 | | | DKK | | Vestas Wind Systems, A/S | | | 1,067,710 | |
| | | | | | | | | | |
| | | | | | | | | 24,889,181 | |
| | | | | | | | | | |
| | | | | | Information Technology (19.0%) | |
| | 23,000 | | | | | Accenture, PLC - Class A | | | 4,201,410 | |
| | | |
| | 1,375 | | | EUR | | Adyen, NV#* | | | 1,120,622 | |
| | | |
| | 13,800 | | | EUR | | ASML Holding, NV | | | 2,881,589 | |
| | | |
| | 2,450 | | | CAD | | Constellation Software, Inc. | | | 2,161,731 | |
| | | |
| | 28,000 | | | | | CyberArk Software, Ltd.# | | | 3,610,040 | |
| | | |
| | 212,000 | | | TWD | | Delta Electronics, Inc. | | | 1,118,953 | |
| | | |
| | 21,200 | | | | | Globant, SA# | | | 1,780,588 | |
| | | | |
| 116 | | CALAMOS OPEN-END FAMILY OF FUNDS SEMIANNUAL REPORT | | See accompanying Notes to Schedule of Investments |
International Growth Fund Schedule of Investments April 30, 2019 (Unaudited)
| | | | | | | | | | |
NUMBER OF
SHARES | | | | | | | VALUE | |
| | | |
| | 109,984 | | | CNY | | Hangzhou Hikvision Digital Technology Company, Ltd. - Class A | | $ | 534,886 | |
| | | |
| | 30,000 | | | SEK | | Hexagon, AB - Class B | | | 1,638,966 | |
| | | |
| | 5,700 | | | JPY | | Keyence Corp. | | | 3,561,323 | |
| | | |
| | 590,000 | | | SEK | | LM Ericsson Telephone Company - Class B | | | 5,836,382 | |
| | | |
| | 42,000 | | | KRW | | Samsung Electronics Company, Ltd. | | | 1,651,323 | |
| | | |
| | 18,000 | | | EUR | | SAP, SE | | | 2,320,349 | |
| | | |
| | 26,000 | | | EUR | | SOITEC# | | | 2,633,386 | |
| | | |
| | 535,000 | | | GBP | | Spirent Communications, PLC | | | 1,107,853 | |
| | | |
| | 598,000 | | | TWD | | Taiwan Semiconductor Manufacturing Company, Ltd. | | | 5,020,826 | |
| | | | | | | | | | |
| | | | | | | | | 41,180,227 | |
| | | | | | | | | | |
| | | | | | Materials (2.8%) | | | | |
| | 110,000 | | | AUD | | Fortescue Metals Group, Ltd. | | | 555,853 | |
| | | |
| | 700 | | | CHF | | Givaudan, SA | | | 1,812,513 | |
| | | |
| | 354,000 | | | AUD | | Northern Star Resources, Ltd. | | | 2,049,855 | |
| | | |
| | 23,600 | | | AUD | | Rio Tinto, Ltd. | | | 1,590,695 | |
| | | | | | | | | | |
| | | | | | | | | 6,008,916 | |
| | | | | | | | | | |
| | | |
| | | | | | TOTAL COMMON STOCKS
(Cost $173,821,569) | | | 211,354,232 | |
| | | | | | | | | | |
| | | | | | | | | | |
NUMBER OF
CONTRACTS/
NOTIONAL
AMOUNT | | | | | | | VALUE | |
|
| | PURCHASED OPTIONS (0.1%)# | |
| | | | | | Financials (0.1%) | |
| 1,130
5,691,245 |
| | EUR | | Estx Banks
Call, 12/20/19, Strike 105.00 | | | 234,471 | |
| | | | | | | | | | |
| | | | | | Information Technology (0.0%) | |
| 220
2,836,460 |
| | | | CyberArk Software, Ltd.
Put, 05/17/19, Strike $120.00 | | | 66,000 | |
| | | | | | | | | | |
| | | |
| | | | | | TOTAL PURCHASED OPTIONS
(Cost $327,427) | | | 300,471 | |
| | | | | | | | | | |
| | | | | | | | | | |
NUMBER OF
SHARES | | | | | | | VALUE | |
|
| | SHORT TERM INVESTMENTS (1.9%) | |
| | 2,006,207 | | | | | Fidelity Prime Money Market Fund - Institutional Class, 2.500%*** | | | 2,006,809 | |
| | | |
| | 2,006,560 | | | | | Morgan Stanley Institutional Liquidity Funds - Government Portfolio, 2.350%*** | | | 2,006,560 | |
| | | | | | | | | | |
| | | |
| | | | | | TOTAL SHORT TERM INVESTMENTS
(Cost $4,013,369) | | | 4,013,369 | |
| | | | | | | | | | |
| | | | | | | | | | |
| | | | | | | | | | |
NUMBER OF
SHARES/
PRINCIPAL
AMOUNT | | | | | | | VALUE | |
|
| INVESTMENT OF CASH COLLATERAL FOR SECURITIES
LOANED (0.8%) |
|
| | 1,824,874 | | | | | State Street Navigator Securities Lending Government Money Market Portfolio†
(Cost $1,824,874) | | $ | 1,824,874 | |
| | | | | | | | | | |
| |
| TOTAL INVESTMENTS (100.2%)
(Cost $179,987,239) | | | 217,492,946 | |
| | | | | | | | |
| |
| | PAYABLE UPON RETURN OF SECURITIES ON LOAN(-0.8%) | | | (1,824,874 | ) |
| | | | | |
| |
| | OTHER ASSETS, LESS LIABILITIES (0.6%) | | | 1,409,910 | |
| | | | | | | | | | |
| |
| | NET ASSETS (100.0%) | | $ | 217,077,982 | |
| | | | | | | | | | |
FORWARD FOREIGN CURRENCY CONTRACTS
| | | | | | | | | | | | | | | | |
COUNTER
PARTY | | LONG CONTRACTS | | SETTLEMENT DATE | | LOCAL CURRENCY | | | CURRENT VALUE | | | UNREALIZED GAIN/LOSS | |
| | | | | |
| Northern Trust Company | | European Monetary Unit | | 05/31/19 | | | 13,845,000 | | | $ | 15,566,211 | | | $ | (160,837 | ) |
| | | | | | | | | | | | | | | | |
NOTES TO SCHEDULE OF INVESTMENTS
| # | Non-income producing security. |
| ^ | Security, or portion of security, is on loan. |
| ~ | Security, or portion of security, is segregated as collateral (or collateral for potential future transactions) for written options. The aggregate value of such securities is $16,753. |
| * | Securities issued and sold pursuant to a Rule 144A transaction are excepted from the registration requirement of the Securities Act of 1933, as amended. These securities may only be sold to qualified institutional buyers (“QIBs”), such as the Fund. Any resale of these securities must generally be effected through a sale that is registered under the Act or otherwise exempted from such registration requirements. |
| *** | The rate disclosed is the 7 day net yield as of April 30, 2019. |
| † | Represents investment of cash collateral received from securities on loan as of April 30, 2019. |
| | | | | | |
| See accompanying Notes to Financial Statements | | www.calamos.com | | | 117 | |
International Growth Fund Schedule of Investments April 30, 2019 (Unaudited)
FOREIGN CURRENCY ABBREVIATIONS
| | |
| |
| AUD | | Australian Dollar |
| |
| BRL | | Brazilian Real |
| |
| CAD | | Canadian Dollar |
| |
| CHF | | Swiss Franc |
| |
| CNY | | Chinese Yuan Renminbi |
| |
| DKK | | Danish Krone |
| |
| EUR | | European Monetary Unit |
| |
| GBP | | British Pound Sterling |
| |
| HKD | | Hong Kong Dollar |
| |
| IDR | | Indonesian Rupiah |
| |
| INR | | Indian Rupee |
| |
| JPY | | Japanese Yen |
| |
| KRW | | South Korean Won |
| |
| SEK | | Swedish Krona |
| |
| TWD | | New Taiwan Dollar |
Note: Value for securities denominated in foreign currencies is shown in U.S. dollars. The date on options represents the expiration date of the option contract. The option contract may be exercised at any date on or before the date shown.
CURRENCY EXPOSURE
APRIL 30, 2019
| | | | | | | | |
| | | VALUE | | | % OF TOTAL
INVESTMENTS | |
| | |
| US Dollar | | $ | 58,746,853 | | | | 27.0% | |
| European Monetary Unit | | | 33,958,259 | | | | 15.6% | |
| | |
| Hong Kong Dollar | | | 24,174,711 | | | | 11.1% | |
| British Pound Sterling | | | 18,568,005 | | | | 8.5% | |
| | |
| Canadian Dollar | | | 13,449,671 | | | | 6.2% | |
| Japanese Yen | | | 12,000,328 | | | | 5.5% | |
| | |
| Swiss Franc | | | 11,650,822 | | | | 5.4% | |
| Swedish Krona | | | 10,603,130 | | | | 4.9% | |
| | |
| Australian Dollar | | | 10,136,489 | | | | 4.7% | |
| New Taiwan Dollar | | | 7,003,223 | | | | 3.2% | |
| | |
| Indian Rupee | | | 4,846,737 | | | | 2.2% | |
| Chinese Yuan Renminbi | | | 4,800,864 | | | | 2.2% | |
| | |
| Brazilian Real | | | 3,196,541 | | | | 1.5% | |
| South Korean Won | | | 1,651,323 | | | | 0.8% | |
| | |
| Indonesian Rupiah | | | 1,638,280 | | | | 0.7% | |
| Danish Krone | | | 1,067,710 | | | | 0.5% | |
| | |
| Total Investments | | $ | 217,492,946 | | | | 100.0% | |
Currency exposure may vary over time.
| | | | |
| 118 | | CALAMOS OPEN-END FAMILY OF FUNDS SEMIANNUAL REPORT | | See accompanying Notes to Financial Statements |
Evolving World Growth Fund Schedule of Investments April 30, 2019 (Unaudited)
| | | | | | | | | | |
PRINCIPAL
AMOUNT | | | | | | | VALUE | |
|
| | CONVERTIBLE BONDS (20.5%) | |
| | | | | | Communication Services (2.0%) | |
| | 1,710,000 | | | | | Momo, Inc.*
1.250%, 07/01/25 | | $ | 1,601,612 | |
| | | |
| | 1,440,000 | | | | | Sea, Ltd.*~
2.250%, 07/01/23 | | | 2,091,881 | |
| | | | | | | | | | |
| | | | | | | | | 3,693,493 | |
| | | | | | | | | | |
| | | | | | Consumer Discretionary (4.8%) | |
| | 1,900,000 | | | | | Baozun, Inc.*
1.625%, 05/01/24 | | | 2,139,419 | |
| | | |
| | 1,645,000 | | | | | Ctrip.com International, Ltd.^
1.990%, 07/01/25 | | | 1,845,525 | |
| | | |
| | 2,031,000 | | | | | GOL Equity Finance, SA*
3.750%, 07/15/24 | | | 1,799,466 | |
| | | |
| | 1,610,000 | | | | | Huazhu Group, Ltd.^
0.375%, 11/01/22 | | | 1,865,805 | |
| | | |
| | 1,785,000 | | | | | NIO, Inc.*
4.500%, 02/01/24 | | | 1,372,219 | |
| | | | | | | | | | |
| | | | | | | | | 9,022,434 | |
| | | | | | | | | | |
| | | | | | Energy (4.2%) | |
| | 4,400,000 | | | | | TOTAL, SA
0.500%, 12/02/22 | | | 4,687,452 | |
| | | |
| | 2,600,000 | | | | | Tullow Oil Jersey, Ltd.
6.625%, 07/12/21 | | | 3,123,653 | |
| | | | | | | | | | |
| | | | | | | | | 7,811,105 | |
| | | | | | | | | | |
| | | | | | Financials (4.9%) | |
| | 7,800,000 | | | | | JPMorgan Chase Bank, N.A.
0.000%, 12/30/20 | | | 9,163,362 | |
| | | | | | | | | | |
| | | | | | Industrials (2.0%) | |
| | 1,750,000 | | | | | China Railway Construction Corp., Ltd.
0.000%, 01/29/21 | | | 1,889,545 | |
| | | |
| | 1,750,000 | | | | | CRRC Corp., Ltd.
0.000%, 02/05/21 | | | 1,779,986 | |
| | | | | | | | | | |
| | | | | | | | | 3,669,531 | |
| | | | | | | | | | |
| | | | | | Information Technology (1.0%) | |
| | 1,665,000 | | | | | Lenovo Group, Ltd.
3.375%, 01/24/24 | | | 1,953,361 | |
| | | | | | | | | | |
| | | | | | Materials (1.6%) | |
| | 800,000 | | | | | Glencore Funding, LLC
0.000%, 03/27/25 | | | 733,424 | |
| | | |
| | 2,000,000 | | | | | Taiwan Cement Corp.
0.000%, 12/10/23 | | | 2,236,790 | |
| | | | | | | | | | |
| | | | | | | | | 2,970,214 | |
| | | | | | | | | | |
| | | |
| | | | | | TOTAL CONVERTIBLE BONDS
(Cost $37,189,119) | | | 38,283,500 | |
| | | | | | | | | | |
| | | | | | | | | | |
NUMBER OF
SHARES | | | | | | | VALUE | |
|
| | CONVERTIBLE PREFERRED STOCK (6.3%) | |
| | | | | | Communication Services (6.3%) | |
| | 56,998 | | | | | Alibaba Exchangeable (Softbank)*§
5.750%, 06/01/19
(Cost $6,312,342) | | $ | 11,831,588 | |
| | | | | | | | | | |
| | |
|
| | COMMON STOCKS (72.0%) | |
| | | | | | Communication Services (11.2%) | |
| | 11,880 | | | | | Baidu, Inc.# | | | 1,974,813 | |
| | | |
| | 13,340 | | | ZAR | | Naspers, Ltd. - Class N | | | 3,431,719 | |
| | | |
| | 39,600 | | | | | Telekomunikasi Indonesia Persero, Tbk PT | | | 1,059,300 | |
| | | |
| | 294,700 | | | HKD | | Tencent Holdings, Ltd. | | | 14,525,068 | |
| | | | | | | | | | |
| | | | | | | | | 20,990,900 | |
| | | | | | | | | | |
| | | | | | Consumer Discretionary (7.0%) | |
| | 7,913,000 | | | IDR | | Ace Hardware Indonesia, Tbk PT | | | 916,790 | |
| | | |
| | 204,000 | | | HKD | | ANTA Sports Products, Ltd. | | | 1,434,759 | |
| | | |
| | 210,051 | | | BRL | | BK Brasil Operacao e Assessoria a Restaurantes, SA | | | 1,215,490 | |
| | | |
| | 754,000 | | | HKD | | Guangzhou Automobile Group Company, Ltd. - Class H | | | 812,078 | |
| | | |
| | 756,600 | | | HKD | | Li Ning Company, Ltd.# | | | 1,374,527 | |
| | | |
| | 87,800 | | | BRL | | Lojas Renner, SA | | | 1,049,722 | |
| | | |
| | 24,200 | | | BRL | | Magazine Luiza, SA | | | 1,180,407 | |
| | | |
| | 15,200 | | | | | New Oriental Education & Technology Group, Inc.# | | | 1,450,992 | |
| | | |
| | 245,100 | | | HKD | | Techtronic Industries Company, Ltd. | | | 1,773,666 | |
| | | |
| | 30,600 | | | | | Yum China Holdings, Inc. | | | 1,454,724 | |
| | | |
| | 49,160 | | | CNY | | Zhejiang Supor Company, Ltd. - Class A | | | 494,349 | |
| | | | | | | | | | |
| | | | | | | | | 13,157,504 | |
| | | | | | | | | | |
| | | | | | Consumer Staples (6.7%) | |
| | 848,200 | | | THB | | CP ALL, PCL | | | 2,054,655 | |
| | | |
| | 34,000 | | | GBP | | Diageo, PLC | | | 1,433,363 | |
| | | |
| | 28,800 | | | PLN | | Dino Polska, SA*# | | | 956,268 | |
| | | |
| | 22,319 | | | CNY | | Kweichow Moutai Company, Ltd. - Class A | | | 3,227,537 | |
| | | |
| | 1,580 | | | KRW | | LG Household & Health Care, Ltd. | | | 1,925,272 | |
| | | |
| | 14,800 | | | CHF | | Nestlé, SA | | | 1,424,908 | |
| | | |
| | 544,600 | | | MXN | | Wal-Mart de Mexico, SAB de CV | | | 1,600,096 | |
| | | | | | | | | | |
| | | | | | | | | 12,622,099 | |
| | | | | | | | | | |
| | | | | | Energy (4.0%) | |
| | 285,000 | | | GBP | | BP, PLC | | | 2,072,434 | |
| | | |
| | 13,200 | | | | | CNOOC, Ltd. | | | 2,398,176 | |
| | | |
| | 150,100 | | | INR | | Reliance Industries, Ltd. | | | 3,006,269 | |
| | | | | | | | | | |
| | | | | | | | | 7,476,879 | |
| | | | | | | | | | |
| | | | | | Financials (16.9%) | |
| | 317,600 | | | HKD | | AIA Group, Ltd. | | | 3,252,045 | |
| | | |
| | 174,400 | | | BRL | | Banco do Brasil, SA | | | 2,209,633 | |
| | | | | | |
| See accompanying Notes to Schedule of Investments | | www.calamos.com | | | 119 | |
Evolving World Growth Fund Schedule of Investments April 30, 2019 (Unaudited)
| | | | | | | | | | |
NUMBER OF
SHARES | | | | | | | VALUE | |
| | | |
| | 1,484,100 | | | IDR | | Bank Central Asia, Tbk PT | | $ | 2,997,992 | |
| | | |
| | 4,299,000 | | | HKD | | China Construction Bank Corp. - Class H | | | 3,789,849 | |
| | | |
| | 411,600 | | | HKD | | China International Capital Corp., Ltd. - Class H* | | | 885,296 | |
| | | |
| | 5,800 | | | | | Credicorp, Ltd. | | | 1,374,020 | |
| | | |
| | 334,700 | | | ZAR | | FirstRand, Ltd. | | | 1,592,849 | |
| | | |
| | 43,600 | | | KRW | | Hana Financial Group, Inc. | | | 1,375,176 | |
| | | |
| | 190,500 | | | INR | | HDFC Bank, Ltd. | | | 6,332,670 | |
| | | |
| | 56,000 | | | INR | | Housing Development Finance Corp., Ltd. | | | 1,606,980 | |
| | | |
| | 88,700 | | | INR | | ICICI Lombard General Insurance Company, Ltd.* | | | 1,386,637 | |
| | | |
| | 79,200 | | | BRL | | IRB Brasil Resseguros, SA | | | 1,896,631 | |
| | | |
| | 330,000 | | | | | Itau Unibanco Holding, SA | | | 2,854,500 | |
| | | | | | | | | | |
| | | | | | | | | 31,554,278 | |
| | | | | | | | | | |
| | | | | | Health Care (1.8%) | | | | |
| | 87,995 | | | CNY | | Aier Eye Hospital Group Company, Ltd. - Class A | | | 488,040 | |
| | | |
| | 36,700 | | | | | AstraZeneca, PLC^ | | | 1,382,122 | |
| | | |
| | 55,000 | | | BRL | | Notre Dame Intermedica Participacoes, SA | | | 492,617 | |
| | | |
| | 96,500 | | | HKD | | Wuxi Biologics Cayman, Inc.*# | | | 972,237 | |
| | | | | | | | | | |
| | | | | | | | | 3,335,016 | |
| | | | | | | | | | |
| | | | | | Industrials (3.7%) | | | | |
| | 35,714 | | | CNY | | Contemporary Amperex Technology Company, Ltd. - Class A# | | | 422,834 | |
| | | |
| | 32,800 | | | | | Gol Linhas Aereas Inteligentes, SA^# | | | 370,968 | |
| | | |
| | 634,600 | | | PHP | | International Container Terminal Services, Inc. | | | 1,540,454 | |
| | | |
| | 157,000 | | | BRL | | Localiza Rent a Car, SA | | | 1,449,440 | |
| | | |
| | 514,300 | | | BRL | | Randon, SA Implementos e Participacoes | | | 1,114,878 | |
| | | |
| | 335,000 | | | TWD | | Rexon Industrial Corp., Ltd. | | | 777,564 | |
| | | |
| | 717,277 | | | CNY | | Sany Heavy Industry Company, Ltd. - Class A | | | 1,305,933 | |
| | | | | | | | | | |
| | | | | | | | | 6,982,071 | |
| | | | | | | | | | |
| | | | | | Information Technology (15.8%) | | | | |
| | 54,000 | | | TWD | | ASMedia Technology, Inc. | | | 936,698 | |
| | | |
| | 192,000 | | | TWD | | Delta Electronics, Inc. | | | 1,013,392 | |
| | | |
| | 24,300 | | | | | Fabrinet# | | | 1,470,636 | |
| | | |
| | 19,500 | | | | | Globant, SA# | | | 1,637,805 | |
| | | |
| | 100,100 | | | CNY | | Hangzhou Hikvision Digital Technology Company, Ltd. - Class A | | | 486,817 | |
| | | |
| | 826,000 | | | HKD | | Kingdee International Software Group Company, Ltd. | | | 1,013,888 | |
| | | |
| | 13,800 | | | KRW | | Koh Young Technology, Inc. | | | 1,142,431 | |
| | | |
| | 365,000 | | | SEK | | LM Ericsson Telephone Company - Class B | | | 3,610,643 | |
| | | |
| | 1,900 | | | | | MercadoLibre, Inc.^# | | | 919,866 | |
| | | | | | | | | | |
NUMBER OF
SHARES | | | | | | | VALUE | |
| | | |
| | 134,500 | | | KRW | | Samsung Electronics Company, Ltd. | | $ | 5,288,165 | |
| | | |
| | 954,649 | | | TWD | | Taiwan Semiconductor Manufacturing Company, Ltd. | | | 8,015,262 | |
| | | |
| | 122,300 | | | INR | | Tata Consultancy Services, Ltd. | | | 3,968,084 | |
| | | | | | | | | | |
| | | | | | | | | 29,503,687 | |
| | | | | | | | | | |
| | | | | | Materials (2.6%) | | | | |
| | 113,300 | | | | | Cia de Minas Buenaventura, SAA | | | 1,836,593 | |
| | | |
| | 99,000 | | | AUD | | Fortescue Metals Group, Ltd. | | | 500,268 | |
| | | |
| | 476,000 | | | MYR | | Petronas Chemicals Group, Bhd | | | 1,036,301 | |
| | | |
| | 21,100 | | | AUD | | Rio Tinto, Ltd. | | | 1,422,189 | |
| | | | | | | | | | |
| | | | | | | | | 4,795,351 | |
| | | | | | | | | | |
| | | | | | Real Estate (2.3%) | | | | |
| | 1,580,100 | | | PHP | | Ayala Land, Inc. | | | 1,486,579 | |
| | | |
| | 378,000 | | | HKD | | China Overseas Land & Investment, Ltd. | | | 1,416,234 | |
| | | |
| | 391,500 | | | HKD | | Longfor Group Holdings, Ltd. | | | 1,447,580 | |
| | | | | | | | | | |
| | | | | | | | | 4,350,393 | |
| | | | | | | | | | |
| | | |
| | | | | | TOTAL COMMON STOCKS
(Cost $103,090,169) | | | 134,768,178 | |
| | | | | | | | | | |
| | | | | | | | | | |
NUMBER OF
CONTRACTS/
NOTIONAL
AMOUNT | | | | | | | VALUE | |
|
| | PURCHASED OPTIONS (1.0%)# | |
| | | | | | Communication Services (0.0%) | | | | |
| 155
2,576,565 |
| | | | Baidu, Inc.
Call, 01/17/20, Strike $250.00 | | | 15,733 | |
| | | |
| 780
1,941,420 |
| | | | Sea, Ltd.
Put, 06/21/19, Strike $22.50 | | | 60,450 | |
| | | | | | | | | | |
| | | | | | | | | 76,183 | |
| | | | | | | | | | |
| | | | | | Consumer Discretionary (0.2%) | | | | |
| 75
1,391,775 |
| | | | Alibaba Group Holding, Ltd.
Call, 01/17/20, Strike $175.00 | | | 194,812 | |
| | | |
| 780
1,957,800 |
| | | | Melco Resorts & Entertainment
Call, 01/17/20, Strike $27.00 | | | 173,550 | |
| | | | | | | | | | |
| | | | | | | | | 368,362 | |
| | | | | | | | | | |
| | | | | | Energy (0.2%) | | | | |
| 385
3,291,750 |
| | | | Lukoil, PJSC
Call, 12/20/19, Strike $84.00 | | | 188,650 | |
| | | |
| 1,160
1,766,680 |
| | | | Petroleo Brasileiro, SA
Call, 10/18/19, Strike $17.00 | | | 107,300 | |
| | | | | | | | | | |
| | | | | | | | | 295,950 | |
| | | | | | | | | | |
| | | | | | Financials (0.1%) | | | | |
| 1,480
2,124,984 |
| | | | Sberbank of Russia, PJSC
Call, 12/20/19, Strike $14.00 | | | 168,720 | |
| | | | | | | | | | |
| | | | | | Information Technology (0.1%) | | | | |
| 1,990
9,701,250 |
| | | | Kraneshares Csi China Internet
Put, 06/21/19, Strike $46.00 | | | 184,075 | |
| | | | |
| 120 | | CALAMOS OPEN-END FAMILY OF FUNDS SEMIANNUAL REPORT | | See accompanying Notes to Schedule of Investments |
Evolving World Growth Fund Schedule of Investments April 30, 2019 (Unaudited)
| | | | | | | | | | |
NUMBER OF
CONTRACTS/
NOTIONAL
AMOUNT | | | | | | | VALUE | |
| | | |
| 530
1,983,790 |
| | | | Yandex, NV
Call, 05/17/19, Strike $36.00 | | $ | 104,675 | |
| | | | | | | | | | |
| | | | | | | | | 288,750 | |
| | | | | | | | | | |
| | | | | | Other (0.4%) | | | | |
| 4,460
19,592,780 |
| | | | iShares MSCI Emerging Markets ETF
Put, 07/19/19, Strike $42.00 | | | 287,670 | |
| | | |
| 695
1,620,740 |
| | | | iShares MSCI Turkey ETF
Call, 01/17/20, Strike $28.00 | | | 52,125 | |
| | | |
| 870
2,523,000 |
| | | | Xtrackers Harvest CSI 300 China A Shares ETF
Call, 01/17/20, Strike $26.71 | | | 343,650 | |
| | | | | | | | | | |
| | | | | | | | | 683,445 | |
| | | | | | | | | | |
| | | |
| | | | | | TOTAL PURCHASED OPTIONS
(Cost $2,404,797) | | | 1,881,410 | |
| | | | | | | | | | |
| | | | | | | | | | |
NUMBER OF
SHARES | | | | | | | VALUE | |
|
| | SHORT TERM INVESTMENTS (0.0%) | |
| | 1,582 | | | | | Fidelity Prime Money Market Fund - Institutional Class, 2.500%*** | | | 1,582 | |
| | | |
| | 1,483 | | | | | Morgan Stanley Institutional Liquidity Funds - Government Portfolio, 2.350%*** | | | 1,483 | |
| | | | | | | | | | |
| | | |
| | | | | | TOTAL SHORT TERM INVESTMENTS
(Cost $3,065) | | | 3,065 | |
| | | | | | | | | | |
| | | | | | | | | | |
NUMBER OF
SHARES/
PRINCIPAL
AMOUNT | | | | | | | VALUE | |
|
| INVESTMENT OF CASH COLLATERAL FOR SECURITIES
LOANED (2.3%) |
|
| | 4,310,157 | | | | | State Street Navigator Securities Lending Government Money Market Portfolio† (Cost $4,310,157) | | | 4,310,157 | |
| | | | | | | | | | |
| |
| TOTAL INVESTMENTS (102.1%)
(Cost $153,309,649) | | | 191,077,898 | |
| | | | | | | | | | |
| |
| | PAYABLE UPON RETURN OF SECURITIES ON LOAN(-2.3%) | | | (4,310,157 | ) |
| | | | | |
| |
| | OTHER ASSETS, LESS LIABILITIES (0.2%) | | | 470,361 | |
| | | | | | | | | | |
| |
| | NET ASSETS (100.0%) | | $ | 187,238,102 | |
| | | | | | | | | | |
NOTES TO SCHEDULE OF INVESTMENTS
| * | Securities issued and sold pursuant to a Rule 144A transaction are excepted from the registration requirement of the Securities Act of 1933, as amended. These securities may only be sold to qualified institutional buyers (“QIBs”), such as the Fund. Any resale of these securities must generally be effected through a sale that is registered under the Act or otherwise exempted from such registration requirements. |
| ~ | Security, or portion of security, is segregated as collateral for written options. The aggregate value of such securities is $217,904. |
| ^ | Security, or portion of security, is on loan. |
| § | Securities exchangeable or convertible into securities of one or more entities that are different than the issuer. Each entity is identified in the parenthetical. |
| # | Non-income producing security. |
| *** | The rate disclosed is the 7 day net yield as of April 30, 2019. |
| † | Represents investment of cash collateral received from securities on loan as of April 30, 2019. |
FOREIGN CURRENCY ABBREVIATIONS
| | |
| |
| AUD | | Australian Dollar |
| |
| BRL | | Brazilian Real |
| |
| CHF | | Swiss Franc |
| |
| CNY | | Chinese Yuan Renminbi |
| |
| GBP | | British Pound Sterling |
| |
| HKD | | Hong Kong Dollar |
| |
| IDR | | Indonesian Rupiah |
| |
| INR | | Indian Rupee |
| |
| KRW | | South Korean Won |
| |
| MXN | | Mexican Peso |
| |
| MYR | | Malaysian Ringgit |
| |
| PHP | | Philippine Peso |
| |
| PLN | | Polish Zloty |
| |
| SEK | | Swedish Krona |
| |
| THB | | Thai Baht |
| |
| TWD | | New Taiwan Dollar |
| |
| ZAR | | South African Rand |
Note: Value for securities denominated in foreign currencies is shown in U.S. dollars. The principal amount for such securities is shown in the respective foreign currency. The date on options represents the expiration date of the option contract. The option contract may be exercised at any date on or before the date shown.
| | | | | | |
| See accompanying Notes to Financial Statements | | www.calamos.com | | | 121 | |
Evolving World Growth Fund Schedule of Investments April 30, 2019 (Unaudited)
CURRENCY EXPOSURE
APRIL 30, 2019
| | | | | | | | |
| | | VALUE | | | % OF TOTAL
INVESTMENTS | |
| | |
| US Dollar | | $ | 76,494,235 | | | | 40.0% | |
| Hong Kong Dollar | | | 32,697,227 | | | | 17.1% | |
| | |
| Indian Rupee | | | 16,300,640 | | | | 8.5% | |
| New Taiwan Dollar | | | 10,742,916 | | | | 5.6% | |
| | |
| Brazilian Real | | | 10,608,818 | | | | 5.6% | |
| South Korean Won | | | 9,731,044 | | | | 5.1% | |
| | |
| Chinese Yuan Renminbi | | | 6,425,510 | | | | 3.4% | |
| South African Rand | | | 5,024,568 | | | | 2.6% | |
| | |
| Indonesian Rupiah | | | 3,914,782 | | | | 2.1% | |
| Swedish Krona | | | 3,610,643 | | | | 1.9% | |
| | |
| British Pound Sterling | | | 3,505,797 | | | | 1.8% | |
| Philippine Peso | | | 3,027,033 | | | | 1.6% | |
| | |
| Thai Baht | | | 2,054,655 | | | | 1.1% | |
| Australian Dollar | | | 1,922,457 | | | | 1.0% | |
| | |
| Mexican Peso | | | 1,600,096 | | | | 0.8% | |
| Swiss Franc | | | 1,424,908 | | | | 0.8% | |
| | |
| Malaysian Ringgit | | | 1,036,301 | | | | 0.5% | |
| Polish Zloty | | | 956,268 | | | | 0.5% | |
| | |
| Total Investments | | $ | 191,077,898 | | | | 100.0% | |
Currency exposure may vary over time.
| | | | |
| 122 | | CALAMOS OPEN-END FAMILY OF FUNDS SEMIANNUAL REPORT | | See accompanying Notes to Financial Statements |
Emerging Market Equity Fund Schedule of Investments April 30, 2019 (Unaudited)
| | | | | | | | | | |
NUMBER OF
SHARES | | | | | | | VALUE | |
|
| | COMMON STOCKS (95.1%) | |
| | | | | | Communication Services (13.0%) | |
| | 1,065 | | | | | Baidu, Inc.# | | $ | 177,035 | |
| | | |
| | 1,293 | | | ZAR | | Naspers, Ltd. - Class N | | | 332,625 | |
| | | |
| | 165 | | | KRW | | NCSoft Corp. | | | 74,305 | |
| | | |
| | 320 | | | | | NetEase, Inc. | | | 91,050 | |
| | | |
| | 6,100 | | | | | Sea, Ltd.# | | | 151,829 | |
| | | |
| | 2,900 | | | | | Telekomunikasi Indonesia Persero, Tbk PT | | | 77,575 | |
| | | |
| | 23,300 | | | HKD | | Tencent Holdings, Ltd. | | | 1,148,402 | |
| | | | | | | | | | |
| | | | | | | | | 2,052,821 | |
| | | | | | | | | | |
| | | | | | Consumer Discretionary (16.6%) | |
| | 600,000 | | | IDR | | Ace Hardware Indonesia, Tbk PT | | | 69,515 | |
| | | |
| | 5,925 | | | | | Alibaba Group Holding, Ltd.# | | | 1,099,502 | |
| | | |
| | 17,000 | | | HKD | | ANTA Sports Products, Ltd. | | | 119,563 | |
| | | |
| | 1,900 | | | | | Baozun, Inc.#^ | | | 92,150 | |
| | | |
| | 18,798 | | | BRL | | BK Brasil Operacao e Assessoria a Restaurantes, SA | | | 108,777 | |
| | | |
| | 15,000 | | | HKD | | Galaxy Entertainment Group, Ltd. | | | 112,339 | |
| | | |
| | 1,800 | | | | | Geely Automobile Holdings, Ltd. | | | 72,684 | |
| | | |
| | 60,500 | | | HKD | | Guangzhou Automobile Group Company, Ltd. - Class H | | | 65,160 | |
| | | |
| | 63,500 | | | HKD | | Li Ning Company, Ltd.# | | | 115,361 | |
| | | |
| | 9,700 | | | BRL | | Lojas Renner, SA | | | 115,972 | |
| | | |
| | 2,550 | | | BRL | | Magazine Luiza, SA | | | 124,382 | |
| | | |
| | 1,430 | | | | | New Oriental Education & Technology Group, Inc.# | | | 136,508 | |
| | | |
| | 9,100 | | | | | NIO, Inc.#^ | | | 44,135 | |
| | | |
| | 25,500 | | | HKD | | Techtronic Industries Company, Ltd. | | | 184,531 | |
| | | |
| | 2,580 | | | | | Yum China Holdings, Inc. | | | 122,653 | |
| | | |
| | 4,000 | | | CNY | | Zhejiang Supor Company, Ltd. - Class A | | | 40,224 | |
| | | | | | | | | | |
| | | | | | | | | 2,623,456 | |
| | | | | | | | | | |
| | | | | | Consumer Staples (6.1%) | | | | |
| | 70,900 | | | THB | | CP ALL, PCL | | | 171,746 | |
| | | |
| | 2,500 | | | PLN | | Dino Polska, SA#* | | | 83,009 | |
| | | |
| | 28,000 | | | | | ITC, Ltd.# | | | 121,520 | |
| | | |
| | 2,292 | | | CNY | | Kweichow Moutai Company, Ltd. - Class A | | | 331,445 | |
| | | |
| | 108 | | | KRW | | LG Household & Health Care, Ltd. | | | 131,601 | |
| | | |
| | 43,400 | | | MXN | | Wal-Mart de Mexico, SAB de CV | | | 127,514 | |
| | | | | | | | | | |
| | | | | | | | | 966,835 | |
| | | | | | | | | | |
| | | | | | Energy (4.2%) | | | | |
| | 1,170 | | | | | CNOOC, Ltd. | | | 212,566 | |
| | | |
| | 4,700 | | | | | Reliance Industries, Ltd.* | | | 189,263 | |
| | | |
| | 3,025 | | | | | Reliance Industries, Ltd.* | | | 121,151 | |
| | | |
| | 48,900 | | | GBP | | Tullow Oil, PLC | | | 143,381 | |
| | | | | | | | | | |
| | | | | | | | | 666,361 | |
| | | | | | | | | | |
| | | | | | | | | | |
NUMBER OF
SHARES | | | | | | | VALUE | |
| | | | | | | | | | |
| | | | | | Financials (22.4%) | | | | |
| | 24,800 | | | HKD | | AIA Group, Ltd. | | $ | 253,938 | |
| | | |
| | 17,800 | | | BRL | | Banco do Brasil, SA | | | 225,524 | |
| | | |
| | 2,200 | | | | | Bancolombia, SA | | | 111,584 | |
| | | |
| | 161,513 | | | IDR | | Bank Central Asia, Tbk PT | | | 326,268 | |
| | | |
| | 443,000 | | | HKD | | China Construction Bank Corp. - Class H | | | 390,533 | |
| | | |
| | 32,400 | | | HKD | | China International Capital Corp., Ltd. - Class H* | | | 69,688 | |
| | | |
| | 620 | | | | | Credicorp, Ltd. | | | 146,878 | |
| | | |
| | 160,000 | | | TWD | | E.Sun Financial Holding Company, Ltd. | | | 131,377 | |
| | | |
| | 37,700 | | | ZAR | | FirstRand, Ltd. | | | 179,416 | |
| | | |
| | 14,000 | | | MXN | | Grupo Financiero Banorte, SAB de CV - Class O | | | 88,707 | |
| | | |
| | 4,650 | | | KRW | | Hana Financial Group, Inc. | | | 146,664 | |
| | | |
| | 4,400 | | | | | HDFC Bank, Ltd.~ | | | 504,460 | |
| | | |
| | 14,600 | | | | | ICICI Bank, Ltd. | | | 167,170 | |
| | | |
| | 7,200 | | | BRL | | IRB Brasil Resseguros, SA | | | 172,421 | |
| | | |
| | 22,650 | | | | | Itau Unibanco Holding, SA | | | 195,923 | |
| | | |
| | 35,600 | | | HKD | | Ping An Insurance Group Company of China, Ltd. - Class H | | | 430,926 | |
| | | | | | | | | | |
| | | | | | | | | 3,541,477 | |
| | | | | | | | | | |
| | | | | | Health Care (2.3%) | | | | |
| | 7,200 | | | CNY | | Aier Eye Hospital Group Company, Ltd. - Class A | | | 39,933 | |
| | | |
| | 3,100 | | | | | Dr. Reddy’s Laboratories, Ltd.^ | | | 129,859 | |
| | | |
| | 8,100 | | | BRL | | Notre Dame Intermedica Participacoes, SA | | | 72,549 | |
| | | |
| | 11,500 | | | HKD | | Wuxi Biologics Cayman, Inc.#* | | | 115,862 | |
| | | | | | | | | | |
| | | | | | | | | 358,203 | |
| | | | | | | | | | |
| | | | | | Industrials (5.4%) | | | | |
| | 68,000 | | | HKD | | China Railway Construction Corp., Ltd. - Class H | | | 80,350 | |
| | | |
| | 2,800 | | | CNY | | Contemporary Amperex Technology Company, Ltd. - Class A | | | 33,150 | |
| | | |
| | 107,000 | | | HKD | | CRRC Corp., Ltd. - Class H | | | 93,472 | |
| | | |
| | 7,200 | | | | | Gol Linhas Aereas Inteligentes, SA#^ | | | 81,432 | |
| | | |
| | 51,600 | | | PHP | | International Container Terminal Services, Inc. | | | 125,256 | |
| | | |
| | 13,100 | | | BRL | | Localiza Rent a Car, SA | | | 120,941 | |
| | | |
| | 57,300 | | | BRL | | Randon, SA Implementos e Participacoes | | | 124,213 | |
| | | |
| | 40,000 | | | TWD | | Rexon Industrial Corp., Ltd. | | | 92,843 | |
| | | |
| | 59,000 | | | CNY | | Sany Heavy Industry Company, Ltd. - Class A | | | 107,420 | |
| | | | | | | | | | |
| | | | | | | | | 859,077 | |
| | | | | | | | | | |
| | | | | | Information Technology (17.7%) | | | | |
| | 30,000 | | | TWD | | Accton Technology Corp. | | | 127,441 | |
| | | |
| | 4,000 | | | TWD | | ASMedia Technology, Inc. | | | 69,385 | |
| | | |
| | 23,000 | | | TWD | | Delta Electronics, Inc. | | | 121,396 | |
| | | |
| | 1,950 | | | | | Fabrinet# | | | 118,014 | |
| | | | | | |
| See accompanying Notes to Schedule of Investments | | www.calamos.com | | | 123 | |
Emerging Market Equity Fund Schedule of Investments April 30, 2019 (Unaudited)
| | | | | | | | | | |
NUMBER OF
SHARES | | | | | | �� | VALUE | |
| | | |
| | 1,590 | | | | | Globant, SA# | | $ | 133,544 | |
| | | |
| | 7,700 | | | CNY | | Hangzhou Hikvision Digital Technology Company, Ltd. - Class A | | | 37,448 | |
| | | |
| | 22,800 | | | | | Infosys, Ltd.^ | | | 245,328 | |
| | | |
| | 97,000 | | | HKD | | Kingdee International Software Group Company, Ltd. | | | 119,064 | |
| | | |
| | 1,060 | | | KRW | | Koh Young Technology, Inc. | | | 87,752 | |
| | | |
| | 1,000 | | | TWD | | Largan Precision Company, Ltd. | | | 150,123 | |
| | | |
| | 132,000 | | | HKD | | Lenovo Group, Ltd. | | | 122,321 | |
| | | |
| | 150 | | | | | MercadoLibre, Inc.#^ | | | 72,621 | |
| | | |
| | 16,050 | | | KRW | | Samsung Electronics Company, Ltd. | | | 631,041 | |
| | | |
| | 1,320 | | | KRW | | SK Hynix, Inc. | | | 89,325 | |
| | | |
| | 71,000 | | | TWD | | Taiwan Semiconductor Manufacturing Company, Ltd. | | | 596,118 | |
| | | |
| | 46,200 | | | HKD | | Xiaomi Corp. - Class B#* | | | 71,006 | |
| | | | | | | | | | |
| | | | | | | | | 2,791,927 | |
| | | | | | | | | | |
| | | | | | Materials (4.1%) | | | | |
| | 13,800 | | | HKD | | Anhui Conch Cement Company, Ltd. - Class H | | | 84,233 | |
| | | |
| | 9,300 | | | | | Cia de Minas Buenaventura, SAA | | | 150,753 | |
| | | |
| | 8,000 | | | AUD | | Fortescue Metals Group, Ltd. | | | 40,426 | |
| | | |
| | 472 | | | KRW | | LG Chem, Ltd. | | | 146,416 | |
| | | |
| | 52,700 | | | MYR | | Petronas Chemicals Group, Bhd | | | 114,733 | |
| | | |
| | 1,700 | | | AUD | | Rio Tinto, Ltd. | | | 114,584 | |
| | | | | | | | | | |
| | | | | | | | | 651,145 | |
| | | | | | | | | | |
| | | | | | Real Estate (3.3%) | | | | |
| | 268,500 | | | PHP | | Ayala Land, Inc. | | | 252,608 | |
| | | |
| | 40,000 | | | HKD | | China Overseas Land & Investment, Ltd. | | | 149,866 | |
| | | |
| | 33,500 | | | HKD | | Longfor Group Holdings, Ltd. | | | 123,867 | |
| | | | | | | | | | |
| | | | | | | | | 526,341 | |
| | | | | | | | | | |
| | | |
| | | | | | TOTAL COMMON STOCKS
(Cost $12,187,896) | | | 15,037,643 | |
| | | | | | | | | | |
| | | | | | | | | | |
|
| | EXCHANGE-TRADED FUNDS (3.3%) | |
| | | | | | Other (3.3%) | | | | |
| | 4,650 | | | | | iShares MSCI Saudi Arabia Capped ETF | | | 163,447 | |
| | | |
| | 5,200 | | | | | iShares MSCI Turkey ETF^ | | | 121,264 | |
| | | |
| | 14,400 | | | | | VanEck Vectors Vietnam ETF^ | | | 240,048 | |
| | | | | | | | | | |
| | | | | | | | | 524,759 | |
| | | | | | | | | | |
| | | |
| | | | | | TOTAL EXCHANGE-TRADED FUNDS
(Cost $538,735) | | | 524,759 | |
| | | | | | | | | | |
| | | | | | | | | | |
NUMBER OF
CONTRACTS/
NOTIONAL
AMOUNT | | | | | | | VALUE | |
|
| | PURCHASED OPTIONS (0.6%)# | |
| | | | | | Communication Services (0.0%) | | | | |
| 61
151,829 |
| | | | Sea, Ltd.
Put, 06/21/19, Strike $22.50 | | $ | 4,728 | |
| | | | | | | | | | |
| | | | | | Energy (0.1%) | | | | |
| 30
256,500 |
| | | | Lukoil, PJSC
Call, 12/20/19, Strike $84.00 | | | 14,700 | |
| | | |
| 90
137,070 |
| | | | Petroleo Brasileiro, SA
Call, 10/18/19, Strike $17.00 | | | 8,325 | |
| | | | | | | | | | |
| | | | | | | | | 23,025 | |
| | | | | | | | | | |
| | | | | | Financials (0.1%) | | | | |
| 110
157,938 |
| | | | Sberbank of Russia, PJSC
Call, 12/20/19, Strike $14.00 | | | 12,540 | |
| | | | | | | | | | |
| | | | | | Information Technology (0.1%) | | | | |
| 42
157,206 |
| | | | Yandex, NV
Call, 05/17/19, Strike $36.00 | | | 8,295 | |
| | | | | | | | | | |
| | | | | | Other (0.3%) | | | | |
| 120
348,000 |
| | | | Xtrackers Harvest CSI 300 China A Shares ETF
Call, 01/17/20, Strike $26.71 | | | 47,400 | |
| | | | | | | | | | |
| | | |
| | | | | | TOTAL PURCHASED OPTIONS
(Cost $86,075) | | | 95,988 | |
| | | | | | | | | | |
| | | | | | | | | | |
NUMBER OF
SHARES | | | | | | | VALUE | |
|
| | SHORT TERM INVESTMENTS (1.4%) | |
| | 105,895 | | | | | Fidelity Prime Money Market Fund - Institutional Class, 2.500%*** | | | 105,927 | |
| | | |
| | 105,923 | | | | | Morgan Stanley Institutional Liquidity Funds - Government Portfolio, 2.350%*** | | | 105,923 | |
| | | | | | | | | | |
| | | |
| | | | | | TOTAL SHORT TERM INVESTMENTS
(Cost $211,850) | | | 211,850 | |
| | | | | | | | | | |
| | | | | | | | | | |
NUMBER OF
SHARES/
PRINCIPAL
AMOUNT | | | | | | | VALUE | |
|
| INVESTMENT OF CASH COLLATERAL FOR SECURITIES
LOANED (5.2%) |
|
| | 823,146 | | | | | State Street Navigator Securities Lending Government Money Market Portfolio†
(Cost $823,146) | | | 823,146 | |
| | | | | | | | | | |
| |
| TOTAL INVESTMENTS (105.6%)
(Cost $13,847,702) | | | 16,693,386 | |
| | | | | | | | | | |
| |
| | PAYABLE UPON RETURN OF SECURITIES ON LOAN(-5.2%) | | | (823,146 | ) |
| | | | | |
| |
| | LIABILITIES, LESS OTHER ASSETS(-0.4%) | | | (57,361 | ) |
| | | | | | | | | | |
| |
| | NET ASSETS (100.0%) | | $ | 15,812,879 | |
| | | | | | | | | | |
| | | | |
| 124 | | CALAMOS OPEN-END FAMILY OF FUNDS SEMIANNUAL REPORT | | See accompanying Notes to Schedule of Investments |
Emerging Market Equity Fund Schedule of Investments April 30, 2019 (Unaudited)
NOTES TO SCHEDULE OF INVESTMENTS
| # | Non-income producing security. |
| ^ | Security, or portion of security, is on loan. |
| * | Securities issued and sold pursuant to a Rule 144A transaction are excepted from the registration requirement of the Securities Act of 1933, as amended. These securities may only be sold to qualified institutional buyers (“QIBs”), such as the Fund. Any resale of these securities must generally be effected through a sale that is registered under the Act or otherwise exempted from such registration requirements. |
| ~ | Security, or portion of security, is segregated as collateral (or collateral for potential future transactions) for written options. The aggregate value of such securities is $22,930. |
| *** | The rate disclosed is the 7 day net yield as of April 30, 2019. |
| † | Represents investment of cash collateral received from securities on loan as of April 30, 2019. |
FOREIGN CURRENCY ABBREVIATIONS
| | |
| |
| AUD | | Australian Dollar |
| |
| BRL | | Brazilian Real |
| |
| CNY | | Chinese Yuan Renminbi |
| |
| GBP | | British Pound Sterling |
| |
| HKD | | Hong Kong Dollar |
| |
| IDR | | Indonesian Rupiah |
| |
| KRW | | South Korean Won |
| |
| MXN | | Mexican Peso |
| |
| MYR | | Malaysian Ringgit |
| |
| PHP | | Philippine Peso |
| |
| PLN | | Polish Zloty |
| |
| THB | | Thai Baht |
| |
| TWD | | New Taiwan Dollar |
| |
| ZAR | | South African Rand |
Note: Value for securities denominated in foreign currencies is shown in U.S. dollars. The date on options represents the expiration date of the option contract. The option contract may be exercised at any date on or before the date shown.
CURRENCY EXPOSURE
APRIL 30, 2019
| | | | | | | | |
| | | Value | | | % OF TOTAL
INVESTMENTS | |
| | |
| US Dollar | | $ | 6,422,930 | | | | 38.5% | |
| Hong Kong Dollar | | | 3,850,482 | | | | 23.1% | |
| | |
| South Korean Won | | | 1,307,104 | | | | 7.8% | |
| New Taiwan Dollar | | | 1,288,683 | | | | 7.7% | |
| | |
| Brazilian Real | | | 1,064,779 | | | | 6.4% | |
| Chinese Yuan Renminbi | | | 589,620 | | | | 3.5% | |
| | |
| South African Rand | | | 512,041 | | | | 3.1% | |
| Indonesian Rupiah | | | 395,783 | | | | 2.4% | |
| | |
| Philippine Peso | | | 377,864 | | | | 2.3% | |
| Mexican Peso | | | 216,221 | | | | 1.3% | |
| | |
| Thai Baht | | | 171,746 | | | | 1.0% | |
| Australian Dollar | | | 155,010 | | | | 0.9% | |
| | |
| British Pound Sterling | | | 143,381 | | | | 0.8% | |
| Malaysian Ringgit | | | 114,733 | | | | 0.7% | |
| | |
| Polish Zloty | | | 83,009 | | | | 0.5% | |
| Total Investments | | $ | 16,693,386 | | | | 100.0% | |
Currency exposure may vary over time.
| | | | | | |
| See accompanying Notes to Financial Statements | | www.calamos.com | | | 125 | |
Global Equity Fund Schedule of Investments April 30, 2019 (Unaudited)
| | | | | | | | | | |
NUMBER OF
SHARES | | | | | | | VALUE | |
|
| | COMMON STOCKS (96.3%) | |
| | | | | | Communication Services (13.3%) | |
| | 2,835 | | | | | Alphabet, Inc. - Class A# | | $ | 3,399,052 | |
| | | |
| | 5,000 | | | JPY | | Nintendo Company, Ltd. | | | 1,722,078 | |
| | | |
| | 80,500 | | | HKD | | Tencent Holdings, Ltd. | | | 3,967,655 | |
| | | |
| | 26,020 | | | | | Walt Disney Company | | | 3,563,959 | |
| | | | | | | | | | |
| | | | | | | | | 12,652,744 | |
| | | | | | | | | | |
| | | | | | Consumer Discretionary (17.7%) | |
| | 20,430 | | | | | Alibaba Group Holding, Ltd.#^ | | | 3,791,195 | |
| | | |
| | 1,905 | | | | | Amazon.com, Inc.# | | | 3,670,021 | |
| | | |
| | 16,900 | | | | | Aptiv, PLC | | | 1,448,330 | |
| | | |
| | 31,600 | | | GBP | | Compass Group, PLC | | | 719,022 | |
| | | |
| | 14,300 | | | | | Lowe’s Companies, Inc. | | | 1,617,902 | |
| | | |
| | 15,300 | | | | | Lululemon Athletica, Inc.# | | | 2,698,155 | |
| | | |
| | 1,200 | | | | | O’Reilly Automotive, Inc.# | | | 454,284 | |
| | | |
| | 1,950 | | | EUR | | Puma, SE | | | 1,206,197 | |
| | | |
| | 172,000 | | | HKD | | Techtronic Industries Company, Ltd. | | | 1,244,678 | |
| | | | | | | | | | |
| | | | | | | | | 16,849,784 | |
| | | | | | | | | | |
| | | | | | Consumer Staples (7.5%) | |
| | 32,500 | | | CAD | | Alimentation Couche-Tard, Inc. - Class B | | | 1,916,231 | |
| | | |
| | 23,333 | | | GBP | | Diageo, PLC | | | 983,666 | |
| | | |
| | 8,360 | | | EUR | | Kerry Group, PLC - Class A | | | 934,032 | |
| | | |
| | 8,100 | | | CNY | | Kweichow Moutai Company, Ltd. - Class A | | | 1,171,336 | |
| | | |
| | 23,100 | | | SEK | | Swedish Match, AB | | | 1,126,346 | |
| | | |
| | 9,500 | | | | | Walmart, Inc. | | | 976,980 | |
| | | | | | | | | | |
| | | | | | | | | 7,108,591 | |
| | | | | | | | | | |
| | | | | | Energy (4.0%) | |
| | 12,600 | | | | | Marathon Petroleum Corp. | | | 766,962 | |
| | | |
| | 6,220 | | | | | Pioneer Natural Resources Company | | | 1,035,382 | |
| | | |
| | 35,250 | | | EUR | | Royal Dutch Shell, PLC - Class A | | | 1,121,688 | |
| | | |
| | 21,540 | | | | | Schlumberger, Ltd. | | | 919,327 | |
| | | | | | | | | | |
| | | | | | | | | 3,843,359 | |
| | | | | | | | | | |
| | | | | | Financials (13.9%) | |
| | 70,600 | | | HKD | | AIA Group, Ltd. | | | 722,904 | |
| | | |
| | 5,300 | | | | | AON, PLC | | | 954,742 | |
| | | |
| | 46,000 | | | | | Bank of America Corp. | | | 1,406,680 | |
| | | |
| | 11,000 | | | | | Cboe Global Markets, Inc. | | | 1,117,710 | |
| | | |
| | 12,100 | | | EUR | | Deutsche Böerse, AG | | | 1,616,830 | |
| | | |
| | 5,400 | | | | | Goldman Sachs Group, Inc. | | | 1,111,968 | |
| | | |
| | 54,520 | | | INR | | HDFC Bank, Ltd. | | | 1,812,374 | |
| | | |
| | 43,000 | | | | | Itau Unibanco Holding, SA | | | 371,950 | |
| | | |
| | 11,000 | | | GBP | | London Stock Exchange Group, PLC | | | 721,196 | |
| | | |
| | 35,500 | | | | | NMI Holdings, Inc. - Class A# | | | 996,840 | |
| | | |
| | 60,500 | | | HKD | | Ping An Insurance Group Company of China, Ltd. - Class H | | | 732,332 | |
| | | |
| | 12,500 | | | | | Progressive Corp. | | | 976,875 | |
| | | | | | | | | | |
NUMBER OF
SHARES | | | | | | | VALUE | |
| | | |
| | 13,600 | | | | | US Bancorp | | $ | 725,152 | |
| | | | | | | | | | |
| | | | | | | | | 13,267,553 | |
| | | | | | | | | | |
| | | | | | Health Care (14.3%) | |
| | 15,400 | | | GBP | | AstraZeneca, PLC | | | 1,147,297 | |
| | | |
| | 12,100 | | | CAD | | Canopy Growth Corp.#^ | | | 611,187 | |
| | | |
| | 13,800 | | | AUD | | CSL, Ltd. | | | 1,935,612 | |
| | | |
| | 8,500 | | | | | Edwards Lifesciences Corp.# | | | 1,496,595 | |
| | | |
| | 17,600 | | | JPY | | Hoya Corp. | | | 1,243,046 | |
| | | |
| | 6,700 | | | | | Inspire Medical Systems, Inc.# | | | 346,323 | |
| | | |
| | 2,350 | | | | | Intuitive Surgical, Inc.# | | | 1,199,980 | |
| | | |
| | 12,940 | | | | | Johnson & Johnson | | | 1,827,128 | |
| | | |
| | 10,900 | | | | | Laboratory Corp. of America Holdings# | | | 1,743,128 | |
| | | |
| | 3,900 | | | CHF | | Lonza Group, AG# | | | 1,204,434 | |
| | | |
| | 26,000 | | | | | Vericel Corp.#^ | | | 441,740 | |
| | | |
| | 23,000 | | | SEK | | Vitrolife, AB | | | 484,211 | |
| | | | | | | | | | |
| | | | | | | | | 13,680,681 | |
| | | | | | | | | | |
| | | | | | Industrials (7.9%) | |
| | 2,200 | | | | | Boeing Company | | | 830,918 | |
| | | |
| | 15,450 | | | | | CSX Corp. | | | 1,230,283 | |
| | | |
| | 7,000 | | | JPY | | FANUC Corp.^ | | | 1,315,128 | |
| | | |
| | 33,000 | | | GBP | | HomeServe, PLC | | | 467,717 | |
| | | |
| | 26,900 | | | JPY | | Komatsu, Ltd. | | | 694,838 | |
| | | |
| | 63,000 | | | BRL | | Localiza Rent a Car, SA | | | 581,622 | |
| | | |
| | 5,250 | | | | | Raytheon Company | | | 932,347 | |
| | | |
| | 162,000 | | | TWD | | Rexon Industrial Corp, Ltd. | | | 376,016 | |
| | | |
| | 238,756 | | | CNY | | Sany Heavy Industry Company, Ltd. - Class A | | | 434,699 | |
| | | |
| | 8,200 | | | EUR | | Schneider Electric, SE | | | 694,015 | |
| | | | | | | | | | |
| | | | | | | | | 7,557,583 | |
| | | | | | | | | | |
| | | | | | Information Technology (17.7%) | |
| | 6,170 | | | | | Accenture, PLC - Class A | | | 1,127,074 | |
| | | |
| | 600 | | | EUR | | Adyen, NV#* | | | 488,999 | |
| | | |
| | 8,798 | | | | | Apple, Inc. | | | 1,765,495 | |
| | | |
| | 4,030 | | | EUR | | ASML Holding, NV | | | 841,507 | |
| | | |
| | 6,500 | | | | | Atlassian Corp., PLC - Class A# | | | 715,975 | |
| | | |
| | 1,090 | | | CAD | | Constellation Software, Inc. | | | 961,750 | |
| | | |
| | 14,500 | | | | | CyberArk Software, Ltd.# | | | 1,869,485 | |
| | | |
| | 6,300 | | | | | Keysight Technologies, Inc.# | | | 548,289 | |
| | | |
| | 153,000 | | | SEK | | LM Ericsson Telephone Company - Class B | | | 1,513,503 | |
| | | |
| | 8,610 | | | | | MasterCard, Inc. - Class A | | | 2,189,006 | |
| | | |
| | 3,220 | | | | | NVIDIA Corp. | | | 582,820 | |
| | | |
| | 9,300 | | | | | PayPal Holdings, Inc.# | | | 1,048,761 | |
| | | |
| | 13,500 | | | | | Rapid7, Inc.# | | | 733,590 | |
| | | |
| | 5,400 | | | EUR | | SOITEC# | | | 546,934 | |
| | | |
| | 6,400 | | | | | Splunk, Inc.# | | | 883,456 | |
| | | | |
| 126 | | CALAMOS OPEN-END FAMILY OF FUNDS SEMIANNUAL REPORT | | See accompanying Notes to Schedule of Investments |
Global Equity Fund Schedule of Investments April 30, 2019 (Unaudited)
| | | | | | | | | | |
NUMBER OF
SHARES | | | | | | | VALUE | |
| | | |
| | 124,000 | | | TWD | | Taiwan Semiconductor Manufacturing Company, Ltd. | | $ | 1,041,108 | |
| | | | | | | | | | |
| | | | | | | | | 16,857,752 | |
| | | | | | | | | | |
| | | |
| | | | | | TOTAL COMMON STOCKS
(Cost $69,951,894) | | | 91,818,047 | |
| | | | | | | | | | |
| | | | | | | | | | |
NUMBER OF
CONTRACTS/
NOTIONAL
AMOUNT | | | | | | | VALUE | |
|
| | PURCHASED OPTION (0.0%)# | |
| | | | | | Information Technology (0.0%) | |
| 100
1,289,300 |
| | | | CyberArk Software, Ltd.
Put, 05/17/19, Strike $120.00
(Cost $49,122) | | | 30,000 | |
| | | | | | | | | | |
| | | | | | | | | | |
NUMBER OF
SHARES | | | | | | | VALUE | |
|
| | SHORT TERM INVESTMENTS (5.3%) | |
| | 2,528,431 | | | | | Fidelity Prime Money Market Fund - Institutional Class, 2.500%*** | | | 2,529,189 | |
| | | |
| | 2,525,488 | | | | | Morgan Stanley Institutional Liquidity Funds - Government Portfolio, 2.350%*** | | | 2,525,488 | |
| | | | | | | | | | |
| | | |
| | | | | | TOTAL SHORT TERM INVESTMENTS
(Cost $5,054,677) | | | 5,054,677 | |
| | | | | | | | | | |
| | | | | | | | | | |
NUMBER OF
SHARES/
PRINCIPAL
AMOUNT | | | | | | | VALUE | |
|
| INVESTMENT OF CASH COLLATERAL FOR SECURITIES
LOANED (2.1%) |
|
| | 1,987,759 | | | | | State Street Navigator Securities Lending Government Money Market Portfolio†
(Cost $1,987,759) | | | 1,987,759 | |
| | | | | | | | | | |
| |
| TOTAL INVESTMENTS (103.7%)
(Cost $77,043,452) | | | 98,890,483 | |
| | | | | | | | | | |
| |
| | PAYABLE UPON RETURN OF SECURITIES ONLOAN (-2.1%) | | | (1,987,759 | ) |
| | | | | |
| |
| | LIABILITIES, LESS OTHER ASSETS(-1.6%) | | | (1,515,790 | ) |
| | | | | | | | | | |
| |
| | NET ASSETS (100.0%) | | $ | 95,386,934 | |
| | | | | | | | | | |
NOTES TO SCHEDULE OF INVESTMENTS
| # | Non-income producing security. |
| ^ | Security, or portion of security, is on loan. |
| * | Securities issued and sold pursuant to a Rule 144A transaction are excepted from the registration requirement of the Securities Act of 1933, as amended. These securities may only be sold to qualified institutional buyers (“QIBs”), such as the Fund. Any resale of these securities must generally be effected through a sale that is registered under the Act or otherwise exempted from such registration requirements. |
| *** | The rate disclosed is the 7 day net yield as of April 30, 2019. |
| † | Represents investment of cash collateral received from securities on loan as of April 30, 2019. |
FOREIGN CURRENCY ABBREVIATIONS
| | |
| |
| AUD | | Australian Dollar |
| |
| BRL | | Brazilian Real |
| |
| CAD | | Canadian Dollar |
| |
| CHF | | Swiss Franc |
| |
| CNY | | Chinese Yuan Renminbi |
| |
| EUR | | European Monetary Unit |
| |
| GBP | | British Pound Sterling |
| |
| HKD | | Hong Kong Dollar |
| |
| INR | | Indian Rupee |
| |
| JPY | | Japanese Yen |
| |
| SEK | | Swedish Krona |
| |
| TWD | | New Taiwan Dollar |
Note: Value for securities denominated in foreign currencies is shown in U.S. dollars. The date on options represents the expiration date of the option contract. The option contract may be exercised at any date on or before the date shown.
CURRENCY EXPOSURE
APRIL 30, 2019
| | | | | | | | |
| | | VALUE | | | % OF TOTAL
INVESTMENTS | |
| | |
| US Dollar | | $ | 60,588,295 | | | | 61.3% | |
| European Monetary Unit | | | 7,450,202 | | | | 7.5% | |
| | |
| Hong Kong Dollar | | | 6,667,569 | | | | 6.8% | |
| Japanese Yen | | | 4,975,090 | | | | 5.0% | |
| | |
| British Pound Sterling | | | 4,038,898 | | | | 4.1% | |
| Canadian Dollar | | | 3,489,168 | | | | 3.5% | |
| | |
| Swedish Krona | | | 3,124,060 | | | | 3.2% | |
| Australian Dollar | | | 1,935,612 | | | | 2.0% | |
| | |
| Indian Rupee | | | 1,812,374 | | | | 1.8% | |
| Chinese Yuan Renminbi | | | 1,606,035 | | | | 1.6% | |
| | |
| New Taiwan Dollar | | | 1,417,124 | | | | 1.4% | |
| Swiss Franc | | | 1,204,434 | | | | 1.2% | |
| | |
| Brazilian Real | | | 581,622 | | | | 0.6% | |
| Total Investments | | $ | 98,890,483 | | | | 100.0% | |
Currency exposure may vary over time.
| | | | | | |
| See accompanying Notes to Financial Statements | | www.calamos.com | | | 127 | |
Global Growth and Income Fund Schedule of Investments April 30, 2019 (Unaudited)
| | | | | | | | | | |
PRINCIPAL
AMOUNT | | | | | | | VALUE | |
|
| | CONVERTIBLE BONDS (28.9%) | |
| | | | | | Communication Services (1.8%) | |
| | 1,920,000 | | | | | GCI Liberty, Inc.*
1.750%, 09/30/46 | | $ | 2,170,003 | |
| | | |
| | 850,000 | | | | | Twitter, Inc.*
0.250%, 06/15/24 | | | 857,531 | |
| | | | | | | | | | |
| | | | | | | | | 3,027,534 | |
| | | | | | | | | | |
| | | | | | Consumer Discretionary (1.7%) | |
| | 835,000 | | | | | Baozun, Inc.*
1.625%, 05/01/24 | | | 940,218 | |
| | | |
| | 735,000 | | | | | GOL Equity Finance, SA*
3.750%, 07/15/24 | | | 651,210 | |
| | | |
| | 1,545,000 | | | | | NIO, Inc.*
4.500%, 02/01/24 | | | 1,187,719 | |
| | | | | | | | | | |
| | | | | | | | | 2,779,147 | |
| | | | | | | | | | |
| | | | | | Energy (4.1%) | |
| | 3,800,000 | | | | | TOTAL, SA
0.500%, 12/02/22 | | | 4,048,254 | |
| | | |
| | 2,400,000 | | | | | Tullow Oil Jersey, Ltd.
6.625%, 07/12/21 | | | 2,883,372 | |
| | | | | | | | | | |
| | | | | | | | | 6,931,626 | |
| | | | | | | | | | |
| | | | | | Financials (6.8%) | |
| | 1,100,000 | | | EUR | | AURELIUS Equity Opportunities SE & Co., KGaA
1.000%, 12/01/20 | | | 1,311,062 | |
| | | |
| | | | | | JPMorgan Chase Bank, N.A. | | | | |
| | 17,000,000 | | | HKD | | 0.000%, 10/29/20* | | | 2,663,076 | |
| | 4,700,000 | | | | | 0.000%, 12/30/20 | | | 5,521,513 | |
| | | |
| | 220,000,000 | | | JPY | | Mitsubishi Chemical Holdings Corp.
0.000%, 03/29/24 | | | 1,989,905 | |
| | | | | | | | | | |
| | | | | | | | | 11,485,556 | |
| | | | | | | | | | |
| | | | | | Health Care (2.9%) | |
| | 1,800,000 | | | EUR | | Bayer Capital Corp., BV
5.625%, 11/22/19 | | | 1,542,829 | |
| | | |
| | 1,326,000 | | | CAD | | Canopy Growth Corp.*
4.250%, 07/15/23 | | | 1,532,912 | |
| | | |
| | 885,000 | | | | | DexCom, Inc.*
0.750%, 12/01/23 | | | 923,715 | |
| | | |
| | 840,000 | | | | | Wright Medical Group, Inc.
2.000%, 02/15/20 | | | 912,097 | |
| | | | | | | | | | |
| | | | | | | | | 4,911,553 | |
| | | | | | | | | | |
| | | | | | Industrials (1.4%) | |
| | 5,000,000 | | | CNY | | China Railway Construction Corp., Ltd.
1.500%, 12/21/21 | | | 732,603 | |
| | | |
| | 1,250,000 | | | | | Echo Global Logistics, Inc.
2.500%, 05/01/20 | | | 1,234,606 | |
| | | |
| | 400,000 | | | | | Vinci, SA
0.375%, 02/16/22 | | | 454,756 | |
| | | | | | | | | | |
| | | | | | | | | 2,421,965 | |
| | | | | | | | | | |
| | | | | | | | | | |
PRINCIPAL
AMOUNT | | | | | | | VALUE | |
| | | | | | | | | | |
| | | | | | Information Technology (8.2%) | |
| | 1,035,000 | | | | | DocuSign, Inc.*
0.500%, 09/15/23 | | $ | 1,113,023 | |
| | | |
| | 1,000,000 | | | | | Envestnet, Inc.
1.750%, 12/15/19 | | | 1,176,610 | |
| | | |
| | 780,000 | | | | | Lenovo Group, Ltd.
3.375%, 01/24/24 | | | 915,088 | |
| | | |
| | 2,945,000 | | | | | Palo Alto Networks, Inc.*
0.750%, 07/01/23 | | | 3,338,776 | |
| | | |
| | 1,360,000 | | | EUR | | SOITEC
0.000%, 06/28/23 | | | 1,779,520 | |
| | | |
| | 2,045,000 | | | | | Splunk, Inc.*
0.500%, 09/15/23 | | | 2,326,699 | |
| | | |
| | 700,000 | | | | | Workday, Inc.
0.250%, 10/01/22 | | | 1,039,350 | |
| | | |
| | 2,050,000 | | | | | Xero Investments, Ltd.
2.375%, 10/04/23 | | | 2,134,060 | |
| | | | | | | | | | |
| | | | | | | | | 13,823,126 | |
| | | | | | | | | | |
| | | | | | Materials (1.5%) | |
| | 1,560,000 | | | | | Cemex, SAB de CV
3.720%, 03/15/20 | | | 1,553,081 | |
| | | |
| | 1,000,000 | | | | | Glencore Funding, LLC
0.000%, 03/27/25 | | | 916,780 | |
| | | | | | | | | | |
| | | | | | | | | 2,469,861 | |
| | | | | | | | | | |
| | | | | | Real Estate (0.5%) | |
| | 747,000 | | | | | IH Merger Sub, LLC
3.500%, 01/15/22 | | | 867,622 | |
| | | | | | | | | | |
| | | |
| | | | | | TOTAL CONVERTIBLE BONDS
(Cost $48,559,620) | | | 48,717,990 | |
| | | | | | | | | | |
| | | | | | | | | | |
|
| | SYNTHETIC CONVERTIBLE SECURITIES (7.0%)¤ | |
| | Corporate Bond (0.6%) | |
| | | | | | Information Technology (0.6%) | |
| | 1,080,000 | | | | | Apple, Inc.
2.000%, 11/13/20 | | | 1,072,618 | |
| | | | | | | | | | |
| | U.S. Government and Agency Securities (6.3%) | |
| | | | | | United States Treasury Note | |
| | 2,205,000 | | | | | 1.875%, 05/31/22 | | | 2,181,224 | |
| | | |
| | 2,200,000 | | | | | 1.875%, 10/31/22 | | | 2,172,595 | |
| | | |
| | 2,125,000 | | | | | 1.750%, 10/31/20 | | | 2,107,559 | |
| | | |
| | 2,095,000 | | | | | 2.625%, 08/15/20^ | | | 2,102,581 | |
| | | |
| | 2,080,000 | | | | | 2.625%, 11/15/20 | | | 2,089,528 | |
| | | | | | | | | | |
| | | |
| | | | | | TOTAL U.S. GOVERNMENT AND AGENCY SECURITIES | | | 10,653,487 | |
| | | | | | | | | | |
| | | | |
| 128 | | CALAMOS OPEN-END FAMILY OF FUNDS SEMIANNUAL REPORT | | See accompanying Notes to Schedule of Investments |
Global Growth and Income Fund Schedule of Investments April 30, 2019 (Unaudited)
| | | | | | | | | | |
NUMBER OF
CONTRACTS/
NOTIONAL
AMOUNT | | | | | | | VALUE | |
| | Purchased Option (0.1%) # | |
| | | | | | Consumer Discretionary (0.1%) | |
| 8
1,483,992 |
| | | | Booking Holdings, Inc.
Call, 01/17/20, Strike $1,920.00 | | $ | 116,440 | |
| | | | | | | | | | |
| | | |
| | | | | | TOTAL SYNTHETIC CONVERTIBLE SECURITIES
(Cost $12,021,316) | | | 11,842,545 | |
| | | | | | | | | | |
| | | | | | | | | | |
NUMBER OF
SHARES | | | | | | | VALUE | |
|
| | CONVERTIBLE PREFERRED STOCKS (7.7%) | |
| | | | | | Communication Services (3.1%) | |
| | 24,900 | | | | | Alibaba Exchangeable (Softbank)*§
5.750%, 06/01/19 | | | 5,168,717 | |
| | | | | | | | | | |
| | | | | | Health Care (0.5%) | |
| | 835 | | | | | Danaher Corp.
4.750%, 04/15/22 | | | 879,673 | |
| | | | | | | | | | |
| | | | | | Real Estate (1.1%) | |
| | 1,580 | | | | | Crown Castle International Corp.
6.875%, 08/01/20 | | | 1,823,304 | |
| | | | | | | | | | |
| | | | | | Utilities (3.0%) | |
| | 16,600 | | | | | American Electric Power Company, Inc.
6.125%, 03/15/22 | | | 862,868 | |
| | | |
| | 37,800 | | | | | DTE Energy Company
6.500%, 10/01/19 | | | 2,109,618 | |
| | | |
| | 33,600 | | | | | NextEra Energy, Inc.
6.123%, 09/01/19 | | | 2,096,640 | |
| | | | | | | | | | |
| | | | | | | | | 5,069,126 | |
| | | | | | | | | | |
| | | |
| | | | | | TOTAL CONVERTIBLE PREFERRED STOCKS
(Cost $9,804,895) | | | 12,940,820 | |
| | | | | | | | | | |
| | | | | | | | | | |
|
| | COMMON STOCKS (53.7%) | |
| | | | | | Communication Services (9.5%) | |
| | 2,250 | | | | | Alphabet, Inc. - Class A# | | | 2,697,660 | |
| | | |
| | 5,800 | | | JPY | | Nintendo Company, Ltd. | | | 1,997,610 | |
| | | |
| | 74,800 | | | HKD | | Tencent Holdings, Ltd. | | | 3,686,716 | |
| | | |
| | 24,600 | | | | | Verizon Communications, Inc. | | | 1,406,874 | |
| | | |
| | 45,900 | | | | | Walt Disney Company | | | 6,286,923 | |
| | | | | | | | | | |
| | | | | | | | | 16,075,783 | |
| | | | | | | | | | |
| | | | | | Consumer Discretionary (5.7%) | |
| | 530 | | | | | Amazon.com, Inc.# | | | 1,021,056 | |
| | | |
| | 16,200 | | | | | Aptiv, PLC | | | 1,388,340 | |
| | | |
| | 57,100 | | | GBP | | Compass Group, PLC | | | 1,299,245 | |
| | | |
| | 16,100 | | | EUR | | Daimler, AG | | | 1,056,739 | |
| | | |
| | 14,300 | | | | | Lowe’s Companies, Inc. | | | 1,617,902 | |
| | | |
| | 7,400 | | | | | Lululemon Athletica, Inc.# | | | 1,304,990 | |
| | | | | | | | | | |
NUMBER OF
SHARES | | | | | | | VALUE | |
| | | |
| | 3,200 | | | EUR | | Puma, SE | | $ | 1,979,401 | |
| | | | | | | | | | |
| | | | | | | | | 9,667,673 | |
| | | | | | | | | | |
| | | | | | Consumer Staples (8.9%) | |
| | 36,800 | | | CAD | | Alimentation Couche-Tard, Inc. - Class B | | | 2,169,763 | |
| | | |
| | 32,800 | | | | | Coca-Cola Company | | | 1,609,168 | |
| | | |
| | 14,000 | | | EUR | | Danone, SA | | | 1,132,286 | |
| | | |
| | 30,900 | | | GBP | | Diageo, PLC | | | 1,302,674 | |
| | | |
| | 16,000 | | | EUR | | Kerry Group, PLC - Class A | | | 1,787,620 | |
| | | |
| | 26,700 | | | CHF | | Nestlé, SA | | | 2,570,612 | |
| | | |
| | 10,500 | | | | | Philip Morris International, Inc. | | | 908,880 | |
| | | |
| | 14,983 | | | EUR | | Unilever, NV | | | 906,540 | |
| | | |
| | 26,000 | | | | | Walmart, Inc. | | | 2,673,840 | |
| | | | | | | | | | |
| | | | | | | | | 15,061,383 | |
| | | | | | | | | | |
| | | | | | Energy (4.9%) | |
| | 12,800 | | | | | Chevron Corp. | | | 1,536,768 | |
| | | |
| | 24,500 | | | | | Exxon Mobil Corp. | | | 1,966,860 | |
| | | |
| | 18,400 | | | | | Marathon Petroleum Corp. | | | 1,120,008 | |
| | | |
| | 55,000 | | | EUR | | Royal Dutch Shell, PLC - Class A | | | 1,750,152 | |
| | | |
| | 42,800 | | | | | Schlumberger, Ltd. | | | 1,826,704 | |
| | | | | | | | | | |
| | | | | | | | | 8,200,492 | |
| | | | | | | | | | |
| | | | | | Financials (8.7%) | |
| | 127,000 | | | HKD | | AIA Group, Ltd. | | | 1,300,408 | |
| | | |
| | 117,200 | | | | | Bank of America Corp. | | | 3,583,976 | |
| | | |
| | 10,500 | | | | | Cboe Global Markets, Inc. | | | 1,066,905 | |
| | | |
| | 15,850 | | | EUR | | Deutsche Böerse, AG | | | 2,117,914 | |
| | | |
| | 8,600 | | | | | Goldman Sachs Group, Inc. | | | 1,770,912 | |
| | | |
| | 75,100 | | | INR | | HDFC Bank, Ltd. | | | 2,496,502 | |
| | | |
| | 80,400 | | | | | Itau Unibanco Holding, SA | | | 695,460 | |
| | | |
| | 32,300 | | | | | US Bancorp | | | 1,722,236 | |
| | | | | | | | | | |
| | | | | | | | | 14,754,313 | |
| | | | | | | | | | |
| | | | | | Health Care (7.1%) | |
| | 21,400 | | | GBP | | AstraZeneca, PLC | | | 1,594,296 | |
| | | |
| | 12,600 | | | AUD | | CSL, Ltd. | | | 1,767,298 | |
| | | |
| | 8,800 | | | | | Edwards Lifesciences Corp.# | | | 1,549,416 | |
| | | |
| | 1,800 | | | | | Intuitive Surgical, Inc.# | | | 919,134 | |
| | | |
| | 27,400 | | | | | Johnson & Johnson | | | 3,868,880 | |
| | | |
| | 14,000 | | | | | Laboratory Corp. of America Holdings# | | | 2,238,880 | |
| | | | | | | | | | |
| | | | | | | | | 11,937,904 | |
| | | | | | | | | | |
| | | | | | Industrials (1.8%) | |
| | 14,700 | | | | | Delta Air Lines, Inc. | | | 856,863 | |
| | | |
| | 11,500 | | | JPY | | FANUC Corp. | | | 2,160,567 | |
| | | | | | | | | | |
| | | | | | | | | 3,017,430 | |
| | | | | | | | | | |
| | | | | | Information Technology (7.1%) | |
| | 10,800 | | | | | Apple, Inc. | | | 2,167,236 | |
| | | |
| | 5,025 | | | EUR | | ASML Holding, NV | | | 1,049,274 | |
| | | | | | |
| See accompanying Notes to Schedule of Investments | | www.calamos.com | | | 129 | |
Global Growth and Income Fund Schedule of Investments April 30, 2019 (Unaudited)
| | | | | | | | | | |
NUMBER OF
SHARES | | | | | | | VALUE | |
| | | |
| | 194,800 | | | SEK | | LM Ericsson Telephone Company - Class B | | $ | 1,926,995 | |
| | | |
| | 7,700 | | | | | MasterCard, Inc. - Class A | | | 1,957,648 | |
| | | |
| | 17,800 | | | | | Microsoft Corp. | | | 2,324,680 | |
| | | |
| | 9,100 | | | | | PayPal Holdings, Inc.# | | | 1,026,207 | |
| | | |
| | 174,000 | | | TWD | | Taiwan Semiconductor Manufacturing Company, Ltd. | | | 1,460,909 | |
| | | | | | | | | | |
| | | | | | | | | 11,912,949 | |
| | | | | | | | | | |
| | | |
| | | | | | TOTAL COMMON STOCKS
(Cost $73,641,088) | | | 90,627,927 | |
| | | | | | | | | | |
| | | | | | | | | | |
NUMBER OF
CONTRACTS/
NOTIONAL
AMOUNT | | | | | | | VALUE | |
|
| | PURCHASED OPTIONS (0.1%)# | |
| | | | | | Other (0.1%) | |
| | | | | | Invesco QQQ Trust Series | | | | |
| | | |
| 950
18,006,300 |
| | | | Put, 05/17/19, Strike $178.00 | | | 27,550 | |
| | | |
| 440
8,339,760 |
| | | | Put, 07/19/19, Strike $187.00 | | | 187,440 | |
| | | | | | | | | | |
| | | |
| | | | | | TOTAL PURCHASED OPTIONS
(Cost $589,403) | | | 214,990 | |
| | | | | | | | | | |
| | | | | | | | | | |
NUMBER OF
SHARES | | | | | | | VALUE | |
|
| | SHORT TERM INVESTMENTS (3.1%) | |
| | 2,578,200 | | | | | Fidelity Prime Money Market Fund - Institutional Class, 2.500%*** | | | 2,578,973 | |
| | | |
| | 2,577,640 | | | | | Morgan Stanley Institutional Liquidity Funds - Government Portfolio, 2.350%*** | | | 2,577,640 | |
| | | | | | | | | | |
| | | |
| | | | | | TOTAL SHORT TERM INVESTMENTS
(Cost $5,156,613) | | | 5,156,613 | |
| | | | | | | | | | |
| | | | | | | | | | |
| | | | | | | | | | |
NUMBER OF
SHARES/
PRINCIPAL
AMOUNT | | | | | | | VALUE | |
|
| INVESTMENT OF CASH COLLATERAL FOR SECURITIES
LOANED (0.3%) |
|
| | | |
| | 442,808 | | | | | State Street Navigator Securities Lending Government Money Market Portfolio† (Cost $442,808) | | $ | 442,808 | |
| | | | | | | | | | |
| |
| TOTAL INVESTMENTS (100.8%)
(Cost $150,215,743) | | | 169,943,693 | |
| | | | | | | | | | |
| |
| | PAYABLE UPON RETURN OF SECURITIES ONLOAN (-0.3%) | | | (442,808 | ) |
| | | | | | | | | | |
| |
| | LIABILITIES, LESS OTHER ASSETS(-0.5%) | | | (833,312 | ) |
| | | | | | | | | | |
| |
| | NET ASSETS (100.0%) | | $ | 168,667,573 | |
| | | | | | | | | | |
NOTES TO SCHEDULE OF INVESTMENTS
| * | Securities issued and sold pursuant to a Rule 144A transaction are excepted from the registration requirement of the Securities Act of 1933, as amended. These securities may only be sold to qualified institutional buyers (“QIBs”), such as the Fund. Any resale of these securities must generally be effected through a sale that is registered under the Act or otherwise exempted from such registration requirements. |
| ¤ | The synthetic convertible securities strategy combines separate securities that together possess the economic characteristics similar to a convertible security. |
| ^ | Security, or portion of security, is on loan. |
| # | Non-income producing security. |
| § | Securities exchangeable or convertible into securities of one or more entities that are different than the issuer. Each entity is identified in the parenthetical. |
| *** | The rate disclosed is the 7 day net yield as of April 30, 2019. |
| † | Represents investment of cash collateral received from securities on loan as of April 30, 2019. |
| | | | |
| 130 | | CALAMOS OPEN-END FAMILY OF FUNDS SEMIANNUAL REPORT | | See accompanying Notes to Financial Statements |
Global Growth and Income Fund Schedule of Investments April 30, 2019 (Unaudited)
FOREIGN CURRENCY ABBREVIATIONS
| | |
| |
| AUD | | Australian Dollar |
| |
| CAD | | Canadian Dollar |
| |
| CHF | | Swiss Franc |
| |
| CNY | | Chinese Yuan Renminbi |
| |
| EUR | | European Monetary Unit |
| |
| GBP | | British Pound Sterling |
| |
| HKD | | Hong Kong Dollar |
| |
| INR | | Indian Rupee |
| |
| JPY | | Japanese Yen |
| |
| SEK | | Swedish Krona |
| |
| TWD | | New Taiwan Dollar |
Note: Value for securities denominated in foreign currencies is shown in U.S. dollars. The principal amount for such securities is shown in the respective foreign currency. The date on options represents the expiration date of the option contract. The option contract may be exercised at any date on or before the date shown.
CURRENCY EXPOSURE
APRIL 30, 2019
| | | | | | | | |
| | | VALUE | | | % OF TOTAL
INVESTMENTS | |
| | |
| US Dollar | | $ | 120,878,265 | | | | 71.1% | |
| European Monetary Unit | | | 16,413,337 | | | | 9.7% | |
| | |
| Hong Kong Dollar | | | 7,650,200 | | | | 4.5% | |
| Japanese Yen | | | 6,148,082 | | | | 3.6% | |
| | |
| British Pound Sterling | | | 4,196,215 | | | | 2.5% | |
| Canadian Dollar | | | 3,702,675 | | | | 2.2% | |
| | |
| Swiss Franc | | | 2,570,612 | | | | 1.5% | |
| Indian Rupee | | | 2,496,502 | | | | 1.5% | |
| | |
| Swedish Krona | | | 1,926,995 | | | | 1.1% | |
| Australian Dollar | | | 1,767,298 | | | | 1.0% | |
| | |
| New Taiwan Dollar | | | 1,460,909 | | | | 0.9% | |
| Chinese Yuan Renminbi | | | 732,603 | | | | 0.4% | |
| | |
| Total Investments | | $ | 169,943,693 | | | | 100.0% | |
Currency exposure may vary over time.
| | | | | | |
| See accompanying Notes to Financial Statements | | www.calamos.com | | | 131 | |
Total Return Bond Fund Schedule of Investments April 30, 2019 (Unaudited)
| | | | | | | | | | |
PRINCIPAL
AMOUNT | | | | | | | VALUE | |
|
| | CORPORATE BONDS (49.1%) | |
| | | | | | Airlines (0.2%) | | | | |
| | 110,346 | | | | | UAL Pass Through TrustSeries 2007-1
6.636%, 01/02/24 | | $ | 116,421 | |
| | | | | | | | | | |
| | | | | | Communication Services (3.9%) | | | | |
| | 250,000 | | | | | Comcast Corp.
3.900%, 03/01/38 | | | 248,786 | |
| | | |
| | 110,000 | | | | | Crown Castle Towers, LLC*
3.720%, 07/15/43 | | | 111,667 | |
| | | |
| | 200,000 | | | | | CSC Holdings, LLC*
5.500%, 05/15/26 | | | 205,967 | |
| | | |
| | 300,000 | | | | | Electronic Arts, Inc.
4.800%, 03/01/26 | | | 322,566 | |
| | | |
| | 150,000 | | | | | Embarq Corp.
7.995%, 06/01/36 | | | 148,125 | |
| | | |
| | 150,000 | | | | | Fox Corp.*
3.666%, 01/25/22 | | | 153,194 | |
| | | |
| | 110,000 | | | | | Hughes Satellite Systems Corp.
5.250%, 08/01/26 | | | 110,747 | |
| | | |
| | 125,000 | | | | | Inmarsat Finance, PLC*
4.875%, 05/15/22 | | | 126,408 | |
| | | |
| | 125,000 | | | | | T-Mobile USA, Inc.^
4.000%, 04/15/22 | | | 127,092 | |
| | | |
| | 135,000 | | | | | United States Cellular Corp.
6.700%, 12/15/33 | | | 143,916 | |
| | | |
| | 255,000 | | | | | Verizon Communications, Inc.*
4.016%, 12/03/29 | | | 266,392 | |
| | | | | | | | | | |
| | | | | | | | | 1,964,860 | |
| | | | | | | | | | |
| | | | | | Consumer Discretionary (7.2%) | | | | |
| | 200,000 | | | | | Allergan Funding SCS
3.800%, 03/15/25 | | | 202,109 | |
| | | |
| | 250,000 | | | | | BMW US Capital, LLC*
3.100%, 04/12/21 | | | 251,891 | |
| | | |
| | 275,000 | | | | | Cargill, Inc.*
3.250%, 03/01/23 | | | 279,212 | |
| | | |
| | 150,000 | | | | | CCO Holdings, LLC / CCO Holdings Capital Corp.*^
5.750%, 02/15/26 | | | 157,121 | |
| | | |
| | 250,000 | | | | | D.R. Horton, Inc.
4.750%, 02/15/23 | | | 260,527 | |
| | | |
| | 130,000 | | | | | Delta Air Lines Pass Through TrustSeries 2019-1, Class AA
3.204%, 10/25/25 | | | 131,593 | |
| | | |
| | 150,000 | | | | | DISH DBS Corp.^
7.750%, 07/01/26 | | | 134,473 | |
| | | |
| | 250,000 | | | | | Expedia Group, Inc.
5.950%, 08/15/20 | | | 260,006 | |
| | | |
| | 250,000 | | | | | Ford Motor Credit Company, LLC
5.875%, 08/02/21 | | | 261,799 | |
| | | |
| | 250,000 | | | | | General Motors Financial Company, Inc.
3.700%, 05/09/23 | | | 251,638 | |
| | | |
| | 250,000 | | | | | Harley-Davidson Financial Services, Inc.*
4.050%, 02/04/22 | | | 255,739 | |
| | | | | | | | | | |
PRINCIPAL
AMOUNT | | | | | | | VALUE | |
| | | |
| | 250,000 | | | | | Hasbro, Inc.
3.150%, 05/15/21 | | $ | 251,125 | |
| | | |
| | 125,000 | | | | | International Game Technology, PLC*
6.250%, 02/15/22 | | | 131,103 | |
| | | |
| | 150,000 | | | | | Lennar Corp.
4.750%, 11/15/22 | | | 154,085 | |
| | | |
| | 100,000 | | | | | Mattel, Inc.*
6.750%, 12/31/25 | | | 100,291 | |
| | | |
| | 125,000 | | | | | Penske Automotive Group, Inc.
3.750%, 08/15/20 | | | 125,544 | |
| | | |
| | 174,847 | | | | | US Airways Pass Through TrustSeries 2012-2, Class B
6.750%, 12/03/22 | | | 183,754 | |
| | | |
| | 250,000 | | | | | Warner Media, LLC
3.600%, 07/15/25 | | | 253,120 | |
| | | | | | | | | | |
| | | | | | | | | 3,645,130 | |
| | | | | | | | | | |
| | | | | | Consumer Staples (2.7%) | | | | |
| | 200,000 | | | | | Brown-Forman Corp.
3.500%, 04/15/25 | | | 206,301 | |
| | | |
| | 250,000 | | | | | Conagra Brands, Inc.
3.800%, 10/22/21 | | | 254,967 | |
| | | |
| | 250,000 | | | | | General Mills, Inc.
2.600%, 10/12/22 | | | 247,494 | |
| | | |
| | 150,000 | | | | | Land O’Lakes, Inc.*
6.000%, 11/15/22 | | | 154,865 | |
| | | |
| | 250,000 | | | | | Mondelez International Holdings Netherlands, BV*
2.000%, 10/28/21 | | | 244,336 | |
| | | |
| | 250,000 | | | | | WM Wrigley Jr. Company*
3.375%, 10/21/20 | | | 252,221 | |
| | | | | | | | | | |
| | | | | | | | | 1,360,184 | |
| | | | | | | | | | |
| | | | | | Energy (1.9%) | | | | |
| | 200,000 | | | | | Buckeye Partners, LP‡
6.375%, 01/22/78
3 mo. USD LIBOR + 4.02% | | | 184,905 | |
| | | |
| | 150,000 | | | | | Continental Resources, Inc.^
4.500%, 04/15/23 | | | 155,364 | |
| | | |
| | 175,000 | | | | | Energy Transfer Operating, LP‡
5.597%, 11/01/66
3 mo. USD LIBOR + 3.02% | | | 145,240 | |
| | | |
| | 125,000 | | | | | Enterprise Products Operating, LLC‡
4.875%, 08/16/77
3 mo. USD LIBOR + 2.99% | | | 119,604 | |
| | | |
| | 125,000 | | | | | Plains All American Pipeline, LP‡
6.125%, 11/15/22
3 mo. USD LIBOR + 4.11% | | | 120,281 | |
| | | |
| | 250,000 | | | | | Schlumberger Investment, SA*
3.300%, 09/14/21 | | | 252,915 | |
| | | | | | | | | | |
| | | | | | | | | 978,309 | |
| | | | | | | | | | |
| | | | | | Financials (14.3%) | | | | |
| | 100,000 | | | | | Ally Financial, Inc.
8.000%, 11/01/31 | | | 128,378 | |
| | | | |
| 132 | | CALAMOS OPEN-END FAMILY OF FUNDS SEMIANNUAL REPORT | | See accompanying Notes to Schedule of Investments |
Total Return Bond Fund Schedule of Investments April 30, 2019 (Unaudited)
| | | | | | | | | | |
PRINCIPAL
AMOUNT | | | | | | | VALUE | |
| | | |
| | 250,000 | | | | | American Express Company
3.000%, 10/30/24 | | $ | 250,059 | |
| | | |
| | 250,000 | | | | | American International Group, Inc.
3.750%, 07/10/25 | | | 252,910 | |
| | | |
| | 250,000 | | | | | Axis Specialty Finance, PLC^
4.000%, 12/06/27 | | | 249,022 | |
| | | |
| | 300,000 | | | | | Bank of America Corp.‡
3.366%, 01/23/26
3 mo. USD LIBOR + 0.81% | | | 300,541 | |
| | | |
| | 250,000 | | | | | Bank of Montreal
3.300%, 02/05/24 | | | 253,260 | |
| | | |
| | 300,000 | | | | | Bank of Nova Scotia^
2.450%, 09/19/22 | | | 298,672 | |
| | | |
| | 150,000 | | | | | Berkshire Hathaway Finance Corp.
4.250%, 01/15/49 | | | 157,247 | |
| | | |
| | 350,000 | | | | | Capital One Financial Corp.
3.200%, 01/30/23 | | | 351,491 | |
| | | |
| | 250,000 | | | | | CIT Group, Inc.
4.125%, 03/09/21 | | | 253,841 | |
| | | |
| | 150,000 | | | | | CNO Financial Group, Inc.
4.500%, 05/30/20 | | | 151,858 | |
| | | |
| | 350,000 | | | | | Discover Bank
3.450%, 07/27/26 | | | 341,595 | |
| | | |
| | 200,000 | | | | | Fifth Third Bancorp^
3.650%, 01/25/24 | | | 205,724 | |
| | | |
| | 250,000 | | | | | Franklin Resources, Inc.
2.850%, 03/30/25 | | | 248,899 | |
| | | |
| | 125,000 | | | | | Goldman Sachs Group, Inc.‡
3.814%, 04/23/29
3 mo. USD LIBOR + 1.16% | | | 124,436 | |
| | | |
| | 250,000 | | | | | ILFCE-Capital Trust II*‡
4.850%, 12/21/65
3 mo. USD LIBOR + 1.80% | | | 193,676 | |
| | | |
| | 300,000 | | | | | JPMorgan Chase & Company‡
3.220%, 03/01/25
3 mo. USD LIBOR + 1.16% | | | 300,346 | |
| | | |
| | 200,000 | | | | | Macquarie Group, Ltd.*‡
4.150%, 03/27/24
3 mo. USD LIBOR + 1.33% | | | 204,277 | |
| | | |
| | 250,000 | | | | | Markel Corp.^
3.500%, 11/01/27 | | | 239,574 | |
| | | |
| | 400,000 | | | | | MetLife, Inc.
6.400%, 12/15/66 | | | 442,738 | |
| | | |
| | 250,000 | | | | | Morgan Stanley
2.500%, 04/21/21 | | | 248,699 | |
| | | |
| | 100,000 | | | | | Oil Insurance, Ltd.*‡
5.574%, 06/30/19
3 mo. USD LIBOR + 2.98% | | | 97,332 | |
| | | |
| | 250,000 | | | | | RenaissanceRe Finance, Inc.
3.450%, 07/01/27 | | | 246,311 | |
| | | |
| | 100,000 | | | | | Starwood Property Trust, Inc.
4.750%, 03/15/25 | | | 100,436 | |
| | | |
| | 250,000 | | | | | Torchmark Corp.
4.550%, 09/15/28 | | | 266,109 | |
| | | | | | | | | | |
PRINCIPAL
AMOUNT | | | | | | | VALUE | |
| | | |
| | 170,000 | | | | | Toronto-Dominion Bank^
3.250%, 03/11/24 | | $ | 172,629 | |
| | | |
| | 200,000 | | | | | Travelers Companies, Inc.
4.050%, 03/07/48 | | | 205,686 | |
| | | |
| | 250,000 | | | | | US Bancorp
3.600%, 09/11/24 | | | 258,344 | |
| | | |
| | 350,000 | | | | | USAA Capital Corp.*
2.000%, 06/01/21 | | | 345,142 | |
| | | |
| | 250,000 | | | | | Ventas Realty, LP
4.000%, 03/01/28 | | | 253,747 | |
| | | |
| | 125,000 | | | | | Wells Fargo & Company^
4.400%, 06/14/46 | | | 125,738 | |
| | | | | | | | | | |
| | | | | | | | | 7,268,717 | |
| | | | | | | | | | |
| | | | | | Health Care (3.0%) | |
| | 250,000 | | | | | AbbVie, Inc.
2.850%, 05/14/23 | | | 247,685 | |
| | | |
| | 150,000 | | | | | CVS Health Corp.
4.780%, 03/25/38 | | | 146,286 | |
| | | |
| | 200,000 | | | | | Humana, Inc.
3.850%, 10/01/24 | | | 204,642 | |
| | | |
| | 250,000 | | | | | Johnson & Johnson
3.400%, 01/15/38 | | | 245,713 | |
| | | |
| | 200,000 | | | | | Magellan Health, Inc.
4.900%, 09/22/24 | | | 195,169 | |
| | | |
| | 250,000 | | | | | Teva Pharmaceutical Finance Netherlands III, BV
6.000%, 04/15/24 | | | 255,192 | |
| | | |
| | 200,000 | | | | | Thermo Fisher Scientific, Inc.
3.150%, 01/15/23 | | | 201,536 | |
| | | | | | | | | | |
| | | | | | | | | 1,496,223 | |
| | | | | | | | | | |
| | | | | | Industrials (3.2%) | |
| | 205,000 | | | | | Aircastle, Ltd.^
5.000%, 04/01/23 | | | 213,144 | |
| | | |
| | 200,000 | | | | | Delta Air Lines, Inc.
3.625%, 03/15/22 | | | 202,238 | |
| | | |
| | 91,654 | | | | | Hawaiian Airlines Pass Through Certificates Series2013-1, Class B
4.950%, 07/15/23 | | | 92,690 | |
| | | |
| | 200,000 | | | | | IHO Verwaltungs GmbH*
4.125%, 09/15/21
4.875% PIK rate | | | 201,502 | |
| | | |
| | 250,000 | | | | | Park Aerospace Holdings, Ltd.*
5.250%, 08/15/22 | | | 260,476 | |
| | | |
| | 200,000 | | | | | Rockwell Collins, Inc.^
2.800%, 03/15/22 | | | 199,539 | |
| | | |
| | 193,302 | | | | | United Airlines Pass Through TrustSeries 2018-1, Class B
4.600%, 09/01/27 | | | 196,491 | |
| | | |
| | 250,000 | | | | | Verisk Analytics, Inc.
4.125%, 09/12/22 | | | 259,808 | |
| | | | | | | | | | |
| | | | | | | | | 1,625,888 | |
| | | | | | | | | | |
| | | | | | |
| See accompanying Notes to Schedule of Investments | | www.calamos.com | | | 133 | |
Total Return Bond Fund Schedule of Investments April 30, 2019 (Unaudited)
| | | | | | | | | | |
PRINCIPAL
AMOUNT | | | | | | | VALUE | |
| | | | | | Information Technology (3.7%) | |
| | 200,000 | | | | | Alliance Data Systems Corp.*
5.875%, 11/01/21 | | $ | 204,803 | |
| | | |
| | 250,000 | | | | | Amphenol Corp.
4.000%, 02/01/22 | | | 257,143 | |
| | | |
| | 250,000 | | | | | Apple, Inc.
4.375%, 05/13/45 | | | 267,922 | |
| | | |
| | 200,000 | | | | | Dell International, LLC / EMC Corp.*
6.020%, 06/15/26 | | | 217,078 | |
| | | |
| | 250,000 | | | | | Fiserv, Inc.
3.500%, 10/01/22 | | | 254,771 | |
| | | |
| | 125,000 | | | | | Hewlett Packard Enterprise Company^
4.900%, 10/15/25 | | | 133,593 | |
| | | |
| | 250,000 | | | | | Microsoft Corp.
4.100%, 02/06/37 | | | 269,006 | |
| | | |
| | 250,000 | | | | | NXP, BV / NXP Funding, LLC*
4.125%, 06/01/21 | | | 255,085 | |
| | | | | | | | | | |
| | | | | | | | | 1,859,401 | |
| | | | | | | | | | |
| | | | | | Materials (1.3%) | |
| | 200,000 | | | | | Alcoa Nederland Holding, BV*
6.750%, 09/30/24 | | | 211,766 | |
| | | |
| | 175,000 | | | | | ArcelorMittal, SA
7.000%, 10/15/39 | | | 201,489 | |
| | | |
| | 250,000 | | | | | Georgia-Pacific, LLC*
3.600%, 03/01/25 | | | 256,882 | |
| | | | | | | | | | |
| | | | | | | | | 670,137 | |
| | | | | | | | | | |
| | | | | | Real Estate (3.6%) | |
| | 250,000 | | | | | American Tower Corp.
5.900%, 11/01/21 | | | 268,580 | |
| | | |
| | 250,000 | | | | | EPR Properties
4.950%, 04/15/28 | | | 262,148 | |
| | | |
| | 250,000 | | | | | HCP, Inc.
4.200%, 03/01/24 | | | 259,834 | |
| | | |
| | 300,000 | | | | | Hospitality Properties Trust
3.950%, 01/15/28 | | | 279,754 | |
| | | |
| | 150,000 | | | | | SL Green Operating Partnership, LP
3.250%, 10/15/22 | | | 150,030 | |
| | | |
| | 400,000 | | | | | Tanger Properties, LP^
3.875%, 07/15/27 | | | 387,218 | |
| | | |
| | 200,000 | | | | | UDR, Inc.
4.625%, 01/10/22 | | | 207,777 | |
| | | | | | | | | | |
| | | | | | | | | 1,815,341 | |
| | | | | | | | | | |
| | | | | | Utilities (4.1%) | |
| | 250,000 | | | | | AES Corp.
4.000%, 03/15/21 | | | 253,614 | |
| | | |
| | 250,000 | | | | | Alabama Power Company^
2.450%, 03/30/22 | | | 248,741 | |
| | | |
| | 150,000 | | | | | Berkshire Hathaway Energy Company^
3.800%, 07/15/48 | | | 143,813 | |
| | | |
| | 250,000 | | | | | CenterPoint Energy, Inc.
3.850%, 02/01/24 | | | 257,340 | |
| | | | | | | | | | |
PRINCIPAL
AMOUNT | | | | | | | VALUE | |
| | | |
| | 150,000 | | | | | Duke Energy Carolinas, LLC
3.700%, 12/01/47 | | $ | 145,402 | |
| | | |
| | 250,000 | | | | | Exelon Corp.
2.450%, 04/15/21 | | | 247,341 | |
| | | |
| | 100,000 | | | | | NGPL PipeCo, LLC*
4.875%, 08/15/27 | | | 103,345 | |
| | | |
| | 150,000 | | | | | Northern States Power Co.
3.750%, 12/01/47 | | | 143,610 | |
| | | |
| | 175,000 | | | | | PPL Capital Funding, Inc.‡
5.266%, 03/30/67
3 mo. USD LIBOR + 2.67% | | | 163,504 | |
| | | |
| | 150,000 | | | | | Public Service Electric & Gas Company
3.600%, 12/01/47 | | | 144,584 | |
| | | |
| | 250,000 | | | | | Southern California Edison Company
3.400%, 06/01/23 | | | 251,671 | |
| | | | | | | | | | |
| | | | | | | | | 2,102,965 | |
| | | | | | | | | | |
| | | |
| | | | | | TOTAL CORPORATE BONDS
(Cost $24,694,995) | | | 24,903,576 | |
| | | | | | | | | | |
| | | | | | | | | | |
|
| | BANK LOANS (3.8%)‡ | |
| | | | | | Communication Services (0.4%) | |
| | 199,500 | | | | | Sprint Communications, Inc.
5.500%, 02/02/24
1 mo. LIBOR + 3.00% | | | 196,923 | |
| | | | | | | | | | |
| | | | | | Consumer Staples (0.4%) | |
| | 177,934 | | | | | JBS USA LUX, SA!
10/30/22 | | | 178,259 | |
| | | | | | | | | | |
| | | | | | Financials (0.9%) | |
| | 222,727 | | | | | GLP Financing, LLC
3.977%, 04/28/21
1 mo. LIBOR + 1.50% | | | 221,474 | |
| | | |
| | 250,000 | | | | | Level 3 Financing, Inc.
4.733%, 02/22/24
1 mo. LIBOR + 2.25% | | | 250,438 | |
| | | | | | | | | | |
| | | | | | | | | 471,912 | |
| | | | | | | | | | |
| | | | | | Health Care (1.5%) | |
| | 249,370 | | | | | HCA, Inc.
4.483%, 03/13/25
1 mo. LIBOR + 2.00% | | | 250,172 | |
| | | |
| | 282,022 | | | | | Mallinckrodt International Finance, SA
5.351%, 09/24/24
3 mo. LIBOR + 2.75% | | | 254,827 | |
| | | |
| | 272,874 | | | | | Amneal Pharmaceuticals, LLC
6.000%, 05/04/25
1 mo. LIBOR + 3.50% | | | 274,204 | |
| | | | | | | | | | |
| | | | | | | | | 779,203 | |
| | | | | | | | | | |
| | | | | | Information Technology (0.6%) | |
| | 275,000 | | | | | First Data Corp.
4.481%, 04/26/24
1 mo. LIBOR + 2.00% | | | 275,259 | |
| | | | | | | | | | |
| | | |
| | | | | | TOTAL BANK LOANS
(Cost $1,926,935) | | | 1,901,556 | |
| | | | | | | | | | |
| | | | | | | | | | |
| | | | |
| 134 | | CALAMOS OPEN-END FAMILY OF FUNDS SEMIANNUAL REPORT | | See accompanying Notes to Schedule of Investments |
Total Return Bond Fund Schedule of Investments April 30, 2019 (Unaudited)
| | | | | | | | | | |
PRINCIPAL
AMOUNT | | | | | | | VALUE | |
|
| | U.S. GOVERNMENT AND AGENCY SECURITIES (37.9%) | |
| | 544,109 | | | | | Federal Home Loan Mortgage Corp.
3.500%, 11/01/47 | | $ | 550,736 | |
| | | |
| | | | | | Federal National Mortgage Association | | | | |
| | 1,281,596 | | | | | 3.500%, 02/01/49 | | | 1,293,908 | |
| | 1,026,089 | | | | | 3.000%, 07/01/46 | | | 1,015,751 | |
| | 934,979 | | | | | 4.000%, 06/01/48 | | | 959,815 | |
| | 885,377 | | | | | 3.500%, 08/01/47 | | | 895,679 | |
| | 641,409 | | | | | 4.000%, 04/01/48 | | | 658,446 | |
| | 519,869 | | | | | 4.500%, 04/01/48 | | | 541,042 | |
| | 494,854 | | | | | 3.000%, 03/01/47 | | | 489,868 | |
| | 465,288 | | | | | 4.000%, 03/01/47 | | | 480,147 | |
| | 429,825 | | | | | 3.000%, 02/01/33 | | | 432,316 | |
| | 352,999 | | | | | 2.500%, 09/01/31 | | | 349,963 | |
| | | |
| | 833,839 | | | | | Freddie Mac Multifamily Structured Pass Through Certificates Class A1
2.892%, 06/25/27 | | | 838,800 | |
| | | |
| | 460,000 | | | | | Freddie Mac Multifamily Structured Pass Through Certificates Class A2
3.350%, 01/25/28 | | | 474,203 | |
| | | |
| | | | | | Government National Mortgage Association II Pool | | | | |
| | 802,385 | | | | | 3.500%, 10/20/47 | | | 816,327 | |
| | 533,329 | | | | | 3.000%, 10/20/47 | | | 532,605 | |
| | | |
| | | | | | United States Treasury Bond | | | | |
| | 1,400,000 | | | | | 2.750%, 08/15/47^ | | | 1,349,972 | |
| | 1,250,000 | | | | | 3.500%, 02/15/39 | | | 1,393,533 | |
| | 750,000 | | | | | 2.875%, 11/15/46^ | | | 743,071 | |
| | 500,000 | | | | | 3.000%, 05/15/47 | | | 507,097 | |
| | 300,000 | | | | | 3.000%, 02/15/49 | | | 303,967 | |
| | | |
| | | | | | United States Treasury Inflation Indexed Note | | | | |
| | 1,024,630 | | | | | 0.500%, 01/15/28 | | | 1,021,070 | |
| | 532,885 | | | | | 0.375%, 07/15/25 | | | 532,294 | |
| | | |
| | | | | | United States Treasury Note | | | | |
| | 1,000,000 | | | | | 2.875%, 11/30/25 | | | 1,030,045 | |
| | 750,000 | | | | | 2.500%, 02/28/26 | | | 755,320 | |
| | 750,000 | | | | | 2.125%, 03/31/24 | | | 744,549 | |
| | 500,000 | | | | | 2.625%, 01/31/26 | | | 507,411 | |
| | | | | | | | | | |
| | | |
| | | | | | TOTAL U.S. GOVERNMENT AND AGENCY SECURITIES
(Cost $19,125,032) | | | 19,217,935 | |
| | | | | | | | | | |
| | | | | | | | | | |
|
| | ASSET BACKED SECURITIES (8.2%) | |
| | 680,000 | | | | | Ally Master Owner Trust Series2018-1, Class A2
2.700%, 01/17/23 | | | 679,735 | |
| | | |
| | 250,000 | | | | | Credit Acceptance Auto Loan TrustSeries 2018-3A, Class A*
3.550%, 08/15/27 | | | 252,857 | |
| | | |
| | 235,000 | | | | | Dell Equipment Finance TrustSeries 2017-2, Class B*
2.470%, 10/24/22 | | | 234,111 | |
| | | |
| | 174,142 | | | | | Enterprise Fleet Financing, LLCSeries 2018-1, Class A2*
2.870%, 10/20/23 | | | 174,314 | |
| | | | | | | | | | |
PRINCIPAL
AMOUNT | | | | | | | VALUE | |
| | | |
| | 500,000 | | | | | Ford Credit Floorplan Master Owner Trust Series2018-1, Class A1
2.950%, 05/15/23 | | $ | 502,805 | |
| | | |
| | 350,000 | | | | | Hertz Fleet Lease Funding, LPSeries 2018-1, Class A2*
3.230%, 05/10/32 | | | 351,196 | |
| | | |
| | 300,000 | | | | | OSCAR US Funding Trust IX, LLCSeries 2018-2A, Class A3*
3.390%, 09/12/22 | | | 302,327 | |
| | | |
| | 191,630 | | | | | SoFi Consumer Loan Program Trust Series2018-4, Class A*
3.540%, 11/26/27 | | | 193,094 | |
| | | |
| | 350,201 | | | | | SoFi Professional Loan Program LLC Series2016-C, Class A2B*
2.360%, 12/27/32 | | | 346,274 | |
| | | |
| | 500,000 | | | | | SoFi Professional Loan Program LLC Series2017-F, Class A2FX*
2.840%, 01/25/41 | | | 496,918 | |
| | | |
| | 400,000 | | | | | Verizon Owner Trust Series2018-1A, Class A1A*
2.820%, 09/20/22 | | | 401,186 | |
| | | |
| | 200,000 | | | | | Verizon Owner Trust Series2018-A, Class A1A
3.230%, 04/20/23 | | | 202,494 | |
| | | | | | | | | | |
| | | |
| | | | | | TOTAL ASSET BACKED SECURITIES
(Cost $4,126,912) | | | 4,137,311 | |
| | | | | | | | | | |
| | | | | | | | | | |
NUMBER OF
SHARES | | | | | | | VALUE | |
|
| | SHORT TERM INVESTMENTS (0.8%) | |
| | 206,805 | | | | | Fidelity Prime Money Market Fund - Institutional Class, 2.500%*** | | | 206,867 | |
| | | |
| | 206,782 | | | | | Morgan Stanley Institutional Liquidity Funds - Government Portfolio, 2.350%*** | | | 206,782 | |
| | | | | | | | | | |
| | | |
| | | | | | TOTAL SHORT TERM INVESTMENTS
(Cost $413,649) | | | 413,649 | |
| | | | | | | | | | |
| | | | | | | | | | |
NUMBER OF
SHARES/
PRINCIPAL
AMOUNT | | | | | | | VALUE | |
|
| INVESTMENT OF CASH COLLATERAL FOR SECURITIES
LOANED (5.0%) |
|
| | 2,550,385 | | | | | State Street Navigator Securities Lending Government Money Market Portfolio†
(Cost $2,550,385) | | | 2,550,385 | |
| | | | | | | | | | |
| |
| TOTAL INVESTMENTS (104.8%)
(Cost $52,837,908) | | | 53,124,412 | |
| | | | | | | | | | |
| |
| | PAYABLE UPON RETURN OF SECURITIES ON LOAN(-5.0%) | | | (2,550,385 | ) |
| | | | | |
| |
| | OTHER ASSETS, LESS LIABILITIES (0.2%) | | | 92,540 | |
| | | | | | | | | | |
| |
| | NET ASSETS (100.0%) | | $ | 50,666,567 | |
| | | | | | | | | | |
| | | | | | |
| See accompanying Notes to Schedule of Investments | | www.calamos.com | | | 135 | |
Total Return Bond Fund Schedule of Investments April 30, 2019 (Unaudited)
NOTES TO SCHEDULE OF INVESTMENTS
| * | Securities issued and sold pursuant to a Rule 144A transaction are excepted from the registration requirement of the Securities Act of 1933, as amended. These securities may only be sold to qualified institutional buyers (“QIBs”), such as the Fund. Any resale of these securities must generally be effected through a sale that is registered under the Act or otherwise exempted from such registration requirements. |
| ^ | Security, or portion of security, is on loan. |
| ‡ | Variable rate security. The rate shown is the rate in effect at April 30, 2019. |
| ! | This position represents an unsettled loan commitment at period end. Certain details associated with this purchase are not known prior to the settlement date, including coupon rate, which will be adjusted on settlement date. |
| *** | The rate disclosed is the 7 day net yield as of April 30, 2019. |
| † | Represents investment of cash collateral received from securities on loan as of April 30, 2019. |
| | | | |
| 136 | | CALAMOS OPEN-END FAMILY OF FUNDS SEMIANNUAL REPORT | | See accompanying Notes to Financial Statements |
High Income Opportunities Fund Schedule of Investments April 30, 2019 (Unaudited)
| | | | | | | | | | |
PRINCIPAL
AMOUNT | | | | | | | VALUE | |
|
| | CORPORATE BONDS (80.2%) | |
| | | | | | Communication Services (12.0%) | |
| | 200,000 | | | | | Altice Financing, SA*
7.500%, 05/15/26 | | $ | 202,732 | |
| | | |
| | 300,000 | | | | | Altice France, SA*
7.375%, 05/01/26 | | | 304,854 | |
| | | |
| | 50,000 | | | | | Arrow Bidco, LLC*
9.500%, 03/15/24 | | | 49,619 | |
| | | |
| | 120,000 | | | | | Belo Corp.
7.250%, 09/15/27 | | | 129,428 | |
| | | |
| | 145,000 | | | | | Cincinnati Bell, Inc.*
8.000%, 10/15/25 | | | 133,945 | |
| | | |
| | | | | | CommScope, Inc.* | | | | |
| | 115,000 | | | | | 5.500%, 03/01/24 | | | 120,038 | |
| | 25,000 | | | | | 8.250%, 03/01/27 | | | 27,102 | |
| | | |
| | 80,000 | | | | | Consolidated Communications, Inc.^
6.500%, 10/01/22 | | | 76,015 | |
| | | |
| | | | | | CSC Holdings, LLC* | | | | |
| | 335,000 | | | | | 5.500%, 04/15/27 | | | 345,780 | |
| | 200,000 | | | | | 7.500%, 04/01/28^ | | | 218,509 | |
| | 200,000 | | | | | 5.500%, 05/15/26 | | | 205,967 | |
| | | |
| | 622,000 | | | | | Embarq Corp.
7.995%, 06/01/36 | | | 614,225 | |
| | | |
| | 50,000 | | | | | Entercom Media Corp.*
6.500%, 05/01/27 | | | 51,059 | |
| | | |
| | | | | | Frontier Communications Corp. | | | | |
| | 355,000 | | | | | 11.000%, 09/15/25 | | | 230,308 | |
| | 265,000 | | | | | 7.625%, 04/15/24 | | | 146,730 | |
| | 105,000 | | | | | 8.500%, 04/01/26*^ | | | 99,188 | |
| | 50,000 | | | | | 8.000%, 04/01/27* | | | 51,847 | |
| | | |
| | | | | | Gray Television, Inc.* | | | | |
| | 70,000 | | | | | 5.875%, 07/15/26 | | | 72,207 | |
| | 50,000 | | | | | 7.000%, 05/15/27^ | | | 54,126 | |
| | | |
| | | | | | Hughes Satellite Systems Corp. | | | | |
| | 90,000 | | | | | 6.625%, 08/01/26^ | | | 91,200 | |
| | 30,000 | | | | | 5.250%, 08/01/26 | | | 30,204 | |
| | | |
| | 300,000 | | | | | Inmarsat Finance, PLC*
4.875%, 05/15/22 | | | 303,378 | |
| | | |
| | | | | | Intelsat Jackson Holdings, SA | | | | |
| | 195,000 | | | | | 9.750%, 07/15/25* | | | 201,251 | |
| | 110,000 | | | | | 5.500%, 08/01/23^ | | | 99,619 | |
| | | |
| | 65,000 | | | | | MDC Partners, Inc.*^
6.500%, 05/01/24 | | | 55,213 | |
| | | |
| | 125,000 | | | | | Nexstar Broadcasting, Inc.*
5.625%, 08/01/24 | | | 127,035 | |
| | | |
| | 155,000 | | | | | Qwest Corp.
6.875%, 09/15/33 | | | 155,187 | |
| | | |
| | | | | | Sprint Corp. | | | | |
| | 370,000 | | | | | 7.875%, 09/15/23 | | | 386,012 | |
| | 310,000 | | | | | 7.125%, 06/15/24 | | | 311,550 | |
| | 145,000 | | | | | 7.625%, 03/01/26 | | | 145,236 | |
| | | |
| | 140,000 | | | | | T-Mobile USA, Inc.^
4.750%, 02/01/28 | | | 141,518 | |
| | | |
| | 80,000 | | | | | Telecom Italia Capital, SA
6.000%, 09/30/34 | | | 74,185 | |
| | | | | | | | | | |
PRINCIPAL
AMOUNT | | | | | | | VALUE | |
| | | |
| | 196,000 | | | | | United States Cellular Corp.
6.700%, 12/15/33 | | $ | 208,945 | |
| | | |
| | | | | | Windstream Services, LLC / Windstream Finance Corp.@ | | | | |
| | 42,000 | | | | | 7.750%, 10/01/21 | | | 9,203 | |
| | 24,000 | | | | | 10.500%, 06/30/24* | | | 16,796 | |
| | | |
| | 55,000 | | | | | Zayo Group, LLC / Zayo Capital, Inc.*
5.750%, 01/15/27 | | | 55,864 | |
| | | | | | | | | | |
| | | | | | | | | 5,546,075 | |
| | | | | | | | | | |
| | | | | | Consumer Discretionary (11.4%) | |
| | 85,000 | | | | | Ashton Woods USA, LLC / Ashton Woods Finance Company*
9.875%, 04/01/27 | | | 88,492 | |
| | | |
| | 195,000 | | | | | Beverages & More, Inc.*
11.500%, 06/15/22 | | | 144,134 | |
| | | |
| | 140,000 | | | | | Boyd Gaming Corp.
6.000%, 08/15/26 | | | 145,627 | |
| | | |
| | 155,000 | | | | | Caesars Resort Collection, LLC / CRC Finco, Inc.*
5.250%, 10/15/25 | | | 151,867 | |
| | | |
| | | | | | CCO Holdings, LLC / CCO Holdings Capital Corp.*^ | | | | |
| | 430,000 | | | | | 5.125%, 05/01/27 | | | 437,125 | |
| | 80,000 | | | | | 5.000%, 02/01/28 | | | 79,969 | |
| | | |
| | | | | | Century Communities, Inc. | | | | |
| | 259,000 | | | | | 6.875%, 05/15/22 | | | 264,781 | |
| | 85,000 | | | | | 5.875%, 07/15/25 | | | 84,433 | |
| | | |
| | 263,000 | | | | | Dana, Inc.
5.500%, 12/15/24 | | | 267,470 | |
| | | |
| | | | | | DISH DBS Corp.^ | | | | |
| | 150,000 | | | | | 7.750%, 07/01/26 | | | 134,473 | |
| | 90,000 | | | | | 5.875%, 11/15/24 | | | 77,860 | |
| | | |
| | 270,000 | | | | | Eldorado Resorts, Inc.
6.000%, 04/01/25 | | | 279,497 | |
| | | |
| | 130,000 | | | | | ESH Hospitality, Inc.*
5.250%, 05/01/25 | | | 131,024 | |
| | | |
| | 110,000 | | | | | goeasy, Ltd.*
7.875%, 11/01/22 | | | 115,673 | |
| | | |
| | 175,000 | | | | | Guitar Center Escrow Issuer, Inc.*
9.500%, 10/15/21 | | | 170,603 | |
| | | |
| | 200,000 | | | | | International Game Technology, PLC*^
6.250%, 01/15/27 | | | 210,172 | |
| | | |
| | | | | | L Brands, Inc.^ | | | | |
| | 285,000 | | | | | 6.875%, 11/01/35 | | | 254,524 | |
| | 59,000 | | | | | 5.250%, 02/01/28 | | | 52,731 | |
| | | |
| | 135,000 | | | | | Lennar Corp.
5.250%, 06/01/26 | | | 140,825 | |
| | | |
| | 125,000 | | | | | Liberty Interactive, LLC
8.250%, 02/01/30 | | | 129,490 | |
| | | |
| | 170,000 | | | | | M/I Homes, Inc.^
5.625%, 08/01/25 | | | 167,622 | |
| | | |
| | | | | | Mattel, Inc. | | | | |
| | 115,000 | | | | | 6.750%, 12/31/25* | | | 115,335 | |
| | 5,000 | | | | | 2.350%, 08/15/21 | | | 4,815 | |
| | | | | | |
| See accompanying Notes to Schedule of Investments | | www.calamos.com | | | 137 | |
High Income Opportunities Fund Schedule of Investments April 30, 2019 (Unaudited)
| | | | | | | | | | |
PRINCIPAL
AMOUNT | | | | | | | VALUE | |
| | | |
| | 200,000 | | | | | Mclaren Finance, PLC*
5.750%, 08/01/22 | | $ | 196,880 | |
| | | |
| | 155,000 | | | | | Meritage Homes Corp.
6.000%, 06/01/25 | | | 165,011 | |
| | | |
| | 160,000 | | | | | Penske Automotive Group, Inc.
5.375%, 12/01/24 | | | 162,548 | |
| | | |
| | | | | | PetSmart, Inc.*^ | | | | |
| | 195,000 | | | | | 5.875%, 06/01/25 | | | 176,965 | |
| | 35,000 | | | | | 8.875%, 06/01/25 | | | 31,156 | |
| | | |
| | | | | | Rite Aid Corp. | | | | |
| | 275,000 | | | | | 7.700%, 02/15/27 | | | 170,940 | |
| | 85,000 | | | | | 6.125%, 04/01/23* | | | 72,384 | |
| | | |
| | 100,000 | | | | | Salem Media Group, Inc.*
6.750%, 06/01/24 | | | 90,038 | |
| | | |
| | 135,000 | | | | | Sally Holdings, LLC / Sally Capital, Inc.
5.625%, 12/01/25 | | | 134,749 | |
| | | |
| | 150,000 | | | | | Sotheby’s*
4.875%, 12/15/25 | | | 147,273 | |
| | | |
| | 100,000 | | | | | Staples, Inc.*
7.500%, 04/15/26 | | | 100,150 | |
| | | |
| | 140,000 | | | | | Taylor Morrison Communities Corp.
6.625%, 05/15/22 | | | 144,792 | |
| | | |
| | 49,131 | | | | | US Airways Pass Through TrustSeries 2012-2, Class B
6.750%, 12/03/22 | | | 51,633 | |
| | | | | | | | | | |
| | | | | | | | | 5,293,061 | |
| | | | | | | | | | |
| | | | | | Consumer Staples (4.6%) | |
| | | | | | Albertsons Companies, LLC / Safeway, Inc. / New Albertsons, LP / Albertson’s, LLC | | | | |
| | 125,000 | | | | | 5.750%, 03/15/25 | | | 124,426 | |
| | 75,000 | | | | | 7.500%, 03/15/26*^ | | | 79,797 | |
| | | |
| | 50,000 | | | | | Dean Foods Company*
6.500%, 03/15/23 | | | 26,360 | |
| | | |
| | 85,000 | | | | | Energizer Holdings, Inc.*^
6.375%, 07/15/26 | | | 87,949 | |
| | | |
| | 120,000 | | | | | Fresh Market, Inc.*
9.750%, 05/01/23 | | | 92,189 | |
| | | |
| | | | | | JBS USA LUX, SA / JBS USA Finance, Inc.* | | | | |
| | 500,000 | | | | | 7.250%, 06/01/21 | | | 502,107 | |
| | 205,000 | | | | | 6.750%, 02/15/28 | | | 216,807 | |
| | 25,000 | | | | | 5.875%, 07/15/24 | | | 25,684 | |
| | | |
| | 200,000 | | | | | JBS USA LUX, SA / JBS USA Food Company / JBS USA Finance, Inc.*
6.500%, 04/15/29 | | | 211,499 | |
| | | |
| | | | | | New Albertson’s, Inc. | | | | |
| | 105,000 | | | | | 7.450%, 08/01/29^ | | | 98,470 | |
| | 90,000 | | | | | 7.750%, 06/15/26 | | | 85,820 | |
| | 70,000 | | | | | 8.000%, 05/01/31 | | | 66,380 | |
| | | |
| | | | | | Pilgrim’s Pride Corp.* | | | | |
| | 145,000 | | | | | 5.875%, 09/30/27 | | | 150,129 | |
| | 60,000 | | | | | 5.750%, 03/15/25 | | | 61,478 | |
| | | |
| | | | | | Post Holdings, Inc.* | | | | |
| | 110,000 | | | | | 5.750%, 03/01/27 | | | 113,076 | |
| | 30,000 | | | | | 5.625%, 01/15/28 | | | 30,393 | |
| | | | | | | | | | |
PRINCIPAL
AMOUNT | | | | | | | VALUE | |
| | | |
| | | | | | Simmons Foods, Inc.* | | | | |
| | 104,000 | | | | | 7.750%, 01/15/24 | | $ | 111,213 | |
| | 65,000 | | | | | 5.750%, 11/01/24^ | | | 59,815 | |
| | | | | | | | | | |
| | | | | | | | | 2,143,592 | |
| | | | | | | | | | |
| | | | | | Energy (11.9%) | |
| | 85,000 | | | | | Apergy Corp.
6.375%, 05/01/26 | | | 88,029 | |
| | | |
| | 45,000 | | | | | Berry Petroleum Company, LLC*
7.000%, 02/15/26 | | | 44,325 | |
| | | |
| | 145,000 | | | | | Brazos Valley Longhorn, LLC / Brazos Valley Longhorn Finance Corp.
6.875%, 02/01/25 | | | 145,912 | |
| | | |
| | 82,000 | | | | | Bruin E&P Partners, LLC*
8.875%, 08/01/23 | | | 77,940 | |
| | | |
| | 145,000 | | | | | Buckeye Partners, LP‡
6.375%, 01/22/78
3 mo. USD LIBOR + 4.02% | | | 134,056 | |
| | | |
| | 205,000 | | | | | Calfrac Holdings, LP*
8.500%, 06/15/26 | | | 172,613 | |
| | | |
| | 105,000 | | | | | California Resources Corp.*^
8.000%, 12/15/22 | | | 80,326 | |
| | | |
| | 160,000 | | | | | Carrizo Oil & Gas, Inc.^
6.250%, 04/15/23 | | | 155,908 | |
| | | |
| | 145,000 | | | | | Chaparral Energy, Inc.*^
8.750%, 07/15/23 | | | 107,462 | |
| | | |
| | 110,000 | | | | | Cheniere Energy Partners, LP*^
5.625%, 10/01/26 | | | 113,778 | |
| | | |
| | | | | | Chesapeake Energy Corp.^ | | | | |
| | 150,000 | | | | | 8.000%, 01/15/25 | | | 151,998 | |
| | 120,000 | | | | | 7.000%, 10/01/24 | | | 118,925 | |
| | | |
| | 50,000 | | | | | Comstock Resources, Inc.*
9.750%, 08/15/26 | | | 45,791 | |
| | | |
| | 125,000 | | | | | DCP Midstream Operating, LP*‡
5.850%, 05/21/43
3 mo. USD LIBOR + 3.85% | | | 116,695 | |
| | | |
| | 75,000 | | | | | DCP Midstream, LP‡
7.375%, 12/15/22
3 mo. USD LIBOR + 5.15% | | | 74,169 | |
| | | |
| | | | | | Denbury Resources, Inc. | | | | |
| | 120,000 | | | | | 5.500%, 05/01/22 | | | 93,193 | |
| | 110,000 | | | | | 7.500%, 02/15/24*^ | | | 101,918 | |
| | 80,000 | | | | | 9.250%, 03/31/22*^ | | | 81,398 | |
| | | |
| | 75,000 | | | | | Diamond Offshore Drilling, Inc.^
7.875%, 08/15/25 | | | 73,046 | |
| | | |
| | 285,000 | | | | | Energy Transfer Operating, LP‡
5.597%, 11/01/66
3 mo. USD LIBOR + 3.02% | | | 236,534 | |
| | | |
| | | | | | Enterprise Products Operating, LLC‡ | | | | |
| | 170,000 | | | | | 4.875%, 08/16/77
3 mo. USD LIBOR + 2.99% | | | 162,662 | |
| | 55,000 | | | | | 5.375%, 02/15/78
3 mo. USD LIBOR + 2.57% | | | 51,197 | |
| | | |
| | | | | | EP Energy, LLC / Everest Acquisition Finance, Inc.* | | | | |
| | 100,000 | | | | | 9.375%, 05/01/24 | | | 36,372 | |
| | | | |
| 138 | | CALAMOS OPEN-END FAMILY OF FUNDS SEMIANNUAL REPORT | | See accompanying Notes to Schedule of Investments |
High Income Opportunities Fund Schedule of Investments April 30, 2019 (Unaudited)
| | | | | | | | | | |
PRINCIPAL
AMOUNT | | | | | | | VALUE | |
| | 75,000 | | | | | 7.750%, 05/15/26 | | $ | 66,880 | |
| | | |
| | | | | | Genesis Energy, LP / Genesis Energy Finance Corp. | | | | |
| | 150,000 | | | | | 6.500%, 10/01/25 | | | 150,914 | |
| | 150,000 | | | | | 6.250%, 05/15/26^ | | | 148,717 | |
| | | |
| | | | | | Gulfport Energy Corp. | | | | |
| | 130,000 | | | | | 6.375%, 05/15/25^ | | | 114,617 | |
| | 100,000 | | | | | 6.000%, 10/15/24 | | | 88,106 | |
| | | |
| | 110,000 | | | | | Halcon Resources Corp.
6.750%, 02/15/25 | | | 70,983 | |
| | | |
| | 183,000 | | | | | Lonestar Resources America, Inc.*
11.250%, 01/01/23 | | | 182,594 | |
| | | |
| | 135,000 | | | | | Magnolia Oil & Gas Operating, LLC / Magnolia Oil & Gas Finance Corp.*
6.000%, 08/01/26 | | | 137,853 | |
| | | |
| | 180,000 | | | | | McDermott Technologies Americas, Inc. / McDermott Technology U.S., Inc.*
10.625%, 05/01/24 | | | 163,647 | |
| | | |
| | | | | | Moss Creek Resources Holdings, Inc.* | | | | |
| | 50,000 | | | | | 7.500%, 01/15/26 | | | 45,913 | |
| | 45,000 | | | | | 10.500%, 05/15/27 | | | 46,042 | |
| | | |
| | 80,000 | | | | | Nine Energy Service, Inc.*
8.750%, 11/01/23 | | | 82,797 | |
| | | |
| | 15,074 | | | | | Northern Oil and Gas, Inc.
9.500%, 05/15/23
9.500% PIK rate | | | 15,911 | |
| | | |
| | 95,000 | | | | | Oasis Petroleum, Inc.*^
6.250%, 05/01/26 | | | 92,930 | |
| | | |
| | 150,000 | | | | | Par Petroleum, LLC / Par Petroleum Finance Corp.*
7.750%, 12/15/25 | | | 146,464 | |
| | | |
| | 80,000 | | | | | PDC Energy, Inc.
5.750%, 05/15/26 | | | 80,186 | |
| | | |
| | 125,000 | | | | | PetroleumGeo-Services, ASA*
7.375%, 12/15/20 | | | 124,968 | |
| | | |
| | 100,000 | | | | | Plains All American Pipeline, LP‡
6.125%, 11/15/22
3 mo. USD LIBOR + 4.11% | | | 96,224 | |
| | | |
| | 55,000 | | | | | QEP Resources, Inc.^
5.625%, 03/01/26 | | | 51,644 | |
| | | |
| | 165,000 | | | | | SESI, LLC
7.750%, 09/15/24 | | | 121,922 | |
| | | |
| | 60,000 | | | | | SM Energy Company^
6.750%, 09/15/26 | | | 57,715 | |
| | | |
| | 75,000 | | | | | Targa Resources Partners, LP / Targa Resources Partners Finance Corp.*
6.500%, 07/15/27 | | | 80,491 | |
| | | |
| | 30,000 | | | | | TransMontaigne Partners, LP / TLP Finance Corp.
6.125%, 02/15/26 | | | 29,002 | |
| | | |
| | 25,515 | | | | | Transocean Pontus, Ltd.*
6.125%, 08/01/25 | | | 26,310 | |
| | | |
| | 145,000 | | | | | Transocean, Inc.*^
7.500%, 01/15/26 | | | 143,570 | |
| | | | | | | | | | |
PRINCIPAL
AMOUNT | | | | | | | VALUE | |
| | | |
| | 150,000 | | | | | Vine Oil & Gas, LP / Vine Oil & Gas Finance Corp.*
8.750%, 04/15/23 | | $ | 117,296 | |
| | | |
| | 215,000 | | | | | W&T Offshore, Inc.*
9.750%, 11/01/23 | | | 219,075 | |
| | | |
| | 285,000 | | | | | Weatherford International, Ltd.
8.250%, 06/15/23 | | | 201,425 | |
| | | |
| | 150,000 | | | | | Whiting Petroleum Corp.^
6.625%, 01/15/26 | | | 149,652 | |
| | | | | | | | | | |
| | | | | | | | | 5,518,095 | |
| | | | | | | | | | |
| | | | | | Financials (11.9%) | |
| | 295,000 | | | | | Acrisure, LLC / Acrisure Finance, Inc.*^
7.000%, 11/15/25 | | | 267,572 | |
| | | |
| | 390,000 | | | | | Ally Financial, Inc.
8.000%, 11/01/31 | | | 500,672 | |
| | | |
| | 145,000 | | | | | Amwins Group, Inc.*
7.750%, 07/01/26 | | | 145,964 | |
| | | |
| | 275,000 | | | | | Ardonagh Midco 3, PLC*^
8.625%, 07/15/23 | | | 228,287 | |
| | | |
| | 315,000 | | | | | AssuredPartners, Inc.*
7.000%, 08/15/25 | | | 298,199 | |
| | | |
| | 70,000 | | | | | Bank of America Corp.‡
5.875%, 03/15/28
3 mo. USD LIBOR + 2.93% | | | 72,429 | |
| | | |
| | 125,000 | | | | | Brookfield Property REIT, Inc. / BPR Cumulus, LLC / BPR Nimbus, LLC / GGSI Sellco, LLC*
5.750%, 05/15/26 | | | 126,888 | |
| | | |
| | 45,000 | | | | | Charles Schwab Corp.‡
5.000%, 12/01/27
3 mo. USD LIBOR + 2.58% | | | 43,834 | |
| | | |
| | 130,000 | | | | | Credit Acceptance Corp.*
6.625%, 03/15/26 | | | 136,840 | |
| | | |
| | 130,000 | | | | | Greystar Real Estate Partners, LLC*
5.750%, 12/01/25 | | | 130,811 | |
| | | |
| | 135,000 | | | | | HUB International, Ltd.*
7.000%, 05/01/26 | | | 136,254 | |
| | | |
| | 160,000 | | | | | ILFCE-Capital Trust II*‡
4.850%, 12/21/65
3 mo. USD LIBOR + 1.80% | | | 123,953 | |
| | | |
| | 230,000 | | | | | Iron Mountain, Inc.*
5.250%, 03/15/28 | | | 227,132 | |
| | | |
| | 625,000 | | | | | Jefferies Finance, LLC*
7.250%, 08/15/24 | | | 617,875 | |
| | | |
| | 140,000 | | | | | Ladder Capital Finance Holdings LLLP / Ladder Capital Finance Corp.*
5.250%, 10/01/25 | | | 139,688 | |
| | | |
| | 150,000 | | | | | Level 3 Financing, Inc.
5.375%, 05/01/25 | | | 153,011 | |
| | | |
| | 125,000 | | | | | Lions Gate Capital Holdings, LLC*
6.375%, 02/01/24 | | | 130,973 | |
| | | |
| | 175,000 | | | | | LPL Holdings, Inc.*
5.750%, 09/15/25 | | | 178,588 | |
| | | | | | |
| See accompanying Notes to Schedule of Investments | | www.calamos.com | | | 139 | |
High Income Opportunities Fund Schedule of Investments April 30, 2019 (Unaudited)
| | | | | | | | | | |
PRINCIPAL
AMOUNT | | | | | | | VALUE | |
| | | |
| | 260,000 | | | | | MetLife, Inc.
6.400%, 12/15/66 | | $ | 287,780 | |
| | | |
| | 285,000 | | | | | Nationstar Mortgage, LLC / Nationstar Capital Corp.
6.500%, 07/01/21 | | | 285,627 | |
| | | |
| | 225,000 | | | | | Navient Corp.
6.750%, 06/25/25 | | | 230,559 | |
| | | |
| | 190,000 | | | | | Oil Insurance, Ltd.*‡
5.574%, 06/30/19
3 mo. USD LIBOR + 2.98% | | | 184,931 | |
| | | |
| | 80,000 | | | | | Realogy Group, LLC / RealogyCo-Issuer Corp.*^
4.875%, 06/01/23 | | | 76,397 | |
| | | |
| | | | | | Springleaf Finance Corp. | | | | |
| | 185,000 | | | | | 6.875%, 03/15/25 | | | 198,691 | |
| | 140,000 | | | | | 7.125%, 03/15/26 | | | 150,495 | |
| | | |
| | 150,000 | | | | | Starwood Property Trust, Inc.
4.750%, 03/15/25 | | | 150,653 | |
| | | |
| | 310,000 | | | | | Tronox Finance, PLC*^
5.750%, 10/01/25 | | | 303,290 | |
| | | | | | | | | | |
| | | | | | | | | 5,527,393 | |
| | | | | | | | | | |
| | | | | | Health Care (8.7%) | |
| | 180,000 | | | | | Acadia Healthcare Company, Inc.^
6.500%, 03/01/24 | | | 186,098 | |
| | | |
| | | | | | Bausch Health Americas, Inc.* | | | | |
| | 295,000 | | | | | 8.500%, 01/31/27 | | | 322,195 | |
| | 135,000 | | | | | 9.250%, 04/01/26 | | | 150,436 | |
| | | |
| | | | | | Bausch Health Cos., Inc.* | | | | |
| | 300,000 | | | | | 9.000%, 12/15/25 | | | 332,471 | |
| | 25,000 | | | | | 5.750%, 08/15/27^ | | | 26,120 | |
| | | |
| | | | | | CHS/Community Health Systems, Inc. | | | | |
| | 388,000 | | | | | 8.125%, 06/30/24* | | | 290,113 | |
| | 75,000 | | | | | 6.250%, 03/31/23 | | | 73,119 | |
| | 60,000 | | | | | 8.000%, 03/15/26* | | | 58,451 | |
| | 40,000 | | | | | 6.875%, 02/01/22 | | | 26,272 | |
| | | |
| | 265,000 | | | | | DaVita, Inc.^
5.125%, 07/15/24 | | | 265,538 | |
| | | |
| | 275,000 | | | | | Endo DAC / Endo Finance, LLC / Endo Finco, Inc.*
6.000%, 07/15/23 | | | 224,531 | |
| | | |
| | 130,000 | | | | | HCA, Inc.
7.500%, 11/06/33 | | | 150,264 | |
| | | |
| | 200,000 | | | | | Horizon Pharma USA, Inc.*
8.750%, 11/01/24 | | | 216,735 | |
| | | |
| | 240,000 | | | | | Magellan Health, Inc.
4.900%, 09/22/24 | | | 234,203 | |
| | | |
| | 80,000 | | | | | Mallinckrodt International Finance, SA / Mallinckrodt CB, LLC*
5.625%, 10/15/23 | | | 62,902 | |
| | | |
| | 80,000 | | | | | Par Pharmaceutical, Inc.*
7.500%, 04/01/27 | | | 83,152 | |
| | | |
| | 60,000 | | | | | Team Health Holdings, Inc.*^
6.375%, 02/01/25 | | | 51,142 | |
| | | |
| | | | | | Tenet Healthcare Corp. | | | | |
| | 140,000 | | | | | 4.625%, 07/15/24 | | | 140,547 | |
| | | | | | | | | | |
PRINCIPAL
AMOUNT | | | | | | | VALUE | |
| | 120,000 | | | | | 6.250%, 02/01/27* | | $ | 125,221 | |
| | 50,000 | | | | | 6.875%, 11/15/31 | | | 46,180 | |
| | | |
| | | | | | Teva Pharmaceutical Finance Netherlands III, BV | | | | |
| | 600,000 | | | | | 6.000%, 04/15/24 | | | 612,462 | |
| | 255,000 | | | | | 2.800%, 07/21/23 | | | 231,994 | |
| | | |
| | 125,000 | | | | | West Street Merger Sub, Inc.*
6.375%, 09/01/25 | | | 121,379 | |
| | | | | | | | | | |
| | | | | | | | | 4,031,525 | |
| | | | | | | | | | |
| | | | | | Industrials (11.3%) | |
| | 200,000 | | | | | ACCO Brands Corp.*
5.250%, 12/15/24 | | | 199,143 | |
| | | |
| | | | | | Allison Transmission, Inc.* | | | | |
| | 175,000 | | | | | 4.750%, 10/01/27^ | | | 171,884 | |
| | 25,000 | | | | | 5.875%, 06/01/29 | | | 25,755 | |
| | | |
| | 115,000 | | | | | Arconic, Inc.^
5.125%, 10/01/24 | | | 118,820 | |
| | | |
| | 218,287 | | | | | ARD Securities Finance Sarl*
8.750%, 01/31/23
8.750% PIK rate | | | 215,725 | |
| | | |
| | 50,000 | | | | | Avolon Holdings Funding, Ltd.*
5.250%, 05/15/24 | | | 52,331 | |
| | | |
| | 150,000 | | | | | Beacon Roofing Supply, Inc.*^
4.875%, 11/01/25 | | | 144,526 | |
| | | |
| | 220,000 | | | | | Bombardier, Inc.*^
7.500%, 03/15/25 | | | 221,422 | |
| | | |
| | | | | | Covanta Holding Corp. | | | | |
| | 160,000 | | | | | 5.875%, 03/01/24 | | | 165,001 | |
| | 45,000 | | | | | 5.875%, 07/01/25 | | | 46,251 | |
| | | |
| | 155,000 | | | | | Delphi Technologies, PLC*^
5.000%, 10/01/25 | | | 142,445 | |
| | | |
| | 200,000 | | | | | Fly Leasing, Ltd.
5.250%, 10/15/24 | | | 194,938 | |
| | | |
| | 257,000 | | | | | Garda World Security Corp.*
7.250%, 11/15/21 | | | 257,733 | |
| | | |
| | | | | | Golden Nugget, Inc.* | | | | |
| | 135,000 | | | | | 6.750%, 10/15/24 | | | 138,247 | |
| | 130,000 | | | | | 8.750%, 10/01/25 | | | 136,048 | |
| | | |
| | 155,000 | | | | | Great Lakes Dredge & Dock Corp.
8.000%, 05/15/22 | | | 163,914 | |
| | | |
| | 255,000 | | | | | H&E Equipment Services, Inc.^
5.625%, 09/01/25 | | | 260,465 | |
| | | |
| | | | | | Hertz Corp. | | | | |
| | 75,000 | | | | | 7.375%, 01/15/21 | | | 75,094 | |
| | 40,000 | | | | | 7.625%, 06/01/22*^ | | | 41,371 | |
| | | |
| | 182,000 | | | | | Icahn Enterprises, LP
6.750%, 02/01/24 | | | 191,300 | |
| | | |
| | 200,000 | | | | | James Hardie International Finance, Ltd.*
4.750%, 01/15/25 | | | 200,590 | |
| | | |
| | 150,000 | | | | | Jeld-Wen, Inc.*
4.625%, 12/15/25 | | | 143,736 | |
| | | |
| | 80,000 | | | | | JPW Industries Holding Corp.*
9.000%, 10/01/24 | | | 78,021 | |
| | | | |
| 140 | | CALAMOS OPEN-END FAMILY OF FUNDS SEMIANNUAL REPORT | | See accompanying Notes to Schedule of Investments |
High Income Opportunities Fund Schedule of Investments April 30, 2019 (Unaudited)
| | | | | | | | | | |
PRINCIPAL
AMOUNT | | | | | | | VALUE | |
| | | |
| | 205,000 | | | | | Meritor, Inc.
6.250%, 02/15/24 | | $ | 211,442 | |
| | | |
| | 210,000 | | | | | Navistar International Corp.*
6.625%, 11/01/25 | | | 214,869 | |
| | | |
| | | | | | Park Aerospace Holdings, Ltd.* | | | | |
| | 90,000 | | | | | 4.500%, 03/15/23 | | | 91,173 | |
| | 65,000 | | | | | 5.500%, 02/15/24 | | | 68,533 | |
| | | |
| | 315,000 | | | | | Park-Ohio Industries, Inc.
6.625%, 04/15/27 | | | 316,147 | |
| | | |
| | 60,000 | | | | | Scientific Games International, Inc.*
8.250%, 03/15/26 | | | 62,183 | |
| | | |
| | 30,000 | | | | | Summit Materials, LLC / Summit Materials Finance Corp.*^
6.500%, 03/15/27 | | | 31,061 | |
| | | |
| | 105,000 | | | | | Tennant Company
5.625%, 05/01/25 | | | 108,157 | |
| | | |
| | 25,000 | | | | | Titan Acquisition, Ltd. / TitanCo-Borrower, LLC*^
7.750%, 04/15/26 | | | 23,011 | |
| | | |
| | | | | | TransDigm, Inc.* | | | | |
| | 195,000 | | | | | 7.500%, 03/15/27 | | | 201,373 | |
| | 125,000 | | | | | 6.250%, 03/15/26 | | | 130,309 | |
| | | |
| | | | | | United Rentals North America, Inc. | | | | |
| | 125,000 | | | | | 5.875%, 09/15/26 | | | 130,786 | |
| | 55,000 | | | | | 6.500%, 12/15/26^ | | | 58,944 | |
| | | |
| | 75,000 | | | | | Waste Pro USA, Inc.*
5.500%, 02/15/26 | | | 74,961 | |
| | | |
| | 115,000 | | | | | XPO Logistics, Inc.*
6.750%, 08/15/24 | | | 119,149 | |
| | | | | | | | | | |
| | | | | | | | | 5,226,858 | |
| | | | | | | | | | |
| | | | | | Information Technology (1.3%) | |
| | 130,000 | | | | | CommScope Technologies, LLC*
6.000%, 06/15/25 | | | 132,400 | |
| | | |
| | 150,000 | | | | | Entercom Media Corp.*^
7.250%, 11/01/24 | | | 155,452 | |
| | | |
| | 145,000 | | | | | Harland Clarke Holdings Corp.*
8.375%, 08/15/22 | | | 128,540 | |
| | | |
| | 170,000 | | | | | VFH Parent, LLC*
6.750%, 06/15/22 | | | 175,952 | |
| | | | | | | | | | |
| | | | | | | | | 592,344 | |
| | | | | | | | | | |
| | | | | | Materials (5.4%) | |
| | 308,000 | | | | | AK Steel Corp.
6.375%, 10/15/25 | | | 260,626 | |
| | | |
| | 470,000 | | | | | ArcelorMittal, SA
7.000%, 10/15/39 | | | 541,142 | |
| | | |
| | 335,000 | | | | | Ardagh Packaging Finance, PLC / Ardagh Holdings USA, Inc.*
6.000%, 02/15/25 | | | 338,650 | |
| | | |
| | 55,000 | | | | | Baffinland Iron Mines Corp. / Baffinland Iron Mines, LP*
8.750%, 07/15/26 | | | 55,714 | |
| | | |
| | 200,000 | | | | | First Quantum Minerals, Ltd.*
7.250%, 04/01/23 | | | 197,936 | |
| | | | | | | | | | |
PRINCIPAL
AMOUNT | | | | | | | VALUE | |
| | | |
| | 200,000 | | | | | INEOS Group Holdings, SA*^
5.625%, 08/01/24 | | $ | 202,600 | |
| | | |
| | 85,000 | | | | | JW Aluminum Continuous Cast Company*
10.250%, 06/01/26 | | | 87,123 | |
| | | |
| | 50,000 | | | | | Kinross Gold Corp.
4.500%, 07/15/27 | | | 48,403 | |
| | | |
| | 25,000 | | | | | Mineral Resources, Ltd.*
8.125%, 05/01/27 | | | 25,685 | |
| | | |
| | 140,000 | | | | | New Gold, Inc.*^
6.375%, 05/15/25 | | | 112,673 | |
| | | |
| | 400,000 | | | | | PBF Holding Company, LLC / PBF Finance Corp.
7.250%, 06/15/25 | | | 413,206 | |
| | | |
| | | | | | United States Steel Corp.^ | | | | |
| | 185,000 | | | | | 6.875%, 08/15/25 | | | 174,618 | |
| | 55,000 | | | | | 6.250%, 03/15/26 | | | 49,444 | |
| | | | | | | | | | |
| | | | | | | | | 2,507,820 | |
| | | | | | | | | | |
| | | | | | Real Estate (0.5%) | |
| | 130,000 | | | | | CBL & Associates, LP^
5.250%, 12/01/23 | | | 94,532 | |
| | | |
| | 125,000 | | | | | Forestar Group, Inc.*
8.000%, 04/15/24 | | | 128,663 | |
| | | | | | | | | | |
| | | | | | | | | 223,195 | |
| | | | | | | | | | |
| | | | | | Utilities (1.2%) | |
| | 85,000 | | | | | NGPL PipeCo, LLC*
4.875%, 08/15/27 | | | 87,843 | |
| | | |
| | 265,000 | | | | | PPL Capital Funding, Inc.‡
5.266%, 03/30/67
3 mo. USD LIBOR + 2.67% | | | 247,592 | |
| | | |
| | 55,000 | | | | | Talen Energy Supply, LLC*
10.500%, 01/15/26 | | | 57,716 | |
| | | |
| | 150,000 | | | | | TerraForm Power Operating, LLC*
5.000%, 01/31/28 | | | 148,267 | |
| | | | | | | | | | |
| | | | | | | | | 541,418 | |
| | | | | | | | | | |
| | | |
| | | | | | TOTAL CORPORATE BONDS
(Cost $38,215,498) | | | 37,151,376 | |
| | | | | | | | | | |
| | | | | | | | | | |
|
| | CONVERTIBLE BONDS (1.1%) | |
| | | | | | Consumer Discretionary (0.8%) | |
| | 110,000 | | | | | DISH Network Corp.
2.375%, 03/15/24 | | | 95,681 | |
| | | |
| | | | | | Liberty Interactive, LLC | | | | |
| | 253,579 | | | | | 4.000%, 11/15/29 | | | 177,850 | |
| | 165,000 | | | | | 3.750%, 02/15/30 | | | 115,301 | |
| | | | | | | | | | |
| | | | | | | | | 388,832 | |
| | | | | | | | | | |
| | | | | | Financials (0.3%) | |
| | 125,000 | | | | | Prospect Capital Corp.
4.950%, 07/15/22 | | | 123,806 | |
| | | | | | | | | | |
| | | |
| | | | | | TOTAL CONVERTIBLE BONDS
(Cost $516,904) | | | 512,638 | |
| | | | | | | | | | |
| | | | | | | | | | |
| | | | | | |
| See accompanying Notes to Schedule of Investments | | www.calamos.com | | | 141 | |
High Income Opportunities Fund Schedule of Investments April 30, 2019 (Unaudited)
| | | | | | | | | | |
PRINCIPAL
AMOUNT | | | | | | | VALUE | |
|
| | BANK LOANS (10.8%) | |
| | | | | | Communication Services (2.3%) | |
| | 205,209 | | | | | Cumulus Media New Holdings, Inc.‡
6.990%, 05/15/22
1 mo. LIBOR + 4.50% | | $ | 203,850 | |
| | | |
| | 150,000 | | | | | Intelsat Jackson Holdings, SA
6.625%, 01/02/24 | | | 151,625 | |
| | | |
| | 125,000 | | | | | Intelsat Jackson Holdings, SA‡
6.979%, 01/02/24
1 mo. LIBOR + 4.50% | | | 126,228 | |
| | | |
| | 192,186 | | | | | New Media Holdings II, LLC‡
8.733%, 07/14/22
1 mo. LIBOR + 6.25% | | | 192,266 | |
| | | |
| | 249,375 | | | | | Sprint Communications, Inc.‡
5.500%, 02/02/24
1 mo. LIBOR + 3.00% | | | 246,154 | |
| | | |
| | 130,000 | | | | | Windstream Services, LLC‡
9.750%, 02/17/24
3 mo. LIBOR + 4.25%” | | | 132,210 | |
| | | | | | | | | | |
| | | | | | | | | 1,052,333 | |
| | | | | | | | | | |
| | | | | | Consumer Discretionary (1.3%) | |
| | 69,475 | | | | | American Greetings Corp.‡
6.983%, 04/06/24
1 mo. LIBOR + 4.50% | | | 69,779 | |
| | | |
| | 249,375 | | | | | R.R. Donnelley & Sons Company‡
7.483%, 01/15/24
1 mo. LIBOR + 5.00% | | | 250,361 | |
| | | |
| | 281,250 | | | | | Weight Watchers International, Inc.‡
7.350%, 11/29/24
3 mo. LIBOR + 4.75% | | | 271,231 | |
| | | | | | | | | | |
| | | | | | | | | 591,371 | |
| | | | | | | | | | |
| | | | | | Consumer Staples (0.5%) | |
| | 222,418 | | | | | JBS USA LUX, SA!
10/30/22 | | | 222,823 | |
| | | | | | | | | | |
| | | | | | Energy (0.5%) | |
| | 100,000 | | | | | Epic Crude Services, LP‡
7.490%, 02/20/26
1 mo. LIBOR + 5.00% | | | 99,834 | |
| | | |
| | 118,800 | | | | | McDermott Technology Americas, Inc.‡
7.483%, 05/10/25
1 mo. LIBOR + 5.00% | | | 117,822 | |
| | | | | | | | | | |
| | | | | | | | | 217,656 | |
| | | | | | | | | | |
| | | | | | Financials (1.3%) | |
| | 54,412 | | | | | AssuredPartners, Inc.‡
5.733%, 10/22/24
1 mo. LIBOR + 3.25% | | | 54,242 | |
| | | |
| | 272,250 | | | | | Genworth Holdings, Inc.‡
6.987%, 03/07/23
1 mo. LIBOR + 4.50% | | | 275,143 | |
| | | |
| | 89,091 | | | | | GLP Financing, LLC‡
3.977%, 04/28/21
1 mo. LIBOR + 1.50% | | | 88,590 | |
| | | | | | | | | | |
PRINCIPAL
AMOUNT | | | | | | | VALUE | |
| | | |
| | 198,500 | | | | | HUB International, Ltd.‡
5.336%, 04/25/25
3 mo. LIBOR + 2.75% | | $ | 196,763 | |
| | | | | | | | | | |
| | | | | | | | | 614,738 | |
| | | | | | | | | | |
| | | | | | Health Care (3.3%) | |
| | 272,874 | | | | | Amneal Pharmaceuticals, LLC‡
6.000%, 05/04/25
1 mo. LIBOR + 3.50% | | | 274,204 | |
| | | |
| | 254,375 | | | | | Bausch Health Americas, Inc.‡
5.474%, 06/02/25
1 mo. LIBOR + 3.00% | | | 255,820 | |
| | | |
| | 195,000 | | | | | Gentiva Health Services, Inc.‡
9.500%, 07/02/26
1 mo. LIBOR + 7.00% | | | 200,728 | |
| | | |
| | 68,074 | | | | | Gentiva Health Services, Inc.‡
6.250%, 07/02/25
1 mo. LIBOR + 3.75% | | | 68,372 | |
| | | |
| | 258,520 | | | | | Mallinckrodt International Finance, SA‡
5.351%, 09/24/24
3 mo. LIBOR + 2.75% | | | 233,591 | |
| | | |
| | 269,500 | | | | | Ortho Clinical Diagnostics, SA‡
5.733%, 06/30/25
1 mo. LIBOR + 3.25% | | | 264,784 | |
| | | |
| | 271,537 | | | | | Team Health Holdings, Inc.‡
5.233%, 02/06/24
1 mo. LIBOR + 2.75% | | | 255,584 | |
| | | | | | | | | | |
| | | | | | | | | 1,553,083 | |
| | | | | | | | | | |
| | | | | | Industrials (0.5%) | |
| | 250,000 | | | | | Dun & Bradstreet Corporation (The)‡
7.479%, 02/01/26
1 mo. LIBOR + 5.00% | | | 252,189 | |
| | | | | | | | | | |
| | | | | | Information Technology (1.1%) | |
| | 249,375 | | | | | BMC Software Finance, Inc.‡
6.851%, 10/02/25
3 mo. LIBOR + 4.25% | | | 248,284 | |
| | | |
| | 250,000 | | | | | First Data Corp.‡
4.481%, 04/26/24
1 mo. LIBOR + 2.00% | | | 250,235 | |
| | | | | | | | | | |
| | | | | | | | | 498,519 | |
| | | | | | | | | | |
| | | |
| | | | | | TOTAL BANK LOANS
(Cost $5,002,118) | | | 5,002,712 | |
| | | | | | | | | | |
| | | | | | | | | | |
NUMBER OF
SHARES | | | | | | | VALUE | |
|
| | CONVERTIBLE PREFERRED STOCKS (0.9%) | |
| | | | | | Energy (0.9%) | |
| | | | | | NuStar Energy, LP‡ | | | | |
| | 12,850 | | | | | 7.625%, 06/15/22
3 mo. USD LIBOR + 5.64% | | | 265,224 | |
| | 6,917 | | | | | 8.500%, 12/15/21
3 mo. USD LIBOR + 6.77% | | | 162,273 | |
| | | | | | | | | | |
| | | | | | TOTAL CONVERTIBLE PREFERRED STOCKS
(Cost $506,756) | | | 427,497 | |
| | | | | | | | | | |
| | | | |
| 142 | | CALAMOS OPEN-END FAMILY OF FUNDS SEMIANNUAL REPORT | | See accompanying Notes to Schedule of Investments |
High Income Opportunities Fund Schedule of Investments April 30, 2019 (Unaudited)
| | | | | | | | | | |
NUMBER OF
SHARES | | | | | | | VALUE | |
|
| | COMMON STOCKS (1.6%) | |
| | | | | | Communication Services (0.1%) | |
| | 1,527 | | | | | Cumulus Media, Inc. - Class A# | | $ | 27,669 | |
| | | | | | | | | | |
| | | | | | Energy (1.5%) | |
| | 215 | | | | | Chevron Corp. | | | 25,813 | |
| | | |
| | 6,100 | | | | | Energy Transfer, LP | | | 92,232 | |
| | | |
| | 4,645 | | | | | Enterprise Products Partners, LP | | | 132,986 | |
| | | |
| | 1,525 | | | | | GasLog, Ltd. | | | 23,836 | |
| | | |
| | 1,840 | | | | | Magellan Midstream Partners, LP | | | 114,098 | |
| | | |
| | 790 | | | | | Schlumberger, Ltd. | | | 33,717 | |
| | | |
| | 2,675 | | | | | Targa Resources Corp. | | | 107,401 | |
| | | |
| | 4,769 | | | | | Tidewater, Inc.# | | | 107,303 | |
| | | |
| | 5,504 | | | | | Transocean, Ltd.^# | | | 43,261 | |
| | | |
| | 965 | | | | | Williams Companies, Inc. | | | 27,339 | |
| | | | | | | | | | |
| | | | 707,986 | |
| | | | | |
| | | |
| | | | | | TOTAL COMMON STOCKS
(Cost $754,276) | | | 735,655 | |
| | | | | | | | | | |
|
| | SHORT TERM INVESTMENTS (4.9%) | |
| | 1,119,269 | | | | | Fidelity Prime Money Market Fund - Institutional Class, 2.500%*** | | | 1,119,605 | |
| | | |
| | 1,119,280 | | | | | Morgan Stanley Institutional Liquidity Funds - Government Portfolio, 2.350%*** | | | 1,119,280 | |
| | | | | | | | | | |
| | | |
| | | | | | TOTAL SHORT TERM INVESTMENTS
(Cost $2,238,956) | | | 2,238,885 | |
| | | | | | | | | | |
| | | | | | | | | | |
NUMBER OF
SHARES/
PRINCIPAL
AMOUNT | | | | | | | VALUE | |
|
| INVESTMENT OF CASH COLLATERAL FOR SECURITIES
LOANED (12.5%) |
|
| | 5,792,850 | | | | | State Street Navigator Securities Lending Government Money Market Portfolio†
(Cost $5,792,850) | | | 5,792,850 | |
| | | | | | | | | | |
| |
| TOTAL INVESTMENTS (112.0%)
(Cost $53,027,358) | | | 51,861,613 | |
| | | | | | | | | | |
| |
| | PAYABLE UPON RETURN OF SECURITIES ON LOAN(-12.5%) | | | (5,792,850 | ) |
| | | | | | | | | | |
| |
| | OTHER ASSETS, LESS LIABILITIES (0.5%) | | | 247,793 | |
| | | | | | | | | | |
| |
| | NET ASSETS (100.0%) | | $ | 46,316,556 | |
| | | | | | | | | | |
NOTES TO SCHEDULE OF INVESTMENTS
| * | Securities issued and sold pursuant to a Rule 144A transaction are excepted from the registration requirement of the Securities Act of 1933, as amended. These securities may only be sold to qualified institutional buyers (“QIBs”), such as the Fund. Any resale of these securities must generally be effected through a sale that is registered under the Act or otherwise exempted from such registration requirements. |
| ^ | Security, or portion of security, is on loan. |
| @ | In default status and considerednon-income producing. |
| ‡ | Variable rate security. The rate shown is the rate in effect at April 30, 2019. |
| ! | This position represents an unsettled loan commitment at period end. Certain details associated with this purchase are not known prior to the settlement date, including coupon rate, which will be adjusted on settlement date. |
| # | Non-income producing security. |
| *** | The rate disclosed is the 7 day net yield as of April 30, 2019. |
| † | Represents investment of cash collateral received from securities on loan as of April 30, 2019. |
| | | | | | |
| See accompanying Notes to Financial Statements | | www.calamos.com | | | 143 | |
Short-Term Bond Fund Schedule of Investments April 30, 2019 (Unaudited)
| | | | | | | | | | |
PRINCIPAL
AMOUNT | | | | | | | VALUE | |
|
| | CORPORATE BONDS (62.1%) | |
| | | | | | Airlines (0.4%) | |
| | 227,181 | | | | | American Airlines Pass Through Trust Series2013-2, Class B*
5.600%, 07/15/20 | | $ | 230,537 | |
| | | |
| | 518,625 | | | | | UAL Pass Through Trust Series2007-1
6.636%, 07/02/22 | | | 547,178 | |
| | | | | | | | | | |
| | | | | | | | | 777,715 | |
| | | | | | | | | | |
| | | | | | Communication Services (2.5%) | |
| | 500,000 | | | | | Activision Blizzard, Inc.
2.300%, 09/15/21 | | | 494,155 | |
| | | |
| | | | | | AT&T, Inc. | | | | |
| | 250,000 | | | | | 2.800%, 02/17/21 | | | 250,204 | |
| | 225,000 | | | | | 2.450%, 06/30/20 | | | 224,372 | |
| | | |
| | 200,000 | | | | | Charter Communications Operating, LLC / Charter Communications Operating Capital
4.464%, 07/23/22 | | | 207,606 | |
| | | |
| | 500,000 | | | | | Comcast Corp.
3.300%, 10/01/20 | | | 504,340 | |
| | | |
| | 500,000 | | | | | Electronic Arts, Inc.
3.700%, 03/01/21 | | | 507,743 | |
| | | |
| | 500,000 | | | | | Fox Corp.*
3.666%, 01/25/22 | | | 510,647 | |
| | | |
| | 250,000 | | | | | Hughes Satellite Systems Corp.
6.500%, 06/15/19 | | | 251,186 | |
| | | |
| | | | | | Netflix, Inc. | | | | |
| | 250,000 | | | | | 5.500%, 02/15/22 | | | 263,530 | |
| | 250,000 | | | | | 5.375%, 02/01/21 | | | 260,036 | |
| | | |
| | 250,000 | | | | | Qwest Corp.
6.750%, 12/01/21 | | | 266,594 | |
| | | |
| | 312,500 | | | | | Sprint Spectrum Company, LLC / Sprint Spectrum Company II, LLC / Sprint Spectrum Company III, LLC*
3.360%, 09/20/21 | | | 312,252 | |
| | | |
| | 250,000 | | | | | T-Mobile USA, Inc.^
4.000%, 04/15/22 | | | 254,185 | |
| | | |
| | 250,000 | | | | | Tencent Holdings, Ltd.*
3.375%, 05/02/19 | | | 250,000 | |
| | | | | | | | | | |
| | | | | | | | | 4,556,850 | |
| | | | | | | | | | |
| | | | | | Consumer Discretionary (7.9%) | |
| | | | | | American Honda Finance Corp.^ | | | | |
| | 250,000 | | | | | 3.150%, 01/08/21 | | | 252,304 | |
| | 250,000 | | | | | 2.000%, 02/14/20 | | | 248,611 | |
| | | |
| | | | | | BMW US Capital, LLC* | | | | |
| | 250,000 | | | | | 3.100%, 04/12/21 | | | 251,891 | |
| | 250,000 | | | | | 2.950%, 04/14/22 | | | 250,885 | |
| | 250,000 | | | | | 2.000%, 04/11/21 | | | 246,783 | |
| | | |
| | | | | | Cargill, Inc.* | | | | |
| | 500,000 | | | | | 3.250%, 11/15/21 | | | 505,475 | |
| | 250,000 | | | | | 3.050%, 04/19/21 | | | 251,538 | |
| | | |
| | 159,532 | | | | | Continental Airlines Pass Through Trust Series2012-2, Class B
5.500%, 10/29/20 | | | 163,634 | |
| | | | | | | | | | |
PRINCIPAL
AMOUNT | | | | | | | VALUE | |
| | | |
| | | | | | D.R. Horton, Inc. | | | | |
| | 250,000 | | | | | 4.000%, 02/15/20 | | $ | 252,157 | |
| | 250,000 | | | | | 2.550%, 12/01/20 | | | 248,921 | |
| | | |
| | | | | | Daimler Finance North America, LLC* | | | | |
| | 500,000 | | | | | 3.000%, 02/22/21 | | | 501,045 | |
| | 250,000 | | | | | 3.400%, 02/22/22 | | | 252,825 | |
| | | |
| | 327,177 | | | | | Delta Air Lines Pass Through TrustSeries 2007-1, Class A
6.821%, 08/10/22 | | | 357,106 | |
| | | |
| | 272,622 | | | | | Delta Air Lines Pass Through TrustSeries 2007-1, Class B
8.021%, 08/10/22 | | | 299,809 | |
| | | |
| | 16,964 | | | | | Delta Air Lines Pass Through TrustSeries 2010-2, Class A
4.950%, 05/23/19 | | | 16,990 | |
| | | |
| | 323,802 | | | | | Delta Air Lines Pass Through TrustSeries 2012-1, Class A
4.750%, 05/07/20 | | | 328,539 | |
| | | |
| | 252,000 | | | | | Expedia Group, Inc.
5.950%, 08/15/20 | | | 262,086 | |
| | | |
| | 250,000 | | | | | Ford Motor Credit Company, LLC
2.343%, 11/02/20 | | | 246,393 | |
| | | |
| | | | | | General Motors Financial Company, Inc. | | | | |
| | 400,000 | | | | | 3.200%, 07/06/21 | | | 399,924 | |
| | 250,000 | | | | | 3.200%, 07/13/20 | | | 250,630 | |
| | 100,000 | | | | | 3.150%, 01/15/20 | | | 100,135 | |
| | | |
| | 500,000 | | | | | GLP Capital, LP / GLP Financing II, Inc.
4.875%, 11/01/20 | | | 509,910 | |
| | | |
| | 505,000 | | | | | goeasy, Ltd.*
7.875%, 11/01/22 | | | 531,043 | |
| | | |
| | 500,000 | | | | | Harley-Davidson Financial Services, Inc.*
3.550%, 05/21/21 | | | 505,112 | |
| | | |
| | 750,000 | | | | | Hasbro, Inc.
3.150%, 05/15/21 | | | 753,375 | |
| | | |
| | 250,000 | | | | | Home Depot, Inc.
3.250%, 03/01/22 | | | 254,812 | |
| | | |
| | 250,000 | | | | | International Game Technology, PLC*
6.250%, 02/15/22 | | | 262,206 | |
| | | |
| | | | | | Lennar Corp. | | | | |
| | 250,000 | | | | | 6.250%, 12/15/21 | | | 264,319 | |
| | 250,000 | | | | | 4.500%, 11/15/19 | | | 250,800 | |
| | | |
| | | | | | Marriott International, Inc.‡ | | | | |
| | 500,000 | | | | | 3.245%, 03/08/21 | | | 502,002 | |
| | 250,000 | | | | | 3.226%, 12/01/20
3 mo. USD LIBOR + .60% | | | 251,263 | |
| | | |
| | 500,000 | | | | | Mattel, Inc.
2.350%, 08/15/21 | | | 481,507 | |
| | | |
| | 432,000 | | | | | McDonald’s Corp.
3.500%, 07/15/20 | | | 436,588 | |
| | | |
| | 250,000 | | | | | Nissan Motor Acceptance Corp.*
2.150%, 07/13/20 | | | 247,154 | |
| | | |
| | 500,000 | | | | | Nordstrom, Inc.
4.750%, 05/01/20 | | | 509,430 | |
| | | |
| | 250,000 | | | | | Penske Automotive Group, Inc.
3.750%, 08/15/20 | | | 251,088 | |
| | | | |
| 144 | | CALAMOS OPEN-END FAMILY OF FUNDS SEMIANNUAL REPORT | | See accompanying Notes to Schedule of Investments |
Short-Term Bond Fund Schedule of Investments April 30, 2019 (Unaudited)
| | | | | | | | | | |
PRINCIPAL
AMOUNT | | | | | | | VALUE | |
| | | |
| | 500,000 | | | | | Penske Truck Leasing Company, LP / PTL Finance Corp.*
3.650%, 07/29/21 | | $ | 506,535 | |
| | | |
| | 250,000 | | | | | Sirius XM Radio, Inc.*
3.875%, 08/01/22 | | | 250,814 | |
| | | |
| | 500,000 | | | | | Taylor Morrison Communities Corp.
6.625%, 05/15/22 | | | 517,115 | |
| | | |
| | 380,000 | | | | | Toll Brothers Finance Corp.
6.750%, 11/01/19 | | | 387,720 | |
| | | |
| | | | | | Toyota Motor Credit Corp. | | | | |
| | 250,000 | | | | | 2.950%, 04/13/21 | | | 251,972 | |
| | 250,000 | | | | | 2.650%, 04/12/22 | | | 250,659 | |
| | | |
| | 572,949 | | | | | US Airways Pass Through TrustSeries 2012-2, Class B
6.750%, 06/03/21 | | | 602,135 | |
| | | | | | | | | | |
| | | | | | | | | 14,465,240 | |
| | | | | | | | | | |
| | | | | | Consumer Staples (2.4%) | |
| | 500,000 | | | | | Altria Group, Inc.^
3.490%, 02/14/22 | | | 506,877 | |
| | | |
| | 250,000 | | | | | Anheuser-Busch InBev Finance, Inc.
2.650%, 02/01/21 | | | 249,738 | |
| | | |
| | 250,000 | | | | | Archer-Daniels-Midland Company
3.375%, 03/15/22 | | | 254,903 | |
| | | |
| | 100,000 | | | | | Conagra Brands, Inc.‡
3.092%, 10/09/20
3 mo. USD LIBOR + .50% | | | 99,719 | |
| | | |
| | | | | | Constellation Brands, Inc. | | | | |
| | 250,000 | | | | | 2.250%, 11/06/20^ | | | 247,860 | |
| | 250,000 | | | | | 2.000%, 11/07/19 | | | 248,843 | |
| | | |
| | | | | | General Mills, Inc. | | | | |
| | 516,000 | | | | | 3.200%, 04/16/21 | | | 520,283 | |
| | 250,000 | | | | | 2.200%, 10/21/19 | | | 249,376 | |
| | | |
| | 95,000 | | | | | JBS USA LUX, SA / JBS USA Finance, Inc.*
7.250%, 06/01/21 | | | 95,400 | |
| | | |
| | 250,000 | | | | | Land O’Lakes, Inc.*
6.000%, 11/15/22 | | | 258,108 | |
| | | |
| | 500,000 | | | | | Mondelez International Holdings Netherlands, BV*
2.000%, 10/28/21 | | | 488,672 | |
| | | |
| | | | | | Unilever Capital Corp. | | | | |
| | 350,000 | | | | | 4.250%, 02/10/21 | | | 360,489 | |
| | 150,000 | | | | | 3.000%, 03/07/22 | | | 151,739 | |
| | | |
| | 685,000 | | | | | WM Wrigley Jr. Company*
3.375%, 10/21/20 | | | 691,086 | |
| | | | | | | | | | |
| | | | | | | | | 4,423,093 | |
| | | | | | | | | | |
| | | | | | Energy (2.9%) | |
| | 300,000 | | | | | CenterPoint Energy Houston Electric, LLC
1.850%, 06/01/21 | | | 295,145 | |
| | | |
| | 225,000 | | | | | Chevron Corp.
2.100%, 05/16/21 | | | 222,623 | |
| | | |
| | 456,000 | | | | | Continental Resources, Inc.
5.000%, 09/15/22 | | | 459,739 | |
| | | | | | | | | | |
PRINCIPAL
AMOUNT | | | | | | | VALUE | |
| | | |
| | 500,000 | | | | | DCP Midstream Operating, LP*
4.750%, 09/30/21 | | $ | 511,597 | |
| | | |
| | | | | | Enterprise Products Operating, LLC | | | | |
| | 250,000 | | | | | 3.500%, 02/01/22 | | | 254,303 | |
| | 250,000 | | | | | 2.550%, 10/15/19 | | | 249,693 | |
| | 125,000 | | | | | 2.850%, 04/15/21 | | | 125,075 | |
| | | |
| | 500,000 | | | | | Halliburton Company
3.250%, 11/15/21 | | | 504,937 | |
| | | |
| | 225,000 | | | | | Magellan Midstream Partners, LP
4.250%, 02/01/21 | | | 230,474 | |
| | | |
| | 750,000 | | | | | Midwest Connector Capital Company, LLC*
3.625%, 04/01/22 | | | 761,145 | |
| | | |
| | 500,000 | | | | | Saudi Arabian Oil Company*
2.750%, 04/16/22 | | | 497,168 | |
| | | |
| | 750,000 | | | | | Schlumberger Holdings Corp.*
3.000%, 12/21/20 | | | 752,501 | |
| | | |
| | 500,000 | | | | | TransCanada PipeLines, Ltd.
3.800%, 10/01/20 | | | 507,607 | |
| | | | | | | | | | |
| | | | | | | | | 5,372,007 | |
| | | | | | | | | | |
| | | | | | Financials (25.2%) | |
| | 150,000 | | | | | AerCap Ireland Capital DAC / AerCap Global Aviation Trust^
4.450%, 12/16/21 | | | 154,149 | |
| | | |
| | | | | | Ally Financial, Inc. | | | | |
| | 250,000 | | | | | 4.250%, 04/15/21 | | | 253,850 | |
| | 250,000 | | | | | 4.125%, 03/30/20 | | | 251,599 | |
| | | |
| | | | | | American Express Company | | | | |
| | 250,000 | | | | | 3.700%, 11/05/21 | | | 255,418 | |
| | 250,000 | | | | | 3.000%, 02/22/21 | | | 251,114 | |
| | | |
| | 250,000 | | | | | American Express Credit Corp.
2.375%, 05/26/20 | | | 249,185 | |
| | | |
| | 500,000 | | | | | American International Group, Inc.
3.300%, 03/01/21 | | | 503,820 | |
| | | |
| | 750,000 | | | | | Ameriprise Financial, Inc.
3.000%, 03/22/22 | | | 753,247 | |
| | | |
| | 350,000 | | | | | AON Corp.
5.000%, 09/30/20 | | | 361,330 | |
| | | |
| | 500,000 | | | | | Aviation Capital Group, LLC*
2.875%, 01/20/22 | | | 495,750 | |
| | | |
| | 608,000 | | | | | AXIS Specialty Finance, LLC
5.875%, 06/01/20 | | | 627,541 | |
| | | |
| | 500,000 | | | | | Bank of America Corp.‡
2.369%, 07/21/21
3 mo. USD LIBOR + .66% | | | 497,055 | |
| | | |
| | | | | | Bank of Montreal | | | | |
| | 500,000 | | | | | 2.900%, 03/26/22 | | | 501,237 | |
| | 250,000 | | | | | 3.100%, 04/13/21 | | | 252,393 | |
| | 250,000 | | | | | 2.100%, 06/15/20 | | | 248,679 | |
| | | |
| | 250,000 | | | | | Bank of New York Mellon Corp.
2.450%, 11/27/20 | | | 249,480 | |
| | | |
| | 500,000 | | | | | Bank of Nova Scotia
2.500%, 01/08/21 | | | 498,898 | |
| | | | | | |
| See accompanying Notes to Schedule of Investments | | www.calamos.com | | | 145 | |
Short-Term Bond Fund Schedule of Investments April 30, 2019 (Unaudited)
| | | | | | | | | | |
PRINCIPAL
AMOUNT | | | | | | | VALUE | |
| | | |
| | | | | | BB&T Corp. | | | | |
| | 500,000 | | | | | 3.200%, 09/03/21^ | | $ | 505,365 | |
| | 250,000 | | | | | 3.050%, 06/20/22 | | | 251,794 | |
| | | |
| | 500,000 | | | | | Blackstone Holdings Finance Company, LLC*
5.875%, 03/15/21 | | | 526,605 | |
| | | |
| | | | | | BP Capital Markets, PLC | | | | |
| | 400,000 | | | | | 3.561%, 11/01/21 | | | 408,492 | |
| | 100,000 | | | | | 2.315%, 02/13/20^ | | | 99,706 | |
| | | |
| | 500,000 | | | | | Capital One Financial Corp.
3.450%, 04/30/21 | | | 506,062 | |
| | | |
| | | | | | Caterpillar Financial Services Corp. | | | | |
| | 400,000 | | | | | 3.350%, 12/07/20 | | | 404,644 | |
| | 250,000 | | | | | 2.950%, 02/26/22 | | | 251,858 | |
| | 100,000 | | | | | 2.100%, 01/10/20 | | | 99,637 | |
| | | |
| | 250,000 | | | | | Charles Schwab Corp.
3.250%, 05/21/21 | | | 252,983 | |
| | | |
| | 500,000 | | | | | Chubb INA Holdings, Inc.^
2.300%, 11/03/20 | | | 497,665 | |
| | | |
| | 500,000 | | | | | CIT Group, Inc.
4.125%, 03/09/21 | | | 507,682 | |
| | | |
| | 500,000 | | | | | Citibank, N.A.
3.165%, 02/19/22 | | | 502,492 | |
| | | |
| | 250,000 | | | | | Citigroup, Inc.
2.400%, 02/18/20 | | | 249,326 | |
| | | |
| | 250,000 | | | | | Citizens Bank, N.A.
3.250%, 02/14/22 | | | 252,339 | |
| | | |
| | 250,000 | | | | | CNO Financial Group, Inc.^
4.500%, 05/30/20 | | | 253,096 | |
| | | |
| | 500,000 | | | | | Comerica Bank
2.500%, 06/02/20 | | | 498,700 | |
| | | |
| | 500,000 | | | | | Discover Bank
3.100%, 06/04/20 | | | 501,437 | |
| | | |
| | 750,000 | | | | | Duke Realty, LP
3.875%, 02/15/21 | | | 762,637 | |
| | | |
| | 500,000 | | | | | ERP Operating, LP
4.625%, 12/15/21 | | | 521,725 | |
| | | |
| | 500,000 | | | | | Essex Portfolio, LP
3.625%, 08/15/22 | | | 508,945 | |
| | | |
| | | | | | European Investment Bank | | | | |
| | 1,500,000 | | | | | 2.000%, 03/15/21 | | | 1,490,580 | |
| | 1,000,000 | | | | | 1.625%, 12/15/20 | | | 988,490 | |
| | | |
| | 500,000 | | | | | Fifth Third Bank
2.875%, 10/01/21 | | | 502,142 | |
| | | |
| | 497,000 | | | | | Franklin Resources, Inc.
2.800%, 09/15/22 | | | 497,335 | |
| | | |
| | | | | | Goldman Sachs Group, Inc. | | | | |
| | 500,000 | | | | | 3.000%, 04/26/22 | | | 500,982 | |
| | 225,000 | | | | | 2.625%, 04/25/21 | | | 224,448 | |
| | | |
| | | | | | Hyundai Capital America* | | | | |
| | 250,000 | | | | | 3.950%, 02/01/22^ | | | 254,054 | |
| | 250,000 | | | | | 2.600%, 03/19/20 | | | 248,706 | |
| | | |
| | | | | | Inter-American Development Bank | | | | |
| | 1,500,000 | | | | | 2.125%, 11/09/20 | | | 1,494,397 | |
| | 1,000,000 | | | | | 1.750%, 04/14/22 | | | 984,100 | |
| | | | | | | | | | |
PRINCIPAL
AMOUNT | | | | | | | VALUE | |
| | | |
| | | | | | International Bank for Reconstruction & Development | | | | |
| | 1,500,000 | | | | | 1.375%, 05/24/21 | | $ | 1,471,125 | |
| | 1,000,000 | | | | | 1.625%, 02/10/22 | | | 981,880 | |
| | | |
| | 100,000 | | | | | International Lease Finance Corp.
4.625%, 04/15/21 | | | 102,657 | |
| | | |
| | 500,000 | | | | | Jackson National Life Global Funding*
3.300%, 06/11/21 | | | 505,465 | |
| | | |
| | 350,000 | | | | | Jefferies Finance, LLC*
7.375%, 04/01/20 | | | 350,935 | |
| | | |
| | | | | | John Deere Capital Corp. | | | | |
| | 500,000 | | | | | 3.200%, 01/10/22 | | | 507,477 | |
| | 100,000 | | | | | 2.050%, 03/10/20 | | | 99,532 | |
| | | |
| | 250,000 | | | | | JPMorgan Chase & Company^
2.250%, 01/23/20 | | | 249,288 | |
| | | |
| | 500,000 | | | | | JPMorgan Chase Bank, N.A.‡
2.604%, 02/01/21 | | | 499,360 | |
| | | |
| | 500,000 | | | | | KeyCorp
2.900%, 09/15/20 | | | 501,497 | |
| | | |
| | | | | | Kreditanstalt fuer Wiederaufbau | | | | |
| | 2,000,000 | | | | | 2.500%, 02/15/22 | | | 2,009,380 | |
| | 1,500,000 | | | | | 1.500%, 04/20/20 | | | 1,486,537 | |
| | 1,000,000 | | | | | 1.875%, 12/15/20 | | | 992,410 | |
| | | |
| | 100,000 | | | | | Markel Corp.
5.350%, 06/01/21 | | | 104,794 | |
| | | |
| | | | | | Marsh & McLennan Companies, Inc. | | | | |
| | 250,000 | | | | | 4.800%, 07/15/21 | | | 259,250 | |
| | 250,000 | | | | | 2.350%, 03/06/20 | | | 249,183 | |
| | | |
| | 100,000 | | | | | MetLife, Inc.
4.750%, 02/08/21 | | | 103,638 | |
| | | |
| | 500,000 | | | | | Metropolitan Life Global Funding I*
3.375%, 01/11/22 | | | 508,117 | |
| | | |
| | 750,000 | | | | | Mitsubishi UFJ Financial Group, Inc.
3.218%, 03/07/22 | | | 756,735 | |
| | | |
| | 390,000 | | | | | Morgan Stanley
2.650%, 01/27/20 | | | 389,858 | |
| | | |
| | 250,000 | | | | | Nasdaq, Inc.
5.550%, 01/15/20 | | | 254,883 | |
| | | |
| | 500,000 | | | | | NatWest Markets, PLC*
3.625%, 09/29/22 | | | 501,490 | |
| | | |
| | 500,000 | | | | | New York Life Global Funding*
2.950%, 01/28/21 | | | 502,972 | |
| | | |
| | 500,000 | | | | | PACCAR Financial Corp.
2.850%, 03/01/22 | | | 503,772 | |
| | | |
| | 500,000 | | | | | PNC Bank, N.A.
2.500%, 01/22/21 | | | 498,838 | |
| | | |
| | 250,000 | | | | | Progressive Corp.
3.750%, 08/23/21 | | | 258,494 | |
| | | |
| | | | | | Prudential Financial, Inc. | | | | |
| | 250,000 | | | | | 4.500%, 11/16/21 | | | 261,110 | |
| | 250,000 | | | | | 2.350%, 08/15/19 | | | 249,684 | |
| | | |
| | 1,000,000 | | | | | Reliance Standard Life Global Funding II*
3.850%, 09/19/23 | | | 1,018,120 | |
| | | |
| | 500,000 | | | | | Royal Bank of Canada
2.500%, 01/19/21 | | | 499,520 | |
| | | | |
| 146 | | CALAMOS OPEN-END FAMILY OF FUNDS SEMIANNUAL REPORT | | See accompanying Notes to Schedule of Investments |
Short-Term Bond Fund Schedule of Investments April 30, 2019 (Unaudited)
| | | | | | | | | | |
PRINCIPAL
AMOUNT | | | | | | | VALUE | |
| | | |
| | 250,000 | | | | | Royal Bank Of Canada
2.800%, 04/29/22 | | $ | 250,299 | |
| | | |
| | 750,000 | | | | | Santander Holdings USA, Inc.
3.700%, 03/28/22 | | | 759,904 | |
| | | |
| | 260,000 | | | | | SBA Tower Trust*
3.156%, 10/08/20 | | | 260,166 | |
| | | |
| | 500,000 | | | | | Shell International Finance, BV
1.875%, 05/10/21 | | | 493,420 | |
| | | |
| | 500,000 | | | | | Silversea Cruise Finance, Ltd.*
7.250%, 02/01/25 | | | 538,462 | |
| | | |
| | 750,000 | | | | | Skandinaviska Enskilda Banken, AB*^
3.050%, 03/25/22 | | | 752,175 | |
| | | |
| | 250,000 | | | | | Starwood Property Trust, Inc.
3.625%, 02/01/21 | | | 249,288 | |
| | | |
| | 500,000 | | | | | SunTrust Banks, Inc.
2.900%, 03/03/21 | | | 501,447 | |
| | | |
| | | | | | Toronto-Dominion Bank | | | | |
| | 350,000 | | | | | 2.550%, 01/25/21 | | | 349,682 | |
| | 150,000 | | | | | 3.150%, 09/17/20 | | | 151,109 | |
| | | |
| | 500,000 | | | | | Travelers Companies, Inc.
3.900%, 11/01/20 | | | 509,760 | |
| | | |
| | 250,000 | | | | | US Bancorp^
2.350%, 01/29/21 | | | 249,560 | |
| | | |
| | 250,000 | | | | | US Bank, N.A.
3.450%, 11/16/21 | | | 254,876 | |
| | | |
| | | | | | USAA Capital Corp.* | | | | |
| | 510,000 | | | | | 2.000%, 06/01/21 | | | 502,921 | |
| | 450,000 | | | | | 2.450%, 08/01/20 | | | 449,438 | |
| | | |
| | 500,000 | | | | | Ventas Realty, LP
3.125%, 06/15/23 | | | 502,095 | |
| | | |
| | 200,000 | | | | | Ventas Realty, LP / Ventas Capital Corp.
2.700%, 04/01/20 | | | 199,898 | |
| | | |
| | 100,000 | | | | | Weingarten Realty Investors
3.375%, 10/15/22 | | | 100,532 | |
| | | |
| | 250,000 | | | | | Wells Fargo & Company
2.500%, 03/04/21 | | | 248,884 | |
| | | |
| | 500,000 | | | | | Zions Bancorporation, N.A.
3.350%, 03/04/22 | | | 504,717 | |
| | | | | | | | | | |
| | | | | | | | | 46,459,803 | |
| | | | | | | | | | |
| | | | | | Health Care (5.6%) | |
| | | | | | AbbVie, Inc. | | | | |
| | 250,000 | | | | | 3.375%, 11/14/21 | | | 252,749 | |
| | 250,000 | | | | | 2.500%, 05/14/20 | | | 249,306 | |
| | | |
| | | | | | Amgen, Inc. | | | | |
| | 250,000 | | | | | 2.125%, 05/01/20 | | | 248,621 | |
| | 250,000 | | | | | 1.850%, 08/19/21 | | | 245,086 | |
| | | |
| | 250,000 | | | | | Anthem, Inc.
2.250%, 08/15/19 | | | 249,546 | |
| | | |
| | 500,000 | | | | | AstraZeneca, PLC
2.375%, 11/16/20 | | | 497,473 | |
| | | |
| | 250,000 | | | | | Baxter International, Inc.
1.700%, 08/15/21 | | | 244,011 | |
| | | | | | | | | | |
PRINCIPAL
AMOUNT | | | | | | | VALUE | |
| | | |
| | | | | | Celgene Corp. | | | | |
| | 500,000 | | | | | 2.875%, 08/15/20 | | $ | 500,328 | |
| | 250,000 | | | | | 3.550%, 08/15/22 | | | 254,568 | |
| | | |
| | | | | | Centene Corp. | | | | |
| | 500,000 | | | | | 4.750%, 05/15/22 | | | 509,797 | |
| | 250,000 | | | | | 5.625%, 02/15/21 | | | 254,310 | |
| | | |
| | 500,000 | | | | | Coventry Health Care, Inc.
5.450%, 06/15/21 | | | 522,360 | |
| | | |
| | 500,000 | | | | | CVS Health Corp.
3.125%, 03/09/20 | | | 501,038 | |
| | | |
| | 250,000 | | | | | Elanco Animal Health, Inc.*
3.912%, 08/27/21 | | | 254,556 | |
| | | |
| | | | | | Gilead Sciences, Inc. | | | | |
| | 500,000 | | | | | 3.250%, 09/01/22 | | | 508,112 | |
| | 250,000 | | | | | 2.550%, 09/01/20 | | | 249,726 | |
| | 250,000 | | | | | 2.350%, 02/01/20^ | | | 249,569 | |
| | | |
| | | | | | GlaxoSmithKline Capital, PLC | | | | |
| | 500,000 | | | | | 2.850%, 05/08/22 | | | 501,923 | |
| | 100,000 | | | | | 3.043%, 05/14/21‡
3 mo. USD LIBOR + .35% | | | 100,235 | |
| | | |
| | | | | | HCA, Inc. | | | | |
| | 275,000 | | | | | 5.875%, 03/15/22 | | | 294,330 | |
| | 225,000 | | | | | 6.500%, 02/15/20 | | | 231,021 | |
| | | |
| | 500,000 | | | | | Horizon Pharma USA, Inc.*
8.750%, 11/01/24 | | | 541,837 | |
| | | |
| | 250,000 | | | | | McKesson Corp.
3.650%, 11/30/20 | | | 253,184 | |
| | | |
| | 137,000 | | | | | Mylan, NV
2.500%, 06/07/19 | | | 136,929 | |
| | | |
| | 500,000 | | | | | Takeda Pharmaceutical Company, Ltd.*
3.800%, 11/26/20 | | | 507,200 | |
| | | |
| | 850,000 | | | | | Teva Pharmaceutical Finance Netherlands III, BV
2.200%, 07/21/21 | | | 816,735 | |
| | | |
| | 500,000 | | | | | Thermo Fisher Scientific, Inc.
4.500%, 03/01/21 | | | 515,430 | |
| | | |
| | | | | | UnitedHealth Group, Inc. | | | | |
| | 100,000 | | | | | 2.871%, 06/15/21‡
3 mo. USD LIBOR + .26% | | | 100,010 | |
| | 100,000 | | | | | 2.300%, 12/15/19 | | | 99,792 | |
| | | |
| | | | | | Zoetis, Inc. | | | | |
| | 254,000 | | | | | 3.450%, 11/13/20 | | | 256,454 | |
| | 250,000 | | | | | 3.250%, 08/20/21 | | | 252,491 | |
| | | | | | | | | | |
| | | | | | | | | 10,398,727 | |
| | | | | | | | | | |
| | | | | | Industrials (4.9%) | |
| | 200,000 | | | | | 3M Company^
3.000%, 09/14/21 | | | 202,333 | |
| | | |
| | | | | | Air Lease Corp. | | | | |
| | 520,000 | | | | | 3.500%, 01/15/22 | | | 525,574 | |
| | 200,000 | | | | | 3.375%, 06/01/21 | | | 201,307 | |
| | 100,000 | | | | | 2.125%, 01/15/20 | | | 99,505 | |
| | | |
| | 415,000 | | | | | Aircastle, Ltd.
6.250%, 12/01/19 | | | 422,532 | |
| | | |
| | 500,000 | | | | | Anheuser-Busch InBev Worldwide, Inc.^
2.500%, 07/15/22 | | | 495,568 | |
| | | | | | |
| See accompanying Notes to Schedule of Investments | | www.calamos.com | | | 147 | |
Short-Term Bond Fund Schedule of Investments April 30, 2019 (Unaudited)
| | | | | | | | | | |
PRINCIPAL
AMOUNT | | | | | | | VALUE | |
| | | |
| | 500,000 | | | | | Avolon Holdings Funding, Ltd.*
3.625%, 05/01/22 | | $ | 501,345 | |
| | | |
| | 500,000 | | | | | Boeing Company
2.700%, 05/01/22 | | | 499,115 | |
| | | |
| | 500,000 | | | | | CSX Corp.
3.700%, 10/30/20 | | | 505,870 | |
| | | |
| | 250,000 | | | | | FedEx Corp.
3.400%, 01/14/22 | | | 253,831 | |
| | | |
| | 100,000 | | | | | GATX Corp.‡
3.453%, 11/05/21
3 mo. USD LIBOR + .72% | | | 99,549 | |
| | | |
| | 100,000 | | | | | General Dynamics Corp.‡
3.077%, 05/11/22
3 mo. USD LIBOR + .38% | | | 100,461 | |
| | | |
| | 145,913 | | | | | Hawaiian Airlines Pass Through Certificates Series2013-1, Class B
4.950%, 01/15/22 | | | 147,562 | |
| | | |
| | 250,000 | | | | | John Deere Capital Corp.
2.950%, 04/01/22 | | | 252,395 | |
| | | |
| | 500,000 | | | | | Norfolk Southern Corp.
3.250%, 12/01/21 | | | 505,137 | |
| | | |
| | | | | | Park Aerospace Holdings, Ltd.* | | | | |
| | 250,000 | | | | | 5.250%, 08/15/22 | | | 260,476 | |
| | 250,000 | | | | | 3.625%, 03/15/21^ | | | 250,295 | |
| | | |
| | 250,000 | | | | | QVC, Inc.
5.125%, 07/02/22 | | | 261,411 | |
| | | |
| | | | | | Siemens Financieringsmaatschappij, NV* | | | | |
| | 500,000 | | | | | 1.700%, 09/15/21 | | | 488,333 | |
| | 250,000 | | | | | 2.150%, 05/27/20 | | | 248,690 | |
| | | |
| | 500,000 | | | | | Southwest Airlines Company
2.650%, 11/05/20 | | | 499,628 | |
| | | |
| | 500,000 | | | | | Union Pacific Corp.
2.950%, 03/01/22 | | | 503,370 | |
| | | |
| | 508,000 | | | | | United Rentals North America, Inc.
4.625%, 07/15/23 | | | 517,261 | |
| | | |
| | 500,000 | | | | | United Technologies Corp.
3.350%, 08/16/21 | | | 506,567 | |
| | | |
| | 500,000 | | | | | Volkswagen Group of America Finance, LLC*
3.875%, 11/13/20 | | | 506,892 | |
| | | |
| | 100,000 | | | | | Vulcan Materials Company‡
3.276%, 03/01/21
3 mo. USD LIBOR + .65% | | | 100,172 | |
| | | | | | | | | | |
| | | | | | | | | 8,955,179 | |
| | | | | | | | | | |
| | | | | | Information Technology (2.6%) | |
| | 500,000 | | | | | Amphenol Corp.
3.125%, 09/15/21 | | | 504,687 | |
| | | |
| | 500,000 | | | | | Autodesk, Inc.
3.125%, 06/15/20 | | | 501,525 | |
| | | |
| | 500,000 | | | | | Broadcom, Inc.*
3.125%, 04/15/21 | | | 499,788 | |
| | | |
| | 500,000 | | | | | Broadridge Financial Solutions, Inc.
3.950%, 09/01/20 | | | 507,202 | |
| | | | | | | | | | |
PRINCIPAL
AMOUNT | | | | | | | VALUE | |
| | | |
| | 250,000 | | | | | Cisco Systems, Inc.
2.200%, 02/28/21 | | $ | 248,688 | |
| | | |
| | | | | | Hewlett Packard Enterprise Company | | | | |
| | 500,000 | | | | | 3.600%, 10/15/20 | | | 504,975 | |
| | 225,000 | | | | | 3.500%, 10/05/21 | | | 227,942 | |
| | | |
| | 145,000 | | | | | NetApp, Inc.
3.375%, 06/15/21 | | | 146,237 | |
| | | |
| | 500,000 | | | | | NVIDIA Corp.
2.200%, 09/16/21 | | | 494,490 | |
| | | |
| | 500,000 | | | | | NXP, BV / NXP Funding, LLC*
4.125%, 06/15/20 | | | 506,057 | |
| | | |
| | 310,000 | | | | | Oracle Corp.^
3.875%, 07/15/20 | | | 315,206 | |
| | | |
| | 250,000 | | | | | QUALCOMM, Inc.
2.250%, 05/20/20 | | | 249,049 | |
| | | | | | | | | | |
| | | | | | | | | 4,705,846 | |
| | | | | | | | | | |
| | | | | | Materials (1.0%) | | | | |
| | 285,000 | | | | | Alcoa Nederland Holding, BV*
6.750%, 09/30/24 | | | 301,767 | |
| | | |
| | 75,000 | | | | | ArcelorMittal, SA
5.125%, 06/01/20 | | | 76,738 | |
| | | |
| | 500,000 | | | | | DowDuPont, Inc.
3.766%, 11/15/20 | | | 508,087 | |
| | | |
| | 100,000 | | | | | EI du Pont de Nemours & Company
2.200%, 05/01/20 | | | 99,816 | |
| | | |
| | 750,000 | | | | | Georgia-Pacific, LLC*
5.400%, 11/01/20 | | | 778,680 | |
| | | | | | | | | | |
| | | | | | | | | 1,765,088 | |
| | | | | | | | | | |
| | | | | | Real Estate (2.7%) | | | | |
| | | | | | American Tower Corp. | | | | |
| | 500,000 | | | | | 2.800%, 06/01/20 | | | 500,030 | |
| | 159,000 | | | | | 3.450%, 09/15/21 | | | 161,190 | |
| | | |
| | 500,000 | | | | | AvalonBay Communities, Inc.
3.625%, 10/01/20 | | | 505,797 | |
| | | |
| | 500,000 | | | | | Boston Properties, LP
5.625%, 11/15/20 | | | 518,690 | |
| | | |
| | 525,000 | | | | | Equinix, Inc.
5.375%, 01/01/22 | | | 540,073 | |
| | | |
| | 200,000 | | | | | Federal Realty Investment Trust
2.550%, 01/15/21 | | | 199,178 | |
| | | |
| | | | | | Kimco Realty Corp. | | | | |
| | 500,000 | | | | | 3.125%, 06/01/23 | | | 498,720 | |
| | 250,000 | | | | | 3.200%, 05/01/21 | | | 251,439 | |
| | | |
| | 500,000 | | | | | Public Storage
2.370%, 09/15/22 | | | 495,192 | |
| | | |
| | 100,000 | | | | | Realty Income Corp.
5.750%, 01/15/21 | | | 104,378 | |
| | | |
| | | | | | Simon Property Group, LP | | | | |
| | 500,000 | | | | | 3.375%, 03/15/22 | | | 508,845 | |
| | 250,000 | | | | | 2.500%, 09/01/20 | | | 249,689 | |
| | | |
| | 500,000 | | | | | UDR, Inc.
4.625%, 01/10/22 | | | 519,442 | |
| | | | | | | | | | |
| | | | | | | | | 5,052,663 | |
| | | | | | | | | | |
| | | | |
| 148 | | CALAMOS OPEN-END FAMILY OF FUNDS SEMIANNUAL REPORT | | See accompanying Notes to Schedule of Investments |
Short-Term Bond Fund Schedule of Investments April 30, 2019 (Unaudited)
| | | | | | | | | | |
PRINCIPAL
AMOUNT | | | | | | | VALUE | |
| | | | | | | | | | |
| | | | | | Utilities (4.0%) | | | | |
| | 250,000 | | | | | AES Corp.
4.000%, 03/15/21 | | $ | 253,614 | |
| | | |
| | 510,000 | | | | | American Electric Power Company, Inc.
3.650%, 12/01/21 | | | 520,557 | |
| | | |
| | 225,000 | | | | | CenterPoint Energy, Inc.
3.600%, 11/01/21 | | | 229,044 | |
| | | |
| | 100,000 | | | | | Consolidated Edison Company of New York, Inc.‡
3.002%, 06/25/21
3 mo. USD LIBOR + .40% | | | 100,347 | |
| | | |
| | 400,000 | | | | | Consolidated Edison, Inc.^
2.000%, 03/15/20 | | | 397,972 | |
| | | |
| | 250,000 | | | | | Dominion Energy, Inc.***
2.962%, 07/01/19 | | | 250,003 | |
| | | |
| | 500,000 | | | | | Duke Energy Carolinas, LLC
3.350%, 05/15/22 | | | 512,227 | |
| | | |
| | 430,000 | | | | | Entergy Arkansas, LLC
3.750%, 02/15/21 | | | 437,379 | |
| | | |
| | 500,000 | | | | | Exelon Corp.
2.850%, 06/15/20 | | | 500,255 | |
| | | |
| | 250,000 | | | | | Exelon Generation Company, LLC
2.950%, 01/15/20 | | | 250,056 | |
| | | |
| | 250,000 | | | | | Georgia Power Company
4.250%, 12/01/19 | | | 251,998 | |
| | | |
| | 100,000 | | | | | Nevada Power Company
2.750%, 04/15/20 | | | 100,092 | |
| | | |
| | 500,000 | | | | | NextEra Energy Capital Holdings, Inc.
2.900%, 04/01/22 | | | 501,802 | |
| | | |
| | 500,000 | | | | | NGPL PipeCo, LLC*
4.375%, 08/15/22 | | | 512,762 | |
| | | |
| | 100,000 | | | | | PPL Capital Funding, Inc.^‡
5.266%, 03/30/67
3 mo. USD LIBOR + 2.67% | | | 93,431 | |
| | | |
| | | | | | Sempra Energy | | | | |
| | 400,000 | | | | | 2.400%, 02/01/20 | | | 398,942 | |
| | 100,000 | | | | | 3.061%, 03/15/21‡
3 mo. USD LIBOR + .45% | | | 98,982 | |
| | | |
| | 250,000 | | | | | Southern Company
2.350%, 07/01/21 | | | 247,773 | |
| | | |
| | 233,000 | | | | | Vistra Energy Corp.
7.375%, 11/01/22 | | | 241,440 | |
| | | |
| | | | | | WEC Energy Group, Inc. | | | | |
| | 250,000 | | | | | 3.375%, 06/15/21 | | | 253,076 | |
| | 250,000 | | | | | 3.100%, 03/08/22 | | | 251,878 | |
| | | |
| | 250,000 | | | | | Wisconsin Public Service Corp.^
3.350%, 11/21/21 | | | 254,098 | |
| | | |
| | 733,000 | | | | | Xcel Energy, Inc.
2.600%, 03/15/22 | | | 729,042 | |
| | | | | | | | | | |
| | | | | | | | | 7,386,770 | |
| | | | | | | | | | |
| | | |
| | | | | | TOTAL CORPORATE BONDS
(Cost $113,460,732) | | | 114,318,981 | |
| | | | | | | | | | |
| | | | | | | | | | |
| | | | | | | | | | |
PRINCIPAL
AMOUNT | | | | | | | VALUE | |
|
| | CONVERTIBLE BOND (0.2%) | |
| | | | | | Financials (0.2%) | | | | |
| | 400,000 | | | | | Prospect Capital Corp.
4.950%, 07/15/22
(Cost $395,052) | | $ | 396,178 | |
| | | | | | | | | | |
| | | | | | | | | | |
|
| | U.S. GOVERNMENT AND AGENCY SECURITIES (18.2%) | |
| | | | | | United States Treasury Note | | | | |
| | 9,000,000 | | | | | 2.250%, 04/15/22 | | | 9,002,520 | |
| | 6,000,000 | | | | | 2.500%, 01/15/22 | | | 6,039,517 | |
| | 6,000,000 | | | | | 2.500%, 02/15/22 | | | 6,042,160 | |
| | 4,000,000 | | | | | 2.250%, 03/31/21 | | | 3,997,895 | |
| | 4,000,000 | | | | | 1.375%, 06/30/23 | | | 3,859,568 | |
| | 3,500,000 | | | | | 2.000%, 10/31/22 | | | 3,470,922 | |
| | 1,000,000 | | | | | 2.875%, 11/15/21 | | | 1,015,378 | |
| | | | | | | | | | |
| | | |
| | | | | | TOTAL U.S. GOVERNMENT AND AGENCY SECURITIES
(Cost $33,256,318) | | | 33,427,960 | |
| | | | | | | | | | |
| | | | | | | | | | |
|
| | BANK LOANS (4.4%) | |
| | | | | | Communication Services (1.1%) | | | | |
| | 747,478 | | | | | Charter Communications Operating, LLC‡ 4.490%, 04/30/25
1 mo. LIBOR + 2.00% | | | 750,165 | |
| | | |
| | 500,000 | | | | | CSC Holdings, LLC‡
5.470%, 04/15/27
1 mo. LIBOR + 3.00% | | | 502,435 | |
| | | |
| | 748,125 | | | | | Sprint Communications, Inc.‡
5.500%, 02/02/24
1 mo. LIBOR + 3.00% | | | 738,463 | |
| | | | | | | | | | |
| | | | | | | | | 1,991,063 | |
| | | | | | | | | | |
| | | | | | Consumer Discretionary (0.3%) | | | | |
| | 500,000 | | | | | MGM Resorts International‡
4.730%, 12/21/23
1 mo. LIBOR + 2.25% | | | 498,333 | |
| | | | | | | | | | |
| | | | | | Consumer Staples (0.4%) | | | | |
| | 667,253 | | | | | JBS USA LUX, SA!
10/30/22 | | | 668,471 | |
| | | | | | | | | | |
| | | | | | Financials (0.4%) | | | | |
| | 750,000 | | | | | Level 3 Financing, Inc.‡
4.730%, 02/22/24
1 mo. LIBOR + 2.25% | | | 751,312 | |
| | | | | | | | | | |
| | | | | | Health Care (0.8%) | | | | |
| | 484,253 | | | | | Bausch Health Cos., Inc.‡
5.220%, 11/27/25
1 mo. LIBOR + 2.75% | | | 485,270 | |
| | | |
| | 249,346 | | | | | DaVita, Inc.‡
5.230%, 06/24/21
1 mo. LIBOR + 2.75% | | | 250,187 | |
| | | |
| | 748,111 | | | | | HCA, Inc.‡
4.480%, 03/13/25
1 mo. LIBOR + 2.00% | | | 750,516 | |
| | | | | | | | | | |
| | | | | | | | | 1,485,973 | |
| | | | | | | | | | |
| | | | | | |
| See accompanying Notes to Schedule of Investments | | www.calamos.com | | | 149 | |
Short-Term Bond Fund Schedule of Investments April 30, 2019 (Unaudited)
| | | | | | | | | | |
PRINCIPAL
AMOUNT | | | | | | | VALUE | |
| | | | | | | | | | |
| | | | | | Information Technology (0.8%) | | | | |
| | 748,077 | | | | | CDW, LLC‡
4.230%, 08/17/23
1 mo. LIBOR + 1.75% | | $ | 750,961 | |
| | | |
| | 750,000 | | | | | First Data Corp.‡
4.480%, 04/26/24
1 mo. LIBOR + 2.00% | | | 750,705 | |
| | | | | | | | | | |
| | | | | | | | | 1,501,666 | |
| | | | | | | | | | |
| | | | | | Information Technology (0.6%) | | | | |
| | 1,152,439 | | | | | Dell International LLC‡
4.490%, 09/07/23
1 mo. LIBOR + 2.00% | | | 1,154,387 | |
| | | | | | | | | | |
| | | |
| | | | | | TOTAL BANK LOANS
(Cost $8,026,276) | | | 8,051,205 | |
| | | | | | | | | | |
| | | | | | | | | | |
|
| | ASSET BACKED SECURITIES (11.9%) | |
| | 1,000,000 | | | | | American Express Credit Account Master Trust Series2019-1, Class A
2.870%, 10/15/24 | | | 1,009,570 | |
| | | |
| | 250,000 | | | | | Avis Budget Rental Car Funding AESOP, LLC Series2015-2A, Class A*
2.630%, 12/20/21 | | | 249,017 | |
| | | |
| | 1,500,000 | | | | | Avis Budget Rental Car Funding AESOP, LLC Series2017-1A, Class A*
3.070%, 09/20/23 | | | 1,503,116 | |
| | | |
| | 150,000 | | | | | BA Credit Card Trust Series2017-A1, Class A1
1.950%, 08/15/22 | | | 149,213 | |
| | | |
| | 910,000 | | | | | BMW Vehicle Lease Trust Series2019-1, Class A4
2.920%, 08/22/22 | | | 916,400 | |
| | | |
| | 150,000 | | | | | Capital One Multi-Asset Execution Trust Series2016-A6, Class A6
1.820%, 09/15/22 | | | 149,380 | |
| | | |
| | 133,610 | | | | | CarMax Auto Owner Trust Series2018-3, Class A2A
2.880%, 10/15/21 | | | 133,776 | |
| | | |
| | 250,000 | | | | | Credit Acceptance Auto Loan TrustSeries 2017-3A, Class A*
2.650%, 06/15/26 | | | 249,427 | |
| | | |
| | 1,100,000 | | | | | Credit Acceptance Auto Loan TrustSeries 2019-1A, Class A*
3.330%, 02/15/28 | | | 1,108,862 | |
| | | |
| | 200,000 | | | | | Dell Equipment Finance TrustSeries 2017-2, Class A3*
2.190%, 10/24/22 | | | 199,481 | |
| | | |
| | 250,000 | | | | | Dell Equipment Finance TrustSeries 2018-1, Class A3*
3.180%, 06/22/23 | | | 251,486 | |
| | | |
| | 200,000 | | | | | Dell Equipment Finance TrustSeries 2018-2, Class A2*
3.160%, 02/22/21 | | | 200,769 | |
| | | |
| | 1,000,000 | | | | | Dell Equipment Finance TrustSeries 2018-2, Class A3*
3.370%, 10/22/23 | | | 1,012,074 | |
| | | | | | | | | | |
PRINCIPAL
AMOUNT | | | | | | | VALUE | |
| | | |
| | 200,000 | | | | | Discover Card Execution Note TrustSeries 2012-A6, Class A6
1.670%, 01/18/22 | | $ | 199,612 | |
| | | |
| | 444,062 | | | | | Enterprise Fleet Financing, LLCSeries 2018-1, Class A2*
2.870%, 10/20/23 | | | 444,501 | |
| | | |
| | 50,000 | | | | | Ford Credit Auto Lease TrustSeries 2017-A, Class A4
2.020%, 06/15/20 | | | 49,953 | |
| | | |
| | 1,000,000 | | | | | Ford Credit Floorplan Master Owner Trust A
2.840%, 03/15/24 | | | 1,003,079 | |
| | | |
| | 150,000 | | | | | GE Capital Credit Card Master Note Trust Series2012-7, Class A
1.760%, 09/15/22 | | | 149,372 | |
| | | |
| | 150,000 | | | | | GM Financial Consumer Automobile Receivables Series2018-3, Class A3
3.020%, 05/16/23 | | | 151,087 | |
| | | |
| | 1,000,000 | | | | | Hertz Fleet Lease Funding, LPSeries 2018-1, Class A2*
3.230%, 05/10/32 | | | 1,003,418 | |
| | | |
| | 150,000 | | | | | Hertz Vehicle Financing II,LP Series 2015-1A, Class A*
2.730%, 03/25/21 | | | 149,692 | |
| | | |
| | 500,000 | | | | | Honda Auto Receivables Owner TrustSeries 2018-4, Class A3
3.160%, 01/17/23 | | | 505,561 | |
| | | |
| | 1,000,000 | | | | | NextGear Floorplan Master Owner Trust Series2019-1A, Class A2*
3.210%, 02/15/24 | | | 1,007,625 | |
| | | |
| | 225,150 | | | | | OSCAR US Funding Trust V, LLCSeries 2016-2A, Class A3*
2.730%, 12/15/20 | | | 225,080 | |
| | | |
| | 1,500,000 | | | | | OSCAR US Funding Trust VIII, LLCSeries 2018-1A, Class A3*
3.230%, 05/10/22 | | | 1,506,971 | |
| | | |
| | 1,000,000 | | | | | OSCAR US Funding Trust X, LLCSeries 2019-1A, Class A3*
3.180%, 05/10/23 | | | 1,004,600 | |
| | | |
| | 186,009 | | | | | SCF Equipment Leasing, LLCSeries 2018-1A, Class A2*
3.630%, 10/20/24 | | | 186,091 | |
| | | |
| | 1,184,274 | | | | | SoFi Consumer Loan Program TrustSeries 2018-4, Class A*
3.540%, 11/26/27 | | | 1,193,323 | |
| | | |
| | 1,907,003 | | | | | SoFi Professional Loan Program LLCSeries 2016-E, Class A2B*
2.490%, 01/25/36 | | | 1,893,163 | |
| | | |
| | 63,221 | | | | | SoFi Professional Loan Program LLCSeries 2017-C, Class A2A*
1.750%, 07/25/40 | | | 62,927 | |
| | | |
| | 844,340 | | | | | Verizon Owner Trust Series2017-1A, Class A*
2.060%, 09/20/21 | | | 841,974 | |
| | | | |
| 150 | | CALAMOS OPEN-END FAMILY OF FUNDS SEMIANNUAL REPORT | | See accompanying Notes to Schedule of Investments |
Short-Term Bond Fund Schedule of Investments April 30, 2019 (Unaudited)
| | | | | | | | | | |
PRINCIPAL
AMOUNT | | | | | | | VALUE | |
| | | |
| | 500,000 | | | | | Volvo Financial Equipment, LLCSeries 2018-1A, Class A4*
2.760%, 10/17/22 | | $ | 500,669 | |
| | | |
| | 1,525,000 | | | | | Volvo Financial Equipment, LLCSeries 2018-1A, Class B*
2.910%, 01/17/23 | | | 1,535,296 | |
| | | |
| | 30,000 | | | | | World Financial Network Credit Card Master Trust Series2015-B, Class A
2.550%, 06/17/24 | | | 29,923 | |
| | | |
| | 140,000 | | | | | World Financial Network Credit Card Master Trust Series2017-A, Class A
2.120%, 03/15/24 | | | 139,194 | |
| | | |
| | 1,000,000 | | | | | World Omni Auto Receivables Trust Series 2019- A, Class A2
3.020%, 04/15/22 | | | 1,003,696 | |
| | | | | | | | | | |
| | | |
| | | | | | TOTAL ASSET BACKED SECURITIES
(Cost $21,807,359) | | | 21,919,378 | |
| | | | | | | | | | |
| | | | | | | | | | |
|
| | RESIDENTIAL MORTGAGE BACKED SECURITIES (1.7%) | |
| | 144,623 | | | | | Federal National Mortgage Association
2.761%, 04/01/21 | | | 144,739 | |
| | | |
| | 19,223 | | | | | Morgan Stanley Bank of America Merrill Lynch Trust, Series2016-C29, Class A1
1.597%, 05/15/49 | | | 19,038 | |
| | | |
| | 16,387 | | | | | Morgan Stanley Capital I Trust,Series 2015-UBS8, Class A1
1.966%, 12/15/48 | | | 16,320 | |
| | | |
| | 133,658 | | | | | Morgan Stanley Capital I Trust,Series 2018-H3, Class A1
3.176%, 07/15/51 | | | 134,811 | |
| | | |
| | 884,566 | | | | | Wells Fargo Commercial Mortgage TrustSeries 2015-C26, Class A2
2.663%, 02/15/48 | | | 882,843 | |
| | | |
| | 471,792 | | | | | Wells Fargo Commercial Mortgage Trust Series 2015-LC20, Class A2
2.678%, 04/15/50 | | | 471,035 | |
| | | |
| | 310,000 | | | | | Wells Fargo Commercial Mortgage TrustSeries 2017-RC1, Class A2
3.118%, 01/15/60 | | | 312,174 | |
| | | |
| | 534,000 | | | | | WFRBS Commercial Mortgage TrustSeries 2011-C4, Class A4*‡
4.902%, 06/15/44 | | | 553,967 | |
| | | |
| | 264,651 | | | | | WFRBS Commercial Mortgage TrustSeries 2012-C10, Class ASB
2.453%, 12/15/45 | | | 263,549 | |
| | | |
| | 289,498 | | | | | WFRBS Commercial Mortgage Trust Series 2014-LC14, Class ASB
3.522%, 03/15/47 | | | 294,496 | |
| | | | | | | | | | |
| | | |
| | | | | | TOTAL RESIDENTIAL MORTGAGE BACKED SECURITIES
(Cost $3,081,168) | | | 3,092,972 | |
| | | | | | | | | | |
| | | | | | | | | | |
| | | | | | | | | | |
PRINCIPAL
AMOUNT | | | | | | | VALUE | |
|
| | MUNICIPAL OBLIGATIONS (0.3%) | |
| | | | | | Financials (0.1%) | |
| | 95,000 | | | | | Massachusetts Housing Finance Agency
2.313%, 12/01/19 | | $ | 94,800 | |
| | | | | | | | | | |
| | | | | | Industrials (0.1%) | |
| | 100,000 | | | | | Metropolitan Transportation Authority
5.269%, 11/15/20 | | | 104,048 | |
| | | | | | | | | | |
| | | | | | Other (0.1%) | |
| | 260,000 | | | | | City of Miami, Florida*
3.558%, 01/01/21 | | | 261,389 | |
| | | |
| | 200,000 | | | | | City of Ridgecrest, California
5.000%, 06/01/20 | | | 204,102 | |
| | | | | | | | | | |
| | | | | | | | | 465,491 | |
| | | | | | | | | | |
| | | |
| | | | | | TOTAL MUNICIPAL OBLIGATIONS
(Cost $661,396) | | | 664,339 | |
| | | | | | | | | | |
| | | | | | | | | | |
NUMBER OF
SHARES | | | | | | | VALUE | |
|
| | SHORT TERM INVESTMENTS (1.3%) | |
| | 1,184,510 | | | | | Fidelity Prime Money Market Fund - Institutional Class, 2.500%*** | | | 1,184,865 | |
| | | |
| | 1,183,304 | | | | | Morgan Stanley Institutional Liquidity Funds - Government Portfolio, 2.350%*** | | | 1,183,304 | |
| | | | | | | | | | |
| | | |
| | | | | | TOTAL SHORT TERM INVESTMENTS
(Cost $2,368,169) | | | 2,368,169 | |
| | | | | | | | | | |
| | | | | | | | | | |
NUMBER OF
SHARES/
PRINCIPAL
AMOUNT | | | | | | | VALUE | |
|
| INVESTMENT OF CASH COLLATERAL FOR SECURITIES
LOANED (2.1%) |
|
| | 3,834,570 | | | | | State Street Navigator Securities Lending Government Money Market Portfolio†
(Cost $3,834,570) | | | 3,834,570 | |
| | | | | | | | | | |
| |
| TOTAL INVESTMENTS (102.2%)
(Cost $186,891,040) | | | 188,073,752 | |
| | | | | | | | | | |
| |
| | PAYABLE UPON RETURN OF SECURITIES ON LOAN(-2.1%) | �� | | (3,834,570 | ) |
| | | | | | | | | | |
| |
| | LIABILITIES, LESS OTHER ASSETS(-0.1%) | | | (266,689 | ) |
| | | | | | | | | | |
| |
| | NET ASSETS (100.0%) | | $ | 183,972,493 | |
| | | | | | | | | | |
| | | | | | |
| See accompanying Notes to Schedule of Investments | | www.calamos.com | | | 151 | |
Short-Term Bond Fund Schedule of Investments April 30, 2019 (Unaudited)
NOTES TO SCHEDULE OF INVESTMENTS
| * | Securities issued and sold pursuant to a Rule 144A transaction are excepted from the registration requirement of the Securities Act of 1933, as amended. These securities may only be sold to qualified institutional buyers (“QIBs”), such as the Fund. Any resale of these securities must generally be effected through a sale that is registered under the Act or otherwise exempted from such registration requirements. |
| ^ | Security, or portion of security, is on loan. |
| ‡ | Variable rate security. The rate shown is the rate in effect at April 30, 2019. |
| ** | Step coupon security. Coupon changes periodically based upon a predetermined schedule. The rate shown is the rate in effect at April 30, 2019. |
| ! | This position represents an unsettled loan commitment at period end. Certain details associated with this purchase are not known prior to the settlement date, including coupon rate, which will be adjusted on settlement date. |
| *** | The rate disclosed is the 7 day net yield as of April 30, 2019. |
| † | Represents investment of cash collateral received from securities on loan as of April 30, 2019. |
| | | | |
| 152 | | CALAMOS OPEN-END FAMILY OF FUNDS SEMIANNUAL REPORT | | See accompanying Notes to Financial Statements |
Statements of Assets and Liabilities April 30, 2019 (Unaudited)
| | | | | | | | | | | | | | | | | | | | |
| | | MARKET NEUTRAL INCOME FUND | | | HEDGED EQUITY FUND | | | PHINEUS LONG/SHORT FUND | | | CONVERTIBLE FUND | | | GLOBAL CONVERTIBLE FUND | |
ASSETS | | | | | | | | | | | | | | | | | | | | |
Investments in securities, at cost | | $ | 7,280,287,384 | | | $ | 183,520,513 | | | $ | 887,070,195 | | | $ | 718,776,216 | | | $ | 140,337,825 | |
Investments in affiliated funds, at cost | | | 120,000,000 | | | | — | | | | 35,250,728 | | | | — | | | | — | |
Investment in securities, at value | | $ | 8,297,271,823 | | | $ | 196,644,113 | | | $ | 908,135,520 | | | $ | 766,477,709 | | | $ | 139,930,904 | |
Investments in affiliated funds, at value | | | 120,649,094 | | | | — | | | | 35,636,415 | | | | — | | | | — | |
Cash with custodian (interest bearing) | | | — | | | | — | | | | 5,045,764 | | | | 42,556 | | | | 15 | |
Restricted cash | | | 4,280,000 | | | | — | | | | — | | | | — | | | | — | |
Restricted cash for short positions (interest bearing) | | | 2,642,462,375 | | | | — | | | | 851,346,461 | | | | — | | | | — | |
Restricted foreign currency for short positions (cost $107,742,551) | | | 107,025,675 | | | | — | | | | — | | | | — | | | | — | |
Unrealized appreciation on total return swaps | | | 15,716 | | | | — | | | | — | | | | — | | | | — | |
Unrealized appreciation on forward foreign currency contracts | | | 669,834 | | | | — | | | | — | | | | 27,062 | | | | — | |
Receivables: | | | | | | | | | | | | | | | | | | | | |
Accrued interest and dividends | | | 18,286,431 | | | | 146,108 | | | | 2,790,317 | | | | 1,850,014 | | | | 395,992 | |
Investments sold | | | 30,377,328 | | | | — | | | | 21,779,772 | | | | — | | | | — | |
Open swap contracts | | | 861,468 | | | | — | | | | — | | | | — | | | | — | |
Fund shares sold | | | 30,037,768 | | | | 811,353 | | | | 1,516,133 | | | | 1,238,585 | | | | 642,769 | |
Prepaid expenses | | | 354,394 | | | | 40,886 | | | | 91,045 | | | | 54,883 | | | | 33,892 | |
Other assets | | | 164,399 | | | | 8,128 | | | | 10,816 | | | | 157,534 | | | | 8,187 | |
Total assets | | | 11,252,456,305 | | | | 197,650,588 | | | | 1,826,352,243 | | | | 769,848,343 | | | | 141,011,759 | |
LIABILITIES | | | | | | | | | | | | | | | | | | | | |
Due to custodian bank | | | 17,786,168 | | | | — | | | | 10,559,120 | | | | — | | | | — | |
Collateral for securities loaned | | | 312,062,310 | | | | 6,379,104 | | | | 21,674,355 | | | | 65,427,763 | | | | 5,474,323 | |
Securities sold short, at value (proceeds $2,026,497,663, and $771,763,735) | | | 2,725,215,526 | | | | — | | | | 842,852,923 | | | | — | | | | — | |
Options written, at value (premium $253,552,577, $9,172,336, $5,165,649, and $331,669) | | | 481,050,571 | | | | 15,558,943 | | | | 6,067,252 | | | | 96,600 | | | | — | |
Unrealized depreciation on total return swaps | | | 450,063 | | | | — | | | | — | | | | — | | | | — | |
Unrealized depreciation on forward foreign currency contracts | | | 183,932 | | | | — | | | | — | | | | 475 | | | | — | |
Payables: | | | | | | | | | | | | | | | | | | | | |
Investments purchased | | | 12,866,641 | | | | 331,586 | | | | 824,380 | | | | 596,382 | | | | 274,666 | |
Fund shares redeemed | | | 8,508,312 | | | | 74,352 | | | | 1,743,378 | | | | 1,089,535 | | | | 133,688 | |
Affiliates: | | | | | | | | | | | | | | | | | | | | |
Investment advisory fees | | | 4,099,027 | | | | 104,025 | | | | 951,248 | | | | 419,748 | | | | 92,256 | |
Distribution fees | | | 25,935 | | | | 199 | | | | 3,838 | | | | 7,438 | | | | 356 | |
Deferred compensation to trustees | | | 164,399 | | | | 8,128 | | | | 10,816 | | | | 157,534 | | | | 8,187 | |
Trustees’ fees and officer compensation | | | 45,374 | | | | 1,979 | | | | 8,624 | | | | 6,336 | | | | 2,743 | |
Other accounts payable and accrued liabilities | | | 3,003,583 | | | | 45,901 | | | | 252,268 | | | | 136,366 | | | | 48,237 | |
Total liabilities | | | 3,565,461,841 | | | | 22,504,217 | | | | 884,948,202 | | | | 67,938,177 | | | | 6,034,456 | |
NET ASSETS | | $ | 7,686,994,464 | | | $ | 175,146,371 | | | $ | 941,404,041 | | | $ | 701,910,166 | | | $ | 134,977,303 | |
COMPOSITION OF NET ASSETS | | | | | | | | | | | | | | | | | | | | |
Paid in capital | | $ | 7,564,319,848 | | | $ | 170,244,157 | | | $ | 992,311,094 | | | $ | 634,119,227 | | | $ | 128,712,409 | |
Undistributed net investment income (loss) | | | 69,268,826 | | | | 358,707 | | | | 1,806,447 | | | | 5,702,667 | | | | 3,389,152 | |
Accumulated net realized gain (loss) on investments, foreign currency transactions, written options, short positions and total return swaps | | | (37,342,280 | ) | | | (2,193,486 | ) | | | (2,177,056 | ) | | | 14,125,123 | | | | 3,284,321 | |
Unrealized appreciation (depreciation) of investments, foreign currency translations, written options, short positions and total return swaps | | | 90,748,070 | | | | 6,736,993 | | | | (50,536,444 | ) | | | 47,963,149 | | | | (408,579 | ) |
NET ASSETS | | $ | 7,686,994,464 | | | $ | 175,146,371 | | | $ | 941,404,041 | | | $ | 701,910,166 | | | $ | 134,977,303 | |
CLASS A SHARES† | | | | | | | | | | | | | | | | | | | | |
Net assets applicable to shares outstanding | | $ | 819,556,595 | | | $ | 6,782,607 | | | $ | 94,446,617 | | | $ | 254,452,522 | | | $ | 11,481,090 | |
Shares outstanding | | | 61,800,875 | | | | 583,118 | | | | 7,990,186 | | | | 14,762,131 | | | | 1,052,229 | |
Net asset value and redemption price per share | | $ | 13.26 | | | $ | 11.63 | | | $ | 11.82 | | | $ | 17.24 | | | $ | 10.91 | |
Maximum offering price per share (Net asset value, plus 4.75% of offering price) | | $ | 13.57 | # | | $ | 12.21 | | | $ | 12.41 | | | $ | 17.64 | # | | $ | 11.16 | # |
CLASS C SHARES†** | | | | | | | | | | | | | | | | | | | | |
Net assets applicable to shares outstanding | | $ | 268,755,897 | | | $ | 1,932,657 | | | $ | 46,252,132 | | | $ | 72,467,011 | | | $ | 3,651,266 | |
Shares outstanding | | | 19,937,088 | | | | 168,176 | | | | 4,006,975 | | | | 4,247,911 | | | | 338,789 | |
Net asset value and redemption price per share | | $ | 13.48 | | | $ | 11.49 | | | $ | 11.54 | | | $ | 17.06 | | | $ | 10.78 | |
CLASS I SHARES† | | | | | | | | | | | | | | | | | | | | |
Net assets applicable to shares outstanding | | $ | 6,598,681,972 | | | $ | 166,431,107 | | | $ | 800,705,292 | | | $ | 374,990,633 | | | $ | 119,844,947 | |
Shares outstanding | | | 503,965,045 | | | | 14,328,035 | | | | 67,175,278 | | | | 24,668,973 | | | | 10,978,257 | |
Net asset value and redemption price per share | | $ | 13.09 | | | $ | 11.62 | | | $ | 11.92 | | | $ | 15.20 | | | $ | 10.92 | |
| † | No par value; unlimited number of shares authorized. |
| # | For Market Neutral Income Fund, Convertible Fund and Global Convertible Fund, maximum offering price per share is Net asset value plus 2.25% of offering price. |
| ** | Redemption price may be reduced by contingent deferred sales charge. |
| | | | | | |
| See accompanying Notes to Financial Statements | | www.calamos.com | | | 153 | |
Statements of Assets and Liabilities April 30, 2019 (Unaudited)
| | | | | | | | | | | | | | | | |
| | | GROWTH FUND | | | GROWTH AND INCOME FUND | | | DIVIDEND GROWTH FUND | | | OPPORTUNISTIC VALUE FUND | |
ASSETS | | | | | | | | | | | | | | | | |
Investments in securities, at cost | | $ | 1,139,683,423 | | | $ | 1,592,707,978 | | | $ | 13,515,370 | | | $ | 42,130,050 | |
Investments in affiliated funds, at cost | | | 5,540,119 | | | | — | | | | — | | | | — | |
Investment in securities, at value | | $ | 1,502,091,337 | | | $ | 2,106,967,796 | | | $ | 18,723,572 | | | $ | 47,026,621 | |
Investments in affiliated funds, at value | | | 5,595,561 | | | | — | | | | — | | | | — | |
Cash with custodian (interest bearing) | | | 31,269 | | | | — | | | | — | | | | — | |
Unrealized appreciation on forward foreign currency contracts | | | — | | | | 24,907 | | | | — | | | | — | |
Receivables: | | | | | | | | | | | | | | | | |
Accrued interest and dividends | | | 500,510 | | | | 2,926,033 | | | | 12,946 | | | | 29,199 | |
Investments sold | | | 8,100,096 | | | | — | | | | 596,791 | | | | — | |
Fund shares sold | | | 110,873 | | | | 1,887,253 | | | | — | | | | 24,510 | |
Due from investment advisor | | | — | | | | — | | | | 10,951 | | | | 19,026 | |
Prepaid expenses | | | 66,271 | | | | 93,235 | | | | 15,197 | | | | 28,897 | |
Other assets | | | 705,228 | | | | 316,089 | | | | 10,827 | | | | 79,400 | |
Total assets | | | 1,517,201,145 | | | | 2,112,215,313 | | | | 19,370,284 | | | | 47,207,653 | |
LIABILITIES | | | | | | | | | | | | | | | | |
Due to custodian bank | | | — | | | | — | | | | 230,918 | | | | — | |
Collateral for securities loaned | | | 32,958,710 | | | | 64,784,526 | | | | 89,769 | | | | 536,508 | |
Options written, at value (premium $2,839,473) | | | 2,760,886 | | | | — | | | | — | | | | — | |
Unrealized depreciation on forward foreign currency contracts | | | — | | | | 433 | | | | — | | | | — | |
Payables: | | | | | | | | | | | | | | | | |
Investments purchased | | | 1,228,694 | | | | 1,199,154 | | | | — | | | | — | |
Fund shares redeemed | | | 1,699,343 | | | | 2,587,948 | | | | 39,760 | | | | 55,434 | |
Affiliates: | | | | | | | | | | | | | | | | |
Investment advisory fees | | | 1,080,430 | | | | 1,138,064 | | | | 15,958 | | | | 38,235 | |
Distribution fees | | | 19,084 | | | | 25,024 | | | | 92 | | | | 453 | |
Deferred compensation to trustees | | | 705,228 | | | | 316,089 | | | | 10,827 | | | | 79,400 | |
Trustees’ fees and officer compensation | | | 6,720 | | | | 19,636 | | | | 2,089 | | | | 2,267 | |
Other accounts payable and accrued liabilities | | | 572,257 | | | | 529,268 | | | | 22,812 | | | | 25,491 | |
Total liabilities | | | 41,031,352 | | | | 70,600,142 | | | | 412,225 | | | | 737,788 | |
NET ASSETS | | $ | 1,476,169,793 | | | $ | 2,041,615,171 | | | $ | 18,958,059 | | | $ | 46,469,865 | |
COMPOSITION OF NET ASSETS | | | | | | | | | | | | | | | | |
Paid in capital | | $ | 1,023,521,443 | | | $ | 1,493,778,894 | | | $ | 11,739,498 | | | $ | 40,601,801 | |
Undistributed net investment income (loss) | | | (1,991,115 | ) | | | (6,486,951 | ) | | | 22,995 | | | | 73,913 | |
Accumulated net realized gain (loss) on investments, foreign currency transactions, and written options | | | 92,099,169 | | | | 40,038,936 | | | | 1,987,364 | | | | 897,580 | |
Unrealized appreciation (depreciation) of investments, foreign currency translations and written options | | | 362,540,296 | | | | 514,284,292 | | | | 5,208,202 | | | | 4,896,571 | |
NET ASSETS | | $ | 1,476,169,793 | | | $ | 2,041,615,171 | | | $ | 18,958,059 | | | $ | 46,469,865 | |
CLASS A SHARES† | | | | | | | | | | | | | | | | |
Net assets applicable to shares outstanding | | $ | 1,122,040,958 | | | $ | 1,155,515,439 | | | $ | 3,121,952 | | | $ | 11,769,691 | |
Shares outstanding | | | 35,547,670 | | | | 35,339,066 | | | | 240,825 | | | | 855,632 | |
Net asset value and redemption price per share | | $ | 31.56 | | | $ | 32.70 | | | $ | 12.96 | | | $ | 13.76 | |
Maximum offering price per share (Net asset value, plus 4.75% of offering price) | | $ | 33.13 | | | $ | 34.33 | | | $ | 13.61 | | | $ | 14.45 | |
CLASS C SHARES†** | | | | | | | | | | | | | | | | |
Net assets applicable to shares outstanding | | $ | 66,882,022 | | | $ | 168,091,053 | | | $ | 901,302 | | | $ | 5,344,648 | |
Shares outstanding | | | 3,726,236 | | | | 5,103,636 | | | | 71,026 | | | | 445,159 | |
Net asset value and redemption price per share | | $ | 17.95 | | | $ | 32.94 | | | $ | 12.69 | | | $ | 12.01 | |
CLASS I SHARES† | | | | | | | | | | | | | | | | |
Net assets applicable to shares outstanding | | $ | 287,246,813 | | | $ | 718,008,679 | | | $ | 14,934,805 | | | $ | 29,355,526 | |
Shares outstanding | | | 6,654,957 | | | | 22,913,111 | | | | 1,153,343 | | | | 2,077,225 | |
Net asset value and redemption price per share | | $ | 43.16 | | | $ | 31.34 | | | $ | 12.95 | | | $ | 14.13 | |
| † | No par value; unlimited number of shares authorized. |
| ** | Redemption price may be reduced by contingent deferred sales charge. |
| | | | |
| 154 | | CALAMOS OPEN-END FAMILY OF FUNDS SEMIANNUAL REPORT | | See accompanying Notes to Financial Statements |
Statements of Assets and Liabilities April 30, 2019 (Unaudited)
| | | | | | | | | | | | | | | | | | | | |
| | | INTERNATIONAL GROWTH FUND | | | EVOLVING WORLD GROWTH FUND | | | EMERGING MARKET EQUITY FUND | | | GLOBAL EQUITY FUND | | | GLOBAL GROWTH AND INCOME FUND | |
ASSETS | | | | | | | | | | | | | | | | | | | | |
Investments in securities, at cost | | $ | 179,987,239 | | | $ | 153,309,649 | | | $ | 13,847,702 | | | $ | 77,043,452 | | | $ | 150,215,743 | |
Investment in securities, at value | | $ | 217,492,946 | | | $ | 191,077,898 | | | $ | 16,693,386 | | | $ | 98,890,483 | | | $ | 169,943,693 | |
Cash with custodian (interest bearing) | | | 640,000 | | | | — | | | | — | | | | — | | | | — | |
Foreign currency (cost $27,710, $74,299, and $7,296 ) | | | 27,736 | | | | 74,497 | | | | 7,313 | | | | — | | | | — | |
Restricted cash for open forward foreign currency contracts | | | 260,000 | | | | — | | | | — | | | | — | | | | — | |
Receivables: | | | | | | | | | | | | | | | | | | | | |
Accrued interest and dividends | | | 1,155,720 | | | | 499,047 | | | | 15,045 | | | | 207,463 | | | | 607,264 | |
Investments sold | | | — | | | | 2,284,309 | | | | — | | | | — | | | | 804,754 | |
Fund shares sold | | | 92,720 | | | | 79,196 | | | | 3,000 | | | | 15,184 | | | | 83,919 | |
Due from investment advisor | | | 98,178 | | | | — | | | | 6,914 | | | | 10,694 | | | | — | |
Prepaid expenses | | | 143,255 | | | | 17,011 | | | | 27,057 | | | | 35,811 | | | | 24,074 | |
Other assets | | | 62,000 | | | | 28,584 | | | | 10,826 | | | | 37,182 | | | | 121,900 | |
Total assets | | | 219,972,555 | | | | 194,060,542 | | | | 16,763,541 | | | | 99,196,817 | | | | 171,585,604 | |
LIABILITIES | | | | | | | | | | | | | | | | | | | | |
Due to custodian bank | | | — | | | | 227,362 | | | | — | | | | — | | | | — | |
Collateral for securities loaned | | | 1,824,874 | | | | 4,310,157 | | | | 823,146 | | | | 1,987,759 | | | | 442,808 | |
Unrealized depreciation on forward foreign currency contracts | | | 160,837 | | | | — | | | | — | | | | — | | | | — | |
Payables: | | | | | | | | | | | | | | | | | | | | |
Investments purchased | | | — | | | | 607,782 | | | | 72,533 | | | | 1,582,805 | | | | 1,307,492 | |
Fund shares redeemed | | | 327,056 | | | | 1,098,912 | | | | — | | | | 40,622 | | | | 758,987 | |
Affiliates: | | | | | | | | | | | | | | | | | | | | |
Investment advisory fees | | | 177,693 | | | | 172,204 | | | | 14,304 | | | | 77,796 | | | | 138,001 | |
Distribution fees | | | 1,399 | | | | 1,340 | | | | 84 | | | | 929 | | | | 2,366 | |
Deferred compensation to trustees | | | 62,000 | | | | 28,584 | | | | 10,826 | | | | 37,182 | | | | 121,900 | |
Trustees’ fees and officer compensation | | | 3,917 | | | | 4,349 | | | | 2,008 | | | | 347 | | | | 3,483 | |
Other accounts payable and accrued liabilities | | | 336,797 | | | | 371,750 | | | | 27,761 | | | | 82,443 | | | | 142,994 | |
Total liabilities | | | 2,894,573 | | | | 6,822,440 | | | | 950,662 | | | | 3,809,883 | | | | 2,918,031 | |
NET ASSETS | | $ | 217,077,982 | | | $ | 187,238,102 | | | $ | 15,812,879 | | | $ | 95,386,934 | | | $ | 168,667,573 | |
COMPOSITION OF NET ASSETS | | | | | | | | | | | | | | | | | | | | |
Paid in capital | | $ | 189,877,974 | | | $ | 174,940,448 | | | $ | 15,956,994 | | | $ | 70,451,381 | | | $ | 144,608,470 | |
Undistributed net investment income (loss) | | | 909,450 | | | | 95,968 | | | | (24,815 | ) | | | (91,516 | ) | | | 616,972 | |
Accumulated net realized gain (loss) on investments, and foreign currency transactions | | | (10,964,057 | ) | | | (25,333,796 | ) | | | (2,964,859 | ) | | | 3,206,658 | | | | 3,754,674 | |
Unrealized appreciation (depreciation) of investments and foreign currency translations | | | 37,254,615 | * | | | 37,535,482 | * | | | 2,845,559 | | | | 21,820,411 | * | | | 19,687,457 | * |
NET ASSETS | | $ | 217,077,982 | | | $ | 187,238,102 | | | $ | 15,812,879 | | | $ | 95,386,934 | | | $ | 168,667,573 | |
CLASS A SHARES† | | | | | | | | | | | | | | | | | | | | |
Net assets applicable to shares outstanding | | $ | 57,276,606 | | | $ | 34,009,361 | | | $ | 5,207,699 | | | $ | 29,530,130 | | | $ | 89,092,671 | |
Shares outstanding | | | 3,289,213 | | | | 2,411,767 | | | | 529,695 | | | | 2,538,541 | | | | 10,389,315 | |
Net asset value and redemption price per share | | $ | 17.41 | | | $ | 14.10 | | | $ | 9.83 | | | $ | 11.63 | | | $ | 8.58 | |
Maximum offering price per share (Net asset value, plus 4.75% of offering price) | | $ | 18.28 | | | $ | 14.80 | | | $ | 10.32 | | | $ | 12.21 | | | $ | 9.01 | |
CLASS C SHARES†** | | | | | | | | | | | | | | | | | | | | |
Net assets applicable to shares outstanding | | $ | 11,197,854 | | | $ | 15,961,066 | | | $ | 228,457 | | | $ | 9,542,716 | | | $ | 20,793,670 | |
Shares outstanding | | | 723,786 | | | | 1,209,734 | | | | 23,970 | | | | 936,614 | | | | 2,766,539 | |
Net asset value and redemption price per share | | $ | 15.47 | | | $ | 13.19 | | | $ | 9.53 | | | $ | 10.19 | | | $ | 7.52 | |
CLASS I SHARES† | | | | | | | | | | | | | | | | | | | | |
Net assets applicable to shares outstanding | | $ | 140,919,335 | | | $ | 137,267,675 | | | $ | 10,376,723 | | | $ | 56,314,088 | | | $ | 58,781,232 | |
Shares outstanding | | | 7,860,888 | | | | 9,650,813 | | | | 1,050,289 | | | | 4,691,422 | | | | 6,638,043 | |
Net asset value and redemption price per share | | $ | 17.93 | | | $ | 14.22 | | | $ | 9.88 | | | $ | 12.00 | | | $ | 8.86 | |
CLASS R6 SHARES† | | | | | | | | | | | | | | | | | | | | |
Net assets applicable to shares outstanding | | $ | 7,684,187 | | | $ | — | | | $ | — | | | $ | — | | | $ | — | |
Shares Outstanding | | | 425,476 | | | | — | | | | — | | | | — | | | | — | |
Net asset value and redemption price per share | | $ | 18.06 | | | $ | — | | | $ | — | | | $ | — | | | $ | — | |
| * | Net of deferred foreign capital gains tax of $(65,668), $(219,860), $(24,905), and $(32,419). |
| † | No par value; unlimited number of shares authorized. |
| ** | Redemption price may be reduced by contingent deferred sales charge. |
| | | | | | |
| See accompanying Notes to Financial Statements | | www.calamos.com | | | 155 | |
Statements of Assets and Liabilities April 30, 2019 (Unaudited)
| | | | | | | | | | | | |
| | | TOTAL RETURN BOND FUND | | | HIGH INCOME OPPORTUNITIES FUND | | | SHORT-TERM BOND FUND | |
ASSETS | | | | | | | | | | | | |
Investments in securities, at cost | | $ | 52,837,908 | | | $ | 53,027,358 | | | $ | 186,891,040 | |
Investment in securities, at value | | $ | 53,124,412 | | | $ | 51,861,613 | | | $ | 188,073,752 | |
Cash with custodian (interest bearing) | | | 3,800 | | | | 8,095 | | | | 9,647 | |
Receivables: | | | | | | | | | | | | |
Accrued interest and dividends | | | 340,987 | | | | 723,419 | | | | 1,198,291 | |
Investments sold | | | — | | | | 210,439 | | | | 5,047,975 | |
Fund shares sold | | | 28,031 | | | | 2,672 | | | | 225,415 | |
Due from investment advisor | | | 10,546 | | | | 11,061 | | | | 13,202 | |
Prepaid expenses | | | 11,361 | | | | 24,379 | | | | 15,940 | |
Deferred offering costs | | | — | | | | — | | | | 111,086 | |
Other assets | | | 39,597 | | | | 87,551 | | | | — | |
Total assets | | | 53,558,734 | | | | 52,929,229 | | | | 194,695,308 | |
LIABILITIES | | | | | | | | | | | | |
Collateral for securities loaned | | | 2,550,385 | | | | 5,792,850 | | | | 3,834,570 | |
Payables: | | | | | | | | | | | | |
Investments purchased | | | 177,934 | | | | 440,058 | | | | 6,447,774 | |
Fund shares redeemed | | | 65,692 | | | | 165,370 | | | | 4,958 | |
Dividends payable | | | 9,416 | | | | 13,292 | | | | 333,275 | |
Affiliates: | | | | | | | | | | | | |
Investment advisory fees | | | 18,769 | | | | 22,875 | | | | 40,547 | |
Distribution fees | | | 458 | | | | 658 | | | | 3 | |
Deferred compensation to trustees | | | 39,597 | | | | 87,551 | | | | — | |
Trustees’ fees and officer compensation | | | 170 | | | | 2,311 | | | | 74 | |
Other accounts payable and accrued liabilities | | | 29,746 | | | | 87,708 | | | | 61,614 | |
Total liabilities | | | 2,892,167 | | | | 6,612,673 | | | | 10,722,815 | |
NET ASSETS | | $ | 50,666,567 | | | $ | 46,316,556 | | | $ | 183,972,493 | |
COMPOSITION OF NET ASSETS | | | | | | | | | | | | |
Paid in capital | | $ | 51,546,205 | | | $ | 57,154,001 | | | $ | 182,700,462 | |
Undistributed net investment income (loss) | | | (68,709 | ) | | | (244,969 | ) | | | (19,278 | ) |
Accumulated net realized gain (loss) on investments | | | (1,097,433 | ) | | | (9,426,731 | ) | | | 108,597 | |
Unrealized appreciation (depreciation) of investments | | | 286,504 | | | | (1,165,745 | ) | | | 1,182,712 | |
NET ASSETS | | $ | 50,666,567 | | | $ | 46,316,556 | | | $ | 183,972,493 | |
CLASS A SHARES† | | | | | | | | | | | | |
Net assets applicable to shares outstanding | | $ | 20,309,491 | | | $ | 36,076,911 | | | $ | 226,242 | |
Shares outstanding | | | 1,998,107 | | | | 4,248,941 | | | | 22,444 | |
Net asset value and redemption price per share | | $ | 10.16 | | | $ | 8.49 | | | $ | 10.08 | |
Maximum offering price per share (Net asset value, plus 4.75% of offering price) | | $ | 10.39 | # | | $ | 8.69 | # | | $ | 10.31 | # |
CLASS C SHARES†** | | | | | | | | | | | | |
Net assets applicable to shares outstanding | | $ | 3,271,070 | | | $ | 2,977,924 | | | $ | — | |
Shares outstanding | | | 321,840 | | | | 332,092 | | | | — | |
Net asset value and redemption price per share | | $ | 10.16 | | | $ | 8.97 | | | $ | — | |
CLASS I SHARES† | | | | | | | | | | | | |
Net assets applicable to shares outstanding | | $ | 27,086,006 | | | $ | 7,261,721 | | | $ | 183,746,251 | |
Shares outstanding | | | 2,664,600 | | | | 855,177 | | | | 18,226,842 | |
Net asset value and redemption price per share | | $ | 10.16 | | | $ | 8.49 | | | $ | 10.08 | |
| † | No par value; unlimited number of shares authorized. |
| # | For Total Return Bond Fund, High Income Opportunities Fund, and Short-Term Bond Fund, maximum offering price per share is Net asset value plus 2.25% of offering price. |
| ** | Redemption price may be reduced by contingent deferred sales charge. |
| | | | |
| 156 | | CALAMOS OPEN-END FAMILY OF FUNDS SEMIANNUAL REPORT | | See accompanying Notes to Financial Statements |
Statements of Operations Six Months Ended April 30, 2019 (Unaudited)
| | | | | | | | | | | | | | | | | | | | |
| | | MARKET NEUTRAL
INCOME FUND | | | HEDGED
EQUITY FUND | | | PHINEUS
LONG/SHORT FUND | | | CONVERTIBLE
FUND | | | GLOBAL
CONVERTIBLE FUND | |
INVESTMENT INCOME | |
Interest | | $ | 100,413,522 | | | $ | 5,362 | | | $ | 5,726,050 | | | $ | 10,074,206 | | | $ | 3,902,303 | |
Dividends | | | 49,613,463 | | | | 1,401,455 | | | | 8,351,162 | | | | 2,825,146 | | | | 399,159 | |
Dividends from affiliated funds | | | 631,268 | | | | — | | | | 498,378 | | | | — | | | | — | |
Dividend taxes withheld | | | — | | | | — | | | | (223,304 | ) | | | — | | | | (3,950 | ) |
Total investment income | | | 150,658,253 | | | | 1,406,817 | | | | 14,352,286 | | | | 12,899,352 | | | | 4,297,512 | |
|
EXPENSES | |
Investment advisory fees | | | 23,410,137 | | | | 499,031 | | | | 6,150,147 | | | | 2,343,168 | | | | 547,229 | |
Distribution fees | |
Class A | | | 948,017 | | | | 6,936 | | | | 121,415 | | | | 272,190 | | | | 13,865 | |
Class C | | | 1,483,142 | | | | 5,334 | | | | 243,219 | | | | 541,434 | | | | 18,871 | |
Dividend or interest expense on short positions | | | 7,088,695 | | | | — | | | | 4,957,557 | | | | — | | | | — | |
Transfer agent fees | | | 3,011,878 | | | | 48,533 | | | | 495,713 | | | | 302,794 | | | | 58,705 | |
Fund administration fees | | | 310,355 | | | | 5,010 | | | | 49,774 | | | | 27,754 | | | | 6,027 | |
Printing and mailing fees | | | 255,509 | | | | 4,031 | | | | 56,034 | | | | 28,286 | | | | 6,570 | |
Accounting fees | | | 211,690 | | | | 13,541 | | | | 32,875 | | | | 23,860 | | | | 11,190 | |
Trustees’ fees and officer compensation | | | 178,565 | | | | 9,921 | | | | 34,753 | | | | 22,003 | | | | 10,152 | |
Legal fees | | | 164,546 | | | | 8,430 | | | | 25,830 | | | | 18,310 | | | | 8,446 | |
Audit fees | | | 111,180 | | | | 5,701 | | | | 18,648 | | | | 13,011 | | | | 5,687 | |
Registration fees | | | 98,193 | | | | 17,832 | | | | 59,622 | | | | 31,730 | | | | 18,903 | |
Custodian fees | | | 87,306 | | | | 31,645 | | | | 64,843 | | | | 7,066 | | | | 5,534 | |
Other | | | 353,952 | | | | 9,639 | | | | 63,600 | | | | 34,085 | | | | 18,130 | |
Total expenses | | | 37,713,165 | | | | 665,584 | | | | 12,374,030 | | | | 3,665,691 | | | | 729,309 | |
Less expense reductions | | | (68,623 | ) | | | — | | | | (51,173 | ) | | | — | | | | — | |
Net expenses | | | 37,644,542 | | | | 665,584 | | | | 12,322,857 | | | | 3,665,691 | | | | 729,309 | |
NET INVESTMENT INCOME (LOSS) | | | 113,013,711 | | | | 741,233 | | | | 2,029,429 | | | | 9,233,661 | | | | 3,568,203 | |
|
REALIZED AND UNREALIZED GAIN (LOSS) | |
Net realized gain (loss) from: | |
Investments, excluding purchased options | | | 41,517,583 | | | | 1,187,891 | | | | (26,895,966 | ) | | | 2,562,295 | | | | (675,861 | ) |
Purchased options | | | (73,344,739 | ) | | | (1,388,186 | ) | | | (27,724,131 | ) | | | (1,200,752 | ) | | | 254,177 | |
Foreign currency transactions | | | (204,540 | ) | | | — | | | | (15,599 | ) | | | — | | | | (25,076 | ) |
Forward foreign currency contracts | | | 3,584,535 | | | | — | | | | — | | | | 123,913 | | | | — | |
Written options | | | 112,306,075 | | | | 1,035,402 | | | | 17,055,381 | | | | (347,851 | ) | | | 40,659 | |
Short positions | | | 12,779,136 | | | | (14,031 | ) | | | 45,507,668 | | | | — | | | | — | |
Total return swaps | | | 4,561,219 | | | | — | | | | — | | | | — | | | | — | |
Realized capital gain distribution from Affiliated fund | | | — | | | | — | | | | 211 | | | | — | | | | — | |
Change in net unrealized appreciation/(depreciation) on: | |
Investments, excluding purchased options | | | 629,698,777 | | | | 13,460,807 | | | | 102,844,995 | | | | 38,126,519 | | | | 3,631,901 | |
Affiliated funds | | | 649,094 | | | | — | | | | 385,687 | | | | — | | | | — | |
Purchased options | | | (7,194,590 | ) | | | (828,898 | ) | | | (17,084,771 | ) | | | 1,809,848 | | | | 48,063 | |
Foreign currency translations | | | 3,397,838 | | | | — | | | | 5,516 | | | | — | | | | 13,579 | |
Forward foreign currency contracts | | | (2,948,020 | ) | | | — | | | | — | | | | (48,716 | ) | | | — | |
Written options | | | (283,955,915 | ) | | | (7,300,235 | ) | | | 1,834,585 | | | | 498,174 | | | | — | |
Short positions | | | (396,929,706 | ) | | | — | | | | (91,704,218 | ) | | | — | | | | — | |
Total return swaps | | | (434,347 | ) | | | — | | | | — | | | | — | | | | — | |
NET GAIN (LOSS) | | | 43,482,400 | | | | 6,152,750 | | | | 4,209,358 | | | | 41,523,430 | | | | 3,287,442 | |
NET INCREASE (DECREASE) IN NET ASSETS RESULTING FROM OPERATIONS | | $ | 156,496,111 | | | $ | 6,893,983 | | | $ | 6,238,787 | | | $ | 50,757,091 | | | $ | 6,855,645 | |
| | | | | | |
| See accompanying Notes to Financial Statements | | www.calamos.com | | | 157 | |
Statements of Operations Six Months Ended April 30, 2019 (Unaudited)
| | | | | | | | | | | | | | | | |
| | | GROWTH
FUND | | | GROWTH AND
INCOME FUND | | | DIVIDEND
GROWTH FUND | | | OPPORTUNISTIC
VALUE FUND | |
INVESTMENT INCOME | |
Interest | | $ | 65,091 | | | $ | 3,167,457 | | | $ | 584 | | | $ | 1,462 | |
Dividends | | | 8,484,055 | | | | 17,782,150 | | | | 221,310 | | | | 502,727 | |
Dividends from affiliated funds | | | 79,005 | | | | — | | | | — | | | | — | |
Dividend taxes withheld | | | (665 | ) | | | — | | | | — | | | | (317 | ) |
Total investment income | | | 8,627,486 | | | | 20,949,607 | | | | 221,894 | | | | 503,872 | |
|
EXPENSES | |
Investment advisory fees | | | 6,325,248 | | | | 6,638,726 | | | | 106,758 | | | | 230,265 | |
Distribution fees | |
Class A | | | 1,110,637 | | | | 1,115,956 | | | | 3,226 | | | | 13,571 | |
Class C | | | 1,190,710 | | | | 1,922,008 | | | | 5,228 | | | | 30,514 | |
Transfer agent fees | | | 938,983 | | | | 991,039 | | | | 7,404 | | | | 19,498 | |
Fund administration fees | | | 64,106 | | | | 88,083 | | | | 1,066 | | | | 2,130 | |
Printing and mailing fees | | | 101,055 | | | | 89,161 | | | | 1,764 | | | | 2,947 | |
Accounting fees | | | 42,451 | | | | 57,978 | | | | 7,878 | | | | 9,279 | |
Trustees’ fees and officer compensation | | | 46,148 | | | | 53,224 | | | | 7,435 | | | | 8,017 | |
Legal fees | | | 27,137 | | | | 47,833 | | | | 7,955 | | | | 6,707 | |
Audit fees | | | 23,962 | | | | 32,190 | | | | 4,111 | | | | 4,470 | |
Custodian fees | | | 21,296 | | | | 17,073 | | | | 745 | | | | 2,287 | |
Registration fees | | | 30,242 | | | | 40,766 | | | | 20,717 | | | | 18,725 | |
Other | | | 90,231 | | | | 103,604 | | | | 6,390 | | | | 6,327 | |
Total expenses | | | 10,012,206 | | | | 11,197,641 | | | | 180,677 | | | | 354,737 | |
Less expense reductions | | | (8,203 | ) | | | — | | | | (54,789 | ) | | | (103,274 | ) |
Net expenses | | | 10,004,003 | | | | 11,197,641 | | | | 125,888 | | | | 251,463 | |
NET INVESTMENT INCOME (LOSS) | | | (1,376,517 | ) | | | 9,751,966 | | | | 96,006 | | | | 252,409 | |
|
REALIZED AND UNREALIZED GAIN (LOSS) | |
Net realized gain (loss) from: | |
Investments, excluding purchased options | | | 92,424,427 | | | | 46,736,821 | | | | 1,986,295 | | | �� | 784,076 | |
Purchased options | | | (5,881,751 | ) | | | (4,557,673 | ) | | | — | | | | 334,184 | |
Foreign currency transactions | | | (2,038 | ) | | | — | | | | — | | | | — | |
Forward foreign currency contracts | | | — | | | | 112,238 | | | | — | | | | — | |
Written options | | | (346,438 | ) | | | 310,929 | | | | — | | | | (154,996 | ) |
Short positions | | | 6,097,024 | | | | — | | | | — | | | | — | |
Realized capital gain distribution from Affiliated fund | | | 33 | | | | — | | | | — | | | | — | |
Change in net unrealized appreciation/(depreciation) on: | |
Investments, excluding purchased options | | | 63,522,687 | | | | 108,371,853 | | | | (462,775 | ) | | | 1,643,753 | |
Affiliated funds | | | 55,442 | | | | — | | | | — | | | | — | |
Purchased options | | | (920,744 | ) | | | (1,568,471 | ) | | | — | | | | (220,004 | ) |
Foreign currency translations | | | (268 | ) | | | — | | | | — | | | | — | |
Forward foreign currency contracts | | | — | | | | (42,666 | ) | | | — | | | | — | |
Written options | | | 152,211 | | | | — | | | | — | | | | 103,451 | |
NET GAIN (LOSS) | | | 155,100,585 | | | | 149,363,031 | | | | 1,523,520 | | | | 2,490,464 | |
NET INCREASE (DECREASE) IN NET ASSETS RESULTING FROM OPERATIONS | | $ | 153,724,068 | | | $ | 159,114,997 | | | $ | 1,619,526 | | | $ | 2,742,873 | |
| | | | |
| 158 | | CALAMOS OPEN-END FAMILY OF FUNDS SEMIANNUAL REPORT | | See accompanying Notes to Financial Statements |
Statements of Operations Six Months Ended April 30, 2019 (Unaudited)
| | | | | | | | | | | | | | | | | | | | |
| | | INTERNATIONAL
GROWTH FUND | | | EVOLVING WORLD
GROWTH FUND | | | EMERGING MARKET
EQUITY FUND | | | GLOBAL
EQUITY FUND | | | GLOBAL
GROWTH AND
INCOME FUND | |
INVESTMENT INCOME | |
Interest | | $ | 44,475 | | | $ | 260,238 | | | $ | 4,976 | | | $ | 16,061 | | | $ | 1,079,393 | |
Dividends | | | 1,999,391 | | | | 1,553,216 | | | | 111,414 | | | | 654,564 | | | | 1,254,905 | |
Dividend taxes withheld | | | (164,829 | ) | | | (119,246 | ) | | | (11,404 | ) | | | (34,697 | ) | | | (49,048 | ) |
Total investment income | | | 1,879,037 | | | | 1,694,208 | | | | 104,986 | | | | 635,928 | | | | 2,285,250 | |
|
EXPENSES | |
Investment advisory fees | | | 1,008,795 | | | | 1,064,545 | | | | 80,336 | | | | 424,630 | | | | 834,470 | |
Distribution fees | |
Class A | | | 67,080 | | | | 41,944 | | | | 5,976 | | | | 32,918 | | | | 83,521 | |
Class C | | | 81,862 | | | | 84,691 | | | | 1,105 | | | | 51,604 | | | | 212,107 | |
Transfer agent fees | | | 185,992 | | | | 131,368 | | | | 6,206 | | | | 54,949 | | | | 113,622 | |
Fund administration fees | | | 10,034 | | | | 9,140 | | | | 640 | | | | 4,168 | | | | 7,987 | |
Printing and mailing fees | | | 13,570 | | | | 16,140 | | | | 1,837 | | | | 4,827 | | | | 11,377 | |
Accounting fees | | | 12,014 | | | | 11,938 | | | | 6,989 | | | | 8,832 | | | | 11,536 | |
Trustees’ fees and officer compensation | | | 12,240 | | | | 11,365 | | | | 7,220 | | | | 11,042 | | | | 11,084 | |
Legal fees | | | 61,127 | | | | 22,881 | | | | 5,983 | | | | 12,091 | | | | 20,833 | |
Audit fees | | | 7,313 | | | | 6,672 | | | | 3,998 | | | | 5,069 | | | | 6,191 | |
Custodian fees | | | 41,558 | | | | 72,320 | | | | 11,674 | | | | 12,358 | | | | 16,123 | |
Registration fees | | | 36,167 | | | | 25,621 | | | | 15,144 | | | | 23,169 | | | | 27,503 | |
Other | | | 18,834 | | | | 22,826 | | | | 6,735 | | | | 10,801 | | | | 15,728 | |
Total expenses | | | 1,556,586 | | | | 1,521,451 | | | | 153,843 | | | | 656,458 | | | | 1,372,082 | |
Less expense reductions | | | (508,999 | ) | | | — | | | | (37,073 | ) | | | (54,383 | ) | | | — | |
Net expenses | | | 1,047,587 | | | | 1,521,451 | | | | 116,770 | | | | 602,075 | | | | 1,372,082 | |
NET INVESTMENT INCOME (LOSS) | | | 831,450 | | | | 172,757 | | | | (11,784 | ) | | | 33,853 | | | | 913,168 | |
|
REALIZED AND UNREALIZED GAIN (LOSS) | |
Net realized gain (loss) from: | |
Investments, excluding purchased options | | | (9,306,144 | ) | | | (3,925,425 | )(a) | | | (355,956 | ) | | | 3,452,820 | | | | 4,734,569 | |
Purchased options | | | (388,302 | ) | | | (290,048 | ) | | | (49,928 | ) | | | (151,183 | ) | | | (1,545,912 | ) |
Foreign currency transactions | | | (4,609 | ) | | | (52,250 | ) | | | (5,592 | ) | | | (2,424 | ) | | | (9,757 | ) |
Forward foreign currency contracts | | | (655,697 | ) | | | — | | | | — | | | | — | | | | — | |
Written options | | | (132,452 | ) | | | — | | | | — | | | | (61,495 | ) | | | (203,830 | ) |
Change in net unrealized appreciation/(depreciation) on: | |
Investments, excluding purchased options | | | 28,120,954 | (b) | | | 27,073,992 | (b) | | | 2,482,379 | | | | 5,499,707 | (b) | | | 6,603,009 | (b) |
Purchased options | | | 57,734 | | | | (126,031 | ) | | | 30,876 | | | | (5,834 | ) | | | 399,772 | |
Foreign currency translations | | | (8,675 | ) | | | 5,091 | | | | (293 | ) | | | (1,845 | ) | | | 306 | |
Forward foreign currency contracts | | | 231,699 | | | | — | | | | — | | | | — | | | | — | |
NET GAIN (LOSS) | | | 17,914,508 | | | | 22,685,329 | | | | 2,101,486 | | | | 8,729,746 | | | | 9,978,157 | |
NET INCREASE (DECREASE) IN NET ASSETS RESULTING FROM OPERATIONS | | $ | 18,745,958 | | | $ | 22,858,086 | | | $ | 2,089,702 | | | $ | 8,763,599 | | | $ | 10,891,325 | |
| (a) | Net of foreign capital gains tax of $(5). |
| (b) | Net of change of $(65,668), (219,860), (24,905) and (32,419), respectively in deferred capital gains tax. |
| | | | | | |
| See accompanying Notes to Financial Statements | | www.calamos.com | | | 159 | |
Statements of Operations Six Months Ended April 30, 2019 (Unaudited)
| | | | | | | | | | | | |
| | | TOTAL RETURN
BOND FUND | | | HIGH INCOME
OPPORTUNITIES FUND | | | SHORT-TERM
BOND FUND | |
INVESTMENT INCOME | |
Interest | | $ | 948,594 | | | $ | 1,541,956 | | | $ | 1,601,635 | |
Dividends | | | 5,838 | | | | 63,897 | | | | 50,468 | |
Dividend taxes withheld | | | — | | | | — | | | | (283 | ) |
Total investment income | | | 954,432 | | | | 1,605,853 | | | | 1,651,820 | |
|
EXPENSES | |
Investment advisory fees | | | 115,594 | | | | 138,371 | | | | 154,298 | |
Distribution fees | |
Class A | | | 23,131 | | | | 39,709 | | | | 147 | |
Class C | | | 28,073 | | | | 36,613 | | | | — | |
Transfer agent fees | | | 26,113 | | | | 31,711 | | | | 6,313 | |
Fund administration fees | | | 2,401 | | | | 2,160 | | | | 2,795 | |
Printing and mailing fees | | | 4,072 | | | | 17,178 | | | | 905 | |
Accounting fees | | | 10,207 | | | | 12,138 | | | | 10,412 | |
Trustees’ fees and officer compensation | | | 10,339 | | | | 8,019 | | | | 8,949 | |
Legal fees | | | 8,197 | | | | 7,536 | | | | 15,385 | |
Audit fees | | | 4,557 | | | | 4,463 | | | | 4,983 | |
Custodian fees | | | 1,564 | | | | 2,744 | | | | 2,715 | |
Registration fees | | | 23,610 | | | | 21,408 | | | | 730 | |
Offering costs | | | — | | | | — | | | | 17,738 | |
Other | | | 11,326 | | | | 14,528 | | | | 10,265 | |
Total expenses | | | 269,184 | | | | 336,578 | | | | 235,635 | |
Less expense reductions | | | (51,014 | ) | | | (86,935 | ) | | | (28,822 | ) |
Net expenses | | | 218,170 | | | | 249,643 | | | | 206,813 | |
NET INVESTMENT INCOME (LOSS) | | | 736,262 | | | | 1,356,210 | | | | 1,445,007 | |
|
REALIZED AND UNREALIZED GAIN (LOSS) | |
Net realized gain (loss) from: | |
Investments | | | (260,527 | ) | | | (604,664 | ) | | | 114,270 | |
Change in net unrealized appreciation/(depreciation) on: | |
Investments | | | 2,091,939 | | | | 1,224,358 | | | | 1,219,756 | |
NET GAIN (LOSS) | | | 1,831,412 | | | | 619,694 | | | | 1,334,026 | |
NET INCREASE (DECREASE) IN NET ASSETS RESULTING FROM OPERATIONS | | $ | 2,567,674 | | | $ | 1,975,904 | | | $ | 2,779,033 | |
| | | | |
| 160 | | CALAMOS OPEN-END FAMILY OF FUNDS SEMIANNUAL REPORT | | See accompanying Notes to Financial Statements |
Statements of Changes in Net Assets
| | | | | | | | | | | | | | | | | | | | | | | | |
| | | MARKET NEUTRAL INCOME FUND | | | HEDGED EQUITY FUND | | | PHINEUS LONG/SHORT FUND | |
| | | (UNAUDITED)
SIX MONTHS
ENDED
APRIL 30,
2019 | | | YEAR ENDED
OCTOBER 31,
2018 | | | (UNAUDITED)
SIX MONTHS
ENDED
APRIL 30,
2019 | | | YEAR ENDED
OCTOBER 31,
2018 | | | (UNAUDITED)
SIX MONTHS
ENDED
APRIL 30,
2019 | | | YEAR ENDED
OCTOBER 31,
2018 | |
OPERATIONS | |
Net investment income (loss) | | $ | 113,013,711 | | | $ | 133,560,542 | | | $ | 741,233 | | | $ | 395,193 | | | $ | 2,029,429 | | | $ | (368,973 | ) |
Net realized gain (loss) | | | 101,199,269 | | | | (84,087,826 | ) | | | 821,076 | | | | (348,206 | ) | | | 7,927,564 | | | | 33,591,055 | |
Change in unrealized appreciation/(depreciation) | | | (57,716,869 | ) | | | 150,563,215 | | | | 5,331,674 | | | | (334,618 | ) | | | (3,718,206 | ) | | | (64,915,641 | ) |
Net increase (decrease) in net assets resulting from operations | | | 156,496,111 | | | | 200,035,931 | | | | 6,893,983 | | | | (287,631 | ) | | | 6,238,787 | | | | (31,693,559 | ) |
|
DISTRIBUTIONS TO SHAREHOLDERS | |
Class A | | | (29,179,323 | ) | | | (19,790,489 | ) | | | (119,461 | ) | | | (98,050 | ) | | | (3,642,160 | ) | | | (963,926 | ) |
Class C | | | (10,520,115 | ) | | | (6,104,800 | ) | | | (16,781 | ) | | | (87 | ) | | | (1,859,837 | ) | | | (403,405 | ) |
Class I | | | (242,460,143 | ) | | | (132,167,069 | ) | | | (2,862,311 | ) | | | (196,116 | ) | | | (32,415,010 | ) | | | (4,970,781 | ) |
Class R | | | — | | | | (126,158 | )(a) | | | — | | | | — | | | | — | | | | — | |
Total distributions | | | (282,159,581 | ) | | | (158,188,516 | ) | | | (2,998,553 | ) | | | (294,253 | ) | | | (37,917,007 | ) | | | (6,338,112 | ) |
| | | | | | |
CAPITAL SHARE TRANSACTIONS | | | 1,106,816,730 | | | | 1,958,907,302 | | | | 73,894,430 | | | | 84,875,022 | | | | (191,273,723 | ) | | | 757,759,541 | |
TOTAL INCREASE (DECREASE) IN NET ASSETS | | | 981,153,260 | | | | 2,000,754,717 | | | | 77,789,860 | | | | 84,293,138 | | | | (222,951,943 | ) | | | 719,727,870 | |
|
NET ASSETS | |
Beginning of period | | $ | 6,705,841,204 | | | $ | 4,705,086,487 | | | $ | 97,356,511 | | | $ | 13,063,373 | | | $ | 1,164,355,984 | | | $ | 444,628,114 | |
End of period | | $ | 7,686,994,464 | | | $ | 6,705,841,204 | | | $ | 175,146,371 | | | $ | 97,356,511 | | | $ | 941,404,041 | | | $ | 1,164,355,984 | |
| (a) | Class R shares were converted into Class A shares at the close of business on February 22, 2018. |
| | | | | | |
| See accompanying Notes to Financial Statements | | www.calamos.com | | | 161 | |
Statements of Changes in Net Assets
| | | | | | | | | | | | | | | | | | | | | | | | |
| | | CONVERTIBLE FUND | | | GLOBAL CONVERTIBLE FUND | | | GROWTH FUND | |
| | | (UNAUDITED)
SIX MONTHS
ENDED
APRIL 30,
2019 | | |
YEAR ENDED
OCTOBER 31,
2018 | | | (UNAUDITED)
SIX MONTHS
ENDED
APRIL 30,
2019 | | |
YEAR ENDED
OCTOBER 31,
2018 | | | (UNAUDITED)
SIX MONTHS
ENDED
APRIL 30,
2019 | | |
YEAR ENDED
OCTOBER 31,
2018 | |
OPERATIONS | |
Net investment income (loss) | | $ | 9,233,661 | | | $ | 15,251,028 | | | $ | 3,568,203 | | | $ | 4,049,578 | | | $ | (1,376,517 | ) | | $ | (5,683,541 | ) |
Net realized gain (loss) | | | 1,137,605 | | | | 63,802,671 | | | | (406,101 | ) | | | 4,557,628 | | | | 92,291,257 | | | | 246,806,178 | |
Change in unrealized appreciation/(depreciation) | | | 40,385,825 | | | | (61,042,739 | ) | | | 3,693,543 | | | | (9,247,330 | ) | | | 62,809,328 | | | | (134,210,439 | ) |
Net increase (decrease) in net assets resulting from operations | | | 50,757,091 | | | | 18,010,960 | | | | 6,855,645 | | | | (640,124 | ) | | | 153,724,068 | | | | 106,912,198 | |
|
DISTRIBUTIONS TO SHAREHOLDERS | |
Class A | | | (23,520,533 | ) | | | (9,096,274 | ) | | | (487,803 | ) | | | (486,775 | ) | | | (110,345,634 | ) | | | (118,711,102 | ) |
Class C | | | (14,115,823 | ) | | | (5,028,361 | ) | | | (163,061 | ) | | | (95,051 | ) | | | (66,517,149 | ) | | | (70,806,265 | ) |
Class I | | | (35,848,449 | ) | | | (11,800,923 | ) | | | (5,518,161 | ) | | | (3,913,214 | ) | | | (27,706,322 | ) | | | (28,576,842 | ) |
Class R | | | — | | | | (52,590 | )(a) | | | — | | | | (245 | )(a) | | | — | | | | (690,251 | )(a) |
Total distributions | | | (73,484,805 | ) | | | (25,978,148 | ) | | | (6,169,025 | ) | | | (4,495,285 | ) | | | (204,569,105 | ) | | | (218,784,460 | ) |
| | | | | | |
CAPITAL SHARE TRANSACTIONS | | | 109,096,711 | | | | 19,548,691 | | | | (1,947,314 | ) | | | 34,679,408 | | | | 63,479,755 | | | | (97,019,944 | ) |
TOTAL INCREASE (DECREASE) IN NET ASSETS | | | 86,368,997 | | | | 11,581,503 | | | | (1,260,694 | ) | | | 29,543,999 | | | | 12,634,718 | | | | (208,892,206 | ) |
|
NET ASSETS | |
Beginning of period | | $ | 615,541,169 | | | $ | 603,959,666 | | | $ | 136,237,997 | | | $ | 106,693,998 | | | $ | 1,463,535,075 | | | $ | 1,672,427,281 | |
End of period | | $ | 701,910,166 | | | $ | 615,541,169 | | | $ | 134,977,303 | | | $ | 136,237,997 | | | $ | 1,476,169,793 | | | $ | 1,463,535,075 | |
| (a) | Class R shares were converted into Class A shares at the close of business on February 22, 2018. |
| | | | |
| 162 | | CALAMOS OPEN-END FAMILY OF FUNDS SEMIANNUAL REPORT | | See accompanying Notes to Financial Statements |
Statements of Changes in Net Assets
| | | | | | | | | | | | | | | | | | | | | | | | |
| | | GROWTH AND INCOME FUND | | | DIVIDEND GROWTH FUND | | | OPPORTUNISTIC VALUE FUND | |
| | | (UNAUDITED)
SIX MONTHS
ENDED
APRIL 30,
2019 | | |
YEAR ENDED
OCTOBER 31,
2018 | | | (UNAUDITED)
SIX MONTHS
ENDED
APRIL 30,
2019 | | |
YEAR ENDED
OCTOBER 31,
2018 | | | (UNAUDITED)
SIX MONTHS
ENDED
APRIL 30,
2019 | | |
YEAR ENDED
OCTOBER 31,
2018 | |
OPERATIONS | |
Net investment income (loss) | | $ | 9,751,966 | | | $ | 13,113,736 | | | $ | 96,006 | | | $ | 192,868 | | | $ | 252,409 | | | $ | 359,439 | |
Net realized gain (loss) | | | 42,602,315 | | | | 125,919,453 | | | | 1,986,295 | | | | 1,005,910 | | | | 963,264 | | | | 7,267,910 | |
Change in unrealized appreciation/(depreciation) | | | 106,760,716 | | | | (35,656,274 | ) | | | (462,775 | ) | | | 197,081 | | | | 1,527,200 | | | | (5,172,491 | ) |
Net increase (decrease) in net assets resulting from operations | | | 159,114,997 | | | | 103,376,915 | | | | 1,619,526 | | | | 1,395,859 | | | | 2,742,873 | | | | 2,454,858 | |
|
DISTRIBUTIONS TO SHAREHOLDERS | |
Class A | | | (57,442,098 | ) | | | (61,831,918 | ) | | | (95,179 | ) | | | (163,449 | ) | | | (1,446,325 | ) | | | (737,994 | ) |
Class C | | | (31,048,076 | ) | | | (34,200,058 | ) | | | (38,283 | ) | | | (79,037 | ) | | | (1,259,904 | ) | | | (155,577 | ) |
Class I | | | (47,146,192 | ) | | | (41,414,931 | ) | | | (845,145 | ) | | | (1,856,416 | ) | | | (4,646,839 | ) | | | (917,598 | ) |
Class R | | | — | | | | (687,487 | )(a) | | | — | | | | — | | | | — | | | | (5,402 | )(a) |
Total distributions | | | (135,636,366 | ) | | | (138,134,394 | ) | | | (978,607 | ) | | | (2,098,902 | ) | | | (7,353,068 | ) | | | (1,816,571 | ) |
| | | | | | |
CAPITAL SHARE TRANSACTIONS | | | 39,687,805 | | | | (46,306,586 | ) | | | (5,642,896 | ) | | | (607,473 | ) | | | 3,521,217 | | | | (5,531,659 | ) |
TOTAL INCREASE (DECREASE) IN NET ASSETS | | | 63,166,436 | | | | (81,064,065 | ) | | | (5,001,977 | ) | | | (1,310,516 | ) | | | (1,088,978 | ) | | | (4,893,372 | ) |
|
NET ASSETS | |
Beginning of period | | $ | 1,978,448,735 | | | $ | 2,059,512,800 | | | $ | 23,960,036 | | | $ | 25,270,552 | | | $ | 47,558,843 | | | $ | 52,452,215 | |
End of period | | $ | 2,041,615,171 | | | $ | 1,978,448,735 | | | $ | 18,958,059 | | | $ | 23,960,036 | | | $ | 46,469,865 | | | $ | 47,558,843 | |
| (a) | Class R shares were converted into Class A shares at the close of business on February 22, 2018. |
| | | | | | |
| See accompanying Notes to Financial Statements | | www.calamos.com | | | 163 | |
Statements of Changes in Net Assets
| | | | | | | | | | | | | | | | | | | | | | | | |
| | | INTERNATIONAL GROWTH FUND | | | EVOLVING WORLD GROWTH FUND | | | EMERGING MARKET EQUITY FUND | |
| | | (UNAUDITED)
SIX MONTHS
ENDED
APRIL 30,
2019 | | | YEAR ENDED
OCTOBER 31,
2018(a) | | | (UNAUDITED)
SIX MONTHS
ENDED
APRIL 30,
2019 | | |
YEAR ENDED
OCTOBER 31,
2018 | | | (UNAUDITED)
SIX MONTHS
ENDED
APRIL 30, 2019 | | |
YEAR ENDED
OCTOBER 31,
2018 | |
OPERATIONS | |
Net investment income (loss) | | $ | 831,450 | | | $ | 2,204,265 | | | $ | 172,757 | | | $ | 29,128 | | | $ | (11,784 | ) | | $ | 27,211 | |
Net realized gain (loss) | | | (10,487,204 | ) | | | 26,684,732 | | | | (4,267,723 | ) | | | 33,416,762 | | | | (411,476 | ) | | | 231,800 | |
Change in unrealized appreciation/(depreciation) | | | 28,401,712 | | | | (63,063,179 | ) | | | 26,953,052 | | | | (69,667,885 | ) | | | 2,512,962 | | | | (3,688,532 | ) |
Net increase (decrease) in net assets resulting from operations | | | 18,745,958 | | | | (34,174,182 | ) | | | 22,858,086 | | | | (36,221,995 | ) | | | 2,089,702 | | | | (3,429,521 | ) |
|
DISTRIBUTIONS TO SHAREHOLDERS | |
Class A | | | (6,172,737 | ) | | | (4,300,922 | ) | | | — | | | | (8,575 | ) | | | — | | | | (9,319 | ) |
Class C | | | (2,405,608 | ) | | | (1,129,875 | ) | | | — | | | | — | | | | — | | | | — | |
Class I | | | (15,226,176 | ) | | | (6,458,775 | ) | | | — | | | | (954,899 | ) | | | (5,001 | ) | | | (45,343 | ) |
Class R | | | — | | | | (267,543 | )(b) | | | — | | | | — | (b) | | | — | | | | — | |
Class R6 | | | (2,420 | ) | | | — | (a) | | | — | | | | — | | | | — | | | | — | |
Total distributions | | | (23,806,941 | ) | | | (12,157,115 | ) | | | — | | | | (963,474 | ) | | | (5,001 | ) | | | (54,662 | ) |
|
Return of capital | |
Class A | | | — | | | | — | | | | — | | | | (1 | ) | | | — | | | | (1 | ) |
Class I | | | — | | | | — | | | | — | | | | (109 | ) | | | — | | | | (7 | ) |
Total return of capital | | | — | | | | — | | | | — | | | | (110 | ) | | | — | | | | (8 | ) |
| | | | | | |
CAPITAL SHARE TRANSACTIONS | | | (11,211,105 | ) | | | (2,477,933 | ) | | | (40,151,189 | ) | | | (79,460,414 | ) | | | (271,247 | ) | | | 399,376 | |
TOTAL INCREASE (DECREASE) IN NET ASSETS | | | (16,272,088 | ) | | | (48,809,230 | ) | | | (17,293,103 | ) | | | (116,645,993 | ) | | | 1,813,454 | | | | (3,084,815 | ) |
|
NET ASSETS | |
Beginning of period | | $ | 233,350,070 | | | $ | 282,159,300 | | | $ | 204,531,205 | | | $ | 321,177,198 | | | $ | 13,999,425 | | | $ | 17,084,240 | |
End of period | | $ | 217,077,982 | | | $ | 233,350,070 | | | $ | 187,238,102 | | | $ | 204,531,205 | | | $ | 15,812,879 | | | $ | 13,999,425 | |
| (a) | International Growth Fund Class R6 commenced operations on September 17, 2018. |
| (b) | Class R shares were converted into Class A shares at the close of business on February 22, 2018. |
| | | | |
| 164 | | CALAMOS OPEN-END FAMILY OF FUNDS SEMIANNUAL REPORT | | See accompanying Notes to Financial Statements |
Statements of Changes in Net Assets
| | | | | | | | | | | | | | | | | | | | | | | | |
| | | GLOBAL EQUITY FUND | | | GLOBAL GROWTH AND INCOME FUND | | | TOTAL RETURN BOND FUND | |
| | | (UNAUDITED)
SIX MONTHS
ENDED
APRIL 30,
2019 | | |
YEAR ENDED
OCTOBER 31,
2018 | | | (UNAUDITED)
SIX MONTHS
ENDED
APRIL 30,
2019 | | |
YEAR ENDED
OCTOBER 31,
2018 | | | (UNAUDITED)
SIX MONTHS
ENDED
APRIL 30,
2019 | | |
YEAR ENDED
OCTOBER 31,
2018 | |
OPERATIONS | |
Net investment income (loss) | | $ | 33,853 | | | $ | 22,110 | | | $ | 913,168 | | | $ | 1,739,689 | | | $ | 736,262 | | | $ | 1,640,128 | |
Net realized gain (loss) | | | 3,237,718 | | | | 22,866,735 | | | | 2,975,070 | | | | 18,995,830 | | | | (260,527 | ) | | | (587,926 | ) |
Change in unrealized appreciation/(depreciation) | | | 5,492,028 | | | | (24,904,595 | ) | | | 7,003,087 | | | | (25,939,489 | ) | | | 2,091,939 | | | | (2,567,811 | ) |
Net increase (decrease) in net assets resulting from operations | | | 8,763,599 | | | | (2,015,750 | ) | | | 10,891,325 | | | | (5,203,970 | ) | | | 2,567,674 | | | | (1,515,609 | ) |
|
DISTRIBUTIONS TO SHAREHOLDERS | |
Class A | | | (5,307,306 | ) | | | (2,369,038 | ) | | | (6,250,599 | ) | | | (4,633,084 | ) | | | (259,562 | ) | | | (628,147 | ) |
Class C | | | (2,645,190 | ) | | | (1,306,602 | ) | | | (5,796,232 | ) | | | (4,392,776 | ) | | | (57,709 | ) | | | (192,264 | ) |
Class I | | | (10,702,341 | ) | | | (7,611,885 | ) | | | (6,136,312 | ) | | | (4,640,349 | ) | | | (416,222 | ) | | | (1,298,630 | ) |
Class R | | | — | | | | (472,463 | )(a) | | | — | | | | (74,198 | )(a) | | | — | | | | (5,977 | )(a) |
Total distributions | | | (18,654,837 | ) | | | (11,759,988 | ) | | | (18,183,143 | ) | | | (13,740,407 | ) | | | (733,493 | ) | | | (2,125,018 | ) |
|
Return of capital | |
Class A | | | — | | | | — | | | | — | | | | — | | | | — | | | | (52,753 | ) |
Class C | | | — | | | | — | | | | — | | | | — | | | | — | | | | (15,293 | ) |
Class I | | | — | | | | — | | | | — | | | | — | | | | — | | | | (111,460 | ) |
Class R | | | — | | | | — | (a) | | | — | | | | — | (a) | | | — | | | | (414 | ) |
Total return of capital | | | — | | | | — | | | | — | | | | — | | | | — | | | | (179,920 | ) |
| | | | | | |
CAPITAL SHARE TRANSACTIONS | | | 8,824,582 | | | | (22,045,459 | ) | | | (14,377,137 | ) | | | (13,750,518 | ) | | | (7,577,000 | ) | | | (11,492,890 | ) |
TOTAL INCREASE (DECREASE) IN NET ASSETS | | | (1,066,656 | ) | | | (35,821,197 | ) | | | (21,668,955 | ) | | | (32,694,895 | ) | | | (5,742,819 | ) | | | (15,313,437 | ) |
|
NET ASSETS | |
Beginning of period | | $ | 96,453,590 | | | $ | 132,274,787 | | | $ | 190,336,528 | | | $ | 223,031,423 | | | $ | 56,409,386 | | | $ | 71,722,823 | |
End of period | | $ | 95,386,934 | | | $ | 96,453,590 | | | $ | 168,667,573 | | | $ | 190,336,528 | | | $ | 50,666,567 | | | $ | 56,409,386 | |
| (a) | Class R shares were converted into Class A shares at the close of business on February 22, 2018. |
| | | | | | |
| See accompanying Notes to Financial Statements | | www.calamos.com | | | 165 | |
Statements of Changes in Net Assets
| | | | | | | | | | | | | | | | |
| | | HIGH INCOME OPPORTUNITIES FUND | | | SHORT-TERM BOND FUND | |
| | | (UNAUDITED)
SIX MONTHS
ENDED
APRIL 30,
2019 | | |
YEAR ENDED
OCTOBER 31,
2018 | | | (UNAUDITED)
SIX MONTHS
ENDED
APRIL 30,
2019 | | |
YEAR ENDED
OCTOBER 31,
2018(a) | |
OPERATIONS | |
Net investment income (loss) | | $ | 1,356,210 | | | $ | 2,881,984 | | | $ | 1,445,007 | | | $ | 54,729 | |
Net realized gain (loss) | | | (604,664 | ) | | | (547,859 | ) | | | 114,270 | | | | 356 | |
Change in unrealized appreciation/(depreciation) | | | 1,224,358 | | | | (2,172,841 | ) | | | 1,219,756 | | | | (37,044 | ) |
Net increase (decrease) in net assets resulting from operations | | | 1,975,904 | | | | 161,284 | | | | 2,779,033 | | | | 18,041 | |
|
DISTRIBUTIONS TO SHAREHOLDERS | |
Class A | | | (989,071 | ) | | | (2,078,697 | ) | | | (1,547 | ) | | | (81 | ) |
Class C | | | (187,182 | ) | | | (565,261 | ) | | | — | | | | — | |
Class I | | | (226,965 | ) | | | (537,734 | ) | | | (1,469,326 | ) | | | (54,089 | ) |
Class R | | | — | | | | (1,704 | )(b) | | | — | | | | — | |
Total distributions | | | (1,403,218 | ) | | | (3,183,396 | ) | | | (1,470,873 | ) | | | (54,170 | ) |
| | | | |
CAPITAL SHARE TRANSACTIONS | | | (4,016,266 | ) | | | (7,003,095 | ) | | | 167,521,358 | | | | 15,179,104 | |
TOTAL INCREASE (DECREASE) IN NET ASSETS | | | (3,443,580 | ) | | | (10,025,207 | ) | | | 168,829,518 | | | | 15,142,975 | |
|
NET ASSETS | |
Beginning of period | | $ | 49,760,136 | | | $ | 59,785,343 | | | $ | 15,142,975 | | | $ | — | |
End of period | | $ | 46,316,556 | | | $ | 49,760,136 | | | $ | 183,972,493 | | | $ | 15,142,975 | |
| (a) | Short-Term Bond Fund commenced operations on September 19, 2018. |
| (b) | Class R shares were converted into Class A shares at the close of business on February 22, 2018. |
| | | | |
| 166 | | CALAMOS OPEN-END FAMILY OF FUNDS SEMIANNUAL REPORT | | See accompanying Notes to Financial Statements |
Notes to Financial Statements (Unaudited)
Note 1 – Organization and Significant Accounting Policies
Organization. CALAMOS INVESTMENT TRUST, a Massachusetts business trust organized December 21, 1987 (the “Trust”), consists of seventeen series,Market Neutral Income Fund, Hedged Equity Fund, Phineus Long/Short Fund, Convertible Fund, Global Convertible Fund, Growth Fund, Growth and Income Fund, Dividend Growth Fund, Opportunistic Value Fund, International Growth Fund, Evolving World Growth Fund, Emerging Market Equity Fund , Global Equity Fund, Global Growth and Income Fund, Total Return Bond Fund, High Income Opportunities Fund, and Short-Term Bond Fund (commenced operations on September 19, 2018),(each a “Fund” and collectively the “Funds”). The Trust is registered under the Investment Company Act of 1940 as amended (the “1940 Act”) as anopen-end management investment company. The Fund is considered an investment company under U.S. GAAP and follows the accounting and reporting guidance applicable to investment companies. The Trust currently offers Class A, Class C, and Class I shares of each of the Funds (except Short-Term Bond Fund). Class R6 shares are offered in International Growth Fund only.
Significant Accounting Policies. The financial statements have been prepared in conformity with accounting principles generally accepted in the United States of America (U.S. GAAP), and the Funds’ are each considered an investment company under U.S. GAAP and follow the accounting and reporting guidance applicable to investment companies. The Funds adhere to the accounting and reporting requirements set forth in ASU2013-08 and ASC 946. Under U.S. GAAP, management is required to make certain estimates and assumptions at the date of the financial statements and actual results may differ from those estimates. Subsequent events, if any, through the date that the financial statements were issued, have been evaluated in the preparation of the financial statements. The following summarizes the significant accounting policies of the Fund:
Fund Valuation. The valuation of the Funds’ investments is in accordance with policies and procedures adopted by and under the ultimate supervision of the board of trustees.
Fund securities that are traded on U.S. securities exchanges, except option securities, are valued at the official closing price, which is the last current reported sales price on its principal exchange at the time each Fund determines its net asset value (“NAV”). Securities traded in theover-the-counter market and quoted on The NASDAQ Stock Market are valued at the NASDAQ Official Closing Price, as determined by NASDAQ, or lacking a NASDAQ Official Closing Price, the last current reported sale price on NASDAQ at the time a Fund determines its NAV. When a last sale or closing price is not available, equity securities, other than option securities, that are traded on a U.S. securities exchange and other equity securities traded in theover-the-counter market are valued at the mean between the most recent bid and asked quotations on its principal exchange in accordance with guidelines adopted by the board of trustees. Each option security traded on a U.S. securities exchange is valued at themid-point of the consolidated bid/ask quote for the option security, also in accordance with guidelines adopted by the board of trustees. Eachover-the-counter option that is not traded through the Options Clearing Corporation is valued either by an independent pricing agent approved by the board of trustees or based on a quotation provided by the counterparty to such option under the ultimate supervision of the board of trustees.
Fixed income securities, certain convertible preferred securities, andnon-exchange traded derivatives are normally valued by independent pricing services or by dealers or brokers who make markets in such securities. Valuations of such fixed income securities, certain convertible preferred securities andnon-exchange traded derivatives consider yield or price of equivalent securities of comparable quality, coupon rate, maturity, type of issue, trading characteristics and other market data and do not rely exclusively upon exchange orover-the-counter prices.
Trading on European and Far Eastern exchanges andover-the-counter markets is typically completed at various times before the close of business on each day on which the New York Stock Exchange (“NYSE”) is open. Each security trading on these exchanges or inover-the-counter markets may be valued utilizing a systematic fair valuation model provided by an independent pricing service approved by the board of trustees. The valuation of each security that meets certain criteria in relation to the valuation model is systematically adjusted to reflect the impact of movement in the U.S. market after the foreign markets close. Securities that do not meet the criteria, or that are principally traded in other foreign markets, are valued as of the last reported sale price at the time the respective Fund determines its NAV, or when reliable market prices or quotations are not readily available, at the mean between the most recent bid and asked quotations as of the close of the appropriate exchange or other designated time. Trading of foreign securities may not take place on every NYSE business day. In addition, trading may take place in various foreign markets on Saturdays or on other days when the NYSE is not open and on which the respective Fund’s NAV is not calculated.
Notes to Financial Statements (Unaudited)
If the pricing committee determines that the valuation of a security in accordance with the methods described above is not reflective of a fair value for such security, the security is valued at a fair value by the pricing committee, under the ultimate supervision of the board of trustees, following the guidelines and/or procedures adopted by the board of trustees.
Each Fund also may use fair value pricing, pursuant to guidelines adopted by the board of trustees and under the ultimate supervision of the board of trustees, if trading in the security is halted or if the value of a security it holds is materially affected by events occurring before the Fund’s pricing time but after the close of the primary market or exchange on which the security is listed. Those procedures may utilize valuations furnished by pricing services approved by the board of trustees, which may be based on market transactions for comparable securities and various relationships between securities that are generally recognized by institutional traders, a computerized matrix system, or appraisals derived from information concerning the securities or similar securities received from recognized dealers in those securities.
When fair value pricing of securities is employed, the prices of securities used by the Fund to calculate its NAV may differ from market quotations or official closing prices. In light of the judgment involved in fair valuations, there can be no assurance that a fair value assigned to a particular security is accurate.
Investment Transactions. Investment transactions are recorded on a trade date basis as of April 30, 2019. Net realized gains and losses from investment transactions are reported on an identified cost basis. Interest income is recognized using the accrual method and includes accretion of original issue and market discount and amortization of premium. Dividend income is recognized on theex-dividend date, except that certain dividends from foreign securities are recorded as soon as the information becomes available after theex-dividend date.
Foreign Currency Translation. Values of investments and other assets and liabilities denominated in foreign currencies are translated into U.S. dollars using a rate quoted by a major bank or dealer in the particular currency market, as reported by a recognized quotation dissemination service.
The Funds do not isolate that portion of the results of operations resulting from changes in foreign exchange rates on investments from the fluctuations arising from changes in market prices of securities held. Such fluctuations are included with the net realized and unrealized gain or loss from investments.
Reported net realized foreign currency gains or losses arise from disposition of foreign currency, the difference in the foreign exchange rates between the trade and settlement dates on securities transactions, and the difference between the amounts of dividends, interest and foreign withholding taxes recorded on theex-date or accrual date and the U.S. dollar equivalent of the amounts actually received or paid. Net unrealized foreign exchange gains and losses arise from changes (due to the changes in the exchange rate) in the value of foreign currency and other assets and liabilities denominated in foreign currencies held at period end.
Allocation of Expenses Among Funds and Classes. Expenses directly attributable to a Fund are charged to that Fund; certain other common expenses of the Trust, Calamos Advisors Trust, Calamos Convertible Opportunities and Income Fund, Calamos Convertible and High Income Fund, Calamos Strategic Total Return Fund, Calamos Global Total Return Fund,Calamos Global Dynamic Income Fund and Calamos Dynamic Convertible and Income Fundare allocated proportionately among each Fund to which the expenses relate in relation to the net assets of each Fund or on another reasonable basis. Expenses directly attributable to a particular class of a fund in the Trust are charged directly to such class. In calculating the net asset value per share of each class, investment income, realized and unrealized gains and losses and expenses other than class specific expenses are allocated daily to each class of shares based upon the proportion of net assets of each class at the beginning of each day plus current day fund share activity.
Income Taxes. No provision has been made for U.S. income taxes because the Trust’s policy is to continue to qualify as a regulated investment company under the Internal Revenue Code of 1986, as amended, and distribute to shareholders substantially all of theFunds’ taxable income and net realized gains.
Dividends and distributions paid to shareholders are recorded on theex-dividend date. The amount of dividends and distributions from net investment income and net realized capital gains is determined in accordance with federal income tax regulations, which may differ from U.S. generally accepted accounting principles. To the extent these “book/tax” differences are permanent in nature, such amounts are reclassified within the capital accounts based on their federaltax-basis treatment. These differences are primarily due to differing treatments for foreign currency transactions, contingent payment debt instruments and methods of amortizing and accreting for fixed income securities. The financial statements are not adjusted for temporary differences.
The Fund recognized no liability for uncertain tax positions. A reconciliation is not provided as the beginning and ending amounts of unrecognized benefits are zero, with no interim additions, reductions or settlements. Tax years 2015 – 2018 remain subject to
| | | | |
| 168 | | CALAMOS OPEN-END FAMILY OF FUNDS SEMIANNUAL REPORT | | |
Notes to Financial Statements (Unaudited)
examination by the U.S. and the State of Illinois tax jurisdictions for those Funds that have been in existence during that time, and for all years since inception for those Funds created subsequent to October 31, 2013.
Indemnifications. Under the Trust’s organizational documents, the Trust is obligated to indemnify its officers and trustees against certain liabilities incurred by them by reason of having been an officer or trustee of the Trust. In addition, in the normal course of business, the Trust may enter into contracts that provide general indemnifications to other parties. Each Fund’s maximum exposure under these arrangements is unknown as this would involve future claims that may be made against the Fund that have not yet occurred. Currently, the Funds’ management expects the risk of material loss in connection to a potential claim to be remote.
Note 2 – Investment Adviser and Transactions With Affiliates Or Certain Other Parties
Pursuant to an investment advisory agreement with Calamos Advisors LLC (“Calamos Advisors”), each Fund pays a monthly investment advisory fee based on the average daily net assets of the Fund, as shown below:
| | | | | | | | | | | | | | | | |
| AVERAGE DAILY NET ASSETS | | GROWTH FUND
ANNUAL RATE | | | EVOLVING WORLD
GROWTH FUND,
EMERGING MARKET
EQUITY FUND
ANNUAL RATE | | | TOTAL RETURN
BOND FUND
ANNUAL RATE | | | OPPORTUNISTIC VALUE FUND,
DIVIDEND GROWTH FUND,
INTERNATIONAL GROWTH FUND*,
GLOBAL EQUITY FUND*, GLOBAL GROWTH AND INCOME FUND ANNUAL RATE | |
| First $500 million | | | 1.00% | | | | 1.10% | | | | 0.45% | | | | 1.00% | |
| | | | |
| | | | |
| Next $500 million | | | 0.90% | | | | 1.05% | | | | 0.43% | | | | 0.95% | |
| | | | |
| | | | |
| Next $5 billion | | | 0.80% | | | | 1.00% | | | | 0.41% | | | | 0.90% | |
| | | | |
| | | | |
| Over $6 billion | | | 0.70% | | | | 0.90% | | | | 0.35% | | | | 0.80% | |
| | | | |
| * | International Growth Fund and Global Equity Fund are subject to a possible adjustment based on performance as described below. |
| | | | | | | | | | | | | | | | | | | | |
| AVERAGE DAILY NET ASSETS | | GLOBAL CONVERTIBLE
FUND ANNUAL RATE | | | SHORT-TERM
BOND FUND
ANNUAL RATE | | | GROWTH AND INCOME FUND,
CONVERTIBLE FUND, MARKET NEUTRAL INCOME FUND,
HEDGED EQUITY FUND
ANNUAL RATE | | | HIGH INCOME
OPPORTUNITIES
FUND ANNUAL RATE | | | PHINEUS LONG/SHORT FUND ANNUAL RATE | |
| First $500 million | | | 0.85% | | | | 0.30% | | | | 0.75% | | | | 0.60% | | | | 1.25% | |
| | | | |
| | | | | |
| Next $500 million | | | 0.80% | | | | 0.27% | | | | 0.70% | | | | 0.55% | | | | 1.20% | |
| | | | |
| | | | | |
| Over $1 billion | | | 0.75% | | | | 0.25% | | | | 0.65% | | | | 0.50% | | | | 1.15% | |
| | | | |
The average investment advisory fee as of the period ended April 30, 2019 was as follows:
| | | | |
| FUND | | PERCENTAGE | |
| Market Neutral Income Fund | | | 0.66 | % |
| |
| Hedged Equity Fund | | | 0.75 | |
| |
| Phineus Long/Short Fund | | | 1.22 | |
| |
| Convertible Fund | | | 0.74 | |
| |
| Global Convertible Fund | | | 0.85 | |
| |
| Growth Fund | | | 0.91 | |
| |
| Growth and Income Fund | | | 0.69 | |
| |
| Dividend Growth Fund | | | 1.00 | |
| |
| Opportunistic Value Fund | | | 1.00 | |
| |
| International Growth Fund | | | 0.95 | |
| |
| Evolving World Growth Fund | | | 1.10 | |
| |
| Emerging Market Equity Fund | | | 1.10 | |
| |
| Global Equity Fund | | | 0.94 | |
| |
| Global Growth and Income Fund | | | 1.00 | |
| |
| Total Return Bond Fund | | | 0.45 | |
| |
| High Income Opportunities Fund | | | 0.60 | |
| |
| Short-Term Bond Fund | | | 0.30 | |
Notes to Financial Statements (Unaudited)
Each of theInternational Growth andGlobal Equity Funds pays a fee based on average daily net assets of the Fund that is accrued daily and paid on a monthly basis, subject to possible adjustment based on the Fund’s investment performance (since March 2006 forInternational Growth Fund and since February 2008 forGlobal Equity Fund). The performance adjustment increases or decreases the management fee, on a monthly basis, by 1/12 of 0.03% of a Fund’s average daily net assets over the performance period for each full 1% increment amount by which a Fund outperforms or underperforms the benchmark index (“Index”), on an annualized basis, over the performance measurement period. The benchmark indexes are the MSCI EAFE Growth Index and the MSCI World Index for theInternational Growth Fund andGlobal Equity Fund, respectively.
The base fee is shown in the table above. The performance adjustment rate is calculated by comparing over the performance measurement period the Fund’s Class A share performance to that of the respective Index. The performance measurement period commenced at the beginning of each Fund’s first full month of operation (April 2005 and March 2007 for theInternational Growth Fund andGlobal Equity Fund, respectively). The first performance adjustment was applied to the advisory fee at the end of the twelfth month. Each month subsequent to the twelfth month, a new month is added to the performance measurement period until the performance measurement period includes 36 months. Thereafter, the performance measurement period consists of the most recent month plus the previous 35 months.
The performance comparison is made at the end of each month. The maximum annualized performance adjustment rate is+/-0.30% of the Fund’s average daily net assets over the performance measurement period. The performance adjustment rate is divided by twelve and multiplied by the Fund’s average daily net assets over the performance measurement period, and the resulting dollar amount is then added to or subtracted from the base fee. Calamos Advisors may receive a positive performance adjustment even if the Fund has a negative return over a performance measurement period if it otherwise outperforms the Index during that period.
Each Fund may invest in shares of theShort Term Bond Fund(“STBF”). Calamos Advisors has contractually agreed to waive a portion of its advisory fee charged to the Fund equal to the advisory fee paid by STBF attributable to the Fund’s investment in STBF, based on daily net assets. For the period ended April 30, 2019, the total advisory fees waived pursuant to such agreement were $8,203, $68,623, and $51,173 for theGrowth Fund, Market Neutral Income Fund, Phineus Long/Short Fund,respectively, and are included in the Statements of Operations under the caption “Expense reductions”.
As of April 30, 2019, theGrowth Fund, Market Neutral Income Fund,and Phineus Long/Short Fundhad holdings of $5.6 million, $120.6 million, and $35.6 million, respectively inSTBF. During the period from November 1, 2018 through April 30, 2019, theGrowth Fund, Market Neutral Income Fund,and Phineus Long/Short Fundhad net subscriptions of $5.5 million, $120.0 million, and $35.3 million and earned $79.0 thousand, $631.3 thousand, and $498.4 thousand in dividends, respectively. As of November 1, 2018, no affiliate Fund had a balance in STBF.
The Funds reimburses Calamos Advisors for a portion of compensation paid to the Trust’s Chief Compliance Officer. This compensation is reported as part of the “Trustees’ fees and officer compensation” expense on the Statements of Operations.
Calamos Advisors has contractually agreed to limit the annual ordinary operating expenses of each Fund as a percentage of the average daily net assets as follows:
| | | | | | | | | | | | | | | | |
| FUND | | CLASS A
SHARES | | | CLASS C
SHARES | | | CLASS I
SHARES | | | CLASS R6
SHARES | |
| Market Neutral Income Fund | | | 1.75% | | | | 2.50% | | | | 1.50% | | | | — | |
| | | | |
| Hedged Equity Fund | | | 1.25% | | | | 2.00% | | | | 1.00% | | | | — | |
| | | | |
| Phineus Long/Short Fund | | | 2.00% | | | | 2.75% | | | | 1.75% | | | | — | |
| | | | |
| Convertible Fund | | | 1.75% | | | | 2.50% | | | | 1.50% | | | | — | |
| | | | |
| Global Convertible Fund | | | 1.35% | | | | 2.10% | | | | 1.10% | | | | — | |
| | | | |
| Growth Fund | | | 1.75% | | | | 2.50% | | | | 1.50% | | | | — | |
| | | | |
| Growth and Income Fund | | | 1.75% | | | | 2.50% | | | | 1.50% | | | | — | |
| | | | |
| Dividend Growth Fund | | | 1.35% | | | | 2.10% | | | | 1.10% | | | | — | |
| | | | |
| Opportunistic Value Fund | | | 1.15% | | | | 1.90% | | | | 0.90% | | | | — | |
| | | | |
| 170 | | CALAMOS OPEN-END FAMILY OF FUNDS SEMIANNUAL REPORT | | |
Notes to Financial Statements (Unaudited)
| | | | | | | | | | | | | | | | |
| FUND | | CLASS A
SHARES | | | CLASS C
SHARES | | | CLASS I
SHARES | | | CLASS R6
SHARES | |
| International Growth Fund | | | 1.10% | | | | 1.85% | | | | 0.85% | | |
| 0.85% less
the annual
sub-transfer
agency
ratio |
* |
| | | | |
| Evolving World Growth Fund | | | 1.75% | | | | 2.50% | | | | 1.50% | | | | — | |
| | | | |
| Emerging Market Equity Fund | | | 1.75% | | | | 2.50% | | | | 1.50% | | | | — | |
| | | | |
| Global Equity Fund | | | 1.40% | | | | 2.15% | | | | 1.15% | | | | — | |
| | | | |
| Global Growth and Income Fund | | | 1.75% | | | | 2.50% | | | | 1.50% | | | | — | |
| | | | |
| Total Return Bond Fund | | | 0.90% | | | | 1.65% | | | | 0.65% | | | | — | |
| | | | |
| High Income Opportunities Fund | | | 1.00% | | | | 1.75% | | | | 0.75% | | | | — | |
| | | | |
| Short-Term Bond Fund | | | 0.65% | | | | — | | | | 0.40% | | | | — | |
| * | The annualsub-transfer agency ratio is equal to the aggregatesub-transfer agency expenses common to the other share classes of the Fund divided by the aggregated average annual net assets of the Fund’s other share classes. |
These agreements are binding on Calamos Advisors through March 1, 2022.
For the period ended April 30, 2019, Calamos Advisors waived or absorbed the following expenses:
| | | | |
| FUND | | AMOUNT | |
| Market Neutral Income Fund | | $ | 68,623 | |
| |
| Phineus Long/Short Fund | | | 51,173 | |
| |
| Growth Fund | | | 8,203 | |
| |
| Dividend Growth Fund | | | 54,789 | |
| |
| Opportunistic Value Fund | | | 103,274 | |
| |
| International Growth Fund | | | 508,999 | |
| |
| Emerging Market Equity Fund | | | 37,073 | |
| |
| Global Equity Fund | | | 54,383 | |
| |
| Total Return Bond Fund | | | 51,014 | |
| |
| High Income Opportunities Fund | | | 86,935 | |
| |
| Short-Term Bond Fund | | | 28,822 | |
These amounts are included in the Statements of Operations under the caption “Expense reductions”.
As Distributor, Calamos Financial Services LLC (“CFS”) assumed all expenses of personnel, office space, office facilities and equipment incidental to such service. Each Fund has adopted a Distribution Plan pursuant to Rule12b-1 under the 1940 Act whereby the Fund pays to CFS a distribution and/or service fee at the annual rate of 0.25% of the average daily net assets of the Fund’s Class A shares; a service fee at the annual rate of 0.25% and a distribution fee at the rate of 0.75% of the average daily net assets of the Fund’s Class B and Class C shares; a service fee at the annual rate of 0.25% and a distribution fee of 0.25% of the average daily net assets of the Fund’s Class R shares. No such fees are paid on each Fund’s Class I or Class R6 shares.
CFS also receives a sales commission and/or an underwriting fee on certain sales of each Fund’s Class A shares. During the period ended April 30, 2019, CFS received commissions and underwriting fees as follows:
| | | | |
| FUND | | AMOUNT | |
| Market Neutral Income Fund | | $ | 19,674 | |
| |
| Hedged Equity Fund | | | 1,252 | |
| |
| Phineus Long/Short Fund | | | 16,660 | |
| |
| Convertible Fund | | | 7,762 | |
| |
| Global Convertible Fund | | | 111 | |
| |
| Growth Fund | | | 18,588 | |
| |
| Growth and Income Fund | | | 46,013 | |
| |
| Dividend Growth Fund | | | 642 | |
Notes to Financial Statements (Unaudited)
| | | | |
| FUND | | AMOUNT | |
| Opportunistic Value Fund | | $ | 979 | |
| |
| International Growth Fund | | | 550 | |
| |
| Evolving World Growth Fund | | | 994 | |
| |
| Emerging Market Equity Fund | | | 8 | |
| |
| Global Equity Fund | | | 470 | |
| |
| Global Growth and Income Fund | | | 1,946 | |
| |
| Total Return Bond Fund | | | 257 | |
| |
| High Income Opportunities Fund | | | 114 | |
| |
| Short-Term Bond Fund | | | 38 | |
A trustee and certain officers of the Trust are also officers and directors of CFS and Calamos Advisors. Such trustee and officers serve without direct compensation from the Trust. The Trust’s Statement of Additional Information contains additional information about the Trust’s Trustees and Officers and is available without charge, upon request, at www.calamos.com or by calling 800.582.6959.
As of April 30, 2019, certain affiliates of Calamos Advisors hold material investments in the Funds as follows:
| | | | |
| FUND | | PERCENTAGE | |
| Opportunistic Value Fund | | | 47 | % |
| |
| Emerging Market Equity Fund | | | 80 | |
| |
| High Income Opportunities Fund | | | 26 | |
As of April 30, 2019, theGrowth Fund, Market Neutral Income Fund,and Phineus Long/Short Fundheld 3.0%, 65.6%, and 19.4% of the outstanding shares respectively of Short Term Bond Fund.
The Trust has adopted a deferred compensation plan (the “Plan”). Under the Plan, a trustee who is not an “interested person” (as defined in the 1940 Act) and has elected to participate in the Plan (a “participating trustee”) may defer receipt of all or a portion of his compensation from the Trust. The deferred compensation payable to the participating trustee is credited to the trustee’s deferral account as of the business day such compensation would have been paid to the participating trustee. The value of amounts deferred for a participating trustee is determined by reference to the change in value of Class I shares of one or more funds of the Trust designated by the participant. The value of the account increases with contributions to the account or with increases in the value of the measuring shares, and the value of the account decreases with withdrawals from the account or with declines in the value of the measuring shares.
At April 30, 2019, the Funds had deferred compensation balances, which are included in “Other assets” on the Statements of Assets and Liabilities, as follows:
| | | | |
| FUND | | AMOUNT | |
| Market Neutral Income Fund | | $ | 164,399 | |
| |
| Hedged Equity Fund | | | 8,128 | |
| |
| Phineus Long/Short Fund | | | 10,816 | |
| |
| Convertible Fund | | | 157,534 | |
| |
| Global Convertible Fund | | | 8,187 | |
| |
| Growth Fund | | | 705,228 | |
| |
| Growth and Income Fund | | | 316,089 | |
| |
| Dividend Growth Fund | | | 10,827 | |
| |
| Opportunistic Value Fund | | | 79,400 | |
| |
| International Growth Fund | | | 62,000 | |
| |
| Evolving World Growth Fund | | | 28,584 | |
| |
| Emerging Market Equity Fund | | | 10,826 | |
| |
| Global Equity Fund | | | 37,182 | |
| |
| Global Growth and Income Fund | | | 121,900 | |
| |
| Total Return Bond Fund | | | 39,597 | |
| |
| High Income Opportunities Fund | | | 87,551 | |
| | | | |
| 172 | | CALAMOS OPEN-END FAMILY OF FUNDS SEMIANNUAL REPORT | | |
Notes to Financial Statements (Unaudited)
Each Fund’s obligation to make payments under the Plan is a general obligation of the Fund and is included in “Payable for deferred compensation to trustees” on the Statements of Assets and Liabilities at April 30, 2019.
Note 3 – Investments
The cost of purchases and proceeds from sales of long-term investments for the period ended April 30, 2019 were as follows:
| | | | | | | | | | | | | | | | |
| | | COST OF PURCHASES | | | PROCEEDS FROM SALES | |
| FUND | | U.S. GOV’T
SECURITIES | | | OTHER | | | U.S. GOV’T
SECURITIES | | | OTHER | |
| Market Neutral Income Fund | | $ | 49,831,055 | | | $ | 2,786,361,780 | | | $ | — | | | $ | 2,683,314,862 | |
| | | | |
| Hedged Equity Fund | | | — | | | | 148,835,233 | | | | — | | | | 78,740,612 | |
| | | | |
| Phineus Long/Short Fund | | | — | | | | 1,317,643,085 | | | | — | | | | 1,727,553,772 | |
| | | | |
| Convertible Fund | | | — | | | | 152,665,436 | | | | 5,846,250 | | | | 114,438,826 | |
| | | | |
| Global Convertible Fund | | | — | | | | 24,963,756 | | | | 551,955 | | | | 29,061,260 | |
| | | | |
| Growth Fund | | | — | | | | 384,316,932 | | | | — | | | | 618,879,914 | |
| | | | |
| Growth and Income Fund | | | — | | | | 126,243,765 | | | | 8,450,000 | | | | 191,159,425 | |
| | | | |
| Dividend Growth Fund | | | — | | | | 949,373 | | | | — | | | | 8,413,943 | |
| | | | |
| Opportunistic Value Fund | | | — | | | | 19,284,742 | | | | — | | | | 22,476,522 | |
| | | | |
| International Growth Fund | | | — | | | | 73,904,850 | | | | — | | | | 102,173,616 | |
| | | | |
| Evolving World Growth Fund | | | — | | | | 51,157,521 | | | | — | | | | 74,383,550 | |
| | | | |
| Emerging Market Equity Fund | | | — | | | | 4,439,160 | | | | — | | | | 4,310,641 | |
| | | | |
| Global Equity Fund | | | — | | | | 21,677,959 | | | | — | | | | 31,636,840 | |
| | | | |
| Global Growth and Income Fund | | | — | | | | 29,840,969 | | | | — | | | | 55,982,994 | |
| | | | |
| Total Return Bond Fund | | | 8,165,008 | | | | 4,028,228 | | | | 4,090,366 | | | | 15,450,752 | |
| | | | |
| High Income Opportunities Fund | | | — | | | | 7,023,631 | | | | — | | | | 12,648,879 | |
| | | | |
| Short-Term Bond Fund | | | 149,835,709 | | | | 126,675,113 | | | | 116,716,502 | | | | 1,470,042 | |
The following information is presented on a federal income tax basis as of April 30, 2019. Differences between the cost basis under U.S. generally accepted accounting principles and federal income tax purposes are primarily due to temporary differences.
The cost basis of investments for federal income tax purposes at April 30, 2019 was as follows*:
| | | | | | | | | | | | | | | | |
| FUND | | COST BASIS OF INVESTMENTS | | | GROSS UNREALIZED APPRECIATION | | | GROSS UNREALIZED
DEPRECIATION | | | NET UNREALIZED APPRECIATION
(DEPRECIATION) | |
| Market Neutral Income Fund | | $ | 5,120,237,144 | | | $ | 1,402,239,657 | | | $ | (1,311,256,328 | ) | | $ | 90,983,329 | |
| | | | |
| Hedged Equity Fund | | | 174,348,177 | | | | 17,300,870 | | | | (10,563,877 | ) | | | 6,736,993 | |
| | | | |
| Phineus Long/Short Fund | | | 145,391,539 | | | | 57,957,023 | | | | (108,496,802 | ) | | | (50,539,779 | ) |
| | | | |
| Convertible Fund | | | 718,444,547 | | | | 71,485,884 | | | | (23,549,322 | ) | | | 47,936,562 | |
| | | | |
| Global Convertible Fund | | | 140,337,825 | | | | 8,740,925 | | | | (9,147,846 | ) | | | (406,921 | ) |
| | | | |
| Growth Fund | | | 1,142,384,069 | | | | 379,361,137 | | | | (16,819,194 | ) | | | 362,541,943 | |
| | | | |
| Growth and Income Fund | | | 1,592,707,978 | | | | 560,858,517 | | | | (46,598,699 | ) | | | 514,259,818 | |
| | | | |
| Dividend Growth Fund | | | 13,515,370 | | | | 5,612,281 | | | | (404,079 | ) | | | 5,208,202 | |
| | | | |
| Opportunistic Value Fund | | | 42,130,050 | | | | 5,552,735 | | | | (656,164 | ) | | | 4,896,571 | |
| | | | |
| International Growth Fund | | | 179,987,239 | | | | 39,217,364 | | | | (1,711,657 | ) | | | 37,505,707 | |
| | | | |
| Evolving World Growth Fund | | | 153,309,649 | | | | 41,988,891 | | | | (4,220,642 | ) | | | 37,768,249 | |
| | | | |
| Emerging Market Equity Fund | | | 13,847,702 | | | | 3,250,805 | | | | (405,121 | ) | | | 2,845,684 | |
| | | | |
| Global Equity Fund | | | 77,043,452 | | | | 23,497,695 | | | | (1,650,664 | ) | | | 21,847,031 | |
| | | | |
| Global Growth and Income Fund | | | 150,215,743 | | | | 25,911,467 | | | | (6,183,517 | ) | | | 19,727,950 | |
| | | | |
| Total Return Bond Fund | | | 52,837,908 | | | | 665,243 | | | | (378,739 | ) | | | 286,504 | |
| | | | |
| High Income Opportunities Fund | | | 53,027,358 | | | | 658,597 | | | | (1,824,342 | ) | | | (1,165,745 | ) |
| | | | |
| Short-Term Bond Fund | | | 186,891,040 | | | | 1,205,292 | | | | (22,580 | ) | | | 1,182,712 | |
| * | Because tax adjustments are calculated annually, the above table does not reflect tax adjustments. For the previous fiscal year’s federal income tax information, please refer to the Notes to Financial Statements section in the Funds’ most recent annual report. |
Notes to Financial Statements (Unaudited)
Note 4 – Income Taxes
The tax character of distributions for the period ended April 30, 2019 will be determined at the end of each Fund’s current fiscal year. Distributions during the fiscal period ended October 31, 2018 were characterized for federal income tax purposes as follows:
| | | | | | | | | | | | |
| | | YEAR OR PERIOD ENDED OCTOBER 31, 2018 | |
| FUND | | ORDINARY
INCOME | | | LONG-TERM
CAPITAL GAIN | | | RETURN OF CAPITAL | |
| Market Neutral Income Fund | | $ | 77,379,152 | | | $ | 80,809,364 | | | | — | |
| | | |
| Hedged Equity Fund | | | 294,253 | | | | 223 | | | | — | |
| | | |
| Phineus Long/Short Fund | | | 4,847,673 | | | | 3,469,521 | | | | — | |
| | | |
| Convertible Fund | | | 10,520,105 | | | | 18,076,624 | | | | — | |
| | | |
| Global Convertible Fund | | | 1,935,321 | | | | 2,717,363 | | | | — | |
| | | |
| Growth Fund | | | 34,957,588 | | | | 218,784,460 | | | | — | |
| | | |
| Growth and Income Fund | | | 30,462,496 | | | | 116,932,931 | | | | — | |
| | | |
| Dividend Growth Fund | | | 157,148 | | | | 2,083,020 | | | | — | |
| | | |
| Opportunistic Value Fund | | | 679,851 | | | | 1,596,824 | | | | — | |
| | | |
| International Growth Fund | | | 2,007,704 | | | | 16,295,738 | | | | — | |
| | | |
| Evolving World Growth Fund | | | 2,351,175 | | | | — | | | | 110 | |
| | | |
| Emerging Market Equity Fund | | | 86,283 | | | | — | | | | 8 | |
| | | |
| Global Equity Fund | | | 2,634,875 | | | | 13,457,533 | | | | — | |
| | | |
| Global Growth and Income Fund | | | 2,786,565 | | | | 13,090,122 | | | | — | |
| | | |
| Total Return Bond Fund | | | 1,692,483 | | | | 352,324 | | | | 179,920 | |
| | | |
| High Income Opportunities Fund | | | 3,181,977 | | | | — | | | | — | |
| | | |
| Short-Term Bond Fund | | | 54,170 | | | | — | | | | — | |
As of October 31, 2018, the components of accumulated earnings/(loss) on a tax basis were as follows:
| | | | | | | | | | | | | | | | | | | | |
| | | MARKET NEUTRAL
INCOME FUND | | | HEDGED EQUITY
FUND | | | PHINEUS LONG/SHORT FUND | | | CONVERTIBLE
FUND | | | GLOBAL
CONVERTIBLE FUND | |
| Undistributed ordinary income | | $ | 121,821,134 | | | $ | 115,829 | | | $ | 28,941,168 | | | $ | 19,864,531 | | | $ | 3,197,164 | |
| | | | | |
| Undistributed capital gains | | | 123,323,179 | | | | 2,507,493 | | | | 8,774,837 | | | | 51,619,872 | | | | 2,821,799 | |
| | | | |
| Total undistributed earnings | | | 245,144,313 | | | | 2,623,322 | | | | 37,716,005 | | | | 71,484,403 | | | | 6,018,963 | |
| | | | | |
| Accumulated capital and other losses | | | — | | | | — | | | | — | | | | — | | | | — | |
| | | | | |
| Net unrealized gains/(losses) | | | 171,748,292 | | | | (1,606,899 | ) | | | (56,617,019 | ) | | | 19,243,896 | | | | (427,927 | ) |
| | | | |
| Total accumulated earnings/(losses) | | | 416,892,605 | | | | 1,016,423 | | | | (18,901,014 | ) | | | 90,728,299 | | | | 5,591,036 | |
| | | | | |
| Other | | | (168,554,519 | ) | | | (9,639 | ) | | | (327,819 | ) | | | (209,646 | ) | | | (12,762 | ) |
| | | | | |
| Paid-in-capital | | | 6,457,503,118 | | | | 96,349,727 | | | | 1,183,584,817 | | | | 525,022,516 | | | | 130,659,723 | |
| | | | |
| Net assets applicable to common shareholders | | $ | 6,705,841,204 | | | $ | 97,356,511 | | | $ | 1,164,355,984 | | | $ | 615,541,169 | | | $ | 136,237,997 | |
| | | | |
| | | | | |
| | | GROWTH FUND | | | GROWTH AND
INCOME FUND | | | DIVIDEND
GROWTH FUND | | | OPPORTUNISTIC
VALUE FUND | | | | |
| Undistributed ordinary income | | $ | 55,750,632 | | | $ | 20,038,784 | | | $ | 39,753 | | | $ | 1,883,295 | | | | | |
| | | | | |
| Undistributed capital gains | | | 148,820,107 | | | | 106,596,572 | | | | 873,817 | | | | 5,369,753 | | | | | |
| | | | | | | | |
| Total undistributed earnings | | | 204,570,739 | | | | 126,635,356 | | | | 913,570 | | | | 7,253,048 | | | | | |
| | | | | |
| Accumulated capital and other losses | | | — | | | | — | | | | — | | | | — | | | | | |
| | | | | |
| Net unrealized gains/(losses) | | | 299,538,112 | | | | 398,017,496 | | | | 5,672,060 | | | | 3,303,686 | | | | | |
| | | | | | | | |
| Total accumulated earnings/(losses) | | | 504,108,851 | | | | 524,652,852 | | | | 6,585,630 | | | | 10,556,734 | | | | | |
| | | | | |
| Other | | | (615,464 | ) | | | (295,206 | ) | | | (7,988 | ) | | | (78,475 | ) | | | | |
| | | | | |
| Paid-in-capital | | | 960,041,688 | | | | 1,454,091,089 | | | | 17,382,394 | | | | 37,080,584 | | | | | |
| | | | | | | | |
| Net assets applicable to common shareholders | | $ | 1,463,535,075 | | | $ | 1,978,448,735 | | | $ | 23,960,036 | | | $ | 47,558,843 | | | | | |
| | | | | | | | |
| | | | |
| 174 | | CALAMOS OPEN-END FAMILY OF FUNDS SEMIANNUAL REPORT | | |
Notes to Financial Statements (Unaudited)
| | | | | | | | | | | | | | | | | | | | |
| | | INTERNATIONAL
GROWTH FUND | | | EVOLVING WORLD
GROWTH FUND | | | EMERGING MARKET EQUITY
FUND | | | GLOBAL EQUITY
FUND | | | GLOBAL GROWTH
AND INCOME
FUND | |
| Undistributed ordinary income | | $ | — | | | $ | — | | | $ | — | | | $ | — | | | $ | 3,498,839 | |
| | | | | |
| Undistributed capital gains | | | 23,806,913 | | | | — | | | | — | | | | 18,654,809 | | | | 14,609,164 | |
| | | | |
| Total undistributed earnings | | | 23,806,913 | | | | — | | | | — | | | | 18,654,809 | | | | 18,108,003 | |
| | | | | |
| Accumulated capital and other losses | | | — | | | | (21,066,008 | ) | | | (2,535,659 | ) | | | — | | | | — | |
| | | | | |
| Net unrealized gains/(losses) | | | 8,051,751 | | | | 10,582,365 | | | | 315,085 | | | | 16,233,753 | | | | 13,450,176 | |
| | | | |
| Total accumulated earnings/(losses) | | | 31,858,664 | | | | (10,483,643 | ) | | | (2,220,574 | ) | | | 34,888,562 | | | | 31,558,179 | |
| | | | | |
| Other | | | 402,327 | | | | (76,789 | ) | | | (8,242 | ) | | | (61,771 | ) | | | (207,258 | ) |
| | | | | |
| Paid-in-capital | | | 201,089,079 | | | | 215,091,637 | | | | 16,228,241 | | | | 61,626,799 | | | | 158,985,607 | |
| | | | |
| Net assets applicable to common shareholders | | $ | 233,350,070 | | | $ | 204,531,205 | | | $ | 13,999,425 | | | $ | 96,453,590 | | | $ | 190,336,528 | |
| | | | |
| | | | | |
| | | TOTAL RETURN
BOND FUND | | | HIGH INCOME
OPPORTUNITIES
FUND | | | SHORT-TERM
BOND FUND | | | | | | | |
| Undistributed ordinary income | | $ | — | | | $ | 10,982 | | | $ | 8,807 | | | | | | | | | |
| | | | | |
| Undistributed capital gains | | | — | | | | — | | | | — | | | | | | | | | |
| | | | | | | | | | | | |
| Total undistributed earnings | | | — | | | | 10,982 | | | | 8,807 | | | | | | | | | |
| | | | | |
| Accumulated capital and other losses | | | (758,886 | ) | | | (8,722,495 | ) | | | — | | | | | | | | | |
| | | | | |
| Net unrealized gains/(losses) | | | (1,883,455 | ) | | | (2,597,567 | ) | | | (42,743 | ) | | | | | | | | |
| | | | | | | | | | | | |
| Total accumulated earnings/(losses) | | | (2,642,341 | ) | | | (11,309,080 | ) | | | (33,936 | ) | | | | | | | | |
| | | | | |
| Other | | | (71,478 | ) | | | (101,051 | ) | | | (2,193 | ) | | | | | | | | |
| | | | | |
| Paid-in-capital | | | 59,123,205 | | | | 61,170,267 | | | | 15,179,104 | | | | | | | | | |
| | | | | | | | | | | | |
| Net assets applicable to common shareholders | | $ | 56,409,386 | | | $ | 49,760,136 | | | $ | 15,142,975 | | | | | | | | | |
| | | | | | | | | | | | |
| | | | | | | | | | | | |
The following Funds had capital loss carryforwards for the period ended April 30, 2019, with no expiration date, available to offset future realized capital gains:
| | | | | | | | |
| FUND | | SHORT-TERM | | | LONG-TERM | |
| Evolving World Growth Fund | | $ | (21,066,008 | ) | | $ | — | |
| | |
| Emerging Market Equity Fund | | | (2,535,659 | ) | | | — | |
| | |
| Total Return Bond Fund | | | (365,302 | ) | | | (393,584 | ) |
| | |
| High Income Opportunities Fund | | | (1,130,937 | ) | | | (7,591,558 | ) |
Note 5 – Short Sales
Securities sold short represent obligations to deliver the securities at a future date. A Fund may sell a security it does not own in anticipation of a decline in the value of that security before the delivery date. When the Fund sells a security short, it must borrow the security sold short and deliver it to the broker-dealer through which it made the short sale. Dividends paid on securities sold short are disclosed as an expense on the Statements of Operations. A gain, limited to the price at which the Fund sold the security short, or a loss, unlimited in size, will be realized upon the termination of a short sale.
To secure its obligation to deliver to the broker-dealer the securities sold short, the Fund must segregate an amount of cash or liquid securities with its custodian equal to any excess of the current market value of the securities sold short over any cash or liquid securities deposited as collateral with the broker in connection with the short sale (not including the proceeds of the short sale). As a result of that requirement, the Fund will not gain any leverage merely by selling short, except to the extent that it earns interest or other income or gains on the segregated cash or liquid securities while also being subject to the possibility of gain or loss from the securities sold short.
Note 6 – Derivative Investments
Foreign Currency Risk. Each Fund may engage in portfolio hedging with respect to changes in currency exchange rates by entering into forward foreign currency contracts to purchase or sell currencies. A forward foreign currency contract is a commitment to
Notes to Financial Statements (Unaudited)
purchase or sell a foreign currency at a future date at a negotiated forward rate. Risks associated with such contracts include, among other things, movement in the value of the foreign currency relative to the U.S. dollar and the ability of the counterparty to perform.
To mitigate the counterparty risk, the Fund may enter into an International Swaps and Derivatives Association, Inc. Master Agreement (“ISDA Master Agreement”) or similar agreement with its derivative contract counterparties. An ISDA Master Agreement is a bilateral agreement between the Fund and a counterparty that governsover-the-counter derivatives and foreign exchange contracts and typically contains, among other things, collateral posting terms and netting provisions in the event of a default and/or termination event. Under an ISDA Master Agreement, the Fund may, under certain circumstances, offset with the counterparty certain derivative financial instrument’s payables and/or receivables with collateral held and/or posted and create one single net payment. The provisions of the ISDA Master Agreement typically permit a single net payment in the event of default(close-out netting) including the bankruptcy or insolvency of the counterparty. Generally, collateral is exchanged between the Fund and the counterparty and the amount of collateral due from the Fund or to a counterparty has to exceed a minimum transfer amount threshold before a transfer has to be made. To the extent amounts due to the Fund from its counterparties are not fully collateralized, contractually or otherwise, the Fund bears the risk of loss from counterparty nonperformance. When a Fund is required to post collateral under the terms of a derivatives transaction and master netting agreement, the Fund’s custodian holds the collateral in a segregated account, subject to the terms of atri-party agreement among the Fund, the custodian and the counterparty. The master netting agreement andtri-party agreement provide, in relevant part, that the counterparty may have rights to the amounts in the segregated account in the event that the Fund defaults in its obligation with respect to the derivative instrument that is subject to the collateral requirement. When a counterparty is required to post collateral under the terms of a derivatives transaction and master netting agreement, the counterparty delivers such amount to the Fund’s custodian. The master netting agreement provides, in relevant part, that the Fund may have rights to such collateral in the event that the counterparty defaults in its obligation with respect to the derivative instrument that is subject to the collateral requirement. Generally before a default, neither a Fund nor the counterparty may resell, rehypothecate, or repledge any collateral that it receives.
For financial reporting purposes, the Funds do not offset derivative assets and derivative liabilities that are subject to netting arrangements in the Statements of Assets and Liabilities. The Fund’s net counterparty exposure is reflected in the counterparty table below. The net unrealized gain, if any, represents the credit risk to the respective Fund on a forward foreign currency contract. The contracts are valued daily at forward foreign exchange rates. The Funds realize a gain or loss when a position is closed or upon settlement of the contracts. Please see the disclosure regarding ISDA Master Agreements under Foreign Currency Risk within this note.
As of April 30, 2019, the Funds had outstanding forward foreign currency contracts listed on the Schedules of Investments.
Equity Risk. Each Fund may engage in option transactions and in doing so achieves similar objectives to what it would achieve through the sale or purchase of individual securities. A call option, upon payment of a premium, gives the purchaser of the option the right to buy, and the seller of the option the obligation to sell, the underlying security, index or other instrument at the exercise price. A put option gives the purchaser of the option, upon payment of a premium, the right to sell, and the seller the obligation to buy, the underlying security, index, or other instrument at the exercise price.
To seek to offset some of the risk of a potential decline in value of certain long positions, each Fund may also purchase put options on individual securities, broad-based securities indexes or certain exchange-traded funds (“ETFs”). Each Fund may also seek to generate income from option premiums by writing (selling) options on a portion of the equity securities (including securities that are convertible into equity securities) in the Fund’s portfolio, on broad-based securities indexes, or certain ETFs.
When the Fund purchases an option, it pays a premium and an amount equal to that premium is recorded as an asset. When the Fund writes an option, it receives a premium and an amount equal to that premium is recorded as a liability. The asset or liability is adjusted daily to reflect the current market value of the option. If an option expires unexercised, the Fund realizes a gain or loss to the extent of the premium received or paid. If an option is exercised, the premium received or paid is recorded as an adjustment to the proceeds from the sale or the cost basis of the purchase. The difference between the premium and the amount received or paid on a closing purchase or sale transaction is also treated as a realized gain or loss. The cost of securities acquired through the exercise of call options is increased by premiums paid. The proceeds from securities sold through the exercise of put options are decreased by the premiums paid. Gain or loss on written options and purchased options is presented separately as net realized gain or loss on written options and net realized gain or loss on purchased options, respectively.
| | | | |
| 176 | | CALAMOS OPEN-END FAMILY OF FUNDS SEMIANNUAL REPORT | | |
Notes to Financial Statements (Unaudited)
Options written by each Fund do not typically give rise to counterparty credit risk since options written obligate each Fund and not the counterparty to perform. Exchange traded purchased options have minimal counterparty credit risk to each Fund since the exchange’s clearinghouse, as counterparty to such instruments, guarantees against a possible default.
As of April 30, 2019, the Fund had outstanding purchased options and/or written options as listed on the Schedules of Investments.
As ofApril 30, 2019, the Funds had outstanding derivative contracts which are reflected on the Statements of Assets and Liabilities as follows:
| | | | | | | | |
| | | ASSET
DERIVATIVES | | | LIABILITY
DERIVATIVES | |
| | | MARKET NEUTRAL INCOME FUND | |
| Gross amounts at fair value: | | | | | | | | |
| | |
| Forward foreign currency contracts(1) | | $ | 669,834 | | | $ | 183,932 | |
| | |
| Purchased options(2) | | | 33,291,201 | | | | — | |
| | |
| Written options(3) | | | — | | | | 481,050,571 | |
| | |
| Total Return Swaps(4) | | | 15,716 | | | | 450,063 | |
| | | | |
| | $ | 33,976,751 | | | $ | 481,684,566 | |
| | | | |
| |
| | | HEDGED EQUITY FUND | |
| Gross amounts at fair value: | | | | |
| | |
| Purchased options(2) | | $ | 2,022,904 | | | $ | — | |
| | |
| Written options(3) | | | — | | | | 15,558,943 | |
| | | | |
| | |
| | $ | 2,022,904 | | | $ | 15,558,943 | |
| | | | |
| |
| | | PHINEUS LONG/SHORT FUND | |
| Gross amounts at fair value: | | | | |
| | |
| Purchased Options(2) | | $ | 2,534,258 | | | $ | — | |
| | |
| Written Options(3) | | | — | | | | 6,067,252 | |
| | | | |
| | |
| | $ | 2,534,258 | | | $ | 6,067,252 | |
| | | | |
| |
| | | CONVERTIBLE FUND | |
| Gross amounts at fair value: | | | | |
| | |
| Forward foreign currency contracts(1) | | $ | 27,062 | | | $ | 475 | |
| | |
| Purchased Options(2) | | | 4,908,735 | | | | — | |
| | |
| Written options(3) | | | — | | | | 96,600 | |
| | | | |
| | |
| | $ | 4,935,797 | | | $ | 97,075 | |
| | | | |
| |
| | | GLOBAL CONVERTIBLE FUND | |
| Gross amounts at fair value: | | | | |
| | |
| Purchased Options(2) | | $ | 947,462 | | | $ | — | |
| | | | |
| | |
| | $ | 947,462 | | | $ | — | |
| | | | |
| |
| | | GROWTH FUND | |
| Gross amounts at fair value: | | | | |
| | |
| Purchased Options(2) | | $ | 1,316,050 | | | $ | — | |
| | |
| Written options(3) | | | — | | | | 2,760,886 | |
| | | | |
| | |
| | $ | 1,316,050 | | | $ | 2,760,886 | |
| | | | |
Notes to Financial Statements (Unaudited)
| | | | | | | | |
| | | ASSET
DERIVATIVES | | | LIABILITY
DERIVATIVES | |
| | | GROWTH AND INCOME | |
| Gross amounts at fair value: | | | | |
| | |
| Forward foreign currency contracts(1) | | $ | 24,907 | | | $ | 433 | |
| | |
| Purchased Options(2) | | | 6,043,083 | | | | — | |
| | | | |
| | |
| | $ | 6,067,990 | | | $ | 433 | |
| | | | |
| |
| | | INTERNATIONAL GROWTH FUND | |
| Gross amounts at fair value: | | | | |
| | |
| Forward foreign currency contracts(1) | | $ | — | | | $ | 160,837 | |
| | |
| Purchased options(2) | | | 300,471 | | | | — | |
| | | | |
| | |
| | $ | 300,471 | | | $ | 160,837 | |
| | | | |
| |
| | | EMERGING MARKET EQUITY FUND | |
| Gross amounts at fair value: | | | | |
| Purchased Options(2) | | $ | 95,988 | | | $ | — | |
| | | | |
| | $ | 95,988 | | | $ | — | |
| | | | |
| |
| | | GLOBAL EQUITY FUND | |
| Gross amounts at fair value: | | | | |
| Purchased options(2) | | $ | 30,000 | | | $ | — | |
| | | | |
| | $ | 30,000 | | | $ | — | |
| | | | |
| |
| | | GLOBAL GROWTH AND INCOME | |
| Gross amounts at fair value: | | | | |
| Purchased Options(2) | | $ | 331,430 | | | $ | — | |
| | | | |
| | $ | 331,430 | | | $ | — | |
| | | | |
The following table presents the outstanding derivative contracts, organized by counterparty, that are subject to enforceable master netting agreements as of April 30, 2019:
| | | | | | | | | | | | | | | | | | | | | | | | |
| | | GROSS AMOUNTS NOT OFFSET
IN THE STATEMENTS OF ASSETS AND LIABILITIES | |
| MARKET NEUTRAL INCOME FUND | | GROSS AMOUNTS PRESENTED IN THE
STATEMENTS OF ASSETS AND LIABILITIES | | | COLLATERAL PLEDGED | | | NET AMOUNT
RECEIVABLE IN
THE EVENT OF DEFAULT | | | NET AMOUNT
PAYABLE IN
THE EVENT OF DEFAULT | |
| Counterparty | | | | | ASSETS | | | LIABILITIES | |
| Goldman Sachs & Co. | | | ISDA | | | $ | 15,716 | | | $ | 450,063 | | | $ | — | | | $ | — | | | $ | 434,347 | |
| | | | | | |
| Northern Trust Company | | | ISDA | | | | 669,834 | | | | — | | | | — | | | | 669,834 | | | | — | |
| | | | | | |
| State Street Bank and Trust | | | ISDA | | | | — | | | | 183,932 | | | | — | | | | — | | | | 183,932 | |
| | | | |
| | | $ | 685,550 | | | $ | 633,995 | | | $ | — | | | $ | 669,834 | | | $ | 618,279 | |
| | | | |
| | | | |
| CONVERTIBLE FUND | | GROSS AMOUNTS PRESENTED IN THE
STATEMENTS OF ASSETS AND LIABILITIES | | | COLLATERAL PLEDGED | | | NET AMOUNT
RECEIVABLE IN
THE EVENT OF DEFAULT | | | NET AMOUNT
PAYABLE IN
THE EVENT OF DEFAULT | |
| Counterparty | | | | | ASSETS | | | LIABILITIES | |
| Bank of New York | | | ISDA | | | $ | — | | | $ | 401 | | | $ | — | | | $ | — | | | $ | 401 | |
| | | | | | |
| Northern Trust Company | | | ISDA | | | | 26,912 | | | | — | | | | — | | | | 26,912 | | | | — | |
| | | | | | |
| State Street Bank and Trust | | | ISDA | | | | 150 | | | | 74 | | | | — | | | | 76 | | | | — | |
| | | | |
| | | $ | 27,062 | | | $ | 475 | | | $ | — | | | $ | 26,988 | | | $ | 401 | |
| | | | |
| | | | |
| 178 | | CALAMOS OPEN-END FAMILY OF FUNDS SEMIANNUAL REPORT | | |
Notes to Financial Statements (Unaudited)
| | | | | | | | | | | | | | | | | | | | | | | | |
| | | GROSS AMOUNTS NOT OFFSET
IN THE STATEMENTS OF ASSETS AND LIABILITIES | |
| | | | |
| GROWTH AND INCOME | | GROSS AMOUNTS PRESENTED IN THE
STATEMENTS OF ASSETS AND LIABILITIES | | | COLLATERAL PLEDGED | | | NET AMOUNT
RECEIVABLE IN
THE EVENT OF DEFAULT | | | NET AMOUNT
PAYABLE IN
THE EVENT OF DEFAULT | |
| Counterparty | | | | | ASSETS | | | LIABILITIES | |
| Northern Trust Company | | | ISDA | | | $ | 24,750 | | | $ | — | | | $ | — | | | $ | 24,750 | | | $ | — | |
| | | | | | |
| Bank of New York | | | ISDA | | | | — | | | | 355 | | | | — | | | | — | | | | 355 | |
| | | | | | |
| State Street Bank and Trust | | | ISDA | | | | 157 | | | | 78 | | | | — | | | | 79 | | | | — | |
| | | | |
| | | $ | 24,907 | | | $ | 433 | | | $ | — | | | $ | 24,829 | | | $ | 355 | |
| | | | |
| | | | |
| INTERNATIONAL GROWTH FUND | | GROSS AMOUNTS PRESENTED IN THE
STATEMENTS OF ASSETS AND LIABILITIES | | | COLLATERAL PLEDGED | | | NET AMOUNT
RECEIVABLE IN
THE EVENT OF DEFAULT | | | NET AMOUNT
PAYABLE IN
THE EVENT OF DEFAULT | |
| Counterparty | | | | | ASSETS | | | LIABILITIES | |
| Northern Trust Company | | | ISDA | | | $ | — | | | $ | 160,837 | | | $ | — | | | $ | — | | | $ | 160,837 | |
| | | | |
| | | $ | — | | | $ | 160,837 | | | $ | — | | | $ | — | | | $ | 160,837 | |
| | | | |
For the period endedApril 30, 2019, the volume of derivative activity for the Fund is reflected below:*
| | | | | | | | | | | | | | | | |
| FUND | | FORWARD
CONTRACTS(1) | | | PURCHASED
OPTIONS(2) | | | WRITTEN
OPTIONS(3) | | | SWAPS(4) | |
| Market Neutral Income Fund | | | 328,967,029 | | | | 154,163 | | | | 99,944 | | | | 5,582,100 | |
| | | | |
| Hedged Equity Fund | | | — | | | | 5,100 | | | | 3,061 | | | | — | |
| | | | |
| Phineus Long/Short Fund | | | — | | | | 512,450 | | | | 519,027 | | | | — | |
| | | | |
| Convertible Fund | | | 14,947,242 | | | | 13,338 | | | | 501 | | | | — | |
| | | | |
| Global Convertible Fund | | | — | | | | 2,390 | | | | 130 | | | | — | |
| | | | |
| Growth Fund | | | — | | | | 72,226 | | | | 69,347 | | | | — | |
| | | | |
| Growth and Income Fund | | | 14,723,018 | | | | 74,393 | | | | 9,162 | | | | — | |
| | | | |
| Dividend Growth Fund | | | — | | | | — | | | | — | | | | — | |
| | | | |
| Opportunistic Value Fund | | | — | | | | — | | | | — | | | | — | |
| | | | |
| International Growth Fund | | | 113,563,876 | | | | 4,504 | | | | 140 | | | | — | |
| | | | |
| Evolving World Growth Fund | | | — | | | | 17,680 | | | | — | | | | — | |
| | | | |
| Emerging Market Equity Fund | | | — | | | | 609 | | | | — | | | | — | |
| | | | |
| Global Equity Fund | | | — | | | | 228 | | | | 65 | | | | — | |
| | | | |
| Global Growth and Income Fund | | | — | | | | 4,640 | | | | 1,940 | | | | — | |
| | | | |
| Total Return Bond Fund | | | — | | | | — | | | | — | | | | — | |
| | | | |
| High Income Opportunities Fund | | | — | | | | — | | | | — | | | | — | |
| | | | |
| Short-Term Bond Fund | | | — | | | | — | | | | — | | | | — | |
| * | Activity during the period is measured by opened number of contracts for options purchased or written, opened foreign currency contracts (measured in notional), and opened total return swaps (measured in notional). |
| (1) | Generally, the Statement of Assets and Liabilities location for Forward contracts is Unrealized appreciation on forward foreign currency contracts for asset derivatives and Unrealized depreciation on forward foreign currency contracts for liability derivatives. |
| (2) | Generally, the Statement of Assets and Liabilities location for Purchased Options is Investments in securities, at value. |
| (3) | Generally, the Statement of Assets and Liabilities location for Written Options is Options written, at value. |
| (4) | Generally, the Statement of Assets and Liabilities location for Swap contracts is Unrealized appreciation on total return swaps for asset derivatives and Unrealized depreciation on total return swaps for liability derivatives. |
Note 7 – Securities Lending
The Funds may loan one or more of their securities to broker-dealers and banks. Any such loan must be secured by collateral in cash or cash equivalents maintained on a current basis in an amount at least equal to the value of the securities loaned by the Funds. The Funds continue to receive the equivalent of the interest or dividends paid by the issuer on the securities loaned and also receive an additional return that may be in the form of a fixed fee or a percentage of the collateral. The additional return is disclosed on a net basis as Securities lending income in the Statements of Operations. Upon receipt of cash or cash equivalent collateral, the Funds’
Notes to Financial Statements (Unaudited)
securities lending agent invests the collateral into short term investments following investment guidelines approved by Calamos Advisors. The Funds record the investment of collateral as an asset and the value of the collateral as a liability on the Statements of Assets and Liabilities. If the value of the invested collateral declines below the value of the collateral deposited by the borrower, the Funds will record unrealized depreciation equal to the decline in value of the invested collateral. The Funds will pay reasonable fees to persons unaffiliated with the Funds for services in arranging these loans. The Funds have the right to call a loan and obtain the securities loaned at any time. The Funds do not have the right to vote the securities during the existence of the loan but could call the loan in an attempt to permit voting of the securities in certain circumstances. Upon return of the securities loaned, the cash or cash equivalent collateral will be returned to the borrower. In the event of bankruptcy or other default of the borrower, the Funds could experience both delays in liquidating the loan collateral or recovering the loaned securities and losses, including (a) possible decline in the value of the collateral or in the value of the securities loaned during the period while the Funds seek to enforce its rights thereto, (b) possible subnormal levels of income and lack of access to income during this period, and (c) the expenses of enforcing their rights. In an effort to reduce these risks, the Funds’ security lending agent monitors and reports to Calamos Advisors on the creditworthiness of the firms to which a Fund lends securities.
The following table indicates the total amount of securities loaned by asset class, reconciled to the gross liability payable upon return of the securities loaned by the Funds as of April 30, 2019.
| | | | | | | | | | | | | | | | | | | | |
| FUND | | VALUE OF SECURITIES
ON LOAN TO
BROKER-DEALERS
AND BANKS | | | EQUITY | | | FIXED INCOME | | | TOTAL | | | RESIDUAL AMOUNT
DUE TO/FROM
COUNTERPARTY | |
| Market Neutral Income Fund | | $ | 312,062,310 | | | $ | 137,668,391 | | | $ | 244,920,584 | | | $ | 382,588,975 | | | $ | 70,526,665 | |
| | | | | |
| Hedged Equity Fund | | | 6,379,104 | | | | 7,710,678 | | | | — | | | | 7,710,678 | | | | 1,331,574 | |
| | | | | |
| Phineus Long/Short Fund | | | 21,674,355 | | | | 20,855,012 | | | | — | | | | 20,855,012 | | | | (819,343 | ) |
| | | | | |
| Convertible Fund | | | 65,427,763 | | | | — | | | | 85,491,257 | | | | 85,491,257 | | | | 20,063,494 | |
| | | | | |
| Global Convertible Fund | | | 5,474,323 | | | | — | | | | 5,368,330 | | | | 5,368,330 | | | | (105,993 | ) |
| | | | | |
| Growth Fund | | | 32,958,710 | | | | 48,784,857 | | | | — | | | | 48,784,857 | | | | 15,826,147 | |
| | | | | |
| Growth and Income Fund | | | 64,784,526 | | | | 24,135,611 | | | | 53,434,377 | | | | 77,569,988 | | | | 12,785,462 | |
| | | | | |
| Dividend Growth Fund | | | 89,769 | | | | 237,322 | | | | — | | | | 237,322 | | | | 147,553 | |
| | | | | |
| Opportunistic Value Fund | | | 536,508 | | | | 807,663 | | | | — | | | | 807,663 | | | | 271,155 | |
| | | | | |
| International Growth Fund | | | 1,824,874 | | | | 14,224,955 | | | | — | | | | 14,224,955 | | | | 12,400,081 | |
| | | | | |
| Evolving World Growth Fund | | | 4,310,157 | | | | 2,232,142 | | | | 3,140,797 | | | | 5,372,939 | | | | 1,062,782 | |
| | | | | |
| Emerging Market Equity Fund | | | 823,146 | | | | 802,440 | | | | — | | | | 802,440 | | | | (20,706 | ) |
| | | | | |
| Global Equity Fund | | | 1,987,759 | | | | 5,983,500 | | | | — | | | | 5,983,500 | | | | 3,995,741 | |
| | | | | |
| Global Growth and Income Fund | | | 442,808 | | | | — | | | | 2,540,747 | | | | 2,540,747 | | | | 2,097,939 | |
| | | | | |
| Total Return Bond Fund | | | 2,550,385 | | | | — | | | | 5,011,003 | | | | 5,011,003 | | | | 2,460,618 | |
| | | | | |
| High Income Opportunities Fund | | | 5,792,850 | | | | 43,261 | | | | 7,304,611 | | | | 7,347,872 | | | | 1,555,022 | |
| | | | | |
| Short-Term Bond Fund | | | 3,834,570 | | | | — | | | | 3,742,027 | | | | 3,742,027 | | | | (92,543 | ) |
Note 8 – Fair Value Measurements
Various inputs are used to determine the value of the Funds’ investments. These inputs are categorized into three broad levels as follows:
| | • | | Level 1 – Prices are determined using inputs from unadjusted quoted prices from active markets (including securities actively traded on a securities exchange) for identical assets. |
| | • | | Level 2 – Prices are determined using significant observable market inputs other than unadjusted quoted prices, including quoted prices of similar securities, fair value adjustments to quoted foreign securities, interest rates, credit risk, prepayment speeds, and other relevant data. |
| | • | | Level 3 – Prices reflect unobservable market inputs (including the Funds’ own judgments about assumptions market participants would use in determining fair value) when observable inputs are unavailable. |
| | | | |
| 180 | | CALAMOS OPEN-END FAMILY OF FUNDS SEMIANNUAL REPORT | | |
Notes to Financial Statements (Unaudited)
Debt securities are valued based upon evaluated prices received from an independent pricing service or from a dealer or broker who makes markets in such securities. Pricing services utilize various observable market data and as such, debt securities are generally categorized as Level 2. The levels are not necessarily an indication of the risk or liquidity of the Fund’s investments.
The following is a summary of the inputs used in valuing the Funds’ holdings at fair value:
| | | | | | | | | | | | | | | | |
| | | MARKET NEUTRAL INCOME FUND | |
| | | LEVEL 1 | | | LEVEL 2 | | | LEVEL 3 | | | TOTAL | |
| Assets: | |
| | | | |
Convertible Bonds | | $ | — | | | $ | 3,296,303,974 | | | $ | — | | | $ | 3,296,303,974 | |
| | | | |
U.S. Government and Agency Securities | | | — | | | | 50,201,147 | | | | — | | | | 50,201,147 | |
| | | | |
Convertible Preferred Stocks | | | 275,771,972 | | | | 155,853,400 | | | | — | | | | 431,625,372 | |
| | | | |
Common Stocks U.S. | | | 3,896,110,517 | | | | — | | | | — | | | | 3,896,110,517 | |
| | | | |
Exchange-Traded Fund | | | 75,563,140 | | | | — | | | | — | | | | 75,563,140 | |
| | | | |
Investments in Affiliated Fund | | | 120,649,094 | | | | — | | | | — | | | | 120,649,094 | |
| | | | |
Purchased Options | | | 33,291,201 | | | | — | | | | — | | | | 33,291,201 | |
| | | | |
Short Term Investments | | | 202,114,162 | | | | — | | | | — | | | | 202,114,162 | |
| | | | |
Investment of Cash Collateral For Securities Loaned | | | 145,172,436 | | | | 166,889,874 | | | | — | | | | 312,062,310 | |
| | | | |
Forward Foreign Currency Contracts | | | — | | | | 669,834 | | | | — | | | | 669,834 | |
| | | | |
Total Return Swaps | | | — | | | | 15,716 | | | | — | | | | 15,716 | |
| | | | |
Total | | $ | 4,748,672,522 | | | $ | 3,669,933,945 | | | $ | — | | | $ | 8,418,606,467 | |
| | | | |
|
| Liabilities: | |
| | | | |
Common Stocks Sold Short U.S. | | $ | 2,618,409,593 | | | $ | — | | | $ | — | | | $ | 2,618,409,593 | |
| | | | |
Common Stocks Sold Short Foreign | | | — | | | | 106,805,933 | | | | — | | | | 106,805,933 | |
| | | | |
Written Options | | | 481,050,571 | | | | — | | | | — | | | | 481,050,571 | |
| | | | |
Forward Foreign Currency Contracts | | | — | | | | 183,932 | | | | — | | | | 183,932 | |
| | | | |
Total Return Swaps | | | — | | | | 450,063 | | | | — | | | | 450,063 | |
| | | | |
Total | | $ | 3,099,460,164 | | | $ | 107,439,928 | | | $ | — | | | $ | 3,206,900,092 | |
| | | | |
| |
| | | HEDGED EQUITY FUND | |
| | | LEVEL 1 | | | LEVEL 2 | | | LEVEL 3 | | | TOTAL | |
| Assets: | |
| | | | |
Common Stocks U.S. | | $ | 176,664,877 | | | $ | — | | | $ | — | | | $ | 176,664,877 | |
| | | | |
Exchange-Traded Funds | | | 7,631,289 | | | | — | | | | — | | | | 7,631,289 | |
| | | | |
Purchased Options | | | 2,022,904 | | | | — | | | | — | | | | 2,022,904 | |
| | | | |
Short Term Investments | | | 3,945,939 | | | | — | | | | — | | | | 3,945,939 | |
| | | | |
Investment of Cash Collateral For Securities Loaned | | | — | | | | 6,379,104 | | | | — | | | | 6,379,104 | |
| | | | |
Total | | $ | 190,265,009 | | | $ | 6,379,104 | | | $ | — | | | $ | 196,644,113 | |
| | | | |
|
| Liabilities: | |
| | | | |
Written Options | | $ | 15,558,943 | | | $ | — | | | $ | — | | | $ | 15,558,943 | |
| | | | |
Total | | $ | 15,558,943 | | | $ | — | | | $ | — | | | $ | 15,558,943 | |
| | | | |
Notes to Financial Statements (Unaudited)
| | | | | | | | | | | | | | | | |
| | | PHINEUS LONG/SHORT FUND | |
| | | LEVEL 1 | | | LEVEL 2 | | | LEVEL 3 | | | TOTAL | |
| Assets: | |
| | | | |
Common Stocks U.S. | | $ | 807,016,654 | | | $ | — | | | $ | — | | | $ | 807,016,654 | |
| | | | |
Common Stocks Foreign | | | — | | | | 18,821,038 | | | | — | | | | 18,821,038 | |
| | | | |
Investments in Affiliated Fund | | | 35,636,415 | | | | — | | | | — | | | | 35,636,415 | |
| | | | |
Purchased Options | | | 2,534,258 | | | | — | | | | — | | | | 2,534,258 | |
| | | | |
Short Term Investments | | | 58,089,215 | | | | — | | | | — | | | | 58,089,215 | |
| | | | |
Investment of Cash Collateral For Securities Loaned | | | 5,878,622 | | | | 15,795,733 | | | | — | | | | 21,674,355 | |
| | | | |
Total | | $ | 909,155,164 | | | $ | 34,616,771 | | | $ | — | | | $ | 943,771,935 | |
| | | | |
|
| Liabilities: | |
| | | | |
Common Stocks Sold Short U.S. | | $ | 5,450,200 | | | $ | — | | | $ | — | | | $ | 5,450,200 | |
| | | | |
Exchange-Traded Funds Sold Short | | | 837,402,723 | | | | — | | | | — | | | | 837,402,723 | |
| | | | |
Written Options | | | 6,067,252 | | | | — | | | | — | | | | 6,067,252 | |
| | | | |
Total | | $ | 848,920,175 | | | $ | — | | | $ | — | | | $ | 848,920,175 | |
| | | | |
| |
| | | CONVERTIBLE FUND | |
| | | LEVEL 1 | | | LEVEL 2 | | | LEVEL 3 | | | TOTAL | |
| Assets: | |
| | | | |
Convertible Bonds | | $ | — | | | $ | 557,857,457 | | | $ | — | | | $ | 557,857,457 | |
| | | | |
Synthetic Convertible Securities (U.S. Government and Agency Security) | | | — | | | | 12,219,440 | | | | — | | | | 12,219,440 | |
| | | | |
Synthetic Convertible Securities (Purchased Options) | | | 4,441,695 | | | | — | | | | — | | | | 4,441,695 | |
| | | | |
Convertible Preferred Stocks | | | 101,221,823 | | | | 3,611,875 | | | | — | | | | 104,833,698 | |
| | | | |
Common Stocks U.S. | | | 6,561,283 | | | | — | | | | — | | | | 6,561,283 | |
| | | | |
Purchased Options | | | 467,040 | | | | — | | | | — | | | | 467,040 | |
| | | | |
Short Term Investments | | | 14,669,333 | | | | — | | | | — | | | | 14,669,333 | |
| | | | |
Investment of Cash Collateral For Securities Loaned | | | 26,430,753 | | | | 38,997,010 | | | | — | | | | 65,427,763 | |
| | | | |
Forward Foreign Currency Contracts | | | — | | | | 27,062 | | | | — | | | | 27,062 | |
| | | | |
Total | | $ | 153,791,927 | | | $ | 612,712,844 | | | $ | — | | | $ | 766,504,771 | |
| | | | |
| | | | |
| Liabilities: | | | | | | | | | | | | | | | | |
| | | | |
Written Options | | $ | 96,600 | | | $ | — | | | $ | — | | | $ | 96,600 | |
| | | | |
Forward Foreign Currency Contracts | | | — | | | | 475 | | | | — | | | | 475 | |
| | | | |
Total | | $ | 96,600 | | | $ | 475 | | | $ | — | | | $ | 97,075 | |
| | | | |
| |
| | | GLOBAL CONVERTIBLE FUND | |
| | | LEVEL 1 | | | LEVEL 2 | | | LEVEL 3 | | | TOTAL | |
| Assets: | |
| | | | |
Convertible Bonds | | $ | — | | | $ | 95,403,056 | | | $ | — | | | $ | 95,403,056 | |
| | | | |
Synthetic Convertible Securities (Corporate Bonds) | | | — | | | | 2,116,654 | | | | — | | | | 2,116,654 | |
| | | | |
Synthetic Convertible Securities (U.S. Government and Agency Securities) | | | — | | | | 11,409,850 | | | | — | | | | 11,409,850 | |
| | | | |
Synthetic Convertible Securities (Purchased Options) | | | 947,462 | | | | — | | | | — | | | | 947,462 | |
| | | | |
Convertible Preferred Stocks | | | 13,856,164 | | | | 814,955 | | | | — | | | | 14,671,119 | |
| | | | |
Common Stocks U.S. | | | 3,078,794 | | | | — | | | | — | | | | 3,078,794 | |
| | | | |
Short Term Investments | | | 6,829,646 | | | | — | | | | — | | | | 6,829,646 | |
| | | | |
Investment of Cash Collateral For Securities Loaned | | | — | | | | 5,474,323 | | | | — | | | | 5,474,323 | |
| | | | |
Total | | $ | 24,712,066 | | | $ | 115,218,838 | | | $ | — | | | $ | 139,930,904 | |
| | | | |
| | | | |
| 182 | | CALAMOS OPEN-END FAMILY OF FUNDS SEMIANNUAL REPORT | | |
Notes to Financial Statements (Unaudited)
| | | | | | | | | | | | | | | | |
| | | GROWTH FUND | |
| | | LEVEL 1 | | | LEVEL 2 | | | LEVEL 3 | | | TOTAL | |
| Assets: | |
| | | | |
Common Stocks U.S. | | $ | 1,348,522,851 | | | $ | — | | | $ | — | | | $ | 1,348,522,851 | |
| | | | |
Common Stocks Foreign | | | 743,818 | | | | — | | | | — | | | | 743,818 | |
| | | | |
Exchange-Traded Funds | | | 2,406,690 | | | | — | | | | — | | | | 2,406,690 | |
| | | | |
Investments in Affiliated Fund | | | 5,595,561 | | | | — | | | | — | | | | 5,595,561 | |
| | | | |
Purchased Options | | | 1,316,050 | | | | — | | | | — | | | | 1,316,050 | |
| | | | |
Short Term Investments | | | 116,143,218 | | | | — | | | | — | | | | 116,143,218 | |
| | | | |
Investment of Cash Collateral For Securities Loaned | | | 8,440,660 | | | | 24,518,050 | | | | — | | | | 32,958,710 | |
| | | | |
Total | | $ | 1,483,168,848 | | | $ | 24,518,050 | | | $ | — | | | $ | 1,507,686,898 | |
| | | | |
| | | | |
| Liabilities: | | | | | | | | | | | | | | | | |
| | | | |
Written Options | | $ | 2,760,886 | | | $ | — | | | $ | — | | | $ | 2,760,886 | |
| | | | |
Total | | $ | 2,760,886 | | | $ | — | | | $ | — | | | $ | 2,760,886 | |
| | | | |
| |
| | | GROWTH AND INCOME FUND | |
| | | LEVEL 1 | | | LEVEL 2 | | | LEVEL 3 | | | TOTAL | |
| Assets: | |
| | | | |
Convertible Bonds | | $ | — | | | $ | 303,146,960 | | | $ | — | | | $ | 303,146,960 | |
| | | | |
Synthetic Convertible Securities (Corporate Bonds) | | | — | | | | 61,558,979 | | | | — | | | | 61,558,979 | |
| | | | |
Synthetic Convertible Securities (U.S. Government and Agency Security) | | | — | | | | 32,946,270 | | | | — | | | | 32,946,270 | |
| | | | |
Synthetic Convertible Securities (Purchased Options) | | | 3,956,013 | | | | — | | | | — | | | | 3,956,013 | |
| | | | |
Convertible Preferred Stocks | | | 134,930,976 | | | | 15,223,489 | | | | — | | | | 150,154,465 | |
| | | | |
Common Stocks U.S. | | | 1,417,544,404 | | | | — | | | | — | | | | 1,417,544,404 | |
| | | | |
Exchange-Traded Funds | | | 31,860,943 | | | | — | | | | — | | | | 31,860,943 | |
| | | | |
Purchased Options | | | 2,087,070 | | | | — | | | | — | | | | 2,087,070 | |
| | | | |
Short Term Investments | | | 38,928,166 | | | | — | | | | — | | | | 38,928,166 | |
| | | | |
Investment of Cash Collateral For Securities Loaned | | | 32,811,010 | | | | 31,973,516 | | | | — | | | | 64,784,526 | |
| | | | |
Forward Foreign Currency Contracts | | | — | | | | 24,907 | | | | — | | | | 24,907 | |
| | | | |
Total | | $ | 1,662,118,582 | | | $ | 444,874,121 | | | $ | — | | | $ | 2,106,992,703 | |
| | | | |
| | | | |
| Liabilities: | | | | | | | | | | | | | | | | |
| | | | |
Forward Foreign Currency Contracts | | $ | — | | | $ | 433 | | | $ | — | | | $ | 433 | |
| | | | |
Total | | $ | — | | | $ | 433 | | | $ | — | | | $ | 433 | |
| | | | |
| |
| | | DIVIDEND GROWTH FUND | |
| | | LEVEL 1 | | | LEVEL 2 | | | LEVEL 3 | | | TOTAL | |
| Assets: | |
| | | | |
Common Stocks U.S. | | $ | 18,481,208 | | | $ | — | | | $ | — | | | $ | 18,481,208 | |
| | | | |
Exchange-Traded Funds | | | 152,532 | | | | — | | | | — | | | | 152,532 | |
| | | | |
Short Term Investments | | | 63 | | | | — | | | | — | | | | 63 | |
| | | | |
Investment of Cash Collateral For Securities Loaned | | | — | | | | 89,769 | | | | — | | | | 89,769 | |
| | | | |
Total | | $ | 18,633,803 | | | $ | 89,769 | | | $ | — | | | $ | 18,723,572 | |
| | | | |
| |
| | | OPPORTUNISTIC VALUE FUND | |
| | | LEVEL 1 | | | LEVEL 2 | | | LEVEL 3 | | | TOTAL | |
| Assets: | |
| | | | |
Common Stocks U.S. | | $ | 45,165,685 | | | $ | — | | | $ | — | | | $ | 45,165,685 | |
| | | | |
Exchange-Traded Funds | | | 1,083,231 | | | | — | | | | — | | | | 1,083,231 | |
| | | | |
Short Term Investments | | | 241,197 | | | | — | | | | — | | | | 241,197 | |
| | | | |
Investment of Cash Collateral For Securities Loaned | | | — | | | | 536,508 | | | | — | | | | 536,508 | |
| | | | |
Total | | $ | 46,490,113 | | | $ | 536,508 | | | $ | — | | | $ | 47,026,621 | |
| | | | |
Notes to Financial Statements (Unaudited)
| | | | | | | | | | | | | | | | |
| | | INTERNATIONAL GROWTH FUND | |
| | | LEVEL 1 | | | LEVEL 2 | | | LEVEL 3 | | | TOTAL | |
| Assets: | |
| | | | |
Common Stocks U.S. | | $ | 52,842,610 | | | $ | — | | | $ | — | | | $ | 52,842,610 | |
| | | | |
Common Stocks Foreign | | | 23,554,416 | | | | 134,957,206 | | | | — | | | | 158,511,622 | |
| | | | |
Purchased Options | | | 300,471 | | | | — | | | | — | | | | 300,471 | |
| | | | |
Short Term Investments | | | 4,013,369 | | | | — | | | | — | | | | 4,013,369 | |
| | | | |
Investment of Cash Collateral For Securities Loaned | | | — | | | | 1,824,874 | | | | — | | | | 1,824,874 | |
| | | | |
Total | | $ | 80,710,866 | | | $ | 136,782,080 | | | $ | — | | | $ | 217,492,946 | |
| | | | |
|
| Liabilities: | |
| | | | |
Forward Foreign Currency Contracts | | $ | — | | | $ | 160,837 | | | $ | — | | | $ | 160,837 | |
| | | | |
Total | | $ | — | | | $ | 160,837 | | | $ | — | | | $ | 160,837 | |
| | | | |
| |
| | | EVOLVING WORLD GROWTH FUND | |
| | | LEVEL 1 | | | LEVEL 2 | | | LEVEL 3 | | | TOTAL | |
| Assets: | |
| | | | |
Convertible Bonds | | $ | — | | | $ | 38,283,500 | | | $ | — | | | $ | 38,283,500 | |
| | | | |
Convertible Preferred Stocks | | | — | | | | 11,831,588 | | | | — | | | | 11,831,588 | |
| | | | |
Common Stocks U.S. | | | 20,184,515 | | | | — | | | | — | | | | 20,184,515 | |
| | | | |
Common Stocks Foreign | | | 14,172,202 | | | | 100,411,461 | | | | — | | | | 114,583,663 | |
| | | | |
Purchased Options | | | 1,881,410 | | | | — | | | | — | | | | 1,881,410 | |
| | | | |
Short Term Investments | | | 3,065 | | | | — | | | | — | | | | 3,065 | |
| | | | |
Investment of Cash Collateral For Securities Loaned | | | — | | | | 4,310,157 | | | | — | | | | 4,310,157 | |
| | | | |
Total | | $ | 36,241,192 | | | $ | 154,836,706 | | | $ | — | | | $ | 191,077,898 | |
| | | | |
| |
| | | EMERGING MARKET EQUITY FUND | |
| | | LEVEL 1 | | | LEVEL 2 | | | LEVEL 3 | | | TOTAL | |
| Assets: | |
| | | | |
Common Stocks U.S. | | $ | 4,577,924 | | | $ | 189,263 | | | $ | — | | | $ | 4,767,187 | |
| | | | |
Common Stocks Foreign | | | 1,439,406 | | | | 8,831,050 | | | | — | | | | 10,270,456 | |
| | | | |
Exchange-Traded Funds | | | 524,759 | | | | — | | | | — | | | | 524,759 | |
| | | | |
Purchased Options | | | 95,988 | | | | — | | | | — | | | | 95,988 | |
| | | | |
Short Term Investments | | | 211,850 | | | | — | | | | — | | | | 211,850 | |
| | | | |
Investment of Cash Collateral For Securities Loaned | | | — | | | | 823,146 | | | | — | | | | 823,146 | |
| | | | |
Total | | $ | 6,849,927 | | | $ | 9,843,459 | | | $ | — | | | $ | 16,693,386 | |
| | | | |
| |
| | | GLOBAL EQUITY FUND | |
| | | LEVEL 1 | | | LEVEL 2 | | | LEVEL 3 | | | TOTAL | |
| Assets: | |
| | | | |
Common Stocks U.S. | | $ | 53,515,859 | | | $ | — | | | $ | — | | | $ | 53,515,859 | |
| | | | |
Common Stocks Foreign | | | 5,971,002 | | | | 32,331,186 | | | | — | | | | 38,302,188 | |
| | | | |
Purchased Options | | | 30,000 | | | | — | | | | — | | | | 30,000 | |
| | | | |
Short Term Investments | | | 5,054,677 | | | | — | | | | — | | | | 5,054,677 | |
| | | | |
Investment of Cash Collateral For Securities Loaned | | | — | | | | 1,987,759 | | | | — | | | | 1,987,759 | |
| | | | |
Total | | $ | 64,571,538 | | | $ | 34,318,945 | | | $ | — | | | $ | 98,890,483 | |
| | | | |
| | | | |
| 184 | | CALAMOS OPEN-END FAMILY OF FUNDS SEMIANNUAL REPORT | | |
Notes to Financial Statements (Unaudited)
| | | | | | | | | | | | | | | | |
| | | GLOBAL GROWTH AND INCOME FUND | |
| | | LEVEL 1 | | | LEVEL 2 | | | LEVEL 3 | | | TOTAL | |
| Assets: | |
| | | | |
Convertible Bonds | | $ | — | | | $ | 48,717,990 | | | $ | — | | | $ | 48,717,990 | |
| | | | |
Synthetic Convertible Securities (Corporate Bonds) | | | — | | | | 1,072,618 | | | | — | | | | 1,072,618 | |
| | | | |
Synthetic Convertible Securities (U.S. Government and Agency Security) | | | — | | | | 10,653,487 | | | | — | | | | 10,653,487 | |
| | | | |
Synthetic Convertible Securities (Purchased Options) | | | 116,440 | | | | — | | | | — | | | | 116,440 | |
| | | | |
Convertible Preferred Stocks | | | 7,772,103 | | | | 5,168,717 | | | | — | | | | 12,940,820 | |
| | | | |
Common Stocks U.S. | | | 53,114,406 | | | | — | | | | — | | | | 53,114,406 | |
| | | | |
Common Stocks Foreign | | | 4,149,164 | | | | 33,364,357 | | | | — | | | | 37,513,521 | |
| | | | |
Purchased Options | | | 214,990 | | | | — | | | | — | | | | 214,990 | |
| | | | |
Short Term Investments | | | 5,156,613 | | | | — | | | | — | | | | 5,156,613 | |
| | | | |
Investment of Cash Collateral For Securities Loaned | | | — | | | | 442,808 | | | | — | | | | 442,808 | |
| | | | |
Total | | $ | 70,523,716 | | | $ | 99,419,977 | | | $ | — | | | $ | 169,943,693 | |
| | | | |
| |
| | | TOTAL RETURN BOND FUND | |
| | | LEVEL 1 | | | LEVEL 2 | | | LEVEL 3 | | | TOTAL | |
| Assets: | |
| | | | |
Corporate Bonds | | $ | — | | | $ | 24,903,576 | | | $ | — | | | $ | 24,903,576 | |
| | | | |
Bank Loans | | | — | | | | 1,901,556 | | | | — | | | | 1,901,556 | |
| | | | |
U.S. Government and Agency Securities | | | — | | | | 19,217,935 | | | | — | | | | 19,217,935 | |
| | | | |
Asset Backed Securities | | | — | | | | 4,137,311 | | | | — | | | | 4,137,311 | |
| | | | |
Short Term Investments | | | 413,649 | | | | — | | | | — | | | | 413,649 | |
| | | | |
Investment of Cash Collateral For Securities Loaned | | | — | | | | 2,550,385 | | | | — | | | | 2,550,385 | |
| | | | |
Total | | $ | 413,649 | | | $ | 52,710,763 | | | $ | — | | | $ | 53,124,412 | |
| | | | |
| |
| | | HIGH INCOME OPPORTUNITIES FUND | |
| | | LEVEL 1 | | | LEVEL 2 | | | LEVEL 3 | | | TOTAL | |
| Assets: | |
| | | | |
Corporate Bonds | | $ | — | | | $ | 37,151,376 | | | $ | — | | | $ | 37,151,376 | |
| | | | |
Convertible Bonds | | | — | | | | 512,638 | | | | — | | | | 512,638 | |
| | | | |
Bank Loans | | | — | | | | 5,002,712 | | | | — | | | | 5,002,712 | |
| | | | |
Convertible Preferred Stocks | | | 427,497 | | | | — | | | | — | | | | 427,497 | |
| | | | |
Common Stocks U.S. | | | 735,655 | | | | — | | | | — | | | | 735,655 | |
| | | | |
Short Term Investments | | | 2,238,885 | | | | — | | | | — | | | | 2,238,885 | |
| | | | |
Investment of Cash Collateral For Securities Loaned | | | — | | | | 5,792,850 | | | | — | | | | 5,792,850 | |
| | | | |
Total | | $ | 3,402,037 | | | $ | 48,459,576 | | | $ | — | | | $ | 51,861,613 | |
| | | | |
| |
| | | SHORT-TERM BOND FUND | |
| | | LEVEL 1 | | | LEVEL 2 | | | LEVEL 3 | | | TOTAL | |
| Assets: | |
| | | | |
Corporate Bonds | | $ | — | | | $ | 114,318,981 | | | $ | — | | | $ | 114,318,981 | |
| | | | |
Convertible Bond | | | — | | | | 396,178 | | | | — | | | | 396,178 | |
| | | | |
U.S. Government and Agency Securities | | | — | | | | 33,427,960 | | | | — | | | | 33,427,960 | |
| | | | |
Bank Loans | | | — | | | | 8,051,205 | | | | — | | | | 8,051,205 | |
| | | | |
Asset Backed Securities | | | — | | | | 21,919,378 | | | | — | | | | 21,919,378 | |
| | | | |
Residential Mortgage Backed Securities | | | — | | | | 3,092,972 | | | | — | | | | 3,092,972 | |
| | | | |
Municipal Obligations | | | — | | | | 664,339 | | | | — | | | | 664,339 | |
| | | | |
Short Term Investments | | | 2,368,169 | | | | — | | | | — | | | | 2,368,169 | |
| | | | |
Investment of Cash Collateral For Securities Loaned | | | — | | | | 3,834,570 | | | | — | | | | 3,834,570 | |
| | | | |
Total | | $ | 2,368,169 | | | $ | 185,705,583 | | | $ | — | | | $ | 188,073,752 | |
| | | | |
Notes to Financial Statements (Unaudited)
Note 9 – Capital Share Transactions
The following table summarizes the activity in capital shares of the Funds for the Six Months ended April 30, 2019:
| | | | | | | | | | | | | | | | | | | | | | | | |
| | | MARKET NEUTRAL INCOME FUND | | | HEDGED EQUITY FUND | | | PHINEUS LONG/SHORT FUND | |
| Class A | | Shares | | | Dollars | | | Shares | | | Dollars | | | Shares | | | Dollars | |
| Shares sold | | | 17,243,748 | | | $ | 227,224,259 | | | | 426,611 | | | $ | 4,796,133 | | | | 1,559,995 | | | $ | 18,280,140 | |
| | | | | | |
| Shares issued as reinvestment of distributions | | | 2,089,160 | | | | 26,786,097 | | | | 11,169 | | | | 119,461 | | | | 325,291 | | | | 3,636,756 | |
| | | | | | |
| Less shares redeemed | | | (12,565,838 | ) | | | (164,971,269 | ) | | | (304,789 | ) | | | (3,445,703 | ) | | | (2,847,588 | ) | | | (33,179,589 | ) |
| | | | |
| Net increase (decrease) | | | 6,767,070 | | | $ | 89,039,087 | | | | 132,991 | | | $ | 1,469,891 | | | | (962,302 | ) | | $ | (11,262,693 | ) |
| | | | |
| | | | | | |
| Class C | | Shares | | | Dollars | | | Shares | | | Dollars | | | Shares | | | Dollars | |
| Shares sold | | | 3,152,630 | | | $ | 42,319,488 | | | | 136,628 | | | $ | 1,525,839 | | | | 414,881 | | | $ | 4,761,791 | |
| | | | | | |
| Shares issued as reinvestment of distributions | | | 712,934 | | | | 9,283,599 | | | | 1,590 | | | | 16,781 | | | | 170,003 | | | | 1,859,837 | |
| | | | | | |
| Less shares redeemed | | | (6,034,985 | ) | | | (80,743,138 | ) | | | (24,348 | ) | | | (269,280 | ) | | | (956,239 | ) | | | (10,956,348 | ) |
| | | | |
| Net increase (decrease) | | | (2,169,421 | ) | | $ | (29,140,051 | ) | | | 113,870 | | | $ | 1,273,340 | | | | (371,355 | ) | | $ | (4,334,720 | ) |
| | | | |
| | | | | | |
| Class I | | Shares | | | Dollars | | | Shares | | | Dollars | | | Shares | | | Dollars | |
| Shares sold | | | 141,636,789 | | | $ | 1,843,813,326 | | | | 7,807,466 | | | $ | 87,644,016 | | | | 16,128,139 | | | $ | 190,683,895 | |
| | | | | | |
| Shares issued as reinvestment of distributions | | | 16,052,474 | | | | 203,306,462 | | | | 267,614 | | | | 2,862,311 | | | | 2,860,728 | | | | 32,211,796 | |
| | | | | | |
| Less shares redeemed | | | (77,184,902 | ) | | | (1,000,202,094 | ) | | | (1,744,641 | ) | | | (19,355,128 | ) | | | (33,847,959 | ) | | | (398,572,001 | ) |
| | | | |
| Net increase (decrease) | | | 80,504,361 | | | $ | 1,046,917,694 | | | | 6,330,439 | | | $ | 71,151,199 | | | | (14,859,092 | ) | | $ | (175,676,310 | ) |
| | | | |
| | | | | | |
| Class R6 | | Shares | | | Dollars | | | Shares | | | Dollars | | | Shares | | | Dollars | |
| Shares sold | | | — | | | $ | — | | | | — | | | $ | — | | | | — | | | $ | — | |
| | | | | | |
| Shares issued as reinvestment of distributions | | | — | | | | — | | | | — | | | | — | | | | — | | | | — | |
| | | | | | |
| Less shares redeemed | | | — | | | | — | | | | — | | | | — | | | | — | | | | — | |
| | | | |
| Net increase (decrease) | | | — | | | $ | — | | | | — | | | $ | — | | | | — | | | $ | — | |
| | | | |
| | | | |
| 186 | | CALAMOS OPEN-END FAMILY OF FUNDS SEMIANNUAL REPORT | | |
Notes to Financial Statements (Unaudited)
| | | | | | | | | | | | | | | | | | | | | | | | |
| | | CONVERTIBLE FUND | | | GLOBAL CONVERTIBLE
FUND | | | GROWTH FUND | |
| Class A | | Shares | | | Dollars | | | Shares | | | Dollars | | | Shares | | | Dollars | |
| Shares sold | | | 4,771,123 | | | $ | 79,811,740 | | | | 147,619 | | | $ | 1,546,131 | | | | 9,037,174 | | | $ | 267,624,312 | |
| | | | | | |
| Shares issued as reinvestment of distributions | | | 1,356,087 | | | | 20,873,410 | | | | 48,772 | | | | 487,744 | | | | 3,896,550 | | | | 99,712,712 | |
| | | | | | |
| Less shares redeemed | | | (3,008,547 | ) | | | (50,572,581 | ) | | | (178,699 | ) | | | (1,898,872 | ) | | | (3,085,063 | ) | | | (92,443,524 | ) |
| | | | |
| Net increase (decrease) | | | 3,118,663 | | | $ | 50,112,569 | | | | 17,692 | | | $ | 135,003 | | | | 9,848,661 | | | $ | 274,893,500 | |
| | | | |
| | | | | | |
| Class C | | Shares | | | Dollars | | | Shares | | | Dollars | | | Shares | | | Dollars | |
| Shares sold | | | 495,321 | | | $ | 8,141,003 | | | | 31,400 | | | $ | 325,487 | | | | 282,028 | | | $ | 4,463,314 | |
| | | | | | |
| Shares issued as reinvestment of distributions | | | 862,173 | | | | 13,096,402 | | | | 16,223 | | | | 160,278 | | | | 4,480,634 | | | | 65,327,650 | |
| | | | | | |
| Less shares redeemed | | | (4,304,170 | ) | | | (71,431,648 | ) | | | (72,011 | ) | | | (760,596 | ) | | | (16,745,125 | ) | | | (284,243,458 | ) |
| | | | |
| Net increase (decrease) | | | (2,946,676 | ) | | $ | (50,194,243 | ) | | | (24,388 | ) | | $ | (274,831 | ) | | | (11,982,463 | ) | | $ | (214,452,494 | ) |
| | | | |
| | | | | | |
| Class I | | Shares | | | Dollars | | | Shares | | | Dollars | | | Shares | | | Dollars | |
| Shares sold | | | 11,643,119 | | | $ | 171,211,992 | | | | 2,580,240 | | | $ | 27,240,024 | | | | 276,301 | | | $ | 10,944,207 | |
| | | | | | |
| Shares issued as reinvestment of distributions | | | 2,582,374 | | | | 35,075,454 | | | | 550,885 | | | | 5,512,508 | | | | 776,327 | | | | 27,140,373 | |
| | | | | | |
| Less shares redeemed | | | (6,550,690 | ) | | | (97,109,061 | ) | | | (3,354,484 | ) | | | (34,560,018 | ) | | | (885,105 | ) | | | (35,045,831 | ) |
| | | | |
| Net increase (decrease) | | | 7,674,803 | | | $ | 109,178,385 | | | | (223,359 | ) | | $ | (1,807,486 | ) | | | 167,523 | | | $ | 3,038,749 | |
| | | | |
| | | | | | |
| Class R6 | | Shares | | | Dollars | | | Shares | | | Dollars | | | Shares | | | Dollars | |
| Shares sold | | | — | | | $ | — | | | | — | | | $ | — | | | | — | | | $ | — | |
| | | | | | |
| Shares issued as reinvestment of distributions | | | — | | | | — | | | | — | | | | — | | | | — | | | | — | |
| | | | | | |
| Less shares redeemed | | | — | | | | — | | | | — | | | | — | | | | — | | | | — | |
| | | | |
| Net increase (decrease) | | | — | | | $ | — | | | | — | | | $ | — | | | | — | | | $ | — | |
| | | | |
Notes to Financial Statements (Unaudited)
| | | | | | | | | | | | | | | | | | | | | | | | |
| | | GROWTH AND
INCOME FUND | | | DIVIDEND
GROWTH FUND | | | OPPORTUNISTIC
VALUE FUND | |
| Class A | | Shares | | | Dollars | | | Shares | | | Dollars | | | Shares | | | Dollars | |
| Shares sold | | | 11,139,954 | | | $ | 347,645,791 | | | | 63,984 | | | $ | 763,537 | | | | 186,697 | | | $ | 2,465,706 | |
| | | | | | |
| Shares issued as reinvestment of distributions | | | 1,762,591 | | | | 49,693,856 | | | | 8,757 | | | | 94,994 | | | | 111,969 | | | | 1,322,359 | |
| | | | | | |
| Less shares redeemed | | | (3,149,615 | ) | | | (96,918,382 | ) | | | (22,051 | ) | | | (265,960 | ) | | | (832,114 | ) | | | (12,726,437 | ) |
| | | | |
| Net increase (decrease) | | | 9,752,930 | | | $ | 300,421,265 | | | | 50,690 | | | $ | 592,571 | | | | (533,448 | ) | | $ | (8,938,372 | ) |
| | | | |
| | | | | | |
| Class C | | Shares | | | Dollars | | | Shares | | | Dollars | | | Shares | | | Dollars | |
| Shares sold | | | 440,816 | | | $ | 13,327,308 | | | | 28,927 | | | $ | 311,019 | | | | 270,405 | | | $ | 3,670,899 | |
| | | | | | |
| Shares issued as reinvestment of distributions | | | 1,050,283 | | | | 29,607,487 | | | | 3,605 | | | | 38,283 | | | | 119,355 | | | | 1,232,939 | |
| | | | | | |
| Less shares redeemed | | | (11,759,985 | ) | | | (368,563,802 | ) | | | (46,544 | ) | | | (550,994 | ) | | | (258,086 | ) | | | (2,977,649 | ) |
| | | | |
| Net increase (decrease) | | | (10,268,886 | ) | | $ | (325,629,007 | ) | | | (14,012 | ) | | $ | (201,692 | ) | | | 131,674 | | | $ | 1,926,189 | |
| | | | |
| | | | | | |
| Class I | | Shares | | | Dollars | | | Shares | | | Dollars | | | Shares | | | Dollars | |
| Shares sold | | | 4,289,451 | | | $ | 124,358,912 | | | | 192,934 | | | $ | 2,360,754 | | | | 736,995 | | | $ | 11,726,599 | |
| | | | | | |
| Shares issued as reinvestment of distributions | | | 1,709,621 | | | | 46,132,959 | | | | 78,025 | | | | 845,145 | | | | 383,271 | | | | 4,645,250 | |
| | | | | | |
| Less shares redeemed | | | (3,656,086 | ) | | | (105,596,324 | ) | | | (787,253 | ) | | | (9,239,674 | ) | | | (428,747 | ) | | | (5,838,449 | ) |
| | | | |
| Net increase (decrease) | | | 2,342,986 | | | $ | 64,895,547 | | | | (516,294 | ) | | $ | (6,033,775 | ) | | | 691,519 | | | $ | 10,533,400 | |
| | | | |
| | | | | | |
| Class R6 | | Shares | | | Dollars | | | Shares | | | Dollars | | | Shares | | | Dollars | |
| Shares sold | | | — | | | $ | — | | | | — | | | $ | — | | | | — | | | $ | — | |
| | | | | | |
| Shares issued as reinvestment of distributions | | | — | | | | — | | | | — | | | | — | | | | — | | | | — | |
| | | | | | |
| Less shares redeemed | | | — | | | | — | | | | — | | | | — | | | | — | | | | — | |
| | | | |
| Net increase (decrease) | | | — | | | $ | — | | | | — | | | $ | — | | | | — | | | $ | — | |
| | | | |
| | | | |
| 188 | | CALAMOS OPEN-END FAMILY OF FUNDS SEMIANNUAL REPORT | | |
Notes to Financial Statements (Unaudited)
| | | | | | | | | | | | | | | | | | | | | | | | |
| | | INTERNATIONAL
GROWTH FUND | | | EVOLVING WORLD
GROWTH FUND | | | EMERGING MARKET
EQUITY FUND | |
| Class A | | Shares | | | Dollars | | | Shares | | | Dollars | | | Shares | | | Dollars | |
| Shares sold | | | 762,747 | | | $ | 12,730,166 | | | | 251,518 | | | $ | 3,373,691 | | | | 12,998 | | | $ | 120,672 | |
| | | | | | |
| Shares issued as reinvestment of distributions | | | 362,648 | | | | 5,305,535 | | | | — | | | | — | | | | — | | | | — | |
| | | | | | |
| Less shares redeemed | | | (1,126,927 | ) | | | (18,792,651 | ) | | | (605,155 | ) | | | (7,999,440 | ) | | | (7,661 | ) | | | (71,088 | ) |
| | | | |
| Net increase (decrease) | | | (1,532 | ) | | $ | (756,950 | ) | | | (353,637 | ) | | $ | (4,625,749 | ) | | | 5,337 | | | $ | 49,584 | |
| | | | |
| | | | | | |
| Class C | | Shares | | | Dollars | | | Shares | | | Dollars | | | Shares | | | Dollars | |
| Shares sold | | | 40,844 | | | $ | 554,670 | | | | 47,452 | | | $ | 580,615 | | | | 825 | | | $ | 7,250 | |
| | | | | | |
| Shares issued as reinvestment of distributions | | | 171,935 | | | | 2,240,318 | | | | — | | | | — | | | | — | | | | — | |
| | | | | | |
| Less shares redeemed | | | (737,442 | ) | | | (10,798,789 | ) | | | (344,038 | ) | | | (4,312,174 | ) | | | (11,069 | ) | | | (93,279 | ) |
| | | | |
| Net increase (decrease) | | | (524,663 | ) | | $ | (8,003,801 | ) | | | (296,586 | ) | | $ | (3,731,559 | ) | | | (10,244 | ) | | $ | (86,029 | ) |
| | | | |
| | | | | | |
| Class I | | Shares | | | Dollars | | | Shares | | | Dollars | | | Shares | | | Dollars | |
| Shares sold | | | 1,030,801 | | | $ | 16,919,682 | | | | 688,186 | | | $ | 9,151,676 | | | | 20,988 | | | $ | 186,042 | |
| | | | | | |
| Shares issued as reinvestment of distributions | | | 1,006,590 | | | | 15,149,175 | | | | — | | | | — | | | | 586 | | | | 5,001 | |
| | | | | | |
| Less shares redeemed | | | (2,442,310 | ) | | | (41,441,985 | ) | | | (3,078,550 | ) | | | (40,945,557 | ) | | | (47,901 | ) | | | (425,845 | ) |
| | | | |
| Net increase (decrease) | | | (404,919 | ) | | $ | (9,373,128 | ) | | | (2,390,364 | ) | | $ | (31,793,881 | ) | | | (26,327 | ) | | $ | (234,802 | ) |
| | | | |
| | | | | | |
| Class R6 | | Shares | | | Dollars | | | Shares | | | Dollars | | | Shares | | | Dollars | |
| Shares sold | | | 432,592 | | | $ | 7,066,950 | | | | — | | | $ | — | | | | — | | | $ | — | |
| | | | | | |
| Shares issued as reinvestment of distributions | | | 160 | | | | 2,420 | | | | — | | | | — | | | | — | | | | — | |
| | | | | | |
| Less shares redeemed | | | (8,473 | ) | | | (146,596 | ) | | | — | | | | — | | | | — | | | | — | |
| | | | |
| Net increase (decrease) | | | 424,279 | | | $ | 6,922,774 | | | | — | | | $ | — | | | | — | | | $ | — | |
| | | | |
Notes to Financial Statements (Unaudited)
| | | | | | | | | | | | | | | | | | | | | | | | |
| | | GLOBAL EQUITY FUND | | | GLOBAL GROWTH AND
INCOME FUND | | | TOTAL RETURN
BOND FUND | |
| Class A | | Shares | | | Dollars | | | Shares | | | Dollars | | | Shares | | | Dollars | |
| Shares sold | | | 469,534 | | | $ | 4,897,021 | | | | 3,992,236 | | | $ | 32,967,403 | | | | 718,536 | | | $ | 7,142,631 | |
| | | | | | |
| Shares issued as reinvestment of distributions | | | 421,580 | | | | 4,009,226 | | | | 714,476 | | | | 5,375,534 | | | | 20,971 | | | | 209,980 | |
| | | | | | |
| Less shares redeemed | | | (372,546 | ) | | | (4,166,652 | ) | | | (1,333,175 | ) | | | (11,054,757 | ) | | | (485,958 | ) | | | (4,842,343 | ) |
| | | | |
| Net increase (decrease) | | | 518,568 | | | $ | 4,739,595 | | | | 3,373,537 | | | $ | 27,288,180 | | | | 253,549 | | | $ | 2,510,268 | |
| | | | |
| | | | | | |
| Class C | | Shares | | | Dollars | | | Shares | | | Dollars | | | Shares | | | Dollars | |
| Shares sold | | | 201,483 | | | $ | 2,208,434 | | | | 373,336 | | | $ | 2,478,979 | | | | 136,897 | | | $ | 1,346,924 | |
| | | | | | |
| Shares issued as reinvestment of distributions | | | 289,494 | | | | 2,417,271 | | | | 832,153 | | | | 5,492,213 | | | | 5,352 | | | | 53,384 | |
| | | | | | |
| Less shares redeemed | | | (436,873 | ) | | | (4,205,875 | ) | | | (5,260,874 | ) | | | (38,069,071 | ) | | | (474,155 | ) | | | (4,738,125 | ) |
| | | | |
| Net increase (decrease) | | | 54,104 | | | $ | 419,830 | | | | (4,055,385 | ) | | $ | (30,097,879 | ) | | | (331,906 | ) | | $ | (3,337,817 | ) |
| | | | |
| | | | | | |
| Class I | | Shares | | | Dollars | | | Shares | | | Dollars | | | Shares | | | Dollars | |
| Shares sold | | | 241,415 | | | $ | 2,726,363 | | | | 856,285 | | | $ | 7,145,549 | | | | 271,250 | | | $ | 2,740,738 | |
| | | | | | |
| Shares issued as reinvestment of distributions | | | 1,073,542 | | | | 10,520,717 | | | | 757,447 | | | | 5,881,685 | | | | 41,187 | | | | 411,573 | |
| | | | | | |
| Less shares redeemed | | | (792,138 | ) | | | (9,581,923 | ) | | | (2,849,525 | ) | | | (24,594,672 | ) | | | (1,000,898 | ) | | | (9,901,762 | ) |
| | | | |
| Net increase (decrease) | | | 522,819 | | | $ | 3,665,157 | | | | (1,235,793 | ) | | $ | (11,567,438 | ) | | | (688,461 | ) | | $ | (6,749,451 | ) |
| | | | |
| | | | | | |
| Class R6 | | Shares | | | Dollars | | | Shares | | | Dollars | | | Shares | | | Dollars | |
| Shares sold | | | — | | | $ | — | | | | — | | | $ | — | | | | — | | | $ | — | |
| | | | | | |
| Shares issued as reinvestment of distributions | | | — | | | | — | | | | — | | | | — | | | | — | | | | — | |
| | | | | | |
| Less shares redeemed | | | — | | | | — | | | | — | | | | — | | | | — | | | | — | |
| | | | |
| Net increase (decrease) | | | — | | | $ | — | | | | — | | | $ | — | | | | — | | | $ | — | |
| | | | |
| | | | |
| 190 | | CALAMOS OPEN-END FAMILY OF FUNDS SEMIANNUAL REPORT | | |
Notes to Financial Statements (Unaudited)
| | | | | | | | | | | | | | | | |
| | | HIGH INCOME
OPPORTUNITIES FUND | | | SHORT-TERM BOND FUND | |
| Class A | | Shares | | | Dollars | | | Shares | | | Dollars | |
| Shares sold | | | 747,027 | | | $ | 6,269,280 | | | | 19,829 | | | $ | 198,676 | |
| | | | |
| Shares issued as reinvestment of distributions | | | 111,881 | | | | 925,327 | | | | 154 | | | | 1,547 | |
| | | | |
| Less shares redeemed | | | (465,535 | ) | | | (3,825,864 | ) | | | (47 | ) | | | (472 | ) |
| | | | |
| Net increase (decrease) | | | 393,373 | | | $ | 3,368,743 | | | | 19,936 | | | $ | 199,751 | |
| | | | |
| | | | |
| Class C | | Shares | | | Dollars | | | Shares | | | Dollars | |
| Shares sold | | | 23,806 | | | $ | 209,198 | | | | — | | | $ | — | |
| | | | |
| Shares issued as reinvestment of distributions | | | 21,297 | | | | 184,346 | | | | — | | | | — | |
| | | | |
| Less shares redeemed | | | (820,561 | ) | | | (7,244,533 | ) | | | — | | | | — | |
| | | | |
| Net increase (decrease) | | | (775,458 | ) | | $ | (6,850,989 | ) | | | — | | | $ | — | |
| | | | |
| | | | |
| Class I | | Shares | | | Dollars | | | Shares | | | Dollars | |
| Shares sold | | | 151,820 | | | $ | 1,273,910 | | | | 16,666,159 | | | $ | 166,868,766 | |
| | | | |
| Shares issued as reinvestment of distributions | | | 25,989 | | | | 214,786 | | | | 55,074 | | | | 551,526 | |
| | | | |
| Less shares redeemed | | | (242,948 | ) | | | (2,022,716 | ) | | | (9,802 | ) | | | (98,685 | ) |
| | | | |
| Net increase (decrease) | | | (65,139 | ) | | $ | (534,020 | ) | | | 16,711,431 | | | $ | 167,321,607 | |
| | | | |
| | | | |
| Class R6 | | Shares | | | Dollars | | | Shares | | | Dollars | |
| Shares sold | | | — | | | $ | — | | | | — | | | $ | — | |
| | | | |
| Shares issued as reinvestment of distributions | | | — | | | | — | | | | — | | | | — | |
| | | | |
| Less shares redeemed | | | — | | | | — | | | | — | | | | — | |
| | | | |
| Net increase (decrease) | | | — | | | $ | — | | | | — | | | $ | — | |
| | | | |
Notes to Financial Statements (Unaudited)
The following table summarizes the activity in capital shares of the Funds for the year ended October 31, 2018:
| | | | | | | | | | | | | | | | | | | | | | | | |
| | | MARKET NEUTRAL
INCOME FUND | | | HEDGED EQUITY
FUND | | | PHINEUS LONG/SHORT FUND | |
| Class A | | Shares | | | Dollars | | | Shares | | | Dollars | | | Shares | | | Dollars | |
| Shares sold | | | 23,304,729 | | | $ | 313,766,420 | | | | 3,026,723 | | | $ | 34,707,585 | | | | 6,488,594 | | | $ | 81,785,520 | |
| | | | | | |
| Shares issued as reinvestment of distributions | | | 1,389,035 | | | | 18,438,255 | | | | 8,436 | | | | 98,050 | | | | 77,219 | | | | 962,149 | |
| | | | | | |
| Shares converted from class R | | | 456,993 | | | | 6,105,427 | | | | — | | | | — | | | | — | | | | — | |
| | | | | | |
| Less shares redeemed | | | (20,993,918 | ) | | | (282,581,777 | ) | | | (2,677,841 | ) | | | (30,489,455 | ) | | | (3,035,625 | ) | | | (38,072,768 | ) |
| | | | |
| Net increase (decrease) | | | 4,156,839 | | | $ | 55,728,325 | | | | 357,318 | | | $ | 4,316,180 | | | | 3,530,188 | | | $ | 44,674,901 | |
| | | | |
| | | | | | |
| Class C | | Shares | | | Dollars | | | Shares | | | Dollars | | | Shares | | | Dollars | |
| Shares sold | | | 5,044,232 | | | $ | 69,003,246 | | | | 41,040 | | | $ | 471,929 | | | | 2,677,188 | | | $ | 33,309,114 | |
| | | | | | |
| Shares issued as reinvestment of distributions | | | 410,720 | | | | 5,529,317 | | | | 8 | | | | 87 | | | | 32,298 | | | | 397,268 | |
| | | | | | |
| Less shares redeemed | | | (4,056,839 | ) | | | (55,404,303 | ) | | | (2,778 | ) | | | (30,004 | ) | | | (704,983 | ) | | | (8,639,555 | ) |
| | | | |
| Net increase (decrease) | | | 1,398,113 | | | $ | 19,128,260 | | | | 38,270 | | | $ | 442,012 | | | | 2,004,503 | | | $ | 25,066,827 | |
| | | | |
| | | | | | |
| Class I | | Shares | | | Dollars | | | Shares | | | Dollars | | | Shares | | | Dollars | |
| Shares sold | | | 201,073,177 | | | $ | 2,677,721,119 | | | | 7,299,401 | | | $ | 84,667,799 | | | | 72,928,696 | | | $ | 926,283,927 | |
| | | | | | |
| Shares issued as reinvestment of distributions | | | 8,642,306 | | | | 113,598,391 | | | | 16,925 | | | | 196,116 | | | | 392,138 | | | | 4,909,564 | |
| | | | | | |
| Less shares redeemed | | | (67,773,139 | ) | | | (900,807,963 | ) | | | (414,839 | ) | | | (4,747,085 | ) | | | (19,452,058 | ) | | | (243,175,678 | ) |
| | | | |
| Net increase (decrease) | | �� | 141,942,344 | | | $ | 1,890,511,547 | | | | 6,901,487 | | | $ | 80,116,830 | | | | 53,868,776 | | | $ | 688,017,813 | |
| | | | |
| | | | | | |
| Class R(a) | | Shares | | | Dollars | | | Shares | | | Dollars | | | Shares | | | Dollars | |
| Shares sold | | | 25,000 | | | $ | 332,597 | | | | — | | | $ | — | | | | — | | | $ | — | |
| | | | | | |
| Shares issued as reinvestment of distributions | | | 7,310 | | | | 96,131 | | | | — | | | | — | | | | — | | | | — | |
| | | | | | |
| Less shares redeemed | | | (58,819 | ) | | | (784,131 | ) | | | — | | | | — | | | | — | | | | — | |
| | | | | | |
| Shares converted to class A | | | (458,875 | ) | | | (6,105,427 | ) | | | — | | | | — | | | | — | | | | — | |
| | | | |
| Net increase (decrease) | | | (485,384 | ) | | $ | (6,460,830 | ) | | | — | | | $ | — | | | | — | | | $ | — | |
| | | | |
| | | | | | |
| Class R6 | | Shares | | | Dollars | | | Shares | | | Dollars | | | Shares | | | Dollars | |
| Shares sold | | | — | | | $ | — | | | | — | | | $ | — | | | | — | | | $ | — | |
| | | | | | |
| Shares issued as reinvestment of distributions | | | — | | | | — | | | | — | | | | — | | | | — | | | | — | |
| | | | | | |
| Less shares redeemed | | | — | | | | — | | | | — | | | | — | | | | — | | | | — | |
| | | | |
| Net increase (decrease) | | | — | | | $ | — | | | | — | | | $ | — | | | | — | | | $ | — | |
| | | | |
| (a) | Class R shares were converted into Class A shares at the close of business on February 22, 2018. |
| | | | |
| 192 | | CALAMOS OPEN-END FAMILY OF FUNDS SEMIANNUAL REPORT | | |
Notes to Financial Statements (Unaudited)
| | | | | | | | | | | | | | | | | | | | | | | | |
| | | CONVERTIBLE FUND | | | GLOBAL CONVERTIBLE
FUND | | | GROWTH FUND | |
| Class A | | Shares | | | Dollars | | | Shares | | | Dollars | | | Shares | | | Dollars | |
| Shares sold | | | 2,490,392 | | | $ | 46,027,206 | | | | 769,987 | | | $ | 8,556,786 | | | | 1,045,901 | | | $ | 35,392,030 | |
| | | | | | |
| Shares issued as reinvestment of distributions | | | 445,294 | | | | 7,973,633 | | | | 44,303 | | | | 483,005 | | | | 3,302,766 | | | | 106,811,442 | |
| | | | | | |
| Shares converted from class R | | | 94,626 | | | | 1,692,856 | | | | 743 | | | | 8,253 | | | | 160,063 | | | | 5,406,928 | |
| | | | | | |
| Less shares redeemed | | | (3,539,359 | ) | | | (65,339,068 | ) | | | (911,638 | ) | | | (10,154,591 | ) | | | (6,039,038 | ) | | | (208,488,738 | ) |
| | | | |
| Net increase (decrease) | | | (509,047 | ) | | $ | (9,645,373 | ) | | | (96,605 | ) | | $ | (1,106,547 | ) | | | (1,530,308 | ) | | $ | (60,878,338 | ) |
| | | | |
| | | | | | |
| Class C | | Shares | | | Dollars | | | Shares | | | Dollars | | | Shares | | | Dollars | |
| Shares sold | | | 451,525 | | | $ | 8,239,481 | | | | 147,136 | | | $ | 1,617,477 | | | | 239,855 | | | $ | 5,182,517 | |
| | | | | | |
| Shares issued as reinvestment of distributions | | | 263,210 | | | | 4,631,349 | | | | 8,538 | | | | 91,739 | | | | 3,338,958 | | | | 68,882,701 | |
| | | | | | |
| Less shares redeemed | | | (1,653,755 | ) | | | (30,141,422 | ) | | | (51,663 | ) | | | (566,118 | ) | | | (4,283,795 | ) | | | (95,076,494 | ) |
| | | | |
| Net increase (decrease) | | | (939,020 | ) | | $ | (17,270,592 | ) | | | 104,011 | | | $ | 1,143,098 | | | | (704,982 | ) | | $ | (21,011,276 | ) |
| | | | |
| | | | | | |
| Class I | | Shares | | | Dollars | | | Shares | | | Dollars | | | Shares | | | Dollars | |
| Shares sold | | | 7,786,551 | | | $ | 129,978,184 | | | | 5,534,311 | | | $ | 61,616,069 | | | | 759,645 | | | $ | 34,701,111 | |
| | | | | | |
| Shares issued as reinvestment of distributions | | | 716,667 | | | | 11,544,487 | | | | 357,579 | | | | 3,907,030 | | | | 658,057 | | | | 27,862,157 | |
| | | | | | |
| Less shares redeemed | | | (5,674,347 | ) | | | (93,339,101 | ) | | | (2,791,104 | ) | | | (30,872,234 | ) | | | (1,597,541 | ) | | | (72,616,037 | ) |
| | | | |
| Net increase (decrease) | | | 2,828,871 | | | $ | 48,183,570 | | | | 3,100,786 | | | $ | 34,650,865 | | | | (179,839 | ) | | $ | (10,052,769 | ) |
| | | | |
| | | | | | |
| Class R(a) | | Shares | | | Dollars | | | Shares | | | Dollars | | | Shares | | | Dollars | |
| Shares sold | | | 2,804 | | | $ | 50,132 | | | | — | | | $ | — | | | | 14,470 | | | $ | 457,344 | |
| | | | | | |
| Shares issued as reinvestment of distributions | | | 2,260 | | | | 39,597 | | | | 23 | | | | 245 | | | | 19,006 | | | | 574,749 | |
| | | | | | |
| Less shares redeemed | | | (6,421 | ) | | | (115,787 | ) | | | — | | | | — | | | | (21,840 | ) | | | (702,726 | ) |
| | | | | | |
| Shares converted to class A | | | (95,040 | ) | | | (1,692,856 | ) | | | (747 | ) | | | (8,253 | ) | | | (171,252 | ) | | | (5,406,928 | ) |
| | | | |
| Net increase (decrease) | | | (96,397 | ) | | $ | (1,718,914 | ) | | | (724 | ) | | $ | (8,008 | ) | | | (159,616 | ) | | $ | (5,077,561 | ) |
| | | | |
| | | | | | |
| Class R6 | | Shares | | | Dollars | | | Shares | | | Dollars | | | Shares | | | Dollars | |
| Shares sold | | | — | | | $ | — | | | | — | | | $ | — | | | | — | | | $ | — | |
| | | | | | |
| Shares issued as reinvestment of distributions | | | — | | | | — | | | | — | | | | — | | | | — | | | | — | |
| | | | | | |
| Less shares redeemed | | | — | | | | — | | | | — | | | | — | | | | — | | | | — | |
| | | | |
| Net increase (decrease) | | | — | | | $ | — | | | | — | | | $ | — | | | | — | | | $ | — | |
| | | | |
| (a) | Class R shares were converted into Class A shares at the close of business on February 22, 2018. |
Notes to Financial Statements (Unaudited)
| | | | | | | | | | | | | | | | | | | | | | | | |
| | | GROWTH AND
INCOME FUND | | | DIVIDEND
GROWTH FUND | | | OPPORTUNISTIC
VALUE FUND | |
| Class A | | Shares | | | Dollars | | | Shares | | | Dollars | | | Shares | | | Dollars | |
| Shares sold | | | 1,828,279 | | | $ | 60,648,514 | | | | 36,621 | | | $ | 457,419 | | | | 68,060 | | | $ | 1,062,665 | |
| | | | | | |
| Shares issued as reinvestment of distributions | | | 1,668,011 | | | | 53,417,704 | | | | 13,502 | | | | 163,449 | | | | 47,295 | | | | 712,264 | |
| | | | | | |
| Shares converted from class R | | | 348,363 | | | | 11,447,223 | | | | — | | | | — | | | | 9,856 | | | | 151,294 | |
| | | | | | |
| Less shares redeemed | | | (5,973,982 | ) | | | (199,006,475 | ) | | | (19,572 | ) | | | (247,248 | ) | | | (175,440 | ) | | | (2,724,491 | ) |
| | | | |
| Net increase (decrease) | | | (2,129,329 | ) | | $ | (73,493,034 | ) | | | 30,551 | | | $ | 373,620 | | | | (50,229 | ) | | $ | (798,268 | ) |
| | | | |
| | | | | | |
| Class C | | Shares | | | Dollars | | | Shares | | | Dollars | | | Shares | | | Dollars | |
| Shares sold | | | 620,929 | | | $ | 20,716,983 | | | | 9,121 | | | $ | 111,383 | | | | 3,505 | | | $ | 49,331 | |
| | | | | | |
| Shares issued as reinvestment of distributions | | | 1,010,250 | | | | 32,400,402 | | | | 6,653 | | | | 79,037 | | | | 10,988 | | | | 149,333 | |
| | | | | | |
| Less shares redeemed | | | (3,510,401 | ) | | | (117,073,601 | ) | | | (13,712 | ) | | | (170,222 | ) | | | (45,143 | ) | | | (637,684 | ) |
| | | | |
| Net increase (decrease) | | | (1,879,222 | ) | | $ | (63,956,216 | ) | | | 2,062 | | | $ | 20,198 | | | | (30,650 | ) | | $ | (439,020 | ) |
| | | | |
| | | | | | |
| Class I | | Shares | | | Dollars | | | Shares | | | Dollars | | | Shares | | | Dollars | |
| Shares sold | | | 5,419,973 | | | $ | 174,411,586 | | | | 131,156 | | | $ | 1,670,092 | | | | 29,642 | | | $ | 473,387 | |
| | | | | | |
| Shares issued as reinvestment of distributions | | | 1,302,327 | | | | 40,205,524 | | | | 153,479 | | | | 1,856,415 | | | | 57,863 | | | | 893,972 | |
| | | | | | |
| Less shares redeemed | | | (3,503,146 | ) | | | (111,683,122 | ) | | | (361,307 | ) | | | (4,527,798 | ) | | | (344,243 | ) | | | (5,499,472 | ) |
| | | | |
| Net increase (decrease) | | | 3,219,154 | | | $ | 102,933,988 | | | | (76,672 | ) | | $ | (1,001,291 | ) | | | (256,738 | ) | | $ | (4,132,113 | ) |
| | | | |
| | | | | | |
| Class R(a) | | Shares | | | Dollars | | | Shares | | | Dollars | | | Shares | | | Dollars | |
| Shares sold | | | 15,639 | | | $ | 506,978 | | | | — | | | $ | — | | | | 291 | | | $ | 4,471 | |
| | | | | | |
| Shares issued as reinvestment of distributions | | | 19,246 | | | | 606,450 | | | | — | | | | — | | | | 80 | | | | 1,186 | |
| | | | | | |
| Less shares redeemed | | | (44,626 | ) | | | (1,457,529 | ) | | | — | | | | — | | | | (1,114 | ) | | | (16,621 | ) |
| | | | | | |
| Shares converted to class A | | | (351,366 | ) | | | (11,447,223 | ) | | | — | | | | — | | | | (9,994 | ) | | | (151,294 | ) |
| | | | |
| Net increase (decrease) | | | (361,107 | ) | | $ | (11,791,324 | ) | | | — | | | $ | — | | | | (10,737 | ) | | $ | (162,258 | ) |
| | | | |
| | | | | | |
| Class R6 | | Shares | | | Dollars | | | Shares | | | Dollars | | | Shares | | | Dollars | |
| Shares sold | | | — | | | $ | — | | | | — | | | $ | — | | | | — | | | $ | — | |
| | | | | | |
| Shares issued as reinvestment of distributions | | | — | | | | — | | | | — | | | | — | | | | — | | | | — | |
| | | | | | |
| Less shares redeemed | | | — | | | | — | | | | — | | | | — | | | | — | | | | — | |
| | | | |
| Net increase (decrease) | | | — | | | $ | — | | | | — | | | $ | — | | | | — | | | $ | — | |
| | | | |
| (a) | Class R shares were converted into Class A shares at the close of business on February 22, 2018. |
| | | | |
| 194 | | CALAMOS OPEN-END FAMILY OF FUNDS SEMIANNUAL REPORT | | |
Notes to Financial Statements (Unaudited)
| | | | | | | | | | | | | | | | | | | | | | | | |
| | | INTERNATIONAL
GROWTH FUND | | | EVOLVING WORLD
GROWTH FUND | | | EMERGING MARKET
EQUITY FUND | |
| Class A | | Shares | | | Dollars | | | Shares | | | Dollars | | | Shares | | | Dollars | |
| Shares sold | | | 3,560,783 | | | $ | 77,582,022 | | | | 793,820 | | | $ | 12,006,694 | | | | 16,938 | | | $ | 182,579 | |
| | | | | | |
| Shares issued as reinvestment of distributions | | | 188,722 | | | | 3,940,528 | | | | 550 | | | | 8,122 | | | | 887 | | | | 9,320 | |
| | | | | | |
| Shares converted from class R | | | 312,475 | | | | 6,808,822 | | | | 145,134 | | | | 2,303,279 | | | | — | | | | — | |
| | | | | | |
| Less shares redeemed | | | (4,134,915 | ) | | | (87,647,764 | ) | | | (2,769,557 | ) | | | (41,240,663 | ) | | | (12,255 | ) | | | (126,537 | ) |
| | | | |
| Net increase (decrease) | | | (72,935 | ) | | $ | 683,608 | | | | (1,830,053 | ) | | $ | (26,922,568 | ) | | | 5,570 | | | $ | 65,362 | |
| | | | |
| | | | | | |
| Class C | | Shares | | | Dollars | | | Shares | | | Dollars | | | Shares | | | Dollars | |
| Shares sold | | | 77,422 | | | $ | 1,510,861 | | | | 175,178 | | | $ | 2,500,143 | | | | 4,210 | | | $ | 41,438 | |
| | | | | | |
| Shares issued as reinvestment of distributions | | | 54,710 | | | | 1,040,583 | | | | — | | | | — | | | | — | | | | — | |
| | | | | | |
| Less shares redeemed | | | (295,417 | ) | | | (5,656,723 | ) | | | (440,136 | ) | | | (6,102,909 | ) | | | (7,248 | ) | | | (71,644 | ) |
| | | | |
| Net increase (decrease) | | | (163,285 | ) | | $ | (3,105,279 | ) | | | (264,958 | ) | | $ | (3,602,766 | ) | | | (3,038 | ) | | $ | (30,206 | ) |
| | | | |
| | | | | | |
| Class I | | Shares | | | Dollars | | | Shares | | | Dollars | | | Shares | | | Dollars | |
| Shares sold | | | 1,908,475 | | | $ | 41,551,059 | | | | 3,062,969 | | | $ | 46,063,386 | | | | 109,133 | | | $ | 1,222,231 | |
| | | | | | |
| Shares issued as reinvestment of distributions | | | 295,866 | | | | 6,316,729 | | | | 59,671 | | | | 885,521 | | | | 4,307 | | | | 45,350 | |
| | | | | | |
| Less shares redeemed | | | (1,893,024 | ) | | | (41,115,312 | ) | | | (6,143,599 | ) | | | (92,860,230 | ) | | | (91,379 | ) | | | (903,361 | ) |
| | | | |
| Net increase (decrease) | | | 311,317 | | | $ | 6,752,476 | | | | (3,020,959 | ) | | $ | (45,911,323 | ) | | | 22,061 | | | $ | 364,220 | |
| | | | |
| | | | | | |
| Class R(a) | | Shares | | | Dollars | | | Shares | | | Dollars | | | Shares | | | Dollars | |
| Shares sold | | | 26,978 | | | $ | 574,860 | | | | 11,039 | | | $ | 168,394 | | | | — | | | $ | — | |
| | | | | | |
| Shares issued as reinvestment of distributions | | | 9,239 | | | | 188,200 | | | | — | | | | — | | | | — | | | | — | |
| | | | | | |
| Less shares redeemed | | | (36,825 | ) | | | (787,976 | ) | | | (58,709 | ) | | | (888,872 | ) | | | — | | | | — | |
| | | | | | |
| Shares converted to class A | | | (320,427 | ) | | | (6,808,822 | ) | | | (147,156 | ) | | | (2,303,279 | ) | | | — | | | | — | |
| | | | |
| Net increase (decrease) | | | (321,035 | ) | | $ | (6,833,738 | ) | | | (194,826 | ) | | $ | (3,023,757 | ) | | | — | | | $ | — | |
| | | | |
| | | | | | |
| Class R6(b) | | Shares | | | Dollars | | | Shares | | | Dollars | | | Shares | | | Dollars | |
| Shares sold | | | 1,197 | | | $ | 25,000 | | | | — | | | $ | — | | | | — | | | $ | — | |
| | | | | | |
| Shares issued as reinvestment of distributions | | | — | | | | — | | | | — | | | | — | | | | — | | | | — | |
| | | | | | |
| Less shares redeemed | | | — | | | | — | | | | — | | | | — | | | | — | | | | — | |
| | | | |
| Net increase (decrease) | | | 1,197 | | | $ | 25,000 | | | | — | | | $ | — | | | | — | | | $ | — | |
| | | | |
| (a) | Class R shares were converted into Class A shares at the close of business on February 22, 2018. |
| (b) | International Growth Fund Class R6 commenced operations on September 17, 2018. |
Notes to Financial Statements (Unaudited)
| | | | | | | | | | | | | | | | | | | | | | | | |
| | | GLOBAL EQUITY FUND | | | GLOBAL GROWTH AND
INCOME FUND | | | TOTAL RETURN
BOND FUND | |
| Class A | | Shares | | | Dollars | | | Shares | | | Dollars | | | Shares | | | Dollars | |
| Shares sold | | | 346,836 | | | $ | 5,221,585 | | | | 544,702 | | | $ | 5,257,205 | | | | 168,855 | | | $ | 1,706,191 | |
| | | | | | |
| Shares issued as reinvestment of distributions | | | 126,959 | | | | 1,837,097 | | | | 420,944 | | | | 3,955,552 | | | | 51,227 | | | | 517,633 | |
| | | | | | |
| Shares converted from class R | | | 357,072 | | | | 5,398,935 | | | | 104,769 | | | | 1,016,255 | | | | 61,291 | | | | 614,140 | |
| | | | | | |
| Less shares redeemed | | | (535,449 | ) | | | (8,085,122 | ) | | | (1,993,126 | ) | | | (19,270,396 | ) | | | (626,257 | ) | | | (6,288,448 | ) |
| | | | |
| Net increase (decrease) | | | 295,418 | | | $ | 4,372,495 | | | | (922,711 | ) | | $ | (9,041,384 | ) | | | (344,884 | ) | | $ | (3,450,484 | ) |
| | | | |
| | | | | | |
| Class C | | Shares | | | Dollars | | | Shares | | | Dollars | | | Shares | | | Dollars | |
| Shares sold | | | 83,432 | | | $ | 1,145,132 | | | | 291,472 | | | $ | 2,491,887 | | | | 67,659 | | | $ | 686,541 | |
| | | | | | |
| Shares issued as reinvestment of distributions | | | 86,016 | | | | 1,135,416 | | | | 489,662 | | | | 4,088,680 | | | | 18,552 | | | | 187,881 | |
| | | | | | |
| Less shares redeemed | | | (243,411 | ) | | | (3,334,186 | ) | | | (1,901,384 | ) | | | (16,249,536 | ) | | | (330,688 | ) | | | (3,351,059 | ) |
| | | | |
| Net increase (decrease) | | | (73,963 | ) | | $ | (1,053,638 | ) | | | (1,120,250 | ) | | $ | (9,668,969 | ) | | | (244,477 | ) | | $ | (2,476,637 | ) |
| | | | |
| | | | | | |
| Class I | | Shares | | | Dollars | | | Shares | | | Dollars | | | Shares | | | Dollars | |
| Shares sold | | | 1,007,980 | | | $ | 15,534,006 | | | | 2,678,700 | | | $ | 26,661,221 | | | | 1,193,049 | | | $ | 12,036,831 | |
| | | | | | |
| Shares issued as reinvestment of distributions | | | 506,670 | | | | 7,488,587 | | | | 429,390 | | | | 4,152,611 | | | | 137,422 | | | | 1,386,984 | |
| | | | | | |
| Less shares redeemed | | | (2,764,474 | ) | | | (43,444,918 | ) | | | (2,487,651 | ) | | | (24,606,215 | ) | | | (1,854,902 | ) | | | (18,617,344 | ) |
| | | | |
| Net increase (decrease) | | | (1,249,824 | ) | | $ | (20,422,325 | ) | | | 620,439 | | | $ | 6,207,617 | | | | (524,431 | ) | | $ | (5,193,529 | ) |
| | | | |
| | | | | | |
| Class R(a) | | Shares | | | Dollars | | | Shares | | | Dollars | | | Shares | | | Dollars | |
| Shares sold | | | 61,091 | | | $ | 901,022 | | | | 5,432 | | | $ | 51,418 | | | | 25,219 | | | $ | 257,282 | |
| | | | | | |
| Shares issued as reinvestment of distributions | | | 28,155 | | | | 394,456 | | | | 5,692 | | | | 52,426 | | | | 162 | | | | 1,666 | |
| | | | | | |
| Less shares redeemed | | | (57,612 | ) | | | (838,534 | ) | | | (34,928 | ) | | | (335,371 | ) | | | (1,672 | ) | | | (17,048 | ) |
| | | | | | |
| Shares converted to class A | | | (368,961 | ) | | | (5,398,935 | ) | | | (106,802 | ) | | | (1,016,255 | ) | | | (61,421 | ) | | | (614,140 | ) |
| | | | |
| Net increase (decrease) | | | (337,327 | ) | | $ | (4,941,991 | ) | | | (130,606 | ) | | $ | (1,247,782 | ) | | | (37,712 | ) | | $ | (372,240 | ) |
| | | | |
| | | | | | |
| Class R6 | | Shares | | | Dollars | | | Shares | | | Dollars | | | Shares | | | Dollars | |
| Shares sold | | | — | | | $ | — | | | | — | | | $ | — | | | | — | | | $ | — | |
| | | | | | |
| Shares issued as reinvestment of distributions | | | — | | | | — | | | | — | | | | — | | | | — | | | | — | |
| | | | | | |
| Less shares redeemed | | | — | | | | — | | | | — | | | | — | | | | — | | | | — | |
| | | | |
| Net increase (decrease) | | | — | | | $ | — | | | | — | | | $ | — | | | | — | | | $ | — | |
| | | | |
| (a) | Class R shares were converted into Class A shares at the close of business on February 22, 2018. |
| | | | |
| 196 | | CALAMOS OPEN-END FAMILY OF FUNDS SEMIANNUAL REPORT | | |
Notes to Financial Statements (Unaudited)
| | | | | | | | | | | | | | | | |
| | | HIGH INCOME
OPPORTUNITIES FUND | | | SHORT-TERM
BOND FUND(b) | |
| Class A | | Shares | | | Dollars | | | Shares | | | Dollars | |
| Shares sold | | | 995,944 | | | $ | 8,579,913 | | | | 2,500 | | | $ | 25,000 | |
| | | | |
| Shares issued as reinvestment of distributions | | | 221,549 | | | | 1,906,178 | | | | 8 | | | | 81 | |
| | | | |
| Shares converted from class R | | | 13,166 | | | | 114,548 | | | | — | | | | — | |
| | | | |
| Less shares redeemed | | | (1,475,277 | ) | | | (12,733,842 | ) | | | — | | | | — | |
| | | | |
| Net increase (decrease) | | | (244,618 | ) | | $ | (2,133,203 | ) | | | 2,508 | | | $ | 25,081 | |
| | | | |
| | | | |
| Class C | | Shares | | | Dollars | | | Shares | | | Dollars | |
| Shares sold | | | 21,467 | | | $ | 198,026 | | | | — | | | $ | — | |
| | | | |
| Shares issued as reinvestment of distributions | | | 61,066 | | | | 553,202 | | | | — | | | | — | |
| | | | |
| Less shares redeemed | | | (401,593 | ) | | | (3,653,160 | ) | | | — | | | | — | |
| | | | |
| Net increase (decrease) | | | (319,060 | ) | | $ | (2,901,932 | ) | | | — | | | $ | — | |
| | | | |
| | | | |
| Class I | | Shares | | | Dollars | | | Shares | | | Dollars | |
| Shares sold | | | 348,933 | | | $ | 3,017,151 | | | | 3,015 | | | $ | 30,140 | |
| | | | |
| Shares acquired throughIn-Kind purchases | | | — | | | | — | | | | 1,507,400 | | | | 15,074,001 | |
| | | | |
| Shares issued as reinvestment of distributions | | | 55,269 | | | | 475,680 | | | | 5,418 | | | | 54,087 | |
| | | | |
| Less shares redeemed | | | (614,914 | ) | | | (5,339,800 | ) | | | (422 | ) | | | (4,205 | ) |
| | | | |
| Net increase (decrease) | | | (210,712 | ) | | $ | (1,846,969 | ) | | | 1,515,411 | | | $ | 15,154,023 | |
| | | | |
| | | | |
| Class R(a) | | Shares | | | Dollars | | | Shares | | | Dollars | |
| Shares sold | | | 646 | | | $ | 5,668 | | | | — | | | $ | — | |
| | | | |
| Shares issued as reinvestment of distributions | | | 174 | | | | 1,527 | | | | — | | | | — | |
| | | | |
| Less shares redeemed | | | (1,543 | ) | | | (13,638 | ) | | | — | | | | — | |
| | | | |
| Shares converted to class A | | | (13,211 | ) | | | (114,548 | ) | | | — | | | | — | |
| | | | |
| Net increase (decrease) | | | (13,934 | ) | | $ | (120,991 | ) | | | — | | | $ | — | |
| | | | |
| | | | |
| Class R6 | | Shares | | | Dollars | | | Shares | | | Dollars | |
| Shares sold | | | — | | | $ | — | | | | — | | | $ | — | |
| | | | |
| Shares issued as reinvestment of distributions | | | — | | | | — | | | | — | | | | — | |
| | | | |
| Less shares redeemed | | | — | | | | — | | | | — | | | | — | |
| | | | |
| Net increase (decrease) | | | — | | | $ | — | | | | — | | | $ | — | |
| | | | |
| (a) | Class R shares were converted into Class A shares at the close of business on February 22, 2018. |
| (b) | Short-Term Bond Fund commenced operations on September 19, 2018. |
Calamos Market Neutral Income Fund Financial Highlights
Selected data for a share outstanding throughout each period were as follows:
| | | | | | | | | | | | | | | | | | | | | | | | |
| | | CLASS A | |
| | | (Unaudited)
Six Months
Ended
April 30, | | | Year Ended October 31, | |
| | | 2019 | | | 2018 | | | 2017 | | | 2016 | | | 2015 | | | 2014 | |
| | | | | | |
Net asset value, beginning of period | | | $13.52 | | | | $13.41 | | | | $13.13 | | | | $13.08 | | | | $13.13 | | | | $13.09 | |
| | | | | | |
Income from investment operations: | | | | | | | | | | | | | | | | | | | | | | | | |
| | | | | | |
Net investment income (loss)(a) | | | 0.20 | | | | 0.30 | | | | 0.26 | | | | 0.25 | | | | 0.21 | | | | 0.15 | |
| | | | | | |
Net realized and unrealized gain (loss) | | | 0.06 | | | | 0.19 | | | | 0.35 | | | | 0.16 | | | | — | | | | 0.27 | |
| | | | | | |
Total from investment operations | | | 0.26 | | | | 0.49 | | | | 0.61 | | | | 0.41 | | | | 0.21 | | | | 0.42 | |
| | | | | | |
Distributions: | | | | | | | | | | | | | | | | | | | | | | | | |
| | | | | | |
Dividends from net investment income | | | (0.11 | ) | | | (0.16 | ) | | | (0.13 | ) | | | (0.16 | ) | | | (0.12 | ) | | | (0.12 | ) |
| | | | | | |
Dividends from net realized gains | | | (0.41 | ) | | | (0.22 | ) | | | (0.20 | ) | | | (0.20 | ) | | | (0.14 | ) | | | (0.26 | ) |
| | | | | | |
Total distributions | | | (0.52 | ) | | | (0.38 | ) | | | (0.33 | ) | | | (0.36 | ) | | | (0.26 | ) | | | (0.38 | ) |
| | | | | | |
Net asset value, end of period | | | $13.26 | | | | $13.52 | | | | $13.41 | | | | $13.13 | | | | $13.08 | | | | $13.13 | |
| | | | | | |
Ratios and supplemental data: | | | | | | | | | | | | | | | | | | | | | | | | |
| | | | | | |
Total return(b) | | | 2.06% | | | | 3.79% | | | | 4.74% | | | | 3.16% | | | | 1.60% | | | | 3.27% | |
| | | | | | |
Net assets, end of period (000) | | | $819,557 | | | | $743,925 | | | | $682,451 | | | | $970,737 | | | | $1,051,576 | | | | $1,351,641 | |
| | | | | | |
Ratio of net expenses to average net assets | | | 1.24% | (c)(d) | | | 1.25% | (e) | | | 1.28% | (f) | | | 1.22% | (g) | | | 1.23% | | | | 1.20% | |
| | | | | | |
Ratio of gross expenses to average net assets prior to expense reductions | | | 1.25% | (c) | | | 1.25% | | | | 1.28% | | | | 1.22% | | | | 1.23% | | | | 1.20% | |
| | | | | | |
Ratio of net investment income (loss) to average net assets | | | 3.00% | (c) | | | 2.26% | | | | 1.96% | | | | 1.91% | | | | 1.58% | | | | 1.17% | |
| | |
| | | (Unaudited)
Six Months
Ended
April 30, | | | Year Ended October 31, | |
| | | 2019 | | | 2018 | | | 2017 | | | 2016 | | | 2015 | | | 2014 | |
| | | | | | |
Portfolio turnover rate | | | 28.8% | | | | 66.8% | | | | 81.1% | | | | 37.5% | | | | 37.6% | | | | 70.5% | |
| |
| | | CLASS C | |
| | | (Unaudited)
Six Months
Ended
April 30, | | | Year Ended October 31, | |
| | | 2019 | | | 2018 | | | 2017 | | | 2016 | | | 2015 | | | 2014 | |
| | | | | | |
Net asset value, beginning of period | | | $13.73 | | | | $13.62 | | | | $13.33 | | | | $13.27 | | | | $13.32 | | | | $13.30 | |
| | | | | | |
Income from investment operations: | | | | | | | | | | | | | | | | | | | | | | | | |
| | | | | | |
Net investment income (loss)(a) | | | 0.17 | | | | 0.21 | | | | 0.16 | | | | 0.15 | | | | 0.11 | | | | 0.06 | |
| | | | | | |
Net realized and unrealized gain (loss) | | | 0.04 | | | | 0.19 | | | | 0.36 | | | | 0.17 | | | | 0.01 | | | | 0.26 | |
| | | | | | |
Total from investment operations | | | 0.21 | | | | 0.40 | | | | 0.52 | | | | 0.32 | | | | 0.12 | | | | 0.32 | |
| | | | | | |
Distributions: | | | | | | | | | | | | | | | | | | | | | | | | |
| | | | | | |
Dividends from net investment income | | | (0.05 | ) | | | (0.07 | ) | | | (0.03 | ) | | | (0.06 | ) | | | (0.03 | ) | | | (0.04 | ) |
| | | | | | |
Dividends from net realized gains | | | (0.41 | ) | | | (0.22 | ) | | | (0.20 | ) | | | (0.20 | ) | | | (0.14 | ) | | | (0.26 | ) |
| | | | | | |
Total distributions | | | (0.46 | ) | | | (0.29 | ) | | | (0.23 | ) | | | (0.26 | ) | | | (0.17 | ) | | | (0.30 | ) |
| | | | | | |
Net asset value, end of period | | | $13.48 | | | | $13.73 | | | | $13.62 | | | | $13.33 | | | | $13.27 | | | | $13.32 | |
| | | | | | |
Ratios and supplemental data: | | | | | | | | | | | | | | | | | | | | | | | | |
| | | | | | |
Total return(b) | | | 1.67% | | | | 3.03% | | | | 3.98% | | | | 2.41% | | | | 0.86% | | | | 2.40% | |
| | | | | | |
Net assets, end of period (000) | | | $268,756 | | | | $303,417 | | | | $282,115 | | | | $318,853 | | | | $339,054 | | | | $349,791 | |
| | | | | | |
Ratio of net expenses to average net assets | | | 1.99% | (c)(d) | | | 2.00% | (e) | | | 2.03% | (f) | | | 1.97% | (g) | | | 1.98% | | | | 1.95% | |
| | | | | | |
Ratio of gross expenses to average net assets prior to expense reductions | | | 1.99% | (c) | | | 2.00% | | | | 2.03% | | | | 1.97% | | | | 1.98% | | | | 1.95% | |
| | | | | | |
Ratio of net investment income (loss) to average net assets | | | 2.62% | (c) | | | 1.51% | | | | 1.22% | | | | 1.16% | | | | 0.83% | | | | 0.42% | |
| (a) | Net investment income (loss) allocated based on average shares method. |
| (b) | Total return measures net investment income (loss) and capital gain or loss from portfolio investments assuming reinvestment of dividends and capital gains distributions. Total return is not annualized for periods that are less than a full year, does not reflect the effect of sales charge for Class A shares nor the contingent deferred sales charge for Class C shares and does not reflect the deduction of taxes that a shareholder would pay on fund distributions or the redemption of fund shares. |
| (d) | Ratio of net expenses, excluding dividend expense on short positions, to average net assets was 1.04% and 1.79% for the period ended April 30, 2019. |
| (e) | Ratio of net expenses, excluding dividend expense on short positions, to average net assets was 1.07% and 1.81% for the year ended October 31, 2018. |
| (f) | Ratio of net expenses, excluding dividend expense on short positions, to average net assets was 1.08% and 1.83% for the year ended October 31, 2017. |
| (g) | Ratio of net expenses, excluding dividend expense on short positions, to average net assets was 1.08% and 1.84% for the year ended October 31, 2016. |
| | | | |
| 198 | | CALAMOS OPEN-END FAMILY OF FUNDS SEMIANNUAL REPORT | | |
Calamos Market Neutral Income Fund Financial Highlights
| | | | | | | | | | | | | | | | | | | | | | | | |
| | | CLASS I | |
| | | (Unaudited)
Six Months
Ended
April 30, | | | Year Ended October 31, | |
| | | 2019 | | | 2018 | | | 2017 | | | 2016 | | | 2015 | | | 2014 | |
| | | | | | |
Net asset value, beginning of period | | | $13.36 | | | | $13.26 | | | | $12.98 | | | | $12.94 | | | | $12.99 | | | | $12.97 | |
| | | | | | |
Income from investment operations: | | | | | | | | | | | | | | | | | | | | | | | | |
| | | | | | |
Net investment income (loss)(a) | | | 0.21 | | | | 0.33 | | | | 0.29 | | | | 0.27 | | | | 0.24 | | | | 0.18 | |
| | | | | | |
Net realized and unrealized gain (loss) | | | 0.05 | | | | 0.19 | | | | 0.36 | | | | 0.16 | | | | — | | | | 0.25 | |
| | | | | | |
Total from investment operations | | | 0.26 | | | | 0.52 | | | | 0.65 | | | | 0.43 | | | | 0.24 | | | | 0.43 | |
| | | | | | |
Distributions: | | | | | | | | | | | | | | | | | | | | | | | | |
| | | | | | |
Dividends from net investment income | | | (0.12 | ) | | | (0.20 | ) | | | (0.17 | ) | | | (0.19 | ) | | | (0.15 | ) | | | (0.15 | ) |
| | | | | | |
Dividends from net realized gains | | | (0.41 | ) | | | (0.22 | ) | | | (0.20 | ) | | | (0.20 | ) | | | (0.14 | ) | | | (0.26 | ) |
| | | | | | |
Total distributions | | | (0.53 | ) | | | (0.42 | ) | | | (0.37 | ) | | | (0.39 | ) | | | (0.29 | ) | | | (0.41 | ) |
| | | | | | |
Net asset value, end of period | | | $13.09 | | | | $13.36 | | | | $13.26 | | | | $12.98 | | | | $12.94 | | | | $12.99 | |
| | | | | | |
Ratios and supplemental data: | | | | | | | | | | | | | | | | | | | | | | | | |
| | | | | | |
Total return(b) | | | 2.20% | | | | 4.02% | | | | 5.07% | | | | 3.38% | | | | 1.89% | | | | 3.40% | |
| | | | | | |
Net assets, end of period (000) | | | $6,598,682 | | | | $5,658,499 | | | | $3,734,035 | | | | $2,587,922 | | | | $2,377,641 | | | | $2,470,829 | |
| | | | | | |
Ratio of net expenses to average net assets | | | 0.99% | (c)(d) | | | 0.99% | (e) | | | 1.02% | (f) | | | 0.97% | (g) | | | 0.98% | | | | 0.95% | |
| | | | | | |
Ratio of gross expenses to average net assets prior to expense reductions | | | 1.00% | (c) | | | 0.99% | | | | 1.02% | | | | 0.97% | | | | 0.98% | | | | 0.95% | |
| | | | | | |
Ratio of net investment income (loss) to average net assets | | | 3.24% | (c) | | | 2.49% | | | | 2.22% | | | | 2.15% | | | | 1.83% | | | | 1.41% | |
| (a) | Net investment income (loss) allocated based on average shares method. |
| (b) | Total return measures net investment income (loss) and capital gain or loss from portfolio investments assuming reinvestment of dividends and capital gains distributions. Total return is not annualized for periods that are less than a full year, does not reflect the effect of sales charge for Class A shares nor the contingent deferred sales charge for Class C shares and does not reflect the deduction of taxes that a shareholder would pay on fund distributions or the redemption of fund shares. |
| (d) | Ratio of net expenses, excluding dividend expense on short positions, to average net assets was 0.79% for the period ended April 30, 2019. |
| (e) | Ratio of net expenses, excluding dividend expense on short positions, to average net assets was 0.81% for the year ended October 31, 2018. |
| (f) | Ratio of net expenses, excluding dividend expense on short positions, to average net assets was 0.83% for the year ended October 31, 2017. |
| (g) | Ratio of net expenses, excluding dividend expense on short positions, to average net assets was 0.84% for the year ended October 31, 2016. |
Calamos Hedged Equity Fund Financial Highlights
Selected data for a share outstanding throughout each period were as follows:
| | | | | | | | | | | | | | | | | | | | |
| | | CLASS A | |
| | | (Unaudited)
Six Months
Ended
April 30, | | | Year Ended October 31, | | | December 31, 2014• through
October 31, | |
| | | 2019 | | | 2018 | | | 2017 | | | 2016 | | | 2015 | |
| | | | | |
Net asset value, beginning of period | | | $11.44 | | | | $10.85 | | | | $10.03 | | | | $10.00 | | | | $10.00 | |
| | | | | |
Income from investment operations: | | | | | | | | | | | | | | | | | | | | |
| | | | | |
Net investment income (loss)(a) | | | 0.05 | | | | 0.08 | | | | 0.12 | | | | 0.10 | | | | 0.06 | |
| | | | | |
Net realized and unrealized gain (loss) | | | 0.40 | | | | 0.57 | | | | 0.76 | | | | 0.17 | | | | 0.01 | |
| | | | | |
Total from investment operations | | | 0.45 | | | | 0.65 | | | | 0.88 | | | | 0.27 | | | | 0.07 | |
| | | | | |
Distributions: | | | | | | | | | | | | | | | | | | | | |
| | | | | |
Dividends from net investment income | | | (0.01 | ) | | | (0.06 | ) | | | (0.06 | ) | | | (0.15 | ) | | | (0.07 | ) |
| | | | | |
Dividends from net realized gains | | | (0.25 | ) | | | — | | | | — | | | | (0.09 | ) | | | — | |
| | | | | |
Total distributions | | | (0.26 | ) | | | (0.06 | ) | | | (0.06 | ) | | | (0.24 | ) | | | (0.07 | ) |
| | | | | |
Net asset value, end of period | | | $11.63 | | | | $11.44 | | | | $10.85 | | | | $10.03 | | | | $10.00 | |
| | | | | |
Ratios and supplemental data: | | | | | | | | | | | | | | | | | | | | |
| | | | | |
Total return(b) | | | 4.07% | | | | 6.08% | | | | 8.77% | | | | 2.79% | | | | 0.67% | |
| | | | | |
Net assets, end of period (000) | | | $6,783 | | | | $5,151 | | | | $1,007 | | | | $10,275 | | | | $5,661 | |
| | | | | |
Ratio of net expenses to average net assets | | | 1.23% | (c) | | | 1.25% | | | | 1.25% | | | | 1.22% | | | | 1.25% | (c) |
| | | | | |
Ratio of gross expenses to average net assets prior to expense reductions | | | 1.23% | (c) | | | 1.47% | | | | 2.14% | | | | 2.03% | | | | 3.05% | (c) |
| | | | | |
Ratio of net investment income (loss) to average net assets | | | 0.87% | (c) | | | 0.65% | | | | 1.12% | | | | 1.01% | | | | 0.78% | (c) |
| | | |
| | | (Unaudited)
Six Months
Ended
April 30, | | | Year Ended October 31, | | | December 31, 2014•
through
October 31, | |
| | | 2019 | | | 2018 | | | 2017 | | | 2016 | | | 2015 | |
| | | | | |
Portfolio turnover rate | | | 57.6% | | | | 140.8% | | | | 49.2% | | | | 19.6% | | | | 29.4% | |
| |
| | | CLASS C | |
| | | (Unaudited)
Six Months
Ended
April 30, | | | Year Ended October 31, | | | December 31, 2014•
through October 31, | |
| | | 2019 | | | 2018 | | | 2017 | | | 2016 | | | 2015 | |
| | | | | |
Net asset value, beginning of period | | | $11.35 | | | | $10.78 | | | | $10.00 | | | | $9.98 | | | | $10.00 | |
| | | | | |
Income from investment operations: | | | | | | | | | | | | | | | | | | | | |
| | | | | |
Net investment income (loss)(a) | | | 0.00 | * | | | (0.01 | ) | | | 0.02 | | | | 0.03 | | | | 0.00 | * |
| | | | | |
Net realized and unrealized gain (loss) | | | 0.40 | | | | 0.58 | | | | 0.79 | | | | 0.16 | | | | 0.01 | |
| | | | | |
Total from investment operations | | | 0.40 | | | | 0.57 | | | | 0.81 | | | | 0.19 | | | | 0.01 | |
| | | | | |
Distributions: | | | | | | | | | | | | | | | | | | | | |
| | | | | |
Dividends from net investment income | | | (0.01 | ) | | | (0.00 | )* | | | (0.03 | ) | | | (0.08 | ) | | | (0.03 | ) |
| | | | | |
Dividends from net realized gains | | | (0.25 | ) | | | — | | | | — | | | | (0.09 | ) | | | — | |
| | | | | |
Total distributions | | | (0.26 | ) | | | (0.00 | )* | | | (0.03 | ) | | | (0.17 | ) | | | (0.03 | ) |
| | | | | |
Net asset value, end of period | | | $11.49 | | | | $11.35 | | | | $10.78 | | | | $10.00 | | | | $9.98 | |
| | | | | |
Ratios and supplemental data: | | | | | | | | | | | | | | | | | | | | |
| | | | | |
Total return(b) | | | 3.72% | | | | 5.31% | | | | 8.09% | | | | 1.92% | | | | 0.09% | |
| | | | | |
Net assets, end of period (000) | | | $1,933 | | | | $616 | | | | $173 | | | | $156 | | | | $100 | |
| | | | | |
Ratio of net expenses to average net assets | | | 1.97% | (c) | | | 2.00% | | | | 2.00% | | | | 1.97% | | | | 2.00% | (c) |
| | | | | |
Ratio of gross expenses to average net assets prior to expense reductions | | | 1.97% | (c) | | | 2.30% | | | | 3.03% | | | | 2.79% | | | | 3.79% | (c) |
| | | | | |
Ratio of net investment income (loss) to average net assets | | | 0.04% | (c) | | | (0.07% | ) | | | 0.24% | | | | 0.26% | | | | 0.03% | (c) |
| • | Commencement of operations. |
| * | Amounts are less than $0.005. |
| (a) | Net investment income (loss) allocated based on average shares method. |
| (b) | Total return measures net investment income (loss) and capital gain or loss from portfolio investments assuming reinvestment of dividends and capital gains distributions. Total return is not annualized for periods that are less than a full year, does not reflect the effect of sales charge for Class A shares nor the contingent deferred sales charge for Class C shares and does not reflect the deduction of taxes that a shareholder would pay on fund distributions or the redemption of fund shares. |
| | | | |
| 200 | | CALAMOS OPEN-END FAMILY OF FUNDS SEMIANNUAL REPORT | | |
Calamos Hedged Equity Fund Financial Highlights
| | | | | | | | | | | | | | | | | | | | |
| | | CLASS I | |
| | | (Unaudited)
Six Months
Ended
April 30, | | | Year Ended October 31, | | | December 31, 2014• through October 31, | |
| | | 2019 | | | 2018 | | | 2017 | | | 2016 | | | 2015 | |
| | | | | |
Net asset value, beginning of period | | | $11.45 | | | | $10.84 | | | | $10.04 | | | | $10.01 | | | | $10.00 | |
| | | | | |
Income from investment operations: | | | | | | | | | | | | | | | | | | | | |
| | | | | |
Net investment income (loss)(a) | | | 0.06 | | | | 0.10 | | | | 0.13 | | | | 0.13 | | | | 0.09 | |
| | | | | |
Net realized and unrealized gain (loss) | | | 0.41 | | | | 0.59 | | | | 0.78 | | | | 0.17 | | | | — | |
| | | | | |
Total from investment operations | | | 0.47 | | | | 0.69 | | | | 0.91 | | | | 0.30 | | | | 0.09 | |
| | | | | |
Distributions: | | | | | | | | | | | | | | | | | | | | |
| | | | | |
Dividends from net investment income | | | (0.05 | ) | | | (0.08 | ) | | | (0.11 | ) | | | (0.18 | ) | | | (0.08 | ) |
| | | | | |
Dividends from net realized gains | | | (0.25 | ) | | | — | | | | — | | | | (0.09 | ) | | | — | |
| | | | | |
Total distributions | | | (0.30 | ) | | | (0.08 | ) | | | (0.11 | ) | | | (0.27 | ) | | | (0.08 | ) |
| | | | | |
Net asset value, end of period | | | $11.62 | | | | $11.45 | | | | $10.84 | | | | $10.04 | | | | $10.01 | |
| | | | | |
Ratios and supplemental data: | | | | | | | | | | | | | | | | | | | | |
| | | | | |
Total return(b) | | | 4.32% | | | | 6.38% | | | | 9.12% | | | | 3.02% | | | | 0.89% | |
| | | | | |
Net assets, end of period (000) | | | $166,431 | | | | $91,589 | | | | $11,883 | | | | $8,035 | | | | $5,527 | |
| | | | | |
Ratio of net expenses to average net assets | | | 0.97% | (c) | | | 1.00% | | | | 1.00% | | | | 0.97% | | | | 1.00% | (c) |
| | | | | |
Ratio of gross expenses to average net assets prior to expense reductions | | | 0.97% | (c) | | | 1.26% | | | | 2.06% | | | | 1.81% | | | | 2.80% | (c) |
| | | | | |
Ratio of net investment income (loss) to average net assets | | | 1.13% | (c) | | | 0.91% | | | | 1.22% | | | | 1.27% | | | | 1.03% | (c) |
| • | Commencement of operations. |
| (a) | Net investment income (loss) allocated based on average shares method. |
| (b) | Total return measures net investment income (loss) and capital gain or loss from portfolio investments assuming reinvestment of dividends and capital gains distributions. Total return is not annualized for periods that are less than a full year, does not reflect the effect of sales charge for Class A shares nor the contingent deferred sales charge for Class C shares and does not reflect the deduction of taxes that a shareholder would pay on fund distributions or the redemption of fund shares. |
Calamos Phineus Long/Short Fund Financial Highlights
Selected data for a share outstanding throughout each period were as follows:
| | | | | | | | | | | | | | | | |
| | | CLASS A | |
| | | (Unaudited)
Six Months
Ended
April 30, | | | Year Ended October 31, | | | April 5, 2016• through
October 31, | |
| | | 2019 | | | 2018 | | | 2017 | | | 2016 | |
| | | | |
Net asset value, beginning of period | | | $12.15 | | | | $12.33 | | | | $10.77 | | | | $10.00 | |
| | | | |
Income from investment operations: | | | | | | | | | | | | | | | | |
| | | | |
Net investment income (loss)(a) | | | 0.01 | | | | (0.03 | ) | | | (0.16 | ) | | | (0.10 | ) |
| | | | |
Net realized and unrealized gain (loss) | | | 0.10 | | | | — | | | | 1.82 | | | | 0.87 | |
| | | | |
Total from investment operations | | | 0.11 | | | | (0.03 | ) | | | 1.66 | | | | 0.77 | |
| | | | |
Distributions: | | | | | | | | | | | | | | | | |
| | | | |
Dividends from net investment income | | | — | | | | — | | | | — | | | | — | |
| | | | |
Dividends from net realized gains | | | (0.44 | ) | | | (0.15 | ) | | | (0.10 | ) | | | — | |
| | | | |
Total distributions | | | (0.44 | ) | | | (0.15 | ) | | | (0.10 | ) | | | — | |
| | | | |
Net asset value, end of period | | | $11.82 | | | | $12.15 | | | | $12.33 | | | | $10.77 | |
| | | | |
Ratios and supplemental data: | | | | | | | | | | | | | | | | |
| | | | |
Total return(b) | | | 1.18% | | | | (0.34% | ) | | | 15.46% | | | | 7.70% | |
| | | | |
Net assets, end of period (000) | | | $94,447 | | | | $108,730 | | | | $66,854 | | | | $14,708 | |
| | | | |
Ratio of net expenses to average net assets | | | 2.64% | (c)(d) | | | 2.28% | (e) | | | 2.71% | (f) | | | 2.99% | (c)(g) |
| | | | |
Ratio of gross expenses to average net assets prior to expense reductions | | | 2.65% | (c) | | | 2.28% | | | | 2.71% | | | | 4.04% | (c) |
| | | | |
Ratio of net investment income (loss) to average net assets | | | 0.24% | (c) | | | (0.27% | ) | | | (1.34% | ) | | | (1.77% | )(c) |
| | | |
| | | (Unaudited)
Six Months
Ended
April 30, | | | Year Ended October 31, | | | April 5, 2016• through
October 31, | |
| | | 2019 | | | 2018 | | | 2017 | | | 2016 | |
| | | | |
Portfolio turnover rate | | | 87.5% | | | | 228.6% | | | | 167.8% | | | | 177.6% | |
| |
| | | CLASS C | |
| | | (Unaudited)
Six Months
Ended
April 30, | | | Year Ended October 31, | | | April 5, 2016• through October 31, | |
| | | 2019 | | | 2018 | | | 2017 | | | 2016 | |
| | | | |
Net asset value, beginning of period | | | $11.92 | | | | $12.19 | | | | $10.73 | | | | $10.00 | |
| | | | |
Income from investment operations: | | | | | | | | | | | | | | | | |
| | | | |
Net investment income (loss)(a) | | | (0.03 | ) | | | (0.13 | ) | | | (0.25 | ) | | | (0.15 | ) |
| | | | |
Net realized and unrealized gain (loss) | | | 0.09 | | | | 0.01 | | | | 1.81 | | | | 0.88 | |
| | | | |
Total from investment operations | | | 0.06 | | | | (0.12 | ) | | | 1.56 | | | | 0.73 | |
| | | | |
Distributions: | | | | | | | | | | | | | | | | |
| | | | |
Dividends from net investment income | | | — | | | | — | | | | — | | | | — | |
| | | | |
Dividends from net realized gains | | | (0.44 | ) | | | (0.15 | ) | | | (0.10 | ) | | | — | |
| | | | |
Total distributions | | | (0.44 | ) | | | (0.15 | ) | | | (0.10 | ) | | | — | |
| | | | |
Net asset value, end of period | | | $11.54 | | | | $11.92 | | | | $12.19 | | | | $10.73 | |
| | | | |
Ratios and supplemental data: | | | | | | | | | | | | | | | | |
| | | | |
Total return(b) | | | 0.77% | | | | (1.09% | ) | | | 14.58% | | | | 7.30% | |
| | | | |
Net assets, end of period (000) | | | $46,252 | | | | $52,169 | | | | $28,933 | | | | $4,936 | |
| | | | |
Ratio of net expenses to average net assets | | | 3.39% | (c)(d) | | | 3.03% | (e) | | | 3.46% | (f) | | | 3.69% | (c)(g) |
| | | | |
Ratio of gross expenses to average net assets prior to expense reductions | | | 3.40% | (c) | | | 3.03% | | | | 3.46% | | | | 4.82% | (c) |
| | | | |
Ratio of net investment income (loss) to average net assets | | | (0.51% | )(c) | | | (1.02% | ) | | | (2.11% | ) | | | (2.54% | )(c) |
| • | Commencement of operations. |
| (a) | Net investment income (loss) allocated based on average shares method. |
| (b) | Total return measures net investment income (loss) and capital gain or loss from portfolio investments assuming reinvestment of dividends and capital gains distributions. Total return is not annualized for periods that are less than a full year, does not reflect the effect of sales charge for Class A shares nor the contingent deferred sales charge for Class C shares and does not reflect the deduction of taxes that a shareholder would pay on fund distributions or the redemption of fund shares. |
| (d) | Ratio of net expenses, excluding dividend expense on short positions, to average net assets was 1.65% and 2.40% for the period ended April 30, 2019. |
| (e) | Ratio of net expenses, excluding dividend expense on short positions, to average net assets was 1.64% and 2.39% for the year ended October 31, 2018. |
| (f) | Ratio of net expenses, excluding dividend expense on short positions, to average net assets was 1.73% and 2.47% for the year ended October 31, 2017. |
| (g) | Ratio of net expenses, excluding dividend expense on short positions, to average net assets was 2.01% and 2.67% for the period ended October 31, 2016. |
| | | | |
| 202 | | CALAMOS OPEN-END FAMILY OF FUNDS SEMIANNUAL REPORT | | |
Calamos Phineus Long/Short Fund Financial Highlights
| | | | | | | | | | | | | | | | |
| | | CLASS I | |
| | | (Unaudited)
Six Months
Ended
April 30, | | | Year Ended October 31, | | | April 5, 2016• through October 31, | |
| | | 2019 | | | 2018 | | | 2017 | | | 2016 | |
| | | | |
Net asset value, beginning of period | | | $12.23 | | | | $12.39 | | | | $10.80 | | | | $10.00 | |
| | | | |
Income from investment operations: | | | | | | | | | | | | | | | | |
| | | | |
Net investment income (loss)(a) | | | 0.03 | | | | 0.01 | | | | (0.13 | ) | | | (0.08 | ) |
| | | | |
Net realized and unrealized gain (loss) | | | 0.10 | | | | (0.02 | ) | | | 1.82 | | | | 0.88 | |
| | | | |
Total from investment operations | | | 0.13 | | | | (0.01 | ) | | | 1.69 | | | | 0.80 | |
| | | | |
Distributions: | | | | | | | | | | | | | | | | |
| | | | |
Dividends from net investment income | | | (0.00 | )* | | | — | | | | — | | | | — | |
| | | | |
Dividends from net realized gains | | | (0.44 | ) | | | (0.15 | ) | | | (0.10 | ) | | | — | |
| | | | |
Total distributions | | | (0.44 | ) | | | (0.15 | ) | | | (0.10 | ) | | | — | |
| | | | |
Net asset value, end of period | | | $11.92 | | | | $12.23 | | | | $12.39 | | | | $10.80 | |
| | | | |
Ratios and supplemental data: | | | | | | | | | | | | | | | | |
| | | | |
Total return(b) | | | 1.28% | | | | (0.10% | ) | | | 15.70% | | | | 8.00% | |
| | | | |
Net assets, end of period (000) | | | $800,705 | | | | $1,003,457 | | | | $348,840 | | | | $56,319 | |
| | | | |
Ratio of net expenses to average net assets | | | 2.38% | (c)(d) | | | 2.00% | (e) | | | 2.45% | (f) | | | 2.77% | (c)(g) |
| | | | |
Ratio of gross expenses to average net assets prior to expense reductions | | | 2.39% | (c) | | | 2.00% | | | | 2.45% | | | | 4.04% | (c) |
| | | | |
Ratio of net investment income (loss) to average net assets | | | 0.47% | (c) | | | 0.05% | | | | (1.09% | ) | | | (1.33% | )(c) |
| • | Commencement of operations. |
| * | Amounts are less than $0.005. |
| (a) | Net investment income (loss) allocated based on average shares method. |
| (b) | Total return measures net investment income (loss) and capital gain or loss from portfolio investments assuming reinvestment of dividends and capital gains distributions. Total return is not annualized for periods that are less than a full year, does not reflect the effect of sales charge for Class A shares nor the contingent deferred sales charge for Class C shares and does not reflect the deduction of taxes that a shareholder would pay on fund distributions or the redemption of fund shares. |
| (d) | Ratio of net expenses, excluding dividend expense on short positions, to average net assets was 1.40% for the period ended April 30, 2019. |
| (e) | Ratio of net expenses, excluding dividend expense on short positions, to average net assets was 1.39% for the year ended October 31, 2018. |
| (f) | Ratio of net expenses, excluding dividend expense on short positions, to average net assets was 1.47% for the year ended October 31, 2017. |
| (g) | Ratio of net expenses, excluding dividend expense on short positions, to average net assets was 1.76% for the period ended October 31, 2016. |
Calamos Convertible Fund Financial Highlights
Selected data for a share outstanding throughout each period were as follows:
| | | | | | | | | | | | | | | | | | | | | | | | |
| | | CLASS A | |
| | | (Unaudited)
Six Months
Ended
April 30, | | | Year Ended October 31, | |
| | | 2019 | | | 2018 | | | 2017 | | | 2016 | | | 2015 | | | 2014 | |
| | | | | | |
Net asset value, beginning of period | | | $18.11 | | | | $18.27 | | | | $15.93 | | | | $16.56 | | | | $18.59 | | | | $19.14 | |
| | | | | | |
Income from investment operations: | | | | | | | | | | | | | | | | | | | | | | | | |
| | | | | | |
Net investment income (loss)(a) | | | 0.24 | | | | 0.48 | | | | 0.49 | | | | 0.50 | | | | 0.44 | | | | 0.40 | |
| | | | | | |
Net realized and unrealized gain (loss) | | | 0.98 | | | | 0.13 | | | | 2.16 | | | | (0.30 | ) | | | (1.01 | ) | | | 1.14 | |
| | | | | | |
Total from investment operations | | | 1.22 | | | | 0.61 | | | | 2.65 | | | | 0.20 | | | | (0.57 | ) | | | 1.54 | |
| | | | | | |
Distributions: | | | | | | | | | | | | | | | | | | | | | | | | |
| | | | | | |
Dividends from net investment income | | | (0.27 | ) | | | (0.24 | ) | | | (0.31 | ) | | | (0.56 | ) | | | (0.58 | ) | | | (0.76 | ) |
| | | | | | |
Dividends from net realized gains | | | (1.82 | ) | | | (0.53 | ) | | | — | | | | (0.27 | ) | | | (0.88 | ) | | | (1.33 | ) |
| | | | | | |
Total distributions | | | (2.09 | ) | | | (0.77 | ) | | | (0.31 | ) | | | (0.83 | ) | | | (1.46 | ) | | | (2.09 | ) |
| | | | | | |
Net asset value, end of period | | | $17.24 | | | | $18.11 | | | | $18.27 | | | | $15.93 | | | | $16.56 | | | | $18.59 | |
| | | | | | |
Ratios and supplemental data: | | | | | | | | | | | | | | | | | | | | | | | | |
| | | | | | |
Total return(b) | | | 8.20% | | | | 3.43% | | | | 16.88% | | | | 1.33% | | | | (3.31% | ) | | | 8.74% | |
| | | | | | |
Net assets, end of period (000) | | | $254,453 | | | | $210,845 | | | | $222,017 | | | | $228,334 | | | | $385,844 | | | | $488,842 | |
| | | | | | |
Ratio of net expenses to average net assets | | | 1.15% | (c) | | | 1.16% | | | | 1.18% | | | | 1.15% | | | | 1.13% | | | | 1.10% | |
| | | | | | |
Ratio of gross expenses to average net assets prior to expense reductions | | | 1.15% | (c) | | | 1.16% | | | | 1.18% | | | | 1.15% | | | | 1.13% | | | | 1.10% | |
| | | | | | |
Ratio of net investment income (loss) to average net assets | | | 2.91% | (c) | | | 2.58% | | | | 2.87% | | | | 3.17% | | | | 2.53% | | | | 2.18% | |
| | |
| | | (Unaudited)
Six Months
Ended
April 30, | | | Year Ended October 31, | |
| | | 2019 | | | 2018 | | | 2017 | | | 2016 | | | 2015 | | | 2014 | |
| | | | | | |
Portfolio turnover rate | | | 19.8% | | | | 73.2% | | | | 55.7% | | | | 43.8% | | | | 63.0% | | | | 68.1% | |
| |
| | | CLASS C | |
| | | (Unaudited)
Six Months
Ended
April 30, | | | Year Ended October 31, | |
| | | 2019 | | | 2018 | | | 2017 | | | 2016 | | | 2015 | | | 2014 | |
| | | | | | |
Net asset value, beginning of period | | | $17.92 | | | | $18.09 | | | | $15.79 | | | | $16.41 | | | | $18.43 | | | | $18.87 | |
| | | | | | |
Income from investment operations: | | | | | | | | | | | | | | | | | | | | | | | | |
| | | | | | |
Net investment income (loss)(a) | | | 0.18 | | | | 0.34 | | | | 0.36 | | | | 0.37 | | | | 0.31 | | | | 0.26 | |
| | | | | | |
Net realized and unrealized gain (loss) | | | 0.97 | | | | 0.12 | | | | 2.14 | | | | (0.28 | ) | | | (1.00 | ) | | | 1.11 | |
| | | | | | |
Total from investment operations | | | 1.15 | | | | 0.46 | | | | 2.50 | | | | 0.09 | | | | (0.69 | ) | | | 1.37 | |
| | | | | | |
Distributions: | | | | | | | | | | | | | | | | | | | | | | | | |
| | | | | | |
Dividends from net investment income | | | (0.19 | ) | | | (0.10 | ) | | | (0.20 | ) | | | (0.44 | ) | | | (0.45 | ) | | | (0.48 | ) |
| | | | | | |
Dividends from net realized gains | | | (1.82 | ) | | | (0.53 | ) | | | — | | | | (0.27 | ) | | | (0.88 | ) | | | (1.33 | ) |
| | | | | | |
Total distributions | | | (2.01 | ) | | | (0.63 | ) | | | (0.20 | ) | | | (0.71 | ) | | | (1.33 | ) | | | (1.81 | ) |
| | | | | | |
Net asset value, end of period | | | $17.06 | | | | $17.92 | | | | $18.09 | | | | $15.79 | | | | $16.41 | | | | $18.43 | |
| | | | | | |
Ratios and supplemental data: | | | | | | | | | | | | | | | | | | | | | | | | |
| | | | | | |
Total return(b) | | | 7.80% | | | | 2.65% | | | | 15.99% | | | | 0.62% | | | | (4.01% | ) | | | 7.86% | |
| | | | | | |
Net assets, end of period (000) | | | $72,467 | | | | $128,920 | | | | $147,112 | | | | $193,339 | | | | $265,686 | | | | $319,654 | |
| | | | | | |
Ratio of net expenses to average net assets | | | 1.90% | (c) | | | 1.91% | | | | 1.93% | | | | 1.90% | | | | 1.88% | | | | 1.86% | |
| | | | | | |
Ratio of gross expenses to average net assets prior to expense reductions | | | 1.90% | (c) | | | 1.91% | | | | 1.93% | | | | 1.90% | | | | 1.88% | | | | 1.86% | |
| | | | | | |
Ratio of net investment income (loss) to average net assets | | | 2.20% | (c) | | | 1.85% | | | | 2.14% | | | | 2.40% | | | | 1.78% | | | | 1.43% | |
| (a) | Net investment income (loss) allocated based on average shares method. |
| (b) | Total return measures net investment income (loss) and capital gain or loss from portfolio investments assuming reinvestment of dividends and capital gains distributions. Total return is not annualized for periods that are less than a full year, does not reflect the effect of sales charge for Class A shares nor the contingent deferred sales charge for Class C shares and does not reflect the deduction of taxes that a shareholder would pay on fund distributions or the redemption of fund shares. |
| | | | |
| 204 | | CALAMOS OPEN-END FAMILY OF FUNDS SEMIANNUAL REPORT | | |
Calamos Convertible Fund Financial Highlights
| | | | | | | | | | | | | | | | | | | | | | | | |
| | | CLASS I | |
| | | (Unaudited)
Six Months
Ended
April 30, | | | Year Ended October 31, | |
| | | 2019 | | | 2018 | | | 2017 | | | 2016 | | | 2015 | | | 2014 | |
| | | | | | |
Net asset value, beginning of period | | | $16.23 | | | | $16.45 | | | | $14.38 | | | | $15.03 | | | | $17.02 | | | | $17.74 | |
| | | | | | |
Income from investment operations: | | | | | | | | | | | | | | | | | | | | | | | | |
| | | | | | |
Net investment income (loss)(a) | | | 0.23 | | | | 0.47 | | | | 0.48 | | | | 0.49 | | | | 0.44 | | | | 0.41 | |
| | | | | | |
Net realized and unrealized gain (loss) | | | 0.85 | | | | 0.13 | | | | 1.95 | | | | (0.27 | ) | | | (0.93 | ) | | | 1.04 | |
| | | | | | |
Total from investment operations | | | 1.08 | | | | 0.60 | | | | 2.43 | | | | 0.22 | | | | (0.49 | ) | | | 1.45 | |
| | | | | | |
Distributions: | | | | | | | | | | | | | | | | | | | | | | | | |
| | | | | | |
Dividends from net investment income | | | (0.29 | ) | | | (0.29 | ) | | | (0.36 | ) | | | (0.60 | ) | | | (0.62 | ) | | | (0.84 | ) |
| | | | | | |
Dividends from net realized gains | | | (1.82 | ) | | | (0.53 | ) | | | — | | | | (0.27 | ) | | | (0.88 | ) | | | (1.33 | ) |
| | | | | | |
Total distributions | | | (2.11 | ) | | | (0.82 | ) | | | (0.36 | ) | | | (0.87 | ) | | | (1.50 | ) | | | (2.17 | ) |
| | | | | | |
Net asset value, end of period | | | $15.20 | | | | $16.23 | | | | $16.45 | | | | $14.38 | | | | $15.03 | | | | $17.02 | |
| | | | | | |
Ratios and supplemental data: | | | | | | | | | | | | | | | | | | | | | | | | |
| | | | | | |
Total return(b) | | | 8.30% | | | | 3.73% | | | | 17.14% | | | | 1.64% | | | | (3.11% | ) | | | 8.99% | |
| | | | | | |
Net assets, end of period (000) | | | $374,991 | | | | $275,776 | | | | $233,077 | | | | $238,309 | | | | $455,702 | | | | $553,594 | |
| | | | | | |
Ratio of net expenses to average net assets | | | 0.90% | (c) | | | 0.91% | | | | 0.93% | | | | 0.90% | | | | 0.88% | | | | 0.85% | |
| | | | | | |
Ratio of gross expenses to average net assets prior to expense reductions | | | 0.90% | (c) | | | 0.91% | | | | 0.93% | | | | 0.90% | | | | 0.88% | | | | 0.85% | |
| | | | | | |
Ratio of net investment income (loss) to average net assets | | | 3.16% | (c) | | | 2.83% | | | | 3.12% | | | | 3.48% | | | | 2.77% | | | | 2.46% | |
| (a) | Net investment income (loss) allocated based on average shares method. |
| (b) | Total return measures net investment income (loss) and capital gain or loss from portfolio investments assuming reinvestment of dividends and capital gains distributions. Total return is not annualized for periods that are less than a full year, does not reflect the effect of sales charge for Class A shares nor the contingent deferred sales charge for Class C shares and does not reflect the deduction of taxes that a shareholder would pay on fund distributions or the redemption of fund shares. |
Calamos Global Convertible Fund Financial Highlights
Selected data for a share outstanding throughout each period were as follows:
| | | | | | | | | | | | | | | | | | | | |
| | | CLASS A | |
| | | (Unaudited)
Six Months
Ended
April 30, | | | Year Ended October 31, | | | December 31, 2014•
through October 31, | |
| | | 2019 | | | 2018 | | | 2017 | | | 2016 | | | 2015 | |
| | | | | |
Net asset value, beginning of period | | | $10.81 | | | | $11.24 | | | | $9.89 | | | | $9.93 | | | | $10.00 | |
| | | | | |
Income from investment operations: | | | | | | | | | | | | | | | | | | | | |
| | | | | |
Net investment income (loss)(a) | | | 0.28 | | | | 0.33 | | | | 0.25 | | | | 0.26 | | | | 0.13 | |
| | | | | |
Net realized and unrealized gain (loss) | | | 0.30 | | | | (0.34 | ) | | | 1.21 | | | | (0.14 | ) | | | (0.13 | ) |
| | | | | |
Total from investment operations | | | 0.58 | | | | (0.01 | ) | | | 1.46 | | | | 0.12 | | | | — | |
| | | | | |
Distributions: | | | | | | | | | | | | | | | | | | | | |
| | | | | |
Dividends from net investment income | | | (0.17 | ) | | | (0.08 | ) | | | (0.11 | ) | | | (0.16 | ) | | | (0.07 | ) |
| | | | | |
Dividends from net realized gains | | | (0.31 | ) | | | (0.34 | ) | | | — | | | | — | | | | — | |
| | | | | |
Total distributions | | | (0.48 | ) | | | (0.42 | ) | | | (0.11 | ) | | | (0.16 | ) | | | (0.07 | ) |
| | | | | |
Net asset value, end of period | | | $10.91 | | | | $10.81 | | | | $11.24 | | | | $9.89 | | | | $9.93 | |
| | | | | |
Ratios and supplemental data: | | | | | | | | | | | | | | | | | | | | |
| | | | | |
Total return(b) | | | 5.81% | | | | (0.09% | ) | | | 14.86% | | | | 1.27% | | | | —% | |
| | | | | |
Net assets, end of period (000) | | | $11,481 | | | | $11,184 | | | | $12,713 | | | | $29,037 | | | | $20,550 | |
| | | | | |
Ratio of net expenses to average net assets | | | 1.33% | (c) | | | 1.34% | | | | 1.35% | | | | 1.35% | | | | 1.35% | (c) |
| | | | | |
Ratio of gross expenses to average net assets prior to expense reductions | | | 1.33% | (c) | | | 1.35% | | | | 1.45% | | | | 1.46% | | | | 2.30% | (c) |
| | | | | |
Ratio of net investment income (loss) to average net assets | | | 5.35% | (c) | | | 2.98% | | | | 2.46% | | | | 2.64% | | | | 1.56% | (c) |
| | | |
| | | (Unaudited)
Six Months
Ended
April 30, | | | Year Ended October 31, | | | December 31, 2014•
through October 31, | |
| | | 2019 | | | 2018 | | | 2017 | | | 2016 | | | 2015 | |
| | | | | |
Portfolio turnover rate | | | 20.5% | | | | 32.0% | | | | 52.2% | | | | 38.4% | | | | 28.2% | |
| |
| | | CLASS C | |
| | | (Unaudited)
Six Months
Ended
April 30, | | | Year Ended October 31, | | | December 31, 2014• through October 31, | |
| | | 2019 | | | 2018 | | | 2017 | | | 2016 | | | 2015 | |
| | | | | |
Net asset value, beginning of period | | | $10.69 | | | | $11.14 | | | | $9.85 | | | | $9.90 | | | | $10.00 | |
| | | | | |
Income from investment operations: | | | | | | | | | | | | | | | | | | | | |
| | | | | |
Net investment income (loss)(a) | | | 0.24 | | | | 0.24 | | | | 0.16 | | | | 0.18 | | | | 0.07 | |
| | | | | |
Net realized and unrealized gain (loss) | | | 0.30 | | | | (0.33 | ) | | | 1.21 | | | | (0.13 | ) | | | (0.12 | ) |
| | | | | |
Total from investment operations | | | 0.54 | | | | (0.09 | ) | | | 1.37 | | | | 0.05 | | | | (0.05 | ) |
| | | | | |
Distributions: | | | | | | | | | | | | | | | | | | | | |
| | | | | |
Dividends from net investment income | | | (0.14 | ) | | | (0.02 | ) | | | (0.08 | ) | | | (0.10 | ) | | | (0.05 | ) |
| | | | | |
Dividends from net realized gains | | | (0.31 | ) | | | (0.34 | ) | | | — | | | | — | | | | — | |
| | | | | |
Total distributions | | | (0.45 | ) | | | (0.36 | ) | | | (0.08 | ) | | | (0.10 | ) | | | (0.05 | ) |
| | | | | |
Net asset value, end of period | | | $10.78 | | | | $10.69 | | | | $11.14 | | | | $9.85 | | | | $9.90 | |
| | | | | |
Ratios and supplemental data: | | | | | | | | | | | | | | | | | | | | |
| | | | | |
Total return(b) | | | 5.39% | | | | (0.77% | ) | | | 13.95% | | | | 0.50% | | | | (0.52% | ) |
| | | | | |
Net assets, end of period (000) | | | $3,651 | | | | $3,884 | | | | $2,887 | | | | $2,440 | | | | $1,259 | |
| | | | | |
Ratio of net expenses to average net assets | | | 2.08% | (c) | | | 2.09% | | | | 2.10% | | | | 2.10% | | | | 2.10% | (c) |
| | | | | |
Ratio of gross expenses to average net assets prior to expense reductions | | | 2.08% | (c) | | | 2.10% | | | | 2.19% | | | | 2.21% | | | | 2.88% | (c) |
| | | | | |
Ratio of net investment income (loss) to average net assets | | | 4.61% | (c) | | | 2.21% | | | | 1.54% | | | | 1.89% | | | | 0.84% | (c) |
| • | Commencement of operations. |
| (a) | Net investment income (loss) allocated based on average shares method. |
| (b) | Total return measures net investment income (loss) and capital gain or loss from portfolio investments assuming reinvestment of dividends and capital gains distributions. Total return is not annualized for periods that are less than a full year, does not reflect the effect of sales charge for Class A shares nor the contingent deferred sales charge for Class C shares and does not reflect the deduction of taxes that a shareholder would pay on fund distributions or the redemption of fund shares. |
| | | | |
| 206 | | CALAMOS OPEN-END FAMILY OF FUNDS SEMIANNUAL REPORT | | |
Calamos Global Convertible Fund Financial Highlights
| | | | | | | | | | | | | | | | | | | | |
| | | CLASS I | |
| | | (Unaudited)
Six Months
Ended
April 30, | | | Year Ended October 31, | | | December 31, 2014• through October 31, | |
| | | 2019 | | | 2018 | | | 2017 | | | 2016 | | | 2015 | |
| | | | | |
Net asset value, beginning of period | | | $10.82 | | | | $11.24 | | | | $9.92 | | | | $9.95 | | | | $10.00 | |
| | | | | |
Income from investment operations: | | | | | | | | | | | | | | | | | | | | |
| | | | | |
Net investment income (loss)(a) | | | 0.29 | | | | 0.36 | | | | 0.26 | | | | 0.28 | | | | 0.15 | |
| | | | | |
Net realized and unrealized gain (loss) | | | 0.31 | | | | (0.33 | ) | | | 1.21 | | | | (0.13 | ) | | | (0.12 | ) |
| | | | | |
Total from investment operations | | | 0.60 | | | | 0.03 | | | | 1.47 | | | | 0.15 | | | | 0.03 | |
| | | | | |
Distributions: | | | | | | | | | | | | | | | | | | | | |
| | | | | |
Dividends from net investment income | | | (0.19 | ) | | | (0.11 | ) | | | (0.15 | ) | | | (0.18 | ) | | | (0.08 | ) |
| | | | | |
Dividends from net realized gains | | | (0.31 | ) | | | (0.34 | ) | | | — | | | | — | | | | — | |
| | | | | |
Total distributions | | | (0.50 | ) | | | (0.45 | ) | | | (0.15 | ) | | | (0.18 | ) | | | (0.08 | ) |
| | | | | |
Net asset value, end of period | | | $10.92 | | | | $10.82 | | | | $11.24 | | | | $9.92 | | | | $9.95 | |
| | | | | |
Ratios and supplemental data: | | | | | | | | | | | | | | | | | | | | |
| | | | | |
Total return(b) | | | 5.95% | | | | 0.24% | | | | 14.98% | | | | 1.60% | | | | 0.29% | |
| | | | | |
Net assets, end of period (000) | | | $119,845 | | | | $121,170 | | | | $91,086 | | | | $47,637 | | | | $23,054 | |
| | | | | |
Ratio of net expenses to average net assets | | | 1.08% | (c) | | | 1.09% | | | | 1.10% | | | | 1.10% | | | | 1.10% | (c) |
| | | | | |
Ratio of gross expenses to average net assets prior to expense reductions | | | 1.08% | (c) | | | 1.10% | | | | 1.18% | | | | 1.21% | | | | 1.80% | (c) |
| | | | | |
Ratio of net investment income (loss) to average net assets | | | 5.59% | (c) | | | 3.22% | | | | 2.47% | | | | 2.88% | | | | 1.81% | (c) |
| • | Commencement of operations. |
| (a) | Net investment income (loss) allocated based on average shares method. |
| (b) | Total return measures net investment income (loss) and capital gain or loss from portfolio investments assuming reinvestment of dividends and capital gains distributions. Total return is not annualized for periods that are less than a full year, does not reflect the effect of sales charge for Class A shares nor the contingent deferred sales charge for Class C shares and does not reflect the deduction of taxes that a shareholder would pay on fund distributions or the redemption of fund shares. |
Calamos Growth Fund Financial Highlights
Selected data for a share outstanding throughout each period were as follows:
| | | | | | | | | | | | | | | | | | | | | | | | |
| | | CLASS A | |
| | | (Unaudited)
Six Months
Ended
April 30, | | | Year Ended October 31, | |
| | | 2019 | | | 2018 | | | 2017 | | | 2016 | | | 2015 | | | 2014 | |
| | | | | | |
Net asset value, beginning of period | | | $33.14 | | | | $35.54 | | | | $30.12 | | | | $42.80 | | | | $50.16 | | | | $58.75 | |
| | | | | | |
Income from investment operations: | | | | | | | | | | | | | | | | | | | | | | | | |
| | | | | | |
Net investment income (loss)(a) | | | (0.02 | ) | | | (0.08 | ) | | | (0.17 | ) | | | (0.07 | ) | | | (0.07 | ) | | | (0.20 | ) |
| | | | | | |
Net realized and unrealized gain (loss) | | | 2.84 | | | | 2.15 | | | | 6.79 | | | | (1.67 | ) | | | 2.84 | | | | 6.90 | |
| | | | | | |
Total from investment operations | | | 2.82 | | | | 2.07 | | | | 6.62 | | | | (1.74 | ) | | | 2.77 | | | | 6.70 | |
| | | | | | |
Distributions: | | | | | | | | | | | | | | | | | | | | | | | | |
| | | | | | |
Dividends from net investment income | | | — | | | | — | | | | — | | | | — | | | | — | | | | — | |
| | | | | | |
Dividends from net realized gains | | | (4.40 | ) | | | (4.47 | ) | | | (1.20 | ) | | | (10.94 | ) | | | (10.13 | ) | | | (15.29 | ) |
| | | | | | |
Total distributions | | | (4.40 | ) | | | (4.47 | ) | | | (1.20 | ) | | | (10.94 | ) | | | (10.13 | ) | | | (15.29 | ) |
| | | | | | |
Net asset value, end of period | | | $31.56 | | | | $33.14 | | | | $35.54 | | | | $30.12 | | | | $42.80 | | | | $50.16 | |
| | | | | | |
Ratios and supplemental data: | | | | | | | | | | | | | | | | | | | | | | | | |
| | | | | | |
Total return(b) | | | 11.63% | | | | 6.12% | | | | 22.79% | | | | (4.76% | ) | | | 6.55% | | | | 13.84% | |
| | | | | | |
Net assets, end of period (000) | | | $1,122,041 | | | | $851,590 | | | | $967,725 | | | | $1,017,541 | | | | $1,424,967 | | | | $1,718,674 | |
| | | | | | |
Ratio of net expenses to average net assets | | | 1.35% | (c) | | | 1.29% | | | | 1.39% | | | | 1.34% | | | | 1.31% | | | | 1.26% | |
| | | | | | |
Ratio of gross expenses to average net assets prior to expense reductions | | | 1.35% | (c) | | | 1.29% | | | | 1.39% | | | | 1.34% | | | | 1.31% | | | | 1.26% | |
| | | | | | |
Ratio of net investment income (loss) to average net assets | | | (0.16% | )(c) | | | (0.22% | ) | | | (0.52% | ) | | | (0.21% | ) | | | (0.17% | ) | | | (0.42% | ) |
| | |
| | | (Unaudited)
Six Months
Ended
April 30, | | | Year Ended October 31, | |
| | | 2019 | | | 2018 | | | 2017 | | | 2016 | | | 2015 | | | 2014 | |
| | | | | | |
Portfolio turnover rate | | | 28.3% | | | | 71.7% | | | | 104.4% | | | | 90.0% | | | | 60.0% | | | | 41.8% | |
| |
| | | CLASS C | |
| | | (Unaudited)
Six Months
Ended
April 30, | | | Year Ended October 31, | |
| | | 2019 | | | 2018 | | | 2017 | | | 2016 | | | 2015 | | | 2014 | |
| | | | | | |
Net asset value, beginning of period | | | $21.00 | | | | $24.26 | | | | $21.08 | | | | $33.48 | | | | $41.66 | | | | $51.58 | |
| | | | | | |
Income from investment operations: | | | | | | | | | | | | | | | | | | | | | | | | |
| | | | | | |
Net investment income (loss)(a) | | | (0.06 | ) | | | (0.22 | ) | | | (0.28 | ) | | | (0.21 | ) | | | (0.32 | ) | | | (0.48 | ) |
| | | | | | |
Net realized and unrealized gain (loss) | | | 1.41 | | | | 1.43 | | | | 4.66 | | | | (1.25 | ) | | | 2.27 | | | | 5.85 | |
| | | | | | |
Total from investment operations | | | 1.35 | | | | 1.21 | | | | 4.38 | | | | (1.46 | ) | | | 1.95 | | | | 5.37 | |
| | | | | | |
Distributions: | | | | | | | | | | | | | | | | | | | | | | | | |
| | | | | | |
Dividends from net investment income | | | — | | | | — | | | | — | | | | — | | | | — | | | | — | |
| | | | | | |
Dividends from net realized gains | | | (4.40 | ) | | | (4.47 | ) | | | (1.20 | ) | | | (10.94 | ) | | | (10.13 | ) | | | (15.29 | ) |
| | | | | | |
Total distributions | | | (4.40 | ) | | | (4.47 | ) | | | (1.20 | ) | | | (10.94 | ) | | | (10.13 | ) | | | (15.29 | ) |
| | | | | | |
Net asset value, end of period | | | $17.95 | | | | $21.00 | | | | $24.26 | | | | $21.08 | | | | $33.48 | | | | $41.66 | |
| | | | | | |
Ratios and supplemental data: | | | | | | | | | | | | | | | | | | | | | | | | |
| | | | | | |
Total return(b) | | | 11.26% | | | | 5.34% | | | | 21.85% | | | | (5.45% | ) | | | 5.75% | | | | 12.97% | |
| | | | | | |
Net assets, end of period (000) | | | $66,882 | | | | $329,883 | | | | $398,115 | | | | $540,422 | | | | $792,046 | | | | $959,445 | |
| | | | | | |
Ratio of net expenses to average net assets | | | 2.12% | (c) | | | 2.04% | | | | 2.14% | | | | 2.09% | | | | 2.06% | | | | 2.01% | |
| | | | | | |
Ratio of gross expenses to average net assets prior to expense reductions | | | 2.12% | (c) | | | 2.04% | | | | 2.14% | | | | 2.09% | | | | 2.06% | | | | 2.01% | |
| | | | | | |
Ratio of net investment income (loss) to average net assets | | | (0.71% | )(c) | | | (0.97% | ) | | | (1.26% | ) | | | (0.96% | ) | | | (0.92% | ) | | | (1.17% | ) |
| (a) | Net investment income (loss) allocated based on average shares method. |
| (b) | Total return measures net investment income (loss) and capital gain or loss from portfolio investments assuming reinvestment of dividends and capital gains distributions. Total return is not annualized for periods that are less than a full year, does not reflect the effect of sales charge for Class A shares nor the contingent deferred sales charge for Class C shares and does not reflect the deduction of taxes that a shareholder would pay on fund distributions or the redemption of fund shares. |
| | | | |
| 208 | | CALAMOS OPEN-END FAMILY OF FUNDS SEMIANNUAL REPORT | | |
Calamos Growth Fund Financial Highlights
| | | | | | | | | | | | | | | | | | | | | | | | |
| | | CLASS I | |
| | | (Unaudited)
Six Months
Ended
April 30, | | | Year Ended October 31, | |
| | | 2019 | | | 2018 | | | 2017 | | | 2016 | | | 2015 | | | 2014 | |
| | | | | | |
Net asset value, beginning of period | | | $43.48 | | | | $45.18 | | | | $37.88 | | | | $50.84 | | | | $57.59 | | | | $65.15 | |
| | | | | | |
Income from investment operations: | | | | | | | | | | | | | | | | | | | | | | | | |
| | | | | | |
Net investment income (loss)(a) | | | 0.03 | | | | 0.02 | | | | (0.11 | ) | | | 0.02 | | | | 0.05 | | | | (0.10 | ) |
| | | | | | |
Net realized and unrealized gain (loss) | | | 4.05 | | | | 2.75 | | | | 8.61 | | | | (2.04 | ) | | | 3.33 | | | | 7.83 | |
| | | | | | |
Total from investment operations | | | 4.08 | | | | 2.77 | | | | 8.50 | | | | (2.02 | ) | | | 3.38 | | | | 7.73 | |
| | | | | | |
Distributions: | | | | | | | | | | | | | | | | | | | | | | | | |
| | | | | | |
Dividends from net investment income | | | — | | | | — | | | | — | | | | — | | | | — | | | | — | |
| | | | | | |
Dividends from net realized gains | | | (4.40 | ) | | | (4.47 | ) | | | (1.20 | ) | | | (10.94 | ) | | | (10.13 | ) | | | (15.29 | ) |
| | | | | | |
Total distributions | | | (4.40 | ) | | | (4.47 | ) | | | (1.20 | ) | | | (10.94 | ) | | | (10.13 | ) | | | (15.29 | ) |
| | | | | | |
Net asset value, end of period | | | $43.16 | | | | $43.48 | | | | $45.18 | | | | $37.88 | | | | $50.84 | | | | $57.59 | |
| | | | | | |
Ratios and supplemental data: | | | | | | | | | | | | | | | | | | | | | | | | |
| | | | | | |
Total return(b) | | | 11.75% | | | | 6.41% | | | | 23.09% | | | | (4.51% | ) | | | 6.80% | | | | 14.12% | |
| | | | | | |
Net assets, end of period (000) | | | $287,247 | | | | $282,061 | | | | $301,237 | | | | $327,872 | | | | $480,028 | | | | $759,432 | |
| | | | | | |
Ratio of net expenses to average net assets | | | 1.10% | (c) | | | 1.04% | | | | 1.14% | | | | 1.09% | | | | 1.06% | | | | 1.01% | |
| | | | | | |
Ratio of gross expenses to average net assets prior to expense reductions | | | 1.10% | (c) | | | 1.04% | | | | 1.14% | | | | 1.09% | | | | 1.06% | | | | 1.01% | |
| | | | | | |
Ratio of net investment income (loss) to average net assets | | | 0.13% | (c) | | | 0.03% | | | | (0.27% | ) | | | 0.04% | | | | 0.09% | | | | (0.18% | ) |
| (a) | Net investment income (loss) allocated based on average shares method. |
| (b) | Total return measures net investment income (loss) and capital gain or loss from portfolio investments assuming reinvestment of dividends and capital gains distributions. Total return is not annualized for periods that are less than a full year, does not reflect the effect of sales charge for Class A shares nor the contingent deferred sales charge for Class C shares and does not reflect the deduction of taxes that a shareholder would pay on fund distributions or the redemption of fund shares. |
Calamos Growth and Income Fund Financial Highlights
Selected data for a share outstanding throughout each period were as follows:
| | | | | | | | | | | | | | | | | | | | | | | | |
| | | CLASS A | |
| | | (Unaudited)
Six Months
Ended
April 30, | | | Year Ended October 31, | |
| | | 2019 | | | 2018 | | | 2017 | | | 2016 | | | 2015 | | | 2014 | |
| | | | | | |
Net asset value, beginning of period | | | $32.53 | | | | $33.15 | | | | $30.17 | | | | $31.68 | | | | $35.22 | | | | $35.84 | |
| | | | | | |
Income from investment operations: | | | | | | | | | | | | | | | | | | | | | | | | |
| | | | | | |
Net investment income (loss)(a) | | | 0.16 | | | | 0.25 | | | | 0.49 | | | | 0.48 | | | | 0.60 | | | | 0.60 | |
| | | | | | |
Net realized and unrealized gain (loss) | | | 2.25 | | | | 1.41 | | | | 4.53 | | | | 0.16 | | | | 0.51 | | | | 2.78 | |
| | | | | | |
Total from investment operations | | | 2.41 | | | | 1.66 | | | | 5.02 | | | | 0.64 | | | | 1.11 | | | | 3.38 | |
| | | | | | |
Distributions: | | | | | | | | | | | | | | | | | | | | | | | | |
| | | | | | |
Dividends from net investment income | | | (0.33 | ) | | | (0.38 | ) | | | (0.84 | ) | | | (0.84 | ) | | | (0.89 | ) | | | (0.80 | ) |
| | | | | | |
Dividends from net realized gains | | | (1.91 | ) | | | (1.90 | ) | | | (1.20 | ) | | | (1.31 | ) | | | (3.76 | ) | | | (3.20 | ) |
| | | | | | |
Total distributions | | | (2.24 | ) | | | (2.28 | ) | | | (2.04 | ) | | | (2.15 | ) | | | (4.65 | ) | | | (4.00 | ) |
| | | | | | |
Net asset value, end of period | | | $32.70 | | | | $32.53 | | | | $33.15 | | | | $30.17 | | | | $31.68 | | | | $35.22 | |
| | | | | | |
Ratios and supplemental data: | | | | | | | | | | | | | | | | | | | | | | | | |
| | | | | | |
Total return(b) | | | 8.51% | | | | 5.20% | | | | 17.39% | | | | 2.26% | | | | 3.50% | | | | 10.33% | |
| | | | | | |
Net assets, end of period (000) | | | $1,155,515 | | | | $832,433 | | | | $918,695 | | | | $930,625 | | | | $1,105,102 | | | | $1,316,498 | |
| | | | | | |
Ratio of net expenses to average net assets | | | 1.10% | (c) | | | 1.09% | | | | 1.11% | | | | 1.11% | | | | 1.10% | | | | 1.09% | |
| | | | | | |
Ratio of gross expenses to average net assets prior to expense reductions | | | 1.10% | (c) | | | 1.09% | | | | 1.11% | | | | 1.11% | | | | 1.10% | | | | 1.09% | |
| | | | | | |
Ratio of net investment income (loss) to average net assets | | | 1.04% | (c) | | | 0.77% | | | | 1.58% | | | | 1.59% | | | | 1.86% | | | | 1.76% | |
| | |
| | | (Unaudited)
Six Months
Ended
April 30, | | | Year Ended October 31, | |
| | | 2019 | | | 2018 | | | 2017 | | | 2016 | | | 2015 | | | 2014 | |
| | | | | | |
Portfolio turnover rate | | | 6.8% | | | | 25.3% | | | | 31.6% | | | | 23.5% | | | | 23.8% | | | | 32.8% | |
| |
| | | CLASS C | |
| | | (Unaudited)
Six Months
Ended
April 30, | | | Year Ended October 31, | |
| | | 2019 | | | 2018 | | | 2017 | | | 2016 | | | 2015 | | | 2014 | |
| | | | | | |
Net asset value, beginning of period | | | $32.69 | | | | $33.30 | | | | $30.28 | | | | $31.81 | | | | $35.34 | | | | $35.78 | |
| | | | | | |
Income from investment operations: | | | | | | | | | | | | | | | | | | | | | | | | |
| | | | | | |
Net investment income (loss)(a) | | | 0.06 | | | | 0.01 | | | | 0.27 | | | | 0.25 | | | | 0.36 | | | | 0.35 | |
| | | | | | |
Net realized and unrealized gain (loss) | | | 2.26 | | | | 1.41 | | | | 4.54 | | | | 0.14 | | | | 0.51 | | | | 2.77 | |
| | | | | | |
Total from investment operations | | | 2.32 | | | | 1.42 | | | | 4.81 | | | | 0.39 | | | | 0.87 | | | | 3.12 | |
| | | | | | |
Distributions: | | | | | | | | | | | | | | | | | | | | | | | | |
| | | | | | |
Dividends from net investment income | | | (0.16 | ) | | | (0.13 | ) | | | (0.59 | ) | | | (0.61 | ) | | | (0.64 | ) | | | (0.36 | ) |
| | | | | | |
Dividends from net realized gains | | | (1.91 | ) | | | (1.90 | ) | | | (1.20 | ) | | | (1.31 | ) | | | (3.76 | ) | | | (3.20 | ) |
| | | | | | |
Total distributions | | | (2.07 | ) | | | (2.03 | ) | | | (1.79 | ) | | | (1.92 | ) | | | (4.40 | ) | | | (3.56 | ) |
| | | | | | |
Net asset value, end of period | | | $32.94 | | | | $32.69 | | | | $33.30 | | | | $30.28 | | | | $31.81 | | | | $35.34 | |
| | | | | | |
Ratios and supplemental data: | | | | | | | | | | | | | | | | | | | | | | | | |
| | | | | | |
Total return(b) | | | 8.13% | | | | 4.42% | | | | 16.54% | | | | 1.39% | | | | 2.73% | | | | 9.48% | |
| | | | | | |
Net assets, end of period (000) | | | $168,091 | | | | $502,593 | | | | $574,455 | | | | $739,780 | | | | $889,516 | | | | $1,009,029 | |
| | | | | | |
Ratio of net expenses to average net assets | | | 1.85% | (c) | | | 1.84% | | | | 1.86% | | | | 1.86% | | | | 1.85% | | | | 1.84% | |
| | | | | | |
Ratio of gross expenses to average net assets prior to expense reductions | | | 1.85% | (c) | | | 1.84% | | | | 1.86% | | | | 1.86% | | | | 1.85% | | | | 1.84% | |
| | | | | | |
Ratio of net investment income (loss) to average net assets | | | 0.42% | (c) | | | 0.02% | | | | 0.85% | | | | 0.84% | | | | 1.11% | | | | 1.02% | |
| (a) | Net investment income (loss) allocated based on average shares method. |
| (b) | Total return measures net investment income (loss) and capital gain or loss from portfolio investments assuming reinvestment of dividends and capital gains distributions. Total return is not annualized for periods that are less than a full year, does not reflect the effect of sales charge for Class A shares nor the contingent deferred sales charge for Class C shares and does not reflect the deduction of taxes that a shareholder would pay on fund distributions or the redemption of fund shares. |
| | | | |
| 210 | | CALAMOS OPEN-END FAMILY OF FUNDS SEMIANNUAL REPORT | | |
Calamos Growth and Income Fund Financial Highlights
| | | | | | | | | | | | | | | | | | | | | | | | |
| | | CLASS I | |
| | | (Unaudited)
Six Months
Ended
April 30, | | | Year Ended October 31, | |
| | | 2019 | | | 2018 | | | 2017 | | | 2016 | | | 2015 | | | 2014 | |
| | | | | | |
Net asset value, beginning of period | | | $31.28 | | | | $31.96 | | | | $29.15 | | | | $30.71 | | | | $34.28 | | | | $35.07 | |
| | | | | | |
Income from investment operations: | | | | | | | | | | | | | | | | | | | | | | | | |
| | | | | | |
Net investment income (loss)(a) | | | 0.20 | | | | 0.32 | | | | 0.55 | | | | 0.53 | | | | 0.66 | | | | 0.68 | |
| | | | | | |
Net realized and unrealized gain (loss) | | | 2.13 | | | | 1.37 | | | | 4.38 | | | | 0.14 | | | | 0.50 | | | | 2.69 | |
| | | | | | |
Total from investment operations | | | 2.33 | | | | 1.69 | | | | 4.93 | | | | 0.67 | | | | 1.16 | | | | 3.37 | |
| | | | | | |
Distributions: | | | | | | | | | | | | | | | | | | | | | | | | |
| | | | | | |
Dividends from net investment income | | | (0.36 | ) | | | (0.47 | ) | | | (0.92 | ) | | | (0.92 | ) | | | (0.97 | ) | | | (0.96 | ) |
| | | | | | |
Dividends from net realized gains | | | (1.91 | ) | | | (1.90 | ) | | | (1.20 | ) | | | (1.31 | ) | | | (3.76 | ) | | | (3.20 | ) |
| | | | | | |
Total distributions | | | (2.27 | ) | | | (2.37 | ) | | | (2.12 | ) | | | (2.23 | ) | | | (4.73 | ) | | | (4.16 | ) |
| | | | | | |
Net asset value, end of period | | | $31.34 | | | | $31.28 | | | | $31.96 | | | | $29.15 | | | | $30.71 | | | | $34.28 | |
| | | | | | |
Ratios and supplemental data: | | | | | | | | | | | | | | | | | | | | | | | | |
| | | | | | |
Total return(b) | | | 8.67% | | | | 5.45% | | | | 17.71% | | | | 2.43% | | | | 3.79% | | | | 10.60% | |
| | | | | | |
Net assets, end of period (000) | | | $718,009 | | | | $643,422 | | | | $554,490 | | | | $513,604 | | | | $577,449 | | | | $688,258 | |
| | | | | | |
Ratio of net expenses to average net assets | | | 0.85% | (c) | | | 0.84% | | | | 0.86% | | | | 0.86% | | | | 0.85% | | | | 0.84% | |
| | | | | | |
Ratio of gross expenses to average net assets prior to expense reductions | | | 0.85% | (c) | | | 0.84% | | | | 0.86% | | | | 0.86% | | | | 0.85% | | | | 0.84% | |
| | | | | | |
Ratio of net investment income (loss) to average net assets | | | 1.32% | (c) | | | 1.01% | | | | 1.83% | | | | 1.84% | | | | 2.11% | | | | 2.04% | |
| (a) | Net investment income (loss) allocated based on average shares method. |
| (b) | Total return measures net investment income (loss) and capital gain or loss from portfolio investments assuming reinvestment of dividends and capital gains distributions. Total return is not annualized for periods that are less than a full year, does not reflect the effect of sales charge for Class A shares nor the contingent deferred sales charge for Class C shares and does not reflect the deduction of taxes that a shareholder would pay on fund distributions or the redemption of fund shares. |
Calamos Dividend Growth Fund Financial Highlights
Selected data for a share outstanding throughout each period were as follows:
| | | | | | | | | | | | | | | | | | | | | | | | |
| | | Class A | |
| | | (Unaudited)
Six Months
Ended
April 30, | | | Year Ended October 31, | |
| | | 2019 | | | 2018 | | | 2017 | | | 2016 | | | 2015 | | | 2014 | |
| | | | | | |
Net asset value, beginning of period | | | $12.34 | | | | $12.73 | | | | $10.38 | | | | $10.52 | | | | $10.78 | | | | $10.36 | |
| | | | | | |
Income from investment operations: | | | | | | | | | | | | | | | | | | | | | | | | |
| | | | | | |
Net investment income (loss)(a) | | | 0.04 | | | | 0.07 | | | | 0.10 | | | | 0.10 | | | | 0.17 | | | | 0.39 | |
| | | | | | |
Net realized and unrealized gain (loss) | | | 1.08 | | | | 0.57 | | | | 2.30 | | | | 0.11 | | | | (0.15 | ) | | | 0.24 | |
| | | | | | |
Total from investment operations | | | 1.12 | | | | 0.64 | | | | 2.40 | | | | 0.21 | | | | 0.02 | | | | 0.63 | |
| | | | | | |
Distributions: | | | | | | | | | �� | | | | | | | | | | | | | | | |
| | | | | | |
Dividends from net investment income | | | (0.04 | ) | | | (0.05 | ) | | | (0.05 | ) | | | (0.08 | ) | | | (0.15 | ) | | | (0.18 | ) |
| | | | | | |
Dividends from net realized gains | | | (0.46 | ) | | | (0.98 | ) | | | — | | | | (0.27 | ) | | | (0.13 | ) | | | (0.03 | ) |
| | | | | | |
Total distributions | | | (0.50 | ) | | | (1.03 | ) | | | (0.05 | ) | | | (0.35 | ) | | | (0.28 | ) | | | (0.21 | ) |
| | | | | | |
Net asset value, end of period | | | $12.96 | | | | $12.34 | | | | $12.73 | | | | $10.38 | | | | $10.52 | | | | $10.78 | |
| | | | | | |
Ratios and supplemental data: | | | | | | | | | | | | | | | | | | | | | | | | |
| | | | | | |
Total return(b) | | | 9.88% | | | | 5.26% | | | | 23.17% | | | | 2.17% | | | | 0.21% | | | | 6.12% | |
| | | | | | |
Net assets, end of period (000) | | | $3,122 | | | | $2,347 | | | | $2,031 | | | | $23,157 | | | | $28,030 | | | | $28,365 | |
| | | | | | |
Ratio of net expenses to average net assets | | | 1.35% | (c) | | | 1.35% | | | | 1.35% | | | | 1.33% | | | | 1.35% | | | | 1.35% | |
| | | | | | |
Ratio of gross expenses to average net assets prior to expense reductions | | | 1.84% | (c) | | | 1.83% | | | | 1.87% | | | | 1.73% | | | | 1.74% | | | | 1.73% | |
| | | | | | |
Ratio of net investment income (loss) to average net assets | | | 0.65% | (c) | | | 0.55% | | | | 0.93% | | | | 0.95% | | | | 1.66% | | | | 3.68% | |
| | |
| | | (Unaudited)
Six Months
Ended
April 30, | | | Year Ended October 31, | |
| | | 2019 | | | 2018 | | | 2017 | | | 2016 | | | 2015 | | | 2014 | |
| | | | | | |
Portfolio turnover rate | | | 4.5% | | | | 10.7% | | | | 15.3% | | | | 11.5% | | | | 107.6% | | | | 130.0% | |
| |
| | | Class C | |
| | | (Unaudited)
Six Months
Ended
April 30, | | | Year Ended October 31, | |
| | | 2019 | | | 2018 | | | 2017 | | | 2016 | | | 2015 | | | 2014 | |
| | | | | | |
Net asset value, beginning of period | | | $12.09 | | | | $12.52 | | | | $10.26 | | | | $10.41 | | | | $10.74 | | | | $10.34 | |
| | | | | | |
Income from investment operations: | | | | | | | | | | | | | | | | | | | | | | | | |
| | | | | | |
Net investment income (loss)(a) | | | (0.00 | )* | | | (0.02 | ) | | | 0.00 | * | | | 0.02 | | | | 0.08 | | | | 0.31 | |
| | | | | | |
Net realized and unrealized gain (loss) | | | 1.06 | | | | 0.57 | | | | 2.28 | | | | 0.12 | | | | (0.15 | ) | | | 0.25 | |
| | | | | | |
Total from investment operations | | | 1.06 | | | | 0.55 | | | | 2.28 | | | | 0.14 | | | | (0.07 | ) | | | 0.56 | |
| | | | | | |
Distributions: | | | | | | | | | | | | | | | | | | | | | | | | |
| | | | | | |
Dividends from net investment income | | | — | | | | — | | | | (0.02 | ) | | | (0.02 | ) | | | (0.13 | ) | | | (0.13 | ) |
| | | | | | |
Dividends from net realized gains | | | (0.46 | ) | | | (0.98 | ) | | | — | | | | (0.27 | ) | | | (0.13 | ) | | | (0.03 | ) |
| | | | | | |
Total distributions | | | (0.46 | ) | | | (0.98 | ) | | | (0.02 | ) | | | (0.29 | ) | | | (0.26 | ) | | | (0.16 | ) |
| | | | | | |
Net asset value, end of period | | | $12.69 | | | | $12.09 | | | | $12.52 | | | | $10.26 | | | | $10.41 | | | | $10.74 | |
| | | | | | |
Ratios and supplemental data: | | | | | | | | | | | | | | | | | | | | | | | | |
| | | | | | |
Total return(b) | | | 9.46% | | | | 4.56% | | | | 22.26% | | | | 1.42% | | | | (0.63% | ) | | | 5.40% | |
| | | | | | |
Net assets, end of period (000) | | | $901 | | | | $1,028 | | | | $1,039 | | | | $969 | | | | $702 | | | | $418 | |
| | | | | | |
Ratio of net expenses to average net assets | | | 2.10% | (c) | | | 2.10% | | | | 2.10% | | | | 2.08% | | | | 2.10% | | | | 2.10% | |
| | | | | | |
Ratio of gross expenses to average net assets prior to expense reductions | | | 2.57% | (c) | | | 2.59% | | | | 2.73% | | | | 2.48% | | | | 2.51% | | | | 2.44% | |
| | | | | | |
Ratio of net investment income (loss) to average net assets | | | 0.00% | (c) | | | (0.19% | ) | | | 0.00% | ** | | | 0.17% | | | | 0.77% | | | | 2.90% | |
| * | Amounts are less than $0.005. |
| ** | Amounts are less than 0.005%. |
| (a) | Net investment income (loss) allocated based on average shares method. |
| (b) | Total return measures net investment income (loss) and capital gain or loss from portfolio investments assuming reinvestment of dividends and capital gains distributions. Total return is not annualized for periods that are less than a full year, does not reflect the effect of sales charge for Class A shares nor the contingent deferred sales charge for Class C shares and does not reflect the deduction of taxes that a shareholder would pay on fund distributions or the redemption of fund shares. |
| | | | |
| 212 | | CALAMOS OPEN-END FAMILY OF FUNDS SEMIANNUAL REPORT | | |
Calamos Dividend Growth Fund Financial Highlights
| | | | | | | | | | | | | | | | | | | | | | | | |
| | | CLASS I | |
| | | (Unaudited)
Six Months
Ended
April 30, | | | Year Ended October 31, | |
| | | 2019 | | | 2018 | | | 2017 | | | 2016 | | | 2015 | | | 2014 | |
| | | | | | |
Net asset value, beginning of period | | | $12.33 | | | | $12.71 | | | | $10.39 | | | | $10.55 | | | | $10.79 | | | | $10.37 | |
| | | | | | |
Income from investment operations: | | | | | | | | | | | | | | | | | | | | | | | | |
| | | | | | |
Net investment income (loss)(a) | | | 0.06 | | | | 0.10 | | | | 0.11 | | | | 0.12 | | | | 0.20 | | | | 0.42 | |
| | | | | | |
Net realized and unrealized gain (loss) | | | 1.08 | | | | 0.58 | | | | 2.32 | | | | 0.12 | | | | (0.16 | ) | | | 0.23 | |
| | | | | | |
Total from investment operations | | | 1.14 | | | | 0.68 | | | | 2.43 | | | | 0.24 | | | | 0.04 | | | | 0.65 | |
| | | | | | |
Distributions: | | | | | | | | | | | | | | | | | | | | | | | | |
| | | | | | |
Dividends from net investment income | | | (0.06 | ) | | | (0.08 | ) | | | (0.11 | ) | | | (0.13 | ) | | | (0.15 | ) | | | (0.20 | ) |
| | | | | | |
Dividends from net realized gains | | | (0.46 | ) | | | (0.98 | ) | | | — | | | | (0.27 | ) | | | (0.13 | ) | | | (0.03 | ) |
| | | | | | |
Total distributions | | | (0.52 | ) | | | (1.06 | ) | | | (0.11 | ) | | | (0.40 | ) | | | (0.28 | ) | | | (0.23 | ) |
| | | | | | |
Net asset value, end of period | | | $12.95 | | | | $12.33 | | | | $12.71 | | | | $10.39 | | | | $10.55 | | | | $10.79 | |
| | | | | | |
Ratios and supplemental data: | | | | | | | | | | | | | | | | | | | | | | | | |
| | | | | | |
Total return(b) | | | 10.03% | | | | 5.61% | | | | 23.46% | | | | 2.39% | | | | 0.47% | | | | 6.33% | |
| | | | | | |
Net assets, end of period (000) | | | $14,935 | | | | $20,585 | | | | $22,201 | | | | $7,989 | | | | $7,375 | | | | $8,020 | |
| | | | | | |
Ratio of net expenses to average net assets | | | 1.10% | (c) | | | 1.10% | | | | 1.10% | | | | 1.08% | | | | 1.10% | | | | 1.10% | |
| | | | | | |
Ratio of gross expenses to average net assets prior to expense reductions | | | 1.60% | (c) | | | 1.60% | | | | 1.80% | | | | 1.48% | | | | 1.49% | | | | 1.48% | |
| | | | | | |
Ratio of net investment income (loss) to average net assets | | | 0.99% | (c) | | | 0.82% | | | | 0.89% | | | | 1.17% | | | | 1.91% | | | | 3.97% | |
| (a) | Net investment income (loss) allocated based on average shares method. |
| (b) | Total return measures net investment income (loss) and capital gain or loss from portfolio investments assuming reinvestment of dividends and capital gains distributions. Total return is not annualized for periods that are less than a full year, does not reflect the effect of sales charge for Class A shares nor the contingent deferred sales charge for Class C shares and does not reflect the deduction of taxes that a shareholder would pay on fund distributions or the redemption of fund shares. |
Calamos Opportunistic Value Fund Financial Highlights
Selected data for a share outstanding throughout each period were as follows:
| | | | | | | | | | | | | | | | | | | | | | | | |
| | | CLASS A | |
| | | (Unaudited)
Six Months
Ended
April 30, | | | Year Ended October 31, | |
| | | 2019 | | | 2018 | | | 2017 | | | 2016 | | | 2015 | | | 2014 | |
| | | | | | |
Net asset value, beginning of period | | | $15.37 | | | | $15.21 | | | | $12.60 | | | | $13.61 | | | | $15.07 | | | | $15.22 | |
| | | | | | |
Income from investment operations: | | | | | | | | | | | | | | | | | | | | | | | | |
| | | | | | |
Net investment income (loss)(a) | | | 0.09 | | | | 0.10 | | | | 0.15 | | | | 0.21 | | | | 0.19 | | | | 0.18 | |
| | | | | | |
Net realized and unrealized gain (loss) | | | 0.56 | | | | 0.58 | | | | 2.56 | | | | (0.15 | ) | | | (0.52 | ) | | | 0.92 | |
| | | | | | |
Total from investment operations | | | 0.65 | | | | 0.68 | | | | 2.71 | | | | 0.06 | | | | (0.33 | ) | | | 1.10 | |
| | | | | | |
Distributions: | | | | | | | | | | | | | | | | | | | | | | | | |
| | | | | | |
Dividends from net investment income | | | (0.06 | ) | | | (0.05 | ) | | | (0.10 | ) | | | (0.16 | ) | | | (0.14 | ) | | | (0.14 | ) |
| | | | | | |
Dividends from net realized gains | | | (2.20 | ) | | | (0.47 | ) | | | — | | | | (0.91 | ) | | | (0.99 | ) | | | (1.11 | ) |
| | | | | | |
Total distributions | | | (2.26 | ) | | | (0.52 | ) | | | (0.10 | ) | | | (1.07 | ) | | | (1.13 | ) | | | (1.25 | ) |
| | | | | | |
Net asset value, end of period | | | $13.76 | | | | $15.37 | | | | $15.21 | | | | $12.60 | | | | $13.61 | | | | $15.07 | |
| | | | | | |
Ratios and supplemental data: | | | | | | | | | | | | | | | | | | | | | | | | |
| | | | | | |
Total return(b) | | | 6.65% | | | | 4.53% | | | | 21.56% | | | | 0.76% | | | | (2.32% | ) | | | 7.67% | |
| | | | | | |
Net assets, end of period (000) | | | $11,770 | | | | $21,349 | | | | $21,894 | | | | $32,350 | | | | $44,792 | | | | $58,419 | |
| | | | | | |
Ratio of net expenses to average net assets | | | 1.15% | (c) | | | 1.15% | | | | 1.15% | | | | 1.12% | | | | 1.15% | | | | 1.15% | |
| | | | | | |
Ratio of gross expenses to average net assets prior to expense reductions | | | 1.61% | (c) | | | 1.60% | | | | 1.67% | | | | 1.57% | | | | 1.61% | | | | 1.50% | |
| | | | | | |
Ratio of net investment income (loss) to average net assets | | | 1.32% | (c) | | | 0.64% | | | | 1.10% | | | | 1.67% | | | | 1.38% | | | | 1.19% | |
| | |
| | | (Unaudited)
Six Months
Ended
April 30, | | | Year Ended October 31, | |
| | | 2019 | | | 2018 | | | 2017 | | | 2016 | | | 2015 | | | 2014 | |
| | | | | | |
Portfolio turnover rate | | | 41.8% | | | | 119.3% | | | | 104.7% | | | | 40.7% | | | | 139.8% | | | | 165.4% | |
| |
| | | CLASS C | |
| | | (Unaudited)
Six Months
Ended
April 30, | | | Year Ended October 31, | |
| | | 2019 | | | 2018 | | | 2017 | | | 2016 | | | 2015 | | | 2014 | |
| | | | | | |
Net asset value, beginning of period | | | $13.77 | | | | $13.74 | | | | $11.39 | | | | $12.38 | | | | $13.79 | | | | $14.09 | |
| | | | | | |
Income from investment operations: | | | | | | | | | | | | | | | | | | | | | | | | |
| | | | | | |
Net investment income (loss)(a) | | | 0.01 | | | | (0.01 | ) | | | 0.04 | | | | 0.10 | | | | 0.08 | | | | 0.06 | |
| | | | | | |
Net realized and unrealized gain (loss) | | | 0.49 | | | | 0.51 | | | | 2.32 | | | | (0.13 | ) | | | (0.47 | ) | | | 0.85 | |
| | | | | | |
Total from investment operations | | | 0.50 | | | | 0.50 | | | | 2.36 | | | | (0.03 | ) | | | (0.39 | ) | | | 0.91 | |
| | | | | | |
Distributions: | | | | | | | | | | | | | | | | | | | | | | | | |
| | | | | | |
Dividends from net investment income | | | (0.06 | ) | | | — | | | | (0.01 | ) | | | (0.05 | ) | | | (0.03 | ) | | | (0.10 | ) |
| | | | | | |
Dividends from net realized gains | | | (2.20 | ) | | | (0.47 | ) | | | — | | | | (0.91 | ) | | | (0.99 | ) | | | (1.11 | ) |
| | | | | | |
Total distributions | | | (2.26 | ) | | | (0.47 | ) | | | (0.01 | ) | | | (0.96 | ) | | | (1.02 | ) | | | (1.21 | ) |
| | | | | | |
Net asset value, end of period | | | $12.01 | | | | $13.77 | | | | $13.74 | | | | $11.39 | | | | $12.38 | | | | $13.79 | |
| | | | | | |
Ratios and supplemental data: | | | | | | | | | | | | | | | | | | | | | | | | |
| | | | | | |
Total return(b) | | | 6.23% | | | | 3.77% | | | | 20.70% | | | | (0.04% | ) | | | (3.01% | ) | | | 6.82% | |
| | | | | | |
Net assets, end of period (000) | | | $5,345 | | | | $4,318 | | | | $4,728 | | | | $4,915 | | | | $5,738 | | | | $9,964 | |
| | | | | | |
Ratio of net expenses to average net assets | | | 1.90% | (c) | | | 1.90% | | | | 1.90% | | | | 1.87% | | | | 1.90% | | | | 1.90% | |
| | | | | | |
Ratio of gross expenses to average net assets prior to expense reductions | | | 2.33% | (c) | | | 2.35% | | | | 2.42% | | | | 2.32% | | | | 2.35% | | | | 2.25% | |
| | | | | | |
Ratio of net investment income (loss) to average net assets | | | 0.25% | (c) | | | (0.10% | ) | | | 0.31% | | | | 0.91% | | | | 0.64% | | | | 0.44% | |
| (a) | Net investment income (loss) allocated based on average shares method. |
| (b) | Total return measures net investment income (loss) and capital gain or loss from portfolio investments assuming reinvestment of dividends and capital gains distributions. Total return is not annualized for periods that are less than a full year, does not reflect the effect of sales charge for Class A shares nor the contingent deferred sales charge for Class C shares and does not reflect the deduction of taxes that a shareholder would pay on fund distributions or the redemption of fund shares. |
| | | | |
| 214 | | CALAMOS OPEN-END FAMILY OF FUNDS SEMIANNUAL REPORT | | |
Calamos Opportunistic Value Fund Financial Highlights
| | | | | | | | | | | | | | | | | | | | | | | | |
| | | CLASS I | |
| | | (Unaudited)
Six Months
Ended
April 30, | | | Year Ended October 31, | |
| | | 2019 | | | 2018 | | | 2017 | | | 2016 | | | 2015 | | | 2014 | |
| | | | | | |
Net asset value, beginning of period | | | $15.80 | | | | $15.63 | | | | $12.94 | | | | $13.96 | | | | $15.44 | | | | $15.57 | |
| | | | | | |
Income from investment operations: | | | | | | | | | | | | | | | | | | | | | | | | |
| | | | | | |
Net investment income (loss)(a) | | | 0.08 | | | | 0.14 | | | | 0.18 | | | | 0.24 | | | | 0.23 | | | | 0.22 | |
| | | | | | |
Net realized and unrealized gain (loss) | | | 0.60 | | | | 0.59 | | | | 2.64 | | | | (0.14 | ) | | | (0.53 | ) | | | 0.94 | |
| | | | | | |
Total from investment operations | | | 0.68 | | | | 0.73 | | | | 2.82 | | | | 0.10 | | | | (0.30 | ) | | | 1.16 | |
| | | | | | |
Distributions: | | | | | | | | | | | | | | | | | | | | | | | | |
| | | | | | |
Dividends from net investment income | | | (0.15 | ) | | | (0.09 | ) | | | (0.13 | ) | | | (0.21 | ) | | | (0.19 | ) | | | (0.18 | ) |
| | | | | | |
Dividends from net realized gains | | | (2.20 | ) | | | (0.47 | ) | | | — | | | | (0.91 | ) | | | (0.99 | ) | | | (1.11 | ) |
| | | | | | |
Total distributions | | | (2.35 | ) | | | (0.56 | ) | | | (0.13 | ) | | | (1.12 | ) | | | (1.18 | ) | | | (1.29 | ) |
| | | | | | |
Net asset value, end of period | | | $14.13 | | | | $15.80 | | | | $15.63 | | | | $12.94 | | | | $13.96 | | | | $15.44 | |
| | | | | | |
Ratios and supplemental data: | | | | | | | | | | | | | | | | | | | | | | | | |
| | | | | | |
Total return(b) | | | 6.73% | | | | 4.78% | | | | 21.92% | | | | 0.98% | | | | (2.08% | ) | | | 7.87% | |
| | | | | | |
Net assets, end of period (000) | | | $29,356 | | | | $21,892 | | | | $25,669 | | | | $16,672 | | | | $19,583 | | | | $32,147 | |
| | | | | | |
Ratio of net expenses to average net assets | | | 0.90% | (c) | | | 0.90% | | | | 0.90% | | | | 0.87% | | | | 0.90% | | | | 0.90% | |
| | | | | | |
Ratio of gross expenses to average net assets prior to expense reductions | | | 1.35% | (c) | | | 1.36% | | | | 1.42% | | | | 1.32% | | | | 1.36% | | | | 1.25% | |
| | | | | | |
Ratio of net investment income (loss) to average net assets | | | 1.19% | (c) | | | 0.90% | | | | 1.28% | | | | 1.91% | | | | 1.63% | | | | 1.45% | |
| (a) | Net investment income (loss) allocated based on average shares method. |
| (b) | Total return measures net investment income (loss) and capital gain or loss from portfolio investments assuming reinvestment of dividends and capital gains distributions. Total return is not annualized for periods that are less than a full year, does not reflect the effect of sales charge for Class A shares nor the contingent deferred sales charge for Class C shares and does not reflect the deduction of taxes that a shareholder would pay on fund distributions or the redemption of fund shares. |
Calamos International Growth Fund Financial Highlights
Selected data for a share outstanding throughout each period were as follows:
| | | | | | | | | | | | | | | | | | | | | | | | |
| | | CLASS A | |
| | | (Unaudited)
Six Months
Ended
April 30, | | | Year Ended October 31, | |
| | | 2019 | | | 2018 | | | 2017 | | | 2016 | | | 2015 | | | 2014 | |
| | | | | | |
Net asset value, beginning of period | | | $18.10 | | | | $21.55 | | | | $16.65 | | | | $17.27 | | | | $19.27 | | | | $19.24 | |
| | | | | | |
Income from investment operations: | | | | | | | | | | | | | | | | | | | | | | | | |
| | | | | | |
Net investment income (loss)(a) | | | 0.06 | | | | 0.15 | | | | 0.07 | | | | 0.05 | | | | 0.09 | | | | 0.09 | |
| | | | | | |
Net realized and unrealized gain (loss) | | | 1.27 | | | | (2.78 | ) | | | 4.83 | | | | (0.65 | ) | | | 0.02 | | | | 0.02 | |
| | | | | | |
Total from investment operations | | | 1.33 | | | | (2.63 | ) | | | 4.90 | | | | (0.60 | ) | | | 0.11 | | | | 0.11 | |
| | | | | | |
Distributions: | | | | | | | | | | | | | | | | | | | | | | | | |
| | | | | | |
Dividends from net investment income | | | — | | | | — | | | | — | | | | — | | | | — | | | | (0.08 | ) |
| | | | | | |
Dividends from net realized gains | | | (2.02 | ) | | | (0.82 | ) | | | — | | | | (0.02 | ) | | | (2.11 | ) | | | — | |
| | | | | | |
Return of capital | | | — | | | | — | | | | — | | | | (0.00 | )* | | | — | | | | — | |
| | | | | | |
Total distributions | | | (2.02 | ) | | | (0.82 | ) | | | — | | | | (0.02 | ) | | | (2.11 | ) | | | (0.08 | ) |
| | | | | | |
Net asset value, end of period | | | $17.41 | | | | $18.10 | | | | $21.55 | | | | $16.65 | | | | $17.27 | | | | $19.27 | |
| | | | | | |
Ratios and supplemental data: | | | | | | | | | | | | | | | | | | | | | | | | |
| | | | | | |
Total return(b) | | | 9.48% | | | | (12.70% | ) | | | 29.43% | | | | (3.46% | ) | | | 0.94% | | | | 0.57% | |
| | | | | | |
Net assets, end of period (000) | | | $57,277 | | | | $59,566 | | | | $72,491 | | | | $111,036 | | | | $209,548 | | | | $254,400 | |
| | | | | | |
Ratio of net expenses to average net assets | | | 1.10% | (c) | | | 1.33% | | | | 1.40% | | | | 1.38% | | | | 1.31% | | | | 1.39% | |
| | | | | | |
Ratio of gross expenses to average net assets prior to expense reductions | | | 1.58% | (c) | | | 1.51% | | | | 1.46% | | | | 1.39% | | | | 1.31% | | | | 1.39% | |
| | | | | | |
Ratio of net investment income (loss) to average net assets | | | 0.69% | (c) | | | 0.71% | | | | 0.41% | | | | 0.32% | | | | 0.52% | | | | 0.43% | |
| | |
| | | (Unaudited)
Six Months
Ended
April 30, | | | Year Ended October 31, | |
| | | 2019 | | | 2018 | | | 2017 | | | 2016 | | | 2015 | | | 2014 | |
| | | | | | |
Portfolio turnover rate | | | 35.4% | | | | 111.8% | | | | 100.4% | | | | 69.0% | | | | 65.0% | | | | 81.6% | |
| |
| | | CLASS C | |
| | | (Unaudited)
Six Months
Ended
April 30, | | | Year Ended October 31, | |
| | | 2019 | | | 2018 | | | 2017 | | | 2016 | | | 2015 | | | 2014 | |
| | | | | | |
Net asset value, beginning of period | | | $16.38 | | | | $19.72 | | | | $15.35 | | | | $16.04 | | | | $18.18 | | | | $18.21 | |
|
Income from investment operations: | |
| | | | | | |
Net investment income (loss)(a) | | | (0.02 | ) | | | (0.03 | ) | | | (0.05 | ) | | | (0.07 | ) | | | (0.04 | ) | | | (0.06 | ) |
| | | | | | |
Net realized and unrealized gain (loss) | | | 1.13 | | | | (2.49 | ) | | | 4.42 | | | | (0.60 | ) | | | 0.01 | | | | 0.03 | |
| | | | | | |
Total from investment operations | | | 1.11 | | | | (2.52 | ) | | | 4.37 | | | | (0.67 | ) | | | (0.03 | ) | | | (0.03 | ) |
|
Distributions: | |
| | | | | | |
Dividends from net investment income | | | — | | | | — | | | | — | | | | — | | | | — | | | | — | |
| | | | | | |
Dividends from net realized gains | | | (2.02 | ) | | | (0.82 | ) | | | — | | | | (0.02 | ) | | | (2.11 | ) | | | — | |
| | | | | | |
Return of capital | | | — | | | | — | | | | — | | | | (0.00 | )* | | | — | | | | — | |
| | | | | | |
Total distributions | | | (2.02 | ) | | | (0.82 | ) | | | — | | | | (0.02 | ) | | | (2.11 | ) | | | — | |
| | | | | | |
Net asset value, end of period | | | $15.47 | | | | $16.38 | | | | $19.72 | | | | $15.35 | | | | $16.04 | | | | $18.18 | |
|
Ratios and supplemental data: | |
| | | | | | |
Total return(b) | | | 9.10% | | | | (13.35% | ) | | | 28.47% | | | | (4.16% | ) | | | 0.15% | | | | (0.16% | ) |
| | | | | | |
Net assets, end of period (000) | | | $11,198 | | | | $20,449 | | | | $27,840 | | | | $35,537 | | | | $47,996 | | | | $59,756 | |
| | | | | | |
Ratio of net expenses to average net assets | | | 1.85% | (c) | | | 2.06% | | | | 2.15% | | | | 2.13% | | | | 2.06% | | | | 2.13% | |
| | | | | | |
Ratio of gross expenses to average net assets prior to expense reductions | | | 2.32% | (c) | | | 2.26% | | | | 2.21% | | | | 2.14% | | | | 2.06% | | | | 2.13% | |
| | | | | | |
Ratio of net investment income (loss) to average net assets | | | (0.32% | )(c) | | | (0.17% | ) | | | (0.33% | ) | | | (0.46% | ) | | | (0.23% | ) | | | (0.32% | ) |
| * | Amounts are less than $0.005. |
| (a) | Net investment income (loss) allocated based on average shares method. |
| (b) | Total return measures net investment income (loss) and capital gain or loss from portfolio investments assuming reinvestment of dividends and capital gains distributions. Total return is not annualized for periods that are less than a full year, does not reflect the effect of sales charge for Class A shares nor the contingent deferred sales charge for Class C shares and does not reflect the deduction of taxes that a shareholder would pay on fund distributions or the redemption of fund shares. |
| | | | |
| 216 | | CALAMOS OPEN-END FAMILY OF FUNDS SEMIANNUAL REPORT | | |
Calamos International Growth Fund Financial Highlights
| | | | | | | | | | | | | | | | | | | | | | | | |
| | | CLASS I | |
| | | (Unaudited)
Six Months
Ended
April 30, | | | Year Ended October 31, | |
| | | 2019 | | | 2018 | | | 2017 | | | 2016 | | | 2015 | | | 2014 | |
| | | | | | |
Net asset value, beginning of period | | | $18.55 | | | | $22.01 | | | | $16.96 | | | | $17.54 | | | | $19.50 | | | | $19.48 | |
|
Income from investment operations: | |
| | | | | | |
Net investment income (loss)(a) | | | 0.08 | | | | 0.18 | | | | 0.12 | | | | 0.09 | | | | 0.14 | | | | 0.13 | |
| | | | | | |
Net realized and unrealized gain (loss) | | | 1.32 | | | | (2.82 | ) | | | 4.93 | | | | (0.65 | ) | | | 0.01 | | | | 0.03 | |
| | | | | | |
Total from investment operations | | | 1.40 | | | | (2.64 | ) | | | 5.05 | | | | (0.56 | ) | | | 0.15 | | | | 0.16 | |
|
Distributions: | |
| | | | | | |
Dividends from net investment income | | | — | | | | — | | | | — | | | | — | | | | — | | | | (0.14 | ) |
| | | | | | |
Dividends from net realized gains | | | (2.02 | ) | | | (0.82 | ) | | | — | | | | (0.02 | ) | | | (2.11 | ) | | | — | |
| | | | | | |
Return of capital | | | — | | | | — | | | | — | | | | (0.00 | )* | | | — | | | | — | |
| | | | | | |
Total distributions | | | (2.02 | ) | | | (0.82 | ) | | | — | | | | (0.02 | ) | | | (2.11 | ) | | | (0.14 | ) |
| | | | | | |
Net asset value, end of period | | | $17.93 | | | | $18.55 | | | | $22.01 | | | | $16.96 | | | | $17.54 | | | | $19.50 | |
|
Ratios and supplemental data: | |
| | | | | | |
Total return(b) | | | 9.65% | | | | (12.48% | ) | | | 29.78% | | | | (3.18% | ) | | | 1.16% | | | | 0.80% | |
| | | | | | |
Net assets, end of period (000) | | | $140,919 | | | | $153,312 | | | | $175,070 | | | | $213,166 | | | | $339,909 | | | | $410,485 | |
| | | | | | |
Ratio of net expenses to average net assets | | | 0.85% | (c) | | | 1.06% | | | | 1.15% | | | | 1.13% | | | | 1.06% | | | | 1.14% | |
| | | | | | |
Ratio of gross expenses to average net assets prior to expense reductions | | | 1.33% | (c) | | | 1.26% | | | | 1.21% | | | | 1.14% | | | | 1.06% | | | | 1.14% | |
| | | | | | |
Ratio of net investment income (loss) to average net assets | | | 0.92% | (c) | | | 0.85% | | | | 0.66% | | | | 0.53% | | | | 0.78% | | | | 0.66% | |
| | | | | | | | |
| | | CLASS R6 | |
| | | (Unaudited)
Six Months
Ended
April 30, | | | September 17, 2018•
through October 31, | |
| | | 2019 | | | 2018 | |
| | |
Net asset value, beginning of period | | | $18.66 | | | | $20.89 | |
|
Income from investment operations: | |
| | |
Net investment income (loss)(a) | | | 0.18 | | | | 0.01 | |
| | |
Net realized and unrealized gain (loss) | | | 1.24 | | | | (2.24 | ) |
| | |
Total from investment operations | | | 1.42 | | | | (2.23 | ) |
|
Distributions: | |
| | |
Dividends from net investment income | | | — | | | | — | |
| | |
Dividends from net realized gains | | | (2.02 | ) | | | — | |
| | |
Total distributions | | | (2.02 | ) | | | — | |
| | |
Net asset value, end of period | | | $18.06 | | | | $18.66 | |
|
Ratios and supplemental data: | |
| | |
Total return(b) | | | 9.70% | | | | (10.67% | ) |
| | |
Net assets, end of period (000) | | | $7,684 | | | | $22 | |
| | |
Ratio of net expenses to average net assets | | | 0.71% | (c) | | | 0.76% | (c) |
| | |
Ratio of gross expenses to average net assets prior to expense reductions | | | 1.23% | (c) | | | 1.21% | (c) |
| | |
Ratio of net investment income (loss) to average net assets | | | 2.13% | (c) | | | 0.34% | (c) |
| • | Commencement of operations. |
| * | Amounts are less than $0.005. |
| (a) | Net investment income (loss) allocated based on average shares method. |
| (b) | Total return measures net investment income (loss) and capital gain or loss from portfolio investments assuming reinvestment of dividends and capital gains distributions. Total return is not annualized for periods that are less than a full year, does not reflect the effect of sales charge for Class A shares nor the contingent deferred sales charge for Class C shares and does not reflect the deduction of taxes that a shareholder would pay on fund distributions or the redemption of fund shares. |
Calamos Evolving World Growth Fund Financial Highlights
Selected data for a share outstanding throughout each period were as follows:
| | | | | | | | | | | | | | | | | | | | | | | | |
| | | CLASS A | |
| | | (Unaudited)
Six Months
Ended
April 30, | | | Year Ended October 31, | |
| | | 2019 | | | 2018 | | | 2017 | | | 2016 | | | 2015 | | | 2014 | |
| | | | | | |
Net asset value, beginning of period | | | $12.54 | | | | $14.83 | | | | $12.11 | | | | $12.11 | | | | $13.73 | | | | $13.97 | |
|
Income from investment operations: | |
| | | | | | |
Net investment income (loss)(a) | | | 0.00 | * | | | (0.01 | ) | | | 0.05 | | | | 0.03 | | | | 0.02 | | | | 0.06 | |
| | | | | | |
Net realized and unrealized gain (loss) | | | 1.56 | | | | (2.28 | ) | | | 2.67 | | | | (0.02 | ) | | | (1.31 | ) | | | (0.18 | ) |
| | | | | | |
Total from investment operations | | | 1.56 | | | | (2.29 | ) | | | 2.72 | | | | 0.01 | | | | (1.29 | ) | | | (0.12 | ) |
|
Distributions: | |
| | | | | | |
Dividends from net investment income | | | — | | | | (0.00 | )* | | | — | | | | (0.01 | ) | | | (0.03 | ) | | | (0.01 | ) |
| | | | | | |
Dividends from net realized gains | | | — | | | | — | | | | — | | | | — | | | | (0.30 | ) | | | (0.11 | ) |
| | | | | | |
Return of capital | | | — | | | | (0.00 | )* | | | — | | | | (0.00 | )* | | | (0.00 | )* | | | — | |
| | | | | | |
Total distributions | | | — | | | | (0.00 | )* | | | — | | | | (0.01 | ) | | | (0.33 | ) | | | (0.12 | ) |
| | | | | | |
Net asset value, end of period | | | $14.10 | | | | $12.54 | | | | $14.83 | | | | $12.11 | | | | $12.11 | | | | $13.73 | |
|
Ratios and supplemental data: | |
| | | | | | |
Total return(b) | | | 12.44% | | | | (15.43% | ) | | | 22.46% | | | | 0.08% | | | | (9.56% | ) | | | (0.84% | ) |
| | | | | | |
Net assets, end of period (000) | | | $34,009 | | | | $34,678 | | | | $68,142 | | | | $102,545 | | | | $121,946 | | | | $168,332 | |
| | | | | | |
Ratio of net expenses to average net assets | | | 1.69% | (c) | | | 1.63% | | | | 1.67% | | | | 1.64% | | | | 1.65% | | | | 1.61% | |
| | | | | | |
Ratio of gross expenses to average net assets prior to expense reductions | | | 1.69% | (c) | | | 1.63% | | | | 1.67% | | | | 1.64% | | | | 1.65% | | | | 1.61% | |
| | | | | | |
Ratio of net investment income (loss) to average net assets | | | 0.05% | (c) | | | (0.08% | ) | | | 0.40% | | | | 0.23% | | | | 0.14% | | | | 0.45% | |
| | |
| | | (Unaudited)
Six Months
Ended
April 30, | | | Year Ended October 31, | |
| | | 2019 | | | 2018 | | | 2017 | | | 2016 | | | 2015 | | | 2014 | |
| | | | | | |
Portfolio turnover rate | | | 26.9% | | | | 97.3% | | | | 104.8% | | | | 87.4% | | | | 58.8% | | | | 99.9% | |
| |
| | | CLASS C | |
| | | (Unaudited)
Six Months
Ended
April 30, | | | Year Ended October 31, | |
| | | 2019 | | | 2018 | | | 2017 | | | 2016 | | | 2015 | | | 2014 | |
| | | | | | |
Net asset value, beginning of period | | | $11.78 | | | | $14.03 | | | | $11.55 | | | | $11.62 | | | | $13.26 | | | | $13.59 | |
|
Income from investment operations: | |
| | | | | | |
Net investment income (loss)(a) | | | (0.04 | ) | | | (0.12 | ) | | | (0.03 | ) | | | (0.06 | ) | | | (0.07 | ) | | | (0.04 | ) |
| | | | | | |
Net realized and unrealized gain (loss) | | | 1.45 | | | | (2.13 | ) | | | 2.51 | | | | (0.01 | ) | | | (1.27 | ) | | | (0.18 | ) |
| | | | | | |
Total from investment operations | | | 1.41 | | | | (2.25 | ) | | | 2.48 | | | | (0.07 | ) | | | (1.34 | ) | | | (0.22 | ) |
|
Distributions: | |
| | | | | | |
Dividends from net investment income | | | — | | | | — | | | | — | | | | — | | | | — | | | | — | |
| | | | | | |
Dividends from net realized gains | | | — | | | | — | | | | — | | | | — | | | | (0.30 | ) | | | (0.11 | ) |
| | | | | | |
Return of capital | | | — | | | | — | | | | — | | | | (0.00 | )* | | | (0.00 | )* | | | — | |
| | | | | | |
Total distributions | | | — | | | | — | | | | — | | | | — | | | | (0.30 | ) | | | (0.11 | ) |
| | | | | | |
Net asset value, end of period | | | $13.19 | | | | $11.78 | | | | $14.03 | | | | $11.55 | | | | $11.62 | | | | $13.26 | |
|
Ratios and supplemental data: | |
| | | | | | |
Total return(b) | | | 11.97% | | | | (16.04% | ) | | | 21.47% | | | | (0.60% | ) | | | (10.25% | ) | | | (1.59% | ) |
| | | | | | |
Net assets, end of period (000) | | | $15,961 | | | | $17,739 | | | | $24,846 | | | | $31,231 | | | | $36,532 | | | | $44,611 | |
| | | | | | |
Ratio of net expenses to average net assets | | | 2.44% | (c) | | | 2.38% | | | | 2.41% | | | | 2.39% | | | | 2.40% | | | | 2.37% | |
| | | | | | |
Ratio of gross expenses to average net assets prior to expense reductions | | | 2.44% | (c) | | | 2.38% | | | | 2.41% | | | | 2.39% | | | | 2.40% | | | | 2.37% | |
| | | | | | |
Ratio of net investment income (loss) to average net assets | | | (0.69% | )(c) | | | (0.85% | ) | | | (0.29% | ) | | | (0.54% | ) | | | (0.59% | ) | | | (0.33% | ) |
| * | Amounts are less than $0.005. |
| (a) | Net investment income (loss) allocated based on average shares method. |
| (b) | Total return measures net investment income (loss) and capital gain or loss from portfolio investments assuming reinvestment of dividends and capital gains distributions. Total return is not annualized for periods that are less than a full year, does not reflect the effect of sales charge for Class A shares nor the contingent deferred sales charge for Class C shares and does not reflect the deduction of taxes that a shareholder would pay on fund distributions or the redemption of fund shares. |
| | | | |
| 218 | | CALAMOS OPEN-END FAMILY OF FUNDS SEMIANNUAL REPORT | | |
Calamos Evolving World Growth Fund Financial Highlights
| | | | | | | | | | | | | | | | | | | | | | | | |
| | | CLASS I | |
| | | (Unaudited)
Six Months
Ended
April 30, | | | Year Ended October 31, | |
| | | 2019 | | | 2018 | | | 2017 | | | 2016 | | | 2015 | | | 2014 | |
| | | | | | |
Net asset value, beginning of period | | | $12.63 | | | | $14.96 | | | | $12.19 | | | | $12.19 | | | | $13.83 | | | | $14.07 | |
|
Income from investment operations: | |
| | | | | | |
Net investment income (loss)(a) | | | 0.02 | | | | 0.02 | | | | 0.09 | | | | 0.06 | | | | 0.05 | | | | 0.09 | |
| | | | | | |
Net realized and unrealized gain (loss) | | | 1.57 | | | | (2.29 | ) | | | 2.68 | | | | (0.01 | ) | | | (1.32 | ) | | | (0.18 | ) |
| | | | | | |
Total from investment operations | | | 1.59 | | | | (2.27 | ) | | | 2.77 | | | | 0.05 | | | | (1.27 | ) | | | (0.09 | ) |
|
Distributions: | |
| | | | | | |
Dividends from net investment income | | | — | | | | (0.06 | ) | | | — | | | | (0.05 | ) | | | (0.07 | ) | | | (0.04 | ) |
| | | | | | |
Dividends from net realized gains | | | — | | | | — | | | | — | | | | — | | | | (0.30 | ) | | | (0.11 | ) |
| | | | | | |
Return of capital | | | — | | | | (0.00 | )* | | | — | | | | (0.00 | )* | | | (0.00 | )* | | | — | |
| | | | | | |
Total distributions | | | — | | | | (0.06 | ) | | | — | | | | (0.05 | ) | | | (0.37 | ) | | | (0.15 | ) |
| | | | | | |
Net asset value, end of period | | | $14.22 | | | | $12.63 | | | | $14.96 | | | | $12.19 | | | | $12.19 | | | | $13.83 | |
|
Ratios and supplemental data: | |
| | | | | | |
Total return(b) | | | 12.59% | | | | (15.21% | ) | | | 22.72% | | | | 0.38% | | | | (9.35% | ) | | | (0.60% | ) |
| | | | | | |
Net assets, end of period (000) | | | $137,268 | | | | $152,114 | | | | $225,339 | | | | $255,965 | | | | $351,571 | | | | $436,546 | |
| | | | | | |
Ratio of net expenses to average net assets | | | 1.44% | (c) | | | 1.38% | | | | 1.41% | | | | 1.39% | | | | 1.40% | | | | 1.37% | |
| | | | | | |
Ratio of gross expenses to average net assets prior to expense reductions | | | 1.44% | (c) | | | 1.38% | | | | 1.41% | | | | 1.39% | | | | 1.40% | | | | 1.37% | |
| | | | | | |
Ratio of net investment income (loss) to average net assets | | | 0.31% | (c) | | | 0.14% | | | | 0.72% | | | | 0.50% | | | | 0.42% | | | | 0.65% | |
| * | Amounts are less than $0.005. |
| (a) | Net investment income (loss) allocated based on average shares method. |
| (b) | Total return measures net investment income (loss) and capital gain or loss from portfolio investments assuming reinvestment of dividends and capital gains distributions. Total return is not annualized for periods that are less than a full year, does not reflect the effect of sales charge for Class A shares nor the contingent deferred sales charge for Class C shares and does not reflect the deduction of taxes that a shareholder would pay on fund distributions or the redemption of fund shares. |
Calamos Emerging Market Equity Fund Financial Highlights
Selected data for a share outstanding throughout each period were as follows:
| | | | | | | | | | | | | | | | | | | | | | | | |
| | | CLASS A | |
| | | (Unaudited)
Six Months
Ended
April 30, | | | Year Ended October 31, | | | December 31, 2013• through October 31, | |
| | | 2019 | | | 2018 | | | 2017 | | | 2016 | | | 2015 | | | 2014 | |
| | | | | | |
Net asset value, beginning of period | | | $8.54 | | | | $10.58 | | | | $8.61 | | | | $8.41 | | | | $9.84 | | | | $10.00 | |
|
Income from investment operations: | |
| | | | | | |
Net investment income (loss)(a) | | | (0.01 | ) | | | 0.00 | * | | | 0.00 | * | | | (0.02 | ) | | | (0.01 | ) | | | 0.02 | |
| | | | | | |
Net realized and unrealized gain (loss) | | | 1.30 | | | | (2.02 | ) | | | 1.97 | | | | 0.23 | | | | (1.37 | ) | | | (0.18 | ) |
| | | | | | |
Total from investment operations | | | 1.29 | | | | (2.02 | ) | | | 1.97 | | | | 0.21 | | | | (1.38 | ) | | | (0.16 | ) |
|
Distributions: | |
| | | | | | |
Dividends from net investment income | | | — | | | | (0.02 | ) | | | — | | | | (0.01 | ) | | | (0.05 | ) | | | — | |
| | | | | | |
Dividends from net realized gains | | | — | | | | — | | | | — | | | | — | | | | — | | | | — | |
| | | | | | |
Return of capital | | | — | | | | (0.00 | )* | | | — | | | | — | | | | — | | | | — | |
| | | | | | |
Total distributions | | | — | | | | (0.02 | ) | | | — | | | | (0.01 | ) | | | (0.05 | ) | | | — | |
| | | | | | |
Net asset value, end of period | | | $9.83 | | | | $8.54 | | | | $10.58 | | | | $8.61 | | | | $8.41 | | | | $9.84 | |
|
Ratios and supplemental data: | |
| | | | | | |
Total return(b) | | | 15.11% | | | | (19.14% | ) | | | 22.88% | | | | 2.49% | | | | (14.09% | ) | | | (1.60% | ) |
| | | | | | |
Net assets, end of period (000) | | | $5,208 | | | | $4,479 | | | | $5,491 | | | | $4,483 | | | | $4,465 | | | | $5,360 | |
| | | | | | |
Ratio of net expenses to average net assets | | | 1.75% | (c) | | | 1.75% | | | | 1.75% | | | | 1.67% | | | | 1.75% | | | | 1.75% | (c) |
| | | | | | |
Ratio of gross expenses to average net assets prior to expense reductions | | | 2.26% | (c) | | | 2.28% | | | | 2.67% | | | | 2.49% | | | | 2.43% | | | | 3.45% | (c) |
| | | | | | |
Ratio of net investment income (loss) to average net assets | | | (0.31% | )(c) | | | (0.01% | ) | | | 0.04% | | | | (0.23% | ) | | | (0.14% | ) | | | 0.24% | (c) |
| | | |
| | | (Unaudited)
Six Months
Ended
April 30, | | | Year Ended October 31, | | | December 31, 2013• through October 31, | |
| | | 2019 | | | 2018 | | | 2017 | | | 2016 | | | 2015 | | | 2014 | |
| | | | | | |
Portfolio turnover rate | | | 30.0% | | | | 99.8% | | | | 104.0% | | | | 74.8% | | | | 68.0% | | | | 109.2% | |
| |
| | | CLASS C | |
| | | (Unaudited)
Six Months
Ended
April 30, | | | Year Ended October 31, | | | December 31, 2013•
through October 31, | |
| | | 2019 | | | 2018 | | | 2017 | | | 2016 | | | 2015 | | | 2014 | |
| | | | | | |
Net asset value, beginning of period | | | $8.31 | | | | $10.36 | | | | $8.49 | | | | $8.34 | | | | $9.78 | | | | $10.00 | |
|
Income from investment operations: | |
| | | | | | |
Net investment income (loss)(a) | | | (0.05 | ) | | | (0.08 | ) | | | (0.06 | ) | | | (0.08 | ) | | | (0.07 | ) | | | (0.04 | ) |
| | | | | | |
Net realized and unrealized gain (loss) | | | 1.27 | | | | (1.97 | ) | | | 1.93 | | | | 0.23 | | | | (1.37 | ) | | | (0.18 | ) |
| | | | | | |
Total from investment operations | | | 1.22 | | | | (2.05 | ) | | | 1.87 | | | | 0.15 | | | | (1.44 | ) | | | (0.22 | ) |
|
Distributions: | |
| | | | | | |
Dividends from net investment income | | | — | | | | — | | | | — | | | | — | | | | — | | | | — | |
| | | | | | |
Dividends from net realized gains | | | — | | | | — | | | | — | | | | — | | | | — | | | | — | |
| | | | | | |
Total distributions | | | — | | | | — | | | | — | | | | — | | | | — | | | | — | |
| | | | | | |
Net asset value, end of period | | | $9.53 | | | | $8.31 | | | | $10.36 | | | | $8.49 | | | | $8.34 | | | | $9.78 | |
| | | | | | |
Ratios and supplemental data: | | | | | | | | | | | | | | | | | | | | | | | | |
| | | | | | |
Total return(b) | | | 14.68% | | | | (19.79% | ) | | | 22.03% | | | | 1.80% | | | | (14.72% | ) | | | (2.20% | ) |
| | | | | | |
Net assets, end of period (000) | | | $228 | | | | $284 | | | | $386 | | | | $280 | | | | $241 | | | | $288 | |
| | | | | | |
Ratio of net expenses to average net assets | | | 2.50% | (c) | | | 2.50% | | | | 2.50% | | | | 2.43% | | | | 2.50% | | | | 2.50% | (c) |
| | | | | | |
Ratio of gross expenses to average net assets prior to expense reductions | | | 3.02% | (c) | | | 3.03% | | | | 3.42% | | | | 3.24% | | | | 3.22% | | | | 4.08% | (c) |
| | | | | | |
Ratio of net investment income (loss) to average net assets | | | (1.07% | )(c) | | | (0.77% | ) | | | (0.69% | ) | | | (0.98% | ) | | | (0.80% | ) | | | (0.45% | )(c) |
| • | Commencement of operations. |
| * | Amounts are less than $0.005. |
| (a) | Net investment income (loss) allocated based on average shares method. |
| (b) | Total return measures net investment income (loss) and capital gain or loss from portfolio investments assuming reinvestment of dividends and capital gains distributions. Total return is not annualized for periods that are less than a full year, does not reflect the effect of sales charge for Class A shares nor the contingent deferred sales charge for Class C shares and does not reflect the deduction of taxes that a shareholder would pay on fund distributions or the redemption of fund shares. |
| | | | |
| 220 | | CALAMOS OPEN-END FAMILY OF FUNDS SEMIANNUAL REPORT | | |
Calamos Emerging Market Equity Fund Financial Highlights
| | | | | | | | | | | | | | | | | | | | | | | | |
| | | CLASS I | |
| | | (Unaudited)
Six Months
Ended
April 30, | | | Year Ended October 31, | | | December 31, 2013• through
October 31, | |
| | | 2019 | | | 2018 | | | 2017 | | | 2016 | | | 2015 | | | 2014 | |
| | | | | | |
Net asset value, beginning of period | | | $8.58 | | | | $10.63 | | | | $8.62 | | | | $8.43 | | | | $9.86 | | | | $10.00 | |
| | | | | | |
Income from investment operations: | | | | | | | | | | | | | | | | | | | | | | | | |
| | | | | | |
Net investment income (loss)(a) | | | (0.00 | )* | | | 0.03 | | | | 0.03 | | | | 0.00 | * | | | 0.02 | | | | 0.04 | |
| | | | | | |
Net realized and unrealized gain (loss) | | | 1.30 | | | | (2.04 | ) | | | 1.98 | | | | 0.23 | | | | (1.39 | ) | | | (0.18 | ) |
| | | | | | |
Total from investment operations | | | 1.30 | | | | (2.01 | ) | | | 2.01 | | | | 0.23 | | | | (1.37 | ) | | | (0.14 | ) |
| | | | | | |
Distributions: | | | | | | | | | | | | | | | | | | | | | | | | |
| | | | | | |
Dividends from net investment income | | | (0.00 | )* | | | (0.04 | ) | | | — | | | | (0.04 | ) | | | (0.06 | ) | | | — | |
| | | | | | |
Dividends from net realized gains | | | — | | | | — | | | | — | | | | — | | | | — | | | | — | |
| | | | | | |
Return of capital | | | — | | | | (0.00 | )* | | | — | | | | (0.00 | )* | | | — | | | | — | |
| | | | | | |
Total distributions | | | (0.00 | )* | | | (0.04 | ) | | | — | | | | (0.04 | ) | | | (0.06 | ) | | | — | |
| | | | | | |
Net asset value, end of period | | | $9.88 | | | | $8.58 | | | | $10.63 | | | | $8.62 | | | | $8.43 | | | | $9.86 | |
| | | | | | |
Ratios and supplemental data: | | | | | | | | | | | | | | | | | | | | | | | | |
| | | | | | |
Total return(b) | | | 15.22% | | | | (18.96% | ) | | | 23.32% | | | | 2.75% | | | | (13.92% | ) | | | (1.40% | ) |
| | | | | | |
Net assets, end of period (000) | | | $10,377 | | | | $9,236 | | | | $11,207 | | | | $9,039 | | | | $8,763 | | | | $9,701 | |
| | | | | | |
Ratio of net expenses to average net assets | | | 1.50% | (c) | | | 1.50% | | | | 1.50% | | | | 1.42% | | | | 1.50% | | | | 1.50% | (c) |
| | | | | | |
Ratio of gross expenses to average net assets prior to expense reductions | | | 2.01% | (c) | | | 2.03% | | | | 2.42% | | | | 2.24% | | | | 2.23% | | | | 3.04% | (c) |
| | | | | | |
Ratio of net investment income (loss) to average net assets | | | (0.06% | )(c) | | | 0.26% | | | | 0.30% | | | | 0.02% | | | | 0.21% | | | | 0.50% | (c) |
| • | Commencement of operations. |
| * | Amounts are less than $0.005. |
| (a) | Net investment income (loss) allocated based on average shares method. |
| (b) | Total return measures net investment income (loss) and capital gain or loss from portfolio investments assuming reinvestment of dividends and capital gains distributions. Total return is not annualized for periods that are less than a full year, does not reflect the effect of sales charge for Class A shares nor the contingent deferred sales charge for Class C shares and does not reflect the deduction of taxes that a shareholder would pay on fund distributions or the redemption of fund shares. |
Calamos Global Equity Fund Financial Highlights
Selected data for a share outstanding throughout each period were as follows:
| | | | | | | | | | | | | | | | | | | | | | | | |
| | | CLASS A | |
| | | (Unaudited)
Six Months
Ended
April 30, | | | Year Ended October 31, | |
| | | 2019 | | | 2018 | | | 2017 | | | 2016 | | | 2015 | | | 2014 | |
| | | | | | |
Net asset value, beginning of period | | | $13.61 | | | | $15.63 | | | | $12.74 | | | | $13.19 | | | | $15.67 | | | | $14.97 | |
| | | | | | |
Income from investment operations: | | | | | | | | | | | | | | | | | | | | | | | | |
| | | | | | |
Net investment income (loss)(a) | | | 0.00 | * | | | 0.00 | * | | | (0.00 | )* | | | 0.01 | | | | 0.00 | * | | | (0.01 | ) |
| | | | | | |
Net realized and unrealized gain (loss) | | | 0.77 | | | | (0.63 | ) | | | 3.45 | | | | (0.21 | ) | | | 0.62 | | | | 1.08 | |
| | | | | | |
Total from investment operations | | | 0.77 | | | | (0.63 | ) | | | 3.45 | | | | (0.20 | ) | | | 0.62 | | | | 1.07 | |
| | | | | | |
Distributions: | | | | | | | | | | | | | | | | | | | | | | | | |
| | | | | | |
Dividends from net investment income | | | — | | | | — | | | | — | | | | — | | | | — | | | | (0.10 | ) |
| | | | | | |
Dividends from net realized gains | | | (2.75 | ) | | | (1.39 | ) | | | (0.56 | ) | | | (0.25 | ) | | | (3.10 | ) | | | (0.27 | ) |
| | | | | | |
Total distributions | | | (2.75 | ) | | | (1.39 | ) | | | (0.56 | ) | | | (0.25 | ) | | | (3.10 | ) | | | (0.37 | ) |
| | | | | | |
Net asset value, end of period | | | $11.63 | | | | $13.61 | | | | $15.63 | | | | $12.74 | | | | $13.19 | | | | $15.67 | |
| | | | | | |
Ratios and supplemental data: | | | | | | | | | | | | | | | | | | | | | | | | |
| | | | | | |
Total return(b) | | | 10.18% | | | | (4.59% | ) | | | 28.42% | | | | (1.47% | ) | | | 5.33% | | | | 7.25% | |
| | | | | | |
Net assets, end of period (000) | | | $29,530 | | | | $27,489 | | | | $26,957 | | | | $29,314 | | | | $67,141 | | | | $87,989 | |
| | | | | | |
Ratio of net expenses to average net assets | | | 1.40% | (c) | | | 1.40% | | | | 1.40% | | | | 1.38% | | | | 1.34% | | | | 1.40% | |
| | | | | | |
Ratio of gross expenses to average net assets prior to expense reductions | | | 1.52% | (c) | | | 1.56% | | | | 1.53% | | | | 1.50% | | | | 1.34% | | | | 1.40% | |
| | | | | | |
Ratio of net investment income (loss) to average net assets | | | 0.03% | (c) | | | 0.03% | | | | (0.02% | ) | | | 0.06% | | | | 0.00% | ** | | | (0.10% | ) |
| | |
| | | (Unaudited)
Six Months
Ended
April 30, | | | Year Ended October 31, | |
| | | 2019 | | | 2018 | | | 2017 | | | 2016 | | | 2015 | | | 2014 | |
| | | | | | |
Portfolio turnover rate | | | 24.5% | | | | 81.3% | | | | 102.0% | | | | 64.6% | | | | 43.0% | | | | 53.3% | |
| |
| | | CLASS C | |
| | | (Unaudited)
Six Months
Ended
April 30, | | | Year Ended October 31, | |
| | | 2019 | | | 2018 | | | 2017 | | | 2016 | | | 2015 | | | 2014 | |
| | | | | | |
Net asset value, beginning of period | | | $12.34 | | | | $14.40 | | | | $11.86 | | | | $12.39 | | | | $15.00 | | | | $14.36 | |
| | | | | | |
Income from investment operations: | | | | | | | | | | | | | | | | | | | | | | | | |
| | | | | | |
Net investment income (loss)(a) | | | (0.04 | ) | | | (0.10 | ) | | | (0.09 | ) | | | (0.08 | ) | | | (0.09 | ) | | | (0.12 | ) |
| | | | | | |
Net realized and unrealized gain (loss) | | | 0.64 | | | | (0.57 | ) | | | 3.19 | | | | (0.20 | ) | | | 0.58 | | | | 1.03 | |
| | | | | | |
Total from investment operations | | | 0.60 | | | | (0.67 | ) | | | 3.10 | | | | (0.28 | ) | | | 0.49 | | | | 0.91 | |
| | | | | | |
Distributions: | | | | | | | | | | | | | | | | | | | | | | | | |
| | | | | | |
Dividends from net investment income | | | — | | | | — | | | | — | | | | — | | | | — | | | | — | |
| | | | | | |
Dividends from net realized gains | | | (2.75 | ) | | | (1.39 | ) | | | (0.56 | ) | | | (0.25 | ) | | | (3.10 | ) | | | (0.27 | ) |
| | | | | | |
Total distributions | | | (2.75 | ) | | | (1.39 | ) | | | (0.56 | ) | | | (0.25 | ) | | | (3.10 | ) | | | (0.27 | ) |
| | | | | | |
Net asset value, end of period | | | $10.19 | | | | $12.34 | | | | $14.40 | | | | $11.86 | | | | $12.39 | | | | $15.00 | |
| | | | | | |
Ratios and supplemental data: | | | | | | | | | | | | | | | | | | | | | | | | |
| | | | | | |
Total return(b) | | | 9.79% | | | | (5.31% | ) | | | 27.53% | | | | (2.23% | ) | | | 4.55% | | | | 6.43% | |
| | | | | | |
Net assets, end of period (000) | | | $9,543 | | | | $10,887 | | | | $13,769 | | | | $16,375 | | | | $21,227 | | | | $28,811 | |
| | | | | | |
Ratio of net expenses to average net assets | | | 2.15% | (c) | | | 2.15% | | | | 2.15% | | | | 2.13% | | | | 2.09% | | | | 2.14% | |
| | | | | | |
Ratio of gross expenses to average net assets prior to expense reductions | | | 2.27% | (c) | | | 2.32% | | | | 2.27% | | | | 2.25% | | | | 2.09% | | | | 2.14% | |
| | | | | | |
Ratio of net investment income (loss) to average net assets | | | (0.77% | )(c) | | | (0.76% | ) | | | (0.76% | ) | | | (0.68% | ) | | | (0.76% | ) | | | (0.82% | ) |
| * | Amounts are less than $0.005. |
| ** | Amounts are less than 0.005%. |
| (a) | Net investment income (loss) allocated based on average shares method. |
| (b) | Total return measures net investment income (loss) and capital gain or loss from portfolio investments assuming reinvestment of dividends and capital gains distributions. Total return is not annualized for periods that are less than a full year, does not reflect the effect of sales charge for Class A shares nor the contingent deferred sales charge for Class C shares and does not reflect the deduction of taxes that a shareholder would pay on fund distributions or the redemption of fund shares. |
| | | | |
| 222 | | CALAMOS OPEN-END FAMILY OF FUNDS SEMIANNUAL REPORT | | |
Calamos Global Equity Fund Financial Highlights
| | | | | | | | | | | | | | | | | | | | | | | | |
| | | CLASS I | |
| | | (Unaudited)
Six Months
Ended
April 30, | | | Year Ended October 31, | |
| | | 2019 | | | 2018 | | | 2017 | | | 2016 | | | 2015 | | | 2014 | |
| | | | | | |
Net asset value, beginning of period | | | $13.93 | | | | $15.95 | | | | $12.95 | | | | $13.38 | | | | $15.81 | | | | $15.11 | |
| | | | | | |
Income from investment operations: | | | | | | | | | | | | | | | | | | | | | | | | |
| | | | | | |
Net investment income (loss)(a) | | | 0.02 | | | | 0.03 | | | | 0.03 | | | | 0.04 | | | | 0.04 | | | | 0.02 | |
| | | | | | |
Net realized and unrealized gain (loss) | | | 0.80 | | | | (0.64 | ) | | | 3.53 | | | | (0.22 | ) | | | 0.63 | | | | 1.09 | |
| | | | | | |
Total from investment operations | | | 0.82 | | | | (0.61 | ) | | | 3.56 | | | | (0.18 | ) | | | 0.67 | | | | 1.11 | |
| | | | | | |
Distributions: | | | | | | | | | | | | | | | | | | | | | | | | |
| | | | | | |
Dividends from net investment income | | | — | | | | (0.02 | ) | | | — | | | | — | | | | — | | | | (0.14 | ) |
| | | | | | |
Dividends from net realized gains | | | (2.75 | ) | | | (1.39 | ) | | | (0.56 | ) | | | (0.25 | ) | | | (3.10 | ) | | | (0.27 | ) |
| | | | | | |
Total distributions | | | (2.75 | ) | | | (1.41 | ) | | | (0.56 | ) | | | (0.25 | ) | | | (3.10 | ) | | | (0.41 | ) |
| | | | | | |
Net asset value, end of period | | | $12.00 | | | | $13.93 | | | | $15.95 | | | | $12.95 | | | | $13.38 | | | | $15.81 | |
| | | | | | |
Ratios and supplemental data: | | | | | | | | | | | | | | | | | | | | | | | | |
| | | | | | |
Total return(b) | | | 10.34% | | | | (4.38% | ) | | | 28.82% | | | | (1.30% | ) | | | 5.64% | | | | 7.48% | |
| | | | | | |
Net assets, end of period (000) | | | $56,314 | | | | $58,078 | | | | $86,429 | | | | $87,605 | | | | $96,390 | | | | $101,511 | |
| | | | | | |
Ratio of net expenses to average net assets | | | 1.15% | (c) | | | 1.15% | | | | 1.15% | | | | 1.13% | | | | 1.09% | | | | 1.15% | |
| | | | | | |
Ratio of gross expenses to average net assets prior to expense reductions | | | 1.27% | (c) | | | 1.31% | | | | 1.28% | | | | 1.25% | | | | 1.09% | | | | 1.15% | |
| | | | | | |
Ratio of net investment income (loss) to average net assets | | | 0.26% | (c) | | | 0.18% | | | | 0.23% | | | | 0.33% | | | | 0.26% | | | | 0.15% | |
| (a) | Net investment income (loss) allocated based on average shares method. |
| (b) | Total return measures net investment income (loss) and capital gain or loss from portfolio investments assuming reinvestment of dividends and capital gains distributions. Total return is not annualized for periods that are less than a full year, does not reflect the effect of sales charge for Class A shares nor the contingent deferred sales charge for Class C shares and does not reflect the deduction of taxes that a shareholder would pay on fund distributions or the redemption of fund shares. |
Calamos Global Growth and Income Fund Financial Highlights
Selected data for a share outstanding throughout each period were as follows:
| | | | | | | | | | | | | | | | | | | | | | | | |
| | | CLASS A | |
| | | (Unaudited)
Six Months
Ended
April 30, | | | Year Ended October 31, | |
| | | 2019 | | | 2018 | | | 2017 | | | 2016 | | | 2015 | | | 2014 | |
| | | | | | |
Net asset value, beginning of period | | | $8.99 | | | | $9.85 | | | | $8.47 | | | | $8.63 | | | | $10.22 | | | | $11.78 | |
| | | | | | |
Income from investment operations: | | | | | | | | | | | | | | | | | | | | | | | | |
| | | | | | |
Net investment income (loss)(a) | | | 0.05 | | | | 0.09 | | | | 0.10 | | | | 0.09 | | | | 0.10 | | | | 0.11 | |
| | | | | | |
Net realized and unrealized gain (loss) | | | 0.46 | | | | (0.35 | ) | | | 1.35 | | | | (0.14 | ) | | | 0.06 | | | | 0.36 | |
| | | | | | |
Total from investment operations | | | 0.51 | | | | (0.26 | ) | | | 1.45 | | | | (0.05 | ) | | | 0.16 | | | | 0.47 | |
| | | | | | |
Distributions: | | | | | | | | | | | | | | | | | | | | | | | | |
| | | | | | |
Dividends from net investment income | | | (0.04 | ) | | | (0.03 | ) | | | (0.01 | ) | | | — | | | | (0.04 | ) | | | (0.29 | ) |
| | | | | | |
Dividends from net realized gains | | | (0.88 | ) | | | (0.57 | ) | | | (0.06 | ) | | | (0.11 | ) | | | (1.71 | ) | | | (1.74 | ) |
| | | | | | |
Total distributions | | | (0.92 | ) | | | (0.60 | ) | | | (0.07 | ) | | | (0.11 | ) | | | (1.75 | ) | | | (2.03 | ) |
| | | | | | |
Net asset value, end of period | | | $8.58 | | | | $8.99 | | | | $9.85 | | | | $8.47 | | | | $8.63 | | | | $10.22 | |
| | | | | | |
Ratios and supplemental data: | | | | | | | | | | | | | | | | | | | | | | | | |
| | | | | | |
Total return(b) | | | 7.23% | | | | (2.91% | ) | | | 17.16% | | | | (0.59% | ) | | | 2.02% | | | | 4.77% | |
| | | | | | |
Net assets, end of period (000) | | | $89,093 | | | | $63,069 | | | | $78,196 | | | | $84,648 | | | | $111,615 | | | | $146,431 | |
| | | | | | |
Ratio of net expenses to average net assets | | | 1.53% | (c) | | | 1.50% | | | | 1.54% | | | | 1.46% | | | | 1.49% | | | | 1.44% | |
| | | | | | |
Ratio of gross expenses to average net assets prior to expense reductions | | | 1.53% | (c) | | | 1.50% | | | | 1.54% | | | | 1.46% | | | | 1.49% | | | | 1.44% | |
| | | | | | |
Ratio of net investment income (loss) to average net assets | | | 1.22% | (c) | | | 0.93% | | | | 1.16% | | | | 1.09% | | | | 1.18% | | | | 1.01% | |
| | |
| | | (Unaudited)
Six Months
Ended
April 30, | | | Year Ended October 31, | |
| | | 2019 | | | 2018 | | | 2017 | | | 2016 | | | 2015 | | | 2014 | |
| | | | | | |
Portfolio turnover rate | | | 18.4% | | | | 75.0% | | | | 100.2% | | | | 58.0% | | | | 54.7% | | | | 72.6% | |
| |
| | | CLASS C | |
| | | (Unaudited)
Six Months
Ended
April 30, | | | Year Ended October 31, | |
| | | 2019 | | | 2018 | | | 2017 | | | 2016 | | | 2015 | | | 2014 | |
| | | | | | |
Net asset value, beginning of period | | | $7.98 | | | | $8.84 | | | | $7.65 | | | | $7.87 | | | | $9.50 | | | | $11.06 | |
| | | | | | |
Income from investment operations: | | | | | | | | | | | | | | | | | | | | | | | | |
| | | | | | |
Net investment income (loss)(a) | | | 0.01 | | | | 0.02 | | | | 0.04 | | | | 0.03 | | | | 0.03 | | | | 0.03 | |
| | | | | | |
Net realized and unrealized gain (loss) | | | 0.41 | | | | (0.31 | ) | | | 1.21 | | | | (0.14 | ) | | | 0.05 | | | | 0.33 | |
| | | | | | |
Total from investment operations | | | 0.42 | | | | (0.29 | ) | | | 1.25 | | | | (0.11 | ) | | | 0.08 | | | | 0.36 | |
| | | | | | |
Distributions: | | | | | | | | | | | | | | | | | | | | | | | | |
| | | | | | |
Dividends from net investment income | | | — | | | | — | | | | — | | | | — | | | | — | | | | (0.18 | ) |
| | | | | | |
Dividends from net realized gains | | | (0.88 | ) | | | (0.57 | ) | | | (0.06 | ) | | | (0.11 | ) | | | (1.71 | ) | | | (1.74 | ) |
| | | | | | |
Total distributions | | | (0.88 | ) | | | (0.57 | ) | | | (0.06 | ) | | | (0.11 | ) | | | (1.71 | ) | | | (1.92 | ) |
| | | | | | |
Net asset value, end of period | | | $7.52 | | | | $7.98 | | | | $8.84 | | | | $7.65 | | | | $7.87 | | | | $9.50 | |
| | | | | | |
Ratios and supplemental data: | | | | | | | | | | | | | | | | | | | | | | | | |
| | | | | | |
Total return(b) | | | 6.86% | | | | (3.61% | ) | | | 16.41% | | | | (1.42% | ) | | | 1.19% | | | | 3.98% | |
| | | | | | |
Net assets, end of period (000) | | | $20,794 | | | | $54,425 | | | | $70,210 | | | | $90,640 | | | | $119,620 | | | | $151,091 | |
| | | | | | |
Ratio of net expenses to average net assets | | | 2.30% | (c) | | | 2.25% | | | | 2.29% | | | | 2.21% | | | | 2.24% | | | | 2.19% | |
| | | | | | |
Ratio of gross expenses to average net assets prior to expense reductions | | | 2.30% | (c) | | | 2.25% | | | | 2.29% | | | | 2.21% | | | | 2.24% | | | | 2.19% | |
| | | | | | |
Ratio of net investment income (loss) to average net assets | | | 0.41% | (c) | | | 0.18% | | | | 0.44% | | | | 0.34% | | | | 0.43% | | | | 0.27% | |
| (a) | Net investment income (loss) allocated based on average shares method. |
| (b) | Total return measures net investment income (loss) and capital gain or loss from portfolio investments assuming reinvestment of dividends and capital gains distributions. Total return is not annualized for periods that are less than a full year, does not reflect the effect of sales charge for Class A shares nor the contingent deferred sales charge for Class C shares and does not reflect the deduction of taxes that a shareholder would pay on fund distributions or the redemption of fund shares. |
| | | | |
| 224 | | CALAMOS OPEN-END FAMILY OF FUNDS SEMIANNUAL REPORT | | |
Calamos Global Growth and Income Fund Financial Highlights
| | | | | | | | | | | | | | | | | | | | | | | | |
| | | CLASS I | |
| | | (Unaudited)
Six Months
Ended
April 30, | | | Year Ended October 31, | |
| | | 2019 | | | 2018 | | | 2017 | | | 2016 | | | 2015 | | | 2014 | |
| | | | | | |
Net asset value, beginning of period | | | $9.25 | | | | $10.11 | | | | $8.70 | | | | $8.84 | | | | $10.43 | | | | $11.99 | |
| | | | | | |
Income from investment operations: | | | | | | | | | | | | | | | | | | | | | | | | |
| | | | | | |
Net investment income (loss)(a) | | | 0.06 | | | | 0.12 | | | | 0.13 | | | | 0.11 | | | | 0.13 | | | | 0.14 | |
| | | | | | |
Net realized and unrealized gain (loss) | | | 0.48 | | | | (0.36 | ) | | | 1.38 | | | | (0.14 | ) | | | 0.05 | | | | 0.36 | |
| | | | | | |
Total from investment operations | | | 0.54 | | | | (0.24 | ) | | | 1.51 | | | | (0.03 | ) | | | 0.18 | | | | 0.50 | |
| | | | | | |
Distributions: | | | | | | | | | | | | | | | | | | | | | | | | |
| | | | | | |
Dividends from net investment income | | | (0.05 | ) | | | (0.05 | ) | | | (0.04 | ) | | | — | | | | (0.06 | ) | | | (0.32 | ) |
| | | | | | |
Dividends from net realized gains | | | (0.88 | ) | | | (0.57 | ) | | | (0.06 | ) | | | (0.11 | ) | | | (1.71 | ) | | | (1.74 | ) |
| | | | | | |
Total distributions | | | (0.93 | ) | | | (0.62 | ) | | | (0.10 | ) | | | (0.11 | ) | | | (1.77 | ) | | | (2.06 | ) |
| | | | | | |
Net asset value, end of period | | | $8.86 | | | | $9.25 | | | | $10.11 | | | | $8.70 | | | | $8.84 | | | | $10.43 | |
| | | | | | |
Ratios and supplemental data: | | | | | | | | | | | | | | | | | | | | | | | | |
| | | | | | |
Total return(b) | | | 7.37% | | | | (2.65% | ) | | | 17.51% | | | | (0.35% | ) | | | 2.23% | | | | 4.99% | |
| | | | | | |
Net assets, end of period (000) | | | $58,781 | | | | $72,843 | | | | $73,361 | | | | $124,175 | | | | $146,241 | | | | $182,064 | |
| | | | | | |
Ratio of net expenses to average net assets | | | 1.29% | (c) | | | 1.25% | | | | 1.29% | | | | 1.21% | | | | 1.24% | | | | 1.19% | |
| | | | | | |
Ratio of gross expenses to average net assets prior to expense reductions | | | 1.29% | (c) | | | 1.25% | | | | 1.29% | | | | 1.21% | | | | 1.24% | | | | 1.19% | |
| | | | | | |
Ratio of net investment income (loss) to average net assets | | | 1.45% | (c) | | | 1.18% | | | | 1.43% | | | | 1.34% | | | | 1.43% | | | | 1.29% | |
| (a) | Net investment income (loss) allocated based on average shares method. |
| (b) | Total return measures net investment income (loss) and capital gain or loss from portfolio investments assuming reinvestment of dividends and capital gains distributions. Total return is not annualized for periods that are less than a full year, does not reflect the effect of sales charge for Class A shares nor the contingent deferred sales charge for Class C shares and does not reflect the deduction of taxes that a shareholder would pay on fund distributions or the redemption of fund shares. |
Calamos Total Return Bond Fund Financial Highlights
Selected data for a share outstanding throughout each period were as follows:
| | | | | | | | | | | | | | | | | | | | | | | | |
| | | CLASS A | |
| | | (Unaudited)
Six Months
Ended
April 30, | | | Year Ended October 31, | |
| | | 2019 | | | 2018 | | | 2017 | | | 2016 | | | 2015 | | | 2014 | |
| | | | | | |
Net asset value, beginning of period | | | $9.81 | | | | $10.39 | | | | $10.54 | | | | $10.51 | | | | $10.70 | | | | $10.89 | |
| | | | | | |
Income from investment operations: | | | | | | | | | | | | | | | | | | | | | | | | |
| | | | | | |
Net investment income (loss)(a) | | | 0.14 | | | | 0.25 | | | | 0.22 | | | | 0.24 | | | | 0.26 | | | | 0.26 | |
| | | | | | |
Net realized and unrealized gain (loss) | | | 0.35 | | | | (0.49 | ) | | | (0.13 | ) | | | 0.20 | | | | (0.05 | ) | | | 0.12 | |
| | | | | | |
Total from investment operations | | | 0.49 | | | | (0.24 | ) | | | 0.09 | | | | 0.44 | | | | 0.21 | | | | 0.38 | |
| | | | | | |
Distributions: | | | | | | | | | | | | | | | | | | | | | | | | |
| | | | | | |
Dividends from net investment income | | | (0.14 | ) | | | (0.26 | ) | | | (0.23 | ) | | | (0.28 | ) | | | (0.28 | ) | | | (0.53 | ) |
| | | | | | |
Dividends from net realized gains | | | — | | | | (0.05 | ) | | | (0.01 | ) | | | (0.13 | ) | | | (0.12 | ) | | | (0.04 | ) |
| | | | | | |
Return of capital | | | — | | | | (0.03 | ) | | | — | | | | — | | | | — | | | | — | |
| | | | | | |
Total distributions | | | (0.14 | ) | | | (0.34 | ) | | | (0.24 | ) | | | (0.41 | ) | | | (0.40 | ) | | | (0.57 | ) |
| | | | | | |
Net asset value, end of period | | | $10.16 | | | | $9.81 | | | | $10.39 | | | | $10.54 | | | | $10.51 | | | | $10.70 | |
| | | | | | |
Ratios and supplemental data: | | | | | | | | | | | | | | | | | | | | | | | | |
| | | | | | |
Total return(b) | | | 5.01% | | | | (2.30% | ) | | | 0.92% | | | | 4.35% | | | | 2.04% | | | | 3.71% | |
| | | | | | |
Net assets, end of period (000) | | | $20,309 | | | | $17,109 | | | | $21,707 | | | | $57,339 | | | | $51,462 | | | | $67,287 | |
| | | | | | |
Ratio of net expenses to average net assets | | | 0.90% | (c) | | | 0.90% | | | | 0.90% | | | | 0.88% | | | | 0.90% | | | | 0.90% | |
| | | | | | |
Ratio of gross expenses to average net assets prior to expense reductions | | | 1.09% | (c) | | | 1.05% | | | | 1.14% | | | | 1.07% | | | | 1.13% | | | | 1.05% | |
| | | | | | |
Ratio of net investment income (loss) to average net assets | | | 2.82% | (c) | | | 2.44% | | | | 2.14% | | | | 2.25% | | | | 2.49% | | | | 2.47% | |
| | |
| | | (Unaudited)
Six Months
Ended
April 30, | | | Year Ended October 31, | |
| | | 2019 | | | 2018 | | | 2017 | | | 2016 | | | 2015 | | | 2014 | |
| | | | | | |
Portfolio turnover rate | | | 23.7% | | | | 64.3% | | | | 79.1% | | | | 54.0% | | | | 80.0% | | | | 35.3% | |
| |
| | | CLASS C | |
| | | (Unaudited)
Six Months
Ended
April 30, | | | Year Ended October 31, | |
| | | 2019 | | | 2018 | | | 2017 | | | 2016 | | | 2015 | | | 2014 | |
| | | | | | |
Net asset value, beginning of period | | | $9.81 | | | | $10.39 | | | | $10.54 | | | | $10.51 | | | | $10.70 | | | | $10.89 | |
| | | | | | |
Income from investment operations: | | | | | | | | | | | | | | | | | | | | | | | | |
| | | | | | |
Net investment income (loss)(a) | | | 0.10 | | | | 0.17 | | | | 0.14 | | | | 0.16 | | | | 0.18 | | | | 0.18 | |
| | | | | | |
Net realized and unrealized gain (loss) | | | 0.35 | | | | (0.48 | ) | | | (0.12 | ) | | | 0.20 | | | | (0.05 | ) | | | 0.12 | |
| | | | | | |
Total from investment operations | | | 0.45 | | | | (0.31 | ) | | | 0.02 | | | | 0.36 | | | | 0.13 | | | | 0.30 | |
| | | | | | |
Distributions: | | | | | | | | | | | | | | | | | | | | | | | | |
| | | | | | |
Dividends from net investment income | | | (0.10 | ) | | | (0.20 | ) | | | (0.16 | ) | | | (0.20 | ) | | | (0.20 | ) | | | (0.45 | ) |
| | | | | | |
Dividends from net realized gains | | | — | | | | (0.05 | ) | | | (0.01 | ) | | | (0.13 | ) | | | (0.12 | ) | | | (0.04 | ) |
| | | | | | |
Return of capital | | | — | | | | (0.02 | ) | | | — | | | | — | | | | — | | | | — | |
| | | | | | |
Total distributions | | | (0.10 | ) | | | (0.27 | ) | | | (0.17 | ) | | | (0.33 | ) | | | (0.32 | ) | | | (0.49 | ) |
| | | | | | |
Net asset value, end of period | | | $10.16 | | | | $9.81 | | | | $10.39 | | | | $10.54 | | | | $10.51 | | | | $10.70 | |
| | | | | | |
Ratios and supplemental data: | | | | | | | | | | | | | | | | | | | | | | | | |
| | | | | | |
Total return(b) | | | 4.62% | | | | (3.03% | ) | | | 0.17% | | | | 3.57% | | | | 1.28% | | | | 2.94% | |
| | | | | | |
Net assets, end of period (000) | | | $3,271 | | | | $6,413 | | | | $9,334 | | | | $16,340 | | | | $15,898 | | | | $17,818 | |
| | | | | | |
Ratio of net expenses to average net assets | | | 1.65% | (c) | | | 1.65% | | | | 1.65% | | | | 1.63% | | | | 1.65% | | | | 1.65% | |
| | | | | | |
Ratio of gross expenses to average net assets prior to expense reductions | | | 1.84% | (c) | | | 1.80% | | | | 1.89% | | | | 1.82% | | | | 1.88% | | | | 1.80% | |
| | | | | | |
Ratio of net investment income (loss) to average net assets | | | 2.07% | (c) | | | 1.69% | | | | 1.38% | | | | 1.51% | | | | 1.74% | | | | 1.73% | |
| (a) | Net investment income (loss) allocated based on average shares method. |
| (b) | Total return measures net investment income (loss) and capital gain or loss from portfolio investments assuming reinvestment of dividends and capital gains distributions. Total return is not annualized for periods that are less than a full year, does not reflect the effect of sales charge for Class A shares nor the contingent deferred sales charge for Class C shares and does not reflect the deduction of taxes that a shareholder would pay on fund distributions or the redemption of fund shares. |
| | | | |
| 226 | | CALAMOS OPEN-END FAMILY OF FUNDS SEMIANNUAL REPORT | | |
Calamos Total Return Bond Fund Financial Highlights
| | | | | | | | | | | | | | | | | | | | | | | | |
| | | CLASS I | |
| | | (Unaudited)
Six Months
Ended
April 30, | | | Year Ended October 31, | |
| | | 2019 | | | 2018 | | | 2017 | | | 2016 | | | 2015 | | | 2014 | |
| | | | | | |
Net asset value, beginning of period | | | $9.81 | | | | $10.39 | | | | $10.54 | | | | $10.51 | | | | $10.70 | | | | $10.89 | |
| | | | | | |
Income from investment operations: | | | | | | | | | | | | | | | | | | | | | | | | |
| | | | | | |
Net investment income (loss)(a) | | | 0.15 | | | | 0.27 | | | | 0.24 | | | | 0.26 | | | | 0.29 | | | | 0.29 | |
| | | | | | |
Net realized and unrealized gain (loss) | | | 0.35 | | | | (0.48 | ) | | | (0.12 | ) | | | 0.21 | | | | (0.05 | ) | | | 0.12 | |
| | | | | | |
Total from investment operations | | | 0.50 | | | | (0.21 | ) | | | 0.12 | | | | 0.47 | | | | 0.24 | | | | 0.41 | |
| | | | | | |
Distributions: | | | | | | | | | | | | | | | | | | | | | | | | |
| | | | | | |
Dividends from net investment income | | | (0.15 | ) | | | (0.29 | ) | | | (0.26 | ) | | | (0.31 | ) | | | (0.31 | ) | | | (0.56 | ) |
| | | | | | |
Dividends from net realized gains | | | — | | | | (0.05 | ) | | | (0.01 | ) | | | (0.13 | ) | | | (0.12 | ) | | | (0.04 | ) |
| | | | | | |
Return of capital | | | — | | | | (0.03 | ) | | | — | | | | — | | | | — | | | | — | |
| | | | | | |
Total distributions | | | (0.15 | ) | | | (0.37 | ) | | | (0.27 | ) | | | (0.44 | ) | | | (0.43 | ) | | | (0.60 | ) |
| | | | | | |
Net asset value, end of period | | | $10.16 | | | | $9.81 | | | | $10.39 | | | | $10.54 | | | | $10.51 | | | | $10.70 | |
| | | | | | |
Ratios and supplemental data: | | | | | | | | | | | | | | | | | | | | | | | | |
| | | | | | |
Total return(b) | | | 5.14% | | | | (2.06% | ) | | | 1.18% | | | | 4.60% | | | | 2.30% | | | | 3.97% | |
| | | | | | |
Net assets, end of period (000) | | | $27,086 | | | | $32,888 | | | | $40,290 | | | | $22,067 | | | | $16,561 | | | | $13,347 | |
| | | | | | |
Ratio of net expenses to average net assets | | | 0.65% | (c) | | | 0.65% | | | | 0.65% | | | | 0.63% | | | | 0.65% | | | | 0.65% | |
| | | | | | |
Ratio of gross expenses to average net assets prior to expense reductions | | | 0.85% | (c) | | | 0.80% | | | | 0.90% | | | | 0.82% | | | | 0.88% | | | | 0.80% | |
| | | | | | |
Ratio of net investment income (loss) to average net assets | | | 3.07% | (c) | | | 2.69% | | | | 2.32% | | | | 2.49% | | | | 2.73% | | | | 2.70% | |
| (a) | Net investment income (loss) allocated based on average shares method. |
| (b) | Total return measures net investment income (loss) and capital gain or loss from portfolio investments assuming reinvestment of dividends and capital gains distributions. Total return is not annualized for periods that are less than a full year, does not reflect the effect of sales charge for Class A shares nor the contingent deferred sales charge for Class C shares and does not reflect the deduction of taxes that a shareholder would pay on fund distributions or the redemption of fund shares. |
Calamos High Income Opportunities Fund Financial Highlights
Selected data for a share outstanding throughout each period were as follows:
| | | | | | | | | | | | | | | | | | | | | | | | |
| | | CLASS A | |
| | | (Unaudited)
Six Months
Ended
April 30, | | | Year Ended October 31, | |
| | | 2019 | | | 2018 | | | 2017 | | | 2016 | | | 2015 | | | 2014 | |
| | | | | | |
Net asset value, beginning of period | | | $8.37 | | | | $8.87 | | | | $8.62 | | | | $8.63 | | | | $9.65 | | | | $9.90 | |
| | | | | | |
Income from investment operations: | | | | | | | | | | | | | | | | | | | | | | | | |
| | | | | | |
Net investment income (loss)(a) | | | 0.24 | | | | 0.47 | | | | 0.40 | | | | 0.40 | | | | 0.43 | | | | 0.48 | |
| | | | | | |
Net realized and unrealized gain (loss) | | | 0.14 | | | | (0.45 | ) | | | 0.26 | | | | 0.03 | | | | (0.74 | ) | | | 0.01 | |
| | | | | | |
Total from investment operations | | | 0.38 | | | | 0.02 | | | | 0.66 | | | | 0.43 | | | | (0.31 | ) | | | 0.49 | |
| | | | | | |
Distributions: | | | | | | | | | | | | | | | | | | | | | | | | |
| | | | | | |
Dividends from net investment income | | | (0.26 | ) | | | (0.52 | ) | | | (0.41 | ) | | | (0.44 | ) | | | (0.47 | ) | | | (0.55 | ) |
| | | | | | |
Dividends from net realized gains | | | — | | | | — | | | | — | | | | — | | | | (0.24 | ) | | | (0.19 | ) |
| | | | | | |
Return of capital | | | — | | | | — | | | | — | | | | — | | | | (0.00 | )* | | | — | |
| | | | | | |
Total distributions | | | (0.26 | ) | | | (0.52 | ) | | | (0.41 | ) | | | (0.44 | ) | | | (0.71 | ) | | | (0.74 | ) |
| | | | | | |
Net asset value, end of period | | | $8.49 | | | | $8.37 | | | | $8.87 | | | | $8.62 | | | | $8.63 | | | | $9.65 | |
| | | | | | |
Ratios and supplemental data: | | | | | | | | | | | | | | | | | | | | | | | | |
| | | | | | |
Total return(b) | | | 4.65% | | | | 0.25% | | | | 7.82% | | | | 5.26% | | | | (3.25% | ) | | | 5.11% | |
| | | | | | |
Net assets, end of period (000) | | | $36,077 | | | | $32,282 | | | | $36,351 | | | | $41,046 | | | | $71,513 | | | | $132,756 | |
| | | | | | |
Ratio of net expenses to average net assets | | | 1.00% | (c) | | | 1.00% | | | | 1.29% | | | | 1.33% | | | | 1.28% | | | | 1.18% | |
| | | | | | |
Ratio of gross expenses to average net assets prior to expense reductions | | | 1.37% | (c) | | | 1.46% | | | | 1.43% | | | | 1.33% | | | | 1.28% | | | | 1.18% | |
| | | | | | |
Ratio of net investment income (loss) to average net assets | | | 5.95% | (c) | | | 5.41% | | | | 4.57% | | | | 4.81% | | | | 4.73% | | | | 4.84% | |
| | |
| | | (Unaudited)
Six Months
Ended
April 30, | | | Year Ended October 31, | |
| | | 2019 | | | 2018 | | | 2017 | | | 2016 | | | 2015 | | | 2014 | |
| | | | | | |
Portfolio turnover rate | | | 15.6% | | | | 55.5% | | | | 93.1% | | | | 44.4% | | | | 65.3% | | | | 51.2% | |
| |
| | | CLASS C | |
| | | (Unaudited)
Six Months
Ended
April 30, | | | Year Ended October 31, | |
| | | 2019 | | | 2018 | | | 2017 | | | 2016 | | | 2015 | | | 2014 | |
| | | | | | |
Net asset value, beginning of period | | | $8.82 | | | | $9.31 | | | | $9.03 | | | | $9.03 | | | | $10.06 | | | | $10.29 | |
|
Income from investment operations: | |
| | | | | | |
Net investment income (loss)(a) | | | 0.23 | | | | 0.42 | | | | 0.35 | | | | 0.36 | | | | 0.38 | | | | 0.42 | |
| | | | | | |
Net realized and unrealized gain (loss) | | | 0.14 | | | | (0.46 | ) | | | 0.27 | | | | 0.01 | | | | (0.78 | ) | | | 0.01 | |
| | | | | | |
Total from investment operations | | | 0.37 | | | | (0.04 | ) | | | 0.62 | | | | 0.37 | | | | (0.40 | ) | | | 0.43 | |
|
Distributions: | |
| | | | | | |
Dividends from net investment income | | | (0.22 | ) | | | (0.45 | ) | | | (0.34 | ) | | | (0.37 | ) | | | (0.39 | ) | | | (0.47 | ) |
| | | | | | |
Dividends from net realized gains | | | — | | | | — | | | | — | | | | — | | | | (0.24 | ) | | | (0.19 | ) |
| | | | | | |
Return of capital | | | — | | | | — | | | | — | | | | — | | | | (0.00 | )* | | | — | |
| | | | | | |
Total distributions | | | (0.22 | ) | | | (0.45 | ) | | | (0.34 | ) | | | (0.37 | ) | | | (0.63 | ) | | | (0.66 | ) |
| | | | | | |
Net asset value, end of period | | | $8.97 | | | | $8.82 | | | | $9.31 | | | | $9.03 | | | | $9.03 | | | | $10.06 | |
|
Ratios and supplemental data: | |
| | | | | | |
Total return(b) | | | 4.33% | | | | (0.42% | ) | | | 6.97% | | | | 4.35% | | | | (3.94% | ) | | | 4.32% | |
| | | | | | |
Net assets, end of period (000) | | | $2,978 | | | | $9,772 | | | | $13,286 | | | | $17,479 | | | | $21,149 | | | | $29,333 | |
| | | | | | |
Ratio of net expenses to average net assets | | | 1.75% | (c) | | | 1.75% | | | | 2.05% | | | | 2.08% | | | | 2.04% | | | | 1.93% | |
| | | | | | |
Ratio of gross expenses to average net assets prior to expense reductions | | | 2.15% | (c) | | | 2.22% | | | | 2.18% | | | | 2.08% | | | | 2.04% | | | | 1.93% | |
| | | | | | |
Ratio of net investment income (loss) to average net assets | | | 5.29% | (c) | | | 4.66% | | | | 3.80% | | | | 4.07% | | | | 3.98% | | | | 4.10% | |
| * | Amounts are less than $0.005. |
| (a) | Net investment income (loss) allocated based on average shares method. |
| (b) | Total return measures net investment income (loss) and capital gain or loss from portfolio investments assuming reinvestment of dividends and capital gains distributions. Total return is not annualized for periods that are less than a full year, does not reflect the effect of sales charge for Class A shares nor the contingent deferred sales charge for Class C shares and does not reflect the deduction of taxes that a shareholder would pay on fund distributions or the redemption of fund shares. |
| | | | |
| 228 | | CALAMOS OPEN-END FAMILY OF FUNDS SEMIANNUAL REPORT | | |
Calamos High Income Opportunities Fund Financial Highlights
| | | | | | | | | | | | | | | | | | | | | | | | |
| | | CLASS I | |
| | | (Unaudited)
Six Months
Ended
April 30, | | | Year Ended October 31, | |
| | | 2019 | | | 2018 | | | 2017 | | | 2016 | | | 2015 | | | 2014 | |
| | | | | | |
Net asset value, beginning of period | | | $8.37 | | | | $8.86 | | | | $8.61 | | | | $8.63 | | | | $9.65 | | | | $9.90 | |
| | | | | | |
Income from investment operations: | | | | | | | | | | | | | | | | | | | | | | | | |
| | | | | | |
Net investment income (loss)(a) | | | 0.26 | | | | 0.49 | | | | 0.43 | | | | 0.42 | | | | 0.45 | | | | 0.50 | |
| | | | | | |
Net realized and unrealized gain (loss) | | | 0.13 | | | | (0.44 | ) | | | 0.25 | | | | 0.02 | | | | (0.74 | ) | | | 0.02 | |
| | | | | | |
Total from investment operations | | | 0.39 | | | | 0.05 | | | | 0.68 | | | | 0.44 | | | | (0.29 | ) | | | 0.52 | |
| | | | | | |
Distributions: | | | | | | | | | | | | | | | | | | | | | | | | |
| | | | | | |
Dividends from net investment income | | | (0.27 | ) | | | (0.54 | ) | | | (0.43 | ) | | | (0.46 | ) | | | (0.49 | ) | | | (0.58 | ) |
| | | | | | |
Dividends from net realized gains | | | — | | | | — | | | | — | | | | — | | | | (0.24 | ) | | | (0.19 | ) |
| | | | | | |
Return of capital | | | — | | | | — | | | | — | | | | — | | | | (0.00 | )* | | | — | |
| | | | | | |
Total distributions | | | (0.27 | ) | | | (0.54 | ) | | | (0.43 | ) | | | (0.46 | ) | | | (0.73 | ) | | | (0.77 | ) |
| | | | | | |
Net asset value, end of period | | | $8.49 | | | | $8.37 | | | | $8.86 | | | | $8.61 | | | | $8.63 | | | | $9.65 | |
| | | | | | |
Ratios and supplemental data: | | | | | | | | | | | | | | | | | | | | | | | | |
| | | | | | |
Total return(b) | | | 4.77% | | | | 0.62% | | | | 8.09% | | | | 5.41% | | | | (3.00% | ) | | | 5.37% | |
| | | | | | |
Net assets, end of period (000) | | | $7,262 | | | | $7,706 | | | | $10,026 | | | | $15,183 | | | | $17,452 | | | | $24,342 | |
| | | | | | |
Ratio of net expenses to average net assets | | | 0.75% | (c) | | | 0.75% | | | | 1.02% | | | | 1.08% | | | | 1.04% | | | | 0.93% | |
| | | | | | |
Ratio of gross expenses to average net assets prior to expense reductions | | | 1.13% | (c) | | | 1.21% | | | | 1.18% | | | | 1.08% | | | | 1.04% | | | | 0.93% | |
| | | | | | |
Ratio of net investment income (loss) to average net assets | | | 6.21% | (c) | | | 5.65% | | | | 4.84% | | | | 5.07% | | | | 4.98% | | | | 5.10% | |
| * | Amounts are less than $0.005. |
| (a) | Net investment income (loss) allocated based on average shares method. |
| (b) | Total return measures net investment income (loss) and capital gain or loss from portfolio investments assuming reinvestment of dividends and capital gains distributions. Total return is not annualized for periods that are less than a full year, does not reflect the effect of sales charge for Class A shares nor the contingent deferred sales charge for Class C shares and does not reflect the deduction of taxes that a shareholder would pay on fund distributions or the redemption of fund shares. |
Calamos Short-Term Bond Fund Financial Highlights
Selected data for a share outstanding throughout each period were as follows:
| | | | | | | | |
| | | CLASS A | |
| | | (Unaudited)
Six Months
Ended
April 30, | | | September 19, 2018•
through October 31, | |
| | | 2019 | | | 2018 | |
| | |
Net asset value, beginning of period | | | $9.98 | | | | $10.00 | |
| | |
Income from investment operations: | | | | | | | | |
| | |
Net investment income (loss)(a) | | | 0.13 | | | | 0.03 | |
| | |
Net realized and unrealized gain (loss) | | | 0.10 | | | | (0.02 | ) |
| | |
Total from investment operations | | | 0.23 | | | | 0.01 | |
| | |
Distributions: | | | | | | | | |
| | |
Dividends from net investment income | | | (0.13 | ) | | | (0.03 | ) |
| | |
Dividends from net realized gains | | | (0.00 | )* | | | — | |
| | |
Total distributions | | | (0.13 | ) | | | (0.03 | ) |
| | |
Net asset value, end of period | | | $10.08 | | | | $9.98 | |
| | |
Ratios and supplemental data: | | | | | | | | |
| | |
Total return(b) | | | 2.34% | | | | 0.12% | |
| | |
Net assets, end of period (000) | | | $226 | | | | $25 | |
| | |
Ratio of net expenses to average net assets | | | 0.65% | (c) | | | 0.66% | (c) |
| | |
Ratio of gross expenses to average net assets prior to expense reductions | | | 0.71% | (c) | | | 48.01% | (c) |
| | |
Ratio of net investment income (loss) to average net assets | | | 2.57% | (c) | | | 2.55% | (c) |
| | |
| | | (Unaudited)
Six Months
Ended
April 30, | | | September 19, 2018•
through October 31, | |
| | | 2019 | | | 2018 | |
| | |
Portfolio turnover rate | | | 120.9% | | | | 3.3% | |
| |
| | | CLASS I | |
| | | (Unaudited)
Six Months
Ended
April 30, | | | September 19, 2018•
through October 31, | |
| | | 2019 | | | 2018 | |
| | |
Net asset value, beginning of period | | | $9.98 | | | | $10.00 | |
|
Income from investment operations: | |
| | |
Net investment income (loss)(a) | | | 0.14 | | | | 0.04 | |
| | |
Net realized and unrealized gain (loss) | | | 0.10 | | | | (0.02 | ) |
| | |
Total from investment operations | | | 0.24 | | | | 0.02 | |
|
Distributions: | |
| | |
Dividends from net investment income | | | (0.14 | ) | | | (0.04 | ) |
| | |
Dividends from net realized gains | | | (0.00 | )* | | | — | |
| | |
Total distributions | | | (0.14 | ) | | | (0.04 | ) |
| | |
Net asset value, end of period | | | $10.08 | | | | $9.98 | |
|
Ratios and supplemental data: | |
| | |
Total return(b) | | | 2.46% | | | | 0.16% | |
| | |
Net assets, end of period (000) | | | $183,746 | | | | $15,118 | |
| | |
Ratio of net expenses to average net assets | | | 0.40% | (c) | | | 0.42% | (c) |
| | |
Ratio of gross expenses to average net assets prior to expense reductions | | | 0.46% | (c) | | | 2.13% | (c) |
| | |
Ratio of net investment income (loss) to average net assets | | | 2.81% | (c) | | | 3.22% | (c) |
| • | Commencement of operations. |
| * | Amounts are less than $0.005. |
| (a) | Net investment income (loss) allocated based on average shares method. |
| (b) | Total return measures net investment income (loss) and capital gain or loss from portfolio investments assuming reinvestment of dividends and capital gains distributions. Total return is not annualized for periods that are less than a full year, does not reflect the effect of sales charge for Class A shares nor the contingent deferred sales charge for Class C shares and does not reflect the deduction of taxes that a shareholder would pay on fund distributions or the redemption of fund shares. |
| | | | |
| 230 | | CALAMOS OPEN-END FAMILY OF FUNDS SEMIANNUAL REPORT | | |
Report of Independent Registered Public Accounting Firm
To the Shareholders and Board of Trustees of Calamos Investment Trust
Results of Review of Interim Financial Information
We have reviewed the accompanying statements of assets and liabilities, including the schedules of investments, of Calamos Investment Trust (the “Trust”), including Calamos Growth Fund, Calamos Opportunistic Value Fund, Calamos Dividend Growth Fund, Calamos International Growth Fund, Calamos Evolving World Growth Fund, Calamos Emerging Market Equity Fund, Calamos Global Equity Fund, Calamos Growth and Income Fund, Calamos Global Growth and Income Fund, Calamos Convertible Fund, Calamos Global Convertible Fund, Calamos Total Return Bond Fund, Calamos High Income Opportunities Fund, Calamos Market Neutral Income Fund, Calamos Hedged Equity Fund, Calamos Phineus Long/Short Fund, and Calamos Short-Term Bond Fund (the “Funds”), as of April 30, 2019, and the related statements of operations and changes in net assets, and the financial highlights for the six month period then ended. Based on our reviews, we are not aware of any material modifications that should be made to the accompanying interim financial statements and financial highlights for them to be in conformity with accounting principles generally accepted in the United States of America.
We have previously audited, in accordance with the standards of the Public Company Accounting Oversight Board (United States) (PCAOB), the statements of changes in net assets of the Funds for the year ended October 31, 2018, and the financial highlights for each of the five years in the period then ended for the Funds, except Calamos Emerging Market Equity Fund, Calamos Global Convertible Fund, Calamos Hedged Equity Fund, Calamos Phineus Long/Short Fund, and Calamos Short-Term Bond Fund; the financial highlights for the periods indicated in the table below for Calamos Emerging Market Equity Fund, Calamos Global Convertible Fund, Calamos Hedged Equity Fund, Calamos Phineus Long/Short Fund, and Calamos Short-Term Bond Fund; and in our report dated December 17, 2018, we expressed an unqualified opinion on such statement of changes in net assets and financial highlights.
| | |
Individual Fund Comprising the
Calamos Investment Trust | | Financial Highlights |
| |
| Calamos Emerging Market Equity Fund | | For the years ended October 31, 2018, 2017, 2016, 2015, and the period from December 31, 2013 (commencement of operations) through October 31, 2014 |
| |
| Calamos Global Convertible Fund | | For the years ended October 31, 2018, 2017, 2016, and the period from December 31, 2014 (commencement of operations) through October 31, 2015 |
| |
| Calamos Hedged Equity Fund | | For the years ended October 31, 2018, 2017, 2016, and the period from December 31, 2014 (commencement of operations) through October 31, 2015 |
| |
| Calamos Phineus Long/Short Fund | | For the years ended October 31, 2018, 2017, and the period from April 5, 2016 (commencement of operations) through October 31, 2016 |
| |
| Calamos Short-Term Bond Fund | | For the period from September 19, 2018 (commencement of operations) through October 31, 2018 |
Basis for Review Results
This interim financial information is the responsibility of the Funds’ management. We are a public accounting firm registered with the Public Company Accounting Oversight Board (United States) (PCAOB) and are required to be independent with respect to the Funds in accordance with the U.S. federal securities laws and the applicable rules and regulations of the Securities and Exchange Commission and the PCAOB.
We conducted our reviews in accordance with standards of the PCAOB. A review of interim financial information consists principally of applying analytical procedures and making inquiries of persons responsible for financial and accounting matters. It is substantially less in scope than an audit conducted in accordance with the standards of the PCAOB, the objective of which is the expression of an opinion regarding the financial statements and financial highlights taken as a whole. Accordingly, we do not express such an opinion.

June 14, 2019
We have served as the auditor of one or more Calamos Advisors LLC investment companies since 2003.
MANAGING YOUR CALAMOS FUNDS INVESTMENTS
Calamos Investments offers several convenient means to monitor, manage and feel confident about your Calamos investment choice.
24-HOUR AUTOMATED SHAREHOLDER ASSISTANCE: 800.823.7386
Through a single toll-free number, Calamos24-Hour Shareholder Assistance is fast and easy. Get fund prices and account balances, review recent transactions, order statements, literature and more.
PERSONAL ASSISTANCE: 800.582.6959
Dial this toll-free number to speak with a knowledgeable Client Services Representative who can help answer questions or address issues concerning your Calamos Fund.
ONLINE ACCOUNT MANAGEMENT: www.calamos.com
Manage your personal account of Calamos Funds online at www.calamos.com. On your account access page, you can view account history and download data.
YOUR FINANCIAL ADVISOR
We encourage you to talk to your financial advisor to determine how the Calamos Funds can benefit your investment portfolio based on your financial goals, risk tolerance, time horizon and income needs.
This report, including the audited financial statements contained herein, is submitted for general information for the shareholders of the Funds. The report is not authorized for distribution to prospective investors in the Funds unless accompanied by a currently effective prospectus of the Funds. The views expressed in this report reflect those of Calamos Advisors LLC only through April 30, 2019.
A description of the Calamos Proxy Voting Policies and Procedures and the Funds’ proxy voting record for the 12-month period ended June 30 are available free of charge upon request by calling 800.582.6959, by visiting the Calamos Web site at www.calamos.com, or by writing Calamos at: Calamos Investments, Attn: Client Services, 2020 Calamos Court, Naperville, IL 60563. The Funds’ proxy voting record is also available free of charge by visiting the SEC Web site at www.sec.gov.
The Funds file a complete list of their portfolio holdings with the SEC for the first and third quarters each fiscal year on Form N-Q. The Forms N-Q are available free of charge, upon request, by calling or writing Calamos Investments at the phone number or address provided above or by visiting the SEC Web site at www.sec.gov. You may also review or, for a fee, copy the forms at the SEC’s Public Reference Room in Washington, D.C. Information on the operation of the Public Reference Room may be obtained by calling 800.732.0330.
FOR 24-HOUR AUTOMATED SHAREHOLDER ASSISTANCE: 800.823.7386
TO OBTAIN INFORMATION ABOUT YOUR INVESTMENTS: 800.582.6959
VISIT OUR WEB SITE:www.calamos.com
INVESTMENT ADVISER:
Calamos Advisors LLC
2020 Calamos Court
Naperville, IL 60563-2787
CUSTODIAN AND FUND ACCOUNTING AGENT:
State Street Bank and Trust Company
Boston, MA
TRANSFER AGENT:
U.S. Bancorp Fund Services, LLC
615 E. Michigan St., 3rd Floor
Milwaukee, WI 53202
INDEPENDENT REGISTERED PUBLIC ACCOUNTING FIRM:
Deloitte & Touche LLP
Chicago, IL
LEGAL COUNSEL:
Ropes & Gray LLP
Chicago, IL
| | |

| | STAY CONNECTED www.calamos.com/connect |
|
Visit our Web site for timely fund performance, detailed fund profiles, fund news and insightful market commentary. |

2020 Calamos Court
Naperville, IL 60563-2787
800.582.6959
www.calamos.com
© 2019 Calamos Investments LLC. All Rights Reserved.
Calamos® and Calamos Investments® are registered
trademarks of Calamos Investments LLC.
MFSAN 1631 2019
ITEM 2. CODE OF ETHICS.
The information required by this Item 2 is only required in an annual report on this Form N-CSR.
ITEM 3. AUDIT COMMITTEE FINANCIAL EXPERT.
The information required by this Item 3 is only required in an annual report on this Form N-CSR.
ITEM 4. PRINCIPAL ACCOUNTANT FEES AND SERVICES.
The information required by this Item 4 is only required in an annual report on this Form N-CSR.
ITEM 5. AUDIT COMMITTEE OF LISTED REGISTRANTS.
Not applicable.
ITEM 6. SCHEDULE OF INVESTMENTS
Included in the Report to Shareholders in Item 1.
ITEM 7. DISCLOSURE OF PROXY VOTING POLICIES AND PROCEDURES FORCLOSED-END MANAGEMENT INVESTMENT COMPANIES.
Not applicable.
ITEM 8. PORTFOLIO MANAGERS OFCLOSED-END MANAGEMENT INVESTMENT COMPANIES.
Not applicable.
ITEM 9. PURCHASES OF EQUITY SECURITIES BYCLOSED-END MANAGEMENT INVESTMENT COMPANY AND AFFILIATED PURCHASERS.
Not applicable.
ITEM 10. SUBMISSION OF MATTERS TO A VOTE OF SECURITY HOLDERS.
No material changes.
ITEM 11. CONTROLS AND PROCEDURES.
a) The registrant’s principal executive officer and principal financial officer have evaluated the registrant’s disclosure controls and procedures within 90 days of this filing and have concluded that the registrant’s disclosure controls and procedures were effective, as of that date, in ensuring that information required to be disclosed by the registrant in this FormN-CSR was recorded, processed, summarized, and reported within the time periods specified in the Commission’s rules and forms.
b) There were no changes in the registrant’s internal controls over financial reporting (as defined in Rule30a-3(d) under the Investment Company Act of 1940) that occurred during the registrant’s most recent fiscal quarter that has materially affected, or is reasonably likely to materially affect, the registrant’s internal control over financial reporting.
ITEM 12. DISCLOSURE OF SECURITIES LENDING ACTIVITIES FOR CLOSED-END MANAGEMENT INVESTMENT COMPANIES.
Not applicable.
ITEM 13. EXHIBITS.
(a)(1) Code of Ethics - Not applicable for this semiannual report.
(a)(2)(i) Certification of Principal Executive Officer.
(a)(2)(ii) Certification of Principal Financial Officer.
(b) Certifications pursuant to Section 906 of the Sarbanes Oxley Act of 2002.
SIGNATURES
Pursuant to the requirements of the Securities Exchange Act of 1934 and the Investment Company Act of 1940, the registrant has duly caused this report to be signed on its behalf by the undersigned, thereunto duly authorized.
Calamos Investment Trust
| | |
| |
| By: | | /s/ John P. Calamos, Sr. |
| Name: | | John P. Calamos, Sr. |
| Title: | | Principal Executive Officer |
| Date: | | June 25, 2019 |
| | |
| |
| By: | | /s/ Curtis Holloway |
| Name: | | Curtis Holloway |
| Title: | | Principal Financial Officer |
| Date: | | June 25, 2019 |
Pursuant to the requirements of the Securities Exchange Act of 1934 and the Investment Company Act of 1940, this report has been signed by the following persons on behalf of the registrant and in the capacities and on the dates indicated.
| | |
| |
| By: | | /s/ John P. Calamos, Sr. |
| Name: | | John P. Calamos, Sr. |
| Title: | | Principal Executive Officer |
| Date: | | June 25, 2019 |
| | |
| |
| By: | | /s/ Curtis Holloway |
| Name: | | Curtis Holloway |
| Title: | | Principal Financial Officer |
| Date: | | June 25, 2019 |