UNITED STATES
SECURITIES AND EXCHANGE COMMISSION
Washington, D.C. 20549
FORM N-CSR
CERTIFIED SHAREHOLDER REPORT OF REGISTERED
MANAGEMENT INVESTMENT COMPANIES
| | |
INVESTMENT COMPANY ACT FILE NUMBER: | | 811-05443 |
| |
| EXACT NAME OF REGISTRANT AS SPECIFIED IN CHARTER: | | Calamos Investment Trust |
| |
ADDRESS OF PRINCIPAL EXECUTIVE OFFICES: | | 2020 Calamos Court, Naperville Illinois 60563-2787 |
| |
NAME AND ADDRESS OF AGENT FOR SERVICE: | | John P Calamos, Sr., President, Calamos Advisors LLC 2020 Calamos Court, Naperville, Illinois 60563-2787 |
REGISTRANT’S TELEPHONE NUMBER, INCLUDING AREA CODE: (630) 245-7200
DATE OF FISCAL YEAR END: October 31, 2016
DATE OF REPORTING PERIOD: November 1, 2015 through April 30, 2016
Item 1. Report to Shareholders

Experience and Foresight
About Calamos Investments
For over 35 years, we have helped investors like you manage and build wealth to meet long-term objectives. Because investors have different time horizons, risk tolerances and goals, we offer funds to suit a variety of asset allocation needs. Our 20 mutual funds include equity, fixed income, convertible and alternative funds. We offer U.S. funds as well as global and international choices.
We are dedicated to helping our clients build and protect wealth. We understand when you entrust us with your assets, you also entrust us with your achievements, goals and aspirations. We believe we best honor this trust by making investment decisions guided by integrity, by discipline and by our conscientious research.
We believe an active, risk-conscious approach is essential for wealth creation. In the 1970s, we pioneered the use of convertible securities as a means to control risk in volatile markets. We followed with strategies that combine convertibles and stocks, with the aim of participating in equity market upside with potentially less volatility than an all-stock portfolio. In the 1990s, we introduced our first stock fund, which invests in growth companies both large and small. Across our funds, our investment process seeks to manage risk at multiple levels and draws upon our experience investing through many market cycles. In a rapidly changing environment, we believe that this active management is essential.
We are global in our perspective. We believe globalization offers tremendous opportunities for countries and companies all over the world. In our U.S., global and international portfolios, we are seeking to capitalize on the potential growth of the global economy.
We believe there are opportunities in all markets. Our history traces back to the 1970s, a period of significant volatility and economic concerns. We have invested through multiple market cycles, each with its own challenges. Out of this experience comes our belief that the flipside of volatility is opportunity.
Letter to Shareholders

JOHN P. CALAMOS, SR.
Chairman and Global CIO
Dear Fellow Shareholder:
Welcome to your semiannual report for the six-month period ended April 30, 2016. In this report, you will find commentary from the Calamos portfolio management teams, as well as a listing of portfolio holdings, financial statements and highlights, and detailed information about the performance and positioning of the Calamos Funds.
Market Review
The reporting period proved to be an extremely turbulent time in the financial markets, as changing sentiment fueled volatility and market rotation. During the final months of 2015, investors remained concerned about low commodity prices, global economic growth forecasts, and the implications of central bank policies—including the Federal Reserve’s move to raise short-term interest rates for the first time since 2006.
As 2016 began, markets fell sharply as investor apprehension increased. By mid-February, investors appeared more confident about the health of the U.S. economy and the likelihood of fewer Federal Reserve increases, while commodity prices stabilized. This increased optimism drove a rally in emerging markets, high yield bonds, and value and cyclical stocks. (A stronger economic environment can provide tailwinds for cyclically oriented companies and fewer hurdles for companies with less robust growth prospects.)
In this challenging environment, the S&P 500 Index gained 0.43% for the semiannual period. On the whole, stocks from developed markets landed in negative territory, as measured by the MSCI World Index’s return of -0.74%. Emerging market stocks were essentially flat, with a -0.01% return for the MSCI Emerging Markets Index. Global convertibles outpaced their U.S. counterparts, as the U.S. index reflected the added headwinds faced by small and mid-cap companies during the period. The BofA Merrill Lynch Global 300 Convertible Index returned 0.83%, while the BofA Merrill Lynch All U.S. Convertibles Index returned -2.88%.
Outlook
We do not believe a U.S. recession is imminent, but think the pace of expansion is likely to be measured in 2016. Similarly, we expect that the global economy will grow, but not at a robust pace overall. Around the world, we believe fiscal policy remains an overarching cause of concern, as a lack of clarity on key regulatory issues casts a shadow over a number of sectors. We believe investors will be challenged by a host of
Letter to Shareholders
uncertainties, including global growth concerns, the policies of the Federal Reserve and other central banks, the U.S. presidential election, commodity prices, and geopolitical uncertainties.
Our teams continue to identify opportunities in this slower-growth environment, but they recognize that selectivity and risk management remain crucial. We believe investment opportunities exist across many asset classes, but selectivity remains paramount. During the reporting period, swings in market sentiment illustrated investors’ tendency to respond dramatically to events and data. Our portfolio management teams are holding to their long-term discipline, seeking to capitalize on short-term investor emotion as they position the funds for longer-term opportunities.
Introducing Calamos Phineus Long/Short Fund
Throughout the years, we have been proud to provide individual investors with access to institutional-caliber investment strategies, including in the alternatives asset class. When we launched Calamos Convertible Fund in 1985, we were one of the first asset managers to offer a convertible mutual fund, at a time when convertibles could be considered an alternative investment. In 1990, we launched Calamos Market Neutral Income Fund, which offers access to sophisticated strategies not broadly available to individual investors. Continuing this tradition, we introduce Calamos Phineus Long/Short Fund. In 2015, Calamos Investments acquired Phineus Partners, an established long/short manager, and we are pleased to provide investors with this time-tested long/short approach. I invite you to learn more about the fund (page 67) and to ask your financial advisor if the fund is appropriate for your needs.
Conclusion
The market environment is always changing. To keep up-to-date on our views of the global financial markets and the opportunities that are emerging, I encourage you to visit our website on an ongoing basis. You’ll find our blog and videos from our team, as well as a variety of pieces designed to help you and your financial advisor make sound asset allocation decisions that align with your long-term goals and risk tolerance.
As always, we thank you for your continued trust. All of us at Calamos Investments are honored that you have chosen us to help you achieve your financial goals.
Sincerely,

John P. Calamos, Sr.
Founder, Chairman and Global Chief Investment Officer
| | | | |
| 2 | | CALAMOS OPEN-END FAMILY OF FUNDS SEMIANNUAL REPORT | | |
Letter to Shareholders
Before investing, carefully consider a fund’s investment objectives, risks, charges and expenses. Please see the prospectus containing this and other information or call 800.582.6959. Please read the prospectus carefully. Performance data represents past performance, which is no guarantee of future results. Current performance may be lower or higher than the performance quoted.
The MSCI World Index is a market-capitalization weighted index composed of companies representative of the market structure of developed market countries in North America, Europe and the Asia/Pacific region. The S&P 500 Index is an unmanaged index generally considered representative of the U.S. stock market. The MSCI Emerging Markets Index is a free float-adjusted market capitalization index considered broadly representative of emerging market equity performance. The index represents companies within the constituent emerging markets that are available to investors worldwide. The BofA Merrill Lynch All U.S. Convertibles Ex-Mandatory Index represents the U.S. convertible securities market excluding mandatory convertibles. The BofA Merrill Lynch Global 300 Convertible Index is a global convertible index composed of companies representative of the market structure of countries in North America, Europe and the Asia/Pacific region. Sources: Lipper, Inc.; Morningstar, Inc.
Unmanaged index returns assume reinvestment of any and all distributions and, unlike fund returns, do not reflect fees, expenses or sales charges. Investors cannot invest directly in an index. Investments in overseas markets pose special risks, including currency fluctuation and political risks. These risks are generally intensified for investments in emerging markets. Countries, regions, and sectors mentioned are presented to illustrate countries, regions, and sectors in which a fund may invest. Fund holdings are subject to change daily. The Funds are actively managed.
The information contained herein is based on internal research derived from various sources and does not purport to be statements of all material facts relating to the securities mentioned. The information contained herein, while not guaranteed as to accuracy or completeness, has been obtained from sources we believe to be reliable. There are certain risks involved with investing in convertible securities in addition to market risk, such as call risk, dividend risk, liquidity risk and default risk, that should be carefully considered prior to investing. This information is being provided for informational purposes only and should not be considered investment advice or an offer to buy or sell any security in the portfolio. Investments in alternative strategies may not be suitable for all investors.
This report is intended for informational purposes only and should not be considered investment advice.
Calamos Growth Fund
OVERVIEW
The fund invests in the equities of U.S. companies from a range of market capitalizations that we believe offer the best potential for growth.
KEY FEATURES
| | ¡ | | Utilizes more than two decades of extensive research experience in growth investing | |
| | ¡ | | Active management focuses on top-down views and bottom-up fundamentals | |
| | ¡ | | Research-driven approach identifies opportunities by combining top-down analysis with a focus on key growth characteristics | |
PORTFOLIO FIT
This actively managed fund seeks to provide attractive returns through its emphasis on higher growth companies primarily in large and mid cap arenas.
| | |
| FUND NASDAQ SYMBOLS |
A Shares | | CVGRX |
B Shares | | CVGBX |
C Shares | | CVGCX |
I Shares | | CGRIX |
R Shares | | CGRRX |
| | | |
|
| FUND CUSIP NUMBERS |
A Shares | | 128119302 |
B Shares | | 128119740 |
C Shares | | 128119856 |
I Shares | | 128119807 |
R Shares | | 128119435 |
| | | |
CALAMOS GROWTH FUND
INVESTMENT TEAM DISCUSSION
How has the Fund performed?
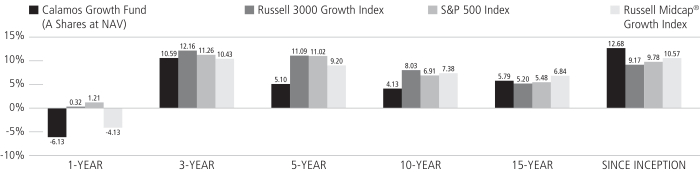
For the six-month period ended April 30, 2016, Calamos Growth Fund declined 6.37% (Class A shares at net asset value), versus a 1.64% decrease for the Russell 3000 Growth Index. For the same period the S&P 500 Index rose 0.43% and the Russell Midcap Growth Index lost 1.54%.
U.S. equities experienced a steep sell-off that started just prior to the end of calendar year 2015 through February 11, 2016. Concerns regarding falling commodity prices, China’s economic growth and potential currency devaluations, and U.S. earnings fueled recessionary fears and led investors toward safe haven investments and out of higher-growth businesses, which hurt the Fund.
As modest-yet-positive economic data was reported during the first quarter of 2016, investors returned to the equity market with a preference for value, cyclical and higher-dividend stocks. We generally take underweight positions in these categories because of their lower-growth prospects over time. As a consequence, our quality-growth focus lagged the market. When Federal Reserve Chair Janet Yellen spoke in mid-March letting investors know that the Fed foresaw two interest rate hikes and would consider global risks in their interest rate moves, growth stocks returned to favor and the Fund made a strong comeback in March, though not enough to offset earlier losses.
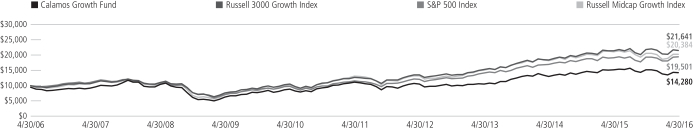
Since its inception on September 4, 1990, the Fund has returned 12.68% on an annualized basis (Class A shares at net asset value). We believe this demonstrates the Fund’s ability to outdistance the growth and broad indices over full market cycles. Over the same period, the Russell 3000 Growth Index returned 9.17%, while the S&P 500 Index and the Russell Midcap Growth Index returned 9.77% and 10.57%, respectively.
What factors influenced performance?
The Fund’s security selection in health care detracted the most value from performance. Specifically, selection in pharmaceuticals and health care services disappointed. Pharmaceutical names have come under pressure as negative headlines and politicians target drug pricing.
The Fund’s selection in consumer discretionary hindered performance. Holdings within the movies and entertainment industry and the cable and satellite industry detracted most. We have been favoring media and experiences as opposed to brick-and-mortar retail. Although we believe that the U.S. consumer is in better health owing to improvements in the labor and housing markets, we have preferred to focus on low-cost providers in the retail space. This tact paid off as discount retail stores contributed positively during the period.
Even though energy was the worst-performing sector in the Russell 3000 Growth Index, as oil prices came under severe pressure, our selection within energy contributed positively to the Fund’s results. We avoided areas that were most negatively impacted during the period and saw positive returns from our energy names.
Selection in industrials also benefited the fund, though the underweight hurt to a small extent. Specifically, aerospace and defense as well as airlines were most additive. We
| | | | |
| 4 | | CALAMOS OPEN-END FAMILY OF FUNDS SEMIANNUAL REPORT | | |
Calamos Growth Fund
believe the defense space may see increases in outlays as the geopolitical arena remains volatile.
How is the Fund positioned?
In this all-cap growth equity Fund, we seek to invest in U.S. companies that we believe have the best prospects for growth including higher sustainable growth, high relative growth, or acceleration in growth. The Fund offers a diversified approach and participates in long-term growth trends by focusing on companies with solid fundamentals, global brands, strong growth catalysts and attractive valuations. We continue to actively manage our sector exposures in conjunction with our fundamental, bottom-up research.
Our investments reflect a positive long-term outlook for equities, but we maintain a somewhat cautious view in light of economic and political conditions. We believe a combination of secular and cyclical growth holdings is appropriate, given our view that we are in a slow-growth phase of the economic cycle, yet conditions are improving for some cyclical areas of the economy. We are emphasizing companies with improving fundamentals, increasing returns on invested capital as well as more stable growth areas of the market, all the while being mindful of valuations in those spaces.
We have increased our allocation within industrials, adding to areas such as defense and environmental services. We believe that defense is an area that will continue to see growth as worrisome geopolitical events elevate fears and outlays to support the space. Industrials selection was additive to Fund performance as mentioned previously and narrowed our underweight relative to the Russell 3000 Growth Index. Conversely, we reduced investments within the consumer discretionary space, moving from a slight overweight to an underweight position relative to the benchmark. While we believe the U.S. consumer to be in decent health by virtue of increased employment and a strengthened housing market, we believe consumers will be a bit more selective in purchases, to the detriment of traditional retail and brick-and-mortar stores. We still have a considerable position in consumer discretionary names, with home improvement and entertainment names among our current favorites within the space.
What closing thoughts do you have for Fund shareholders?
The weakened U.S. dollar, a recovery in oil, and efforts from central banks around the world to reflate the global economy could create tailwinds for cyclical areas of the market. We have increased our investments in energy and industrials, as well as semiconductors within information technology. It appears that growth will remain scarce, so we believe investors will be willing to pay for those businesses that can offer superior growth. We expect to be a bit more cautious concerning valuations as higher-valued stocks may have a greater potential to sell off if volatility returns. We don’t believe that the market’s rotation to low-quality stocks is a sustained shift where companies with very low returns on capital can continue to fare well. However, cyclical growth stocks may continue to be attractive as economic growth picks up, even at a slower pace.
| | | | |
| SECTOR WEIGHTINGS | |
Information Technology | | | 30.3 | % |
Consumer Discretionary | | | 20.6 | |
Health Care | | | 16.1 | |
Industrials | | | 9.9 | |
Financials | | | 4.3 | |
Consumer Staples | | | 3.8 | |
Energy | | | 3.4 | |
Telecommunication Services | | | 1.8 | |
Materials | | | 0.7 | |
| | | | | |
Sector weightings are subject to change daily and are calculated as a percentage of net assets. The table excludes cash or cash equivalents, any government/sovereign bonds or broad based index hedging securities the Fund may hold.
Calamos Growth Fund
ANNUALIZED RETURN: SINCE INCEPTION (9/4/90) THROUGH 4/30/16
Performance data quoted represents past performance, which is no guarantee of future results. Current performance may be lower or higher than the performance quoted.
The principal value and investment return of an investment will fluctuate so that your shares, when redeemed, may be worth more or less than their original cost. You can obtain performance data current to the most recent month end by visiting www.calamos.com. Average annual total return measures net investment income and capital gain or loss from portfolio investments as an annualized average. All performance shown assumes reinvestment of dividends and capital gains distributions. Performance is for the Fund’s Class A shares at net asset value and does not include the Fund’s maximum front-end sales charge of 4.75%—had it been included, the Fund’s return would have been lower. The Fund also offers Class B, Class C, Class I and Class R shares, the performance of which may vary. Source: State Street Corporation and Lipper, Inc.
| | | | |
| 6 | | CALAMOS OPEN-END FAMILY OF FUNDS SEMIANNUAL REPORT | | |
Calamos Growth Fund
GROWTH OF $10,000: FOR THE 10-YEAR PERIOD ENDED 4/30/16
AVERAGE ANNUAL TOTAL RETURN† AS OF 4/30/16
| | | | | | | | | | | | | | | | | | | | |
| | | 6
MONTHS | | 1
YEAR | | 5
YEARS | | 10 YEARS
OR ^SINCE
INCEPTION |
Class A Shares – Inception 9/4/90 | | | | | | | | | | | | | | | | | | | | |
Without Sales Charge | | | | -6.37 | % | | | | -6.13 | % | | | | 5.10 | % | | | | 4.13 | % |
With Sales Charge | | | | -10.81 | | | | | -10.59 | | | | | 4.08 | | | | | 3.63 | |
Class B Shares – Inception 9/11/00 | | | | | | | | | | | | | | | | | | | | |
Without Sales Charge | | | | -6.71 | | | | | -6.82 | | | | | 4.32 | | | | | 3.51 | |
With Sales Charge | | | | -10.07 | | | | | -10.18 | | | | | 4.16 | | | | | 3.51 | |
Class C Shares – Inception 9/3/96 | | | | | | | | | | | | | | | | | | | | |
Without Sales Charge | | | | -6.71 | | | | | -6.85 | | | | | 4.32 | | | | | 3.35 | |
With Sales Charge | | | | -7.33 | | | | | -7.47 | | | | | 4.32 | | | | | 3.35 | |
Class I Shares – Inception 9/18/97 | | | | -6.25 | | | | | -5.90 | | | | | 5.36 | | | | | 4.39 | |
Class R Shares – Inception 3/1/07 | | | | -6.46 | | | | | -6.35 | | | | | 4.84 | | | | | 4.93 | ^ |
Performance data quoted represents past performance, which is no guarantee of future results. Current performance may be lower or higher than the performance quoted. The principal value and investment return of an investment will fluctuate so that your shares, when redeemed, may be worth more or less than their original cost.
As of the prospectus dated 2/29/16, the Fund’s gross expense ratio for Class A shares is 1.32%; Class B and C shares is 2.07%; Class I shares is 1.07%; Class R shares is 1.57%.
| † | Average annual total return measures net investment income and capital gain or loss from portfolio investments as an annualized average assuming reinvestment of dividends and capital gains distributions. Performance shown reflects the effects of an expense reimbursement that improved results and was in effect until March 31, 2000. Load-adjusted returns are adjusted for the maximum front-end sales load of 4.75% for Class A shares and returns for Class B and C have been adjusted for the contingent deferred sales charge (CDSC). |
NOTES:
The graphs do not reflect the income taxes that you would pay on fund distributions or the redemption of fund shares. Fund performance includes reinvestment of dividends and adjustment for the maximum sales charge for Class A shares. The performance of other classes will vary from the performance of the class shown based on the difference in sales charges and fees paid by shareholders investing in different share classes.
The Russell 3000® Growth Index measures the performance of companies with higher price-to-book ratios and higher forecasted growth values. Index data shown for the Annualized Return Since Inception graph is from 8/31/90, since comparative index data is only available for full monthly periods. Source: Lipper, Inc.
The S&P 500 Index is an unmanaged index generally considered representative of the U.S. stock market. Index data shown for the Annualized Return Since Inception graph is from 8/31/90, since comparative index data is only available for full monthly periods. Source: Lipper, Inc.
The Russell Midcap® Growth Index measures the performance of mid-sized companies with growth characteristics. Index data shown for the Annualized Return Since Inception graph is from 8/31/90, since comparative index data is only available for full monthly periods. Source: Lipper, Inc.
Index returns assume reinvestment of dividends and do not reflect deduction of fees and expenses. It is not possible to invest directly in an index.
Calamos Opportunistic Value Fund
OVERVIEW
The fund invests in the equities of small, midsize and large U.S companies that we believe are undervalued according to certain financial measurements of their intrinsic values.
KEY FEATURES
| | ¡ | | Utilizes bottom-up stock picking and a benchmark-agnostic approach, which focuses on good businesses with solid cash flow and value prices | |
PORTFOLIO FIT
The fund is a core value option that may balance a growth allocation and complement other value strategies. Our flexibility in analyzing all companies regardless of sector helps us avoid the cyclicality inherent in a deep value strategy or momentum growth strategy.
| | |
| FUND NASDAQ SYMBOLS |
A Shares | | CVAAX |
B Shares | | CVABX |
C Shares | | CVACX |
I Shares | | CVAIX |
R Shares | | CVARX |
| |
|
| FUND CUSIP NUMBERS |
A Shares | | 128119666 |
B Shares | | 128119658 |
C Shares | | 128119641 |
I Shares | | 128119633 |
R Shares | | 128119419 |
| | | |
CALAMOS OPPORTUNISTIC VALUE FUND
INVESTMENT TEAM DISCUSSION
How has the Fund performed?
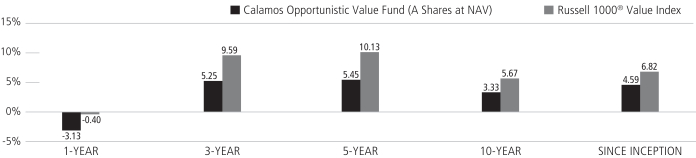
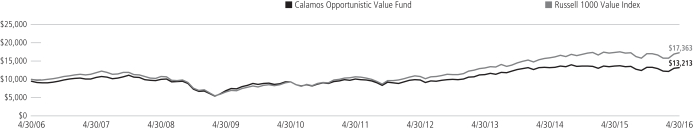
For the six-month period ended April 30, 2016, the Fund dipped 0.92% (Class A shares at net asset value) versus a gain of 1.93% for the Russell 1000 Value Index.
The Fund performed broadly in line with the Russell 1000 Value Index through the first half of the reporting period as U.S. equities experienced a steep sell-off that started just prior to the end of 2015 through February 11, 2016. Concerns of falling commodity prices, China’s economic growth and potential currency devaluations, and U.S. earnings setbacks fueled recessionary fears and led investors into safe-haven investments and out of higher-growth businesses. The market rebound in mid-February through March favored deeper cyclical and value oriented names that performed well once investors came to accept that the global economy was not falling into a recession. The Fund’s performance improved in March, but lost ground relative to the index.
What factors influenced performance?
The U.S. equity market saw a dramatic sell-off during the reporting period, with the Russell 1000 Value Index falling more than 12% by February 11. As modest-yet-positive economic data was reported midway through the quarter, it appears that investors switched gears and returned to the equity market with a preference for deeper value, cyclical and higher-dividend stocks. Federal Reserve Chair Janet Yellen spoke in mid-March letting investors know that the Fed foresaw two rather than four interest rate hikes and, additionally, would consider global risks in deciding interest rate moves. The Fed’s stance appeared to have helped the market return to more balanced leadership between cyclical and secular growth-oriented companies.
Investors in the value space showed a strong preference for lower-beta and higher-dividend stocks. Based upon economic sectors, our selection in energy and industrials were the biggest detractors to performance versus the Russell 1000 Value Index. In the energy space, which was affected by a rapid decline in oil prices worldwide, selection in refining and marketing as well as exploration and production weighed down results. Industrials saw improvement as cyclicals enjoyed success when investor demand returned. The Fund’s overweight to the sector was beneficial, but selections in electrical components and equipment holdings, despite showing strong absolute results, lagged those of the benchmark. Human resource and employment services names also impeded relative performance. The Fund’s selection within information technology added value as IT consulting and data processing and outsourced services strongly outperformed their benchmark brethren. Selection within telecommunications services also worked well for the Fund, as the market favored securities offering higher dividends as is common in telecommunications services.
How is the Fund positioned?
The Fund seeks to identify attractively valued, temporarily out of favor stocks or mispriced companies with good future business prospects. In essence, we believe that the Fund’s positioning reflects good businesses trading at value prices.
We continue to actively manage our sector exposures in conjunction with our fundamental, bottom-up research. Our research has pointed us toward opportunities in
| | | | |
| 8 | | CALAMOS OPEN-END FAMILY OF FUNDS SEMIANNUAL REPORT | | |
Calamos Opportunistic Value Fund
the consumer discretionary and industrials sectors, and the Fund is positioned as such. Within consumer discretionary, we have found opportunities in the movies and entertainment and specialty stores. In Industrials, our research led us to favor industrial machinery. Our most significant underweight is in the utilities sector, where we do have ownership, but have concerns of overheating valuations vis-a-vis higher-dividend and perceived safe-haven investments. During the period, we added to consumer staples, narrowing our underweight to the sector. As mentioned previously, we have concerns over the higher valuations assigned to some areas within the value universe of stocks as investors favor higher-quality, lower-volatility earnings stories. In response, we have constructed a portfolio with favorable valuation metrics such as price-to-sales and price-to-cash flow measures.
What closing thoughts do you have for Fund shareholders?
One commonly held assumption is that today’s financial landscape is fragile. We understand the concerns regarding the economy and have strategically positioned the Fund in areas of the equity market we believe have appreciation potential. Value stocks may offer opportunities as it appears to us that investors have priced in extremely modest expectations for many businesses, and have bid up other safe-haven investments. For example, we think that many consumer staples stocks trade at premiums to the market and to their own history despite negligible growth. Investors appear to be paying for the stability and defensiveness of these companies rather than their long-term potential.
Our focus remains on solid businesses with sustainable cash flows, trading at attractive prices. We are mindful of valuations and have been trimming positions where valuations may subject stocks to increased volatility. In addition, we have used market pullbacks in an attempt to selectively add to positions offering solid fundamentals.
| | | | |
SECTOR WEIGHTINGS | |
Financials | | | 27.6 | % |
Energy | | | 13.0 | |
Health Care | | | 11.9 | |
Information Technology | | | 11.6 | |
Industrials | | | 11.4 | |
Consumer Discretionary | | | 6.8 | |
Consumer Staples | | | 6.2 | |
Utilities | | | 4.5 | |
Materials | | | 2.3 | |
Telecommunication Services | | | 2.3 | |
Sector weightings are subject to change daily and are calculated as a percentage of net assets. The table excludes cash or cash equivalents, any government/sovereign bonds or broad based index hedging securities the Fund may hold.
ANNUALIZED RETURN: SINCE INCEPTION (1/2/02) THROUGH 4/30/16
Performance data quoted represents past performance, which is no guarantee of future results. Current performance may be lower or higher than the performance quoted.
The principal value and investment return of an investment will fluctuate so that your shares, when redeemed, may be worth more or less than their original cost. You can obtain performance data current to the most recent month end by visiting www.calamos.com. Average annual total return measures net investment income and capital gain or loss from portfolio investments as an annualized average. All performance shown assumes reinvestment of dividends and capital gains distributions. Performance is for the Fund’s Class A shares at net asset value and does not include the Fund’s maximum front-end sales charge of 4.75%—had it been included, the Fund’s return would have been lower. The Fund also offers Class B, Class C, Class I and Class R shares, the performance of which may vary. Performance shown reflects an expense reimbursement that improved results. Source: State Street Corporation and Lipper, Inc.
Calamos Opportunistic Value Fund
GROWTH OF $10,000: FOR THE 10-YEAR PERIOD ENDED 4/30/16
AVERAGE ANNUAL TOTAL RETURN† AS OF 4/30/16
| | | | | | | | | | | | | | | | | | | | |
| | | 6
MONTHS | | 1
YEAR | | 5
YEARS | | 10 YEARS
OR ^SINCE
INCEPTION |
Class A Shares – Inception 1/2/02 | | | | | | | | | | | | | | | | | | | | |
Without Sales Charge | | | | -0.92 | % | | | | -3.13 | % | | | | 5.45 | % | | | | 3.33 | % |
With Sales Charge | | | | -5.64 | | | | | -7.70 | | | | | 4.43 | | | | | 2.83 | |
Class B Shares – Inception 1/2/02 | | | | | | | | | | | | | | | | | | | | |
Without Sales Charge | | | | -1.25 | | | | | -3.85 | | | | | 4.67 | | | | | 2.71 | |
With Sales Charge | | | | -5.82 | | | | | -8.30 | | | | | 4.33 | | | | | 2.71 | |
Class C Shares – Inception 1/2/02 | | | | | | | | | | | | | | | | | | | | |
Without Sales Charge | | | | -1.35 | | | | | -3.91 | | | | | 4.66 | | | | | 2.56 | |
With Sales Charge | | | | -2.26 | | | | | -4.80 | | | | | 4.66 | | | | | 2.56 | |
Class I Shares – Inception 3/1/02 | | | | -0.82 | | | | | -2.91 | | | | | 5.72 | | | | | 3.58 | |
Class R Shares – Inception 3/1/07 | | | | -0.99 | | | | | -3.37 | | | | | 5.19 | | | | | 2.80 | ^ |
Performance data quoted represents past performance, which is no guarantee of future results. Current performance may be lower or higher than the performance quoted. The principal value and investment return of an investment will fluctuate so that your shares, when redeemed, may be worth more or less than their original cost.
As of the prospectus dated 2/29/16, the Fund’s gross expense ratio for Class A shares is 1.60%; Class B shares is 2.34%; Class C shares is 2.35%; Class I shares is 1.34%; Class R shares is 1.86%. The Fund’s investment advisor has contractually agreed to reimburse Fund expenses through March 1, 2017, to the extent necessary so that Total Annual Fund Operating Expenses (excluding taxes, interest, short interest, short dividend expenses, brokerage commissions, acquired fund fees and expenses, and extraordinary expenses, if any) of Class A, Class B, Class C, Class I and Class R are limited to 1.15%, 1.90%, 1.90%, 0.90% and 1.40% of average net assets, respectively.
| † | Average annual total return measures net investment income and capital gain or loss from portfolio investments as an annualized average assuming reinvestment of dividends and capital gains distributions. Performance shown reflects the effects of an expense reimbursement that improved results and was in effect until March 31, 2004. Load-adjusted returns are adjusted for the maximum front-end sales load of 4.75% for Class A shares and returns for Class B and C shares have been adjusted for the contingent deferred sales charge (CDSC). |
NOTES:
The graphs do not reflect the income taxes that you would pay on fund distributions or the redemption of fund shares. Fund performance includes reinvestment of dividends and adjustment for the maximum sales charge for Class A shares. The performance of other classes will vary from the performance of the class shown based on the difference in sales charges and fees paid by shareholders investing in different share classes.
The Russell 1000® Value Index measures the performance of those companies in the Russell 1000® Index with lower price-to-book ratios and lower forecasted growth values. Index data shown for the Annualized Return Since Inception graph is from 12/31/01, since comparative index data is only available for full monthly periods. Source: Lipper, Inc.
Index returns assume reinvestment of dividends and do not reflect deduction of fees and expenses. It is not possible to invest directly in an index.
| | | | |
| 10 | | CALAMOS OPEN-END FAMILY OF FUNDS SEMIANNUAL REPORT | | |
Calamos Focus Growth Fund
CALAMOS FOCUS GROWTH FUND
INVESTMENT TEAM DISCUSSION
How has the Fund performed?
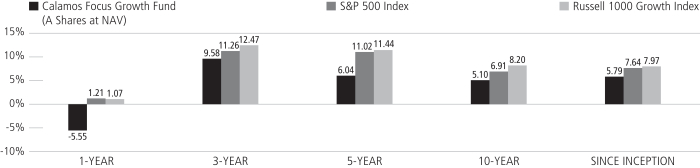
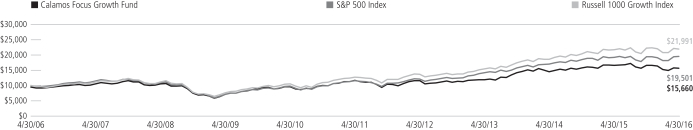
For the six-month period ended April 30, 2016, the Fund declined 5.66% (Class A Shares at net asset value) versus a return of 0.43% for the S&P 500 Index and a loss of 1.37% for the Russell 1000 Growth Index.
The Fund had performed broadly in line with the U.S. equity market as well as growth stocks through early February, but lagged during a value-oriented market rally in the last two months of the reporting period. The sectors that led the rally in March and April included energy, materials, industrials and financials.
Since its inception on December 1, 2003, the Fund has returned 5.79% NAV versus returns of 7.64% for the S&P 500 Index and 7.97% for the Russell 1000 Growth Index.
What factors influenced performance?
The Fund was challenged in a period characterized by a dramatic and broad sell-off in the marketplace in January. Investors appeared to be concerned about global growth, a rising U.S. dollar, and the dollar’s effects on U.S. corporate earnings. The Russell 1000 Growth Index had declined 11.16% from January 1, 2016 through February 11, 2016 (the market’s low for the reporting period). The subsequent rally was led by cyclical areas of the market (energy, materials, and industrials) and value stocks, counter to the Fund’s growth bias and positioning.
Holdings within the health care sector lagged those of the Russell 1000 Growth Index. The biotechnology industry came under pressure as drug price increases made negative news headlines, and the names held within the Fund subsequently underperformed. Additionally, our ownership of higher growth pharmaceuticals fell out of favor as more conservative pharmaceutical names drew investor attention in the reporting period. Selection within the cable and satellite industry of consumer discretionary also detracted from results. Selection within energy added to performance, as names held within the portfolio finished in positive territory for the period, while the sector was the biggest laggard in the Russell 1000 Growth Index. Additionally, selection within industrials performed well for the Fund, most notably within defense and environmental services.
How is the Fund positioned?
This large cap growth equity Fund invests in a diversified, yet concentrated portfolio of common stocks. We seek to invest in U.S. companies that we believe have the best prospects for growth, including higher sustainable growth, high relative growth, or acceleration in growth. We aim to participate in long-term growth trends by focusing on companies with solid or improving fundamentals, global brands, strong growth catalysts and attractive valuations.
We believe our investments reflect a positive long-term outlook for equities, but we maintain a somewhat cautious view in light of economic and political conditions. We believe a combination of secular and cyclical growth holdings is appropriate, given our view that we are in a slow-growth phase of the economic cycle, yet conditions are improving for some cyclical areas of the economy. We are emphasizing companies that
OVERVIEW
The fund invests in a select portfolio of equities issued by “blue chip” U.S. companies that offer opportunities for growth.
KEY FEATURES
| | ¡ | | Active management utilizes over 20 years of extensive research experience in growth investing | |
| | ¡ | | The compact portfolio comprises only those large cap stocks in which we have the greatest confidence of sustained growth | |
| | ¡ | | Stresses company fundamentals, including global presence, strong or accelerated earnings growth, and solid returns on invested capital | |
PORTFOLIO FIT
The fund is a core growth allocation centered on a compact equity portfolio of large cap stocks.
| | |
| FUND NASDAQ SYMBOLS |
A Shares | | CBCAX |
B Shares | | CBCBX |
C Shares | | CBXCX |
I Shares | | CBCIX |
R Shares | | CBCRX |
| | | |
|
| FUND CUSIP NUMBERS |
A Shares | | 128119625 |
B Shares | | 128119617 |
C Shares | | 128119591 |
I Shares | | 128119583 |
R Shares | | 128119427 |
| | | |
Calamos Focus Growth Fund
| | | | |
| SECTOR WEIGHTINGS | |
Information Technology | | | 35.2 | % |
Consumer Discretionary | | | 20.2 | |
Health Care | | | 14.8 | |
Industrials | | | 9.0 | |
Consumer Staples | | | 3.9 | |
Financials | | | 3.8 | |
Energy | | | 3.0 | |
Telecommunication Services | | | 2.3 | |
Materials | | | 0.7 | |
| | | | | |
Sector weightings are subject to change daily and are calculated as a percentage of net assets. The table excludes cash or cash equivalents, any government/sovereign bonds or broad based index hedging securities the Fund may hold.
we believe have improving fundamentals and increasing returns on invested capital. We also look for more stable growth areas of the market, while being mindful of valuations in those spaces.
We increased our allocation within industrials, adding to areas such as defense and environmental services. We believe that defense is an area that will continue to see growth as worrisome geopolitical events elevate fears and outlays to support the space. The additions to industrials was additive to Fund performance as mentioned previously and we narrowed our underweight relative to the Russell 1000 Growth Index. Conversely, we reduced investments within the consumer discretionary space, moving from a slight overweight to an underweight position relative to the benchmark. While we believe the U.S. consumer to be in decent health by virtue of increased employment and a strengthened housing market, we believe consumers will be a bit more selective in purchases, to the detriment of traditional retail and brick-and-mortar stores. We still have a considerable position in consumer discretionary names, with home improvement and entertainment names among our current favorites within the space.
What closing thoughts do you have for Fund shareholders?
The weakened U.S. dollar, a recovery in oil, and efforts from central banks around the world to reflate the global economy could create tailwinds for cyclical areas of the market. We have increased our investments in energy and industrials, as well as semiconductors within information technology. Growth may remain scarce, so we believe investors may be willing to pay for those businesses that can offer superior growth. We expect to be a bit more cautious concerning valuations as higher-valued stocks may have a greater potential to sell off if volatility returns. We don’t believe that the market’s rotation to low-quality stocks is a sustained shift where companies with very low returns on capital can continue to fare well. However, cyclical growth stocks may continue to be attractive as economic growth picks up.
ANNUALIZED RETURN: SINCE INCEPTION (12/1/03) THROUGH 4/30/16
Performance data quoted represents past performance, which is no guarantee of future results. Current performance may be lower or higher than the performance quoted.
The principal value and investment return of an investment will fluctuate so that your shares, when redeemed, may be worth more or less than their original cost. You can obtain performance data current to the most recent month end by visiting www.calamos.com. Average annual total return measures net investment income and capital gain or loss from portfolio investments as an annualized average. All performance shown assumes reinvestment of dividends and capital gains distributions. Performance is for the Fund’s Class A shares at net asset value and does not include the Fund’s maximum front-end sales charge of 4.75%—had it been included, the Fund’s return would have been lower. The Fund also offers Class B, Class C, Class I and Class R shares, the performance of which may vary. Performance shown reflects an expense reimbursement that improved results. Source: State Street Corporation and Lipper, Inc.
| | | | |
| 12 | | CALAMOS OPEN-END FAMILY OF FUNDS SEMIANNUAL REPORT | | |
Calamos Focus Growth Fund
GROWTH OF $10,000: FOR THE 10-YEAR PERIOD ENDED 4/30/16
AVERAGE ANNUAL TOTAL RETURN† AS OF 4/30/16
| | | | | | | | | | | | | | | | | | | | |
| | | 6
MONTHS | | 1
YEAR | | 5
YEARS | | 10 YEARS
OR ^SINCE
INCEPTION |
Class A Shares – Inception 12/1/03 | | | | | | | | | | | | | | | | | | | | |
Without Sales Charge | | | | -5.66 | % | | | | -5.55 | % | | | | 6.04 | % | | | | 5.10 | % |
With Sales Charge | | | | -10.13 | | | | | -10.03 | | | | | 5.02 | | | | | 4.59 | |
Class B Shares – Inception 12/1/03 | | | | | | | | | | | | | | | | | | | | |
Without Sales Charge | | | | -6.00 | | | | | -6.23 | | | | | 5.24 | | | | | 4.46 | |
With Sales Charge | | | | -9.79 | | | | | -10.01 | | | | | 4.94 | | | | | 4.46 | |
Class C Shares – Inception 12/1/03 | | | | | | | | | | | | | | | | | | | | |
Without Sales Charge | | | | -6.00 | | | | | -6.23 | | | | | 5.26 | | | | | 4.31 | |
With Sales Charge | | | | -6.76 | | | | | -6.99 | | | | | 5.26 | | | | | 4.31 | |
Class I Shares – Inception 12/1/03 | | | | -5.57 | | | | | -5.31 | | | | | 6.31 | | | | | 5.36 | |
Class R Shares – Inception 3/1/07 | | | | -5.71 | | | | | -5.71 | | | | | 5.79 | | | | | 4.73 | ^ |
Performance data quoted represents past performance, which is no guarantee of future results. Current performance may be lower or higher than the performance quoted. The principal value and investment return of an investment will fluctuate so that your shares, when redeemed, may be worth more or less than their original cost.
As of the prospectus dated 2/29/16, the Fund’s gross expense ratio for Class A shares is 1.58%; Class B and C shares is 2.33%; Class I shares is 1.33%; Class R shares is 1.85%. The Fund’s investment advisor has contractually agreed to reimburse Fund expenses through March 1, 2017 to the extent necessary so that Total Annual Fund Operating Expenses (excluding taxes, interest, short interest, short dividend expenses, brokerage commissions, acquired fund fees and expenses, and extraordinary expenses, if any) of Class A, Class B, Class C, Class I and Class R are limited to 1.15%, 1.90%, 1.90%, 0.90% and 1.40% of average net assets, respectively.
| † | Average annual total return measures net investment income and capital gain or loss from portfolio investments as an annualized average assuming reinvestment of dividends and capital gains distributions. Performance shown reflects the effects of an expense reimbursement that improved results and was in effect until March 31, 2004. Load-adjusted returns are adjusted for the maximum front-end sales load of 4.75% for Class A shares and returns for Class B and C shares have been adjusted for the contingent deferred sales charge (CDSC). |
NOTES:
The graphs do not reflect the income taxes that you would pay on fund distributions or the redemption of fund shares. Fund performance includes reinvestment of dividends and adjustment for the maximum sales charge for Class A shares. The performance of other classes will vary from the performance of the class shown based on the difference in sales charges and fees paid by shareholders investing in different share classes.
The S&P 500 Index is an unmanaged index generally considered representative of the U.S. stock market. Index data shown for the Since Inception Growth of $10,000 graph is from 11/30/03, since comparative index data is only available for full monthly periods. Source: Lipper, Inc.
The Russell 1000® Growth Index measures the performance of the large-cap growth segment of the U.S. equity universe. It includes those Russell 1000 companies with higher price to-book ratios and higher forecasted growth values. Index data shown for the Since Inception Growth of $10,000 graph is from 11/30/03, since comparative index data is only available for full monthly periods. Source: Lipper, Inc.
Index returns assume reinvestment of dividends and do not reflect deduction of fees and expenses. It is not possible to invest directly in an index.
Calamos Discovery Growth Fund
OVERVIEW
The fund invests in small and midsize U.S. companies that we believe offer the best potential for growth.
KEY FEATURES
| | ¡ | | Employs bottom-up stock selection based on a combination of quantitative and fundamental research drivers | |
| | ¡ | | Applies in-depth research to add value in the inefficient small and mid cap market | |
| | ¡ | | Emphasizes risk management and portfolio construction in a process that seeks greater risk-adjusted returns over a full market cycle | |
PORTFOLIO FIT
The fund is a SMID cap growth equity allocation option.
| | |
| FUND NASDAQ SYMBOLS |
A Shares | | CADGX |
B Shares | | CBDGX |
C Shares | | CCDGX |
I Shares | | CIDGX |
R Shares | | CRDGX |
| | | |
|
| FUND CUSIP NUMBERS |
A Shares | | 128120102 |
B Shares | | 128120201 |
C Shares | | 128120300 |
I Shares | | 128120409 |
R Shares | | 128120508 |
| | | |
CALAMOS DISCOVERY GROWTH FUND
INVESTMENT TEAM DISCUSSION
How has the Fund performed?
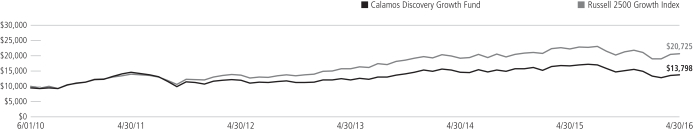
For the six-month period ended April 30, 2016, the Fund declined 8.80% (Class A shares at net asset value) versus a loss of 3.05% for the Russell 2500 Growth Index.
The Fund performed in line with the Russell 2500 Growth Index through the first half of the reporting period as U.S. equities experienced a steep sell-off that started just prior to the end of 2015 and continued until February 11, 2016. Concerns of falling commodity prices, China’s economic growth and potential currency devaluations, and U.S. earnings fueled recessionary fears and led investors into safe-haven investments and out of higher-growth businesses. The Fund lagged as the market rebound in mid-February favored cyclical and value-oriented names that performed well once investors seemed to accept that the global economy was not falling into a recession.
What factors influenced performance?
The mid cap growth space saw a dramatic sell-off during the reporting period, with the Russell 2500 Growth Index falling more than 20% by February 11. As modest-yet-positive economic data was reported midway through the first quarter of 2016, investors switched gears and returned to the equity market with a preference for value, cyclical and higher-dividend stocks. In mid-March, Federal Reserve Chair Janet Yellen told investors that the Fed foresaw two rather than four interest rate hikes and would consider global risks in deciding interest rate moves. After those comments, growth stocks returned to favor for the month, much as they had for most of 2015.
Investors in this space showed a strong preference for lower-beta and higher-dividend stocks. Based upon economic sectors, our selection in consumer discretionary and information technology were the biggest detractors to relative performance versus the Russell 2500 Growth Index. Selection in auto parts and equipment and restaurants took the biggest hit within consumer discretionary. Within information technology, Internet software and services names lagged those of the benchmark.
Alternatively, selection within health care and energy, the two worst-performing sectors within the index for the period, added to the Fund’s relative performance. Selection in pharmaceuticals and health care equipment worked well as did underweighting the biotechnology industry, which came under severe pressure during the period. Turning to energy, stocks within the exploration and services industry outperformed, and the Fund also benefitted from avoiding other areas within energy that were severely challenged.
How is the Fund positioned?
This Fund seeks to invest in small and midsize U.S. companies that we believe have the best prospects for high sustainable or accelerated growth. The Fund takes a diversified and active approach that participates in long-term growth trends and focuses on companies with solid fundamentals, global brands, strong growth catalysts and attractive valuations. Our investments reflect what we believe to be a positive long-term outlook for equities. We believe a combination of secular and cyclical growth holdings is appropriate, given our view that we are in a business cycle characterized by
| | | | |
| 14 | | CALAMOS OPEN-END FAMILY OF FUNDS SEMIANNUAL REPORT | | |
Calamos Discovery Growth Fund
low inflation and moderate global growth. The Fund holds these secular and cyclical opportunities where we believe expectations for growth are unreasonably low, creating the investment opportunity. We are emphasizing companies with sound growth fundamentals, increasing returns on invested capital and attractive valuations.
We continue to actively manage our sector exposures in conjunction with our fundamental, bottom-up research. Our largest absolute weightings by sector include opportunities within the information technology, consumer discretionary and health care sectors. We believe that technology offers great long-term growth opportunities as well as some cyclical investments as well. We also believe the U.S. consumer is in overall good health as the employment and housing markets have improved, yet we are selective in the consumer discretionary space, with a preference for low-cost providers in the retail space and more experiential discretionary purchases such as entertainment. We believe health care still offers great opportunity, but we have been cautious on account of negative drug pricing headlines and highly politicized public concerns. We have added to cyclical areas such as energy and industrials, albeit at small absolute levels.
What closing thoughts do you have for Fund shareholders?
We believe the U.S. market will have modestly positive returns and may represent a compelling equity market in a low-return world. We do not foresee a recession in the U.S., but trends in housing and employment point to a slow-growth economy. The market will remain volatile and is anxiously awaiting further news from the Federal Reserve as to the path of potential interest rate moves and indications of strong, self-sustaining economic expansion.
The weakened U.S. dollar, a recovery in oil, and efforts from central banks around the world to reflate the global economy could create tailwinds for cyclical areas of the market. In response, we have increased our investments in energy and industrials. Growth may remain scarce, so we believe investors will be willing to pay for those businesses that can offer superior growth. We expect to be a bit more cautious around valuation as higher-valued stocks may have greater potential for selling off if volatility returns. We don’t believe that the market’s rotation to low-quality stocks is a sustained shift where companies with low returns on capital can continue to fare well. However, cyclical growth stocks may continue to be attractive as economic growth picks up, even at a slower pace.
| | | | |
| SECTOR WEIGHTINGS | |
Information Technology | | | 29.0 | % |
Health Care | | | 25.1 | |
Consumer Discretionary | | | 18.7 | |
Industrials | | | 10.0 | |
Financials | | | 9.0 | |
Energy | | | 3.6 | |
Telecommunication Services | | | 2.4 | |
Materials | | | 1.3 | |
Sector weightings are subject to change daily and are calculated as a percentage of net assets. The table excludes cash or cash equivalents, any government/sovereign bonds or broad based index hedging securities the Fund may hold.
Calamos Discovery Growth Fund
GROWTH OF $10,000: SINCE INCEPTION (6/1/10) THROUGH 4/30/16
AVERAGE ANNUAL TOTAL RETURN† AS OF 4/30/16
| | | | | | | | | | | | | | | | | | | | |
| | | 6
MONTHS | | 1
YEAR | | 5
YEARS | | SINCE
INCEPTION |
Class A Shares – Inception 6/1/2010 | | | | | | | | | | | | | | | | | | | | |
Without Sales Charge | | | | -8.80 | % | | | | -17.35 | % | | | | -1.16 | % | | | | 6.47 | % |
With Sales Charge | | | | -13.12 | | | | | -21.30 | | | | | -2.11 | | | | | 5.59 | |
Class B Shares – Inception 6/1/2010 | | | | | | | | | | | | | | | | | | | | |
Without Sales Charge | | | | -9.22 | | | | | -18.03 | | | | | -1.89 | | | | | 5.68 | |
With Sales Charge | | | | -13.71 | | | | | -22.09 | | | | | -2.19 | | | | | 5.55 | |
Class C Shares – Inception 6/1/2010 | | | | | | | | | | | | | | | | | | | | |
Without Sales Charge | | | | -9.14 | | | | | -17.97 | | | | | -1.89 | | | | | 5.68 | |
With Sales Charge | | | | -10.04 | | | | | -18.78 | | | | | -1.89 | | | | | 5.68 | |
Class I Shares – Inception 6/1/2010 | | | | -8.66 | | | | | -17.10 | | | | | -0.89 | | | | | 6.75 | |
Class R Shares – Inception 6/1/2010 | | | | -8.92 | | | | | -17.51 | | | | | -1.39 | | | | | 6.22 | |
Performance data quoted represents past performance, which is no guarantee of future results. Current performance may be lower or higher than the performance quoted. The principal value and investment return of an investment will fluctuate so that your shares, when redeemed, may be worth more or less than their original cost. You can obtain performance data current to the most recent month end by visiting www.calamos.com.
As of the prospectus dated 2/29/16, the Fund’s gross expense ratio for Class A shares is 1.64%; Class B and Class C shares is 2.39%; Class I shares is 1.39%; Class R shares is 1.89%. The Fund’s investment advisor has contractually agreed to reimburse Fund expenses through March 1, 2017, to the extent necessary so that Total Annual Fund Operating Expenses (excluding taxes, interest, short interest, short dividend expenses, brokerage commissions, acquired fund fees and expenses, and extraordinary expenses, if any) of Class A, Class B, Class C, Class I and Class R are limited to 1.50%, 2.25%, 2.25%, 1.25% and 1.75% of average net assets, respectively.
| † | Average annual total return measures net investment income and capital gain or loss from portfolio investments as an annualized average assuming reinvestment of dividends and capital gains distributions. Load-adjusted returns are adjusted for the maximum front-end sales load of 4.75% for Class A shares and returns for Class B and C shares have been adjusted for the contingent deferred sales charge (CDSC). |
NOTES:
The graph does not reflect the income taxes you would pay on fund distributions or the redemption of fund shares. Fund performance includes reinvestment of dividends and adjustment for the maximum sales charge for Class A shares. The performance of other classes will vary from the performance of the class shown based on the difference in sales charges and fees paid by shareholders investing in different share classes.
The Russell 2500™ Growth Index measures the performance of the small- to mid-cap growth segment of the U.S. equity universe. It includes those Russell 2500 companies with higher price-to-book ratios and higher forecasted growth values. Source: Lipper, Inc.
Index returns assume reinvestments of dividends and do not reflect deduction of fees and expenses. It is not possible to invest directly in an index.
| | | | |
| 16 | | CALAMOS OPEN-END FAMILY OF FUNDS SEMIANNUAL REPORT | | |
Calamos Dividend Growth Fund
CALAMOS DIVIDEND GROWTH FUND
INVESTMENT TEAM DISCUSSION
How has the Fund performed?
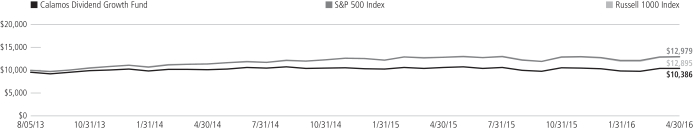
For the six-month period ended April 30, 2016, the Fund decreased 1.02% (Class A shares at net asset value) versus a 0.43% gain for the S&P 500 Index and a 0.22% gain for the Russell 1000 Index.
The Fund performed in line with the U.S. equity market as U.S. equities experienced a steep sell-off that started prior to the end of 2015 through February 11, 2016. Concerns of falling commodity prices, China’s economic growth and potential currency devaluations, and U.S. earnings setbacks fueled recessionary fears and led investors toward safe-haven investments and out of higher-growth businesses. The Fund lagged slightly as the market rebound favored cyclical and value-oriented names that performed well after investors appeared to accept that the global economy was not falling into a recession.
What factors influenced performance?
The Fund’s slight overweights to the telecommunications services and utilities sectors bolstered performance as these sectors typically represent higher-dividend-paying securities and were the two leading sectors within the S&P 500 Index for the reporting period. Selection in the consumer discretionary sector also provided a lift to Fund performance as stocks from the advertising and home improvement retail spaces were beneficial. Conversely, stock selection in energy detracted from performance as a small allocation to the oil and-gas storage and transportation industry disappointed. Energy names rebounded strongly during the period, and were led by large cap integrated oil and gas names. Selection within the consumer staples sector lagged because of our lack of holdings in the strong performing packaged foods and meats industry.
How is the Fund positioned?
The Fund’s investments reflect our positive yet cautious long-term outlook for equities and our preference for dividend-paying companies with sound fundamentals and attractive valuations. Furthermore, we seek companies that have an ability to increase dividends over time, either through increasing profits or more efficient use of capital. We continue to actively manage our sector exposures in conjunction with our fundamental, bottom-up research approach. The Fund has slight overweights to telecommunications services and the utilities sectors, while remaining underweight energy, information technology and financials. The Fund’s largest allocations in absolute terms are in the information technology, financials and health care sectors.
OVERVIEW
The fund invests in companies that we believe have the ability to increase dividends over time, either through increasing profits or more efficient use of capital.
KEY FEATURES
| | ¡ | | Utilizes bottom-up stock picking and a benchmark-agnostic approach, which focuses on good businesses with solid cash flow and value prices | |
PORTFOLIO FIT
The fund seeks to provide a regular stream of income and dividend-paying equity investments that tend to be less volatile than non-dividend payers.
| | |
| FUND NASDAQ SYMBOLS |
A Shares | | CADVX |
C Shares | | CCDVX |
I Shares | | CIDVX |
R Shares | | CRDVX |
|
| FUND CUSIP NUMBERS |
A Shares | | 128120839 |
C Shares | | 128120821 |
I Shares | | 128120813 |
R Shares | | 128120797 |
Calamos Dividend Growth Fund
| | | | |
| SECTOR WEIGHTINGS | |
Information Technology | | | 18.0 | % |
Health Care | | | 14.7 | |
Financials | | | 14.6 | |
Consumer Discretionary | | | 12.8 | |
Industrials | | | 9.8 | |
Consumer Staples | | | 9.5 | |
Energy | | | 5.5 | |
Utilities | | | 3.6 | |
Telecommunication Services | | | 3.5 | |
Materials | | | 2.1 | |
Sector weightings are subject to change daily and are calculated as a percentage of net assets. The table excludes cash or cash equivalents, any government/sovereign bonds or broad based index hedging securities the Fund may hold.
Our focus remains on solid businesses with sustainable cash flows, trading at attractive prices. We are mindful of valuations and have been trimming positions where valuations may subject stocks to increased volatility. In addition, we have used market pullbacks in an attempt to selectively add to positions offering solid fundamentals.
| | | | |
| 18 | | CALAMOS OPEN-END FAMILY OF FUNDS SEMIANNUAL REPORT | | |
Calamos Dividend Growth Fund
GROWTH OF $10,000: SINCE INCEPTION (8/5/13) THROUGH 4/30/16
AVERAGE ANNUAL TOTAL RETURN† AS OF 4/30/16
| | | | | | | | | | | | | | | |
| | | 6
MONTHS | | 1
YEAR | | SINCE
INCEPTION |
Class A Shares – Inception 8/5/2013 | | | | | | | | | | | | | | | |
Without Sales Charge | | | | -1.02 | % | | | | -1.67 | % | | | | 3.22 | % |
With Sales Charge | | | | -5.68 | | | | | -6.36 | | | | | 1.39 | |
Class C Shares – Inception 8/5/2013 | | | | | | | | | | | | | | | |
Without Sales Charge | | | | -1.34 | | | | | -2.37 | | | | | 2.45 | |
With Sales Charge | | | | -2.30 | | | | | -3.32 | | | | | 2.45 | |
Class I Shares – Inception 8/5/2013 | | | | -0.93 | | | | | -1.39 | | | | | 3.46 | |
Class R Shares – Inception 8/5/2013 | | | | -1.22 | | | | | -1.97 | | | | | 2.93 | |
Performance data quoted represents past performance, which is no guarantee of future results. Current performance may be lower or higher than the performance quoted. The principal value and investment return of an investment will fluctuate so that your shares, when redeemed, may be worth more or less than their original cost. You can obtain performance data current to the most recent month end by visiting www.calamos.com.
As of the prospectus dated 2/29/16, the Fund’s gross expense ratio for Class A shares is 1.74%; Class C shares is 2.51%; Class I shares is 1.49%; Class R shares is 1.99%. The Fund’s Investment Adviser has contractually agreed to reimburse Fund expenses through March 1, 2017 to the extent necessary so that Total Annual Fund Operating Expenses (excluding taxes, interest, short interest, short dividend expenses, brokerage commissions, acquired fund fees and expenses and extraordinary expenses, if any) of Class A, Class C, Class I and Class R are limited to 1.35%, 2.10%, 1.10% and 1.60% of average net assets, respectively. This agreement is not terminable by either party.
| † | Average annual total return measures net investment income and capital gain or loss from portfolio investments as an annualized average assuming reinvestment of dividends and capital gains distributions. Load-adjusted returns are adjusted for the maximum front-end sales load of 4.75% for Class A shares. Returns for Class C shares have been adjusted for the contingent deferred sales charge (CDSC). |
NOTES:
The graph does not reflect the income taxes that you would pay on fund distributions or the redemption of fund shares. Fund performance includes reinvestment of dividends and adjustment for the maximum sales charge for Class A shares. The performance of other classes will vary from the performance of the class shown based on the difference in sales charges and fees paid by shareholders investing in different share classes.
The S&P 500 Index is an unmanaged index generally considered representative of the U.S. stock market. Index data shown for the Annualized Return Since Inception graph is from 8/31/13, since comparative index data is only available for full monthly periods. Source: Lipper, Inc.
The Russell 1000 Index measures the performance of the large-cap segment of the U.S. equity universe. It is a subset of the Russell 3000 Index and includes approximately 1,000 of the largest securities based on a combination of their market cap and current index membership.
Index returns assume reinvestment of dividends and do not reflect deduction of fees and expenses. It is not possible to invest directly in an index.
Calamos Mid Cap Growth Fund
OVERVIEW
The fund invests primarily in equity securities issued by midsize U.S. companies that we believe offer the best opportunities for growth.
KEY FEATURES
| | ¡ | | Utilizes more than two decades of extensive research experience in growth investing | |
| | ¡ | | Focuses on top-down views and bottom-up fundamentals | |
| | ¡ | | Identifies opportunities by combining top-down analysis with a focus on key growth characteristics | |
PORTFOLIO FIT
The fund seeks to diversify an equity allocation with a primarily mid cap growth strategy that provides exposure to companies with historically higher growth rates and returns than larger companies.
| | |
| FUND NASDAQ SYMBOLS |
A Shares | | CMXAX |
C Shares | | CMXCX |
I Shares | | CMXIX |
R Shares | | CMXRX |
|
| FUND CUSIP NUMBERS |
A Shares | | 128120870 |
C Shares | | 128120862 |
I Shares | | 128120854 |
R Shares | | 128120847 |
CALAMOS MID CAP GROWTH FUND
INVESTMENT TEAM DISCUSSION
How has the Fund performed?
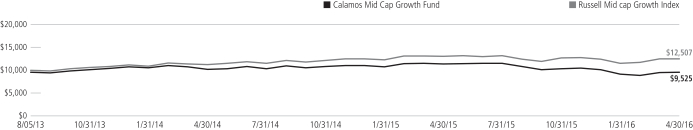
For the six-month period ended April 30, 2016, the Fund declined 7.59% (Class A shares at net asset value) versus a decrease of 1.54% for the Russell Midcap Growth Index.
In this Fund, we target mid cap companies with established track records and strong revenue and earnings profiles with high or accelerated growth. Many of these businesses were out of favor during the reporting period as investors showed a preference for perceived safe haven investments including dividend-paying securities.
What factors influenced performance?
The mid cap growth space had a dramatic sell-off during the reporting period, with the Russell Midcap Growth Index falling more than 15% by February 11. Concerns of falling commodity prices, China’s economic growth and potential currency devaluations, and U.S. earnings fueled recessionary fears and led investors into safe-haven investments and out of higher-growth businesses. As modest yet positive economic data was reported during the quarter, investors returned to the equity market, with a preference for value, cyclical and higher-dividend stocks. In mid-March, Federal Reserve Chair Janet Yellen told investors that the Fed foresaw two rather than four interest rate hikes and would consider global risks in deciding interest rate moves. After those comments, growth stocks returned to favor for the month, much as they had for most of 2015.
Investors in this space showed a strong preference for lower-beta and higher-dividend stocks. Based upon economic sectors, our selection in financials and health care were the biggest detractors to performance versus the Russell Midcap Growth Index. Specifically, an overweight to and selection among real estate services names and selection within consumer finance weighed on performance. Real estate investment trusts (REITs), which the Fund did not own, did well as dividend-paying securities. Selection in potentially higher-growth biotechnology and pharmaceutical names trailed in the health care sector; pressure mounted on drug companies as concerns over pricing weighed on their outlook.
Selection in the energy sector added value during the period, as did some well-timed additions to the once beleaguered sector. The Fund benefitted from positions in the exploration and production space as well as avoiding some of the heavy equipment industry within energy. The Fund also benefitted from selection within the telecommunications services sector as wireless services names performed well.
How is the Fund positioned?
This Fund seeks to invest in midsize U.S. companies that we believe have the best prospects for high sustainable or accelerated growth. The Fund offers a diversified and active approach, and seeks to participate in long-term growth trends by focusing on companies that we believe have solid fundamentals, global brands, strong growth catalysts and attractive valuations. Our investments reflect what we believe to be a positive long-term outlook for equities. We believe a combination of secular and
| | | | |
| 20 | | CALAMOS OPEN-END FAMILY OF FUNDS SEMIANNUAL REPORT | | |
Calamos Mid Cap Growth Fund
cyclical growth holdings is appropriate, given our view that we are in a business cycle characterized by low inflation and moderate global growth. The Fund holds these secular and cyclical opportunities where we believe expectations for growth are unreasonably low, creating investment opportunities. We are emphasizing companies with sound growth fundamentals, increasing returns on invested capital and attractive valuations.
We continue to actively manage our sector exposures in conjunction with our fundamental, bottom-up research. Our largest absolute weightings by sector include opportunities within the information technology, consumer discretionary and health care sectors. We believe that technology offers great long term growth opportunities as well as some cyclical investments as well. We also believe the U.S. consumer is overall in good health as the employment and housing markets have improved, but we are selective in the consumer discretionary space, with a preference for low-cost providers in the retail space and more experiential discretionary purchases such as entertainment. We think that health care still offers great opportunities, but we have been cautious on account of negative drug pricing headlines and highly politicized public concerns. We have added to cyclical areas such as energy, materials and industrials, albeit at small absolute levels.
What closing thoughts do you have for Fund shareholders?
We believe the U.S. market will have modestly positive returns and may represent a compelling equity market in a low-return world. We do not foresee a recession in the U.S., but trends in housing and employment point to a slow-growth economy. We believe the market will remain volatile and is anxiously awaiting news from the Federal Reserve as to the path of potential interest rate moves and indications of strong, self-sustaining economic expansion.
The weakened U.S. dollar, a recovery in oil, and efforts from central banks around the world to reflate the global economy can create tailwinds for cyclical areas of the market. In response, we have increased our investments in energy and industrials. Growth may remain scarce, so we believe investors will be willing to pay for those businesses that can offer superior growth. We expect to be a bit more cautious around valuation as higher-valued stocks may have greater potential for sell-offs if volatility returns. We don’t believe that the market’s rotation to low-quality stocks is a sustained shift where companies with low returns on capital can continue to fare well. However, cyclical growth stocks may continue to be attractive as economic growth picks up, even at a slower pace.
| | | | |
| SECTOR WEIGHTINGS | |
Consumer Discretionary | | | 24.8 | % |
Information Technology | | | 23.9 | |
Health Care | | | 19.3 | |
Industrials | | | 12.6 | |
Financials | | | 9.3 | |
Telecommunication Services | | | 4.0 | |
Energy | | | 3.5 | |
Materials | | | 0.9 | |
Sector weightings are subject to change daily and are calculated as a percentage of net assets. The table excludes cash or cash equivalents, any government/sovereign bonds or broad based index hedging securities the Fund may hold.
Calamos Mid Cap Growth Fund
GROWTH OF $10,000: SINCE INCEPTION (8/5/13) THROUGH 4/30/16
AVERAGE ANNUAL TOTAL RETURN† AS OF 4/30/16
| | | | | | | | | | | | | | | |
| | | 6
MONTHS
| | 1
YEAR | | SINCE
INCEPTION |
Class A Shares – Inception 8/5/2013 | | | | | | | | | | | | | | | |
Without Sales Charge | | | | -7.59 | % | | | | -16.19 | % | | | | 0.01 | % |
With Sales Charge | | | | -11.98 | | | | | -20.14 | | | | | -1.76 | |
Class C Shares – Inception 8/5/2013 | | | | | | | | | | | | | | | |
Without Sales Charge | | | | -7.93 | | | | | -16.84 | | | | | -0.74 | |
With Sales Charge | | | | -8.79 | | | | | -17.61 | | | | | -0.74 | |
Class I Shares – Inception 8/5/2013 | | | | -7.45 | | | | | -16.02 | | | | | 0.27 | |
Class R Shares – Inception 8/5/2013 | | | | -7.64 | | | | | -16.42 | | | | | -0.22 | |
Performance data quoted represents past performance, which is no guarantee of future results. Current performance may be lower or higher than the performance quoted. The principal value and investment return of an investment will fluctuate so that your shares, when redeemed, may be worth more or less than their original cost. You can obtain performance data current to the most recent month end by visiting www.calamos.com.
As of the prospectus dated 2/29/16, the Fund’s gross expense ratio for Class A shares is 1.69%; Class C shares is 2.46%; Class I shares is 1.45%; Class R shares is 1.97%. The Fund’s Investment Adviser has contractually agreed to reimburse the Fund expenses through March 1, 2017, to the extent necessary so that Total Annual Fund Operating Expenses (excluding taxes, interest, short interest, short dividend expenses, brokerage commissions, acquired funds fees and expenses and extraordinary expenses, if any) of Class A, Class C, Class I and Class R are limited to 1.25%, 2.00%, 1.00% and 1.50% of average net assets, respectively. This agreement is not terminable by either party.
| † | Average annual total return measures net investment income and capital gain or loss from portfolio investments as an annualized average assuming reinvestment of dividends and capital gains distributions. Load-adjusted returns are adjusted for the maximum front-end sales load of 4.75% for Class A shares. Returns for Class C shares have been adjusted for the contingent deferred sales charge (CDSC). |
NOTES:
The graph does not reflect the income taxes that you would pay on fund distributions or the redemption of fund shares. Fund performance includes reinvestment of dividends and adjustment for the maximum sales charge for Class A shares. The performance of other classes will vary from the performance of the class shown based on the difference in sales charges and fees paid by shareholders investing in different share classes.
The Russell Midcap Growth Index measures the performance of midcap growth companies.
Index returns assume reinvestment of dividends and do not reflect deduction of fees and expenses. It is not possible to invest directly in an index.
| | | | |
| 22 | | CALAMOS OPEN-END FAMILY OF FUNDS SEMIANNUAL REPORT | | |
Calamos International Growth Fund
CALAMOS INTERNATIONAL GROWTH FUND
INVESTMENT TEAM DISCUSSION
How has the Fund Performed?
For the six-month period ended April 30, 2016, Calamos International Growth Fund declined 5.55% (Class A shares at net asset value) versus a 1.05% decrease for the MSCI ACWI ex-U.S. Growth Index and 1.44% loss for the MSCI EAFE Growth Index.
International equities experienced a six-month period with multiple bouts of heightened volatility and modest declines in broad international indexes overall. Equity prices were impacted by several distinct phases of volatility and rallies vis-a-vis investor sentiment and positioning.
Equities faced relatively steep and rapid losses in early 2016 brought on by concerns relating to slow global growth, depressed commodity prices, and uncertainty over central bank policies. More recently, markets responded positively as the world’s major central banks signaled a renewed commitment to bolster sluggish growth, global economic data showed improvement, and commodity prices recovered from recent lows.
In this difficult environment, the Fund underperformed the index due to trailing security selection and relative sector positioning. Specifically, our emphasis on higher-growth and higher-quality businesses was challenged by markets which rewarded higher-dividend yield, defensive-oriented companies outperform in January’s sharp sell-off followed by a lower-quality, global cyclical rally from February into April 2016.
Since its inception on March 16, 2005, the Fund gained 6.17% on an annualized basis (Class A Shares at net asset value) versus a return of 4.93% for the MSCI EAFE Growth Index and 4.96% for the MSCI ACWI ex-U.S. Growth Index.
What factors influenced performance?
In addition to being underweight defensive, value and dividend-oriented securities, which led the market short-term but we think offer lower-growth prospects over time, the following factors influenced the Fund’s performance.
Relative to the MSCI ACWI ex-U.S. Growth Index, the Fund’s trailing selection in the financials sector detracted from Fund results during the period. In particular, holdings in the diversified banks industry trailed those of the index. Even so, we expect diversified bank holdings to respond positively over time as demand for relatively higher-quality assets and attractive valuations come to the fore. This belief contributes to our selective view of opportunities in financials and rationale for maintaining an underweight stance overall.
Selection in health care also hampered performance. In particular, holdings in the pharmaceuticals industry underperformed as higher-growth companies trailed; the market, as mentioned, rewarded higher-dividend yield, more-defensive characteristics. With respect to individual opportunities, we continue to invest in companies that we believe have a strong innovation and pipeline profile, rising return on invested capital, and alignment with our secular themes.
OVERVIEW
The fund invests in non-U.S. growth companies. We focus on those firms that we believe demonstrate key growth characteristics, including increasing profit margins and high returns on invested capital.
KEY FEATURES
| | ¡ | | Focuses on growth in an asset class that is mostly defined by core and value offerings | |
| | ¡ | | Stresses company fundamentals, including global presence and strong or accelerated earnings growth | |
| | ¡ | | Investments driven by international sources of revenue for companies, not on location of headquarters | |
PORTFOLIO FIT
Investors tend to underinvest in growth outside the U.S. compared with a higher emphasis on growth with U.S. oriented equity funds. The fund stands as a potential growth-focused addition to a mostly core- or value-intensive international allocation.
| | |
| FUND NASDAQ SYMBOLS |
A Shares | | CIGRX |
B Shares | | CIGBX |
C Shares | | CIGCX |
I Shares | | CIGIX |
R Shares | | CIGFX |
| | | |
| |
| FUND CUSIP NUMBERS | | |
A Shares | | 128119575 |
B Shares | | 128119567 |
C Shares | | 128119559 |
I Shares | | 128119542 |
R Shares | | 128119393 |
| | | |
Calamos International Growth Fund
| | | | |
| SECTOR WEIGHTINGS | | | |
Information Technology | | | 23.6 | % |
Consumer Staples | | | 16.0 | |
Health Care | | | 14.9 | |
Industrials | | | 13.1 | |
Consumer Discretionary | | | 12.5 | |
Financials | | | 11.6 | |
Energy | | | 4.4 | |
Materials | | | 2.1 | |
Telecommunication Services | | | 0.8 | |
| | | | | |
Sector weightings are subject to change daily and are calculated as a percentage of net assets. The table excludes cash or cash equivalents, any government/sovereign bonds or broad based index hedging securities the Fund may hold.
The Fund’s selection in information technology contributed positively during the period. In particular, a larger weight and positive performance in the Internet software and services industry added value. We continue to hold an overweight position in the sector overall based on solid earnings growth, cash flow generation, balance sheet quality and large addressable markets. We see excellent alignment with our themes in the sector, and we think many current holdings are well positioned to benefit from global demand for mobility, analytics, and e-commerce among other areas.
The Fund’s modest overweight position in energy also added value, while relative selection lagged the index. Higher global supply and a strong dollar have pressured oil prices over the past few years, but there have been more recent signs of stabilization and improved performance in the sector. We incrementally added to the Fund’s weight during the period but will continue to be highly selective, seeking companies with better quality balance sheets and the potential for earnings improvement.
From a geographic perspective, the Fund’s country weights negatively affected performance overall in the period. In particular, the Fund’s selection in the U.K. and Canada trailed the index. The Fund’s selection in China, Germany and Italy added the most value in the period.
How is the Fund positioned?
Our regional and country positioning reflects the combined inputs from our top-down global framework and our bottom-up security analysis. Our investment team continually evaluates macroeconomic factors and growth opportunities, then actively integrates these into investment decision making.
From a regional perspective, we continue to hold an overweight position in Europe, reflecting our view of stabilizing economic data, a still weak euro, and the European Central Bank’s accommodative monetary policy programs. We have a relatively even-weight view in Japan, supported by accommodative policies and effective corporate reforms but also challenged by low growth and a stronger yen. Economic data has been mixed to lower in recent months, but we see a growing universe of companies with improved capital allocation and more shareholder friendly policies. In emerging markets, we are highly selective, preferring investments in commodity-consuming and pro-growth reform economies.
We made moderate changes to sector weightings during the period, with most adjustments driven by security-specific rationale. We increased the weight in consumer staples while trimming consumer discretionary holdings, as we moderately tilted exposure to more-defensive growth areas. We also added modestly to energy and materials reflecting a marginal increase in cyclically oriented commodity areas. We reduced the weight to financials because of continued challenges to sector fundamentals.
What closing thoughts do you have for Fund shareholders?
We believe the global economy is positioned for moderate growth in 2016. There may be spikes in volatility as mixed fundamental data, key elections and central bank policies influence markets. We continue to see signs of improvement in European economic data along with a positive liquidity environment. However, market headwinds have persisted, fanned by Britain’s potential exit from the European Union and the refugee crisis. In our opinion, Japan’s economy remains lackluster and the
| | | | |
| 24 | | CALAMOS OPEN-END FAMILY OF FUNDS SEMIANNUAL REPORT | | |
Calamos International Growth Fund
negative interest rate policy is a potential cause for concern. Despite these challenges, we believe that many bottom-up investment opportunities are arising from increased corporate governance initiatives and increased capital efficiency. We expect to be highly selective in emerging markets, but stability in commodities and currencies increases our optimism. China’s recent releases seem to reveal a pickup in economic data but also a divergence between weaker industrial data versus stronger demand in consumption and services.
Given our outlook for a continued period of muted economic growth, we are favoring quality growth companies over cyclicals. We are emphasizing investments in companies with solid free cash flow generation and stronger balance sheets. From a thematic perspective, we see opportunities in the information technology sector, companies tied to global consumption, and businesses positioned to benefit from improving fundamentals in Europe. We believe our active investment approach and long-term perspective positions us to take advantage of the volatility as we seek international investment opportunities.
ANNUALIZED RETURN: SINCE INCEPTION (3/16/05) THROUGH 4/30/16
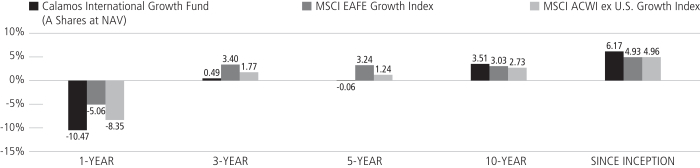
Performance data quoted represents past performance, which is no guarantee of future results. Current performance may be lower or higher than the performance quoted.
The principal value and investment return of an investment will fluctuate so that your shares, when redeemed, may be worth more or less than their original cost. You can obtain performance data current to the most recent month end by visiting www.calamos.com. Average annual total return measures net investment income and capital gain or loss from portfolio investments as an annualized average. All performance shown assumes reinvestment of dividends and capital gains distributions. Performance is for the Fund’s Class A shares at net asset value and does not include the Fund’s maximum front-end sales charge of 4.75%—had it been included, the Fund’s return would have been lower. The Fund also offers Class B, Class C, Class I and Class R shares, the performance of which may vary. Source: State Street Corporation and Lipper, Inc.
Calamos International Growth Fund
GROWTH OF $10,000: FOR THE 10-YEAR PERIOD ENDED 4/30/16
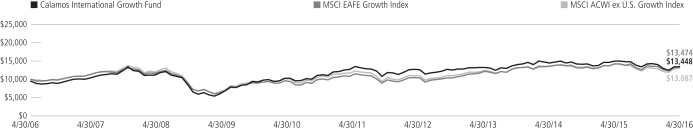
AVERAGE ANNUAL TOTAL RETURN† AS OF 4/30/16
| | | | | | | | | | | | | | | | | | | | |
| | | 6
MONTHS | | 1
YEAR | | 5
YEARS | | 10 YEARS
OR ^SINCE
INCEPTION |
Class A Shares – Inception 3/16/05 | | | | | | | | | | | | | | | | | | | | |
Without Sales Charge | | | | -5.55 | % | | | | -10.47 | % | | | | -0.06 | % | | | | 3.51 | % |
With Sales Charge | | | | -10.03 | | | | | -14.73 | | | | | -1.02 | | | | | 3.01 | |
Class B Shares – Inception 3/16/05 | | | | | | | | | | | | | | | | | | | | |
Without Sales Charge | | | | -5.84 | | | | | -11.15 | | | | | -0.80 | | | | | 2.88 | |
With Sales Charge | | | | -10.54 | | | | | -15.59 | | | | | -1.16 | | | | | 2.88 | |
Class C Shares – Inception 3/16/05 | | | | | | | | | | | | | | | | | | | | |
Without Sales Charge | | | | -5.85 | | | | | -11.11 | | | | | -0.79 | | | | | 2.73 | |
With Sales Charge | | | | -6.79 | | | | | -12.00 | | | | | -0.79 | | | | | 2.73 | |
Class I Shares – Inception 3/16/05 | | | | -5.41 | | | | | -10.27 | | | | | 0.19 | | | | | 3.76 | |
Class R Shares – Inception 3/1/07 | | | | -5.65 | | | | | -10.71 | | | | | -0.30 | | | | | 3.12 | ^ |
Performance data quoted represents past performance, which is no guarantee of future results. Current performance may be lower or higher than the performance quoted. The principal value and investment return of an investment will fluctuate so that your shares, when redeemed, may be worth more or less than their original cost.
As of the prospectus dated 2/29/16, the Fund’s gross expense ratio for Class A shares is 1.31%; Class B and C shares is 2.06%; Class I shares is 1.06%; Class R shares is 1.56%.
| † | Average annual total return measures net investment income and capital gain or loss from portfolio investments as an annualized average assuming reinvestment of dividends and capital gains distributions. Performance shown reflects the effects of an expense reimbursement that improved results and was in effect until March 31, 2005. Load-adjusted returns are adjusted for the maximum front-end sales load of 4.75% for Class A shares and returns for Class B and C shares have been adjusted for the contingent deferred sales charge (CDSC). |
NOTES:
The graphs do not reflect the income taxes that you would pay on fund distributions or the redemption of fund shares. Fund performance includes reinvestment of dividends and adjustment for the maximum sales charge for Class A shares. The performance of other classes will vary from the performance of the class shown based on the difference in sales charges and fees paid by shareholders investing in different share classes.
The MSCI EAFE Growth Index measures developed market growth equity performance (excluding the U.S. and Canada). Source: MSCI Barra.
The MSCI ACWI ex U.S. Growth Index measures equity market performance of companies outside of the United States with higher growth values in developed and emerging markets.
Index returns assume reinvestment of dividends and do not reflect deduction of fees and expenses. It is not possible to invest directly in an index.
| | | | |
| 26 | | CALAMOS OPEN-END FAMILY OF FUNDS SEMIANNUAL REPORT | | |
Calamos Evolving World Growth Fund
CALAMOS EVOLVING WORLD GROWTH FUND
INVESTMENT TEAM DISCUSSION
How has the Fund performed?
For the six-month period ended April 30, 2016, Calamos Evolving World Growth Fund declined 3.39% (Class A shares at net asset value), versus a dip of 0.01% for the MSCI Emerging Markets Index.
From the period’s onset, emerging market equities experienced turbulence, initially declining almost 20% from the November 2015 peak levels to the January low. The Fund provided some resilience and held up relatively better than the index during the significant sell-off due to our risk-management process and a wider investable opportunity set.
In a rapid turn, emerging markets rallied sharply in February and March and finished the period over 20% above the recent January low. Investors responded positively to signs of stabilization in commodity prices, a decline in the U.S. dollar, and a more dovish stance on interest rates from the Federal Reserve. The Fund returns experienced less volatility but trailed the index during this relatively lower-quality, beta-driven equity rally.
Since its inception on August 15, 2008, the Fund gained 2.75% on an annualized basis (Class A shares at net asset value) versus 0.80% for the MSCI Emerging Markets Index.
What factors influenced performance?
In addition to being underweight lower-quality, beta-driven equities, which led the market short-term but we think offer lower-growth prospects over time, the following factors influenced the Fund’s performance.
Relative to the MSCI Emerging Markets Index, our overweight to and selection in consumer staples aided performance. Specifically, holdings in the personal products and packaged foods industries performed well by virtue of higher-quality, stable-growth characteristics. Within the sector, we continue to be opportunistic and own a combination of emerging market companies in addition to diversified multinationals operating in a variety of categories. We believe our holdings deliver both unit volume increases and earnings growth that is attractive given the sluggish global growth environment.
Our selection in the utilities sector also added value while the underweight position hampered results. Specifically, holdings in the electric utilities industry outperformed those of the index. The portfolio holds a small weight in the sector based on our concerns regarding its perceived low-growth potential, highly regulated operations, and lesser returns on invested capital.
The Fund’s underweight to and selection in energy hindered results. Holdings in the integrated oil and gas industry flagged as index companies with lower-quality, higher-leverage attributes rallied. We continue to take a cautious and patient tact toward the energy sector as reflected by an underweight position. Global oversupply and a strong dollar have pressured oil prices, though we have seen signs of stabilization. We will continue to be highly selective, choosing companies that we believe offer better-quality balance sheets, attractive production profiles, and the potential for earnings improvement.
OVERVIEW
The fund globally invests in growth companies, emphasizing businesses with revenue streams derived within or from emerging markets. The fund is designed to actively manage risk over a full market cycle.
KEY FEATURES
| | ¡ | | Active risk management aims to generate alpha with less downside risk than the benchmark and peers | |
| | ¡ | | Stresses strong or accelerated earnings growth and solid returns on invested capital | |
| | ¡ | | Targets well-positioned global growth companies that may benefit from long-term secular themes in emerging markets such as the rise of the emerging-market consumer | |
PORTFOLIO FIT
Given its focus on risk management, the fund can serve as a long-term emerging market allocation.
| | |
| FUND NASDAQ SYMBOLS |
A Shares | | CNWGX |
B Shares | | CNWZX |
C Shares | | CNWDX |
I Shares | | CNWIX |
R Shares | | CNWRX |
| | | |
|
| FUND CUSIP NUMBERS |
A Shares | | 128119161 |
B Shares | | 128119153 |
C Shares | | 128119146 |
I Shares | | 128119138 |
R Shares | | 128119120 |
| | | |
Calamos Evolving World Growth Fund
| | | | |
| SECTOR WEIGHTINGS | | | |
Information Technology | | | 25.2 | % |
Consumer Discretionary | | | 18.2 | |
Consumer Staples | | | 15.2 | |
Financials | | | 14.5 | |
Industrials | | | 8.1 | |
Health Care | | | 5.0 | |
Energy | | | 4.5 | |
Telecommunication Services | | | 3.8 | |
Materials | | | 3.1 | |
Utilities | | | 0.9 | |
Sector weightings are subject to change daily and are calculated as a percentage of net assets. The table excludes cash or cash equivalents, any government/sovereign bonds or broad based index hedging securities the Fund may hold.
Our underweight to materials also challenged performance, while selection contributed. We are cautious in this area because declining global demand may cause oversupply and lower prices.
How is the Fund positioned?
We are highly selective in emerging markets. We have positioned the Fund toward commodity-consumers and economies benefiting from positive economic and fiscal reforms. We favor investments in India, the Philippines, Mexico, and select Chinese opportunities that we believe are benefiting from exposure to economic reforms and more positive growth conditions. We remain underweight to the most commodity-intensive economies, including Russia, Brazil, South Africa and Malaysia as we view recent rallies in these markets as lower-quality in nature.
From a sector perspective, the Fund is overweight information technology, consumer discretionary and consumer staples, while we are underweight commodity-intensive areas including energy and materials. In addition, the Fund holds lower weights in financials and utilities.
We added selectively to the materials and energy sectors, though we remain underweight overall. We have seen signs of price stabilization, though generally weak fundamentals and low global growth temper our enthusiasm. We reduced the weight in financials during the period, reflecting mainly security-specific rationale and some slowdown in domestic-demand.
From a bottom-up perspective, we favor companies that we believe offer strong balance sheets and high or increasing returns on invested capital, which directly reflect their competitive positioning and capital efficiency. In line with our process, we emphasize companies benefiting from secular themes that could provide a tailwind for potential growth.
What closing thoughts do you have for Fund shareholders?
Our approach to emerging markets remains highly selective. We are incrementally becoming more positive as we have seen signs of stabilization in currencies and commodities, in addition to improving economic data and capital inflows. For example, we have a positive-yet-discerning view of China as we have seen improvement in key guideposts, including purchasing data and export volumes. In recent months, monetary policy has become more accommodative, additional infrastructure stimulus has been announced, and fiscal stimulus has been targeted to support key industries. Generally, we see more positive conditions in consumption-led portions of the economy versus industrial demand.
With respect to commodities, several emerging market economies face significant headwinds from low prices, while many other markets may benefit from this trend by virtue of reduced input costs and increased policy flexibility. We remain underweight key commodity-producing economies. While Russia and Brazil benefited from the commodity super-cycle, they may be unable to implement the policies necessary to support more sustainable growth. Although lower-quality, cyclical investments led the first quarter rally, we expect companies with stronger balance sheets, higher returns on invested capital, and growing markets to regain leadership over time. Ultimately, we believe there will be a broader dispersion of returns among countries, which we believe will benefit our active and risk-aware investment approach in emerging markets.
| | | | |
| 28 | | CALAMOS OPEN-END FAMILY OF FUNDS SEMIANNUAL REPORT | | |
Calamos Evolving World Growth Fund
GROWTH OF $10,000: SINCE INCEPTION (8/15/08) THROUGH 4/30/16
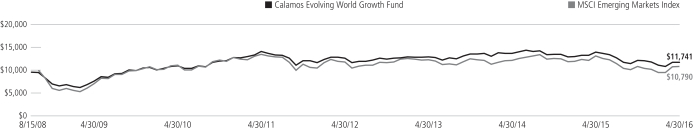
AVERAGE ANNUAL TOTAL RETURN† AS OF 4/30/16
| | | | | | | | | | | | | | | | | | | | |
| | | 6
MONTHS | | 1
YEAR | | 5
YEARS | | SINCE
INCEPTION |
Class A Shares – Inception 8/15/08 | | | | | | | | | | | | | | | | | | | | |
Without Sales Charge | | | | -3.39 | % | | | | -15.71 | % | | | | -3.59 | % | | | | 2.75 | % |
With Sales Charge | | | | -7.95 | | | | | -19.70 | | | | | -4.52 | | | | | 2.10 | |
Class B Shares – Inception 8/15/08 | | | | | | | | | | | | | | | | | | | | |
Without Sales Charge | | | | -3.70 | | | | | -16.31 | | | | | -4.31 | | | | | 1.99 | |
With Sales Charge | | | | -8.52 | | | | | -20.49 | | | | | -4.69 | | | | | 1.99 | |
Class C Shares – Inception 8/15/08 | | | | | | | | | | | | | | | | | | | | |
Without Sales Charge | | | | -3.79 | | | | | -16.38 | | | | | -4.32 | | | | | 1.99 | |
With Sales Charge | | | | -4.75 | | | | | -17.22 | | | | | -4.32 | | | | | 1.99 | |
Class I Shares – Inception 8/15/08 | | | | -3.24 | | | | | -15.45 | | | | | -3.35 | | | | | 3.01 | |
Class R Shares – Inception 8/15/08 | | | | -3.50 | | | | | -15.90 | | | | | -3.83 | | | | | 2.49 | |
Performance data quoted represents past performance, which is no guarantee of future results. Current performance may be lower or higher than the performance quoted. The principal value and investment return of an investment will fluctuate so that your shares, when redeemed, may be worth more or less than their original cost. You can obtain performance data current to the most recent month end by visiting www.calamos.com.
As of the prospectus dated 2/29/16, the Fund’s gross expense ratio for Class A shares is 1.66%; Class B and C shares is 2.41%; Class I shares is 1.41%; Class R shares is 1.91%.
| † | Average annual total return measures net investment income and capital gain or loss from portfolio investments as an annualized average assuming reinvestment of dividends and capital gains distributions. Load-adjusted returns are adjusted for the maximum front-end sales load of 4.75% for Class A shares and returns for Class B and C shares have been adjusted for the contingent deferred sales charge (CDSC). |
NOTES:
The graph does not reflect the income taxes that you would pay on fund distributions or the redemption of fund shares. Fund performance includes reinvestment of dividends and adjustment for the maximum sales charge for Class A shares. The performance of other classes will vary from the performance of the class shown based on the difference in sales charges and fees paid by shareholders investing in different share classes.
The MSCI Emerging Markets Index is a free float-adjusted market capitalization index considered broadly representative of emerging market equity performance. The index represents companies within the constituent emerging markets that are available to investors worldwide. Index data shown for the Since Inception Growth of $10,000 graph is from 8/31/08, since comparative index data is only available for full monthly periods. Source: Lipper, Inc.
Index returns assume reinvestment of dividends and do not reflect deduction of fees and expenses. It is not possible to invest directly in an index.
Calamos Emerging Market Equity Fund
OVERVIEW
The fund globally invests in growth companies, whose principal activities are in a developing market or are economically tied to a developing market country that we believe offers the best opportunities for growth.
KEY FEATURES
| | ¡ | | Stresses company fundamentals, including global presence, strong revenue and earnings growth, solid returns on invested capital, and lower debt-to-capital levels | |
| | ¡ | | Actively seeks growth opportunities by investing in equities with at least 80% emerging market exposure | |
| | ¡ | | Draws upon decades of Calamos experience investing globally through multiple economic, market and credit cycles | |
PORTFOLIO FIT
This actively managed fund complements emerging-market strategies with a less-pronounced growth orientation, such as those that more closely track the broad EM equity market.
| | |
| FUND NASDAQ SYMBOLS |
A Shares | | CEGAX |
C Shares | | CEGCX |
I Shares | | CIEIX |
R Shares | | CEGRX |
|
| FUND CUSIP NUMBERS |
A Shares | | 128120789 |
C Shares | | 128120771 |
I Shares | | 128120763 |
R Shares | | 128120755 |
CALAMOS EMERGING MARKET
EQUITY FUND
INVESTMENT TEAM DISCUSSION
How has the Fund performed?
For the six-month period ended April 30, 2016, Calamos Emerging Market Equity Fund declined 2.74% (Class A shares at net asset value), versus a slight 0.01% dip for the MSCI Emerging Markets Index.
From the period’s onset, emerging market equities experienced turbulence, initially declining almost 20% from the November 2015 peak levels to the January low. The Fund provided some resilience and held up relatively better than the index during the significant sell-off due to the portfolio’s higher-quality, higher-growth fundamental profile.
In a rapid turn, emerging markets rallied sharply in February and March and finished the period over 20% above the recent January low. Investors responded positively to signs of stabilization in commodity prices, a decline in the U.S. dollar, and a more dovish stance on interest rates from the Federal Reserve. The Fund trailed the index during this relatively lower-quality, higher-beta, value-oriented equity rally.
What factors influenced performance?
The Fund was underweight to the most cyclical and volatile stocks, which led the market during the period but have historically offered lower-growth prospects over time. While this hindered performance during the period, we believe that our growth-oriented positioning will more benefit shareholders over time.
Relative to the MSCI Emerging Markets Index, selection in industrials added the most value versus the benchmark. Holdings in the aerospace and defense industry especially outperformed as demand remains high and fundamentals are stronger than many other industrial areas. We hold a relatively even-weight stance in industrials and may add some cyclical names as we expect a potential pickup in demand and export opportunities.
Selection in consumer staples also contributed to performance. Holdings in the personal products and packaged foods industries performed well by virtue of their higher-quality, stable-growth characteristics. Within the sector, we own a combination of emerging market companies in a variety of categories. Our holdings are delivering both unit volume increases and earnings growth owing to their ability to access burgeoning domestic demand.
Our underweight to and selection in materials detracted value. Specifically, holdings in the construction materials industry underperformed those of the index. We are cautious in this area because declining global demand may cause oversupply and lower prices.
Our underweight to and selection in energy hindered performance. Holdings in the integrated oil and gas industry flagged as index companies with lower-quality, higher-leverage characteristics rallied. We continue to take a cautious and patient tact toward the energy sector as reflected by an underweight position. Global oversupply and a
| | | | |
| 30 | | CALAMOS OPEN-END FAMILY OF FUNDS SEMIANNUAL REPORT | | |
Calamos Emerging Market Equity Fund
strong dollar have put downward pressure on oil prices, though we have seen signs of stabilization. We will continue to be highly selective, choosing companies that we believe have better quality balance sheets and the potential for earnings improvement.
How is the Fund positioned?
We are highly selective in emerging markets. We have positioned the Fund toward commodity-consumers and economies benefiting from positive economic and fiscal reforms. We favor investments in India, the Philippines, Mexico, and select Chinese opportunities, which we see benefiting from exposure to economic reforms and more positive growth conditions. We remain underweight the most commodity-intensive economies, including Russia, Brazil, South Africa and Malaysia, as we view recent rallies in these markets as lower-quality in nature.
From a sector perspective, the Fund is overweight information technology, consumer discretionary, consumer staples and health care, while we are underweight commodity-intensive areas including energy and materials. In addition, the Fund holds lower weights in financials, utilities and telecommunication services.
We increased the weight to consumer staples in the period, investing in those businesses that we believe offer more stable growth in domestic demand and earnings potential. We reduced the weight to financials during the period, reflecting mainly security-specific rationale and a slowdown in credit demand.
From a bottom-up perspective, we favor companies with strong balance sheets and high or increasing returns on invested capital, which we believe directly reflect their competitive positioning and capital efficiency. In line with our process, we emphasize companies that we see benefiting from secular themes that provide a tailwind for potential growth.
What closing thoughts do you have for Fund shareholders?
Our approach to emerging markets remains highly selective. We are incrementally becoming more positive as we have seen signs of stabilization in currencies and commodities, in addition to improving economic data and capital inflows. For example, we have a positive yet discerning view of China, as we have seen improvement in key guideposts, including purchasing data and export volumes. In recent months, monetary policy has become more accommodative, additional infrastructure stimulus has been announced, and fiscal stimulus has been targeted to support key industries. Generally, we see more positive conditions in consumption-led portions of the economy versus industrial demand.
With respect to commodities, several emerging market economies face significant headwinds from low prices, while many other markets benefit from this trend by virtue of reduced input costs and increased policy flexibility. We remain underweight key commodity-producing economies. While Russia and Brazil benefited from the commodity super-cycle, we maintain the view that they are now unable to implement the policies necessary to support more sustainable growth. Although the first quarter had a lower-quality, cyclical-led rally, we expect companies with stronger balance sheets, higher return on invested capital, and growing markets to regain leadership over time. Ultimately, we believe there will be a broader dispersion of returns among countries, which will benefit our selective and active stance in emerging markets.
| | | | |
| SECTOR WEIGHTINGS | |
Information Technology | | | 27.7 | % |
Financials | | | 18.9 | |
Consumer Discretionary | | | 13.9 | |
Consumer Staples | | | 13.1 | |
Industrials | | | 7.5 | |
Health Care | | | 5.7 | |
Telecommunication Services | | | 3.8 | |
Energy | | | 3.2 | |
Materials | | | 2.0 | |
Utilities | | | 1.8 | |
Other | | | 0.7 | |
| | | | | |
Sector weightings are subject to change daily and are calculated as a percentage of net assets. The table excludes cash or cash equivalents, any government/sovereign bonds or broad based index hedging securities the Fund may hold.
Calamos Emerging Market Equity Fund
GROWTH OF $10,000: SINCE INCEPTION (12/31/13) THROUGH 4/30/16
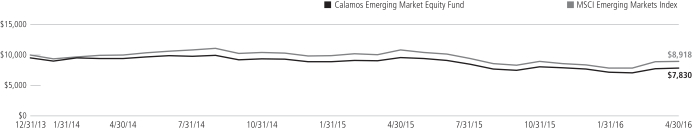
AVERAGE ANNUAL TOTAL RETURN† AS OF 4/30/16
| | | | | | | | | | | | | | | |
| | | 6
MONTHS | | 1
YEAR | | SINCE
INCEPTION |
Class A Shares – Inception 12/31/2013 | | | | | | | | | | | | | | | |
Without Sales Charge | | | | -2.74 | % | | | | -18.21 | % | | | | -8.06 | % |
With Sales Charge | | | | -7.37 | | | | | -22.10 | | | | | -9.96 | |
Class C Shares – Inception 12/31/2013 | | | | | | | | | | | | | | | |
Without Sales Charge | | | | -3.12 | | | | | -18.88 | | | | | -8.74 | |
With Sales Charge | | | | -4.09 | | | | | -19.69 | | | | | -8.74 | |
Class I Shares – Inception 12/31/2013 | | | | -2.62 | | | | | -18.07 | | | | | -7.85 | |
Class R Shares – Inception 12/31/2013 | | | | -2.86 | | | | | -18.40 | | | | | -8.29 | |
Performance data quoted represents past performance, which is no guarantee of future results. Current performance may be lower or higher than the performance quoted. The principal value and investment return of an investment will fluctuate so that your shares, when redeemed, may be worth more or less than their original cost. You can obtain performance data current to the most recent month end by visiting www.calamos.com.
As of the prospectus dated 2/29/16, the Fund’s gross expense ratio for Class A shares is 2.44%; Class C shares is 3.23%; Class I shares is 2.24%; Class R shares is 2.74%. The Fund’s Investment Adviser has contractually agreed to reimburse the Fund expenses through March 1, 2017, to the extent necessary so that Total Annual Fund Operating Expenses (excluding taxes, interest, short interest, short dividend expenses, brokerage commissions, acquired funds fees and expenses and extraordinary expenses, if any) of Class A, Class C, Class I and Class R are limited to 1.75%, 2.50%, 1.50% and 2.00% of average net assets, respectively. This agreement is not terminable by either party.
| † | Average annual total return measures net investment income and capital gain or loss from portfolio investments as an annualized average assuming reinvestment of dividends and capital gains distributions. Load-adjusted returns are adjusted for the maximum front-end sales load of 4.75% for Class A shares. Returns for Class C shares have been adjusted for the contingent deferred sales charge (CDSC). |
NOTES:
The graph does not reflect the income taxes that you would pay on fund distributions or the redemption of fund shares. Fund performance includes reinvestment of dividends and adjustment for the maximum sales charge for Class A shares. The performance of other classes will vary from the performance of the class shown based on the difference in sales charges and fees paid by shareholders investing in different share classes.
The MSCI Emerging Markets Index is a free float-adjusted market capitalization index considered broadly representative of emerging market equity performance. The index represents companies within the constituent emerging markets that are available to investors worldwide. Index data shown for the Since Inception Growth of $10,000 graph is from 12/31/13, since comparative index data is only available for full monthly periods. Source: Lipper, Inc.
Index returns assume reinvestment of dividends and do not reflect deduction of fees and expenses. It is not possible to invest directly in an index.
| | | | |
| 32 | | CALAMOS OPEN-END FAMILY OF FUNDS SEMIANNUAL REPORT | | |
Calamos Global Equity Fund
CALAMOS GLOBAL EQUITY FUND
INVESTMENT TEAM DISCUSSION
How has the Fund performed?
For the six-month period ended April 30, 2016, Calamos Global Equity Fund declined 6.58% (Class A shares at net asset value) versus a 1.47% decrease for the MSCI ACWI Growth Index and 0.74% loss for the MSCI World Index.
Global equities experienced a six-month period with multiple periods of heightened volatility and modest declines in broad global equity indexes overall. Equity prices were impacted by several distinct phases of volatility and rallies prodded along by investor sentiment and frenetic repositioning.
Equities faced relatively steep and rapid losses in early 2016 brought on by concerns relating to slow global growth, depressed commodity prices, and uncertainty over monetary policy. More recently, markets responded positively as the world’s major central banks signaled a renewed commitment to bolster sluggish growth, global economic data showed improvement, and commodity prices recovered from recent lows.
In this challenging environment, the Fund underperformed the index due to trailing security selection and relative sector positioning. Specifically, our emphasis on what we believe are higher-growth and higher-quality businesses was out of step with the market which saw higher-dividend yield, defensive-oriented companies outperform in January’s sharp sell-off followed by a lower-quality, global cyclical rally from February into April 2016.
Since its inception on March 1, 2007, the Fund has returned 5.74% on an annualized basis (Class A shares at net asset value) versus a 4.08% return for the MSCI World Index and a 4.97% return for the MSCI ACWI Growth Index. We believe the Fund’s track record since its inception is a testament to our focus on long-term global investing and adding value over full market cycles.
What factors influenced performance?
In addition to being underweight in defensive, value and dividend-oriented securities, which led the market short-term but offer lower-growth prospects over time, the following factors influenced the Fund’s performance.
The Fund’s overweight to and selection in information technology detracted the most value during the period versus the MSCI ACWI Growth Index. In particular, Fund holdings in the Internet software and services industry trailed those in the index. Despite the disappointing period, we continue to favor the sector overall based on solid earnings growth, cash flow generation, balance sheet quality and large addressable markets. We see strong alignment with our investment themes in the sector, and we believe many current holdings are well positioned to benefit from the global demand for mobility, analytics, and e-commerce among other areas.
Selection in health care also hampered performance, while the modest underweight stance contributed positively as the sector underperformed. In particular, holdings in the pharmaceuticals industry underperformed as higher-growth companies trailed as the market rewarded higher-dividend-yield, more-defensive characteristics. With
OVERVIEW
The fund invests in equities of companies around the globe. We focus on those firms that we believe demonstrate key growth characteristics, including increasing profit margins and high returns on invested capital.
KEY FEATURES
| | ¡ | | Flexibly seeks growth globally, searching for the best risk/reward opportunities across countries, market capitalizations and sectors | |
| | ¡ | | Seeks global growth companies that may benefit from long-term secular themes, including a burgeoning global middle class and increasing demand for information and entertainment | |
PORTFOLIO FIT
The fund can serve as a growth-oriented addition to a strategic global equity allocation and may complement or provide an alternative to value or blended styles.
| | |
| FUND NASDAQ SYMBOLS |
A Shares | | CAGEX |
B Shares | | CBGEX |
C Shares | | CCGEX |
I Shares | | CIGEX |
R Shares | | CRGEX |
| | | |
|
| FUND CUSIP NUMBERS |
A Shares | | 128119484 |
B Shares | | 128119476 |
C Shares | | 128119468 |
I Shares | | 128119450 |
R Shares | | 128119443 |
| | | |
Calamos Global Equity Fund
| | | | |
| SECTOR WEIGHTINGS | | | |
Information Technology | | | 29.1 | % |
Consumer Discretionary | | | 19.4 | |
Health Care | | | 12.8 | |
Financials | | | 11.3 | |
Consumer Staples | | | 10.1 | |
Industrials | | | 9.9 | |
Energy | | | 3.2 | |
Materials | | | 1.8 | |
Sector weightings are subject to change daily and are calculated as a percentage of net assets. The table excludes cash or cash equivalents, any government/sovereign bonds or broad based index hedging securities the Fund may hold.
respect to individual opportunities, we continue to invest in companies that we believe have a strong innovation and pipeline profile, rising return on invested capital, and alignment with our secular themes including advances in biotechnology and genetics and the impact of changing global demographics.
Conversely, the Fund’s selection in the materials sector contributed positively to performance while the underweight position detracted value. Holdings in the gold mining and production industry performed well as demand for gold and company fundamentals improved. We have held an underweight position in the materials sector overall based on our cautious view of global demand trends and commodity prices.
Our modest overweight to energy added value while relative selection lagged. Higher global supply and a strong dollar have pressured oil prices over the past few years, but there have been more recent signs of stabilization and improved performance in the sector. We incrementally added to the Fund weight during the period but will continue to be highly selective, seeking companies that we believe offer better quality balance sheets and the potential for earnings improvement.
From a country perspective, the Fund’s selection in the U.S. and Japan trailed the index while our underweight to Canada also held back returns. The Fund’s strong selection in Germany, China and Italy added the most value.
How is the Fund positioned?
Our regional and country positioning reflects the combined inputs from our top-down global framework and our bottom-up security analysis. Our investment team continually evaluates macroeconomic factors and growth opportunities, then actively integrates these into investment decision making.
From a regional perspective, we continue to hold an overweight position in Europe, reflecting our view of stabilizing economic data, a still weak euro, and the European Central Bank’s accommodative monetary policy programs. This weight, in addition to an emphasis on companies benefiting from asset reflation and export opportunities, has been a key catalyst of Fund performance.
We remain underweight the U.S. with our exposure primarily focused on secular growth opportunities and companies that are relatively domestically focused in revenue exposure. We are underweight cyclical businesses as we are skeptical of a significant pickup in U.S. economic growth. We continue to favor technology and consumer companies in the U.S. that we believe are delivering innovation and effectively navigating a low-growth environment.
We have a relatively even-weight view in Japan, supported by accommodative policies and effective corporate reforms but also challenged by low growth and a stronger yen. Economic data has been mixed or lower in recent months, but we see a growing universe of companies with improved capital allocation and more shareholder friendly policies. This trend has resulted in increased stock buybacks, dividend increases and capital expenditures. We believe Japan’s market remains reasonably well positioned, although a bottom-up approach is paramount.
We continue to hold a highly selective view in emerging markets, preferring investments in commodity-consuming and pro-growth reform economies. We anticipate continued divergence in the near-term prospects of emerging market economies because of volatility in commodity prices and currencies, political uncertainty, and varying structural reform paths.
| | | | |
| 34 | | CALAMOS OPEN-END FAMILY OF FUNDS SEMIANNUAL REPORT | | |
Calamos Global Equity Fund
From a sector standpoint, we maintained relatively stable sector weights during the period. We modestly increased weight in consumer staples and materials offset by a small decrease in industrials and health care, driven mainly by security-specific rationale. The largest overweight positions in the Fund are in the information technology and consumer discretionary sectors, while the key underweights are in financials, materials, telecom services and utilities.
What closing thoughts do you have for Fund shareholders?
We believe the global economy is positioned for moderate growth in 2016. There may be spikes in volatility as geopolitical tensions, elections and central bank policies influence markets. Favorable factors within the U.S. include solid job growth, low interest rates and limited inflationary pressures. Potential risks to the economy include deflation, fiscal policy and onerous regulations that restrain growth. There are signs of improvement in Europe as mixed but hopeful economic data reflects resilience despite persistently low inflation. Japan’s economy remains lackluster, although many bottom-up investment opportunities are benefiting from increased capital efficiency and corporate governance reforms. China’s economic data shows signs of stabilization but also a divergence between relatively weaker industrial numbers versus stronger demand in consumption and services.
Given our outlook for a continued period of muted economic growth, we are favoring quality growth companies over cyclicals. We are emphasizing investments in companies with positive free cash flow generation and stronger balance sheets. From a thematic perspective, we see opportunities in the information technology sector, companies tied to global consumption, and businesses positioned to benefit from improving fundamentals in Europe. We believe our active investment approach and long-term perspective positions us to take advantage of the opportunities in global markets as they arise.
Calamos Global Equity Fund
GROWTH OF $10,000: SINCE INCEPTION (3/1/07) THROUGH 4/30/16
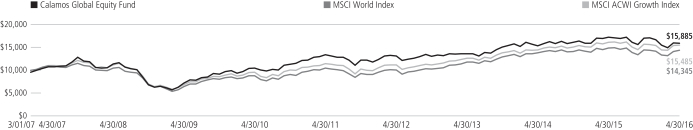
AVERAGE ANNUAL TOTAL RETURN† AS OF 4/30/16
| | | | | | | | | | | | | | | | | | | | |
| | | 6
MONTHS | | 1
YEAR | | 5
YEARS | | SINCE
INCEPTION |
Class A Shares – Inception 3/1/07 | | | | | | | | | | | | | | | | | | | | |
Without Sales Charge | | | | -6.58 | % | | | | -7.97 | % | | | | 3.43 | % | | | | 5.74 | % |
With Sales Charge | | | | -11.03 | | | | | -12.36 | | | | | 2.42 | | | | | 5.18 | |
Class B Shares – Inception 3/1/07 | | | | | | | | | | | | | | | | | | | | |
Without Sales Charge | | | | -6.91 | | | | | -8.67 | | | | | 2.66 | | | | | 5.05 | |
With Sales Charge | | | | -11.47 | | | | | -13.14 | | | | | 2.34 | | | | | 5.05 | |
Class C Shares – Inception 3/1/07 | | | | | | | | | | | | | | | | | | | | |
Without Sales Charge | | | | -6.93 | | | | | -8.69 | | | | | 2.65 | | | | | 4.95 | |
With Sales Charge | | | | -7.84 | | | | | -9.59 | | | | | 2.65 | | | | | 4.95 | |
Class I Shares – Inception 3/1/07 | | | | -6.48 | | | | | -7.79 | | | | | 3.69 | | | | | 6.01 | |
Class R Shares – Inception 3/1/07 | | | | -6.65 | | | | | -8.22 | | | | | 3.17 | | | | | 5.48 | |
Performance data quoted represents past performance, which is no guarantee of future results. Current performance may be lower or higher than the performance quoted. The principal value and investment return of an investment will fluctuate so that your shares, when redeemed, may be worth more or less than their original cost. You can obtain performance data current to the most recent month end by visiting www.calamos.com.
As of the prospectus dated 2/29/16, the Fund’s gross expense ratio for Class A shares is 1.35%; Class B and C shares is 2.10%; Class I shares is 1.10%; Class R shares is 1.60%.
| † | Average annual total return measures net investment income and capital gain or loss from portfolio investments as an annualized average assuming reinvestment of dividends and capital gains distributions. Load-adjusted returns are adjusted for the maximum front-end sales load of 4.75% for Class A shares and returns for Class B and C shares have been adjusted for the contingent deferred sales charge (CDSC). |
NOTES:
The graph does not reflect the income taxes that you would pay on fund distributions or the redemption of fund shares. Fund performance includes reinvestment of dividends and adjustment for the maximum sales charge for Class A shares. The performance of other classes will vary from the performance of the class shown based on the difference in sales charges and fees paid by shareholders investing in different share classes.
The MSCI World Index (U.S. Dollars) is a market-capitalization weighted index composed of companies representative of the market structure of developed market countries in North America, Europe and the Asia/Pacific region. Since inception data for the index is shown from 2/28/07 since data is only available for full monthly periods. Source: Lipper, Inc.
The MSCI ACWI Growth Index is designed to measure the equity performance of companies with higher growth values in developed and emerging markets.
Index returns assume reinvestment of dividends and do not reflect deduction of fees and expenses. It is not possible to invest directly in an index.
| | | | |
| 36 | | CALAMOS OPEN-END FAMILY OF FUNDS SEMIANNUAL REPORT | | |
Calamos Growth and Income Fund
CALAMOS GROWTH AND INCOME FUND
INVESTMENT TEAM DISCUSSION
How has the Fund performed?
For the six-month period ended April 30, 2016, the Fund decreased 1.14% (Class A shares at net asset value) versus a return of 0.43% for the S&P 500 Index and loss of 3.49% for the BofA Merrill Lynch All U.S. Convertibles ex-Mandatory Index.
We manage this Fund with the goal of achieving upside equity participation and potential downside protection over full market cycles. Since its inception on September 22, 1988, the Fund returned 10.87% on an annualized basis (Class A shares at net asset value) versus a 10.05% gain for the S&P 500 Index and an 8.98% return for the BofA Merrill Lynch All U.S. Convertibles ex-Mandatory Index.
Please discuss the Fund’s lower-volatility characteristics?
We believe the Fund’s historical lower-volatility characteristics are a by-product of our investment style and focus on participating in equity market upside with less volatility than the market as a whole. Beta is one popular statistic for measuring volatility. Beta considers a fund’s historic volatility versus the market, which is assigned a beta of 1.0. A fund with half the volatility of the market would have a beta of 0.5, while a fund with a beta of 2.0 would have been twice as volatile as the market.
Since its inception, the Fund has had a beta of 0.73 (Class A shares) versus the S&P 500 Index. The Fund has therefore outperformed the broader equity market, as measured by the S&P 500 Index, with less volatility than the equity market. Please note that past performance does not indicate future results and that beta is one of many measures of risk.
What factors influenced performance?
The Fund invests in a combination of stocks, convertible securities and bonds. It offers a total return-oriented investment that seeks to keep a consistent balance of risk and reward through full market cycles. As we focus on managing volatility, we strive to participate in a greater portion of equity market upside than downside.
Equities experienced a steep sell-off that started just prior to the end of 2015 through February 11, 2016. Concerns of falling commodity prices, China’s economic growth and potential currency devaluations, and U.S. earnings fueled recessionary fears and led investors into safe-haven investments and out of higher growth businesses. As modest yet positive economic data was reported, investors switched gears and returned to the equity market with a preference for value, cyclical and higher-dividend stocks. In mid-March, Federal Reserve Chair Janet Yellen told investors that the Fed foresaw two rather than four interest rate hikes and would consider global risks in deciding interest rate moves. After those comments, growth stocks returned to favor for the month, much as they had for most of 2015.
In this environment, the Fund managed to protect assets during the market’s rapid sell-off, outperforming both the equity and convertible indices. During the market’s recovery, the Fund participated well but did not own as many value-oriented and cyclical names that the market favored as U.S. and global recessionary fears abated. Subsequently, the Fund lagged on the upside. Overall, the Fund provided a less-volatile
OVERVIEW
The fund invests primarily in U.S. equity and convertible securities in an attempt to balance risk/reward while providing growth and income.
KEY FEATURES
| | ¡ | | Leverages more than three decades of research experience combining equities and convertible holdings to provide equity-like participation | |
| | ¡ | | Provides a core holding option that aims to maintain a consistent risk posture throughout the market cycle | |
| | ¡ | | Research-driven approach identifies opportunities by combining top-down analysis with a focus on key growth characteristics | |
PORTFOLIO FIT
The fund can provide a long-term core equity allocation with the potential for lower volatility.
| | |
| FUND NASDAQ SYMBOLS |
A Shares | | CVTRX |
B Shares | | CVTYX |
C Shares | | CVTCX |
I Shares | | CGIIX |
R Shares | | CGNRX |
| | | |
|
| FUND CUSIP NUMBERS |
A Shares | | 128119104 |
B Shares | | 128119765 |
C Shares | | 128119831 |
I Shares | | 128119872 |
R Shares | | 128119336 |
| | | |
Calamos Growth and Income Fund
| | | | |
| SECTOR WEIGHTINGS | |
Information Technology | | | 20.0 | % |
Consumer Discretionary | | | 17.9 | |
Financials | | | 14.4 | |
Health Care | | | 13.5 | |
Industrials | | | 10.1 | |
Consumer Staples | | | 9.2 | |
Energy | | | 5.8 | |
Utilities | | | 2.4 | |
Materials | | | 0.9 | |
Telecommunication Services | | | 0.7 | |
Sector weightings are subject to change daily and are calculated as a percentage of net assets. The table excludes cash or cash equivalents, any government/sovereign bonds or broad based index hedging securities the Fund may hold.
path for investors while participating in the equity markets. In essence, it performed well relative to the equity and convertible market indexes.
In terms of economic sectors, selection in the consumer discretionary and information technology sectors contributed most to performance versus the S&P 500 Index during the six-month period. In particular, selection in home improvement retail, catalog retail as well as houseware and specialties added the most value through both stocks and convertibles. We believe the consumer to be in overall good health, but we are selective in the sector. In the information technology sector, semiconductor holdings added value.
Conversely, selection in financials and consumer staples hindered results. Multi-line insurance and property and casualty insurance holdings lagged within the financials sector, while hypermarkets and super centers detracted among consumer staples. Our use of convertibles in the sector to manage risk provided positive results but lagged the underlying stocks. We appreciate the consistency and stability of consumer staples, but we have been wary of the higher valuations the market has placed on the sector because of perceived safety.
MANAGING RISK OVER MARKET CYCLES
The Growth and Income Fund historically has captured a significant amount of upside during bull markets and limited losses when markets have plunged.
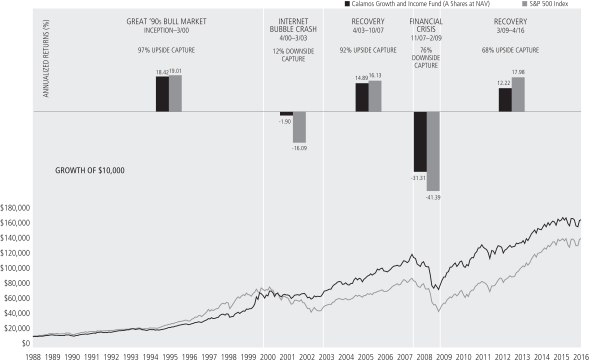
Performance data quoted represents past performance, which is no guarantee of future results. Current performance may be lower or higher than the performance quoted. The principal value and return of an investment will fluctuate so that your shares, when redeemed, may be worth more or less than their original cost. Performance reflected at NAV does not include the Fund’s maximum front-end sales load of 4.75% had it been included, the Fund’s return would have been lower. For the most recent fund performance information visit www.calamos.com.
| | | | |
| 38 | | CALAMOS OPEN-END FAMILY OF FUNDS SEMIANNUAL REPORT | | |
Calamos Growth and Income Fund
Please describe the Fund’s participation in up and down markets since its inception.
The Fund invests in a combination of stocks, convertible securities and bonds to offer a total-return-oriented investment that seeks to consistently balance risk and reward through full market cycles. As we focus on managing volatility, we strive to participate in a greater portion of equity market upside than downside.
There are a variety of ways to express up- and down-market capture, whether it is calculated daily, monthly, quarterly, or as we look at the markets—in longer-term trends. In the chart above, you can see how the Fund performed through distinct market periods. In the five major market periods shown, the Fund has generally participated in the upside movements of the equity market while limiting the downside exposure during times of tumult.
How is the Fund positioned?
The portfolio’s largest weightings are found within the information technology, consumer discretionary, health care and financials sectors. Our positioning reflects a cautious but positive long-term outlook and we are mindful of risk and valuations. Regardless of the sector, we seek to identify companies with sustainable competitive advantages, accelerating fundamentals, growth potential uncaptured by current analysts’ estimates, and identifiable catalysts. Among the themes we expect will drive growth are productivity enhancements, demographic shifts, data digitalization and security, advancements in biotechnology and genomics, and global infrastructure build-out. We remain cognizant of valuations within the portfolio and have reduced exposure to more expensive names when given the opportunity.
While we have been active in many sectors, absolute and relative changes to the portfolio have been moderate. Among selected changes in the period, we reduced the weight to financials as the path of interest rates, as indicated by Chair Yellen of the Federal Reserve, appears to be lower for longer. We increased the consumer discretionary weight based on our positive view of personal income and consumption. We have been monitoring consumer names for opportunities to add to the portfolio during market volatility.
What closing thoughts do you have for Fund shareholders?
We believe the U.S. market will have modestly positive returns and may represent a compelling equity market in a low-return world. We do not foresee a recession in the U.S., but trends in housing and employment point to a slow-growth economy. The market may remain volatile and may be impacted by news from the Federal Reserve as to the path of potential interest rate moves and indications of strong, self-sustaining economic expansion. Growth may remain scarce, so we believe investors may be willing to pay for those businesses that can offer superior growth. Given the market’s volatile episodes, we expect to be a bit more cautious of valuations as higher-valued stocks may have a greater potential for sell-offs when volatility returns. We believe our flexibility to utilize convertibles and equities underscores the Fund’s ability to help manage risk in this environment.
Calamos Growth and Income Fund
ANNUALIZED RETURN: SINCE INCEPTION (9/22/88) THROUGH 4/30/16
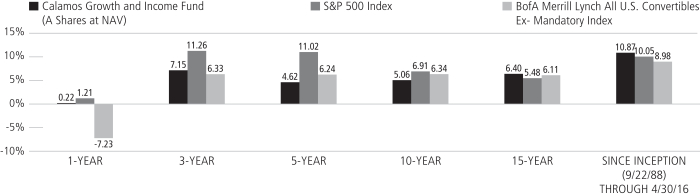
Performance data quoted represents past performance, which is no guarantee of future results. Current performance may be lower or higher than the performance quoted.
The principal value and investment return of an investment will fluctuate so that your shares, when redeemed, may be worth more or less than their original cost. You can obtain performance data current to the most recent month end by visiting www.calamos.com. Average annual total return measures net investment income and capital gain or loss from portfolio investments as an annualized average. All performance shown assumes reinvestment of dividends and capital gains distributions. Performance is for the Fund’s Class A shares at net asset value and does not include the Fund’s maximum front-end sales charge of 4.75%—had it been included, the Fund’s return would have been lower. The Fund also offers Class B, Class C, Class I and R shares, the performance of which may vary. Source: State Street Corporation and Lipper, Inc.
| | | | |
| 40 | | CALAMOS OPEN-END FAMILY OF FUNDS SEMIANNUAL REPORT | | |
Calamos Growth and Income Fund
GROWTH OF $10,000: FOR 10-YEAR PERIOD ENDED 4/30/16
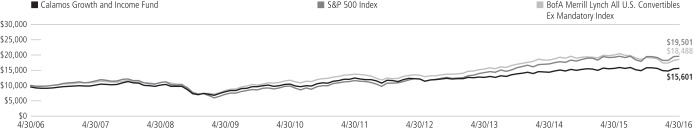
AVERAGE ANNUAL TOTAL RETURN† AS OF 4/30/16
| | | | | | | | | | | | | | | | | | | | |
| | | 6
MONTHS | | 1
YEAR | | 5
YEARS | | 10 YEARS
OR ^SINCE
INCEPTION |
Class A Shares – Inception 9/22/88 | | | | | | | | | | | | | | | | | | | | |
Without Sales Charge | | | | -1.14 | % | | | | 0.22 | % | | | | 4.62 | % | | | | 5.06 | % |
With Sales Charge | | | | -5.83 | | | | | -4.54 | | | | | 3.61 | | | | | 4.55 | |
Class B Shares – Inception 9/11/00 | | | | | | | | | | | | | | | | | | | | |
Without Sales Charge | | | | -1.55 | | | | | -0.60 | | | | | 4.06 | | | | | 4.53 | |
With Sales Charge | | | | -6.27 | | | | | -5.31 | | | | | 3.75 | | | | | 4.53 | |
Class C Shares – Inception 8/5/96 | | | | | | | | | | | | | | | | | | | | |
Without Sales Charge | | | | -1.57 | | | | | -0.61 | | | | | 3.83 | | | | | 4.27 | |
With Sales Charge | | | | -2.51 | | | | | -1.54 | | | | | 3.83 | | | | | 4.27 | |
Class I Shares – Inception 9/18/97 | | | | -1.05 | | | | | 0.45 | | | | | 4.88 | | | | | 5.32 | |
Class R Shares – Inception 3/1/07 | | | | -1.24 | | | | | -0.01 | | | | | 4.37 | | | | | 5.00 | ^ |
Performance data quoted represents past performance, which is no guarantee of future results. Current performance may be lower or higher than the performance quoted. The principal value and investment return of an investment will fluctuate so that your shares, when redeemed, may be worth more or less than their original cost.
As of the prospectus dated 2/29/16, the Fund’s gross expense ratio for Class A shares is 1.11%; Class B and C shares is 1.86%; Class I shares is 0.86%; Class R shares is 1.36%.
| † | Average annual total return measures net investment income and capital gain or loss from portfolio investments as an annualized average assuming reinvestment of dividends and capital gains distributions. Load-adjusted returns are adjusted for the maximum front-end sales load of 4.75% for Class A shares and returns for Class B and C shares have been adjusted for the contingent deferred sales charge (CDSC). |
NOTES:
The graphs do not reflect the income taxes that you would pay on fund distributions or the redemption of fund shares. Fund performance includes reinvestment of dividends and adjustment for the maximum sales charge for Class A shares. The performance of other classes will vary from the performance of the class shown based on the difference in sales charges and fees paid by shareholders investing in different share classes.
The S&P 500 Index is an unmanaged index generally considered representative of the U.S. stock market. Source: Lipper, Inc.
The BofA Merrill Lynch All U.S. Convertibles Ex-Mandatory Index represents the U.S. convertibles securities market excluding mandatory convertibles. Index data shown for the Annualized Return Since Inception graph is from 9/30/88, since comparative index data is only available for full monthly periods. Source: Lipper, Inc.
Index returns assume reinvestment of dividends and do not reflect deduction of fees and expenses. It is not possible to invest directly in an index.
Calamos Global Growth and Income Fund
OVERVIEW
The fund invests primarily in global equity and convertible securities in an attempt to balance risk/reward while providing growth and income.
KEY FEATURES
| | ¡ | | Combines equity and convertible holdings in order to limit downside risk while potentially capturing upside equity participation | |
| | ¡ | | Provides a core holding option that seeks to maintain a consistent risk posture throughout the market cycle | |
| | ¡ | | Seeks to participate in the upside movements of the global equity market while lessening the impact of down periods | |
PORTFOLIO FIT
The fund can provide a long-term, global-equity core allocation with the potential for lower volatility over a full market cycle.
| | |
| FUND NASDAQ SYMBOLS |
A Shares | | CVLOX |
B Shares | | CVLDX |
C Shares | | CVLCX |
I Shares | | CGCIX |
R Shares | | CVLRX |
| | | |
|
| FUND CUSIP NUMBERS |
A Shares | | 128119500 |
B Shares | | 128119732 |
C Shares | | 128119708 |
I Shares | | 128119609 |
R Shares | | 128119385 |
| | | |
CALAMOS GLOBAL GROWTH AND INCOME FUND
INVESTMENT TEAM DISCUSSION
How has the Fund performed?
For the six-month period ended April 30, 2016, Calamos Global Growth and Income Fund declined 3.17% (Class A shares at net asset value), versus a 0.65% decrease for the MSCI ACWI Index and 0.74% slip for the MSCI World Index.
Equities faced relatively steep and rapid losses in early 2016 brought on by concerns relating to slow global growth, depressed commodity prices, and uncertainty over monetary policy. More recently, markets responded more positively as the world’s major central banks signaled renewed commitment to bolster sluggish growth, global economic data showed improvement, and commodity prices recovered from recent lows.
In this challenging environment, the Fund experienced less volatility but underperformed the index. The Fund provided some resilience and held up relatively better than the index during the significant sell-off in January and February but trailed the upside rally in global equities over the final couple months of the period. Specifically, our emphasis on higher-growth and higher-quality businesses was out of step with the market which saw a lower-quality, global cyclical rally from February into April 2016.
Since its inception on September 9, 1996, the Fund returned 7.69% on an annualized basis (Class A shares at net asset value) and outperformed the MSCI ACWI Index return of 6.33% and the MSCI World Index return of 6.45%. The Fund delivered this outperformance with less volatility as discussed below.
Please discuss the Fund’s lower-volatility characteristics?
We believe the Fund’s historical lower-volatility characteristics are a by-product of our investment style, which focuses on participating in equity market upside with less volatility than the market as a whole. Beta is one popular statistic for measuring volatility. Beta considers a Fund’s historic volatility versus the market, which is assigned a beta of 1.0. A fund with half the volatility of the market would have a beta of 0.5, while a fund with a beta of 2.0 would have been twice as volatile as the market.
Since its inception, the Fund has had a beta of 0.70 (Class A shares) versus the MSCI ACWI Index. The Fund has therefore outperformed the broader equity market, as measured by the MSCI ACWI Index, with almost 30% less volatility. Please note that past performance does not indicate future results and that beta is one of many measures of risk.
What factors influenced performance?
The Fund’s security selection in industrials detracted the most value from performance versus the MSCI ACWI Index. Holdings in the construction and engineering industry and industrial conglomerates underperformed as spending in capital goods and heavy industry continued to come under pressure. We continue to evaluate these areas and may add select cyclical opportunities as we expect a potential pickup in demand and export opportunities.
| | | | |
| 42 | | CALAMOS OPEN-END FAMILY OF FUNDS SEMIANNUAL REPORT | | |
Calamos Global Growth and Income Fund
Our underweight to and selection in consumer staples also hindered results. Specifically, holdings in the distillers and packaged foods industries trailed because of slowing volume growth and multinational revenue given a challenging and volatile currency environment. Despite the setback this period, we believe strongly that we own high-quality consumer staples businesses with excellent long-term growth potential in multiple consumer categories.
Our underweight to and selection in the financials sector added the most value. In particular, holdings in the asset management and custody banks industry outperformed because of relatively stronger fundamentals and a more predictable revenue stream. We have a selective view of opportunities in financials and maintain an underweight to the sector overall. Specifically, we take an underweight stance toward banks.
Selection in the consumer discretionary sector also contributed. Holdings in the apparel and accessories as well as apparel retail industries outperformed. We have an overweight to the sector and own companies in growing categories and across a number of industries including Internet retail, cable and satellite, apparel and textiles, and autos.
| | | | |
| SECTOR WEIGHTINGS | |
Information Technology | | | 22.9 | % |
Consumer Discretionary | | | 20.0 | |
Financials | | | 13.0 | |
Industrials | | | 12.9 | |
Health Care | | | 11.8 | |
Consumer Staples | | | 7.7 | |
Energy | | | 5.2 | |
Materials | | | 3.6 | |
Utilities | | | 1.2 | |
Telecommunication Services | | | 1.2 | |
Sector weightings are subject to change daily and are calculated as a percentage of net assets. The table excludes cash or cash equivalents, any government/sovereign bonds or broad based index hedging securities the Fund may hold.
MANAGING RISK OVER MARKET CYCLES
The Global Growth and Income Fund historically has captured a significant amount of upside during bull markets and limited losses when global markets have plunged.
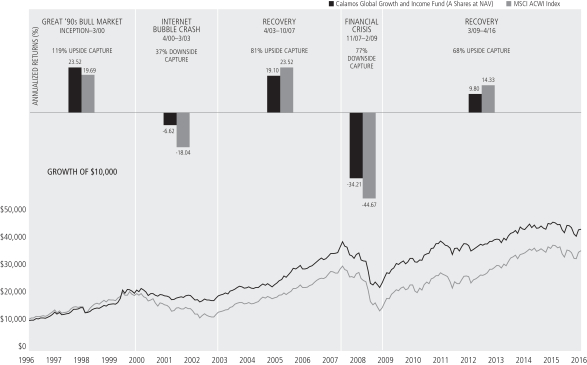
Performance data quoted represents past performance, which is no guarantee of future results. Current performance may be lower or higher than the performance quoted. The principal value and return of an investment will fluctuate so that your shares, when redeemed, may be worth more or less than their original cost. Performance reflected at NAV does not include the Fund’s maximum front-end sales load of 4.75% had it been included, the Fund’s return would have been lower. For the most recent fund performance information visit www.calamos.com.
There is no assurance that the fund will achieve or maintain its investment objective. Results are before taxes on fund distributions and assume reinvestment of dividends and capital gains. Index data shown is from 9/1/96, since comparative index data is available only for full monthly periods.
Calamos Global Growth and Income Fund
From a geographic perspective, our selection in the U.S. trailed as many secular growth names performed reasonably well but not up to expectations. Also, the underweight to Canada also held back returns. Selection in China and Japan added value.
How is the Fund positioned?
Our regional and country positioning reflects the combined inputs from our top-down global framework and our bottom-up security analysis. Our investment team continually evaluates macroeconomic factors and growth opportunities, then actively integrates these into investment decision making.
From a regional perspective, we hold a significant weight in Europe, reflecting our view of stabilizing economic data, a still weak euro, and the European Central Bank’s accommodative monetary policy programs. This weight, in addition to an emphasis on companies benefiting from asset reflation and export opportunities, has been a key catalyst of Fund performance.
We hold a large but moderately underweight position in the U.S., with our exposure primarily focused on secular growth opportunities and companies that are relatively domestically focused in revenue exposure. We are underweight cyclical businesses as we are skeptical of a significant pickup in U.S. economic growth. We continue to favor technology and consumer companies in the U.S. that are delivering innovation and effectively navigating a low-growth environment.
We have a relatively even-weight view in Japan, supported by accommodative policies and effective corporate reforms but also challenged by low growth and a stronger yen. Economic data has been mixed to lower in recent months, but we see a growing universe of companies with improved capital allocation and more shareholder friendly policies. This trend has resulted in increased stock buybacks, dividend increases and capital expenditures. We believe Japan’s market remains reasonably well positioned, although a bottom-up approach is paramount.
We are highly selective in emerging markets, preferring investments in commodity-consuming and pro-growth reform economies. We anticipate continued divergence in the near-term prospects of emerging market countries because of volatility in commodity prices and currencies, political uncertainty, and varying structural reform paths.
From a sector standpoint, we made moderate adjustments to sector weights during the period. We modestly increased the weight to consumer sectors and materials and lowered the weight to information technology, driven by bottom-up rationale. The largest overweight positions reside in the information technology and consumer discretionary sectors, while underweights are found in financials, telecommunication services and utilities.
What closing thoughts do you have for Fund shareholders?
We believe the global economy is positioned for moderate growth in 2016. There may be spikes in volatility as geopolitical tensions, elections and central bank policies influence markets. Favorable factors within the U.S. include solid job growth, low interest rates and limited inflationary pressures. Potential risks to the economy include deflation, fiscal policy and onerous regulations that restrain growth. There are signs of improvement in Europe as mixed but hopeful economic data reflects resilience despite
| | | | |
| 44 | | CALAMOS OPEN-END FAMILY OF FUNDS SEMIANNUAL REPORT | | |
Calamos Global Growth and Income Fund
persistently low inflation. We believe Japan’s economy remains lackluster, although many bottom-up investment opportunities are benefiting from increased capital efficiency and corporate governance reforms. China’s economic data shows signs of stabilization but also a divergence between relatively weaker industrial numbers versus stronger demand in consumption and services.
Given our outlook for a continued period of muted economic growth, we are favoring quality growth companies over cyclicals. We are emphasizing investments in companies with positive free cash flow generation and stronger balance sheets. From a thematic perspective, we see opportunities in the information technology sector, companies tied to global consumption, and businesses positioned to benefit from improving Fundamentals in Europe. We believe our active, risk-managed investment approach positions us to take advantage of potential volatility and opportunities in global equities and convertible securities.
ANNUALIZED RETURN: SINCE INCEPTION (9/9/96) THROUGH 4/30/16
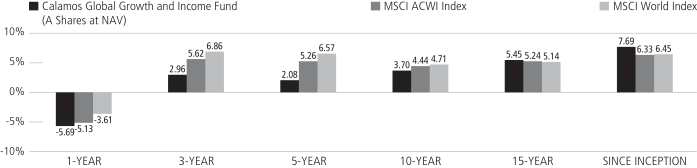
Performance data quoted represents past performance, which is no guarantee of future results. Current performance may be lower or higher than the performance quoted.
The principal value and investment return of an investment will fluctuate so that your shares, when redeemed, may be worth more or less than their original cost. You can obtain performance data current to the most recent month end by visiting www.calamos.com. Average annual total return measures net investment income and capital gain or loss from portfolio investments as an annualized average. All performance shown assumes reinvestment of dividends and capital gains distributions. Performance is for the Fund’s Class A shares at net asset value and does not include the Fund’s maximum front-end sales charge of 4.75%—had it been included, the Fund’s return would have been lower. The Fund also offers Class B, Class C, Class I and Class R shares, the performance of which may vary. Source: State Street Corporation and Lipper, Inc.
Calamos Global Growth and Income Fund
GROWTH OF $10,000: FOR THE 10-YEAR PERIOD ENDED 4/30/16
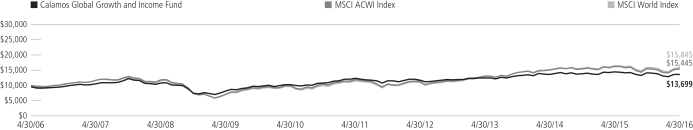
AVERAGE ANNUAL TOTAL RETURN† AS OF 4/30/16
| | | | | | | | | | | | | | | | | | | | |
| | | 6
MONTHS | | 1
YEAR | | 5
YEARS | | 10 YEARS
OR ^SINCE
INCEPTION |
Class A Shares – Inception 9/9/96 | | | | | | | | | | | | | | | | | | | | |
Without Sales Charge | | | | -3.17 | % | | | | -5.69 | % | | | | 2.08 | % | | | | 3.70 | % |
With Sales Charge | | | | -7.77 | | | | | -10.15 | | | | | 1.09 | | | | | 3.20 | |
Class B Shares – Inception 9/11/00 | | | | | | | | | | | | | | | | | | | | |
Without Sales Charge | | | | -3.48 | | | | | -6.37 | | | | | 1.33 | | | | | 3.07 | |
With Sales Charge | | | | -8.24 | | | | | -10.99 | | | | | 1.05 | | | | | 3.07 | |
Class C Shares – Inception 9/24/96 | | | | | | | | | | | | | | | | | | | | |
Without Sales Charge | | | | -3.48 | | | | | -6.34 | | | | | 1.33 | | | | | 2.93 | |
With Sales Charge | | | | -4.44 | | | | | -7.26 | | | | | 1.33 | | | | | 2.93 | |
Class I Shares – Inception 9/18/97 | | | | -2.99 | | | | | -5.34 | | | | | 2.35 | | | | | 3.96 | |
Class R Shares – Inception 3/1/07 | | | | -3.33 | | | | | -5.87 | | | | | 1.84 | | | | | 3.08 | ^ |
Performance data quoted represents past performance, which is no guarantee of future results. Current performance may be lower or higher than the performance quoted. The principal value and investment return of an investment will fluctuate so that your shares, when redeemed, may be worth more or less than their original cost.
As of the prospectus dated 2/29/16, the Fund’s gross expense ratio for Class A shares is 1.49%; Class B and C shares is 2.24%; Class I shares is 1.24%; Class R shares is 1.74%.
| † | Average annual total return measures net investment income and capital gain or loss from portfolio investments as an annualized average assuming reinvestment of dividends and capital gains distributions. Performance shown reflects the effects of an expense reimbursement that improved results and was in effect until March 31, 2003. Load-adjusted returns are adjusted for the maximum front-end sales load of 4.75% for Class A shares and returns for Class B and C shares have been adjusted for the contingent deferred sales charge (CDSC). |
NOTES:
The graphs do not reflect the income taxes that you would pay on fund distributions or the redemption of fund shares. Fund performance includes reinvestment of dividends and adjustment for the maximum sales charge for Class A shares. The performance of other classes will vary from the performance of the class shown based on the difference in sales charges and fees paid by shareholders investing in different share classes.
The MSCI ACWI Index is a free float-adjusted market capitalization weighted index that is designed to measure the equity market performance of developed and emerging markets.
The MSCI World Index (U.S. Dollars) is a market-capitalization weighted index composed of companies representative of the market structure of developed market countries in North America, Europe and the Asia/Pacific region. Since inception data for the index is shown from 9/30/96 since data is only available for full monthly periods. Source: Lipper, Inc.
Index returns assume reinvestment of dividends and do not reflect deduction of fees and expenses. It is not possible to invest directly in an index.
| | | | |
| 46 | | CALAMOS OPEN-END FAMILY OF FUNDS SEMIANNUAL REPORT | | |
Calamos Convertible Fund
CALAMOS CONVERTIBLE FUND
INVESTMENT TEAM DISCUSSION
How has the Fund performed?
For the six-month period ended April 30, 2016, the Fund had a loss of 3.39% (Class A shares at net asset value) versus the BofA Merrill Lynch All U.S. Convertibles Index decrease of 2.88%. For the same period the Value Line Convertible Index declined 2.51% and the S&P 500 Index gained 0.43%.
The six-month period had significant bouts of volatility as investors grappled with a myriad of concerns including commodity-price and U.S. dollar volatility, U.S. recessionary fears, and central bank monetary policy shifts. The convertible market was not immune to these pressures, which also affected equities. Further, because small cap and mid cap growth stocks are well represented within the convertible index, the convertible market shared in the added headwinds that these securities encountered.
Since its inception on June 21, 1985, the Fund returned 8.76% on an annualized basis (Class A shares at net asset value), compared with a gain of 8.27% for the Value Line Convertible Index and 10.56% for the S&P 500 Index.
Please discuss the Fund’s lower-volatility characteristics.
We believe the Fund’s historical lower-volatility characteristics are a by-product of our investment style and we focus on participating in equity market upside with less volatility than the market as a whole. Beta is one popular statistic for measuring volatility. Beta considers a fund’s historic volatility versus a market index, which is assigned a beta of 1.0. A fund with half the volatility of the benchmark index has a beta of 0.5, while a fund with a beta of 2.0 is twice as volatile as the market. Since its inception, the Fund had a beta of 0.63 (Class A shares) versus the S&P 500 Index. The Fund has therefore provided comparable performance to the broader equity market, as measured by the S&P 500 Index, with less volatility. Please note that past performance does not indicate future results and that beta is one of many measures of risk.
What factors influenced performance?
While the Fund slightly trailed the convertible benchmarks during the period, our goal in this Fund is to manage the hybrid characteristics of convertibles with more upside equity participation than downside over full market cycles. We believe our approach is well positioned for the environment we expect, one of both opportunity and volatility, over the long-run.
From an economic sector perspective, selection in information technology lagged as holdings in Internet software and services, systems software, and communications equipment underperformed versus the BofA ML All U.S. Convertibles Index. Our underweight to and selection in the utilities sector also held back the result as the Fund had a lighter allocation to the relatively robust integrated telecommunication services industry.
Selection in the financials sector added value. The Fund benefited from its heavy allocation to the strong performing asset management and custody banks and diversified banks industries as well as its lighter weighting to the underperforming thrifts and mortgage finance industry. Selection in the consumer staples sector also helped, particularly holdings in the packaged foods and meats industry.
OVERVIEW
The fund invests primarily in convertible securities of U.S. companies that are diversified across market sector and credit quality.
KEY FEATURES
| | ¡ | | Leverages more than three decades of research and experience in convertible security investing | |
| | ¡ | | Provides diversification across market sectors and credit quality, emphasizing midsize companies with higher-quality balance sheets | |
| | ¡ | | Seeks to provide upside participation in equity markets with less exposure to downside than an equity-only portfolio over a full market cycle | |
PORTFOLIO FIT
When used in conjunction with an equity allocation, the fund offers a way potentially to manage risk by employing securities that engage in upside equity movements with limited downside participation.
| | |
| FUND NASDAQ SYMBOLS |
A Shares | | CCVIX |
B Shares | | CALBX |
C Shares | | CCVCX |
I Shares | | CICVX |
R Shares | | CCVRX |
| | | |
|
| FUND CUSIP NUMBERS |
A Shares | | 128119401 |
B Shares | | 128119773 |
C Shares | | 128119823 |
I Shares | | 128119864 |
R Shares | | 128119369 |
| | | |
Calamos Convertible Fund
| | | | |
| SECTOR WEIGHTINGS | |
Information Technology | | | 30.5 | % |
Health Care | | | 19.3 | |
Consumer Discretionary | | | 17.9 | |
Financials | | | 17.0 | |
Energy | | | 4.2 | |
Utilities | | | 2.4 | |
Telecommunication Services | | | 2.2 | |
Industrials | | | 2.0 | |
Consumer Staples | | | 1.7 | |
Materials | | | 1.3 | |
Sector weightings are subject to change daily and are calculated as a percentage of net assets. The table excludes cash or cash equivalents, any government/sovereign bonds or broad based index hedging securities the Fund may hold.
Please describe the Fund’s participation in up and down markets since its inception.
Convertible securities combine characteristics of stocks and fixed income securities. Like stocks, convertibles typically offer potential upside participation in rising equity markets. Like bonds, convertible securities may provide income and potential downside protection in declining equity markets. There are a variety of ways to express up-market and down-market capture, whether it is calculated daily, monthly, quarterly, or as we look at the markets—in longer-term up and down market trends. In the chart above, you can see how the Convertible Fund performed compared to the U.S. equity market through distinct market periods over the past 20 years. In the five major market periods shown, we believe that the Fund has participated in the upside movements of the equity market while limiting the downside exposure during times of tumult.
MANAGING RISK OVER MARKET CYCLES
Over the last 20 years, the Convertible Fund historically has captured a significant amount of upside during bull markets and limited losses when markets have plunged.
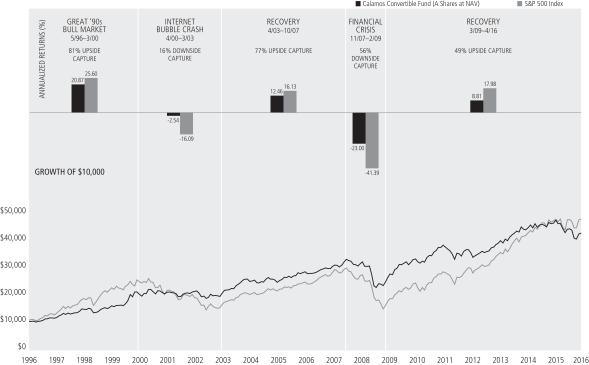
Performance data quoted represents past performance, which is no guarantee of future results. Current performance may be lower or higher than the performance quoted. The principal value and return of an investment will fluctuate so that your shares, when redeemed, may be worth more or less than their original cost. Performance reflected at NAV does not include the Fund’s maximum front-end sales load of 4.75% had it been included, the Fund’s return would have been lower. For the most recent fund performance information visit www.calamos.com.
| | | | |
| 48 | | CALAMOS OPEN-END FAMILY OF FUNDS SEMIANNUAL REPORT | | |
Calamos Convertible Fund
How is the Fund positioned?
Our positioning in the U.S. convertible market is cautious but not defensive. We are finding exciting opportunities in information technology where innovation is generating growth in social media, mobile, security, cloud computing, Internet of things, and data center disruption. We think that each of these trends has a long runway of growth.
We have a positive view of the consumer discretionary sector where electric car innovation is disrupting the traditional auto market while the U.S. consumer stands to benefit from higher wages, lower unemployment, lower fuel prices, and an improving housing market. We think that employment and wage gains, stock market and home-value appreciation, and lower energy prices will contribute to increased consumer spending throughout the year.
We are more selective in health care, which faces political pressure during an election year because of escalating drug prices and the negative overtones of tax-inversion acquisitions. In this area, our investments are centered on long-term secular themes such as Medicaid expansion, home health trends, and personalized medicine and genome sequencing.
Although we’ve been cautious on the cyclical sectors (energy, materials and industrials) for the last year as fundamentals had been weak, we have opportunistically added at the margin. We have seen improvements in long-term valuations and fundamentals, such as lower oil rig counts and decreased capital spending that can benefit commodity prices.
As we expect continued bouts of volatility, we are focused on convertibles with balanced risk/reward profiles that participate in rallies and may help to limit losses when equities fall. With more credit-sensitive convertibles, we favor higher-quality balance sheets and companies that we believe can improve their credit profiles. With more equity-sensitive convertibles, we are highly mindful of valuations. In this low-growth environment we’re experiencing, companies with strong balance sheets that generate above-average organic growth have typically been rewarded by investors. Given the volatility that mid cap growth issuers have experienced, we continue to evaluate available opportunities to align the Fund more closely with the attributes of the broader equity market.
Do you have any closing thoughts for shareholders?
We believe that the U.S. economy will maintain its slow growth and markets will advance, though amid volatility—which plays to the strengths of convertibles. We see volatility coming from a variety of sources including presidential politics, the U.K.’s vote on whether to withdraw from the European Union, and continued speculation regarding global central banking policies.
In our view, interest rates are likely to continue to rise, albeit at a slower rate than previously expected, and convertible bonds historically have performed well when rates have risen. We are investing with an eye to risk management because of the potential for volatile markets. We believe that relative to stocks and traditional fixed income securities, convertibles can provide unique advantages in volatile markets as long-term investors may potentially benefit from narrowing spreads, a rebound in convertibles’ underlying equities, and improving convertible valuations.
Calamos Convertible Fund
ANNUALIZED RETURN: SINCE INCEPTION (6/21/85) THROUGH 4/30/16
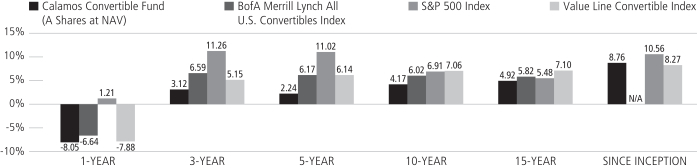
Performance data quoted represents past performance, which is no guarantee of future results. Current performance may be lower or higher than the performance quoted.
The principal value and investment return of an investment will fluctuate so that your shares, when redeemed, may be worth more or less than their original cost. You can obtain performance data current to the most recent month end by visiting www.calamos.com. Average annual total return measures net investment income and capital gain or loss from portfolio investments as an annualized average. All performance shown assumes reinvestment of dividends and capital gains distributions. Performance is for the Fund’s Class A shares at net asset value and does not include the Fund’s maximum front-end sales charge of 4.75%—had it been included, the Fund’s return would have been lower. The Fund also offers Class B, Class C, Class I and Class R shares, the performance of which may vary. Source: State Street Corporation, Lipper, Inc., and Mellon Analytical Solutions, LLC.
| | | | |
| 50 | | CALAMOS OPEN-END FAMILY OF FUNDS SEMIANNUAL REPORT | | |
Calamos Convertible Fund
GROWTH OF $10,000: FOR THE 10-YEAR PERIOD ENDED 4/30/16
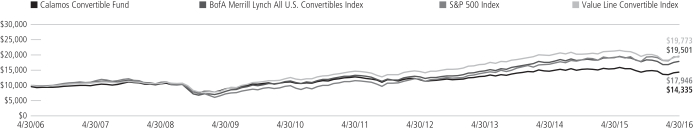
AVERAGE ANNUAL TOTAL RETURN† AS OF 4/30/16
| | | | | | | | | | | | | | | | | | | | |
| | | 6
MONTHS | | 1
YEAR | | 5
YEARS | | 10 YEARS
OR ^SINCE
INCEPTION |
Class A Shares – Inception 6/21/85 | | | | | | | | | | | | | | | | | | | | |
Without Sales Charge | | | | -3.39 | % | | | | -8.05 | % | | | | 2.24 | % | | | | 4.17 | % |
With Sales Charge | | | | -8.00 | | | | | -12.44 | | | | | 1.25 | | | | | 3.67 | |
Class B Shares – Inception 9/11/00 | | | | | | | | | | | | | | | | | | | | |
Without Sales Charge | | | | -3.71 | | | | | -8.68 | | | | | 1.48 | | | | | 3.55 | |
With Sales Charge | | | | -8.41 | | | | | -13.09 | | | | | 1.18 | | | | | 3.55 | |
Class C Shares – Inception 7/5/96 | | | | | | | | | | | | | | | | | | | | |
Without Sales Charge | | | | -3.73 | | | | | -8.71 | | | | | 1.47 | | | | | 3.39 | |
With Sales Charge | | | | -4.66 | | | | | -9.58 | | | | | 1.47 | | | | | 3.39 | |
Class I Shares – Inception 6/25/97 | | | | -3.18 | | | | | -7.77 | | | | | 2.51 | | | | | 4.44 | |
Class R Shares – Inception 3/1/07 | | | | -3.45 | | | | | -8.23 | | | | | 1.99 | | | | | 3.91 | ^ |
Performance data quoted represents past performance, which is no guarantee of future results. Current performance may be lower or higher than the performance quoted. The principal value and investment return of an investment will fluctuate so that your shares, when redeemed, may be worth more or less than their original cost.
As of the prospectus dated 2/29/16, the Fund’s gross expense ratio for Class A shares is 1.13%; Class B and C shares is 1.88%; Class I shares is 0.88%; Class R shares is 1.38%.
| † | Average annual total return measures net investment income and capital gain or loss from portfolio investments as an annualized average assuming reinvestment of dividends and capital gains distributions. Load-adjusted returns are adjusted for the maximum front-end sales load of 4.75% for Class A shares and returns for Class B and C shares have been adjusted for the contingent deferred sales charge (CDSC). |
NOTES:
The graphs do not reflect the income of taxes that you would pay on fund distributions or the redemption of fund shares. Fund performance includes reinvestment of dividends and adjustment for the maximum sales charge for Class A shares. The performance of other classes will vary from the performance of the class shown based on the difference in sales charges and fees paid by shareholders investing in different share classes.
The BofA Merrill Lynch All U.S. Convertibles Index is comprised of approximately 700 issues of only convertible bonds and preferreds of all qualities.
The S&P 500 Index is an unmanaged index generally considered representative of the U.S. stock market.
The Value Line Convertible Index is an equally-weighted index of the larger convertibles, representing 90% of the U.S. convertible securities market. Index data shown for the Annualized Returns Since Inception graph is from 6/30/85, since comparative index data is only available for full monthly periods. Source: Mellon Analytical Solutions, LLC.
Index returns assume reinvestment of dividends and do not reflect deduction of fees and expenses. It is not possible to invest directly in an index.
Calamos Global Convertible Fund
OVERVIEW
The fund invests in global convertible securities. It strives to balance risk/reward, while providing growth and income.
KEY FEATURES
| | ¡ | | Provides broadly diversified exposure to the global convertible bond universe | |
| | ¡ | | Leverages more than 30 years of research in convertible security investing | |
| | ¡ | | Seeks to provide upside participation in equity markets with less exposure to downside than an equity-only portfolio over a full market cycle | |
| | ¡ | | Blends global investment themes and fundamental research via active management | |
PORTFOLIO FIT
Consisting of convertible securities that can participate in upside equity movements with potentially limited downside exposure, the fund can provide a means to manage risk in conjunction with an equity allocation. The fund can also serve a role within a fixed income allocation, as convertibles have performed well during periods of rising interest rates and inflation.
| | |
| FUND NASDAQ SYMBOLS |
A Shares | | CAGCX |
C Shares | | CCGCX |
I Shares | | CXGCX |
R Shares | | CRGCX |
|
| FUND CUSIP NUMBERS |
A Shares | | 128120748 |
C Shares | | 128120730 |
I Shares | | 128120722 |
R Shares | | 128120714 |
CALAMOS GLOBAL CONVERTIBLE FUND
INVESTMENT TEAM DISCUSSION
How has the Fund performed?
For the six-month period ended April 30, 2016, the Fund had a loss of 1.39% (Class A shares at net asset value) versus the BofA Merrill Lynch Global 300 Convertible Index return of 0.83%. Since its inception on December 31, 2014, the Fund declined 1.04% versus a 2.49% gain by the index.
The benchmark BofA Merrill Lynch Global 300 Convertible Index was led by the strong performance of convertibles with the greatest equity sensitivity. We have been significantly underweight to these convertibles relative to the index as they do not offer downside protection when their underlying equities retreat.
What factors influenced performance?
During the period, we witnessed significant bouts of volatility as investors grappled with a myriad of concerns including commodity prices and currency volatility, U.S. recessionary fears and central bank monetary policy shifts. While the Federal Reserve raised interest rates in December, the European Central Bank and Bank of Japan continued their accommodative policies that advanced a stronger U.S. dollar relative to the euro and the yen. The volatile environment hindered the convertible and equities markets.
Our goal in this strategy is to manage the hybrid characteristics of convertibles with more upside equity participation than downside to build wealth for clients over market cycles. In this respect, the Fund was overweight to convertibles displaying these more balanced attributes relative to the index. Within the index, the most equity-sensitive and credit-sensitive names outperformed those with balanced attributes and our overweight allocation to balanced convertibles held back performance versus the benchmark. We continue to believe we are well positioned for the environment we expect, which is one of both opportunity and volatility.
From an economic sector perspective, our overweight to and selection in energy, particularly in the oil and gas exploration and production industry, aided performance versus the BofA Merrill Lynch Global 300 Convertible Index. Our selection in materials also contributed, especially in diversified chemicals, specialty chemicals and construction materials. The Fund was underweight to the most speculative credit tiers, including securities rated CCC and below. This positioning proved beneficial as speculative credits significantly lagged during the period.
Conversely, selection in the automobile manufacturers, apparel accessories and luxury goods, housewares and specialties, and Internet retail industries in the consumer discretionary sector hindered performance. Selection in the health care sector’s pharmaceuticals and health care equipment industries also lagged. Further, selection in the information technology sector trailed, particularly in the semiconductor equipment, Internet software and services, and technology hardware storage and peripherals industries.
On a regional basis, our underweight to and selection in Europe, along with our selection in emerging Europe and South Africa detracted from performance, while selection in the U.S. added value.
| | | | |
| 52 | | CALAMOS OPEN-END FAMILY OF FUNDS SEMIANNUAL REPORT | | |
Calamos Global Convertible Fund
How is the Fund positioned?
Reflecting our emphasis on growth sectors, the Fund’s largest allocation are found in the financials, information technology, health care, and consumer discretionary sectors. We are becoming more selective in health care, although we have identified issuers that we believe are potential beneficiaries of long-term secular themes. The Fund has its lightest allocations to consumer staples, utilities, materials, energy and telecommunication services. We are cautious of energy, materials and industrials, but we have opportunistically added at the margin when we’ve found attractive valuations and improving fundamentals.
The Fund is allocated heaviest to convertibles displaying attractive risk-reward attributes relative to their underlying common stocks. The Fund is overweight to emerging markets and underweight to Japan versus the benchmark. The Fund also is slightly underweight to Europe and the U.S.
What are your closing thoughts for shareholders?
In a volatile environment where the valuations of many defensive stocks are high, we see pronounced opportunities for global convertibles as a means to pursue lower-volatility equity participation. We remain focused on the more balanced structures within the convertible market, which we believe enables us to protect on a downside equity move yet participate in the upside of a volatile market. We are also favoring higher credit qualities. In this low-growth environment, companies with strong balance sheets that generate above-average organic growth have typically been rewarded by investors.
| | | | |
| SECTOR WEIGHTINGS | |
Financials | | | 24.1 | % |
Information Technology | | | 20.9 | |
Health Care | | | 14.3 | |
Consumer Discretionary | | | 12.5 | |
Industrials | | | 11.1 | |
Energy | | | 3.7 | |
Telecommunication Services | | | 3.6 | |
Materials | | | 2.3 | |
Utilities | | | 1.5 | |
| | | | | |
Sector weightings are subject to change daily and are calculated as a percentage of net assets. The table excludes cash or cash equivalents, any government/sovereign bonds or broad based index hedging securities the Fund may hold.
Calamos Global Convertible Fund
GROWTH OF $10,000: SINCE INCEPTION (12/31/14) THROUGH 4/30/16
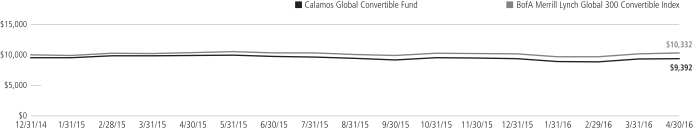
AVERAGE ANNUAL TOTAL RETURN† AS OF 4/30/16
| | | | | | | | | | | | | | | |
| | | 6
MONTHS | | 1
YEAR | | SINCE
INCEPTION |
Class A Shares – Inception 12/31/2014 | | | | | | | | | | | | | | | |
Without Sales Charge | | | | -1.39 | % | | | | -5.27 | % | | | | -1.04 | % |
With Sales Charge | | | | -6.11 | | | | | -9.78 | | | | | -4.60 | |
Class C Shares – Inception 12/31/2014 | | | | | | | | | | | | | | | |
Without Sales Charge | | | | -1.87 | | | | | -6.05 | | | | | -1.79 | |
With Sales Charge | | | | -2.84 | | | | | -6.97 | | | | | -1.79 | |
Class I Shares – Inception 12/31/2014 | | | | -1.28 | | | | | -5.08 | | | | | -0.75 | |
Class R Shares – Inception 12/31/2014 | | | | -1.52 | | | | | -5.59 | | | | | -1.29 | |
Performance data quoted represents past performance, which is no guarantee of future results. Current performance may be lower or higher than the performance quoted. The principal value and investment return of an investment will fluctuate so that your shares, when redeemed, may be worth more or less than their original cost. You can obtain performance data current to the most recent month end by visiting www.calamos.com.
As of the prospectus dated 2/29/16, the Fund’s gross expense ratio for Class A shares is 2.31%; Class C shares is 2.89%; Class I shares is 1.80%; Class R shares is 2.93%. The fund’s investment adviser has contractually agreed to reimburse the fund expenses through March 1, 2017, to the extent necessary so that total annual fund operating expenses (excluding taxes, interest, short interest, short dividend expenses, brokerage commissions, acquired funds fees and expenses and extraordinary expenses, if any) of Class A, Class C, Class I and Class R are limited to 1.35%, 2.10%, 1.10% and 1.60% of average net assets, respectively.
| † | Average annual total return measures net investment income and capital gain or loss from portfolio investments as an annualized average assuming reinvestment of dividends and capital gains distributions. Load-adjusted returns are adjusted for the maximum front-end sales load of 4.75% for Class A shares. Returns for Class C shares have been adjusted for the contingent deferred sales charge (CDSC). |
NOTES:
The BofA Merrill Lynch Global 300 Convertible Index is a global convertible index composed of companies representative of the market structure of countries in North America, Europe and the Asia/Pacific region.
Unmanaged index returns assume reinvestment of any and all distributions and, unlike fund returns, do not reflect fees, expenses or sales charges. Investors cannot invest directly in an index.
| | | | |
| 54 | | CALAMOS OPEN-END FAMILY OF FUNDS SEMIANNUAL REPORT | | |
Calamos Total Return Bond Fund
CALAMOS TOTAL RETURN BOND FUND
INVESTMENT TEAM DISCUSSION
How has the Fund performed?
For the six-month period ended April 30, 2016, Calamos Total Return Bond Fund gained 2.73% (Class A shares at net asset value) performing in line with the 2.82% return for the Barclays U.S. Aggregate Bond Index.
Since its inception on June 27, 2007, the Fund gained 4.74% on an annualized basis (Class A shares at net asset value) versus a 4.92% return for the Barclays U.S. Aggregate Bond Index.
What factors influenced performance?
The portfolio benefited from its overweight to corporate bonds as corporate bonds outperformed within the Barclays U.S. Aggregate Bond Index during the period. The corporate bond component of the index returned 4.34%. Within the Barclays U.S. Credit Index, AA-rated spreads were 12 basis points (bps) tighter, A-rated spreads were 9 bps tighter and BBB-rated spreads were 16 bps tighter.
The portfolio held a shorter duration than the Barclays U.S. Aggregate Bond Index. However, longer-duration names outperformed. During the period, the 10+ year sector returned 7.19% versus the 2.82% overall index return during that period. The 30-Year Treasury saw its yield decline 24 bps to 2.68% while 3-Year and 5-Year Treasury yields fell 13 bps and 24 bps to 0.92% and 1.28%, respectively.
Our allocation to below-investment grade credits hurt performance during the period. The Barclays U.S. High Yield Index returned 2.37%. Within the index, BB credit returned 2.96% and B credit returned 1.37%. Our below-investment grade allocation underperformed largely because of our limited exposure to the energy and metals and mining sectors, which outperformed during the period.
The portfolio was underweight U.S. Treasurys, which proved beneficial as Treasurys lagged within the index. Additionally, the portfolio benefited from its lack of investment in mortgages, which underperformed during the reporting period.
How is the fund positioned?
The Fund’s duration of 5.0 years is shorter than 5.4 years duration of the Barclays U.S. Aggregate Bond Index.
The portfolio is overweight to corporate debt as we see this as the most-attractive segment of the bond market at present. Additionally, we continue to seek opportunities in the high yield market and will adjust our exposure based on fundamentals and valuations.
We continue to be underweight the energy and metals and mining sectors given our concerns regarding continued commodity price volatility.
Within corporate bonds, the portfolio has its heaviest weightings in the financials, consumer discretionary, and information technology sectors. Our lightest positions are found in utilities, materials and consumer staples.
OVERVIEW
The fund invests in a diversified portfolio of fixed income instruments, seeking total return consistent with capital preservation.
KEY FEATURES
| | ¡ | | Flexible mandate allows us to invest across the fixed income universe with a focus on investment grade credit, high yield credit and U.S. Treasury securities | |
| | ¡ | | Dynamic investment process combines rigorous, fundamental credit research with top-down macro views | |
| | ¡ | | Employs proprietary high yield research to identify securities with the best potential to migrate to investment-grade status, ahead of ratings agency upgrades | |
PORTFOLIO FIT
The fund offers broad, diversified exposure to the U.S. investment grade bond market with opportunistic allocation to high yield securities.
| | |
| FUND NASDAQ SYMBOLS |
A Shares | | CTRAX |
B Shares | | CTXBX |
C Shares | | CTRCX |
I Shares | | CTRIX |
R Shares | | CTRRX |
| | | |
|
| FUND CUSIP NUMBERS |
A Shares | | 128119310 |
B Shares | | 128119294 |
C Shares | | 128119286 |
I Shares | | 128119278 |
R Shares | | 128119260 |
| | | |
|
| ASSET ALLOCATION |
| | |
Corporate Bonds | | 87.2% |
U.S. Government and Agency Securities | | 10.1 |
Cash and Receivables/Payables | | 2.7 |
| | | |
Asset allocation is subject to change daily and is calculated as a percentage of net assets.
Calamos Total Return Bond Fund
Do you have any closing thoughts for shareholders?
We continue to expect that the combination of moderate economic growth and low U.S. Treasury yields will support the corporate bond asset class. The European Central Bank’s purchase program and negative interest rates in many parts of the world may also bolster demand for the asset class as investors seek higher yields. However, volatility in commodity prices, heightened fears of a U.K. exit from the European Union, angst over growth prospects for the Chinese economy, the upcoming U.S. presidential election and lackluster corporate earnings may add volatility to the credit markets. After a rally in January, U.S. rates have remained range bound since early February. While the consensus view is for the range trade to continue, recent commentary from the Federal Reserve makes us wonder if markets are underestimating the willingness of the Fed to hike rates this year, which could put upward pressure on rates. Although our short-duration bias has hurt performance year-to-date, we continue to maintain a cautious outlook. Additionally, we continue to see the best risk-adjusted opportunities in corporate bonds and we’ll opportunistically adjust positioning based on fundamentals and valuations.
| | | | |
| 56 | | CALAMOS OPEN-END FAMILY OF FUNDS SEMIANNUAL REPORT | | |
Calamos Total Return Bond Fund
GROWTH OF $10,000: SINCE INCEPTION (6/30/07) THROUGH 4/30/16
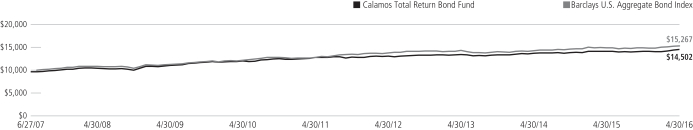
AVERAGE ANNUAL TOTAL RETURN† AS OF 4/30/16
| | | | | | | | | | | | | | | | | | | | |
| | | 6
MONTHS | | 1
YEAR | | 5
YEARS | | SINCE
INCEPTION |
Class A Shares – Inception 6/27/07 | | | | | | | | | | | | | | | | | | | | |
Without Sales Charge | | | | 2.73 | % | | | | 2.71 | % | | | | 2.61 | % | | | | 4.74 | % |
With Sales Charge | | | | -1.12 | | | | | -1.11 | | | | | 1.82 | | | | | 4.29 | |
Class B Shares – Inception 6/27/07 | | | | | | | | | | | | | | | | | | | | |
Without Sales Charge | | | | 2.26 | | | | | 1.84 | | | | | 1.83 | | | | | 4.04 | |
With Sales Charge | | | | -1.23 | | | | | -1.60 | | | | | 1.61 | | | | | 4.04 | |
Class C Shares – Inception 6/27/07 | | | | | | | | | | | | | | | | | | | | |
Without Sales Charge | | | | 2.26 | | | | | 1.84 | | | | | 1.83 | | | | | 3.96 | |
With Sales Charge | | | | 1.26 | | | | | 0.86 | | | | | 1.83 | | | | | 3.96 | |
Class I Shares – Inception 6/27/07 | | | | 2.76 | | | | | 2.86 | | | | | 2.85 | | | | | 5.00 | |
Class R Shares – Inception 6/27/07 | | | | 2.61 | | | | | 2.45 | | | | | 2.36 | | | | | 4.48 | |
Performance data quoted represents past performance, which is no guarantee of future results. Current performance may be lower or higher than the performance quoted. The principal value and investment return of an investment will fluctuate so that your shares, when redeemed, may be worth more or less than their original cost. You can obtain performance data current to the most recent month end by visiting www.calamos.com.
As of the prospectus dated 2/29/16, the Fund’s gross expense ratio for Class A shares is 1.12%; Class B and C shares is 1.87%; Class I shares is 0.87%; Class R shares is 1.37%. The Fund’s investment advisor has contractually agreed to reimburse Fund expenses through March 1, 2017 to the extent necessary so that Total Annual Fund Operating Expenses (excluding taxes, interest, short interest, short dividend expenses, brokerage commissions, acquired fund fees and expenses, and extraordinary expenses, if any) of Class A, Class B, Class C, Class I and Class R are limited to 0.90%, 1.65%, 1.65%, 0.65% and 1.15% of average net assets, respectively.
| † | Average annual total return measures net investment income and capital gain or loss from portfolio investments as an annualized average assuming reinvestment of dividends and capital gains distributions. Load-adjusted returns are adjusted for the maximum front-end sales load of 3.75% for Class A shares and returns for Class B and C shares have been adjusted for the contingent deferred sales charge (CDSC). |
NOTES:
The graph does not reflect the income taxes that you would pay on fund distributions or the redemption of fund shares. Fund performance includes reinvestment of dividends and adjustment for the maximum sales charge for Class A shares. The performance of other classes will vary from the performance of the class shown based on the difference in sales charges and fees paid by shareholders investing in different share classes.
The Barclays U.S. Aggregate Bond Index is considered generally representative of the investment-grade bond market. Index data shown for the Since Inception Growth of $10,000 graph is from 6/30/07, since comparative index data is only available for full monthly periods. Source: Lipper, Inc.
Index returns assume reinvestment of dividends and do not reflect deduction of fees and expenses. It is not possible to invest directly in an index.
Duration is useful in measuring a bond fund’s sensitivity to changes in interest rates. The longer the duration, the more a bond fund’s price will fluctuate when interest rates change.
Calamos High Income Fund
OVERVIEW
The fund invests primarily in a diversified portfolio of U.S. high yield bonds.
KEY FEATURES
| | ¡ | | Emphasizes total return rather than an exclusive focus on yield; our total-return framework enhances our ability to potentially generate alpha and preserve capital over entire credit cycles | |
| | ¡ | | A disciplined process utilizes proprietary credit research to identify securities most likely to migrate to investment grade, ahead of a rating agency upgrade | |
| | ¡ | | Multi-faceted risk management includes stress testing under various economic assumptions and avoids securities with a high probability of default and low expected recovery from default losses | |
PORTFOLIO FIT
The fund can complement investment grade credit exposure, providing attractive income and total return potential for more risk-tolerant investors.
| | |
| FUND NASDAQ SYMBOLS |
A Shares | | CHYDX |
B Shares | | CAHBX |
C Shares | | CCHYX |
I Shares | | CIHYX |
R Shares | | CHYRX |
| | | |
|
| FUND CUSIP NUMBERS |
A Shares | | 128119815 |
B Shares | | 128119724 |
C Shares | | 128119799 |
I Shares | | 128119781 |
R Shares | | 128119377 |
| | | |
CALAMOS HIGH INCOME FUND
INVESTMENT TEAM DISCUSSION
How has the Fund performed?
For the six-month period ended April 30, 2016, the Fund declined 0.68% (Class A shares at net asset value) versus a gain of 2.34% for the BofA ML BB-B U.S. High Yield Constrained Index and a 1.73% return for the Credit Suisse High Yield Index.
The Fund underperformed versus the BofA ML BB-B U.S. High Yield Constrained Index largely because of our underweight to and selection in the energy sector. The sector lagged early in the reporting period as an oversupply of oil drove prices downward, but after bottoming out in mid-February, oil prices rallied through the end of the reporting period. We were underweight as defaults by energy companies became more likely.
Since its inception on August 2, 1999, the Fund gained 5.91% on an annualized basis (Class A shares at net asset value) versus a 6.47% return for the BofA ML BB-B U.S. High Yield Constrained Index and a 6.93% gain for the Credit Suisse High Yield Index over the same period.
What factors influenced performance?
Beyond the challenges presented by the energy sector discussed above, our selection versus the BofA ML BB-B U.S. High Yield Constrained Index in the telecommunication services sector hindered performance, particularly in the alternative carriers industry. Further, our selection in and underweight to materials also detracted as our light position in the relatively strong-performing diversified metals and mining industry held back results.
Conversely, the Fund benefited to a small extent from selection in financials, namely in diversified real estate, asset management and custody banks, and diversified banks. Further, our selection in information technology contributed, as we were underweight to the lagging semiconductors industry and overweight to the robust electronic components industry versus the BofA ML BB-B U.S. High Yield Constrained Index. Also, our selection in communication equipment outperformed.
How is the fund positioned?
From an economic sector perspective, the Fund’s largest overweight positions are to the consumer discretionary, industrials and health care sectors while its largest underweights are to energy, telecommunication services and utilities. From a credit-quality perspective, the Fund is underweight to the BB credit tier. We believe that the BB tier has the highest amount of risk if interest rates move higher. Similarly, in an effort to reduce to the potential negative effects of future rate increases, we have a slightly lower duration than the benchmark.
In terms of changes during the reporting period, we reduced holdings in energy, consumer staples and telecommunication services. We added to financials, consumer discretionary and industrials.
| | | | |
| 58 | | CALAMOS OPEN-END FAMILY OF FUNDS SEMIANNUAL REPORT | | |
Calamos High Income Fund
What are your closing thoughts for shareholders?
Following the recent rally in high yield, we are concerned that current prices do not fully reflect the number of defaults that may occur as some issuers face declines in revenue and profits. It is our view that tightening lending standards by the banks and reduced market liquidity also will present challenges. We believe that European easing measures and negative interest rates in many parts of the world will help support demand for the high yield asset class. We believe that periods of volatility will crop up throughout 2016, and returns mainly will come from income rather than price appreciation. We think that strategic and risk-tolerant fixed income investors still will find the yields attractive relative to other fixed income securities. It’s our perspective that security selection will continue to be paramount to the relative success of the Fund as we navigate through 2016’s more challenging credit environment.
| | | | |
| SECTOR WEIGHTINGS | |
Consumer Discretionary | | | 26.0 | % |
Industrials | | | 14.2 | |
Health Care | | | 11.2 | |
Materials | | | 9.7 | |
Financials | | | 8.3 | |
Energy | | | 7.6 | |
Information Technology | | | 7.0 | |
Telecommunication Services | | | 6.7 | |
Consumer Staples | | | 4.5 | |
Utilities | | | 1.1 | |
Sector weightings are subject to change daily and are calculated as a percentage of net assets. The table excludes cash or cash equivalents, any government/sovereign bonds or broad based index hedging securities the Fund may hold.
ANNUALIZED RETURN: SINCE INCEPTION (8/2/99) THROUGH 4/30/16
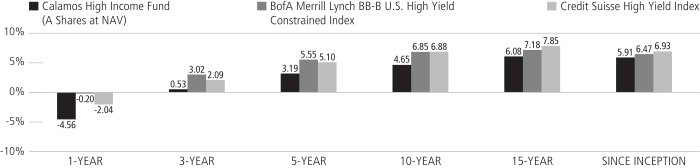
Performance data quoted represents past performance, which is no guarantee of future results. Current performance may be lower or higher than the performance quoted.
The principal value and investment return of an investment will fluctuate so that your shares, when redeemed, may be worth more or less than their original cost. You can obtain performance data current to the most recent month end by visiting www.calamos.com. Average annual total return measures net investment income and capital gain or loss from portfolio investments as an annualized average. All performance shown assumes reinvestment of dividends and capital gains distributions. Performance is for the Fund’s Class A shares at net asset value and does not include the Fund’s maximum front-end sales charge of 4.75%—had it been included, the Fund’s return would have been lower. The Fund also offers Class B, Class C, Class I and Class R shares, the performance of which may vary. Source: State Street Corporation and Mellon Analytical Solutions, LLC.
Calamos High Income Fund
GROWTH OF $10,000: FOR THE 10-YEAR PERIOD ENDED 4/30/16
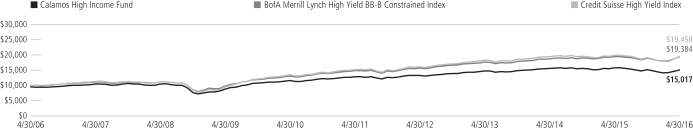
AVERAGE ANNUAL TOTAL RETURN† AS OF 4/30/16
| | | | | | | | | | | | | | | | | | | | |
| | | 6
MONTHS | | 1
YEAR | | 5
YEARS | | 10 YEARS
OR ^SINCE
INCEPTION |
Class A Shares – Inception 8/2/99 | | | | | | | | | | | | | | | | | | | | |
Without Sales Charge | | | | -0.68 | % | | | | -4.56 | % | | | | 3.19 | % | | | | 4.65 | % |
With Sales Charge | | | | -5.39 | | | | | -9.11 | | | | | 2.18 | | | | | 4.15 | |
Class B Shares – Inception 12/21/00 | | | | | | | | | | | | | | | | | | | | |
Without Sales Charge | | | | -1.13 | | | | | -5.28 | | | | | 2.40 | | | | | 4.03 | |
With Sales Charge | | | | -5.97 | | | | | -9.83 | | | | | 2.09 | | | | | 4.03 | |
Class C Shares – Inception 12/21/00 | | | | | | | | | | | | | | | | | | | | |
Without Sales Charge | | | | -1.13 | | | | | -5.30 | | | | | 2.40 | | | | | 3.86 | |
With Sales Charge | | | | -2.10 | | | | | -6.21 | | | | | 2.40 | | | | | 3.86 | |
Class I Shares – Inception 3/1/02 | | | | -0.55 | | | | | -4.32 | | | | | 3.45 | | | | | 4.92 | |
Class R Shares – Inception 3/1/07 | | | | -0.92 | | | | | -4.81 | | | | | 2.90 | | | | | 4.11 | ^ |
Performance data quoted represents past performance, which is no guarantee of future results. Current performance may be lower or higher than the performance quoted. The principal value and investment return of an investment will fluctuate so that your shares, when redeemed, may be worth more or less than their original cost.
As of the prospectus dated 2/29/16, the Fund’s gross expense ratio for Class A shares is 1.29%; Class B shares is 2.03%; C shares is 2.04%; Class I shares is 1.04%; Class R shares is 1.54%.
| † | Average annual total return measures net investment income and capital gain or loss from portfolio investments as an annualized average assuming reinvestment of dividends and capital gains distributions. Performance shown reflects the effects of an expense reimbursement that improved results and was in effect until March 31, 2003. Load-adjusted returns are adjusted for the maximum front-end sales load of 4.75% for Class A shares and returns for Class B and C shares have been adjusted for the contingent deferred sales charge (CDSC). |
NOTES:
The graphs do not reflect the income taxes that you would pay on fund distributions or the redemption of fund shares. Fund performance includes reinvestment of dividends and adjustment for the maximum sales charge for Class A shares. The performance of other classes will vary from the performance of the class shown based on the difference in sales charges and fees paid by shareholders investing in different share classes.
The BofA Merrill Lynch BB-B US High Yield Constrained Index tracks the performance of BB and B rated high yield bonds.
The Credit Suisse High Yield Index is an unmanaged index of high yield debt securities. Index data shown is from 7/31/99, since comparative index data is only available for full monthly periods. Source: Mellon Analytical Solutions, LLC
Index returns assume reinvestment of dividends and do not reflect deduction of fees and expenses. It is not possible to invest directly in an index.
| | | | |
| 60 | | CALAMOS OPEN-END FAMILY OF FUNDS SEMIANNUAL REPORT | | |
Calamos Market Neutral Income Fund
CALAMOS MARKET NEUTRAL INCOME FUND
INVESTMENT TEAM DISCUSSION
How has the Fund performed?
For the six-month period ended April 30, 2016, the Fund returned 0.47% (Class A shares at net asset value) versus a 3.18% return for the Barclays U.S. Government/Credit Bond Index and a 0.07% return for the Citigroup 30-Day U.S. Treasury Bill Index.
For both the 10-year and 5-year periods as of April 30, 2016, the Fund’s A share return ranked in the 10th percentile and 11th percentile, respectively, in the Morningstar Market Neutral category peer group.* The Fund is among the first liquid alternative offerings with more than 25 years of history that blends two main strategies, convertible arbitrage and covered call writing. In addition to offering an attractive historical risk/reward profile, the Fund may enhance long-term portfolio diversification potential, especially versus fixed income securities.
Both strategies utilized in the Fund, convertible arbitrage and covered call writing, contributed positively to performance during a period that included spikes of volatility. Since its inception on September 4, 1990, the Fund gained 6.40% on an annualized basis (Class A shares at net asset value). For the same period, the Barclays U.S. Government/Credit Bond Index gained 6.43% while the Citigroup 30-Day U.S. Treasury Bill Index returned 2.66%.
How did the covered call strategy perform?
In this strategy, we purchase a basket of equities to represent the broad U.S. stock market and sell call options to generate income. We also purchase puts to protect against heavy losses when equities fall. While volatility, on average, was low for the period, it spiked when equities plummeted in January and February of 2016. The covered call writing strategy benefited from the volatility spikes during the period, as we were able to rebalance the portfolio and actively trade options for gains. However, the cost of puts that we purchased was high, which hindered performance. We believe that the high cost of put options reflects investor fears of market downturns, which drives up the price of put options.
How did convertible arbitrage perform?
In the convertible arbitrage strategy, we purchase convertibles bonds and sell short the underlying equities. The strategy also benefited from the volatility spikes during the period when we added value through trading strategies related to convertible arbitrage. As the equity market declined in mid-February, for example, we were able to generate trading profits as we opportunistically adjusted existing hedges while also establishing new ones. The Fund also benefited slightly in December when the Federal Reserve raised short-term interest rates, which allowed us to generate income from cash in our short positions. While widened credit spreads hindered performance, much of this was offset by lower Treasury yields.
| * | Data is as of 4/30/16. Morningstar category percentile rating is based on annualized total return for the 10-year and 5-year periods. Calamos Market Neutral Income Fund Class A shares were in the 40th, 25th, 11th, and 10th percentiles of 152, 104, 66 and 33 funds for the 1-year, 3-year, 5-year and 10-year periods, respectively, for the Morningstar Market Neutral category. |
OVERVIEW
The fund’s core market strategies include covered call writing and convertible arbitrage, complemented by an opportunistic sleeve. Together, these strategies intend to provide the fund with an enhanced potential for risk-managed returns due to their differing responses to volatility.
KEY FEATURES
| | ¡ | | One of the first alternative mutual funds capitalizes on more than three decades of experience in the convertible space | |
| | ¡ | | Lower correlation with most fixed income benchmarks provides a means to dampen volatility | |
| | ¡ | | Risk-management focus blends strategies to achieve the most appropriate risk/reward profile | |
PORTFOLIO FIT
The fund may provide potential diversification, particularly in a low-interest-rate environment.
| | |
| FUND NASDAQ SYMBOLS |
A Shares | | CVSIX |
B Shares | | CAMNX |
C Shares | | CVSCX |
I Shares | | CMNIX |
R Shares | | CVSRX |
| | | |
|
| FUND CUSIP NUMBERS |
A Shares | | 128119203 |
B Shares | | 128119757 |
C Shares | | 128119849 |
I Shares | | 128119880 |
R Shares | | 128119351 |
| | | |
Calamos Market Neutral Income Fund
| | | | |
| SECTOR WEIGHTINGS | |
Information Technology | | | 31.2 | % |
Consumer Discretionary | | | 15.4 | |
Health Care | | | 14.8 | |
Financials | | | 11.3 | |
Energy | | | 7.5 | |
Industrials | | | 7.1 | |
Consumer Staples | | | 5.4 | |
Materials | | | 2.2 | |
Telecommunication Services | | | 2.2 | |
Utilities | | | 1.9 | |
Sector weightings are subject to change daily and are calculated as a percentage of net assets. The table excludes cash or cash equivalents, any government/sovereign bonds or broad based index hedging securities the Fund may hold.
How is the fund positioned?
At the end of the reporting period, the Fund had an equal allocation between convertible arbitrage (50%) and covered call writing (50%) as we believe that both strategies have the potential to perform well going forward. We also believe there is an opportunity to take advantage of high put-option prices with option trading strategies.
What are your closing thoughts for shareholders?
We believe that volatility will continue to periodically spike. Political events, speculation regarding potential future Federal Reserve interest rate hikes, and concerns about a slowing global economy are among the factors that we believe may fuel volatility. We are optimistic that this environment can be favorable to the Fund as it seeks to benefit from swings in volatility, whether from trading opportunities in convertible arbitrage or the potential for more income from the sale of call options in the covered call strategy. As the Fund has lower correlations to other asset classes, we believe the Fund can provide stability to a portfolio in this environment. Additionally, it is our view that when used within a fixed income allocation, the Fund has historically provided bond-like returns with bond-like risk without having bond-like interest rate sensitivity.
ANNUALIZED RETURN: SINCE INCEPTION (9/4/90) THROUGH 4/30/16
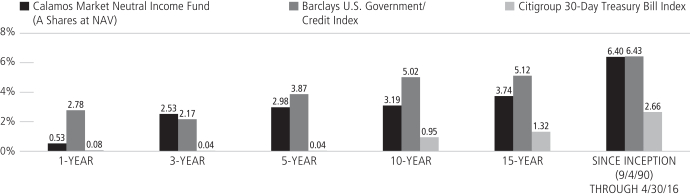
Performance data quoted represents past performance, which is no guarantee of future results. Current performance may be lower or higher than the performance quoted.
The principal value and investment return of an investment will fluctuate so that your shares, when redeemed, may be worth more or less than their original cost. You can obtain performance data current to the most recent month end by visiting www.calamos.com. Average annual total return measures net investment income and capital gain or loss from portfolio investments as an annualized average. All performance shown assumes reinvestment of dividends and capital gains distributions. Performance is for the Fund’s Class A shares at net asset value and does not include the Fund’s maximum front-end sales charge of 4.75%—had it been included, the Fund’s return would have been lower. The Fund also offers Class B, Class C, Class I and Class R shares, the performance of which may vary. Source: State Street Corporation, Lipper, Inc., and Mellon Analytical Solutions, LLC.
| | | | |
| 62 | | CALAMOS OPEN-END FAMILY OF FUNDS SEMIANNUAL REPORT | | |
Calamos Market Neutral Income Fund
GROWTH OF $10,000: FOR THE 10-YEAR PERIOD ENDED 4/30/16
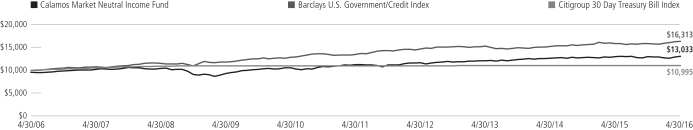
AVERAGE ANNUAL TOTAL RETURN† AS OF 4/30/16
| | | | | | | | | | | | | | | | | | | | |
| | | 6
MONTHS | | 1
YEAR | | 5
YEARS | | 10 YEARS
OR ^SINCE
INCEPTION |
Class A Shares – Inception 9/4/90 | | | | | | | | | | | | | | | | | | | | |
Without Sales Charge | | | | 0.47 | % | | | | 0.53 | % | | | | 2.98 | % | | | | 3.19 | % |
With Sales Charge | | | | -4.29 | | | | | -4.22 | | | | | 1.99 | | | | | 2.68 | |
Class B Shares – Inception 9/11/00 | | | | | | | | | | | | | | | | | | | | |
Without Sales Charge | | | | 0.12 | | | | | -0.17 | | | | | 2.21 | | | | | 2.57 | |
With Sales Charge | | | | -4.81 | | | | | -5.09 | | | | | 1.84 | | | | | 2.57 | |
Class C Shares – Inception 2/16/00 | | | | | | | | | | | | | | | | | | | | |
Without Sales Charge | | | | 0.16 | | | | | -0.19 | | | | | 2.22 | | | | | 2.42 | |
With Sales Charge | | | | -0.82 | | | | | -1.17 | | | | | 2.22 | | | | | 2.42 | |
Class I Shares – Inception 5/10/00 | | | | 0.60 | | | | | 0.79 | | | | | 3.23 | | | | | 3.45 | |
Class R Shares – Inception 3/1/07 | | | | 0.34 | | | | | 0.29 | | | | | 2.72 | | | | | 2.64 | ^ |
Performance data quoted represents past performance, which is no guarantee of future results. Current performance may be lower or higher than the performance quoted. The principal value and investment return of an investment will fluctuate so that your shares, when redeemed, may be worth more or less than their original cost.
As of the prospectus dated 2/29/16, the Fund’s gross expense ratio for Class A shares is 1.23%; Class B and C shares is 1.98%; Class I shares is 0.98%; Class R shares is 1.48%.
| † | Average annual total return measures net investment income and capital gain or loss from portfolio investments as an annualized average assuming reinvestment of dividends and capital gains distributions. Performance shown reflects the effects of an expense reimbursement that improved results and was in effect until March 31, 2000. Load-adjusted returns are adjusted for the maximum front-end sales load of 4.75% for Class A shares and returns for Class B and C shares have been adjusted for the contingent deferred sales charge (CDSC). |
NOTES:
The graphs do not reflect the income taxes that you would pay on fund distributions or the redemption of fund shares. Fund performance includes reinvestment of dividends and adjustment for the maximum sales charge for Class A shares. The performance of other classes will vary from the performance of the class shown based on the difference in sales charges and fees paid by shareholders investing in different share classes.
The Barclays U.S. Government/Credit Index is comprised of long-term government and investment-grade corporate debt securities and is generally considered representative of the performance of the broad U.S. bond market. Index data shown for the Annualized Returns Since Inception graph is from 8/31/90, since comparative index data is only available for full monthly periods. Source: Lipper, Inc.
The Citigroup 30-Day Treasury Bill Index is an unmanaged index generally considered representative of the performance of short-term money instruments. U.S. Treasury Bills are backed by the full faith and credit of the U.S. government and offer a guarantee as to the repayment of principal and interest at maturity. Index data shown for the Annualized Returns Since Inception graph is from 8/31/90, since comparative index data is only available for full monthly periods. Source: Mellon Analytical Solutions, LLC
Index returns assume reinvestment of dividends and do not reflect deduction of fees and expenses. It is not possible to invest directly in an index.
Calamos Hedged Equity Income Fund
OVERVIEW
The fund is an alternative strategy that invests in equities and sells options with the aim of achieving the total return of equity markets with lower volatility. It utilizes a covered call strategy, which involves investing in a diversified portfolio of equities while using options to generate income and manage risk.
KEY FEATURES
| | ¡ | | Draws upon almost a decade of experience in covered call writing and two decades of equity investing | |
| | ¡ | | Option-based risk-management strategy attempts to lower the volatility of equity investments | |
| | ¡ | | An alternative approach potentially provides upside participation in equity markets while limiting downside exposure | |
PORTFOLIO FIT
The fund provides an alternative strategy that can generate income and provide equity exposure with potentially lower volatility than equities.
| | |
| FUND NASDAQ SYMBOLS |
A Shares | | CAHEX |
C Shares | | CCHEX |
I Shares | | CIHEX |
R Shares | | CRHEX |
|
| FUND CUSIP NUMBERS |
A Shares | | 128120698 |
C Shares | | 128120680 |
I Shares | | 128120672 |
R Shares | | 128120664 |
CALAMOS HEDGED EQUITY INCOME FUND
INVESTMENT TEAM DISCUSSION
How has the Fund performed?
For the six-month period ended April 30, 2016, Calamos Hedged Equity Income Fund dipped 0.19% (Class A shares at net asset value) versus the S&P 500 Index gain of 0.43% and the Barclays U.S. Aggregate Bond Index return of 2.82%. Since its inception on December 31, 2014, the Fund gained 0.36% on an annualized basis (Class A shares at net asset value) versus 2.35% for the S&P 500 Index and 2.98% for the Barclays U.S. Aggregate Bond Index.
In this strategy, we utilize covered call writing in which we sell call options for income and buy a basket of equities that represents the broad stock market. The selling prices of call options tend to be higher when volatility is higher. While there were spikes of volatility during the period, especially in February, volatility on average was low, which inhibited performance.
What factors influenced performance?
Volatility, as represented by the CBOE Volatility Index (VIX), ended the period at 15.70 from 15.07 six months earlier, well below the long-term average of about 20. Still, we believe the beginning and end points aren’t representative of some of the spikes in volatility during the period, in particular the high of 28.14 on February 11. While low average volatility inhibited the income we received from selling call options, the Fund benefited from changes in volatility, which allowed us to rebalance the portfolio and actively trade the options for gains.
In this strategy, we also purchase put options that may limit losses when equities fall. However, we found that put options were expensive, especially relative to the price of call options we sell, because of investor fears of equity losses. To illustrate, Credit Suisse Group AG’s “Fear Barometer,” which compares the relative value of call and put options hit a new high in April, according to Bloomberg. We have utilized other hedging tools using put option strategies that we feel may be more effective than straight purchases of put options.
How is the fund positioned?
Option Positioning. The call and put quantities are frequently adjusted to maintain a balanced risk and reward profile. At the end of April, the portfolio was positioned with 60% calls written against the equity basket versus a 39% put hedge. Additionally, the calls sold were roughly at the money with 141 days to expiration, while the puts purchased averaged 3.8% out of the money with 57 days to expiration.
Sector Positioning. At the end of the reporting period, the equity basket was slightly overweight to the information technology and energy sectors. We were slightly underweight to the industrials and consumer discretionary sectors.
Market Cap Positioning. The Fund maintained a heavier weight to larger cap (>$22 billion) holdings versus the S&P 500 Index and lighter weights to small cap ($1 billion to $7 billion) and mid cap (>$7 billion to $22 billion) names.
| | | | |
| 64 | | CALAMOS OPEN-END FAMILY OF FUNDS SEMIANNUAL REPORT | | |
Calamos Hedged Equity Income Fund
What closing thoughts do you have for shareholders?
We see elevated levels of volatility in the markets because of election year politics in the U.S., instability in commodity prices, political uncertainty outside the U.S., and concerns about a slowing global economy. We are optimistic that this environment can be favorable for the Fund. The Fund derives benefits from “volatility in volatility,” whether from the rebalancing opportunities higher volatility provides to our option strategies or the potential to receive more income from call options.
| | | | |
| SECTOR WEIGHTINGS | |
Information Technology | | | 20.3 | % |
Financials | | | 15.1 | |
Health Care | | | 14.0 | |
Consumer Discretionary | | | 12.0 | |
Consumer Staples | | | 9.8 | |
Industrials | | | 9.0 | |
Energy | | | 7.5 | |
Utilities | | | 3.4 | |
Telecommunication Services | | | 2.8 | |
Other | | | 4.5 | |
Sector weightings are subject to change daily and are calculated as a percentage of net assets. The table excludes cash or cash equivalents, any government/sovereign bonds or broad based index hedging securities the Fund may hold.
Calamos Hedged Equity Income Fund
GROWTH OF $10,000: SINCE INCEPTION (12/31/14) THROUGH 4/30/16
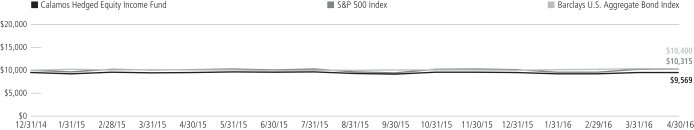
AVERAGE ANNUAL TOTAL RETURN† AS OF 4/30/16
| | | | | | | | | | | | | | | |
| | | 6 MONTHS | | 1 YEAR | | SINCE
INCEPTION |
Class A Shares – Inception 12/31/2014 | | | | | | | | | | | | | | | |
Without Sales Charge | | | | -0.19 | % | | | | 0.08 | % | | | | 0.36 | % |
With Sales Charge | | | | -4.94 | | | | | -4.67 | | | | | -3.25 | |
Class C Shares – Inception 12/31/2014 | | | | | | | | | | | | | | | |
Without Sales Charge | | | | -0.61 | | | | | -0.71 | | | | | -0.39 | |
With Sales Charge | | | | -1.58 | | | | | -1.69 | | | | | -0.39 | |
Class I Shares – Inception 12/31/2014 | | | | -0.08 | | | | | 0.31 | | | | | 0.61 | |
Class R Shares – Inception 12/31/2014 | | | | -0.43 | | | | | -0.29 | | | | | 0.08 | |
Performance data quoted represents past performance, which is no guarantee of future results. Current performance may be lower or higher than the performance quoted. The principal value and investment return of an investment will fluctuate so that your shares, when redeemed, may be worth more or less than their original cost. You can obtain performance data current to the most recent month end by visiting www.calamos.com.
As of the prospectus dated 2/29/16, the Fund’s gross expense ratio for Class A shares is 3.06%; Class C shares is 3.80%; Class I shares is 2.81%; Class R shares is 3.30%. The Fund’s investment advisor has contractually agreed to reimburse Fund expenses through March 1, 2017, to the extent necessary so that Total Annual Fund Operating Expenses (excluding taxes, interest, short interest, short dividend expenses, brokerage commissions, acquired fund fees and expenses, and extraordinary expenses, if any) of Class A, Class C, Class I and Class R are limited to 1.25%, 2.00%, 1.00% and 1.50% of average net assets, respectively.
| † | Average annual total return measures net investment income and capital gain or loss from portfolio investments as an annualized average assuming reinvestment of dividends and capital gains distributions. Load-adjusted returns are adjusted for the maximum front-end sales load of 4.75% for Class A shares. Returns for Class C shares have been adjusted for the contingent deferred sales charge (CDSC). |
NOTES:
The S&P 500 Index is an unmanaged index generally considered representative of the U.S. stock market.
The Barclays U.S. Aggregate Bond Index is considered generally representative of the investment-grade bond market. Index data shown for the Since Inception Growth of $10,000 graph is from 6/30/07, since comparative index data is only available for full monthly periods. Source: Lipper, Inc.
The CBOE Volatility Index (VIX) is a leading measure of market expectations of near-term volatility conveyed by S&P 500 Index (SPX) option prices.
Index returns assume reinvestment of dividends and do not reflect deduction of fees and expenses. It is not possible to invest directly in an index.
| | | | |
| 66 | | CALAMOS OPEN-END FAMILY OF FUNDS SEMIANNUAL REPORT | | |
Calamos Phineus Long/Short Fund
CALAMOS PHINEUS LONG/SHORT FUND
INVESTMENT TEAM DISCUSSION
What is your rationale behind launching the Calamos Phineus Long/Short Fund?
Calamos Phineus Long/Short Fund offers our clients access to an institutionally managed global equity portfolio that has outperformed its indexes over its 14-year history by the same portfolio manager. This Fund is an alternative strategy because we are able to generate gains by shorting stocks, where the Fund gains when stocks we short fall, and making traditional long-only investments, where the Fund gains when stocks we buy rise. Given a market environment of sluggish growth, low interest rates and sporadic episodes of high volatility, the Fund offers a compelling alternative in a strategy that has generated returns in excess of the S&P 500 Index and the MSCI World Index with lower volatility.
What is the investment approach?
The Fund primarily invests globally in publicly listed equities of issuers of all market capitalizations that operate in the knowledge-based sectors such as technology, communications and media, as well as financial services and healthcare and other investment companies. The Fund seeks to achieve its investment objective through the use of long and short investing. Long investing generally involves buying a security expecting to profit from an increase in its price. Short investing generally involves selling a security that the Fund does not own, expecting to profit from a decline in its price at a later time.
The Fund pursues a fundamental, global approach that incorporates a blend of top-down and bottom-up considerations. The advantages of its investment process are based upon: 1) a comprehensive assessment of what drives share prices; 2) how companies and industries are analyzed; and 3) the flexible management of style, capitalization and country factors. We believe that flexible asset allocation across the global equity universe, with less emphasis upon the traditional role of benchmarks, provides the potential for excess returns. The approach is primarily derived from its assessment of corporate and economic fundamentals. Equally, the Fund’s strategy allows for all investment styles (for example, growth versus value, small versus large capitalization) to be considered depending upon a company’s business model, prevailing market conditions and the economic cycle.
How has the Fund performed?
For the six-month period ended April 30, 2016, Calamos Phineus Long/Short Fund (and for the period prior to April 5, 2016, of its predecessor fund) declined 5.95% (Class A shares at net asset value) versus the HFRI Equity Hedge Index loss of 1.64%. The MSCI World Index declined 0.74% and the S&P 500 Index rose 0.43% over the period.
During the period, we witnessed an unusual degree of volatility and uncertainty. While the S&P 500 Index went mostly unchanged over this period, most non-U.S. markets suffered notable declines. We believe much of this reflects declining profits in the U.S., concern over the timing of future rate hikes by the Federal Reserve, and a growing awareness of risks in China and the emerging economies. We believe those reasons, combined with the impact of a strong U.S. dollar, have negatively affected the non-U.S. sales and earnings of U.S. companies.
FUND OVERVIEW
The fund seeks strong risk-adjusted and absolute returns across the global equity universe. The fund uses a global long/short strategy to invest in publicly listed equity securities.
KEY FEATURES
| | ¡ | | Fundamental global approach blends top-down and bottom-up considerations | |
| | ¡ | | Flexible asset allocation allows for all investment styles, market caps and geographic regions depending on the market environment | |
| | ¡ | | Comprehensive approach assesses stock, industry, style, country and market factors | |
| | ¡ | | Knowledge-based industry concentration includes technology, communications, media, financials and health care | |
PORTFOLIO FIT
The fund seeks to provide strong risk-adjusted returns via an alternative solution that complements and diversifies a global or U.S. equity allocation.
| | |
| FUND NASDAQ SYMBOLS |
A Shares | | CPLSX |
C Shares | | CPCLX |
I Shares | | CPLIX |
| | | |
|
| FUND CUSIP NUMBERS |
A Shares | | 128120656 |
C Shares | | 128120649 |
I Shares | | 128120631 |
| | | |
Calamos Phineus Long/Short Fund
| | | | |
| SECTOR WEIGHTINGS | |
Financials | | | 26.6 | % |
Information Technology | | | 8.0 | |
Industrials | | | 6.0 | |
Energy | | | 5.5 | |
Consumer Discretionary | | | 4.9 | |
Other | | | 29.7 | |
Sector weightings are subject to change daily and are calculated as a percentage of net assets. The table excludes cash or cash equivalents, any government/sovereign bonds or broad based index hedging securities the Fund may hold.
Since its inception on May 1, 2002 through April 30, 2016, the Fund (and for the period prior to April 5, 2016, of its predecessor fund) returned 11.28% (Class A shares at net asset value) and strongly outperformed both the MSCI World Index and S&P 500 Index, which returned 6.61% and 6.91%, respectively, over the same period.
What factors influenced performance over the period?
Selection in the energy and information technology sectors provided the largest contribution, while long exposure in financials and airlines hindered performance. As of April 30, 2016, notable contributors during the period included long positions in energy, including Gulfport Energy Corp. (1.7%), Exxon Mobil Corp. (1.5%), and TOTAL, SA (1.5%). Selection in information technology also helped through investments in PayPal Holdings, Inc. (2.4%) and Baidu, Inc. (2.8%). Detractors included long positions in financials such as Citigroup, Inc. (3.0%), Morgan Stanley (3.3%) and Bank of America Corp. (3.3%). Our long airline investments in American Airlines Group, Inc. (2.4%) and United Continental Holdings, Inc. (1.9%) also hindered performance.
How is the Fund positioned?
We increased our long exposure, relative to our short exposure, over the period because we believe market participants have an overly negative outlook for the U.S. economy. We think the economy remains on sound footing and we believe the recent fluctuating equity performance represents a typical mid-cycle pause in a long expansion. Lower oil prices and the strong U.S. dollar drove down profits in recent quarters, which contributed to the pervasive mood of uncertainty. We think these impediments will recede this year.
We think another source of market volatility was the timing of the Federal Reserve’s next interest-rate hike. The Federal Reserve said it intends to be gradual with increases to avoid disrupting the U.S. expansion. More recently, the Federal Reserve said that it would incorporate the risks of a global economic slowdown into its decisions. This increases the likelihood that the pace of rate increases will be unhurried. The Fed seems to be saying that it will only raise rates when confident that increases will not lead to a stronger U.S. dollar. This implies that the rate cycle will be highly dependent upon the strength of the global economy.
Early in the six-month period, we added several financial names to the long portfolio because we believe they offer value and timely exposure to renewed economic confidence. Financials will be the main beneficiaries of the inevitable increase in rates as confidence returns to the investment community. The team also added selectively to the major oil companies. We do not expect a significant recovery in oil prices, but company managers are embracing the new price regime. They are increasingly focused on reducing costs and sustaining cash flows to support dividend payouts. There could be substantial upside for oil companies as dividend yields are well above the market average and historical norms.
On the short side, we added new positions in health care and consumer staples. We think the major U.S. drug companies are vulnerable to U.S. presidential politics and the negative impact of market pricing will be greater than generally understood. With the consumer staples stocks, market participants may be overpaying for their defensive characteristics rather than their growth potential, which we believe is limited. We believe that these stocks have become overvalued because of the trauma of the global financial crisis and the misplaced perception that the U.S. economy is unusually fragile.
| | | | |
| 68 | | CALAMOS OPEN-END FAMILY OF FUNDS SEMIANNUAL REPORT | | |
Calamos Phineus Long/Short Fund
What are your closing thoughts for the coming year?
We believe collapsing oil prices, tighter U.S. monetary policy and the uncertain health of the Chinese economy played on the nerves of investors for the first six weeks of 2016. All these concerns have shown distinct improvement since February.
Into spring, investors wondered if we had seen the bottom of the earnings cycle. At the same time, Federal Reserve Chair Janet Yellen promised to go easy for an extended period, or at least until there is more visible strength across the global economy. This would be a favorable mix to be sure: an acceleration of the profit cycle and an easy Fed. A strong global economy would help as well. If the U.S. expansion is sustained through 2018, while Europe and select emerging economies can struggle forward rather than backward, it’s our belief that investors are underestimating the potential for a normalization of economic activity.
All of this supports the bullish case for equities. The world has suffered a series of rolling-debt crises since 2008 and we believe we are approaching the end of this course. If a modicum of healthy growth can emerge, we think the upside for equities is underestimated. This is the scenario we favor. In our view, it is time to focus on what can go right for the global economy and the coming year could be a respectable one for U.S. and European stocks in particular.
Calamos Phineus Long/Short Fund
ANNUALIZED RETURN: SINCE INCEPTION (5/1/02) THROUGH 4/30/16
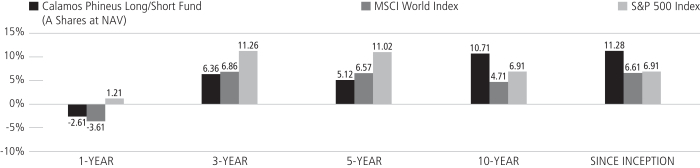
Performance data quoted represents past performance, which is no guarantee of future results. Current performance may be lower or higher than the performance quoted.
The principal value and investment return of an investment will fluctuate so that your shares, when redeemed, may be worth more or less than their original cost. You can obtain performance data current to the most recent month end by visiting www.calamos.com. Average annual total return measures net investment income and capital gain or loss from portfolio investments as an annualized average. All performance shown assumes reinvestment of dividends and capital gains distributions. Performance is for the Fund’s Class A shares at net asset value and does not include the Fund’s maximum front-end sales charge of 4.75%—had it been included, the Fund’s return would have been lower. The Fund also offers Class C and Class I shares, the performance of which may vary. Source: Morningstar, Inc.
The performance shown for periods prior to April 5, 2016 is the performance of a predecessor investment vehicle (the “Predecessor Fund”). The Predecessor Fund was reorganized into the Fund on April 5, 2016, the date upon which the Fund commenced operations. On October 1, 2015, the parent company of Calamos Advisors, purchased Phineus Partners LP, the prior investment adviser to the Predecessor Fund (“Phineus”), and Calamos Advisors served as the Predecessor Fund’s investment adviser between October 1, 2015 until it was reorganized into the Fund. Phineus and Calamos Advisors managed the Predecessor Fund using investment policies, objectives, guidelines and restrictions that were in all material respects equivalent to those of the Fund. Phineus and Calamos Advisors managed the Predecessor Fund in this manner either directly or indirectly by investing all of the Predecessor Fund’s assets in a master fund structure. The Predecessor Fund performance information has been adjusted to reflect Class A, C and I share expenses. However, the Predecessor Fund was not a registered mutual fund and thus was not subject to the same investment and tax restrictions as the Fund. If it had been, the Predecessor Fund’s performance may have been lower.
| | | | |
| 70 | | CALAMOS OPEN-END FAMILY OF FUNDS SEMIANNUAL REPORT | | |
Calamos Phineus Long/Short Fund
GROWTH OF $10,000: FOR THE 10-YEAR PERIOD ENDED 4/30/16
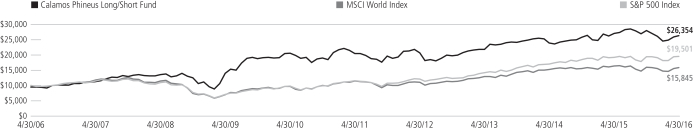
AVERAGE ANNUAL TOTAL RETURN† AS OF 4/30/16
| | | | | | | | | | | | | | | |
| | | 1 YEAR | | 5 YEARS | | 10 YEARS |
Class A Shares – Inception 5/1/02 | | | | | | | | | | | | | | | |
Without Sales Charge | | | | -2.61 | % | | | | 5.12 | % | | | | 10.71 | % |
With Sales Charge | | | | -7.24 | | | | | 4.10 | | | | | 10.18 | |
Class C Shares – Inception 5/1/02 | | | | | | | | | | | | | | | |
Without Sales Charge | | | | -3.35 | | | | | 4.33 | | | | | 9.89 | |
With Sales Charge | | | | -4.31 | | | | | 4.33 | | | | | 9.89 | |
Class I Shares – Inception 5/1/02 | | | | -2.37 | | | | | 5.38 | | | | | 10.99 | |
Performance data quoted represents past performance, which is no guarantee of future results. Current performance may be lower or higher than the performance quoted. The principal value and investment return of an investment will fluctuate so that your shares, when redeemed, may be worth more or less than their original cost. You can obtain performance data current to the most recent month end by visiting www.calamos.com.
The performance shown for periods prior to April 5, 2016 is the performance of a predecessor investment vehicle (the “Predecessor Fund”). The Predecessor Fund was reorganized into the Fund on April 5, 2016, the date upon which the Fund commenced operations. On October 1, 2015, the parent company of Calamos Advisors, purchased Phineus Partners LP, the prior investment adviser to the Predecessor Fund (“Phineus”), and Calamos Advisors served as the Predecessor Fund’s investment adviser between October 1, 2015 until it was reorganized into the Fund. Phineus and Calamos Advisors managed the Predecessor Fund using investment policies, objectives, guidelines and restrictions that were in all material respects equivalent to those of the Fund. Phineus and Calamos Advisors managed the Predecessor Fund in this manner either directly or indirectly by investing all of the Predecessor Fund’s assets in a master fund structure. The Predecessor Fund performance information has been adjusted to reflect Class A, C and I share expenses. However, the Predecessor Fund was not a registered mutual fund and thus was not subject to the same investment and tax restrictions as the Fund. If it had been, the Predecessor Fund’s performance may have been lower.
As of the prospectus dated 4/5/16, the Fund’s gross expense ratio for Class A shares is 3.65%; Class C shares is 4.40%; Class I shares is 3.40%.
The Fund’s investment advisor has contractually agreed to reimburse Fund expenses through 3/31/18, to the extent necessary so that Total Annual Fund Operating Expenses (excluding taxes, interest, short interest, short dividend expenses, brokerage commissions, acquired fund fees and expenses, and extraordinary or non-routine expenses, if any) of Class A, Class C and Class I are limited to 2.00%, 2.75% and 1.75% of average net assets, respectively.
The gross expense ratio is inclusive of the 1.25% management fee, short dividend and interest expenses (Class A: 1.12%, Class C: 1.12%, Class I: 1.12%); acquired fund fees, other expenses and 12b-1 fees (Class A: 1.28%, Class C: 2.03%); acquired fund fees and other expenses (Class I: 1.03%).
| † | Average annual total return measures net investment income and capital gain or loss from portfolio investments as an annualized average assuming reinvestment of dividends and capital gains distributions. Load-adjusted returns are adjusted for the maximum front-end sales load of 4.75% for Class A shares. Returns for Class C shares have been adjusted for the contingent deferred sales charge (CDSC). |
Calamos Phineus Long/Short Fund
NOTES:
The graph does not reflect the income taxes that you would pay on fund distributions or the redemption of fund shares. Fund performance includes reinvestment of dividends and adjustment for the maximum sales charge for Class A shares. The performance of other classes will vary from the performance of the class shown based on the difference in sales charges and fees paid by shareholders investing in different share classes.
The MSCI World Index (U.S. Dollars) is a market-capitalization weighted index composed of companies representative of
the market structure of developed market countries in North America, Europe and the Asia/Pacific region. Since inception data for the index is shown from 4/30/02 since data is only available for full monthly periods. Source: Lipper, Inc.
The S&P 500 Index is an unmanaged index generally considered representative of the U.S. stock market. Source: Lipper, Inc.
The HFRI Equity Hedge Index consists of funds where portfolio managers maintain long and short positions in primarily equity and derivative securities.
Index returns assume reinvestment of dividends and do not reflect deduction of fees and expenses. It is not possible to invest directly in an index.
| | | | |
| 72 | | CALAMOS OPEN-END FAMILY OF FUNDS SEMIANNUAL REPORT | | |
Calamos Long/Short Fund
CALAMOS LONG/SHORT FUND
INVESTMENT TEAM DISCUSSION
How has the Fund performed?
For the six-month period ended April 30, 2016, Calamos Long/Short Fund declined 4.38% (Class A shares at net asset value) versus the HFRI Equity Hedge Index loss of 1.64% and S&P 500 Index return of 0.43%.
The six months under review has witnessed what we believe to be an unusual degree of volatility and uncertainty during the reporting period. While the S&P 500 Index went mostly unchanged over this period, most overseas markets suffered notable declines. We attribute much of this to the profit recession in the U.S., concerns over the timing of future interest rate hikes by the Federal Reserve, and a growing awareness of deflationary risks in China and other emerging economies. These factors, combined with the impact of a strong U.S. dollar, appeared to have negatively affected the foreign sales and earnings of U.S. companies.
The Fund held up well during the market’s rapid sell-off at the beginning of 2016, but, in the rebound, the portfolio lagged the S&P 500 Index as value stocks advanced.
The Fund is an alternative strategy, where we take long positions on individual companies that gain when stocks rise and short positions that gain when stocks fall. We believe the Fund provides an opportunity for consistent performance under various market conditions. Our focus is on fundamental research, a consistent portfolio management process, and a mission to generate attractive risk-adjusted returns for our investors. Commencing on October 6, 2015, a new management team led by Michael Grant assumed portfolio responsibilities for the Fund.
What factors influenced performance over the period?
Relative to the S&P 500 Index, selection in the energy and information technology sectors provided the largest contributions, while long exposure in financials and airlines hindered performance. As of April 30, 2016, notable contributors during the period included long positions in energy, including Gulfport Energy Corp. (2.4%), and TOTAL, SA (2.1%). Selection in information technology also helped through investments in Facebook, Inc. (3.1%), PayPal Holdings, Inc. (2.5%) and Baidu, Inc. (3.1%). Detractors included long positions in financials such as Citigroup, Inc. (3.4%), Morgan Stanley (3.7%) and Bank of America Corp. (3.7%). Our long airline investments in American Airlines Group, Inc. (2.7%) and United Continental Holdings, Inc. (2.1%) also hindered performance.
How is the Fund positioned?
We increased our long exposure, relative to our short exposure, over the period because we believe market participants have an overly negative outlook for the U.S. economy. We believe the economy remains on sound footing and we believe the recent fluctuating equity performance represents a typical mid-cycle pause in a long expansion. Lower oil prices and the strong U.S. dollar drove down profits in recent quarters, which, in our view, contributed to the pervasive mood of uncertainty. We think these impediments will recede this year.
OVERVIEW
This fund invests primarily in U.S. equity securities and is diversified across key sectors.
KEY FEATURES
| | ¡ | | Fundamental global approach blends top-down and bottom-up considerations | |
| | ¡ | | Flexible asset allocation allows for all investment styles, market caps and geographic regions depending on the market environment | |
| | ¡ | | Comprehensive approach assesses stock, industry, style, country and market factors | |
| | ¡ | | Knowledge-based industry concentration includes technology, communications, media, financials and health care | |
PORTFOLIO FIT
The fund seeks to provide an alternative solution to complement and diversify a long-only portfolio. It has the potential to lower overall portfolio beta and create superior risk-adjusted returns.
| | |
| FUND NASDAQ SYMBOLS |
A Shares | | CALSX |
C Shares | | CCLSX |
I Shares | | CILSX |
R Shares | | CRLSX |
|
| FUND CUSIP NUMBERS |
A Shares | | 128120607 |
C Shares | | 128120706 |
I Shares | | 128120805 |
R Shares | | 128120888 |
Calamos Long/Short Fund
| | | | |
| SECTOR WEIGHTINGS | |
Financials | | | 34.7 | % |
Information Technology | | | 14.1 | |
Consumer Discretionary | | | 12.7 | |
Energy | | | 7.6 | |
Health Care | | | 6.8 | |
Industrials | | | 4.8 | |
Other | | | 5.4 | |
| | | | | |
Sector weightings are subject to change daily and are calculated as a percentage of net assets. The table excludes cash or cash equivalents, any government/sovereign bonds or broad based index hedging securities the Fund may hold.
Another source of market volatility was the timing of the Federal Reserve’s next interest-rate hike. The Federal Reserve stated its intention to be gradual with increases to avoid disrupting the U.S. expansion. More recently, the Federal Reserve said it would factor the risks of a global economic slowdown into its decisions. This increases the likelihood that the pace of rate increases will be unhurried. Given the Fed’s statements, it is our view that it will only raise rates when confident that rate increases will not lead to a stronger U.S. dollar. Further, we believe this implies that the rate cycle will be highly dependent upon the strength of the global economy.
Early in the six-month period, we added several financial names to the long portfolio because we believe they offer value and timely exposure to renewed economic confidence. Financials will be the main beneficiaries of the inevitable increase in rates as confidence returns to the investment community. We also added selectively to major oil companies. While we do not expect a significant recovery in oil prices, it appears that oil company managers are embracing the new price regime and that they are increasingly focused on reducing costs and sustaining cash flows to support dividend payouts. We believe there could be substantial upside for oil companies as dividend yields are well above the market average and historical norms.
On the short side, we added new positions in health care and consumer staples during the period. We think the major U.S. drug companies are vulnerable to U.S. presidential politics and the negative impact of market pricing will be greater than generally understood. With the consumer staples stocks, we believe market participants may be overpaying for their defensive characteristics rather than their growth potential, which we believe to be limited. We believe that these stocks have become overvalued because of the trauma of the global financial crisis and the misplaced perception that the U.S. economy is unusually fragile.
What are your closing thoughts for the coming year?
Collapsing oil prices, tighter U.S. monetary policy and the uncertain health of the Chinese economy appeared to play on the nerves of investors for the first six weeks of 2016. All these concerns have shown distinct improvement since February.
Into spring, investors appeared to wonder if we had seen the bottom of the earnings cycle. At the same time, Federal Reserve Chair Janet Yellen promised to go easy on future rate hikes for an extended period, or at least until there is more visible strength across the global economy. If our understanding proves correct, we believe that an acceleration of the profit cycle and a dovish Fed, coupled with a strong global economy would be a favorable scenario. If the U.S. expansion is sustained through 2018, while Europe and select emerging economies can struggle forward rather than backward, it’s our belief that investors are underestimating the potential for a normalization of economic activity.
All of this supports our bullish case for equities. The world has suffered a series of rolling-debt crisis since 2008, and it is our view that we are approaching the end of this course. Assuming a modicum of healthy growth can emerge, we believe the upside for equities is underestimated. This is the scenario we favor. In our view, it is time to focus on what can go right for the global economy and the coming year could be a respectable one for U.S. and European stocks in particular.
| | | | |
| 74 | | CALAMOS OPEN-END FAMILY OF FUNDS SEMIANNUAL REPORT | | |
Calamos Long/Short Fund
GROWTH OF $10,000: SINCE INCEPTION (6/3/13) THROUGH 4/30/16
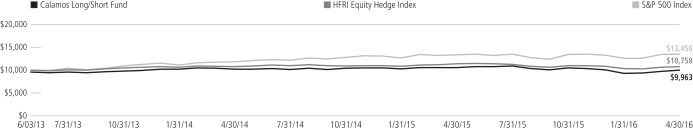
AVERAGE ANNUAL TOTAL RETURN† AS OF 4/30/16
| | | | | | | | | | | | | | | |
| | | 6
MONTHS | | 1
YEAR | | SINCE
INCEPTION |
Class A Shares – Inception 6/3/2013 | | | | | | | | | | | | | | | |
Without Sales Charge | | | | -4.38 | % | | | | -5.62 | % | | | | 1.56 | % |
With Sales Charge | | | | -8.89 | | | | | -10.09 | | | | | -0.13 | |
Class C Shares – Inception 6/3/2013 | | | | | | | | | | | | | | | |
Without Sales Charge | | | | -4.74 | | | | | -6.34 | | | | | 0.81 | |
With Sales Charge | | | | -5.70 | | | | | -7.28 | | | | | 0.81 | |
Class I Shares – Inception 6/3/2013 | | | | -4.17 | | | | | -5.32 | | | | | 1.84 | |
Class R Shares – Inception 6/3/2013 | | | | -4.40 | | | | | -5.73 | | | | | 1.37 | |
Performance data quoted represents past performance, which is no guarantee of future results. Current performance may be lower or higher than the performance quoted. The principal value and investment return of an investment will fluctuate so that your shares, when redeemed, may be worth more or less than their original cost. You can obtain performance data current to the most recent month end by visiting www.calamos.com.
As of the prospectus dated 2/29/16, the Fund’s gross expense ratio for Class A shares is 2.30%; Class C shares is 3.05%; Class I shares is 2.06%; Class R shares is 2.55%.
| † | Average annual total return measures net investment income and capital gain or loss from portfolio investments as an annualized average assuming reinvestment of dividends and capital gains distributions. Load-adjusted returns are adjusted for the maximum front-end sales load of 4.75% for Class A shares. Returns for Class C shares have been adjusted for the contingent deferred sales charge (CDSC). |
NOTES:
The graph does not reflect the income taxes that you would pay on fund distributions or the redemption of fund shares. Fund performance includes reinvestment of dividends and adjustment for the maximum sales charge for Class A shares. The performance of other classes will vary from the performance of the class shown based on the difference in sales charges and fees paid by shareholders investing in different share classes.
The HFRI Equity Hedge Index consists of funds where portfolio managers maintain long and short positions in primarily equity and derivative securities.
The S&P 500 Index is an unmanaged index generally considered representative of the U.S. stock market. Source: Lipper, Inc.
Index returns assume reinvestment of dividends and do not reflect deduction of fees and expenses. It is not possible to invest directly in an index.
Expense Overview
EXPENSE OVERVIEW
As a shareholder of a mutual fund, you incur two types of costs. You incur:
1) Transaction costs, including sales charges, or loads, on purchase payment and redemption fees.
2) Ongoing costs, including management fees, distribution and/or service (12b-1) fees and other fund expenses.
The examples in this report are based on an investment of $1,000 made at the beginning of the period and held for the entire period from November 1, 2015 to April 30, 2016. It is intended to help you understand the ongoing costs associated with investing in each mutual fund and to compare these costs with the ongoing costs of investing in other mutual funds.
There are two parts of each Fund’s chart:
Actual
In this part of the chart, you’ll see the actual expenses you would have paid on a $1,000 investment made at the beginning of the period and held for the entire period in each fund from November 1, 2015 to April 30, 2016, the period covered by this report. This chart also shows the actual returns, after expenses, you would have earned during that time. This chart can help you estimate your own expenses. For example, if you invested $8,600 in Class A shares of the fund, simply divide $8,600 by $1,000, then multiply that result by the figure in the Actual Expenses per $1,000 row. In this example, you would multiply 8.6 times the figure.
Hypothetical
In this part of the chart, you’ll see the hypothetical expenses you would have paid on a $1,000 investment from November 1, 2015 to April 30, 2016, and the hypothetical returns, after expenses, you would have earned during that time. The Securities and Exchange Commission (SEC) has established the guidelines for this chart, including the assumed 5% annual rate of return before expenses, which is what you’ll see in the chart. Note that this chart will not help you determine your own expenses, but will help you compare expenses of the fund you own to the expenses of another fund since the information for that fund should be calculated using the same assumptions.
Please note that the expenses shown in the chart are meant to highlight your ongoing costs only and do not include any transactional costs, such as sales charges (loads), redemption fees or exchange fees. Therefore, the second line of the chart is useful in comparing ongoing costs only and will not help you determine the relative total costs of owning different funds. In addition, if these transaction costs were included, your costs would have been higher.
| | | | |
| 76 | | CALAMOS OPEN-END FAMILY OF FUNDS SEMIANNUAL REPORT | | |
Expense Example
The actual and hypothetical examples shown assume a $1,000 investment at the beginning of the period, November 1, 2015 and held through April 30, 2016.
| | | | | | | | | | | | | | | | | | | | |
| | | CLASS A
SHARES | | | CLASS B
SHARES | | | CLASS C
SHARES | | | CLASS I
SHARES | | | CLASS R
SHARES | |
| CALAMOS GROWTH FUND | |
Actual Expenses per $1,000* | | $ | 6.45 | | | $ | 10.04 | | | $ | 10.04 | | | $ | 5.25 | | | $ | 7.65 | |
Actual – Ending Balance | | $ | 936.30 | | | $ | 932.90 | | | $ | 932.90 | | | $ | 937.50 | | | $ | 935.40 | |
| | | | |
Hypothetical Expenses per $1,000* | | $ | 6.72 | | | $ | 10.47 | | | $ | 10.47 | | | $ | 5.47 | | | $ | 7.97 | |
Hypothetical – Ending Value | | $ | 1,018.20 | | | $ | 1,014.47 | | | $ | 1,014.47 | | | $ | 1,019.44 | | | $ | 1,016.96 | |
| | | | |
Annualized expense ratio | | | 1.34% | | | | 2.09% | | | | 2.09% | | | | 1.09% | | | | 1.59% | |
| CALAMOS OPPORTUNISTIC VALUE FUND | |
Actual Expenses per $1,000* | | $ | 5.69 | | | $ | 9.39 | | | $ | 9.38 | | | $ | 4.46 | | | $ | 6.93 | |
Actual – Ending Balance | | $ | 990.80 | | | $ | 987.50 | | | $ | 986.50 | | | $ | 991.80 | | | $ | 990.10 | |
| | | | |
Hypothetical Expenses per $1,000* | | $ | 5.77 | | | $ | 9.52 | | | $ | 9.52 | | | $ | 4.52 | | | $ | 7.02 | |
Hypothetical – Ending Value | | $ | 1,019.14 | | | $ | 1,015.42 | | | $ | 1,015.42 | | | $ | 1,020.39 | | | $ | 1,017.90 | |
| | | | |
Annualized expense ratio(1) | | | 1.15% | | | | 1.90% | | | | 1.90% | | | | 0.90% | | | | 1.40% | |
| CALAMOS FOCUS GROWTH FUND | | | | | | | | | | | | | | | | | | | | |
Actual Expenses per $1,000* | | $ | 5.56 | | | $ | 9.16 | | | $ | 9.16 | | | $ | 4.35 | | | $ | 6.76 | |
Actual – Ending Balance | | $ | 943.40 | | | $ | 940.00 | | | $ | 940.00 | | | $ | 944.30 | | | $ | 942.90 | |
| | | | |
Hypothetical Expenses per $1,000* | | $ | 5.77 | | | $ | 9.52 | | | $ | 9.52 | | | $ | 4.52 | | | $ | 7.02 | |
Hypothetical – Ending Value | | $ | 1,019.14 | | | $ | 1,015.42 | | | $ | 1,015.42 | | | $ | 1,020.39 | | | $ | 1,017.90 | |
| | | | |
Annualized expense ratio(1) | | | 1.15% | | | | 1.90% | | | | 1.90% | | | | 0.90% | | | | 1.40% | |
| CALAMOS DISCOVERY GROWTH FUND | | | | | | | | | | | | | | | | | | | | |
Actual Expenses per $1,000* | | $ | 7.13 | | | $ | 10.67 | | | $ | 10.68 | | | $ | 5.95 | | | $ | 8.31 | |
Actual – Ending Balance | | $ | 912.00 | | | $ | 907.80 | | | $ | 908.60 | | | $ | 913.40 | | | $ | 910.80 | |
| | | | |
Hypothetical Expenses per $1,000* | | $ | 7.52 | | | $ | 11.27 | | | $ | 11.27 | | | $ | 6.27 | | | $ | 8.77 | |
Hypothetical – Ending Value | | $ | 1,017.40 | | | $ | 1,013.67 | | | $ | 1,013.67 | | | $ | 1,018.65 | | | $ | 1,016.16 | |
| | | | |
Annualized expense ratio(1) | | | 1.50% | | | | 2.25% | | | | 2.25% | | | | 1.25% | | | | 1.75% | |
| CALAMOS DIVIDEND GROWTH FUND | | | | | | | | | | | | | | | | | | | | |
Actual Expenses per $1,000* | | $ | 6.68 | | | | — | | | $ | 10.37 | | | $ | 5.44 | | | $ | 7.91 | |
Actual – Ending Balance | | $ | 989.80 | | | | — | | | $ | 986.60 | | | $ | 990.70 | | | $ | 987.80 | |
| | | | |
Hypothetical Expenses per $1,000* | | $ | 6.77 | | | | — | | | $ | 10.52 | | | $ | 5.52 | | | $ | 8.02 | |
Hypothetical – Ending Value | | $ | 1,018.15 | | | | — | | | $ | 1,014.42 | | | $ | 1,019.39 | | | $ | 1,016.91 | |
| | | | |
Annualized expense ratio(1) | | | 1.35% | | | | — | | | | 2.10% | | | | 1.10% | | | | 1.60% | |
| CALAMOS MID CAP GROWTH FUND | | | | | | | | | | | | | | | | | | | | |
Actual Expenses per $1,000* | | $ | 5.98 | | | | — | | | $ | 9.55 | | | $ | 4.79 | | | $ | 7.17 | |
Actual – Ending Balance | | $ | 924.10 | | | | — | | | $ | 920.70 | | | $ | 925.50 | | | $ | 923.60 | |
| | | | |
Hypothetical Expenses per $1,000* | | $ | 6.27 | | | | — | | | $ | 10.02 | | | $ | 5.02 | | | $ | 7.52 | |
Hypothetical – Ending Value | | $ | 1,018.65 | | | | — | | | $ | 1,014.92 | | | $ | 1,019.89 | | | $ | 1,017.40 | |
| | | | |
Annualized expense ratio(1) | | | 1.25% | | | | — | | | | 2.00% | | | | 1.00% | | | | 1.50% | |
| CALAMOS INTERNATIONAL GROWTH FUND | | | | | | | | | |
Actual Expenses per $1,000* | | $ | 6.58 | | | $ | 10.19 | | | $ | 10.19 | | | $ | 5.37 | | | $ | 7.78 | |
Actual – Ending Balance | | $ | 944.50 | | | $ | 941.60 | | | $ | 941.50 | | | $ | 945.90 | | | $ | 943.50 | |
| | | | |
Hypothetical Expenses per $1,000* | | $ | 6.82 | | | $ | 10.57 | | | $ | 10.57 | | | $ | 5.57 | | | $ | 8.07 | |
Hypothetical – Ending Value | | $ | 1,018.10 | | | $ | 1,014.37 | | | $ | 1,014.37 | | | $ | 1,019.34 | | | $ | 1,016.86 | |
| | | | |
Annualized expense ratio | | | 1.36% | | | | 2.11% | | | | 2.11% | | | | 1.11% | | | | 1.61% | |
| * | Expenses for all Fund Classes A, B, C, I and R, are equal to the Fund’s annualized expense ratio, multiplied by the average account value over the period, multiplied by 182/366. |
| (1) | Annualized Expense Ratios for Opportunistic Value Fund, Focus Growth Fund, Discovery Growth Fund, Dividend Growth Fund, Mid Cap Growth Fund, Emerging Market Equity Fund, Global Equity Fund, Global Convertible Fund, Total Return Bond Fund, Hedged Equity Income Fund and Phineus Long/Short Fund are adjusted to reflect fee waiver. |
Expense Example
The actual and hypothetical examples shown assume a $1,000 investment at the beginning of the period, November 1, 2015 and held through April 30, 2016.
| | | | | | | | | | | | | | | | | | | | |
| | | CLASS A
SHARES | | | CLASS B
SHARES | | | CLASS C
SHARES | | | CLASS I
SHARES | | | CLASS R
SHARES | |
| CALAMOS EVOLVING WORLD GROWTH FUND | | | | | | | | | | | | | |
Actual Expenses per $1,000* | | $ | 8.02 | | | $ | 11.81 | | | $ | 11.66 | | | $ | 6.80 | | | $ | 9.23 | |
Actual – Ending Balance | | $ | 966.10 | | | $ | 963.00 | | | $ | 962.10 | | | $ | 967.60 | | | $ | 965.00 | |
| | | | |
Hypothetical Expenses per $1,000* | | $ | 8.22 | | | $ | 12.11 | | | $ | 11.96 | | | $ | 6.97 | | | $ | 9.47 | |
Hypothetical – Ending Value | | $ | 1,016.71 | | | $ | 1,012.83 | | | $ | 1,012.98 | | | $ | 1,017.95 | | | $ | 1,015.47 | |
| | | | |
Annualized expense ratio | | | 1.64% | | | | 2.42% | | | | 2.39% | | | | 1.39% | | | | 1.89% | |
| CALAMOS EMERGING MARKET EQUITY FUND | | | | | | | | | | | | | |
Actual Expenses per $1,000* | | $ | 8.58 | | | | — | | | $ | 12.24 | | | $ | 7.36 | | | $ | 9.80 | |
Actual – Ending Balance | | $ | 972.60 | | | | — | | | $ | 968.80 | | | $ | 973.80 | | | $ | 971.40 | |
| | | | |
Hypothetical Expenses per $1,000* | | $ | 8.77 | | | | — | | | $ | 12.51 | | | $ | 7.52 | | | $ | 10.02 | |
Hypothetical – Ending Value | | $ | 1,016.16 | | | | — | | | $ | 1,012.43 | | | $ | 1,017.40 | | | $ | 1,014.92 | |
| | | | |
Annualized expense ratio(1) | | | 1.75% | | | | — | | | | 2.50% | | | | 1.50% | | | | 2.00% | |
| CALAMOS GLOBAL EQUITY FUND | | | | | | | | | | | | | | | | | | | | |
Actual Expenses per $1,000* | | $ | 6.73 | | | $ | 10.32 | | | $ | 10.32 | | | $ | 5.53 | | | $ | 7.93 | |
Actual – Ending Balance | | $ | 934.20 | | | $ | 930.90 | | | $ | 930.70 | | | $ | 935.20 | | | $ | 933.50 | |
| | | | |
Hypothetical Expenses per $1,000* | | $ | 7.02 | | | $ | 10.77 | | | $ | 10.77 | | | $ | 5.77 | | | $ | 8.27 | |
Hypothetical – Ending Value | | $ | 1,017.90 | | | $ | 1,014.17 | | | $ | 1,014.17 | | | $ | 1,019.14 | | | $ | 1,016.66 | |
| | | | |
Annualized expense ratio(1) | | | 1.40% | | | | 2.15% | | | | 2.15% | | | | 1.15% | | | | 1.65% | |
| CALAMOS GROWTH AND INCOME FUND | | | | | | | | | | | | | |
Actual Expenses per $1,000* | | $ | 5.44 | | | $ | 9.18 | | | $ | 9.13 | | | $ | 4.20 | | | $ | 6.67 | |
Actual – Ending Balance | | $ | 988.60 | | | $ | 984.50 | | | $ | 984.30 | | | $ | 989.50 | | | $ | 987.60 | |
| | | | |
Hypothetical Expenses per $1,000* | | $ | 5.52 | | | $ | 9.32 | | | $ | 9.27 | | | $ | 4.27 | | | $ | 6.77 | |
Hypothetical – Ending Value | | $ | 1,019.39 | | | $ | 1,015.61 | | | $ | 1,015.66 | | | $ | 1,020.64 | | | $ | 1,018.15 | |
| | | | |
Annualized expense ratio | | | 1.10% | | | | 1.86% | | | | 1.85% | | | | 0.85% | | | | 1.35% | |
| CALAMOS GLOBAL GROWTH AND INCOME FUND | | | | | | | | | | | | | |
Actual Expenses per $1,000* | | $ | 7.24 | | | $ | 10.90 | | | $ | 10.90 | | | $ | 6.02 | | | $ | 8.46 | |
Actual – Ending Balance | | $ | 968.30 | | | $ | 965.20 | | | $ | 965.20 | | | $ | 970.10 | | | $ | 966.70 | |
| | | | |
Hypothetical Expenses per $1,000* | | $ | 7.42 | | | $ | 11.17 | | | $ | 11.17 | | | $ | 6.17 | | | $ | 8.67 | |
Hypothetical – Ending Value | | $ | 1,017.50 | | | $ | 1,013.77 | | | $ | 1,013.77 | | | $ | 1,018.75 | | | $ | 1,016.26 | |
| | | | |
Annualized expense ratio | | | 1.48% | | | | 2.23% | | | | 2.23% | | | | 1.23% | | | | 1.73% | |
| CALAMOS CONVERTIBLE FUND | | | | | | | | | | | | | | | | | | | | |
Actual Expenses per $1,000* | | $ | 5.67 | | | $ | 9.32 | | | $ | 9.32 | | | $ | 4.45 | | | $ | 6.89 | |
Actual – Ending Balance | | $ | 966.10 | | | $ | 962.90 | | | $ | 962.70 | | | $ | 968.20 | | | $ | 965.50 | |
| | | | |
Hypothetical Expenses per $1,000* | | $ | 5.82 | | | $ | 9.57 | | | $ | 9.57 | | | $ | 4.57 | | | $ | 7.07 | |
Hypothetical – Ending Value | | $ | 1,019.10 | | | $ | 1,015.37 | | | $ | 1,015.37 | | | $ | 1,020.34 | | | $ | 1,017.85 | |
| | | | |
Annualized expense ratio | | | 1.16% | | | | 1.91% | | | | 1.91% | | | | 0.91% | | | | 1.41% | |
| CALAMOS GLOBAL CONVERTIBLE FUND | | | | | | | | | | | | | | | | | | | | |
Actual Expenses per $1,000* | | $ | 6.67 | | | | — | | | $ | 10.34 | | | $ | 5.43 | | | $ | 7.90 | |
Actual – Ending Balance | | $ | 986.10 | | | | — | | | $ | 981.30 | | | $ | 987.20 | | | $ | 984.80 | |
| | | | |
Hypothetical Expenses per $1,000* | | $ | 6.77 | | | | — | | | $ | 10.52 | | | $ | 5.52 | | | $ | 8.02 | |
Hypothetical – Ending Value | | $ | 1,018.15 | | | | — | | | $ | 1,014.42 | | | $ | 1,019.39 | | | $ | 1,016.91 | |
| | | | |
Annualized expense ratio(1) | | | 1.35% | | | | — | | | | 2.10% | | | | 1.10% | | | | 1.60% | |
| * | Expenses for all Fund Classes A, B, C, I and R, are equal to the Fund’s annualized expense ratio, multiplied by the average account value over the period, multiplied by 182/366. |
| (1) | Annualized Expense Ratios for Opportunistic Value Fund, Focus Growth Fund, Discovery Growth Fund, Dividend Growth Fund, Mid Cap Growth Fund, Emerging Market Equity Fund, Global Equity Fund, Global Convertible Fund, Total Return Bond Fund, Hedged Equity Income Fund and Phineus Long/Short Fund are adjusted to reflect fee waiver. |
| | | | |
| 78 | | CALAMOS OPEN-END FAMILY OF FUNDS SEMIANNUAL REPORT | | |
Expense Example
The actual and hypothetical examples shown assume a $1,000 investment at the beginning of the period, November 1, 2015 and held through April 30, 2016.
| | | | | | | | | | | | | | | | | | | | |
| | | CLASS A
SHARES | | | CLASS B
SHARES | | | CLASS C
SHARES | | | CLASS I
SHARES | | | CLASS R
SHARES | |
| CALAMOS TOTAL RETURN BOND FUND | | | | | | | | | | | | | | | | | | | | |
Actual Expenses per $1,000* | | $ | 4.54 | | | $ | 8.30 | | | $ | 8.30 | | | $ | 3.28 | | | $ | 5.79 | |
Actual – Ending Balance | | $ | 1,027.30 | | | $ | 1,022.60 | | | $ | 1,022.60 | | | $ | 1,027.60 | | | $ | 1,026.10 | |
| | | | |
Hypothetical Expenses per $1,000* | | $ | 4.52 | | | $ | 8.27 | | | $ | 8.27 | | | $ | 3.27 | | | $ | 5.77 | |
Hypothetical – Ending Value | | $ | 1,020.39 | | | $ | 1,016.66 | | | $ | 1,016.66 | | | $ | 1,021.63 | | | $ | 1,019.14 | |
| | | | |
Annualized expense ratio(1) | | | 0.90% | | | | 1.65% | | | | 1.65% | | | | 0.65% | | | | 1.15% | |
| CALAMOS HIGH INCOME FUND | | | | | | | | | | | | | | | | | | | | |
Actual Expenses per $1,000* | | $ | 6.64 | | | $ | 10.38 | | | $ | 10.38 | | | $ | 5.41 | | | $ | 7.92 | |
Actual – Ending Balance | | $ | 993.20 | | | $ | 988.70 | | | $ | 988.70 | | | $ | 994.50 | | | $ | 990.80 | |
| | | | |
Hypothetical Expenses per $1,000* | | $ | 6.72 | | | $ | 10.52 | | | $ | 10.52 | | | $ | 5.47 | | | $ | 8.02 | |
Hypothetical – Ending Value | | $ | 1,018.20 | | | $ | 1,014.42 | | | $ | 1,014.42 | | | $ | 1,019.44 | | | $ | 1,016.91 | |
| | | | |
Annualized expense ratio | | | 1.34% | | | | 2.10% | | | | 2.10% | | | | 1.09% | | | | 1.60% | |
| CALAMOS MARKET NEUTRAL INCOME FUND | | | | | | | | | | | | | |
Actual Expenses per $1,000* | | $ | 5.98 | | | $ | 9.70 | | | $ | 9.70 | | | $ | 4.74 | | | $ | 7.22 | |
Actual – Ending Balance | | $ | 1,004.70 | | | $ | 1,001.20 | | | $ | 1,001.60 | | | $ | 1,006.00 | | | $ | 1,003.40 | |
| | | | |
Hypothetical Expenses per $1,000* | | $ | 6.02 | | | $ | 9.77 | | | $ | 9.77 | | | $ | 4.77 | | | $ | 7.27 | |
Hypothetical – Ending Value | | $ | 1,018.90 | | | $ | 1,015.17 | | | $ | 1,015.17 | | | $ | 1,020.14 | | | $ | 1,017.65 | |
| | | | |
Annualized expense ratio(2) | | | 1.20% | | | | 1.95% | | | | 1.95% | | | | 0.95% | | | | 1.45% | |
| CALAMOS HEDGED EQUITY INCOME FUND | | | | | | | | | | | | | |
Actual Expenses per $1,000* | | $ | 6.21 | | | | — | | | $ | 9.92 | | | $ | 4.97 | | | $ | 7.44 | |
Actual – Ending Balance | | $ | 998.10 | | | | — | | | $ | 993.90 | | | $ | 999.20 | | | $ | 995.70 | |
| | | | |
Hypothetical Expenses per $1,000* | | $ | 6.27 | | | | — | | | $ | 10.02 | | | $ | 5.02 | | | $ | 7.52 | |
Hypothetical – Ending Value | | $ | 1,018.65 | | | | — | | | $ | 1,014.92 | | | $ | 1,019.89 | | | $ | 1,017.40 | |
| | | | |
Annualized expense ratio(1) | | | 1.25% | | | | — | | | | 2.00% | | | | 1.00% | | | | 1.50% | |
| CALAMOS PHINEUS LONG/SHORT FUND† | | | | | | | | | | | | | |
Actual Expenses per $1,000* | | $ | 1.47 | | | | — | | | $ | 2.02 | | | $ | 1.34 | | | | — | |
Actual – Ending Balance | | $ | 1,049.00 | | | | — | | | $ | 1,049.00 | | �� | $ | 1,049.00 | | | | — | |
| | | | |
Hypothetical Expenses per $1,000* | | $ | 1.44 | | | | — | | | $ | 1.98 | | | $ | 1.31 | | | | — | |
Hypothetical – Ending Value | | $ | 1,001.98 | | | | — | | | $ | 1,001.44 | | | $ | 1,002.10 | | | | — | |
| | | | |
Annualized expense ratio(1) (2) | | | 2.10% | | | | — | | | | 2.89% | | | | 1.92% | | | | — | |
| CALAMOS LONG/SHORT FUND | | | | | | | | | | | | | | | | | | | | |
Actual Expenses per $1,000* | | $ | 12.55 | | | | — | | | $ | 16.65 | | | $ | 11.59 | | | $ | 14.25 | |
Actual – Ending Balance | | $ | 956.20 | | | | — | | | $ | 952.60 | | | $ | 958.30 | | | $ | 956.00 | |
| | | | |
Hypothetical Expenses per $1,000* | | $ | 12.91 | | | | — | | | $ | 17.12 | | | $ | 11.91 | | | $ | 14.64 | |
Hypothetical – Ending Value | | $ | 1,012.03 | | | | — | | | $ | 1,007.81 | | | $ | 1,013.03 | | | $ | 1,010.29 | |
| | | | |
Annualized expense ratio(2) | | | 2.58% | | | | — | | | | 3.43% | | | | 2.38% | | | | 2.93% | |
| † | April 5, 2016 (commencement of operations) through April 30, 2016. Expenses for all Fund Classes of the Phineus Long/Short Fund are equal to the Fund’s annualized expense ratio, multiplied by the average account value from inception to period end, multiplied by 25/366. |
| * | Expenses for all Fund Classes A, B, C, I and R, are equal to the Fund’s annualized expense ratio, multiplied by the average account value over the period, multiplied by 182/366. |
| (1) | Annualized Expense Ratios for Opportunistic Value Fund, Focus Growth Fund, Discovery Growth Fund, Dividend Growth Fund, Mid Cap Growth Fund, Emerging Market Equity Fund, Global Equity Fund, Global Convertible Fund, Total Return Bond Fund, Hedged Equity Income Fund and Phineus Long/Short Fund are adjusted to reflect fee waiver. |
| (2) | Includes 0.12%, 0.17% and 0.72% related to dividend expense on short positions for Market Neutral Income Fund, Phineus Long/Short Fund and Long/Short Fund, respectively. |
Growth Fund Schedule of Investments April 30, 2016 (Unaudited)
| | | | | | | | | | |
NUMBER OF
SHARES | | | | | | | VALUE | |
| | COMMON STOCKS (90.9%) | |
| | | | | | Consumer Discretionary (20.6%) | |
| | 69,870 | | | | | Amazon.com, Inc.# | | $ | 46,085,553 | |
| | 638,000 | | | | | Comcast Corp. - Class A | | | 38,764,880 | |
| | 308,800 | | | | | Delphi Automotive, PLC | | | 22,736,944 | |
| | 604,000 | | | | | Dollar General Corp. | | | 49,473,640 | |
| | 1,401,300 | | | | | Hilton Worldwide Holdings, Inc. | | | 30,898,665 | |
| | 464,100 | | | | | Home Depot, Inc. | | | 62,138,349 | |
| | 564,230 | | | | | IMAX Corp.# | | | 18,055,360 | |
| | 382,800 | | | | | Johnson Controls, Inc. | | | 15,847,920 | |
| | 898,000 | | | | | Liberty Global, PLC - Class A# | | | 33,881,540 | |
| | 656,900 | | | | | Lions Gate Entertainment Corp.^ | | | 14,583,180 | |
| | 361,600 | | | | | Norwegian Cruise Line Holdings, Ltd.# | | | 17,678,624 | |
| | 172,600 | | | | | Signet Jewelers, Ltd. | | | 18,737,456 | |
| | 556,900 | | | | | Starbucks Corp. | | | 31,314,487 | |
| | 42,500 | | | | | Tesla Motors, Inc.#^ | | | 10,232,300 | |
| | 285,400 | | | | | Walt Disney Company | | | 29,470,404 | |
| | | | | | | | | | |
| | | | | | | | | 439,899,302 | |
| | | | | | | | | | |
| | | | | | Consumer Staples (3.8%) | |
| | 515,690 | | | | | Mondelez International, Inc. - Class A | | | 22,154,043 | |
| | 460,400 | | | | | Reynolds American, Inc. | | | 22,835,840 | |
| | 442,900 | | | | | Walgreens Boots Alliance, Inc. | | | 35,113,112 | |
| | | | | | | | | | |
| | | | | | | | | 80,102,995 | |
| | | | | | | | | | |
| | | | | | Energy (3.4%) | |
| | 293,000 | | | | | Diamondback Energy, Inc.# | | | 25,367,940 | |
| | 187,000 | | | | | Pioneer Natural Resources Company | | | 31,060,700 | |
| | 193,400 | | | | | Schlumberger, Ltd. | | | 15,537,756 | |
| | | | | | | | | | |
| | | | | | | | | 71,966,396 | |
| | | | | | | | | | |
| | | | | | Financials (4.3%) | |
| | 411,700 | | | | | E*TRADE Financial Corp.# | | | 10,366,606 | |
| | 384,300 | | | | | Evercore Partners, Inc. - Class A | | | 19,845,252 | |
| | 118,800 | | | | | Intercontinental Exchange, Inc. | | | 28,515,564 | |
| | 100,000 | | | | | Jones Lang LaSalle, Inc. | | | 11,517,000 | |
| | 217,400 | | | | | Realogy Holdings Corp.# | | | 7,769,876 | |
| | 139,200 | | | | | SVB Financial Group# | | | 14,515,776 | |
| | | | | | | | | | |
| | | | | | | | | 92,530,074 | |
| | | | | | | | | | |
| | | | | | Health Care (16.1%) | |
| | 665,700 | | | | | AbbVie, Inc. | | | 40,607,700 | |
| | 573,500 | | | | | Acadia Healthcare Company, Inc.# | | | 36,239,465 | |
| | 170,400 | | | | | Alexion Pharmaceuticals, Inc.# | | | 23,733,312 | |
| | 97,300 | | | | | Allergan, PLC# | | | 21,071,288 | |
| | 202,400 | | | | | Celgene Corp.# | | | 20,930,184 | |
| | 343,200 | | | | | Centene Corp.# | | | 21,264,672 | |
| | 1,024,400 | | | | | Envision Healthcare Holdings, Inc.# | | | 23,182,172 | |
| | 393,600 | | | | | Express Scripts Holding Company# | | | 29,020,128 | |
| | 136,600 | | | | | HCA Holdings, Inc.# | | | 11,012,692 | |
| | | | | | | | | | |
NUMBER OF
SHARES | | | | | | | VALUE | |
| | 754,900 | | | | | IMS Health Holdings, Inc.# | | $ | 20,110,536 | |
| | 86,800 | | | | | Jazz Pharmaceuticals, PLC# | | | 13,080,760 | |
| | 159,800 | | | | | Perrigo Company, PLC | | | 15,447,866 | |
| | 115,000 | | | | | Shire, PLC^ | | | 21,553,300 | |
| | 208,500 | | | | | VCA, Inc.# | | | 13,129,245 | |
| | 701,400 | | | | | Zoetis, Inc. | | | 32,986,842 | |
| | | | | | | | | | |
| | | | | | | | | 343,370,162 | |
| | | | | | | | | | |
| | | | | | Industrials (9.9%) | |
| | 171,700 | | | | | Allegion, PLC | | | 11,237,765 | |
| | 1,122,000 | | | | | CSX Corp. | | | 30,596,940 | |
| | 255,300 | | | | | Eaton Corp., PLC | | | 16,152,831 | |
| | 84,500 | | | | | Lennox International, Inc. | | | 11,403,275 | |
| | 164,000 | | | | | Lockheed Martin Corp. | | | 38,110,320 | |
| | 172,200 | | | | | Manpowergroup, Inc. | | | 13,264,566 | |
| | 166,200 | | | | | Raytheon Company | | | 20,999,370 | |
| | 395,800 | | | | | Southwest Airlines Company | | | 17,656,638 | |
| | 350,800 | | | | | United Parcel Service, Inc. - Class B | | | 36,858,556 | |
| | 229,100 | | | | | Waste Connections, Inc. | | | 15,413,848 | |
| | | | | | | | | | |
| | | | | | | | | 211,694,109 | |
| | | | | | | | | | |
| | | | | | Information Technology (30.3%) | |
| | 357,400 | | | | | Accenture, PLC - Class A | | | 40,357,608 | |
| | 204,100 | | | | | Alphabet, Inc. - Class A# | | | 144,478,308 | |
| | 1,229,200 | | | | | Apple, Inc. | | | 115,225,208 | |
| | 1,120,700 | | | | | Applied Materials, Inc. | | | 22,940,729 | |
| | 907,000 | | | | | Booz Allen Hamilton Holding Corp. | | | 25,005,990 | |
| | 863,700 | | | | | Corning, Inc. | | | 16,125,279 | |
| | 90,200 | | | | | CoStar Group, Inc.# | | | 17,797,362 | |
| | 593,400 | | | | | Facebook, Inc. - Class A# | | | 69,771,972 | |
| | 611,400 | | | | | FireEye, Inc.#^ | | | 10,607,790 | |
| | 668,700 | | | | | InterXion Holding, NV# | | | 22,655,556 | |
| | 1,195,500 | | | | | Microsoft Corp. | | | 59,619,585 | |
| | 131,200 | | | | | NXP Semiconductors, NV# | | | 11,188,736 | |
| | 180,900 | | | | | Red Hat, Inc.# | | | 13,272,633 | |
| | 525,100 | | | | | Sabre Corp. | | | 15,201,645 | |
| | 253,300 | | | | | Salesforce.com, Inc.# | | | 19,200,140 | |
| | 359,500 | | | | | TE Connectivity, Ltd. | | | 21,383,060 | |
| | 750,200 | | | | | VeriFone Systems, Inc.# | | | 21,350,692 | |
| | | | | | | | | | |
| | | | | | | | | 646,182,293 | |
| | | | | | | | | | |
| | | | | | Materials (0.7%) | |
| | 216,300 | | | | | Scotts Miracle-Gro Co- Class A | | | 15,309,714 | |
| | | | | | | | | | |
| | | | | | Telecommunication Services (1.8%) | |
| | 616,100 | | | | | T-Mobile USA, Inc.# | | | 24,200,408 | |
| | 530,900 | | | | | Zayo Group Holdings, Inc.# | | | 13,782,164 | |
| | | | | | | | | | |
| | | | | | | | | 37,982,572 | |
| | | | | | | | | | |
| | | | | | TOTAL COMMON STOCKS
(Cost $1,698,672,086) | | | 1,939,037,617 | |
| | | | | | | | | | |
| | | | | | | | | | |
| | | | |
| 80 | | CALAMOS OPEN-END FAMILY OF FUNDS SEMIANNUAL REPORT | | See accompanying Notes to Schedule of Investments |
Growth Fund Schedule of Investments April 30, 2016 (Unaudited)
| | | | | | | | | | |
NUMBER OF
SHARES | | | | | | | VALUE | |
| | SHORT TERM INVESTMENT (9.6%) | | | | |
| | 204,737,882 | | | | | Fidelity Prime Money Market Fund - Institutional Class
(Cost $204,737,882) | | $ | 204,737,882 | |
| | | | | | | | | | |
| | | | | | | | | | |
NUMBER OF
SHARES/
PRINCIPAL
AMOUNT | | | | | | | VALUE | |
| INVESTMENT OF CASH COLLATERAL FOR SECURITIES
LOANED (1.9%) |
|
| | | | | | Federal Home Loan Bank Discount Notes | |
| | 8,762,256 | | | | | 0.000%, 06/15/16 | | | 8,762,256 | |
| | 7,010,627 | | | | | 0.000%, 05/24/16 | | | 7,010,627 | |
| | 5,258,116 | | | | | 0.000%, 05/02/16 | | | 5,258,116 | |
| | 8,093,833 | | | | | Fidelity Prime Money Market Fund - Institutional Class | | | 8,093,833 | |
| | 5,415,895 | | | | | Goldman Sachs Financial Square Prime Obligations Fund | | | 5,415,895 | |
| | 6,296,134 | | | | | Morgan Stanley Institutional Liquidity Fund | | | 6,296,134 | |
| | | | | | | | | | |
| | | | | | TOTAL INVESTMENT OF
CASH COLLATERAL FOR
SECURITIES LOANED
(Cost $40,836,861) | | | 40,836,861 | |
| | | | | | | | | | |
| TOTAL INVESTMENTS (102.4%)
(Cost $1,944,246,829) | | | 2,184,612,360 | |
| | | | | | | | | | |
| |
| | PAYABLE UPON RETURN OF SECURITIES ON LOAN (-1.9%) | | | (40,836,861 | ) |
| | | | | | | | | | |
| |
| | LIABILITIES, LESS OTHER ASSETS (-0.4%) | | | (9,363,365 | ) |
| | | | | | | | | | |
| |
| | NET ASSETS (100.0%) | | $ | 2,134,412,134 | |
| | | | | | | | | | |
FORWARD FOREIGN CURRENCY CONTRACTS
| | | | | | | | | | | | | | | | |
COUNTER
PARTY | | SHORT CONTRACTS | | SETTLEMENT DATE | | LOCAL CURRENCY | | | CURRENT VALUE | | | UNREALIZED GAIN/LOSS | |
Northern
Trust Company | | British Pound Sterling | | 07/21/16 | | | 14,039,000 | | | $ | 20,518,077 | | | $ | (322,667 | ) |
| | | | | | | | | | | | | | | | |
NOTES TO SCHEDULE OF INVESTMENTS
| # | Non-income producing security. |
| ^ | Security, or portion of security, is on loan. |
| | | | | | |
| See accompanying Notes to Financial Statements | | www.calamos.com | | | 81 | |
Opportunistic Value Fund Schedule of Investments April 30, 2016 (Unaudited)
| | | | | | | | | | |
NUMBER OF
SHARES | | | | | | | VALUE | |
| | COMMON STOCKS (97.6%) | |
| | | | | | Consumer Discretionary (6.8%) | |
| | 3,600 | | | | | Carnival Corp. | | $ | 176,580 | |
| | 3,500 | | | | | Comcast Corp. - Class A | | | 212,660 | |
| | 4,200 | | | | | Dick’s Sporting Goods, Inc. | | | 194,628 | |
| | 2,700 | | | | | Foot Locker, Inc. | | | 165,888 | |
| | 22,800 | | | | | Ford Motor Company | | | 309,168 | |
| | 4,400 | | | | | GameStop Corp. - Class A^ | | | 144,320 | |
| | 12,350 | | | | | General Motors Company, Inc. | | | 392,730 | |
| | 14,000 | | | | | Gentex Corp. | | | 224,560 | |
| | 2,600 | | | | | Genuine Parts Company | | | 249,522 | |
| | 6,300 | | | | | Goodyear Tire & Rubber Company | | | 182,511 | |
| | 4,500 | | | | | H&R Block, Inc. | | | 91,080 | |
| | 5,950 | | | | | Harley-Davidson, Inc. | | | 284,589 | |
| | 4,500 | | | | | Kohl’s Corp. | | | 199,350 | |
| | 1,200 | | | | | Lear Corp. | | | 138,156 | |
| | 4,700 | | | | | Target Corp. | | | 373,650 | |
| | 2,515 | | | | | Tiffany & Company | | | 179,445 | |
| | 4,980 | | | | | Time Warner, Inc. | | | 374,197 | |
| | 10,150 | | | | | Twenty-First Century Fox, Inc. | | | 307,139 | |
| | | | | | | | | | |
| | | | | | | | | 4,200,173 | |
| | | | | | | | | | |
| | | | | | Consumer Staples (6.2%) | |
| | 2,300 | | | | | CVS Health Corp. | | | 231,150 | |
| | 12,750 | | | | | Mondelez International, Inc. - Class A | | | 547,740 | |
| | 2,730 | | | | | Philip Morris International, Inc. | | | 267,868 | |
| | 15,150 | | | | | Procter & Gamble Company | | | 1,213,818 | |
| | 12,200 | | | | | Wal-Mart Stores, Inc. | | | 815,814 | |
| | 6,215 | | | | | Walgreens Boots Alliance, Inc. | | | 492,725 | |
| | 8,400 | | | | | Whole Foods Market, Inc. | | | 244,272 | |
| | | | | | | | | | |
| | | | | | | | | 3,813,387 | |
| | | | | | | | | | |
| | | | | | Energy (13.0%) | |
| | 2,850 | | | | | Apache Corp. | | | 155,040 | |
| | 11,700 | | | | | Chevron Corp. | | | 1,195,506 | |
| | 8,855 | | | | | ConocoPhillips | | | 423,180 | |
| | 6,900 | | | | | CVR Energy, Inc.^ | | | 167,532 | |
| | 6,188 | | | | | Devon Energy Corp. | | | 214,600 | |
| | 5,900 | | | | | Dril-Quip, Inc.# | | | 382,438 | |
| | 1,500 | | | | | EOG Resources, Inc. | | | 123,930 | |
| | 25,770 | | | | | Exxon Mobil Corp. | | | 2,278,068 | |
| | 6,030 | | | | | FMC Technologies, Inc.# | | | 183,855 | |
| | 15,300 | | | | | Frank’s International, NV^ | | | 254,745 | |
| | 9,350 | | | | | Halliburton Company | | | 386,249 | |
| | 3,900 | | | | | Marathon Petroleum Corp. | | | 152,412 | |
| | 6,900 | | | | | National Oilwell Varco, Inc. | | | 248,676 | |
| | 3,325 | | | | | Occidental Petroleum Corp. | | | 254,861 | |
| | 5,600 | | | | | Phillips 66 | | | 459,816 | |
| | 7,895 | | | | | Schlumberger, Ltd. | | | 634,284 | |
| | | | | | | | | | |
NUMBER OF
SHARES | | | | | | | VALUE | |
| | 6,120 | | | | | Valero Energy Corp. | | $ | 360,284 | |
| | 3,815 | | | | | World Fuel Services Corp. | | | 178,275 | |
| | | | | | | | | | |
| | | | | | | | | 8,053,751 | |
| | | | | | | | | | |
| | | | | | Financials (27.6%) | |
| | 7,400 | | | | | American Express Company | | | 484,182 | |
| | 12,265 | | | | | American International Group, Inc. | | | 684,632 | |
| | 1,850 | | | | | AvalonBay Communities, Inc. | | | 327,061 | |
| | 60,500 | | | | | Bank of America Corp. | | | 880,880 | |
| | 5,540 | | | | | Bank of Hawaii Corp. | | | 378,991 | |
| | 6,400 | | | | | Bank of New York Mellon Corp. | | | 257,536 | |
| | 10,461 | | | | | Berkshire Hathaway, Inc. - Class B# | | | 1,521,866 | |
| | 670 | | | | | BlackRock, Inc. | | | 238,741 | |
| | 6,805 | | | | | Brown & Brown, Inc. | | | 238,924 | |
| | 4,150 | | | | | Capital One Financial Corp. | | | 300,419 | |
| | 1,080 | | | | | Chubb Corp. | | | 127,289 | |
| | 2,675 | | | | | Cincinnati Financial Corp. | | | 176,577 | |
| | 24,080 | | | | | Citigroup, Inc. | | | 1,114,422 | |
| | 1,950 | | | | | Digital Realty Trust, Inc. | | | 171,561 | |
| | 6,900 | | | | | Discover Financial Services | | | 388,263 | |
| | 5,135 | | | | | East West Bancorp, Inc. | | | 192,511 | |
| | 4,100 | | | | | Equity Residential | | | 279,087 | |
| | 6,125 | | | | | Franklin Resources, Inc. | | | 228,708 | |
| | 7,900 | | | | | General Growth Properties, Inc. | | | 221,437 | |
| | 2,045 | | | | | Goldman Sachs Group, Inc. | | | 335,605 | |
| | 7,800 | | | | | Hartford Financial Services Group, Inc. | | | 346,164 | |
| | 10,700 | | | | | Host Hotels & Resorts, Inc. | | | 169,274 | |
| | 870 | | | | | Intercontinental Exchange, Inc. | | | 208,826 | |
| | 865 | | | | | Jones Lang LaSalle, Inc. | | | 99,622 | |
| | 24,970 | | | | | JPMorgan Chase & Company | | | 1,578,104 | |
| | 5,660 | | | | | Legg Mason, Inc. | | | 181,743 | |
| | 2,240 | | | | | Marsh & McLennan Companies, Inc. | | | 141,456 | |
| | 8,600 | | | | | MetLife, Inc. | | | 387,860 | |
| | 4,540 | | | | | Morgan Stanley | | | 122,852 | |
| | 3,200 | | | | | Northern Trust Corp. | | | 227,456 | |
| | 4,800 | | | | | PNC Financial Services Group, Inc. | | | 421,344 | |
| | 6,390 | | | | | Principal Financial Group, Inc. | | | 272,725 | |
| | 8,340 | | | | | Progressive Corp. | | | 271,884 | |
| | 5,000 | | | | | Prologis, Inc. | | | 227,050 | |
| | 22,500 | | | | | Regions Financial Corp. | | | 211,050 | |
| | 1,785 | | | | | Signature Bank# | | | 246,027 | |
| | 1,800 | | | | | SL Green Realty Corp. | | | 189,144 | |
| | 9,790 | | | | | Unum Group | | | 334,916 | |
| | 11,300 | | | | | US Bancorp | | | 482,397 | |
| | 2,030 | | | | | Vornado Realty Trust | | | 194,332 | |
| | 33,050 | | | | | Wells Fargo & Company | | | 1,651,839 | |
| | 3,000 | | | | | Welltower, Inc. | | | 208,260 | |
| | 6,605 | | | | | WR Berkley Corp. | | | 369,880 | |
| | | | | | | | | | |
| | | | | | | | | 17,092,897 | |
| | | | | | | | | | |
| | | | |
| 82 | | CALAMOS OPEN-END FAMILY OF FUNDS SEMIANNUAL REPORT | | See accompanying Notes to Schedule of Investments |
Opportunistic Value Fund Schedule of Investments April 30, 2016 (Unaudited)
| | | | | | | | | | |
NUMBER OF
SHARES | | | | | | | VALUE | |
| | | | | | Health Care (11.9%) | |
| | 7,385 | | | | | Abbott Laboratories | | $ | 287,277 | |
| | 2,500 | | | | | Aetna, Inc. | | | 280,675 | |
| | 2,085 | | | | | Allergan, PLC# | | | 451,528 | |
| | 2,150 | | | | | Anthem, Inc. | | | 302,655 | |
| | 2,800 | | | | | Cardinal Health, Inc. | | | 219,688 | |
| | 2,900 | | | | | Gilead Sciences, Inc. | | | 255,809 | |
| | 14,660 | | | | | Johnson & Johnson | | | 1,643,093 | |
| | 3,500 | | | | | MEDNAX, Inc.# | | | 249,515 | |
| | 8,000 | | | | | Medtronic, PLC | | | 633,200 | |
| | 19,425 | | | | | Merck & Company, Inc. | | | 1,065,267 | |
| | 47,671 | | | | | Pfizer, Inc. | | | 1,559,318 | |
| | 1,450 | | | | | UnitedHealth Group, Inc. | | | 190,936 | |
| | 1,840 | | | | | Universal Health Services, Inc. - Class B | | | 245,971 | |
| | | | | | | | | | |
| | | | | | | | | 7,384,932 | |
| | | | | | | | | | |
| | | | | | Industrials (11.4%) | |
| | 1,300 | | | | | Boeing Company | | | 175,240 | |
| | 5,350 | | | | | Crane Company | | | 297,300 | |
| | 9,295 | | | | | CSX Corp. | | | 253,475 | |
| | 2,850 | | | | | Cummins, Inc. | | | 333,535 | |
| | 3,600 | | | | | Dover Corp. | | | 236,520 | |
| | 3,700 | | | | | Eaton Corp., PLC | | | 234,099 | |
| | 4,280 | | | | | Emerson Electric Company | | | 233,816 | |
| | 1,700 | | | | | General Dynamics Corp. | | | 238,884 | |
| | 49,700 | | | | | General Electric Company | | | 1,528,275 | |
| | 2,135 | | | | | Hubbell, Inc. | | | 225,798 | |
| | 6,040 | | | | | ITT Corp. | | | 231,755 | |
| | 4,125 | | | | | Jacobs Engineering Group, Inc.# | | | 183,893 | |
| | 11,600 | | | | | JetBlue Airways Corp.# | | | 229,564 | |
| | 3,555 | | | | | Lincoln Electric Holdings, Inc. | | | 222,792 | |
| | 3,800 | | | | | Manpowergroup, Inc. | | | 292,714 | |
| | 720 | | | | | Northrop Grumman Corp. | | | 148,507 | |
| | 1,965 | | | | | Parker-Hannifin Corp. | | | 227,979 | |
| | 505 | | | | | Raytheon Company | | | 63,807 | |
| | 3,800 | | | | | Spirit AeroSystems Holdings Inc - Class A# | | | 179,170 | |
| | 3,125 | | | | | Stanley Black & Decker, Inc. | | | 349,750 | |
| | 2,400 | | | | | United Parcel Service, Inc. - Class B | | | 252,168 | |
| | 6,650 | | | | | United Technologies Corp. | | | 694,060 | |
| | 5,740 | | | | | Xylem, Inc. | | | 239,817 | |
| | | | | | | | | | |
| | | | | | | | | 7,072,918 | |
| | | | | | | | | | |
| | | | | | Information Technology (11.6%) | |
| | 1,950 | | | | | Accenture, PLC - Class A | | | 220,194 | |
| | 3,350 | | | | | Analog Devices, Inc. | | | 188,672 | |
| | 2,100 | | | | | Ansys, Inc.# | | | 190,617 | |
| | 2,796 | | | | | Apple, Inc. | | | 262,097 | |
| | 11,900 | | | | | Applied Materials, Inc. | | | 243,593 | |
| | 2,430 | | | | | Automatic Data Processing, Inc. | | | 214,909 | |
| | | | | | | | | | |
NUMBER OF
SHARES | | | | | | | VALUE | |
| | 37,275 | | | | | Cisco Systems, Inc. | | $ | 1,024,690 | |
| | 1,950 | | | | | DST Systems, Inc. | | | 235,326 | |
| | 6,700 | | | | | FLIR Systems, Inc. | | | 202,407 | |
| | 30,230 | | | | | Intel Corp. | | | 915,364 | |
| | 3,900 | | | | | International Business Machines Corp. | | | 569,166 | |
| | 7,900 | | | | | Juniper Networks, Inc. | | | 184,860 | |
| | 2,900 | | | | | Lam Research Corp. | | | 221,560 | |
| | 14,700 | | | | | Micron Technology, Inc.# | | | 158,025 | |
| | 19,200 | | | | | Microsoft Corp. | | | 957,504 | |
| | 4,700 | | | | | Oracle Corp. | | | 187,342 | |
| | 3,600 | | | | | Paychex, Inc. | | | 187,632 | |
| | 12,150 | | | | | QUALCOMM, Inc. | | | 613,818 | |
| | 3,900 | | | | | Synopsys, Inc.# | | | 185,328 | |
| | 10,200 | | | | | Teradyne, Inc. | | | 192,882 | |
| | | | | | | | | | |
| | | | | | | | | 7,155,986 | |
| | | | | | | | | | |
| | | | | | Materials (2.3%) | |
| | 12,300 | | | | | Alcoa, Inc. | | | 137,391 | |
| | 2,940 | | | | | Celanese Corp. | | | 207,858 | |
| | 4,500 | | | | | Dow Chemical Company | | | 236,745 | |
| | 4,200 | | | | | E.I. du Pont de Nemours and Company | | | 276,822 | |
| | 14,050 | | | | | Graphic Packaging Holding Company | | | 186,584 | |
| | 4,125 | | | | | Mosaic Company | | | 115,459 | |
| | 3,400 | | | | | Reliance Steel & Aluminum Company | | | 251,498 | |
| | | | | | | | | | |
| | | | | | | | | 1,412,357 | |
| | | | | | | | | | |
| | | | | | Telecommunication Services (2.3%) | |
| | 22,500 | | | | | AT&T, Inc. | | | 873,450 | |
| | 7,800 | | | | | CenturyLink, Inc. | | | 241,410 | |
| | 5,600 | | | | | Verizon Communications, Inc. | | | 285,264 | |
| | | | | | | | | | |
| | | | | | | | | 1,400,124 | |
| | | | | | | | | | |
| | | | | | Utilities (4.5%) | |
| | 4,000 | | | | | American Electric Power Company, Inc. | | | 254,000 | |
| | 3,800 | | | | | Consolidated Edison, Inc. | | | 283,480 | |
| | 2,480 | | | | | Dominion Resources, Inc. | | | 177,246 | |
| | 4,200 | | | | | Duke Energy Corp. | | | 330,876 | |
| | 3,400 | | | | | Edison International | | | 240,414 | |
| | 6,900 | | | | | Exelon Corp. | | | 242,121 | |
| | 1,940 | | | | | NextEra Energy, Inc. | | | 228,105 | |
| | 4,200 | | | | | PG&E Corp. | | | 244,440 | |
| | 3,800 | | | | | PPL Corp. | | | 143,032 | |
| | 5,450 | | | | | Public Service Enterprise Group, Inc. | | | 251,408 | |
| | 1,185 | | | | | Sempra Energy | | | 122,470 | |
| | 5,010 | | | | | Southern Company | | | 251,001 | |
| | | | | | | | | | |
| | | | | | | | | 2,768,593 | |
| | | | | | | | | | |
| | | | | | TOTAL COMMON STOCKS
(Cost $59,765,069) | | | 60,355,118 | |
| | | | | | | | | | |
| | | | | | | | | | |
| | | | | | |
| See accompanying Notes to Schedule of Investments | | www.calamos.com | | | 83 | |
Opportunistic Value Fund Schedule of Investments April 30, 2016 (Unaudited)
| | | | | | | | | | |
NUMBER OF
SHARES | | | | | | | VALUE | |
| | SHORT TERM INVESTMENT (2.1%) | | | | |
| | 1,303,697 | | | | | Fidelity Prime Money Market Fund - Institutional Class
(Cost $1,303,697) | | $ | 1,303,697 | |
| | | | | | | | | | |
| | | | | | | | | | |
NUMBER OF
SHARES/
PRINCIPAL
AMOUNT | | | | | | | VALUE | |
| INVESTMENT OF CASH COLLATERAL FOR SECURITIES
LOANED (0.8%) |
|
| | | | | | Federal Home Loan Bank Discount Notes | | | | |
| | 104,784 | | | | | 0.000%, 06/15/16 | | | 104,784 | |
| | 83,837 | | | | | 0.000%, 05/24/16 | | | 83,837 | |
| | 62,879 | | | | | 0.000%, 05/02/16 | | | 62,879 | |
| | 96,791 | | | | | Fidelity Prime Money Market Fund - Institutional Class | | | 96,791 | |
| | 64,766 | | | | | Goldman Sachs Financial Square Prime Obligations Fund | | | 64,766 | |
| | 75,293 | | | | | Morgan Stanley Institutional Liquidity Fund | | | 75,293 | |
| | | | | | | | | | |
| | | | | | TOTAL INVESTMENT OF
CASH COLLATERAL FOR
SECURITIES LOANED
(Cost $488,350) | | | 488,350 | |
| | | | | | | | | | |
| TOTAL INVESTMENTS (100.5%)
(Cost $61,557,116) | | | 62,147,165 | |
| | | | | | | | | | |
| |
| | PAYABLE UPON RETURN OF SECURITIES ON LOAN (-0.8%) | | | (488,350 | ) |
| | | | | | | | | | |
| |
| | OTHER ASSETS, LESS LIABILITIES (0.3%) | | | 196,156 | |
| | | | | | | | | | |
| |
| | NET ASSETS (100.0%) | | $ | 61,854,971 | |
| | | | | | | | | | |
NOTES TO SCHEDULE OF INVESTMENTS
| ^ | Security, or portion of security, is on loan. |
| # | Non-income producing security. |
| | | | |
| 84 | | CALAMOS OPEN-END FAMILY OF FUNDS SEMIANNUAL REPORT | | See accompanying Notes to Financial Statements |
Focus Growth Fund Schedule of Investments April 30, 2016 (Unaudited)
| | | | | | | | | | |
NUMBER OF
SHARES | | | | | | | VALUE | |
| | COMMON STOCKS (92.9%) | |
| | | | | | Consumer Discretionary (20.2%) | |
| | 15,355 | | | | | Comcast Corp. - Class A | | $ | 932,970 | |
| | 7,600 | | | | | Delphi Automotive, PLC | | | 559,588 | |
| | 14,900 | | | | | Dollar General Corp. | | | 1,220,459 | |
| | 36,900 | | | | | Hilton Worldwide Holdings, Inc. | | | 813,645 | |
| | 18,200 | | | | | Home Depot, Inc. | | | 2,436,798 | |
| | 30,200 | | | | | Liberty Global, PLC - Class A# | | | 1,139,446 | |
| | 13,400 | | | | | Norwegian Cruise Line Holdings, Ltd.# | | | 655,126 | |
| | 13,800 | | | | | Starbucks Corp. | | | 775,974 | |
| | 1,800 | | | | | Tesla Motors, Inc.#^ | | | 433,368 | |
| | 11,600 | | | | | Walt Disney Company | | | 1,197,816 | |
| | | | | | | | | | |
| | | | | | | | | 10,165,190 | |
| | | | | | | | | | |
| | | | | | Consumer Staples (3.9%) | |
| | 12,700 | | | | | Mondelez International, Inc. - Class A | | | 545,592 | |
| | 10,850 | | | | | Reynolds American, Inc. | | | 538,160 | |
| | 11,050 | | | | | Walgreens Boots Alliance, Inc. | | | 876,044 | |
| | | | | | | | | | |
| | | | | | | | | 1,959,796 | |
| | | | | | | | | | |
| | | | | | Energy (3.0%) | |
| | 9,000 | | | | | Diamondback Energy, Inc.# | | | 779,220 | |
| | 4,550 | | | | | Pioneer Natural Resources Company | | | 755,755 | |
| | | | | | | | | | |
| | | | | | | | | 1,534,975 | |
| | | | | | | | | | |
| | | | | | Financials (3.8%) | |
| | 20,000 | | | | | E*TRADE Financial Corp.# | | | 503,600 | |
| | 4,400 | | | | | Intercontinental Exchange, Inc. | | | 1,056,132 | |
| | 3,300 | | | | | SVB Financial Group# | | | 344,124 | |
| | | | | | | | | | |
| | | | | | | | | 1,903,856 | |
| | | | | | | | | | |
| | | | | | Health Care (14.8%) | |
| | 22,100 | | | | | AbbVie, Inc. | | | 1,348,100 | |
| | 14,400 | | | | | Acadia Healthcare Company, Inc.# | | | 909,936 | |
| | 5,150 | | | | | Alexion Pharmaceuticals, Inc.# | | | 717,292 | |
| | 2,300 | | | | | Allergan, PLC# | | | 498,088 | |
| | 5,050 | | | | | Celgene Corp.# | | | 522,220 | |
| | 6,650 | | | | | Centene Corp.# | | | 412,034 | |
| | 9,800 | | | | | Express Scripts Holding Company# | | | 722,554 | |
| | 3,175 | | | | | HCA Holdings, Inc.# | | | 255,969 | |
| | 6,000 | | | | | Perrigo Company, PLC | | | 580,020 | |
| | 3,950 | | | | | Shire, PLC^ | | | 740,309 | |
| | 16,400 | | | | | Zoetis, Inc. | | | 771,292 | |
| | | | | | | | | | |
| | | | | | | | | 7,477,814 | |
| | | | | | | | | | |
| | | | | | Industrials (9.0%) | |
| | 6,000 | | | | | Eaton Corp., PLC | | | 379,620 | |
| | 4,800 | | | | | Northrop Grumman Corp. | | | 990,048 | |
| | 3,950 | | | | | Raytheon Company | | | 499,082 | |
| | 13,555 | | | | | Southwest Airlines Company | | | 604,689 | |
| | 10,200 | | | | | United Parcel Service, Inc. - Class B | | | 1,071,714 | |
| | | | | | | | | | |
NUMBER OF
SHARES | | | | | | | VALUE | |
| | 14,400 | | | | | Waste Connections, Inc. | | $ | 968,832 | |
| | | | | | | | | | |
| | | | | | | | | 4,513,985 | |
| | | | | | | | | | |
| | | | | | Information Technology (35.2%) | |
| | 13,000 | | | | | Accenture, PLC - Class A | | | 1,467,960 | |
| | 4,800 | | | | | Alphabet, Inc. - Class A# | | | 3,397,824 | |
| | 33,050 | | | | | Apple, Inc. | | | 3,098,107 | |
| | 27,800 | | | | | Applied Materials, Inc. | | | 569,066 | |
| | 19,250 | | | | | Booz Allen Hamilton Holding Corp. | | | 530,722 | |
| | 3,430 | | | | | CoStar Group, Inc.# | | | 676,773 | |
| | 13,950 | | | | | Facebook, Inc. - Class A# | | | 1,640,241 | |
| | 23,700 | | | | | FireEye, Inc.#^ | | | 411,195 | |
| | 44,425 | | | | | InterXion Holding, NV# | | | 1,505,119 | |
| | 28,100 | | | | | Microsoft Corp. | | | 1,401,347 | |
| | 3,100 | | | | | NXP Semiconductors, NV# | | | 264,368 | |
| | 17,550 | | | | | Sabre Corp. | | | 508,073 | |
| | 10,600 | | | | | Salesforce.com, Inc.# | | | 803,480 | |
| | 18,600 | | | | | Visa, Inc. - Class A | | | 1,436,664 | |
| | | | | | | | | | |
| | | | | | | | | 17,710,939 | |
| | | | | | | | | | |
| | | | | | Materials (0.7%) | |
| | 5,100 | | | | | Scotts Miracle-Gro Co - Class A | | | 360,978 | |
| | | | | | | | | | |
| | | | | | Telecommunication Services (2.3%) | |
| | 30,000 | | | | | T-Mobile USA, Inc.# | | | 1,178,400 | |
| | | | | | | | | | |
| | | | | | TOTAL COMMON STOCKS
(Cost $43,564,930) | | | 46,805,933 | |
| | | | | | | | | | |
| | SHORT TERM INVESTMENT (7.8%) | | | | |
| | 3,909,309 | | | | | Fidelity Prime Money Market Fund - Institutional Class
(Cost $3,909,309) | | | 3,909,309 | |
| | | | | | | | | | |
| | | | | | | | | | |
NUMBER OF
SHARES/
PRINCIPAL
AMOUNT | | | | | | | VALUE | |
| INVESTMENT OF CASH COLLATERAL FOR SECURITIES
LOANED (1.7%) |
|
| | | | | | Federal Home Loan Bank Discount Notes | |
| | 183,584 | | | | | 0.000%, 06/15/16 | | | 183,584 | |
| | 146,884 | | | | | 0.000%, 05/24/16 | | | 146,884 | |
| | 110,166 | | | | | 0.000%, 05/02/16 | | | 110,166 | |
| | 169,579 | | | | | Fidelity Prime Money Market Fund - Institutional Class | | | 169,579 | |
| | 113,472 | | | | | Goldman Sachs Financial Square Prime Obligations Fund | | | 113,472 | |
| | | | | | |
| See accompanying Notes to Schedule of Investments | | www.calamos.com | | | 85 | |
Focus Growth Fund Schedule of Investments April 30, 2016 (Unaudited)
| | | | | | | | | | |
NUMBER OF
SHARES/
PRINCIPAL
AMOUNT | | | | | | | VALUE | |
| | 131,915 | | | | | Morgan Stanley Institutional Liquidity Fund | | $ | 131,915 | |
| | | | | | | | | | |
| | | | | | TOTAL INVESTMENT OF
CASH COLLATERAL FOR SECURITIES LOANED
(Cost $855,600) | | | 855,600 | |
| | | | | | | | | | |
| TOTAL INVESTMENTS (102.4%)
(Cost $48,329,839) | | | 51,570,842 | |
| | | | | | | | | | |
| |
| | PAYABLE UPON RETURN OF SECURITIES ON LOAN (-1.7%) | | | (855,600 | ) |
| | | | | | | | | | |
| |
| | LIABILITIES, LESS OTHER ASSETS (-0.7%) | | | (344,829 | ) |
| | | | | | | | | | |
| |
| | NET ASSETS (100.0%) | | $ | 50,370,413 | |
| | | | | | | | | | |
FORWARD FOREIGN CURRENCY CONTRACT
| | | | | | | | | | | | | | | | |
| COUNTERPARTY | | SHORT CONTRACTS | | SETTLEMENT DATE | | LOCAL CURRENCY | | | CURRENT VALUE | | | UNREALIZED GAIN/LOSS | |
| Northern Trust Company | | British Pound Sterling | | 07/21/16 | | | 482,000 | | | $ | 704,446 | | | $ | (11,078 | ) |
| | | | | | | | | | | | | | | | |
NOTES TO SCHEDULE OF INVESTMENTS
| # | Non-income producing security. |
| ^ | Security, or portion of security, is on loan. |
| | | | |
| 86 | | CALAMOS OPEN-END FAMILY OF FUNDS SEMIANNUAL REPORT | | See accompanying Notes to Financial Statements |
Discovery Growth Fund Schedule of Investments April 30, 2016 (Unaudited)
| | | | | | | | | | |
NUMBER OF
SHARES | | | | | | | VALUE | |
| | COMMON STOCKS (99.1%) | |
| | | | | | Consumer Discretionary (18.7%) | | | | |
| | 3,700 | | | | | AMC Networks, Inc. - Class A# | | $ | 241,351 | |
| | 3,475 | | | | | Bright Horizons Family Solutions, Inc.# | | | 228,029 | |
| | 6,400 | | | | | Burlington Stores, Inc.# | | | 364,608 | |
| | 5,400 | | | | | Cedar Fair, LP | | | 313,578 | |
| | 1,725 | | | | | Chuy’s Holdings, Inc.# | | | 52,682 | |
| | 8,800 | | | | | Gentherm, Inc.# | | | 323,312 | |
| | 12,600 | | | | | IMAX Corp.# | | | 403,200 | |
| | 5,300 | | | | | Lions Gate Entertainment Corp. | | | 117,660 | |
| | 1,800 | | | | | Lululemon Athletica, Inc.# | | | 117,990 | |
| | 6,000 | | | | | Norwegian Cruise Line Holdings, Ltd.# | | | 293,340 | |
| | 2,450 | | | | | Red Robin Gourmet Burgers, Inc.# | | | 158,907 | |
| | 600 | | | | | Signet Jewelers, Ltd. | | | 65,136 | |
| | 12,300 | | | | | Videocon d2h, Ltd.# | | | 95,817 | |
| | 1,925 | | | | | Williams-Sonoma, Inc. | | | 113,151 | |
| | | | | | | | | | |
| | | | | | | | | 2,888,761 | |
| | | | | | | | | | |
| | | | | | Energy (3.6%) | | | | |
| | 3,300 | | | | | Diamondback Energy, Inc.# | | | 285,714 | |
| | 1,575 | | | | | Pioneer Natural Resources Company | | | 261,608 | |
| | | | | | | | | | |
| | | | | | | | | 547,322 | |
| | | | | | | | | | |
| | | | | | Financials (9.0%) | | | | |
| | 4,600 | | | | | BankUnited, Inc. | | | 158,700 | |
| | 8,300 | | | | | Evercore Partners, Inc. - Class A | | | 428,612 | |
| | 1,950 | | | | | Jones Lang LaSalle, Inc. | | | 224,581 | |
| | 7,600 | | | | | PrivateBancorp, Inc. | | | 316,236 | |
| | 4,525 | | | | | Realogy Holdings Corp.# | | | 161,724 | |
| | 1,025 | | | | | SVB Financial Group# | | | 106,887 | |
| | | | | | | | | | |
| | | | | | | | | 1,396,740 | |
| | | | | | | | | | |
| | | | | | Health Care (25.1%) | | | | |
| | 9,600 | | | | | Acadia Healthcare Company, Inc.# | | | 606,624 | |
| | 5,375 | | | | | Acorda Therapeutics, Inc.# | | | 138,944 | |
| | 3,050 | | | | | Amsurg Corp.# | | | 246,989 | |
| | 4,750 | | | | | Centene Corp.# | | | 294,310 | |
| | 36,100 | | | | | Cerus Corp.# | | | 225,986 | |
| | 4,300 | | | | | Emergent Biosolutions, Inc.# | | | 165,636 | |
| | 12,500 | | | | | Envision Healthcare Holdings, Inc.# | | | 282,875 | |
| | 2,200 | | | | | Jazz Pharmaceuticals, PLC# | | | 331,540 | |
| | 15,200 | | | | | NxStage Medical, Inc.# | | | 245,024 | |
| | 6,000 | | | | | Otonomy, Inc.# | | | 85,560 | |
| | 41,100 | | | | | Staar Surgical Company# | | | 316,881 | |
| | 3,500 | | | | | STERIS, PLC | | | 247,345 | |
| | 6,600 | | | | | VCA, Inc.# | | | 415,602 | |
| | 3,800 | | | | | Veeva Systems, Inc., Class A# | | | 104,538 | |
| | 5,800 | | | | | Zeltiq Aesthetics, Inc.#^ | | | 173,420 | |
| | | | | | | | | | |
| | | | | | | | | 3,881,274 | |
| | | | | | | | | | |
| | | | | | | | | | |
NUMBER OF
SHARES | | | | | | | VALUE | |
| | | | | | Industrials (10.0%) | | | | |
| | 3,300 | | | | | Allegion, PLC | | $ | 215,985 | |
| | 1,500 | | | | | Dover Corp. | | | 98,550 | |
| | 2,000 | | | | | Lennox International, Inc. | | | 269,900 | |
| | 1,950 | | | | | Lincoln Electric Holdings, Inc. | | | 122,207 | |
| | 2,700 | | | | | Manpowergroup, Inc. | | | 207,981 | |
| | 1,725 | | | | | Orbital ATK, Inc. | | | 150,075 | |
| | 2,325 | | | | | United Rentals, Inc.# | | | 155,612 | |
| | 4,900 | | | | | Waste Connections, Inc. | | | 329,672 | |
| | | | | | | | | | |
| | | | | | | | | 1,549,982 | |
| | | | | | | | | | |
| | | | | | Information Technology (29.0%) | | | | |
| | 9,400 | | | | | Adtran, Inc. | | | 181,608 | |
| | 10,200 | | | | | Booz Allen Hamilton Holding Corp. | | | 281,214 | |
| | 46,000 | | | | | Calix, Inc.# | | | 318,780 | |
| | 3,700 | | | | | CommVault Systems, Inc.# | | | 161,949 | |
| | 1,850 | | | | | CoStar Group, Inc.# | | | 365,023 | |
| | 7,300 | | | | | Criteo, SA# | | | 304,337 | |
| | 9,400 | | | | | FireEye, Inc.#^ | | | 163,090 | |
| | 14,700 | | | | | Gogo, Inc.#^ | | | 155,673 | |
| | 19,300 | | | | | GTT Communications, Inc.# | | | 308,414 | |
| | 1,850 | | | | | Guidewire Software, Inc.# | | | 105,394 | |
| | 2,770 | | | | | Harris Corp. | | | 221,628 | |
| | 13,675 | | | | | InterXion Holding, NV# | | | 463,309 | |
| | 5,100 | | | | | J2 Global, Inc. | | | 323,952 | |
| | 3,800 | | | | | NICE-Systems, Ltd. | | | 242,630 | |
| | 4,025 | | | | | Sabre Corp. | | | 116,524 | |
| | 9,800 | | | | | SunPower Corp.#^ | | | 197,372 | |
| | 9,450 | | | | | VeriFone Systems, Inc.# | | | 268,947 | |
| | 24,900 | | | | | Workiva, Inc.#^ | | | 296,559 | |
| | | | | | | | | | |
| | | | | | | | | 4,476,403 | |
| | | | | | | | | | |
| | | | | | Materials (1.3%) | | | | |
| | 2,850 | | | | | Scotts Miracle-Gro Company, Class A | | | 201,723 | |
| | | | | | | | | | |
| | | | | | Telecommunication Services (2.4%) | | | | |
| | 14,350 | | | | | Zayo Group Holdings, Inc.# | | | 372,526 | |
| | | | | | | | | | |
| | | | | | TOTAL COMMON STOCKS
(Cost $15,219,256) | | | 15,314,731 | |
| | | | | | | | | | |
| | | | | | | | | | |
| | SHORT TERM INVESTMENT (1.5%) | | | | |
| | 233,218 | | | | | Fidelity Prime Money Market Fund - Institutional Class
(Cost $233,218) | | | 233,218 | |
| | | | | | | | | | |
| | | | | | |
| See accompanying Notes to Schedule of Investments | | www.calamos.com | | | 87 | |
Discovery Growth Fund Schedule of Investments April 30, 2016 (Unaudited)
| | | | | | | | | | |
NUMBER OF
SHARES/
PRINCIPAL
AMOUNT | | | | | | | VALUE | |
| INVESTMENT OF CASH COLLATERAL FOR SECURITIES
LOANED (5.7%) |
|
| | | | | | Federal Home Loan Bank Discount Notes | | | | |
| | 187,440 | | | | | 0.000%, 06/15/16 | | $ | 187,440 | |
| | 149,970 | | | | | 0.000%, 05/24/16 | | | 149,970 | |
| | 112,481 | | | | | 0.000%, 05/02/16 | | | 112,481 | |
| | 173,142 | | | | | Fidelity Prime Money Market Fund - Institutional Class | | | 173,142 | |
| | 115,856 | | | | | Goldman Sachs Financial Square Prime Obligations Fund | | | 115,856 | |
| | 134,686 | | | | | Morgan Stanley Institutional Liquidity Fund | | | 134,686 | |
| | | | | | | | | | |
| | | | | | TOTAL INVESTMENT OF
CASH COLLATERAL FOR
SECURITIES LOANED
(Cost $873,575) | | | 873,575 | |
| | | | | | | | | | |
| TOTAL INVESTMENTS (106.3%)
(Cost $16,326,049) | | | 16,421,524 | |
| | | | | | | | | | |
| |
| | PAYABLE UPON RETURN OF SECURITIES ON LOAN (-5.7%) | | | (873,575 | ) |
| | | | | | | | | | |
| |
| | LIABILITIES, LESS OTHER ASSETS (-0.6%) | | | (98,429 | ) |
| | | | | | | | | | |
| |
| | NET ASSETS (100.0%) | | $ | 15,449,520 | |
| | | | | | | | | | |
NOTE TO SCHEDULE OF INVESTMENTS
| # | Non-income producing security. |
| ^ | Security, or portion of security, is on loan. |
| | | | |
| 88 | | CALAMOS OPEN-END FAMILY OF FUNDS SEMIANNUAL REPORT | | See accompanying Notes to Financial Statements |
Dividend Growth Fund Schedule of Investments April 30, 2016 (Unaudited)
| | | | | | | | | | |
NUMBER OF
SHARES | | | | | | | VALUE | |
| | COMMON STOCKS (94.1%) | |
| | | | | | Consumer Discretionary (12.8%) | |
| | 755 | | | | | Amazon.com, Inc.# | | $ | 497,990 | |
| | 5,600 | | | | | Comcast Corp. - Class A | | | 340,256 | |
| | 9,715 | | | | | Ford Motor Company | | | 131,735 | |
| | 4,115 | | | | | General Motors Company, Inc. | | | 130,857 | |
| | 4,970 | | | | | Home Depot, Inc. | | | 665,433 | |
| | 2,920 | | | | | McDonald’s Corp. | | | 369,351 | |
| | 4,960 | | | | | Nike, Inc. - Class B | | | 292,342 | |
| | 4,420 | | | | | Omnicom Group, Inc. | | | 366,728 | |
| | 130 | | | | | Priceline Group, Inc.# | | | 174,676 | |
| | 1,205 | | | | | Royal Caribbean Cruises, Ltd. | | | 93,267 | |
| | 7,200 | | | | | Starbucks Corp. | | | 404,856 | |
| | 6,150 | | | | | Target Corp. | | | 488,925 | |
| | 785 | | | | | Time Warner Cable, Inc. | | | 166,506 | |
| | 1,855 | | | | | Time Warner, Inc. | | | 139,385 | |
| | 4,000 | | | | | Walt Disney Company | | | 413,040 | |
| | | | | | | | | | |
| | | | | | | | | 4,675,347 | |
| | | | | | | | | | |
| | | | | | Consumer Staples (9.5%) | |
| | 4,450 | | | | | Altria Group, Inc. | | | 279,059 | |
| | 7,700 | | | | | Coca-Cola Company | | | 344,960 | |
| | 1,750 | | | | | Costco Wholesale Corp. | | | 259,228 | |
| | 2,475 | | | | | CVS Health Corp. | | | 248,738 | |
| | 3,020 | | | | | Kroger Company | | | 106,878 | |
| | 5,450 | | | | | Mondelez International, Inc. - Class A | | | 234,132 | |
| | 5,000 | | | | | PepsiCo, Inc. | | | 514,800 | |
| | 5,385 | | | | | Philip Morris International, Inc. | | | 528,376 | |
| | 2,870 | | | | | Procter & Gamble Company | | | 229,944 | |
| | 3,555 | | | | | Reynolds American, Inc. | | | 176,328 | |
| | 6,915 | | | | | Walgreens Boots Alliance, Inc. | | | 548,221 | |
| | | | | | | | | | |
| | | | | | | | | 3,470,664 | |
| | | | | | | | | | |
| | | | | | Energy (5.5%) | |
| | 3,940 | | | | | Chevron Corp. | | | 402,589 | |
| | 3,400 | | | | | ConocoPhillips | | | 162,486 | |
| | 1,770 | | | | | EOG Resources, Inc. | | | 146,238 | |
| | 8,495 | | | | | Exxon Mobil Corp. | | | 750,958 | |
| | 1,750 | | | | | Marathon Petroleum Corp. | | | 68,390 | |
| | 2,100 | | | | | Phillips 66 | | | 172,431 | |
| | 3,865 | | | | | Schlumberger, Ltd. | | | 310,514 | |
| | | | | | | | | | |
| | | | | | | | | 2,013,606 | |
| | | | | | | | | | |
| | | | | | Financials (14.6%) | |
| | 2,025 | | | | | American Express Company | | | 132,496 | |
| | 5,850 | | | | | American International Group, Inc. | | | 326,547 | |
| | 4,400 | | | | | American Tower Corp. | | | 461,472 | |
| | 18,800 | | | | | Bank of America Corp. | | | 273,728 | |
| | 8,850 | | | | | Bank of New York Mellon Corp. | | | 356,124 | |
| | | | | | | | | | |
NUMBER OF
SHARES | | | | | | | VALUE | |
| | 9,570 | | | | | BB&T Corp. | | $ | 338,587 | |
| | 3,255 | | | | | Berkshire Hathaway, Inc. - Class B# | | | 473,537 | |
| | 7,900 | | | | | Charles Schwab Corp. | | | 224,439 | |
| | 5,715 | | | | | Citigroup, Inc. | | | 264,490 | |
| | 1,050 | | | | | Crown Castle International Corp. | | | 91,224 | |
| | 800 | | | | | Goldman Sachs Group, Inc. | | | 131,288 | |
| | 1,225 | | | | | Intercontinental Exchange, Inc. | | | 294,037 | |
| | 13,080 | | | | | JPMorgan Chase & Company | | | 826,656 | |
| | 4,300 | | | | | MetLife, Inc. | | | 193,930 | |
| | 1,800 | | | | | Prudential Financial, Inc. | | | 139,752 | |
| | 3,170 | | | | | State Street Corp. | | | 197,491 | |
| | 800 | | | | | Travelers Companies, Inc. | | | 87,920 | |
| | 10,790 | | | | | Wells Fargo & Company~ | | | 539,284 | |
| | | | | | | | | | |
| | | | | | | | | 5,353,002 | |
| | | | | | | | | | |
| | | | | | Health Care (14.7%) | |
| | 4,850 | | | | | Abbott Laboratories | | | 188,665 | |
| | 3,200 | | | | | AbbVie, Inc. | | | 195,200 | |
| | 1,025 | | | | | Alexion Pharmaceuticals, Inc.# | | | 142,762 | |
| | 630 | | | | | Allergan, PLC# | | | 136,433 | |
| | 1,400 | | | | | Amgen, Inc. | | | 221,620 | |
| | 2,300 | | | | | Anthem, Inc. | | | 323,771 | |
| | 350 | | | | | Biogen, Inc.# | | | 96,247 | |
| | 3,200 | | | | | Bristol-Myers Squibb Company | | | 230,976 | |
| | 2,665 | | | | | Cardinal Health, Inc. | | | 209,096 | |
| | 2,175 | | | | | Celgene Corp.# | | | 224,917 | |
| | 1,650 | | | | | Express Scripts Holding Company# | | | 121,654 | |
| | 3,250 | | | | | Gilead Sciences, Inc. | | | 286,682 | |
| | 480 | | | | | Illumina, Inc.# | | | 64,795 | |
| | 4,500 | | | | | Johnson & Johnson~ | | | 504,360 | |
| | 760 | | | | | Laboratory Corp. of America Holdings# | | | 95,243 | |
| | 14,765 | | | | | Merck & Company, Inc. | | | 809,713 | |
| | 20,550 | | | | | Pfizer, Inc. | | | 672,190 | |
| | 3,230 | | | | | Stryker Corp. | | | 352,102 | |
| | 1,020 | | | | | Thermo Fisher Scientific, Inc. | | | 147,135 | |
| | 1,535 | | | | | UnitedHealth Group, Inc. | | | 202,129 | |
| | 1,340 | | | | | Zimmer Biomet Holdings, Inc. | | | 155,132 | |
| | | | | | | | | | |
| | | | | | | | | 5,380,822 | |
| | | | | | | | | | |
| | | | | | Industrials (9.8%) | |
| | 880 | | | | | 3M Company | | | 147,294 | |
| | 3,095 | | | | | Boeing Company | | | 417,206 | |
| | 8,480 | | | | | CSX Corp. | | | 231,250 | |
| | 3,475 | | | | | Delta Air Lines, Inc. | | | 144,803 | |
| | 3,300 | | | | | Eaton Corp., PLC | | | 208,791 | |
| | 20,965 | | | | | General Electric Company | | | 644,674 | |
| | 4,360 | | | | | Honeywell International, Inc. | | | 498,217 | |
| | 3,550 | | | | | Ingersoll-Rand, PLC | | | 232,667 | |
| | 1,605 | | | | | Lockheed Martin Corp. | | | 372,970 | |
| | | | | | |
| See accompanying Notes to Schedule of Investments | | www.calamos.com | | | 89 | |
Dividend Growth Fund Schedule of Investments April 30, 2016 (Unaudited)
| | | | | | | | | | |
NUMBER OF
SHARES | | | | | | | VALUE | |
| | 1,615 | | | | | Stanley Black & Decker, Inc. | | $ | 180,751 | |
| | 1,600 | | | | | Union Pacific Corp. | | | 139,568 | |
| | 975 | | | | | United Parcel Service, Inc. - Class B | | | 102,443 | |
| | 2,700 | | | | | United Technologies Corp. | | | 281,799 | |
| | | | | | | | | | |
| | | | | | | | | 3,602,433 | |
| | | | | | | | | | |
| | | | | | Information Technology (18.0%) | |
| | 1,785 | | | | | Accenture, PLC - Class A | | | 201,562 | |
| | 175 | | | | | Alphabet, Inc. - Class A# | | | 123,879 | |
| | 1,002 | | | | | Alphabet, Inc. - Class C# | | | 694,396 | |
| | 12,100 | | | | | Apple, Inc. | | | 1,134,254 | |
| | 8,295 | | | | | Cisco Systems, Inc. | | | 228,030 | |
| | 2,100 | | | | | Electronic Arts, Inc.# | | | 129,885 | |
| | 5,050 | | | | | Facebook, Inc. - Class A# | | | 593,779 | |
| | 12,830 | | | | | Intel Corp. | | | 388,492 | |
| | 1,695 | | | | | International Business Machines Corp. | | | 247,368 | |
| | 2,400 | | | | | Lam Research Corp. | | | 183,360 | |
| | 2,900 | | | | | MasterCard, Inc. - Class A | | | 281,271 | |
| | 17,335 | | | | | Microsoft Corp. | | | 864,497 | |
| | 3,300 | | | | | NVIDIA Corp. | | | 117,249 | |
| | 6,000 | | | | | Oracle Corp. | | | 239,160 | |
| | 2,530 | | | | | QUALCOMM, Inc. | | | 127,816 | |
| | 1,300 | | | | | Red Hat, Inc.# | | | 95,381 | |
| | 3,300 | | | | | Salesforce.com, Inc.# | | | 250,140 | |
| | 3,000 | | | | | Texas Instruments, Inc. | | | 171,120 | |
| | 4,650 | | | | | Visa, Inc. - Class A | | | 359,166 | |
| | 3,750 | | | | | Xilinx, Inc. | | | 161,550 | |
| | | | | | | | | | |
| | | | | | | | | 6,592,355 | |
| | | | | | | | | | |
| | | | | | Materials (2.1%) | |
| | 1,700 | | | | | Avery Dennison Corp. | | | 123,437 | |
| | 5,350 | | | | | Dow Chemical Company | | | 281,463 | |
| | 4,300 | | | | | E.I. du Pont de Nemours and Company | | | 283,413 | |
| | 1,200 | | | | | LyondellBasell Industries, NV - Class A | | | 99,204 | |
| | | | | | | | | | |
| | | | | | | | | 787,517 | |
| | | | | | | | | | |
| | | | | | Telecommunication Services (3.5%) | |
| | 9,400 | | | | | AT&T, Inc. | | | 364,908 | |
| | 18,284 | | | | | Verizon Communications, Inc. | | | 931,387 | |
| | | | | | | | | | |
| | | | | | | | | 1,296,295 | |
| | | | | | | | | | |
| | | | | | Utilities (3.6%) | |
| | 4,400 | | | | | Dominion Resources, Inc. | | | 314,468 | |
| | 4,000 | | | | | Duke Energy Corp. | | | 315,120 | |
| | 9,500 | | | | | Exelon Corp. | | | 333,355 | |
| | 3,100 | | | | | NextEra Energy, Inc. | | | 364,498 | |
| | | | | | | | | | |
| | | | | | | | | 1,327,441 | |
| | | | | | | | | | |
| | | | | | TOTAL COMMON STOCKS
(Cost $33,430,365) | | | 34,499,482 | |
| | | | | | | | | | |
| | | | | | | | | | |
| | | | | | | | | | |
NUMBER OF
SHARES | | | | | | | VALUE | |
| | SHORT TERM INVESTMENT (6.0%) | | | | |
| | 2,197,345 | | | | | Fidelity Prime Money Market Fund - Institutional Class
(Cost $2,197,345) | | $ | 2,197,345 | |
| | | | | | | | | | |
| TOTAL INVESTMENTS (100.1%)
(Cost $35,627,710) | | | 36,696,827 | |
| | | | | | | | | | |
| |
| | LIABILITIES, LESS OTHER ASSETS (-0.1%) | | | (40,309 | ) |
| | | | | | | | | | |
| |
| | NET ASSETS (100.0%) | | $ | 36,656,518 | |
| | | | | | | | | | |
NOTES TO SCHEDULE OF INVESTMENTS
| # | Non-income producing security. |
| ~ | Security, or portion of security, is segregated as collateral (or potential collateral for future transactions) for written options. The aggregate value of such securities is $238,969. |
| | | | |
| 90 | | CALAMOS OPEN-END FAMILY OF FUNDS SEMIANNUAL REPORT | | See accompanying Notes to Financial Statements |
Mid Cap Growth Fund Schedule of Investments April 30, 2016 (Unaudited)
| | | | | | | | | | |
NUMBER OF
SHARES | | | | | | | VALUE | |
| | COMMON STOCKS (98.3%) | |
| | | | | | Consumer Discretionary (24.8%) | |
| �� | 2,175 | | | | | AMC Networks, Inc. - Class A# | | $ | 141,875 | |
| | 135 | | | | | AutoZone, Inc.# | | | 103,306 | |
| | 3,375 | | | | | Burlington Stores, Inc.# | | | 192,274 | |
| | 950 | | | | | Delphi Automotive, PLC | | | 69,949 | |
| | 1,675 | | | | | Dollar General Corp. | | | 137,199 | |
| | 1,750 | | | | | Gentherm, Inc.# | | | 64,295 | |
| | 6,625 | | | | | Hilton Worldwide Holdings, Inc. | | | 146,081 | |
| | 3,000 | | | | | IMAX Corp.# | | | 96,000 | |
| | 3,850 | | | | | Liberty Global, PLC - Class A# | | | 145,260 | |
| | 2,825 | | | | | Lions Gate Entertainment Corp. | | | 62,715 | |
| | 725 | | | | | Lululemon Athletica, Inc.# | | | 47,524 | |
| | 1,700 | | | | | Norwegian Cruise Line Holdings, Ltd.# | | | 83,113 | |
| | 1,225 | | | | | Red Robin Gourmet Burgers, Inc.# | | | 79,453 | |
| | 400 | | | | | Signet Jewelers, Ltd. | | | 43,424 | |
| | 225 | | | | | Tesla Motors, Inc.# | | | 54,171 | |
| | 1,025 | | | | | Williams-Sonoma, Inc. | | | 60,250 | |
| | | | | | | | | | |
| | | | | | | | | 1,526,889 | |
| | | | | | | | | | |
| | | | | | Energy (3.5%) | |
| | 1,125 | | | | | Diamondback Energy, Inc.# | | | 97,403 | |
| | 710 | | | | | Pioneer Natural Resources Company | | | 117,931 | |
| | | | | | | | | | |
| | | | | | | | | 215,334 | |
| | | | | | | | | | |
| | | | | | Financials (9.3%) | |
| | 4,100 | | | | | Evercore Partners, Inc. - Class A | | | 211,724 | |
| | 1,625 | | | | | Jones Lang LaSalle, Inc. | | | 187,151 | |
| | 1,475 | | | | | PrivateBancorp, Inc. | | | 61,375 | |
| | 2,025 | | | | | Realogy Holdings Corp.# | | | 72,373 | |
| | 400 | | | | | SVB Financial Group# | | | 41,712 | |
| | | | | | | | | | |
| | | | | | | | | 574,335 | |
| | | | | | | | | | |
| | | | | | Health Care (19.3%) | |
| | 3,700 | | | | | Acadia Healthcare Company, Inc.# | | | 233,803 | |
| | 1,625 | | | | | Amsurg Corp.# | | | 131,592 | |
| | 1,000 | | | | | Centene Corp.# | | | 61,960 | |
| | 5,500 | | | | | Envision Healthcare Holdings, Inc.# | | | 124,465 | |
| | 5,600 | | | | | IMS Health Holdings, Inc.# | | | 149,184 | |
| | 675 | | | | | Jazz Pharmaceuticals, PLC# | | | 101,722 | |
| | 1,000 | | | | | Perrigo Company, PLC | | | 96,670 | |
| | 1,025 | | | | | STERIS, PLC | | | 72,437 | |
| | 1,475 | | | | | VCA, Inc.# | | | 92,881 | |
| | 2,725 | | | | | Zoetis, Inc. | | | 128,157 | |
| | | | | | | | | | |
| | | | | | | | | 1,192,871 | |
| | | | | | | | | | |
| | | | | | Industrials (12.6%) | |
| | 825 | | | | | Allegion, PLC | | | 53,996 | |
| | 8,100 | | | | | CSX Corp. | | | 220,887 | |
| | 400 | | | | | Lennox International, Inc. | | | 53,980 | |
| | | | | | | | | | |
NUMBER OF
SHARES | | | | | | | VALUE | |
| | 750 | | | | | Lincoln Electric Holdings, Inc. | | $ | 47,003 | |
| | 2,000 | | | | | Manpowergroup, Inc. | | | 154,060 | |
| | 600 | | | | | Orbital ATK, Inc. | | | 52,200 | |
| | 1,560 | | | | | Southwest Airlines Company | | | 69,592 | |
| | 925 | | | | | United Rentals, Inc.# | | | 61,910 | |
| | 900 | | | | | Waste Connections, Inc. | | | 60,552 | |
| | | | | | | | | | |
| | | | | | | | | 774,180 | |
| | | | | | | | | | |
| | | | | | Information Technology (23.9%) | |
| | 4,150 | | | | | Adtran, Inc. | | | 80,178 | |
| | 7,650 | | | | | Booz Allen Hamilton Holding Corp. | | | 210,911 | |
| | 1,100 | | | | | CommVault Systems, Inc.# | | | 48,147 | |
| | 2,575 | | | | | Corning, Inc. | | | 48,075 | |
| | 870 | | | | | CoStar Group, Inc.# | | | 171,660 | |
| | 6,500 | | | | | FireEye, Inc.#^ | | | 112,775 | |
| | 8,200 | | | | | Gogo, Inc.#^ | | | 86,838 | |
| | 5,425 | | | | | InterXion Holding, NV# | | | 183,799 | |
| | 1,070 | | | | | Red Hat, Inc.# | | | 78,506 | |
| | 4,400 | | | | | Sabre Corp. | | | 127,380 | |
| | 2,950 | | | | | SunPower Corp.#^ | | | 59,413 | |
| | 1,080 | | | | | TE Connectivity, Ltd. | | | 64,238 | |
| | 7,200 | | | | | VeriFone Systems, Inc.# | | | 204,912 | |
| | | | | | | | | | |
| | | | | | | | | 1,476,832 | |
| | | | | | | | | | |
| | | | | | Materials (0.9%) | |
| | 750 | | | | | Scotts Miracle-Gro Company, Class A | | | 53,085 | |
| | | | | | | | | | |
| | | | | | Telecommunication Services (4.0%) | |
| | 3,700 | | | | | T-Mobile USA, Inc.# | | | 145,336 | |
| | 3,950 | | | | | Zayo Group Holdings, Inc.# | | | 102,542 | |
| | | | | | | | | | |
| | | | | | | | | 247,878 | |
| | | | | | | | | | |
| | | | | | TOTAL COMMON STOCKS
(Cost $6,642,030) | | | 6,061,404 | |
| | | | | | | | | | |
| | | | | | | | | | |
| | SHORT TERM INVESTMENT (0.6%) | | | | |
| | 38,133 | | | | | Fidelity Prime Money Market Fund - Institutional Class
(Cost $38,133) | | | 38,133 | |
| | | | | | | | | | |
| | | | | | | | | | |
NUMBER OF
SHARES/
PRINCIPAL
AMOUNT | | | | | | | VALUE | |
| INVESTMENT OF CASH COLLATERAL FOR SECURITIES
LOANED (3.8%) |
|
| | | | | | Federal Home Loan Bank Discount Notes | |
| | 49,485 | | | | | 0.000%, 06/15/16 | | | 49,485 | |
| | 39,592 | | | | | 0.000%, 05/24/16 | | | 39,592 | |
| | 29,695 | | | | | 0.000%, 05/02/16 | | | 29,695 | |
| | 45,710 | | | | | Fidelity Prime Money Market Fund - Institutional Class | | | 45,710 | |
| | | | | | |
| See accompanying Notes to Schedule of Investments | | www.calamos.com | | | 91 | |
Mid Cap Growth Fund Schedule of Investments April 30, 2016 (Unaudited)
| | | | | | | | | | |
NUMBER OF
SHARES/
PRINCIPAL
AMOUNT | | | | | | | VALUE | |
| | 35,557 | | | | | Morgan Stanley Institutional Liquidity Fund | | $ | 35,557 | |
| | 30,586 | | | | | Goldman Sachs Financial Square Prime Obligations Fund | | | 30,586 | |
| | | | | | | | | | |
| | | | | | TOTAL INVESTMENT OF
CASH COLLATERAL FOR
SECURITIES LOANED
(Cost $230,625) | | | 230,625 | |
| | | | | | | | | | |
| TOTAL INVESTMENTS (102.7%)
(Cost $6,910,788) | | | 6,330,162 | |
| | | | | | | | | | |
| |
| | PAYABLE UPON RETURN OF SECURITIES ON LOAN (-3.7%) | | | (230,625 | ) |
| | | | | | | | | | |
| |
| | OTHER ASSETS, LESS LIABILITIES (1.0%) | | | 66,472 | |
| | | | | | | | | | |
| |
| | NET ASSETS (100.0%) | | $ | 6,166,009 | |
| | | | | | | | | | |
NOTES TO SCHEDULE OF INVESTMENTS
| # | Non-income producing security. |
| ^ | Security, or portion of security, is on loan. |
| | | | |
| 92 | | CALAMOS OPEN-END FAMILY OF FUNDS SEMIANNUAL REPORT | | See accompanying Notes to Financial Statements |
International Growth Fund Schedule of Investments April 30, 2016 (Unaudited)
| | | | | | | | | | |
NUMBER OF
SHARES | | | | | | | VALUE | |
| | COMMON STOCKS (99.0%) | |
| | | | | | Consumer Discretionary (12.5%) | |
| | 152,750 | | | | | Ctrip.com International, Ltd.#^ | | $ | 6,661,428 | |
| | 50,000 | | | EUR | | Daimler, AG | | | 3,483,834 | |
| | 53,000 | | | | | Delphi Automotive, PLC | | | 3,902,390 | |
| | 254,500 | | | GBP | | Domino’s Pizza Group, PLC | | | 3,421,666 | |
| | 22,000 | | | EUR | | LVMH Moet Hennessy Louis Vuitton, SE | | | 3,665,454 | |
| | 1,230,685 | | | INR | | Motherson Sumi Systems, Ltd. | | | 4,669,293 | |
| | 65,150 | | | ZAR | | Naspers, Ltd. - Class N | | | 8,965,384 | |
| | 81,000 | | | DKK | | Pandora, A/S | | | 10,531,017 | |
| | 20,000 | | | JPY | | Ryohin Keikaku Company, Ltd. | | | 4,637,218 | |
| | 70,300 | | | JPY | | Toyota Motor Corp. | | | 3,735,679 | |
| | 220,131 | | | GBP | | WPP, PLC | | | 5,142,832 | |
| | | | | | | | | | |
| | | | | | | | | 58,816,195 | |
| | | | | | | | | | |
| | | | | | Consumer Staples (16.0%) | |
| | 118,600 | | | EUR | | Anheuser-Busch InBev, SA | | | 14,712,798 | |
| | 157,000 | | | GBP | | British American Tobacco, PLC | | | 9,572,624 | |
| | 369,000 | | | GBP | | Diageo, PLC | | | 9,976,325 | |
| | 105,000 | | | CHF | | Nestlé, SA | | | 7,837,167 | |
| | 80,450 | | | GBP | | Reckitt Benckiser Group, PLC | | | 7,837,355 | |
| | 121,000 | | | JPY | | Seven & I Holdings Company, Ltd. | | | 5,166,382 | |
| | 128,000 | | | SEK | | Svenska Cellulosa, AB SCA | | | 4,038,609 | |
| | 215,000 | | | EUR | | Unilever, NV^ | | | 9,444,920 | |
| | 2,590,000 | | | MXN | | Wal-Mart de Mexico SAB de CV | | | 6,400,990 | |
| | | | | | | | | | |
| | | | | | | | | 74,987,170 | |
| | | | | | | | | | |
| | | | | | Energy (4.4%) | |
| | 135,000 | | | EUR | | Royal Dutch Shell, PLC | | | 3,566,415 | |
| | 103,000 | | | | | Schlumberger, Ltd. | | | 8,275,020 | |
| | 170,000 | | | EUR | | TOTAL, SA | | | 8,591,936 | |
| | | | | | | | | | |
| | | | | | | | | 20,433,371 | |
| | | | | | | | | | |
| | | | | | Financials (11.6%) | |
| | 888,400 | | | HKD | | AIA Group, Ltd. | | | 5,316,724 | |
| | 62,000 | | | EUR | | AURELIUS, SE & Co. KGaA | | | 3,711,004 | |
| | 209,850 | | | EUR | | Azimut Holding, S.p.A | | | 5,296,897 | |
| | 837,000 | | | JPY | | Daiwa Securities Group, Inc. | | | 5,083,359 | |
| | 55,000 | | | EUR | | Flow Traders* | | | 2,183,208 | |
| | 215,000 | | | INR | | Housing Development Finance Corp., Ltd. | | | 3,523,250 | |
| | 321,000 | | | EUR | | ING Groep, NV | | | 3,933,349 | |
| | 800,000 | | | JPY | | Kenedix, Inc. | | | 3,571,428 | |
| | 327,000 | | | EUR | | Merlin Properties Socimi, SA | | | 3,806,170 | |
| | 1,999,854 | | | PHP | | Metropolitan Bank & Trust Company | | | 3,463,039 | |
| | 155,000 | | | EUR | | PATRIZIA Immobilien, AG# | | | 3,594,786 | |
| | 201,600 | | | GBP | | Prudential, PLC | | | 3,979,493 | |
| | 180,000 | | | GBP | | St. James’s Place, PLC | | | 2,284,865 | |
| | 140,452 | | | EUR | | Vonovia, SE | | | 4,734,378 | |
| | | | | | | | | | |
| | | | | | | | | 54,481,950 | |
| | | | | | | | | | |
| | | | | | | | | | |
NUMBER OF
SHARES | | | | | | | VALUE | |
| | | | | | Health Care (14.9%) | |
| | 17,500 | | | | | Allergan, PLC# | | $ | 3,789,800 | |
| | 365,000 | | | JPY | | Chugai Pharmaceutical Company, Ltd. | | | 12,898,496 | |
| | 99,000 | | | EUR | | Fresenius, SE & Company KGaA | | | 7,218,908 | |
| | 160,000 | | | DKK | | H Lundbeck, A/S#^ | | | 5,346,075 | |
| | 1,866,000 | | | AUD | | Healthscope, Ltd. | | | 3,843,021 | |
| | 153,000 | | | GBP | | Hikma Pharmaceuticals, PLC | | | 4,932,819 | |
| | 38,500 | | | JPY | | Kaken Pharmaceutical Company, Ltd. | | | 2,196,382 | |
| | 70,000 | | | | | LivaNova, PLC# | | | 3,691,100 | |
| | 134,000 | | | DKK | | Novo Nordisk, A/S - Class B | | | 7,481,809 | |
| | 32,800 | | | CHF | | Roche Holding, AG | | | 8,298,703 | |
| | 137,951 | | | EUR | | UCB, SA^ | | | 10,347,594 | |
| | | | | | | | | | |
| | | | | | | | | 70,044,707 | |
| | | | | | | | | | |
| | | | | | Industrials (13.1%) | |
| | 70,500 | | | EUR | | ANDRITZ, AG | | | 3,957,318 | |
| | 312,000 | | | GBP | | Ashtead Group, PLC | | | 4,149,418 | |
| | 61,000 | | | CAD | | Canadian National Railway Company | | | 3,756,165 | |
| | 548,560 | | | HKD | | CK Hutchison Holdings, Ltd. | | | 6,562,765 | |
| | 5,700 | | | CHF | | dorma+kaba Holding AG | | | 3,701,459 | |
| | 43,100 | | | JPY | | FANUC Corp. | | | 6,685,766 | |
| | 124,750 | | | EUR | | KION Group, AG | | | 6,812,288 | |
| | 359,000 | | | JPY | | MISUMI Group, Inc. | | | 5,243,289 | |
| | 76,000 | | | JPY | | Nidec Corp. | | | 5,846,428 | |
| | 52,250 | | | EUR | | Safran, SA | | | 3,602,097 | |
| | 73,000 | | | EUR | | Schneider Electric, SE | | | 4,773,295 | |
| | 71,500 | | | EUR | | Thales, SA | | | 6,187,445 | |
| | | | | | | | | | |
| | | | | | | | | 61,277,733 | |
| | | | | | | | | | |
| | | | | | Information Technology (23.6%) | |
| | 38,000 | | | | | Accenture, PLC - Class A | | | 4,290,960 | |
| | 74,000 | | | | | Alibaba Group Holding, Ltd.# | | | 5,693,560 | |
| | 354,045 | | | GBP | | ARM Holdings, PLC | | | 4,859,576 | |
| | 65,400 | | | | | Baidu, Inc.# | | | 12,707,220 | |
| | 85,000 | | | | | Check Point Software Technologies, Ltd.#^ | | | 7,043,950 | |
| | 89,000 | | | CAD | | Enghouse Systems, Ltd. | | | 3,720,451 | |
| | 4,300 | | | JPY | | Keyence Corp. | | | 2,714,173 | |
| | 10,200 | | | KRW | | NAVER Corp. | | | 6,045,003 | |
| | 68,700 | | | | | NXP Semiconductors, NV# | | | 5,858,736 | |
| | 103,300 | | | JPY | | Optex Company, Ltd. | | | 3,441,715 | |
| | 156,800 | | | EUR | | SAP SE | | | 12,302,697 | |
| | 264,000 | | | JPY | | Square Enix Holdings Company, Ltd. | | | 7,044,135 | |
| | 3,103,000 | | | TWD | | Taiwan Semiconductor Manufacturing Company, Ltd. | | | 14,256,330 | |
| | 678,900 | | | HKD | | Tencent Holdings, Ltd. | | | 13,814,472 | |
| | 73,000 | | | EUR | | United Internet, AG | | | 3,568,108 | |
| | 18,561 | | | EUR | | XING, AG | | | 3,523,832 | |
| | | | | | | | | | |
| | | | | | | | | 110,884,918 | |
| | | | | | | | | | |
| | | | | | |
| See accompanying Notes to Schedule of Investments | | www.calamos.com | | | 93 | |
International Growth Fund Schedule of Investments April 30, 2016 (Unaudited)
| | | | | | | | | | |
NUMBER OF
SHARES | | | | | | | VALUE | |
| | | | | | Materials (2.1%) | |
| | 200,000 | | | EUR | | Buzzi Unicem S.p.A | | $ | 3,798,911 | |
| | 420,000 | | | AUD | | Newcrest Mining, Ltd.# | | | 6,124,281 | |
| | | | | | | | | | |
| | | | | | | | | 9,923,192 | |
| | | | | | | | | | |
| | | | | | Telecommunication Services (0.8%) | |
| | 205,000 | | | EUR | | Deutsche Telekom, AG | | | 3,598,454 | |
| | | | | | | | | | |
| | | | | | TOTAL COMMON STOCKS
(Cost $438,424,968) | | | 464,447,690 | |
| | | | | | | | | | |
| | | | | | | | | | |
| | SHORT TERM INVESTMENT (1.6%) | | | | |
| | 7,466,188 | | | | | Fidelity Prime Money Market Fund - Institutional Class
(Cost $7,466,188) | | | 7,466,188 | |
| | | | | | | | | | |
| | | | | | | | | | |
NUMBER OF
SHARES/
PRINCIPAL
AMOUNT | | | | | | | VALUE | |
| INVESTMENT OF CASH COLLATERAL FOR SECURITIES
LOANED (6.9%) |
|
| | | | | | Federal Home Loan Bank Discount Notes | | | | |
| | 6,992,553 | | | | | 0.000%, 06/15/16 | | | 6,992,553 | |
| | 5,594,698 | | | | | 0.000%, 05/24/16 | | | 5,594,698 | |
| | 4,196,140 | | | | | 0.000%, 05/02/16 | | | 4,196,140 | |
| | 6,459,130 | | | | | Fidelity Prime Money Market Fund - Institutional Class | | | 6,459,130 | |
| | 4,322,052 | | | | | Goldman Sachs Financial Square Prime Obligations Fund | | | 4,322,052 | |
| | 5,024,510 | | | | | Morgan Stanley Institutional Liquidity Fund | | | 5,024,510 | |
| | | | | | | | | | |
| | | | | | TOTAL INVESTMENT OF
CASH COLLATERAL FOR
SECURITIES LOANED
(Cost $32,589,083) | | | 32,589,083 | |
| | | | | | | | | | |
| TOTAL INVESTMENTS (107.5%)
(Cost $478,480,239) | | | 504,502,961 | |
| | | | | | | | | | |
| |
| | PAYABLE UPON RETURN OF SECURITIES ON LOAN (-6.9%) | | | (32,589,083 | ) |
| | | | | | | | | | |
| |
| | LIABILITIES, LESS OTHER ASSETS (-0.6%) | | | (2,535,395 | ) |
| | | | | | | | | | |
| |
| | NET ASSETS (100.0%) | | $ | 469,378,483 | |
| | | | | | | | | | |
FORWARD FOREIGN CURRENCY CONTRACTS
| | | | | | | | | | | | | | | | |
COUNTER
PARTY | | SHORT CONTRACTS | | SETTLEMENT DATE | | LOCAL CURRENCY | | | CURRENT VALUE | | | UNREALIZED GAIN/LOSS | |
| Northern Trust Company | | European Monetary Unit | | 05/31/16 | | | 35,388,000 | | | $ | 40,553,643 | | | $ | (723,175 | ) |
| Northern Trust Company | | Japanese Yen | | 05/31/16 | | | 488,081,000 | | | | 4,589,794 | | | | (206,584 | ) |
| | | | | | | | | | | | | | | | |
| | | $ | (929,759 | ) |
| | | | | | | | | | | | | | | | |
NOTES TO SCHEDULE OF INVESTMENTS
| # | Non-income producing security. |
| ^ | Security, or portion of security, is on loan. |
| * | Securities issued and sold pursuant to a Rule 144A transaction are excepted from the registration requirement of the Securities Act of 1933, as amended. These securities may only be sold to qualified institutional buyers (“QIBs”), such as the Fund. Any resale of these securities must generally be effected through a sale that is registered under the Act or otherwise exempted from such registration requirements. |
FOREIGN CURRENCY ABBREVIATIONS
| | |
| AUD | | Australian Dollar |
| CAD | | Canadian Dollar |
| CHF | | Swiss Franc |
| DKK | | Danish Krone |
| EUR | | European Monetary Unit |
| GBP | | British Pound Sterling |
| HKD | | Hong Kong Dollar |
| INR | | Indian Rupee |
| JPY | | Japanese Yen |
| KRW | | South Korean Won |
| MXN | | Mexican Peso |
| PHP | | Philippine Peso |
| SEK | | Swedish Krona |
| TWD | | New Taiwan Dollar |
| ZAR | | South African Rand |
Note: Value for securities denominated in foreign currencies is shown in U.S. dollars.
| | | | |
| 94 | | CALAMOS OPEN-END FAMILY OF FUNDS SEMIANNUAL REPORT | | See accompanying Notes to Financial Statements |
International Growth Fund Schedule of Investments April 30, 2016 (Unaudited)
CURRENCY EXPOSURE
APRIL 30, 2016
| | | | | | | | |
| | | VALUE | | | % OF TOTAL
INVESTMENTS | |
| European Monetary Unit | | $ | 140,416,096 | | | | 27.9% | |
| US Dollar | | | 101,969,435 | | | | 20.2% | |
| Japanese Yen | | | 68,264,450 | | | | 13.5% | |
| British Pound Sterling | | | 56,156,973 | | | | 11.1% | |
| Hong Kong Dollar | | | 25,693,961 | | | | 5.1% | |
| Danish Krone | | | 23,358,901 | | | | 4.6% | |
| Swiss Franc | | | 19,837,329 | | | | 3.9% | |
| New Taiwan Dollar | | | 14,256,330 | | | | 2.8% | |
| Australian Dollar | | | 9,967,302 | | | | 2.0% | |
| South African Rand | | | 8,965,384 | | | | 1.8% | |
| Indian Rupee | | | 8,192,543 | | | | 1.6% | |
| Canadian Dollar | | | 7,476,616 | | | | 1.5% | |
| Mexican Peso | | | 6,400,990 | | | | 1.3% | |
| South Korean Won | | | 6,045,003 | | | | 1.2% | |
| Swedish Krona | | | 4,038,609 | | | | 0.8% | |
| Philippine Peso | | | 3,463,039 | | | | 0.7% | |
| Total Investments | | $ | 504,502,961 | | | | 100.0% | |
Currency exposure may vary over time.
| | | | | | |
| See accompanying Notes to Financial Statements | | www.calamos.com | | | 95 | |
Evolving World Growth Fund Schedule of Investments April 30, 2016 (Unaudited)
| | | | | | | | | | |
PRINCIPAL
AMOUNT | | | | | | | VALUE | |
| | CONVERTIBLE BONDS (18.8%) | |
| | | | | | Consumer Discretionary (6.9%) | |
| | | | | | Ctrip.com International, Ltd. | | | | |
| | 12,100,000 | | | | | 1.000%, 07/01/20* | | $ | 13,308,548 | |
| | 1,815,000 | | | | | 1.250%, 10/15/18 | | | 2,315,586 | |
| | 2,360,000 | | | | | LVMH Moet Hennessy Louis Vuitton, SE 0.000%, 02/16/21 | | | 6,123,478 | |
| | 34,000,000 | | | HKD | | Shenzhou International Group Holdings, Ltd.
0.500%, 06/18/19 | | | 5,181,423 | |
| | 4,200,000 | | | EUR | | Steinhoff Finance Holding Company 1.250%, 10/21/23 | | | 4,824,167 | |
| | | | | | | | | | |
| | | | | | | | | 31,753,202 | |
| | | | | | | | | | |
| | | | | | Consumer Staples (0.6%) | |
| | 348,300 | | | ZAR | | Shoprite Investments, Ltd.
6.500%, 04/03/17 | | | 2,633,664 | |
| | | | | | | | | | |
| | | | | | Financials (2.9%) | |
| | 9,000,000 | | | | | AYC Finance, Ltd.
0.500%, 05/02/19 | | | 9,428,422 | |
| | 4,200,000 | | | | | China Overseas Finance Investment Cayman V, Ltd.
0.000%, 01/05/23 | | | 4,235,373 | |
| | | | | | | | | | |
| | | | | | | | | 13,663,795 | |
| | | | | | | | | | |
| | | | | | Health Care (1.4%) | |
| | 7,600,000 | | | SGD | | Indah Capital, Ltd.
0.000%, 10/24/18 | | | 6,595,198 | |
| | | | | | | | | | |
| | | | | | Industrials (1.4%) | |
| | 6,000,000 | | | | | CRRC Corp., Ltd.
0.000%, 02/05/21 | | | 6,383,760 | |
| | | | | | | | | | |
| | | | | | Information Technology (3.6%) | |
| | 4,750,000 | | | | | MercadoLibre, Inc.
2.250%, 07/01/19 | | | 5,572,106 | |
| | 4,350,000 | | | | | NXP Semiconductors, NV
1.000%, 12/01/19 | | | 4,935,619 | |
| | 2,965,000 | | | | | ON Semiconductor Corp.
2.625%, 12/15/26 | | | 3,160,749 | |
| | 3,000,000 | | | | | Semiconductor Manufacturing International Corp.
0.000%, 11/07/18 | | | 3,180,645 | |
| | | | | | | | | | |
| | | | | | | | | 16,849,119 | |
| | | | | | | | | | |
| | | | | | Materials (2.0%) | |
| | 1,600,000 | | | EUR | | Buzzi Unicem, S.p.A.
1.375%, 07/17/19 | | | 2,254,030 | |
| | 6,300,000 | | | | | Newmont Mining Corp.^
1.625%, 07/15/17 | | | 6,851,282 | |
| | | | | | | | | | |
| | | | | | | | | 9,105,312 | |
| | | | | | | | | | |
| | | | | | TOTAL CONVERTIBLE BONDS
(Cost $87,649,517) | | | 86,984,050 | |
| | | | | | | | | | |
| | | | | | | | | | |
NUMBER OF
SHARES | | | | | | | VALUE | |
| | COMMON STOCKS (79.7%) | |
| | | | | | Consumer Discretionary (11.3%) | |
| | 1,435,595 | | | MXN | | Alsea, SAB de CV^ | | $ | 5,503,017 | |
| | 3,100,000 | | | HKD | | Brilliance China Automotive Holdings, Ltd. | | | 3,057,672 | |
| | 531,585 | | | TWD | | Eclat Textile Company, Ltd. | | | 6,050,551 | |
| | 3,998,667 | | | IDR | | Matahari Department Store, Tbk PT | | | 5,733,543 | |
| | 1,740,255 | | | INR | | Motherson Sumi Systems, Ltd. | | | 6,602,632 | |
| | 72,640 | | | ZAR | | Naspers, Ltd. - Class N | | | 9,996,094 | |
| | 2,356,300 | | | MXN | | Nemak SAB de CV*^ | | | 3,367,776 | |
| | 237,000 | | | TWD | | Tung Thih Electronic Company, Ltd. | | | 4,212,425 | |
| | 145,400 | | | GBP | | WPP, PLC | | | 3,396,922 | |
| | 58,000 | | | | | Yum! Brands, Inc. | | | 4,614,480 | |
| | | | | | | | | | |
| | | | | | | | | 52,535,112 | |
| | | | | | | | | | |
| | | | | | Consumer Staples (14.6%) | |
| | 963,263 | | | BRL | | Ambev, SA | | | 5,430,739 | |
| | 9,900 | | | KRW | | Amorepacific Corp. | | | 3,530,731 | |
| | 46,700 | | | EUR | | Anheuser-Busch InBev, SA | | | 5,793,319 | |
| | 55,217 | | | GBP | | British American Tobacco, PLC | | | 3,366,698 | |
| | 300,000 | | | GBP | | Diageo, PLC | | | 8,110,833 | |
| | 536,000 | | | MXN | | Fomento Economico Mexicano, SAB de CV | | | 4,996,538 | |
| | 1,360,000 | | | MXN | | Grupo Lala, SAB de CV | | | 3,637,017 | |
| | 459,366 | | | IDR | | Hanjaya Mandala Sampoerna Tbk PT | | | 3,474,413 | |
| | 745,950 | | | BRL | | Hypermarcas, SA | | | 6,580,540 | |
| | 213,000 | | | EUR | | Jeronimo Martins SGPS, SA | | | 3,487,310 | |
| | 141,000 | | | EUR | | Unilever, NV^ | | | 6,194,110 | |
| | 630,000 | | | PHP | | Universal Robina Corp. | | | 2,797,591 | |
| | 4,116,000 | | | MXN | | Wal-Mart de Mexico SAB de CV | | | 10,172,385 | |
| | | | | | | | | | |
| | | | | | | | | 67,572,224 | |
| | | | | | | | | | |
| | | | | | Energy (4.5%) | |
| | 70,000 | | | | | Anadarko Petroleum Corp. | | | 3,693,200 | |
| | 5,272,000 | | | HKD | | PetroChina Company, Ltd. - Class H | | | 3,857,154 | |
| | 135,000 | | | EUR | | Royal Dutch Shell, PLC | | | 3,566,415 | |
| | 190,000 | | | EUR | | TOTAL, SA | | | 9,602,753 | |
| | | | | | | | | | |
| | | | | | | | | 20,719,522 | |
| | | | | | | | | | |
| | | | | | Financials (11.6%) | |
| | 880,000 | | | HKD | | AIA Group, Ltd. | | | 5,266,453 | |
| | 4,501,500 | | | IDR | | Bank Mandiri Persero, Tbk PT | | | 3,272,251 | |
| | 542,000 | | | BRL | | BB Seguridade Participacoes, SA | | | 4,727,775 | |
| | 100,000 | | | EUR | | Erste Group Bank, AG# | | | 2,878,623 | |
| | 1,615,000 | | | MXN | | Fibra Uno Administracion, SA de CV | | | 3,836,466 | |
| | 1,482,000 | | | MXN | | Grupo Financiero Banorte, SAB de CV | | | 8,426,166 | |
| | 278,000 | | | INR | | Housing Development Finance Corp., Ltd. | | | 4,555,645 | |
| | 660,000 | | | THB | | Kasikornbank, PCL | | | 3,149,005 | |
| | 4,072,538 | | | PHP | | Metropolitan Bank & Trust Company | | | 7,052,194 | |
| | | | |
| 96 | | CALAMOS OPEN-END FAMILY OF FUNDS SEMIANNUAL REPORT | | See accompanying Notes to Schedule of Investments |
Evolving World Growth Fund Schedule of Investments April 30, 2016 (Unaudited)
| | | | | | | | | | |
NUMBER OF
SHARES | | | | | | | VALUE | |
| | 18,500 | | | KRW | | Samsung Fire & Marine Insurance Company, Ltd. | | $ | 4,768,990 | |
| | 96,700 | | | KRW | | Shinhan Financial Group Company, Ltd. | | | 3,545,597 | |
| | 2,310,000 | | | HKD | | Value Partners Group, Ltd.^ | | | 2,205,013 | |
| | | | | | | | | | |
| | | | | | | | | 53,684,178 | |
| | | | | | | | | | |
| | | | | | Health Care (3.6%) | |
| | 27,900 | | | | | China Biologic Products, Inc.# | | | 3,264,300 | |
| | 263,000 | | | INR | | Glenmark Pharmaceuticals, Ltd. | | | 3,277,386 | |
| | 217,000 | | | GBP | | Hikma Pharmaceuticals, PLC | | | 6,996,221 | |
| | 12,200 | | | KRW | | Hugel, Inc.# | | | 3,248,959 | |
| | | | | | | | | | |
| | | | | | | | | 16,786,866 | |
| | | | | | | | | | |
| | | | | | Industrials (6.7%) | |
| | 20,494 | | | EUR | | ANDRITZ, AG | | | 1,150,373 | |
| | 825,000 | | | TRY | | Aselsan Elektronik Sanayi Ve Ticaret AS | | | 5,883,011 | |
| | 699,556 | | | HKD | | CK Hutchison Holdings, Ltd. | | | 8,369,224 | |
| | 182,000 | | | | | Controladora Vuela Cia de Aviacion, SAB de CV# | | | 3,800,160 | |
| | 20,500 | | | JPY | | FANUC Corp. | | | 3,180,005 | |
| | 250,000 | | | INR | | Larsen & Toubro, Ltd. | | | 4,718,178 | |
| | 675,000 | | | HKD | | Zhuzhou CRRC Times Electric Co., Ltd. | | | 3,840,575 | |
| | | | | | | | | | |
| | | | | | | | | 30,941,526 | |
| | | | | | | | | | |
| | | | | | Information Technology (21.6%) | |
| | 30,000 | | | | | Accenture, PLC - Class A | | | 3,387,600 | |
| | 88,800 | | | | | Alibaba Group Holding, Ltd.# | | | 6,832,272 | |
| | 78,000 | | | | | Baidu, Inc.# | | | 15,155,400 | |
| | 238,000 | | | INR | | Infosys, Ltd. | | | 4,329,653 | |
| | 52,000 | | | TWD | | Largan Precision Company, Ltd. | | | 3,629,813 | |
| | 16,100 | | | KRW | | NAVER Corp. | | | 9,541,622 | |
| | 3,822,000 | | | HKD | | PAX Global Technology, Ltd.^ | | | 3,291,586 | |
| | 12,044 | | | KRW | | Samsung Electronics Co., Ltd. | | | 13,125,932 | |
| | 4,107,649 | | | TWD | | Taiwan Semiconductor Manufacturing Company, Ltd. | | | 18,872,059 | |
| | 89,518 | | | INR | | Tata Consultancy Services, Ltd. | | | 3,418,099 | |
| | 667,100 | | | HKD | | Tencent Holdings, Ltd. | | | 13,574,361 | |
| | 237,500 | | | | | Yandex, NV - Class A# | | | 4,861,625 | |
| | | | | | | | | | |
| | | | | | | | | 100,020,022 | |
| | | | | | | | | | |
| | | | | | Materials (1.1%) | |
| | 355,400 | | | AUD | | Newcrest Mining, Ltd.# | | | 5,182,308 | |
| | | | | | | | | | |
| | | | | | Telecommunication Services (3.8%) | |
| | 1,166,500 | | | HKD | | China Mobile, Ltd. | | | 13,392,321 | |
| | 16,450,000 | | | IDR | | Telekomunikasi Indonesia Persero Tbk PT | | | 4,413,417 | |
| | | | | | | | | | |
| | | | | | | | | 17,805,738 | |
| | | | | | | | | | |
| | | | | | | | | | |
NUMBER OF
SHARES | | | | | | | VALUE | |
| | | | | | Utilities (0.9%) | |
| | 80,000 | | | KRW | | Korea Electric Power Corp. | | $ | 4,345,501 | |
| | | | | | | | | | |
| | | | | | TOTAL COMMON STOCKS
(Cost $370,315,743) | | | 369,592,997 | |
| | | | | | | | | | |
| | SHORT TERM INVESTMENT (3.6%) | |
| | 16,744,710 | | | | | Fidelity Prime Money Market Fund - Institutional Class
(Cost $16,744,710) | | | 16,744,710 | |
| | | | | | | | | �� | |
NUMBER OF
SHARES/
PRINCIPAL
AMOUNT | | | | | | | VALUE | |
| INVESTMENT OF CASH COLLATERAL FOR SECURITIES
LOANED (3.6%) |
|
| | | | | | Federal Home Loan Bank Discount Notes | |
| | 3,606,839 | | | | | 0.000%, 06/15/16 | | | 3,606,839 | |
| | 2,885,810 | | | | | 0.000%, 05/24/16 | | | 2,885,810 | |
| | 2,164,418 | | | | | 0.000%, 05/02/16 | | | 2,164,418 | |
| | 3,331,694 | | | | | Fidelity Prime Money Market Fund - Institutional Class | | | 3,331,694 | |
| | 2,229,365 | | | | | Goldman Sachs Financial Square Prime Obligations Fund | | | 2,229,365 | |
| | 2,591,700 | | | | | Morgan Stanley Institutional Liquidity Fund | | | 2,591,700 | |
| | | | | | | | | | |
| | | | | | TOTAL INVESTMENT OF
CASH COLLATERAL FOR SECURITIES LOANED
(Cost $16,809,826) | | | 16,809,826 | |
| | | | | | | | | | |
| TOTAL INVESTMENTS (105.7%)
(Cost $491,519,796) | | | 490,131,583 | |
| | | | | | | | | | |
| |
| | PAYABLE UPON RETURN OF SECURITIES ON LOAN (-3.6%) | | | (16,809,826 | ) |
| | | | | | | | | | |
| |
| | LIABILITIES, LESS OTHER ASSETS (-2.1%) | | | (9,668,320 | ) |
| | | | | | | | | | |
| |
| | NET ASSETS (100.0%) | | $ | 463,653,437 | |
| | | | | | | | | | |
FORWARD FOREIGN CURRENCY CONTRACTS
| | | | | | | | | | | | | | | | |
COUNTER
PARTY | | LONG CONTRACTS | | SETTLEMENT DATE | | LOCAL CURRENCY | | | CURRENT VALUE | | | UNREALIZED GAIN/LOSS | |
| JPMorgan Chase Bank N.A | | Japanese Yen | | 05/31/16 | | | 135,418,000 | | | $ | 1,273,438 | | | $ | 53,226 | |
| | | | | | | | | | | | | | | | |
| | | | | |
COUNTER
PARTY | | SHORT CONTRACTS | | SETTLEMENT DATE | | LOCAL CURRENCY | | | CURRENT VALUE | | | UNREALIZED GAIN/LOSS | |
| Northern Trust Company | | British Pound Sterling | | 05/31/16 | | | 13,965,000 | | | $ | 20,406,251 | | | $ | (321,579 | ) |
| Northern Trust Company | | European Monetary Unit | | 05/31/16 | | | 23,761,000 | | | | 27,229,431 | | | | (485,570 | ) |
| Northern Trust Company | | Japanese Yen | | 05/31/16 | | | 504,809,000 | | | | 4,747,100 | | | | (213,664 | ) |
| | | | | | | | | | | | | | | | |
| | | | | | | | | | | | | | $ | (1,020,813 | ) |
| | | | | | | | | | | | | | | | |
| | | | | | |
| See accompanying Notes to Schedule of Investments | | www.calamos.com | | | 97 | |
Evolving World Growth Fund Schedule of Investments April 30, 2016 (Unaudited)
NOTES TO SCHEDULE OF INVESTMENTS
| * | Securities issued and sold pursuant to a Rule 144A transaction are excepted from the registration requirement of the Securities Act of 1933, as amended. These securities may only be sold to qualified institutional buyers (“QIBs”), such as the Fund. Any resale of these securities must generally be effected through a sale that is registered under the Act or otherwise exempted from such registration requirements. |
| ^ | Security, or portion of security, is on loan. |
| # | Non-income producing security. |
FOREIGN CURRENCY ABBREVIATIONS
| | |
| AUD | | Australian Dollar |
| BRL | | Brazilian Real |
| EUR | | European Monetary Unit |
| GBP | | British Pound Sterling |
| HKD | | Hong Kong Dollar |
| IDR | | Indonesian Rupiah |
| INR | | Indian Rupee |
| JPY | | Japanese Yen |
| KRW | | South Korean Won |
| MXN | | Mexican Peso |
| PHP | | Philippine Peso |
| SGD | | Singapore Dollar |
| THB | | Thai Baht |
| TRY | | Turkish Lira |
| TWD | | New Taiwan Dollar |
| ZAR | | South African Rand |
Note: Value for securities denominated in foreign currencies is shown in U.S. dollars. The principal amount for such securities is shown in the respective foreign currency.
CURRENCY EXPOSURE
APRIL 30, 2016
| | | | | | | | |
| | | VALUE | | | % OF TOTAL
INVESTMENTS | |
| US Dollar | | $ | 144,659,141 | | | | 29.5% | |
| Hong Kong Dollar | | | 62,035,782 | | | | 12.7% | |
| South Korean Won | | | 42,107,332 | | | | 8.6% | |
| Mexican Peso | | | 39,939,365 | | | | 8.1% | |
| European Monetary Unit | | | 39,751,100 | | | | 8.1% | |
| New Taiwan Dollar | | | 32,764,848 | | | | 6.7% | |
| Indian Rupee | | | 26,901,593 | | | | 5.5% | |
| British Pound Sterling | | | 21,870,674 | | | | 4.5% | |
| Indonesian Rupiah | | | 16,893,624 | | | | 3.4% | |
| Brazilian Real | | | 16,739,054 | | | | 3.4% | |
| South African Rand | | | 12,629,758 | | | | 2.6% | |
| Philippine Peso | | | 9,849,785 | | | | 2.0% | |
| Singapore Dollar | | | 6,595,198 | | | | 1.3% | |
| Turkish Lira | | | 5,883,011 | | | | 1.2% | |
| Australian Dollar | | | 5,182,308 | | | | 1.1% | |
| Japanese Yen | | | 3,180,005 | | | | 0.7% | |
| Thai Baht | | | 3,149,005 | | | | 0.6% | |
| Total Investments | | $ | 490,131,583 | | | | 100.0% | |
Currency exposure may vary over time.
| | | | |
| 98 | | CALAMOS OPEN-END FAMILY OF FUNDS SEMIANNUAL REPORT | | See accompanying Notes to Financial Statements |
Emerging Market Equity Fund Schedule of Investments April 30, 2016 (Unaudited)
| | | | | | | | | | |
NUMBER OF
SHARES | | | | | | | VALUE | |
| | COMMON STOCKS (97.6%) | |
| | | | | | Consumer Discretionary (13.9%) | |
| | 35,947 | | | MXN | | Alsea, SAB de CV | | $ | 137,794 | |
| | 169,400 | | | IDR | | Astra International, Tbk PT | | | 85,963 | |
| | 116,000 | | | HKD | | Brilliance China Automotive Holdings, Ltd. | | | 114,416 | |
| | 6,730 | | | | | Ctrip.com International, Ltd.# | | | 293,495 | |
| | 15,188 | | | TWD | | Eclat Textile Company, Ltd. | | | 172,871 | |
| | 33,200 | | | PHP | | Jollibee Foods Corp. | | | 162,415 | |
| | 5,000 | | | | | Mahindra & Mahindra, Ltd. | | | 99,000 | |
| | 146,870 | | | IDR | | Matahari Department Store, Tbk PT | | | 210,592 | |
| | 2,033 | | | ZAR | | Naspers, Ltd. - Class N | | | 279,764 | |
| | 68,850 | | | MXN | | Nemak SAB de CV^* | | | 98,405 | |
| | 10,000 | | | TWD | | Tung Thih Electronic Company, Ltd. | | | 177,740 | |
| | | | | | | | | | |
| | | | | | | | | 1,832,455 | |
| | | | | | | | | | |
| | | | | | Consumer Staples (13.1%) | |
| | 27,700 | | | BRL | | Ambev, SA | | | 156,168 | |
| | 300 | | | KRW | | Amorepacific Corp. | | | 106,992 | |
| | 47,000 | | | HKD | | China Resources Beer Holdings Company, Ltd. | | | 103,278 | |
| | 15,700 | | | MXN | | Fomento Economico Mexicano, SAB de CV | | | 146,354 | |
| | 53,000 | | | MXN | | Grupo Lala, SAB de CV | | | 141,737 | |
| | 14,905 | | | IDR | | Hanjaya Mandala Sampoerna Tbk PT | | | 112,734 | |
| | 27,667 | | | BRL | | Hypermarcas, SA | | | 244,070 | |
| | 21,000 | | | | | ITC, Ltd.# | | | 102,732 | |
| | 10,500 | | | EUR | | Jeronimo Martins SGPS, SA | | | 171,910 | |
| | 4,440 | | | | | United Spirits, Ltd.# | | | 79,387 | |
| | 18,000 | | | PHP | | Universal Robina Corp. | | | 79,931 | |
| | 115,000 | | | MXN | | Wal-Mart de Mexico SAB de CV | | | 284,214 | |
| | | | | | | | | | |
| | | | | | | | | 1,729,507 | |
| | | | | | | | | | |
| | | | | | Energy (3.2%) | |
| | 73,000 | | | HKD | | CNOOC, Ltd. | | | 90,178 | |
| | 1,800 | | | | | Lukoil PJSC | | | 76,293 | |
| | 960 | | | | | Lukoil PJSC | | | 40,800 | |
| | 163,000 | | | HKD | | PetroChina Company, Ltd. - Class H | | | 119,256 | |
| | 5,000 | | | | | YPF, SA | | | 100,750 | |
| | | | | | | | | | |
| | | | | | | | | 427,277 | |
| | | | | | | | | | |
| | | | | | Financials (18.9%) | |
| | 24,200 | | | HKD | | AIA Group, Ltd. | | | 144,828 | |
| | 6,225 | | | | | Axis Bank, Ltd. | | | 222,855 | |
| | 276,600 | | | PHP | | Ayala Land, Inc. | | | 204,082 | |
| | 113,800 | | | IDR | | Bank Rakyat Indonesia Persero, Tbk PT | | | 88,933 | |
| | 12,700 | | | BRL | | BB Seguridade Participacoes, SA | | | 110,780 | |
| | 42,000 | | | HKD | | China Overseas Land & Investment, Ltd. | | | 133,319 | |
| | 4,270 | | | EUR | | Erste Group Bank, AG# | | | 122,917 | |
| | 58,300 | | | MXN | | Fibra Uno Administracion, SA de CV | | | 138,493 | |
| | | | | | | | | | |
NUMBER OF
SHARES | | | | | | | VALUE | |
| | 45,300 | | | MXN | | Grupo Financiero Banorte, SAB de CV | | $ | 257,561 | |
| | 3,325 | | | PHP | | GT Capital Holdings, Inc. | | | 96,789 | |
| | 14,625 | | | | | ICICI Bank, Ltd. | | | 103,106 | |
| | 29,200 | | | BRL | | Itausa - Investimentos Itau, SA | | | 73,525 | |
| | 20,700 | | | THB | | Kasikornbank, PCL | | | 98,764 | |
| | 147,891 | | | PHP | | Metropolitan Bank & Trust Company | | | 256,095 | |
| | 595 | | | KRW | | Samsung Fire & Marine Insurance Company, Ltd. | | | 153,381 | |
| | 2,700 | | | KRW | | Shinhan Financial Group Company, Ltd. | | | 98,998 | |
| | 34,500 | | | | | Turkiye Garanti Bankasi AS | | | 104,535 | |
| | 89,000 | | | HKD | | Value Partners Group, Ltd.^ | | | 84,955 | |
| | | | | | | | | | |
| | | | | | | | | 2,493,916 | |
| | | | | | | | | | |
| | | | | | Health Care (5.7%) | |
| | 1,055 | | | | | China Biologic Products, Inc.# | | | 123,435 | |
| | 2,030 | | | | | Dr. Reddy’s Laboratories, Ltd. | | | 92,568 | |
| | 8,140 | | | GBP | | Hikma Pharmaceuticals, PLC | | | 262,439 | |
| | 600 | | | KRW | | Hugel, Inc.# | | | 159,785 | |
| | 66,200 | | | MYR | | IHH Healthcare Bhd | | | 110,897 | |
| | | | | | | | | | |
| | | | | | | | | 749,124 | |
| | | | | | | | | | |
| | | | | | Industrials (7.5%) | |
| | 38,885 | | | TRY | | Aselsan Elektronik Sanayi Ve Ticaret AS | | | 277,286 | |
| | 8,200 | | | | | Controladora Vuela Cia de Aviacion, SAB de CV#~ | | | 171,216 | |
| | 13,600 | | | | | Larsen & Toubro, Ltd. | | | 259,080 | |
| | 679,000 | | | IDR | | Wijaya Karya Persero, Tbk PT | | | 136,009 | |
| | 27,000 | | | HKD | | Zhuzhou CRRC Times Electric Co., Ltd. | | | 153,623 | |
| | | | | | | | | | |
| | | | | | | | | 997,214 | |
| | | | | | | | | | |
| | | | | | Information Technology (27.7%) | |
| | 3,330 | | | | | Alibaba Group Holding, Ltd.# | | | 256,210 | |
| | 2,190 | | | | | Baidu, Inc.# | | | 425,517 | |
| | 9,830 | | | | | Infosys, Ltd. | | | 184,804 | |
| | 2,000 | | | TWD | | Largan Precision Company, Ltd. | | | 139,608 | |
| | 5,300 | | | BRL | | Linx, SA | | | 72,891 | |
| | 1,124 | | | | | MercadoLibre, Inc. | | | 140,377 | |
| | 123,500 | | | MYR | | My EG Services Bhd | | | 63,470 | |
| | 570 | | | KRW | | NAVER Corp. | | | 337,809 | |
| | 98,000 | | | HKD | | PAX Global Technology, Ltd.^ | | | 84,400 | |
| | 480 | | | KRW | | Samsung Electronics Co., Ltd. | | | 523,119 | |
| | 1,071,500 | | | HKD | | Semiconductor Manufacturing International Corp.# | | | 88,086 | |
| | 119,000 | | | TWD | | Taiwan Semiconductor Manufacturing Company, Ltd. | | | 546,730 | |
| | 27,200 | | | HKD | | Tencent Holdings, Ltd. | | | 553,474 | |
| | 11,770 | | | | | Yandex, NV - Class A# | | | 240,932 | |
| | | | | | | | | | |
| | | | | | | | | 3,657,427 | |
| | | | | | | | | | |
| | | | | | |
| See accompanying Notes to Schedule of Investments | | www.calamos.com | | | 99 | |
Emerging Market Equity Fund Schedule of Investments April 30, 2016 (Unaudited)
| | | | | | | | | | |
NUMBER OF
SHARES | | | | | | | VALUE | |
| | | | | | Materials (2.0%) | |
| | 6,700 | | | ZAR | | AngloGold Ashanti, Ltd.# | | $ | 106,370 | |
| | 1,500 | | | KRW | | Kolon Industries, Inc. | | | 91,901 | |
| | 650 | | | GBP | | Randgold Resources, Ltd. | | | 64,927 | |
| | | | | | | | | | |
| | | | | | | | | 263,198 | |
| | | | | | | | | | |
| | | | | | Telecommunication Services (3.8%) | |
| | 33,500 | | | HKD | | China Mobile, Ltd. | | | 384,606 | |
| | 460,000 | | | IDR | | Telekomunikasi Indonesia Persero Tbk PT | | | 123,415 | |
| | | | | | | | | | |
| | | | | | | | | 508,021 | |
| | | | | | | | | | |
| | | | | | Utilities (1.8%) | |
| | 4,400 | | | KRW | | Korea Electric Power Corp. | | | 239,002 | |
| | | | | | | | | | |
| | | | | | TOTAL COMMON STOCKS
(Cost $12,925,954) | | | 12,897,141 | |
| | | | | | | | | | |
| | EXCHANGE-TRADED FUND (0.7%) | |
| | | | | | Other (0.7%) | |
| | 6,500 | | | | | VanEck Vectors Vietnam ETF
0.000%
(Cost $95,503) | | | 93,730 | |
| | | | | | | | | | |
| | SHORT TERM INVESTMENT (2.3%) | |
| | 307,314 | | | | | Fidelity Prime Money Market Fund - Institutional Class
(Cost $307,314) | | | 307,314 | |
| | | | | | | | | | |
| | | | | | | | | | |
NUMBER OF
SHARES/
PRINCIPAL
AMOUNT | | | | | | | VALUE | |
| INVESTMENT OF CASH COLLATERAL FOR SECURITIES
LOANED (1.3%) |
|
| | | | | | Federal Home Loan Bank Discount Notes | | | | |
| | 37,899 | | | | | 0.000%, 06/15/16 | | | 37,899 | |
| | 30,322 | | | | | 0.000%, 05/24/16 | | | 30,322 | |
| | 22,742 | | | | | 0.000%, 05/02/16 | | | 22,742 | |
| | 35,007 | | | | | Fidelity Prime Money Market Fund - Institutional Class | | | 35,007 | |
| | 23,425 | | | | | Goldman Sachs Financial Square Prime Obligations Fund | | | 23,425 | |
| | 27,232 | | | | | Morgan Stanley Institutional Liquidity Fund | | | 27,232 | |
| | | | | | | | | | |
| | | | | | TOTAL INVESTMENT OF
CASH COLLATERAL FOR
SECURITIES LOANED
(Cost $176,627) | | | 176,627 | |
| | | | | | | | | | |
| TOTAL INVESTMENTS (101.9%)
(Cost $13,505,398) | | | 13,474,812 | |
| | | | | | | | | | |
| |
| | PAYABLE UPON RETURN OF SECURITIES ON LOAN (-1.3%) | | | (176,627 | ) |
| | | | | | | | | | |
| |
| | LIABILITIES, LESS OTHER ASSETS (-0.6%) | | | (81,277 | ) |
| | | | | | | | | | |
| |
| | NET ASSETS (100.0%) | | $ | 13,216,908 | |
| | | | | | | | | | |
NOTES TO SCHEDULE OF INVESTMENTS
| # | Non-income producing security. |
| ^ | Security, or portion of security, is on loan. |
| * | Securities issued and sold pursuant to a Rule 144A transaction are excepted from the registration requirement of the Securities Act of 1933, as amended. These securities may only be sold to qualified institutional buyers (“QIBs”), such as the Fund. Any resale of these securities must generally be effected through a sale that is registered under the Act or otherwise exempted from such registration requirements. |
| ~ | Security, or portion of security, is segregated as collateral (or potential collateral for future transactions) for written options. The aggregate value of such securities is $41,760. |
FOREIGN CURRENCY ABBREVIATIONS
| | |
| BRL | | Brazilian Real |
| EUR | | European Monetary Unit |
| GBP | | British Pound Sterling |
| HKD | | Hong Kong Dollar |
| IDR | | Indonesian Rupiah |
| KRW | | South Korean Won |
| MXN | | Mexican Peso |
| MYR | | Malaysian Ringgit |
| PHP | | Philippine Peso |
| THB | | Thai Baht |
| TRY | | Turkish Lira |
| TWD | | New Taiwan Dollar |
| ZAR | | South African Rand |
Note: Value for securities denominated in foreign currencies is shown in U.S. dollars. The common stocks amount for such securities is shown in the respective foreign currency.
| | | | |
| 100 | | CALAMOS OPEN-END FAMILY OF FUNDS SEMIANNUAL REPORT | | See accompanying Notes to Financial Statements |
Emerging Market Equity Fund Schedule of Investments April 30, 2016 (Unaudited)
CURRENCY EXPOSURE
APRIL 30, 2016
| | | | | | | | |
| | | VALUE | | | % OF TOTAL
INVESTMENTS | |
| US Dollar | | $ | 3,694,763 | | | | 27.4% | |
| Hong Kong Dollar | | | 2,054,419 | | | | 15.3% | |
| South Korean Won | | | 1,710,987 | | | | 12.7% | |
| Mexican Peso | | | 1,204,558 | | | | 8.9% | |
| New Taiwan Dollar | | | 1,036,949 | | | | 7.7% | |
| Philippine Peso | | | 799,312 | | | | 5.9% | |
| Indonesian Rupiah | | | 757,646 | | | | 5.6% | |
| Brazilian Real | | | 657,434 | | | | 4.9% | |
| South African Rand | | | 386,134 | | | | 2.9% | |
| British Pound Sterling | | | 327,366 | | | | 2.4% | |
| European Monetary Unit | | | 294,827 | | | | 2.2% | |
| Turkish Lira | | | 277,286 | | | | 2.1% | |
| Malaysian Ringgit | | | 174,367 | | | | 1.3% | |
| Thai Baht | | | 98,764 | | | | 0.7% | |
| Total Investments | | $ | 13,474,812 | | | | 100.0% | |
Currency exposure may vary over time.
| | | | | | |
| See accompanying Notes to Financial Statements | | www.calamos.com | | | 101 | |
Global Equity Fund Schedule of Investments April 30, 2016 (Unaudited)
| | | | | | | | | | |
NUMBER OF
SHARES | | | | | | | VALUE | |
| | COMMON STOCKS (97.6%) | |
| | | | | | Consumer Discretionary (19.4%) | |
| | 2,420 | | | | | Amazon.com, Inc.# | | $ | 1,596,208 | |
| | 31,300 | | | | | Comcast Corp. - Class A | | | 1,901,788 | |
| | 46,000 | | | | | Ctrip.com International, Ltd.# | | | 2,006,060 | |
| | 23,800 | | | EUR | | Daimler, AG | | | 1,658,305 | |
| | 20,100 | | | | | Delphi Automotive, PLC | | | 1,479,963 | |
| | 19,600 | | | | | Dollar General Corp. | | | 1,605,436 | |
| | 51,400 | | | GBP | | Domino’s Pizza Group, PLC | | | 691,056 | |
| | 5,700 | | | | | Home Depot, Inc. | | | 763,173 | |
| | 25,700 | | | | | Michael Kors Holdings, Ltd.# | | | 1,327,662 | |
| | 290,000 | | | INR | | Motherson Sumi Systems, Ltd. | | | 1,100,277 | |
| | 22,750 | | | ZAR | | Naspers, Ltd. - Class N | | | 3,130,660 | |
| | 22,600 | | | DKK | | Pandora, A/S | | | 2,938,284 | |
| | 2,825 | | | | | Priceline Group, Inc.# | | | 3,795,839 | |
| | 5,500 | | | | | Tesla Motors, Inc.#^ | | | 1,324,180 | |
| | 13,100 | | | JPY | | Toyota Motor Corp. | | | 696,122 | |
| | 10,700 | | | | | Walt Disney Company | | | 1,104,882 | |
| | 65,800 | | | GBP | | WPP, PLC | | | 1,537,259 | |
| | | | | | | | | | |
| | | | | | | | | 28,657,154 | |
| | | | | | | | | | |
| | | | | | Consumer Staples (10.1%) | |
| | 31,780 | | | EUR | | Anheuser-Busch InBev, SA | | | 3,942,435 | |
| | 38,600 | | | GBP | | British American Tobacco, PLC | | | 2,353,524 | |
| | 100,600 | | | GBP | | Diageo, PLC | | | 2,719,833 | |
| | 24,300 | | | | | Mondelez International, Inc. - Class A | | | 1,043,928 | |
| | 7,500 | | | GBP | | Reckitt Benckiser Group, PLC | | | 730,642 | |
| | 27,000 | | | JPY | | Seven & I Holdings Company, Ltd. | | | 1,152,829 | |
| | 34,000 | | | EUR | | Unilever, NV^ | | | 1,493,615 | |
| | 18,100 | | | | | Walgreens Boots Alliance, Inc. | | | 1,434,968 | |
| | | | | | | | | | |
| | | | | | | | | 14,871,774 | |
| | | | | | | | | | |
| | | | | | Energy (3.2%) | |
| | 12,200 | | | | | Anadarko Petroleum Corp. | | | 643,672 | |
| | 19,150 | | | | | EOG Resources, Inc. | | | 1,582,173 | |
| | 11,000 | | | | | Occidental Petroleum Corp. | | | 843,150 | |
| | 21,300 | | | | | Schlumberger, Ltd. | | | 1,711,242 | |
| | | | | | | | | | |
| | | | | | | | | 4,780,237 | |
| | | | | | | | | | |
| | | | | | Financials (11.3%) | |
| | 219,600 | | | HKD | | AIA Group, Ltd. | | | 1,314,219 | |
| | 18,500 | | | EUR | | AURELIUS, SE & Co. KGaA | | | 1,107,316 | |
| | 68,500 | | | EUR | | Azimut Holding, S.p.A | | | 1,729,032 | |
| | 14,900 | | | | | Citigroup, Inc. | | | 689,572 | |
| | 297,000 | | | JPY | | Daiwa Securities Group, Inc. | | | 1,803,773 | |
| | 46,400 | | | INR | | Housing Development Finance Corp., Ltd. | | | 760,367 | |
| | 113,000 | | | EUR | | ING Groep, NV | | | 1,384,637 | |
| | 18,500 | | | | | JPMorgan Chase & Company | | | 1,169,200 | |
| | 454,197 | | | PHP | | Metropolitan Bank & Trust Company | | | 786,508 | |
| | | | | | | | | | |
NUMBER OF
SHARES | | | | | | | VALUE | |
| | 33,000 | | | JPY | | Mitsui Fudosan Company, Ltd. | | $ | 845,160 | |
| | 49,500 | | | EUR | | PATRIZIA Immobilien, AG# | | | 1,148,012 | |
| | 35,400 | | | GBP | | Prudential, PLC | | | 698,780 | |
| | 57,200 | | | GBP | | St. James’s Place, PLC | | | 726,079 | |
| | 43,035 | | | EUR | | Vonovia, SE | | | 1,450,630 | |
| | 22,400 | | | | | Wells Fargo & Company | | | 1,119,552 | |
| | | | | | | | | | |
| | | | | | | | | 16,732,837 | |
| | | | | | | | | | |
| | | | | | Health Care (12.8%) | |
| | 6,700 | | | | | Allergan, PLC# | | | 1,450,952 | |
| | 18,150 | | | | | Celgene Corp.# | | | 1,876,891 | |
| | 71,600 | | | JPY | | Chugai Pharmaceutical Company, Ltd. | | | 2,530,225 | |
| | 7,700 | | | | | Gilead Sciences, Inc. | | | 679,217 | |
| | 45,000 | | | DKK | | H Lundbeck, A/S# | | | 1,503,584 | |
| | 10,720 | | | | | Illumina, Inc.# | | | 1,447,093 | |
| | 2,380 | | | | | Intuitive Surgical, Inc.# | | | 1,490,737 | |
| | 12,800 | | | JPY | | Kaken Pharmaceutical Company, Ltd. | | | 730,226 | |
| | 14,915 | | | | | Laboratory Corp. of America Holdings# | | | 1,869,148 | |
| | 23,000 | | | DKK | | Novo Nordisk, A/S - Class B | | | 1,284,191 | |
| | 8,500 | | | | | Stryker Corp. | | | 926,585 | |
| | 29,500 | | | EUR | | UCB, SA^ | | | 2,212,771 | |
| | 8,000 | | | | | Zimmer Biomet Holdings, Inc. | | | 926,160 | |
| | | | | | | | | | |
| | | | | | | | | 18,927,780 | |
| | | | | | | | | | |
| | | | | | Industrials (9.9%) | |
| | 22,700 | | | EUR | | ANDRITZ, AG | | | 1,274,200 | |
| | 88,000 | | | GBP | | Ashtead Group, PLC | | | 1,170,349 | |
| | 124,888 | | | HKD | | CK Hutchison Holdings, Ltd. | | | 1,494,113 | |
| | 29,800 | | | | | CSX Corp. | | | 812,646 | |
| | 1,190 | | | CHF | | dorma+kaba Holding AG | | | 772,761 | |
| | 11,100 | | | JPY | | FANUC Corp. | | | 1,721,856 | |
| | 42,750 | | | EUR | | KION Group, AG | | | 2,334,471 | |
| | 16,100 | | | JPY | | Nidec Corp. | | | 1,238,520 | |
| | 17,200 | | | EUR | | Schneider Electric, SE | | | 1,124,667 | |
| | 17,400 | | | EUR | | Thales, SA | | | 1,505,756 | |
| | 12,000 | | | | | United Parcel Service, Inc. - Class B | | | 1,260,840 | |
| | | | | | | | | | |
| | | | | | | | | 14,710,179 | |
| | | | | | | | | | |
| | | | | | Information Technology (29.1%) | |
| | 15,300 | | | | | Alibaba Group Holding, Ltd.# | | | 1,177,182 | |
| | 9,025 | | | | | Alphabet, Inc. - Class A# | | | 6,388,617 | |
| | 3,537 | | | | | Alphabet, Inc. - Class C# | | | 2,451,176 | |
| | 53,100 | | | | | Apple, Inc. | | | 4,977,594 | |
| | 104,000 | | | GBP | | ARM Holdings, PLC | | | 1,427,491 | |
| | 15,900 | | | | | Baidu, Inc.# | | | 3,089,370 | |
| | 15,030 | | | | | Check Point Software Technologies, Ltd.# | | | 1,245,536 | |
| | 31,100 | | | | | Facebook, Inc. - Class A# | | | 3,656,738 | |
| | 14,000 | | | | | Lam Research Corp. | | | 1,069,600 | |
| | 9,600 | | | | | LinkedIn Corp. - Class A# | | | 1,202,976 | |
| | | | |
| 102 | | CALAMOS��OPEN-END FAMILY OF FUNDS SEMIANNUAL REPORT | | See accompanying Notes to Schedule of Investments |
Global Equity Fund Schedule of Investments April 30, 2016 (Unaudited)
| | | | | | | | | | |
NUMBER OF
SHARES | | | | | | | VALUE | |
| | 21,000 | | | | | MasterCard, Inc. - Class A | | $ | 2,036,790 | |
| | 1,080 | | | KRW | | Samsung Electronics Co., Ltd. | | | 1,177,018 | |
| | 31,600 | | | EUR | | SAP SE | | | 2,479,370 | |
| | 87,300 | | | JPY | | Square Enix Holdings Company, Ltd. | | | 2,329,368 | |
| | 569,000 | | | TWD | | Taiwan Semiconductor Manufacturing Company, Ltd. | | | 2,614,197 | |
| | 170,200 | | | HKD | | Tencent Holdings, Ltd. | | | 3,463,283 | |
| | 98,600 | | | | | Trimble Navigation, Ltd.# | | | 2,361,470 | |
| | | | | | | | | | |
| | | | | | | | | 43,147,776 | |
| | | | | | | | | | |
| | | | | | Materials (1.8%) | |
| | 60,000 | | | EUR | | Buzzi Unicem S.p.A | | | 1,139,673 | |
| | 43,700 | | | | | Newmont Mining Corp. | | | 1,528,189 | |
| | | | | | | | | | |
| | | | | | | | | 2,667,862 | |
| | | | | | | | | | |
| | | | | | TOTAL COMMON STOCKS
(Cost $127,291,424) | | | 144,495,599 | |
| | | | | | | | | | |
| | | | | | | | | | |
| | SHORT TERM INVESTMENT (2.8%) | | | | |
| | 4,080,650 | | | | | Fidelity Prime Money Market Fund - Institutional Class
(Cost $4,080,650) | | | 4,080,650 | |
| | | | | | | | | | |
| | | | | | | | | | |
NUMBER OF
SHARES/
PRINCIPAL
AMOUNT | | | | | | | VALUE | |
| INVESTMENT OF CASH COLLATERAL FOR SECURITIES
LOANED (3.0%) |
|
| | | | | | Federal Home Loan Bank Discount Notes | | | | |
| | 961,429 | | | | | 0.000%, 06/15/16 | | | 961,429 | |
| | 769,233 | | | | | 0.000%, 05/24/16 | | | 769,233 | |
| | 576,941 | | | | | 0.000%, 05/02/16 | | | 576,941 | |
| | 888,087 | | | | | Fidelity Prime Money Market Fund - Institutional Class | | | 888,087 | |
| | 594,253 | | | | | Goldman Sachs Financial Square Prime Obligations Fund | | | 594,253 | |
| | 690,836 | | | | | Morgan Stanley Institutional Liquidity Fund | | | 690,836 | |
| | | | | | | | | | |
| | | | | | TOTAL INVESTMENT OF CASH COLLATERAL FOR SECURITIES LOANED
(Cost $4,480,779) | | | 4,480,779 | |
| | | | | | | | | | |
| TOTAL INVESTMENTS (103.4%)
(Cost $135,852,853) | | | 153,057,028 | |
| | | | | | | | | | |
| |
| | PAYABLE UPON RETURN OF SECURITIES ON LOAN (-3.0%) | | | (4,480,779 | ) |
| | | | | | | | | | |
| |
| | LIABILITIES, LESS OTHER ASSETS (-0.4%) | | | (524,992 | ) |
| | | | | | | | | | |
| |
| | NET ASSETS (100.0%) | | $ | 148,051,257 | |
| | | | | | | | | | |
| | | | | | | | | | |
FORWARD FOREIGN CURRENCY CONTRACTS
| | | | | | | | | | | | | | | | |
COUNTER
PARTY | | LONG CONTRACTS | | SETTLEMENT DATE | | LOCAL CURRENCY | | | CURRENT VALUE | | | UNREALIZED GAIN/LOSS | |
| JPMorgan Chase Bank N.A | | Japanese Yen | | 05/31/16 | | | 79,380,000 | | | $ | 746,470 | | | $ | 31,200 | |
| | | | | |
COUNTER
PARTY | | SHORT CONTRACTS | | SETTLEMENT DATE | | LOCAL CURRENCY | | | CURRENT VALUE | | | UNREALIZED GAIN/LOSS | |
| Northern Trust Company | | British Pound Sterling | | 05/31/16 | | | 1,847,000 | | | $ | 2,698,915 | | | $ | (42,532 | ) |
| Northern Trust Company | | European Monetary Unit | | 05/31/16 | | | 9,505,000 | | | | 10,892,460 | | | | (194,240 | ) |
| Northern Trust Company | | Japanese Yen | | 05/31/16 | | | 739,290,000 | | | | 6,952,102 | | | | (312,910 | ) |
| | | | | | | | | | | | | | | | |
| | | $ | (549,682 | ) |
| | | | | | | | | | | | | | | | |
NOTES TO SCHEDULE OF INVESTMENTS
| # | Non-income producing security. |
| ^ | Security, or portion of security, is on loan. |
FOREIGN CURRENCY ABBREVIATIONS
| | |
| CHF | | Swiss Franc |
| DKK | | Danish Krone |
| EUR | | European Monetary Unit |
| GBP | | British Pound Sterling |
| HKD | | Hong Kong Dollar |
| INR | | Indian Rupee |
| JPY | | Japanese Yen |
| KRW | | South Korean Won |
| PHP | | Philippine Peso |
| TWD | | New Taiwan Dollar |
| ZAR | | South African Rand |
Note: Value for securities denominated in foreign currencies is shown in U.S. dollars.
| | | | | | |
| See accompanying Notes to Financial Statements | | www.calamos.com | | | 103 | |
Global Equity Fund Schedule of Investments April 30, 2016 (Unaudited)
CURRENCY EXPOSURE
APRIL 30, 2016
| | | | | | | | |
| | | VALUE | | | % OF TOTAL
INVESTMENTS | |
| US Dollar | | $ | 79,629,584 | | | | 52.0% | |
| European Monetary Unit | | | 25,984,890 | | | | 17.0% | |
| Japanese Yen | | | 13,048,079 | | | | 8.5% | |
| British Pound Sterling | | | 12,055,013 | | | | 7.9% | |
| Hong Kong Dollar | | | 6,271,615 | | | | 4.1% | |
| Danish Krone | | | 5,726,059 | | | | 3.7% | |
| South African Rand | | | 3,130,660 | | | | 2.1% | |
| New Taiwan Dollar | | | 2,614,197 | | | | 1.7% | |
| Indian Rupee | | | 1,860,644 | | | | 1.2% | |
| South Korean Won | | | 1,177,018 | | | | 0.8% | |
| Philippine Peso | | | 786,508 | | | | 0.5% | |
| Swiss Franc | | | 772,761 | | | | 0.5% | |
| Total Investments | | $ | 153,057,028 | | | | 100.0% | |
Currency exposure may vary over time.
| | | | |
| 104 | | CALAMOS OPEN-END FAMILY OF FUNDS SEMIANNUAL REPORT | | See accompanying Notes to Financial Statements |
Growth and Income Fund Schedule of Investments April 30, 2016 (Unaudited)
| | | | | | | | | | |
PRINCIPAL
AMOUNT | | | | | | | VALUE | |
| | CONVERTIBLE BONDS (15.7%) | |
| | | | | | Consumer Discretionary (5.9%) | |
| | | | | | Jarden Corp. | | | | |
| | 16,600,000 | | | | | 1.125%, 03/15/34 | | $ | 21,493,846 | |
| | 9,275,000 | | | | | 1.500%, 06/15/19 | | | 14,598,850 | |
| | 29,395,000 | | | | | Liberty Interactive, LLC (Time Warner Cable, Inc., Time Warner, Inc.)§ 0.750%, 03/30/43 | | | 50,688,003 | |
| | 13,063,000 | | | | | Liberty Media Corp. 1.375%, 10/15/23 | | | 13,153,527 | |
| | 18,000,000 | | | | | Priceline Group, Inc. 1.000%, 03/15/18 | | | 26,595,360 | |
| | 13,700,000 | | | | | Tesla Motors, Inc. 1.250%, 03/01/21 | | | 12,600,095 | |
| | | | | | | | | | |
| | | | | | | | | 139,129,681 | |
| | | | | | | | | | |
| | | | | | Health Care (1.8%) | |
| | 9,904,000 | | | | | BioMarin Pharmaceutical, Inc.
1.500%, 10/15/20 | | | 12,067,182 | |
| | 10,700,000 | | | | | Hologic, Inc.‡
0.000%, 12/15/43 | | | 13,258,424 | |
| | 17,525,000 | | | | | Illumina, Inc.^
0.000%, 06/15/19 | | | 17,490,563 | |
| | | | | | | | | | |
| | | | | | | | | 42,816,169 | |
| | | | | | | | | | |
| | | | | | Industrials (0.6%) | |
| | 10,050,000 | | | | | Air Lease Corp.
3.875%, 12/01/18 | | | 13,271,779 | |
| | | | | | | | | | |
| | | | | | Information Technology (6.8%) | |
| | 3,405,000 | | | | | Citrix Systems, Inc.
0.500%, 04/15/19 | | | 3,838,337 | |
| | 9,000,000 | | | | | Euronet Worldwide, Inc.
1.500%, 10/01/44 | | | 11,028,285 | |
| | 12,500,000 | | | | | Intel Corp.
3.250%, 08/01/39 | | | 18,990,062 | |
| | 6,200,000 | | | | | Lam Research Corp.
0.500%, 05/15/16 | | | 7,921,523 | |
| | 14,260,000 | | | | | Microchip Technology, Inc.
1.625%, 02/15/25 | | | 14,844,304 | |
| | 6,600,000 | | | | | NVIDIA Corp.
1.000%, 12/01/18 | | | 11,765,127 | |
| | 13,723,000 | | | | | NXP Semiconductors, NV
1.000%, 12/01/19 | | | 15,570,459 | |
| | 13,860,000 | | | | | ON Semiconductor Corp.*
1.000%, 12/01/20 | | | 12,584,672 | |
| | 10,200,000 | | | | | Red Hat, Inc.^
0.250%, 10/01/19 | | | 12,545,133 | |
| | 19,925,000 | | | | | Salesforce.com, Inc.
0.250%, 04/01/18 | | | 25,128,214 | |
| | 11,400,000 | | | | | Workday, Inc.
0.750%, 07/15/18 | | | 12,796,158 | |
| | 14,700,000 | | | | | Yahoo!, Inc.
0.000%, 12/01/18 | | | 14,777,543 | |
| | | | | | | | | | |
| | | | | | | | | 161,789,817 | |
| | | | | | | | | | |
| | | | | | | | | | |
PRINCIPAL
AMOUNT | | | | | | | VALUE | |
| | | | | | Materials (0.6%) | |
| | 12,721,000 | | | | | RTI International Metals, Inc.
1.625%, 10/15/19 | | $ | 14,592,832 | |
| | | | | | | | | | |
| | | | | | TOTAL CONVERTIBLE BONDS
(Cost $334,762,497) | | | 371,600,278 | |
| | | | | | | | | | |
| | CORPORATE BONDS (7.2%) | |
| | | | | | Consumer Discretionary (4.3%) | | | | |
| | 5,153,000 | | | | | Dana Holding Corp.^
5.500%, 12/15/24 | | | 5,024,175 | |
| | | | | | DISH DBS Corp. | | | | |
| | 12,500,000 | | | | | 5.875%, 07/15/22 | | | 12,226,563 | |
| | 10,030,000 | | | | | 5.125%, 05/01/20 | | | 10,130,300 | |
| | 23,500,000 | | | | | Expedia, Inc.
5.950%, 08/15/20 | | | 25,997,815 | |
| | 5,935,000 | | | | | GameStop Corp.*
6.750%, 03/15/21 | | | 5,838,556 | |
| | 9,900,000 | | | | | Home Depot, Inc.
2.700%, 04/01/23 | | | 10,272,636 | |
| | 23,000,000 | | | | | L Brands, Inc.
5.625%, 02/15/22 | | | 25,357,500 | |
| | 2,429,000 | | | | | Lowe’s Companies, Inc.
3.875%, 09/15/23 | | | 2,687,081 | |
| | 3,040,000 | | | | | PVH Corp.
4.500%, 12/15/22 | | | 3,144,500 | |
| | | | | | | | | | |
| | | | | | | | | 100,679,126 | |
| | | | | | | | | | |
| | | | | | Consumer Staples (0.5%) | | | | |
| | 9,865,000 | | | | | Wal-Mart Stores, Inc.
3.300%, 04/22/24 | | | 10,695,238 | |
| | | | | | | | | | |
| | | | | | Financials (0.7%) | | | | |
| | 4,950,000 | | | | | Berkshire Hathaway, Inc.
2.750%, 03/15/23 | | | 5,106,940 | |
| | 12,000,000 | | | | | Neuberger Berman Group, LLC*
5.875%, 03/15/22 | | | 12,509,160 | |
| | | | | | | | | | |
| | | | | | | | | 17,616,100 | |
| | | | | | | | | | |
| | | | | | Health Care (0.1%) | | | | |
| | 3,000,000 | | | | | Universal Health Services, Inc.*
4.750%, 08/01/22 | | | 3,086,250 | |
| | | | | | | | | | |
| | | | | | Industrials (0.0%) | | | | |
| | 1,020,000 | | | | | Icahn Enterprises, LP
4.875%, 03/15/19 | | | 1,018,088 | |
| | | | | | | | | | |
| | | | | | Information Technology (1.3%) | | | | |
| | 2,230,000 | | | | | ACI Worldwide, Inc.*
6.375%, 08/15/20 | | | 2,305,262 | |
| | 9,865,000 | | | | | Alphabet, Inc.
3.375%, 02/25/24 | | | 10,762,468 | |
| | 4,935,000 | | | | | Apple, Inc.
3.450%, 05/06/24 | | | 5,270,457 | |
| | 11,415,000 | | | | | Brocade Communications Systems, Inc.
4.625%, 01/15/23 | | | 11,200,969 | |
| | | | | | | | | | |
| | | | | | | | | 29,539,156 | |
| | | | | | | | | | |
| | | | | | |
| See accompanying Notes to Schedule of Investments | | www.calamos.com | | | 105 | |
Growth and Income Fund Schedule of Investments April 30, 2016 (Unaudited)
| | | | | | | | | | |
PRINCIPAL
AMOUNT | | | | | | | VALUE | |
| | | | | | Materials (0.3%) | | | | |
| | 7,135,000 | | | | | Alcoa, Inc.^
5.125%, 10/01/24 | | $ | 6,978,922 | |
| | | | | | | | | | |
| | | | | | Total CORPORATE BONDS
(Cost $164,903,001) | | | 169,612,880 | |
| | | | | | | | | | |
NUMBER OF
SHARES | | | | | | | VALUE | |
| | CONVERTIBLE PREFERRED STOCKS (10.1%) | |
| | | | | | Consumer Staples (0.5%) | | | | |
| | 176,350 | | | | | Tyson Foods, Inc.
4.750% | | | 12,862,969 | |
| | | | | | | | | | |
| | | | | | Energy (0.9%) | | | | |
| | 272,520 | | | | | Hess Corp.
8.000% | | | 20,716,970 | |
| | | | | | | | | | |
| | | | | | Financials (2.9%) | | | | |
| | 462,500 | | | | | Affiliated Managers Group, Inc.
5.150% | | | 26,738,282 | |
| | 161,930 | | | | | American Tower Corp.
5.250% | | | 17,187,250 | |
| | 220,000 | | | | | Crown Castle International Corp.
4.500% | | | 23,367,300 | |
| | | | | | | | | | |
| | | | | | | | | 67,292,832 | |
| | | | | | | | | | |
| | | | | | Health Care (2.9%) | | | | |
| | 31,575 | | | | | Allergan, PLC
5.500% | | | 25,622,797 | |
| | 921,975 | | | | | Anthem, Inc.
5.250% | | | 42,733,541 | |
| | | | | | | | | | |
| | | | | | | | | 68,356,338 | |
| | | | | | | | | | |
| | | | | | Industrials (0.7%) | | | | |
| | 135,000 | | | | | Stanley Black & Decker, Inc.^
6.250% | | | 15,986,700 | |
| | | | | | | | | | |
| | | | | | Telecommunication Services (0.7%) | | | | |
| | 236,200 | | | | | T-Mobile USA, Inc.
5.500% | | | 16,016,722 | |
| | | | | | | | | | |
| | | | | | Utilities (1.5%) | | | | |
| | 301,775 | | | | | Dominion Resources, Inc.
6.375% | | | 14,886,561 | |
| | 320,000 | | | | | Exelon Corp.^
6.500% | | | 15,507,200 | |
| | 95,000 | | | | | NextEra Energy, Inc.
6.371% | | | 5,681,000 | |
| | | | | | | | | | |
| | | | | | | | | 36,074,761 | |
| | | | | | | | | | |
| | | | | | TOTAL CONVERTIBLE
PREFERRED STOCKS
(Cost $219,006,304) | | | 237,307,292 | |
| | | | | | | | | | |
| | | | | | | | | | |
NUMBER OF
SHARES | | | | | | | VALUE | |
| | COMMON STOCKS (62.0%) | |
| | | | | | Consumer Discretionary (7.7%) | | | | |
| | 47,500 | | | | | Amazon.com, Inc.# | | $ | 31,330,525 | |
| | 198,200 | | | | | Comcast Corp. - Class A | | | 12,042,632 | |
| | 376,350 | | | | | Home Depot, Inc. | | | 50,389,502 | |
| | 536,000 | | | | | Nike, Inc. - Class B | | | 31,591,840 | |
| | 508,000 | | | | | Starbucks Corp. | | | 28,564,840 | |
| | 275,000 | | | | | Walt Disney Company | | | 28,396,500 | |
| | | | | | | | | | |
| | | | | | | | | 182,315,839 | |
| | | | | | | | | | |
| | | | | | Consumer Staples (8.2%) | | | | |
| | 825,000 | | | | | Coca-Cola Company | | | 36,960,000 | |
| | 215,000 | | | | | Costco Wholesale Corp. | | | 31,847,950 | |
| | 560,000 | | | | | Mondelez International, Inc. - Class A | | | 24,057,600 | |
| | 215,000 | | | | | PepsiCo, Inc. | | | 22,136,400 | |
| | 200,000 | | | | | Philip Morris International, Inc. | | | 19,624,000 | |
| | 321,000 | | | | | Procter & Gamble Company | | | 25,718,520 | |
| | 415,000 | | | | | Walgreens Boots Alliance, Inc. | | | 32,901,200 | |
| | | | | | | | | | |
| | | | | | | | | 193,245,670 | |
| | | | | | | | | | |
| | | | | | Energy (5.0%) | | | | |
| | 200,000 | | | | | Anadarko Petroleum Corp. | | | 10,552,000 | |
| | 130,600 | | | | | Chevron Corp. | | | 13,344,708 | |
| | 140,000 | | | | | EOG Resources, Inc. | | | 11,566,800 | |
| | 409,000 | | | | | Exxon Mobil Corp. | | | 36,155,600 | |
| | 400,000 | | | | | Occidental Petroleum Corp. | | | 30,660,000 | |
| | 179,000 | | | | | Schlumberger, Ltd. | | | 14,380,860 | |
| | | | | | | | | | |
| | | | | | | | | 116,659,968 | |
| | | | | | | | | | |
| | | | | | Financials (10.8%) | | | | |
| | 520,000 | | | | | American International Group, Inc. | | | 29,026,400 | |
| | 304,500 | | | | | Bank of New York Mellon Corp. | | | 12,253,080 | |
| | 844,710 | | | | | Citigroup, Inc. | | | 39,093,179 | |
| | 64,450 | | | | | Intercontinental Exchange, Inc. | | | 15,469,933 | |
| | 1,000,000 | | | | | JPMorgan Chase & Company | | | 63,200,000 | |
| | 400,890 | | | | | MetLife, Inc. | | | 18,080,139 | |
| | 258,302 | | | | | State Street Corp. | | | 16,092,215 | |
| | 1,250,000 | | | | | Wells Fargo & Company | | | 62,475,000 | |
| | | | | | | | | | |
| | | | | | | | | 255,689,946 | |
| | | | | | | | | | |
| | | | | | Health Care (8.7%) | | | | |
| | 76,270 | | | | | Alexion Pharmaceuticals, Inc.# | | | 10,622,885 | |
| | 215,000 | | | | | Celgene Corp.# | | | 22,233,150 | |
| | 172,000 | | | | | Gilead Sciences, Inc. | | | 15,172,120 | |
| | 388,675 | | | | | Johnson & Johnson | | | 43,562,694 | |
| | 611,300 | | | | | Merck & Company, Inc. | | | 33,523,692 | |
| | 870,000 | | | | | Pfizer, Inc. | | | 28,457,700 | |
| | 218,675 | | | | | Stryker Corp. | | | 23,837,762 | |
| | 249,000 | | | | | Zimmer Biomet Holdings, Inc. | | | 28,826,730 | |
| | | | | | | | | | |
| | | | | | | | | 206,236,733 | |
| | | | | | | | | | |
| | | | |
| 106 | | CALAMOS OPEN-END FAMILY OF FUNDS SEMIANNUAL REPORT | | See accompanying Notes to Schedule of Investments |
Growth and Income Fund Schedule of Investments April 30, 2016 (Unaudited)
| | | | | | | | | | |
NUMBER OF
SHARES | | | | | | | VALUE | |
| | | | | | Industrials (8.8%) | | | | |
| | 56,875 | | | | | 3M Company | | $ | 9,519,738 | |
| | 92,000 | | | | | Boeing Company | | | 12,401,600 | |
| | 400,000 | | | | | CSX Corp. | | | 10,908,000 | |
| | 416,000 | | | | | Delta Air Lines, Inc. | | | 17,334,720 | |
| | 240,800 | | | | | Eaton Corp., PLC | | | 15,235,416 | |
| | 1,100,000 | | | | | General Electric Company | | | 33,825,000 | |
| | 177,300 | | | | | Honeywell International, Inc. | | | 20,260,071 | |
| | 72,800 | | | | | Lockheed Martin Corp. | | | 16,917,264 | |
| | 100,000 | | | | | Northrop Grumman Corp. | | | 20,626,000 | |
| | 136,750 | | | | | Union Pacific Corp. | | | 11,928,702 | |
| | 240,000 | | | | | United Parcel Service, Inc. - Class B | | | 25,216,800 | |
| | 135,072 | | | | | United Technologies Corp. | | | 14,097,465 | |
| | | | | | | | | | |
| | | | | | | | | 208,270,776 | |
| | | | | | | | | | |
| | | | | | Information Technology (11.9%) | | | | |
| | 300,000 | | | | | Accenture, PLC - Class A | | | 33,876,000 | |
| | 67,500 | | | | | Alphabet, Inc. - Class A# | | | 47,781,900 | |
| | 820,000 | | | | | Apple, Inc. | | | 76,866,800 | |
| | 205,800 | | | | | Facebook, Inc. - Class A# | | | 24,197,964 | |
| | 270,100 | | | | | MasterCard, Inc. - Class A | | | 26,196,999 | |
| | 1,118,000 | | | | | Microsoft Corp. | | | 55,754,660 | |
| | 375,000 | | | | | Oracle Corp. | | | 14,947,500 | |
| | | | | | | | | | |
| | | | | | | | | 279,621,823 | |
| | | | | | | | | | |
| | | | | | Utilities (0.9%) | | | | |
| | 189,090 | | | | | NextEra Energy, Inc. | | | 22,233,202 | |
| | | | | | | | | | |
| | | | | | TOTAL COMMON STOCKS
(Cost $1,185,358,924) | | | 1,464,273,957 | |
| | | | | | | | | | |
| | SHORT TERM INVESTMENT (4.9%) | |
| | 115,612,115 | | | | | Fidelity Prime Money Market Fund - Institutional Class
(Cost $115,612,115) | | | 115,612,115 | |
| | | | | | | | | | |
NUMBER OF
SHARES/
PRINCIPAL
AMOUNT | | | | | | | VALUE | |
| INVESTMENT OF CASH COLLATERAL FOR SECURITIES
LOANED (1.2%) |
|
| | | | | | Federal Home Loan Bank Discount Notes | |
| | 5,920,346 | | | | | 0.000%, 06/15/16 | | | 5,920,346 | |
| | 4,736,833 | | | | | 0.000%, 05/24/16 | | | 4,736,833 | |
| | 3,552,723 | | | | | 0.000%, 05/02/16 | | | 3,552,723 | |
| | 5,468,716 | | | | | Fidelity Prime Money Market Fund - Institutional Class | | | 5,468,716 | |
| | 3,659,329 | | | | | Goldman Sachs Financial Square Prime Obligations Fund | | | 3,659,329 | |
| | | | | | | | | | |
NUMBER OF
SHARES/
PRINCIPAL
AMOUNT | | | | | | | VALUE | |
| | 4,254,075 | | | | | Morgan Stanley Institutional Liquidity Fund | | $ | 4,254,075 | |
| | | | | | | | | | |
| | | | | | TOTAL INVESTMENT OF CASH COLLATERAL FOR SECURITIES LOANED
(Cost $27,592,022) | | | 27,592,022 | |
| | | | | | | | | | |
| TOTAL INVESTMENTS (101.1%)
(Cost $2,047,234,863) | | | 2,385,998,544 | |
| | | | | | | | | | |
| |
| | PAYABLE UPON RETURN OF SECURITIES ON LOAN (-1.2%) | | | (27,592,022 | ) |
| | | | | | | | | | |
| |
| | OTHER ASSETS, LESS LIABILITIES (0.1%) | | | 1,933,627 | |
| | | | | | | | | | |
| |
| | NET ASSETS (100.0%) | | $ | 2,360,340,149 | |
| | | | | | | | | | |
NOTES TO SCHEDULE OF INVESTMENTS
| § | Securities exchangeable or convertible into securities of one or more entities that are different than the issuer. Each entity is identified in the parenthetical. |
| ‡ | Variable rate or step bond security. The rate shown is the rate in effect at April 30, 2016. |
| ^ | Security, or portion of security, is on loan. |
| * | Securities issued and sold pursuant to a Rule 144A transaction are excepted from the registration requirement of the Securities Act of 1933, as amended. These securities may only be sold to qualified institutional buyers (“QIBs”), such as the Fund. Any resale of these securities must generally be effected through a sale that is registered under the Act or otherwise exempted from such registration requirements. |
| # | Non-income producing security. |
| | | | | | |
| See accompanying Notes to Financial Statements | | www.calamos.com | | | 107 | |
Global Growth and Income Fund Schedule of Investments April 30, 2016 (Unaudited)
| | | | | | | | | | |
PRINCIPAL
AMOUNT | | | | | | | VALUE | |
| | CONVERTIBLE BONDS (39.3%) | |
| | | | | | Consumer Discretionary (12.0%) | |
| | | | | | Ctrip.com International, Ltd. | | | | |
| | 6,460,000 | | | | | 1.000%, 07/01/20* | | $ | 7,105,225 | |
| | 1,200,000 | | | | | 1.250%, 10/15/18 | | | 1,530,966 | |
| | 170,000,000 | | | JPY | | Iida Group Holdings Company, Ltd.
0.000%, 06/18/20 | | | 1,700,018 | |
| | 1,261,000 | | | | | LVMH Moet Hennessy Louis Vuitton, SE
0.000%, 02/16/21 | | | 3,271,909 | |
| | 14,165,000 | | | | | Priceline Group, Inc.^
0.900%, 09/15/21 | | | 14,640,944 | |
| | 3,000,000 | | | EUR | | Steinhoff Finance Holding Company
1.250%, 10/21/23 | | | 3,445,834 | |
| | | | | | Tesla Motors, Inc. | | | | |
| | 7,270,000 | | | | | 1.250%, 03/01/21 | | | 6,686,328 | |
| | 1,900,000 | | | | | 0.250%, 03/01/19 | | | 1,788,764 | |
| | | | | | | | | | |
| | | | | | | | | 40,169,988 | |
| | | | | | | | | | |
| | | | | | Energy (0.5%) | |
| | 1,810,000 | | | | | SEACOR Holdings, Inc.
2.500%, 12/15/27 | | | 1,771,483 | |
| | | | | | | | | | |
| | | | | | Financials (7.0%) | |
| | 3,500,000 | | | EUR | | AURELIUS, SE & Co. KGaA
1.000%, 12/01/20 | | | 4,556,587 | |
| | 5,500,000 | | | | | AYC Finance, Ltd.
0.500%, 05/02/19 | | | 5,761,814 | |
| | 7,100,000 | | | EUR | | Azimut Holding, S.p.A.
2.125%, 11/25/20 | | | 9,455,829 | |
| | 3,000,000 | | | EUR | | Grand City Properties, SA
0.250%, 03/02/22 | | | 3,665,208 | |
| | | | | | | | | | |
| | | | | | | | | 23,439,438 | |
| | | | | | | | | | |
| | | | | | Health Care (1.1%) | |
| | 1,620,000 | | | | | Illumina, Inc.^
0.500%, 06/15/21 | | | 1,673,322 | |
| | 2,030,000 | | | | | Medidata Solutions, Inc.
1.000%, 08/01/18 | | | 2,149,527 | |
| | | | | | | | | | |
| | | | | | | | | 3,822,849 | |
| | | | | | | | | | |
| | | | | | Industrials (7.7%) | |
| | 3,000,000 | | | GBP | | Carillion Finance Jersey, Ltd.
2.500%, 12/19/19 | | | 4,250,597 | |
| | 1,500,000 | | | | | CRRC Corp., Ltd.
0.000%, 02/05/21 | | | 1,595,940 | |
| | 5,350,000 | | | | | Larsen & Toubro, Ltd.
0.675%, 10/22/19 | | | 4,969,989 | |
| | 540,000,000 | | | JPY | | Lixil Group Corp.
0.000%, 03/04/20 | | | 5,016,986 | |
| | 4,000,000 | | | | | MISUMI Group, Inc.
0.000%, 10/22/18 | | | 5,060,300 | |
| | 4,500,000 | | | EUR | | Safran, SA
0.000%, 12/31/20 | | | 4,812,381 | |
| | | | | | | | | | |
| | | | | | | | | 25,706,193 | |
| | | | | | | | | | |
| | | | | | | | | | |
PRINCIPAL
AMOUNT | | | | | | | VALUE | |
| | | | | | Information Technology (7.2%) | |
| | 7,420,000 | | | | | LinkedIn Corp.
0.500%, 11/01/19 | | $ | 6,932,691 | |
| | 3,440,000 | | | | | NXP Semiconductors, NV
1.000%, 12/01/19 | | | 3,903,110 | |
| | 3,325,000 | | | | | ON Semiconductor Corp.
2.625%, 12/15/26 | | | 3,544,516 | |
| | 2,700,000 | | | EUR | | Rocket Internet, SE
3.000%, 07/22/22 | | | 2,542,600 | |
| | 1,375,000 | | | | | Salesforce.com, Inc.
0.250%, 04/01/18 | | | 1,734,068 | |
| | 1,555,000 | | | | | WebMD Health Corp.
2.500%, 01/31/18 | | | 1,784,075 | |
| | 3,390,000 | | | | | Workday, Inc.
0.750%, 07/15/18 | | | 3,805,173 | |
| | | | | | | | | | |
| | | | | | | | | 24,246,233 | |
| | | | | | | | | | |
| | | | | | Materials (2.6%) | |
| | 3,500,000 | | | EUR | | Buzzi Unicem, S.p.A.
1.375%, 07/17/19 | | | 4,930,692 | |
| | 3,400,000 | | | | | Newmont Mining Corp.^
1.625%, 07/15/17 | | | 3,697,517 | |
| | | | | | | | | | |
| | | | | | | | | 8,628,209 | |
| | | | | | | | | | |
| | | | | | Telecommunication Services (1.2%) | |
| | 3,500,000 | | | EUR | | America Movil, SAB de CV
0.000%, 05/28/20 | | | 4,009,278 | |
| | | | | | | | | | |
| | | | | | TOTAL CONVERTIBLE BONDS
(Cost $133,220,515) | | | 131,793,671 | |
| | | | | | | | | | |
| | | | | | | | | | |
| | SYNTHETIC CONVERTIBLE SECURITIES (4.2%) ¤ | |
| | Corporate Bonds (4.0%) | | | | |
| | | | | | Consumer Discretionary (2.5%) | |
| | 4,400,000 | | | | | L Brands, Inc.
5.625%, 02/15/22 | | | 4,851,000 | |
| | 3,270,000 | | | | | Toll Brothers Finance Corp.
4.000%, 12/31/18 | | | 3,394,669 | |
| | | | | | | | | | |
| | | | | | | | | 8,245,669 | |
| | | | | | | | | | |
| | | | | | Industrials (1.5%) | |
| | | | | | Icahn Enterprises, LP | | | | |
| | 2,725,000 | | | | | 4.875%, 03/15/19 | | | 2,719,891 | |
| | 2,460,000 | | | | | 5.875%, 02/01/22 | | | 2,360,062 | |
| | | | | | | | | | |
| | | | | | | | | 5,079,953 | |
| | | | | | | | | | |
| | | | | | Total CORPORATE BONDS | | | 13,325,622 | |
| | | | | | | | | | |
| | | | | | | | | | |
NUMBER OF
CONTRACTS | | | | | | | VALUE | |
| | | | | | | | | | |
| | Purchased Options (0.2%) # | |
| | | | | | Health Care (0.1%) | | | | |
| | 76 | | | | | Intuitive Surgical, Inc.
Call, 01/20/17, Strike $640.00 | | | 367,460 | |
| | | | | | | | | | |
| | | | |
| 108 | | CALAMOS OPEN-END FAMILY OF FUNDS SEMIANNUAL REPORT | | See accompanying Notes to Schedule of Investments |
Global Growth and Income Fund Schedule of Investments April 30, 2016 (Unaudited)
| | | | | | | | | | |
NUMBER OF
CONTRACTS | | | | | | | VALUE | |
| | | | | | Information Technology (0.1%) | | | | |
| | 595 | | | | | Lam Research Corp.
Call, 01/20/17, Strike $82.50 | | $ | 267,750 | |
| | | | | | | | | | |
| | | | | | TOTAL PURCHASED OPTIONS | | | 635,210 | |
| | | | | | | | | | |
| | | | | | TOTAL SYNTHETIC CONVERTIBLE SECURITIES
(Cost $13,853,426) | | | 13,960,832 | |
| | | | | | | | | | |
NUMBER OF
SHARES | | | | | | | VALUE | |
| | CONVERTIBLE PREFERRED STOCKS (4.0%) | |
| | | | | | Financials (0.9%) | | | | |
| | 28,600 | | | | | American Tower Corp.
5.250% | | | 3,035,604 | |
| | | | | | | | | | |
| | | | | | Health Care (1.9%) | | | | |
| | 4,250 | | | | | Allergan, PLC
5.500% | | | 3,448,832 | |
| | 62,800 | | | | | Anthem, Inc.
5.250% | | | 2,910,780 | |
| | | | | | | | | | |
| | | | | | | | | 6,359,612 | |
| | | | | | | | | | |
| | | | | | Utilities (1.2%) | | | | |
| | 68,586 | | | | | NextEra Energy, Inc.
5.799% | | | 4,146,024 | |
| | | | | | | | | | |
| | | | | | TOTAL CONVERTIBLE PREFERRED STOCKS
(Cost $14,142,115) | | | 13,541,240 | |
| | | | | | | | | | |
| | COMMON STOCKS (52.0%) | |
| | | | | | Consumer Discretionary (5.5%) | | | | |
| | 56,770 | | | | | Comcast Corp. - Class A | | | 3,449,345 | |
| | 13,400 | | | | | Home Depot, Inc. | | | 1,794,126 | |
| | 38,350 | | | ZAR | | Naspers, Ltd. - Class N | | | 5,277,398 | |
| | 13,815 | | | DKK | | Pandora, A/S | | | 1,796,124 | |
| | 30,200 | | | JPY | | Toyota Motor Corp. | | | 1,604,801 | |
| | 17,335 | | | | | Walt Disney Company | | | 1,790,012 | |
| | 111,110 | | | GBP | | WPP, PLC | | | 2,595,818 | |
| | | | | | | | | | |
| | | | | | | | | 18,307,624 | |
| | | | | | | | | | |
| | | | | | Consumer Staples (7.7%) | | | | |
| | 51,000 | | | EUR | | Anheuser-Busch InBev, SA | | | 6,326,751 | |
| | 58,920 | | | GBP | | British American Tobacco, PLC | | | 3,592,478 | |
| | 53,600 | | | | | Coca-Cola Company | | | 2,401,280 | |
| | 206,600 | | | GBP | | Diageo, PLC | | | 5,585,661 | |
| | 37,180 | | | CHF | | Nestlé, SA | | | 2,775,104 | |
| | 77,955 | | | EUR | | Unilever, NV^ | | | 3,424,552 | |
| | 20,500 | | | | | Walgreens Boots Alliance, Inc. | | | 1,625,240 | |
| | | | | | | | | | |
| | | | | | | | | 25,731,066 | |
| | | | | | | | | | |
| | | | | | Energy (4.7%) | | | | |
| | 26,000 | | | | | Anadarko Petroleum Corp. | | | 1,371,760 | |
| | 34,597 | | | | | EOG Resources, Inc. | | | 2,858,404 | |
| | | | | | | | | | |
NUMBER OF
SHARES | | | | | | | VALUE | |
| | 35,830 | | | | | Exxon Mobil Corp. | | $ | 3,167,372 | |
| | 130,000 | | | EUR | | Royal Dutch Shell, PLC | | | 3,434,325 | |
| | 38,450 | | | | | Schlumberger, Ltd. | | | 3,089,073 | |
| | 39,790 | | | EUR | | TOTAL, SA | | | 2,011,019 | |
| | | | | | | | | | |
| | | | | | | | | 15,931,953 | |
| | | | | | | | | | |
| | | | | | Financials (5.1%) | | | | |
| | 337,600 | | | HKD | | AIA Group, Ltd. | | | 2,020,403 | |
| | 35,581 | | | | | Citigroup, Inc. | | | 1,646,689 | |
| | 497,000 | | | JPY | | Daiwa Securities Group, Inc. | | | 3,018,434 | |
| | 58,800 | | | | | JPMorgan Chase & Company | | | 3,716,160 | |
| | 75,810 | | | EUR | | Vonovia, SE | | | 2,555,415 | |
| | 81,000 | | | | | Wells Fargo & Company | | | 4,048,380 | |
| | | | | | | | | | |
| | | | | | | | | 17,005,481 | |
| | | | | | | | | | |
| | | | | | Health Care (8.7%) | | | | |
| | 135,300 | | | JPY | | Chugai Pharmaceutical Company, Ltd. | | | 4,781,278 | |
| | 16,600 | | | | | Gilead Sciences, Inc. | | | 1,464,286 | |
| | 10,950 | | | | | Illumina, Inc.# | | | 1,478,141 | |
| | 65,365 | | | | | Johnson & Johnson | | | 7,326,109 | |
| | 51,500 | | | | | Merck & Company, Inc. | | | 2,824,260 | |
| | 28,000 | | | DKK | | Novo Nordisk, A/S - Class B | | | 1,563,363 | |
| | 29,000 | | | | | Stryker Corp. | | | 3,161,290 | |
| | 56,480 | | | EUR | | UCB, SA^ | | | 4,236,520 | |
| | 19,500 | | | | | Zimmer Biomet Holdings, Inc. | | | 2,257,515 | |
| | | | | | | | | | |
| | | | | | | | | 29,092,762 | |
| | | | | | | | | | |
| | | | | | Industrials (3.7%) | | | | |
| | 166,500 | | | GBP | | Ashtead Group, PLC | | | 2,214,353 | |
| | 276,512 | | | HKD | | CK Hutchison Holdings, Ltd. | | | 3,308,085 | |
| | 16,900 | | | JPY | | FANUC Corp. | | | 2,621,565 | |
| | 91,800 | | | INR | | Larsen & Toubro, Ltd. | | | 1,732,515 | |
| | 23,500 | | | | | United Parcel Service, Inc. - Class B | | | 2,469,145 | |
| | | | | | | | | | |
| | | | | | | | | 12,345,663 | |
| | | | | | | | | | |
| | | | | | Information Technology (15.6%) | | | | |
| | 32,900 | | | | | Accenture, PLC - Class A | | | 3,715,068 | |
| | 23,225 | | | | | Alibaba Group Holding, Ltd.# | | | 1,786,931 | |
| | 20,350 | | | | | Alphabet, Inc. - Class A# | | | 14,405,358 | |
| | 69,300 | | | | | Apple, Inc. | | | 6,496,182 | |
| | 19,800 | | | | | Baidu, Inc.# | | | 3,847,140 | |
| | 26,100 | | | | | Facebook, Inc. - Class A# | | | 3,068,838 | |
| | 24,000 | | | | | MasterCard, Inc. - Class A | | | 2,327,760 | |
| | 72,000 | | | | | Microsoft Corp. | | | 3,590,640 | |
| | 50,575 | | | EUR | | SAP SE | | | 3,968,169 | |
| | 863,000 | | | TWD | | Taiwan Semiconductor Manufacturing Company, Ltd. | | | 3,964,941 | |
| | 253,200 | | | HKD | | Tencent Holdings, Ltd. | | | 5,152,194 | |
| | | | | | | | | | |
| | | | | | | | | 52,323,221 | |
| | | | | | | | | | |
| | | | | | |
| See accompanying Notes to Schedule of Investments | | www.calamos.com | | | 109 | |
Global Growth and Income Fund Schedule of Investments April 30, 2016 (Unaudited)
| | | | | | | | | | |
NUMBER OF
SHARES | | | | | | | VALUE | |
| | | | | | Materials (1.0%) | | | | |
| | 99,660 | | | | | Newmont Mining Corp. | | $ | 3,485,110 | |
| | | | | | | | | | |
| | | | | | TOTAL COMMON STOCKS
(Cost $156,047,271) | | | 174,222,880 | |
| | | | | | | | | | |
| | SHORT TERM INVESTMENT (1.0%) | | | | |
| | 3,346,566 | | | | | Fidelity Prime Money Market Fund - Institutional Class
(Cost $3,346,566) | | | 3,346,566 | |
| | | | | | | | | | |
| | | | | | | | | | |
NUMBER OF
SHARES/
PRINCIPAL
AMOUNT | | | | | | | VALUE | |
| INVESTMENT OF CASH COLLATERAL FOR SECURITIES
LOANED (3.1%) |
|
| | | | | | Federal Home Loan Bank Discount Notes | |
| | 2,200,155 | | | | | 0.000%, 06/15/16 | | | 2,200,155 | |
| | 1,760,331 | | | | | 0.000%, 05/24/16 | | | 1,760,331 | |
| | 1,320,285 | | | | | 0.000%, 05/02/16 | | | 1,320,285 | |
| | 2,032,318 | | | | | Fidelity Prime Money Market Fund - Institutional Class | | | 2,032,318 | |
| | 1,359,902 | | | | | Goldman Sachs Financial Square Prime Obligations Fund | | | 1,359,902 | |
| | 1,580,926 | | | | | Morgan Stanley Institutional Liquidity Fund | | | 1,580,926 | |
| | | | | | | | | | |
| | | | | | TOTAL INVESTMENT OF CASH COLLATERAL FOR SECURITIES LOANED
(Cost $10,253,917) | | | 10,253,917 | |
| | | | | | | | | | |
| TOTAL INVESTMENTS (103.6%)
(Cost $330,863,810) | | | 347,119,106 | |
| | | | | | | | | | |
| |
| | PAYABLE UPON RETURN OF SECURITIES ON LOAN (-3.1%) | | | (10,253,917 | ) |
| | | | | | | | | | |
| |
| | LIABILITIES, LESS OTHER ASSETS (-0.5%) | | | (1,645,025 | ) |
| | | | | | | | | | |
| |
| | NET ASSETS (100.0%) | | $ | 335,220,164 | |
| | | | | | | | | | |
FORWARD FOREIGN CURRENCY CONTRACTS
| | | | | | | | | | | | | | | | |
COUNTER
PARTY | | SHORT CONTRACTS | | SETTLEMENT DATE | | LOCAL CURRENCY | | | CURRENT VALUE | | | UNREALIZED GAIN/LOSS | |
| Northern Trust Company | | European
Monetary Unit | | 05/31/16 | | | 18,121,000 | | | $ | 20,766,151 | | | $ | (370,313 | ) |
| | | | | | | | | | | | | | | | |
NOTES TO SCHEDULE OF INVESTMENTS
| * | Securities issued and sold pursuant to a Rule 144A transaction are excepted from the registration requirement of the Securities Act of 1933, as amended. These securities may only be sold to qualified institutional buyers (“QIBs”), such as the Fund. Any resale of these securities must generally be effected through a sale that is registered under the Act or otherwise exempted from such registration requirements. |
| ^ | Security, or portion of security, is on loan. |
| ¤ | The synthetic convertible securities strategy combines separate securities that together possess the economic characteristics similar to a convertible security. |
| # | Non-income producing security. |
FOREIGN CURRENCY ABBREVIATIONS
| | |
| CHF | | Swiss Franc |
| DKK | | Danish Krone |
| EUR | | European Monetary Unit |
| GBP | | British Pound Sterling |
| HKD | | Hong Kong Dollar |
| INR | | Indian Rupee |
| JPY | | Japanese Yen |
| TWD | | New Taiwan Dollar |
| ZAR | | South African Rand |
Note: Value for securities denominated in foreign currencies is shown in U.S. dollars. The principal amount for such securities is shown in the respective foreign currency. The date on options represents the expiration date of the option contract. The option contract may be exercised at any date on or before the date shown.
CURRENCY EXPOSURE APRIL 30, 2016
| | | | | | | | |
| | | VALUE | | | % OF TOTAL
INVESTMENTS | |
| US Dollar | | $ | 219,171,830 | | | | 63.1% | |
| European Monetary Unit | | | 63,375,160 | | | | 18.3% | |
| Japanese Yen | | | 18,743,082 | | | | 5.4% | |
| British Pound Sterling | | | 18,238,907 | | | | 5.3% | |
| Hong Kong Dollar | | | 10,480,682 | | | | 3.0% | |
| South African Rand | | | 5,277,398 | | | | 1.5% | |
| New Taiwan Dollar | | | 3,964,941 | | | | 1.1% | |
| Danish Krone | | | 3,359,487 | | | | 1.0% | |
| Swiss Franc | | | 2,775,104 | | | | 0.8% | |
| Indian Rupee | | | 1,732,515 | | | | 0.5% | |
| Total Investments | | $ | 347,119,106 | | | | 100.0% | |
Currency exposure may vary over time.
| | | | |
| 110 | | CALAMOS OPEN-END FAMILY OF FUNDS SEMIANNUAL REPORT | | See accompanying Notes to Financial Statements |
Convertible Fund Schedule of Investments April 30, 2016 (Unaudited)
| | | | | | | | | | |
PRINCIPAL
AMOUNT | | | | | | | VALUE | |
| | CONVERTIBLE BONDS (64.6%) | |
| | | | | | Consumer Discretionary (15.7%) | |
| | 12,600,000 | | | | | CalAtlantic Group, Inc.
1.625%, 05/15/18 | | $ | 15,112,062 | |
| | 8,200,000 | | | | | Ctrip.com International, Ltd.*
1.000%, 07/01/20 | | | 9,019,016 | |
| | 7,000,000 | | | | | Jarden Corp.
1.125%, 03/15/34 | | | 9,063,670 | |
| | 4,700,000 | | | | | Lennar Corp.
3.250%, 11/15/21 | | | 9,107,073 | |
| | 7,700,000 | | | | | Liberty Interactive, LLC (Time Warner Cable, Inc., Time Warner, Inc.)§
0.750%, 03/30/43 | | | 13,277,688 | |
| | 13,600,000 | | | | | Liberty Media Corp.
1.375%, 10/15/23 | | | 13,694,248 | |
| | 15,900,000 | | | | | Priceline Group, Inc.^
0.350%, 06/15/20 | | | 19,447,846 | |
| | | | | | Tesla Motors, Inc. | | | | |
| | 38,500,000 | | | | | 1.250%, 03/01/21 | | | 35,409,027 | |
| | 4,530,000 | | | | | 0.250%, 03/01/19 | | | 4,264,791 | |
| | | | | | | | | | |
| | | | | | | | | 128,395,421 | |
| | | | | | | | | | |
| | | | | | Energy (1.5%) | |
| | 12,300,000 | | | | | SEACOR Holdings, Inc.
2.500%, 12/15/27 | | | 12,038,256 | |
| | | | | | | | | | |
| | | | | | Financials (6.4%) | |
| | 18,800,000 | | | | | Ares Capital Corp.^
4.750%, 01/15/18 | | | 19,593,078 | |
| | 4,200,000 | | | EUR | | Azimut Holding, S.p.A.
2.125%, 11/25/20 | | | 5,593,589 | |
| | 11,600,000 | | | | | Colony Starwood Homes
3.000%, 07/01/19 | | | 11,595,534 | |
| | 4,195,000 | | | | | Spirit Realty Capital, Inc.^
3.750%, 05/15/21 | | | 4,539,451 | |
| | 10,700,000 | | | | | Starwood Property Trust, Inc.
4.550%, 03/01/18 | | | 10,902,819 | |
| | | | | | | | | | |
| | | | | | | | | 52,224,471 | |
| | | | | | | | | | |
| | | | | | Health Care (10.8%) | |
| | 4,250,000 | | | | | Anacor Pharmaceuticals, Inc.*
2.000%, 04/15/23 | | | 4,880,955 | |
| | 4,900,000 | | | | | BioMarin Pharmaceutical, Inc.
0.750%, 10/15/18 | | | 5,771,245 | |
| | 9,900,000 | | | | | Emergent Biosolutions, Inc.
2.875%, 01/15/21 | | | 13,521,618 | |
| | 975,000 | | | | | Gilead Sciences, Inc.
1.625%, 05/01/16 | | | 3,861,302 | |
| | 6,700,000 | | | | | Hologic, Inc.‡
0.000%, 12/15/43 | | | 8,302,004 | |
| | 4,000,000 | | | | | Illumina, Inc.^
0.500%, 06/15/21 | | | 4,131,660 | |
| | 2,700,000 | | | | | Incyte Corp.
0.375%, 11/15/18 | | | 4,162,050 | |
| | | | | | | | | | |
PRINCIPAL
AMOUNT | | | | | | | VALUE | |
| | 4,600,000 | | | | | Ionis Pharmaceuticals, Inc.
1.000%, 11/15/21 | | $ | 4,271,077 | |
| | 4,040,000 | | | | | Jazz Investments I, Ltd.^
1.875%, 08/15/21 | | | 4,514,276 | |
| | 9,733,000 | | | | | Medidata Solutions, Inc.^
1.000%, 08/01/18 | | | 10,306,079 | |
| | 11,100,000 | | | | | Molina Healthcare, Inc.
1.625%, 08/15/44 | | | 12,438,271 | |
| | 8,440,000 | | | | | NuVasive, Inc.*
2.250%, 03/15/21 | | | 9,517,619 | |
| | 3,000,000 | | | | | XenoPort, Inc.
2.500%, 02/01/22 | | | 2,167,095 | |
| | | | | | | | | | |
| | | | | | | | | 87,845,251 | |
| | | | | | | | | | |
| | | | | | Industrials (0.7%) | |
| | 5,135,000 | | | | | Greenbrier Companies, Inc.
3.500%, 04/01/18 | | | 5,630,964 | |
| | | | | | | | | | |
| | | | | | Information Technology (28.9%) | |
| | 4,943,000 | | | | | Citrix Systems, Inc.
0.500%, 04/15/19 | | | 5,572,071 | |
| | 4,300,000 | | | | | Finisar Corp.
0.500%, 12/15/33 | | | 4,127,635 | |
| | 5,900,000 | | | | | FireEye, Inc.*
1.625%, 06/01/35 | | | 4,874,197 | |
| | 5,486,000 | | | | | Inphi Corp.*
1.125%, 12/01/20 | | | 5,755,884 | |
| | 11,600,000 | | | | | Intel Corp.
3.250%, 08/01/39 | | | 17,622,778 | |
| | 3,100,000 | | | | | Knowles Corp.*
3.250%, 11/01/21 | | | 3,154,250 | |
| | 25,100,000 | | | | | LinkedIn Corp.
0.500%, 11/01/19 | | | 23,451,557 | |
| | 5,355,000 | | | | | Microchip Technology, Inc.
1.625%, 02/15/25 | | | 5,574,421 | |
| | 8,000,000 | | | | | Micron Technology, Inc.
1.625%, 02/15/33 | | | 9,553,200 | |
| | 8,150,000 | | | | | NVIDIA Corp.
1.000%, 12/01/18 | | | 14,528,149 | |
| | 15,000,000 | | | | | NXP Semiconductors, NV^
1.000%, 12/01/19 | | | 17,019,375 | |
| | 2,600,000 | | | | | Palo Alto Networks, Inc.
0.000%, 07/01/19 | | | 3,820,414 | |
| | 6,285,000 | | | | | Proofpoint, Inc.*^
0.750%, 06/15/20 | | | 6,433,232 | |
| | 9,235,000 | | | | | Red Hat, Inc.^
0.250%, 10/01/19 | | | 11,358,265 | |
| | 23,600,000 | | | | | Salesforce.com, Inc.
0.250%, 04/01/18 | | | 29,762,904 | |
| | 3,795,000 | | | | | ServiceNow, Inc.
0.000%, 11/01/18 | | | 4,392,276 | |
| | | | | | SunPower Corp. | | | | |
| | 8,300,000 | | | | | 0.750%, 06/01/18^ | | | 8,789,866 | |
| | 4,978,000 | | | | | 4.000%, 01/15/23* | | | 4,803,322 | |
| | | | | | |
| See accompanying Notes to Schedule of Investments | | www.calamos.com | | | 111 | |
Convertible Fund Schedule of Investments April 30, 2016 (Unaudited)
| | | | | | | | | | |
PRINCIPAL
AMOUNT | | | | | | | VALUE | |
| | 16,385,000 | | | | | Synchronoss Technologies, Inc.^
0.750%, 08/15/19 | | $ | 15,925,155 | |
| | 2,800,000 | | | | | Take-Two Interactive Software, Inc.
1.750%, 12/01/16 | | | 5,021,968 | |
| | 8,450,000 | | | | | Twitter, Inc.
1.000%, 09/15/21 | | | 7,083,719 | |
| | 4,000,000 | | | | | WebMD Health Corp.
2.500%, 01/31/18 | | | 4,589,260 | |
| | | | | | Workday, Inc. | | | | |
| | 10,800,000 | | | | | 0.750%, 07/15/18 | | | 12,122,676 | |
| | 9,000,000 | | | | | 1.500%, 07/15/20 | | | 10,533,735 | |
| | | | | | | | | | |
| | | | | | | | | 235,870,309 | |
| | | | | | | | | | |
| | | | | | Materials (0.6%) | |
| | 4,000,000 | | | | | RTI International Metals, Inc.
1.625%, 10/15/19 | | | 4,588,580 | |
| | | | | | | | | | |
| | | | | | TOTAL CONVERTIBLE BONDS
(Cost $530,839,943) | | | 526,593,252 | |
| | | | | | | | | | |
| | | | | | | | | | |
| | SYNTHETIC CONVERTIBLE SECURITIES (2.4%) ¤ | |
| | Corporate Bonds (2.2%) | | | | |
| | | | | | Consumer Discretionary (1.6%) | |
| | | | | | DISH DBS Corp. | | | | |
| | 3,170,000 | | | | | 5.125%, 05/01/20 | | | 3,201,700 | |
| | 2,830,000 | | | | | 5.875%, 07/15/22 | | | 2,768,094 | |
| | 7,000,000 | | | | | GameStop Corp.*^
5.500%, 10/01/19 | | | 6,825,000 | |
| | | | | | | | | | |
| | | | | | | | | 12,794,794 | |
| | | | | | | | | | |
| | | | | | Telecommunication Services (0.6%) | |
| | 4,900,000 | | | | | SBA Communications Corp.
4.875%, 07/15/22 | | | 4,945,937 | |
| | | | | | | | | | |
| | | | | | Total CORPORATE BONDS | | | 17,740,731 | |
| | | | | | | | | | |
| | | | | | | | | | |
NUMBER OF
CONTRACTS | | | | | | | VALUE | |
| | Purchased Options (0.2%) # | |
| | | | | | Information Technology (0.2%) | |
| | 1,625 | | | | | Apple, Inc.
Call, 01/20/17, Strike $110.00 | | | 450,937 | |
| | 1,700 | | | | | Lam Research Corp.
Call, 01/20/17, Strike $82.50 | | | 765,000 | |
| | | | | | Xilinx, Inc. | | | | |
| | 1,950 | | | | | Call, 01/20/17, Strike $50.00 | | | 218,400 | |
| | 1,375 | | | | | Call, 06/17/16, Strike $43.00 | | | 193,188 | |
| | | | | | | | | | |
| | | | | | TOTAL PURCHASED OPTIONS | | | 1,627,525 | |
| | | | | | | | | | |
| | | | | | TOTAL SYNTHETIC CONVERTIBLE SECURITIES
(Cost $21,522,363) | | | 19,368,256 | |
| | | | | | | | | | |
| | | | | | | | | | |
NUMBER OF
SHARES | | | | | | | VALUE | |
| | CONVERTIBLE PREFERRED STOCKS (30.1%) | |
| | | | | | Consumer Discretionary (0.6%) | |
| | 62,300 | | | | | Fiat Chrysler Automobiles, NV
7.875% | | $ | 4,505,193 | |
| | | | | | | | | | |
| | | | | | Consumer Staples (1.7%) | |
| | 194,500 | | | | | Tyson Foods, Inc.
4.750% | | | 14,186,830 | |
| | | | | | | | | | |
| | | | | | Energy (2.7%) | |
| | 140,000 | | | | | Hess Corp.^
8.000% | | | 10,642,800 | |
| | 183,000 | | | | | Southwestern Energy Company
6.250% | | | 5,799,270 | |
| | 120,000 | | | | | WPX Energy, Inc.
6.250% | | | 5,672,400 | |
| | | | | | | | | | |
| | | | | | | | | 22,114,470 | |
| | | | | | | | | | |
| | | | | | Financials (10.6%) | |
| | 254,170 | | | | | Affiliated Managers Group, Inc.
5.150% | | | 14,694,203 | |
| | 108,000 | | | | | American Tower Corp.
5.250% | | | 11,463,120 | |
| | 17,500 | | | | | Bank of America Corp.
7.250% | | | 20,620,250 | |
| | 83,500 | | | | | Crown Castle International Corp.
4.500% | | | 8,868,953 | |
| | 17,955 | | | | | Wells Fargo & Company
7.500% | | | 22,371,930 | |
| | 135,000 | | | | | Welltower, Inc.#
6.500% | | | 8,333,550 | |
| | | | | | | | | | |
| | | | | | | | | 86,352,006 | |
| | | | | | | | | | |
| | | | | | Health Care (8.5%) | |
| | 39,425 | | | | | Allergan, PLC
5.500% | | | 31,992,993 | |
| | 58,350 | | | | | Amsurg Corp.
5.250% | | | 8,862,198 | |
| | 358,260 | | | | | Anthem, Inc.
5.250% | | | 16,605,351 | |
| | 13,340 | | | | | Teva Pharmaceutical Industries, Ltd.
7.000% | | | 12,019,340 | |
| | | | | | | | | | |
| | | | | | | | | 69,479,882 | |
| | | | | | | | | | |
| | | | | | Industrials (1.3%) | |
| | 92,000 | | | | | Stanley Black & Decker, Inc.^
6.250% | | | 10,894,640 | |
| | | | | | | | | | |
| | | | | | Materials (0.7%) | |
| | 138,150 | | | | | Alcoa, Inc.^
5.375% | | | 5,260,752 | |
| | | | | | | | | | |
| | | | | | Telecommunication Services (1.6%) | |
| | 52,300 | | | | | Frontier Communications Corp.
11.125% | | | 5,454,890 | |
| | 113,500 | | | | | T-Mobile USA, Inc.
5.500% | | | 7,696,435 | |
| | | | | | | | | | |
| | | | | | | | | 13,151,325 | |
| | | | | | | | | | |
| | | | |
| 112 | | CALAMOS OPEN-END FAMILY OF FUNDS SEMIANNUAL REPORT | | See accompanying Notes to Schedule of Investments |
Convertible Fund Schedule of Investments April 30, 2016 (Unaudited)
| | | | | | | | | | |
NUMBER OF
SHARES | | | | | | | VALUE | |
| | | | | | Utilities (2.4%) | |
| | 140,600 | | | | | Dominion Resources, Inc.
6.375% | | $ | 6,935,798 | |
| | 130,000 | | | | | Exelon Corp.^
6.500% | | | 6,299,800 | |
| | 104,000 | | | | | NextEra Energy, Inc.
5.799% | | | 6,286,800 | |
| | | | | | | | | | |
| | | | | | | | | 19,522,398 | |
| | | | | | | | | | |
| | | | | | TOTAL CONVERTIBLE PREFERRED STOCKS
(Cost $239,172,841) | | | 245,467,496 | |
| | | | | | | | | | |
| | COMMON STOCKS (1.4%) | |
| | | | | | Information Technology (1.4%) | |
| | 115,500 | | | | | Finisar Corp.# | | | 1,901,130 | |
| | 127,000 | | | | | Lam Research Corp. | | | 9,702,800 | |
| | | | | | | | | | |
| | | | | | TOTAL COMMON STOCKS
(Cost $12,400,227) | | | 11,603,930 | |
| | | | | | | | | | |
NUMBER OF
SHARES | | | | | | | VALUE | |
| | SHORT TERM INVESTMENT (2.3%) | |
| | 19,101,702 | | | | | Fidelity Prime Money Market Fund - Institutional Class
(Cost $19,101,702) | | | 19,101,702 | |
| | | | | | | | | | |
NUMBER OF
SHARES/
PRINCIPAL
AMOUNT | | | | | | | VALUE | |
| INVESTMENT OF CASH COLLATERAL FOR SECURITIES
LOANED (6.7%) |
|
| | | | | | Federal Home Loan Bank Discount Notes | |
| | 11,772,040 | | | | | 0.000%, 06/15/16 | | | 11,772,040 | |
| | 9,418,736 | | | | | 0.000%, 05/24/16 | | | 9,418,736 | |
| | 7,064,248 | | | | | 0.000%, 05/02/16 | | | 7,064,248 | |
| | 10,874,017 | | | | | Fidelity Prime Money Market Fund - Institutional Class | | | 10,874,017 | |
| | 7,276,223 | | | | | Goldman Sachs Financial Square Prime Obligations Fund | | | 7,276,223 | |
| | 8,458,818 | | | | | Morgan Stanley Institutional Liquidity Fund | | | 8,458,818 | |
| | | | | | | | | | |
| | | | | | TOTAL INVESTMENT OF CASH COLLATERAL FOR SECURITIES LOANED
(Cost $54,864,082) | | | 54,864,082 | |
| | | | | | | | | | |
| TOTAL INVESTMENTS (107.5%)
(Cost $877,901,158) | | | 876,998,718 | |
| | | | | | | | | | |
| |
| | PAYABLE UPON RETURN OF SECURITIES ON LOAN (-6.7%) | | | (54,864,082 | ) |
| | | | | | | | | | |
| |
| | LIABILITIES, LESS OTHER ASSETS (-0.8%) | | | (6,313,093 | ) |
| | | | | | | | | | |
| |
| | NET ASSETS (100.0%) | | $ | 815,821,543 | |
| | | | | | | | | | |
FORWARD FOREIGN CURRENCY CONTRACTS
| | | | | | | | | | | | | | | | |
COUNTER
PARTY | | SHORT CONTRACTS | | SETTLEMENT DATE | | LOCAL CURRENCY | | | CURRENT VALUE | | | UNREALIZED GAIN/LOSS | |
| Northern Trust Company | | European
Monetary Unit | | 07/21/16 | | | 4,471,000 | | | $ | 5,132,006 | | | $ | (91,584 | ) |
| | | | | | | | | | | | | | | | |
NOTES TO SCHEDULE OF INVESTMENTS
| * | Securities issued and sold pursuant to a Rule 144A transaction are excepted from the registration requirement of the Securities Act of 1933, as amended. These securities may only be sold to qualified institutional buyers (“QIBs”), such as the Fund. Any resale of these securities must generally be effected through a sale that is registered under the Act or otherwise exempted from such registration requirements. |
| § | Securities exchangeable or convertible into securities of one or more entities that are different than the issuer. Each entity is identified in the parenthetical. |
| ^ | Security, or portion of security, is on loan. |
| ‡ | Variable rate or step bond security. The rate shown is the rate in effect at April 30, 2016. |
| ¤ | The synthetic convertible securities strategy combines separate securities that together possess the economic characteristics similar to a convertible security. |
| # | Non-income producing security. |
FOREIGN CURRENCY ABBREVIATION
| | |
| EUR | | European Monetary Unit |
Note: Value for securities denominated in foreign currencies is shown in U.S. dollars. The principal amount for such securities is shown in the respective foreign currency. The date on options represents the expiration date of the option contract. The option contract may be exercised at any date on or before the date shown.
| | | | | | |
| See accompanying Notes to Financial Statements | | www.calamos.com | | | 113 | |
Global Convertible Fund Schedule of Investments April 30, 2016 (Unaudited)
| | | | | | | | | | |
PRINCIPAL
AMOUNT | | | | | | | VALUE | |
| | CONVERTIBLE BONDS (70.8%) | |
| | | | | | Consumer Discretionary (10.4%) | |
| | | | | | Ctrip.com International, Ltd. | | | | |
| | 410,000 | | | | | 1.000%, 07/01/20* | | $ | 450,951 | |
| | 360,000 | | | | | 1.250%, 10/15/18 | | | 459,290 | |
| | 50,000,000 | | | JPY | | Iida Group Holdings Company, Ltd.
0.000%, 06/18/20 | | | 500,005 | |
| | 560,000 | | | | | Liberty Media Corp.
1.375%, 10/15/23 | | | 563,881 | |
| | | | | | Priceline Group, Inc. | | | | |
| | 785,000 | | | | | 1.000%, 03/15/18 | | | 1,159,853 | |
| | 725,000 | | | | | 0.900%, 09/15/21 | | | 749,360 | |
| | 90,000,000 | | | JPY | | Sony Corp.
0.000%, 09/30/22 | | | 855,314 | |
| | 1,000,000 | | | EUR | | Steinhoff Finance Holdings, GmbH
1.250%, 08/11/22 | | | 1,184,306 | |
| | | | | | Tesla Motors, Inc. | | | | |
| | 1,395,000 | | | | | 1.250%, 03/01/21 | | | 1,283,002 | |
| | 610,000 | | | | | 0.250%, 03/01/19 | | | 574,287 | |
| | | | | | | | | | |
| | | | | | | | | 7,780,249 | |
| | | | | | | | | | |
| | | | | | Energy (1.1%) | |
| | 1,060,000 | | | | | Whiting Petroleum Corp.*
1.250%, 04/01/20 | | | 802,680 | |
| | | | | | | | | | |
| | | | | | Financials (17.1%) | |
| | | | | | Ares Capital Corp. | | | | |
| | 435,000 | | | | | 4.750%, 01/15/18 | | | 453,350 | |
| | 155,000 | | | | | 4.375%, 01/15/19 | | | 160,354 | |
| | 800,000 | | | EUR | | AURELIUS, SE & Co. KGaA
1.000%, 12/01/20 | | | 1,041,506 | |
| | 1,000,000 | | | | | AYC Finance, Ltd.
0.500%, 05/02/19 | | | 1,047,602 | |
| | 1,500,000 | | | EUR | | Azimut Holding, S.p.A.
2.125%, 11/25/20 | | | 1,997,710 | |
| | 400,000 | | | EUR | | Beni Stabili S.p.A SIIQ
0.875%, 01/31/21 | | | 456,989 | |
| | 400,000 | | | GBP | | British Land White 2015, Ltd.
0.000%, 06/09/20 | | | 557,853 | |
| | 1,040,000 | | | | | Colony Starwood Homes
3.000%, 07/01/19 | | | 1,039,600 | |
| | 1,951,013 | | | EUR | | Credit Agricole, SA
0.000%, 12/06/16 | | | 1,584,058 | |
| | 1,200,000 | | | EUR | | Cromwell SPV Finance Pty, Ltd.
2.000%, 02/04/20 | | | 1,340,547 | |
| | 505,000 | | | CAD | | Element Financial Corp.*
4.250%, 06/30/20 | | | 392,396 | |
| | 800,000 | | | EUR | | Grand City Properties, SA
0.250%, 03/02/22 | | | 977,389 | |
| | 200,000 | | | EUR | | LEG Immobilien, AG
0.500%, 07/01/21 | | | 344,180 | |
| | 20,000 | | | | | PRA Group, Inc.
3.000%, 08/01/20 | | | 17,165 | |
| | | | | | | | | | |
PRINCIPAL
AMOUNT | | | | | | | VALUE | |
| | 608,000 | | | | | Starwood Property Trust, Inc.
4.550%, 03/01/18 | | $ | 619,525 | |
| | 94,000 | | | EUR | | Unibail-Rodamco, SE
0.000%, 01/01/22 | | | 379,773 | |
| | 400,000 | | | | | Yamaguchi Financial Group, Inc.‡
0.130%, 03/26/20 | | | 377,700 | |
| | | | | | | | | | |
| | | | | | | | | 12,787,697 | |
| | | | | | | | | | |
| | | | | | Health Care (9.3%) | |
| | 355,000 | | | | | Anacor Pharmaceuticals, Inc.*
2.000%, 04/15/23 | | | 407,703 | |
| | | | | | BioMarin Pharmaceutical, Inc. | | | | |
| | 330,000 | | | | | 0.750%, 10/15/18 | | | 388,676 | |
| | 225,000 | | | | | 1.500%, 10/15/20 | | | 274,143 | |
| | 241,000 | | | | | Emergent Biosolutions, Inc.
2.875%, 01/15/21 | | | 329,163 | |
| | 580,000 | | | | | Hologic, Inc.‡ 0.000%, 12/15/43 | | | 718,681 | |
| | | | | | Illumina, Inc. | | | | |
| | 235,000 | | | | | 0.000%, 06/15/19^ | | | 234,538 | |
| | 95,000 | | | | | 0.500%, 06/15/21 | | | 98,127 | |
| | 415,000 | | | SGD | | Indah Capital, Ltd.
0.000%, 10/24/18 | | | 360,132 | |
| | 800,000 | | | EUR | | Magyar Nemzeti Vagyonkezelo Zrt
3.375%, 04/02/19 | | | 1,027,215 | |
| | 1,320,000 | | | | | Molina Healthcare, Inc.
1.625%, 08/15/44 | | | 1,479,146 | |
| | 845,000 | | | | | NuVasive, Inc.*
2.250%, 03/15/21 | | | 952,890 | |
| | 600,000 | | | | | QIAGEN, NV
0.875%, 03/19/21 | | | 650,007 | |
| | | | | | | | | | |
| | | | | | | | | 6,920,421 | |
| | | | | | | | | | |
| | | | | | Industrials (8.8%) | |
| | 500,000 | | | GBP | | Carillion Finance Jersey, Ltd.
2.500%, 12/19/19 | | | 708,433 | |
| | 355,000 | | | | | Greenbrier Companies, Inc.
3.500%, 04/01/18 | | | 389,288 | |
| | 90,000,000 | | | JPY | | Japan Airport Terminal Company, Ltd.
0.000%, 03/06/20 | | | 847,353 | |
| | 200,000 | | | | | Larsen & Toubro, Ltd.
0.675%, 10/22/19 | | | 185,794 | |
| | 60,000,000 | | | JPY | | Lixil Group Corp.
0.000%, 03/04/22 | | | 556,328 | |
| | 1,000,000 | | | | | MISUMI Group, Inc.
0.000%, 10/22/18 | | | 1,265,075 | |
| | 500,000 | | | EUR | | Prysmian S.p.A.
1.250%, 03/08/18 | | | 639,242 | |
| | 1,506,000 | | | EUR | | Safran, SA
0.000%, 12/31/20 | | | 1,610,543 | |
| | 335,000 | | | | | Trinity Industries, Inc.
3.875%, 06/01/36 | | | 366,996 | |
| | | | | | | | | | |
| | | | | | | | | 6,569,052 | |
| | | | | | | | | | |
| | | | |
| 114 | | CALAMOS OPEN-END FAMILY OF FUNDS SEMIANNUAL REPORT | | See accompanying Notes to Schedule of Investments |
Global Convertible Fund Schedule of Investments April 30, 2016 (Unaudited)
| | | | | | | | | | |
PRINCIPAL
AMOUNT | | | | | | | VALUE | |
| | | | | | Information Technology (20.7%) | |
| | 1,000,000 | | | | | Advanced Semiconductor Engineering, Inc.
0.000%, 03/27/18 | | $ | 911,560 | |
| | 919,000 | | | | | Citrix Systems, Inc.
0.500%, 04/15/19 | | | 1,035,957 | |
| | 348,000 | | | | | Euronet Worldwide, Inc.
1.500%, 10/01/44 | | | 426,427 | |
| | | | | | FireEye, Inc.* | | | | |
| | 348,000 | | | | | 1.000%, 06/01/35 | | | 301,925 | |
| | 330,000 | | | | | 1.625%, 06/01/35 | | | 272,625 | |
| | 320,000 | | | | | Inphi Corp.*
1.125%, 12/01/20 | | | 335,742 | |
| | | | | | Intel Corp. | | | | |
| | 330,000 | | | | | 2.950%, 12/15/35 | | | 410,431 | |
| | 235,000 | | | | | 3.250%, 08/01/39 | | | 357,013 | |
| | 720,000 | | | | | LinkedIn Corp.
0.500%, 11/01/19 | | | 672,714 | |
| | 795,000 | | | | | Microchip Technology, Inc.
1.625%, 02/15/25 | | | 827,575 | |
| | 215,000 | | | | | Micron Technology, Inc.
2.125%, 02/15/33 | | | 261,861 | |
| | 795,000 | | | | | NVIDIA Corp.
1.000%, 12/01/18 | | | 1,417,163 | |
| | 600,000 | | | | | NXP Semiconductors, NV
1.000%, 12/01/19 | | | 680,775 | |
| | 600,000 | | | | | Qihoo 360 Technology Company, Ltd.
1.750%, 08/15/21 | | | 593,352 | |
| | 535,000 | | | | | Red Hat, Inc.^
0.250%, 10/01/19 | | | 658,005 | |
| | 900,000 | | | EUR | | Rocket Internet, SE
3.000%, 07/22/22 | | | 847,533 | |
| | 1,465,000 | | | | | Salesforce.com, Inc.
0.250%, 04/01/18 | | | 1,847,570 | |
| | 335,000 | | | | | SanDisk Corp.
1.500%, 08/15/17 | | | 523,881 | |
| | 230,000 | | | | | Synchronoss Technologies, Inc.
0.750%, 08/15/19 | | | 223,545 | |
| | 405,000 | | | | | Take-Two Interactive Software, Inc.
1.000%, 07/01/18 | | | 663,991 | |
| | | | | | Twitter, Inc. | | | | |
| | 345,000 | | | | | 1.000%, 09/15/21 | | | 289,217 | |
| | 325,000 | | | | | 0.250%, 09/15/19 | | | 283,899 | |
| | | | | | Workday, Inc. | | | | |
| | 495,000 | | | | | 1.500%, 07/15/20 | | | 579,355 | |
| | 295,000 | | | | | 0.750%, 07/15/18 | | | 331,129 | |
| | 690,000 | | | | | Yahoo!, Inc. 0.000%, 12/01/18 | | | 693,640 | |
| | | | | | | | | | |
| | | | | | | | | 15,446,885 | |
| | | | | | | | | | |
| | | | | | Materials (1.1%) | |
| | 600,000 | | | EUR | | Buzzi Unicem, S.p.A.
1.375%, 07/17/19 | | | 845,261 | |
| | | | | | | | | | |
| | | | | | | | | | |
PRINCIPAL
AMOUNT | | | | | | | VALUE | |
| | | | | | Telecommunication Services (2.3%) | |
| | 1,500,000 | | | EUR | | America Movil, SAB de CV
0.000%, 05/28/20 | | $ | 1,718,262 | |
| | | | | | | | | | |
| | | | | | TOTAL CONVERTIBLE BONDS
(Cost $53,342,103) | | | 52,870,507 | |
| | | | | | | | | | |
| | | | | | | | | | |
| | SYNTHETIC CONVERTIBLE SECURITIES (7.8%) ¤ | |
| | Corporate Bonds (7.2%) | | | | |
| | | | | | Consumer Discretionary (1.9%) | |
| | 445,000 | | | | | CalAtlantic Group, Inc.
6.625%, 05/01/20 | | | 493,116 | |
| | 625,000 | | | | | D.R. Horton, Inc.
3.750%, 03/01/19 | | | 640,625 | |
| | 284,000 | | | | | Mediacom Broadband, LLC / Mediacom Broadband Corp.
5.500%, 04/15/21 | | | 282,047 | |
| | | | | | | | | | |
| | | | | | | | | 1,415,788 | |
| | | | | | | | | | |
| | | | | | Energy (0.1%) | |
| | 50,000 | | | | | Gulfport Energy Corp.
7.750%, 11/01/20 | | | 50,719 | |
| | | | | | | | | | |
| | | | | | Health Care (0.6%) | |
| | 445,000 | | | | | HCA Holdings, Inc.
6.250%, 02/15/21 | | | 484,216 | |
| | | | | | | | | | |
| | | | | | Industrials (2.2%) | |
| | 450,000 | | | | | AerCap Ireland Capital, Ltd. / AerCap Global Aviation Trust
5.000%, 10/01/21 | | | 476,156 | |
| | 695,000 | | | | | Icahn Enterprises, LP
4.875%, 03/15/19 | | | 693,697 | |
| | 455,000 | | | | | United Continental Holdings, Inc.
6.375%, 06/01/18 | | | 480,025 | |
| | | | | | | | | | |
| | | | | | | | | 1,649,878 | |
| | | | | | | | | | |
| | | | | | Materials (1.2%) | |
| | 305,000 | | | | | Chemtura Corp.
5.750%, 07/15/21 | | | 305,381 | |
| | 300,000 | | | EUR | | Huntsman International, LLC
5.125%, 04/15/21 | | | 354,250 | |
| | 200,000 | | | EUR | | INEOS Group Holdings, SA
5.750%, 02/15/19 | | | 235,594 | |
| | | | | | | | | | |
| | | | | | | | | 895,225 | |
| | | | | | | | | | |
| | | | | | Telecommunication Services (1.2%) | |
| | 283,000 | | | | | Sprint Corp.
7.250%, 09/15/21 | | | 227,815 | |
| | 645,000 | | | | | T-Mobile USA, Inc.
6.250%, 04/01/21 | | | 677,653 | |
| | | | | | | | | | |
| | | | | | | | | 905,468 | |
| | | | | | | | | | |
| | | | | | TOTAL CORPORATE BONDS | | | 5,401,294 | |
| | | | | | | | | | |
| | | | | | |
| See accompanying Notes to Schedule of Investments | | www.calamos.com | | | 115 | |
Global Convertible Fund Schedule of Investments April 30, 2016 (Unaudited)
| | | | | | | | | | |
NUMBER OF
CONTRACTS | | | | | | | VALUE | |
| | Purchased Options (0.6%) # | |
| | | | | | Consumer Discretionary (0.2%) | |
| | 320 | | | | | Lennar Corp.
Call, 05/20/16, Strike $45.00 | | $ | 45,120 | |
| | 80 | | | EUR | | LVMH Moet Hennessy Louis Vuitton, SE Call, 12/16/16, Strike 150.00 | | | 93,940 | |
| | | | | | | | | | |
| | | | | | | | | 139,060 | |
| | | | | | | | | | |
| | | | | | Financials (0.0%) | |
| | 195 | | | EUR | | UniCredit S.p.A
Call, 06/17/16, Strike 5.60 | | | 2,344 | |
| | | | | | | | | | |
| | | | | | Industrials (0.1%) | |
| | 255 | | | EUR | | Airbus Group
Call, 06/17/16, Strike 60.00 | | | 11,096 | |
| | 125 | | | GBP | | International Consolidated Air
Call, 07/15/16, Strike 5.80 | | | 18,721 | |
| | 95 | | | EUR | | Siemens, AG
Call, 12/16/16, Strike 94.00 | | | 62,929 | |
| | | | | | | | | | |
| | | | | | | | | 92,746 | |
| | | | | | | | | | |
| | | | | | Information Technology (0.2%) | |
| | 145 | | | | | Apple, Inc.
Call, 01/20/17, Strike $110.00 | | | 40,238 | |
| | 255 | | | | | Lam Research Corp.
Call, 01/20/17, Strike $82.50 | | | 114,750 | |
| | | | | | | | | | |
| | | | | | | | | 154,988 | |
| | | | | | | | | | |
| | | | | | Telecommunication Services (0.1%) | |
| | 450 | | | GBP | | Vodafone Group, PLC
Call, 12/16/16, Strike 2.20 | | | 84,943 | |
| | | | | | | | | | |
| | | | | | TOTAL PURCHASED OPTIONS | | | 474,081 | |
| | | | | | | | | | |
| | | | | | TOTAL SYNTHETIC
CONVERTIBLE SECURITIES
(Cost $6,454,901) | | | 5,875,375 | |
| | | | | | | | | | |
| | | | | | | | | | |
NUMBER OF
SHARES | | | | | | | VALUE | |
| | CONVERTIBLE PREFERRED STOCKS (15.4%) | |
| | | | | | Energy (2.5%) | |
| | 6,510 | | | | | Hess Corp.
8.000% | | | 494,890 | |
| | 28,040 | | | | | Southwestern Energy Company
6.250% | | | 888,588 | |
| | 9,770 | | | | | WPX Energy, Inc.
6.250% | | | 461,828 | |
| | | | | | | | | | |
| | | | | | | | | 1,845,306 | |
| | | | | | | | | | |
| | | | | | Financials (7.0%) | |
| | 6,345 | | | | | American Tower Corp.
5.250% | | | 673,458 | |
| | 1,610 | | | | | Bank of America Corp.
7.250% | | | 1,897,063 | |
| | 6,565 | | | | | Crown Castle International Corp.
4.500% | | | 697,302 | |
| | 1,565 | | | | | Wells Fargo & Company
7.500% | | | 1,949,990 | |
| | | | | | | | | | |
| | | | | | | | | 5,217,813 | |
| | | | | | | | | | |
| | | | | | | | | | |
NUMBER OF
SHARES | | | | | | | VALUE | |
| | | | | | Health Care (4.4%) | |
| | 1,610 | | | | | Allergan, PLC
5.500% | | $ | 1,306,499 | |
| | 24,490 | | | | | Anthem, Inc.
5.250% | | | 1,135,111 | |
| | 970 | | | | | Teva Pharmaceutical Industries, Ltd.
7.000% | | | 873,970 | |
| | | | | | | | | | |
| | | | | | | | | 3,315,580 | |
| | | | | | | | | | |
| | | | | | Utilities (1.5%) | |
| | 8,205 | | | | | Exelon Corp.
6.500% | | | 397,614 | |
| | 12,075 | | | | | NextEra Energy, Inc.
5.799% | | | 729,934 | |
| | | | | | | | | | |
| | | | | | | | | 1,127,548 | |
| | | | | | | | | | |
| | | | | | TOTAL CONVERTIBLE PREFERRED STOCKS
(Cost $11,272,894) | | | 11,506,247 | |
| | | | | | | | | | |
| | | | | | | | | | |
| | SHORT TERM INVESTMENT (5.4%) | |
| | 3,987,549 | | | | | Fidelity Prime Money Market Fund - Institutional Class
(Cost $3,987,549) | | | 3,987,549 | |
| | | | | | | | | | |
NUMBER OF
SHARES/
PRINCIPAL
AMOUNT | | | | | | | VALUE | |
| INVESTMENT OF CASH COLLATERAL FOR SECURITIES
LOANED (1.1%) |
|
| | | | | | Federal Home Loan Bank Discount Notes | | | | |
| | 175,563 | | | | | 0.000%, 06/15/16 | | | 175,563 | |
| | 140,467 | | | | | 0.000%, 05/24/16 | | | 140,467 | |
| | 105,353 | | | | | 0.000%, 05/02/16 | | | 105,353 | |
| | 162,170 | | | | | Fidelity Prime Money Market Fund - Institutional Class | | | 162,170 | |
| | 108,514 | | | | | Goldman Sachs Financial Square Prime Obligations Fund | | | 108,514 | |
| | 126,151 | | | | | Morgan Stanley Institutional Liquidity Fund | | | 126,151 | |
| | | | | | | | | | |
| | | | | | TOTAL INVESTMENT OF CASH COLLATERAL FOR SECURITIES LOANED
(Cost $818,218) | | | 818,218 | |
| | | | | | | | | | |
| TOTAL INVESTMENTS (100.5%)
(Cost $75,875,665) | | | 75,057,896 | |
| | | | | | | | | | |
| |
| | PAYABLE UPON RETURN OF SECURITIES ON LOAN (-1.1%) | | | (818,218 | ) |
| | | | | | | | | | |
| |
| | OTHER ASSETS, LESS LIABILITIES (0.6%) | | | 416,243 | |
| | | | | | | | | | |
| |
| | NET ASSETS (100.0%) | | $ | 74,655,921 | |
| | | | | | | | | | |
| | | | |
| 116 | | CALAMOS OPEN-END FAMILY OF FUNDS SEMIANNUAL REPORT | | See accompanying Notes to Schedule of Investments |
Global Convertible Fund Schedule of Investments April 30, 2016 (Unaudited)
NOTES TO SCHEDULE OF INVESTMENTS
| * | Securities issued and sold pursuant to a Rule 144A transaction are excepted from the registration requirement of the Securities Act of 1933, as amended. These securities may only be sold to qualified institutional buyers (“QIBs”), such as the Fund. Any resale of these securities must generally be effected through a sale that is registered under the Act or otherwise exempted from such registration requirements. |
| ‡ | Variable rate or step bond security. The rate shown is the rate in effect at April 30, 2016. |
| ^ | Security, or portion of security, is on loan. |
| ¤ | The synthetic convertible securities strategy combines separate securities that together possess the economic characteristics similar to a convertible security. |
| # | Non-income producing security. |
FOREIGN CURRENCY ABBREVIATIONS
| | |
| CAD | | Canadian Dollar |
| EUR | | European Monetary Unit |
| GBP | | British Pound Sterling |
| JPY | | Japanese Yen |
| SGD | | Singapore Dollar |
Note: Value for securities denominated in foreign currencies is shown in U.S. dollars. The principal amount for such securities is shown in the respective foreign currency. The date on options represents the expiration date of the option contract. The option contract may be exercised at any date on or before the date shown.
CURRENCY EXPOSURE
APRIL 30, 2016
| | | | | | | | |
| | | VALUE | | | % OF TOTAL
INVESTMENTS | |
| US Dollar | | $ | 53,421,751 | | | | 71.2% | |
| European Monetary Unit | | | 16,754,667 | | | | 22.3% | |
| Japanese Yen | | | 2,759,000 | | | | 3.7% | |
| British Pound Sterling | | | 1,369,950 | | | | 1.8% | |
| Canadian Dollar | | | 392,396 | | | | 0.5% | |
| Singapore Dollar | | | 360,132 | | | | 0.5% | |
| Total Investments | | $ | 75,057,896 | | | | 100.0% | |
Currency exposure may vary over time.
| | | | | | |
| See accompanying Notes to Financial Statements | | www.calamos.com | | | 117 | |
Total Return Bond Fund Schedule of Investments April 30, 2016 (Unaudited)
| | | | | | | | | | |
PRINCIPAL
AMOUNT | | | | | | | VALUE | |
| | CORPORATE BONDS (87.2%) | |
| | | | | | Consumer Discretionary (18.9%) | |
| | 1,000,000 | | | | | BMW US Capital, LLC*
2.000%, 04/11/21 | | $ | 1,005,280 | |
| | 1,000,000 | | | | | Carnival Corp.
3.950%, 10/15/20 | | | 1,066,485 | |
| | 500,000 | | | | | CCO Holdings, LLC / CCO Holdings Capital Corp.
6.625%, 01/31/22 | | | 531,250 | |
| | 500,000 | | | | | CCO Safari II, LLC*
4.464%, 07/23/22 | | | 532,187 | |
| | 1,000,000 | | | | | Comcast Corp.
2.750%, 03/01/23 | | | 1,034,830 | |
| | 500,000 | | | | | Continental Airlines 2012-3 Class C Pass Thru Certificates
6.125%, 04/29/18 | | | 524,922 | |
| | | | | | Dana Holding Corp. | | | | |
| | 250,000 | | | | | 6.750%, 02/15/21 | | | 259,219 | |
| | 250,000 | | | | | 5.375%, 09/15/21 | | | 256,406 | |
| | 500,000 | | | | | DISH DBS Corp.
4.250%, 04/01/18 | | | 510,313 | |
| | 250,000 | | | | | DR Horton, Inc.
4.750%, 02/15/23 | | | 258,281 | |
| | 500,000 | | | | | Expedia, Inc.
5.950%, 08/15/20 | | | 553,145 | |
| | 500,000 | | | | | Ford Motor Credit Company, LLC
5.875%, 08/02/21 | | | 577,167 | |
| | 500,000 | | | | | General Motors Company, Inc.
3.500%, 10/02/18 | | | 516,250 | |
| | 445,000 | | | | | Goodyear Tire & Rubber Company
8.750%, 08/15/20 | | | 527,325 | |
| | 1,000,000 | | | | | Harley-Davidson Financial Services, Inc.*
2.150%, 02/26/20 | | | 1,007,265 | |
| | 1,000,000 | | | | | Home Depot, Inc.
2.625%, 06/01/22 | | | 1,034,760 | |
| | 1,000,000 | | | | | Interpublic Group of Companies, Inc.
2.250%, 11/15/17 | | | 999,505 | |
| | 500,000 | | | | | L Brands, Inc.
5.625%, 02/15/22 | | | 551,250 | |
| | 500,000 | | | | | Lamar Media Corp.*
5.750%, 02/01/26 | | | 530,312 | |
| | 500,000 | | | | | Lennar Corp.
4.500%, 06/15/19 | | | 519,063 | |
| | 500,000 | | | | | Macy’s, Inc.
3.875%, 01/15/22 | | | 511,778 | |
| | 500,000 | | | | | Mattel, Inc.
2.350%, 05/06/19 | | | 507,075 | |
| | 587,000 | | | | | Netflix, Inc.
5.500%, 02/15/22 | | | 615,249 | |
| | 1,000,000 | | | | | Ralph Lauren Corp.
2.125%, 09/26/18 | | | 1,019,525 | |
| | 250,000 | | | | | Royal Caribbean Cruises, Ltd.
5.250%, 11/15/22 | | | 269,219 | |
| | | | | | | | | | |
PRINCIPAL
AMOUNT | | | | | | | VALUE | |
| | 250,000 | | | | | Sirius XM Radio, Inc.*
6.000%, 07/15/24 | | $ | 264,688 | |
| | 1,000,000 | | | | | Time Warner, Inc.
3.600%, 07/15/25 | | | 1,043,615 | |
| | 1,000,000 | | | | | TJX Companies, Inc.
2.750%, 06/15/21 | | | 1,046,600 | |
| | 500,000 | | | | | Toll Brothers Finance Corp.
5.625%, 01/15/24 | | | 525,000 | |
| | 500,000 | | | | | ZF North America Capital, Inc.*
4.500%, 04/29/22 | | | 512,188 | |
| | | | | | | | | | |
| | | | | | | | | 19,110,152 | |
| | | | | | | | | | |
| | | | | | Consumer Staples (5.6%) | |
| | 1,000,000 | | | | | Anheuser-Busch InBev Finance, Inc.
3.650%, 02/01/26 | | | 1,055,375 | |
| | 1,000,000 | | | | | Coca-Cola Company
2.450%, 11/01/20 | | | 1,042,615 | |
| | 1,000,000 | | | | | Diageo, PLC
1.500%, 05/11/17 | | | 1,005,750 | |
| | 1,000,000 | | | | | General Mills, Inc.
2.200%, 10/21/19 | | | 1,022,545 | |
| | 500,000 | | | | | Smithfield Foods, Inc.*
5.250%, 08/01/18 | | | 509,062 | |
| | 1,000,000 | | | | | WM Wrigley Jr. Company*
3.375%, 10/21/20 | | | 1,050,500 | |
| | | | | | | | | | |
| | | | | | | | | 5,685,847 | |
| | | | | | | | | | |
| | | | | | Energy (4.3%) | |
| | 1,000,000 | | | | | Chevron Corp.
1.961%, 03/03/20 | | | 1,012,655 | |
| | 265,000 | | | | | Cimarex Energy Company
5.875%, 05/01/22 | | | 279,530 | |
| | 1,000,000 | | | | | Exxon Mobil Corp.
2.709%, 03/06/25 | | | 1,021,150 | |
| | 500,000 | | | | | Hess Corp.
8.125%, 02/15/19 | | | 562,187 | |
| | 500,000 | | | | | SESI, LLC
7.125%, 12/15/21 | | | 431,875 | |
| | 1,000,000 | | | | | Shell International Finance, BV
3.250%, 05/11/25 | | | 1,033,360 | |
| | | | | | | | | | |
| | | | | | | | | 4,340,757 | |
| | | | | | | | | | |
| | | | | | Financials (22.0%) | |
| | 500,000 | | | | | Ally Financial, Inc.
3.250%, 09/29/17 | | | 501,250 | |
| | 1,000,000 | | | | | American Express Company
2.600%, 09/14/20 | | | 1,023,465 | |
| | 500,000 | | | | | American Tower Corp.
5.900%, 11/01/21 | | | 573,942 | |
| | 1,000,000 | | | | | AON Corp.
5.000%, 09/30/20 | | | 1,108,175 | |
| | 1,500,000 | | | | | Bank of America Corp.
4.125%, 01/22/24 | | | 1,592,152 | |
| | 1,000,000 | | | | | Bank of New York Mellon Corp.
2.800%, 05/04/26 | | | 1,006,520 | |
| | | | |
| 118 | | CALAMOS OPEN-END FAMILY OF FUNDS SEMIANNUAL REPORT | | See accompanying Notes to Schedule of Investments |
Total Return Bond Fund Schedule of Investments April 30, 2016 (Unaudited)
| | | | | | | | | | |
PRINCIPAL
AMOUNT | | | | | | | VALUE | |
| | 1,000,000 | | | | | BB&T Corp.
2.850%, 04/01/21 | | $ | 1,032,380 | |
| | 1,000,000 | | | | | Berkshire Hathaway, Inc.
2.750%, 03/15/23 | | | 1,031,705 | |
| | 500,000 | | | | | Capital One NA/Mclean VA
2.950%, 07/23/21 | | | 507,963 | |
| | 500,000 | | | | | Citigroup, Inc.
2.650%, 10/26/20 | | | 505,438 | |
| | 198,000 | | | | | DuPont Fabros Technology, LP
5.875%, 09/15/21 | | | 208,148 | |
| | 1,000,000 | | | | | Fifth Third Bancorp
2.300%, 03/01/19 | | | 1,019,085 | |
| | 1,000,000 | | | | | Franklin Resources, Inc.
2.850%, 03/30/25 | | | 1,004,910 | |
| | 250,000 | | | | | GLP Capital, LP / GLP Financing II, Inc.
4.375%, 04/15/21 | | | 255,781 | |
| | 1,000,000 | | | | | Goldman Sachs Group, Inc.
4.250%, 10/21/25 | | | 1,022,290 | |
| | | | | | JPMorgan Chase & Company | | | | |
| | 1,500,000 | | | | | 3.875%, 09/10/24 | | | 1,551,517 | |
| | 500,000 | | | | | 3.875%, 02/01/24 | | | 536,263 | |
| | | | | | Morgan Stanley | | | | |
| | 1,000,000 | | | | | 2.500%, 04/21/21 | | | 1,002,450 | |
| | 500,000 | | | | | 3.875%, 01/27/26 | | | 520,145 | |
| | 1,000,000 | | | | | Neuberger Berman Group, LLC*
5.875%, 03/15/22 | | | 1,042,430 | |
| | 500,000 | | | | | Royal Bank Of Canada
2.350%, 10/30/20 | | | 508,223 | |
| | 1,000,000 | | | | | Simon Property Group, LP
3.375%, 10/01/24 | | | 1,063,150 | |
| | 1,000,000 | | | | | Toronto-Dominion Bank
2.125%, 07/02/19 | | | 1,014,200 | |
| | 1,000,000 | | | | | US Bancorp
3.600%, 09/11/24 | | | 1,056,725 | |
| | 1,500,000 | | | | | Wells Fargo & Company
4.125%, 08/15/23 | | | 1,604,437 | |
| | | | | | | | | | |
| | | | | | | | | 22,292,744 | |
| | | | | | | | | | |
| | | | | | Health Care (8.8%) | |
| | 500,000 | | | | | AbbVie, Inc.
1.750%, 11/06/17 | | | 502,828 | |
| | 1,000,000 | | | | | Actavis, PLC
1.875%, 10/01/17 | | | 1,003,245 | |
| | 1,000,000 | | | | | Celgene Corp.
1.900%, 08/15/17 | | | 1,008,160 | |
| | 250,000 | | | | | Community Health Systems, Inc.
5.125%, 08/15/18 | | | 254,531 | |
| | 500,000 | | | | | Edwards Lifesciences Corp.
2.875%, 10/15/18 | | | 512,388 | |
| | 1,000,000 | | | | | Express Scripts Holding Company
2.650%, 02/15/17 | | | 1,011,855 | |
| | 1,000,000 | | | | | Gilead Sciences, Inc.
3.650%, 03/01/26 | | | 1,069,590 | |
| | | | | | | | | | |
PRINCIPAL
AMOUNT | | | | | | | VALUE | |
| | 500,000 | | | | | HCA, Inc.
3.750%, 03/15/19 | | $ | 514,062 | |
| | 1,000,000 | | | | | Johnson & Johnson
2.450%, 03/01/26 | | | 1,008,425 | |
| | 1,000,000 | | | | | Metropolitan Life Global Funding I*
2.300%, 04/10/19 | | | 1,018,705 | |
| | 1,000,000 | | | | | Thermo Fisher Scientific, Inc.
1.850%, 01/15/18 | | | 1,006,770 | |
| | | | | | | | | | |
| | | | | | | | | 8,910,559 | |
| | | | | | | | | | |
| | | | | | Industrials (7.8%) | |
| | | | | | AerCap Ireland Capital, Ltd. / AerCap Global Aviation Trust | | | | |
| | 500,000 | | | | | 5.000%, 10/01/21 | | | 529,062 | |
| | 250,000 | | | | | 4.625%, 10/30/20 | | | 261,094 | |
| | 500,000 | | | | | Air Lease Corp.
5.625%, 04/01/17 | | | 516,563 | |
| | 500,000 | | | | | American Airlines Group, Inc.
6.125%, 06/01/18 | | | 521,562 | |
| | 1,000,000 | | | | | Boeing Company
2.200%, 10/30/22 | | | 1,014,240 | |
| | 1,000,000 | | | | | Eaton Corp.
1.500%, 11/02/17 | | | 1,003,850 | |
| | 447,000 | | | | | Huntington Ingalls Industries, Inc.*
5.000%, 12/15/21 | | | 470,747 | |
| | 500,000 | | | | | PACCAR Financial Corp.
1.600%, 03/15/17 | | | 503,533 | |
| | 1,000,000 | | | | | Parker-Hannifin Corp.
5.500%, 05/15/18 | | | 1,083,700 | |
| | 1,000,000 | | | | | Roper Technologies, Inc.
1.850%, 11/15/17 | | | 1,004,315 | |
| | 500,000 | | | | | Southwest Airlines Company
2.750%, 11/06/19 | | | 514,833 | |
| | 500,000 | | | | | Verisk Analytics, Inc.
4.125%, 09/12/22 | | | 521,582 | |
| | | | | | | | | | |
| | | | | | | | | 7,945,081 | |
| | | | | | | | | | |
| | | | | | Information Technology (11.8%) | |
| | 500,000 | | | | | Activision Blizzard, Inc.*
5.625%, 09/15/21 | | | 526,250 | |
| | 500,000 | | | | | Alibaba Group Holding Company
3.125%, 11/28/21 | | | 508,662 | |
| | 500,000 | | | | | Alliance Data Systems Corp.*
5.375%, 08/01/22 | | | 483,750 | |
| | 500,000 | | | | | Alphabet, Inc.
3.625%, 05/19/21 | | | 550,200 | |
| | 1,000,000 | | | | | Amphenol Corp.
4.000%, 02/01/22 | | | 1,058,735 | |
| | 1,000,000 | | | | | Apple, Inc.
4.375%, 05/13/45 | | | 1,059,085 | |
| | 500,000 | | | | | Cardtronics, Inc. 5.125%, 08/01/22 | | | 502,188 | |
| | 500,000 | | | | | CDW, LLC / CDW Finance Corp.
5.000%, 09/01/23 | | | 512,187 | |
| | | | | | |
| See accompanying Notes to Schedule of Investments | | www.calamos.com | | | 119 | |
Total Return Bond Fund Schedule of Investments April 30, 2016 (Unaudited)
| | | | | | | | | | |
PRINCIPAL
AMOUNT | | | | | | | VALUE | |
| | 1,000,000 | | | | | Electronic Arts, Inc.
4.800%, 03/01/26 | | $ | 1,070,175 | |
| | 500,000 | | | | | Fiserv, Inc.
3.500%, 10/01/22 | | | 524,522 | |
| | 500,000 | | | | | Flextronics International, Ltd.
4.750%, 06/15/25 | | | 499,375 | |
| | 1,000,000 | | | | | Hewlett Packard Enterprise Company*
4.900%, 10/15/25 | | | 1,038,625 | |
| | 1,000,000 | | | | | Microsoft Corp.
3.125%, 11/03/25 | | | 1,054,660 | |
| | 450,000 | | | | | Nuance Communications, Inc.*
5.375%, 08/15/20 | | | 462,938 | |
| | 1,000,000 | | | | | Oracle Corp.
2.250%, 10/08/19 | | | 1,030,555 | |
| | 1,000,000 | | | | | Visa, Inc.
2.200%, 12/14/20 | | | 1,025,630 | |
| | | | | | | | | | |
| | | | | | | | | 11,907,537 | |
| | | | | | | | | | |
| | | | | | Materials (2.0%) | |
| | 500,000 | | | | | Alcoa, Inc.^
5.125%, 10/01/24 | | | 489,063 | |
| | 217,000 | | | | | Barrick Gold Corp.
6.950%, 04/01/19 | | | 241,789 | |
| | 1,000,000 | | | | | Georgia-Pacific, LLC*
3.600%, 03/01/25 | | | 1,043,915 | |
| | 240,000 | | | | | Kaiser Aluminum Corp.*
5.875%, 05/15/24 | | | 246,000 | |
| | | | | | | | | | |
| | | | | | | | | 2,020,767 | |
| | | | | | | | | | |
| | | | | | Telecommunication Services (4.0%) | |
| | 1,000,000 | | | | | AT&T, Inc.
3.000%, 06/30/22 | | | 1,015,070 | |
| | 1,000,000 | | | | | British Telecommunications, PLC
2.350%, 02/14/19 | | | 1,021,445 | |
| | 500,000 | | | | | Frontier Communications Corp.*
10.500%, 09/15/22 | | | 516,250 | |
| | 500,000 | | | | | Sprint Corp.
7.250%, 09/15/21 | | | 402,500 | |
| | 500,000 | | | | | T-Mobile USA, Inc.
6.625%, 11/15/20 | | | 516,563 | |
| | 500,000 | | | | | Verizon Communications, Inc.
5.150%, 09/15/23 | | | 574,872 | |
| | | | | | | | | | |
| | | | | | | | | 4,046,700 | |
| | | | | | | | | | |
| | | | | | Utilities (2.0%) | |
| | 1,000,000 | | | | | NextEra Energy, Inc.
2.700%, 09/15/19 | | | 1,023,460 | |
| | 1,000,000 | | | | | Southern Company
2.150%, 09/01/19 | | | 1,011,335 | |
| | | | | | | | | | |
| | | | | | | | | 2,034,795 | |
| | | | | | | | | | |
| | | | | | TOTAL CORPORATE BONDS
(Cost $85,607,692) | | | 88,294,939 | |
| | | | | | | | | | |
| | | | | | | | | | |
PRINCIPAL
AMOUNT | | | | | | | VALUE | |
| | U.S. GOVERNMENT AND AGENCY SECURITIES (10.1%) | |
| | | | | | Other (10.1%) | |
| | | | | | United States Treasury Note | | | | |
| | 3,000,000 | | | | | 1.625%, 02/15/26 | | $ | 2,946,328 | |
| | 2,000,000 | | | | | 1.750%, 12/31/20 | | | 2,044,141 | |
| | 1,500,000 | | | | | 2.000%, 02/15/25 | | | 1,527,920 | |
| | 1,200,000 | | | | | 2.000%, 08/15/25 | | | 1,220,367 | |
| | 1,000,000 | | | | | 1.750%, 09/30/22 | | | 1,012,402 | |
| | 1,000,000 | | | | | 1.500%, 02/28/23 | | | 993,809 | |
| | 500,000 | | | | | 1.500%, 03/31/23 | | | 496,621 | |
| | | | | | | | | | |
| | | | | | TOTAL U.S. GOVERNMENT AND AGENCY SECURITIES
(Cost $10,127,863) | | | 10,241,588 | |
| | | | | | | | | | |
| | | | | | | | | | |
NUMBER OF
SHARES | | | | | | | VALUE | |
| | SHORT TERM INVESTMENT (3.4%) | |
| | 3,401,972 | | | | | Fidelity Prime Money Market Fund - Institutional Class
(Cost $3,401,972) | | | 3,401,972 | |
| | | | | | | | | | |
NUMBER OF
SHARES/
PRINCIPAL
AMOUNT | | | | | | | VALUE | |
| INVESTMENT OF CASH COLLATERAL FOR SECURITIES
LOANED (0.5%) |
|
| | | | | | Federal Home Loan Bank Discount Notes | |
| | 105,138 | | | | | 0.000%, 06/15/16 | | | 105,138 | |
| | 84,120 | | | | | 0.000%, 05/24/16 | | | 84,120 | |
| | 63,092 | | | | | 0.000%, 05/02/16 | | | 63,092 | |
| | 97,118 | | | | | Fidelity Prime Money Market Fund - Institutional Class | | | 97,118 | |
| | 64,985 | | | | | Goldman Sachs Financial Square Prime Obligations Fund | | | 64,985 | |
| | 75,547 | | | | | Morgan Stanley Institutional Liquidity Fund | | | 75,547 | |
| | | | | | | | | | |
| | | | | | TOTAL INVESTMENT OF CASH COLLATERAL FOR SECURITIES LOANED
(Cost $490,000) | | | 490,000 | |
| | | | | | | | | | |
| TOTAL INVESTMENTS (101.2%)
(Cost $99,627,527) | | | 102,428,499 | |
| | | | | | | | | | |
| |
| | PAYABLE UPON RETURN OF SECURITIES ON LOAN (-0.5%) | | | (490,000 | ) |
| | | | | | | | | | |
| |
| | LIABILITIES, LESS OTHER ASSETS (-0.7%) | | | (682,524 | ) |
| | | | | | | | | | |
| |
| | NET ASSETS (100.0%) | | $ | 101,255,975 | |
| | | | | | | | | | |
| | | | |
| 120 | | CALAMOS OPEN-END FAMILY OF FUNDS SEMIANNUAL REPORT | | See accompanying Notes to Schedule of Investments |
Total Return Bond Fund Schedule of Investments April 30, 2016 (Unaudited)
NOTES TO SCHEDULE OF INVESTMENTS
| * | Securities issued and sold pursuant to a Rule 144A transaction are excepted from the registration requirement of the Securities Act of 1933, as amended. These securities may only be sold to qualified institutional buyers (“QIBs”), such as the Fund. Any resale of these securities must generally be effected through a sale that is registered under the Act or otherwise exempted from such registration requirements. |
| ^ | Security, or portion of security, is on loan. |
| | | | | | |
| See accompanying Notes to Financial Statements | | www.calamos.com | | | 121 | |
High Income Fund Schedule of Investments April 30, 2016 (Unaudited)
| | | | | | | | | | |
PRINCIPAL
AMOUNT | | | | | | | VALUE | |
| | | | | | | | | | |
| | CORPORATE BONDS (95.0%) | |
| | | | | | Consumer Discretionary (26.0%) | |
| | 350,000 | | | | | Altice Luxembourg, SA*
7.750%, 05/15/22 | | $ | 350,437 | |
| | 750,000 | | | | | CalAtlantic Group, Inc.
6.625%, 05/01/20 | | | 831,094 | |
| | 1,015,000 | | | | | CCO Holdings, LLC / CCO
Holdings Capital Corp.
6.625%, 01/31/22 | | | 1,078,437 | |
| | 870,000 | | | | | Cedar Fair, LP
5.375%, 06/01/24 | | | 911,325 | |
| | 469,000 | | | | | Century Communities, Inc.
6.875%, 05/15/22 | | | 457,861 | |
| | 500,000 | | | | | Cooper Tire & Rubber Company
8.000%, 12/15/19 | | | 571,875 | |
| | | | | | Dana Holding Corp. | | | | |
| | 800,000 | | | | | 5.375%, 09/15/21 | | | 820,500 | |
| | 460,000 | | | | | 5.500%, 12/15/24^ | | | 448,500 | |
| | 805,000 | | | | | DISH DBS Corp.
5.125%, 05/01/20 | | | 813,050 | |
| | 750,000 | | | | | DR Horton, Inc.
4.750%, 02/15/23 | | | 774,844 | |
| | 600,000 | | | | �� | GameStop Corp.*^
5.500%, 10/01/19 | | | 585,000 | |
| | 1,250,000 | | | | | General Motors Company, Inc.
3.500%, 10/02/18 | | | 1,290,625 | |
| | 515,000 | | | | | Golden Nugget Escrow, Inc.*
8.500%, 12/01/21 | | | 534,956 | |
| | 510,000 | | | | | Goodyear Tire & Rubber Company
5.125%, 11/15/23 | | | 529,444 | |
| | | | | | L Brands, Inc. | | | | |
| | 850,000 | | | | | 6.875%, 11/01/35 | | | 935,000 | |
| | 500,000 | | | | | 5.625%, 02/15/22 | | | 551,250 | |
| | 750,000 | | | | | Lamar Media Corp.*
5.750%, 02/01/26 | | | 795,469 | |
| | 800,000 | | | | | Lennar Corp.
4.500%, 06/15/19 | | | 830,500 | |
| | 825,000 | | | | | Mediacom Broadband, LLC / Mediacom Broadband Corp.
5.500%, 04/15/21 | | | 819,328 | |
| | 445,000 | | | | | Meritage Homes Corp.
7.000%, 04/01/22 | | | 480,322 | |
| | 720,000 | | | | | NCL Corp., Ltd. - Class C*
4.625%, 11/15/20 | | | 732,150 | |
| | 500,000 | | | | | Neiman Marcus Group Ltd., LLC*^
8.000%, 10/15/21 | | | 435,625 | |
| | 750,000 | | | | | Netflix, Inc.
5.375%, 02/01/21 | | | 795,000 | |
| | | | | | Numericable-SFR, SA* | | | | |
| | 675,000 | | | | | 6.000%, 05/15/22 | | | 680,062 | |
| | 400,000 | | | | | 7.375%, 05/01/26 | | | 407,000 | |
| | 560,000 | | | | | Penske Automotive Group, Inc.
5.375%, 12/01/24 | | | 565,250 | |
| | 515,000 | | | | | Reliance Intermediate Holdings, LP*
6.500%, 04/01/23 | | | 539,141 | |
| | 308,000 | | | | | Sally Holdings, LLC / Sally Capital, Inc.
5.625%, 12/01/25 | | | 330,523 | |
| | | | | | | | | | |
PRINCIPAL
AMOUNT | | | | | | | VALUE | |
| | | | | | | | | | |
| | 615,000 | | | | | Service Corp. International
5.375%, 05/15/24 | | $ | 655,359 | |
| | 865,000 | | | | | Sirius XM Radio, Inc.*
6.000%, 07/15/24 | | | 915,819 | |
| | 875,000 | | | | | Six Flags Entertainment Corp.*
5.250%, 01/15/21 | | | 907,266 | |
| | 575,000 | | | | | Speedway Motorsports, Inc.
5.125%, 02/01/23 | | | 593,328 | |
| | 775,000 | | | | | Time, Inc.*
5.750%, 04/15/22 | | | 745,453 | |
| | 850,000 | | | | | Toll Brothers Finance Corp.
5.625%, 01/15/24 | | | 892,500 | |
| | 1,000,000 | | | | | ZF North America Capital, Inc.*
4.500%, 04/29/22 | | | 1,024,375 | |
| | | | | | | | | | |
| | | | | | | | | 24,628,668 | |
| | | | | | | | | | |
| | | | | | Consumer Staples (4.5%) | |
| | 742,000 | | | | | Alphabet Holding Company, Inc.
7.750%, 11/01/17 | | | 750,878 | |
| | 485,000 | | | | | Fresh Market, Inc.
9.750%, 05/01/23 | | | 478,634 | |
| | 765,000 | | | | | JBS USA, LLC*
7.250%, 06/01/21 | | | 787,472 | |
| | 500,000 | | | | | Land O’Lakes, Inc.*
6.000%, 11/15/22 | | | 532,500 | |
| | 233,000 | | | | | NBTY, Inc.*
7.625%, 05/15/21 | | | 237,078 | |
| | | | | | Post Holdings, Inc. | | | | |
| | 464,000 | | | | | 7.375%, 02/15/22 | | | 489,810 | |
| | 170,000 | | | | | 7.750%, 03/15/24* | | | 185,619 | |
| | 725,000 | | | | | Smithfield Foods, Inc.
6.625%, 08/15/22 | | | 765,328 | |
| | | | | | | | | | |
| | | | | | | | | 4,227,319 | |
| | | | | | | | | | |
| | | | | | Energy (7.6%) | |
| | 370,000 | | | | | Atwood Oceanics, Inc.
6.500%, 02/01/20 | | | 245,356 | |
| | 420,000 | | | | | Bill Barrett Corp.
7.000%, 10/15/22 | | | 308,175 | |
| | 515,000 | | | | | Blue Racer Midstream, LLC / Blue Racer Finance Corp.*
6.125%, 11/15/22 | | | 454,487 | |
| | 530,000 | | | | | Bonanza Creek Energy, Inc.
6.750%, 04/15/21 | | | 208,688 | |
| | 188,000 | | | | | Calumet Specialty Products Partners, LP
6.500%, 04/15/21 | | | 130,425 | |
| | | | | | Carrizo Oil & Gas, Inc. | | | | |
| | 500,000 | | | | | 7.500%, 09/15/20 | | | 506,875 | |
| | 375,000 | | | | | 6.250%, 04/15/23^ | | | 362,813 | |
| | 981,000 | | | | | Drill Rigs Holdings, Inc.*^
6.500%, 10/01/17 | | | 608,220 | |
| | 535,000 | | | | | Energy Transfer Equity, LP
5.500%, 06/01/27 | | | 461,772 | |
| | 807,000 | | | | | Gulfmark Offshore, Inc.
6.375%, 03/15/22 | | | 369,202 | |
| | | | |
| 122 | | CALAMOS OPEN-END FAMILY OF FUNDS SEMIANNUAL REPORT | | See accompanying Notes to Schedule of Investments |
High Income Fund Schedule of Investments April 30, 2016 (Unaudited)
| | | | | | | | | | |
PRINCIPAL
AMOUNT | | | | | | | VALUE | |
| | | | | | | | | | |
| | | | | | Gulfport Energy Corp. | | | | |
| | 535,000 | | | | | 7.750%, 11/01/20 | | $ | 542,691 | |
| | 445,000 | | | | | 6.625%, 05/01/23 | | | 431,372 | |
| | 645,000 | | | | | Laredo Petroleum, Inc.^
6.250%, 03/15/23 | | | 603,075 | |
| | 575,000 | | | | | Oasis Petroleum, Inc.^
6.875%, 01/15/23 | | | 516,781 | |
| | 600,000 | | | | | Pacific Drilling, SA*^
5.375%, 06/01/20 | | | 183,000 | |
| | 500,000 | | | | | Petroleum Geo-Services, ASA*
7.375%, 12/15/18 | | | 377,812 | |
| | 500,000 | | | | | QEP Resources, Inc.
6.875%, 03/01/21 | | | 499,062 | |
| | 219,000 | | | | | Rice Energy, Inc.
7.250%, 05/01/23 | | | 221,601 | |
| | 1,186,000 | | | | | W&T Offshore, Inc.
8.500%, 06/15/19 | | | 194,949 | |
| | | | | | | | | | |
| | | | | | | | | 7,226,356 | |
| | | | | | | | | | |
| | | | | | Financials (7.9%) | |
| | 1,250,000 | | | | | Ally Financial, Inc.
4.750%, 09/10/18 | | | 1,282,812 | |
| | 565,000 | | | | | Brookfield Residential Properties, Inc.*^
6.375%, 05/15/25 | | | 509,206 | |
| | 960,000 | | | | | DuPont Fabros Technology, LP
5.875%, 09/15/21 | | | 1,009,200 | |
| | 900,000 | | | | | Equinix, Inc.
5.375%, 04/01/23 | | | 942,188 | |
| | 925,000 | | | | | ESH Hospitality, Inc.*
5.250%, 05/01/25 | | | 916,328 | |
| | 640,000 | | | | | First Cash Financial Services, Inc.
6.750%, 04/01/21 | | | 631,600 | |
| | 845,000 | | | | | GLP Capital, LP / GLP Financing II, Inc.
5.375%, 04/15/26 | | | 881,969 | |
| | 760,000 | | | | | Iron Mountain, Inc.
6.000%, 08/15/23 | | | 811,775 | |
| | 550,000 | | | | | Quicken Loans, Inc.*
5.750%, 05/01/25 | | | 518,031 | |
| | | | | | | | | | |
| | | | | | | | | 7,503,109 | |
| | | | | | | | | | |
| | | | | | Health Care (10.8%) | |
| | 900,000 | | | | | Acadia Healthcare Company, Inc.
5.625%, 02/15/23 | | | 924,187 | |
| | 850,000 | | | | | Alere, Inc.
6.500%, 06/15/20 | | | 843,625 | |
| | 750,000 | | | | | Community Health Systems, Inc.
5.125%, 08/15/18 | | | 763,594 | |
| | 500,000 | | | | | DaVita HealthCare Partners, Inc.
5.125%, 07/15/24 | | | 510,938 | |
| | 575,000 | | | | | Endo, Ltd.*
6.000%, 07/15/23 | | | 566,734 | |
| | 835,000 | | | | | ExamWorks Group, Inc.
5.625%, 04/15/23 | | | 898,147 | |
| | 975,000 | | | | | HCA Holdings, Inc.
6.250%, 02/15/21 | | | 1,060,922 | |
| | | | | | | | | | |
PRINCIPAL
AMOUNT | | | | | | | VALUE | |
| | | | | | | | | | |
| | 831,000 | | | | | HCA, Inc.
4.750%, 05/01/23 | | $ | 854,372 | |
| | 255,000 | | | | | Hologic, Inc.*
5.250%, 07/15/22 | | | 268,866 | |
| | 400,000 | | | | | Jaguar Holding Company II / Pharmaceutical Product
Development, LLC*
6.375%, 08/01/23 | | | 418,000 | |
| | 575,000 | | | | | Mallinckrodt International Finance,
SA / Mallinckrodt CB, LLC*
5.625%, 10/15/23 | | | 540,500 | |
| | 500,000 | | | | | Surgical Care Affiliates, Inc.*
6.000%, 04/01/23 | | | 512,187 | |
| | 558,000 | | | | | Teleflex, Inc.
5.250%, 06/15/24 | | | 584,156 | |
| | 840,000 | | | | | Tenet Healthcare Corp.
6.750%, 02/01/20 | | | 852,600 | |
| | 500,000 | | | | | Valeant Pharmaceuticals International, Inc.*
7.250%, 07/15/22 | | | 443,125 | |
| | 200,000 | | | | | VPII Escrow Corp.*
6.750%, 08/15/18 | | | 193,750 | |
| | | | | | | | | | |
| | | | | | | | | 10,235,703 | |
| | | | | | | | | | |
| | | | | | Industrials (14.2%) | |
| | 655,000 | | | | | ACCO Brands Corp.^
6.750%, 04/30/20 | | | 695,937 | |
| | | | | | AerCap Ireland Capital, Ltd. / AerCap Global Aviation Trust | | | | |
| | 685,000 | | | | | 4.625%, 10/30/20 | | | 715,397 | |
| | 575,000 | | | | | 5.000%, 10/01/21 | | | 608,422 | |
| | 315,000 | | | | | Air Lease Corp.
3.875%, 04/01/21 | | | 322,377 | |
| | 1,000,000 | | | | | American Airlines Group, Inc.
6.125%, 06/01/18 | | | 1,043,125 | |
| | 557,000 | | | | | Garda World Security Corp.*
7.250%, 11/15/21 | | | 456,044 | |
| | 790,000 | | | | | GrafTech International, Ltd.
6.375%, 11/15/20 | | | 510,538 | |
| | 865,000 | | | | | Huntington Ingalls Industries, Inc.*
5.000%, 11/15/25 | | | 910,953 | |
| | 606,000 | | | | | Icahn Enterprises, LP
5.875%, 02/01/22 | | | 581,381 | |
| | 725,000 | | | | | Meritor, Inc.
6.750%, 06/15/21 | | | 679,234 | |
| | | | | | Michael Baker International, LLC* | | | | |
| | 688,800 | | | | | 8.875%, 04/15/19 | | | 497,658 | |
| | 459,000 | | | | | 8.250%, 10/15/18 | | | 441,214 | |
| | 795,000 | | | | | Multi-Color Corp.*
6.125%, 12/01/22 | | | 810,900 | |
| | 490,000 | | | | | Navistar International Corp.
8.250%, 11/01/21 | | | 355,863 | |
| | 960,000 | | | | | Oshkosh Corp.
5.375%, 03/01/25 | | | 985,800 | |
| | 765,000 | | | | | Spirit AeroSystems Holdings, Inc.
5.250%, 03/15/22 | | | 805,950 | |
| | | | | | |
| See accompanying Notes to Schedule of Investments | | www.calamos.com | | | 123 | |
High Income Fund Schedule of Investments April 30, 2016 (Unaudited)
| | | | | | | | | | |
PRINCIPAL
AMOUNT | | | | | | | VALUE | |
| | | | | | | | | | |
| | 490,000 | | | | | Terex Corp.
6.000%, 05/15/21 | | $ | 487,244 | |
| | 575,000 | | | | | Titan International, Inc.^
6.875%, 10/01/20 | | | 498,813 | |
| | 500,000 | | | | | TransDigm, Inc.
5.500%, 10/15/20 | | | 509,375 | |
| | 700,000 | | | | | United Continental Holdings, Inc.
6.375%, 06/01/18 | | | 738,500 | |
| | 750,000 | | | | | United Rentals North America, Inc.
7.625%, 04/15/22 | | | 802,500 | |
| | | | | | | | | | |
| | | | | | | | | 13,457,225 | |
| | | | | | | | | | |
| | | | | | Information Technology (7.0%) | |
| | 1,185,000 | | | | | Alliance Data Systems Corp.*
5.375%, 08/01/22 | | | 1,146,487 | |
| | 660,000 | | | | | Amkor Technology, Inc.
6.625%, 06/01/21 | | | 643,088 | |
| | 700,000 | | | | | Belden, Inc.*
5.500%, 09/01/22 | | | 713,563 | |
| | 956,000 | | | | | Cardtronics, Inc.
5.125%, 08/01/22 | | | 960,182 | |
| | 825,000 | | | | | CDW, LLC / CDW Finance Corp.
5.000%, 09/01/23 | | | 845,109 | |
| | 780,000 | | | | | CommScope Technologies Finance, LLC*
6.000%, 06/15/25 | | | 802,425 | |
| | 802,000 | | | | | First Data Corp.*
7.000%, 12/01/23 | | | 828,065 | |
| | 640,000 | | | | | Nuance Communications, Inc.*
5.375%, 08/15/20 | | | 658,400 | |
| | | | | | | | | | |
| | | | | | | | | 6,597,319 | |
| | | | | | | | | | |
| | | | | | Materials (9.7%) | |
| | 640,000 | | | | | Alcoa, Inc.^
5.125%, 10/01/24 | | | 626,000 | |
| | 699,000 | | | | | ArcelorMittal^
6.500%, 03/01/21 | | | 717,786 | |
| | 335,000 | | | | | Ball Corp.
5.250%, 07/01/25 | | | 353,425 | |
| | 1,195,000 | | | | | Cascades, Inc.*
5.750%, 07/15/23 | | | 1,142,719 | |
| | 913,000 | | | | | Chemtura Corp.
5.750%, 07/15/21 | | | 914,141 | |
| | 865,000 | | | | | Constellium, NV*
8.000%, 01/15/23 | | | 753,091 | |
| | | | | | First Quantum Minerals, Ltd.* | | | | |
| | 160,000 | | | | | 7.000%, 02/15/21 | | | 129,800 | |
| | 160,000 | | | | | 6.750%, 02/15/20 | | | 133,500 | |
| | 850,000 | | | | | Huntsman International, LLC^
5.125%, 11/15/22 | | | 854,250 | |
| | | | | | INEOS Group Holdings, SA*^ | | | | |
| | 550,000 | | | | | 6.125%, 08/15/18 | | | 560,312 | |
| | 350,000 | | | | | 5.875%, 02/15/19 | | | 356,781 | |
| | 220,000 | | | | | Kaiser Aluminum Corp.
5.875%, 05/15/24 | | | 225,500 | |
| | | | | | | | | | |
PRINCIPAL
AMOUNT | | | | | | | VALUE | |
| | | | | | | | | | |
| | 605,000 | | | | | New Gold, Inc.*
6.250%, 11/15/22 | | $ | 558,113 | |
| | 875,000 | | | | | Trinseo Materials Operating, SCA*
6.750%, 05/01/22 | | | 905,625 | |
| | 855,000 | | | | | Vulcan Materials Company
4.500%, 04/01/25 | | | 914,850 | |
| | | | | | | | | | |
| | | | | | | | | 9,145,893 | |
| | | | | | | | | | |
| | | | | | Telecommunication Services (6.7%) | |
| | 542,000 | | | | | CenturyLink, Inc.
6.750%, 12/01/23 | | | 537,596 | |
| | | | | | Frontier Communications Corp. | | | | |
| | 745,000 | | | | | 7.625%, 04/15/24 | | | 665,378 | |
| | 275,000 | | | | | 10.500%, 09/15/22* | | | 283,938 | |
| | 850,000 | | | | | Inmarsat Finance, PLC*
4.875%, 05/15/22 | | | 804,844 | |
| | 195,000 | | | | | Intelsat Jackson Holdings, SA*
8.000%, 02/15/24 | | | 201,459 | |
| | 950,000 | | | | | SBA Communications Corp.
4.875%, 07/15/22 | | | 958,906 | |
| | 2,145,000 | | | | | Sprint Corp.
7.250%, 09/15/21 | | | 1,726,725 | |
| | 1,070,000 | | | | | T-Mobile USA, Inc.
6.625%, 04/01/23 | | | 1,144,900 | |
| | | | | | | | | | |
| | | | | | | | | 6,323,746 | |
| | | | | | | | | | |
| | | | | | Utilities (0.6%) | |
| | 500,000 | | | | | NRG Energy, Inc.
7.875%, 05/15/21 | | | 520,625 | |
| | | | | | | | | | |
| | | | | | TOTAL CORPORATE BONDS
(Cost $93,679,486) | | | 89,865,963 | |
| | | | | | | | | | |
NUMBER OF
SHARES | | | | | | | VALUE | |
| | CONVERTIBLE PREFERRED STOCKS (1.3%) | |
| | | | | | Financials (0.4%) | |
| | 3,848 | | | | | Crown Castle International Corp.
4.500% | | | 408,716 | |
| | | | | | | | | | |
| | | | | | Health Care (0.4%) | |
| | 500 | | | | | Allergan, PLC 5.500% | | | 405,745 | |
| | | | | | | | | | |
| | | | | | Utilities (0.5%) | |
| | 8,400 | | | | | Dominion Resources, Inc.
6.375% | | | 414,372 | |
| | | | | | | | | | |
| | | | | | TOTAL CONVERTIBLE PREFERRED STOCKS
(Cost $1,353,680) | | | 1,228,833 | |
| | | | | | | | | | |
| | SHORT TERM INVESTMENT (3.0%) | |
| | 2,849,151 | | | | | Fidelity Prime Money Market Fund -
Institutional Class
(Cost $2,849,151) | | | 2,849,151 | |
| | | | | | | | | | |
| | | | |
| 124 | | CALAMOS OPEN-END FAMILY OF FUNDS SEMIANNUAL REPORT | | See accompanying Notes to Schedule of Investments |
High Income Fund Schedule of Investments April 30, 2016 (Unaudited)
| | | | | | | | | | |
NUMBER OF
SHARES/
PRINCIPAL
AMOUNT | | | | | | | VALUE | |
| INVESTMENT OF CASH COLLATERAL FOR SECURITIES
LOANED (7.6%) |
|
| | | | | | Federal Home Loan Bank
Discount Notes | | | | |
| | 1,544,892 | | | | | 0.000 %, 06/15/16 | | $ | 1,544,892 | |
| | 1,236,058 | | | | | 0.000 %, 05/24/16 | | | 1,236,058 | |
| | 927,069 | | | | | 0.000 %, 05/02/16 | | | 927,069 | |
| | 1,427,041 | | | | | Fidelity Prime Money Market Fund -
Institutional Class | | | 1,427,041 | |
| | 954,888 | | | | | Goldman Sachs Financial Square Prime Obligations Fund | | | 954,888 | |
| | 1,110,084 | | | | | Morgan Stanley Institutional
Liquidity Fund | | | 1,110,084 | |
| | | | | | | | | | |
| | | | | | TOTAL INVESTMENT OF
CASH COLLATERAL FOR SECURITIES LOANED
(Cost $7,200,032) | | | 7,200,032 | |
| | | | | | | | | | |
| TOTAL INVESTMENTS (106.9%)
(Cost $105,082,349) | | | 101,143,979 | |
| | | | | | | | | | |
| |
| | PAYABLE UPON RETURN OF SECURITIES ON LOAN (-7.6%) | | | (7,200,032 | ) |
| | | | | | | | | | |
| |
| | OTHER ASSETS, LESS LIABILITIES (0.7%) | | | 642,979 | |
| | | | | | | | | | |
| |
| | NET ASSETS (100.0%) | | $ | 94,586,926 | |
| | | | | | | | | | |
NOTES TO SCHEDULE OF INVESTMENTS
| * | Securities issued and sold pursuant to a Rule 144A transaction are excepted from the registration requirement of the Securities Act of 1933, as amended. These securities may only be sold to qualified institutional buyers (“QIBs”), such as the Fund. Any resale of these securities must generally be effected through a sale that is registered under the Act or otherwise exempted from such registration requirements. |
| ^ | Security, or portion of security, is on loan. |
| | | | | | |
| See accompanying Notes to Financial Statements | | www.calamos.com | | | 125 | |
Market Neutral Income Fund Schedule of Investments April 30, 2016 (Unaudited)
| | | | | | | | | | |
PRINCIPAL
AMOUNT | | | | | | | VALUE | |
| | | | | | | | | | |
| | CONVERTIBLE BONDS (37.7%) | |
| | | | | | Consumer Discretionary (7.1%) | |
| | | | | | CalAtlantic Group, Inc.~ | | | | |
| | 12,000,000 | | | | | 1.625%, 05/15/18 | | $ | 14,392,440 | |
| | 6,500,000 | | | | | 1.250%, 08/01/32 | | | 6,814,145 | |
| | | | | | Ctrip.com International, Ltd.~
| | | | |
| | 26,000,000 | | | | | 1.250%, 10/15/18 | | | 33,170,930 | |
| | 10,000,000 | | | | | 1.990%, 07/01/25* | | | 11,175,300 | |
| | 4,000,000 | | | | | GNC Holdings, Inc.*
1.500%, 08/15/20 | | | 3,142,940 | |
| | | | | | Jarden Corp.~ | | | | |
| | 12,000,000 | | | | | 1.875%, 09/15/18 | | | 23,122,440 | |
| | 5,000,000 | | | | | 1.500%, 06/15/19 | | | 7,870,000 | |
| | 4,310,602 | | | | | Liberty Interactive, LLC~*
1.000%, 09/30/43 | | | 3,744,835 | |
| | 10,000,000 | | | | | Live Nation Entertainment, Inc.~
2.500%, 05/15/19 | | | 9,983,350 | |
| | 4,000,000 | | | | | M/I Homes, Inc.~^
3.000%, 03/01/18 | | | 3,950,660 | |
| | 11,635,000 | | | | | Meritage Homes Corp.~
1.875%, 09/15/32 | | | 11,539,651 | |
| | | | | | Priceline Group, Inc. | | | | |
| | 15,000,000 | | | | | 1.000%, 03/15/18~ | | | 22,162,800 | |
| | 15,000,000 | | | | | 0.900%, 09/15/21^ | | | 15,504,000 | |
| | 10,000,000 | | | | | Restoration Hardware Holdings, Inc.*^
0.000%, 06/15/19 | | | 8,292,150 | |
| | 14,000,000 | | | | | Shutterfly, Inc.
0.250%, 05/15/18 | | | 13,984,180 | |
| | 5,250,000 | | | | | TAL Education Group^
2.500%, 05/15/19 | | | 11,745,484 | |
| | | | | | Tesla Motors, Inc. | | | | |
| | 32,500,000 | | | | | 1.250%, 03/01/21~ | | | 29,890,738 | |
| | 10,000,000 | | | | | 1.500%, 06/01/18 | | | 19,260,150 | |
| | 15,000,000 | | | | | Vipshop Holdings, Ltd.~
1.500%, 03/15/19 | | | 15,429,075 | |
| | | | | | | | | | |
| | | | | | | | | 265,175,268 | |
| | | | | | | | | | |
| | | | | | Energy (1.2%) | |
| | 22,500,000 | | | | | Energy XXI, Ltd.@
3.000%, 12/15/18 | | | 143,438 | |
| | 3,000,000 | | | | | Helix Energy Solutions Group, Inc.^
3.250%, 03/15/32 | | | 2,756,895 | |
| | 11,500,000 | | | | | Petroleum Development Corp.~*
3.250%, 05/15/16 | | | 16,612,900 | |
| | 3,000,000 | | | | | Renewable Energy Group, Inc.
2.750%, 06/15/19 | | | 2,737,500 | |
| | | | | | SEACOR Holdings, Inc. | | | | |
| | 5,000,000 | | | | | 2.500%, 12/15/27~ | | | 4,893,600 | |
| | 4,000,000 | | | | | 3.000%, 11/15/28^ | | | 3,376,480 | |
| | 6,000,000 | | | | | Stone Energy Corp.~^
1.750%, 03/01/17 | | | 2,025,660 | |
| | 15,000,000 | | | | | Whiting Petroleum Corp.~*
1.250%, 04/01/20 | | | 11,358,675 | |
| | | | | | | | | | |
| | | | | | | | | 43,905,148 | |
| | | | | | | | | | |
| | | | | | | | | | |
PRINCIPAL
AMOUNT | | | | | | | VALUE | |
| | | | | | | | | | |
| | | | | | Financials (2.1%) | |
| | 4,000,000 | | | | | American Residential Properties OP, LP~*
3.250%, 11/15/18 | | $ | 4,148,780 | |
| 4,821,000 | | | | | AmTrust Financial Services, Inc.~
2.750%, 12/15/44 | | | 3,644,845 | |
| | 3,000,000 | | | | | 2.750%, 12/15/44* | | | 2,471,910 | |
| | | | | | Colony Starwood Homes | | | | |
| | 6,000,000 | | | | | 3.000%, 07/01/19 | | | 5,997,690 | |
| | 5,000,000 | | | | | 4.500%, 10/15/17 | | | 5,143,900 | |
| | 3,500,000 | | | | | Cowen Group, Inc.~
3.000%, 03/15/19 | | | 3,177,667 | |
| | 8,200,000 | | | | | Extra Space Storage, LP*^
3.125%, 10/01/35 | | | 9,070,799 | |
| | 6,000,000 | | | | | Forestar Group, Inc.
3.750%, 03/01/20 | | | 5,254,200 | |
| | 1,000,000 | | | | | FXCM, Inc.
2.250%, 06/15/18 | | | 623,935 | |
| | 10,000,000 | | | | | NorthStar Realty Europe Corp.*
4.625%, 12/15/16 | | | 10,025,000 | |
| | 15,000,000 | | | | | SL Green Operating Partnership, LP*
3.000%, 10/15/17 | | | 20,273,400 | |
| | 5,000,000 | | | | | Starwood Property Trust, Inc.
3.750%, 10/15/17 | | | 4,983,400 | |
| | 8,000,000 | | | | | Walter Investment Management Corp.
4.500%, 11/01/19 | | | 4,846,240 | |
| | | | | | | | | | |
| | | | | | | | | 79,661,766 | |
| | | | | | | | | | |
| | | | | | Health Care (6.0%) | |
| | 7,500,000 | | | | | Aceto Corp.~*
2.000%, 11/01/20 | | | 7,047,863 | |
| | 8,391,000 | | | | | Acorda Therapeutics, Inc.~
1.750%, 06/15/21 | | | 7,586,555 | |
| | 7,500,000 | | | | | Alere, Inc.~
3.000%, 05/15/16 | | | 7,538,325 | |
| | 5,000,000 | | | | | Allscripts Healthcare Solutions, Inc.~
1.250%, 07/01/20 | | | 5,159,700 | |
| | 10,000,000 | | | | | AMAG Pharmaceuticals, Inc.~
2.500%, 02/15/19 | | | 11,936,900 | |
| | 5,200,000 | | | | | Anacor Pharmaceuticals, Inc.*
2.000%, 04/15/23 | | | 5,971,992 | |
| | 15,000,000 | | | | | BioMarin Pharmaceutical, Inc.~
0.750%, 10/15/18 | | | 17,667,075 | |
| | 9,500,000 | | | | | Brookdale Senior Living, Inc.~
2.750%, 06/15/18 | | | 9,472,592 | |
| | 7,500,000 | | | | | Depomed, Inc.~
2.500%, 09/01/21 | | | 8,328,225 | |
| | 3,500,000 | | | | | Emergent Biosolutions, Inc.~
2.875%, 01/15/21 | | | 4,780,370 | |
| | 12,500,000 | | | | | Horizon Pharma Investment, Ltd.^
2.500%, 03/15/22 | | | 10,953,625 | |
| | 3,804,000 | | | | | Insulet Corp.~^
2.000%, 06/15/19 | | | 3,745,647 | |
| | 17,500,000 | | | | | Integra LifeSciences Holdings Corp.~
1.625%, 12/15/16 | | | 23,775,587 | |
| | | | |
| 126 | | CALAMOS OPEN-END FAMILY OF FUNDS SEMIANNUAL REPORT | | See accompanying Notes to Schedule of Investments |
Market Neutral Income Fund Schedule of Investments April 30, 2016 (Unaudited)
| | | | | | | | | | |
PRINCIPAL
AMOUNT | | | | | | | VALUE | |
| | | | | | | | | | |
| | 8,000,000 | | | | | Ironwood Pharmaceuticals, Inc.*
2.250%, 06/15/22 | | $ | 7,257,800 | |
| | 7,000,000 | | | | | Ligand Pharmaceuticals, Inc.~
0.750%, 08/15/19 | | | 11,827,830 | |
| | | | | | Medicines Company~ | | | | |
| | 12,500,000 | | | | | 1.375%, 06/01/17 | | | 17,185,250 | |
| | 7,500,000 | | | | | 2.500%, 01/15/22 | | | 9,243,188 | |
| | | | | | Molina Healthcare, Inc.~ | | | | |
| | 10,500,000 | | | | | 1.625%, 08/15/44 | | | 11,765,932 | |
| | 5,000,000 | | | | | 1.125%, 01/15/20 | | | 6,942,325 | |
| | 12,500,000 | | | | | NuVasive, Inc.*
2.250%, 03/15/21 | | | 14,096,000 | |
| | 5,000,000 | | | | | Quidel Corp.~
3.250%, 12/15/20 | | | 4,616,725 | |
| | 8,000,000 | | | | | Spectranetics Corp.
2.625%, 06/01/34 | | | 6,762,720 | |
| | 4,000,000 | | | | | Teligent, Inc.
3.750%, 12/15/19 | | | 3,301,320 | |
| | 10,000,000 | | | | | Wright Medical Group, Inc.
2.000%, 02/15/20 | | | 9,520,100 | |
| | | | | | | | | | |
| | | | | | | | | 226,483,646 | |
| | | | | | | | | | |
| | | | | | Industrials (0.9%) | |
| | 4,000,000 | | | | | Greenbrier Companies, Inc.^
3.500%, 04/01/18 | | | 4,386,340 | |
| | | | | | Navistar International Corp. | | | | |
| | 10,000,000 | | | | | 4.750%, 04/15/19 | | | 6,719,200 | |
| | 10,000,000 | | | | | 4.500%, 10/15/18~ | | | 7,051,250 | |
| | 5,000,000 | | | | | SolarCity Corp.
1.625%, 11/01/19 | | | 3,305,375 | |
| | 10,000,000 | | | | | Trinity Industries, Inc.~
3.875%, 06/01/36 | | | 10,955,100 | |
| | | | | | | | | | |
| | | | | | | | | 32,417,265 | |
| | | | | | | | | | |
| | | | | | Information Technology (19.4%) | |
| | 7,750,000 | | | | | Bottomline Technologies (de), Inc.~
1.500%, 12/01/17 | | | 8,051,862 | |
| | 2,500,000 | | | | | Brocade Communications Systems, Inc.~
1.375%, 01/01/20 | | | 2,431,488 | |
| | 2,500,000 | | | | | CalAmp Corp.~*
1.625%, 05/15/20 | | | 2,278,125 | |
| | 7,000,000 | | | | | Canadian Solar, Inc.~
4.250%, 02/15/19 | | | 6,013,350 | |
| | 8,800,000 | | | | | Cardtronics, Inc.~^
1.000%, 12/01/20 | | | 8,817,292 | |
| | 15,900,000 | | | | | Ciena Corp.~*
3.750%, 10/15/18 | | | 17,895,291 | |
| | 10,000,000 | | | | | Citrix Systems, Inc.~
0.500%, 04/15/19 | | | 11,272,650 | |
| | 12,000,000 | | | | | Cornerstone OnDemand, Inc.~
1.500%, 07/01/18 | | | 12,067,380 | |
| | 11,000,000 | | | | | CSG Systems International, Inc.~*
4.250%, 03/15/36 | | | 11,877,965 | |
| | | | | | | | | | |
PRINCIPAL
AMOUNT | | | | | | | VALUE | |
| | | | | | | | | | |
| | 20,000,000 | | | | | Electronic Arts, Inc.~
0.750%, 07/15/16 | | $ | 38,820,000 | |
| | 10,500,000 | | | | | Electronics For Imaging, Inc.~
0.750%, 09/01/19 | | | 10,799,985 | |
| | 5,000,000 | | | | | Envestnet, Inc.
1.750%, 12/15/19 | | | 4,519,075 | |
| | 5,000,000 | | | | | Euronet Worldwide, Inc.
1.500%, 10/01/44 | | | 6,126,825 | |
| | 12,752,000 | | | | | Finisar Corp.
0.500%, 12/15/33 | | | 12,240,836 | |
| | | | | | FireEye, Inc.* | | | | |
| | 5,000,000 | | | | | 1.625%, 06/01/35 | | | 4,130,675 | |
| | 5,000,000 | | | | | 1.000%, 06/01/35 | | | 4,338,000 | |
| | 9,500,000 | | | | | Infinera Corp.~
1.750%, 06/01/18 | | | 11,225,295 | |
| | 5,000,000 | | | | | Inphi Corp.~*
1.125%, 12/01/20 | | | 5,245,975 | |
| | 10,000,000 | | | | | Integrated Device Technology, Inc.~*
0.875%, 11/15/22 | | | 9,324,450 | |
| | 7,500,000 | | | | | Lam Research Corp.~
0.500%, 05/15/16 | | | 9,582,487 | |
| | 25,000,000 | | | | | LinkedIn Corp.~
0.500%, 11/01/19 | | | 23,358,125 | |
| | 10,000,000 | | | | | Mentor Graphics Corp.~
4.000%, 04/01/31 | | | 10,457,350 | |
| | 10,000,000 | | | | | MercadoLibre, Inc.~
2.250%, 07/01/19 | | | 11,730,750 | |
| | 10,000,000 | | | | | Microchip Technology, Inc.~
1.625%, 02/15/25 | | | 10,409,750 | |
| | 20,000,000 | | | | | Micron Technology, Inc.~
1.625%, 02/15/33 | | | 23,883,000 | |
| | 2,500,000 | | | | | NetSuite, Inc.~
0.250%, 06/01/18 | | | 2,490,625 | |
| | 15,000,000 | | | | | Nuance Communications, Inc.*
1.000%, 12/15/35 | | | 13,599,675 | |
| | 35,000,000 | | | | | NVIDIA Corp.~
1.000%, 12/01/18 | | | 62,390,825 | |
| | 15,000,000 | | | | | NXP Semiconductors, NV~
1.000%, 12/01/19 | | | 17,019,375 | |
| | 25,000,000 | | | | | ON Semiconductor Corp.~
2.625%, 12/15/26 | | | 26,650,500 | |
| | 10,600,000 | | | | | Palo Alto Networks, Inc.~
0.000%, 07/01/19 | | | 15,575,534 | |
| | 7,500,000 | | | | | Pandora Media, Inc.*
1.750%, 12/01/20 | | | 6,837,075 | |
| | 7,500,000 | | | | | Proofpoint, Inc.^
1.250%, 12/15/18 | | | 11,737,912 | |
| | 19,985,000 | | | | | Qihoo 360 Technology Company, Ltd.~^
1.750%, 08/15/21 | | | 19,763,566 | |
| | 10,000,000 | | | | | Rambus, Inc.~
1.125%, 08/15/18 | | | 11,525,000 | |
| | 10,000,000 | | | EUR | | Rocket Internet, SE
3.000%, 07/22/22 | | | 9,417,036 | |
| | | | | | |
| See accompanying Notes to Schedule of Investments | | www.calamos.com | | | 127 | |
Market Neutral Income Fund Schedule of Investments April 30, 2016 (Unaudited)
| | | | | | | | | | |
PRINCIPAL
AMOUNT | | | | | | | VALUE | |
| | | | | | | | | | |
| | 7,500,000 | | | | | Rovi Corp.
0.500%, 03/01/20 | | $ | 7,142,363 | |
| | 18,500,000 | | | | | Salesforce.com, Inc.~
0.250%, 04/01/18 | | | 23,331,090 | |
| | 30,000,000 | | | | | SanDisk Corp.~
1.500%, 08/15/17 | | | 46,914,750 | |
| | 4,500,000 | | | | | ServiceNow, Inc.
0.000%, 11/01/18 | | | 5,208,233 | |
| | 5,000,000 | | | | | SINA Corp.
1.000%, 12/01/18 | | | 4,917,750 | |
| | | | | | SunEdison, Inc.@ | | | | |
| | 14,500,000 | | | | | 2.375%, 04/15/22^ | | | 523,015 | |
| | 6,250,000 | | | | | 2.000%, 10/01/18 | | | 246,250 | |
| | 10,000,000 | | | | | SunPower Corp.*
4.000%, 01/15/23 | | | 9,649,100 | |
| | 4,651,000 | | | | | Synchronoss Technologies, Inc.
0.750%, 08/15/19 | | | 4,520,470 | |
| | | | | | Take-Two Interactive Software, Inc.~ | | | | |
| | 10,000,000 | | | | | 1.000%, 07/01/18 | | | 16,394,850 | |
| | 9,000,000 | | | | | 1.750%, 12/01/16 | | �� | 16,142,040 | |
| | 5,000,000 | | | | | TTM Technologies, Inc.
1.750%, 12/15/20 | | | 4,468,675 | |
| | | | | | Twitter, Inc. | | | | |
| | 15,000,000 | | | | | 1.000%, 09/15/21 | | | 12,574,650 | |
| | 15,000,000 | | | | | 0.250%, 09/15/19 | | | 13,103,025 | |
| | 15,000,000 | | | | | Viavi Solutions, Inc.~
0.625%, 08/15/33 | | | 14,511,225 | |
| | 10,000,000 | | | | | WebMD Health Corp.
2.500%, 01/31/18 | | | 11,473,150 | |
| | 14,500,000 | | | | | Workday, Inc.~
0.750%, 07/15/18 | | | 16,275,815 | |
| | 20,000,000 | | | | | Xilinx, Inc.~
2.625%, 06/15/17 | | | 29,991,500 | |
| | 5,000,000 | | | | | Yahoo!, Inc.~
0.000%, 12/01/18 | | | 5,026,375 | |
| | 12,501,000 | | | | | Yandex, NV
1.125%, 12/15/18 | | | 11,299,904 | |
| | | | | | | | | | |
| | | | | | | | | 727,619,334 | |
| | | | | | | | | | |
| | | | | | Materials (0.8%) | |
| | 4,000,000 | | | | | B2Gold Corp.~
3.250%, 10/01/18 | | | 3,760,500 | |
| | 15,000,000 | | | | | Cemex, SAB de CV~
3.750%, 03/15/18 | | | 16,429,575 | |
| | 10,000,000 | | | | | RTI International Metals, Inc.
1.625%, 10/15/19 | | | 11,471,450 | |
| | | | | | | | | | |
| | | | | | | | | 31,661,525 | |
| | | | | | | | | | |
| | | | | | Telecommunication Services (0.2%) | |
| | 5,000,000 | | | EUR | | America Movil, SAB de CV
0.000%, 05/28/20 | | | 5,727,540 | |
| | | | | | | | | | |
| | | | | | TOTAL CONVERTIBLE BONDS
(Cost $1,470,732,325) | | | 1,412,651,492 | |
| | | | | | | | | | |
| | | | | | | | | | |
PRINCIPAL
AMOUNT | | | | | | | VALUE | |
| | | | | | | | | | |
| | SYNTHETIC CONVERTIBLE SECURITIES (8.1%) ¤ | |
| | Corporate Bonds (7.7%) | |
| | | | | | Consumer Discretionary (2.2%) | |
| | 500,000 | | | | | American Honda Finance Corp.~
1.125%, 10/07/16 | | $ | 501,072 | |
| | 3,000,000 | | | | | CCO Holdings, LLC / CCO Holdings Capital Corp.~
7.000%, 01/15/19 | | | 3,054,240 | |
| | 4,575,000 | | | | | Continental Airlines 2012-3
Class C Pass Thru Certificates~
6.125%, 04/29/18 | | | 4,803,041 | |
| | 6,820,000 | | | | | D.R. Horton, Inc.~
3.750%, 03/01/19 | | | 6,990,500 | |
| | 10,000,000 | | | | | DISH DBS Corp.~
4.250%, 04/01/18 | | | 10,206,250 | |
| | | | | | Ford Motor Credit Company, LLC | | | | |
| | 2,000,000 | | | | | 1.500%, 01/17/17~ | | | 2,003,860 | |
| | 1,000,000 | | | | | 2.943%, 01/08/19 | | | 1,025,095 | |
| | | | | | General Motors Company, Inc. | | | | |
| | 3,000,000 | | | | | 3.250%, 05/15/18~ | | | 3,075,000 | |
| | 2,500,000 | | | | | 3.500%, 10/02/18 | | | 2,581,250 | |
| | 500,000 | | | | | 2.625%, 07/10/17~ | | | 505,000 | |
| | | | | | Lennar Corp.~
| | | | |
| | 8,760,000 | | | | | 4.500%, 06/15/19 | | | 9,093,975 | |
| | 7,000,000 | | | | | 4.125%, 12/01/18 | | | 7,192,500 | |
| | 5,745,000 | | | | | Meritage Homes Corp.~
4.500%, 03/01/18 | | | 5,881,444 | |
| | 4,170,000 | | | | | NCL Corp., Ltd. - Class C~*
4.625%, 11/15/20 | | | 4,240,369 | |
| | 2,000,000 | | | | | Nissan Motor Acceptance Corp.~*‡
1.182%, 03/03/17 | | | 2,002,080 | |
| | 2,000,000 | | | | | Numericable-SFR SA*
4.875%, 05/15/19 | | | 2,074,890 | |
| | 2,000,000 | | | | | Thomson Reuters Corp.~
0.875%, 05/23/16 | | | 1,999,380 | |
| | 13,760,000 | | | | | Toll Brothers Finance Corp.
4.000%, 12/31/18 | | | 14,284,600 | |
| | | | | | | | | | |
| | | | | | | | | 81,514,546 | |
| | | | | | | | | | |
| | | | | | Consumer Staples (0.3%) | |
| | | | | | Constellation Brands, Inc.~ | | | | |
| | 6,000,000 | | | | | 7.250%, 05/15/17 | | | 6,348,750 | |
| | 4,000,000 | | | | | 7.250%, 09/01/16 | | | 4,077,500 | |
| | 1,000,000 | | | | | WM Wrigley Jr. Company~*
1.400%, 10/21/16 | | | 1,002,480 | |
| | | | | | | | | | |
| | | | | | | | | 11,428,730 | |
| | | | | | | | | | |
| | | | | | Energy (0.7%) | | | | |
| | 8,000,000 | | | | | Chesapeake Energy Corp.~*^
8.000%, 12/15/22 | | | 5,500,000 | |
| | | | | | CNOOC, Ltd.~ | | | | |
| | 1,000,000 | | | | | 1.625%, 04/30/17 | | | 1,000,235 | |
| | 500,000 | | | | | 1.125%, 05/09/16 | | | 500,000 | |
| | 3,000,000 | | | | | Enbridge, Inc.~‡
1.275%, 10/01/16 | | | 2,978,460 | |
| | | | |
| 128 | | CALAMOS OPEN-END FAMILY OF FUNDS SEMIANNUAL REPORT | | See accompanying Notes to Schedule of Investments |
Market Neutral Income Fund Schedule of Investments April 30, 2016 (Unaudited)
| | | | | | | | | | |
PRINCIPAL
AMOUNT | | | | | | | VALUE | |
| | | | | | | | | | |
| | 500,000 | | | | | Exxon Mobil Corp.
1.708%, 03/01/19 | | $ | 506,648 | |
| | 1,500,000 | | | | | Nabors Industries, Inc.~
2.350%, 09/15/16 | | | 1,500,000 | |
| | 3,197,000 | | | | | Oasis Petroleum, Inc.^
7.250%, 02/01/19 | | | 3,051,137 | |
| | 10,000,000 | | | | | SESI, LLC~
6.375%, 05/01/19 | | | 9,368,750 | |
| | 1,250,000 | | | | | Whiting Petroleum Corp.^
6.500%, 10/01/18 | | | 1,088,281 | |
| | | | | | | | | | |
| | | | | | | | | 25,493,511 | |
| | | | | | | | | | |
| | | | | | Financials (1.1%) | |
| | | | | | Ally Financial, Inc.~ | | | | |
| | 6,000,000 | | | | | 3.250%, 09/29/17 | | | 6,015,000 | |
| | 2,500,000 | | | | | 3.250%, 11/05/18 | | | 2,498,437 | |
| | 1,000,000 | | | | | ANZ New Zealand (Int’l), Ltd.~*
1.400%, 04/27/17 | | | 1,001,325 | |
| | 5,000,000 | | | | | Aviation Capital Group Corp.~*
3.875%, 09/27/16 | | | 5,037,050 | |
| | 7,750,000 | | | | | BB&T Corp.~
1.000%, 04/03/17 | | | 7,753,449 | |
| | | | | | Berkshire Hathaway Finance Corp.~ | | | | |
| | 1,000,000 | | | | | 1.700%, 03/15/19 | | | 1,014,025 | |
| | 1,000,000 | | | | | 0.950%, 08/15/16 | | | 1,001,075 | |
| | 1,850,000 | | | | | Deutsche Bank, AG~
1.400%, 02/13/17 | | | 1,849,667 | |
| | 1,500,000 | | | | | Goldman Sachs Group, Inc.
2.000%, 04/25/19 | | | 1,506,007 | |
| | 1,000,000 | | | | | Hyundai Capital America*
2.500%, 03/18/19 | | | 1,010,745 | |
| | | | | | iStar, Inc.~ | | | | |
| | 6,000,000 | | | | | 4.875%, 07/01/18 | | | 5,887,500 | |
| | 2,000,000 | | | | | 4.000%, 11/01/17 | | | 1,972,500 | |
| | 2,983,000 | | | | | Neuberger Berman Group, LLC*
5.875%, 03/15/22 | | | 3,109,569 | |
| | | | | | PNC Bank NA | | | | |
| | 1,000,000 | | | | | 1.950%, 03/04/19 | | | 1,010,460 | |
| | 1,000,000 | | | | | 1.800%, 11/05/18~ | | | 1,008,550 | |
| | | | | | | | | | |
| | | | | | | | | 41,675,359 | |
| | | | | | | | | | |
| | | | | | Health Care (0.5%) | |
| | 1,000,000 | | | | | Actavis Funding SCS~
1.300%, 06/15/17 | | | 997,400 | |
| | 5,000,000 | | | | | Amgen, Inc.~
2.500%, 11/15/16 | | | 5,041,900 | |
| | 6,000,000 | | | | | Community Health Systems, Inc.~
5.125%, 08/15/18 | | | 6,108,750 | |
| | 2,703,000 | | | | | HCA, Inc.~
3.750%, 03/15/19 | | | 2,779,022 | |
| | | | | | Mylan, Inc.~ | | | | |
| | 1,000,000 | | | | | 1.800%, 06/24/16 | | | 1,000,750 | |
| | 500,000 | | | | | 1.350%, 11/29/16 | | | 499,147 | |
| | 2,500,000 | | | | | UnitedHealth Group, Inc.
1.700%, 02/15/19 | | | 2,528,850 | |
| | | | | | | | | | |
| | | | | | | | | 18,955,819 | |
| | | | | | | | | | |
| | | | | | | | | | |
PRINCIPAL
AMOUNT | | | | | | | VALUE | |
| | | | | | | | | | |
| | | | | | Industrials (1.3%) | |
| | 12,000,000 | | | | | AerCap Ireland Capital, Ltd. / AerCap Global Aviation Trust~
2.750%, 05/15/17 | | $ | 12,022,500 | |
| | 10,000,000 | | | | | Air Lease Corp.~
5.625%, 04/01/17 | | | 10,331,250 | |
| | 5,000,000 | | | | | American Airlines Group, Inc.
6.125%, 06/01/18 | | | 5,215,625 | |
| | 4,800,000 | | | | | CNH Industrial Capital, LLC~
3.250%, 02/01/17 | | | 4,812,000 | |
| | 5,000,000 | | | | | Deluxe Corp.~
6.000%, 11/15/20 | | | 5,221,875 | |
| | 1,000,000 | | | | | GATX Corp.~
1.250%, 03/04/17 | | | 995,520 | |
| | 9,175,000 | | | | | Icahn Enterprises, LP~
3.500%, 03/15/17 | | | 9,180,734 | |
| | 500,000 | | | | | John Deere Capital Corp.~
1.050%, 10/11/16 | | | 500,863 | |
| | 1,000,000 | | | | | Rockwell Collins, Inc.~‡
0.984%, 12/15/16 | | | 1,000,655 | |
| | | | | | | | | | |
| | | | | | | | | 49,281,022 | |
| | | | | | | | | | |
| | | | | | Information Technology (1.3%) | |
| | 14,700,000 | | | | | Alliance Data Systems Corp.~*
5.250%, 12/01/17 | | | 14,966,437 | |
| | 2,000,000 | | | | | eBay, Inc.~
2.500%, 03/09/18 | | | 2,036,070 | |
| | 10,000,000 | | | | | Hewlett Packard Enterprise Company*
2.850%, 10/05/18 | | | 10,203,650 | |
| | 5,000,000 | | | | | Jabil Circuit, Inc.~
7.750%, 07/15/16 | | | 5,059,375 | |
| | 1,000,000 | | | | | Juniper Networks, Inc.~
3.125%, 02/26/19 | | | 1,017,705 | |
| | 2,725,000 | | | | | NXP Semiconductors, NV~*
3.750%, 06/01/18 | | | 2,793,125 | |
| | 7,000,000 | | | | | Sanmina Corp.*
4.375%, 06/01/19 | | | 7,210,000 | |
| | 5,000,000 | | | | | Seagate Technology, PLC~
3.750%, 11/15/18 | | | 4,956,650 | |
| | | | | | | | | | |
| | | | | | | | | 48,243,012 | |
| | | | | | | | | | |
| | | | | | Materials (0.0%) | |
| | 1,000,000 | | | | | BHP Billiton Finance USA, Ltd.~‡
0.879%, 09/30/16 | | | 998,415 | |
| | | | | | | | | | |
| | | | | | Telecommunication Services (0.3%) | |
| | 5,000,000 | | | | | AT&T, Inc.~
2.400%, 03/15/17 | | | 5,052,500 | |
| | 6,000,000 | | | | | British Telecommunications, PLC~
1.250%, 02/14/17 | | | 6,001,350 | |
| | 500,000 | | | | | Verizon Communications, Inc.~‡
2.164%, 09/15/16 | | | 502,378 | |
| | | | | | | | | | |
| | | | | | | | | 11,556,228 | |
| | | | | | | | | | |
| | | | | | TOTAL CORPORATE BONDS | | | 289,146,642 | |
| | | | | | | | | | |
| | | | | | |
| See accompanying Notes to Schedule of Investments | | www.calamos.com | | | 129 | |
Market Neutral Income Fund Schedule of Investments April 30, 2016 (Unaudited)
| | | | | | | | | | |
NUMBER OF
CONTRACTS | | | | | | | VALUE | |
| | | | | | | | | | |
| | Purchased Options (0.4%) # | |
| | | | | | Energy (0.0%) | |
| | 1,000 | | | | | Southwestern Energy Company
Call, 01/20/17, Strike $8.00 | | $ | 605,000 | |
| | | | | | | | | | |
| | | | | | | | | | |
| | | | | | Other (0.4%) | |
| | | | | | S&P 500 Index | | | | |
| | 1,500 | | | | | Call, 05/06/16, Strike $2,120.00 | | | 60,000 | |
| | 1,000 | | | | | Call, 12/30/16, Strike $2,000.00 | | | 14,045,000 | |
| | | | | | | | | | |
| | | | | | | | | 14,105,000 | |
| | | | | | | | | | |
| | | | | | TOTAL PURCHASED OPTIONS | | | 14,710,000 | |
| | | | | | | | | | |
| | | | | | TOTAL SYNTHETIC
CONVERTIBLE SECURITIES
(Cost $298,462,977) | | | 303,856,642 | |
| | | | | | | | | | |
NUMBER OF
SHARES | | | | | | | VALUE | |
| | CONVERTIBLE PREFERRED STOCKS (4.1%) | |
| | | | | | Consumer Staples (0.1%) | |
| | 40,000 | | | | | Post Holdings, Inc.
5.250% | | | 5,236,600 | |
| | | | | | | | | | |
| | | | | | Energy (1.7%) | |
| | 325,000 | | | | | Hess Corp.^
8.000% | | | 24,706,500 | |
| | 800,000 | | | | | Southwestern Energy Company
6.250% | | | 25,352,000 | |
| | 250,000 | | | | | WPX Energy, Inc.
6.250% | | | 11,817,500 | |
| | | | | | | | | | |
| | | | | | | | | 61,876,000 | |
| | | | | | | | | | |
| | | | | | Financials (0.4%) | |
| | 150,000 | | | | | American Tower Corp.
5.500% | | | 15,552,000 | |
| | | | | | | | | | |
| | | | | | Health Care (1.1%) | |
| | 25,000 | | | | | Allergan, PLC~
5.500% | | | 20,287,250 | |
| | 25,000 | | | | | Teva Pharmaceutical Industries, Ltd.~
7.000% | | | 22,525,000 | |
| | | | | | | | | | |
| | | | | | | | | 42,812,250 | |
| | | | | | | | | | |
| | | | | | Industrials (0.3%) | |
| | 150,000 | | | | | Stericycle, Inc.
5.250% | | | 11,649,000 | |
| | | | | | | | | | |
| | | | | | Telecommunication Services (0.3%) | |
| | 113,200 | | | | | Frontier Communications Corp.
11.125% | | | 11,806,760 | |
| | | | | | | | | | |
| | | | | | Utilities (0.2%) | |
| | 100,000 | | | | | NextEra Energy, Inc.
6.371% | | | 5,980,000 | |
| | | | | | | | | | |
| | | | | | TOTAL CONVERTIBLE
PREFERRED STOCKS
(Cost $160,261,479) | | | 154,912,610 | |
| | | | | | | | | | |
| | | | | | | | | | |
NUMBER OF
SHARES | | | | | | | VALUE | |
| | | | | | | | | | |
| | COMMON STOCKS (49.5%) | |
| | | | | | Consumer Discretionary (6.1%) | |
| | 40,632 | | | | | Amazon.com, Inc.~# | | $ | 26,800,461 | |
| | 3,023 | | | | | AutoZone, Inc.~# | | | 2,313,290 | |
| | 25,185 | | | | | CarMax, Inc.~# | | | 1,333,546 | |
| | 60,443 | | | | | Carnival Corp. | | | 2,964,729 | |
| | 4,562 | | | | | Chipotle Mexican Grill, Inc.# | | | 1,920,465 | |
| | 57,925 | | | | | Coach, Inc.~ | | | 2,332,640 | |
| | 303,989 | | | | | Comcast Corp. - Class A~ | | | 18,470,372 | |
| | 35,259 | | | | | D.R. Horton, Inc.~ | | | 1,059,886 | |
| | 20,147 | | | | | Darden Restaurants, Inc.~ | | | 1,254,151 | |
| | 72,948 | | | | | Delphi Automotive, PLC | | | 5,371,161 | |
| | 25,186 | | | | | Discovery Communications, Inc. -
Class A~# | | | 687,830 | |
| | 25,186 | | | | | Discovery Communications, Inc. -
Class C~# | | | 674,481 | |
| | 26,194 | | | | | Dollar General Corp.~ | | | 2,145,551 | |
| | 406,990 | | | | | Ford Motor Company~ | | | 5,518,784 | |
| | 31,230 | | | | | Gap, Inc.~ | | | 723,911 | |
| | 108,497 | | | | | General Motors Company, Inc. | | | 3,450,205 | |
| | 234,118 | | | | | Home Depot, Inc.~ | | | 31,346,059 | |
| | 35,258 | | | | | Interpublic Group of Companies, Inc.~ | | | 808,819 | |
| | 19,343 | | | | | Lennar Corp. - Class A | | | 876,431 | |
| | 195,336 | | | | | Lowe’s Companies, Inc. | | | 14,849,443 | |
| | 27,703 | | | | | Macy’s, Inc.~ | | | 1,096,762 | |
| | 101,134 | | | | | McDonald’s Corp.~ | | | 12,792,440 | |
| | 21,728 | | | | | Michael Kors Holdings, Ltd.# | | | 1,122,468 | |
| | 10,075 | | | | | Mohawk Industries, Inc.~# | | | 1,940,747 | |
| | 45,012 | | | | | Netflix, Inc.# | | | 4,052,430 | |
| | 191,027 | | | | | Nike, Inc. - Class B~ | | | 11,259,131 | |
| | 6,850 | | | | | Priceline Group, Inc.~# | | | 9,204,071 | |
| | 11,081 | | | | | PVH Corp.~ | | | 1,059,344 | |
| | 40,294 | | | | | Ross Stores, Inc.~ | | | 2,287,893 | |
| | 35,259 | | | | | Royal Caribbean Cruises, Ltd. | | | 2,729,047 | |
| | 119,478 | | | | | Starbucks Corp.~ | | | 6,718,248 | |
| | 21,658 | | | | | Time Warner Cable, Inc. | | | 4,593,878 | |
| | 88,752 | | | | | Time Warner, Inc.~ | | | 6,668,825 | |
| | 37,071 | | | | | TJX Companies, Inc.~ | | | 2,810,723 | |
| | 23,216 | | | | | TripAdvisor, Inc.~# | | | 1,499,521 | |
| | 212,762 | | | | | Twenty-First Century Fox, Inc.~ | | | 6,438,178 | |
| | 17,566 | | | | | Under Armour, Inc., Class A# | | | 771,850 | |
| | 17,566 | | | | | Under Armour, Inc., Class C# | | | 716,693 | |
| | 39,593 | | | | | Viacom, Inc. - Class B~ | | | 1,619,354 | |
| | 209,841 | | | | | Walt Disney Company~ | | | 21,668,182 | |
| | 8,059 | | | | | Whirlpool Corp.~ | | | 1,403,394 | |
| | 20,147 | | | | | Yum! Brands, Inc.~ | | | 1,602,895 | |
| | | | | | | | | | |
| | | | | | | | | 228,958,289 | |
| | | | | | | | | | |
| | | | |
| 130 | | CALAMOS OPEN-END FAMILY OF FUNDS SEMIANNUAL REPORT | | See accompanying Notes to Schedule of Investments |
Market Neutral Income Fund Schedule of Investments April 30, 2016 (Unaudited)
| | | | | | | | | | |
NUMBER OF
SHARES | | | | | | | VALUE | |
| | | | | | | | | | |
| | | | | | Consumer Staples (5.0%) | |
| | 278,950 | | | | | Altria Group, Inc.~ | | $ | 17,492,954 | |
| | 119,377 | | | | | Archer-Daniels-Midland Company | | | 4,767,917 | |
| | 377,775 | | | | | Coca-Cola Company | | | 16,924,320 | |
| | 75,958 | | | | | Colgate-Palmolive Company~ | | | 5,386,941 | |
| | 40,296 | | | | | ConAgra Foods, Inc.~ | | | 1,795,590 | |
| | 45,083 | | | | | Costco Wholesale Corp.~ | | | 6,678,145 | |
| | 157,354 | | | | | CVS Health Corp. | | | 15,814,077 | |
| | 65,077 | | | | | General Mills, Inc. | | | 3,991,823 | |
| | 14,103 | | | | | Hershey Company~ | | | 1,313,130 | |
| | 35,259 | | | | | Kellogg Company~ | | | 2,708,244 | |
| | 32,539 | | | | | Kimberly-Clark Corp. | | | 4,073,557 | |
| | 63,299 | | | | | Kraft Heinz Company | | | 4,941,753 | |
| | 130,963 | | | | | Kroger Company | | | 4,634,781 | |
| | 20,819 | | | | | Mead Johnson Nutrition Company~ | | | 1,814,376 | |
| | 168,327 | | | | | Mondelez International, Inc. - Class A | | | 7,231,328 | |
| | 201,680 | | | | | PepsiCo, Inc.~ | | | 20,764,973 | |
| | 168,236 | | | | | Philip Morris International, Inc.~ | | | 16,507,316 | |
| | 298,491 | | | | | Procter & Gamble Company | | | 23,915,099 | |
| | 35,986 | | | | | Reynolds American, Inc. | | | 1,784,906 | |
| | 202,384 | | | | | Wal-Mart Stores, Inc.~ | | | 13,533,418 | |
| | 105,778 | | | | | Walgreens Boots Alliance, Inc. | | | 8,386,080 | |
| | 73,365 | | | | | Whole Foods Market, Inc.~ | | | 2,133,454 | |
| | | | | | | | | | |
| | | | | | | | | 186,594,182 | |
| | | | | | | | | | |
| | | | | | Energy (3.9%) | |
| | 47,449 | | | | | Anadarko Petroleum Corp.~ | | | 2,503,409 | |
| | 24,680 | | | | | Apache Corp. | | | 1,342,592 | |
| | 48,858 | | | | | Baker Hughes, Inc.~ | | | 2,362,773 | |
| | 208,934 | | | | | Chevron Corp.~ | | | 21,348,876 | |
| | 124,814 | | | | | ConocoPhillips~ | | | 5,964,861 | |
| | 62,964 | | | | | Devon Energy Corp. | | | 2,183,592 | |
| | 91,471 | | | | | EOG Resources, Inc.~ | | | 7,557,334 | |
| | 28,207 | | | | | EQT Corp.~ | | | 1,977,311 | |
| | 549,326 | | | | | Exxon Mobil Corp. | | | 48,560,418 | |
| | 96,611 | | | | | Halliburton Company | | | 3,991,000 | |
| | 10,075 | | | | | Helmerich & Payne, Inc.~ | | | 666,159 | |
| | 385,377 | | | | | Kinder Morgan, Inc. | | | 6,844,296 | |
| | 60,445 | | | | | Marathon Oil Corp.~ | | | 851,670 | |
| | 103,157 | | | | | Marathon Petroleum Corp. | | | 4,031,376 | |
| | 13,095 | | | | | Murphy Oil Corp.~ | | | 468,015 | |
| | 48,858 | | | | | National Oilwell Varco, Inc.~ | | | 1,760,842 | |
| | 70,520 | | | | | Noble Energy, Inc. | | | 2,546,477 | |
| | 81,397 | | | | | Occidental Petroleum Corp. | | | 6,239,080 | |
| | 80,241 | | | | | Phillips 66~ | | | 6,588,589 | |
| | 141,439 | | | | | Schlumberger, Ltd. | | | 11,363,209 | |
| | 103,159 | | | | | Spectra Energy Corp. | | | 3,225,782 | |
| | | | | | | | | | |
NUMBER OF
SHARES | | | | | | | VALUE | |
| | | | | | | | | | |
| | 49,673 | | | | | Valero Energy Corp.~ | | $ | 2,924,250 | |
| | 38,485 | | | | | Williams Companies, Inc. | | | 746,224 | |
| | | | | | | | | | |
| | | | | | | | | 146,048,135 | |
| | | | | | | | | | |
| | | | | | Financials (7.7%) | |
| | 37,273 | | | | | Aflac, Inc.~ | | | 2,570,719 | |
| | 103,158 | | | | | Allstate Corp.~ | | | 6,710,428 | |
| | 189,894 | | | | | American Express Company~ | | | 12,424,764 | |
| | 185,525 | | | | | American International Group, Inc. | | | 10,356,005 | |
| | 40,801 | | | | | American Tower Corp. | | | 4,279,209 | |
| | 32,539 | | | | | Ameriprise Financial, Inc.~ | | | 3,120,490 | |
| | 12,088 | | | | | AvalonBay Communities, Inc.~ | | | 2,137,037 | |
| | 1,108,138 | | | | | Bank of America Corp. | | | 16,134,489 | |
| | 217,094 | | | | | Bank of New York Mellon Corp. | | | 8,735,863 | |
| | 92,279 | | | | | BB&T Corp. | | | 3,264,831 | |
| | 217,093 | | | | | Berkshire Hathaway, Inc. - Class B# | | | 31,582,690 | |
| | 12,994 | | | | | BlackRock, Inc.~ | | | 4,630,152 | |
| | 70,520 | | | | | Capital One Financial Corp. | | | 5,104,943 | |
| | 176,297 | | | | | Charles Schwab Corp.~ | | | 5,008,598 | |
| | 41,339 | | | | | Chubb Corp.~ | | | 4,872,215 | |
| | 314,813 | | | | | Citigroup, Inc.~ | | | 14,569,546 | |
| | 33,446 | | | | | Crown Castle International Corp. | | | 2,905,788 | |
| | 51,379 | | | | | Discover Financial Services | | | 2,891,096 | |
| | 36,872 | | | | | Equity Residential | | | 2,509,877 | |
| | 110,813 | | | | | Fifth Third Bancorp~ | | | 2,028,986 | |
| | 42,813 | | | | | Franklin Resources, Inc.~ | | | 1,598,637 | |
| | 46,642 | | | | | Goldman Sachs Group, Inc.~ | | | 7,654,419 | |
| | 45,334 | | | | | Hartford Financial Services Group, Inc.~ | | | 2,011,923 | |
| | 88,651 | | | | | Host Hotels & Resorts, Inc. | | | 1,402,459 | |
| | 75,553 | | | | | Invesco, Ltd. | | | 2,342,898 | |
| | 469,786 | | | | | JPMorgan Chase & Company | | | 29,690,475 | |
| | 77,066 | | | | | Lincoln National Corp. | | | 3,348,518 | |
| | 15,110 | | | | | Macerich Company | | | 1,149,569 | |
| | 169,486 | | | | | MetLife, Inc.~ | | | 7,643,819 | |
| | 146,578 | | | | | Morgan Stanley~ | | | 3,966,401 | |
| | 58,175 | | | | | PNC Financial Services Group, Inc.~ | | | 5,106,601 | |
| | 55,406 | | | | | Prologis, Inc.~ | | | 2,515,986 | |
| | 91,169 | | | | | Prudential Financial, Inc.~ | | | 7,078,361 | |
| | 14,959 | | | | | Public Storage~ | | | 3,662,113 | |
| | 191,409 | | | | | Regions Financial Corp.~ | | | 1,795,416 | |
| | 44,528 | | | | | Simon Property Group, Inc. | | | 8,957,698 | |
| | 43,822 | | | | | State Street Corp.~ | | | 2,730,111 | |
| | 60,443 | | | | | SunTrust Banks, Inc.~ | | | 2,522,891 | |
| | 88,150 | | | | | Synchrony Financial# | | | 2,694,745 | |
| | 27,200 | | | | | T. Rowe Price Group, Inc.~ | | | 2,047,888 | |
| | 28,005 | | | | | Travelers Companies, Inc.~ | | | 3,077,749 | |
| | 182,251 | | | | | US Bancorp~ | | | 7,780,295 | |
| | | | | | |
| See accompanying Notes to Schedule of Investments | | www.calamos.com | | | 131 | |
Market Neutral Income Fund Schedule of Investments April 30, 2016 (Unaudited)
| | | | | | | | | | |
NUMBER OF
SHARES | | | | | | | VALUE | |
| | | | | | | | | | |
| | 32,740 | | | | | Ventas, Inc.~ | | $ | 2,033,809 | |
| | 30,223 | | | | | Vornado Realty Trust | | | 2,893,248 | |
| | 512,160 | | | | | Wells Fargo & Company~ | | | 25,597,757 | |
| | 33,421 | | | | | Welltower, Inc. | | | 2,320,086 | |
| | | | | | | | | | |
| | | | | | | | | 289,461,598 | |
| | | | | | | | | | |
| | | | | | Health Care (7.2%) | |
| | 141,941 | | | | | Abbott Laboratories~ | | | 5,521,505 | |
| | 222,234 | | | | | AbbVie, Inc.~ | | | 13,556,274 | |
| | 59,941 | | | | | Aetna, Inc.~ | | | 6,729,576 | |
| | 38,792 | | | | | Agilent Technologies, Inc.~ | | | 1,587,369 | |
| | 21,156 | | | | | Alexion Pharmaceuticals, Inc.# | | | 2,946,608 | |
| | 51,231 | | | | | Allergan, PLC# | | | 11,094,585 | |
| | 80,288 | | | | | Amgen, Inc. | | | 12,709,590 | |
| | 40,801 | | | | | Anthem, Inc. | | | 5,743,557 | |
| | 65,077 | | | | | Baxalta, Inc. | | | 2,729,980 | |
| | 65,077 | | | | | Baxter International, Inc.~ | | | 2,877,705 | |
| | 30,927 | | | | | Biogen, Inc.~# | | | 8,504,616 | |
| | 152,219 | | | | | Bristol-Myers Squibb Company~ | | | 10,987,167 | |
| | 33,534 | | | | | Cardinal Health, Inc. | | | 2,631,078 | |
| | 85,439 | | | | | Celgene Corp.# | | | 8,835,247 | |
| | 52,889 | | | | | Cerner Corp.# | | | 2,969,188 | |
| | 40,145 | | | | | Cigna Corp. | | | 5,561,688 | |
| | 20,147 | | | | | DaVita HealthCare Partners, Inc.~# | | | 1,488,863 | |
| | 28,247 | | | | | Edwards Lifesciences Corp.~# | | | 3,000,114 | |
| | 97,718 | | | | | Eli Lilly and Company | | | 7,380,641 | |
| | 105,676 | | | | | Express Scripts Holding Company~# | | | 7,791,492 | |
| | 171,659 | | | | | Gilead Sciences, Inc. | | | 15,142,040 | |
| | 11,600 | | | | | Illumina, Inc.# | | | 1,565,884 | |
| | 304,687 | | | | | Johnson & Johnson | | | 34,149,319 | |
| | 24,179 | | | | | Laboratory Corp. of America Holdings~# | | | 3,030,112 | |
| | 123,774 | | | | | Medtronic, PLC | | | 9,796,712 | |
| | 373,541 | | | | | Merck & Company, Inc. | | | 20,484,988 | |
| | 45,769 | | | | | Mylan, NV# | | | 1,909,025 | |
| | 14,997 | | | | | Perrigo Company, PLC | | | 1,449,760 | |
| | 703,972 | | | | | Pfizer, Inc.~ | | | 23,026,924 | |
| | 15,110 | | | | | Quest Diagnostics, Inc.~ | | | 1,135,819 | |
| | 4,029 | | | | | Regeneron Pharmaceuticals, Inc.~# | | | 1,517,765 | |
| | 35,659 | | | | | St. Jude Medical, Inc.~ | | | 2,717,216 | |
| | 45,333 | | | | | Stryker Corp.~ | | | 4,941,750 | |
| | 81,396 | | | | | Thermo Fisher Scientific, Inc.~ | | | 11,741,373 | |
| | 92,279 | | | | | UnitedHealth Group, Inc. | | | 12,151,299 | |
| | | | | | | | | | |
| | | | | | | | | 269,406,829 | |
| | | | | | | | | | |
| | | | | | Industrials (4.6%) | | | | |
| | 55,304 | | | | | 3M Company | | | 9,256,784 | |
| | 100,741 | | | | | Boeing Company~ | | | 13,579,887 | |
| | 66,186 | | | | | Caterpillar, Inc.~ | | | 5,143,976 | |
| | | | | | | | | | |
NUMBER OF
SHARES | | | | | | | VALUE | |
| | | | | | | | | | |
| | 100,740 | | | | | CSX Corp.~ | | $ | 2,747,180 | |
| | 19,140 | | | | | Cummins, Inc.~ | | | 2,239,954 | |
| | 65,076 | | | | | Danaher Corp. | | | 6,296,103 | |
| | 73,340 | | | | | Deere & Company^ | | | 6,168,627 | |
| | 151,916 | | | | | Delta Air Lines, Inc. | | | 6,330,340 | |
| | 39,793 | | | | | Eaton Corp., PLC | | | 2,517,703 | |
| | 65,077 | | | | | Emerson Electric Company~ | | | 3,555,157 | |
| | 31,733 | | | | | Expeditors International of Washington, Inc.~ | | | 1,574,274 | |
| | 37,977 | | | | | FedEx Corp. | | | 6,270,382 | |
| | 33,244 | | | | | Fluor Corp.~ | | | 1,817,117 | |
| | 32,833 | | | | | General Dynamics Corp. | | | 4,613,693 | |
| | 1,003,093 | | | | | General Electric Company | | | 30,845,110 | |
| | 117,413 | | | | | Honeywell International, Inc. | | | 13,416,784 | |
| | 43,419 | | | | | Illinois Tool Works, Inc.~ | | | 4,538,154 | |
| | 23,297 | | | | | Jacobs Engineering Group, Inc.~# | | | 1,038,580 | |
| | 11,137 | | | | | Kansas City Southern | | | 1,055,231 | |
| | 8,517 | | | | | L-3 Communications Holdings, Inc. | | | 1,120,241 | |
| | 27,740 | | | | | Lockheed Martin Corp. | | | 6,446,221 | |
| | 70,520 | | | | | Masco Corp.~ | | | 2,165,669 | |
| | 27,867 | | | | | Norfolk Southern Corp. | | | 2,511,095 | |
| | 35,259 | | | | | Pentair, PLC | | | 2,047,843 | |
| | 25,186 | | | | | Robert Half International, Inc.~ | | | 964,876 | |
| | 154,033 | | | | | Southwest Airlines Company~ | | | 6,871,412 | |
| | 86,839 | | | | | Union Pacific Corp.~ | | | 7,574,966 | |
| | 89,558 | | | | | United Parcel Service, Inc. - Class B | | | 9,409,859 | |
| | 101,144 | | | | | United Technologies Corp.~ | | | 10,556,399 | |
| | | | | | | | | | |
| | | | | | | | | 172,673,617 | |
| | | | | | | | | | |
| | | | | | Information Technology (10.5%) | | | | |
| | 59,739 | | | | | Accenture, PLC - Class A~ | | | 6,745,728 | |
| | 40,297 | | | | | Akamai Technologies, Inc.~# | | | 2,054,744 | |
| | 30,972 | | | | | Alphabet, Inc. - Class A# | | | 21,924,459 | |
| | 31,073 | | | | | Alphabet, Inc. - Class C~# | | | 21,533,900 | |
| | 40,297 | | | | | Amphenol Corp. - Class A~ | | | 2,249,782 | |
| | 782,490 | | | | | Apple, Inc. | | | 73,350,613 | |
| | 161,182 | | | | | Applied Materials, Inc. | | | 3,299,396 | |
| | 61,776 | | | | | Broadcom, Ltd. | | | 9,003,852 | |
| | 515,588 | | | | | Cisco Systems, Inc. | | | 14,173,514 | |
| | 76,059 | | | | | Cognizant Technology Solutions Corp. - Class A# | | | 4,439,564 | |
| | 115,514 | | | | | eBay, Inc.# | | | 2,822,007 | |
| | 200,396 | | | | | EMC Corp.~ | | | 5,232,340 | |
| | 22,667 | | | | | F5 Networks, Inc.~# | | | 2,374,368 | |
| | 268,146 | | | | | Facebook, Inc. - Class A~# | | | 31,528,607 | |
| | 65,076 | | | | | Fiserv, Inc.# | | | 6,359,227 | |
| | 243,792 | | | | | Hewlett Packard Enterprise Company | | | 4,061,575 | |
| | 243,792 | | | | | HP, Inc. | | | 2,991,328 | |
| | | | |
| 132 | | CALAMOS OPEN-END FAMILY OF FUNDS SEMIANNUAL REPORT | | See accompanying Notes to Schedule of Investments |
Market Neutral Income Fund Schedule of Investments April 30, 2016 (Unaudited)
| | | | | | | | | | |
NUMBER OF
SHARES | | | | | | | VALUE | |
| | | | | | | | | | |
| | 623,379 | | | | | Intel Corp.~ | | $ | 18,875,916 | |
| | 105,981 | | | | | International Business Machines Corp. | | | 15,466,867 | |
| | 73,020 | | | | | Juniper Networks, Inc.~ | | | 1,708,668 | |
| | 170,553 | | | | | MasterCard, Inc. - Class A | | | 16,541,935 | |
| | 40,297 | | | | | Microchip Technology, Inc. | | | 1,958,031 | |
| | 137,427 | | | | | Micron Technology, Inc.~# | | | 1,477,340 | |
| | 998,634 | | | | | Microsoft Corp.~ | | | 49,801,878 | |
| | 373,947 | | | | | Oracle Corp. | | | 14,905,527 | |
| | 115,513 | | | | | PayPal Holdings, Inc.# | | | 4,525,799 | |
| | 209,526 | | | | | QUALCOMM, Inc. | | | 10,585,254 | |
| | 20,147 | | | | | Red Hat, Inc.~# | | | 1,478,185 | |
| | 85,630 | | | | | Symantec Corp.~ | | | 1,425,311 | |
| | 55,884 | | | | | TE Connectivity, Ltd. | | | 3,323,980 | |
| | 20,147 | | | | | Teradata Corp.# | | | 509,719 | |
| | 130,257 | | | | | Texas Instruments, Inc.~ | | | 7,429,859 | |
| | 306,793 | | | | | Visa, Inc. - Class A~^ | | | 23,696,691 | |
| | 44,371 | | | | | Western Digital Corp. | | | 1,813,221 | |
| | 78,075 | | | | | Yahoo!, Inc.# | | | 2,857,545 | |
| | | | | | | | | | |
| | | | | | | | | 392,526,730 | |
| | | | | | | | | | |
| | | | | | Materials (1.4%) | |
| | 28,208 | | | | | Air Products & Chemicals, Inc.~ | | | 4,115,265 | |
| | 6,547 | | | | | Airgas, Inc.~ | | | 932,555 | |
| | 45,341 | | | | | CF Industries Holdings, Inc.~ | | | 1,499,427 | |
| | 173,676 | | | | | Dow Chemical Company~ | | | 9,137,094 | |
| | 106,381 | | | | | E.I. du Pont de Nemours and Company | | | 7,011,572 | |
| | 10,074 | | | | | Eastman Chemical Company~ | | | 769,452 | |
| | 176,894 | | | | | Freeport-McMoRan, Inc. | | | 2,476,516 | |
| | 54,300 | | | | | LyondellBasell Industries, NV - Class A | | | 4,488,981 | |
| | 94,394 | | | | | Monsanto Company | | | 8,842,830 | |
| | 75,958 | | | | | Mosaic Company | | | 2,126,064 | |
| | 84,621 | | | | | Newmont Mining Corp.~ | | | 2,959,196 | |
| | 34,654 | | | | | PPG Industries, Inc. | | | 3,825,455 | |
| | 37,977 | | | | | Praxair, Inc. | | | 4,460,779 | |
| | | | | | | | | | |
| | | | | | | | | 52,645,186 | |
| | | | | | | | | | |
| | | | | | Telecommunication Services (1.4%) | |
| | 749,428 | | | | | AT&T, Inc.~ | | | 29,092,795 | |
| | 102,050 | | | | | CenturyLink, Inc.~ | | | 3,158,448 | |
| | 423,309 | | | | | Verizon Communications, Inc.~ | | | 21,563,360 | |
| | | | | | | | | | |
| | | | | | | | | 53,814,603 | |
| | | | | | | | | | |
| | | | | | Utilities (1.7%) | |
| | 105,778 | | | | | AES Corp.~ | | | 1,180,482 | |
| | 68,403 | | | | | American Electric Power Company, Inc.~ | | | 4,343,591 | |
| | 55,406 | | | | | CMS Energy Corp.~ | | | 2,253,916 | |
| | | | | | | | | | |
NUMBER OF
SHARES | | | | | | | VALUE | |
| | | | | | | | | | |
| | 40,296 | | | | | Consolidated Edison, Inc. | | $ | 3,006,082 | |
| | 48,858 | | | | | Dominion Resources, Inc.~ | | | 3,491,881 | |
| | 135,697 | | | | | Duke Energy Corp.~ | | | 10,690,210 | |
| | 50,371 | | | | | Edison International | | | 3,561,733 | |
| | 24,179 | | | | | Entergy Corp.~ | | | 1,817,777 | |
| | 20,147 | | �� | | | Eversource Energy~ | | | 1,137,097 | |
| | 70,520 | | | | | Exelon Corp.~ | | | 2,474,547 | |
| | 50,371 | | | | | FirstEnergy Corp.~ | | | 1,641,591 | |
| | 83,011 | | | | | NextEra Energy, Inc. | | | 9,760,433 | |
| | 60,443 | | | | | PG&E Corp. | | | 3,517,783 | |
| | 50,371 | | | | | PPL Corp.~ | | | 1,895,964 | |
| | 60,443 | | | | | Public Service Enterprise Group, Inc.~ | | | 2,788,236 | |
| | 174,783 | | | | | Southern Company | | | 8,756,628 | |
| | 45,334 | | | | | Xcel Energy, Inc.~ | | | 1,814,720 | |
| | | | | | | | | | |
| | | | | | | | | 64,132,671 | |
| | | | | | | | | | |
| | | | | | TOTAL COMMON STOCKS
(Cost $1,779,935,126) | | | 1,856,261,840 | |
| | | | | | | | | | |
NUMBER OF
CONTRACTS | | | | | | | VALUE | |
| | PURCHASED OPTIONS (0.6%) # | |
| | | | | | Consumer Discretionary (0.0%) | |
| | | | | | Tesla Motors, Inc. | | | | |
| | 2,500 | | | | | Put, 01/19/18, Strike $30.00 | | | 218,750 | |
| | 34 | | | | | Put, 01/19/18, Strike $20.00 | | | 2,159 | |
| | | | | | | | | | |
| | | | | | | | | 220,909 | |
| | | | | | | | | | |
| | | | | | Financials (0.0%) | |
| | 1,500 | | | | | AmTrust Financial Services, Inc.
Put, 06/17/16, Strike $16.25 | | | 33,750 | |
| | | | | | | | | | |
| | | | | | Information Technology (0.0%) | |
| | 337 | | | | | SanDisk Corp. Put,
07/15/16, Strike $70.00 | | | 60,660 | |
| | | | | | | | | | |
| | | | | | Other (0.6%) | |
| | | | | | S&P 500 Index | | | | |
| | 1,500 | | | | | Put, 05/13/16, Strike $2,035.00 | | | 1,927,500 | |
| | 1,500 | | | | | Put, 05/31/16, Strike $1,975.00 | | | 1,732,500 | |
| | 1,000 | | | | | Put, 05/06/16, Strike $2,040.00 | | | 770,000 | |
| | 1,000 | | | | | Put, 05/20/16, Strike $2,025.00 | | | 1,530,000 | |
| | 1,000 | | | | | Put, 05/31/16, Strike $2,000.00 | | | 1,560,000 | |
| | 1,000 | | | | | Put, 12/30/16, Strike $1,900.00 | | | 6,865,000 | |
| | 750 | | | | | Put, 12/16/16, Strike $2,000.00 | | | 6,971,250 | |
| | | | | | | | | | |
| | | | | | | | | 21,356,250 | |
| | | | | | | | | | |
| | | | | | TOTAL PURCHASED OPTIONS
(Cost $35,351,602) | | | 21,671,569 | |
| | | | | | | | | | |
| | | | | | |
| See accompanying Notes to Schedule of Investments | | www.calamos.com | | | 133 | |
Market Neutral Income Fund Schedule of Investments April 30, 2016 (Unaudited)
| | | | | | | | | | |
NUMBER OF
SHARES | | | | | | | VALUE | |
| | | | | | | | | | |
| | SHORT TERM INVESTMENT (1.0%) | |
| | 36,429,087 | | | | | Fidelity Prime Money Market Fund - Institutional Class
(Cost $36,429,087) | | $ | 36,429,087 | |
| | | | | | | | | | |
NUMBER OF
SHARES/
PRINCIPAL
AMOUNT | | | | | | | VALUE | |
| INVESTMENT OF CASH COLLATERAL FOR SECURITIES
LOANED (0.9%) |
|
| | | | | | Federal Home Loan Bank Discount Notes | | | | |
| | 7,378,624 | | | | | 0.000 %, 06/15/16 | | | 7,378,624 | |
| | 5,903,592 | | | | | 0.000 %, 05/24/16 | | | 5,903,592 | |
| | 4,427,817 | | | | | 0.000 %, 05/02/16 | | | 4,427,817 | |
| | 6,815,750 | | | | | Fidelity Prime Money Market Fund - Institutional Class | | | 6,815,750 | |
| | 4,560,681 | | | | | Goldman Sachs Financial Square Prime Obligations Fund | | | 4,560,681 | |
| | 5,301,923 | | | | | Morgan Stanley Institutional Liquidity Fund | | | 5,301,923 | |
| | | | | | | | | | |
| | | | | | TOTAL INVESTMENT OF
CASH COLLATERAL FOR SECURITIES LOANED
(Cost $34,388,387) | | | 34,388,387 | |
| | | | | | | | | | |
| TOTAL INVESTMENTS (101.9%)
(Cost $3,815,560,983) | | | 3,820,171,627 | |
| | | | | | | | | | |
| |
| | PAYABLE UPON RETURN OF SECURITIES ON LOAN (-0.9%) | | | (34,388,387 | ) |
| | | | | | | | | | |
| |
| | LIABILITIES, LESS OTHER ASSETS (-1.0%) | | | (37,963,486 | ) |
| | | | | | | | | | |
| | NET ASSETS (100.0%) | | $ | 3,747,819,754 | |
| | | | | | | | | | |
NUMBER OF
SHARES | | | | | | | VALUE | |
| | COMMON STOCKS SOLD SHORT (-22.1%) # | |
| | | | | | Consumer Discretionary (-3.3%) | |
| | (362,001 | ) | | | | CalAtlantic Group, Inc. | | | (11,717,972 | ) |
| | (626,000 | ) | | | | Ctrip.com International, Ltd. | | | (27,299,860 | ) |
| | (23,900 | ) | | | | GNC Holdings, Inc. - Class A | | | (582,204 | ) |
| | (27,000 | ) | | | | HSN, Inc. | | | (1,431,810 | ) |
| | (115,800 | ) | | | | Live Nation Entertainment, Inc. | | | (2,487,384 | ) |
| | (50,500 | ) | | | | M/I Homes, Inc. | | | (1,015,050 | ) |
| | (69,850 | ) | | | | Meritage Homes Corp. | | | (2,376,996 | ) |
| | (439,102 | ) | | | | Newell Brands, Inc. | | | (19,996,705 | ) |
| | (16,110 | ) | | | | Priceline Group, Inc. | | | (21,646,363 | ) |
| | (22,000 | ) | | | | Restoration Hardware Holdings, Inc. | | | (951,940 | ) |
| | (88,045 | ) | | | | Shutterfly, Inc. | | | (4,048,309 | ) |
| | (193,100 | ) | | | | TAL Education Group | | | (11,172,766 | ) |
| | (55,000 | ) | | | | Tesla Motors, Inc. | | | (13,241,800 | ) |
| | (296,000 | ) | | | | Vipshop Holdings, Ltd. | | | (4,037,440 | ) |
| | | | | | | | | | |
| | | | | | | | | (122,006,599 | ) |
| | | | | | | | | | |
| | | | | | | | | | |
NUMBER OF
SHARES | | | | | | | VALUE | |
| | | | | | | | | | |
| | | | | | Consumer Staples (-0.1%) | |
| | (63,700 | ) | | | | Post Holdings, Inc. | | $ | (4,576,208 | ) |
| | | | | | | | | | |
| | | | | | Energy (-1.4%) | |
| | (317,100 | ) | | | | Hess Corp. | | | (18,905,502 | ) |
| | (115,011 | ) | | | | PDC Energy, Inc. | | | (7,221,541 | ) |
| | (150,000 | ) | | | | Renewable Energy Group, Inc. | | | (1,458,000 | ) |
| | (25,550 | ) | | | | SEACOR Holdings, Inc. | | | (1,501,574 | ) |
| | (1,150,000 | ) | | | | Southwestern Energy Company | | | (15,444,500 | ) |
| | (100,000 | ) | | | | Whiting Petroleum Corp. | | | (1,200,000 | ) |
| | (785,749 | ) | | | | WPX Energy, Inc. | | | (7,590,335 | ) |
| | | | | | | | | | |
| | | | | | | | | (53,321,452 | ) |
| | | | | | | | | | |
| | | | | | Financials (-1.2%) | |
| | (106,406 | ) | | | | American Homes 4 Rent | | | (1,683,343 | ) |
| | (115,000 | ) | | | | American Tower Corp. | | | (12,061,200 | ) |
| | (156,400 | ) | | | | AmTrust Financial Services, Inc. | | | (3,886,540 | ) |
| | (98,500 | ) | | | | Colony Starwood Homes | | | (2,400,445 | ) |
| | (357,900 | ) | | | | Cowen Group, Inc. | | | (1,247,281 | ) |
| | (43,000 | ) | | | | Extra Space Storage, LP | | | (3,652,850 | ) |
| | (123,500 | ) | | | | Forestar Group, Inc. | | | (1,667,250 | ) |
| | (164,000 | ) | | | | SL Green Realty Corp. | | | (17,233,120 | ) |
| | (40,000 | ) | | | | Starwood Property Trust, Inc. | | | (774,400 | ) |
| | | | | | | | | | |
| | | | | | | | | (44,606,429 | ) |
| | | | | | | | | | |
| | | | | | Health Care (-4.2%) | |
| | (145,000 | ) | | | | Aceto Corp. | | | (3,252,350 | ) |
| | (117,000 | ) | | | | Acorda Therapeutics, Inc. | | | (3,024,450 | ) |
| | (54,500 | ) | | | | Allergan, PLC | | | (11,802,520 | ) |
| | (195,000 | ) | | | | Allscripts Healthcare Solutions, Inc. | | | (2,613,000 | ) |
| | (295,000 | ) | | | | AMAG Pharmaceuticals, Inc. | | | (7,823,400 | ) |
| | (64,000 | ) | | | | Anacor Pharmaceuticals, Inc. | | | (4,015,360 | ) |
| | (100,000 | ) | | | | BioMarin Pharmaceutical, Inc. | | | (8,468,000 | ) |
| | (140,500 | ) | | | | Brookdale Senior Living, Inc. | | | (2,593,630 | ) |
| | (301,000 | ) | | | | Depomed, Inc. | | | (5,231,380 | ) |
| | (90,000 | ) | | | | Emergent Biosolutions, Inc. | | | (3,466,800 | ) |
| | (275,000 | ) | | | | Horizon Pharma, PLC | | | (4,226,750 | ) |
| | (49,000 | ) | | | | Insulet Corp. | | | (1,631,700 | ) |
| | (313,500 | ) | | | | Integra LifeSciences Holdings Corp. | | | (22,202,070 | ) |
| | (342,000 | ) | | | | Ironwood Pharmaceuticals, Inc. | | | (3,573,900 | ) |
| | (88,700 | ) | | | | Ligand Pharmaceuticals, Inc. | | | (10,721,169 | ) |
| | (545,000 | ) | | | | Medicines Company | | | (19,396,550 | ) |
| | (214,100 | ) | | | | Molina Healthcare, Inc. | | | (11,081,816 | ) |
| | (135,500 | ) | | | | NuVasive, Inc. | | | (7,173,370 | ) |
| | (95,973 | ) | | | | Quidel Corp. | | | (1,660,333 | ) |
| | (141,000 | ) | | | | Spectranetics Corp. | | | (2,397,000 | ) |
| | (140,000 | ) | | | | Teligent, Inc. | | | (772,800 | ) |
| | (306,300 | ) | | | | Teva Pharmaceutical Industries, Ltd. | | | (16,678,035 | ) |
| | | | |
| 134 | | CALAMOS OPEN-END FAMILY OF FUNDS SEMIANNUAL REPORT | | See accompanying Notes to Schedule of Investments |
Market Neutral Income Fund Schedule of Investments April 30, 2016 (Unaudited)
| | | | | | | | | | |
NUMBER OF
SHARES | | | | | | | VALUE | |
| | | | | | | | | | |
| | (175,717 | ) | | | | Wright Medical Group, NV | | $ | (3,299,965 | ) |
| | | | | | | | | | |
| | | | | | | | | (157,106,348 | ) |
| | | | | | | | | | |
| | | | | | Industrials (-0.4%) | |
| | (47,500 | ) | | | | Greenbrier Companies, Inc. | | | (1,424,525 | ) |
| | (154,600 | ) | | | | Navistar International Corp. | | | (2,332,914 | ) |
| | (75,000 | ) | | | | Stericycle, Inc. | | | (7,167,000 | ) |
| | (205,000 | ) | | | | Trinity Industries, Inc. | | | (3,999,550 | ) |
| | | | | | | | | | |
| | | | | | | | | (14,923,989 | ) |
| | | | | | | | | | |
| | | | | | Information Technology (-10.8%) | |
| | (142,500 | ) | | | | Bottomline Technologies (de), Inc. | | | (3,499,800 | ) |
| | (45,076 | ) | | | | Brocade Communications Systems, Inc. | | | (433,180 | ) |
| | (50,000 | ) | | | | CalAmp Corp. | | | (748,500 | ) |
| | (70,000 | ) | | | | Canadian Solar, Inc. | | | (1,253,700 | ) |
| | (93,999 | ) | | | | Cardtronics, Inc. | | | (3,705,441 | ) |
| | (449,400 | ) | | | | Ciena Corp. | | | (7,563,402 | ) |
| | (75,000 | ) | | | | Citrix Systems, Inc. | | | (6,138,000 | ) |
| | (102,900 | ) | | | | Cornerstone OnDemand, Inc. | | | (3,534,615 | ) |
| | (120,000 | ) | | | | CSG Systems International, Inc. | | | (5,325,600 | ) |
| | (610,000 | ) | | | | Electronic Arts, Inc. | | | (37,728,500 | ) |
| | (120,000 | ) | | | | Electronics For Imaging, Inc. | | | (4,780,800 | ) |
| | (36,900 | ) | | | | Envestnet, Inc. | | | (1,157,922 | ) |
| | (47,200 | ) | | | | Euronet Worldwide, Inc. | | | (3,639,120 | ) |
| | (185,000 | ) | | | | Finisar Corp. | | | (3,045,100 | ) |
| | (55,000 | ) | | | | FireEye, Inc. | | | (954,250 | ) |
| | (550,035 | ) | | | | Infinera Corp. | | | (6,539,916 | ) |
| | (89,100 | ) | | | | Inphi Corp. | | | (2,643,597 | ) |
| | (163,800 | ) | | | | Integrated Device Technology, Inc. | | | (3,158,064 | ) |
| | (59,071 | ) | | | | Lam Research Corp. | | | (4,513,024 | ) |
| | (22,000 | ) | | | | LinkedIn Corp. | | | (2,756,820 | ) |
| | (217,899 | ) | | | | Mentor Graphics Corp. | | | (4,349,264 | ) |
| | (61,700 | ) | | | | MercadoLibre, Inc. | | | (7,705,713 | ) |
| | (156,000 | ) | | | | Microchip Technology, Inc. | | | (7,580,040 | ) |
| | (1,319,800 | ) | | | | Micron Technology, Inc. | | | (14,187,850 | ) |
| | (8,500 | ) | | | | NetSuite, Inc. | | | (688,840 | ) |
| | (374,700 | ) | | | | Nuance Communications, Inc. | | | (6,437,346 | ) |
| | (1,563,000 | ) | | | | NVIDIA Corp. | | | (55,533,390 | ) |
| | (92,773 | ) | | | | NXP Semiconductors, NV | | | (7,911,682 | ) |
| | (1,272,000 | ) | | | | ON Semiconductor Corp. | | | (12,045,840 | ) |
| | (86,500 | ) | | | | Palo Alto Networks, Inc. | | | (13,050,255 | ) |
| | (285,000 | ) | | | | Pandora Media, Inc. | | | (2,830,050 | ) |
| | (161,300 | ) | | | | Proofpoint, Inc. | | | (9,397,338 | ) |
| | (96,000 | ) | | | | Qihoo 360 Technology Company, Ltd. | | | (7,290,240 | ) |
| | (599,000 | ) | | | | Rambus, Inc. | | | (6,960,380 | ) |
| | (95,000 | ) | | EUR | | Rocket Internet, SE* | | | (2,289,862 | ) |
| | (135,000 | ) | | | | Rovi Corp. | | | (2,378,700 | ) |
| | (225,700 | ) | | | | Salesforce.com, Inc. | | | (17,108,060 | ) |
| | | | | | | | | | |
NUMBER OF
SHARES | | | | | | | VALUE | |
| | | | | | | | | | |
| | (486,000 | ) | | | | SanDisk Corp. | | $ | (36,513,180 | ) |
| | (45,000 | ) | | | | ServiceNow, Inc. | | | (3,216,600 | ) |
| | (7,500 | ) | | | | SINA Corp. | | | (375,675 | ) |
| | (235,000 | ) | | | | SunPower Corp. | | | (4,732,900 | ) |
| | (43,500 | ) | | | | Synchronoss Technologies, Inc. | | | (1,351,545 | ) |
| | (845,000 | ) | | | | Take-Two Interactive Software, Inc. | | | (28,882,100 | ) |
| | (400,500 | ) | | | | TTM Technologies, Inc. | | | (2,611,260 | ) |
| | (75,000 | ) | | | | Twitter, Inc. | | | (1,096,500 | ) |
| | (392,500 | ) | | | | Viavi Solutions, Inc. | | | (2,555,175 | ) |
| | (84,200 | ) | | | | WebMD Health Corp. | | | (5,282,708 | ) |
| | (105,700 | ) | | | | Workday, Inc. - Class A | | | (7,925,386 | ) |
| | (594,000 | ) | | | | Xilinx, Inc. | �� | | (25,589,520 | ) |
| | (31,000 | ) | | | | Yahoo!, Inc. | | | (1,134,600 | ) |
| | (76,000 | ) | | | | Yandex, NV - Class A | | | (1,555,720 | ) |
| | | | | | | | | | |
| | | | | | | | | (403,687,070 | ) |
| | | | | | | | | | |
| | | | | | Materials (-0.3%) | |
| | (359,846 | ) | | | | Alcoa, Inc. | | | (4,019,480 | ) |
| | (378,000 | ) | | | | B2Gold Corp. | | | (839,160 | ) |
| | (1,042,891 | ) | | | | Cemex, SAB de CV | | | (7,769,539 | ) |
| | | | | | | | | | |
| | | | | | | | | (12,628,179 | ) |
| | | | | | | | | | |
| | | | | | Telecommunication Services (-0.3%) | |
| | (1,770,000 | ) | | | | Frontier Communications Corp. | | | (9,841,200 | ) |
| | (153,000 | ) | | EUR | | Koninklijke KPN, NV | | | (601,238 | ) |
| | | | | | | | | | |
| | | | | | | | | (10,442,438 | ) |
| | | | | | | | | | |
| | | | | | Utilities (-0.1%) | |
| | (39,000 | ) | | | | NextEra Energy, Inc. | | | (4,585,620 | ) |
| | | | | | | | | | |
| | | | | | TOTAL COMMON STOCKS
SOLD SHORT
(Proceeds $783,641,056) | | | (827,884,332 | ) |
| | | | | | | | | | |
NUMBER OF
CONTRACTS | | | | | | | VALUE | |
| | WRITTEN OPTIONS (-1.7%) # | |
| | | | | | Consumer Discretionary (-0.2%) | |
| | 435 | | | | | Netflix, Inc.
Put, 08/19/16, Strike $85.00 | | | (261,000 | ) |
| | 800 | | | | | Tesla Motors, Inc.
Call, 01/19/18, Strike $150.00 | | | (8,098,000 | ) |
| | | | | | | | | | |
| | | | | | | | | (8,359,000 | ) |
| | | | | | | | | | |
| | | | | | Energy (0.0%) | |
| | 630 | | | | | EOG Resources, Inc.
Call, 05/06/16, Strike $83.00 | | | (120,960 | ) |
| | 2,000 | | | | | Southwestern Energy Company
Call, 01/20/17, Strike $13.00 | | | (660,000 | ) |
| | | | | | | | | | |
| | | | | | | | | (780,960 | ) |
| | | | | | | | | | |
| | | | | | |
| See accompanying Notes to Schedule of Investments | | www.calamos.com | | | 135 | |
Market Neutral Income Fund Schedule of Investments April 30, 2016 (Unaudited)
| | | | | | | | | | |
NUMBER OF
CONTRACTS | | | | | | | VALUE | |
| | | | | | | | | | |
| | | | | | Health Care (-0.1%) | |
| | 300 | | | | | Allergan, PLC
Put, 11/18/16, Strike $240.00 | | $ | (1,029,000 | ) |
| | | | | | | | | | |
| | | | | | Industrials (0.0%) | |
| | 340 | | | | | SolarCity Corp.
Call, 01/20/17, Strike $85.00 | | | (12,580 | ) |
| | | | | | | | | | |
| | | | | | Information Technology (0.0%) | |
| | 675 | | | | | SanDisk Corp.
Put, 07/15/16, Strike $55.00 | | | (30,375 | ) |
| | | | | | | | | | |
| | | | | | Other (-1.4%) | |
| | | | | | S&P 500 Index | | | | |
| | 2,000 | | | | | Call, 05/31/16, Strike $2,050.00 | | | (7,880,000 | ) |
| | 2,000 | | | | | Call, 12/16/16, Strike $2,150.00 | | | (10,490,000 | ) |
| | 2,000 | | | | | Call, 12/30/16, Strike $2,100.00 | | | (16,020,000 | ) |
| | 2,000 | | | | | Put, 12/30/16, Strike $1,675.00 | | | (6,300,000 | ) |
| | 1,000 | | | | | Put, 05/06/16, Strike $1,960.00 | | | (82,500 | ) |
| | 1,000 | | | | | Call, 05/31/16, Strike $2,000.00 | | | (7,635,000 | ) |
| | 1,000 | | | | | Put, 05/31/16, Strike $1,900.00 | | | (495,000 | ) |
| | 1,000 | | | | | Call, 08/31/16, Strike $2,125.00 | | | (3,560,000 | ) |
| | | | | | | | | | |
| | | | | | | | | (52,462,500 | ) |
| | | | | | | | | | |
| | | | | | TOTAL WRITTEN OPTIONS
(Premium $68,722,675) | | | (62,674,415 | ) |
| | | | | | | | | | |
NOTES TO SCHEDULE OF INVESTMENTS
| ~ | Security, or portion of security, is segregated as collateral (or potential collateral for future transactions) for written options and securities sold short. The aggregate value of such securities is $547,206,590. |
| * | Securities issued and sold pursuant to a Rule 144A transaction are excepted from the registration requirement of the Securities Act of 1933, as amended. These securities may only be sold to qualified institutional buyers (“QIBs”), such as the Fund. Any resale of these securities must generally be effected through a sale that is registered under the Act or otherwise exempted from such registration requirements. |
| ^ | Security, or portion of security, is on loan. |
| @ | In default status and considered non-income producing. |
| ¤ | The synthetic convertible securities strategy combines separate securities that together possess the economic characteristics similar to a convertible security. |
| ‡ | Variable rate or step bond security. The rate shown is the rate in effect at April 30, 2016. |
| # | Non-income producing security. |
| | |
| FOREIGN CURRENCY ABBREVIATION |
| EUR | | European Monetary Unit |
Note: Value for securities denominated in foreign currencies is shown in U.S. dollars. The principal amount for such securities is shown in the respective foreign currency. The date on options represents the expiration date of the option contract. The option contract may be exercised at any date on or before the date shown.
| | | | |
| 136 | | CALAMOS OPEN-END FAMILY OF FUNDS SEMIANNUAL REPORT | | See accompanying Notes to Financial Statements |
Hedged Equity Income Fund Schedule of Investments April 30, 2016 (Unaudited)
| | | | | | | | | | |
NUMBER OF
SHARES | | | | | | | VALUE | |
| | | | | | | | | | |
| | COMMON STOCKS (96.7%) | |
| | | | | | Consumer Discretionary (12.0%) | |
| | 339 | | | | | Amazon.com, Inc.# | | $ | 223,601 | |
| | 27 | | | | | AutoZone, Inc.#~ | | | 20,661 | |
| | 211 | | | | | CarMax, Inc.#~ | | | 11,172 | |
| | 552 | | | | | Carnival Corp. | | | 27,076 | |
| | 39 | | | | | Chipotle Mexican Grill, Inc.# | | | 16,418 | |
| | 480 | | | | | Coach, Inc. | | | 19,330 | |
| | 2,543 | | | | | Comcast Corp. - Class A~ | | | 154,513 | |
| | 295 | | | | | D.R. Horton, Inc. | | | 8,868 | |
| | 170 | | | | | Darden Restaurants, Inc. | | | 10,582 | |
| | 611 | | | | | Delphi Automotive, PLC | | | 44,988 | |
| | 211 | | | | | Discovery Communications, Inc. - Class A#~ | | | 5,762 | |
| | 210 | | | | | Discovery Communications, Inc. - Class C#~ | | | 5,624 | |
| | 222 | | | | | Dollar General Corp. | | | 18,184 | |
| | 3,406 | | | | | Ford Motor Company | | | 46,185 | |
| | 261 | | | | | Gap, Inc.~ | | | 6,050 | |
| | 909 | | | | | General Motors Company, Inc. | | | 28,906 | |
| | 1,961 | | | | | Home Depot, Inc. | | | 262,558 | |
| | 294 | | | | | Interpublic Group of Companies, Inc. | | | 6,744 | |
| | 163 | | | | | Lennar Corp. - Class A | | | 7,386 | |
| | 1,634 | | | | | Lowe’s Companies, Inc.~ | | | 124,217 | |
| | 231 | | | | | Macy’s, Inc. | | | 9,145 | |
| | 848 | | | | | McDonald’s Corp. | | | 107,264 | |
| | 184 | | | | | Michael Kors Holdings, Ltd.#~ | | | 9,505 | |
| | 84 | | | | | Mohawk Industries, Inc.# | | | 16,181 | |
| | 371 | | | | | Netflix, Inc.# | | | 33,401 | |
| | 1,509 | | | | | Nike, Inc. - Class B | | | 88,940 | |
| | 56 | | | | | Priceline Group, Inc.# | | | 75,245 | |
| | 93 | | | | | PVH Corp. | | | 8,891 | |
| | 340 | | | | | Ross Stores, Inc. | | | 19,305 | |
| | 320 | | | | | Royal Caribbean Cruises, Ltd. | | | 24,768 | |
| | 998 | | | | | Starbucks Corp. | | | 56,118 | |
| | 183 | | | | | Time Warner Cable, Inc. | | | 38,816 | |
| | 743 | | | | | Time Warner, Inc. | | | 55,829 | |
| | 290 | | | | | TJX Companies, Inc. | | | 21,988 | |
| | 198 | | | | | TripAdvisor, Inc.# | | | 12,789 | |
| | 1,780 | | | | | Twenty-First Century Fox, Inc. | | | 53,863 | |
| | 161 | | | | | Under Armour, Inc., Class A# | | | 7,074 | |
| | 161 | | | | | Under Armour, Inc., Class C# | | | 6,569 | |
| | 311 | | | | | Viacom, Inc. - Class B | | | 12,720 | |
| | 1,758 | | | | | Walt Disney Company~ | | | 181,531 | |
| | 71 | | | | | Whirlpool Corp. | | | 12,364 | |
| | 167 | | | | | Yum! Brands, Inc. | | | 13,287 | |
| | | | | | | | | | |
| | | | | | | | | 1,914,418 | |
| | | | | | | | | | |
| | | | | | | | | | |
NUMBER OF
SHARES | | | | | | | VALUE | |
| | | | | | | | | | |
| | | | | | | | | | |
| | | | | | Consumer Staples (9.8%) | |
| | 2,332 | | | | | Altria Group, Inc.~ | | $ | 146,240 | |
| | 995 | | | | | Archer-Daniels-Midland Company~ | | | 39,740 | |
| | 3,158 | | | | | Coca-Cola Company~ | | | 141,478 | |
| | 634 | | | | | Colgate-Palmolive Company | | | 44,963 | |
| | 337 | | | | | ConAgra Foods, Inc.~ | | | 15,017 | |
| | 388 | | | | | Costco Wholesale Corp. | | | 57,474 | |
| | 1,317 | | | | | CVS Health Corp.~ | | | 132,359 | |
| | 541 | | | | | General Mills, Inc. | | | 33,185 | |
| | 121 | | | | | Hershey Company~ | | | 11,266 | |
| | 296 | | | | | Kellogg Company | | | 22,736 | |
| | 274 | | | | | Kimberly-Clark Corp. | | | 34,302 | |
| | 529 | | | | | Kraft Heinz Company | | | 41,299 | |
| | 1,096 | | | | | Kroger Company~ | | | 38,787 | |
| | 171 | | | | | Mead Johnson Nutrition Company | | | 14,903 | |
| | 1,401 | | | | | Mondelez International, Inc. - Class A | | | 60,187 | |
| | 1,688 | | | | | PepsiCo, Inc. | | | 173,796 | |
| | 1,408 | | | | | Philip Morris International, Inc. | | | 138,153 | |
| | 2,497 | | | | | Procter & Gamble Company | | | 200,060 | |
| | 298 | | | | | Reynolds American, Inc. | | | 14,781 | |
| | 1,693 | | | | | Wal-Mart Stores, Inc.~ | | | 113,211 | |
| | 886 | | | | | Walgreens Boots Alliance, Inc. | | | 70,242 | |
| | 625 | | | | | Whole Foods Market, Inc. | | | 18,175 | |
| | | | | | | | | | |
| | | | | | | | | 1,562,354 | |
| | | | | | | | | | |
| | | | | | Energy (7.5%) | |
| | 398 | | | | | Anadarko Petroleum Corp.~ | | | 20,998 | |
| | 207 | | | | | Apache Corp. | | | 11,261 | |
| | 408 | | | | | Baker Hughes, Inc.~ | | | 19,731 | |
| | 1,748 | | | | | Chevron Corp.~ | | | 178,611 | |
| | 1,044 | | | | | ConocoPhillips~ | | | 49,893 | |
| | 527 | | | | | Devon Energy Corp. | | | 18,276 | |
| | 764 | | | | | EOG Resources, Inc. | | | 63,122 | |
| | 239 | | | | | EQT Corp. | | | 16,754 | |
| | 4,639 | | | | | Exxon Mobil Corp. | | | 410,088 | |
| | 807 | | | | | Halliburton Company | | | 33,337 | |
| | 83 | | | | | Helmerich & Payne, Inc. | | | 5,488 | |
| | 153 | | | | | Hess Corp.~ | | | 9,122 | |
| | 1,649 | | | | | Kinder Morgan, Inc. | | | 29,286 | |
| | 502 | | | | | Marathon Oil Corp. | | | 7,073 | |
| | 861 | | | | | Marathon Petroleum Corp. | | | 33,648 | |
| | 111 | | | | | Murphy Oil Corp. | | | 3,967 | |
| | 407 | | | | | National Oilwell Varco, Inc. | | | 14,668 | |
| | 586 | | | | | Noble Energy, Inc. | | | 21,160 | |
| | 680 | | | | | Occidental Petroleum Corp. | | | 52,122 | |
| | 668 | | | | | Phillips 66 | | | 54,849 | |
| | 1,185 | | | | | Schlumberger, Ltd. | | | 95,203 | |
| | 862 | | | | | Spectra Energy Corp. | | | 26,955 | |
| | 407 | | | | | Valero Energy Corp. | | | 23,960 | |
| | | | | | |
| See accompanying Notes to Schedule of Investments | | www.calamos.com | | | 137 | |
Hedged Equity Income Fund Schedule of Investments April 30, 2016 (Unaudited)
| | | | | | | | | | |
NUMBER OF
SHARES | | | | | | | VALUE | |
| | | | | | | | | | |
| | 327 | | | | | Williams Companies, Inc. | | $ | 6,341 | |
| | | | | | | | | | |
| | | | | | | | | 1,205,913 | |
| | | | | | | | | | |
| | | | | | Financials (15.1%) | |
| | 275 | | | | | Aflac, Inc.~ | | | 18,967 | |
| | 810 | | | | | Allstate Corp.~ | | | 52,691 | |
| | 1,595 | | | | | American Express Company~ | | | 104,361 | |
| | 1,493 | | | | | American International Group, Inc.~ | | | 83,339 | |
| | 339 | | | | | American Tower Corp.~ | | | 35,554 | |
| | 274 | | | | | Ameriprise Financial, Inc.~ | | | 26,277 | |
| | 104 | | | | | AvalonBay Communities, Inc.~ | | | 18,386 | |
| | 9,270 | | | | | Bank of America Corp.~ | | | 134,971 | |
| | 1,815 | | | | | Bank of New York Mellon Corp.~ | | | 73,036 | |
| | 769 | | | | | BB&T Corp.~ | | | 27,207 | |
| | 1,815 | | | | | Berkshire Hathaway, Inc. - Class B#~ | | | 264,046 | |
| | 108 | | | | | BlackRock, Inc.~ | | | 38,484 | |
| | 586 | | | | | Capital One Financial Corp. | | | 42,421 | |
| | 1,474 | | | | | Charles Schwab Corp. | | | 41,876 | |
| | 348 | | | | | Chubb Corp. | | | 41,015 | |
| | 2,636 | | | | | Citigroup, Inc.~ | | | 121,994 | |
| | 283 | | | | | Crown Castle International Corp. | | | 24,587 | |
| | 427 | | | | | Discover Financial Services | | | 24,027 | |
| | 306 | | | | | Equity Residential | | | 20,829 | |
| | 926 | | | | | Fifth Third Bancorp | | | 16,955 | |
| | 359 | | | | | Franklin Resources, Inc. | | | 13,405 | |
| | 390 | | | | | Goldman Sachs Group, Inc. | | | 64,003 | |
| | 380 | | | | | Hartford Financial Services Group, Inc. | | | 16,864 | |
| | 765 | | | | | Host Hotels & Resorts, Inc. | | | 12,102 | |
| | 630 | | | | | Invesco, Ltd. | | | 19,536 | |
| | 3,743 | | | | | JPMorgan Chase & Company~ | | | 236,558 | |
| | 640 | | | | | Lincoln National Corp. | | | 27,808 | |
| | 132 | | | | | Macerich Company | | | 10,043 | |
| | 1,420 | | | | | MetLife, Inc. | | | 64,042 | |
| | 1,225 | | | | | Morgan Stanley | | | 33,149 | |
| | 480 | | | | | PNC Financial Services Group, Inc. | | | 42,134 | |
| | 460 | | | | | Prologis, Inc. | | | 20,889 | |
| | 760 | | | | | Prudential Financial, Inc. | | | 59,006 | |
| | 130 | | | | | Public Storage | | | 31,825 | |
| | 1,599 | | | | | Regions Financial Corp. | | | 14,999 | |
| | 375 | | | | | Simon Property Group, Inc. | | | 75,439 | |
| | 366 | | | | | State Street Corp. | | | 22,802 | |
| | 503 | | | | | SunTrust Banks, Inc. | | | 20,995 | |
| | 807 | | | | | Synchrony Financial# | | | 24,670 | |
| | 229 | | | | | T. Rowe Price Group, Inc. | | | 17,241 | |
| | 233 | | | | | Travelers Companies, Inc. | | | 25,607 | |
| | 1,502 | | | | | US Bancorp~ | | | 64,120 | |
| | 275 | | | | | Ventas, Inc. | | | 17,083 | |
| | 253 | | | | | Vornado Realty Trust | | | 24,220 | |
| | | | | | | | | | |
NUMBER OF
SHARES | | | | | | | VALUE | |
| | | | | | | | | | |
| | 4,297 | | | | | Wells Fargo & Company~ | | $ | 214,764 | |
| | 283 | | | | | Welltower, Inc. | | | 19,646 | |
| | | | | | | | | | |
| | | | | | | | | 2,403,973 | |
| | | | | | | | | | |
| | | | | | Health Care (14.0%) | |
| | 1,188 | | | | | Abbott Laboratories~ | | | 46,213 | |
| | 1,858 | | | | | AbbVie, Inc.~ | | | 113,338 | |
| | 496 | | | | | Aetna, Inc.~ | | | 55,686 | |
| | 296 | | | | | Agilent Technologies, Inc.~ | | | 12,112 | |
| | 179 | | | | | Alexion Pharmaceuticals, Inc.#~ | | | 24,931 | |
| | 426 | | | | | Allergan, PLC# | | | 92,255 | |
| | 669 | | | | | Amgen, Inc.~ | | | 105,903 | |
| | 338 | | | | | Anthem, Inc.~ | | | 47,580 | |
| | 541 | | | | | Baxalta, Inc. | | | 22,695 | |
| | 541 | | | | | Baxter International, Inc.~ | | | 23,923 | |
| | 256 | | | | | Biogen, Inc.#~ | | | 70,397 | |
| | 1,275 | | | | | Bristol-Myers Squibb Company~ | | | 92,030 | |
| | 290 | | | | | Cardinal Health, Inc. | | | 22,753 | |
| | 703 | | | | | Celgene Corp.# | | | 72,697 | |
| | 439 | | | | | Cerner Corp.# | | | 24,645 | |
| | 340 | | | | | Cigna Corp. | | | 47,104 | |
| | 170 | | | | | DaVita HealthCare Partners, Inc.#~ | | | 12,563 | |
| | 232 | | | | | Edwards Lifesciences Corp.# | | | 24,641 | |
| | 817 | | | | | Eli Lilly and Company | | | 61,708 | |
| | 884 | | | | | Express Scripts Holding Company# | | | 65,177 | |
| | 1,438 | | | | | Gilead Sciences, Inc.~ | | | 126,846 | |
| | 100 | | | | | Illumina, Inc.# | | | 13,499 | |
| | 2,549 | | | | | Johnson & Johnson~ | | | 285,692 | |
| | 203 | | | | | Laboratory Corp. of America Holdings# | | | 25,440 | |
| | 972 | | | | | Medtronic, PLC | | | 76,934 | |
| | 3,127 | | | | | Merck & Company, Inc. | | | 171,485 | |
| | 365 | | | | | Mylan, NV# | | | 15,224 | |
| | 121 | | | | | Perrigo Company, PLC | | | 11,697 | |
| | 5,887 | | | | | Pfizer, Inc. | | | 192,564 | |
| | 127 | | | | | Quest Diagnostics, Inc. | | | 9,547 | |
| | 33 | | | | | Regeneron Pharmaceuticals, Inc.# | | | 12,431 | |
| | 296 | | | | | St. Jude Medical, Inc. | | | 22,555 | |
| | 376 | | | | | Stryker Corp. | | | 40,988 | |
| | 680 | | | | | Thermo Fisher Scientific, Inc. | | | 98,090 | |
| | 769 | | | | | UnitedHealth Group, Inc. | | | 101,262 | |
| | | | | | | | | | |
| | | | | | | | | 2,242,605 | |
| | | | | | | | | | |
| | | | | | Industrials (9.0%) | |
| | 459 | | | | | 3M Company | | | 76,827 | |
| | 840 | | | | | Boeing Company~ | | | 113,232 | |
| | 552 | | | | | Caterpillar, Inc. | | | 42,902 | |
| | 841 | | | | | CSX Corp. | | | 22,934 | |
| | 161 | | | | | Cummins, Inc. | | | 18,842 | |
| | | | |
| 138 | | CALAMOS OPEN-END FAMILY OF FUNDS SEMIANNUAL REPORT | | See accompanying Notes to Schedule of Investments |
Hedged Equity Income Fund Schedule of Investments April 30, 2016 (Unaudited)
| | | | | | | | | | |
NUMBER OF
SHARES | | | | | | | VALUE | |
| | | | | | | | | | |
| | 541 | | | | | Danaher Corp. | | $ | 52,342 | |
| | 615 | | | | | Deere & Company | | | 51,728 | |
| | 1,272 | | | | | Delta Air Lines, Inc. | | | 53,004 | |
| | 328 | | | | | Eaton Corp., PLC | | | 20,753 | |
| | 541 | | | | | Emerson Electric Company | | | 29,555 | |
| | 264 | | | | | Expeditors International of Washington, Inc.~ | | | 13,097 | |
| | 320 | | | | | FedEx Corp. | | | 52,835 | |
| | 277 | | | | | Fluor Corp. | | | 15,141 | |
| | 277 | | | | | General Dynamics Corp. | | | 38,924 | |
| | 8,307 | | | | | General Electric Company~ | | | 255,440 | |
| | 982 | | | | | Honeywell International, Inc. | | | 112,213 | |
| | 364 | | | | | Illinois Tool Works, Inc. | | | 38,045 | |
| | 197 | | | | | Jacobs Engineering Group, Inc.# | | | 8,782 | |
| | 98 | | | | | Kansas City Southern | | | 9,286 | |
| | 76 | | | | | L-3 Communications Holdings, Inc. | | | 9,996 | |
| | 237 | | | | | Lockheed Martin Corp. | | | 55,074 | |
| | 586 | | | | | Masco Corp. | | | 17,996 | |
| | 240 | | | | | Norfolk Southern Corp. | | | 21,626 | |
| | 296 | | | | | Pentair, PLC | | | 17,192 | |
| | 211 | | | | | Robert Half International, Inc. | | | 8,083 | |
| | 1,293 | | | | | Southwest Airlines Company | | | 57,681 | |
| | 726 | | | | | Union Pacific Corp. | | | 63,329 | |
| | 747 | | | | | United Parcel Service, Inc. - Class B | | | 78,487 | |
| | 849 | | | | | United Technologies Corp. | | | 88,610 | |
| | | | | | | | | | |
| | | | | | | | | 1,443,956 | |
| | | | | | | | | | |
| | | | | | Information Technology (20.3%) | |
| | 497 | | | | | Accenture, PLC - Class A | | | 56,121 | |
| | 336 | | | | | Akamai Technologies, Inc.#~ | | | 17,133 | |
| | 247 | | | | | Alphabet, Inc. - Class A#~ | | | 174,846 | |
| | 247 | | | | | Alphabet, Inc. - Class C# | | | 171,173 | |
| | 337 | | | | | Amphenol Corp. - Class A~ | | | 18,815 | |
| | 6,278 | | | | | Apple, Inc. | | | 588,500 | |
| | 1,348 | | | | | Applied Materials, Inc.~ | | | 27,594 | |
| | 491 | | | | | Broadcom, Ltd. | | | 71,563 | |
| | 4,312 | | | | | Cisco Systems, Inc.~ | | | 118,537 | |
| | 638 | | | | | Cognizant Technology Solutions Corp. - Class A# | | | 37,240 | |
| | 963 | | | | | eBay, Inc.# | | | 23,526 | |
| | 1,726 | | | | | EMC Corp.~ | | | 45,066 | |
| | 189 | | | | | F5 Networks, Inc.# | | | 19,798 | |
| | 2,263 | | | | | Facebook, Inc. - Class A# | | | 266,083 | |
| | 541 | | | | | Fiserv, Inc.# | | | 52,866 | |
| | 2,050 | | | | | Hewlett Packard Enterprise Company~ | | | 34,153 | |
| | 2,050 | | | | | HP, Inc. | | | 25,153 | |
| | 5,242 | | | | | Intel Corp.~ | | | 158,728 | |
| | | | | | | | | | |
NUMBER OF
SHARES | | | | | | | VALUE | |
| | | | | | | | | | |
| | 888 | | | | | International Business Machines Corp.~ | | $ | 129,595 | |
| | 607 | | | | | Juniper Networks, Inc. | | | 14,204 | |
| | 1,425 | | | | | MasterCard, Inc. - Class A~ | | | 138,211 | |
| | 335 | | | | | Microchip Technology, Inc. | | | 16,278 | |
| | 1,159 | | | | | Micron Technology, Inc.# | | | 12,459 | |
| | 8,348 | | | | | Microsoft Corp. | | | 416,315 | |
| | 3,129 | | | | | Oracle Corp.~ | | | 124,722 | |
| | 963 | | | | | PayPal Holdings, Inc.# | | | 37,730 | |
| | 1,775 | | | | | QUALCOMM, Inc.~ | | | 89,673 | |
| | 170 | | | | | Red Hat, Inc.#~ | | | 12,473 | |
| | 715 | | | | | Symantec Corp. | | | 11,901 | |
| | 471 | | | | | TE Connectivity, Ltd. | | | 28,015 | |
| | 169 | | | | | Teradata Corp.# | | | 4,276 | |
| | 1,091 | | | | | Texas Instruments, Inc. | | | 62,231 | |
| | 2,572 | | | | | Visa, Inc. - Class A~ | | | 198,661 | |
| | 383 | | | | | Western Digital Corp. | | | 15,651 | |
| | 676 | | | | | Yahoo!, Inc.# | | | 24,742 | |
| | | | | | | | | | |
| | | | | | | | | 3,244,032 | |
| | | | | | | | | | |
| | | | | | Materials (2.8%) | |
| | 235 | | | | | Air Products & Chemicals, Inc.~ | | | 34,284 | |
| | 55 | | | | | Airgas, Inc.~ | | | 7,834 | |
| | 379 | | | | | CF Industries Holdings, Inc. | | | 12,533 | |
| | 1,452 | | | | | Dow Chemical Company | | | 76,390 | |
| | 890 | | | | | E.I. du Pont de Nemours and Company | | | 58,660 | |
| | 84 | | | | | Eastman Chemical Company | | | 6,416 | |
| | 1,472 | | | | | Freeport-McMoRan, Inc. | | | 20,608 | |
| | 452 | | | | | LyondellBasell Industries, NV - Class A | | | 37,367 | |
| | 787 | | | | | Monsanto Company | | | 73,726 | |
| | 634 | | | | | Mosaic Company | | | 17,746 | |
| | 703 | | | | | Newmont Mining Corp. | | | 24,584 | |
| | 294 | | | | | PPG Industries, Inc. | | | 32,455 | |
| | 320 | | | | | Praxair, Inc. | | | 37,587 | |
| | | | | | | | | | |
| | | | | | | | | 440,190 | |
| | | | | | | | | | |
| | | | | | Telecommunication Services (2.8%) | |
| | 6,271 | | | | | AT&T, Inc.~ | | | 243,440 | |
| | 855 | | | | | CenturyLink, Inc. | | | 26,462 | |
| | 3,542 | | | | | Verizon Communications, Inc. | | | 180,430 | |
| | | | | | | | | | |
| | | | | | | | | 450,332 | |
| | | | | | | | | | |
| | | | | | Utilities (3.4%) | |
| | 883 | | | | | AES Corp.~ | | | 9,854 | |
| | 570 | | | | | American Electric Power Company, Inc.~ | | | 36,195 | |
| | 460 | | | | | CMS Energy Corp.~ | | | 18,713 | |
| | 337 | | | | | Consolidated Edison, Inc. | | | 25,140 | |
| | 408 | | | | | Dominion Resources, Inc. | | | 29,160 | |
| | 1,135 | | | | | Duke Energy Corp. | | | 89,415 | |
| | | | | | |
| See accompanying Notes to Schedule of Investments | | www.calamos.com | | | 139 | |
Hedged Equity Income Fund Schedule of Investments April 30, 2016 (Unaudited)
| | | | | | | | | | |
NUMBER OF
SHARES | | | | | | | VALUE | |
| | | | | | | | | | |
| | 421 | | | | | Edison International | | $ | 29,769 | |
| | 203 | | | | | Entergy Corp. | | | 15,262 | |
| | 170 | | | | | Eversource Energy | | | 9,595 | |
| | 586 | | | | | Exelon Corp. | | | 20,563 | |
| | 421 | | | | | FirstEnergy Corp. | | | 13,720 | |
| | 692 | | | | | NextEra Energy, Inc. | | | 81,365 | |
| | 503 | | | | | PG&E Corp. | | | 29,275 | |
| | 421 | | | | | PPL Corp. | | | 15,847 | |
| | 503 | | | | | Public Service Enterprise Group, Inc. | | | 23,203 | |
| | 1,461 | | | | | Southern Company | | | 73,196 | |
| | 381 | | | | | Xcel Energy, Inc. | | | 15,251 | |
| | | | | | | | | | |
| | | | | | | | | 535,523 | |
| | | | | | | | | | |
| | | | | | TOTAL COMMON STOCKS
(Cost $15,420,357) | | | 15,443,296 | |
| | | | | | | | | | |
| | EXCHANGE-TRADED FUND (2.9%) | |
| | | | | | Other (2.9%) | |
| | 2,272 | | | | | SPDR S&P 500 ETF Trust (Cost $455,379) | | | 468,713 | |
| | | | | | | | | | |
NUMBER OF
CONTRACTS | | | | | | | VALUE | |
| | PURCHASED OPTIONS (1.6%) # | |
| | | | | | Other (1.6%) | | | | |
| | | | | | S&P 500 Index | | | | |
| | 13 | | | | | Call, 05/06/16, Strike $2,120.00 | | | 520 | |
| | 12 | | | | | Put, 05/13/16, Strike $2,035.00 | | | 15,420 | |
| | 12 | | | | | Put, 05/31/16, Strike $1,975.00 | | | 13,860 | |
| | 9 | | | | | Put, 05/06/16, Strike $2,040.00 | | | 6,930 | |
| | 9 | | | | | Put, 05/31/16, Strike $2,000.00 | | | 14,040 | |
| | 8 | | | | | Put, 05/20/16, Strike $2,025.00 | | | 12,240 | |
| | 8 | | | | | Call, 12/30/16, Strike $2,000.00 | | | 112,360 | |
| | 6 | | | | | Put, 12/30/16, Strike $1,900.00 | | | 41,190 | |
| | 4 | | | | | Put, 12/16/16, Strike $2,000.00 | | | 37,180 | |
| | | | | | | | | | |
| | | | | | TOTAL PURCHASED OPTIONS
(Cost $318,546) | | | 253,740 | |
| | | | | | | | | | |
NUMBER OF
SHARES | | | | | | | VALUE | |
| | | | | | | | | | |
| | SHORT TERM INVESTMENT (2.7%) | |
| | 425,932 | | | | | Fidelity Prime Money Market Fund - Institutional Class
(Cost $425,932) | | | 425,932 | |
| | | | | | | | | | |
| TOTAL INVESTMENTS (103.9%)
(Cost $16,620,214) | | | 16,591,681 | |
| | | | | | | | | | |
| |
| | LIABILITIES, LESS OTHER ASSETS (-3.9%) | | | (623,722 | ) |
| | | | | | | | | | |
| |
| | NET ASSETS (100.0%) | | $ | 15,967,959 | |
| | | | | | | | | | |
| | | | | | | | | | |
NUMBER OF
CONTRACTS | | | | | | | VALUE | |
| | | | | | | | | | |
| | WRITTEN OPTIONS (-2.8%) # | |
| | | | | | Consumer Discretionary (0.0%) | | | | |
| | 4 | | | | | Netflix, Inc.
Put, 08/19/16, Strike $85.00 | | $ | (2,400 | ) |
| | | | | | | | | | |
| | | | | | Energy (0.0%) | | | | |
| | 5 | | | | | EOG Resources, Inc.
Call, 05/06/16, Strike $83.00 | | | (960 | ) |
| | | | | | | | | | |
| | | | | | Health Care (-0.1%) | | | | |
| | 3 | | | | | Allergan, PLC
Put, 11/18/16, Strike $240.00 | | | (10,290 | ) |
| | | | | | | | | | |
| | | | | | Other (-2.7%) | | | | |
| | | | | | S&P 500 Index | | | | |
| | 18 | | | | | Call, 05/31/16, Strike $2,050.00 | | | (70,920 | ) |
| | 16 | | | | | Call, 12/30/16, Strike $2,100.00 | | | (128,160 | ) |
| | 13 | | | | | Call, 05/31/16, Strike $2,000.00 | | | (99,255 | ) |
| | 12 | | | | | Put, 12/30/16, Strike $1,675.00 | | | (37,800 | ) |
| | 11 | | | | | Call, 12/16/16, Strike $2,150.00 | | | (57,695 | ) |
| | 9 | | | | | Put, 05/06/16, Strike $1,960.00 | | | (743 | ) |
| | 9 | | | | | Put, 05/31/16, Strike $1,900.00 | | | (4,455 | ) |
| | 9 | | | | | Call, 08/31/16, Strike $2,125.00 | | | (32,040 | ) |
| | | | | | | | | | |
| | | | | | | | | (431,068 | ) |
| | | | | | | | | | |
| | | | | | TOTAL WRITTEN OPTIONS
(Premium $462,532) | | | (444,718 | ) |
| | | | | | | | | | |
NOTES TO SCHEDULE OF INVESTMENTS
| # | Non-income producing security. |
| ~ | Security, or portion of security, is segregated as collateral (or potential collateral for future transactions) for written options. The aggregate value of such securities is $3,537,143. |
Note: The date on options represents the expiration date of the option contract. The option contract may be exercised at any date on or before the date shown.
| | | | |
| 140 | | CALAMOS OPEN-END FAMILY OF FUNDS SEMIANNUAL REPORT | | See accompanying Notes to Financial Statements |
Phineus Long/Short Fund Schedule of Investments April 30, 2016 (Unaudited)
| | | | | | | | | | |
NUMBER OF
SHARES | | | | | | | VALUE | |
| | | | | | | | | | |
| | COMMON STOCKS (50.9%) | |
| | | | | | Consumer Discretionary (4.8%) | | | | |
| | 1,750 | | | JPY | | Kadokawa Dwango#~ | | $ | 25,856 | |
| | 367 | | | | | Priceline Group, Inc.#~ | | | 493,123 | |
| | 2,935 | | | | | Wayfair, Inc.#~ | | | 110,796 | |
| | | | | | | | | | |
| | | | | | | | | 629,775 | |
| | | | | | | | | | |
| | | | | | Energy (5.5%) | |
| | 2,243 | | | | | Exxon Mobil Corp.~ | | | 198,281 | |
| | 7,092 | | | | | Gulfport Energy Corp.#~ | | | 221,980 | |
| | 3,729 | | | GBP | | Royal Dutch Shell, PLC - Class A~ | | | 97,674 | |
| | 3,967 | | | | | TOTAL, SA~ | | | 201,325 | |
| | | | | | | | | | |
| | | | | | | | | 719,260 | |
| | | | | | | | | | |
| | | | | | Financials (26.6%) | | | | |
| | 4,728 | | | | | American Express Company | | | 309,353 | |
| | 29,606 | | | | | Bank of America Corp.~ | | | 431,064 | |
| | 13,007 | | | | | Blackstone Group, LP~ | | | 356,912 | |
| | 23 | | | | | Capital One Financial Corp.~ | | | 1,665 | |
| | 11,457 | | | | | CBRE Group, Inc.#~ | | | 339,471 | |
| | 8,444 | | | | | Citigroup, Inc.~ | | | 390,788 | |
| | 3,512 | | | | | Discover Financial Services~ | | | 197,620 | |
| | 2,651 | | | | | Goldman Sachs Group, Inc.~ | | | 435,056 | |
| | 9,941 | | | EUR | | ING Groep, NV~ | | | 121,811 | |
| | 26,373 | | | | | KKR & Co., LP~ | | | 358,673 | |
| | 16,018 | | | | | Morgan Stanley~ | | | 433,447 | |
| | 1,039 | | | | | S&P Global, Inc.~ | | | 111,017 | |
| | | | | | | | | | |
| | | | | | | | | 3,486,877 | |
| | | | | | | | | | |
| | | | | | Industrials (6.0%) | | | | |
| | 6,963 | | | | | Air Lease Corp. | | | 212,232 | |
| | 9,148 | | | | | American Airlines Group, Inc. | | | 317,344 | |
| | 5,454 | | | | | United Continental Holdings, Inc.# | | | 249,848 | |
| | | | | | | | | | |
| | | | | | | | | 779,424 | |
| | | | | | | | | | |
| | | | | | Information Technology (8.0%) | | | | |
| | 1,901 | | | | | Baidu, Inc.# | | | 369,364 | |
| | 7,915 | | | | | PayPal Holdings, Inc.# | | | 310,110 | |
| | 7,209 | | | | | QUALCOMM, Inc.~ | | | 364,199 | |
| | | | | | | | | | |
| | | | | | | | | 1,043,673 | |
| | | | | | | | | | |
| | | | | | TOTAL COMMON STOCKS
(Cost $6,627,022) | | | 6,659,009 | |
| | | | | | | | | | |
| | EXCHANGE-TRADED FUND (29.5%) | |
| | | | | | Other (29.5%) | | | | |
| | 134,590 | | | | | Global X MSCI Greece ETF~ | | | 1,056,531 | |
| | 22,643 | | | | | iShares MSCI Emerging Markets ETF~ | | | 778,693 | |
| | 22,947 | | | | | iShares MSCI India ETF~ | | | 620,946 | |
| | 15,647 | | | | | VanEck Vectors Vietnam ETF~ | | | 225,630 | |
| | 23,785 | | | | | Vanguard FTSE Europe ETF~ | | | 1,185,920 | |
| | | | | | | | | | |
| | | | | | | | | 3,867,720 | |
| | | | | | | | | | |
| | | | | | TOTAL EXCHANGE-TRADED FUNDS
(Cost $3,782,474) | | | 3,867,720 | |
| | | | | | | | | | |
| | | | | | | | | | |
NUMBER OF
CONTRACTS | | | | | | | VALUE | |
| | | | | | | | | | |
| | PURCHASED OPTIONS (0.3%) # | |
| | | | | | Consumer Discretionary (0.1%) | | | | |
| | 38 | | | | | TripAdvisor, Inc.
Call, 05/06/16, Strike $67.00 | | $ | 11,115 | |
| | | | | | | | | | |
| | | | | | Other (0.2%) | | | | |
| | 182 | | | | | Energy Select Sector SPDR Fund
Call, 05/20/16, Strike $68.00 | | | 23,842 | |
| | 74 | | | | | iShares 20+ Year Treasury Bond
Call, 05/06/16, Strike $131.50 | | | 1,517 | |
| | | | | | | | | | |
| | | | | | | | | 25,359 | |
| | | | | | | | | | |
| | | | | | TOTAL PURCHASED OPTIONS
(Cost $51,687) | | | 36,474 | |
| | | | | | | | | | |
NUMBER OF
SHARES | | | | | | | VALUE | |
| | SHORT TERM INVESTMENT (28.6%) | |
| | 3,745,511 | | | | | Fidelity Prime Money Market Fund - Institutional Class
(Cost $3,745,511) | | | 3,745,511 | |
| | | | | | | | | | |
| TOTAL INVESTMENTS (109.3%)
(Cost $14,206,694) | | | 14,308,714 | |
| | | | | | | | | | |
| |
| | LIABILITIES, LESS OTHER ASSETS (-9.3%) | | | (1,214,943 | ) |
| | | | | | | | | | |
| |
| | NET ASSETS (100.0%) | | $ | 13,093,771 | |
| | | | | | | | | | |
| | COMMON STOCKS SOLD SHORT (-3.4%) # | |
| | | | | | Consumer Staples (-2.2%) | | | | |
| | (3,975 | ) | | | | Colgate-Palmolive Company | | | (281,907 | ) |
| | | | | | | | | | |
| | | | | | Health Care (-1.2%) | | | | |
| | (2,860 | ) | | | | Merck & Company, Inc. | | | (156,843 | ) |
| | | | | | | | | | |
| | | | | | TOTAL COMMON STOCKS
SOLD SHORT
(Proceeds $440,341) | | | (438,750 | ) |
| | | | | | | | | | |
| | EXCHANGE-TRADED FUNDS SOLD SHORT (-43.0%) # | |
| | | | | | Other (-43.0%) | | | | |
| | (8,546 | ) | | | | Health Care Select Sector SPDR Fund | | | (596,425 | ) |
| | (9,263 | ) | | | | iShares 20+ Year Treasury Bond ETF | | | (1,198,447 | ) |
| | (18,607 | ) | | | | SPDR S&P 500 ETF Trust | | | (3,838,624 | ) |
| | | | | | | | | | |
| | | | | | TOTAL EXCHANGE-TRADED FUNDS SOLD SHORT
(Proceeds $5,654,576) | | | (5,633,496 | ) |
| | | | | | | | | | |
NUMBER OF
CONTRACTS | | | | | | | VALUE | |
| | WRITTEN OPTIONS (-0.3%) # | |
| | | | | | Consumer Staples (0.0%) | | | | |
| | 6 | | | | | Anheuser-Busch InBev, SA
Call, 05/20/16, Strike $125.00 | | | (1,920 | ) |
| | | | | | |
| See accompanying Notes to Schedule of Investments | | www.calamos.com | | | 141 | |
Phineus Long/Short Fund Schedule of Investments April 30, 2016 (Unaudited)
| | | | | | | | | | |
| NUMBER OF
CONTRACTS |
| | | | | | | VALUE | |
| | | | | | | | | | |
| | | | | | | | | | |
| | | | | | Energy (-0.1%) | | | | |
| | 39 | | | | | TOTAL, SA
Call, 05/20/16, Strike $50.00 | | $ | (5,948 | ) |
| | | | | | | | | | |
| | | | | | Financials (0.0%) | | | | |
| | 52 | | | | | Capital One Financial Corp.
Put, 05/06/16, Strike $71.00 | | | (2,470 | ) |
| | | | | | | | | | |
| | | | | | Other (-0.2%) | | | | |
| | 182 | | | | | Energy Select Sector SPDR Fund
Call, 05/06/16, Strike $67.00 | | | (22,659 | ) |
| | | | | | | | | | |
| | | | | | TOTAL WRITTEN OPTIONS (Premium $26,592) | | | (32,997 | ) |
| | | | | | | | | | |
NOTES TO SCHEDULE OF INVESTMENTS
| # | Non-income producing security. |
| ~ | Security, or portion of security, is segregated as collateral (or potential collateral for future transactions) for written options. The aggregate value of such securities is $4,259,746. |
| | |
| FOREIGN CURRENCY ABBREVIATION |
| EUR | | European Monetary Unit |
| GBP | | British Pound Sterling |
| JPY | | Japanese Yen |
Note: Value for securities denominated in foreign currencies is shown in U.S. dollars. The date on options represents the expiration date of the option contract. The option contract may be exercised at any date on or before the date shown.
| | | | |
| 142 | | CALAMOS OPEN-END FAMILY OF FUNDS SEMIANNUAL REPORT | | See accompanying Notes to Financial Statements |
Long/Short Fund Schedule of Investments April 30, 2016 (Unaudited)
| | | | | | | | | | |
NUMBER OF
SHARES | | | | | | | VALUE | |
| | | | | | | | | | |
| | COMMON STOCKS (75.0%) | |
| | | | | | Consumer Discretionary (7.0%) | |
| | 1,337 | | | | | Priceline Group, Inc.#~ | | $ | 1,796,473 | |
| | 52,952 | | | | | PulteGroup, Inc.~ | | | 973,787 | |
| | 10,650 | | | | | Wayfair, Inc.# | | | 402,038 | |
| | | | | | | | | | |
| | | | | | | | | 3,172,298 | |
| | | | | | | | | | |
| | | | | | Energy (7.6%) | |
| | 10,688 | | | | | Exxon Mobil Corp. | | | 944,819 | |
| | 34,335 | | | | | Gulfport Energy Corp.#~ | | | 1,074,686 | |
| | 8,888 | | | | | Royal Dutch Shell, PLC~ | | | 470,086 | |
| | 18,908 | | | | | TOTAL, SA~ | | | 959,581 | |
| | | | | | | | | | |
| | | | | | | | | 3,449,172 | |
| | | | | | | | | | |
| | | | | | Financials (34.7%) | |
| | 17,292 | | | | | American Express Company | | | 1,131,416 | |
| | 114,857 | | | | | Bank of America Corp. | | | 1,672,318 | |
| | 50,417 | | | | | Blackstone Group, LP | | | 1,383,442 | |
| | 47 | | | | | Capital One Financial Corp. | | | 3,402 | |
| | 56,960 | | | | | CBRE Group, Inc.# | | | 1,687,725 | |
| | 33,417 | | | | | Citigroup, Inc. | | | 1,546,539 | |
| | 23,711 | | | | | Discover Financial Services~ | | | 1,334,218 | |
| | 10,939 | | | | | Goldman Sachs Group, Inc.~ | | | 1,795,199 | |
| | 27,489 | | | | | JPMorgan Chase & Company~ | | | 1,737,305 | |
| | 98,393 | | | | | KKR & Co., LP~ | | | 1,338,145 | |
| | 62,010 | | | | | Morgan Stanley~ | | | 1,677,991 | |
| | 4,911 | | | | | S&P Global, Inc. | | | 524,740 | |
| | | | | | | | | | |
| | | | | | | | | 15,832,440 | |
| | | | | | | | | | |
| | | | | | Health Care (6.8%) | |
| | 16,739 | | | | | Cerner Corp.# | | | 939,728 | |
| | 7,319 | | | | | Laboratory Corp. of America Holdings#~ | | | 917,217 | |
| | 15,874 | | | | | Medtronic, PLC~ | | | 1,256,427 | |
| | | | | | | | | | |
| | | | | | | | | 3,113,372 | |
| | | | | | | | | | |
| | | | | | Industrials (4.8%) | |
| | 34,843 | | | | | American Airlines Group, Inc. | | | 1,208,704 | |
| | 20,981 | | | | | United Continental Holdings, Inc.# | | | 961,139 | |
| | | | | | | | | | |
| | | | | | | | | 2,169,843 | |
| | | | | | | | | | |
| | | | | | Information Technology (14.1%) | |
| | 14,282 | | | | | Apple, Inc. | | | 1,338,795 | |
| | 7,290 | | | | | Baidu, Inc.# | | | 1,416,447 | |
| | 19,982 | | | | | Cisco Systems, Inc. | | | 549,305 | |
| | 67 | | | | | Facebook, Inc. - Class A# | | | 7,878 | |
| | 13,222 | | | | | IAC/InterActiveCorp~ | | | 612,707 | |
| | 29,380 | | | | | PayPal Holdings, Inc.#~ | | | 1,151,108 | |
| | 26,617 | | | | | QUALCOMM, Inc.~ | | | 1,344,691 | |
| | | | | | | | | | |
| | | | | | | | | 6,420,931 | |
| | | | | | | | | | |
| | | | | | TOTAL COMMON STOCKS
(Cost $34,392,969) | | | 34,158,056 | |
| | | | | | | | | | |
| | | | | | | | | | |
NUMBER OF
SHARES | | | | | | | VALUE | |
| | | | | | | | | | |
| | EXCHANGE-TRADED FUND (10.8%) | |
| | | | | | Consumer Discretionary (5.6%) | |
| | 322,354 | | | | | Global X MSCI Greece ETF | | $ | 2,530,479 | |
| | | | | | | | | | |
| | | | | | Other (5.2%) | |
| | 47,629 | | | | | Vanguard FTSE Europe ETF~ | | | 2,374,782 | |
| | | | | | | | | | |
| | | | | | TOTAL EXCHANGE-TRADED FUNDS
(Cost $5,387,788) | | | 4,905,261 | |
| | | | | | | | | | |
NUMBER OF
CONTRACTS | | | | | | | VALUE | |
| | | | | | | | | | |
| | PURCHASED OPTIONS (0.3%) # | |
| | | | | | Consumer Discretionary (0.1%) | |
| | 144 | | | | | TripAdvisor, Inc.
Call, 05/06/16, Strike $67.00 | | | 42,120 | |
| | | | | | | | | | |
| | | | | | Information Technology (0.0%) | |
| | 119 | | | | | Facebook, Inc.
Put, 05/20/16, Strike $100.00 | | | 1,309 | |
| | | | | | | | | | |
| | | | | | Other (0.2%) | |
| | 680 | | | | | Energy Select Sector SPDR Fund
Call, 05/20/16, Strike $68.00 | | | 89,080 | |
| | 354 | | | | | iShares 20+ Year Treasury Bond
Call, 05/06/16, Strike $131.50 | | | 7,257 | |
| | | | | | | | | | |
| | | | | | | | | 96,337 | |
| | | | | | | | | | |
| | | | | | TOTAL PURCHASED OPTIONS
(Cost $226,656) | | | 139,766 | |
| | | | | | | | | | |
NUMBER OF
SHARES | | | | | | | VALUE | |
| | | | | | | | | | |
| | SHORT TERM INVESTMENT (8.8%) | |
| | 4,032,399 | | | | | Fidelity Prime Money Market Fund - Institutional Class
(Cost $4,032,399) | | | 4,032,399 | |
| | | | | | | | | | |
| TOTAL INVESTMENTS (94.9%)
(Cost $44,039,812) | | | 43,235,482 | |
| | | | | | | | | | |
| |
| | OTHER ASSETS, LESS LIABILITIES (5.1%) | | | 2,334,380 | |
| | | | | | | | | | |
| |
| | NET ASSETS (100.0%) | | $ | 45,569,862 | |
| | | | | | | | | | |
NUMBER OF
SHARES | | | | | | | VALUE | |
| | | | | | | | | | |
| | COMMON STOCKS SOLD SHORT (-20.2%) # | |
| | | | | | Consumer Discretionary (-2.3%) | |
| | (12,602 | ) | | | | Omnicom Group, Inc. | | | (1,045,588 | ) |
| | | | | | | | | | |
| | | | | | Consumer Staples (-2.9%) | |
| | (18,361 | ) | | | | Colgate-Palmolive Company | | | (1,302,162 | ) |
| | | | | | | | | | |
| | | | | | Financials (-1.8%) | | | | |
| | (13,635 | ) | | | | NASDAQ, Inc. | | | (841,416 | ) |
| | | | | | | | | | |
| | | | | | |
| See accompanying Notes to Schedule of Investments | | www.calamos.com | | | 143 | |
Long/Short Fund Schedule of Investments April 30, 2016 (Unaudited)
| | | | | | | | | | |
NUMBER OF
SHARES | | | | | | | VALUE | |
| | | | | | | | | | |
| | | | | | Health Care (-3.5%) | |
| | (11,190 | ) | | | | Merck & Company, Inc. | | $ | (613,660 | ) |
| | (9,401 | ) | | DKK | | William Demant Holding, A/S | | | (966,700 | ) |
| | | | | | | | | | |
| | | | | | | | | (1,580,360 | ) |
| | | | | | | | | | |
| | | | | | Industrials (-4.8%) | |
| | (14,466 | ) | | | | Deluxe Corp. | | | (908,175 | ) |
| | (24,961 | ) | | | | Nielsen Holdings, PLC | | | (1,301,467 | ) |
| | | | | | | | | | |
| | | | | | | | | (2,209,642 | ) |
| | | | | | | | | | |
| | | | | | Information Technology (-2.6%) | |
| | (59,487 | ) | | | | Western Union Company | | | (1,189,740 | ) |
| | | | | | | | | | |
| | | | | | Telecommunication Services (-2.3%) | | | | |
| | (26,443 | ) | | | | AT&T, Inc. | | | (1,026,517 | ) |
| | | | | | | | | | |
| | | |
| | | | | | TOTAL COMMON STOCKS SOLD SHORT
(Proceeds $7,775,357) | | | (9,195,425 | ) |
| | | | | | | | | | |
| | EXCHANGE-TRADED FUNDS SOLD SHORT (-31.3%) # | |
| | | | | | Other (-31.3%) | | | | |
| | (51,002 | ) | | | | Consumer Staples Select Sector
SPDR Fund | | | (2,667,405 | ) |
| | (39,380 | ) | | | | Health Care Select Sector SPDR Fund | | | (2,748,330 | ) |
| | (17,070 | ) | | | | iShares 20+ Year Treasury Bond ETF | | | (2,208,517 | ) |
| | (9,000 | ) | | | | PowerShares QQQ | | | (951,480 | ) |
| | (13,000 | ) | | | | SPDR S&P 500 ETF Trust | | | (2,681,900 | ) |
| | (1,756 | ) | | | | SPDR S&P MidCap 400 ETF Trust | | | (466,832 | ) |
| | (21,438 | ) | | | | Technology Select Sector SPDR Fund | | | (903,183 | ) |
| | (34,107 | ) | | | | Utilities Select Sector SPDR Fund | | | (1,651,461 | ) |
| | | | | | | | | | |
| | | |
| | | | | | TOTAL EXCHANGE-TRADED FUNDS SOLD SHORT
(Proceeds $13,865,108) | | | (14,279,108 | ) |
| | | | | | | | | | |
NUMBER OF
CONTRACTS | | | | | | | VALUE | |
| | | | | | | | | | |
| | WRITTEN OPTIONS (-0.3%) # | |
| | | | | | Consumer Staples (0.0%) | | | | |
| | 36 | | | | | Anheuser-Busch InBev, SA
Call, 05/20/16, Strike $125.00 | | | (11,520 | ) |
| | | | | | | | | | |
| | | | | | Energy (-0.1%) | | | | |
| | 189 | | | | | TOTAL, SA
Call, 05/20/16, Strike $50.00 | | | (28,823 | ) |
| | | | | | | | | | |
| | | | | | Financials (0.0%) | | | | |
| | 192 | | | | | Capital One Financial Corp.
Put, 05/06/16, Strike $71.00 | | | (9,120 | ) |
| | | | | | | | | | |
| | | | | | Information Technology (0.0%) | | | | |
| | 119 | | | | | Facebook, Inc.
Put, 05/20/16, Strike $92.50 | | | (476 | ) |
| | | | | | | | | | |
| | | | | | | | | | |
NUMBER OF
CONTRACTS | | | | | | | VALUE | |
| | | | | | Other (-0.2%) | | | | |
| | 680 | | | | | Energy Select Sector SPDR Fund
Call, 05/06/16, Strike $67.00 | | $ | (84,660 | ) |
| | | | | | | | | | |
| | | |
| | | | | | TOTAL WRITTEN OPTIONS
(Premium $114,415) | | | (134,599 | ) |
| | | | | | | | | | |
NOTES TO SCHEDULE OF INVESTMENTS
| # | Non-income producing security. |
| ~ | Security, or portion of security, is segregated as collateral (or potential collateral for future transactions) for written options. The aggregate value of such securities is $6,718,314. |
| | |
| FOREIGN CURRENCY ABBREVIATION |
| DKK | | Danish Krone |
Note: Value for securities denominated in foreign currencies is shown in U.S. dollars. The date on options represents the expiration date of the option contract. The option contract may be exercised at any date on or before the date shown.
| | | | |
| 144 | | CALAMOS OPEN-END FAMILY OF FUNDS SEMIANNUAL REPORT | | See accompanying Notes to Financial Statements |
Statements of Assets and Liabilities April 30, 2016 (Unaudited)
| | | | | | | | | | | | | | | | | | | | |
| | | GROWTH
FUND | | | OPPORTUNISTIC
VALUE FUND | | | FOCUS GROWTH
FUND | | | DISCOVERY
GROWTH FUND | | | DIVIDEND
GROWTH FUND | |
ASSETS | | | | | | | | | | | | | | | | | | | | |
Investments in securities, at cost | | $ | 1,944,246,829 | | | $ | 61,557,116 | | | $ | 48,329,839 | | | $ | 16,326,049 | | | $ | 35,627,710 | |
Investment in securities, at value | | $ | 2,184,612,360 | | | $ | 62,147,165 | | | $ | 51,570,842 | | | $ | 16,421,524 | | | $ | 36,696,827 | |
Cash with custodian (interest bearing) | | | — | | | | — | | | | — | | | | — | | | | — | |
Restricted cash for short positions (interest bearing) | | | — | | | | — | | | | — | | | | — | | | | — | |
Due from investment advisor | | | — | | | | 22,206 | | | | 26,599 | | | | 13,469 | | | | 14,308 | |
Restricted foreign currency for short positions (cost $-) | | | — | | | | — | | | | — | | | | — | | | | — | |
Foreign currency (cost $-) | | | — | | | | — | | | | — | | | | — | | | | — | |
Unrealized appreciation on forward foreign currency contracts | | | — | | | | — | | | | — | | | | — | | | | — | |
Receivables: | | | | | | | | | | | | | | | | | | | | |
Accrued interest and dividends | | | 1,424,854 | | | | 59,135 | | | | 37,473 | | | | 3,462 | | | | 36,149 | |
Investments sold | | | 28,925,037 | | | | 290,466 | | | | 501,916 | | | | 206,484 | | | | — | |
Fund shares sold | | | 1,013,485 | | | | 5,486 | | | | 7,905 | | | | 2,543 | | | | 2,355 | |
Prepaid expenses | | | 126,621 | | | | 38,457 | | | | 38,784 | | | | 20,405 | | | | 39,627 | |
Deferred offering costs | | | — | | | | — | | | | — | | | | — | | | | — | |
Other assets | | | 664,927 | | | | 92,400 | | | | 85,856 | | | | 40,348 | | | | 12,683 | |
Total assets | | | 2,216,767,284 | | | | 62,655,315 | | | | 52,269,375 | | | | 16,708,235 | | | | 36,801,949 | |
LIABILITIES | | | | | | | | | | | | | | | | | | | | |
Collateral for securities loaned | | | 40,836,861 | | | | 488,350 | | | | 855,600 | | | | 873,575 | | | | — | |
Securities sold short, at value (proceeds $-) | | | — | | | | — | | | | — | | | | — | | | | — | |
Options written, at value (premium $-) | | | — | | | | — | | | | — | | | | — | | | | — | |
Unrealized depreciation on forward foreign currency contracts | | | 322,667 | | | | — | | | | 11,078 | | | | — | | | | — | |
Payables: | | | | | | | | | | | | | | | | | | | | |
Investments purchased | | | 32,467,041 | | | | — | | | | 767,532 | | | | 301,027 | | | | — | |
Fund shares redeemed | | | 5,435,506 | | | | 136,834 | | | | 112,336 | | | | 8,916 | | | | 84,424 | |
Dividends payable | | | — | | | | — | | | | — | | | | — | | | | — | |
Affiliates: | | | | | | | | | | | | | | | | | | | | |
Investment advisory fees | | | 1,559,906 | | | | 50,442 | | | | 42,282 | | | | 16,155 | | | | 29,644 | |
Distribution fees | | | 75,747 | | | | 1,266 | | | | 1,055 | | | | 290 | | | | 628 | |
Deferred compensation to trustees | | | 664,927 | | | | 92,400 | | | | 85,856 | | | | 40,348 | | | | 12,683 | |
Financial accounting fees | | | 20,875 | | | | 586 | | | | 492 | | | | 187 | | | | 345 | |
Trustees’ fees and officer compensation | | | 27,752 | | | | 2,596 | | | | 2,550 | | | | 2,354 | | | | 2,273 | |
Other accounts payable and accrued liabilities | | | 943,868 | | | | 27,870 | | | | 20,181 | | | | 15,863 | | | | 15,434 | |
Total liabilities | | | 82,355,150 | | | | 800,344 | | | | 1,898,962 | | | | 1,258,715 | | | | 145,431 | |
NET ASSETS | | $ | 2,134,412,134 | | | $ | 61,854,971 | | | $ | 50,370,413 | | | $ | 15,449,520 | | | $ | 36,656,518 | |
COMPOSITION OF NET ASSETS | | | | | | | | | | | | | | | | | | | | |
Paid in capital | | $ | 1,756,639,692 | | | $ | 62,249,996 | | | $ | 47,362,842 | | | $ | 20,322,383 | | | $ | 35,889,264 | |
Undistributed net investment income (loss) | | | (1,589,769 | ) | | | 663,879 | | | | (15,536 | ) | | | (241,269 | ) | | | 801,698 | |
Accumulated net realized gain (loss) on investments, foreign currency transactions, written options and short positions | | | 139,320,793 | | | | (1,648,953 | ) | | | (206,818 | ) | | | (4,727,069 | ) | | | (1,103,561 | ) |
Unrealized appreciation (depreciation) of investments, foreign currency translations, written options and short positions | | | 240,041,418 | | | | 590,049 | | | | 3,229,925 | | | | 95,475 | | | | 1,069,117 | |
NET ASSETS | | $ | 2,134,412,134 | | | $ | 61,854,971 | | | $ | 50,370,413 | | | $ | 15,449,520 | | | $ | 36,656,518 | |
CLASS A SHARES† | | | | | | | | | | | | | | | | | | | | |
Net assets applicable to shares outstanding | | $ | 1,154,588,356 | | | $ | 37,948,428 | | | $ | 12,756,559 | | | $ | 8,881,583 | | | $ | 26,646,269 | |
Shares outstanding | | | 38,989,690 | | | | 3,063,770 | | | | 931,951 | | | | 789,057 | | | | 2,639,173 | |
Net asset value and redemption price per share | | $ | 29.61 | | | $ | 12.39 | | | $ | 13.69 | | | $ | 11.25 | | | $ | 10.10 | |
Maximum offering price per share (Net asset value, plus 4.75% of offering price) | | $ | 31.09 | | | $ | 13.01 | | | $ | 14.37 | | | $ | 11.81 | | | $ | 10.60 | |
CLASS B SHARES†** | | | | | | | | | | | | | | | | | | | | |
Net assets applicable to shares outstanding | | $ | 11,177,779 | | | $ | 108,968 | | | $ | 143,890 | | | $ | 239,530 | | | $ | — | |
Shares outstanding | | | 415,528 | | | | 9,503 | | | | 11,644 | | | | 22,403 | | | | — | |
Net asset value and redemption price per share | | $ | 26.90 | | | $ | 11.47 | | | $ | 12.36 | | | $ | 10.69 | | | $ | — | |
CLASS C SHARES†** | | | | | | | | | | | | | | | | | | | | |
Net assets applicable to shares outstanding | | $ | 614,820,977 | | | $ | 5,598,648 | | | $ | 9,219,755 | | | $ | 887,829 | | | $ | 853,222 | |
Shares outstanding | | | 29,555,361 | | | | 497,986 | | | | 745,512 | | | | 83,022 | | | | 85,442 | |
Net asset value and redemption price per share | | $ | 20.80 | | | $ | 11.24 | | | $ | 12.37 | | | $ | 10.69 | | | $ | 9.99 | |
CLASS I SHARES† | | | | | | | | | | | | | | | | | | | | |
Net assets applicable to shares outstanding | | $ | 346,345,867 | | | $ | 18,075,759 | | | $ | 27,838,890 | | | $ | 5,210,504 | | | $ | 9,046,585 | |
Shares outstanding | | | 9,311,710 | | | | 1,422,167 | | | | 1,998,996 | | | | 455,082 | | | | 894,975 | |
Net asset value and redemption price per share | | $ | 37.19 | | | $ | 12.71 | | | $ | 13.93 | | | $ | 11.45 | | | $ | 10.11 | |
CLASS R SHARES† | | | | | | | | | | | | | | | | | | | | |
Net assets applicable to shares outstanding | | $ | 7,479,155 | | | $ | 123,168 | | | $ | 411,319 | | | $ | 230,074 | | | $ | 110,442 | |
Shares outstanding | | | 266,191 | | | | 10,064 | | | | 30,704 | | | | 20,768 | | | | 10,962 | |
Net asset value and redemption price per share | | $ | 28.10 | | | $ | 12.24 | | | $ | 13.40 | | | $ | 11.08 | | | $ | 10.07 | |
| † | No par value; unlimited number of shares authorized. |
| ** | Redemption price may be reduced by contingent deferred sales charge. |
| | | | | | |
| See accompanying Notes to Financial Statements | | www.calamos.com | | | 145 | |
Statements of Assets and Liabilities April 30, 2016 (Unaudited)
| | | | | | | | | | | | | | | | | | | | |
| | | MID CAP
GROWTH FUND | | | INTERNATIONAL
GROWTH FUND | | | EVOLVING WORLD
GROWTH FUND | | | EMERGING MARKET
EQUITY FUND | | | GLOBAL
EQUITY FUND | |
ASSETS | | | | | | | | | | | | | | | | | | | | |
Investments in securities, at cost | | $ | 6,910,788 | | | $ | 478,480,239 | | | $ | 491,519,796 | | | $ | 13,505,398 | | | $ | 135,852,853 | |
Investment in securities, at value | | $ | 6,330,162 | | | $ | 504,502,961 | | | $ | 490,131,583 | | | $ | 13,474,812 | | | $ | 153,057,028 | |
Cash with custodian (interest bearing) | | | — | | | | — | | | | 15,998 | | | | 460 | | | | — | |
Restricted cash for short positions (interest bearing) | | | — | | | | — | | | | — | | | | — | | | | — | |
Due from investment advisor | | | 16,637 | | | | — | | | | — | | | | 10,912 | | | | 27,989 | |
Restricted foreign currency for short positions (cost $-) | | | — | | | | — | | | | — | | | | — | | | | — | |
Foreign currency (cost $-) | | | — | | | | — | | | | 2 | | | | — | | | | — | |
Unrealized appreciation on forward foreign currency contracts | | | — | | | | — | | | | 53,226 | | | | — | | | | 31,200 | |
Receivables: | | | | | | | | | | | | | | | | | | | | |
Accrued interest and dividends | | | 2,499 | | | | 2,699,543 | | | | 696,887 | | | | 5,117 | | | | 496,385 | |
Investments sold | | | 162,657 | | | | — | | | | 4,022,379 | | | | 175,541 | | | | — | |
Fund shares sold | | | 1,022 | | | | 380,828 | | | | 842,332 | | | | 11,324 | | | | 97,706 | |
Prepaid expenses | | | 23,165 | | | | 101,803 | | | | 49,227 | | | | 51,806 | | | | 37,714 | |
Deferred offering costs | | | — | | | | — | | | | — | | | | — | | | | — | |
Other assets | | | 12,716 | | | | 93,084 | | | | 58,951 | | | | 11,575 | | | | 65,126 | |
Total assets | | | 6,548,858 | | | | 507,778,219 | | | | 495,870,585 | | | | 13,741,547 | | | | 153,813,148 | |
LIABILITIES | | | | | | | | | | | | | | | | | | | | |
Collateral for securities loaned | | | 230,625 | | | | 32,589,083 | | | | 16,809,826 | | | | 176,627 | | | | 4,480,779 | |
Securities sold short, at value (proceeds $-) | | | — | | | | — | | | | — | | | | — | | | | — | |
Options written, at value (premium $-) | | | — | | | | — | | | | — | | | | — | | | | — | |
Unrealized depreciation on forward foreign currency contracts | | | — | | | | 929,759 | | | | 1,020,813 | | | | — | | | | 549,682 | |
Payables: | | | | | | | | | | | | | | | | | | | | |
Investments purchased | | | 116,809 | | | | 2,810,727 | | | | 12,781,979 | | | | 306,152 | | | | 134,844 | |
Fund shares redeemed | | | 94 | | | | 1,212,790 | | | | 891,395 | | | | 104 | | | | 273,344 | |
Dividends payable | | | — | | | | — | | | | — | | | | — | | | | — | |
Affiliates: | | | | | | | | | | | | | | | | | | | | |
Investment advisory fees | | | 6,012 | | | | 337,364 | | | | 413,872 | | | | 11,837 | | | | 117,387 | |
Distribution fees | | | 90 | | | | 7,143 | | | | 5,326 | | | | 112 | | | | 2,484 | |
Deferred compensation to trustees | | | 12,716 | | | | 93,084 | | | | 58,951 | | | | 11,575 | | | | 65,126 | |
Financial accounting fees | | | 70 | | | | 4,593 | | | | 4,373 | | | | 125 | | | | 1,439 | |
Trustees’ fees and officer compensation | | | 2,240 | | | | 7,659 | | | | 6,639 | | | | 2,097 | | | | 3,630 | |
Other accounts payable and accrued liabilities | | | 14,193 | | | | 407,534 | | | | 223,974 | | | | 16,010 | | | | 133,176 | |
Total liabilities | | | 382,849 | | | | 38,399,736 | | | | 32,217,148 | | | | 524,639 | | | | 5,761,891 | |
NET ASSETS | | $ | 6,166,009 | | | $ | 469,378,483 | | | $ | 463,653,437 | | | $ | 13,216,908 | | | $ | 148,051,257 | |
COMPOSITION OF NET ASSETS | | | | | | | | | | | | | | | | | | | | |
Paid in capital | | $ | 8,084,804 | | | $ | 464,499,066 | | | $ | 520,475,313 | | | $ | 16,008,902 | | | $ | 125,513,117 | |
Undistributed net investment income (loss) | | | 7,485 | | | | 883,437 | | | | (1,573,006 | ) | | | (84,295 | ) | | | 90,885 | |
Accumulated net realized gain (loss) on investments, foreign currency transactions, written options and short positions | | | (1,345,654 | ) | | | (20,945,753 | ) | | | (52,877,492 | ) | | | (2,676,549 | ) | | | 5,787,223 | |
Unrealized appreciation (depreciation) of investments, foreign currency translations, written options and short positions | | | (580,626 | ) | | | 24,941,733 | | | | (2,371,378 | ) | | | (31,150 | ) | | | 16,660,032 | * |
NET ASSETS | | $ | 6,166,009 | | | $ | 469,378,483 | | | $ | 463,653,437 | | | $ | 13,216,908 | | | $ | 148,051,257 | |
CLASS A SHARES† | | | | | | | | | | | | | | | | | | | | |
Net assets applicable to shares outstanding | | $ | 2,896,698 | | | $ | 161,184,828 | | | $ | 115,424,612 | | | $ | 4,225,827 | | | $ | 33,625,245 | |
Shares outstanding | | | 309,202 | | | | 9,894,073 | | | | 9,873,360 | | | | 517,504 | | | | 2,782,854 | |
Net asset value and redemption price per share | | $ | 9.37 | | | $ | 16.29 | | | $ | 11.69 | | | $ | 8.17 | | | $ | 12.08 | |
Maximum offering price per share (Net asset value, plus 4.75% of offering price) | | $ | 9.84 | | | $ | 17.10 | | | $ | 12.27 | | | $ | 8.58 | | | $ | 12.68 | |
CLASS B SHARES†** | | | | | | | | | | | | | | | | | | | | |
Net assets applicable to shares outstanding | | $ | — | | | $ | 513,219 | | | $ | 117,796 | | | $ | — | | | $ | 301,308 | |
Shares outstanding | | | — | | | | 33,998 | | | | 10,524 | | | | — | | | | 26,615 | |
Net asset value and redemption price per share | | $ | — | | | $ | 15.10 | | | $ | 11.19 | | | $ | — | | | $ | 11.32 | |
CLASS C SHARES†** | | | | | | | | | | | | | | | | | | | | |
Net assets applicable to shares outstanding | | $ | 308,666 | | | $ | 41,662,595 | | | $ | 34,410,696 | | | $ | 267,132 | | | $ | 18,859,281 | |
Shares outstanding | | | 33,679 | | | | 2,763,401 | | | | 3,076,694 | | | | 33,074 | | | | 1,669,964 | |
Net asset value and redemption price per share | | $ | 9.16 | | | $ | 15.08 | | | $ | 11.18 | | | $ | 8.08 | | | $ | 11.29 | |
CLASS I SHARES† | | | | | | | | | | | | | | | | | | | | |
Net assets applicable to shares outstanding | | $ | 2,861,257 | | | $ | 258,062,006 | | | $ | 311,241,387 | | | $ | 8,642,249 | | | $ | 90,258,892 | |
Shares outstanding | | | 303,306 | | | | 15,569,496 | | | | 26,488,419 | | | | 1,058,086 | | | | 7,353,637 | |
Net asset value and redemption price per share | | $ | 9.43 | | | $ | 16.57 | | | $ | 11.75 | | | $ | 8.17 | | | $ | 12.27 | |
CLASS R SHARES† | | | | | | | | | | | | | | | | | | | | |
Net assets applicable to shares outstanding | | $ | 99,388 | | | $ | 7,955,835 | | | $ | 2,458,946 | | | $ | 81,700 | | | $ | 5,006,531 | |
Shares outstanding | | | 10,687 | | | | 498,083 | | | | 212,313 | | | | 10,017 | | | | 424,579 | |
Net asset value and redemption price per share | | $ | 9.30 | | | $ | 15.97 | | | $ | 11.58 | | | $ | 8.16 | | | $ | 11.79 | |
| † | No par value; unlimited number of shares authorized. |
| ** | Redemption price may be reduced by contingent deferred sales charge. |
| * | Net of deferred foreign capital gains tax of $(34,491). |
| | | | |
| 146 | | CALAMOS OPEN-END FAMILY OF FUNDS SEMIANNUAL REPORT | | See accompanying Notes to Financial Statements |
Statements of Assets and Liabilities April 30, 2016 (Unaudited)
| | | | | | | | | | | | | | | | | | | | |
| | | GROWTH AND
INCOME FUND | | | GLOBAL GROWTH
AND INCOME FUND | | | CONVERTIBLE
FUND | | | GLOBAL
CONVERTIBLE FUND | | | TOTAL RETURN
BOND FUND | |
ASSETS | | | | | | | | | | | | | | | | | | | | |
Investments in securities, at cost | | $ | 2,047,234,863 | | | $ | 330,863,810 | | | $ | 877,901,158 | | | $ | 75,875,665 | | | $ | 99,627,527 | |
Investment in securities, at value | | $ | 2,385,998,544 | | | $ | 347,119,106 | | | $ | 876,998,718 | | | $ | 75,057,896 | | | $ | 102,428,499 | |
Cash with custodian (interest bearing) | | | 24,663 | | | | — | | | | — | | | | — | | | | 16,563 | |
Restricted cash for short positions (interest bearing) | | | — | | | | — | | | | — | | | | — | | | | — | |
Due from investment advisor | | | 14,348 | | | | — | | | | — | | | | 21,238 | | | | 16,319 | |
Restricted foreign currency for short positions (cost $-) | | | — | | | | — | | | | — | | | | — | | | | — | |
Foreign currency (cost $11,176) | | | — | | | | — | | | | — | | | | 11,311 | | | | — | |
Unrealized appreciation on forward foreign currency contracts | | | — | | | | — | | | | — | | | | — | | | | — | |
Receivables: | | | | | | | | | | | | | | | | | | | | |
Accrued interest and dividends | | | 5,104,746 | | | | 1,320,978 | | | | 3,182,777 | | | | 282,219 | | | | 717,107 | |
Investments sold | | | 6,703,710 | | | | — | | | | — | | | | — | | | | — | |
Fund shares sold | | | 3,087,025 | | | | 231,217 | | | | 651,037 | | | | 243,872 | | | | 69,387 | |
Prepaid expenses | | | 144,950 | | | | 55,394 | | | | 80,346 | | | | 22,709 | | | | 34,380 | |
Deferred offering costs | | | — | | | | — | | | | — | | | | — | | | | — | |
Other assets | | | 347,609 | | | | 143,119 | | | | 188,523 | | | | 5,723 | | | | 66,568 | |
Total assets | | | 2,401,425,595 | | | | 348,869,814 | | | | 881,101,401 | | | | 75,644,968 | | | | 103,348,823 | |
LIABILITIES | | | | | | | | | | | | | | | | | | | | |
Collateral for securities loaned | | | 27,592,022 | | | | 10,253,917 | | | | 54,864,082 | | | | 818,218 | | | | 490,000 | |
Securities sold short, at value (proceeds $-) | | | — | | | | — | | | | — | | | | — | | | | — | |
Options written, at value (premium $-) | | | — | | | | — | | | | — | | | | — | | | | — | |
Unrealized depreciation on forward foreign currency contracts | | | — | | | | 370,313 | | | | 91,584 | | | | — | | | | — | |
Payables: | | | | | | | | | | | | | | | | | | | | |
Investments purchased | | | 3,493,509 | | | | 1,955,168 | | | | 3,130,836 | | | | 131 | | | | 1,236,450 | |
Fund shares redeemed | | | 7,474,251 | | | | 510,995 | | | | 6,176,508 | | | | 94,738 | | | | 207,289 | |
Dividends payable | | | — | | | | — | | | | — | | | | — | | | | 16,964 | |
Affiliates: | | | | | | | | | | | | | | | | | | | | |
Investment advisory fees | | | 1,333,752 | | | | 278,777 | | | | 499,818 | | | | 51,158 | | | | 44,847 | |
Distribution fees | | | 88,541 | | | | 10,648 | | | | 23,900 | | | | 825 | | | | 2,680 | |
Deferred compensation to trustees | | | 347,609 | | | | 143,119 | | | | 188,523 | | | | 5,723 | | | | 66,568 | |
Financial accounting fees | | | 22,748 | | | | 3,240 | | | | 7,958 | | | | 699 | | | | 948 | |
Trustees’ fees and officer compensation | | | 25,491 | | | | 5,450 | | | | 12,508 | | | | 2,166 | | | | 2,612 | |
Other accounts payable and accrued liabilities | | | 707,523 | | | | 118,023 | | | | 284,141 | | | | 15,389 | | | | 24,490 | |
Total liabilities | | | 41,085,446 | | | | 13,649,650 | | | | 65,279,858 | | | | 989,047 | | | | 2,092,848 | |
NET ASSETS | | $ | 2,360,340,149 | | | $ | 335,220,164 | | | $ | 815,821,543 | | | $ | 74,655,921 | | | $ | 101,255,975 | |
COMPOSITION OF NET ASSETS | | | | | | | | | | | | | | | | | | | | |
Paid in capital | | $ | 2,013,886,934 | | | $ | 322,178,431 | | | $ | 827,321,946 | | | $ | 77,356,968 | | | $ | 99,396,054 | |
Undistributed net investment income (loss) | | | (6,448,607 | ) | | | 971,849 | | | | (857,527 | ) | | | 432,954 | | | | (593,765 | ) |
Accumulated net realized gain (loss) on investments, foreign currency transactions, written options and short positions | | | 14,138,141 | | | | (3,823,150 | ) | | | (9,650,375 | ) | | | (2,318,380 | ) | | | (347,286 | ) |
Unrealized appreciation (depreciation) of investments, foreign currency translations, written options and short positions | | | 338,763,681 | | | | 15,893,034 | | | | (992,501 | ) | | | (815,621 | ) | | | 2,800,972 | |
NET ASSETS | | $ | 2,360,340,149 | | | $ | 335,220,164 | | | $ | 815,821,543 | | | $ | 74,655,921 | | | $ | 101,255,975 | |
CLASS A SHARES† | | | | | | | | | | | | | | | | | | | | |
Net assets applicable to shares outstanding | | $ | 1,004,772,707 | | | $ | 97,582,563 | | | $ | 260,290,728 | | | $ | 30,052,258 | | | $ | 60,894,553 | |
Shares outstanding | | | 33,931,676 | | | | 11,830,040 | | | | 16,856,968 | | | | 3,096,430 | | | | 5,806,584 | |
Net asset value and redemption price per share | | $ | 29.61 | | | $ | 8.25 | | | $ | 15.44 | | | $ | 9.71 | | | $ | 10.49 | |
Maximum offering price per share (Net asset value, plus 4.75% of offering price) | | $ | 31.09 | | | $ | 8.66 | | | $ | 16.21 | | | $ | 10.19 | | | $ | 10.90 | # |
CLASS B SHARES†** | | | | | | | | | | | | | | | | | | | | |
Net assets applicable to shares outstanding | | $ | 5,617,681 | | | $ | 972,462 | | | $ | 4,396,378 | | | $ | — | | | $ | 823,466 | |
Shares outstanding | | | 157,602 | | | | 116,660 | | | | 221,292 | | | | — | | | | 78,548 | |
Net asset value and redemption price per share | | $ | 35.64 | | | $ | 8.34 | | | $ | 19.87 | | | $ | — | | | $ | 10.48 | |
CLASS C SHARES†** | | | | | | | | | | | | | | | | | | | | |
Net assets applicable to shares outstanding | | $ | 808,045,332 | | | $ | 103,683,956 | | | $ | 218,214,206 | | | $ | 2,435,601 | | | $ | 16,474,933 | |
Shares outstanding | | | 27,188,190 | | | | 13,850,582 | | | | 14,260,883 | | | | 252,113 | | | | 1,571,564 | |
Net asset value and redemption price per share | | $ | 29.72 | | | $ | 7.49 | | | $ | 15.30 | | | $ | 9.66 | | | $ | 10.48 | |
CLASS I SHARES† | | | | | | | | | | | | | | | | | | | | |
Net assets applicable to shares outstanding | | $ | 528,260,924 | | | $ | 131,909,928 | | | $ | 331,109,181 | | | $ | 41,991,659 | | | $ | 22,623,776 | |
Shares outstanding | | | 18,447,467 | | | | 15,581,484 | | | | 23,706,608 | | | | 4,317,815 | | | | 2,157,746 | |
Net asset value and redemption price per share | | $ | 28.64 | | | $ | 8.47 | | | $ | 13.97 | | | $ | 9.73 | | | $ | 10.48 | |
CLASS R SHARES† | | | | | | | | | | | | | | | | | | | | |
Net assets applicable to shares outstanding | | $ | 13,643,505 | | | $ | 1,071,255 | | | $ | 1,811,050 | | | $ | 176,403 | | | $ | 439,247 | |
Shares outstanding | | | 464,150 | | | | 131,661 | | | | 117,709 | | | | 18,192 | | | | 41,892 | |
Net asset value and redemption price per share | | $ | 29.39 | | | $ | 8.14 | | | $ | 15.39 | | | $ | 9.70 | | | $ | 10.49 | |
| † | No par value; unlimited number of shares authorized. |
| ** | Redemption price may be reduced by contingent deferred sales charge. |
| # | For Total Return Bond Fund, maximum offering price per share is Net asset value plus 3.75% of offering price. |
| | | | | | |
| See accompanying Notes to Financial Statements | | www.calamos.com | | | 147 | |
Statements of Assets and Liabilities April 30, 2016 (Unaudited)
| | | | | | | | | | | | | | | | | | | | |
| | | HIGH INCOME
FUND | | | MARKET NEUTRAL
INCOME FUND | | | HEDGED EQUITY
INCOME FUND | | | PHINEUS
LONG/SHORT
FUND | | | LONG/SHORT
FUND | |
ASSETS | | | | | | | | | | | | | | | | | | | | |
Investments in securities, at cost | | $ | 105,082,349 | | | $ | 3,815,560,983 | | | $ | 16,620,214 | | | $ | 14,206,694 | | | $ | 44,039,812 | |
Investment in securities, at value | | $ | 101,143,979 | | | $ | 3,820,171,627 | | | $ | 16,591,681 | | | $ | 14,308,714 | | | $ | 43,235,482 | |
Cash with custodian (interest bearing) | | | — | | | | 140,109 | | | | — | | | | — | | | | — | |
Restricted cash for short positions (interest bearing) | | | — | | | | 844,489,688 | | | | — | | | | 5,259,447 | | | | 22,744,311 | |
Due from investment advisor | | | — | | | | — | | | | 15,213 | | | | 29,878 | | | | — | |
Restricted foreign currency for short positions (cost $3,622,747, $857,949) | | | — | | | | 3,757,747 | | | | — | | | | — | | | | 872,773 | |
Foreign currency (cost $-) | | | — | | | | — | | | | — | | | | — | | | | — | |
Unrealized appreciation on forward foreign currency contracts | | | — | | | | — | | | | — | | | | — | | | | — | |
Receivables: | | | | | | | | | | | | | | | | | | | | |
Accrued interest and dividends | | | 1,502,823 | | | | 12,317,723 | | | | 17,274 | | | | 9,066 | | | | 43,217 | |
Investments sold | | | 387,265 | | | | 16,111,863 | | | | 60,538 | | | | 1,530,871 | | | | 4,921,916 | |
Fund shares sold | | | 90,534 | | | | 36,735,275 | | | | 1,481 | | | | 712,855 | | | | 33,636 | |
Prepaid expenses | | | 53,228 | | | | 258,221 | | | | 18,184 | | | | — | | | | 32,954 | |
Deferred offering costs | | | — | | | | — | | | | — | | | | 182,751 | | | | — | |
Other assets | | | 101,717 | | | | 197,398 | | | | 5,711 | | | | — | | | | 13,497 | |
Total assets | | | 103,279,546 | | | | 4,734,179,651 | | | | 16,710,082 | | | | 22,033,582 | | | | 71,897,786 | |
LIABILITIES | | | | | | | | | | | | | | | | | | | | |
Collateral for securities loaned | | | 7,200,032 | | | | 34,388,387 | | | | — | | | | — | | | | — | |
Securities sold short, at value (proceeds $783,641,056, $6,094,917, $21,640,465) | | | — | | | | 827,884,332 | | | | — | | | | 6,072,246 | | | | 23,474,533 | |
Options written, at value (premium $68,722,675, $462,532, $26,592, $114,415) | | | — | | | | 62,674,415 | | | | 444,718 | | | | 32,997 | | | | 134,599 | |
Unrealized depreciation on forward foreign currency contracts | | | — | | | | — | | | | — | | | | — | | | | — | |
Payables: | | | | | | | | | | | | | | | | | | | | |
Investments purchased | | | 588,843 | | | | 24,036,854 | | | | 235,354 | | | | 2,613,636 | | | | 2,423,058 | |
Fund shares redeemed | | | 661,749 | | | | 34,019,104 | | | | 31,401 | | | | — | | | | 182,555 | |
Dividends payable | | | 29,273 | | | | — | | | | — | | | | — | | | | — | |
Affiliates: | | | | | | | | | | | | | | | | | | | | |
Investment advisory fees | | | 57,890 | | | | 2,061,308 | | | | 9,718 | | | | 6,710 | | | | 46,749 | |
Distribution fees | | | 2,770 | | | | 48,037 | | | | 214 | | | | 16 | | | | 652 | |
Deferred compensation to trustees | | | 101,717 | | | | 197,398 | | | | 5,711 | | | | — | | | | 13,497 | |
Financial accounting fees | | | 897 | | | | 35,757 | | | | 150 | | | | 61 | | | | 434 | |
Trustees’ fees and officer compensation | | | 2,959 | | | | 35,210 | | | | 1,907 | | | | 775 | | | | 2,819 | |
Other accounts payable and accrued liabilities | | | 46,490 | | | | 979,095 | | | | 12,950 | | | | 213,370 | | | | 49,028 | |
Total liabilities | | | 8,692,620 | | | | 986,359,897 | | | | 742,123 | | | | 8,939,811 | | | | 26,327,924 | |
NET ASSETS | | $ | 94,586,926 | | | $ | 3,747,819,754 | | | $ | 15,967,959 | | | $ | 13,093,771 | | | $ | 45,569,862 | |
COMPOSITION OF NET ASSETS | | | | | | | | | | | | | | | | | | | | |
Paid in capital | | $ | 106,954,883 | | | $ | 3,722,359,896 | | | $ | 16,007,203 | | | $ | 12,871,809 | | | $ | 47,288,450 | |
Undistributed net investment income (loss) | | | (176,953 | ) | | | 16,345,329 | | | | (16,509 | ) | | | (1,602 | ) | | | 99,694 | |
Accumulated net realized gain (loss) on investments, foreign currency transactions, written options and short positions | | | (8,252,634 | ) | | | 42,561,530 | | | | (12,016 | ) | | | 105,243 | | | | 825,476 | |
Unrealized appreciation (depreciation) of investments, foreign currency translations, written options and short positions | | | (3,938,370 | ) | | | (33,447,001 | ) | | | (10,719 | ) | | | 118,321 | | | | (2,643,758 | ) |
NET ASSETS | | $ | 94,586,926 | | | $ | 3,747,819,754 | | | $ | 15,967,959 | | | $ | 13,093,771 | | | $ | 45,569,862 | |
CLASS A SHARES† | | | | | | | | | | | | | | | | | | | | |
Net assets applicable to shares outstanding | | $ | 58,450,925 | | | $ | 966,776,654 | | | $ | 9,602,398 | | | $ | 270,432 | | | $ | 14,459,294 | |
Shares outstanding | | | 6,999,045 | | | | 75,171,449 | | | | 982,085 | | | | 25,771 | | | | 1,410,005 | |
Net asset value and redemption price per share | | $ | 8.35 | | | $ | 12.86 | | | $ | 9.78 | | | $ | 10.49 | | | $ | 10.25 | |
Maximum offering price per share (Net asset value, plus 4.75% of offering price) | | $ | 8.77 | | | $ | 13.50 | | | $ | 10.27 | | | $ | 11.01 | | | $ | 10.76 | |
CLASS B SHARES†** | | | | | | | | | | | | | | | | | | | | |
Net assets applicable to shares outstanding | | $ | 395,618 | | | $ | 852,655 | | | $ | — | | | $ | — | | | $ | — | |
Shares outstanding | | | 44,744 | | | | 62,428 | | | | — | | | | — | | | | — | |
Net asset value and redemption price per share | | $ | 8.84 | | | $ | 13.66 | | | $ | — | | | $ | — | | | $ | — | |
CLASS C SHARES†** | | | | | | | | | | | | | | | | | | | | |
Net assets applicable to shares outstanding | | $ | 18,628,474 | | | $ | 332,218,003 | | | $ | 163,224 | | | $ | 119,787 | | | $ | 4,269,091 | |
Shares outstanding | | | 2,130,821 | | | | 25,445,570 | | | | 16,728 | | | | 11,420 | | | | 424,981 | |
Net asset value and redemption price per share | | $ | 8.74 | | | $ | 13.06 | | | $ | 9.76 | | | $ | 10.49 | | | $ | 10.05 | |
CLASS I SHARES† | | | | | | | | | | | | | | | | | | | | |
Net assets applicable to shares outstanding | | $ | 16,970,887 | | | $ | 2,439,772,478 | | | $ | 6,102,448 | | | $ | 12,703,552 | | | $ | 26,815,727 | |
Shares outstanding | | | 2,032,635 | | | | 191,747,403 | | | | 623,451 | | | | 1,210,192 | | | | 2,596,494 | |
Net asset value and redemption price per share | | $ | 8.35 | | | $ | 12.72 | | | $ | 9.79 | | | $ | 10.50 | | | $ | 10.33 | |
CLASS R SHARES† | | | | | | | | | | | | | | | | | | | | |
Net assets applicable to shares outstanding | | $ | 141,022 | | | $ | 8,199,964 | | | $ | 99,889 | | | $ | — | | | $ | 25,750 | |
Shares outstanding | | | 16,921 | | | | 640,098 | | | | 10,223 | | | | — | | | | 2,524 | |
Net asset value and redemption price per share | | $ | 8.33 | | | $ | 12.81 | | | $ | 9.77 | | | $ | — | | | $ | 10.20 | |
| † | No par value; unlimited number of shares authorized. |
| ** | Redemption price may be reduced by contingent deferred sales charge. |
| | | | |
| 148 | | CALAMOS OPEN-END FAMILY OF FUNDS SEMIANNUAL REPORT | | See accompanying Notes to Financial Statements |
Statements of Operations Six Months Ended April 30, 2016 (Unaudited)
| | | | | | | | | | | | | | | | | | | | |
| | | GROWTH
FUND | | | OPPORTUNISTIC
VALUE FUND | | | FOCUS GROWTH
FUND | | | DISCOVERY
GROWTH FUND | | | DIVIDEND
GROWTH FUND | |
INVESTMENT INCOME | | | | | | | | | | | | | | | | | | | | |
Interest | | $ | — | | | $ | — | | | $ | — | | | $ | 5,236 | | | $ | — | |
Dividends | | | 12,561,782 | | | | 816,673 | | | | 309,099 | | | | 68,891 | | | | 402,144 | |
Securities lending income | | | 195,163 | | | | 2,111 | | | | 7,141 | | | | 6,419 | | | | 116 | |
Dividend taxes withheld | | | (22,245 | ) | | | (857 | ) | | | (1,670 | ) | | | (559 | ) | | | — | |
Total investment income | | | 12,734,700 | | | | 817,927 | | | | 314,570 | | | | 79,987 | | | | 402,260 | |
| | | | | |
EXPENSES | | | | | | | | | | | | | | | | | | | | |
Investment advisory fees | | | 9,994,632 | | | | 301,083 | | | | 280,135 | | | | 156,220 | | | | 174,634 | |
Distribution fees | | | | | | | | | | | | | | | | | | | | |
Class A | | | 1,543,173 | | | | 46,576 | | | | 20,413 | | | | 22,637 | | | | 33,569 | |
Class B | | | 73,388 | | | | 629 | | | | 1,088 | | | | 7,044 | | | | — | |
Class C | | | 3,345,509 | | | | 27,588 | | | | 52,584 | | | | 10,763 | | | | 3,326 | |
Class R | | | 19,949 | | | | 347 | | | | 1,374 | | | | 3,617 | | | | 265 | |
Transfer agent fees | | | 1,753,736 | | | | 26,306 | | | | 22,782 | | | | 12,779 | | | | 8,816 | |
Printing and mailing fees | | | 235,060 | | | | 4,834 | | | | 4,284 | | | | 3,427 | | | | 3,199 | |
Financial accounting fees | | | 134,083 | | | | 3,492 | | | | 3,250 | | | | 1,811 | | | | 2,026 | |
Legal fees | | | 81,690 | | | | 10,233 | | | | 7,425 | | | | 6,784 | | | | 8,215 | |
Accounting fees | | | 73,747 | | | | 15,673 | | | | 11,066 | | | | 11,695 | | | | 12,878 | |
Audit fees | | | 69,482 | | | | 7,199 | | | | 6,986 | | | | 6,207 | | | | 6,426 | |
Trustees’ fees and officer compensation | | | 64,164 | | | | 7,557 | | | | 7,618 | | | | 6,911 | | | | 6,907 | |
Registration fees | | | 42,730 | | | | 25,475 | | | | 27,446 | | | | 24,029 | | | | 29,417 | |
Custodian fees | | | 31,025 | | | | 2,967 | | | | 3,798 | | | | 2,445 | | | | 1,861 | |
Dividend or interest expense on short positions | | | — | | | | — | | | | — | | | | — | | | | — | |
Organization expense | | | — | | | | — | | | | — | | | | — | | | | — | |
Offering costs | | | — | | | | — | | | | — | | | | — | | | | — | |
Other | | | 115,079 | | | | 6,642 | | | | 11,887 | | | | 6,625 | | | | 4,264 | |
Total expenses | | | 17,577,447 | | | | 486,601 | | | | 462,136 | | | | 282,994 | | | | 295,803 | |
Less expense reductions | | | — | | | | (140,045 | ) | | | (134,557 | ) | | | (43,658 | ) | | | (66,545 | ) |
Net expenses | | | 17,577,447 | | | | 346,556 | | | | 327,579 | | | | 239,336 | | | | 229,258 | |
NET INVESTMENT INCOME (LOSS) | | | (4,842,747 | ) | | | 471,371 | | | | (13,009 | ) | | | (159,349 | ) | | | 173,002 | |
| | | | | |
REALIZED AND UNREALIZED GAIN (LOSS) | | | | | | | | | | | | | | | | | | | | |
Net realized gain (loss) from: | | | | | | | | | | | | | | | | | | | | |
Investments | | | 140,872,112 | | | | (1,238,977 | ) | | | (201,765 | ) | | | (4,489,504 | ) | | | (298,755 | ) |
Purchased options | | | — | | | | — | | | | — | | | | — | | | | — | |
Foreign currency transactions | | | 2,300,643 | | | | — | | | | 78,508 | | | | — | | | | — | |
Written options | | | — | | | | — | | | | — | | | | — | | | | — | |
Short positions | | | — | | | | — | | | | — | | | | — | | | | — | |
Change in net unrealized appreciation/(depreciation) on: | | | | | | | | | | | | | | | | | | | | |
Investments | | | (301,971,561 | ) | | | 154,496 | | | | (3,365,113 | ) | | | 862,439 | | | | (367,236 | ) |
Purchased options | | | — | | | | — | | | | — | | | | — | | | | — | |
Foreign currency translations | | | (197,228 | ) | | | — | | | | (6,775 | ) | | | — | | | | — | |
Written options | | | — | | | | — | | | | — | | | | — | | | | — | |
Short positions | | | — | | | | — | | | | — | | | | — | | | | — | |
NET GAIN (LOSS) | | | (158,996,034 | ) | | | (1,084,481 | ) | | | (3,495,145 | ) | | | (3,627,065 | ) | | | (665,991 | ) |
NET INCREASE (DECREASE) IN NET ASSETS RESULTING FROM OPERATIONS | | $ | (163,838,781 | ) | | $ | (613,110 | ) | | $ | (3,508,154 | ) | | $ | (3,786,414 | ) | | $ | (492,989 | ) |
| | | | | | |
| See accompanying Notes to Financial Statements | | www.calamos.com | | | 149 | |
Statements of Operations Six Months Ended April 30, 2016 (Unaudited)
| | | | | | | | | | | | | | | | | | | | |
| | | MID CAP
GROWTH FUND | | | INTERNATIONAL
GROWTH FUND | | | EVOLVING WORLD
GROWTH FUND | | | EMERGING MARKET
EQUITY FUND | | | GLOBAL
EQUITY FUND | |
INVESTMENT INCOME | | | | | | | | | | | | | | | | | | | | |
Interest | | $ | — | | | $ | — | | | $ | 1,285,688 | | | $ | — | | | $ | — | |
Dividends | | | 40,356 | | | | 4,935,388 | | | | 2,738,420 | | | | 74,680 | | | | 1,066,740 | |
Securities lending income | | | 3,447 | | | | 54,505 | | | | 13,945 | | | | 279 | | | | 12,591 | |
Dividend taxes withheld | | | (293 | ) | | | (518,613 | ) | | | (299,387 | ) | | | (9,792 | ) | | | (82,782 | ) |
Total investment income | | | 43,510 | | | | 4,471,280 | | | | 3,738,666 | | | | 65,167 | | | | 996,549 | |
| | | | | |
EXPENSES | | | | | | | | | | | | | | | | | | | | |
Investment advisory fees | | | 63,786 | | | | 2,223,781 | | | | 2,451,236 | | | | 69,076 | | | | 714,765 | |
Distribution fees | | | | | | | | | | | | | | | | | | | | |
Class A | | | 8,407 | | | | 226,884 | | | | 139,666 | | | | 5,058 | | | | 47,118 | |
Class B | | | — | | | | 3,722 | | | | 1,857 | | | | — | | | | 2,015 | |
Class C | | | 1,937 | | | | 224,127 | | | | 170,887 | | | | 1,345 | | | | 98,949 | |
Class R | | | 247 | | | | 19,886 | | | | 5,556 | | | | 195 | | | | 13,392 | |
Transfer agent fees | | | 7,242 | | | | 406,968 | | | | 297,551 | | | | 5,040 | | | | 108,225 | |
Printing and mailing fees | | | 3,026 | | | | 30,872 | | | | 55,160 | | | | 2,483 | | | | 23,402 | |
Financial accounting fees | | | 740 | | | | 30,747 | | | | 25,852 | | | | 729 | | | | 8,914 | |
Legal fees | | | 6,373 | | | | 34,791 | | | | 19,622 | | | | 6,269 | | | | 11,130 | |
Accounting fees | | | 8,993 | | | | 25,606 | | | | 23,098 | | | | 9,904 | | | | 15,293 | |
Audit fees | | | 5,678 | | | | 20,402 | | | | 17,762 | | | | 5,772 | | | | 9,903 | |
Trustees’ fees and officer compensation | | | 6,313 | | | | 19,702 | | | | 17,169 | | | | 6,284 | | | | 10,004 | |
Registration fees | | | 23,024 | | | | 49,518 | | | | 34,315 | | | | 21,925 | | | | 29,922 | |
Custodian fees | | | 2,414 | | | | 65,551 | | | | 112,568 | | | | 7,846 | | | | 15,871 | |
Dividend or interest expense on short positions | | | — | | | | — | | | | — | | | | — | | | | — | |
Organization expense | | | — | | | | — | | | | — | | | | — | | | | — | |
Offering costs | | | — | | | | — | | | | — | | | | — | | | | — | |
Other | | | 13,573 | | | | 38,468 | | | | 39,084 | | | | 10,936 | | | | 26,070 | |
Total expenses | | | 151,753 | | | | 3,421,025 | | | | 3,411,383 | | | | 152,862 | | | | 1,134,973 | |
Less expense reductions | | | (77,376 | ) | | | — | | | | — | | | | (52,130 | ) | | | (89,780 | ) |
Net expenses | | | 74,377 | | | | 3,421,025 | | | | 3,411,383 | | | | 100,732 | | | | 1,045,193 | |
NET INVESTMENT INCOME (LOSS) | | | (30,867 | ) | | | 1,050,255 | | | | 327,283 | | | | (35,565 | ) | | | (48,644 | ) |
| | | | | |
REALIZED AND UNREALIZED GAIN (LOSS) | | | | | | | | | | | | | | | | | | | | |
Net realized gain (loss) from: | | | | | | | | | | | | | | | | | | | | |
Investments | | | (1,297,332 | ) | | | (19,009,390 | ) | | | (42,765,024 | )(a) | | | (1,591,005 | ) | | | 7,153,342 | |
Purchased options | | | — | | | | (672,929 | ) | | | (1,191,306 | ) | | | (34,765 | ) | | | (257,654 | ) |
Foreign currency transactions | | | — | | | | (839,790 | ) | | | 388,382 | | | | 458 | | | | (501,310 | ) |
Written options | | | — | | | | (423,444 | ) | | | (505,268 | ) | | | (14,160 | ) | | | (369,620 | ) |
Short positions | | | — | | | | — | | | | — | | | | — | | | | — | |
Change in net unrealized appreciation/(depreciation) on: | | | | | | | | | | | | | | | | | | | | |
Investments | | | (291,027 | ) | | | (14,809,736 | ) | | | 29,392,839 | (b) | | | 1,296,509 | | | | (16,122,470 | )(b) |
Purchased options | | | — | | | | — | | | | 351,658 | | | | 11,105 | | | | — | |
Foreign currency translations | | | — | | | | (902,319 | ) | | | (1,070,621 | ) | | | (164 | ) | | | (533,168 | ) |
Written options | | | — | | | | — | | | | — | | | | — | | | | — | |
Short positions | | | — | | | | — | | | | — | | | | — | | | | — | |
NET GAIN (LOSS) | | | (1,588,359 | ) | | | (36,657,608 | ) | | | (15,399,340 | ) | | | (332,022 | ) | | | (10,630,880 | ) |
NET INCREASE (DECREASE) IN NET ASSETS RESULTING FROM OPERATIONS | | $ | (1,619,226 | ) | | $ | (35,607,353 | ) | | $ | (15,072,057 | ) | | $ | (367,587 | ) | | $ | (10,679,524 | ) |
| (a) | Net of foreign capital gains tax of $74,148. |
| (b) | Net of change of $ 212,336 and $(34,491), respectively in deferred capital gains tax. |
| | | | |
| 150 | | CALAMOS OPEN-END FAMILY OF FUNDS SEMIANNUAL REPORT | | See accompanying Notes to Financial Statements |
Statements of Operations Six Months Ended April 30, 2016 (Unaudited)
| | | | | | | | | | | | | | | | | | | | |
| | | GROWTH AND
INCOME FUND | | | GLOBAL GROWTH
AND INCOME FUND | | | CONVERTIBLE
FUND | | | GLOBAL
CONVERTIBLE FUND | | | TOTAL RETURN
BOND FUND | |
INVESTMENT INCOME | | | | | | | | | | | | | | | | | | | | |
Interest | | $ | 10,215,482 | | | $ | 2,586,061 | | | $ | 12,609,965 | | | $ | 1,074,512 | | | $ | 1,486,795 | |
Dividends | | | 22,187,254 | | | | 1,907,389 | | | | 7,278,521 | | | | 288,115 | | | | 4,498 | |
Securities lending income | | | 207,612 | | | | 16,496 | | | | 274,226 | | | | 5,200 | | | | 1,791 | |
Dividend taxes withheld | | | — | | | | (101,033 | ) | | | (38,139 | ) | | | (6,981 | ) | | | — | |
Total investment income | | | 32,610,348 | | | | 4,408,913 | | | | 20,124,573 | | | | 1,360,846 | | | | 1,493,084 | |
| | | | | |
EXPENSES | | | | | | | | | | | | | | | | | | | | |
Investment advisory fees | | | 8,189,228 | | | | 1,738,659 | | | | 3,293,781 | | | | 283,965 | | | | 251,744 | |
Distribution fees | | | | | | | | | | | | | | | | | | | | |
Class A | | | 1,283,701 | | | | 126,656 | | | | 375,560 | | | | 31,722 | | | | 69,314 | |
Class B | | | 36,084 | | | | 7,158 | | | | 23,661 | | | | — | | | | 4,391 | |
Class C | | | 4,127,484 | | | | 540,424 | | | | 1,165,930 | | | | 10,572 | | | | 80,275 | |
Class R | | | 35,079 | | | | 2,980 | | | | 4,808 | | | | 391 | | | | 795 | |
Transfer agent fees | | | 1,305,782 | | | | 196,934 | | | | 453,593 | | | | 36,957 | | | | 40,750 | |
Printing and mailing fees | | | 172,711 | | | | 24,642 | | | | 60,405 | | | | 9,234 | | | | 7,411 | |
Financial accounting fees | | | 139,483 | | | | 20,167 | | | | 52,584 | | | | 3,876 | | | | 5,311 | |
Legal fees | | | 74,798 | | | | 26,291 | | | | 40,681 | | | | 9,957 | | | | 6,911 | |
Accounting fees | | | 79,486 | | | | 22,080 | | | | 36,521 | | | | 12,743 | | | | 14,193 | |
Audit fees | | | 70,929 | | | | 15,130 | | | | 30,559 | | | | 7,129 | | | | 7,974 | |
Trustees’ fees and officer compensation | | | 65,899 | | | | 14,725 | | | | 29,342 | | | | 9,036 | | | | 8,317 | |
Registration fees | | | 46,744 | | | | 31,514 | | | | 42,429 | | | | 10,307 | | | | 30,007 | |
Custodian fees | | | 28,418 | | | | 19,627 | | | | 13,453 | | | | 6,224 | | | | 2,419 | |
Dividend or interest expense on short positions | | | — | | | | — | | | | — | | | | — | | | | — | |
Organization expense | | | — | | | | — | | | | — | | | | — | | | | — | |
Offering costs | | | — | | | | — | | | | — | | | | 18,281 | | | | — | |
Other | | | 105,165 | | | | 33,972 | | | | 61,163 | | | | 5,077 | | | | 9,131 | |
Total expenses | | | 15,760,991 | | | | 2,820,959 | | | | 5,684,470 | | | | 455,471 | | | | 538,943 | |
Less expense reductions | | | — | | | | — | | | | — | | | | (44,326 | ) | | | (84,986 | ) |
Net expenses | | | 15,760,991 | | | | 2,820,959 | | | | 5,684,470 | | | | 411,145 | | | | 453,957 | |
NET INVESTMENT INCOME (LOSS) | | | 16,849,357 | | | | 1,587,954 | | | | 14,440,103 | | | | 949,701 | | | | 1,039,127 | |
| | | | | |
REALIZED AND UNREALIZED GAIN (LOSS) | | | | | | | | | | | | | | | | | | | | |
Net realized gain (loss) from: | | | | | | | | | | | | | | | | | | | | |
Investments | | | 3,419,085 | | | | (3,704,654 | ) | | | (21,286,237 | ) | | | (1,391,591 | ) | | | (105,528 | ) |
Purchased options | | | — | | | | (767,105 | ) | | | (2,345,762 | ) | | | (297,029 | ) | | | — | |
Foreign currency transactions | | | 10,936 | | | | (924,915 | ) | | | (76,454 | ) | | | (4,401 | ) | | | — | |
Written options | | | — | | | | — | | | | — | | | | — | | | | — | |
Short positions | | | — | | | | — | | | | — | | | | — | | | | — | |
Change in net unrealized appreciation/(depreciation) on: | | | | | | | | | | | | | | | | | | | | |
Investments | | | (57,222,941 | ) | | | (8,314,163 | ) | | | (26,162,679 | ) | | | 272,217 | | | | 1,665,076 | |
Purchased options | | | — | | | | (225,342 | ) | | | (1,078,516 | ) | | | (509,830 | ) | | | — | |
Foreign currency translations | | | (4,585 | ) | | | (336,888 | ) | | | (109,671 | ) | | | 2,705 | | | | — | |
Written options | | | — | | | | — | | | | — | | | | — | | | | — | |
Short positions | | | — | | | | — | | | | — | | | | — | | | | — | |
NET GAIN (LOSS) | | | (53,797,505 | ) | | | (14,273,067 | ) | | | (51,059,319 | ) | | | (1,927,929 | ) | | | 1,559,548 | |
NET INCREASE (DECREASE) IN NET ASSETS RESULTING FROM OPERATIONS | | $ | (36,948,148 | ) | | $ | (12,685,113 | ) | | $ | (36,619,216 | ) | | $ | (978,228 | ) | | $ | 2,598,675 | |
| | | | | | |
| See accompanying Notes to Financial Statements | | www.calamos.com | | | 151 | |
Statements of Operations Six Months Ended April 30, 2016 (Unaudited)
| | | | | | | | | | | | | | | | | | | | |
| | | HIGH INCOME
FUND | | | MARKET NEUTRAL
INCOME FUND | | | HEDGED EQUITY
INCOME FUND | | | PHINEUS
LONG/SHORT
FUND(a) | | | LONG/SHORT
FUND | |
INVESTMENT INCOME | | | | | | | | | | | | | | | | | | | | |
Interest | | $ | 2,733,062 | | | $ | 33,843,258 | | | $ | — | | | $ | — | | | $ | — | |
Dividends | | | 47,933 | | | | 26,043,896 | | | | 147,585 | | | | 9,325 | | | | 517,098 | |
Securities lending income | | | 31,000 | | | | 158,932 | | | | — | | | | — | | | | 4,254 | |
Dividend taxes withheld | | | — | | | | (87,114 | ) | | | — | | | | (539 | ) | | | (20,246 | ) |
Total investment income | | | 2,811,995 | | | | 59,958,972 | | | | 147,585 | | | | 8,786 | | | | 501,106 | |
| | | | | |
EXPENSES | | | | | | | | | | | | | | | | | | | | |
Investment advisory fees | | | 335,751 | | | | 12,411,380 | | | | 48,493 | | | | 6,710 | | | | 389,639 | |
Distribution fees | | | | | | | | | | | | | | | | | | | | |
Class A | | | 68,092 | | | | 1,259,984 | | | | 8,832 | | | | 28 | | | | 28,157 | |
Class B | | | 2,473 | | | | 5,965 | | | | — | | | | — | | | | — | |
Class C | | | 94,609 | | | | 1,662,035 | | | | 569 | | | | 73 | | | | 24,228 | |
Class R | | | 385 | | | | 20,896 | | | | 248 | | | | — | | | | 222 | |
Transfer agent fees | | | 39,987 | | | | 1,827,663 | | | | 4,898 | | | | 925 | | | | 24,850 | |
Printing and mailing fees | | | 7,622 | | | | 226,602 | | | | 2,036 | | | | 500 | | | | 8,360 | |
Financial accounting fees | | | 5,193 | | | | 214,845 | | | | 750 | | | | 61 | | | | 3,614 | |
Legal fees | | | 9,157 | | | | 119,110 | | | | 8,319 | | | | 500 | | | | 7,681 | |
Accounting fees | | | 14,712 | | | | 145,297 | | | | 18,578 | | | | 1,276 | | | | 10,114 | |
Audit fees | | | 8,007 | | | | 103,550 | | | | 5,732 | | | | 750 | | | | 7,229 | |
Trustees’ fees and officer compensation | | | 8,177 | | | | 97,588 | | | | 7,726 | | | | 775 | | | | 7,765 | |
Registration fees | | | 34,810 | | | | 84,547 | | | | 9,414 | | | | — | | | | 34,369 | |
Custodian fees | | | 2,905 | | | | 62,219 | | | | 10,251 | | | | 825 | | | | 8,123 | |
Dividend or interest expense on short positions | | | — | | | | 2,154,906 | | | | — | | | | 893 | | | | 225,933 | |
Organization expense | | | — | | | | — | | | | — | | | | 13,300 | | | | — | |
Offering costs | | | — | | | | — | | | | 18,281 | | | | 13,450 | | | | — | |
Other | | | 21,981 | | | | 146,203 | | | | 3,435 | | | | 200 | | | | 9,539 | |
Total expenses | | | 653,861 | | | | 20,542,790 | | | | 147,562 | | | | 40,266 | | | | 789,823 | |
Less expense reductions | | | — | | | | — | | | | (73,250 | ) | | | (29,878 | ) | | | — | |
Net expenses | | | 653,861 | | | | 20,542,790 | | | | 74,312 | | | | 10,388 | | | | 789,823 | |
NET INVESTMENT INCOME (LOSS) | | | 2,158,134 | | | | 39,416,182 | | | | 73,273 | | | | (1,602 | ) | | | (288,717 | ) |
| | | | | |
REALIZED AND UNREALIZED GAIN (LOSS) | | | | | | | | | | | | | | | | | | | | |
Net realized gain (loss) from: | | | | | | | | | | | | | | | | | | | | |
Investments | | | (5,164,195 | ) | | | (30,754,766 | ) | | | (2,364 | ) | | | 43,342 | | | | 750,225 | |
Purchased options | | | — | | | | (81,112,241 | ) | | | (443,289 | ) | | | 23,316 | | | | (1,944,931 | ) |
Foreign currency transactions | | | — | | | | 146,802 | | | | — | | | | (391 | ) | | | (9,174 | ) |
Written options | | | — | | | | 57,665,661 | | | | 227,570 | | | | 41,103 | | | | 1,608,623 | |
Short positions | | | — | | | | 47,290,843 | | | | — | | | | (2,127 | ) | | | (291,805 | ) |
Change in net unrealized appreciation/(depreciation) on: | | | | | | | | | | | | | | | | | | | | |
Investments | | | 2,438,013 | | | | (49,695,816 | ) | | | 128,477 | | | | 117,233 | | | | (4,891,216 | ) |
Purchased options | | | — | | | | 9,925,572 | | | | 11,492 | | | | (15,213 | ) | | | 334,316 | |
Foreign currency translations | | | — | | | | 165,041 | | | | — | | | | 35 | | | | 76,861 | |
Written options | | | — | | | | 19,473,914 | | | | 133,685 | | | | (6,405 | ) | | | (294,039 | ) |
Short positions | | | — | | | | 6,749,000 | | | | — | | | | 22,671 | | | | (262,484 | ) |
NET GAIN (LOSS) | | | (2,726,182 | ) | | | (20,145,990 | ) | | | 55,571 | | | | 223,564 | | | | (4,923,624 | ) |
NET INCREASE (DECREASE) IN NET ASSETS RESULTING FROM OPERATIONS | | $ | (568,048 | ) | | $ | 19,270,192 | | | $ | 128,844 | | | $ | 221,962 | | | $ | (5,212,341 | ) |
| (a) | Phineus Long/Short Fund commenced operations April 5, 2016. |
| | | | |
| 152 | | CALAMOS OPEN-END FAMILY OF FUNDS SEMIANNUAL REPORT | | See accompanying Notes to Financial Statements |
Statements of Changes in Net Assets
| | | | | | | | | | | | | | | | | | | | | | | | |
| | | GROWTH FUND | | | OPPORTUNISTIC VALUE FUND | | | FOCUS GROWTH FUND | |
| | | (UNAUDITED)
SIX MONTHS
ENDED
APRIL 30,
2016 | | | YEAR ENDED
OCTOBER 31,
2015 | | | (UNAUDITED)
SIX MONTHS
ENDED
APRIL 30,
2016 | | | YEAR ENDED
OCTOBER 31,
2015 | | | (UNAUDITED)
SIX MONTHS
ENDED
APRIL 30,
2016 | | | YEAR ENDED
OCTOBER 31,
2015 | |
OPERATIONS | | | | | | | | | | | | | | | | | | | | | | | | |
Net investment income (loss) | | $ | (4,842,747 | ) | | $ | (10,420,857 | ) | | $ | 471,371 | | | $ | 1,075,070 | | | $ | (13,009 | ) | | $ | (30,596 | ) |
Net realized gain (loss) | | | 143,172,755 | | | | 700,082,597 | | | | (1,238,977 | ) | | | 5,669,145 | | | | (123,257 | ) | | | 11,279,851 | |
Change in unrealized appreciation/(depreciation) | | | (302,168,789 | ) | | | (481,070,138 | ) | | | 154,496 | | | | (8,618,225 | ) | | | (3,371,888 | ) | | | (7,947,702 | ) |
Net increase (decrease) in net assets resulting from operations | | | (163,838,781 | ) | | | 208,591,602 | | | | (613,110 | ) | | | (1,874,010 | ) | | | (3,508,154 | ) | | | 3,301,553 | |
| | | | | | |
DISTRIBUTIONS TO SHAREHOLDERS | | | | | | | | | | | | | | | | | | | | | | | | |
Net investment income | | | | | | | | | | | | | | | | | | | | | | | | |
Class A | | | — | | | | — | | | | (461,754 | ) | | | (502,337 | ) | | | — | | | | — | |
Class B | | | — | | | | — | | | | — | | | | — | | | | — | | | | — | |
Class C | | | — | | | | — | | | | (21,633 | ) | | | (17,709 | ) | | | — | | | | — | |
Class I | | | — | | | | — | | | | (262,284 | ) | | | (360,195 | ) | | | — | | | | — | |
Class R | | | — | | | | — | | | | (1,573 | ) | | | (1,193 | ) | | | — | | | | — | |
Net realized gains | | | | | | | | | | | | | | | | | | | | | | | | |
Class A | | | (348,035,648 | ) | | | (334,486,301 | ) | | | (2,547,648 | ) | | | (3,570,562 | ) | | | (3,221,717 | ) | | | (1,885,461 | ) |
Class B | | | (4,805,396 | ) | | | (6,995,647 | ) | | | (10,093 | ) | | | (22,490 | ) | | | (51,058 | ) | | | (44,044 | ) |
Class C | | | (243,604,217 | ) | | | (223,372,174 | ) | | | (403,800 | ) | | | (636,667 | ) | | | (2,042,689 | ) | | | (1,433,556 | ) |
Class I | | | (91,511,948 | ) | | | (134,935,100 | ) | | | (1,163,377 | ) | | | (1,911,869 | ) | | | (5,222,205 | ) | | | (2,877,179 | ) |
Class R | | | (2,356,702 | ) | | | (2,037,555 | ) | | | (10,292 | ) | | | (10,016 | ) | | | (77,155 | ) | | | (20,196 | ) |
Return of capital | | | | | | | | | | | | | | | | | | | | | | | | |
Class A | | | — | | | | — | | | | — | | | | — | | | | — | | | | — | |
Class B | | | — | | | | — | | | | — | | | | — | | | | — | | | | — | |
Class C | | | — | | | | — | | | | — | | | | — | | | | — | | | | — | |
Class I | | | — | | | | — | | | | — | | | | — | | | | — | | | | — | |
Total distributions | | | (690,313,911 | ) | | | (701,826,777 | ) | | | (4,882,454 | ) | | | (7,033,038 | ) | | | (10,614,824 | ) | | | (6,260,436 | ) |
| | | | | | |
CAPITAL SHARE TRANSACTIONS | | | 262,439,438 | | | | (265,115,865 | ) | | | (3,090,906 | ) | | | (21,672,940 | ) | | | (313,577 | ) | | | 3,138,780 | |
TOTAL INCREASE (DECREASE) IN NET ASSETS | | | (591,713,254 | ) | | | (758,351,040 | ) | | | (8,586,470 | ) | | | (30,579,988 | ) | | | (14,436,555 | ) | | | 179,897 | |
| | | | | | |
NET ASSETS | | | | | | | | | | | | | | | | | | | | | | | | |
Beginning of period | | $ | 2,726,125,388 | | | $ | 3,484,476,428 | | | $ | 70,441,441 | | | $ | 101,021,429 | | | $ | 64,806,968 | | | $ | 64,627,071 | |
End of period | | | 2,134,412,134 | | | | 2,726,125,388 | | | | 61,854,971 | | | | 70,441,441 | | | | 50,370,413 | | | | 64,806,968 | |
Undistributed net investment income (loss) | | $ | (1,589,769 | ) | | $ | 3,252,978 | | | $ | 663,879 | | | $ | 939,752 | | | $ | (15,536 | ) | | $ | (2,527 | ) |
| | | | | | |
| See accompanying Notes to Financial Statements | | www.calamos.com | | | 153 | |
Statements of Changes in Net Assets
| | | | | | | | | | | | | | | | | | | | | | | | |
| | | DISCOVERY GROWTH FUND | | | DIVIDEND GROWTH FUND | | | MID CAP GROWTH FUND | |
| | | (UNAUDITED)
SIX MONTHS
ENDED
APRIL 30,
2016 | | | YEAR ENDED
OCTOBER 31,
2015 | | | (UNAUDITED)
SIX MONTHS
ENDED
APRIL 30,
2016 | | | YEAR ENDED
OCTOBER 31,
2015 | | | (UNAUDITED)
SIX MONTHS
ENDED
APRIL 30,
2016 | | | YEAR ENDED
OCTOBER 31,
2015 | |
OPERATIONS | | | | | | | | | | | | | | | | | | | | | | | | |
Net investment income (loss) | | $ | (159,349 | ) | | $ | (504,740 | ) | | $ | 173,002 | | | $ | 558,079 | | | $ | (30,867 | ) | | $ | (138,205 | ) |
Net realized gain (loss) | | | (4,489,504 | ) | | | 1,445,056 | | | | (298,755 | ) | | | 409,584 | | | | (1,297,332 | ) | | | 1,951,972 | |
Change in unrealized appreciation/(depreciation) | | | 862,439 | | | | (2,781,869 | ) | | | (367,236 | ) | | | (814,426 | ) | | | (291,027 | ) | | | (2,881,280 | ) |
Net increase (decrease) in net assets resulting from operations | | | (3,786,414 | ) | | | (1,841,553 | ) | | | (492,989 | ) | | | 153,237 | | | | (1,619,226 | ) | | | (1,067,513 | ) |
| | | | | | |
DISTRIBUTIONS TO SHAREHOLDERS | | | | | | | | | | | | | | | | | | | | | | | | |
Net investment income | | | | | | | | | | | | | | | | | | | | | | | | |
Class A | | | — | | | | — | | | | (105,949 | ) | | | (362,247 | ) | | | — | | | | — | |
Class B | | | — | | | | — | | | | — | | | | — | | | | — | | | | — | |
Class C | | | — | | | | — | | | | (567 | ) | | | (4,913 | ) | | | — | | | | — | |
Class I | | | — | | | | — | | | | (49,286 | ) | | | (114,838 | ) | | | — | | | | — | |
Class R | | | — | | | | — | | | | (214 | ) | | | (1,440 | ) | | | — | | | | — | |
Net realized gains | | | | | | | | | | | | | | | | | | | | | | | | |
Class A | | | (224,438 | ) | | | (2,749,737 | ) | | | (740,530 | ) | | | (319,688 | ) | | | (565,411 | ) | | | — | |
Class B | | | (16,091 | ) | | | (162,339 | ) | | | — | | | | — | | | | — | | | | — | |
Class C | | | (26,089 | ) | | | (244,678 | ) | | | (18,239 | ) | | | (4,968 | ) | | | (27,735 | ) | | | — | |
Class I | | | (90,871 | ) | | | (970,172 | ) | | | (186,792 | ) | | | (96,682 | ) | | | (393,240 | ) | | | — | |
Class R | | | (16,644 | ) | | | (171,966 | ) | | | (2,828 | ) | | | (1,326 | ) | | | (6,729 | ) | | | — | |
Return of capital | | | | | | | | | | | | | | | | | | | | | | | | |
Class A | | | — | | | | — | | | | — | | | | — | | | | — | | | | — | |
Class B | | | — | | | | — | | | | — | | | | — | | | | — | | | | — | |
Class C | | | — | | | | — | | | | — | | | | — | | | | — | | | | — | |
Class I | | | — | | | | — | | | | — | | | | — | | | | — | | | | — | |
Total distributions | | | (374,133 | ) | | | (4,298,892 | ) | | | (1,104,405 | ) | | | (906,102 | ) | | | (993,115 | ) | | | — | |
| | | | | | |
CAPITAL SHARE TRANSACTIONS | | | (18,602,602 | ) | | | (3,221,495 | ) | | | 2,038,022 | | | | 56,928 | | | | (13,617,343 | ) | | | (24,075,227 | ) |
TOTAL INCREASE (DECREASE) IN NET ASSETS | | | (22,763,149 | ) | | | (9,361,940 | ) | | | 440,628 | | | | (695,937 | ) | | | (16,229,684 | ) | | | (25,142,740 | ) |
| | | | | | |
NET ASSETS | | | | | | | | | | | | | | | | | | | | | | | | |
Beginning of period | | $ | 38,212,669 | | | $ | 47,574,609 | | | $ | 36,215,890 | | | $ | 36,911,827 | | | $ | 22,395,693 | | | $ | 47,538,433 | |
End of period | | | 15,449,520 | | | | 38,212,669 | | | | 36,656,518 | | | | 36,215,890 | | | | 6,166,009 | | | | 22,395,693 | |
Undistributed net investment income (loss) | | $ | (241,269 | ) | | $ | (81,920 | ) | | $ | 801,698 | | | $ | 784,712 | | | $ | 7,485 | | | $ | 38,352 | |
| | | | |
| 154 | | CALAMOS OPEN-END FAMILY OF FUNDS SEMIANNUAL REPORT | | See accompanying Notes to Financial Statements |
Statements of Changes in Net Assets
| | | | | | | | | | | | | | | | | | | | | | | | |
| | | INTERNATIONAL GROWTH FUND | | | EVOLVING WORLD GROWTH FUND | | | EMERGING MARKET EQUITY FUND | |
| | | (UNAUDITED)
SIX MONTHS
ENDED
APRIL 30,
2016 | | | YEAR ENDED
OCTOBER 31,
2015 | | | (UNAUDITED)
SIX MONTHS
ENDED
APRIL 30,
2016 | | | YEAR ENDED
OCTOBER 31,
2015 | | | (UNAUDITED)
SIX MONTHS
ENDED
APRIL 30,
2016 | | | YEAR ENDED
OCTOBER 31,
2015 | |
OPERATIONS | | | | | | | | | | | | | | | | | | | | | | | | |
Net investment income (loss) | | $ | 1,050,255 | | | $ | 4,024,234 | | | $ | 327,283 | | | $ | 1,596,363 | | | $ | (35,565 | ) | | $ | 7,270 | |
Net realized gain (loss) | | | (20,945,553 | ) | | | 3,300,529 | | | | (44,073,216 | ) | | | (8,984,725 | ) | | | (1,639,472 | ) | | | (747,001 | ) |
Change in unrealized appreciation/(depreciation) | | | (15,712,055 | ) | | | (44,925 | ) | | | 28,673,876 | | | | (53,648,236 | ) | | | 1,307,450 | | | | (1,346,822 | ) |
Net increase (decrease) in net assets resulting from operations | | | (35,607,353 | ) | | | 7,279,838 | | | | (15,072,057 | ) | | | (61,036,598 | ) | | | (367,587 | ) | | | (2,086,553 | ) |
| | | | | | |
DISTRIBUTIONS TO SHAREHOLDERS | | | | | | | | | | | | | | | | | | | | | | | | |
Net investment income | | | | | | | | | | | | | | | | | | | | | | | | |
Class A | | | — | | | | — | | | | (92,329 | ) | | | (307,098 | ) | | | (4,645 | ) | | | (41,566 | ) |
Class B | | | — | | | | — | | | | — | | | | — | | | | — | | | | — | |
Class C | | | — | | | | — | | | | — | | | | — | | | | — | | | | — | |
Class I | | | — | | | | — | | | | (1,119,198 | ) | | | (2,034,145 | ) | | | (40,287 | ) | | | (61,523 | ) |
Class R | | | — | | | | — | | | | — | | | | — | | | | — | | | | (156 | ) |
Net realized gains | | | | | | | | | | | | | | | | | | | | | | | | |
Class A | | | (265,594 | ) | | | (26,448,259 | ) | | | — | | | | (3,433,350 | ) | | | — | | | | — | |
Class B | | | (1,374 | ) | | | (242,569 | ) | | | — | | | | (13,442 | ) | | | — | | | | — | |
Class C | | | (71,999 | ) | | | (6,563,935 | ) | | | — | | | | (1,003,187 | ) | | | — | | | | — | |
Class I | | | (432,514 | ) | | | (43,201,700 | ) | | �� | — | | | | (8,919,021 | ) | | | — | | | | — | |
Class R | | | (11,461 | ) | | | (1,648,974 | ) | | | — | | | | (32,328 | ) | | | — | | | | — | |
Return of capital | | | | | | | | | | | | | | | | | | | | | | | | |
Class A | | | — | | | | — | | | | — | | | | (40 | ) | | | — | | | | — | |
Class B | | | — | | | | — | | | | — | | | | — | | | | — | | | | — | |
Class C | | | — | | | | — | | | | — | | | | — | | | | — | | | | — | |
Class I | | | — | | | | — | | | | — | | | | (265 | ) | | | — | | | | — | |
Total distributions | | | (782,942 | ) | | | (78,105,437 | ) | | | (1,211,527 | ) | | | (15,742,876 | ) | | | (44,932 | ) | | | (103,245 | ) |
| | | | | | |
CAPITAL SHARE TRANSACTIONS | | | (101,647,591 | ) | | | (63,351,312 | ) | | | (32,577,508 | ) | | | (62,269,319 | ) | | | 75,991 | | | | 296,005 | |
TOTAL INCREASE (DECREASE) IN NET ASSETS | | | (138,037,886 | ) | | | (134,176,911 | ) | | | (48,861,092 | ) | | | (139,048,793 | ) | | | (336,528 | ) | | | (1,893,793 | ) |
| | | | | | |
NET ASSETS | | | | | | | | | | | | | | | | | | | | | | | | |
Beginning of period | | $ | 607,416,369 | | | $ | 741,593,280 | | | $ | 512,514,529 | | | $ | 651,563,322 | | | $ | 13,553,436 | | | $ | 15,447,229 | |
End of period | | | 469,378,483 | | | | 607,416,369 | | | | 463,653,437 | | | | 512,514,529 | | | | 13,216,908 | | | | 13,553,436 | |
Undistributed net investment income (loss) | | $ | 883,437 | | | $ | (166,818 | ) | | $ | (1,573,006 | ) | | $ | (688,762 | ) | | $ | (84,295 | ) | | $ | (3,798 | ) |
| | | | | | |
| See accompanying Notes to Financial Statements | | www.calamos.com | | | 155 | |
Statements of Changes in Net Assets
| | | | | | | | | | | | | | | | | | | | | | | | |
| | | GLOBAL EQUITY FUND | | | GROWTH AND INCOME FUND | | | GLOBAL GROWTH AND INCOME FUND | |
| | | (UNAUDITED)
SIX MONTHS
ENDED
APRIL 30,
2016 | | | YEAR ENDED
OCTOBER 31,
2015 | | | (UNAUDITED)
SIX MONTHS
ENDED
APRIL 30,
2016 | | | YEAR ENDED
OCTOBER 31,
2015 | | | (UNAUDITED)
SIX MONTHS
ENDED
APRIL 30,
2016 | | | YEAR ENDED
OCTOBER 31,
2015 | |
OPERATIONS | | | | | | | | | | | | | | | | | | | | | | | | |
Net investment income (loss) | | $ | (48,644 | ) | | $ | 46,559 | | | $ | 16,849,357 | | | $ | 46,228,173 | | | $ | 1,587,954 | | | $ | 4,310,404 | |
Net realized gain (loss) | | | 6,024,758 | | | | 6,071,551 | | | | 3,430,021 | | | | 167,595,445 | | | | (5,396,674 | ) | | | 2,782,109 | |
Change in unrealized appreciation/(depreciation) | | | (16,655,638 | ) | | | 4,546,704 | | | | (57,227,526 | ) | | | (123,738,132 | ) | | | (8,876,393 | ) | | | 604,690 | |
Net increase (decrease) in net assets resulting from operations | | | (10,679,524 | ) | | | 10,664,814 | | | | (36,948,148 | ) | | | 90,085,486 | | | | (12,685,113 | ) | | | 7,697,203 | |
| | | | | | |
DISTRIBUTIONS TO SHAREHOLDERS | | | | | | | | | | | | | | | | | | | | | | | | |
Net investment income | | | | | | | | | | | | | | | | | | | | | | | | |
Class A | | | — | | | | — | | | | (13,556,991 | ) | | | (32,298,585 | ) | | | — | | | | (549,399 | ) |
Class B | | | — | | | | — | | | | (51,050 | ) | | | (167,830 | ) | | | — | | | | — | |
Class C | | | — | | | | — | | | | (7,722,395 | ) | | | (18,307,365 | ) | | | — | | | | — | |
Class I | | | — | | | | — | | | | (7,911,174 | ) | | | (18,901,076 | ) | | | — | | | | (1,008,993 | ) |
Class R | | | — | | | | — | | | | (166,861 | ) | | | (415,706 | ) | | | — | | | | (3,985 | ) |
Net realized gains | | | | | | | | | | | | | | | | | | | | | | | | |
Class A | | | (769,768 | ) | | | (16,689,799 | ) | | | (45,158,073 | ) | | | (136,678,722 | ) | | | (1,349,284 | ) | | | (23,384,613 | ) |
Class B | | | (9,659 | ) | | | (228,886 | ) | | | (299,943 | ) | | | (1,585,363 | ) | | | (21,251 | ) | | | (715,924 | ) |
Class C | | | (434,202 | ) | | | (5,599,563 | ) | | | (36,267,311 | ) | | | (105,660,707 | ) | | | (1,583,129 | ) | | | (26,044,532 | ) |
Class I | | | (1,809,046 | ) | | | (18,756,109 | ) | | | (24,093,672 | ) | | | (73,482,783 | ) | | | (1,753,280 | ) | | | (27,529,458 | ) |
Class R | | | (111,823 | ) | | | (1,686,163 | ) | | | (617,691 | ) | | | (1,953,757 | ) | | | (16,132 | ) | | | (278,726 | ) |
Return of capital | | | | | | | | | | | | | | | | | | | | | | | | |
Class A | | | — | | | | — | | | | — | | | | — | | | | — | | | | — | |
Class B | | | — | | | | — | | | | — | | | | — | | | | — | | | | — | |
Class C | | | — | | | | — | | | | — | | | | — | | | | — | | | | — | |
Class I | | | — | | | | — | | | | — | | | | — | | | | — | | | | — | |
Total distributions | | | (3,134,498 | ) | | | (42,960,520 | ) | | | (135,845,161 | ) | | | (389,451,894 | ) | | | (4,723,076 | ) | | | (79,515,630 | ) |
| | | | | | |
CAPITAL SHARE TRANSACTIONS | | | (30,524,726 | ) | | | (3,109,157 | ) | | | (63,887,725 | ) | | | (155,916,630 | ) | | | (28,234,860 | ) | | | (33,583,373 | ) |
TOTAL INCREASE (DECREASE) IN NET ASSETS | | | (44,338,748 | ) | | | (35,404,863 | ) | | | (236,681,034 | ) | | | (455,283,038 | ) | | | (45,643,049 | ) | | | (105,401,800 | ) |
| | | | | | |
NET ASSETS | | | | | | | | | | | | | | | | | | | | | | | | |
Beginning of period | | $ | 192,390,005 | | | $ | 227,794,868 | | | $ | 2,597,021,183 | | | $ | 3,052,304,221 | | | $ | 380,863,213 | | | $ | 486,265,013 | |
End of period | | | 148,051,257 | | | | 192,390,005 | | | | 2,360,340,149 | | | | 2,597,021,183 | | | | 335,220,164 | | | | 380,863,213 | |
Undistributed net investment income (loss) | | $ | 90,885 | | | $ | 139,529 | | | $ | (6,448,607 | ) | | $ | 6,110,507 | | | $ | 971,849 | | | $ | (616,105 | ) |
| | | | |
| 156 | | CALAMOS OPEN-END FAMILY OF FUNDS SEMIANNUAL REPORT | | See accompanying Notes to Financial Statements |
Statements of Changes in Net Assets
| | | | | | | | | | | | | | | | | | | | | | | | |
| | | CONVERTIBLE FUND | | | GLOBAL CONVERTIBLE FUND | | | TOTAL RETURN BOND FUND | |
| | | (UNAUDITED)
SIX MONTHS
ENDED
APRIL 30,
2016 | | | YEAR ENDED
OCTOBER 31,
2015 | | | (UNAUDITED)
SIX MONTHS
ENDED
APRIL 30,
2016 | | | YEAR ENDED
OCTOBER 31,
2015(a) | | | (UNAUDITED)
SIX MONTHS
ENDED
APRIL 30,
2016 | | | YEAR ENDED
OCTOBER 31,
2015 | |
OPERATIONS | | | | | | | | | | | | | | | | | | | | | | | | |
Net investment income (loss) | | $ | 14,440,103 | | | $ | 30,651,934 | | | $ | 949,701 | | | $ | 313,511 | | | $ | 1,039,127 | | | $ | 1,927,173 | |
Net realized gain (loss) | | | (23,708,453 | ) | | | 51,010,485 | | | | (1,693,021 | ) | | | (622,148 | ) | | | (105,528 | ) | | | 1,517,396 | |
Change in unrealized appreciation/(depreciation) | | | (27,350,866 | ) | | | (122,101,608 | ) | | | (234,908 | ) | | | (580,713 | ) | | | 1,665,076 | | | | (1,763,674 | ) |
Net increase (decrease) in net assets resulting from operations | | | (36,619,216 | ) | | | (40,439,189 | ) | | | (978,228 | ) | | | (889,350 | ) | | | 2,598,675 | | | | 1,680,895 | |
| | | | | | |
DISTRIBUTIONS TO SHAREHOLDERS | | | | | | | | | | | | | | | | | | | | | | | | |
Net investment income | | | | | | | | | | | | | | | | | | | | | | | | |
Class A | | | (5,991,007 | ) | | | (14,689,931 | ) | | | (224,601 | ) | | | (73,599 | ) | | | (877,542 | ) | | | (1,340,474 | ) |
Class B | | | (52,418 | ) | | | (125,993 | ) | | | — | | | | — | | | | (10,823 | ) | | | (27,355 | ) |
Class C | | | (3,635,717 | ) | | | (7,505,842 | ) | | | (12,630 | ) | | | (4,384 | ) | | | (196,578 | ) | | | (326,886 | ) |
Class I | | | (8,101,806 | ) | | | (19,045,320 | ) | | | (403,420 | ) | | | (171,040 | ) | | | (321,844 | ) | | | (391,067 | ) |
Class R | | | (34,935 | ) | | | (72,044 | ) | | | (1,258 | ) | | | (999 | ) | | | (4,484 | ) | | | (5,871 | ) |
Net realized gains | | | | | | | | | | | | | | | | | | | | | | | | |
Class A | | | (5,609,807 | ) | | | (22,983,932 | ) | | | — | | | | — | | | | (664,826 | ) | | | (670,900 | ) |
Class B | | | (66,643 | ) | | | (361,425 | ) | | | — | | | | — | | | | (11,396 | ) | | | (19,196 | ) |
Class C | | | (4,198,102 | ) | | | (15,095,422 | ) | | | — | | | | — | | | | (203,238 | ) | | | (203,184 | ) |
Class I | | | (6,966,433 | ) | | | (27,856,761 | ) | | | — | | | | — | | | | (230,880 | ) | | | (144,935 | ) |
Class R | | | (34,207 | ) | | | (115,733 | ) | | | — | | | | — | | | | (3,487 | ) | | | (2,543 | ) |
Return of capital | | | | | | | | | | | | | | | | | | | | | | | | |
Class A | | | — | | | | — | | | | — | | | | — | | | | — | | | | — | |
Class B | | | — | | | | — | | | | — | | | | — | | | | — | | | | — | |
Class C | | | — | | | | — | | | | — | | | | — | | | | — | | | | — | |
Class I | | | — | | | | — | | | | — | | | | — | | | | — | | | | — | |
Total distributions | | | (34,691,075 | ) | | | (107,852,403 | ) | | | (641,909 | ) | | | (250,022 | ) | | | (2,525,098 | ) | | | (3,132,411 | ) |
| | | | | | |
CAPITAL SHARE TRANSACTIONS | | | (227,667,170 | ) | | | (111,866,169 | ) | | | 31,222,592 | | | | 46,192,838 | | | | 15,957,470 | | | | (13,888,090 | ) |
TOTAL INCREASE (DECREASE) IN NET ASSETS | | | (298,977,461 | ) | | | (260,157,761 | ) | | | 29,602,455 | | | | 45,053,466 | | | | 16,031,047 | | | | (15,339,606 | ) |
| | | | | | |
NET ASSETS | | | | | | | | | | | | | | | | | | | | | | | | |
Beginning of period | | $ | 1,114,799,004 | | | $ | 1,374,956,765 | | | $ | 45,053,466 | | | $ | — | | | $ | 85,224,928 | | | $ | 100,564,534 | |
End of period | | | 815,821,543 | | | | 1,114,799,004 | | | | 74,655,921 | | | | 45,053,466 | | | | 101,255,975 | | | | 85,224,928 | |
Undistributed net investment income (loss) | | $ | (857,527 | ) | | $ | 2,518,253 | | | $ | 432,954 | | | $ | 125,162 | | | $ | (593,765 | ) | | $ | (221,621 | ) |
| (a) | Global Convertible Fund commenced operations on December 31, 2014. |
| | | | | | |
| See accompanying Notes to Financial Statements | | www.calamos.com | | | 157 | |
Statements of Changes in Net Assets
| | | | | | | | | | | | | | | | | | | | | | | | |
| | | HIGH INCOME FUND | | | MARKET NEUTRAL INCOME FUND | | | HEDGED EQUITY INCOME FUND | |
| | | (UNAUDITED)
SIX MONTHS
ENDED
APRIL 30,
2016 | | | YEAR ENDED
OCTOBER 31,
2015 | | | (UNAUDITED)
SIX MONTHS
ENDED
APRIL 30,
2016 | | | YEAR ENDED
OCTOBER 31,
2015 | | | (UNAUDITED)
SIX MONTHS
ENDED
APRIL 30,
2016 | | | YEAR ENDED
OCTOBER 31,
2015(a) | |
OPERATIONS | | | | | | | | | | | | | | | | | | | | | | | | |
Net investment income (loss) | | $ | 2,158,134 | | | $ | 6,183,996 | | | $ | 39,416,182 | | | $ | 66,591,495 | | | $ | 73,273 | | | $ | 81,269 | |
Net realized gain (loss) | | | (5,164,195 | ) | | | (2,354,906 | ) | | | (6,763,701 | ) | | | 32,564,762 | | | | (218,083 | ) | | | 304,743 | |
Change in unrealized appreciation/(depreciation) | | | 2,438,013 | | | | (8,869,137 | ) | | | (13,382,289 | ) | | | (31,131,108 | ) | | | 273,654 | | | | (284,373 | ) |
Net increase (decrease) in net assets resulting from operations | | | (568,048 | ) | | | (5,040,047 | ) | | | 19,270,192 | | | | 68,025,149 | | | | 128,844 | | | | 101,639 | |
| | | | | | |
DISTRIBUTIONS TO SHAREHOLDERS | | | | | | | | | | | | | | | | | | | | | | | | |
Net investment income | | | | | | | | | | | | | | | | | | | | | | | | |
Class A | | | (1,420,931 | ) | | | (4,302,176 | ) | | | (6,599,374 | ) | | | (10,660,238 | ) | | | (75,693 | ) | | | (36,766 | ) |
Class B | | | (10,384 | ) | | | (53,176 | ) | | | — | | | | (2,151 | ) | | | — | | | | — | |
Class C | | | (401,998 | ) | | | (1,034,441 | ) | | | (880,638 | ) | | | (686,837 | ) | | | (786 | ) | | | (289 | ) |
Class I | | | (427,079 | ) | | | (1,191,751 | ) | | | (18,438,979 | ) | | | (29,673,184 | ) | | | (70,993 | ) | | | (42,418 | ) |
Class R | | | (3,830 | ) | | | (8,290 | ) | | | (44,162 | ) | | | (55,036 | ) | | | (1,010 | ) | | | (538 | ) |
Net realized gains | | | | | | | | | | | | | | | | | | | | | | | | |
Class A | | | — | | | | (2,495,790 | ) | | | (15,743,390 | ) | | | (12,913,256 | ) | | | (49,274 | ) | | | — | |
Class B | | | — | | | | (45,543 | ) | | | (20,890 | ) | | | (39,864 | ) | | | — | | | | — | |
Class C | | | — | | | | (687,431 | ) | | | (4,999,398 | ) | | | (3,594,843 | ) | | | (941 | ) | | | — | |
Class I | | | — | | | | (615,285 | ) | | | (35,916,097 | ) | | | (27,320,322 | ) | | | (48,109 | ) | | | — | |
Class R | | | — | | | | (4,908 | ) | | | (130,687 | ) | | | (86,045 | ) | | | (877 | ) | | | — | |
Return of capital | | | | | | | | | | | | | | | | | | | | | | | | |
Class A | | | — | | | | (52 | ) | | | — | | | | — | | | | — | | | | — | |
Class B | | | — | | | | (1 | ) | | | — | | | | — | | | | — | | | | — | |
Class C | | | — | | | | (12 | ) | | | — | | | | — | | | | — | | | | — | |
Class I | | | — | | | | (14 | ) | | | — | | | | — | | | | — | | | | — | |
Total distributions | | | (2,264,222 | ) | | | (10,438,870 | ) | | | (82,773,615 | ) | | | (85,031,776 | ) | | | (247,683 | ) | | | (80,011 | ) |
| | | | | | |
CAPITAL SHARE TRANSACTIONS | | | (13,525,499 | ) | | | (62,313,822 | ) | | | 32,756,274 | | | | (390,222,854 | ) | | | 4,698,887 | | | | 11,366,283 | |
TOTAL INCREASE (DECREASE) IN NET ASSETS | | | (16,357,769 | ) | | | (77,792,739 | ) | | | (30,747,149 | ) | | | (407,229,481 | ) | | | 4,580,048 | | | | 11,387,911 | |
| | | | | | |
NET ASSETS | | | | | | | | | | | | | | | | | | | | | | | | |
Beginning of period | | $ | 110,944,695 | | | $ | 188,737,434 | | | $ | 3,778,566,903 | | | $ | 4,185,796,384 | | | $ | 11,387,911 | | | $ | — | |
End of period | | | 94,586,926 | | | | 110,944,695 | | | | 3,747,819,754 | | | | 3,778,566,903 | | | | 15,967,959 | | | | 11,387,911 | |
Undistributed net investment income (loss) | | $ | (176,953 | ) | | $ | (70,865 | ) | | $ | 16,345,329 | | | $ | 2,892,300 | | | $ | (16,509 | ) | | $ | 58,700 | |
| (a) | Hedged Equity Income Fund commenced operations December 31, 2014. |
| | | | |
| 158 | | CALAMOS OPEN-END FAMILY OF FUNDS SEMIANNUAL REPORT | | See accompanying Notes to Financial Statements |
Statements of Changes in Net Assets
| | | | | | | | | | | | |
| | | PHINEUS
LONG/SHORT FUND | | | LONG/SHORT FUND | |
| | | (UNAUDITED)
PERIOD ENDED
APRIL 30,
2016(a) | | | (UNAUDITED)
SIX MONTHS
ENDED
APRIL 30,
2016 | | | YEAR ENDED
OCTOBER 31,
2015 | |
OPERATIONS | | | | | | | | | | | | |
Net investment income (loss) | | $ | (1,602 | ) | | $ | (288,717 | ) | | $ | (1,321,438 | ) |
Net realized gain (loss) | | | 105,243 | | | | 112,938 | | | | 2,373,298 | |
Change in unrealized appreciation/(depreciation) | | | 118,321 | | | | (5,036,562 | ) | | | (990,675 | ) |
Net increase (decrease) in net assets resulting from operations | | | 221,962 | | | | (5,212,341 | ) | | | 61,185 | |
| | | |
DISTRIBUTIONS TO SHAREHOLDERS | | | | | | | | | | | | |
Net investment income | | | | | | | | | | | | |
Class A | | | — | | | | — | | | | — | |
Class B | | | — | | | | — | | | | — | |
Class C | | | — | | | | — | | | | — | |
Class I | | | — | | | | — | | | | — | |
Class R | | | — | | | | — | | | | — | |
Net realized gains | | | | | | | | | | | | |
Class A | | | — | | | | — | | | | (470,012 | ) |
Class B | | | — | | | | — | | | | — | |
Class C | | | — | | | | — | | | | (77,702 | ) |
Class I | | | — | | | | — | | | | (935,646 | ) |
Class R | | | — | | | | — | | | | (1,308 | ) |
Return of capital | | | | | | | | | | | | |
Class A | | | — | | | | — | | | | — | |
Class B | | | — | | | | — | | | | — | |
Class C | | | — | | | | — | | | | — | |
Class I | | | — | | | | — | | | | — | |
Total distributions | | | — | | | | — | | | | (1,484,668 | ) |
| | | |
CAPITAL SHARE TRANSACTIONS | | | 12,871,809 | | | | (32,105,059 | ) | | | (45,663,152 | ) |
TOTAL INCREASE (DECREASE) IN NET ASSETS | | | 13,093,771 | | | | (37,317,400 | ) | | | (47,086,635 | ) |
| | | |
NET ASSETS | | | | | | | | | | | | |
Beginning of period | | $ | — | | | $ | 82,887,262 | | | $ | 129,973,897 | |
End of period | | | 13,093,771 | | | | 45,569,862 | | | | 82,887,262 | |
Undistributed net investment income (loss) | | $ | (1,602 | ) | | $ | 99,694 | | | $ | 388,411 | |
| (a) | Phineus Long/Short Fund commenced operations April 5, 2016. |
| | | | | | |
| See accompanying Notes to Financial Statements | | www.calamos.com | | | 159 | |
Notes to Financial Statements (Unaudited)
Note 1 – Organization and Significant Accounting Policies
Organization. CALAMOS INVESTMENT TRUST, a Massachusetts business trust organized December 21, 1987 (the “Trust”), consists of twenty series, Growth Fund, Opportunistic Value Fund, Focus Growth Fund, Discovery Growth Fund, Dividend Growth Fund, Mid Cap Growth Fund, International Growth Fund, Evolving World Growth Fund, Emerging Market Equity Fund, Global Equity Fund, Growth and Income Fund, Global Growth and Income Fund, Convertible Fund, Global Convertible Fund, Total Return Bond Fund, High Income Fund, Market Neutral Income Fund, Hedged Equity Income Fund, Phineus Long/Short Fund (commenced operations on April 5, 2016), and Long/Short Fund (each a “Fund” and collectively the “Funds”). The Trust is registered under the Investment Company Act of 1940 as amended (the “1940 Act”) as an open-end management investment company. The Trust currently offers Class A, Class C, Class I and Class R shares of each of the Funds. Class B shares continue to be outstanding, but are no longer an offered class of shares.
Significant Accounting Policies. The financial statements have been prepared in conformity with accounting principles generally accepted in the United States of America (GAAP), which require management to make certain estimates and assumptions at the date of the financial statements. Actual results may differ from those estimates. Subsequent events, if any, through the date that the financial statements were issued have been evaluated in the preparation of the financial statements. The following summarizes the significant accounting policies of the Funds:
Fund Valuation. The valuation of the Funds’ investments is in accordance with policies and procedures adopted by and under the ultimate supervision of the board of trustees.
Fund securities that are traded on U.S. securities exchanges, except option securities, are valued at the official closing price, which is the last current reported sales price on its principal exchange at the time each Fund determines its net asset value (“NAV”). Securities traded in the over-the-counter market and quoted on The NASDAQ Stock Market are valued at the NASDAQ Official Closing Price, as determined by NASDAQ, or lacking a NASDAQ Official Closing Price, the last current reported sale price on NASDAQ at the time a Fund determines its NAV. When a last sale or closing price is not available, equity securities, other than option securities, that are traded on a U.S. securities exchange and other equity securities traded in the over-the-counter market are valued at the mean between the most recent bid and asked quotations on its principal exchange in accordance with guidelines adopted by the board of trustees. Each option security traded on a U.S. securities exchange is valued at the mid-point of the consolidated bid/ask quote for the option security, also in accordance with guidelines adopted by the board of trustees. Each over-the-counter option that is not traded through the Options Clearing Corporation is valued based on a quotation provided by the counterparty to such option under the ultimate supervision of the board of trustees.
Fixed income securities, certain convertible preferred securities, and non-exchange traded derivatives are normally valued by independent pricing services or by dealers or brokers who make markets in such securities. Valuations of such fixed income securities, certain convertible preferred securities and non-exchange traded derivatives consider yield or price of equivalent securities of comparable quality, coupon rate, maturity, type of issue, trading characteristics and other market data and do not rely exclusively upon exchange or over-the-counter prices.
Trading on European and Far Eastern exchanges and over-the-counter markets is typically completed at various times before the close of business on each day on which the New York Stock Exchange (“NYSE”) is open. Each security trading on these exchanges or in over-the-counter markets may be valued utilizing a systematic fair valuation model provided by an independent pricing service approved by the board of trustees. The valuation of each security that meets certain criteria in relation to the valuation model is systematically adjusted to reflect the impact of movement in the U.S. market after the foreign markets close. Securities that do not meet the criteria, or that are principally traded in other foreign markets, are valued as of the last reported sale price at the time the respective Fund determines its NAV, or when reliable market prices or quotations are not readily available, at the mean between the most recent bid and asked quotations as of the close of the appropriate exchange or other designated time. Trading of foreign securities may not take place on every NYSE business day. In addition, trading may take place in various foreign markets on Saturdays or on other days when the NYSE is not open and on which the respective Fund’s NAV is not calculated.
If the pricing committee determines that the valuation of a security in accordance with the methods described above is not reflective of a fair value for such security, the security is valued at a fair value by the pricing committee, under the ultimate supervision of the board of trustees, following the guidelines and/or procedures adopted by the board of trustees.
| | | | |
| 160 | | CALAMOS OPEN-END FAMILY OF FUNDS SEMIANNUAL REPORT | | |
Notes to Financial Statements (Unaudited)
Each Fund also may use fair value pricing, pursuant to guidelines adopted by the board of trustees and under the ultimate supervision of the board of trustees, if trading in the security is halted or if the value of a security it holds is materially affected by events occurring before the Fund’s pricing time but after the close of the primary market or exchange on which the security is listed. Those procedures may utilize valuations furnished by pricing services approved by the board of trustees, which may be based on market transactions for comparable securities and various relationships between securities that are generally recognized by institutional traders, a computerized matrix system, or appraisals derived from information concerning the securities or similar securities received from recognized dealers in those securities.
When fair value pricing of securities is employed, the prices of securities used by the Fund to calculate its NAV may differ from market quotations or official closing prices. In light of the judgment involved in fair valuations, there can be no assurance that a fair value assigned to a particular security is accurate.
Investment Transactions. Investment transactions are recorded on a trade date basis as of April 30, 2016. Net realized gains and losses from investment transactions are reported on an identified cost basis. Interest income is recognized using the accrual method and includes accretion of original issue and market discount and amortization of premium. Dividend income is recognized on the ex-dividend date, except that certain dividends from foreign securities are recorded as soon as the information becomes available after the ex-dividend date.
Foreign Currency Translation. Values of investments and other assets and liabilities denominated in foreign currencies are translated into U.S. dollars using a rate quoted by a major bank or dealer in the particular currency market, as reported by a recognized quotation dissemination service.
The Funds do not isolate that portion of the results of operations resulting from changes in foreign exchange rates on investments from the fluctuations arising from changes in market prices of securities held. Such fluctuations are included with the net realized and unrealized gain or loss from investments.
Reported net realized foreign currency gains or losses arise from disposition of foreign currency, the difference in the foreign exchange rates between the trade and settlement dates on securities transactions, and the difference between the amounts of dividends, interest and foreign withholding taxes recorded on the ex-date or accrual date and the U.S. dollar equivalent of the amounts actually received or paid. Net unrealized foreign exchange gains and losses arise from changes (due to the changes in the exchange rate) in the value of foreign currency and other assets and liabilities denominated in foreign currencies held at period end.
Allocation of Expenses Among Funds and Classes. Expenses directly attributable to a Fund are charged to that Fund; certain other common expenses of the Trust, Calamos Advisors Trust, Calamos ETF Trust, Calamos Convertible Opportunities and Income Fund, Calamos Convertible and High Income Fund, Calamos Strategic Total Return Fund, Calamos Global Total Return Fund, Calamos Global Dynamic Income Fund and Calamos Dynamic Convertible and Income Fund are allocated proportionately among each Fund to which the expenses relate in relation to the net assets of each Fund or on another reasonable basis. Expenses directly attributable to a particular class of a Fund in the Trust are charged directly to such class. In calculating the net asset value per share of each class, investment income, realized and unrealized gains and losses and expenses other than class specific expenses are allocated daily to each class of shares based upon the proportion of net assets of each class at the beginning of each day plus current day fund share activity.
Income Taxes. No provision has been made for U.S. income taxes because the Trust’s policy is to continue to qualify as a regulated investment company under the Internal Revenue Code of 1986, as amended, and distribute to shareholders substantially all of the Funds’ taxable income and net realized gains.
Dividends and distributions paid to shareholders are recorded on the ex-dividend date. The amount of dividends and distributions from net investment income and net realized capital gains is determined in accordance with federal income tax regulations, which may differ from U.S. generally accepted accounting principles. To the extent these “book/tax” differences are permanent in nature, such amounts are reclassified within the capital accounts based on their federal tax basis treatment. These differences are primarily due to differing treatments for foreign currency transactions, contingent payment debt instruments and methods of amortizing and accreting for fixed income securities. The financial statements are not adjusted for temporary differences.
The Funds recognized no liability for uncertain tax positions. A reconciliation is not provided as the beginning and ending amounts of unrecognized benefits are zero, with no interim additions, reductions or settlements. Tax years 2011 and forward remain subject to
Notes to Financial Statements (Unaudited)
examination by U.S. and State tax jurisdictions for those Funds that have been in existence during that time, and for all years since inception for those Funds created subsequent to October 31, 2010.
Indemnifications. Under the Trust’s organizational documents, the Trust is obligated to indemnify its officers and trustees against certain liabilities incurred by them by reason of having been an officer or trustee of the Trust. In addition, in the normal course of business, the Trust may enter into contracts that provide general indemnifications to other parties. Each Fund’s maximum exposure under these arrangements is unknown as this would involve future claims that may be made against the Fund that have not yet occurred. Currently, the Funds’ management expects the risk of material loss in connection to a potential claim to be remote.
Note 2 – Investment Adviser and Transactions With Affiliates Or Certain Other Parties
Pursuant to an investment advisory agreement with Calamos Advisors LLC (“Calamos Advisors”), each Fund pays a monthly investment advisory fee based on the average daily net assets of the Fund, as shown below:
| | | | | | | | | | | | | | | | |
| AVERAGE DAILY NET ASSETS | | GROWTH FUND
ANNUAL RATE | | | EVOLVING WORLD
GROWTH FUND,
EMERGING MARKET
EQUITY FUND
ANNUAL RATE | | | TOTAL RETURN
BOND FUND
ANNUAL RATE | | | OPPORTUNISTIC VALUE FUND, FOCUS GROWTH FUND, DIVIDEND GROWTH FUND, MID CAP GROWTH FUND,
INTERNATIONAL GROWTH FUND*,
GLOBAL EQUITY FUND*, GLOBAL GROWTH AND INCOME FUND
ANNUAL RATE | |
| First $500 million | | | 1.00% | | | | 1.10% | | | | 0.55% | | | | 1.00% | |
| | | | |
| Next $500 million | | | 0.90% | | | | 1.05% | | | | 0.53% | | | | 0.95% | |
| | | | |
| Next $5 billion | | | 0.80% | | | | 1.00% | | | | 0.51% | | | | 0.90% | |
| | | | |
| Next $5 billion | | | 0.78% | | | | 0.98% | | | | 0.49% | | | | 0.88% | |
| | | | |
| Next $5 billion | | | 0.76% | | | | 0.96% | | | | 0.48% | | | | 0.86% | |
| | | | |
| Next $5 billion | | | 0.74% | | | | 0.94% | | | | 0.47% | | | | 0.84% | |
| | | | |
| Next $5 billion | | | 0.72% | | | | 0.92% | | | | 0.46% | | | | 0.82% | |
| | | | |
| Over $26 billion | | | 0.70% | | | | 0.90% | | | | 0.45% | | | | 0.80% | |
| | | | |
| * | International Growth Fund and Global Equity Fund are subject to a possible adjustment based on performance as described below. |
| | | | | | | | | | | | | | | | |
| AVERAGE DAILY NET ASSETS | | GLOBAL
CONVERTIBLE
FUND
ANNUAL RATE | | | GROWTH AND INCOME FUND,
CONVERTIBLE FUND, HIGH
INCOME FUND, MARKET
NEUTRAL INCOME FUND,
HEDGED EQUITY INCOME FUND
ANNUAL RATE | | | PHINEUS LONG/SHORT FUND,
LONG/SHORT FUND
ANNUAL RATE | | | DISCOVERY
GROWTH
FUND
ANNUAL RATE | |
| First $500 million | | | 0.85 | % | | | 0.75 | % | | | 1.25 | % | | | 1.00 | % |
| | | | |
| Next $500 million | | | 0.80 | % | | | 0.70 | % | | | 1.20 | % | | | 0.90 | % |
| | | | |
| Over $1 billion | | | 0.75 | % | | | 0.65 | % | | | 1.15 | % | | | 0.80 | % |
| | | | |
Each of the International Growth and Global Equity Funds pays a fee based on average daily net assets of the Fund that is accrued daily and paid on a monthly basis, subject to possible adjustment based on the Fund’s investment performance (since March 2006 for International Growth Fund and since February 2008 for Global Equity Fund). The performance adjustment increases or decreases the management fee, on a monthly basis, by 1/12 of 0.03% of a Fund’s average daily net assets over the performance period for each full 1% increment amount by which a Fund outperforms or underperforms the benchmark index (“Index”), on an annualized basis, over the performance measurement period. The benchmark indexes are the MSCI EAFE Growth Index and the MSCI World Index for the International Growth Fund and Global Equity Fund, respectively.
The base fee is shown in the table above. The performance adjustment rate is calculated by comparing over the performance measurement period the Fund’s Class A share performance to that of the respective Index. The performance measurement period commenced at the beginning of each Fund’s first full month of operation (April 2005 and March 2007 for the International Growth Fund and Global Equity Fund, respectively). The first performance adjustment was applied to the advisory fee at the end of the
| | | | |
| 162 | | CALAMOS OPEN-END FAMILY OF FUNDS SEMIANNUAL REPORT | | |
Notes to Financial Statements (Unaudited)
twelfth month. Each month subsequent to the twelfth month, a new month is added to the performance measurement period until the performance measurement period includes 36 months. Thereafter, the performance measurement period consists of the most recent month plus the previous 35 months.
The performance comparison is made at the end of each month. The maximum annualized performance adjustment rate is +/- 0.30% of the Fund’s average daily net assets over the performance measurement period. The performance adjustment rate is divided by twelve and multiplied by the Fund’s average daily net assets over the performance measurement period, and the resulting dollar amount is then added to or subtracted from the base fee. Calamos Advisors may receive a positive performance adjustment even if the Fund has a negative return over a performance measurement period if it otherwise outperforms the Index during that period.
Pursuant to a financial accounting services agreement, during the period the Funds paid Calamos Advisors a fee for financial accounting services payable monthly at the annual rate of 0.0175% on the first $1 billion of combined assets, 0.0150% on the next $1 billion of combined assets and 0.0110% on combined assets above $2 billion (for purposes of this calculation “combined assets” means the sum of the total average daily net assets of Calamos Investment Trust, Calamos Advisors Trust, Calamos ETF Trust and the total average weekly managed assets of Calamos Convertible and High Income Fund, Calamos Strategic Total Return Fund, Calamos Convertible Opportunities and Income Fund, Calamos Global Total Return Fund, Calamos Global Dynamic Income Fund and Calamos Dynamic Convertible and Income Fund). Financial accounting services include, but are not limited to, the following: managing expenses and expense payment processing; monitoring the calculation of expense accrual amounts; calculating, tracking and reporting tax adjustments on all assets; and monitoring trustee deferred compensation plan accruals and valuations. The Funds pay their pro rata share of the financial accounting services fee payable to Calamos Advisors based on their relative portion of combined assets used in calculating the fee.
The Funds reimburses Calamos Advisors for a portion of compensation paid to the Trust’s Chief Compliance Officer. This compensation is reported as part of the “Trustees’ fees and officer compensation” expense on the Statements of Operations.
Calamos Advisors has contractually agreed to limit the annual ordinary operating expenses of each Fund as a percentage of the average daily net assets as follows:
| | | | | | | | | | | | | | | | | | | | |
| FUND | | CLASS A
SHARES | | | CLASS B
SHARES | | | CLASS C
SHARES | | | CLASS I
SHARES | | | CLASS R
SHARES | |
| Growth Fund | | | 1.75% | | | | 2.50% | | | | 2.50% | | | | 1.50% | | | | 2.00% | |
| Opportunistic Value Fund | | | 1.15% | | | | 1.90% | | | | 1.90% | | | | 0.90% | | | | 1.40% | |
| Focus Growth Fund | | | 1.15% | | | | 1.90% | | | | 1.90% | | | | 0.90% | | | | 1.40% | |
| Discovery Growth Fund | | | 1.50% | | | | 2.25% | | | | 2.25% | | | | 1.25% | | | | 1.75% | |
| Dividend Growth Fund | | | 1.35% | | | | — | | | | 2.10% | | | | 1.10% | | | | 1.60% | |
| Mid Cap Growth Fund | | | 1.25% | | | | — | | | | 2.00% | | | | 1.00% | | | | 1.50% | |
| International Growth Fund | | | 1.40% | | | | 2.15% | | | | 2.15% | | | | 1.15% | | | | 1.65% | |
| Evolving World Growth Fund | | | 1.75% | | | | 2.50% | | | | 2.50% | | | | 1.50% | | | | 2.00% | |
| Emerging Market Equity Fund | | | 1.75% | | | | — | | | | 2.50% | | | | 1.50% | | | | 2.00% | |
| Global Equity Fund | | | 1.40% | | | | 2.15% | | | | 2.15% | | | | 1.15% | | | | 1.65% | |
| Growth and Income Fund | | | 1.75% | | | | 2.50% | | | | 2.50% | | | | 1.50% | | | | 2.00% | |
| Global Growth and Income Fund | | | 1.75% | | | | 2.50% | | | | 2.50% | | | | 1.50% | | | | 2.00% | |
| Convertible Fund | | | 1.75% | | | | 2.50% | | | | 2.50% | | | | 1.50% | | | | 2.00% | |
| Global Convertible Fund | | | 1.35% | | | | — | | | | 2.10% | | | | 1.10% | | | | 1.60% | |
| Total Return Bond Fund | | | 0.90% | | | | 1.65% | | | | 1.65% | | | | 0.65% | | | | 1.15% | |
| High Income Fund | | | 1.75% | | | | 2.50% | | | | 2.50% | | | | 1.50% | | | | 2.00% | |
| Market Neutral Income Fund | | | 1.75% | | | | 2.50% | | | | 2.50% | | | | 1.75% | | | | 2.25% | |
| Hedged Equity Income Fund | | | 1.25% | | | | — | | | | 2.00% | | | | 1.00% | | | | 1.50% | |
| Phineus Long/Short Fund | | | 2.00% | | | | — | | | | 2.75% | | | | 1.75% | | | | — | |
| Long/Short Fund | | | 2.00% | | | | — | | | | 2.75% | | | | 1.75% | | | | 2.25% | |
Notes to Financial Statements (Unaudited)
These agreements are binding on Calamos Advisors through March 31, 2018.
For the period ended April 30, 2016, Calamos Advisors waived or absorbed the following expenses:
| | | | |
| FUND | | AMOUNT | |
| Opportunistic Value Fund | | $ | 140,045 | |
| Focus Growth Fund | | | 134,557 | |
| Discovery Growth Fund | | | 43,658 | |
| Dividend Growth Fund | | | 66,545 | |
| Mid Cap Growth Fund | | | 77,376 | |
| Emerging Market Equity Fund | | | 52,130 | |
| Global Equity Fund | | | 89,780 | |
| Global Convertible Fund | | | 44,326 | |
| Total Return Bond Fund | | | 84,986 | |
| Hedged Equity Income Fund | | | 73,250 | |
| Phineus Long/Short Fund | | | 29,878 | |
These amounts are included in the Statements of Operations under the caption “Expense reductions”.
As Distributor, Calamos Financial Services LLC (“CFS”) assumed all expenses of personnel, office space, office facilities and equipment incidental to such service. Each Fund has adopted a Distribution Plan pursuant to Rule 12b-1 under the 1940 Act whereby the Fund pays to CFS a distribution and/or service fee at the annual rate of 0.25% of the average daily net assets of the Fund’s Class A shares; a service fee at the annual rate of 0.25% and a distribution fee at the rate of 0.75% of the average daily net assets of the Fund’s Class B and Class C shares; and a service fee at the annual rate of 0.25% and a distribution fee of 0.25% of the average daily net assets of the Fund’s Class R shares. No such fees are paid on each Fund’s Class I shares.
CFS also receives a sales commission and/or an underwriting fee on certain sales of each Fund’s Class A shares. During the period ended April 30, 2016, CFS received commissions and underwriting fees as follows:
| | | | |
| FUND | | AMOUNT | |
| Growth Fund | | $ | 43,574 | |
| Opportunistic Value Fund | | | 3,278 | |
| Focus Growth Fund | | | 821 | |
| Discovery Growth Fund | | | 531 | |
| Dividend Growth Fund | | | 715 | |
| Mid Cap Growth Fund | | | 4 | |
| International Growth Fund | | | 3,262 | |
| Evolving World Growth Fund | | | 12,434 | |
| Emerging Market Equity Fund | | | 39 | |
| Global Equity Fund | | | 1,243 | |
| Growth and Income Fund | | | 53,543 | |
| Global Growth and Income Fund | | | 2,338 | |
| Convertible Fund | | | 19,428 | |
| Global Convertible Fund | | | 1,021 | |
| Total Return Bond Fund | | | 453 | |
| High Income Fund | | | 1,367 | |
| Market Neutral Income Fund | | | 62,852 | |
| Hedged Equity Income Fund | | | 1,705 | |
| Phineus Long/Short Fund | | | — | |
| Long/Short Fund | | | 529 | |
Pursuant to an agreement with US Bancorp Fund Services, LLC, the Funds’ transfer agent (“US Bancorp”), CFS provides certain shareholder administrative services to US Bancorp. CFS receives from US Bancorp an annual aggregate fee of $175,000, paid in monthly installments, for providing these services which relate to Calamos Investment Trust and Calamos Advisors Trust. Also, US
| | | | |
| 164 | | CALAMOS OPEN-END FAMILY OF FUNDS SEMIANNUAL REPORT | | |
Notes to Financial Statements (Unaudited)
Bancorp pays license fees to unaffiliated third parties for CFS’ utilization of certain transfer agent and phone systems in providing the shareholder administrative services. The fees paid to CFS and the payment of license fees to third parties are borne by US Bancorp.
The Funds have not assumed or incurred any additional expenses in connection with CFS providing these services to US Bancorp, and the transfer agency fees payable by the Funds to US Bancorp have not increased as a result thereof.
A trustee and certain officers of the Trust are also officers and directors of CFS and Calamos Advisors. Such trustee and officers serve without direct compensation from the Trust.
As of April 30, 2016, certain affiliates of Calamos Advisors hold material investments in the Funds as follows:
| | | | |
| FUND | | PERCENTAGE | |
| Focus Growth Fund | | | 50 | % |
| Discovery Growth Fund | | | 57 | |
| Mid Cap Growth Fund | | | 81 | |
| Emerging Market Equity Fund | | | 89 | |
| Hedged Equity Income Fund | | | 63 | |
| Phineus Long/Short Fund | | | 62 | |
| Long/Short Fund | | | 26 | |
The Trust has adopted a deferred compensation plan (the “Plan”). Under the Plan, a trustee who is not an “interested person” (as defined in the 1940 Act) and has elected to participate in the Plan (a “participating trustee”) may defer receipt of all or a portion of their compensation from the Trust. The deferred compensation payable to the participating trustee is credited to the trustee’s deferral account as of the business day such compensation would have been paid to the participating trustee. The value of amounts deferred for a participating trustee is determined by reference to the change in value of Class I shares of one or more funds of the Trust designated by the participant. The value of the account increases with contributions to the account or with increases in the value of the measuring shares, and the value of the account decreases with withdrawals from the account or with declines in the value of the measuring shares.
At April 30, 2016, the Funds had deferred compensation balances, which are included in “Other assets” on the Statements of Assets and Liabilities, as follows:
| | | | |
| FUND | | AMOUNT | |
| Growth Fund | | $ | 664,927 | |
| Opportunistic Value Fund | | | 92,400 | |
| Focus Growth Fund | | | 85,856 | |
| Discovery Growth Fund | | | 40,348 | |
| Dividend Growth Fund | | | 12,683 | |
| Mid Cap Growth Fund | | | 12,716 | |
| International Growth Fund | | | 93,084 | |
| Evolving World Growth Fund | | | 58,951 | |
| Emerging Market Equity Fund | | | 11,575 | |
| Global Equity Fund | | | 65,126 | |
| Growth and Income Fund | | | 347,609 | |
| Global Growth and Income Fund | | | 143,119 | |
| Convertible Fund | | | 188,523 | |
| Global Convertible Fund | | | 5,723 | |
| Total Return Bond Fund | | | 66,568 | |
| High Income Fund | | | 101,717 | |
| Market Neutral Income Fund | | | 197,398 | |
| Hedged Equity Income Fund | | | 5,711 | |
| Phineus Long/Short Fund | | | — | |
| Long/Short Fund | | | 13,497 | |
Each Fund’s obligation to make payments under the Plan is a general obligation of the Fund and is included in “Payable for deferred compensation to trustees” on the Statements of Assets and Liabilities at April 30, 2016.
Notes to Financial Statements (Unaudited)
Note 3 – Investments
The cost of purchases and proceeds from sale of long-term investments for the period ended April 30, 2016 were as follows:
| | | | | | | | | | | | | | | | |
| | | COST OF PURCHASES | | | PROCEEDS FROM SALES | |
| FUND | | U.S. GOV’T
SECURITIES | | | OTHER | | | U.S. GOV’T
SECURITIES | | | OTHER | |
| Growth Fund | | $ | — | | | $ | 599,849,882 | | | $ | — | | | $ | 1,051,491,249 | |
| Opportunistic Value Fund | | | — | | | | 9,338,899 | | | | — | | | | 15,913,106 | |
| Focus Growth Fund | | | — | | | | 17,666,015 | | | | — | | | | 26,902,331 | |
| Discovery Growth Fund | | | — | | | | 12,181,037 | | | | — | | | | 28,659,299 | |
| Dividend Growth Fund | | | — | | | | 1,793,234 | | | | — | | | | 1,700,208 | |
| Mid Cap Growth Fund | | | — | | | | 3,647,411 | | | | — | | �� | | 17,956,426 | |
| International Growth Fund | | | — | | | | 166,378,179 | | | | — | | | | 265,681,468 | |
| Evolving World Growth Fund | | | — | | | | 158,623,707 | | | | — | | | | 201,661,785 | |
| Emerging Market Equity Fund | | | — | | | | 4,027,986 | | | | — | | | | 3,603,876 | |
| Global Equity Fund | | | — | | | | 42,379,805 | | | | — | | | | 73,675,302 | |
| Growth and Income Fund | | | — | | | | 106,373,010 | | | | — | | | | 283,612,605 | |
| Global Growth and Income Fund | | | — | | | | 111,239,921 | | | | — | | | | 120,303,145 | |
| Convertible Fund | | | — | | | | 234,229,528 | | | | — | | | | 456,419,115 | |
| Global Convertible Fund | | | — | | | | 39,881,660 | | | | — | | | | 11,232,564 | |
| Total Return Bond Fund | | | 9,678,086 | | | | 22,511,354 | | | | 8,096,466 | | | | 10,932,209 | |
| High Income Fund | | | — | | | | 20,109,801 | | | | — | | | | 31,036,995 | |
| Market Neutral Income Fund | | | — | | | | 772,513,055 | | | | — | | | | 836,281,006 | |
| Hedged Equity Income Fund | | | — | | | | 5,291,767 | | | | — | | | | 1,098,915 | |
| Phineus Long/Short Fund | | | — | | | | 11,531,320 | | | | — | | | | 7,257,778 | |
| Long/Short Fund | | | — | | | | 53,375,957 | | | | — | | | | 70,208,919 | |
The following information is presented on a federal income tax basis as of April 30, 2016. Differences between the cost basis under U.S. generally accepted accounting principles and federal income tax purposes are primarily due to temporary differences.
The cost basis of investments (excluding Investments of Collateral for Securities on Loan) for federal income tax purposes at April 30, 2016 was as follows:
| | | | | | | | | | | | | | | | |
| FUND | | COST BASIS OF
INVESTMENTS | | | GROSS UNREALIZED
APPRECIATION | | | GROSS UNREALIZED
DEPRECIATION | | | NET UNREALIZED
APPRECIATION
(DEPRECIATION) | |
| Growth Fund | | $ | 1,944,246,829 | | | $ | 357,915,635 | | | $ | (117,550,104 | ) | | $ | 240,365,531 | |
| Opportunistic Value Fund | | | 61,604,806 | | | | 3,522,863 | | | | (2,980,504 | ) | | | 542,359 | |
| Focus Growth Fund | | | 48,329,839 | | | | 5,799,733 | | | | (2,558,730 | ) | | | 3,241,003 | |
| Discovery Growth Fund | | | 16,537,858 | | | | 1,045,070 | | | | (1,161,404 | ) | | | (116,334 | ) |
| Dividend Growth Fund | | | 35,646,830 | | | | 2,497,179 | | | | (1,447,182 | ) | | | 1,049,997 | |
| Mid Cap Growth Fund | | | 6,918,339 | | | | 243,492 | | | | (831,669 | ) | | | (588,177 | ) |
| International Growth Fund | | | 478,480,239 | | | | 45,041,256 | | | | (19,018,534 | ) | | | 26,022,722 | |
| Evolving World Growth Fund | | | 490,983,708 | | | | 29,723,768 | | | | (30,575,893 | ) | | | (852,125 | ) |
| Emerging Market Equity Fund | | | 13,531,874 | | | | 940,327 | | | | (997,389 | ) | | | (57,062 | ) |
| Global Equity Fund | | | 135,901,048 | | | | 23,969,406 | | | | (6,813,426 | ) | | | 17,155,980 | |
| Growth and Income Fund | | | 2,048,549,135 | | | | 389,205,159 | | | | (51,755,750 | ) | | | 337,449,409 | |
| Global Growth and Income Fund | | | 329,056,463 | | | | 28,509,889 | | | | (10,447,246 | ) | | | 18,062,643 | |
| Convertible Fund | | | 871,896,925 | | | | 50,340,621 | | | | (45,238,828 | ) | | | 5,101,793 | |
| Global Convertible Fund | | | 75,654,562 | | | | 2,510,225 | | | | (3,106,891 | ) | | | (596,666 | ) |
| Total Return Bond Fund | | | 99,887,477 | | | | 2,648,163 | | | | (107,141 | ) | | | 2,541,022 | |
| High Income Fund | | | 105,371,178 | | | | 1,771,433 | | | | (5,998,632 | ) | | | (4,227,199 | ) |
| Market Neutral Income Fund | | | 3,775,834,116 | | | | 299,886,529 | | | | (255,549,018 | ) | | | 44,337,511 | |
| Hedged Equity Income Fund | | | 16,480,078 | | | | 820,511 | | | | (708,908 | ) | | | 111,603 | |
| Phineus Long/Short Fund | | | 14,203,052 | | | | 263,562 | | | | (157,900 | ) | | | 105,662 | |
| Long/Short Fund | | | 44,346,605 | | | | 1,655,244 | | | | (2,766,367 | ) | | | (1,111,123 | ) |
| | | | |
| 166 | | CALAMOS OPEN-END FAMILY OF FUNDS SEMIANNUAL REPORT | | |
Notes to Financial Statements (Unaudited)
Note 4 – Income Taxes
The tax character of distributions for the period ended April 30, 2016 will be determined at the end of each Fund’s current fiscal year. Distributions during the fiscal period ended October 31, 2015 were characterized for federal income tax purposes as follows:
| | | | | | | | | | | | |
| | | Year Ended October 31, 2015 | |
| FUND | | ORDINARY
INCOME | | | LONG-TERM
CAPITAL GAIN | | | RETURN OF
CAPITAL | |
| Growth Fund | | $ | 43,628,514 | | | $ | 658,198,263 | | | $ | — | |
| Opportunistic Value Fund | | | 3,300,466 | | | | 5,628,860 | | | | — | |
| Focus Growth Fund | | | 699,192 | | | | 6,324,952 | | | | — | |
| Discovery Growth Fund | | | 3,506,654 | | | | 1,387,285 | | | | — | |
| Dividend Growth Fund | | | 708,545 | | | | 425,268 | | | | — | |
| Mid Cap Growth Fund | | | 89,775 | | | | 430,294 | | | | — | |
| International Growth Fund | | | 4,483,595 | | | | 81,175,387 | | | | — | |
| Evolving World Growth Fund | | | 4,180,685 | | | | 13,401,328 | | | | 305 | |
| Emerging Market Equity Fund | | | 135,893 | | | | — | | | | — | |
| Global Equity Fund | | | 86,829 | | | | 46,113,693 | | | | — | |
| Growth and Income Fund | | | 74,992,764 | | | | 338,155,535 | | | | — | |
| Global Growth and Income Fund | | | 6,779,009 | | | | 75,623,881 | | | | — | |
| Convertible Fund | | | 41,439,130 | | | | 81,417,870 | | | | — | |
| Global Convertible Fund | | | 250,022 | | | | — | | | | — | |
| Total Return Bond Fund | | | 2,389,361 | | | | 1,075,895 | | | | — | |
| High Income Fund | | | 6,589,834 | | | | 3,848,957 | | | | 79 | |
| Market Neutral Income Fund | | | 46,850,427 | | | | 38,181,349 | | | | — | |
| Hedged Equity Income Fund | | | 80,011 | | | | 495 | | | | — | |
| Long/Short Fund | | | 1,014,940 | | | | 619,822 | | | | — | |
As of October 31, 2015, the components of accumulated earnings/(loss) on a tax basis were as follows:
| | | | | | | | | | | | | | | | | | | | |
| | | GROWTH
FUND | | | OPPORTUNISTIC
VALUE FUND | | | FOCUS GROWTH
FUND | | | DISCOVERY
GROWTH FUND | | | DIVIDEND
GROWTH FUND | |
| Undistributed ordinary income | | $ | 78,154,909 | | | $ | 1,654,120 | | | $ | — | | | $ | — | | | $ | — | |
| Undistributed capital gains | | | 612,158,769 | | | | 3,132,258 | | | | 10,614,820 | | | | 374,108 | | | | 948,389 | |
| | | | |
| Total undistributed earnings | | | 690,313,678 | | | | 4,786,378 | | | | 10,614,820 | | | | 374,108 | | | | 948,389 | |
| Accumulated capital and other losses | | | — | | | | — | | | | — | | | | — | | | | — | |
| Net unrealized gains/(losses) | | | 542,210,041 | | | | 406,491 | | | | 6,601,799 | | | | (1,004,504 | ) | | | 1,426,176 | |
| | | | |
| Total accumulated earnings/(losses) | | | 1,232,523,719 | | | | 5,192,869 | | | | 17,216,619 | | | | (630,396 | ) | | | 2,374,565 | |
| Other | | | (598,585 | ) | | | (92,330 | ) | | | (86,070 | ) | | | (81,920 | ) | | | (9,917 | ) |
| Paid-in-capital | | | 1,494,200,254 | | | | 65,340,902 | | | | 47,676,419 | | | | 38,924,985 | | | | 33,851,242 | |
| | | | |
| Total | | $ | 2,726,125,388 | | | $ | 70,441,441 | | | $ | 64,806,968 | | | $ | 38,212,669 | | | $ | 36,215,890 | |
| | | | |
| | | | | |
| | | MID CAP
GROWTH FUND | | | INTERNATIONAL
GROWTH FUND | | | EVOLVING WORLD
GROWTH FUND | | | EMERGING
MARKET EQUITY
FUND | | | GLOBAL
EQUITY FUND | |
| Undistributed ordinary income | | $ | — | | | $ | — | | | $ | 1,211,430 | | | $ | 44,929 | | | $ | — | |
| Undistributed capital gains | | | 993,112 | | | | 782,742 | | | | — | | | | — | | | | 3,134,382 | |
| | | | |
| Total undistributed earnings | | | 993,112 | | | | 782,742 | | | | 1,211,430 | | | | 44,929 | | | | 3,134,382 | |
| Accumulated capital and other losses | | | — | | | | — | | | | (9,634,517 | ) | | | (1,014,807 | ) | | | — | |
| Net unrealized gains/(losses) | | | (289,603 | ) | | | 40,653,788 | | | | (31,914,678 | ) | | | (1,401,152 | ) | | | 33,313,411 | |
| | | | |
| Total accumulated earnings/(losses) | | | 703,509 | | | | 41,436,530 | | | | (40,337,765 | ) | | | (2,371,030 | ) | | | 36,447,793 | |
| Other | | | (9,963 | ) | | | (166,818 | ) | | | (200,527 | ) | | | (8,445 | ) | | | (95,631 | ) |
| Paid-in-capital | | | 21,702,147 | | | | 566,146,657 | | | | 553,052,821 | | | | 15,932,911 | | | | 156,037,843 | |
| | | | |
| Total | | $ | 22,395,693 | | | $ | 607,416,369 | | | $ | 512,514,529 | | | $ | 13,553,436 | | | $ | 192,390,005 | |
| | | | |
Notes to Financial Statements (Unaudited)
| | | | | | | | | | | | | | | | | | | | |
| | | GROWTH AND
INCOME FUND | | | GLOBAL GROWTH
AND INCOME
FUND | | | CONVERTIBLE
FUND | | | GLOBAL
CONVERTIBLE
FUND | | | TOTAL
RETURN
BOND FUND | |
| Undistributed ordinary income | | $ | 16,328,591 | | | $ | — | | | $ | 10,725,307 | | | $ | 177,840 | | | $ | — | |
| Undistributed capital gains | | | 106,436,170 | | | | 4,722,926 | | | | 16,875,147 | | | | — | | | | 1,113,807 | |
| | | | |
| Total undistributed earnings | | | 122,764,761 | | | | 4,722,926 | | | | 27,600,454 | | | | 177,840 | | | | 1,113,807 | |
| Accumulated capital and other losses | | | — | | | | — | | | | — | | | | (694,485 | ) | | | — | |
| Net unrealized gains/(losses) | | | 396,867,882 | | | | 26,016,342 | | | | 32,430,475 | | | | (563,476 | ) | | | 894,158 | |
| | | | |
| Total accumulated earnings/(losses) | | | 519,632,643 | | | | 30,739,268 | | | | 60,030,929 | | | | (1,080,121 | ) | | | 2,007,965 | |
| Other | | | (386,119 | ) | | | (289,346 | ) | | | (221,041 | ) | | | (789 | ) | | | (221,621 | ) |
| Paid-in-capital | | | 2,077,774,659 | | | | 350,413,291 | | | | 1,054,989,116 | | | | 46,134,376 | | | | 83,438,584 | |
| | | | |
| Total | | $ | 2,597,021,183 | | | $ | 380,863,213 | | | $ | 1,114,799,004 | | | $ | 45,053,466 | | | $ | 85,224,928 | |
| | | | |
| | | | | | | | | | | | | | | | |
| | | HIGH INCOME
FUND | | | MARKET NEUTRAL
INCOME FUND | | | HEDGED EQUITY
INCOME FUND | | | LONG/SHORT
FUND | |
| Undistributed ordinary income | | $ | 33,547 | | | $ | 25,227,066 | | | $ | 59,473 | | | $ | — | |
| Undistributed capital gains | | | — | | | | 38,744,165 | | | | 99,197 | | | | — | |
| | | | |
| Total undistributed earnings | | | 33,547 | | | | 63,971,231 | | | | 158,670 | | | | — | |
| Accumulated capital and other losses | | | (2,818,255 | ) | | | — | | | | — | | | | — | |
| Net unrealized gains/(losses) | | | (6,646,567 | ) | | | 50,260,510 | | | | (78,302 | ) | | | 3,503,532 | |
| | | | |
| Total accumulated earnings/(losses) | | | (9,431,275 | ) | | | 114,231,741 | | | | 80,368 | | | | 3,503,532 | |
| Other | | | (104,412 | ) | | | (25,268,460 | ) | | | (773 | ) | | | (9,779 | ) |
| Paid-in-capital | | | 120,480,382 | | | | 3,689,603,622 | | | | 11,308,316 | | | | 79,393,509 | |
| | | | |
| Total | | $ | 110,944,695 | | | $ | 3,778,566,903 | | | $ | 11,387,911 | | | $ | 82,887,262 | |
| | | | |
The Regulated Investment Company Modernization Act of 2010 (the “Act”) modernized various tax rules for regulated investment companies, and was effective for taxable years beginning after the enactment date of December 22, 2010. One significant change is to the treatment of capital loss carryforwards. Now, any capital losses recognized will retain their character as either short-term or long-term capital losses, will be utilized before the pre-Act capital loss carryforwards, and will be carried forward indefinitely, until applied in offsetting future capital gains.
In addition, the funds below had post-Act capital losses as follows:
| | | | | | | | |
| FUND | | SHORT-TERM | | | LONG-TERM | |
| Evolving World Growth Fund | | $ | (9,634,517 | ) | | $ | — | |
| Emerging Market Equity Fund | | | (995,308 | ) | | | (19,499 | ) |
| High Income Fund | | | (710,030 | ) | | | (2,108,225 | ) |
Note 5 – Short Sales
Securities sold short represent obligations to deliver the securities at a future date. A Fund may sell a security it does not own in anticipation of a decline in the value of that security before the delivery date. When the Fund sells a security short, it must borrow the security sold short and deliver it to the broker-dealer through which it made the short sale. Dividends paid on securities sold short are disclosed as an expense on the Statements of Operations. A gain, limited to the price at which the Fund sold the security short, or a loss, unlimited in size, will be realized upon the termination of a short sale.
To secure its obligation to deliver to the broker-dealer the securities sold short, the Fund must segregate an amount of cash or liquid securities with its custodian equal to any excess of the current market value of the securities sold short over any cash or liquid securities deposited as collateral with the broker in connection with the short sale (not including the proceeds of the short sale). As a result of that requirement, the Fund will not gain any leverage merely by selling short, except to the extent that it earns interest or other income or gains on the segregated cash or liquid securities while also being subject to the possibility of gain or loss from the securities sold short.
| | | | |
| 168 | | CALAMOS OPEN-END FAMILY OF FUNDS SEMIANNUAL REPORT | | |
Notes to Financial Statements (Unaudited)
Note 6 – Derivative Investments
Foreign Currency Risk. Each Fund may engage in portfolio hedging with respect to changes in currency exchange rates by entering into forward foreign currency contracts to purchase or sell currencies. A forward foreign currency contract is a commitment to purchase or sell a foreign currency at a future date at a negotiated forward rate. Risks associated with such contracts include, among other things, movement in the value of the foreign currency relative to the U.S. dollar and the ability of the counterparty to perform. To mitigate the counterparty risk, the Fund may enter into an International Swaps and Derivatives Association, Inc. Master Agreement (“ISDA Master Agreement”) or similar agreement with its derivative contract counterparties. An ISDA Master Agreement is a bilateral agreement between the Fund and a counterparty that governs over-the-counter derivatives and foreign exchange contracts and typically contains, among other things, collateral posting terms and netting provisions in the event of a default and/or termination event. Under an ISDA Master Agreement, the Fund may, under certain circumstances, offset with the counterparty certain derivative financial instrument’s payables and/or receivables with collateral held and/or posted and create one single net payment. The provisions of the ISDA Master Agreement typically permit a single net payment in the event of default (close-out netting) including the bankruptcy or insolvency of the counterparty. Generally, collateral is exchanged between the Fund and the counterparty and the amount of collateral due from the Fund or to a counterparty has to exceed a minimum transfer amount threshold before a transfer has to be made. To the extent amounts due to the Fund from its counterparties are not fully collateralized, contractually or otherwise, the Fund bears the risk of loss from counterparty nonperformance. For financial reporting purposes, the Funds do not offset derivative assets and derivative liabilities that are subject to netting arrangements in the Statements of Assets and Liabilities. The Fund’s net counterparty exposure is reflected in the counterparty table below. The net unrealized gain, if any, represents the credit risk to the respective Fund on a forward foreign currency contract. The contracts are valued daily at forward foreign exchange rates. The Funds realize a gain or loss when a position is closed or upon settlement of the contracts.
As of April 30, 2016, the Funds had outstanding forward foreign currency contracts listed on the Schedules of Investments.
Equity Risk. Each Fund may engage in option transactions and in doing so achieves similar objectives to what it would achieve through the sale or purchase of individual securities. A call option, upon payment of a premium, gives the purchaser of the option the right to buy, and the seller of the option the obligation to sell, the underlying security, index or other instrument at the exercise price. A put option gives the purchaser of the option, upon payment of a premium, the right to sell, and the seller the obligation to buy, the underlying security, index, or other instrument at the exercise price.
To seek to offset some of the risk of a potential decline in value of certain long positions, each Fund may also purchase put options on individual securities, broad-based securities indexes or certain exchange-traded funds (“ETFs”). Each Fund may also seek to generate income from option premiums by writing (selling) options on a portion of the equity securities (including securities that are convertible into equity securities) in the Fund’s portfolio, on broad-based securities indexes, or certain ETFs.
When the Fund purchases an option, it pays a premium and an amount equal to that premium is recorded as an asset. When the Fund writes an option, it receives a premium and an amount equal to that premium is recorded as a liability. The asset or liability is adjusted daily to reflect the current market value of the option. If an option expires unexercised, the Fund realizes a gain or loss to the extent of the premium received or paid. If an option is exercised, the premium received or paid is recorded as an adjustment to the proceeds from the sale or the cost basis of the purchase. The difference between the premium and the amount received or paid on a closing purchase or sale transaction is also treated as a realized gain or loss. The cost of securities acquired through the exercise of call options is increased by premiums paid. The proceeds from securities sold through the exercise of put options are decreased by the premiums paid. Gain or loss on written options and purchased options is presented separately as net realized gain or loss on written options and net realized gain or loss on purchased options, respectively.
Options written by each Fund do not typically give rise to counterparty credit risk since options written obligate each Fund and not the counterparty to perform. Exchange traded purchased options have minimal counterparty credit risk to each Fund since the exchange’s clearinghouse, as counterparty to such instruments, guarantees against a possible default.
Notes to Financial Statements (Unaudited)
As of April 30, 2016, the Fund had outstanding purchased options and/or written options as listed on the Schedules of Investments. For the period ended April 30, 2016, the Fund had the following transactions in options written:
| | | | | | | | | | | | | | | | |
| | | INTERNATIONAL GROWTH FUND | | | EVOLVING WORLD GROWTH FUND | |
| | | NUMBER OF
CONTRACTS | | | PREMIUMS
RECEIVED | | | NUMBER OF
CONTRACTS | | | PREMIUMS
RECEIVED | |
| Options outstanding at October 31, 2015 | | | — | | | $ | — | | | | — | | | $ | — | |
| Option written | | | 327 | | | | 158,104 | | | | 390 | | | | 188,321 | |
| Options closed | | | (327 | ) | | | (158,104 | ) | | | (390 | ) | | | (188,321 | ) |
| Options exercised | | | — | | | | — | | | | — | | | | — | |
| Options expired | | | — | | | | — | | | | — | | | | — | |
| | | | |
| Options outstanding at April 30, 2016 | | | — | | | $ | — | | | | — | | | $ | — | |
| | |
| | | EMERGING MARKET EQUITY FUND | | | GLOBAL EQUITY FUND | |
| | | NUMBER OF
CONTRACTS | | | PREMIUMS
RECEIVED | | | NUMBER OF
CONTRACTS | | | PREMIUMS
RECEIVED | |
| Options outstanding at October 31, 2015 | | | — | | | $ | — | | | | — | | | $ | — | |
| Option written | | | 11 | | | | 5,403 | | | | 97 | | | | 107,261 | |
| Options closed | | | (11 | ) | | | (5,403 | ) | | | (97 | ) | | | (107,261 | ) |
| Options exercised | | | — | | | | — | | | | — | | | | — | |
| Options expired | | | — | | | | — | | | | — | | | | — | |
| | | | |
| Options outstanding at April 30, 2016 | | | — | | | $ | — | | | | — | | | $ | — | |
| | |
| | | MARKET NEUTRAL INCOME FUND | | | HEDGED EQUITY INCOME FUND | |
| | | NUMBER OF
CONTRACTS | | | PREMIUMS
RECEIVED | | | NUMBER OF
CONTRACTS | | | PREMIUMS
RECEIVED | |
| Options outstanding at October 31, 2015 | | | 20,005 | | | $ | 48,417,521 | | | | 54 | | | $ | 188,039 | |
| Option written | | | 73,893 | | | | 158,268,892 | | | | 492 | | | | 1,079,130 | |
| Options closed | | | (45,454 | ) | | | (86,672,690 | ) | | | (291 | ) | | | (573,387 | ) |
| Options exercised | | | (5,194 | ) | | | (10,809,140 | ) | | | (24 | ) | | | (71,089 | ) |
| Options expired | | | (26,070 | ) | | | (40,481,908 | ) | | | (122 | ) | | | (160,161 | ) |
| | | | |
| Options outstanding at April 30, 2016 | | | 17,180 | | | $ | 68,722,675 | | | | 109 | | | $ | 462,532 | |
| | |
| | | PHINEUS LONG/SHORT FUND | | | LONG/SHORT FUND | |
| | | NUMBER OF
CONTRACTS | | | PREMIUMS
RECEIVED | | | NUMBER OF
CONTRACTS | | | PREMIUMS
RECEIVED | |
| Options outstanding at October 31, 2015 | | | — | | | $ | — | | | | 7,039 | | | $ | 479,798 | |
| Option written | | | 1,259 | | | | 81,292 | | | | 17,528 | | | | 2,006,316 | |
| Options closed | | | (624 | ) | | | (24,761 | ) | | | (11,944 | ) | | | (1,208,227 | ) |
| Options exercised | | | (42 | ) | | | (8,984 | ) | | | (6,048 | ) | | | (350,276 | ) |
| Options expired | | | (314 | ) | | | (20,955 | ) | | | (5,359 | ) | | | (813,196 | ) |
| | | | |
| Options outstanding at April 30, 2016 | | | 279 | | | $ | 26,592 | | | | 1,216 | | | $ | 114,415 | |
| * | Phineus Long/Short Fund commenced operations on April 5, 2016. |
As of April 30, 2016, the Funds had outstanding derivative contracts which are reflected on the Statements of Assets and Liabilities as follows:
| | | | | | | | | | | | | | | | |
| | | GROWTH FUND | | | FOCUS GROWTH FUND | |
| | | ASSET
DERIVATIVES | | | LIABILITY
DERIVATIVES | | | ASSET
DERIVATIVES | | | LIABILITY
DERIVATIVES | |
| Gross amounts at fair value: | | | | | | | | | | | | | | | | |
| Forward foreign currency contracts(1) | | $ | — | | | $ | 322,667 | | | $ | — | | | $ | 11,078 | |
| | | | | | | | |
| | $ | — | | | $ | 322,667 | | | $ | — | | | $ | 11,078 | |
| | | | |
| | | | |
| 170 | | CALAMOS OPEN-END FAMILY OF FUNDS SEMIANNUAL REPORT | | |
Notes to Financial Statements (Unaudited)
| | | | | | | | | | | | | | | | |
| | | INTERNATIONAL GROWTH FUND | | | EVOLVING WORLD GROWTH FUND | |
| | | ASSET
DERIVATIVES | | | LIABILITY
DERIVATIVES | | | ASSET
DERIVATIVES | | | LIABILITY
DERIVATIVES | |
| Gross amounts at fair value: | | | | | | | | | | | | | | | | |
| Forward foreign currency contracts(1) | | $ | — | | | $ | 929,759 | | | $ | 53,226 | | | $ | 1,020,813 | |
| | | | | | | | |
| | $ | — | | | $ | 929,759 | | | $ | 53,226 | | | $ | 1,020,813 | |
| | | | |
| | |
| | | GLOBAL EQUITY FUND | | | GLOBAL GROWTH AND INCOME FUND | |
| | | ASSET
DERIVATIVES | | | LIABILITY
DERIVATIVES | | | ASSET
DERIVATIVES | | | LIABILITY
DERIVATIVES | |
| Gross amounts at fair value: | | | | | | | | | | | | | | | | |
| Forward foreign currency contracts(1) | | $ | 31,200 | | | $ | 549,682 | | | $ | — | | | $ | 370,313 | |
| Purchased options(2) | | | — | | | | — | | | | 635,210 | | | | — | |
| | | | | | | | |
| | $ | 31,200 | | | $ | 549,682 | | | $ | 635,210 | | | $ | 370,313 | |
| | | | |
| | |
| | | CONVERTIBLE FUND | | | GLOBAL CONVERTIBLE FUND | |
| | | ASSET
DERIVATIVES | | | LIABILITY
DERIVATIVES | | | ASSET
DERIVATIVES | | | LIABILITY
DERIVATIVES | |
| Gross amounts at fair value: | | | | | | | | | | | | | | | | |
| Forward foreign currency contracts(1) | | $ | — | | | $ | 91,584 | | | $ | — | | | $ | — | |
| Purchased options(2) | | | 1,627,525 | | | | — | | | | 474,081 | | | | — | |
| | | | | | | | |
| | $ | 1,627,525 | | | $ | 91,584 | | | $ | 474,081 | | | $ | — | |
| | | | |
| | |
| | | MARKET NEUTRAL INCOME FUND | | | HEDGED EQUITY INCOME FUND | |
| | | ASSET
DERIVATIVES | | | LIABILITY
DERIVATIVES | | | ASSET
DERIVATIVES | | | LIABILITY
DERIVATIVES | |
| Gross amounts at fair value: | | | | | | | | | | | | | | | | |
| Purchased options(2) | | $ | 36,381,569 | | | $ | — | | | $ | 253,740 | | | $ | — | |
| Written options(3) | | | — | | | | 62,674,415 | | | | — | | | | 444,718 | |
| | | | | | | | |
| | $ | 36,381,569 | | | $ | 62,674,415 | | | $ | 253,740 | | | $ | 444,718 | |
| | | | |
| | |
| | | PHINEUS LONG/SHORT FUND | | | LONG/SHORT FUND | |
| | | ASSET
DERIVATIVES | | | LIABILITY
DERIVATIVES | | | ASSET
DERIVATIVES | | | LIABILITY
DERIVATIVES | |
| Gross amounts at fair value: | | | | | | | | | | | | | | | | |
| Purchased options(2) | | $ | 36,474 | | | $ | — | | | $ | 139,766 | | | $ | — | |
| Written options(3) | | | — | | | | 32,997 | | | | — | | | | 134,599 | |
| | | | | | | | |
| | $ | 36,474 | | | $ | 32,997 | | | $ | 139,766 | | | $ | 134,599 | |
| | | | | | | | |
| | | | | | | | | | | | | | | | | | | | | | | | |
| | | GROSS AMOUNTS NOT OFFSET
IN THE STATEMENT OF ASSETS AND LIABILITIES | |
| GROWTH FUND | | GROSS AMOUNTS PRESENTED IN THE
STATEMENT OF ASSETS AND LIABILITIES | | | COLLATERAL
PLEDGED | | | NET AMOUNT
RECEIVABLE IN THE EVENT OF
DEFAULT | | | NET AMOUNT
PAYABLE IN
THE EVENT
OF DEFAULT | |
| Counterparty | | | | | ASSETS | | | LIABILITIES | | | | |
| Northern Trust Company | | | ISDA | | | $ | — | | | $ | 322,667 | | | $ | — | | | $ | — | | | $ | 322,667 | |
| | | | |
| | | $ | — | | | $ | 322,667 | | | $ | — | | | $ | — | | | $ | 322,667 | |
| | | | |
Notes to Financial Statements (Unaudited)
| | | | | | | | | | | | | | | | | | | | | | | | |
| | | GROSS AMOUNTS NOT OFFSET
IN THE STATEMENT OF ASSETS AND LIABILITIES | |
| FOCUS GROWTH FUND | | GROSS AMOUNTS PRESENTED IN THE
STATEMENT OF ASSETS AND LIABILITIES | | | COLLATERAL PLEDGED | | | NET AMOUNT
RECEIVABLE IN
THE EVENT OF DEFAULT | | | NET AMOUNT
PAYABLE IN
THE EVENT OF DEFAULT | |
| Counterparty | | | ASSETS | | | LIABILITIES | | | | |
| Northern Trust Company | | | ISDA | | | $ | — | | | $ | 11,078 | | | $ | — | | | $ | — | | | $ | 11,078 | |
| | | | |
| | | $ | — | | | $ | 11,078 | | | $ | — | | | $ | — | | | $ | 11,078 | |
| | | | |
| | | | |
INTERNATIONAL
GROWTH FUND | | GROSS AMOUNTS PRESENTED IN THE
STATEMENT OF ASSETS AND LIABILITIES | | | COLLATERAL PLEDGED | | | NET AMOUNT
RECEIVABLE IN
THE EVENT OF DEFAULT | | | NET AMOUNT
PAYABLE IN
THE EVENT OF DEFAULT | |
| Counterparty | | | ASSETS | | | LIABILITIES | | | | |
| Northern Trust Company | | | ISDA | | | $ | — | | | $ | 929,759 | | | $ | — | | | $ | — | | | $ | 929,759 | |
| | | | |
| | | $ | — | | | $ | 929,759 | | | $ | — | | | $ | — | | | $ | 929,759 | |
| | | | |
| | | | |
EVOLVING WORLD
GROWTH FUND | | GROSS AMOUNTS PRESENTED IN THE
STATEMENT OF ASSETS AND LIABILITIES | | | COLLATERAL PLEDGED | | | NET AMOUNT
RECEIVABLE IN
THE EVENT OF DEFAULT | | | NET AMOUNT
PAYABLE IN
THE EVENT OF DEFAULT | |
| Counterparty | | | ASSETS | | | LIABILITIES | | | | |
| JPMorgan Chase Bank N.A | | | ISDA | | | $ | 53,226 | | | $ | — | | | $ | — | | | $ | 53,226 | | | $ | — | |
| Northern Trust Company | | | ISDA | | | | — | | | | 1,020,813 | | | | — | | | | — | | | | 1,020,813 | |
| | | | |
| | | $ | 53,226 | | | $ | 1,020,813 | | | $ | — | | | $ | 53,226 | | | $ | 1,020,813 | |
| | | | |
| | | | |
| GLOBAL EQUITY FUND | | GROSS AMOUNTS PRESENTED IN THE
STATEMENT OF ASSETS AND LIABILITIES | | | COLLATERAL PLEDGED | | | NET AMOUNT
RECEIVABLE IN
THE EVENT OF DEFAULT | | | NET AMOUNT
PAYABLE IN
THE EVENT OF DEFAULT | |
| Counterparty | | | ASSETS | | | LIABILITIES | | | | |
| JPMorgan Chase Bank N.A | | | ISDA | | | $ | 31,200 | | | $ | — | | | $ | — | | | $ | 31,200 | | | $ | — | |
| Northern Trust Company | | | ISDA | | | | — | | | | 549,682 | | | | — | | | | — | | | | 549,682 | |
| | | | |
| | | $ | 31,200 | | | $ | 549,682 | | | $ | — | | | $ | 31,200 | | | $ | 549,682 | |
| | | | |
| | | | |
GLOBAL GROWTH AND
INCOME FUND | | GROSS AMOUNTS PRESENTED IN THE
STATEMENT OF ASSETS AND LIABILITIES | | | COLLATERAL PLEDGED | | | NET AMOUNT
RECEIVABLE IN
THE EVENT OF DEFAULT | | | NET AMOUNT
PAYABLE IN
THE EVENT OF DEFAULT | |
| Counterparty | | | ASSETS | | | LIABILITIES | | | | |
| Northern Trust Company | | | ISDA | | | $ | — | | | $ | 370,313 | | | | — | | | $ | — | | | $ | 370,313 | |
| | | | |
| | | $ | — | | | $ | 370,313 | | | $ | — | | | $ | — | | | $ | 370,313 | |
| | | | |
| | | | |
| CONVERTIBLE FUND | | GROSS AMOUNTS PRESENTED IN THE
STATEMENT OF ASSETS AND LIABILITIES | | | COLLATERAL PLEDGED | | | NET AMOUNT
RECEIVABLE IN
THE EVENT OF DEFAULT | | | NET AMOUNT
PAYABLE IN
THE EVENT OF DEFAULT | |
| Counterparty | | | ASSETS | | | LIABILITIES | | | | |
| Northern Trust Company | | | ISDA | | | $ | — | | | $ | 91,584 | | | $ | — | | | $ | — | | | $ | 91,584 | |
| | | | |
| | | $ | — | | | $ | 91,584 | | | $ | — | | | $ | — | | | $ | 91,584 | |
| | | | |
| | | | |
| 172 | | CALAMOS OPEN-END FAMILY OF FUNDS SEMIANNUAL REPORT | | |
Notes to Financial Statements (Unaudited)
For the period ended April 30, 2016, the volume of derivative activity for the Funds is reflected below:*
| | | | | | | | | | | | |
| | | DERIVATIVE TYPE | |
| | | FORWARD CONTRACTS(1) | | | OPTIONS PURCHASED(2) | | | OPTIONS WRITTEN(3) | |
| Growth Fund | | | 42,085,588 | | | | — | | | | — | |
| Focus Growth Fund | | | 2,375,653 | | | | — | | | | — | |
| International Growth Fund | | | 314,790,787 | | | | 1,310 | | | | 327 | |
| Evolving World Growth Fund | | | 52,557,666 | | | | 1,560 | | | | 390 | |
| Emerging Market Equity Fund | | | — | | | | 44 | | | | 11 | |
| Global Equity Fund | | | 85,845,114 | | | | 353 | | | | 97 | |
| Global Growth and Income Fund | | | 20,375,832 | | | | 2,761 | | | | — | |
| Convertible Fund | | | 10,330,387 | | | | 9,575 | | | | — | |
| Global Convertible Fund | | | — | | | | 3,935 | | | | — | |
| Market Neutral Income Fund | | | — | | | | 73,911 | | | | 73,893 | |
| Hedged Equity Income Fund | | | — | | | | 455 | | | | 492 | |
| Phineus Long/Short | | | — | | | | 1,234 | | | | 1,259 | |
| Long/Short Fund | | | — | | | | 21,037 | | | | 17,528 | |
| * | Activity during the period is measured by opened number of contracts for options purchased or written and opened forward foreign currency contracts (measured in notional). |
| (1) | Generally, the Statement of Assets and Liabilities location for Forward foreign currency contracts is Unrealized appreciation on forward foreign currency contracts for asset derivatives and Unrealized depreciation on forward foreign currency contracts for liability derivatives. |
| (2) | Generally, the Statement of Assets and Liabilities location for Options purchased is Investments in securities, at value. |
| (3) | Generally, the Statement of Assets and Liabilities location for Options written is Options written, at value. |
Note 7 – Securities Lending
The Funds may loan one or more of their securities to broker-dealers and banks. Any such loan must be secured by collateral in cash or cash equivalents maintained on a current basis in an amount at least equal to the value of the securities loaned by the Funds. The Funds continue to receive the equivalent of the interest or dividends paid by the issuer on the securities loaned and also receive an additional return that may be in the form of a fixed fee or a percentage of the collateral. Upon receipt of cash or cash equivalent collateral, the Funds’ securities lending agent invests the collateral into short term investments following investment guidelines approved by Calamos Advisors. The Funds record the investment of collateral as an asset and the value of the collateral as a liability on the Statements of Assets and Liabilities. If the value of the invested collateral declines below the value of the collateral deposited by the borrower, the Funds will record unrealized depreciation equal to the decline in value of the invested collateral. The Funds may pay reasonable fees to persons unaffiliated with the Funds for services in arranging these loans. The Funds have the right to call a loan and obtain the securities loaned at any time. The Funds do not have the right to vote the securities during the existence of the loan but could call the loan in an attempt to permit voting of the securities in certain circumstances. Upon return of the securities loaned, the cash or cash equivalent collateral will be returned to the borrower. In the event of bankruptcy or other default of the borrower, the Funds could experience both delays in liquidating the loan collateral or recovering the loaned securities and losses, including (a) possible decline in the value of the collateral or in the value of the securities loaned during the period while the Funds seek to enforce its rights thereto, (b) possible subnormal levels of income and lack of access to income during this period, and (c) the expenses of enforcing their rights. In an effort to reduce these risks, the Funds’ security lending agent monitors and reports to Calamos Advisors on the creditworthiness of the firms to which a Fund lends securities.
Notes to Financial Statements (Unaudited)
At April 30, 2016, securities were on loan for the Funds below:
| | | | | | | | | | | | | | | | |
| | | VALUE OF SECURITIES
ON LOAN TO BROKER-DEALERS
AND BANKS | | | AMOUNT OF COLLATERAL HELD IN SHORT TERM
INVESTMENTS BY ASSET CLASS ON LOAN | |
| FUND | | | EQUITY | | | FIXED INCOME | | | TOTAL | |
| Growth Fund | | $ | 39,810,492 | | | $ | 40,836,861 | | | $ | — | | | $ | 40,836,861 | |
| Opportunistic Value Fund | | | 482,119 | | | | 488,350 | | | | — | | | | 488,350 | |
| Focus Growth Fund | | | 808,342 | | | | 855,600 | | | | — | | | | 855,600 | |
| Discovery Growth Fund | | | 830,275 | | | | 873,575 | | | | — | | | | 873,575 | |
| Dividend Growth Fund | | | — | | | | — | | | | — | | | | — | |
| Mid Cap Growth Fund | | | 216,543 | | | | 230,625 | | | | — | | | | 230,625 | |
| International Growth Fund | | | 30,788,826 | | | | 32,589,083 | | | | — | | | | 32,589,083 | |
| Evolving World Growth Fund | | | 15,995,835 | | | | 10,947,028 | | | | 5,862,798 | | | | 16,809,826 | |
| Emerging Market Equity Fund | | | 167,779 | | | | 176,626 | | | | — | | | | 176,626 | |
| Global Equity Fund | | | 4,204,558 | | | | 4,480,779 | | | | — | | | | 4,480,779 | |
| Growth and Income Fund | | | 26,938,453 | | | | 4,138,678 | | | | 23,453,344 | | | | 27,592,022 | |
| Global Growth and Income Fund | | | 9,751,044 | | | | 6,122,495 | | | | 4,131,422 | | | | 10,253,917 | |
| Convertible Fund | | | 53,424,416 | | | | 8,703,376 | | | | 46,160,706 | | | | 54,864,082 | |
| Global Convertible Fund | | | 800,330 | | | | — | | | | 818,218 | | | | 818,218 | |
| Total Return Bond Fund | | | 479,281 | | | | — | | | | 490,000 | | | | 490,000 | |
| High Income Fund | | | 6,959,183 | | | | — | | | | 7,200,032 | | | | 7,200,032 | |
| Market Neutral Income Fund | | | 33,651,205 | | | | 4,273,351 | | | | 30,115,036 | | | | 34,388,387 | |
| Hedged Equity Income Fund | | | — | | | | — | | | | — | | | | — | |
| Long/Short Fund | | | — | | | | — | | | | — | | | | — | |
| Phineus Long/Short Fund | | | — | | | | — | | | | — | | | | — | |
Note 8 – Fair Value Measurement
Various inputs are used to determine the value of the Funds’ investments. These inputs are categorized into three broad levels as follows:
| | • | | Level 1 – Prices are determined using inputs from unadjusted quoted prices from active markets (including securities actively traded on a securities exchange) for identical assets. |
| | • | | Level 2 – Prices are determined using significant observable market inputs other than unadjusted quoted prices, including quoted prices of similar securities, fair value adjustments to quoted foreign securities, interest rates, credit risk, prepayment speeds, and other relevant data. |
| | • | | Level 3 – Prices reflect unobservable market inputs (including the Funds’ own judgments about assumptions market participants would use in determining fair value) when observable inputs are unavailable. |
Debt securities are valued based upon evaluated prices received from an independent pricing service or from a dealer or broker who makes markets in such securities. Pricing services utilize various observable market data and as such, debt securities are generally categorized as Level 2. The levels are not necessarily an indication of the risk or liquidity of the Fund’s investments. Transfers between the levels for investment securities or other financial instruments are measured at the end of the reporting period.
| | | | |
| 174 | | CALAMOS OPEN-END FAMILY OF FUNDS SEMIANNUAL REPORT | | |
Notes to Financial Statements (Unaudited)
The following is a summary of the inputs used in valuing the Funds’ holdings at fair value:
| | | | | | | | | | | | | | | | |
| | | GROWTH FUND | |
| | | LEVEL 1 | | | LEVEL 2 | | | LEVEL 3 | | | TOTAL | |
| Assets: | | | | | | | | | | | | | | | | |
Common Stocks U.S. | | $ | 1,939,037,617 | | | $ | — | | | $ | — | | | $ | 1,939,037,617 | |
Short Term Investment | | | 204,737,882 | | | | — | | | | — | | | | 204,737,882 | |
Investment of Cash Collateral For Securities Loaned | | | 19,805,862 | | | | 21,030,999 | | | | — | | | | 40,836,861 | |
| | | | |
Total | | $ | 2,163,581,361 | | | $ | 21,030,999 | | | $ | — | | | $ | 2,184,612,360 | |
| | | | |
| Liabilities: | | | | | | | | | | | | | | | | |
Forward Foreign Currency Contracts | | $ | — | | | $ | 322,667 | | | $ | — | | | $ | 322,667 | |
| | | | |
Total | | $ | — | | | $ | 322,667 | | | $ | — | | | $ | 322,667 | |
| | | | |
| |
| | | OPPORTUNISTIC VALUE FUND | |
| | | LEVEL 1 | | | LEVEL 2 | | | LEVEL 3 | | | TOTAL | |
| Assets: | | | | | | | | | | | | | | | | |
Common Stocks U.S. | | $ | 60,355,118 | | | $ | — | | | $ | — | | | $ | 60,355,118 | |
Short Term Investment | | | 1,303,697 | | | | — | | | | — | | | | 1,303,697 | |
Investment of Cash Collateral For Securities Loaned | | | 236,850 | | | | 251,500 | | | | — | | | | 488,350 | |
| | | | |
Total | | $ | 61,895,665 | | | $ | 251,500 | | | $ | — | | | $ | 62,147,165 | |
| | | | |
| |
| | | FOCUS GROWTH FUND | |
| | | LEVEL 1 | | | LEVEL 2 | | | LEVEL 3 | | | TOTAL | |
| Assets: | | | | | | | | | | | | | | | | |
Common Stocks U.S. | | $ | 46,805,933 | | | $ | — | | | $ | — | | | $ | 46,805,933 | |
Short Term Investment | | | 3,909,309 | | | | — | | | | — | | | | 3,909,309 | |
Investment of Cash Collateral For Securities Loaned | | | 414,966 | | | | 440,634 | | | | — | | | | 855,600 | |
| | | | |
Total | | $ | 51,130,208 | | | $ | 440,634 | | | $ | — | | | $ | 51,570,842 | |
| | | | |
| Liabilities: | | | | | | | | | | | | | | | | |
Forward Foreign Currency Contracts | | $ | — | | | $ | 11,078 | | | $ | — | | | $ | 11,078 | |
| | | | |
Total | | $ | — | | | $ | 11,078 | | | $ | — | | | $ | 11,078 | |
| | | | |
| |
| | | DISCOVERY GROWTH FUND | |
| | | LEVEL 1 | | | LEVEL 2 | | | LEVEL 3 | | | TOTAL | |
| Assets: | | | | | | | | | | | | | | | | |
Common Stocks U.S. | | $ | 15,314,731 | | | $ | — | | | $ | — | | | $ | 15,314,731 | |
Short Term Investment | | | 233,218 | | | | — | | | | — | | | | 233,218 | |
Investment of Cash Collateral For Securities Loaned | | | 423,684 | | | | 449,891 | | | | — | | | | 873,575 | |
| | | | |
Total | | $ | 15,971,633 | | | $ | 449,891 | | | $ | — | | | $ | 16,421,524 | |
| | | | |
| |
| | | DIVIDEND GROWTH FUND | |
| | | LEVEL 1 | | | LEVEL 2 | | | LEVEL 3 | | | TOTAL | |
| Assets: | | | | | | | | | | | | | | | | |
Common Stocks U.S. | | $ | 34,499,482 | | | $ | — | | | $ | — | | | $ | 34,499,482 | |
Short Term Investment | | | 2,197,345 | | | | — | | | | — | | | | 2,197,345 | |
| | | | |
Total | | $ | 36,696,827 | | | $ | — | | | $ | — | | | $ | 36,696,827 | |
| | | | |
Notes to Financial Statements (Unaudited)
| | | | | | | | | | | | | | | | |
| |
| | | MID CAP GROWTH FUND | |
| | | LEVEL 1 | | | LEVEL 2 | | | LEVEL 3 | | | TOTAL | |
| Assets: | | | | | | | | | | | | | | | | |
Common Stocks U.S. | | $ | 6,061,404 | | | $ | — | | | $ | — | | | $ | 6,061,404 | |
Short Term Investment | | | 38,133 | | | | — | | | | — | | | | 38,133 | |
Investment of Cash Collateral For Securities Loaned | | | 111,853 | | | | 118,772 | | | | — | | | | 230,625 | |
| | | | |
Total | | $ | 6,211,390 | | | $ | 118,772 | | | $ | — | | | $ | 6,330,162 | |
| | | | |
| |
| | | INTERNATIONAL GROWTH FUND | |
| | | LEVEL 1 | | | LEVEL 2 | | | LEVEL 3 | | | TOTAL | |
| Assets: | | | | | | | | | | | | | | | | |
Common Stocks U.S. | | $ | 61,914,164 | | | $ | — | | | $ | — | | | $ | 61,914,164 | |
Common Stocks Foreign | | | 91,586,976 | | | | 310,946,550 | | | | — | | | | 402,533,526 | |
Short Term Investment | | | 7,466,188 | | | | — | | | | — | | | | 7,466,188 | |
Investment of Cash Collateral For Securities Loaned | | | 15,805,692 | | | | 16,783,391 | | | | — | | | | 32,589,083 | |
| | | | |
Total | | $ | 176,773,020 | | | $ | 327,729,941 | | | $ | — | | | $ | 504,502,961 | |
| | | | |
| Liabilities: | | | | | | | | | | | | | | | | |
Forward Foreign Currency Contracts | | $ | — | | | $ | 929,759 | | | $ | — | | | $ | 929,759 | |
| | | | |
Total | | $ | — | | | $ | 929,759 | | | $ | — | | | $ | 929,759 | |
| | | | |
| | | | |
| | | TRANSFERS
IN TO
LEVEL 1* | | | TRANSFERS
OUT OF
LEVEL 1** | | | TRANSFERS
IN TO
LEVEL 2** | | | TRANSFERS
OUT OF
LEVEL 2* | |
| Investments at Value: | | | | | | | | | | | | | | | | |
Common Stocks Foreign | | $ | 59,014,874 | | | $ | 3,933,349 | | | $ | 3,933,349 | | | $ | 59,014,874 | |
| | | | |
Total | | $ | 59,014,874 | | | $ | 3,933,349 | | | $ | 3,933,349 | | | $ | 59,014,874 | |
| | | | |
* Transfers from Level 2 to Level 1 were due to the lack of the availability of an applied factor utilizing a systematic fair valuation model on securities that trade on European and Far Eastern exchanges. | |
** Transfers from Level 1 to Level 2 were due to the availability of an applied factor utilizing a systematic fair valuation model on securities that trade on European and Far Eastern exchanges. | |
| | | | |
| 176 | | CALAMOS OPEN-END FAMILY OF FUNDS SEMIANNUAL REPORT | | |
Notes to Financial Statements �� (Unaudited)
| | | | | | | | | | | | | | | | |
| |
| | | EVOLVING WORLD GROWTH FUND | |
| | | LEVEL 1 | | | LEVEL 2 | | | LEVEL 3 | | | TOTAL | |
| Assets: | | | | | | | | | | | | | | | | |
Convertible Bonds | | $ | — | | | $ | 86,984,050 | | | $ | — | | | $ | 86,984,050 | |
Common Stocks Foreign | | | 66,052,534 | | | | 257,931,426 | | | | — | | | | 323,983,960 | |
Common Stocks U.S. | | | 45,609,037 | | | | — | | | | — | | | | 45,609,037 | |
Short Term Investment | | | 16,744,710 | | | | — | | | | — | | | | 16,744,710 | |
Investment of Cash Collateral For Securities Loaned | | | 8,152,759 | | | | 8,657,067 | | | | — | | | | 16,809,826 | |
Forward Foreign Currency Contracts | | | — | | | | 53,226 | | | | — | | | | 53,226 | |
| | | | |
Total | | $ | 136,559,040 | | | $ | 353,625,769 | | | $ | — | | | $ | 490,184,809 | |
| | | | |
| Liabilities: | | | | | | | | | | | | | | | | |
Forward Foreign Currency Contracts | | $ | — | | | $ | 1,020,813 | | | $ | — | | | $ | 1,020,813 | |
| | | | |
Total | | $ | — | | | $ | 1,020,813 | | | $ | — | | | $ | 1,020,813 | |
| | | | |
| | | | |
| | | TRANSFERS
IN TO
LEVEL 1* | | | TRANSFERS
OUT OF
LEVEL 1 | | | TRANSFERS
IN TO
LEVEL 2 | | | TRANSFERS
OUT OF
LEVEL 2* | |
| Investments at Value: | | | | | | | | | | | | | | | | |
Common Stocks Foreign | | $ | 9,374,115 | | | $ | — | | | $ | — | | | $ | 9,374,115 | |
| | | | |
Total | | $ | 9,374,115 | | | $ | — | | | $ | — | | | $ | 9,374,115 | |
| | | | |
* Transfers from Level 2 to Level 1 were due to the lack of the availability of an applied factor utilizing a systematic fair valuation model on securities that trade on European and Far Eastern exchanges. | |
| |
| | | EMERGING MARKET EQUITY FUND | |
| | | LEVEL 1 | | | LEVEL 2 | | | LEVEL 3 | | | TOTAL | |
| Assets: | | | | | | | | | | | | | | | | |
Common Stocks Foreign | | $ | 1,968,362 | | | $ | 7,811,687 | | | $ | — | | | $ | 9,780,049 | |
Common Stocks U.S. | | | 3,117,092 | | | | — | | | | — | | | | 3,117,092 | |
Exchange-Traded Fund | | | 93,730 | | | | — | | | | — | | | | 93,730 | |
Short Term Investment | | | 307,314 | | | | — | | | | — | | | | 307,314 | |
Investment of Cash Collateral For Securities Loaned | | | 85,664 | | | | 90,963 | | | | — | | | | 176,627 | |
| | | | |
Total | | $ | 5,572,162 | | | $ | 7,902,650 | | | $ | — | | | $ | 13,474,812 | |
| | | | |
Notes to Financial Statements (Unaudited)
| | | | | | | | | | | | | | | | |
| |
| | | GLOBAL EQUITY FUND | |
| | | LEVEL 1 | | | LEVEL 2 | | | LEVEL 3 | | | TOTAL | |
| Assets: | | | | | | | | | | | | | | | | |
Common Stocks U.S. | | $ | 71,068,155 | | | $ | — | | | $ | — | | | $ | 71,068,155 | |
Common Stocks Foreign | | | 14,541,694 | | | | 58,885,750 | | | | — | | | | 73,427,444 | |
Short Term Investment | | | 4,080,650 | | | | — | | | | — | | | | 4,080,650 | |
Investment of Cash Collateral For Securities Loaned | | | 2,173,176 | | | | 2,307,603 | | | | — | | | | 4,480,779 | |
Forward Foreign Currency Contracts | | | — | | | | 31,200 | | | | — | | | | 31,200 | |
| | | | |
Total | | $ | 91,863,675 | | | $ | 61,224,553 | | | $ | — | | | $ | 153,088,228 | |
| | | | |
| Liabilities: | | | | | | | | | | | | | | | | |
Forward Foreign Currency Contracts | | $ | — | | | $ | 549,682 | | | $ | — | | | $ | 549,682 | |
| | | | |
Total | | $ | — | | | $ | 549,682 | | | $ | — | | | $ | 549,682 | |
| | | | |
| | | | |
| | | TRANSFERS
IN TO
LEVEL 1* | | | TRANSFERS
OUT OF
LEVEL 1 | | | TRANSFERS
IN TO
LEVEL 2 | | | TRANSFERS
OUT OF
LEVEL 2* | |
| Investments at Value: | | | | | | | | | | | | | | | | |
Common Stocks Foreign | | $ | 10,718,711 | | | $ | — | | | $ | — | | | $ | 10,718,711 | |
| | | | |
Total | | $ | 10,718,711 | | | $ | — | | | $ | — | | | $ | 10,718,711 | |
| | | | |
* Transfers from Level 2 to Level 1 were due to the lack of the availability of an applied factor utilizing a systematic fair valuation model on securities that trade on European and Far Eastern exchanges. | |
| |
| | | GROWTH AND INCOME FUND | |
| | | LEVEL 1 | | | LEVEL 2 | | | LEVEL 3 | | | TOTAL | |
| Assets: | | | | | | | | | | | | | | | | |
Convertible Bonds | | $ | — | | | $ | 371,600,278 | | | $ | — | | | $ | 371,600,278 | |
Corporate Bonds | | | — | | | | 169,612,880 | | | | — | | | | 169,612,880 | |
Convertible Preferred Stocks | | | 210,569,010 | | | | 26,738,282 | | | | — | | | | 237,307,292 | |
Common Stocks U.S. | | | 1,464,273,957 | | | | — | | | | — | | | | 1,464,273,957 | |
Short Term Investment | | | 115,612,115 | | | | — | | | | — | | | | 115,612,115 | |
Investment of Cash Collateral For Securities Loaned | | | 13,382,120 | | | | 14,209,902 | | | | — | | | | 27,592,022 | |
| | | | |
Total | | $ | 1,803,837,202 | | | $ | 582,161,342 | | | $ | — | | | $ | 2,385,998,544 | |
| | | | |
| | | | |
| 178 | | CALAMOS OPEN-END FAMILY OF FUNDS SEMIANNUAL REPORT | | |
Notes to Financial Statements (Unaudited)
| | | | | | | | | | | | | | | | |
| |
| | | GLOBAL GROWTH AND INCOME FUND | |
| | | LEVEL 1 | | | LEVEL 2 | | | LEVEL 3 | | | TOTAL | |
| Assets: | | | | | | | | | | | | | | | | |
Convertible Bonds | | $ | — | | | $ | 131,793,671 | | | $ | — | | | $ | 131,793,671 | |
Synthetic Convertible Securities (Corporate Bonds) | | | — | | | | 13,325,622 | | | | — | | | | 13,325,622 | |
Synthetic Convertible Securities (Purchased Options) | | | 635,210 | | | | — | | | | — | | | | 635,210 | |
Convertible Preferred Stocks | | | 13,541,240 | | | | — | | | | — | | | | 13,541,240 | |
Common Stocks U.S. | | | 94,661,614 | | | | — | | | | — | | | | 94,661,614 | |
Common Stocks Foreign | | | 15,450,630 | | | | 64,110,636 | | | | — | | | | 79,561,266 | |
Short Term Investment | | | 3,346,566 | | | | — | | | | — | | | | 3,346,566 | |
Investment of Cash Collateral For Securities Loaned | | | 4,973,146 | | | | 5,280,771 | | | | — | | | | 10,253,917 | |
| | | | |
Total | | $ | 132,608,406 | | | $ | 214,510,700 | | | $ | — | | | $ | 347,119,106 | |
| | | | |
| Liabilities: | | | | | | | | | | | | | | | | |
Forward Foreign Currency Contracts | | $ | — | | | $ | 370,313 | | | $ | — | | | $ | 370,313 | |
| | | | |
Total | | $ | — | | | $ | 370,313 | | | $ | — | | | $ | 370,313 | |
| | | | |
| | | | |
| | | TRANSFERS IN
TO LEVEL 1 | | | TRANSFERS OUT
OF LEVEL 1* | | | TRANSFERS IN
TO LEVEL 2* | | | TRANSFERS OUT
OF LEVEL 2 | |
| Investments at Value: | | | | | | | | | | | | | | | | |
Common Stocks Foreign | | $ | 12,026,078 | | | $ | — | | | $ | — | | | $ | 12,026,078 | |
| | | | |
Total | | $ | 12,026,078 | | | $ | — | | | $ | — | | | $ | 12,026,078 | |
| | | | |
* Transfers from Level 2 to Level 1 were due to the lack of the availability of an applied factor utilizing a systematic fair valuation model on securities that trade on European and Far Eastern exchanges. | |
| |
| | | CONVERTIBLE FUND | |
| | | LEVEL 1 | | | LEVEL 2 | | | LEVEL 3 | | | TOTAL | |
| Assets: | | | | | | | | | | | | | | | | |
Convertible Bonds | | $ | — | | | $ | 526,593,252 | | | $ | — | | | $ | 526,593,252 | |
Synthetic Convertible Securities (Corporate Bonds) | | | — | | | | 17,740,731 | | | | — | | | | 17,740,731 | |
Synthetic Convertible Securities (Purchased Options) | | | 1,627,525 | | | | — | | | | — | | | | 1,627,525 | |
Convertible Preferred Stocks | | | 226,268,100 | | | | 19,199,396 | | | | — | | | | 245,467,496 | |
Common Stocks U.S. | | | 11,603,930 | | | | — | | | | — | | | | 11,603,930 | |
Short Term Investment | | | 19,101,702 | | | | — | | | | — | | | | 19,101,702 | |
Investment of Cash Collateral For Securities Loaned | | | 26,609,058 | | | | 28,255,024 | | | | — | | | | 54,864,082 | |
| | | | |
Total | | $ | 285,210,315 | | | $ | 591,788,403 | | | $ | — | | | $ | 876,998,718 | |
| | | | |
| Liabilities: | | | | | | | | | | | | | | | | |
Forward Foreign Currency Contracts | | $ | — | | | $ | 91,584 | | | $ | — | | | $ | 91,584 | |
| | | | |
Total | | $ | — | | | $ | 91,584 | | | $ | — | | | $ | 91,584 | |
| | | | |
| |
| | | GLOBAL CONVERTIBLE FUND | |
| | | LEVEL 1 | | | LEVEL 2 | | | LEVEL 3 | | | TOTAL | |
| Assets: | | | | | | | | | | | | | | | | |
Convertible Bonds | | $ | — | | | $ | 52,870,507 | | | $ | — | | | $ | 52,870,507 | |
Synthetic Convertible Securities (Corporate Bonds) | | | — | | | | 5,401,294 | | | | — | | | | 5,401,294 | |
Synthetic Convertible Securities (Purchased Options) | | | 474,081 | | | | — | | | | — | | | | 474,081 | |
Convertible Preferred Stocks | | | 11,506,247 | | | | — | | | | — | | | | 11,506,247 | |
Short Term Investment | | | 3,987,549 | | | | — | | | | — | | | | 3,987,549 | |
Investment of Cash Collateral For Securities Loaned | | | 396,835 | | | | 421,383 | | | | — | | | | 818,218 | |
| | | | |
Total | | $ | 16,364,712 | | | $ | 58,693,184 | | | $ | — | | | $ | 75,057,896 | |
| | | | |
Notes to Financial Statements (Unaudited)
| | | | | | | | | | | | | | | | |
| |
| | | TOTAL RETURN BOND FUND | |
| | | LEVEL 1 | | | LEVEL 2 | | | LEVEL 3 | | | TOTAL | |
| Assets: | | | | | | | | | | | | | | | | |
Corporate Bonds | | $ | — | | | $ | 88,294,939 | | | $ | — | | | $ | 88,294,939 | |
U.S. Government and Agency Securities | | | — | | | | 10,241,588 | | | | — | | | | 10,241,588 | |
Short Term Investment | | | 3,401,972 | | | | — | | | | — | | | | 3,401,972 | |
Investment of Cash Collateral For Securities Loaned | | | 237,650 | | | | 252,350 | | | | — | | | | 490,000 | |
| | | | |
Total | | $ | 3,639,622 | | | $ | 98,788,877 | | | $ | — | | | $ | 102,428,499 | |
| | | | |
| |
| | | HIGH INCOME FUND | |
| | | LEVEL 1 | | | LEVEL 2 | | | LEVEL 3 | | | TOTAL | |
| Assets: | | | | | | | | | | | | | | | | |
Corporate Bonds | | $ | — | | | $ | 89,865,963 | | | $ | — | | | $ | 89,865,963 | |
Convertible Preferred Stocks | | | 1,228,833 | | | | — | | | | — | | | | 1,228,833 | |
Short Term Investment | | | 2,849,151 | | | | — | | | | — | | | | 2,849,151 | |
Investment of Cash Collateral For Securities Loaned | | | 3,492,013 | | | | 3,708,019 | | | | — | | | | 7,200,032 | |
| | | | |
Total | | $ | 7,569,997 | | | $ | 93,573,982 | | | $ | — | | | $ | 101,143,979 | |
| | | | |
| |
| | | MARKET NEUTRAL INCOME FUND | |
| | | LEVEL 1 | | | LEVEL 2 | | | LEVEL 3 | | | TOTAL | |
| Assets: | | | | | | | | | | | | | | | | |
Convertible Bonds | | $ | — | | | $ | 1,412,651,492 | | | $ | — | | | $ | 1,412,651,492 | |
Synthetic Convertible Securities (Corporate Bonds) | | | — | | | | 289,146,642 | | | | — | | | | 289,146,642 | |
Synthetic Convertible Securities (Purchased Options) | | | 14,710,000 | | | | — | | | | — | | | | 14,710,000 | |
Convertible Preferred Stocks | | | 149,676,010 | | | | 5,236,600 | | | | — | | | | 154,912,610 | |
Common Stocks U.S. | | | 1,856,261,840 | | | | — | | | | — | | | | 1,856,261,840 | |
Purchased Options | | | 21,671,569 | | | | — | | | | — | | | | 21,671,569 | |
Short Term Investment | | | 36,429,087 | | | | — | | | | — | | | | 36,429,087 | |
Investment of Cash Collateral For Securities Loaned | | | 16,678,354 | | | | 17,710,033 | | | | — | | | | 34,388,387 | |
| | | | |
Total | | $ | 2,095,426,860 | | | $ | 1,724,744,767 | | | $ | — | | | $ | 3,820,171,627 | |
| | | | |
| Liabilities: | | | | | | | | | | | | | | | | |
Common Stocks Sold Short U.S. | | $ | 824,993,232 | | | $ | — | | | $ | — | | | $ | 824,993,232 | |
Common Stocks Sold Short Foreign | | | — | | | | 2,891,100 | | | | — | | | | 2,891,100 | |
Written Options | | | 62,674,415 | | | | — | | | | — | | | | 62,674,415 | |
| | | | |
Total | | $ | 887,667,647 | | | $ | 2,891,100 | | | $ | — | | | $ | 890,558,747 | |
| | | | |
| |
| | | HEDGED EQUITY INCOME FUND | |
| | | LEVEL 1 | | | LEVEL 2 | | | LEVEL 3 | | | TOTAL | |
| Assets: | | | | | | | | | | | | | | | | |
Common Stocks U.S. | | $ | 15,443,296 | | | $ | — | | | $ | — | | | $ | 15,443,296 | |
Exchange-Traded Fund | | | 468,713 | | | | — | | | | — | | | | 468,713 | |
Purchased Options | | | 253,740 | | | | — | | | | — | | | | 253,740 | |
Short Term Investment | | | 425,932 | | | | — | | | | — | | | | 425,932 | |
| | | | |
Total | | $ | 16,591,681 | | | $ | — | | | $ | — | | | $ | 16,591,681 | |
| | | | |
| Liabilities: | | | | | | | | | | | | | | | | |
Written Options | | $ | 444,718 | | | $ | — | | | $ | — | | | $ | 444,718 | |
| | | | |
Total | | $ | 444,718 | | | $ | — | | | $ | — | | | $ | 444,718 | |
| | | | |
| | | | |
| 180 | | CALAMOS OPEN-END FAMILY OF FUNDS SEMIANNUAL REPORT | | |
Notes to Financial Statements (Unaudited)
| | | | | | | | | | | | | | | | |
| |
| | | PHINEUS LONG/SHORT FUND | |
| | | LEVEL 1 | | | LEVEL 2 | | | LEVEL 3 | | | TOTAL | |
| Assets: | | | | | | | | | | | | | | | | |
Common Stocks Foreign | | $ | 25,856 | | | $ | 219,485 | | | $ | — | | | $ | 245,341 | |
Common Stocks U.S. | | | 6,413,668 | | | | — | | | | — | | | | 6,413,668 | |
Exchange-Traded Fund | | | 3,867,720 | | | | — | | | | — | | | | 3,867,720 | |
Purchased Options | | | 36,474 | | | | — | | | | — | | | | 36,474 | |
Short Term Investment | | | 3,745,511 | | | | — | | | | — | | | | 3,745,511 | |
| | | | |
Total | | $ | 14,089,229 | | | $ | 219,485 | | | $ | — | | | $ | 14,308,714 | |
| | | | |
| Liabilities: | | | | | | | | | | | | | | | | |
Common Stocks Sold Short U.S. | | $ | 438,750 | | | $ | — | | | $ | — | | | $ | 438,750 | |
Exchange-Traded Funds Sold Short | | | 5,633,496 | | | | — | | | | — | | | | 5,633,496 | |
Written Options | | | 32,997 | | | | — | | | | — | | | | 32,997 | |
| | | | |
Total | | $ | 6,105,243 | | | $ | — | | | $ | — | | | $ | 6,105,243 | |
| | | | |
| |
| | | LONG/SHORT FUND | |
| | | LEVEL 1 | | | LEVEL 2 | | | LEVEL 3 | | | TOTAL | |
| Assets: | | | | | | | | | | | | | | | | |
Common Stocks U.S. | | $ | 34,158,056 | | | $ | — | | | $ | — | | | $ | 34,158,056 | |
Exchange-Traded Fund | | | 4,905,261 | | | | — | | | | — | | | | 4,905,261 | |
Purchased Options | | | 139,766 | | | | — | | | | — | | | | 139,766 | |
Short Term Investment | | | 4,032,399 | | | | — | | | | — | | | | 4,032,399 | |
| | | | |
Total | | $ | 43,235,482 | | | $ | — | | | $ | — | | | $ | 43,235,482 | |
| | | | |
| Liabilities: | | | | | | | | | | | | | | | | |
Common Stocks Sold Short U.S. | | $ | 8,228,725 | | | $ | — | | | $ | — | | | $ | 8,228,725 | |
Common Stocks Sold Short Foreign | | | — | | | | 966,700 | | | | — | | | | 966,700 | |
Exchange-Traded Funds Sold Short | | | 14,279,108 | | | | — | | | | — | | | | 14,279,108 | |
Written Options | | | 134,599 | | | | — | | | | — | | | | 134,599 | |
| | | | |
Total | | $ | 22,642,432 | | | $ | 966,700 | | | $ | — | | | $ | 23,609,132 | |
| | | | |
Notes to Financial Statements (Unaudited)
Note 9 – Capital Share Transactions
The following table summarizes the activity in capital shares of the Funds:
| | | | | | | | | | | | | | | | | | | | | | | | |
| For the Period Ended April 30, 2016 | |
| | | GROWTH FUND | | | OPPORTUNISTIC VALUE FUND | | | FOCUS GROWTH FUND | |
| Class A | | Shares | | | Dollars | | | Shares | | | Dollars | | | Shares | | | Dollars | |
| Shares sold | | | 1,779,748 | | | $ | 55,535,512 | | | | 372,397 | | | $ | 4,353,546 | | | | 67,165 | | | $ | 972,217 | |
| Shares issued as reinvestment of distributions | | | 10,531,182 | | | | 326,045,403 | | | | 243,389 | | | | 2,959,618 | | | | 212,717 | | | | 3,046,104 | |
| Less shares redeemed | | | (6,618,714 | ) | | | (217,686,977 | ) | | | (844,284 | ) | | | (10,770,356 | ) | | | (384,521 | ) | | | (5,373,696 | ) |
| | | | |
| Net increase (decrease) | | | 5,692,216 | | | $ | 163,893,938 | | | | (228,498 | ) | | $ | (3,457,192 | ) | | | (104,639 | ) | | $ | (1,355,375 | ) |
| | | | |
| | | | | | |
| Class B | | Shares | | | Dollars | | | Shares | | | Dollars | | | Shares | | | Dollars | |
| Shares sold* | | | 13,626 | | | $ | 380,393 | | | | 841 | | | $ | 9,176 | | | | 170 | | | $ | 2,000 | |
| Shares issued as reinvestment of distributions | | | 155,685 | | | | 4,390,329 | | | | 856 | | | | 9,671 | | | | 3,712 | | | | 48,147 | |
| Less shares redeemed | | | (256,543 | ) | | | (7,707,018 | ) | | | (6,305 | ) | | | (74,528 | ) | | | (12,469 | ) | | | (165,781 | ) |
| | | | |
| Net increase (decrease) | | | (87,232 | ) | | $ | (2,936,296 | ) | | | (4,608 | ) | | $ | (55,681 | ) | | | (8,587 | ) | | $ | (115,634 | ) |
| | | | |
| | | | | | |
| Class C | | Shares | | | Dollars | | | Shares | | | Dollars | | | Shares | | | Dollars | |
| Shares sold | | | 2,435,577 | | | $ | 52,862,280 | | | | 102,120 | | | $ | 1,112,061 | | | | 180,891 | | | $ | 2,364,192 | |
| Shares issued as reinvestment of distributions | | | 9,087,699 | | | | 198,202,721 | | | | 34,609 | | | | 383,118 | | | | 120,676 | | | | 1,566,380 | |
| Less shares redeemed | | | (5,624,875 | ) | | | (135,666,653 | ) | | | (102,385 | ) | | | (1,137,089 | ) | | | (393,438 | ) | | | (5,613,582 | ) |
| | | | |
| Net increase (decrease) | | | 5,898,401 | | | $ | 115,398,348 | | | | 34,344 | | | $ | 358,090 | | | | (91,871 | ) | | $ | (1,683,010 | ) |
| | | | |
| | | | | | |
| Class I | | Shares | | | Dollars | | | Shares | | | Dollars | | | Shares | | | Dollars | |
| Shares sold | | | 846,083 | | | $ | 32,644,017 | | | | 142,592 | | | $ | 1,741,392 | | | | 39,057 | | | $ | 552,575 | |
| Shares issued as reinvestment of distributions | | | 2,054,942 | | | | 79,834,503 | | | | 106,209 | | | | 1,324,420 | | | | 355,660 | | | | 5,178,407 | |
| Less shares redeemed | | | (3,031,497 | ) | | | (127,863,752 | ) | | | (229,742 | ) | | | (2,988,997 | ) | | | (156,905 | ) | | | (2,507,308 | ) |
| | | | |
| Net increase (decrease) | | | (130,472 | ) | | $ | (15,385,232 | ) | | | 19,059 | | | $ | 76,815 | | | | 237,812 | | | $ | 3,223,674 | |
| | | | |
| | | | | | |
| Class R | | Shares | | | Dollars | | | Shares | | | Dollars | | | Shares | | | Dollars | |
| Shares sold | | | 39,115 | | | $ | 1,131,481 | | | | 238 | | | $ | 3,085 | | | | 20,821 | | | $ | 329,833 | |
| Shares issued as reinvestment of distributions | | | 76,092 | | | | 2,237,107 | | | | 986 | | | | 11,864 | | | | 2,174 | | | | 30,508 | |
| Less shares redeemed | | | (66,535 | ) | | | (1,899,908 | ) | | | (2,316 | ) | | | (27,887 | ) | | | (45,159 | ) | | | (743,573 | ) |
| | | | |
| Net increase (decrease) | | | 48,672 | | | $ | 1,468,680 | | | | (1,092 | ) | | $ | (12,938 | ) | | | (22,164 | ) | | $ | (383,232 | ) |
| | | | |
| * | Class B shares continue to be outstanding but are no longer an offered class of shares. |
| | | | |
| 182 | | CALAMOS OPEN-END FAMILY OF FUNDS SEMIANNUAL REPORT | | |
Notes to Financial Statements (Unaudited)
| | | | | | | | | | | | | | | | | | | | | | | | |
| | | DISCOVERY
GROWTH FUND | | | DIVIDEND
GROWTH FUND | | | MID CAP
GROWTH FUND | |
| Class A | | Shares | | | Dollars | | | Shares | | | Dollars | | | Shares | | | Dollars | |
| Shares sold | | | 64,471 | | | $ | 800,408 | | | | 716,569 | | | $ | 7,101,587 | | | | 11,226 | | | $ | 112,616 | |
| Shares issued as reinvestment of distributions | | | 18,534 | | | | 223,515 | | | | 84,196 | | | | 846,479 | | | | 57,327 | | | | 565,247 | |
| Less shares redeemed | | | (1,141,207 | ) | | | (12,553,741 | ) | | | (826,990 | ) | | | (8,038,749 | ) | | | (1,153,832 | ) | | | (11,289,064 | ) |
| | | | |
| Net increase (decrease) | | | (1,058,202 | ) | | $ | (11,529,818 | ) | | | (26,225 | ) | | $ | (90,683 | ) | | | (1,085,279 | ) | | $ | (10,611,201 | ) |
| | | | |
| | | | | | |
| Class B | | Shares | | | Dollars | | | Shares | | | Dollars | | | Shares | | | Dollars | |
| Shares sold* | | | 6,381 | | | $ | 67,449 | | | | — | | | $ | — | | | | — | | | $ | — | |
| Shares issued as reinvestment of distributions | | | 1,399 | | | | 16,091 | | | | — | | | | — | | | | — | | | | — | |
| Less shares redeemed | | | (116,943 | ) | | | (1,257,005 | ) | | | — | | | | — | | | | — | | | | — | |
| | | | |
| Net increase (decrease) | | | (109,163 | ) | | $ | (1,173,465 | ) | | | — | | | $ | — | | | | — | | | $ | — | |
| | | | |
| | | | | | |
| Class C | | Shares | | | Dollars | | | Shares | | | Dollars | | | Shares | | | Dollars | |
| Shares sold | | | 24,868 | | | $ | 294,025 | | | | 28,771 | | | $ | 285,278 | | | | 2,537 | | | $ | 21,289 | |
| Shares issued as reinvestment of distributions | | | 2,270 | | | | 26,089 | | | | 1,889 | | | | 18,806 | | | | 2,865 | | | | 27,735 | |
| Less shares redeemed | | | (143,375 | ) | | | (1,512,737 | ) | | | (12,615 | ) | | | (123,806 | ) | | | (25,224 | ) | | | (248,115 | ) |
| | | | |
| Net increase (decrease) | | | (116,237 | ) | | $ | (1,192,623 | ) | | | 18,045 | | | $ | 180,278 | | | | (19,822 | ) | | $ | (199,091 | ) |
| | | | |
| | | | | | |
| Class I | | Shares | | | Dollars | | | Shares | | | Dollars | | | Shares | | | Dollars | |
| Shares sold | | | 33,858 | | | $ | 373,900 | | | | 229,374 | | | $ | 2,277,508 | | | | 66,472 | | | $ | 619,446 | |
| Shares issued as reinvestment of distributions | | | 7,408 | | | | 90,821 | | | | 23,462 | | | | 236,078 | | | | 39,601 | | | | 393,240 | |
| Less shares redeemed | | | (342,452 | ) | | | (3,888,032 | ) | | | (57,179 | ) | | | (570,284 | ) | | | (411,905 | ) | | | (3,826,466 | ) |
| | | | |
| Net increase (decrease) | | | (301,186 | ) | | $ | (3,423,311 | ) | | | 195,657 | | | $ | 1,943,302 | | | | (305,832 | ) | | $ | (2,813,780 | ) |
| | | | |
| | | | | | |
| Class R | | Shares | | | Dollars | | | Shares | | | Dollars | | | Shares | | | Dollars | |
| Shares sold | | | — | | | $ | — | | | | 236 | | | $ | 2,297 | | | | — | | | $ | — | |
| Shares issued as reinvestment of distributions | | | 1,401 | | | | 16,644 | | | | 282 | | | | 2,831 | | | | 685 | | | | 6,729 | |
| Less shares redeemed | | | (117,070 | ) | | | (1,300,029 | ) | | | — | ** | | | (3 | ) | | | — | | | | — | |
| | | | |
| Net increase (decrease) | | | (115,669 | ) | | $ | (1,283,385 | ) | | | 518 | | | $ | 5,125 | | | | 685 | | | $ | 6,729 | |
| | | | |
| * | Class B shares continue to be outstanding but are no longer an offered class of shares. |
| ** | Amounts are less than 1 share. |
Notes to Financial Statements (Unaudited)
| | | | | | | | | | | | | | | | | | | | | | | | |
| | | INTERNATIONAL GROWTH FUND | | | EVOLVING WORLD GROWTH FUND | | | EMERGING MARKET EQUITY FUND | |
| Class A | | Shares | | | Dollars | | | Shares | | | Dollars | | | Shares | | | Dollars | |
| Shares sold | | | 1,241,543 | | | $ | 20,325,896 | | | | 2,951,757 | | | $ | 33,629,084 | | | | 5,230 | | | $ | 43,068 | |
| Shares issued as reinvestment of distributions | | | 13,538 | | | | 230,151 | | | | 7,428 | | | | 87,352 | | | | 578 | | | | 4,645 | |
| Less shares redeemed | | | (3,497,242 | ) | | | (56,851,188 | ) | | | (3,159,537 | ) | | | (36,085,596 | ) | | | (19,272 | ) | | | (152,901 | ) |
| | | | |
| Net increase (decrease) | | | (2,242,161 | ) | | $ | (36,295,141 | ) | | | (200,352 | ) | | $ | (2,369,160 | ) | | | (13,464 | ) | | $ | (105,188 | ) |
| | | | |
| | | | | | |
| Class B | | Shares | | | Dollars | | | Shares | | | Dollars | | | Shares | | | Dollars | |
| Shares sold* | | | 1,333 | | | $ | 20,067 | | | | 484 | | | $ | 5,465 | | | | — | | | $ | — | |
| Shares issued as reinvestment of distributions | | | 82 | | | | 1,299 | | | | — | | | | — | | | | — | | | | — | |
| Less shares redeemed | | | (36,108 | ) | | | (547,258 | ) | | | (31,511 | ) | | | (348,409 | ) | | | — | | | | — | |
| | | | |
| Net increase (decrease) | | | (34,693 | ) | | $ | (525,892 | ) | | | (31,027 | ) | | $ | (342,944 | ) | | | — | | | $ | — | |
| | | | |
| | | | | | |
| Class C | | Shares | | | Dollars | | | Shares | | | Dollars | | | Shares | | | Dollars | |
| Shares sold | | | 477,073 | | | $ | 7,506,671 | | | | 502,610 | | | $ | 5,613,306 | | | | 12,495 | | | $ | 101,398 | |
| Shares issued as reinvestment of distributions | | | 3,681 | | | | 58,077 | | | | — | | | | — | | | | — | | | | — | |
| Less shares redeemed | | | (709,513 | ) | | | (10,590,399 | ) | | | (571,189 | ) | | | (6,258,356 | ) | | | (8,297 | ) | | | (64,017 | ) |
| | | | |
| Net increase (decrease) | | | (228,759 | ) | | $ | (3,025,651 | ) | | | (68,579 | ) | | $ | (645,050 | ) | | | 4,198 | | | $ | 37,381 | |
| | | | |
| | | | | | |
| Class I | | Shares | | | Dollars | | | Shares | | | Dollars | | | Shares | | | Dollars | |
| Shares sold | | | 1,574,217 | | | $ | 25,878,419 | | | | 8,359,666 | | | $ | 95,232,102 | | | | 28,021 | | | $ | 211,892 | |
| Shares issued as reinvestment of distributions | | | 22,879 | | | | 395,348 | | | | 88,404 | | | | 1,044,052 | | | | 5,011 | | | | 40,287 | |
| Less shares redeemed | | | (5,401,174 | ) | | | (87,657,768 | ) | | | (10,804,064 | ) | | | (126,040,044 | ) | | | (14,201 | ) | | | (108,381 | ) |
| | | | |
| Net increase (decrease) | | | (3,804,078 | ) | | $ | (61,384,001 | ) | | | (2,355,994 | ) | | $ | (29,763,890 | ) | | | 18,831 | | | $ | 143,798 | |
| | | | |
| | | | | | |
| Class R | | Shares | | | Dollars | | | Shares | | | Dollars | | | Shares | | | Dollars | |
| Shares sold | | | 66,467 | | | $ | 1,051,857 | | | | 74,310 | | | $ | 851,239 | | | | — | | | $ | — | |
| Shares issued as reinvestment of distributions | | | 459 | | | | 7,651 | | | | — | | | | — | | | | — | | | | — | |
| Less shares redeemed | | | (91,596 | ) | | | (1,476,414 | ) | | | (27,183 | ) | | | (307,703 | ) | | | — | | | | — | |
| | | | |
| Net increase (decrease) | | | (24,670 | ) | | $ | (416,906 | ) | | | 47,127 | | | $ | 543,536 | | | | — | | | $ | — | |
| | | | |
| * | Class B shares continue to be outstanding but are no longer an offered class of shares. |
| | | | |
| 184 | | CALAMOS OPEN-END FAMILY OF FUNDS SEMIANNUAL REPORT | | |
Notes to Financial Statements (Unaudited)
| | | | | | | | | | | | | | | | | | | | | | | | |
| | | GLOBAL EQUITY FUND | | | GROWTH AND INCOME FUND | | | GLOBAL GROWTH AND
INCOME FUND | |
| Class A | | Shares | | | Dollars | | | Shares | | | Dollars | | | Shares | | | Dollars | |
| Shares sold | | | 265,186 | | | $ | 3,282,436 | | | | 1,524,951 | | | $ | 45,506,017 | | | | 832,101 | | | $ | 6,902,539 | |
| Shares issued as reinvestment of distributions | | | 49,667 | | | | 630,271 | | | | 1,796,671 | | | | 53,210,638 | | | | 148,082 | | | | 1,237,967 | |
| Less shares redeemed | | | (2,622,512 | ) | | | (33,941,661 | ) | | | (4,274,301 | ) | | | (126,078,865 | ) | | | (2,082,592 | ) | | | (17,171,102 | ) |
| | | | |
| Net increase (decrease) | | | (2,307,659 | ) | | $ | (30,028,954 | ) | | | (952,679 | ) | | $ | (27,362,210 | ) | | | (1,102,409 | ) | | $ | (9,030,596 | ) |
| | | | |
| | | | | | |
| Class B | | Shares | | | Dollars | | | Shares | | | Dollars | | | Shares | | | Dollars | |
| Shares sold* | | | 4,377 | | | $ | 52,152 | | | | 3,172 | | | $ | 114,511 | | | | 1,366 | | | $ | 11,236 | |
| Shares issued as reinvestment of distributions | | | 756 | | | | 9,020 | | | | 8,832 | | | | 315,285 | | | | 2,344 | | | | 19,852 | |
| Less shares redeemed | | | (17,965 | ) | | | (206,784 | ) | | | (109,862 | ) | | | (3,894,715 | ) | | | (126,463 | ) | | | (1,054,686 | ) |
| | | | |
| Net increase (decrease) | | | (12,832 | ) | | $ | (145,612 | ) | | | (97,858 | ) | | $ | (3,464,919 | ) | | | (122,753 | ) | | $ | (1,023,598 | ) |
| | | | |
| | | | | | |
| Class C | | Shares | | | Dollars | | | Shares | | | Dollars | | | Shares | | | Dollars | |
| Shares sold | | | 147,544 | | | $ | 1,761,937 | | | | 1,140,009 | | | $ | 34,095,446 | | | | 619,990 | | | $ | 4,684,322 | |
| Shares issued as reinvestment of distributions | | | 28,225 | | | | 335,880 | | | | 1,172,500 | | | | 34,928,614 | | | | 171,112 | | | | 1,302,161 | |
| Less shares redeemed | | | (219,070 | ) | | | (2,483,604 | ) | | | (3,088,264 | ) | | | (91,228,472 | ) | | | (2,136,918 | ) | | | (15,981,111 | ) |
| | | | |
| Net increase (decrease) | | | (43,301 | ) | | $ | (385,787 | ) | | | (775,755 | ) | | $ | (22,204,412 | ) | | | (1,345,816 | ) | | $ | (9,994,628 | ) |
| | | | |
| | | | | | |
| Class I | | Shares | | | Dollars | | | Shares | | | Dollars | | | Shares | | | Dollars | |
| Shares sold | | | 811,965 | | | $ | 9,885,786 | | | | 2,256,265 | | | $ | 64,135,623 | | | | 1,817,088 | | | $ | 15,291,000 | |
| Shares issued as reinvestment of distributions | | | 117,373 | | | | 1,511,766 | | | | 927,391 | | | | 26,562,417 | | | | 185,762 | | | | 1,593,836 | |
| Less shares redeemed | | | (780,897 | ) | | | (9,717,006 | ) | | | (3,542,223 | ) | | | (100,912,430 | ) | | | (2,957,039 | ) | | | (24,910,697 | ) |
| | | | |
| Net increase (decrease) | | | 148,441 | | | $ | 1,680,546 | | | | (358,567 | ) | | $ | (10,214,390 | ) | | | (954,189 | ) | | $ | (8,025,861 | ) |
| | | | |
| | | | | | |
| Class R | | Shares | | | Dollars | | | Shares | | | Dollars | | | Shares | | | Dollars | |
| Shares sold | | | 31,900 | | | $ | 380,440 | | | | 52,548 | | | $ | 1,547,141 | | | | 12,635 | | | $ | 102,066 | |
| Shares issued as reinvestment of distributions | | | 7,619 | | | | 94,478 | | | | 24,224 | | | | 712,474 | | | | 1,523 | | | | 12,576 | |
| Less shares redeemed | | | (168,841 | ) | | | (2,119,837 | ) | | | (99,362 | ) | | | (2,901,409 | ) | | | (33,991 | ) | | | (274,819 | ) |
| | | | |
| Net increase (decrease) | | | (129,322 | ) | | $ | (1,644,919 | ) | | | (22,590 | ) | | $ | (641,794 | ) | | | (19,833 | ) | | $ | (160,177 | ) |
| | | | |
| * | Class B shares continue to be outstanding but are no longer an offered class of shares. |
Notes to Financial Statements (Unaudited)
| | | | | | | | | | | | | | | | | | | | | | | | |
| | | CONVERTIBLE FUND | | | GLOBAL CONVERTIBLE
FUND | | | TOTAL RETURN BOND FUND | |
| Class A | | Shares | | | Dollars | | | Shares | | | Dollars | | | Shares | | | Dollars | |
| Shares sold | | | 1,823,524 | | | $ | 27,989,352 | | | | 1,659,470 | | | $ | 15,723,798 | | | | 1,549,918 | | | $ | 15,957,470 | |
| Shares issued as reinvestment of distributions | | | 665,356 | | | | 10,447,433 | | | | 23,351 | | | | 224,209 | | | | 141,893 | | | | 1,458,571 | |
| Less shares redeemed | | | (8,937,869 | ) | | | (139,133,946 | ) | | | (655,415 | ) | | | (6,223,878 | ) | | | (780,540 | ) | | | (8,065,827 | ) |
| | | | |
| Net increase (decrease) | | | (6,448,989 | ) | | $ | (100,697,161 | ) | | | 1,027,406 | | | $ | 9,724,129 | | | | 911,271 | | | $ | 9,350,214 | |
| | | | |
| | | | | | |
| Class B | | Shares | | | Dollars | | | Shares | | | Dollars | | | Shares | | | Dollars | |
| Shares sold* | | | 2,366 | | | $ | 47,236 | | | | — | | | $ | — | | | | 5,748 | | | $ | 58,515 | |
| Shares issued as reinvestment of distributions | | | 4,247 | | | | 86,036 | | | | — | | | | — | | | | 1,899 | | | | 19,492 | |
| Less shares redeemed | | | (41,867 | ) | | | (831,361 | ) | | | — | | | | — | | | | (27,191 | ) | | | (282,278 | ) |
| | | | |
| Net increase (decrease) | | | (35,254 | ) | | $ | (698,089 | ) | | | — | | | $ | — | | | | (19,544 | ) | | $ | (204,271 | ) |
| | | | |
| | | | | | |
| Class C | | Shares | | | Dollars | | | Shares | | | Dollars | | | Shares | | | Dollars | |
| Shares sold | | | 583,658 | | | $ | 9,084,325 | | | | 163,131 | | | $ | 1,576,343 | | | | 257,837 | | | $ | 2,650,136 | |
| Shares issued as reinvestment of distributions | | | 383,801 | | | | 5,990,562 | | | | 1,223 | | | | 11,721 | | | | 26,777 | | | | 274,919 | |
| Less shares redeemed | | | (2,897,930 | ) | | | (44,695,620 | ) | | | (39,502 | ) | | | (365,778 | ) | | | (225,875 | ) | | | (2,325,108 | ) |
| | | | |
| Net increase (decrease) | | | (1,930,471 | ) | | $ | (29,620,733 | ) | | | 124,852 | | | $ | 1,222,286 | | | | 58,739 | | | $ | 599,947 | |
| | | | |
| | | | | | |
| Class I | | Shares | | | Dollars | | | Shares | | | Dollars | | | Shares | | | Dollars | |
| Shares sold | | | 4,751,108 | | | $ | 65,483,303 | | | | 4,109,983 | | | $ | 40,008,837 | | | | 732,824 | | | $ | 7,604,254 | |
| Shares issued as reinvestment of distributions | | | 878,826 | | | | 12,471,987 | | | | 41,825 | | | | 402,919 | | | | 50,663 | | | | 520,831 | |
| Less shares redeemed | | | (12,233,196 | ) | | | (174,418,738 | ) | | | (2,151,307 | ) | | | (20,125,182 | ) | | | (201,407 | ) | | | (2,076,793 | ) |
| | | | |
| Net increase (decrease) | | | (6,603,262 | ) | | $ | (96,463,448 | ) | | | 2,000,501 | | | $ | 20,286,574 | | | | 582,080 | | | $ | 6,048,292 | |
| | | | |
| | | | | | |
| Class R | | Shares | | | Dollars | | | Shares | | | Dollars | | | Shares | | | Dollars | |
| Shares sold | | | 19,278 | | | $ | 307,515 | | | | 9,115 | | | $ | 86,909 | | | | 15,393 | | | $ | 158,509 | |
| Shares issued as reinvestment of distributions | | | 3,238 | | | | 50,707 | | | | 129 | | | | 1,241 | | | | 715 | | | | 7,341 | |
| Less shares redeemed | | | (34,921 | ) | | | (545,961 | ) | | | (10,235 | ) | | | (98,547 | ) | | | (246 | ) | | | (2,562 | ) |
| | | | |
| Net increase (decrease) | | | (12,405 | ) | | $ | (187,739 | ) | | | (991 | ) | | $ | (10,397 | ) | | | 15,862 | | | $ | 163,288 | |
| | | | |
| * | Class B shares continue to be outstanding but are no longer an offered class of shares. |
| | | | |
| 186 | | CALAMOS OPEN-END FAMILY OF FUNDS SEMIANNUAL REPORT | | |
Notes to Financial Statements (Unaudited)
| | | | | | | | | | | | | | | | |
| | | HIGH INCOME FUND | | | MARKET NEUTRAL
INCOME FUND | |
| Class A | | Shares | | | Dollars | | | Shares | | | Dollars | |
| Shares sold | | | 2,791,041 | | | $ | 22,191,760 | | | | 14,344,004 | | | $ | 182,926,141 | |
| Shares issued as reinvestment of distributions | | | 162,912 | | | | 1,332,281 | | | | 1,689,367 | | | | 21,520,714 | |
| Less shares redeemed | | | (4,237,412 | ) | | | (35,064,836 | ) | | | (21,270,484 | ) | | | (270,676,880 | ) |
| | | | |
| Net increase (decrease) | | | (1,283,459 | ) | | $ | (11,540,795 | ) | | | (5,237,113 | ) | | $ | (66,230,025 | ) |
| | | | |
| | | | |
| Class B | | Shares | | | Dollars | | | Shares | | | Dollars | |
| Shares sold* | | | 16 | | | $ | 139 | | | | 451 | | | $ | 6,000 | |
| Shares issued as reinvestment of distributions | | | 1,059 | | | | 9,158 | | | | 1,249 | | | | 16,904 | |
| Less shares redeemed | | | (30,446 | ) | | | (265,829 | ) | | | (71,636 | ) | | | (970,387 | ) |
| | | | |
| Net increase (decrease) | | | (29,371 | ) | | $ | (256,532 | ) | | | (69,936 | ) | | $ | (947,483 | ) |
| | | | |
| | | | |
| Class C | | Shares | | | Dollars | | | Shares | | | Dollars | |
| Shares sold | | | 94,529 | | | $ | 817,439 | | | | 2,382,348 | | | $ | 30,797,771 | |
| Shares issued as reinvestment of distributions | | | 37,574 | | | | 321,279 | | | | 371,506 | | | | 4,807,292 | |
| Less shares redeemed | | | (343,357 | ) | | | (2,944,961 | ) | | | (2,854,480 | ) | | | (36,874,951 | ) |
| | | | |
| Net increase (decrease) | | | (211,254 | ) | | $ | (1,806,243 | ) | | | (100,626 | ) | | $ | (1,269,888 | ) |
| | | | |
| | | | |
| Class I | | Shares | | | Dollars | | | Shares | | | Dollars | |
| Shares sold | | | 405,990 | | | $ | 3,313,689 | | | | 48,156,930 | | | $ | 605,772,413 | |
| Shares issued as reinvestment of distributions | | | 46,594 | | | | 380,700 | | | | 3,730,402 | | | | 46,998,050 | |
| Less shares redeemed | | | (441,335 | ) | | | (3,608,852 | ) | | | (43,852,003 | ) | | | (551,460,253 | ) |
| | | | |
| Net increase (decrease) | | | 11,249 | | | $ | 85,537 | | | | 8,035,329 | | | $ | 101,310,210 | |
| | | | |
| | | | |
| Class R | | Shares | | | Dollars | | | Shares | | | Dollars | |
| Shares sold | | | 1,939 | | | $ | 16,364 | | | | 110,074 | | | $ | 1,398,896 | |
| Shares issued as reinvestment of distributions | | | 302 | | | | 2,449 | | | | 10,264 | | | | 130,244 | |
| Less shares redeemed | | | (3,201 | ) | | | (26,279 | ) | | | (129,964 | ) | | | (1,635,680 | ) |
| | | | |
| Net increase (decrease) | | | (960 | ) | | $ | (7,466 | ) | | | (9,626 | ) | | $ | (106,540 | ) |
| | | | |
| * | Class B shares continue to be outstanding but are no longer an offered class of shares. |
Notes to Financial Statements (Unaudited)
| | | | | | | | | | | | | | | | | | | | | | | | |
| | | HEDGED EQUITY
INCOME FUND | | | PHINEUS LONG/ SHORT FUND(a) | | | LONG/SHORT FUND | |
| Class A | | Shares | | | Dollars | | | Shares | | | Dollars | | | Shares | | | Dollars | |
| Shares sold | | | 420,302 | | | $ | 3,991,933 | | | | 25,771 | | | $ | 267,477 | | | | 202,476 | | | $ | 2,080,883 | |
| Shares issued as reinvestment of distributions | | | 11,205 | | | | 109,796 | | | | — | | | | — | | | | — | | | | — | |
| Less shares redeemed | | | (15,232 | ) | | | (148,355 | ) | | | — | | | | — | | | | (1,619,416 | ) | | | (15,725,212 | ) |
| | | | |
| Net increase (decrease) | | | 416,275 | | | $ | 3,953,374 | | | | 25,771 | | | $ | 267,477 | | | | (1,416,940 | ) | | $ | (13,644,329 | ) |
| | | | |
| | | | | | |
| Class B | | Shares | | | Dollars | | | Shares | | | Dollars | | | Shares | | | Dollars | |
| Shares sold* | | | — | | | $ | — | | | | — | | | $ | — | | | | — | | | $ | — | |
| Shares issued as reinvestment of distributions | | | — | | | | — | | | | — | | | | — | | | | — | | | | — | |
| Less shares redeemed | | | — | | | | — | | | | — | | | | — | | | | — | | | | — | |
| | | | |
| Net increase (decrease) | | | — | | | $ | — | | | | — | | | $ | — | | | | — | | | $ | — | |
| | | | |
| | | | | | |
| Class C | | Shares | | | Dollars | | | Shares | | | Dollars | | | Shares | | | Dollars | |
| Shares sold | | | 12,388 | | | $ | 121,755 | | | | 11,420 | | | $ | 114,995 | | | | 162,450 | | | $ | 1,660,191 | |
| Shares issued as reinvestment of distributions | | | 170 | | | | 1,669 | | | | — | | | | — | | | | — | | | | — | |
| Less shares redeemed | | | (5,859 | ) | | | (54,902 | ) | | | — | | | | — | | | | (210,598 | ) | | | (2,053,506 | ) |
| | | | |
| Net increase (decrease) | | | 6,699 | | | $ | 68,522 | | | | 11,420 | | | $ | 114,995 | | | | (48,148 | ) | | $ | (393,315 | ) |
| | | | |
| | | | | | |
| Class I | | Shares | | | Dollars | | | Shares | | | Dollars | | | Shares | | | Dollars | |
| Shares sold | | | 88,925 | | | $ | 844,250 | | | | 1,210,192 | | | $ | 12,489,337 | | | | 1,341,142 | | | $ | 14,412,156 | |
| Shares issued as reinvestment of distributions | | | 10,366 | | | | 101,756 | | | | — | | | | — | | | | — | | | | — | |
| Less shares redeemed | | | (27,826 | ) | | | (270,396 | ) | | | — | | | | — | | | | (3,149,592 | ) | | | (32,403,358 | ) |
| | | | |
| Net increase (decrease) | | | 71,465 | | | $ | 675,610 | | | | 1,210,192 | | | $ | 12,489,337 | | | | (1,808,450 | ) | | $ | (17,991,202 | ) |
| | | | |
| | | | | | |
| Class R | | Shares | | | Dollars | | | Shares | | | Dollars | | | Shares | | | Dollars | |
| Shares sold | | | 1,060 | | | $ | 10,000 | | | | — | | | $ | — | | | | — | | | $ | — | |
| Shares issued as reinvestment of distributions | | | 169 | | | | 1,657 | | | | — | | | | — | | | | — | | | | — | |
| Less shares redeemed | | | (1,060 | ) | | | (10,276 | ) | | | — | | | | — | | | | (7,675 | ) | | | (76,213 | ) |
| | | | |
| Net increase (decrease) | | | 169 | | | $ | 1,381 | | | | — | | | $ | — | | | | (7,675 | ) | | $ | (76,213 | ) |
| | | | |
| * | Class B shares continue to be outstanding but are no longer an offered class of shares. |
| (a) | Phineus Long/Short Fund commenced operations April 5, 2016. |
| | | | |
| 188 | | CALAMOS OPEN-END FAMILY OF FUNDS SEMIANNUAL REPORT | | |
Notes to Financial Statements (Unaudited)
The following table summarizes the activity in capital shares of the Funds:
| | | | | | | | | | | | | | | | | | | | | | | | |
| For the Fiscal Year or Period Ended October 31, 2015 | | | | | | | | | | | | | | | | | | |
| | | GROWTH FUND | | | OPPORTUNISTIC
VALUE FUND | | | FOCUS GROWTH FUND | |
| Class A | | Shares | | | Dollars | | | Shares | | | Dollars | | | Shares | | | Dollars | |
| Shares sold | | | 2,914,931 | | | $ | 124,586,708 | | | | 558,396 | | | $ | 7,498,981 | | | | 179,704 | | | $ | 3,118,013 | |
| Shares issued as reinvestment of distributions | | | 7,699,313 | | | | 313,670,008 | | | | 288,967 | | | | 3,984,849 | | | | 102,952 | | | | 1,750,183 | |
| Less shares redeemed | | | (11,583,483 | ) | | | (501,918,354 | ) | | | (1,432,714 | ) | | | (19,921,855 | ) | | | (306,385 | ) | | | (5,367,756 | ) |
| | | | |
| Net increase (decrease) | | | (969,239 | ) | | $ | (63,661,638 | ) | | | (585,351 | ) | | $ | (8,438,025 | ) | | | (23,729 | ) | | $ | (499,560 | ) |
| | | | |
| | | | | | |
| Class B | | Shares | | | Dollars | | | Shares | | | Dollars | | | Shares | | | Dollars | |
| Shares sold* | | | 16,239 | | | $ | 630,291 | | | | 33 | | | $ | 424 | | | | 5,760 | | | $ | 91,375 | |
| Shares issued as reinvestment of distributions | | | 166,266 | | | | 6,374,662 | | | | 1,724 | | | | 22,066 | | | | 2,271 | | | | 35,880 | |
| Less shares redeemed | | | (449,693 | ) | | | (18,526,842 | ) | | | (12,579 | ) | | | (161,689 | ) | | | (13,600 | ) | | | (221,983 | ) |
| | | | |
| Net increase (decrease) | | | (267,188 | ) | | $ | (11,521,889 | ) | | | (10,822 | ) | | $ | (139,199 | ) | | | (5,569 | ) | | $ | (94,728 | ) |
| | | | |
| | | | | | |
| Class C | | Shares | | | Dollars | | | Shares | | | Dollars | | | Shares | | | Dollars | |
| Shares sold | | | 1,794,239 | | | $ | 58,516,100 | | | | 41,708 | | | $ | 531,723 | | | | 165,339 | | | $ | 2,672,730 | |
| Shares issued as reinvestment of distributions | | | 5,597,831 | | | | 179,578,429 | | | | 44,005 | | | | 555,342 | | | | 62,358 | | | | 985,892 | |
| Less shares redeemed | | | (6,765,514 | ) | | | (233,439,116 | ) | | | (344,640 | ) | | | (4,420,663 | ) | | | (199,122 | ) | | | (3,217,629 | ) |
| | | | |
| Net increase (decrease) | | | 626,556 | | | $ | 4,655,413 | | | | (258,927 | ) | | $ | (3,333,598 | ) | | | 28,575 | | | $ | 440,993 | |
| | | | |
| | | | | | |
| Class I | | Shares | | | Dollars | | | Shares | | | Dollars | | | Shares | | | Dollars | |
| Shares sold | | | 2,149,851 | | | $ | 114,062,912 | | | | 393,017 | | | $ | 5,522,505 | | | | 105,053 | | | $ | 1,851,295 | |
| Shares issued as reinvestment of distributions | | | 2,364,190 | | | | 114,166,718 | | | | 149,268 | | | | 2,106,174 | | | | 166,011 | | | | 2,853,725 | |
| Less shares redeemed | | | (8,259,852 | ) | | | (423,103,153 | ) | | | (1,221,798 | ) | | | (17,411,933 | ) | | | (117,697 | ) | | | (2,096,341 | ) |
| | | | |
| Net increase (decrease) | | | (3,745,811 | ) | | $ | (194,873,523 | ) | | | (679,513 | ) | | $ | (9,783,254 | ) | | | 153,367 | | | $ | 2,608,679 | |
| | | | |
| | | | | | |
| Class R | | Shares | | | Dollars | | | Shares | | | Dollars | | | Shares | | | Dollars | |
| Shares sold | | | 48,305 | | | $ | 1,985,895 | | | | 686 | | | $ | 9,957 | | | | 41,167 | | | $ | 673,773 | |
| Shares issued as reinvestment of distributions | | | 48,259 | | | | 1,897,525 | | | | 821 | | | | 11,210 | | | | 940 | | | | 15,742 | |
| Less shares redeemed | | | (85,891 | ) | | | (3,597,648 | ) | | | (2 | ) | | | (31 | ) | | | (363 | ) | | | (6,119 | ) |
| | | | |
| Net increase (decrease) | | | 10,673 | | | $ | 285,772 | | | | 1,505 | | | $ | 21,136 | | | | 41,744 | | | $ | 683,396 | |
| | | | |
| * | Class B shares continue to be outstanding but are no longer an offered class of shares. |
Notes to Financial Statements (Unaudited)
| | | | | | | | | | | | | | | | | | | | | | | | |
| | | DISCOVERY
GROWTH FUND | | | DIVIDEND
GROWTH FUND | | | MID CAP
GROWTH FUND | |
| Class A | | Shares | | | Dollars | | | Shares | | | Dollars | | | Shares | | | Dollars | |
| Shares sold | | | 161,306 | | | $ | 2,172,090 | | | | 848,773 | | | $ | 8,719,505 | | | | 98,859 | | | $ | 1,139,798 | |
| Shares issued as reinvestment of distributions | | | 208,175 | | | | 2,735,426 | | | | 65,272 | | | | 674,912 | | | | — | | | | — | |
| Less shares redeemed | | | (686,346 | ) | | | (8,986,939 | ) | | | (878,925 | ) | | | (9,157,035 | ) | | | (1,970,732 | ) | | | (22,350,708 | ) |
| | | | |
| Net increase (decrease) | | | (316,865 | ) | | $ | (4,079,423 | ) | | | 35,120 | | | $ | 237,382 | | | | (1,871,873 | ) | | $ | (21,210,910 | ) |
| | | | |
| | | | | | |
| Class B | | Shares | | | Dollars | | | Shares | | | Dollars | | | Shares | | | Dollars | |
| Shares sold* | | | 60 | | | $ | 830 | | | | — | | | $ | — | | | | — | | | $ | — | |
| Shares issued as reinvestment of distributions | | | 12,864 | | | | 162,339 | | | | — | | | | — | | | | — | | | | — | |
| Less shares redeemed | | | (2,979 | ) | | | (37,148 | ) | | | — | | | | — | | | | — | | | | — | |
| | | | |
| Net increase (decrease) | | | 9,945 | | | $ | 126,021 | | | | — | | | $ | — | | | | — | | | $ | — | |
| | | | |
| | | | | | |
| Class C | | Shares | | | Dollars | | | Shares | | | Dollars | | | Shares | | | Dollars | |
| Shares sold | | | 7,803 | | | $ | 102,273 | | | | 37,549 | | | $ | 392,737 | | | | 63,166 | | | $ | 703,439 | |
| Shares issued as reinvestment of distributions | | | 19,388 | | | | 244,677 | | | | 958 | | | | 9,882 | | | | — | | | | — | |
| Less shares redeemed | | | (11,774 | ) | | | (153,355 | ) | | | (10,010 | ) | | | (106,307 | ) | | | (61,481 | ) | | | (706,837 | ) |
| | | | |
| Net increase (decrease) | | | 15,417 | | | $ | 193,595 | | | | 28,497 | | | $ | 296,312 | | | | 1,685 | | | $ | (3,398 | ) |
| | | | |
| | | | | | |
| Class I | | Shares | | | Dollars | | | Shares | | | Dollars | | | Shares | | | Dollars | |
| Shares sold | | | 236,749 | | | $ | 3,253,702 | | | | 344,659 | | | $ | 3,588,315 | | | | 418,202 | | | $ | 4,965,496 | |
| Shares issued as reinvestment of distributions | | | 72,836 | | | | 970,172 | | | | 20,437 | | | | 211,519 | | | | — | | | | — | |
| Less shares redeemed | | | (278,747 | ) | | | (3,789,984 | ) | | | (408,752 | ) | | | (4,279,366 | ) | | | (662,685 | ) | | | (7,826,415 | ) |
| | | | |
| Net increase (decrease) | | | 30,838 | | | $ | 433,890 | | | | (43,656 | ) | | $ | (479,532 | ) | | | (244,483 | ) | | $ | (2,860,919 | ) |
| | | | |
| | | | | | |
| Class R | | Shares | | | Dollars | | | Shares | | | Dollars | | | Shares | | | Dollars | |
| Shares sold | | | — | | | $ | — | | | | — | | | $ | — | | | | — | | | $ | — | |
| Shares issued as reinvestment of distributions | | | 13,249 | | | | 171,966 | | | | 268 | | | | 2,766 | | | | — | | | | — | |
| Less shares redeemed | | | (5,368 | ) | | | (67,544 | ) | | | — | | | | — | | | | — | | | | — | |
| | | | |
| Net increase (decrease) | | | 7,881 | | | $ | 104,422 | | | | 268 | | | $ | 2,766 | | | | — | | | $ | — | |
| | | | |
| * | Class B shares continue to be outstanding but are no longer an offered class of shares. |
| | | | |
| 190 | | CALAMOS OPEN-END FAMILY OF FUNDS SEMIANNUAL REPORT | | |
Notes to Financial Statements (Unaudited)
| | | | | | | | | | | | | | | | | | | | | | | | |
| | | INTERNATIONAL GROWTH FUND | | | EVOLVING WORLD GROWTH FUND | | | EMERGING MARKET
EQUITY FUND | |
| Class A | | Shares | | | Dollars | | | Shares | | | Dollars | | | Shares | | | Dollars | |
| Shares sold | | | 3,500,261 | | | $ | 61,239,325 | | | | 3,057,734 | | | $ | 39,443,486 | | | | 353,807 | | | $ | 3,407,036 | |
| Shares issued as reinvestment of distributions | | | 1,335,539 | | | | 22,316,855 | | | | 284,910 | | | | 3,638,296 | | | | 4,508 | | | | 41,566 | |
| Less shares redeemed | | | (5,901,142 | ) | | | (103,631,544 | ) | | | (5,529,537 | ) | | | (71,072,478 | ) | | | (372,007 | ) | | | (3,640,469 | ) |
| | | | |
| Net increase (decrease) | | | (1,065,342 | ) | | $ | (20,075,364 | ) | | | (2,186,893 | ) | | $ | (27,990,696 | ) | | | (13,692 | ) | | $ | (191,867 | ) |
| | | | |
| | | | | | |
| Class B | | Shares | | | Dollars | | | Shares | | | Dollars | | | Shares | | | Dollars | |
| Shares sold* | | | 2,165 | | | $ | 35,271 | | | | 410 | | | $ | 5,463 | | | | — | | | $ | — | |
| Shares issued as reinvestment of distributions | | | 13,946 | | | | 218,110 | | | | 1,090 | | | | 13,442 | | | | — | | | | — | |
| Less shares redeemed | | | (73,914 | ) | | | (1,224,653 | ) | | | (13,692 | ) | | | (176,449 | ) | | | — | | | | — | |
| | | | |
| Net increase (decrease) | | | (57,803 | ) | | $ | (971,272 | ) | | | (12,192 | ) | | $ | (157,544 | ) | | | — | | | $ | — | |
| | | | |
| | | | | | |
| Class C | | Shares | | | Dollars | | | Shares | | | Dollars | | | Shares | | | Dollars | |
| Shares sold | | | 340,822 | | | $ | 5,594,682 | | | | 622,186 | | | $ | 7,800,801 | | | | 5,669 | | | $ | 52,395 | |
| Shares issued as reinvestment of distributions | | | 342,126 | | | | 5,344,016 | | | | 74,081 | | | | 913,410 | | | | — | | | | — | |
| Less shares redeemed | | | (977,989 | ) | | | (16,176,862 | ) | | | (916,237 | ) | | | (11,339,374 | ) | | | (6,246 | ) | | | (54,108 | ) |
| | | | |
| Net increase (decrease) | | | (295,041 | ) | | $ | (5,238,164 | ) | | | (219,970 | ) | | $ | (2,625,163 | ) | | | (577 | ) | | $ | (1,713 | ) |
| | | | |
| | | | | | |
| Class I | | Shares | | | Dollars | | | Shares | | | Dollars | | | Shares | | | Dollars | |
| Shares sold | | | 4,456,107 | | | $ | 79,278,569 | | | | 11,194,213 | | | $ | 145,211,114 | | | | 234,818 | | | $ | 2,137,842 | |
| Shares issued as reinvestment of distributions | | | 2,336,056 | | | | 39,572,790 | | | | 758,102 | | | | 9,726,452 | | | | 6,673 | | | | 61,523 | |
| Less shares redeemed | | | (8,466,019 | ) | | | (151,756,913 | ) | | | (14,670,291 | ) | | | (187,261,767 | ) | | | (186,181 | ) | | | (1,711,674 | ) |
| | | | |
| Net increase (decrease) | | | (1,673,856 | ) | | $ | (32,905,554 | ) | | | (2,717,976 | ) | | $ | (32,324,201 | ) | | | 55,310 | | | $ | 487,691 | |
| | | | |
| | | | | | |
| Class R | | Shares | | | Dollars | | | Shares | | | Dollars | | | Shares | | | Dollars | |
| Shares sold | | | 183,609 | | | $ | 3,206,561 | | | | 97,628 | | | $ | 1,253,698 | | | | 1,656 | | | $ | 15,500 | |
| Shares issued as reinvestment of distributions | | | 76,975 | | | | 1,265,464 | | | | 2,473 | | | | 31,360 | | | | 17 | | | | 156 | |
| Less shares redeemed | | | (508,903 | ) | | | (8,632,983 | ) | | | (34,905 | ) | | | (456,773 | ) | | | (1,656 | ) | | | (13,762 | ) |
| | | | |
| Net increase (decrease) | | | (248,319 | ) | | $ | (4,160,958 | ) | | | 65,196 | | | $ | 828,285 | | | | 17 | | | $ | 1,894 | |
| | | | |
| * | Class B shares continue to be outstanding but are no longer an offered class of shares. |
Notes to Financial Statements (Unaudited)
| | | | | | | | | | | | | | | | | | | | | | | | |
| | | GLOBAL EQUITY FUND | | | GROWTH AND
INCOME FUND | | | GLOBAL GROWTH
AND INCOME FUND | |
| Class A | | Shares | | | Dollars | | | Shares | | | Dollars | | | Shares | | | Dollars | |
| Shares sold | | | 885,039 | | | $ | 11,565,492 | | | | 2,992,185 | | | $ | 95,746,121 | | | | 1,134,497 | | | $ | 9,884,746 | |
| Shares issued as reinvestment of distributions | | | 1,222,600 | | | | 15,074,660 | | | | 4,876,380 | | | | 153,699,703 | | | | 2,591,794 | | | | 21,822,907 | |
| Less shares redeemed | | | (2,632,605 | ) | | | (34,814,376 | ) | | | (10,366,848 | ) | | | (332,635,089 | ) | | | (5,115,518 | ) | | | (45,215,347 | ) |
| | | | |
| Net increase (decrease) | | | (524,966 | ) | | $ | (8,174,224 | ) | | | (2,498,283 | ) | | $ | (83,189,265 | ) | | | (1,389,227 | ) | | $ | (13,507,694 | ) |
| | | | |
| | | | | | |
| Class B | | Shares | | | Dollars | | | Shares | | | Dollars | | | Shares | | | Dollars | |
| Shares sold* | | | 2,981 | | | $ | 37,161 | | | | 8,557 | | | $ | 322,036 | | | | 8,671 | | | $ | 78,842 | |
| Shares issued as reinvestment of distributions | | | 19,094 | | | | 223,214 | | | | 41,298 | | | | 1,546,009 | | | | 74,467 | | | | 640,419 | |
| Less shares redeemed | | | (60,509 | ) | | | (758,354 | ) | | | (281,045 | ) | | | (10,792,552 | ) | | | (319,885 | ) | | | (2,901,607 | ) |
| | | | |
| Net increase (decrease) | | | (38,434 | ) | | $ | (497,979 | ) | | | (231,190 | ) | | $ | (8,924,507 | ) | | | (236,747 | ) | | $ | (2,182,346 | ) |
| | | | |
| | | | | | |
| Class C | | Shares | | | Dollars | | | Shares | | | Dollars | | | Shares | | | Dollars | |
| Shares sold | | | 270,711 | | | $ | 3,287,932 | | | | 1,841,328 | | | $ | 58,826,641 | | | | 1,393,916 | | | $ | 10,952,002 | |
| Shares issued as reinvestment of distributions | | | 368,575 | | | | 4,297,586 | | | | 3,093,272 | | | | 97,932,563 | | | | 2,710,087 | | | | 20,948,975 | |
| Less shares redeemed | | | (846,571 | ) | | | (10,586,444 | ) | | | (5,524,610 | ) | | | (177,778,084 | ) | | | (4,812,686 | ) | | | (38,969,784 | ) |
| | | | |
| Net increase (decrease) | | | (207,285 | ) | | $ | (3,000,926 | ) | | | (590,010 | ) | | $ | (21,018,880 | ) | | | (708,683 | ) | | $ | (7,068,807 | ) |
| | | | |
| | | | | | |
| Class I | | Shares | | | Dollars | | | Shares | | | Dollars | | | Shares | | | Dollars | |
| Shares sold | | | 2,117,952 | | | $ | 27,865,563 | | | | 3,541,343 | | | $ | 110,341,307 | | | | 2,755,187 | | | $ | 24,411,558 | |
| Shares issued as reinvestment of distributions | | | 1,213,118 | | | | 15,139,713 | | | | 2,539,328 | | | | 77,623,334 | | | | 2,955,029 | | | | 25,442,796 | |
| Less shares redeemed | | | (2,544,744 | ) | | | (34,566,984 | ) | | | (7,351,392 | ) | | | (229,339,611 | ) | | | (6,623,851 | ) | | | (60,471,750 | ) |
| | | | |
| Net increase (decrease) | | | 786,326 | | | $ | 8,438,292 | | | | (1,270,721 | ) | | $ | (41,374,970 | ) | | | (913,635 | ) | | $ | (10,617,396 | ) |
| | | | |
| | | | | | |
| Class R | | Shares | | | Dollars | | | Shares | | | Dollars | | | Shares | | | Dollars | |
| Shares sold | | | 138,939 | | | $ | 1,802,138 | | | | 108,242 | | | $ | 3,475,280 | | | | 37,620 | | | $ | 323,025 | |
| Shares issued as reinvestment of distributions | | | 116,339 | | | | 1,405,379 | | | | 66,352 | | | | 2,076,616 | | | | 28,609 | | | | 238,597 | |
| Less shares redeemed | | | (240,524 | ) | | | (3,081,837 | ) | | | (217,912 | ) | | | (6,960,904 | ) | | | (86,703 | ) | | | (768,752 | ) |
| | | | |
| Net increase (decrease) | | | 14,754 | | | $ | 125,680 | | | | (43,318 | ) | | $ | (1,409,008 | ) | | | (20,474 | ) | | $ | (207,130 | ) |
| | | | |
| * | Class B shares continue to be outstanding but are no longer an offered class of shares. |
| | | | |
| 192 | | CALAMOS OPEN-END FAMILY OF FUNDS SEMIANNUAL REPORT | | |
Notes to Financial Statements (Unaudited)
| | | | | | | | | | | | | | | | | | | | | | | | |
| | | CONVERTIBLE FUND | | | GLOBAL CONVERTIBLE
FUND1 | | | TOTAL RETURN
BOND FUND | |
| Class A | | Shares | | | Dollars | | | Shares | | | Dollars | | | Shares | | | Dollars | |
| Shares sold | | | 6,908,567 | | | $ | 122,488,719 | | | | 2,101,507 | | | $ | 21,010,211 | | | | 1,976,771 | | | $ | 20,802,702 | |
| Shares issued as reinvestment of distributions | | | 1,904,250 | | | | 33,276,754 | | | | 7,376 | | | | 73,599 | | | | 180,659 | | | | 1,904,115 | |
| Less shares redeemed | | | (11,808,296 | ) | | | (206,634,718 | ) | | | (39,859 | ) | | | (401,625 | ) | | | (3,550,696 | ) | | | (37,625,161 | ) |
| | | | |
| Net increase (decrease) | | | (2,995,479 | ) | | $ | (50,869,245 | ) | | | 2,069,024 | | | $ | 20,682,185 | | | | (1,393,266 | ) | | $ | (14,918,344 | ) |
| | | | |
| | | | | | |
| Class B | | Shares | | | Dollars | | | Shares | | | Dollars | | | Shares | | | Dollars | |
| Shares sold* | | | 6,101 | | | $ | 135,340 | | | | — | | | $ | — | | | | 2,827 | | | $ | 29,638 | |
| Shares issued as reinvestment of distributions | | | 14,043 | | | | 311,540 | | | | — | | | | — | | | | 3,554 | | | | 37,430 | |
| Less shares redeemed | | | (187,782 | ) | | | (4,199,108 | ) | | | — | | | | — | | | | (83,980 | ) | | | (888,608 | ) |
| | | | |
| Net increase (decrease) | | | (167,638 | ) | | $ | (3,752,228 | ) | | | — | | | $ | — | | | | (77,599 | ) | | $ | (821,540 | ) |
| | | | |
| | | | | | |
| Class C | | Shares | | | Dollars | | | Shares | | | Dollars | | | Shares | | | Dollars | |
| Shares sold | | | 1,842,735 | | | $ | 32,147,919 | | | | 126,977 | | | $ | 1,288,486 | | | | 221,242 | | | $ | 2,340,075 | |
| Shares issued as reinvestment of distributions | | | 970,022 | | | | 16,808,352 | | | | 414 | | | | 4,107 | | | | 33,594 | | | | 353,765 | |
| Less shares redeemed | | | (3,962,632 | ) | | | (68,842,760 | ) | | | (130 | ) | | | (1,274 | ) | | | (407,891 | ) | | | (4,310,991 | ) |
| | | | |
| Net increase (decrease) | | | (1,149,875 | ) | | $ | (19,886,489 | ) | | | 127,261 | | | $ | 1,291,319 | | | | (153,055 | ) | | $ | (1,617,151 | ) |
| | | | |
| | | | | | |
| Class I | | Shares | | | Dollars | | | Shares | | | Dollars | | | Shares | | | Dollars | |
| Shares sold | | | 10,534,281 | | | $ | 166,993,952 | | | | 2,654,302 | | | $ | 27,302,363 | | | | 640,444 | | | $ | 6,745,470 | |
| Shares issued as reinvestment of distributions | | | 2,429,895 | | | | 38,648,591 | | | | 17,067 | | | | 170,829 | | | | 47,954 | | | | 505,463 | |
| Less shares redeemed | | | (15,184,412 | ) | | | (242,444,512 | ) | | | (354,055 | ) | | | (3,443,780 | ) | | | (360,456 | ) | | | (3,825,872 | ) |
| | | | |
| Net increase (decrease) | | | (2,220,236 | ) | | $ | (36,801,969 | ) | | | 2,317,314 | | | $ | 24,029,412 | | | | 327,942 | | | $ | 3,425,061 | |
| | | | |
| | | | | | |
| Class R | | Shares | | | Dollars | | | Shares | | | Dollars | | | Shares | | | Dollars | |
| Shares sold | | | 64,033 | | | $ | 1,130,744 | | | | 19,247 | | | $ | 190,519 | | | | 6,732 | | | $ | 70,895 | |
| Shares issued as reinvestment of distributions | | | 8,637 | | | | 150,610 | | | | 101 | | | | 999 | | | | 795 | | | | 8,379 | |
| Less shares redeemed | | | (103,875 | ) | | | (1,837,592 | ) | | | (165 | ) | | | (1,596 | ) | | | (3,346 | ) | | | (35,390 | ) |
| | | | |
| Net increase (decrease) | | | (31,205 | ) | | $ | (556,238 | ) | | | 19,183 | | | $ | 189,922 | | | | 4,181 | | | $ | 43,884 | |
| | | | |
| 1 | Global Convertible Fund commenced operations on December 31, 2014. |
| * | Class B shares continue to be outstanding but are no longer an offered class of shares. |
Notes to Financial Statements (Unaudited)
| | | | | | | | | | | | | | | | |
| | | HIGH INCOME FUND | | | MARKET NEUTRAL INCOME FUND | |
| Class A | | Shares | | | Dollars | | | Shares | | | Dollars | |
| Shares sold | | | 6,478,149 | | | $ | 57,789,521 | | | | 25,435,286 | | | $ | 331,907,273 | |
| Shares issued as reinvestment of distributions | | | 718,492 | | | | 6,457,865 | | | | 1,757,729 | | | | 22,777,716 | |
| Less shares redeemed | | | (12,670,719 | ) | | | (115,409,036 | ) | | | (49,761,327 | ) | | | (649,450,135 | ) |
| | | | |
| Net increase (decrease) | | | (5,474,078 | ) | | $ | (51,161,650 | ) | | | (22,568,312 | ) | | $ | (294,765,146 | ) |
| | | | |
| | | | |
| Class B | | Shares | | | Dollars | | | Shares | | | Dollars | |
| Shares sold* | | | 974 | | | $ | 9,387 | | | | 3,450 | | | $ | 47,170 | |
| Shares issued as reinvestment of distributions | | | 9,209 | | | | 87,307 | | | | 2,483 | | | | 34,010 | |
| Less shares redeemed | | | (142,628 | ) | | | (1,366,284 | ) | | | (193,545 | ) | | | (2,665,875 | ) |
| | | | |
| Net increase (decrease) | | | (132,445 | ) | | $ | (1,269,590 | ) | | | (187,612 | ) | | $ | (2,584,695 | ) |
| | | | |
| | | | |
| Class C | | Shares | | | Dollars | | | Shares | | | Dollars | |
| Shares sold | | | 92,673 | | | $ | 871,998 | | | | 4,536,455 | | | $ | 60,072,372 | |
| Shares issued as reinvestment of distributions | | | 145,354 | | | | 1,361,549 | | | | 257,558 | | | | 3,385,832 | |
| Less shares redeemed | | | (811,680 | ) | | | (7,672,675 | ) | | | (5,504,043 | ) | | | (72,808,568 | ) |
| | | | |
| Net increase (decrease) | | | (573,653 | ) | | $ | (5,439,128 | ) | | | (710,030 | ) | | $ | (9,350,364 | ) |
| | | | |
| | | | |
| Class I | | Shares | | | Dollars | | | Shares | | | Dollars | |
| Shares sold | | | 867,341 | | | $ | 7,920,245 | | | | 79,278,656 | | | $ | 1,023,686,463 | |
| Shares issued as reinvestment of distributions | | | 180,014 | | | | 1,615,576 | | | | 3,812,543 | | | | 48,918,321 | |
| Less shares redeemed | | | (1,548,412 | ) | | | (13,944,840 | ) | | | (89,539,893 | ) | | | (1,155,523,315 | ) |
| | | | |
| Net increase (decrease) | | | (501,057 | ) | | $ | (4,409,019 | ) | | | (6,448,694 | ) | | $ | (82,918,531 | ) |
| | | | |
| | | | |
| Class R | | Shares | | | Dollars | | | Shares | | | Dollars | |
| Shares sold | | | 895 | | | $ | 8,421 | | | | 286,295 | | | $ | 3,714,249 | |
| Shares issued as reinvestment of distributions | | | 1,347 | | | | 12,053 | | | | 8,827 | | | | 113,962 | |
| Less shares redeemed | | | (6,029 | ) | | | (54,909 | ) | | | (341,181 | ) | | | (4,432,329 | ) |
| | | | |
| Net increase (decrease) | | | (3,787 | ) | | $ | (34,435 | ) | | | (46,059 | ) | | $ | (604,118 | ) |
| | | | |
| * | Class B shares continue to be outstanding but are no longer an offered class of shares. |
| | | | |
| 194 | | CALAMOS OPEN-END FAMILY OF FUNDS SEMIANNUAL REPORT | | |
Notes to Financial Statements (Unaudited)
| | | | | | | | | | | | | | | | |
| | | HEDGED EQUITY INCOME FUND1 | | | LONG/SHORT FUND | |
| Class A | | Shares | | | Dollars | | | Shares | | | Dollars | |
| Shares sold | | | 567,937 | | | $ | 5,670,164 | | | | 729,770 | | | $ | 7,895,425 | |
| Shares issued as reinvestment of distributions | | | 3,689 | | | | 36,766 | | | | 43,613 | | | | 468,409 | |
| Less shares redeemed | | | (5,816 | ) | | | (58,492 | ) | | | (1,610,320 | ) | | | (17,369,034 | ) |
| | | | |
| Net increase (decrease) | | | 565,810 | | | $ | 5,648,438 | | | | (836,937 | ) | | $ | (9,005,200 | ) |
| | | | |
| | | | |
| Class B | | Shares | | | Dollars | | | Shares | | | Dollars | |
| Shares sold | | | — | | | $ | — | | | | — | | | $ | — | |
| Shares issued as reinvestment of distributions | | | — | | | | — | | | | — | | | | — | |
| Less shares redeemed | | | — | | | | — | | | | — | | | | — | |
| | | | |
| Net increase (decrease) | | | — | | | $ | — | | | | — | | | $ | — | |
| | | | |
| | | | |
| Class C | | Shares | | | Dollars | | | Shares | | | Dollars | |
| Shares sold | | | 10,000 | | | $ | 100,000 | | | | 158,640 | | | $ | 1,694,121 | |
| Shares issued as reinvestment of distributions | | | 29 | | | | 289 | | | | 7,311 | | | | 77,702 | |
| Less shares redeemed | | | — | | | | — | | | | (297,009 | ) | | | (3,164,168 | ) |
| | | | |
| Net increase (decrease) | | | 10,029 | | | $ | 100,289 | | | | (131,058 | ) | | $ | (1,392,345 | ) |
| | | | |
| | | | |
| Class I | | Shares | | | Dollars | | | Shares | | | Dollars | |
| Shares sold | | | 547,856 | | | $ | 5,475,837 | | | | 1,704,498 | | | $ | 18,554,168 | |
| Shares issued as reinvestment of distributions | | | 4,254 | | | | 42,418 | | | | 86,795 | | | | 935,646 | |
| Less shares redeemed | | | (124 | ) | | | (1,237 | ) | | | (5,078,962 | ) | | | (54,756,729 | ) |
| | | | |
| Net increase (decrease) | | | 551,986 | | | $ | 5,517,018 | | | | (3,287,669 | ) | | $ | (35,266,915 | ) |
| | | | |
| | | | |
| Class R | | Shares | | | Dollars | | | Shares | | | Dollars | |
| Shares sold | | | 10,000 | | | $ | 100,000 | | | | — | | | $ | — | |
| Shares issued as reinvestment of distributions | | | 54 | | | | 538 | | | | 123 | | | | 1,308 | |
| Less shares redeemed | | | — | | | | — | | | | — | | | | — | |
| | | | |
| Net increase (decrease) | | | 10,054 | | | $ | 100,538 | | | | 123 | | | $ | 1,308 | |
| | | | |
| 1 | Hedged Equity Income Fund commenced operations December 31, 2014. |
Calamos Growth Fund Financial Highlights
Selected data for a share outstanding throughout each period were as follows:
| | | | | | | | | | | | | | | | | | | | | | | | |
| | | CLASS A | |
| | | (Unaudited)
Six Months
Ended
April 30, | | | Year Ended October 31, | |
| | | 2016 | | | 2015 | | | 2014 | | | 2013 | | | 2012 | | | 2011 | |
Net asset value, beginning of period | | | $42.80 | | | | $50.16 | | | | $58.75 | | | | $49.90 | | | | $51.06 | | | | $49.18 | |
Income from investment operations: | | | | | | | | | | | | | | | | | | | | | | | | |
Net investment income (loss)(a) | | | (0.04 | ) | | | (0.07 | ) | | | (0.20 | ) | | | (0.05 | ) | | | (0.22 | ) | | | (0.32 | ) |
Net realized and unrealized gain (loss) | | | (2.21 | ) | | | 2.84 | | | | 6.90 | | | | 12.63 | | | | 1.21 | | | | 2.20 | |
Total from investment operations | | | (2.25 | ) | | | 2.77 | | | | 6.70 | | | | 12.58 | | | | 0.99 | | | | 1.88 | |
Distributions: | | | | | | | | | | | | | | | | | | | | | | | | |
Dividends from net investment income | | | — | | | | — | | | | — | | | | — | | | | — | | | | — | |
Dividends from net realized gains | | | (10.94 | ) | | | (10.13 | ) | | | (15.29 | ) | | | (3.73 | ) | | | (2.15 | ) | | | — | |
Total distributions | | | (10.94 | ) | | | (10.13 | ) | | | (15.29 | ) | | | (3.73 | ) | | | (2.15 | ) | | | — | |
Net asset value, end of period | | | $29.61 | | | | $42.80 | | | | $50.16 | | | | $58.75 | | | | $49.90 | | | | $51.06 | |
Ratios and supplemental data: | | | | | | | | | | | | | | | | | | | | | | | | |
Total return(b) | | | (6.37% | ) | | | 6.55% | | | | 13.84% | | | | 26.95% | | | | 2.26% | | | | 3.82% | |
Net assets, end of period (000) | | | $1,154,588 | | | | $1,424,967 | | | | $1,718,674 | | | | $2,237,328 | | | | $3,241,595 | | | | $4,232,942 | |
Ratio of net expenses to average net assets | | | 1.34% | (c) | | | 1.31% | | | | 1.26% | | | | 1.26% | | | | 1.29% | | | | 1.26% | |
Ratio of gross expenses to average net assets prior to expense reductions | | | 1.34% | (c) | | | 1.31% | | | | 1.26% | | | | 1.26% | | | | 1.29% | | | | 1.26% | |
Ratio of net investment income (loss) to average net assets | | | (0.24% | )(c) | | | (0.17% | ) | | | (0.42% | ) | | | (0.10% | ) | | | (0.44% | ) | | | (0.60% | ) |
| | |
| | | (Unaudited)
Six Months
Ended
April 30, | | | Year Ended October 31, | |
| | | 2016 | | | 2015 | | | 2014 | | | 2013 | | | 2012 | | | 2011 | |
Portfolio turnover rate | | | 27.4% | | | | 60.0% | | | | 41.8% | | | | 67.1% | | | | 57.0% | | | | 84.7% | |
| (a) | Net investment income (loss) allocated based on average shares method. |
| (b) | Total return measures net investment income (loss) and capital gain or loss from portfolio investments assuming reinvestment of dividends and capital gains distributions. Total return is not annualized for periods that are less than a full year, does not reflect the effect of sales charge for Class A shares nor the contingent deferred sales charge for Class B and C shares and does not reflect the deduction of taxes that a shareholder would pay on fund distributions or the redemption of fund shares. |
| | | | |
| 196 | | CALAMOS OPEN-END FAMILY OF FUNDS SEMIANNUAL REPORT | | |
Calamos Growth Fund Financial Highlights
| | | | | | | | | | | | | | | | | | | | | | | | |
| | | CLASS B | |
| | | (Unaudited)
Six Months
Ended
April 30, | | | Year Ended October 31, | |
| | | 2016 | | | 2015 | | | 2014 | | | 2013 | | | 2012 | | | 2011 | |
Net asset value, beginning of period | | | $40.02 | | | | $47.84 | | | | $57.05 | | | | $48.90 | | | | $50.44 | | | | $48.96 | |
Income from investment operations: | | | | | | | | | | | | | | | | | | | | | | | | |
Net investment income (loss)(a) | | | (0.14 | ) | | | (0.37 | ) | | | (0.56 | ) | | | (0.43 | ) | | | (0.59 | ) | | | (0.71 | ) |
Net realized and unrealized gain (loss) | | | (2.04 | ) | | | 2.68 | | | | 6.64 | | | | 12.31 | | | | 1.20 | | | | 2.19 | |
Total from investment operations | | | (2.18 | ) | | | 2.31 | | | | 6.08 | | | | 11.88 | | | | 0.61 | | | | 1.48 | |
Distributions: | | | | | | | | | | | | | | | | | | | | | | | | |
Dividends from net investment income | | | — | | | | — | | | | — | | | | — | | | | — | | | | — | |
Dividends from net realized gains | | | (10.94 | ) | | | (10.13 | ) | | | (15.29 | ) | | | (3.73 | ) | | | (2.15 | ) | | | — | |
Total distributions | | | (10.94 | ) | | | (10.13 | ) | | | (15.29 | ) | | | (3.73 | ) | | | (2.15 | ) | | | — | |
Net asset value, end of period | | | $26.90 | | | | $40.02 | | | | $47.84 | | | | $57.05 | | | | $48.90 | | | | $50.44 | |
Ratios and supplemental data: | | | | | | | | | | | | | | | | | | | | | | | | |
Total return(b) | | | (6.71% | ) | | | 5.76% | | | | 12.97% | | | | 26.00% | | | | 1.50% | | | | 3.02% | |
Net assets, end of period (000) | | | $11,178 | | | | $20,119 | | | | $36,835 | | | | $84,895 | | | | $171,357 | | | | $335,792 | |
Ratio of net expenses to average net assets | | | 2.09% | (c) | | | 2.06% | | | | 2.00% | | | | 2.02% | | | | 2.03% | | | | 2.01% | |
Ratio of gross expenses to average net assets prior to expense reductions | | | 2.09% | (c) | | | 2.06% | | | | 2.00% | | | | 2.02% | | | | 2.03% | | | | 2.01% | |
Ratio of net investment income (loss) to average net assets | | | (0.98% | )(c) | | | (0.91% | ) | | | (1.17% | ) | | | (0.86% | ) | | | (1.18% | ) | | | (1.34% | ) |
| |
| | | CLASS C | |
| | | (Unaudited)
Six Months
Ended
April 30, | | | Year Ended October 31, | |
| | | 2016 | | | 2015 | | | 2014 | | | 2013 | | | 2012 | | | 2011 | |
Net asset value, beginning of period | | | $33.48 | | | | $41.66 | | | | $51.58 | | | | $44.56 | | | | $46.16 | | | | $44.80 | |
Income from investment operations: | | | | | | | | | | | | | | | | | | | | | | | | |
Net investment income (loss)(a) | | | (0.11 | ) | | | (0.32 | ) | | | (0.48 | ) | | | (0.38 | ) | | | (0.54 | ) | | | (0.66 | ) |
Net realized and unrealized gain (loss) | | | (1.63 | ) | | | 2.27 | | | | 5.85 | | | | 11.13 | | | | 1.09 | | | | 2.02 | |
Total from investment operations | | | (1.74 | ) | | | 1.95 | | | | 5.37 | | | | 10.75 | | | | 0.55 | | | | 1.36 | |
Distributions: | | | | | | | | | | | | | | | | | | | | | | | | |
Dividends from net investment income | | | — | | | | — | | | | — | | | | — | | | | — | | | | — | |
Dividends from net realized gains | | | (10.94 | ) | | | (10.13 | ) | | | (15.29 | ) | | | (3.73 | ) | | | (2.15 | ) | | | — | |
Total distributions | | | (10.94 | ) | | | (10.13 | ) | | | (15.29 | ) | | | (3.73 | ) | | | (2.15 | ) | | | — | |
Net asset value, end of period | | | $20.80 | | | | $33.48 | | | | $41.66 | | | | $51.58 | | | | $44.56 | | | | $46.16 | |
Ratios and supplemental data: | | | | | | | | | | | | | | | | | | | | | | | | |
Total return(b) | | | (6.71% | ) | | | 5.75% | | | | 12.97% | | | | 26.00% | | | | 1.51% | | | | 3.04% | |
Net assets, end of period (000) | | | $614,821 | | | | $792,046 | | | | $959,445 | | | | $1,096,492 | | | | $1,272,104 | | | | $1,517,047 | |
Ratio of net expenses to average net assets | | | 2.09% | (c) | | | 2.06% | | | | 2.01% | | | | 2.01% | | | | 2.04% | | | | 2.01% | |
Ratio of gross expenses to average net assets prior to expense reductions | | | 2.09% | (c) | | | 2.06% | | | | 2.01% | | | | 2.01% | | | | 2.04% | | | | 2.01% | |
Ratio of net investment income (loss) to average net assets | | | (0.99% | )(c) | | | (0.92% | ) | | | (1.17% | ) | | | (0.85% | ) | | | (1.19% | ) | | | (1.35% | ) |
| (a) | Net investment income allocated based on average shares method. |
| (b) | Total return measures net investment income (loss) and capital gain or loss from portfolio investments assuming reinvestment of dividends and capital gains distributions. Total return is not annualized for periods that are less than a full year, does not reflect the effect of sales charge for Class A shares nor the contingent deferred sales charge for Class B and C shares and does not reflect the deduction of taxes that a shareholder would pay on fund distributions or the redemption of fund shares. |
Calamos Growth Fund Financial Highlights
| | | | | | | | | | | | | | | | | | | | | | | | |
| | | CLASS I | |
| | | (Unaudited)
Six Months
Ended
April 30, | | | Year Ended October 31, | |
| | | 2016 | | | 2015 | | | 2014 | | | 2013 | | | 2012 | | | 2011 | |
Net asset value, beginning of period | | | $50.84 | | | | $57.59 | | | | $65.15 | | | | $54.81 | | | | $55.72 | | | | $53.54 | |
Income from investment operations: | | | | | | | | | | | | | | | | | | | | | | | | |
Net investment income (loss)(a) | | | — | | | | 0.05 | | | | (0.10 | ) | | | 0.08 | | | | (0.10 | ) | | | (0.21 | ) |
Net realized and unrealized gain (loss) | | | (2.71 | ) | | | 3.33 | | | | 7.83 | | | | 13.99 | | | | 1.34 | | | | 2.39 | |
Total from investment operations | | | (2.71 | ) | | | 3.38 | | | | 7.73 | | | | 14.07 | | | | 1.24 | | | | 2.18 | |
Distributions: | | | | | | | | | | | | | | | | | | | | | | | | |
Dividends from net investment income | | | — | | | | — | | | | — | | | | — | | | | — | | | | — | |
Dividends from net realized gains | | | (10.94 | ) | | | (10.13 | ) | | | (15.29 | ) | | | (3.73 | ) | | | (2.15 | ) | | | — | |
Total distributions | | | (10.94 | ) | | | (10.13 | ) | | | (15.29 | ) | | | (3.73 | ) | | | (2.15 | ) | | | — | |
Net asset value, end of period | | | $37.19 | | | | $50.84 | | | | $57.59 | | | | $65.15 | | | | $54.81 | | | | $55.72 | |
Ratios and supplemental data: | | | | | | | | | | | | | | | | | | | | | | | | |
Total return(b) | | | (6.25% | ) | | | 6.80% | | | | 14.12% | | | | 27.27% | | | | 2.53% | | | | 4.07% | |
Net assets, end of period (000) | | | $346,346 | | | | $480,028 | | | | $759,432 | | | | $1,010,805 | | | | $1,690,739 | | | | $1,628,191 | |
Ratio of net expenses to average net assets | | | 1.09% | (c) | | | 1.06% | | | | 1.01% | | | | 1.02% | | | | 1.04% | | | | 1.01% | |
Ratio of gross expenses to average net assets prior to expense reductions | | | 1.09% | (c) | | | 1.06% | | | | 1.01% | | | | 1.02% | | | | 1.04% | | | | 1.01% | |
Ratio of net investment income (loss) to average net assets | | | 0.02% | (c) | | | 0.09% | | | | (0.18% | ) | | | 0.15% | | | | (0.19% | ) | | | (0.37% | ) |
| |
| | | CLASS R | |
| | | (Unaudited)
Six Months
Ended
April 30, | | | Year Ended October 31, | |
| | | 2016 | | | 2015 | | | 2014 | | | 2013 | | | 2012 | | | 2011 | |
Net asset value, beginning of period | | | $41.22 | | | | $48.78 | | | | $57.65 | | | | $49.15 | | | | $50.44 | | | | $48.71 | |
Income from investment operations: | | | | | | | | | | | | | | | | | | | | | | | | |
Net investment income (loss)(a) | | | (0.08 | ) | | | (0.18 | ) | | | (0.32 | ) | | | (0.18 | ) | | | (0.34 | ) | | | (0.46 | ) |
Net realized and unrealized gain (loss) | | | (2.10 | ) | | | 2.75 | | | | 6.74 | | | | 12.41 | | | | 1.20 | | | | 2.19 | |
Total from investment operations | | | (2.18 | ) | | | 2.57 | | | | 6.42 | | | | 12.23 | | | | 0.86 | | | | 1.73 | |
Distributions: | | | | | | | | | | | | | | | | | | | | | | | | |
Dividends from net investment income | | | — | | | | — | | | | — | | | | — | | | | — | | | | — | |
Dividends from net realized gains | | | (10.94 | ) | | | (10.13 | ) | | | (15.29 | ) | | | (3.73 | ) | | | (2.15 | ) | | | — | |
Total distributions | | | (10.94 | ) | | | (10.13 | ) | | | (15.29 | ) | | | (3.73 | ) | | | (2.15 | ) | | | — | |
Net asset value, end of period | | | $28.10 | | | | $41.22 | | | | $48.78 | | | | $57.65 | | | | $49.15 | | | | $50.44 | |
Ratios and supplemental data: | | | | | | | | | | | | | | | | | | | | | | | | |
Total return(b) | | | (6.46% | ) | | | 6.28% | | | | 13.56% | | | | 26.62% | | | | 2.02% | | | | 3.55% | |
Net assets, end of period (000) | | | $7,479 | | | | $8,966 | | | | $10,089 | | | | $11,634 | | | | $15,879 | | | | $13,030 | |
Ratio of net expenses to average net assets | | | 1.59% | (c) | | | 1.56% | | | | 1.51% | | | | 1.51% | | | | 1.54% | | | | 1.51% | |
Ratio of gross expenses to average net assets prior to expense reductions | | | 1.59% | (c) | | | 1.56% | | | | 1.51% | | | | 1.51% | | | | 1.54% | | | | 1.51% | |
Ratio of net investment income (loss) to average net assets | | | (0.49% | )(c) | | | (0.43% | ) | | | (0.67% | ) | | | (0.35% | ) | | | (0.68% | ) | | | (0.88% | ) |
| (a) | Net investment income allocated based on average shares method. |
| (b) | Total return measures net investment income (loss) and capital gain or loss from portfolio investments assuming reinvestment of dividends and capital gains distributions. Total return is not annualized for periods that are less than a full year, does not reflect the effect of sales charge for Class A shares nor the contingent deferred sales charge for Class B and C shares and does not reflect the deduction of taxes that a shareholder would pay on fund distributions or the redemption of fund shares. |
| | | | |
| 198 | | CALAMOS OPEN-END FAMILY OF FUNDS SEMIANNUAL REPORT | | |
Calamos Opportunistic Value Fund Financial Highlights
Selected data for a share outstanding throughout each period were as follows:
| | | | | | | | | | | | | | | | | | | | | | | | |
| | | CLASS A | |
| | | (Unaudited)
Six Months
Ended
April 30, | | | Year Ended October 31, | |
| | | 2016 | | | 2015 | | | 2014 | | | 2013 | | | 2012 | | | 2011 | |
Net asset value, beginning of period | | | $13.61 | | | | $15.07 | | | | $15.22 | | | | $12.15 | | | | $11.25 | | | | $11.02 | |
Income from investment operations: | | | | | | | | | | | | | | | | | | | | | | | | |
Net investment income (loss)(a) | | | 0.10 | | | | 0.19 | | | | 0.18 | | | | 0.18 | | | | 0.10 | | | | 0.01 | |
Net realized and unrealized gain (loss) | | | (0.25 | ) | | | (0.52 | ) | | | 0.92 | | | | 3.07 | | | | 0.80 | | | | 0.22 | |
Total from investment operations | | | (0.15 | ) | | | (0.33 | ) | | | 1.10 | | | | 3.25 | | | | 0.90 | | | | 0.23 | |
Distributions: | | | | | | | | | | | | | | | | | | | | | | | | |
Dividends from net investment income | | | (0.16 | ) | | | (0.14 | ) | | | (0.14 | ) | | | (0.18 | ) | | | — | | | | — | |
Dividends from net realized gains | | | (0.91 | ) | | | (0.99 | ) | | | (1.11 | ) | | | — | | | | — | | | | — | |
Total distributions | | | (1.07 | ) | | | (1.13 | ) | | | (1.25 | ) | | | (0.18 | ) | | | — | | | | — | |
Net asset value, end of period | | | $12.39 | | | | $13.61 | | | | $15.07 | | | | $15.22 | | | | $12.15 | | | | $11.25 | |
Ratios and supplemental data: | | | | | | | | | | | | | | | | | | | | | | | | |
Total return(b) | | | (0.92% | ) | | | (2.32% | ) | | | 7.67% | | | | 27.12% | | | | 8.00% | | | | 2.09% | |
Net assets, end of period (000) | | | $37,948 | | | | $44,792 | | | | $58,419 | | | | $78,843 | | | | $38,992 | | | | $23,964 | |
Ratio of net expenses to average net assets | | | 1.15% | (c) | | | 1.15% | | | | 1.15% | | | | 1.15% | | | | 1.15% | | | | 1.52% | |
Ratio of gross expenses to average net assets prior to expense reductions | | | 1.62% | (c) | | | 1.61% | | | | 1.50% | | | | 1.53% | | | | 1.72% | | | | 1.67% | |
Ratio of net investment income (loss) to average net assets | | | 1.61% | (c) | | | 1.38% | | | | 1.19% | | | | 1.31% | | | | 0.84% | | | | 0.11% | |
| | |
| | | (Unaudited)
Six Months
Ended
April 30, | | | Year Ended October 31, | |
| | | 2016 | | | 2015 | | | 2014 | | | 2013 | | | 2012 | | | 2011 | |
Portfolio turnover rate | | | 15.5% | | | | 139.8% | | | | 165.4% | | | | 250.3% | | | | 204.9% | | | | 27.4% | |
| (a) | Net investment income (loss) allocated based on average shares method. |
| (b) | Total return measures net investment income (loss) and capital gain or loss from portfolio investments assuming reinvestment of dividends and capital gains distributions. Total return is not annualized for periods that are less than a full year, does not reflect the effect of sales charge for Class A shares nor the contingent deferred sales charge for Class B and C shares and does not reflect the deduction of taxes that a shareholder would pay on fund distributions or the redemption of fund shares. |
Calamos Opportunistic Value Fund Financial Highlights
| | | | | | | | | | | | | | | | | | | | | | | | |
| | | CLASS B | |
| | | (Unaudited)
Six Months
Ended
April 30, | | | Year Ended October 31, | |
| | | 2016 | | | 2015 | | | 2014 | | | 2013 | | | 2012 | | | 2011 | |
Net asset value, beginning of period | | | $12.55 | | | | $13.94 | | | | $14.17 | | | | $11.24 | | | | $10.49 | | | | $10.35 | |
Income from investment operations: | | | | | | | | | | | | | | | | | | | | | | | | |
Net investment income (loss)(a) | | | 0.05 | | | | 0.08 | | | | 0.06 | | | | 0.07 | | | | 0.02 | | | | (0.07 | ) |
Net realized and unrealized gain (loss) | | | (0.22 | ) | | | (0.48 | ) | | | 0.85 | | | | 2.88 | | | | 0.73 | | | | 0.21 | |
Total from investment operations | | | (0.17 | ) | | | (0.40 | ) | | | 0.91 | | | | 2.95 | | | | 0.75 | | | | 0.14 | |
Distributions: | | | | | | | | | | | | | | | | | | | | | | | | |
Dividends from net investment income | | | — | | | | — | | | | (0.03 | ) | | | (0.02 | ) | | | — | | | | — | |
Dividends from net realized gains | | | (0.91 | ) | | | (0.99 | ) | | | (1.11 | ) | | | — | | | | — | | | | — | |
Total distributions | | | (0.91 | ) | | | (0.99 | ) | | | (1.14 | ) | | | (0.02 | ) | | | — | | | | — | |
Net asset value, end of period | | | $11.47 | | | | $12.55 | | | | $13.94 | | | | $14.17 | | | | $11.24 | | | | $10.49 | |
Ratios and supplemental data: | | | | | | | | | | | | | | | | | | | | | | | | |
Total return(b) | | | (1.25% | ) | | | (3.04% | ) | | | 6.74% | | | | 26.28% | | | | 7.15% | | | | 1.35% | |
Net assets, end of period (000) | | | $109 | | | | $177 | | | | $348 | | | | $1,103 | | | | $1,195 | | | | $2,308 | |
Ratio of net expenses to average net assets | | | 1.90% | (c) | | | 1.90% | | | | 1.90% | | | | 1.90% | | | | 1.90% | | | | 2.29% | |
Ratio of gross expenses to average net assets prior to expense reductions | | | 2.37% | (c) | | | 2.35% | | | | 2.24% | | | | 2.28% | | | | 2.47% | | | | 2.42% | |
Ratio of net investment income (loss) to average net assets | | | 0.90% | (c) | | | 0.63% | | | | 0.42% | | | | 0.59% | | | | 0.20% | | | | (0.63% | ) |
| |
| | | CLASS C | |
| | | (Unaudited)
Six Months
Ended
April 30, | | | Year Ended October 31, | |
| | | 2016 | | | 2015 | | | 2014 | | | 2013 | | | 2012 | | | 2011 | |
Net asset value, beginning of period | | | $12.38 | | | | $13.79 | | | | $14.09 | | | | $11.23 | | | | $10.48 | | | | $10.34 | |
Income from investment operations: | | | | | | | | | | | | | | | | | | | | | | | | |
Net investment income (loss)(a) | | | 0.05 | | | | 0.08 | | | | 0.06 | | | | 0.08 | | | | 0.02 | | | | (0.07 | ) |
Net realized and unrealized gain (loss) | | | (0.23 | ) | | | (0.47 | ) | | | 0.85 | | | | 2.85 | | | | 0.73 | | | | 0.21 | |
Total from investment operations | | | (0.18 | ) | | | (0.39 | ) | | | 0.91 | | | | 2.93 | | | | 0.75 | | | | 0.14 | |
Distributions: | | | | | | | | | | | | | | | | | | | | | | | | |
Dividends from net investment income | | | (0.05 | ) | | | (0.03 | ) | | | (0.10 | ) | | | (0.07 | ) | | | — | | | | — | |
Dividends from net realized gains | | | (0.91 | ) | | | (0.99 | ) | | | (1.11 | ) | | | — | | | | — | | | | — | |
Total distributions | | | (0.96 | ) | | | (1.02 | ) | | | (1.21 | ) | | | (0.07 | ) | | | — | | | | — | |
Net asset value, end of period | | | $11.24 | | | | $12.38 | | | | $13.79 | | | | $14.09 | | | | $11.23 | | | | $10.48 | |
Ratios and supplemental data: | | | | | | | | | | | | | | | | | | | | | | | | |
Total return(b) | | | (1.35% | ) | | | (3.01% | ) | | | 6.82% | | | | 26.27% | | | | 7.16% | | | | 1.35% | |
Net assets, end of period (000) | | | $5,599 | | | | $5,738 | | | | $9,964 | | | | $8,641 | | | | $3,753 | | | | $3,974 | |
Ratio of net expenses to average net assets | | | 1.90% | (c) | | | 1.90% | | | | 1.90% | | | | 1.90% | | | | 1.90% | | | | 2.28% | |
Ratio of gross expenses to average net assets prior to expense reductions | | | 2.37% | (c) | | | 2.35% | | | | 2.25% | | | | 2.28% | | | | 2.47% | | | | 2.42% | |
Ratio of net investment income (loss) to average net assets | | | 0.84% | (c) | | | 0.64% | | | | 0.44% | | | | 0.59% | | | | 0.16% | | | | (0.63% | ) |
| (a) | Net investment income (loss) allocated based on average shares method. |
| (b) | Total return measures net investment income (loss) and capital gain or loss from portfolio investments assuming reinvestment of dividends and capital gains distributions. Total return is not annualized for periods that are less than a full year, does not reflect the effect of sales charge for Class A shares nor the contingent deferred sales charge for Class B and C shares and does not reflect the deduction of taxes that a shareholder would pay on fund distributions or the redemption of fund shares. |
| | | | |
| 200 | | CALAMOS OPEN-END FAMILY OF FUNDS SEMIANNUAL REPORT | | |
Calamos Opportunistic Value Fund Financial Highlights
| | | | | | | | | | | | | | | | | | | | | | | | |
| | | CLASS I | |
| | | (Unaudited)
Six Months
Ended
April 30, | | | Year Ended October 31, | |
| | | 2016 | | | 2015 | | | 2014 | | | 2013 | | | 2012 | | | 2011 | |
Net asset value, beginning of period | | | $13.96 | | | | $15.44 | | | | $15.57 | | | | $12.41 | | | | $11.46 | | | | $11.20 | |
Income from investment operations: | | | | | | | | | | | | | | | | | | | | | | | | |
Net investment income (loss)(a) | | | 0.12 | | | | 0.23 | | | | 0.22 | | | | 0.22 | | | | 0.14 | | | | 0.04 | |
Net realized and unrealized gain (loss) | | | (0.26 | ) | | | (0.53 | ) | | | 0.94 | | | | 3.14 | | | | 0.81 | | | | 0.22 | |
Total from investment operations | | | (0.14 | ) | | | (0.30 | ) | | | 1.16 | | | | 3.36 | | | | 0.95 | | | | 0.26 | |
Distributions: | | | | | | | | | | | | | | | | | | | | | | | | |
Dividends from net investment income | | | (0.20 | ) | | | (0.19 | ) | | | (0.18 | ) | | | (0.20 | ) | | | — | | | | — | |
Dividends from net realized gains | | | (0.91 | ) | | | (0.99 | ) | | | (1.11 | ) | | | — | | | | — | | | | — | |
Total distributions | | | (1.11 | ) | | | (1.18 | ) | | | (1.29 | ) | | | (0.20 | ) | | | — | | | | — | |
Net asset value, end of period | | | $12.71 | | | | $13.96 | | | | $15.44 | | | | $15.57 | | | | $12.41 | | | | $11.46 | |
Ratios and supplemental data: | | | | | | | | | | | | | | | | | | | | | | | | |
Total return(b) | | | (0.82% | ) | | | (2.08% | ) | | | 7.87% | | | | 27.47% | | | | 8.29% | | | | 2.32% | |
Net assets, end of period (000) | | | $18,076 | | | | $19,583 | | | | $32,147 | | | | $20,857 | | | | $9,671 | | | | $11,227 | |
Ratio of net expenses to average net assets | | | 0.90% | (c) | | | 0.90% | | | | 0.90% | | | | 0.90% | | | | 0.90% | | | | 1.27% | |
Ratio of gross expenses to average net assets prior to expense reductions | | | 1.37% | (c) | | | 1.36% | | | | 1.25% | | | | 1.28% | | | | 1.48% | | | | 1.42% | |
Ratio of net investment income (loss) to average net assets | | | 1.85% | (c) | | | 1.63% | | | | 1.45% | | | | 1.56% | | | | 1.15% | | | | 0.37% | |
| |
| | | CLASS R | |
| | | (Unaudited)
Six Months
Ended
April 30, | | | Year Ended October 31, | |
| | | 2016 | | | 2015 | | | 2014 | | | 2013 | | | 2012 | | | 2011 | |
Net asset value, beginning of period | | | $13.44 | | | | $14.91 | | | | $15.09 | | | | $12.02 | | | | $11.16 | | | | $10.96 | |
Income from investment operations: | | | | | | | | | | | | | | | | | | | | | | | | |
Net investment income (loss)(a) | | | 0.08 | | | | 0.15 | | | | 0.14 | | | | 0.14 | | | | 0.07 | | | | (0.01 | ) |
Net realized and unrealized gain (loss) | | | (0.23 | ) | | | (0.51 | ) | | | 0.90 | | | | 3.07 | | | | 0.79 | | | | 0.21 | |
Total from investment operations | | | (0.15 | ) | | | (0.36 | ) | | | 1.04 | | | | 3.21 | | | | 0.86 | | | | 0.20 | |
Distributions: | | | | | | | | | | | | | | | | | | | | | | | | |
Dividends from net investment income | | | (0.14 | ) | | | (0.12 | ) | | | (0.11 | ) | | | (0.14 | ) | | | — | | | | — | |
Dividends from net realized gains | | | (0.91 | ) | | | (0.99 | ) | | | (1.11 | ) | | | — | | | | — | | | | — | |
Total distributions | | | (1.05 | ) | | | (1.11 | ) | | | (1.22 | ) | | | (0.14 | ) | | | — | | | | — | |
Net asset value, end of period | | | $12.24 | | | | $13.44 | | | | $14.91 | | | | $15.09 | | | | $12.02 | | | | $11.16 | |
Ratios and supplemental data: | | | | | | | | | | | | | | | | | | | | | | | | |
Total return(b) | | | (0.99% | ) | | | (2.57% | ) | | | 7.28% | | | | 26.94% | | | | 7.71% | | | | 1.82% | |
Net assets, end of period (000) | | | $123 | | | | $150 | | | | $144 | | | | $128 | | | | $98 | | | | $91 | |
Ratio of net expenses to average net assets | | | 1.40% | (c) | | | 1.40% | | | | 1.40% | | | | 1.40% | | | | 1.40% | | | | 1.76% | |
Ratio of gross expenses to average net assets prior to expense reductions | | | 1.87% | (c) | | | 1.86% | | | | 1.75% | | | | 1.78% | | | | 1.97% | | | | 1.93% | |
Ratio of net investment income (loss) to average net assets | | | 1.39% | (c) | | | 1.11% | | | | 0.95% | | | | 1.08% | | | | 0.65% | | | | (0.10% | ) |
| (a) | Net investment income (loss) allocated based on average shares method. |
| (b) | Total return measures net investment income (loss) and capital gain or loss from portfolio investments assuming reinvestment of dividends and capital gains distributions. Total return is not annualized for periods that are less than a full year, does not reflect the effect of sales charge for Class A shares nor the contingent deferred sales charge for Class B and C shares and does not reflect the deduction of taxes that a shareholder would pay on fund distributions or the redemption of fund shares. |
Calamos Focus Growth Fund Financial Highlights
Selected data for a share outstanding throughout each period were as follows:
| | | | | | | | | | | | | | | | | | | | | | | | |
| | | CLASS A | |
| | | (Unaudited)
Six Months
Ended
April 30, | | | Year Ended October 31, | |
| | | 2016 | | | 2015 | | | 2014 | | | 2013 | | | 2012 | | | 2011 | |
Net asset value, beginning of period | | | $17.68 | | | | $18.59 | | | | $16.71 | | | | $13.10 | | | | $12.37 | | | | $11.93 | |
Income from investment operations: | | | | | | | | | | | | | | | | | | | | | | | | |
Net investment income (loss)(a)** | | | — | | | | 0.00 | ** | | | (0.04 | ) | | | 0.00 | ** | | | 0.01 | | | | (0.03 | ) |
Net realized and unrealized gain (loss) | | | (0.86 | ) | | | 0.90 | | | | 1.94 | | | | 3.67 | | | | 0.72 | | | | 0.47 | |
Total from investment operations | | | (0.86 | ) | | | 0.90 | | | | 1.90 | | | | 3.67 | | | | 0.73 | | | | 0.44 | |
Distributions: | | | | | | | | | | | | | | | | | | | | | | | | |
Dividends from net investment income | | | — | | | | — | | | | (0.02 | ) | | | (0.06 | ) | | | — | | | | — | |
Dividends from net realized gains | | | (3.13 | ) | | | (1.81 | ) | | | — | | | | — | | | | — | | | | — | |
Total distributions | | | (3.13 | ) | | | (1.81 | ) | | | (0.02 | ) | | | (0.06 | ) | | | — | | | | — | |
Net asset value, end of period | | | $13.69 | | | | $17.68 | | | | $18.59 | | | | $16.71 | | | | $13.10 | | | | $12.37 | |
Ratios and supplemental data: | | | | | | | | | | | | | | | | | | | | | | | | |
Total return(b) | | | (5.66% | ) | | | 5.22% | | | | 11.37% | | | | 28.15% | | | | 5.90% | | | | 3.69% | |
Net assets, end of period (000) | | | $12,757 | | | | $18,329 | | | | $19,709 | | | | $26,249 | | | | $22,389 | | | | $22,702 | |
Ratio of net expenses to average net assets | | | 1.15% | (c) | | | 1.15% | | | | 1.15% | | | | 1.15% | | | | 1.15% | | | | 1.44% | |
Ratio of gross expenses to average net assets prior to expense reductions | | | 1.63% | (c) | | | 1.57% | | | | 1.52% | | | | 1.63% | | | | 1.57% | | | | 1.57% | |
Ratio of net investment income (loss) to average net assets | | | 0.02% | (c) | | | 0.01% | | | | (0.25% | ) | | | 0.01% | | | | 0.06% | | | | (0.28% | ) |
| | |
| | | (Unaudited)
Six Months
Ended
April 30, | | | Year Ended October 31, | |
| | | 2016 | | | 2015 | | | 2014 | | | 2013 | | | 2012 | | | 2011 | |
Portfolio turnover rate | | | 33.5% | | | | 147.7% | | | | 61.0% | | | | 89.0% | | | | 47.9% | | | | 73.5% | |
| ** | Amounts are less than $0.005. |
| (a) | Net investment income (loss) allocated based on average shares method. |
| (b) | Total return measures net investment income (loss) and capital gain or loss from portfolio investments assuming reinvestment of dividends and capital gains distributions. Total return is not annualized for periods that are less than a full year, does not reflect the effect of sales charge for Class A shares nor the contingent deferred sales charge for Class B and C shares and does not reflect the deduction of taxes that a shareholder would pay on fund distributions or the redemption of fund shares. |
| | | | |
| 202 | | CALAMOS OPEN-END FAMILY OF FUNDS SEMIANNUAL REPORT | | |
Calamos Focus Growth Fund Financial Highlights
| | | | | | | | | | | | | | | | | | | | | | | | |
| | | CLASS B | |
| | | (Unaudited)
Six Months
Ended
April 30, | | | Year Ended October 31, | |
| | | 2016 | | | 2015 | | | 2014 | | | 2013 | | | 2012 | | | 2011 | |
Net asset value, beginning of period | | | $16.32 | | | | $17.42 | | | | $15.76 | | | | $12.39 | | | | $11.78 | | | | $11.45 | |
Income from investment operations: | | | | | | | | | | | | | | | | | | | | | | | | |
Net investment income (loss)(a) | | | (0.05 | ) | | | (0.12 | ) | | | (0.17 | ) | | | (0.09 | ) | | | (0.08 | ) | | | (0.13 | ) |
Net realized and unrealized gain (loss) | | | (0.78 | ) | | | 0.83 | | | | 1.83 | | | | 3.46 | | | | 0.69 | | | | 0.46 | |
Total from investment operations | | | (0.83 | ) | | | 0.71 | | | | 1.66 | | | | 3.37 | | | | 0.61 | | | | 0.33 | |
Distributions: | | | | | | | | | | | | | | | | | | | | | | | | |
Dividends from net investment income | | | — | | | | — | | | | — | | | | — | | | | — | | | | — | |
Dividends from net realized gains | | | (3.13 | ) | | | (1.81 | ) | | | — | | | | — | | | | — | | | | — | |
Total distributions | | | (3.13 | ) | | | (1.81 | ) | | | — | | | | — | | | | — | | | | — | |
Net asset value, end of period | | | $12.36 | | | | $16.32 | | | | $17.42 | | | | $15.76 | | | | $12.39 | | | | $11.78 | |
Ratios and supplemental data: | | | | | | | | | | | | | | | | | | | | | | | | |
Total return(b) | | | (6.00% | ) | | | 4.41% | | | | 10.53% | | | | 27.20% | | | | 5.18% | | | | 2.88% | |
Net assets, end of period (000) | | | $144 | | | | $330 | | | | $449 | | | | $796 | | | | $1,662 | | | | $2,893 | |
Ratio of net expenses to average net assets | | | 1.90% | (c) | | | 1.90% | | | | 1.90% | | | | 1.90% | | | | 1.90% | | | | 2.20% | |
Ratio of gross expenses to average net assets prior to expense reductions | | | 2.37% | (c) | | | 2.32% | | | | 2.27% | | | | 2.39% | | | | 2.33% | | | | 2.32% | |
Ratio of net investment income (loss) to average net assets | | | (0.74% | )(c) | | | (0.72% | ) | | | (1.00% | ) | | | (0.68% | ) | | | (0.70% | ) | | | (1.03% | ) |
| |
| | | CLASS C | |
| | | (Unaudited)
Six Months
Ended
April 30, | | | Year Ended October 31, | |
| | | 2016 | | | 2015 | | | 2014 | | | 2013 | | | 2012 | | | 2011 | |
Net asset value, beginning of period | | | $16.33 | | | | $17.42 | | | | $15.76 | | | | $12.39 | | | | $11.79 | | | | $11.45 | |
Income from investment operations: | | | | | | | | | | | | | | | | | | | | | | | | |
Net investment income (loss)(a) | | | (0.05 | ) | | | (0.12 | ) | | | (0.17 | ) | | | (0.10 | ) | | | (0.09 | ) | | | (0.12 | ) |
Net realized and unrealized gain (loss) | | | (0.78 | ) | | | 0.84 | | | | 1.83 | | | | 3.47 | | | | 0.69 | | | | 0.46 | |
Total from investment operations | | | (0.83 | ) | | | 0.72 | | | | 1.66 | | | | 3.37 | | | | 0.60 | | | | 0.34 | |
Distributions: | | | | | | | | | | | | | | | | | | | | | | | | |
Dividends from net investment income | | | — | | | | — | | | | — | | | | — | | | | — | | | | — | |
Dividends from net realized gains | | | (3.13 | ) | | | (1.81 | ) | | | — | | | | — | | | | — | | | | — | |
Total distributions | | | (3.13 | ) | | | (1.81 | ) | | | — | | | | — | | | | — | | | | — | |
Net asset value, end of period | | | $12.37 | | | | $16.33 | | | | $17.42 | | | | $15.76 | | | | $12.39 | | | | $11.79 | |
Ratios and supplemental data: | | | | | | | | | | | | | | | | | | | | | | | | |
Total return(b) | | | (6.00% | ) | | | 4.46% | | | | 10.53% | | | | 27.20% | | | | 5.09% | | | | 2.97% | |
Net assets, end of period (000) | | | $9,220 | | | | $13,677 | | | | $14,092 | | | | $10,914 | | | | $9,287 | | | | $10,153 | |
Ratio of net expenses to average net assets | | | 1.90% | (c) | | | 1.90% | | | | 1.90% | | | | 1.90% | | | | 1.90% | | | | 2.19% | |
Ratio of gross expenses to average net assets prior to expense reductions | | | 2.38% | (c) | | | 2.32% | | | | 2.27% | | | | 2.38% | | | | 2.33% | | | | 2.32% | |
Ratio of net investment income (loss) to average net assets | | | (0.73% | )(c) | | | (0.75% | ) | | | (1.01% | ) | | | (0.74% | ) | | | (0.70% | ) | | | (1.03% | ) |
| (a) | Net investment income (loss) allocated based on average shares method. |
| (b) | Total return measures net investment income (loss) and capital gain or loss from portfolio investments assuming reinvestment of dividends and capital gains distributions. Total return is not annualized for periods that are less than a full year, does not reflect the effect of sales charge for Class A shares nor the contingent deferred sales charge for Class B and C shares and does not reflect the deduction of taxes that a shareholder would pay on fund distributions or the redemption of fund shares. |
Calamos Focus Growth Fund Financial Highlights
| | | | | | | | | | | | | | | | | | | | | | | | |
| | | CLASS I | |
| | | (Unaudited)
Six Months
Ended
April 30, | | | Year Ended October 31, | |
| | | 2016 | | | 2015 | | | 2014 | | | 2013 | | | 2012 | | | 2011 | |
Net asset value, beginning of period | | | $17.92 | | | | $18.77 | | | | $16.86 | | | | $13.23 | | | | $12.46 | | | | $11.98 | |
Income from investment operations: | | | | | | | | | | | | | | | | | | | | | | | | |
Net investment income (loss)(a) | | | 0.02 | | | | 0.05 | | | | 0.00 | ** | | | 0.04 | | | | 0.04 | | | | (0.00 | ) |
Net realized and unrealized gain (loss) | | | (0.88 | ) | | | 0.91 | | | | 1.96 | | | | 3.69 | | | | 0.73 | | | | 0.48 | |
Total from investment operations | | | (0.86 | ) | | | 0.96 | | | | 1.96 | | | | 3.73 | | | | 0.77 | | | | 0.48 | |
Distributions: | | | | | | | | | | | | | | | | | | | | | | | | |
Dividends from net investment income | | | — | | | | — | | | | (0.05 | ) | | | (0.10 | ) | | | — | | | | — | |
Dividends from net realized gains | | | (3.13 | ) | | | (1.81 | ) | | | — | | | | — | | | | — | | | | — | |
Total distributions | | | (3.13 | ) | | | (1.81 | ) | | | (0.05 | ) | | | (0.10 | ) | | | — | | | | — | |
Net asset value, end of period | | | $13.93 | | | | $17.92 | | | | $18.77 | | | | $16.86 | | | | $13.23 | | | | $12.46 | |
Ratios and supplemental data: | | | | | | | | | | | | | | | | | | | | | | | | |
Total return(b) | | | (5.57% | ) | | | 5.51% | | | | 11.67% | | | | 28.42% | | | | 6.18% | | | | 4.01% | |
Net assets, end of period (000) | | | $27,839 | | | | $31,553 | | | | $30,173 | | | | $27,931 | | | | $24,863 | | | | $24,547 | |
Ratio of net expenses to average net assets | | | 0.90% | (c) | | | 0.90% | | | | 0.90% | | | | 0.90% | | | | 0.90% | | | | 1.18% | |
Ratio of gross expenses to average net assets prior to expense reductions | | | 1.38% | (c) | | | 1.33% | | | | 1.27% | | | | 1.38% | | | | 1.32% | | | | 1.32% | |
Ratio of net investment income (loss) to average net assets | | | 0.27% | (c) | | | 0.25% | | | | 0.00% | *** | | | 0.27% | | | | 0.30% | | | | (0.02% | ) |
| |
| | | CLASS R | |
| | | (Unaudited)
Six Months
Ended
April 30, | | | Year Ended October 31, | |
| | | 2016 | | | 2015 | | | 2014 | | | 2013 | | | 2012 | | | 2011 | |
Net asset value, beginning of period | | | $17.38 | | | | $18.34 | | | | $16.51 | | | | $12.97 | | | | $12.28 | | | | $11.87 | |
Income from investment operations: | | | | | | | | | | | | | | | | | | | | | | | | |
Net investment income (loss)(a) | | | (0.01 | ) | | | (0.08 | ) | | | (0.08 | ) | | | (0.04 | ) | | | (0.03 | ) | | | (0.07 | ) |
Net realized and unrealized gain (loss) | | | (0.84 | ) | | | 0.93 | | | | 1.91 | | | | 3.63 | | | | 0.72 | | | | 0.48 | |
Total from investment operations | | | (0.85 | ) | | | 0.85 | | | | 1.83 | | | | 3.59 | | | | 0.69 | | | | 0.41 | |
Distributions: | | | | | | | | | | | | | | | | | | | | | | | | |
Dividends from net investment income | | | — | | | | — | | | | — | | | | (0.05 | ) | | | — | | | | — | |
Dividends from net realized gains | | | (3.13 | ) | | | (1.81 | ) | | | — | | | | — | | | | — | | | | — | |
Total distributions | | | (3.13 | ) | | | (1.81 | ) | | | — | | | | (0.05 | ) | | | — | | | | — | |
Net asset value, end of period | | | $13.40 | | | | $17.38 | | | | $18.34 | | | | $16.51 | | | | $12.97 | | | | $12.28 | |
Ratios and supplemental data: | | | | | | | | | | | | | | | | | | | | | | | | |
Total return(b) | | | (5.71% | ) | | | 5.00% | | | | 11.08% | | | | 27.80% | | | | 5.62% | | | | 3.45% | |
Net assets, end of period (000) | | | $411 | | | | $919 | | | | $204 | | | | $266 | | | | $172 | | | | $103 | |
Ratio of net expenses to average net assets | | | 1.40% | (c) | | | 1.40% | | | | 1.40% | | | | 1.40% | | | | 1.40% | | | | 1.68% | |
Ratio of gross expenses to average net assets prior to expense reductions | | | 1.87% | (c) | | | 1.84% | | | | 1.77% | | | | 1.88% | | | | 1.82% | | | | 1.82% | |
Ratio of net investment income (loss) to average net assets | | | (0.09% | )(c) | | | (0.44% | ) | | | (0.49% | ) | | | (0.26% | ) | | | (0.21% | ) | | | (0.52% | ) |
| ** | Amounts are less than $0.005. |
| *** | Amount is less than 0.005%. |
| (a) | Net investment income (loss) allocated based on average shares method. |
| (b) | Total return measures net investment income (loss) and capital gain or loss from portfolio investments assuming reinvestment of dividends and capital gains distributions. Total return is not annualized for periods that are less than a full year, does not reflect the effect of sales charge for Class A shares nor the contingent deferred sales charge for Class B and C shares and does not reflect the deduction of taxes that a shareholder would pay on fund distributions or the redemption of fund shares. |
| | | | |
| 204 | | CALAMOS OPEN-END FAMILY OF FUNDS SEMIANNUAL REPORT | | |
Calamos Discovery Growth Fund Financial Highlights
Selected data for a share outstanding throughout each period were as follows:
| | | | | | | | | | | | | | | | | | | | | | | | |
| | | CLASS A | |
| | | (Unaudited)
Six Months
Ended
April 30, | | | Year Ended October 31, | |
| | | 2016 | | | 2015 | | | 2014 | | | 2013 | | | 2012 | | | 2011 | |
Net asset value, beginning of period | | | $12.46 | | | | $14.33 | | | | $14.77 | | | | $11.82 | | | | $12.04 | | | | $11.64 | |
Income from investment operations: | | | | | | | | | | | | | | | | | | | | | | | | |
Net investment income (loss)(a) | | | (0.06 | ) | | | (0.14 | ) | | | (0.15 | ) | | | (0.12 | ) | | | (0.13 | ) | | | (0.14 | ) |
Net realized and unrealized gain (loss) | | | (1.27 | ) | | | (0.39 | ) | | | 1.78 | | | | 3.07 | | | | (0.09 | ) | | | 0.55 | |
Total from investment operations | | | (1.33 | ) | | | (0.53 | ) | | | 1.63 | | | | 2.95 | | | | (0.22 | ) | | | 0.41 | |
Distributions: | | | | | | | | | | | | | | | | | | | | | | | | |
Dividends from net investment income | | | — | | | | — | | | | — | | | | — | | | | — | | | | (0.01 | ) |
Dividends from net realized gains | | | 0.12 | | | | (1.34 | ) | | | (2.07 | ) | | | — | | | | — | | | | — | |
Total distributions | | | 0.12 | | | | (1.34 | ) | | | (2.07 | ) | | | — | | | | — | | | | (0.01 | ) |
Net asset value, end of period | | | $11.25 | | | | $12.46 | | | | $14.33 | | | | $14.77 | | | | $11.82 | | | | $12.04 | |
Ratios and supplemental data: | | | | | | | | | | | | | | | | | | | | | | | | |
Total return(b) | | | (8.80% | ) | | | (4.20% | ) | | | 12.14% | | | | 24.96% | | | | (1.83% | ) | | | 3.55% | |
Net assets, end of period (000) | | | $8,882 | | | | $23,025 | | | | $31,009 | | | | $30,726 | | | | $21,384 | | | | $23,463 | |
Ratio of net expenses to average net assets | | | 1.50% | (c) | | | 1.50% | | | | 1.50% | | | | 1.50% | | | | 1.50% | | | | 1.50% | |
Ratio of gross expenses to average net assets prior to expense reductions | | | 1.77% | (c) | | | 1.63% | | | | 1.62% | | | | 1.69% | | | | 1.74% | | | | 1.84% | |
Ratio of net investment income (loss) to average net assets | | | (0.98% | )(c) | | | (1.05% | ) | | | (1.06% | ) | | | (0.88% | ) | | | (1.10% | ) | | | (1.08% | ) |
| | |
| | | (Unaudited)
Six Months
Ended
April 30, | | | Year Ended October 31, | |
| | | 2016 | | | 2015 | | | 2014 | | | 2013 | | | 2012 | | | 2011 | |
Portfolio turnover rate | | | 42.0% | | | | 78.1% | | | | 152.7% | | | | 248.3% | | | | 139.8% | | | | 97.1% | |
| (a) | Net investment income (loss) allocated based on average shares method. |
| (b) | Total return measures net investment income (loss) and capital gain or loss from portfolio investments assuming reinvestment of dividends and capital gains distributions. Total return is not annualized for periods that are less than a full year, does not reflect the effect of sales charge for Class A shares nor the contingent deferred sales charge for Class B and C shares and does not reflect the deduction of taxes that a shareholder would pay on fund distributions or the redemption of fund shares. |
Calamos Discovery Growth Fund Financial Highlights
| | | | | | | | | | | | | | | | | | | | | | | | |
| | | CLASS B | |
| | | (Unaudited)
Six Months
Ended
April 30, | | | Year Ended October 31, | |
| | | 2016 | | | 2015 | | | 2014 | | | 2013 | | | 2012 | | | 2011 | |
Net asset value, beginning of period | | | $11.90 | | | | $13.83 | | | | $14.42 | | | | $11.63 | | | | $11.93 | | | | $11.60 | |
Income from investment operations: | | | | | | | | | | | | | | | | | | | | | | | | |
Net investment income (loss)(a) | | | (0.10 | ) | | | (0.23 | ) | | | (0.24 | ) | | | (0.20 | ) | | | (0.22 | ) | | | (0.24 | ) |
Net realized and unrealized gain (loss) | | | (1.23 | ) | | | (0.36 | ) | | | 1.72 | | | | 2.99 | | | | (0.08 | ) | | | 0.57 | |
Total from investment operations | | | (1.33 | ) | | | (0.59 | ) | | | 1.48 | | | | 2.79 | | | | (0.30 | ) | | | 0.33 | |
Distributions: | | | | | | | | | | | | | | | | | | | | | | | | |
Dividends from net investment income | | | — | | | | — | | | | — | | | | — | | | | — | | | | — | |
Dividends from net realized gains | | | 0.12 | | | | (1.34 | ) | | | (2.07 | ) | | | — | | | | — | | | | — | |
Total distributions | | | 0.12 | | | | (1.34 | ) | | | (2.07 | ) | | | — | | | | — | | | | — | |
Net asset value, end of period | | | $10.69 | | | | $11.90 | | | | $13.83 | | | | $14.42 | | | | $11.63 | | | | $11.93 | |
Ratios and supplemental data: | | | | | | | | | | | | | | | | | | | | | | | | |
Total return(b) | | | (9.22% | ) | | | (4.83% | ) | | | 11.28% | | | | 23.99% | | | | (2.51% | ) | | | 2.84% | |
Net assets, end of period (000) | | | $240 | | | | $1,566 | | | | $1,682 | | | | $1,633 | | | | $1,338 | | | | $1,451 | |
Ratio of net expenses to average net assets | | | 2.25% | (c) | | | 2.25% | | | | 2.25% | | | | 2.25% | | | | 2.25% | | | | 2.25% | |
Ratio of gross expenses to average net assets prior to expense reductions | | | 2.53% | (c) | | | 2.38% | | | | 2.37% | | | | 2.44% | | | | 2.49% | | | | 2.61% | |
Ratio of net investment income (loss) to average net assets | | | (1.76% | )(c) | | | (1.80% | ) | | | (1.81% | ) | | | (1.60% | ) | | | (1.84% | ) | | | (1.81% | ) |
| |
| | | CLASS C | |
| | | (Unaudited)
Six Months
Ended
April 30, | | | Year Ended October 31, | |
| | | 2016 | | | 2015 | | | 2014 | | | 2013 | | | 2012 | | | 2011 | |
Net asset value, beginning of period | | | $11.89 | | | | $13.83 | | | | $14.42 | | | | $11.64 | | | | $11.93 | | | | $11.60 | |
Income from investment operations: | | | | | | | | | | | | | | | | | | | | | | | | |
Net investment income (loss)(a) | | | (0.09 | ) | | | (0.23 | ) | | | (0.24 | ) | | | (0.20 | ) | | | (0.22 | ) | | | (0.24 | ) |
Net realized and unrealized gain (loss) | | | (1.23 | ) | | | (0.37 | ) | | | 1.72 | | | | 2.98 | | | | (0.07 | ) | | | 0.57 | |
Total from investment operations | | | (1.32 | ) | | | (0.60 | ) | | | 1.48 | | | | 2.78 | | | | (0.29 | ) | | | 0.33 | |
Distributions: | | | | | | | | | | | | | | | | | | | | | | | | |
Dividends from net investment income | | | — | | | | — | | | | — | | | | — | | | | — | | | | — | |
Dividends from net realized gains | | | 0.12 | | | | (1.34 | ) | | | (2.07 | ) | | | — | | | | — | | | | — | |
Total distributions | | | 0.12 | | | | (1.34 | ) | | | (2.07 | ) | | | — | | | | — | | | | — | |
Net asset value, end of period | | | $10.69 | | | | $11.89 | | | | $13.83 | | | | $14.42 | | | | $11.64 | | | | $11.93 | |
Ratios and supplemental data: | | | | | | | | | | | | | | | | | | | | | | | | |
Total return(b) | | | (9.14% | ) | | | (4.91% | ) | | | 11.30% | | | | 23.88% | | | | (2.43% | ) | | | 2.84% | |
Net assets, end of period (000) | | | $888 | | | | $2,370 | | | | $2,542 | | | | $2,553 | | | | $2,274 | | | | $2,524 | |
Ratio of net expenses to average net assets | | | 2.25% | (c) | | | 2.25% | | | | 2.25% | | | | 2.25% | | | | 2.25% | | | | 2.25% | |
Ratio of gross expenses to average net assets prior to expense reductions | | | 2.53% | (c) | | | 2.38% | | | | 2.37% | | | | 2.45% | | | | 2.49% | | | | 2.59% | |
Ratio of net investment income (loss) to average net assets | | | (1.74% | )(c) | | | (1.80% | ) | | | (1.80% | ) | | | (1.56% | ) | | | (1.84% | ) | | | (1.82% | ) |
| (a) | Net investment income (loss) allocated based on average shares method. |
| (b) | Total return measures net investment income (loss) and capital gain or loss from portfolio investments assuming reinvestment of dividends and capital gains distributions. Total return is not annualized for periods that are less than a full year, does not reflect the effect of sales charge for Class A shares nor the contingent deferred sales charge for Class B and C shares and does not reflect the deduction of taxes that a shareholder would pay on fund distributions or the redemption of fund shares. |
| | | | |
| 206 | | CALAMOS OPEN-END FAMILY OF FUNDS SEMIANNUAL REPORT | | |
Calamos Discovery Growth Fund Financial Highlights
| | | | | | | | | | | | | | | | | | | | | | | | |
| | | CLASS I | |
| | | (Unaudited)
Six Months
Ended
April 30, | | | Year Ended October 31, | |
| | | 2016 | | | 2015 | | | 2014 | | | 2013 | | | 2012 | | | 2011 | |
Net asset value, beginning of period | | | $12.66 | | | | $14.50 | | | | $14.89 | | | | $11.89 | | | | $12.07 | | | | $11.65 | |
Income from investment operations: | | | | | | | | | | | | | | | | | | | | | | | | |
Net investment income (loss)(a) | | | (0.04 | ) | | | (0.11 | ) | | | (0.11 | ) | | | (0.08 | ) | | | (0.10 | ) | | | (0.12 | ) |
Net realized and unrealized gain (loss) | | | (1.29 | ) | | | (0.39 | ) | | | 1.79 | | | | 3.08 | | | | (0.08 | ) | | | 0.57 | |
Total from investment operations | | | (1.33 | ) | | | (0.50 | ) | | | 1.68 | | | | 3.00 | | | | (0.18 | ) | | | 0.45 | |
Distributions: | | | | | | | | | | | | | | | | | | | | | | | | |
Dividends from net investment income | | | — | | | | — | | | | — | | | | — | | | | — | | | | (0.03 | ) |
Dividends from net realized gains | | | 0.12 | | | | (1.34 | ) | | | (2.07 | ) | | | — | | | | — | | | | — | |
Total distributions | | | 0.12 | | | | (1.34 | ) | | | (2.07 | ) | | | — | | | | — | | | | (0.03 | ) |
Net asset value, end of period | | | $11.45 | | | | $12.66 | | | | $14.50 | | | | $14.89 | | | | $11.89 | | | | $12.07 | |
Ratios and supplemental data: | | | | | | | | | | | | | | | | | | | | | | | | |
Total return(b) | | | (8.66% | ) | | | (3.92% | ) | | | 12.40% | | | | 25.23% | | | | (1.49% | ) | | | 3.82% | |
Net assets, end of period (000) | | | $5,211 | | | | $9,575 | | | | $10,519 | | | | $11,062 | | | | $8,608 | | | | $7,738 | |
Ratio of net expenses to average net assets | | | 1.25% | (c) | | | 1.25% | | | | 1.25% | | | | 1.25% | | | | 1.25% | | | | 1.25% | |
Ratio of gross expenses to average net assets prior to expense reductions | | | 1.55% | (c) | | | 1.38% | | | | 1.37% | | | | 1.44% | | | | 1.49% | | | | 1.54% | |
Ratio of net investment income (loss) to average net assets | | | (0.74% | )(c) | | | (0.80% | ) | | | (0.81% | ) | | | (0.60% | ) | | | (0.83% | ) | | | (0.89% | ) |
| |
| | | CLASS R | |
| | | (Unaudited)
Six Months
Ended
April 30, | | | Year Ended October 31, | |
| | | 2016 | | | 2015 | | | 2014 | | | 2013 | | | 2012 | | | 2011 | |
Net asset value, beginning of period | | | $12.29 | | | | $14.18 | | | | $14.66 | | | | $11.77 | | | | $12.01 | | | | $11.63 | |
Income from investment operations: | | | | | | | | | | | | | | | | | | | | | | | | |
Net investment income (loss)(a) | | | (0.07 | ) | | | (0.17 | ) | | | (0.18 | ) | | | (0.14 | ) | | | (0.16 | ) | | | (0.17 | ) |
Net realized and unrealized gain (loss) | | | (1.26 | ) | | | (0.38 | ) | | | 1.77 | | | | 3.03 | | | | (0.08 | ) | | | 0.55 | |
Total from investment operations | | | (1.33 | ) | | | (0.55 | ) | | | 1.59 | | | | 2.89 | | | | (0.24 | ) | | | 0.38 | |
Distributions: | | | | | | | | | | | | | | | | | | | | | | | | |
Dividends from net investment income | | | — | | | | — | | | | — | | | | — | | | | — | | | | — | |
Dividends from net realized gains | | | 0.12 | | | | (1.34 | ) | | | (2.07 | ) | | | — | | | | — | | | | — | |
Total distributions | | | 0.12 | | | | (1.34 | ) | | | (2.07 | ) | | | — | | | | — | | | | — | |
Net asset value, end of period | | | $11.08 | | | | $12.29 | | | | $14.18 | | | | $14.66 | | | | $11.77 | | | | $12.01 | |
Ratios and supplemental data: | | | | | | | | | | | | | | | | | | | | | | | | |
Total return(b) | | | (8.92% | ) | | | (4.40% | ) | | | 11.93% | | | | 24.55% | | | | (2.00% | ) | | | 3.27% | |
Net assets, end of period (000) | | | $230 | | | | $1,676 | | | | $1,822 | | | | $1,787 | | | | $1,175 | | | | $1,201 | |
Ratio of net expenses to average net assets | | | 1.75% | (c) | | | 1.75% | | | | 1.75% | | | | 1.75% | | | | 1.75% | | | | 1.75% | |
Ratio of gross expenses to average net assets prior to expense reductions | | | 2.02% | (c) | | | 1.88% | | | | 1.87% | | | | 1.94% | | | | 1.99% | | | | 2.13% | |
Ratio of net investment income (loss) to average net assets | | | (1.24% | )(c) | | | (1.30% | ) | | | (1.31% | ) | | | (1.11% | ) | | | (1.34% | ) | | | (1.29% | ) |
| (a) | Net investment income allocated based on average shares method. |
| (b) | Total return measures net investment income (loss) and capital gain or loss from portfolio investments assuming reinvestment of dividends and capital gains distributions. Total return is not annualized for periods that are less than a full year, does not reflect the effect of sales charge for Class A shares nor the contingent deferred sales charge for Class B and C shares and does not reflect the deduction of taxes that a shareholder would pay on fund distributions or the redemption of fund shares. |
Calamos Dividend Growth Fund Financial Highlights
Selected data for a share outstanding throughout each period were as follows:
| | | | | | | | | | | | | | | | |
| | | CLASS A | |
| | | (Unaudited)
Six Months
Ended
April 30, | | | Year Ended October 31, | | | August 5, 2013* through
October 31, | |
| | | 2016 | | | 2015 | | | 2014 | | | 2013 | |
Net asset value, beginning of period | | | $10.52 | | | | $10.78 | | | | $10.36 | | | | $10.00 | |
Income from investment operations: | | | | | | | | | | | | | | | | |
Net investment income (loss)(a) | | | 0.05 | | | | 0.17 | | | | 0.39 | | | | 0.05 | |
Net realized and unrealized gain (loss) | | | (0.16 | ) | | | (0.15 | ) | | | 0.24 | | | | 0.31 | |
Total from investment operations | | | (0.11 | ) | | | 0.02 | | | | 0.63 | | | | 0.36 | |
Distributions: | | | | | | | | | | | | | | | | |
Dividends from net investment income | | | (0.04 | ) | | | (0.15 | ) | | | (0.18 | ) | | | — | |
Dividends from net realized gains | | | (0.27 | ) | | | (0.13 | ) | | | (0.03 | ) | | | — | |
Total distributions | | | (0.31 | ) | | | (0.28 | ) | | | (0.21 | ) | | | — | |
Net asset value, end of period | | | $10.10 | | | | $10.52 | | | | $10.78 | | | | $10.36 | |
Ratios and supplemental data: | | | | | | | | | | | | | | | | |
Total return(b) | | | (1.02% | ) | | | 0.21% | | | | 6.12% | | | | 3.60% | |
Net assets, end of period (000) | | | $26,646 | | | | $28,030 | | | | $28,365 | | | | $25,922 | |
Ratio of net expenses to average net assets | | | 1.35% | (c) | | | 1.35% | | | | 1.35% | | | | 1.35% | (c) |
Ratio of gross expenses to average net assets prior to expense reductions | | | 1.73% | (c) | | | 1.74% | | | | 1.73% | | | | 2.14% | (c) |
Ratio of net investment income (loss) to average net assets | | | 0.96% | (c) | | | 1.66% | | | | 3.68% | | | | 1.99% | (c) |
| | | |
| | | (Unaudited)
Six Months
Ended
April 30, | | | Year Ended October 31, | | | August 5, 2013*
through October 31, | |
| | | 2016 | | | 2015 | | | 2014 | | | 2013 | |
Portfolio turnover rate | | | 5.0% | | | | 107.6% | | | | 130.0% | | | | 20.7% | |
| * | Commencement of operations. |
| (a) | Net investment income (loss) allocated based on average shares method. |
| (b) | Total return measures net investment income (loss) and capital gain or loss from portfolio investments assuming reinvestment of dividends and capital gains distributions. Total return is not annualized for periods that are less than a full year, does not reflect the effect of sales charge for Class A shares nor the contingent deferred sales charge for Class C shares and does not reflect the deduction of taxes that a shareholder would pay on fund distributions or the redemption of fund shares. |
| | | | |
| 208 | | CALAMOS OPEN-END FAMILY OF FUNDS SEMIANNUAL REPORT | | |
Calamos Dividend Growth Fund Financial Highlights
| | | | | | | | | | | | | | | | |
| | | CLASS C | |
| | | (Unaudited)
Six Months
Ended
April 30, | | | Year Ended October 31, | | | August 5, 2013*
through
October 31, | |
| | | 2016 | | | 2015 | | | 2014 | | | 2013 | |
Net asset value, beginning of period | | | $10.41 | | | | $10.74 | | | | $10.34 | | | | $10.00 | |
Income from investment operations: | | | | | | | | | | | | | | | | |
Net investment income (loss)(a) | | | 0.01 | | | | 0.08 | | | | 0.31 | | | | 0.03 | |
Net realized and unrealized gain (loss) | | | (0.15 | ) | | | (0.15 | ) | | | 0.25 | | | | 0.31 | |
Total from investment operations | | | (0.14 | ) | | | (0.07 | ) | | | 0.56 | | | | 0.34 | |
Distributions: | | | | | | | | | | | | | | | | |
Dividends from net investment income | | | (0.01 | ) | | | (0.13 | ) | | | (0.13 | ) | | | — | |
Dividends from net realized gains | | | (0.27 | ) | | | (0.13 | ) | | | (0.03 | ) | | | — | |
Total distributions | | | (0.28 | ) | | | (0.26 | ) | | | (0.16 | ) | | | — | |
Net asset value, end of period | | | $9.99 | | | | $10.41 | | | | $10.74 | | | | $10.34 | |
Ratios and supplemental data: | | | | | | | | | | | | | | | | |
Total return(b) | | | (1.34% | ) | | | (0.63% | ) | | | 5.40% | | | | 3.40% | |
Net assets, end of period (000) | | | $853 | | | | $702 | | | | $418 | | | | $253 | |
Ratio of net expenses to average net assets | | | 2.10% | (c) | | | 2.10% | | | | 2.10% | | | | 2.10% | (c) |
Ratio of gross expenses to average net assets prior to expense reductions | | | 2.49% | (c) | | | 2.51% | | | | 2.44% | | | | 3.35% | (c) |
Ratio of net investment income (loss) to average net assets | | | 0.19% | (c) | | | 0.77% | | | | 2.90% | | | | 1.39% | (c) |
| |
| | | CLASS I | |
| | | (Unaudited)
Six Months
Ended
April 30, | | | Year Ended October 31, | | | August 5, 2013*
through
October 31, | |
| | | 2016 | | | 2015 | | | 2014 | | | 2013 | |
Net asset value, beginning of period | | | $10.55 | | | | $10.79 | | | | $10.37 | | | | $10.00 | |
Income from investment operations: | | | | | | | | | | | | | | | | |
Net investment income (loss)(a) | | | 0.06 | | | | 0.20 | | | | 0.42 | | | | 0.05 | |
Net realized and unrealized gain (loss) | | | (0.16 | ) | | | (0.16 | ) | | | 0.23 | | | | 0.32 | |
Total from investment operations | | | (0.10 | ) | | | 0.04 | | | | 0.65 | | | | 0.37 | |
Distributions: | | | | | | | | | | | | | | | | |
Dividends from net investment income | | | (0.07 | ) | | | (0.15 | ) | | | (0.20 | ) | | | — | |
Dividends from net realized gains | | | (0.27 | ) | | | (0.13 | ) | | | (0.03 | ) | | | — | |
Total distributions | | | (0.34 | ) | | | (0.28 | ) | | | (0.23 | ) | | | — | |
Net asset value, end of period | | | $10.11 | | | | $10.55 | | | | $10.79 | | | | $10.37 | |
Ratios and supplemental data: | | | | | | | | | | | | | | | | |
Total return(b) | | | (0.93% | ) | | | 0.47% | | | | 6.33% | | | | 3.70% | |
Net assets, end of period (000) | | | $9,047 | | | | $7,375 | | | | $8,020 | | | | $7,586 | |
Ratio of net expenses to average net assets | | | 1.10% | (c) | | | 1.10% | | | | 1.10% | | | | 1.10% | (c) |
Ratio of gross expenses to average net assets prior to expense reductions | | | 1.49% | (c) | | | 1.49% | | | | 1.48% | | | | 2.13% | (c) |
Ratio of net investment income (loss) to average net assets | | | 1.17% | (c) | | | 1.91% | | | | 3.97% | | | | 2.13% | (c) |
| * | Commencement of operations. |
| (a) | Net investment income (loss) allocated based on average shares method. |
| (b) | Total return measures net investment income (loss) and capital gain or loss from portfolio investments assuming reinvestment of dividends and capital gains distributions. Total return is not annualized for periods that are less than a full year, does not reflect the effect of sales charge for Class A shares nor the contingent deferred sales charge for Class C shares and does not reflect the deduction of taxes that a shareholder would pay on fund distributions or the redemption of fund shares. |
Calamos Dividend Growth Fund Financial Highlights
| | | | | | | | | | | | | | | | |
| | | CLASS R | |
| | | (Unaudited)
Six Months
Ended
April 30, | | | Year Ended October 31, | | | August 5, 2013*
through
October 31, | |
| | | 2016 | | | 2015 | | | 2014 | | | 2013 | |
Net asset value, beginning of period | | | $10.49 | | | | $10.77 | | | | $10.35 | | | | $10.00 | |
Income from investment operations: | | | | | | | | | | | | | | | | |
Net investment income (loss)(a) | | | 0.03 | | | | 0.14 | | | | 0.37 | | | | 0.04 | |
Net realized and unrealized gain (loss) | | | (0.16 | ) | | | (0.15 | ) | | | 0.24 | | | | 0.31 | |
Total from investment operations | | | (0.13 | ) | | | (0.01 | ) | | | 0.61 | | | | 0.35 | |
Distributions: | | | | | | | | | | | | | | | | |
Dividends from net investment income | | | (0.02 | ) | | | (0.14 | ) | | | (0.16 | ) | | | — | |
Dividends from net realized gains | | | (0.27 | ) | | | (0.13 | ) | | | (0.03 | ) | | | — | |
Total distributions | | | (0.29 | ) | | | (0.27 | ) | | | (0.19 | ) | | | — | |
Net asset value, end of period | | | $10.07 | | | | $10.49 | | | | $10.77 | | | | $10.35 | |
Ratios and supplemental data: | | | | | | | | | | | | | | | | |
Total return(b) | | | (1.22% | ) | | | (0.04% | ) | | | 5.89% | | | | 3.50% | |
Net assets, end of period (000) | | | $110 | | | | $110 | | | | $110 | | | | $104 | |
Ratio of net expenses to average net assets | | | 1.60% | (c) | | | 1.60% | | | | 1.60% | | | | 1.60% | (c) |
Ratio of gross expenses to average net assets prior to expense reductions | | | 1.98% | (c) | | | 1.99% | | | | 1.98% | | | | 3.22% | (c) |
Ratio of net investment income (loss) to average net assets | | | 0.70% | (c) | | | 1.38% | | | | 3.44% | | | | 1.62% | (c) |
| * | Commencement of operations. |
| (a) | Net investment income (loss) allocated based on average shares method. |
| (b) | Total return measures net investment income (loss) and capital gain or loss from portfolio investments assuming reinvestment of dividends and capital gains distributions. Total return is not annualized for periods that are less than a full year, does not reflect the effect of sales charge for Class A shares nor the contingent deferred sales charge for Class C shares and does not reflect the deduction of taxes that a shareholder would pay on fund distributions or the redemption of fund shares. |
| | | | |
| 210 | | CALAMOS OPEN-END FAMILY OF FUNDS SEMIANNUAL REPORT | | |
Calamos Mid Cap Growth Fund Financial Highlights
Selected data for a share outstanding throughout each period were as follows:
| | | | | | | | | | | | | | | | |
| | | CLASS A | |
| | | (Unaudited)
Six Months
Ended
April 30, | | | Year Ended October 31, | | | August 5, 2013*
through
October 31, | |
| | | 2016 | | | 2015 | | | 2014 | | | 2013 | |
Net asset value, beginning of period | | | $10.82 | | | | $11.36 | | | | $10.63 | | | | $10.00 | |
Income from investment operations: | | | | | | | | | | | | | | | | |
Net investment income (loss)(a) | | | (0.03 | ) | | | (0.04 | ) | | | (0.06 | ) | | | (0.02 | ) |
Net realized and unrealized gain (loss) | | | (0.76 | ) | | | (0.50 | ) | | | 0.79 | | | | 0.65 | |
Total from investment operations | | | (0.79 | ) | | | (0.54 | ) | | | 0.73 | | | | 0.63 | |
Distributions: | | | | | | | | | | | | | | | | |
Dividends from net investment income | | | — | | | | — | | | | (0.00 | )** | | | — | |
Dividends from net realized gains | | | (0.67 | ) | | | — | | | | (0.00 | )** | | | — | |
Return of capital | | | — | | | | — | | | | (0.00 | )** | | | — | |
Total distributions | | | (0.67 | ) | | | — | | | | (0.00 | )** | | | — | |
Net asset value, end of period | | | $9.36 | | | | $10.82 | | | | $11.36 | | | | $10.63 | |
Ratios and supplemental data: | | | | | | | | | | | | | | | | |
Total return(b) | | | (7.59% | ) | | | (4.75% | ) | | | 6.90% | | | | 6.30% | |
Net assets, end of period (000) | | | $2,897 | | | | $15,090 | | | | $37,112 | | | | $13,032 | |
Ratio of net expenses to average net assets | | | 1.25% | (c) | | | 1.25% | | | | 1.25% | | | | 1.25% | (c) |
Ratio of gross expenses to average net assets prior to expense reductions | | | 2.40% | (c) | | | 1.68% | | | | 1.68% | | | | 5.58% | (c) |
Ratio of net investment income (loss) to average net assets | | | (0.56% | )(c) | | | (0.38% | ) | | | (0.58% | ) | | | (0.72% | )(c) |
| | | |
| | | (Unaudited)
Six Months
Ended
April 30, | | | Year Ended October 31, | | | August 5, 2013*
through October 31, | |
| | | 2016 | | | 2015 | | | 2014 | | | 2013 | |
Portfolio turnover rate | | | 28.0% | | | | 75.9% | | | | 69.2% | | | | 12.0% | |
| * | Commencement of operations. |
| ** | Amounts are less than $0.005. |
| (a) | Net investment income (loss) allocated based on average shares method. |
| (b) | Total return measures net investment income (loss) and capital gain or loss from portfolio investments assuming reinvestment of dividends and capital gains distributions. Total return is not annualized for periods that are less than a full year, does not reflect the effect of sales charge for Class A shares nor the contingent deferred sales charge for Class C shares and does not reflect the deduction of taxes that a shareholder would pay on fund distributions or the redemption of fund shares. |
Calamos Mid Cap Growth Fund Financial Highlights
| | | | | | | | | | | | | | | | |
| | | CLASS C | |
| | | (Unaudited)
Six Months
Ended
April 30, | | | Year Ended October 31, | | | August 5, 2013*
through
October 31, | |
| | | 2016 | | | 2015 | | | 2014 | | | 2013 | |
Net asset value, beginning of period | | | $10.64 | | | | $11.26 | | | | $10.61 | | | | $10.00 | |
Income from investment operations: | | | | | | | | | | | | | | | | |
Net investment income (loss)(a) | | | (0.06 | ) | | | (0.14 | ) | | | (0.14 | ) | | | (0.04 | ) |
Net realized and unrealized gain (loss) | | | (0.75 | ) | | | (0.48 | ) | | | 0.79 | | | | 0.65 | |
Total from investment operations | | | (0.81 | ) | | | (0.62 | ) | | | 0.65 | | | | 0.61 | |
Distributions: | | | | | | | | | | | | | | | | |
Dividends from net investment income | | | — | | | | — | | | | — | | | | — | |
Dividends from net realized gains | | | (0.67 | ) | | | — | | | | (0.00 | )** | | | — | |
Total distributions | | | (0.67 | ) | | | — | | | | (0.00 | )** | | | — | |
Net asset value, end of period | | | $9.16 | | | | $10.64 | | | | $11.26 | | | | $10.61 | |
Ratios and supplemental data: | | | | | | | | | | | | | | | | |
Total return(b) | | | (7.93% | ) | | | (5.51% | ) | | | 6.13% | | | | 6.10% | |
Net assets, end of period (000) | | | $309 | | | | $569 | | | | $583 | | | | $122 | |
Ratio of net expenses to average net assets | | | 2.00% | (c) | | | 2.00% | | | | 2.00% | | | | 2.00% | (c) |
Ratio of gross expenses to average net assets prior to expense reductions | | | 3.31% | (c) | | | 2.45% | | | | 2.41% | | | | 6.60% | (c) |
Ratio of net investment income (loss) to average net assets | | | (1.31% | )(c) | | | (1.18% | ) | | | (1.32% | ) | | | (1.57% | )(c) |
| |
| | | CLASS I | |
| | | (Unaudited)
Six Months
Ended
April 30, | | | Year Ended October 31, | | | August 5, 2013*
through
October 31, | |
| | | 2016 | | | 2015 | | | 2014 | | | 2013 | |
Net asset value, beginning of period | | | $10.88 | | | | $11.40 | | | | $10.64 | | | | $10.00 | |
Income from investment operations: | | | | | | | | | | | | | | | | |
Net investment income (loss)(a) | | | (0.02 | ) | | | (0.02 | ) | | | (0.04 | ) | | | (0.01 | ) |
Net realized and unrealized gain (loss) | | | (0.76 | ) | | | (0.50 | ) | | | 0.81 | | | | 0.65 | |
Total from investment operations | | | (0.78 | ) | | | (0.52 | ) | | | 0.77 | | | | 0.64 | |
Distributions: | | | | | | | | | | | | | | | | |
Dividends from net investment income | | | — | | | | — | | | | (0.01 | ) | | | — | |
Dividends from net realized gains | | | (0.67 | ) | | | — | | | | (0.00 | )** | | | — | |
Return of capital | | | — | | | | — | | | | (0.00 | )** | | | — | |
Total distributions | | | (0.67 | ) | | | — | | | | (0.01 | ) | | | — | |
Net asset value, end of period | | | $9.43 | | | | $10.88 | | | | $11.40 | | | | $10.64 | |
Ratios and supplemental data: | | | | | | | | | | | | | | | | |
Total return(b) | | | (7.45% | ) | | | (4.56% | ) | | | 7.21% | | | | 6.40% | |
Net assets, end of period (000) | | | $2,861 | | | | $6,629 | | | | $9,730 | | | | $7,299 | |
Ratio of net expenses to average net assets | | | 1.00% | (c) | | | 1.00% | | | | 1.00% | | | | 1.00% | (c) |
Ratio of gross expenses to average net assets prior to expense reductions | | | 2.28% | (c) | | | 1.44% | | | | 1.46% | | | | 5.59% | (c) |
Ratio of net investment income (loss) to average net assets | | | (0.33% | )(c) | | | (0.16% | ) | | | (0.33% | ) | | | (0.54% | )(c) |
| * | Commencement of operations. |
| ** | Amounts are less than $0.005. |
| (a) | Net investment income (loss) allocated based on average shares method. |
| (b) | Total return measures net investment income (loss) and capital gain or loss from portfolio investments assuming reinvestment of dividends and capital gains distributions. Total return is not annualized for periods that are less than a full year, does not reflect the effect of sales charge for Class A shares nor the contingent deferred sales charge for Class C shares and does not reflect the deduction of taxes that a shareholder would pay on fund distributions or the redemption of fund shares. |
| | | | |
| 212 | | CALAMOS OPEN-END FAMILY OF FUNDS SEMIANNUAL REPORT | | |
Calamos Mid Cap Growth Fund Financial Highlights
| | | | | | | | | | | | | | | | |
| | | CLASS R | |
| | | (Unaudited)
Six Months
Ended
April 30, | | | Year Ended October 31, | | | August 5, 2013*
through
October 31, | |
| | | 2016 | | | 2015 | | | 2014 | | | 2013 | |
Net asset value, beginning of period | | | $10.76 | | | | $11.33 | | | | $10.63 | | | | $10.00 | |
Income from investment operations: | | | | | | | | | | | | | | | | |
Net investment income (loss)(a) | | | (0.04 | ) | | | (0.08 | ) | | | (0.09 | ) | | | (0.03 | ) |
Net realized and unrealized gain (loss) | | | (0.75 | ) | | | (0.49 | ) | | | 0.79 | | | | 0.66 | |
Total from investment operations | | | (0.79 | ) | | | (0.57 | ) | | | 0.70 | | | | 0.63 | |
Distributions: | | | | | | | | | | | | | | | | |
Dividends from net investment income | | | — | | | | — | | | | — | | | | — | |
Dividends from net realized gains | | | (0.67 | ) | | | — | | | | (0.00 | )** | | | — | |
Total distributions | | | (0.67 | ) | | | — | | | | (0.00 | )** | | | — | |
Net asset value, end of period | | | $9.30 | | | | $10.76 | | | | $11.33 | | | | $10.63 | |
Ratios and supplemental data: | �� | | | | | | | | | | | | | | | |
Total return(b) | | | (7.64% | ) | | | (5.03% | ) | | | 6.59% | | | | 6.30% | |
Net assets, end of period (000) | | | $99 | | | | $108 | | | | $113 | | | | $106 | |
Ratio of net expenses to average net assets | | | 1.50% | (c) | | | 1.50% | | | | 1.50% | | | | 1.50% | (c) |
Ratio of gross expenses to average net assets prior to expense reductions | | | 2.89% | (c) | | | 1.96% | | | | 1.98% | | | | 6.13% | (c) |
Ratio of net investment income (loss) to average net assets | | | (0.84% | )(c) | | | (0.67% | ) | | | (0.82% | ) | | | (1.06% | )(c) |
| * | Commencement of operations. |
| ** | Amounts are less than $0.005. |
| (a) | Net investment income (loss) allocated based on average shares method. |
| (b) | Total return measures net investment income (loss) and capital gain or loss from portfolio investments assuming reinvestment of dividends and capital gains distributions. Total return is not annualized for periods that are less than a full year, does not reflect the effect of sales charge for Class A shares nor the contingent deferred sales charge for Class C shares and does not reflect the deduction of taxes that a shareholder would pay on fund distributions or the redemption of fund shares. |
Calamos International Growth Fund Financial Highlights
Selected data for a share outstanding throughout each period were as follows:
| | | | | | | | | | | | | | | | | | | | | | | | |
| | | CLASS A | |
| | | (Unaudited)
Six Months
Ended
April 30, | | | Year Ended October 31, | |
| | | 2016 | | | 2015 | | | 2014 | | | 2013 | | | 2012 | | | 2011 | |
Net asset value, beginning of period | | | $17.27 | | | | $19.27 | | | | $19.24 | | | | $17.27 | | | | $16.32 | | | | $15.46 | |
Income from investment operations: | | | | | | | | | | | | | | | | | | | | | | | | |
Net investment income (loss)(a) | | | 0.03 | | | | 0.09 | | | | 0.09 | | | | 0.09 | | | | 0.06 | | | | (0.04 | ) |
Net realized and unrealized gain (loss) | | | (0.99 | ) | | | 0.02 | | | | 0.02 | | | | 1.92 | | | | 0.89 | | | | 0.90 | |
Total from investment operations | | | (0.96 | ) | | | 0.11 | | | | 0.11 | | | | 2.01 | | | | 0.95 | | | | 0.86 | |
Distributions: | | | | | | | | | | | | | | | | | | | | | | | | |
Dividends from net investment income | | | — | | | | — | | | | (0.08 | ) | | | (0.04 | ) | | | — | | | | — | |
Dividends from net realized gains | | | (0.02 | ) | | | (2.11 | ) | | | — | | | | — | | | | — | | | | — | |
Total distributions | | | (0.02 | ) | | | (2.11 | ) | | | (0.08 | ) | | | (0.04 | ) | | | — | | | | — | |
Net asset value, end of period | | | $16.29 | | | | $17.27 | | | | $19.27 | | | | $19.24 | | | | $17.27 | | | | $16.32 | |
Ratios and supplemental data: | | | | | | | | | | | | | | | | | | | | | | | | |
Total return(b) | | | (5.55% | ) | | | 0.94% | | | | 0.57% | | | | 11.64% | | | | 5.82% | | | | 5.56% | |
Net assets, end of period (000) | | | $161,185 | | | | $209,548 | | | | $254,400 | | | | $368,964 | | | | $459,516 | | | | $238,764 | |
Ratio of net expenses to average net assets | | | 1.36% | (c) | | | 1.31% | | | | 1.39% | | | | 1.40% | | | | 1.40% | | | | 1.49% | |
Ratio of gross expenses to average net assets prior to expense reductions | | | 1.36% | (c) | | | 1.31% | | | | 1.39% | | | | 1.48% | | | | 1.59% | | | | 1.58% | |
Ratio of net investment income (loss) to average net assets | | | 0.34% | (c) | | | 0.52% | | | | 0.43% | | | | 0.50% | | | | 0.36% | | | | (0.21% | ) |
| | |
| | | (Unaudited)
Six Months
Ended
April 30, | | | Year Ended October 31, | |
| | | 2016 | | | 2015 | | | 2014 | | | 2013 | | | 2012 | | | 2011 | |
Portfolio turnover rate | | | 31.6% | | | | 65.0% | | | | 81.6% | | | | 73.4% | | | | 55.7% | | | | 59.6% | |
| (a) | Net investment income (loss) allocated based on average shares method. |
| (b) | Total return measures net investment income (loss) and capital gain or loss from portfolio investments assuming reinvestment of dividends and capital gains distributions. Total return is not annualized for periods that are less than a full year, does not reflect the effect of sales charge for Class A shares nor the contingent deferred sales charge for Class B and C shares and does not reflect the deduction of taxes that a shareholder would pay on fund distributions or the redemption of fund shares. |
| | | | |
| 214 | | CALAMOS OPEN-END FAMILY OF FUNDS SEMIANNUAL REPORT | | |
Calamos International Growth Fund Financial Highlights
| | | | | | | | | | | | | | | | | | | | | | | | |
| | | CLASS B | |
| | | (Unaudited)
Six Months
Ended
April 30, | | | Year Ended October 31, | |
| | | 2016 | | | 2015 | | | 2014 | | | 2013 | | | 2012 | | | 2011 | |
Net asset value, beginning of period | | | $16.06 | | | | $18.20 | | | | $18.24 | | | | $16.45 | | | | $15.67 | | | | $14.96 | |
Income from investment operations: | | | | | | | | | | | | | | | | | | | | | | | | |
Net investment income (loss)(a) | | | (0.05 | ) | | | (0.05 | ) | | | (0.09 | ) | | | (0.05 | ) | | | (0.07 | ) | | | (0.16 | ) |
Net realized and unrealized gain (loss) | | | (0.89 | ) | | | 0.02 | | | | 0.05 | | | | 1.84 | | | | 0.85 | | | | 0.87 | |
Total from investment operations | | | (0.94 | ) | | | (0.03 | ) | | | (0.04 | ) | | | 1.79 | | | | 0.78 | | | | 0.71 | |
Distributions: | | | | | | | | | | | | | | | | | | | | | | | | |
Dividends from net investment income | | | — | | | | — | | | | — | | | | — | | | | — | | | | — | |
Dividends from net realized gains | | | (0.02 | ) | | | (2.11 | ) | | | — | | | | — | | | | — | | | | — | |
Total distributions | | | (0.02 | ) | | | (2.11 | ) | | | — | | | | — | | | | — | | | | — | |
Net asset value, end of period | | | $15.10 | | | | $16.06 | | | | $18.20 | | | | $18.24 | | | | $16.45 | | | | $15.67 | |
Ratios and supplemental data: | | | | | | | | | | | | | | | | | | | | | | | | |
Total return(b) | | | (5.84% | ) | | | 0.15% | | | | (0.22% | ) | | | 10.88% | | | | 4.98% | | | | 4.75% | |
Net assets, end of period (000) | | | $513 | | | | $1,103 | | | | $2,302 | | | | $5,995 | | | | $9,542 | | | | $13,500 | |
Ratio of net expenses to average net assets | | | 2.11% | (c) | | | 2.06% | | | | 2.15% | | | | 2.15% | | | | 2.15% | | | | 2.25% | |
Ratio of gross expenses to average net assets prior to expense reductions | | | 2.11% | (c) | | | 2.06% | | | | 2.15% | | | | 2.23% | | | | 2.34% | | | | 2.32% | |
Ratio of net investment income (loss) to average net assets | | | (0.63% | )(c) | | | (0.29% | ) | | | (0.46% | ) | | | (0.26% | ) | | | (0.45% | ) | | | (1.01% | ) |
| |
| | | CLASS C | |
| | | (Unaudited)
Six Months
Ended
April 30, | | | Year Ended October 31, | |
| | | 2016 | | | 2015 | | | 2014 | | | 2013 | | | 2012 | | | 2011 | |
Net asset value, beginning of period | | | $16.04 | | | | $18.18 | | | | $18.21 | | | | $16.43 | | | | $15.65 | | | | $14.94 | |
Income from investment operations: | | | | | | | | | | | | | | | | | | | | | | | | |
Net investment income (loss)(a) | | | (0.03 | ) | | | (0.04 | ) | | | (0.06 | ) | | | (0.04 | ) | | | (0.06 | ) | | | (0.16 | ) |
Net realized and unrealized gain (loss) | | | (0.91 | ) | | | 0.01 | | | | 0.03 | | | | 1.82 | | | | 0.84 | | | | 0.87 | |
Total from investment operations | | | (0.94 | ) | | | (0.03 | ) | | | (0.03 | ) | | | 1.78 | | | | 0.78 | | | | 0.71 | |
Distributions: | | | | | | | | | | | | | | | | | | | | | | | | |
Dividends from net investment income | | | — | | | | — | | | | — | | | | — | | | | — | | | | — | |
Dividends from net realized gains | | | (0.02 | ) | | | (2.11 | ) | | | — | | | | — | | | | — | | | | — | |
Total distributions | | | (0.02 | ) | | | (2.11 | ) | | | — | | | | — | | | | — | | | | — | |
Net asset value, end of period | | | $15.08 | | | | $16.04 | | | | $18.18 | | | | $18.21 | | | | $16.43 | | | | $15.65 | |
Ratios and supplemental data: | | | | | | | | | | | | | | | | | | | | | | | | |
Total return(b) | | | (5.85% | ) | | | 0.15% | | | | (0.16% | ) | | | 10.83% | | | | 4.98% | | | | 4.75% | |
Net assets, end of period (000) | | | $41,663 | | | | $47,996 | | | | $59,756 | | | | $65,622 | | | | $65,621 | | �� | | $53,355 | |
Ratio of net expenses to average net assets | | | 2.11% | (c) | | | 2.06% | | | | 2.13% | | | | 2.15% | | | | 2.15% | | | | 2.25% | |
Ratio of gross expenses to average net assets prior to expense reductions | | | 2.11% | (c) | | | 2.06% | | | | 2.13% | | | | 2.23% | | | | 2.34% | | | | 2.32% | |
Ratio of net investment income (loss) to average net assets | | | (0.40% | )(c) | | | (0.23% | ) | | | (0.32% | ) | | | (0.23% | ) | | | (0.41% | ) | | | (0.98% | ) |
| (a) | Net investment income (loss) allocated based on average shares method. |
| (b) | Total return measures net investment income (loss) and capital gain or loss from portfolio investments assuming reinvestment of dividends and capital gains distributions. Total return is not annualized for periods that are less than a full year, does not reflect the effect of sales charge for Class A shares nor the contingent deferred sales charge for Class B and C shares and does not reflect the deduction of taxes that a shareholder would pay on fund distributions or the redemption of fund shares. |
Calamos International Growth Fund Financial Highlights
| | | | | | | | | | | | | | | | | | | | | | | | |
| | | CLASS I | |
| | | (Unaudited)
Six Months
Ended
April 30, | | | Year Ended October 31, | |
| | | 2016 | | | 2015 | | | 2014 | | | 2013 | | | 2012 | | | 2011 | |
Net asset value, beginning of period | | | $17.54 | | | | $19.50 | | | | $19.48 | | | | $17.47 | | | | $16.47 | | | | $15.57 | |
Income from investment operations: | | | | | | | | | | | | | | | | | | | | | | | | |
Net investment income (loss)(a) | | | 0.05 | | | | 0.14 | | | | 0.13 | | | | 0.14 | | | | 0.10 | | | | 0.01 | |
Net realized and unrealized gain (loss) | | | (1.00 | ) | | | 0.01 | | | | 0.03 | | | | 1.94 | | | | 0.90 | | | | 0.89 | |
Total from investment operations | | | (0.95 | ) | | | 0.15 | | | | 0.16 | | | | 2.08 | | | | 1.00 | | | | 0.90 | |
Distributions: | | | | | | | | | | | | | | | | | | | | | | | | |
Dividends from net investment income | | | — | | | | — | | | | (0.14 | ) | | | (0.07 | ) | | | — | | | | — | |
Dividends from net realized gains | | | (0.02 | ) | | | (2.11 | ) | | | — | | | | — | | | | — | | | | — | |
Total distributions | | | (0.02 | ) | | | (2.11 | ) | | | (0.14 | ) | | | (0.07 | ) | | | — | | | | — | |
Net asset value, end of period | | | $16.57 | | | | $17.54 | | | | $19.50 | | | | $19.48 | | | | $17.47 | | | | $16.47 | |
Ratios and supplemental data: | | | | | | | | | | | | | | | | | | | | | | | | |
Total return(b) | | | (5.41% | ) | | | 1.16% | | | | 0.80% | | | | 11.97% | | | | 6.07% | | | | 5.78% | |
Net assets, end of period (000) | | | $258,062 | | | | $339,909 | | | | $410,485 | | | | $460,587 | | | | $415,463 | | | | $226,298 | |
Ratio of net expenses to average net assets | | | 1.11% | (c) | | | 1.06% | | | | 1.14% | | | | 1.15% | | | | 1.15% | | | | 1.23% | |
Ratio of gross expenses to average net assets prior to expense reductions | | | 1.11% | (c) | | | 1.06% | | | | 1.14% | | | | 1.23% | | | | 1.34% | | | | 1.33% | |
Ratio of net investment income (loss) to average net assets | | | 0.56% | (c) | | | 0.78% | | | | 0.66% | | | | 0.79% | | | | 0.61% | | | | 0.07% | |
| |
| | | CLASS R | |
| | | (Unaudited)
Six Months
Ended
April 30, | | | Year Ended October 31, | |
| | | 2016 | | | 2015 | | | 2014 | | | 2013 | | | 2012 | | | 2011 | |
Net asset value, beginning of period | | | $16.95 | | | | $19.00 | | | | $18.98 | | | | $17.06 | | | | $16.16 | | | | $15.35 | |
Income from investment operations: | | | | | | | | | | | | | | | | | | | | | | | | |
Net investment income (loss)(a) | | | 0.01 | | | | 0.05 | | | | 0.03 | | | | 0.06 | | | | 0.02 | | | | (0.08 | ) |
Net realized and unrealized gain (loss) | | | (0.97 | ) | | | 0.01 | | | | 0.03 | | | | 1.88 | | | | 0.88 | | | | 0.89 | |
Total from investment operations | | | (0.96 | ) | | | 0.06 | | | | 0.06 | | | | 1.94 | | | | 0.90 | | | | 0.81 | |
Distributions: | | | | | | | | | | | | | | | | | | | | | | | | |
Dividends from net investment income | | | — | | | | — | | | | (0.04 | ) | | | (0.02 | ) | | | — | | | | — | |
Dividends from net realized gains | | | (0.02 | ) | | | (2.11 | ) | | | — | | | | — | | | | — | | | | — | |
Total distributions | | | (0.02 | ) | | | (2.11 | ) | | | (0.04 | ) | | | (0.02 | ) | | | — | | | | — | |
Net asset value, end of period | | | $15.97 | | | | $16.95 | | | | $19.00 | | | | $18.98 | | | | $17.06 | | | | $16.16 | |
Ratios and supplemental data: | | | | | | | | | | | | | | | | | | | | | | | | |
Total return(b) | | | (5.65% | ) | | | 0.66% | | | | 0.33% | | | | 11.36% | | | | 5.57% | | | | 5.28% | |
Net assets, end of period (000) | | | $7,956 | | | | $8,861 | | | | $14,650 | | | | $19,550 | | | | $12,016 | | | | $3,667 | |
Ratio of net expenses to average net assets | | | 1.61% | (c) | | | 1.56% | | | | 1.64% | | | | 1.65% | | | | 1.65% | | | | 1.73% | |
Ratio of gross expenses to average net assets prior to expense reductions | | | 1.61% | (c) | | | 1.56% | | | | 1.64% | | | | 1.73% | | | | 1.84% | | | | 1.84% | |
Ratio of net investment income (loss) to average net assets | | | 0.16% | (c) | | | 0.29% | | | | 0.14% | | | | 0.33% | | | | 0.11% | | | | (0.46% | ) |
| (a) | Net investment income (loss) allocated based on average shares method. |
| (b) | Total return measures net investment income (loss) and capital gain or loss from portfolio investments assuming reinvestment of dividends and capital gains distributions. Total return is not annualized for periods that are less than a full year, does not reflect the effect of sales charge for Class A shares nor the contingent deferred sales charge for Class B and C shares and does not reflect the deduction of taxes that a shareholder would pay on fund distributions or the redemption of fund shares. |
| | | | |
| 216 | | CALAMOS OPEN-END FAMILY OF FUNDS SEMIANNUAL REPORT | | |
Calamos Evolving World Growth Fund Financial Highlights
Selected data for a share outstanding throughout each period were as follows:
| | | | | | | | | | | | | | | | | | | | | | | | |
| | | CLASS A | |
| | | (Unaudited)
Six Months
Ended
April 30, | | | Year Ended October 31, | |
| | | 2016 | | | 2015 | | | 2014 | | | 2013 | | | 2012 | | | 2011 | |
Net asset value, beginning of period | | | $12.11 | | | | $13.73 | | | | $13.97 | | | | $12.83 | | | | $12.47 | | | | $12.42 | |
Income from investment operations: | | | | | | | | | | | | | | | | | | | | | | | | |
Net investment income (loss)(a) | | | 0.00 | ** | | | 0.02 | | | | 0.06 | | | | 0.03 | | | | 0.04 | | | | 0.01 | |
Net realized and unrealized gain (loss) | | | (0.41 | ) | | | (1.31 | ) | | | (0.18 | ) | | | 1.11 | | | | 0.32 | | | | 0.08 | |
Total from investment operations | | | (0.41 | ) | | | (1.29 | ) | | | (0.12 | ) | | | 1.14 | | | | 0.36 | | | | 0.09 | |
Distributions: | | | | | | | | | | | | | | | | | | | | | | | | |
Dividends from net investment income | | | (0.01 | ) | | | (0.03 | ) | | | (0.01 | ) | | | — | | | | — | | | | (0.04 | ) |
Dividends from net realized gains | | | — | | | | (0.30 | ) | | | (0.11 | ) | | | — | | | | — | | | | — | |
Return of capital | | | — | | | | (0.00 | )** | | | — | | | | — | | | | — | | | | — | |
Total distributions | | | (0.01 | ) | | | (0.33 | ) | | | (0.12 | ) | | | — | | | | — | | | | (0.04 | ) |
Net asset value, end of period | | | $11.69 | | | | $12.11 | | | | $13.73 | | | | $13.97 | | | | $12.83 | | | | $12.47 | |
Ratios and supplemental data: | | | | | | | | | | | | | | | | | | | | | | | | |
Total return(b) | | | (3.39% | ) | | | (9.56% | ) | | | (0.84% | ) | | | 8.89% | | | | 2.89% | | | | 0.68% | |
Net assets, end of period (000) | | | $115,425 | | | | $121,946 | | | | $168,332 | | | | $164,273 | | | | $138,718 | | | | $104,365 | |
Ratio of net expenses to average net assets | | | 1.64% | (c) | | | 1.65% | | | | 1.61% | | | | 1.63% | | | | 1.60% | | | | 1.58% | |
Ratio of gross expenses to average net assets prior to expense reductions | | | 1.64% | (c) | | | 1.65% | | | | 1.61% | | | | 1.63% | | | | 1.60% | | | | 1.58% | |
Ratio of net investment income (loss) to average net assets | | | 0.04% | (c) | | | 0.14% | | | | 0.45% | | | | 0.23% | | | | 0.32% | | | | 0.08% | |
| | |
| | | (Unaudited)
Six Months
Ended
April 30, | | | Year Ended October 31, | |
| | | 2016 | | | 2015 | | | 2014 | | | 2013 | | | 2012 | | | 2011 | |
Portfolio turnover rate | | | 35.6% | | | | 58.8% | | | | 99.9% | | | | 85.8% | | | | 50.1% | | | | 67.4% | |
| ** | Amounts are less than $0.005. |
| (a) | Net investment income (loss) allocated based on average shares method. |
| (b) | Total return measures net investment income (loss) and capital gain or loss from portfolio investments assuming reinvestment of dividends and capital gains distributions. Total return is not annualized for periods that are less than a full year, does not reflect the effect of sales charge for Class A shares nor the contingent deferred sales charge for Class B and C shares and does not reflect the deduction of taxes that a shareholder would pay on fund distributions or the redemption of fund shares. |
Calamos Evolving World Growth Fund Financial Highlights
| | | | | | | | | | | | | | | | | | | | | | | | |
| | | CLASS B | |
| | | (Unaudited)
Six Months
Ended
April 30, | | | Year Ended October 31, | |
| | | 2016 | | | 2015 | | | 2014 | | | 2013 | | | 2012 | | | 2011 | |
Net asset value, beginning of period | | | $11.62 | | | | $13.26 | | | | $13.59 | | | | $12.58 | | | | $12.32 | | | | $12.32 | |
Income from investment operations: | | | | | | | | | | | | | | | | | | | | | | | | |
Net investment income (loss)(a) | | | (0.05 | ) | | | (0.08 | ) | | | (0.03 | ) | | | (0.07 | ) | | | (0.06 | ) | | | (0.09 | ) |
Net realized and unrealized gain (loss) | | | (0.38 | ) | | | (1.26 | ) | | | (0.19 | ) | | | 1.08 | | | | 0.32 | | | | 0.09 | |
Total from investment operations | | | (0.43 | ) | | | (1.34 | ) | | | (0.22 | ) | | | 1.01 | | | | 0.26 | | | | — | |
Distributions: | | | | | | | | | | | | | | | | | | | | | | | | |
Dividends from net investment income | | | — | | | | — | | | | — | | | | — | | | | — | | | | — | |
Dividends from net realized gains | | | — | | | | (0.30 | ) | | | (0.11 | ) | | | — | | | | — | | | | — | |
Return of capital | | | — | | | | (0.00 | )** | | | — | | | | — | | | | — | | | | — | |
Total distributions | | | — | | | | (0.30 | ) | | | (0.11 | ) | | | — | | | | — | | | | — | |
Net asset value, end of period | | | $11.19 | | | | $11.62 | | | | $13.26 | | | | $13.59 | | | | $12.58 | | | | $12.32 | |
Ratios and supplemental data: | | | | | | | | | | | | | | | | | | | | | | | | |
Total return(b) | | | (3.70% | ) | | | (10.25% | ) | | | (1.59% | ) | | | 8.03% | | | | 2.11% | | | | 0.00% | |
Net assets, end of period (000) | | | $118 | | | | $483 | | | | $713 | | | | $1,788 | | | | $1,595 | | | | $1,815 | |
Ratio of net expenses to average net assets | | | 2.42% | (c) | | | 2.40% | | | | 2.35% | | | | 2.38% | | | | 2.34% | | | | 2.33% | |
Ratio of gross expenses to average net assets prior to expense reductions | | | 2.42% | (c) | | | 2.40% | | | | 2.35% | | | | 2.38% | | | | 2.34% | | | | 2.33% | |
Ratio of net investment income (loss) to average net assets | | | (0.94% | )(c) | | | (0.60% | ) | | | (0.23% | ) | | | (0.52% | ) | | | (0.46% | ) | | | (0.71% | ) |
| |
| | | CLASS C | |
| | | (Unaudited)
Six Months
Ended
April 30, | | | Year Ended October 31, | |
| | | 2016 | | | 2015 | | | 2014 | | | 2013 | | | 2012 | | | 2011 | |
Net asset value, beginning of period | | | $11.62 | | | | $13.26 | | | | $13.59 | | | | $12.57 | | | | $12.31 | | | | $12.31 | |
Income from investment operations: | | | | | | | | | | | | | | | | | | | | | | | | |
Net investment income (loss)(a) | | | (0.04 | ) | | | (0.07 | ) | | | (0.04 | ) | | | (0.06 | ) | | | (0.05 | ) | | | (0.09 | ) |
Net realized and unrealized gain (loss) | | | (0.40 | ) | | | (1.27 | ) | | | (0.18 | ) | | | 1.08 | | | | 0.31 | | | | 0.09 | |
Total from investment operations | | | (0.44 | ) | | | (1.34 | ) | | | (0.22 | ) | | | 1.02 | | | | 0.26 | | | | — | |
Distributions: | | | | | | | | | | | | | | | | | | | | | | | | |
Dividends from net investment income | | | — | | | | — | | | | — | | | | — | | | | — | | | | (0.00 | )** |
Dividends from net realized gains | | | — | | | | (0.30 | ) | | | (0.11 | ) | | | — | | | | — | | | | — | |
Return of capital | | | — | | | | (0.00 | )** | | | — | | | | — | | | | — | | | | — | |
Total distributions | | | — | | | | (0.30 | ) | | | (0.11 | ) | | | — | | | | — | | | | — | |
Net asset value, end of period | | | $11.18 | | | | $11.62 | | | | $13.26 | | | | $13.59 | | | | $12.57 | | | | $12.31 | |
Ratios and supplemental data: | | | | | | | | | | | | | | | | | | | | | | | | |
Total return(b) | | | (3.79% | ) | | | (10.25% | ) | | | (1.59% | ) | | | 8.11% | | | | 2.11% | | | | 0.00% | |
Net assets, end of period (000) | | | $34,411 | | | | $36,532 | | | | $44,611 | | | | $34,022 | | | | $21,527 | | | | $8,913 | |
Ratio of net expenses to average net assets | | | 2.39% | (c) | | | 2.40% | | | | 2.37% | | | | 2.39% | | | | 2.35% | | | | 2.33% | |
Ratio of gross expenses to average net assets prior to expense reductions | | | 2.39% | (c) | | | 2.40% | | | | 2.37% | | | | 2.39% | | | | 2.35% | | | | 2.33% | |
Ratio of net investment income (loss) to average net assets | | | (0.72% | )(c) | | | (0.59% | ) | | | (0.33% | ) | | | (0.50% | ) | | | (0.41% | ) | | | (0.66% | ) |
| ** | Amounts are less than $0.005. |
| (a) | Net investment income (loss) allocated based on average shares method. |
| (b) | Total return measures net investment income (loss) and capital gain or loss from portfolio investments assuming reinvestment of dividends and capital gains distributions. Total return is not annualized for periods that are less than a full year, does not reflect the effect of sales charge for Class A shares nor the contingent deferred sales charge for Class B and C shares and does not reflect the deduction of taxes that a shareholder would pay on fund distributions or the redemption of fund shares. |
| | | | |
| 218 | | CALAMOS OPEN-END FAMILY OF FUNDS SEMIANNUAL REPORT | | |
Calamos Evolving World Growth Fund Financial Highlights
| | | | | | | | | | | | | | | | | | | | | | | | |
| | | CLASS I | |
| | | (Unaudited)
Six Months
Ended
April 30, | | | Year Ended October 31, | |
| | | 2016 | | | 2015 | | | 2014 | | | 2013 | | | 2012 | | | 2011 | |
Net asset value, beginning of period | | | $12.19 | | | | $13.83 | | | | $14.07 | | | | $12.92 | | | | $12.54 | | | | $12.46 | |
Income from investment operations: | | | | | | | | | | | | | | | | | | | | | | | | |
Net investment income (loss)(a) | | | 0.02 | | | | 0.05 | | | | 0.09 | | | | 0.07 | | | | 0.07 | | | | 0.04 | |
Net realized and unrealized gain (loss) | | | (0.42 | ) | | | (1.32 | ) | | | (0.18 | ) | | | 1.11 | | | | 0.32 | | | | 0.09 | |
Total from investment operations | | | (0.40 | ) | | | (1.27 | ) | | | (0.09 | ) | | | 1.18 | | | | 0.39 | | | | 0.13 | |
Distributions: | | | | | | | | | | | | | | | | | | | | | | | | |
Dividends from net investment income | | | (0.04 | ) | | | (0.07 | ) | | | (0.04 | ) | | | (0.03 | ) | | | (0.01 | ) | | | (0.05 | ) |
Dividends from net realized gains | | | — | | | | (0.30 | ) | | | (0.11 | ) | | | — | | | | — | | | | — | |
Return of capital | | | — | | | | (0.00 | )** | | | — | | | | — | | | | — | | | | — | |
Total distributions | | | (0.04 | ) | | | (0.37 | ) | | | (0.15 | ) | | | (0.03 | ) | | | (0.01 | ) | | | (0.05 | ) |
Net asset value, end of period | | | $11.75 | | | | $12.19 | | | | $13.83 | | | | $14.07 | | | | $12.92 | | | | $12.54 | |
Ratios and supplemental data: | | | | | | | | | | | | | | | | | | | | | | | | |
Total return(b) | | | (3.24% | ) | | | (9.35% | ) | | | (0.60% | ) | | | 9.16% | | | | 3.11% | | | | 1.05% | |
Net assets, end of period (000) | | | $311,241 | | | | $351,571 | | | | $436,546 | | | | $311,823 | | | | $175,572 | | | | $89,205 | |
Ratio of net expenses to average net assets | | | 1.39% | (c) | | | 1.40% | | | | 1.37% | | | | 1.39% | | | | 1.35% | | | | 1.33% | |
Ratio of gross expenses to average net assets prior to expense reductions | | | 1.39% | (c) | | | 1.40% | | | | 1.37% | | | | 1.39% | | | | 1.35% | | | | 1.33% | |
Ratio of net investment income (loss) to average net assets | | | 0.29% | (c) | | | 0.42% | | | | 0.65% | | | | 0.53% | | | | 0.59% | | | | 0.33% | |
| |
| | | CLASS R | |
| | | (Unaudited)
Six Months
Ended
April 30, | | | Year Ended October 31, | |
| | | 2016 | | | 2015 | | | 2014 | | | 2013 | | | 2012 | | | 2011 | |
Net asset value, beginning of period | | | $12.00 | | | | $13.62 | | | | $13.88 | | | | $12.78 | | | | $12.45 | | | | $12.39 | |
Income from investment operations: | | | | | | | | | | | | | | | | | | | | | | | | |
Net investment income (loss)(a) | | | (0.01 | ) | | | (0.01 | ) | | | 0.04 | | | | — | | | | 0.01 | | | | (0.03 | ) |
Net realized and unrealized gain (loss) | | | (0.41 | ) | | | (1.31 | ) | | | (0.19 | ) | | | 1.10 | | | | 0.32 | | | | 0.09 | |
Total from investment operations | | | (0.42 | ) | | | (1.32 | ) | | | (0.15 | ) | | | 1.10 | | | | 0.33 | | | | 0.06 | |
Distributions: | | | | | | | | | | | | | | | | | | | | | | | | |
Dividends from net investment income | | | — | | | | — | | | | — | | | | — | | | | — | | | | — | |
Dividends from net realized gains | | | — | | | | (0.30 | ) | | | (0.11 | ) | | | — | | | | — | | | | — | |
Return of capital | | | — | | | | (0.00 | )** | | | — | | | | — | | | | — | | | | — | |
Total distributions | | | — | | | | (0.30 | ) | | | (0.11 | ) | | | — | | | | — | | | | — | |
Net asset value, end of period | | | $11.58 | | | | $12.00 | | | | $13.62 | | | | $13.88 | | | | $12.78 | | | | $12.45 | |
Ratios and supplemental data: | | | | | | | | | | | | | | | | | | | | | | | | |
Total return(b) | | | (3.50% | ) | | | (9.83% | ) | | | (1.05% | ) | | | 8.61% | | | | 2.65% | | | | 0.48% | |
Net assets, end of period (000) | | | $2,459 | | | | $1,982 | | | | $1,361 | | | | $1,908 | | | | $1,555 | | | | $1,274 | |
Ratio of net expenses to average net assets | | | 1.89% | (c) | | | 1.91% | | | | 1.86% | | | | 1.88% | | | | 1.84% | | | | 1.83% | |
Ratio of gross expenses to average net assets prior to expense reductions | | | 1.89% | (c) | | | 1.91% | | | | 1.86% | | | | 1.88% | | | | 1.84% | | | | 1.83% | |
Ratio of net investment income (loss) to average net assets | | | (0.19% | )(c) | | | (0.04% | ) | | | 0.28% | | | | (0.04% | ) | | | 0.05% | | | | (0.21% | ) |
| ** | Amounts are less than $0.005. |
| (a) | Net investment income (loss) allocated based on average shares method. |
| (b) | Total return measures net investment income (loss) and capital gain or loss from portfolio investments assuming reinvestment of dividends and capital gains distributions. Total return is not annualized for periods that are less than a full year, does not reflect the effect of sales charge for Class A shares nor the contingent deferred sales charge for Class B and C shares and does not reflect the deduction of taxes that a shareholder would pay on fund distributions or the redemption of fund shares. |
Calamos Emerging Market Equity Fund Financial Highlights
Selected data for a share outstanding throughout each period were as follows:
| | | | | | | | | | | | |
| | | CLASS A | |
| | | (Unaudited)
Six Months
Ended
April 30, | | | Year Ended
October 31, | | | December 31, 2013*
through October 31, | |
| | | 2016 | | | 2015 | | | 2014 | |
Net asset value, beginning of period | | | $8.41 | | | | $9.84 | | | | $10.00 | |
Income from investment operations: | | | | | | | | | | | | |
Net investment income (loss)(a) | | | (0.03 | ) | | | (0.01 | ) | | | 0.02 | |
Net realized and unrealized gain (loss) | | | (0.20 | ) | | | (1.37 | ) | | | (0.18 | ) |
Total from investment operations | | | (0.23 | ) | | | (1.38 | ) | | | (0.16 | ) |
Distributions: | | | | | | | | | | | | |
Dividends from net investment income | | | (0.01 | ) | | | (0.05 | ) | | | — | |
Dividends from net realized gains | | | — | | | | — | | | | — | |
Total distributions | | | (0.01 | ) | | | (0.05 | ) | | | — | |
Net asset value, end of period | | | $8.17 | | | | $8.41 | | | | $9.84 | |
Ratios and supplemental data: | | | | | | | | | | | | |
Total return(b) | | | (2.74% | ) | | | (14.09% | ) | | | (1.60% | ) |
Net assets, end of period (000) | | | $4,226 | | | | $4,465 | | | | $5,360 | |
Ratio of net expenses to average net assets | | | 1.75% | (c) | | | 1.75% | | | | 1.75% | (c) |
Ratio of gross expenses to average net assets prior to expense reductions | | | 2.58% | (c) | | | 2.43% | | | | 3.45% | (c) |
Ratio of net investment income (loss) to average net assets | | | (0.71% | )(c) | | | (0.14% | ) | | | 0.24% | (c) |
| | | |
| | | (Unaudited)
Six Months
Ended
April 30, | | | Year Ended
October 31, | | | December 31, 2013*
through October 31, | |
| | | 2016 | | | 2015 | | | 2014 | |
Portfolio turnover rate | | | 29.2% | | | | 68.0% | | | | 109.2% | |
| * | Commencement of operations. |
| (a) | Net investment income (loss) allocated based on average shares method. |
| (b) | Total return measures net investment income (loss) and capital gain or loss from portfolio investments assuming reinvestment of dividends and capital gains distributions. Total return is not annualized for periods that are less than a full year, does not reflect the effect of sales charge for Class A shares nor the contingent deferred sales charge for Class B and C shares and does not reflect the deduction of taxes that a shareholder would pay on fund distributions or the redemption of fund shares. |
| | | | |
| 220 | | CALAMOS OPEN-END FAMILY OF FUNDS SEMIANNUAL REPORT | | |
Calamos Emerging Market Equity Fund Financial Highlights
| | | | | | | | | | | | |
| | | CLASS C | |
| | | (Unaudited)
Six Months
Ended
April 30, | | | Year Ended
October 31, | | | December 31, 2013*
through October 31, | |
| | | 2016 | | | 2015 | | | 2014 | |
Net asset value, beginning of period | | | $8.34 | | | | $9.78 | | | | $10.00 | |
Income from investment operations: | | | | | | | | | | | | |
Net investment income (loss)(a) | | | (0.06 | ) | | | (0.07 | ) | | | (0.04 | ) |
Net realized and unrealized gain (loss) | | | (0.20 | ) | | | (1.37 | ) | | | (0.18 | ) |
Total from investment operations | | | (0.26 | ) | | | (1.44 | ) | | | (0.22 | ) |
Distributions: | | | | | | | | | | | | |
Dividends from net investment income | | | — | | | | — | | | | — | |
Dividends from net realized gains | | | — | | | | — | | | | — | |
Total distributions | | | — | | | | — | | | | — | |
Net asset value, end of period | | | $8.08 | | | | $8.34 | | | | $9.78 | |
Ratios and supplemental data: | | | | | | | | | | | | |
Total return(b) | | | (3.12% | ) | | | (14.72% | ) | | | (2.20% | ) |
Net assets, end of period (000) | | | $267 | | | | $241 | | | | $288 | |
Ratio of net expenses to average net assets | | | 2.50% | (c) | | | 2.50% | | | | 2.50% | (c) |
Ratio of gross expenses to average net assets prior to expense reductions | | | 3.32% | (c) | | | 3.22% | | | | 4.08% | (c) |
Ratio of net investment income (loss) to average net assets | | | (1.47% | )(c) | | | (0.80% | ) | | | (0.45% | )(c) |
| |
| | | CLASS I | |
| | | (Unaudited)
Six Months
Ended
April 30, | | | Year Ended
October 31, | | | December 31, 2013*
through October 31, | |
| | | 2016 | | | 2015 | | | 2014 | |
Net asset value, beginning of period | | | $8.43 | | | | $9.86 | | | | $10.00 | |
Income from investment operations: | | | | | | | | | | | | |
Net investment income (loss)(a) | | | (0.02 | ) | | | 0.02 | | | | 0.04 | |
Net realized and unrealized gain (loss) | | | (0.20 | ) | | | (1.39 | ) | | | (0.18 | ) |
Total from investment operations | | | (0.22 | ) | | | (1.37 | ) | | | (0.14 | ) |
Distributions: | | | | | | | | | | | | |
Dividends from net investment income | | | (0.04 | ) | | | (0.06 | ) | | | — | |
Dividends from net realized gains | | | — | | | | — | | | | — | |
Total distributions | | | (0.04 | ) | | | (0.06 | ) | | | — | |
Net asset value, end of period | | | $8.17 | | | | $8.43 | | | | $9.86 | |
Ratios and supplemental data: | | | | | | | | | | | | |
Total return(b) | | | (2.62% | ) | | | (13.92% | ) | | | (1.40% | ) |
Net assets, end of period (000) | | | $8,642 | | | | $8,763 | | | | $9,701 | |
Ratio of net expenses to average net assets | | | 1.50% | (c) | | | 1.50% | | | | 1.50% | (c) |
Ratio of gross expenses to average net assets prior to expense reductions | | | 2.33% | (c) | | | 2.23% | | | | 3.04% | (c) |
Ratio of net investment income (loss) to average net assets | | | (0.46% | )(c) | | | 0.21% | | | | 0.50% | (c) |
| * | Commencement of operations. |
| (a) | Net investment income (loss) allocated based on average shares method. |
| (b) | Total return measures net investment income (loss) and capital gain or loss from portfolio investments assuming reinvestment of dividends and capital gains distributions. Total return is not annualized for periods that are less than a full year, does not reflect the effect of sales charge for Class A shares nor the contingent deferred sales charge for Class B and C shares and does not reflect the deduction of taxes that a shareholder would pay on fund distributions or the redemption of fund shares. |
Calamos Emerging Market Equity Fund Financial Highlights
| | | | | | | | | | | | |
| | | CLASS R | |
| | | (Unaudited)
Six Months
Ended
April 30, | | | Year Ended
October 31, | | | December 31, 2013*
through October 31, | |
| | | 2016 | | | 2015 | | | 2014 | |
Net asset value, beginning of period | | | $8.40 | | | | $9.82 | | | | $10.00 | |
Income from investment operations: | | | | | | | | | | | | |
Net investment income (loss)(a) | | | (0.04 | ) | | | (0.03 | ) | | | — | |
Net realized and unrealized gain (loss) | | | (0.20 | ) | | | (1.37 | ) | | | (0.18 | ) |
Total from investment operations | | | (0.24 | ) | | | (1.40 | ) | | | (0.18 | ) |
Distributions: | | | | | | | | | | | | |
Dividends from net investment income | | | — | | | | (0.02 | ) | | | — | |
Dividends from net realized gains | | | — | | | | — | | | | — | |
Total distributions | | | — | | | | (0.02 | ) | | | — | |
Net asset value, end of period | | | $8.16 | | | | $8.40 | | | | $9.82 | |
Ratios and supplemental data: | | | | | | | | | | | | |
Total return(b) | | | (2.86% | ) | | | (14.32% | ) | | | (1.80% | ) |
Net assets, end of period (000) | | | $82 | | | | $84 | | | | $98 | |
Ratio of net expenses to average net assets | | | 2.00% | (c) | | | 2.00% | | | | 2.00% | (c) |
Ratio of gross expenses to average net assets prior to expense reductions | | | 2.83% | (c) | | | 2.73% | | | | 3.72% | (c) |
Ratio of net investment income (loss) to average net assets | | | (0.96% | )(c) | | | (0.30% | ) | | | (0.02% | )(c) |
| * | Commencement of operations. |
| (a) | Net investment income (loss) allocated based on average shares method. |
| (b) | Total return measures net investment income (loss) and capital gain or loss from portfolio investments assuming reinvestment of dividends and capital gains distributions. Total return is not annualized for periods that are less than a full year, does not reflect the effect of sales charge for Class A shares nor the contingent deferred sales charge for Class B and C shares and does not reflect the deduction of taxes that a shareholder would pay on fund distributions or the redemption of fund shares. |
| | | | |
| 222 | | CALAMOS OPEN-END FAMILY OF FUNDS SEMIANNUAL REPORT | | |
Calamos Global Equity Fund Financial Highlights
Selected data for a share outstanding throughout each period were as follows:
| | | | | | | | | | | | | | | | | | | | | | | | |
| | | CLASS A | |
| | | (Unaudited)
Six Months
Ended
April 30, | | | Year Ended October 31, | |
| | | 2016 | | | 2015 | | | 2014 | | | 2013 | | | 2012 | | | 2011 | |
Net asset value, beginning of period | | | $13.19 | | | | $15.67 | | | | $14.97 | | | | $13.00 | | | | $12.14 | | | | $11.28 | |
Income from investment operations: | | | | | | | | | | | | | | | | | | | | | | | | |
Net investment income (loss)(a) | | | (0.01 | ) | | | 0.00 | * | | | (0.01 | ) | | | 0.03 | | | | (0.02 | ) | | | (0.07 | ) |
Net realized and unrealized gain (loss) | | | (0.85 | ) | | | 0.62 | | | | 1.08 | | | | 1.96 | | | | 0.88 | | | | 0.93 | |
Total from investment operations | | | (0.86 | ) | | | 0.62 | | | | 1.07 | | | | 1.99 | | | | 0.86 | | | | 0.86 | |
Distributions: | | | | | | | | | | | | | | | | | | | | | | | | |
Dividends from net investment income | | | — | | | | — | | | | (0.10 | ) | | | (0.02 | ) | | | — | | | | — | |
Dividends from net realized gains | | | (0.25 | ) | | | (3.10 | ) | | | (0.27 | ) | | | — | | | | — | | | | — | |
Total distributions | | | (0.25 | ) | | | (3.10 | ) | | | (0.37 | ) | | | (0.02 | ) | | | — | | | | — | |
Net asset value, end of period | | | $12.08 | | | | $13.19 | | | | $15.67 | | | | $14.97 | | | | $13.00 | | | | $12.14 | |
Ratios and supplemental data: | | | | | | | | | | | | | | | | | | | | | | | | |
Total return(b) | | | (6.58% | ) | | | 5.33% | | | | 7.25% | | | | 15.35% | | | | 7.08% | | | | 7.62% | |
Net assets, end of period (000) | | | $33,625 | | | | $67,141 | | | | $87,989 | | | | $152,068 | | | | $113,260 | | | | $51,525 | |
Ratio of net expenses to average net assets | | | 1.40% | (c) | | | 1.34% | | | | 1.40% | | | | 1.40% | | | | 1.40% | | | | 1.57% | |
Ratio of gross expenses to average net assets prior to expense reductions | | | 1.52% | (c) | | | 1.34% | | | | 1.40% | | | | 1.44% | | | | 1.52% | | | | 1.66% | |
Ratio of net investment income (loss) to average net assets | | | (0.12% | )(c) | | | 0.00% | ** | | | (0.10% | ) | | | 0.22% | | | | (0.14% | ) | | | (0.60% | ) |
| | |
| | | (Unaudited)
Six Months
Ended
April 30, | | | Year Ended October 31, | |
| | | 2016 | | | 2015 | | | 2014 | | | 2013 | | | 2012 | | | 2011 | |
Portfolio turnover rate | | | 27.8% | | | | 43.0% | | | | 53.3% | | | | 75.3% | | | | 44.5% | | | | 58.8% | |
| * | Amounts are less than $0.005. |
| ** | Amount is less than 0.005% |
| (a) | Net investment income (loss) allocated based on average shares method. |
| (b) | Total return measures net investment income (loss) and capital gain or loss from portfolio investments assuming reinvestment of dividends and capital gains distributions. Total return is not annualized for periods that are less than a full year, does not reflect the effect of sales charge for Class A shares nor the contingent deferred sales charge for Class B and C shares and does not reflect the deduction of taxes that a shareholder would pay on fund distributions or the redemption of fund shares. |
Calamos Global Equity Fund Financial Highlights
| | | | | | | | | | | | | | | | | | | | | | | | |
| | | CLASS B | |
| | | (Unaudited)
Six Months
Ended
April 30, | | | Year Ended October 31, | |
| | | 2016 | | | 2015 | | | 2014 | | | 2013 | | | 2012 | | | 2011 | |
Net asset value, beginning of period | | | $12.42 | | | | $15.03 | | | | $14.38 | | | | $12.56 | | | | $11.82 | | | | $11.06 | |
Income from investment operations: | | | | | | | | | | | | | | | | | | | | | | | | |
Net investment income (loss)(a) | | | (0.05 | ) | | | (0.10 | ) | | | (0.12 | ) | | | (0.07 | ) | | | (0.11 | ) | | | (0.16 | ) |
Net realized and unrealized gain (loss) | | | (0.80 | ) | | | 0.59 | | | | 1.04 | | | | 1.89 | | | | 0.85 | | | | 0.92 | |
Total from investment operations | | | (0.85 | ) | | | 0.49 | | | | 0.92 | | | | 1.82 | | | | 0.74 | | | | 0.76 | |
Distributions: | | | | | | | | | | | | | | | | | | | | | | | | |
Dividends from net investment income | | | — | | | | — | | | | — | | | | — | | | | — | | | | — | |
Dividends from net realized gains | | | (0.25 | ) | | | (3.10 | ) | | | (0.27 | ) | | | — | | | | — | | | | — | |
Total distributions | | | (0.25 | ) | | | (3.10 | ) | | | (0.27 | ) | | | — | | | | — | | | | — | |
Net asset value, end of period | | | $11.32 | | | | $12.42 | | | | $15.03 | | | | $14.38 | | | | $12.56 | | | | $11.82 | |
Ratios and supplemental data: | | | | | | | | | | | | | | | | | | | | | | | | |
Total return(b) | | | (6.91% | ) | | | 4.54% | | | | 6.49% | | | | 14.49% | | | | 6.26% | | | | 6.87% | |
Net assets, end of period (000) | | | $301 | | | | $490 | | | | $1,171 | | | | $2,751 | | | | $2,519 | | | | $2,603 | |
Ratio of net expenses to average net assets | | | 2.15% | (c) | | | 2.09% | | | | 2.16% | | | | 2.15% | | | | 2.15% | | | | 2.35% | |
Ratio of gross expenses to average net assets prior to expense reductions | | | 2.27% | (c) | | | 2.09% | | | | 2.16% | | | | 2.19% | | | | 2.28% | | | | 2.42% | |
Ratio of net investment income (loss) to average net assets | | | (0.95% | )(c) | | | (0.76% | ) | | | (0.81% | ) | | | (0.53% | ) | | | (0.90% | ) | | | (1.37% | ) |
| |
| | | CLASS C | |
| | | (Unaudited)
Six Months
Ended
April 30, | | | Year Ended October 31, | |
| | | 2016 | | | 2015 | | | 2014 | | | 2013 | | | 2012 | | | 2011 | |
Net asset value, beginning of period | | | $12.39 | | | | $15.00 | | | | $14.36 | | | | $12.54 | | | | $11.80 | | | | $11.04 | |
Income from investment operations: | | | | | | | | | | | | | | | | | | | | | | | | |
Net investment income (loss)(a) | | | (0.05 | ) | | | (0.09 | ) | | | (0.12 | ) | | | (0.07 | ) | | | (0.11 | ) | | | (0.16 | ) |
Net realized and unrealized gain (loss) | | | (0.80 | ) | | | 0.58 | | | | 1.03 | | | | 1.89 | | | | 0.85 | | | | 0.92 | |
Total from investment operations | | | (0.85 | ) | | | 0.49 | | | | 0.91 | | | | 1.82 | | | | 0.74 | | | | 0.76 | |
Distributions: | | | | | | | | | | | | | | | | | | | | | | | | |
Dividends from net investment income | | | — | | | | — | | | | — | | | | — | | | | — | | | | — | |
Dividends from net realized gains | | | (0.25 | ) | | | (3.10 | ) | | | (0.27 | ) | | | — | | | | — | | | | — | |
Total distributions | | | (0.25 | ) | | | (3.10 | ) | | | (0.27 | ) | | | — | | | | — | | | | — | |
Net asset value, end of period | | | $11.29 | | | | $12.39 | | | | $15.00 | | | | $14.36 | | | | $12.54 | | | | $11.80 | |
Ratios and supplemental data: | | | | | | | | | | | | | | | | | | | | | | | | |
Total return(b) | | | (6.93% | ) | | | 4.55% | | | | 6.43% | | | | 14.51% | | | | 6.27% | | | | 6.88% | |
Net assets, end of period (000) | | | $18,859 | | | | $21,227 | | | | $28,811 | | | | $32,975 | | | | $25,749 | | | | $10,359 | |
Ratio of net expenses to average net assets | | | 2.15% | (c) | | | 2.09% | | | | 2.14% | | | | 2.15% | | | | 2.15% | | | | 2.32% | |
Ratio of gross expenses to average net assets prior to expense reductions | | | 2.27% | (c) | | | 2.09% | | | | 2.14% | | | | 2.19% | | | | 2.27% | | | | 2.41% | |
Ratio of net investment income (loss) to average net assets | | | (0.87% | )(c) | | | (0.76% | ) | | | (0.82% | ) | | | (0.51% | ) | | | (0.89% | ) | | | (1.33% | ) |
| (a) | Net investment income allocated based on average shares method. |
| (b) | Total return measures net investment income (loss) and capital gain or loss from portfolio investments assuming reinvestment of dividends and capital gains distributions. Total return is not annualized for periods that are less than a full year, does not reflect the effect of sales charge for Class A shares nor the contingent deferred sales charge for Class B and C shares and does not reflect the deduction of taxes that a shareholder would pay on fund distributions or the redemption of fund shares. |
| | | | |
| 224 | | CALAMOS OPEN-END FAMILY OF FUNDS SEMIANNUAL REPORT | | |
Calamos Global Equity Fund Financial Highlights
| | | | | | | | | | | | | | | | | | | | | | | | |
| | | CLASS I | |
| | | (Unaudited)
Six Months
Ended
April 30, | | | Year Ended October 31, | |
| | | 2016 | | | 2015 | | | 2014 | | | 2013 | | | 2012 | | | 2011 | |
Net asset value, beginning of period | | | $13.38 | | | | $15.81 | | | | $15.11 | | | | $13.11 | | | | $12.22 | | | | $11.31 | |
Income from investment operations: | | | | | | | | | | | | | | | | | | | | | | | | |
Net investment income (loss)(a) | | | 0.01 | | | | 0.04 | | | | 0.02 | | | | 0.06 | | | | 0.02 | | | | (0.04 | ) |
Net realized and unrealized gain (loss) | | | (0.87 | ) | | | 0.63 | | | | 1.09 | | | | 1.99 | | | | 0.87 | | | | 0.95 | |
Total from investment operations | | | (0.86 | ) | | | 0.67 | | | | 1.11 | | | | 2.05 | | | | 0.89 | | | | 0.91 | |
Distributions: | | | | | | | | | | | | | | | | | | | | | | | | |
Dividends from net investment income | | | — | | | | — | | | | (0.14 | ) | | | (0.05 | ) | | | — | | | | — | |
Dividends from net realized gains | | | (0.25 | ) | | | (3.10 | ) | | | (0.27 | ) | | | — | | | | — | | | | — | |
Total distributions | | | (0.25 | ) | | | (3.10 | ) | | | (0.41 | ) | | | (0.05 | ) | | | — | | | | — | |
Net asset value, end of period | | | $12.27 | | | | $13.38 | | | | $15.81 | | | | $15.11 | | | | $13.11 | | | | $12.22 | |
Ratios and supplemental data: | | | | | | | | | | | | | | | | | | | | | | | | |
Total return(b) | | | (6.48% | ) | | | 5.64% | | | | 7.48% | | | | 15.65% | | | | 7.28% | | | | 8.05% | |
Net assets, end of period (000) | | | $90,259 | | | | $96,390 | | | | $101,511 | | | | $212,913 | | | | $220,364 | | | | $63,563 | |
Ratio of net expenses to average net assets | | | 1.15% | (c) | | | 1.09% | | | | 1.15% | | | | 1.15% | | | | 1.15% | | | | 1.27% | |
Ratio of gross expenses to average net assets prior to expense reductions | | | 1.27% | (c) | | | 1.09% | | | | 1.15% | | | | 1.19% | | | | 1.27% | | | | 1.39% | |
Ratio of net investment income (loss) to average net assets | | | 0.16% | (c) | | | 0.26% | | | | 0.15% | | | | 0.46% | | | | 0.13% | | | | (0.29% | ) |
| |
| | | CLASS R | |
| | | (Unaudited)
Six Months
Ended
April 30, | | | Year Ended October 31, | |
| | | 2016 | | | 2015 | | | 2014 | | | 2013 | | | 2012 | | | 2011 | |
Net asset value, beginning of period | | | $12.89 | | | | $15.42 | | | | $14.75 | | | | $12.83 | | | | $12.02 | | | | $11.19 | |
Income from investment operations: | | | | | | | | | | | | | | | | | | | | | | | | |
Net investment income (loss)(a) | | | (0.02 | ) | | | (0.03 | ) | | | (0.04 | ) | | | 0.00 | * | | | (0.06 | ) | | | (0.10 | ) |
Net realized and unrealized gain (loss) | | | (0.83 | ) | | | 0.60 | | | | 1.05 | | | | 1.93 | | | | 0.87 | | | | 0.93 | |
Total from investment operations | | | (0.85 | ) | | | 0.57 | | | | 1.01 | | | | 1.93 | | | | 0.81 | | | | 0.83 | |
Distributions: | | | | | | | | | | | | | | | | | | | | | | | | |
Dividends from net investment income | | | — | | | | — | | | | (0.07 | ) | | | (0.01 | ) | | | — | | | | — | |
Dividends from net realized gains | | | (0.25 | ) | | | (3.10 | ) | | | (0.27 | ) | | | — | | | | — | | | | — | |
Total distributions | | | (0.25 | ) | | | (3.10 | ) | | | (0.34 | ) | | | (0.01 | ) | | | — | | | | — | |
Net asset value, end of period | | | $11.79 | | | | $12.89 | | | | $15.42 | | | | $14.75 | | | | $12.83 | | | | $12.02 | |
Ratios and supplemental data: | | | | | | | | | | | | | | | | | | | | | | | | |
Total return(b) | | | (6.65% | ) | | | 5.03% | | | | 6.97% | | | | 15.07% | | | | 6.74% | | | | 7.42% | |
Net assets, end of period (000) | | | $5,007 | | | | $7,142 | | | | $8,314 | | | | $9,369 | | | | $4,693 | | | | $1,709 | |
Ratio of net expenses to average net assets | | | 1.65% | (c) | | | 1.59% | | | | 1.64% | | | | 1.65% | | | | 1.65% | | | | 1.83% | |
Ratio of gross expenses to average net assets prior to expense reductions | | | 1.76% | (c) | | | 1.59% | | | | 1.64% | | | | 1.69% | | | | 1.78% | | | | 1.91% | |
Ratio of net investment income (loss) to average net assets | | | (0.38% | )(c) | | | (0.25% | ) | | | (0.29% | ) | | | 0.00% | | | | (0.45% | ) | | | (0.85% | ) |
| * | Amount is less than $0.005. |
| (a) | Net investment income (loss) allocated based on average shares method. |
| (b) | Total return measures net investment income (loss) and capital gain or loss from portfolio investments assuming reinvestment of dividends and capital gains distributions. Total return is not annualized for periods that are less than a full year, does not reflect the effect of sales charge for Class A shares nor the contingent deferred sales charge for Class B and C shares and does not reflect the deduction of taxes that a shareholder would pay on fund distributions or the redemption of fund shares. |
Calamos Growth and Income Fund Financial Highlights
Selected data for a share outstanding throughout each period were as follows:
| | | | | | | | | | | | | | | | | | | | | | | | |
| | | CLASS A | |
| | | (Unaudited)
Six Months
Ended
April 30, | | | Year Ended October 31, | |
| | | 2016 | | | 2015 | | | 2014 | | | 2013 | | | 2012 | | | 2011 | |
Net asset value, beginning of period | | | $31.68 | | | | $35.22 | | | | $35.84 | | | | $32.64 | | | | $32.12 | | | | $30.15 | |
Income from investment operations: | | | | | | | | | | | | | | | | | | | | | | | | |
Net investment income (loss)(a) | | | 0.24 | | | | 0.60 | | | | 0.60 | | | | 0.64 | | | | 0.52 | | | | 0.51 | |
Net realized and unrealized gain (loss) | | | (0.61 | ) | | | 0.51 | | | | 2.78 | | | | 3.70 | | | | 0.66 | | | | 1.89 | |
Total from investment operations | | | (0.37 | ) | | | 1.11 | | | | 3.38 | | | | 4.34 | | | | 1.18 | | | | 2.40 | |
Distributions: | | | | | | | | | | | | | | | | | | | | | | | | |
Dividends from net investment income | | | (0.39 | ) | | | (0.89 | ) | | | (0.80 | ) | | | (0.27 | ) | | | (0.66 | ) | | | (0.43 | ) |
Dividends from net realized gains | | | (1.31 | ) | | | (3.76 | ) | | | (3.20 | ) | | | (0.87 | ) | | | — | | | | — | |
Total distributions | | | (1.70 | ) | | | (4.65 | ) | | | (4.00 | ) | | | (1.14 | ) | | | (0.66 | ) | | | (0.43 | ) |
Net asset value, end of period | | | $29.61 | | | | $31.68 | | | | $35.22 | | | | $35.84 | | | | $32.64 | | | | $32.12 | |
Ratios and supplemental data: | | | | | | | | | | | | | | | | | | | | | | | | |
Total return(b) | | | (1.14% | ) | | | 3.50% | | | | 10.33% | | | | 13.72% | | | | 3.73% | | | | 8.04% | |
Net assets, end of period (000) | | | $1,004,773 | | | | $1,105,102 | | | | $1,316,498 | | | | $1,614,236 | | | | $1,974,535 | | | | $2,017,175 | |
Ratio of net expenses to average net assets | | | 1.10% | (c) | | | 1.10% | | | | 1.09% | | | | 1.09% | | | | 1.09% | | | | 1.08% | |
Ratio of gross expenses to average net assets prior to expense reductions | | | 1.10% | (c) | | | 1.10% | | | | 1.09% | | | | 1.09% | | | | 1.09% | | | | 1.08% | |
Ratio of net investment income (loss) to average net assets | | | 1.61% | (c) | | | 1.86% | | | | 1.76% | | | | 1.92% | | | | 1.62% | | | | 1.60% | |
| | |
| | | (Unaudited)
Six Months
Ended
April 30, | | | Year Ended October 31, | |
| | | 2016 | | | 2015 | | | 2014 | | | 2013 | | | 2012 | | | 2011 | |
Portfolio turnover rate | | | 4.6% | | | | 23.8% | | | | 32.8% | | | | 59.5% | | | | 42.8% | | | | 55.1% | |
| (a) | Net investment income (loss) allocated based on average shares method. |
| (b) | Total return measures net investment income (loss) and capital gain or loss from portfolio investments assuming reinvestment of dividends and capital gains distributions. Total return is not annualized for periods that are less than a full year, does not reflect the effect of sales charge for Class A shares nor the contingent deferred sales charge for Class B and C shares and does not reflect the deduction of taxes that a shareholder would pay on fund distributions or the redemption of fund shares. |
| | | | |
| 226 | | CALAMOS OPEN-END FAMILY OF FUNDS SEMIANNUAL REPORT | | |
Calamos Growth and Income Fund Financial Highlights
| | | | | | | | | | | | | | | | | | | | | | | | |
| | | CLASS B | |
| | | (Unaudited)
Six Months
Ended
April 30, | | | Year Ended October 31, | |
| | | 2016 | | | 2015 | | | 2014 | | | 2013 | | | 2012 | | | 2011 | |
Net asset value, beginning of period | | | $37.76 | | | | $41.04 | | | | $41.04 | | | | $37.26 | | | | $36.47 | | | | $34.22 | |
Income from investment operations: | | | | | | | | | | | | | | | | | | | | | | | | |
Net investment income (loss)(a) | | | 0.16 | | | | 0.42 | | | | 0.54 | | | | 0.70 | | | | 0.36 | | | | 0.32 | |
Net realized and unrealized gain (loss) | | | (0.75 | ) | | | 0.61 | | | | 3.21 | | | | 4.23 | | | | 0.77 | | | | 2.14 | |
Total from investment operations | | | (0.59 | ) | | | 1.03 | | | | 3.75 | | | | 4.93 | | | | 1.13 | | | | 2.46 | |
Distributions: | | | | | | | | | | | | | | | | | | | | | | | | |
Dividends from net investment income | | | (0.22 | ) | | | (0.55 | ) | | | (0.55 | ) | | | (0.28 | ) | | | (0.34 | ) | | | (0.21 | ) |
Dividends from net realized gains | | | (1.31 | ) | | | (3.76 | ) | | | (3.20 | ) | | | (0.87 | ) | | | — | | | | — | |
Total distributions | | | (1.53 | ) | | | (4.31 | ) | | | (3.75 | ) | | | (1.15 | ) | | | (0.34 | ) | | | (0.21 | ) |
Net asset value, end of period | | | $35.64 | �� | | | $37.76 | | | | $41.04 | | | | $41.04 | | | | $37.26 | | | | $36.47 | |
Ratios and supplemental data: | | | | | | | | | | | | | | | | | | | | | | | | |
Total return(b) | | | (1.55% | ) | | | 2.72% | | | | 9.88% | | | | 13.59% | | | | 3.12% | | | | 7.21% | |
Net assets, end of period (000) | | | $5,618 | | | | $9,647 | | | | $19,972 | | | | $49,769 | | | | $92,658 | | | | $184,989 | |
Ratio of net expenses to average net assets | | | 1.86% | (c) | | | 1.85% | | | | 1.44% | | | | 1.18% | | | | 1.73% | | | | 1.82% | |
Ratio of gross expenses to average net assets prior to expense reductions | | | 1.86% | (c) | | | 1.85% | | | | 1.44% | | | | 1.18% | | | | 1.73% | | | | 1.82% | |
Ratio of net investment income (loss) to average net assets | | | 0.89% | (c) | | | 1.09% | | | | 1.37% | | | | 1.85% | | | | 0.97% | | | | 0.88% | |
| |
| | | CLASS C | |
| | | (Unaudited)
Six Months
Ended
April 30, | | | Year Ended October 31, | |
| | | 2016 | | | 2015 | | | 2014 | | | 2013 | | | 2012 | | | 2011 | |
Net asset value, beginning of period | | | $31.81 | | | | $35.34 | | | | $35.78 | | | | $32.76 | | | | $32.23 | | | | $30.30 | |
Income from investment operations: | | | | | | | | | | | | | | | | | | | | | | | | |
Net investment income (loss)(a) | | | 0.13 | | | | 0.36 | | | | 0.35 | | | | 0.39 | | | | 0.28 | | | | 0.27 | |
Net realized and unrealized gain (loss) | | | (0.63 | ) | | | 0.51 | | | | 2.77 | | | | 3.71 | | | | 0.67 | | | | 1.91 | |
Total from investment operations | | | (0.50 | ) | | | 0.87 | | | | 3.12 | | | | 4.10 | | | | 0.95 | | | | 2.18 | |
Distributions: | | | | | | | | | | | | | | | | | | | | | | | | |
Dividends from net investment income | | | (0.28 | ) | | | (0.64 | ) | | | (0.36 | ) | | | (0.21 | ) | | | (0.42 | ) | | | (0.25 | ) |
Dividends from net realized gains | | | (1.31 | ) | | | (3.76 | ) | | | (3.20 | ) | | | (0.87 | ) | | | — | | | | — | |
Total distributions | | | (1.59 | ) | | | (4.40 | ) | | | (3.56 | ) | | | (1.08 | ) | | | (0.42 | ) | | | (0.25 | ) |
Net asset value, end of period | | | $29.72 | | | | $31.81 | | | | $35.34 | | | | $35.78 | | | | $32.76 | | | | $32.23 | |
Ratios and supplemental data: | | | | | | | | | | | | | | | | | | | | | | | | |
Total return(b) | | | (1.57% | ) | | | 2.73% | | | | 9.48% | | | | 12.88% | | | | 2.97% | | | | 7.23% | |
Net assets, end of period (000) | | | $808,045 | | | | $889,516 | | | | $1,009,029 | | | | $1,093,074 | | | | $1,255,629 | | | | $1,344,781 | |
Ratio of net expenses to average net assets | | | 1.85% | (c) | | | 1.85% | | | | 1.84% | | | | 1.84% | | | | 1.84% | | | | 1.83% | |
Ratio of gross expenses to average net assets prior to expense reductions | | | 1.85% | (c) | | | 1.85% | | | | 1.84% | | | | 1.84% | | | | 1.84% | | | | 1.83% | |
Ratio of net investment income (loss) to average net assets | | | 0.86% | (c) | | | 1.11% | | | | 1.02% | | | | 1.17% | | | | 0.87% | | | | 0.86% | |
| (a) | Net investment income allocated based on average shares method. |
| (b) | Total return measures net investment income (loss) and capital gain or loss from portfolio investments assuming reinvestment of dividends and capital gains distributions. Total return is not annualized for periods that are less than a full year, does not reflect the effect of sales charge for Class A shares nor the contingent deferred sales charge for Class B and C shares and does not reflect the deduction of taxes that a shareholder would pay on fund distributions or the redemption of fund shares. |
Calamos Growth and Income Fund Financial Highlights
| | | | | | | | | | | | | | | | | | | | | | | | |
| | | CLASS I | |
| | | (Unaudited)
Six Months
Ended
April 30, | | | Year Ended October 31, | |
| | | 2016 | | | 2015 | | | 2014 | | | 2013 | | | 2012 | | | 2011 | |
Net asset value, beginning of period | | | $30.71 | | | | $34.28 | | | | $35.07 | | | | $31.91 | | | | $31.41 | | | | $29.48 | |
Income from investment operations: | | | | | | | | | | | | | | | | | | | | | | | | |
Net investment income (loss)(a) | | | 0.26 | | | | 0.66 | | | | 0.68 | | | | 0.71 | | | | 0.59 | | | | 0.58 | |
Net realized and unrealized gain (loss) | | | (0.59 | ) | | | 0.50 | | | | 2.69 | | | | 3.62 | | | | 0.65 | | | | 1.84 | |
Total from investment operations | | | (0.33 | ) | | | 1.16 | | | | 3.37 | | | | 4.33 | | | | 1.24 | | | | 2.42 | |
Distributions: | | | | | | | | | | | | | | | | | | | | | | | | |
Dividends from net investment income | | | (0.43 | ) | | | (0.97 | ) | | | (0.96 | ) | | | (0.30 | ) | | | (0.74 | ) | | | (0.49 | ) |
Dividends from net realized gains | | | (1.31 | ) | | | (3.76 | ) | | | (3.20 | ) | | | (0.87 | ) | | | — | | | | — | |
Total distributions | | | (1.74 | ) | | | (4.73 | ) | | | (4.16 | ) | | | (1.17 | ) | | | (0.74 | ) | | | (0.49 | ) |
Net asset value, end of period | | | $28.64 | | | | $30.71 | | | | $34.28 | | | | $35.07 | | | | $31.91 | | | | $31.41 | |
Ratios and supplemental data: | | | | | | | | | | | | | | | | | | | | | | | | |
Total return(b) | | | (1.05% | ) | | | 3.79% | | | | 10.60% | | | | 13.99% | | | | 4.01% | | | | 8.31% | |
Net assets, end of period (000) | | | $528,261 | | | | $577,449 | | | | $688,258 | | | | $668,124 | | | | $915,394 | | | | $856,632 | |
Ratio of net expenses to average net assets | | | 0.85% | (c) | | | 0.85% | | | | 0.84% | | | | 0.84% | | | | 0.84% | | | | 0.83% | |
Ratio of gross expenses to average net assets prior to expense reductions | | | 0.85% | (c) | | | 0.85% | | | | 0.84% | | | | 0.84% | | | | 0.84% | | | | 0.83% | |
Ratio of net investment income (loss) to average net assets | | | 1.86% | (c) | | | 2.11% | | | | 2.04% | | | | 2.18% | | | | 1.87% | | | | 1.85% | |
| |
| | | CLASS R | |
| | | (Unaudited)
Six Months
Ended
April 30, | | | Year Ended October 31, | |
| | | 2016 | | | 2015 | | | 2014 | | | 2013 | | | 2012 | | | 2011 | |
Net asset value, beginning of period | | | $31.45 | | | | $34.99 | | | | $35.57 | | | | $32.46 | | | | $31.95 | | | | $30.02 | |
Income from investment operations: | | | | | | | | | | | | | | | | | | | | | | | | |
Net investment income (loss)(a) | | | 0.20 | | | | 0.51 | | | | 0.51 | | | | 0.55 | | | | 0.44 | | | | 0.43 | |
Net realized and unrealized gain (loss) | | | (0.60 | ) | | | 0.52 | | | | 2.75 | | | | 3.69 | | | | 0.66 | | | | 1.88 | |
Total from investment operations | | | (0.40 | ) | | | 1.03 | | | | 3.26 | | | | 4.24 | | | | 1.10 | | | | 2.31 | |
Distributions: | | | | | | | | | | | | | | | | | | | | | | | | |
Dividends from net investment income | | | (0.35 | ) | | | (0.81 | ) | | | (0.64 | ) | | | (0.26 | ) | | | (0.59 | ) | | | (0.38 | ) |
Dividends from net realized gains | | | (1.31 | ) | | | (3.76 | ) | | | (3.20 | ) | | | (0.87 | ) | | | — | | | | — | |
Total distributions | | | (1.66 | ) | | | (4.57 | ) | | | (3.84 | ) | | | (1.13 | ) | | | (0.59 | ) | | | (0.38 | ) |
Net asset value, end of period | | | $29.39 | | | | $31.45 | | | | $34.99 | | | | $35.57 | | | | $32.46 | | | | $31.95 | |
Ratios and supplemental data: | | | | | | | | | | | | | | | | | | | | | | | | |
Total return(b) | | | (1.24% | ) | | | 3.26% | | | | 10.04% | | | | 13.44% | | | | 3.49% | | | | 7.75% | |
Net assets, end of period (000) | | | $13,644 | | | | $15,307 | | | | $18,547 | | | | $22,181 | | | | $22,265 | | | | $15,486 | |
Ratio of net expenses to average net assets | | | 1.35% | (c) | | | 1.35% | | | | 1.34% | | | | 1.34% | | | | 1.34% | | | | 1.33% | |
Ratio of gross expenses to average net assets prior to expense reductions | | | 1.35% | (c) | | | 1.35% | | | | 1.34% | | | | 1.34% | | | | 1.34% | | | | 1.33% | |
Ratio of net investment income (loss) to average net assets | | | 1.36% | (c) | | | 1.61% | | | | 1.52% | | | | 1.66% | | | | 1.37% | | | | 1.34% | |
| (a) | Net investment income (loss) allocated based on average shares method. |
| (b) | Total return measures net investment income (loss) and capital gain or loss from portfolio investments assuming reinvestment of dividends and capital gains distributions. Total return is not annualized for periods that are less than a full year, does not reflect the effect of sales charge for Class A shares nor the contingent deferred sales charge for Class B and C shares and does not reflect the deduction of taxes that a shareholder would pay on fund distributions or the redemption of fund shares. |
| | | | |
| 228 | | CALAMOS OPEN-END FAMILY OF FUNDS SEMIANNUAL REPORT | | |
Calamos Global Growth and Income Fund Financial Highlights
Selected data for a share outstanding throughout each period were as follows:
| | | | | | | | | | | | | | | | | | | | | | | | |
| | | CLASS A | |
| | | (Unaudited)
Six Months
Ended
April 30, | | | Year Ended October 31, | |
| | | 2016 | | | 2015 | | | 2014 | | | 2013 | | | 2012 | | | 2011 | |
Net asset value, beginning of period | | | $8.63 | | | | $10.22 | | | | $11.78 | | | | $10.88 | | | | $10.77 | | | | $10.16 | |
Income from investment operations: | | | | | | | | | | | | | | | | | | | | | | | | |
Net investment income (loss)(a) | | | 0.04 | | | | 0.10 | | | | 0.11 | | | | 0.10 | | | | 0.11 | | | | 0.11 | |
Net realized and unrealized gain (loss) | | | (0.31 | ) | | | 0.06 | | | | 0.36 | | | | 1.13 | | | | 0.21 | | | | 0.50 | |
Total from investment operations | | | (0.27 | ) | | | 0.16 | | | | 0.47 | | | | 1.23 | | | | 0.32 | | | | 0.61 | |
Distributions: | | | | | | | | | | | | | | | | | | | | | | | | |
Dividends from net investment income | | | — | | | | (0.04 | ) | | | (0.29 | ) | | | (0.09 | ) | | | (0.21 | ) | | | — | |
Dividends from net realized gains | | | (0.11 | ) | | | (1.71 | ) | | | (1.74 | ) | | | (0.24 | ) | | | — | | | | — | |
Total distributions | | | (0.11 | ) | | | (1.75 | ) | | | (2.03 | ) | | | (0.33 | ) | | | (0.21 | ) | | | — | |
Net asset value, end of period | | | $8.25 | | | | $8.63 | | | | $10.22 | | | | $11.78 | | | | $10.88 | | | | $10.77 | |
Ratios and supplemental data: | | | | | | | | | | | | | | | | | | | | | | | | |
Total return(b) | | | (3.17% | ) | | | 2.02% | | | | 4.77% | | | | 11.60% | | | | 3.03% | | | | 6.00% | |
Net assets, end of period (000) | | | $97,583 | | | | $111,615 | | | | $146,431 | | | | $210,537 | | | | $304,914 | | | | $373,595 | |
Ratio of net expenses to average net assets | | | 1.48% | (c) | | | 1.49% | | | | 1.44% | | | | 1.41% | | | | 1.32% | | | | 1.32% | |
Ratio of gross expenses to average net assets prior to expense reductions | | | 1.48% | (c) | | | 1.49% | | | | 1.44% | | | | 1.41% | | | | 1.32% | | | | 1.32% | |
Ratio of net investment income (loss) to average net assets | | | 1.05% | (c) | | | 1.18% | | | | 1.01% | | | | 0.92% | | | | 1.06% | | | | 1.01% | |
| | |
| | | (Unaudited)
Six Months
Ended
April 30, | | | Year Ended October 31, | |
| | | 2016 | | | 2015 | | | 2014 | | | 2013 | | | 2012 | | | 2011 | |
Portfolio turnover rate | | | 33.4% | | | | 54.7% | | | | 72.6% | | | | 48.2% | | | | 55.1% | | | | 73.1% | |
| (a) | Net investment income (loss) allocated based on average shares method. |
| (b) | Total return measures net investment income (loss) and capital gain or loss from portfolio investments assuming reinvestment of dividends and capital gains distributions. Total return is not annualized for periods that are less than a full year, does not reflect the effect of sales charge for Class A shares nor the contingent deferred sales charge for Class B and C shares and does not reflect the deduction of taxes that a shareholder would pay on fund distributions or the redemption of fund shares. |
Calamos Global Growth and Income Fund Financial Highlights
| | | | | | | | | | | | | | | | | | | | | | | | |
| | | CLASS B | |
| | | (Unaudited)
Six Months
Ended
April 30, | | | Year Ended October 31, | |
| | | 2016 | | | 2015 | | | 2014 | | | 2013 | | | 2012 | | | 2011 | |
Net asset value, beginning of period | | | $8.75 | | | | $10.37 | | | | $11.86 | | | | $10.97 | | | | $10.85 | | | | $10.32 | |
Income from investment operations: | | | | | | | | | | | | | | | | | | | | | | | | |
Net investment income (loss)(a) | | | 0.01 | | | | 0.04 | | | | 0.02 | | | | 0.02 | | | | 0.03 | | | | 0.03 | |
Net realized and unrealized gain (loss) | | | (0.31 | ) | | | 0.05 | | | | 0.38 | | | | 1.14 | | | | 0.21 | | | | 0.50 | |
Total from investment operations | | | (0.30 | ) | | | 0.09 | | | | 0.40 | | | | 1.16 | | | | 0.24 | | | | 0.53 | |
Distributions: | | | | | | | | | | | | | | | | | | | | | | | | |
Dividends from net investment income | | | — | | | | — | | | | (0.15 | ) | | | (0.03 | ) | | | (0.12 | ) | | | — | |
Dividends from net realized gains | | | (0.11 | ) | | | (1.71 | ) | | | (1.74 | ) | | | (0.24 | ) | | | — | | | | — | |
Total distributions | | | (0.11 | ) | | | (1.71 | ) | | | (1.89 | ) | | | (0.27 | ) | | | (0.12 | ) | | | — | |
Net asset value, end of period | | | $8.34 | | | | $8.75 | | | | $10.37 | | | | $11.86 | | | | $10.97 | | | | $10.85 | |
Ratios and supplemental data: | | | | | | | | | | | | | | | | | | | | | | | | |
Total return(b) | | | (3.48% | ) | | | 1.18% | | | | 4.04% | | | | 10.77% | | | | 2.25% | | | | 5.14% | |
Net assets, end of period (000) | | | $972 | | | | $2,096 | | | | $4,937 | | | | $10,884 | | | | $16,654 | | | | $30,770 | |
Ratio of net expenses to average net assets | | | 2.23% | (c) | | | 2.23% | | | | 2.19% | | | | 2.16% | | | | 2.07% | | | | 2.07% | |
Ratio of gross expenses to average net assets prior to expense reductions | | | 2.23% | (c) | | | 2.23% | | | | 2.19% | | | | 2.16% | | | | 2.07% | | | | 2.07% | |
Ratio of net investment income (loss) to average net assets | | | 0.22% | (c) | | | 0.42% | | | | 0.22% | | | | 0.17% | | | | 0.30% | | | | 0.26% | |
| |
| | | CLASS C | |
| | | (Unaudited)
Six Months
Ended
April 30, | | | Year Ended October 31, | |
| | | 2016 | | | 2015 | | | 2014 | | | 2013 | | | 2012 | | | 2011 | |
Net asset value, beginning of period | | | $7.87 | | | | $9.50 | | | | $11.06 | | | | $10.25 | | | | $10.15 | | | | $9.65 | |
Income from investment operations: | | | | | | | | | | | | | | | | | | | | | | | | |
Net investment income (loss)(a) | | | 0.01 | | | | 0.03 | | | | 0.03 | | | | 0.02 | | | | 0.03 | | | | 0.03 | |
Net realized and unrealized gain (loss) | | | (0.28 | ) | | | 0.05 | | | | 0.33 | | | | 1.06 | | | | 0.20 | | | | 0.47 | |
Total from investment operations | | | (0.27 | ) | | | 0.08 | | | | 0.36 | | | | 1.08 | | | | 0.23 | | | | 0.50 | |
Distributions: | | | | | | | | | | | | | | | | | | | | | | | | |
Dividends from net investment income | | | — | | | | — | | | | (0.18 | ) | | | (0.03 | ) | | | (0.13 | ) | | | — | |
Dividends from net realized gains | | | (0.11 | ) | | | (1.71 | ) | | | (1.74 | ) | | | (0.24 | ) | | | — | | | | — | |
Total distributions | | | (0.11 | ) | | | (1.71 | ) | | | (1.92 | ) | | | (0.27 | ) | | | (0.13 | ) | | | — | |
Net asset value, end of period | | | $7.49 | | | | $7.87 | | | | $9.50 | | | | $11.06 | | | | $10.25 | | | | $10.15 | |
Ratios and supplemental data: | | | | | | | | | | | | | | | | | | | | | | | | |
Total return(b) | | | (3.48% | ) | | | 1.19% | | | | 3.98% | | | | 10.82% | | | | 2.29% | | | | 5.18% | |
Net assets, end of period (000) | | | $103,684 | | | | $119,620 | | | | $151,091 | | | | $185,577 | | | | $235,194 | | | | $282,801 | |
Ratio of net expenses to average net assets | | | 2.23% | (c) | | | 2.24% | | | | 2.19% | | | | 2.16% | | | | 2.07% | | | | 2.07% | |
Ratio of gross expenses to average net assets prior to expense reductions | | | 2.23% | (c) | | | 2.24% | | | | 2.19% | | | | 2.16% | | | | 2.07% | | | | 2.07% | |
Ratio of net investment income (loss) to average net assets | | | 0.30% | (c) | | | 0.43% | | | | 0.27% | | | | 0.17% | | | | 0.31% | | | | 0.26% | |
| (a) | Net investment income (loss) allocated based on average shares method. |
| (b) | Total return measures net investment income (loss) and capital gain or loss from portfolio investments assuming reinvestment of dividends and capital gains distributions. Total return is not annualized for periods that are less than a full year, does not reflect the effect of sales charge for Class A shares nor the contingent deferred sales charge for Class B and C shares and does not reflect the deduction of taxes that a shareholder would pay on fund distributions or the redemption of fund shares. |
| | | | |
| 230 | | CALAMOS OPEN-END FAMILY OF FUNDS SEMIANNUAL REPORT | | |
Calamos Global Growth and Income Fund Financial Highlights
| | | | | | | | | | | | | | | | | | | | | | | | |
| | | CLASS I | |
| | | (Unaudited)
Six Months
Ended
April 30, | | | Year Ended October 31, | |
| | | 2016 | | | 2015 | | | 2014 | | | 2013 | | | 2012 | | | 2011 | |
Net asset value, beginning of period | | | $8.84 | | | | $10.43 | | | | $11.99 | | | | $11.06 | | | | $10.96 | | | | $10.32 | |
Income from investment operations: | | | | | | | | | | | | | | | | | | | | | | | | |
Net investment income (loss)(a) | | | 0.05 | | | | 0.13 | | | | 0.14 | | | | 0.13 | | | | 0.14 | | | | 0.14 | |
Net realized and unrealized gain (loss) | | | (0.31 | ) | | | 0.05 | | | | 0.36 | | | | 1.15 | | | | 0.22 | | | | 0.50 | |
Total from investment operations | | | (0.26 | ) | | | 0.18 | | | | 0.50 | | | | 1.28 | | | | 0.36 | | | | 0.64 | |
Distributions: | | | | | | | | | | | | | | | | | | | | | | | | |
Dividends from net investment income | | | — | | | | (0.06 | ) | | | (0.32 | ) | | | (0.11 | ) | | | (0.26 | ) | | | — | |
Dividends from net realized gains | | | (0.11 | ) | | | (1.71 | ) | | | (1.74 | ) | | | (0.24 | ) | | | — | | | | — | |
Total distributions | | | (0.11 | ) | | | (1.77 | ) | | | (2.06 | ) | | | (0.35 | ) | | | (0.26 | ) | | | — | |
Net asset value, end of period | | | $8.47 | | | | $8.84 | | | | $10.43 | | | | $11.99 | | | | $11.06 | | | | $10.96 | |
Ratios and supplemental data: | | | | | | | | | | | | | | | | | | | | | | | | |
Total return(b) | | | (2.99% | ) | | | 2.23% | | | | 4.99% | | | | 11.90% | | | | 3.32% | | | | 6.20% | |
Net assets, end of period (000) | | | $131,910 | | | | $146,241 | | | | $182,064 | | | | $232,583 | | | | $986,986 | �� | | | $978,511 | |
Ratio of net expenses to average net assets | | | 1.23% | (c) | | | 1.24% | | | | 1.19% | | | | 1.14% | | | | 1.07% | | | | 1.07% | |
Ratio of gross expenses to average net assets prior to expense reductions | | | 1.23% | (c) | | | 1.24% | | | | 1.19% | | | | 1.14% | | | | 1.07% | | | | 1.07% | |
Ratio of net investment income (loss) to average net assets | | | 1.31% | (c) | | | 1.43% | | | | 1.29% | | | | 1.16% | | | | 1.31% | | | | 1.25% | |
| |
| | | CLASS R | |
| | | (Unaudited)
Six Months
Ended
April 30, | | | Year Ended October 31, | |
| | | 2016 | | | 2015 | | | 2014 | | | 2013 | | | 2012 | | | 2011 | |
Net asset value, beginning of period | | | $8.53 | | | | $10.13 | | | | $11.67 | | | | $10.79 | | | | $10.67 | | | | $10.09 | |
Income from investment operations: | | | | | | | | | | | | | | | | | | | | | | | | |
Net investment income (loss)(a) | | | 0.03 | | | | 0.08 | | | | 0.08 | | | | 0.07 | | | | 0.08 | | | | 0.08 | |
Net realized and unrealized gain (loss) | | | (0.31 | ) | | | 0.05 | | | | 0.37 | | | | 1.12 | | | | 0.21 | | | | 0.50 | |
Total from investment operations | | | (0.28 | ) | | | 0.13 | | | | 0.45 | | | | 1.19 | | | | 0.29 | | | | 0.58 | |
Distributions: | | | | | | | | | | | | | | | | | | | | | | | | |
Dividends from net investment income | | | — | | | | (0.02 | ) | | | (0.25 | ) | | | (0.07 | ) | | | (0.17 | ) | | | — | |
Dividends from net realized gains | | | (0.11 | ) | | | (1.71 | ) | | | (1.74 | ) | | | (0.24 | ) | | | — | | | | — | |
Total distributions | | | (0.11 | ) | | | (1.73 | ) | | | (1.99 | ) | | | (0.31 | ) | | | (0.17 | ) | | | — | |
Net asset value, end of period | | | $8.14 | | | | $8.53 | | | | $10.13 | | | | $11.67 | | | | $10.79 | | | | $10.67 | |
Ratios and supplemental data: | | | | | | | | | | | | | | | | | | | | | | | | |
Total return(b) | | | (3.33% | ) | | | 1.74% | | | | 4.62% | | | | 11.27% | | | | 2.77% | | | | 5.75% | |
Net assets, end of period (000) | | | $1,071 | | | | $1,292 | | | | $1,741 | | | | $1,674 | | | | $3,045 | | | | $1,567 | |
Ratio of net expenses to average net assets | | | 1.73% | (c) | | | 1.73% | | | | 1.69% | | | | 1.66% | | | | 1.58% | | | | 1.57% | |
Ratio of gross expenses to average net assets prior to expense reductions | | | 1.73% | (c) | | | 1.73% | | | | 1.69% | | | | 1.66% | | | | 1.58% | | | | 1.57% | |
Ratio of net investment income (loss) to average net assets | | | 0.79% | (c) | | | 0.94% | | | | 0.77% | | | | 0.68% | | | | 0.75% | | | | 0.77% | |
| (a) | Net investment income (loss) allocated based on average shares method. |
| (b) | Total return measures net investment income (loss) and capital gain or loss from portfolio investments assuming reinvestment of dividends and capital gains distributions. Total return is not annualized for periods that are less than a full year, does not reflect the effect of sales charge for Class A shares nor the contingent deferred sales charge for Class B and C shares and does not reflect the deduction of taxes that a shareholder would pay on fund distributions or the redemption of fund shares. |
Calamos Convertible Fund Financial Highlights
Selected data for a share outstanding throughout each period were as follows:
| | | | | | | | | | | | | | | | | | | | | | | | |
| | | CLASS A | |
| | | (Unaudited)
Six Months
Ended
April 30, | | | Year Ended October 31, | |
| | | 2016 | | | 2015 | | | 2014 | | | 2013 | | | 2012 | | | 2011 | |
Net asset value, beginning of period | | | $16.56 | | | | $18.59 | | | | $19.14 | | | | $17.70 | | | | $19.28 | | | | $19.60 | |
Income from investment operations: | | | | | | | | | | | | | | | | | | | | | | | | |
Net investment income (loss)(a) | | | 0.25 | | | | 0.44 | | | | 0.40 | | | | 0.39 | | | | 0.37 | | | | 0.40 | |
Net realized and unrealized gain (loss) | | | (0.80 | ) | | | (1.01 | ) | | | 1.14 | | | | 2.63 | | | | (0.33 | ) | | | 0.14 | |
Total from investment operations | | | (0.55 | ) | | | (0.57 | ) | | | 1.54 | | | | 3.02 | | | | 0.04 | | | | 0.54 | |
Distributions: | | | | | | | | | | | | | | | | | | | | | | | | |
Dividends from net investment income | | | (0.30 | ) | | | (0.58 | ) | | | (0.76 | ) | | | (0.02 | ) | | | (0.14 | ) | | | (0.25 | ) |
Dividends from net realized gains | | | (0.27 | ) | | | (0.88 | ) | | | (1.33 | ) | | | (1.56 | ) | | | (1.48 | ) | | | (0.61 | ) |
Total distributions | | | (0.57 | ) | | | (1.46 | ) | | | (2.09 | ) | | | (1.58 | ) | | | (1.62 | ) | | | (0.86 | ) |
Net asset value, end of period | | | $15.44 | | | | $16.56 | | | | $18.59 | | | | $19.14 | | | | $17.70 | | | | $19.28 | |
Ratios and supplemental data: | | | | | | | | | | | | | | | | | | | | | | | | |
Total return(b) | | | (3.39% | ) | | | (3.31% | ) | | | 8.74% | | | | 18.50% | | | | 0.51% | | | | 2.73% | |
Net assets, end of period (000) | | | $260,291 | | | | $385,844 | | | | $488,842 | | | | $514,593 | | | | $650,100 | | | | $1,269,501 | |
Ratio of net expenses to average net assets | | | 1.16% | (c) | | | 1.13% | | | | 1.10% | | | | 1.11% | | | | 1.10% | | | | 1.07% | |
Ratio of gross expenses to average net assets prior to expense reductions | | | 1.16% | (c) | | | 1.13% | | | | 1.10% | | | | 1.11% | | | | 1.10% | | | | 1.07% | |
Ratio of net investment income (loss) to average net assets | | | 3.27% | (c) | | | 2.53% | | | | 2.18% | | | | 2.18% | | | | 2.07% | | | | 2.03% | |
| | |
| | | (Unaudited)
Six Months
Ended
April 30, | | | Year Ended October 31, | |
| | | 2016 | | | 2015 | | | 2014 | | | 2013 | | | 2012 | | | 2011 | |
Portfolio turnover rate | | | 26.2% | | | | 63.0% | | | | 68.1% | | | | 73.1% | | | | 56.6% | | | | 65.7% | |
| (a) | Net investment income (loss) allocated based on average shares method. |
| (b) | Total return measures net investment income (loss) and capital gain or loss from portfolio investments assuming reinvestment of dividends and capital gains distributions. Total return is not annualized for periods that are less than a full year, does not reflect the effect of sales charge for Class A shares nor the contingent deferred sales charge for Class B and C shares and does not reflect the deduction of taxes that a shareholder would pay on fund distributions or the redemption of fund shares. |
| | | | |
| 232 | | CALAMOS OPEN-END FAMILY OF FUNDS SEMIANNUAL REPORT | | |
Calamos Convertible Fund Financial Highlights
| | | | | | | | | | | | | | | | | | | | | | | | |
| | | CLASS B | |
| | | (Unaudited)
Six Months
Ended
April 30, | | | Year Ended October 31, | |
| | | 2016 | | | 2015 | | | 2014 | | | 2013 | | | 2012 | | | 2011 | |
Net asset value, beginning of period | | | $21.13 | | | | $23.29 | | | | $23.27 | | | | $21.31 | | | | $22.89 | | | | $23.14 | |
Income from investment operations: | | | | | | | | | | | | | | | | | | | | | | | | |
Net investment income (loss)(a) | | | 0.25 | | | | 0.39 | | | | 0.32 | | | | 0.31 | | | | 0.28 | | | | 0.32 | |
Net realized and unrealized gain (loss) | | | (1.03 | ) | | | (1.29 | ) | | | 1.41 | | | | 3.21 | | | | (0.38 | ) | | | 0.15 | |
Total from investment operations | | | (0.78 | ) | | | (0.90 | ) | | | 1.73 | | | | 3.52 | | | | (0.10 | ) | | | 0.47 | |
Distributions: | | | | | | | | | | | | | | | | | | | | | | | | |
Dividends from net investment income | | | (0.21 | ) | | | (0.38 | ) | | | (0.38 | ) | | | — | | | | (0.00 | )** | | | (0.11 | ) |
Dividends from net realized gains | | | (0.27 | ) | | | (0.88 | ) | | | (1.33 | ) | | | (1.56 | ) | | | (1.48 | ) | | | (0.61 | ) |
Total distributions | | | (0.48 | ) | | | (1.26 | ) | | | (1.71 | ) | | | (1.56 | ) | | | (1.48 | ) | | | (0.72 | ) |
Net asset value, end of period | | | $19.87 | | | | $21.13 | | | | $23.29 | | | | $23.27 | | | | $21.31 | | | | $22.89 | |
Ratios and supplemental data: | | | | | | | | | | | | | | | | | | | | | | | | |
Total return(b) | | | (3.71% | ) | | | (4.03% | ) | | | 7.89% | | | | 17.63% | | | | (0.25% | ) | | | 2.01% | |
Net assets, end of period (000) | | | $4,396 | | | | $5,420 | | | | $9,879 | | | | $11,391 | | | | $14,256 | | | | $21,517 | |
Ratio of net expenses to average net assets | | | 1.91% | (c) | | | 1.88% | | | | 1.86% | | | | 1.86% | | | | 1.85% | | | | 1.82% | |
Ratio of gross expenses to average net assets prior to expense reductions | | | 1.91% | (c) | | | 1.88% | | | | 1.86% | | | | 1.86% | | | | 1.85% | | | | 1.82% | |
Ratio of net investment income (loss) to average net assets | | | 2.52% | (c) | | | 1.74% | | | | 1.42% | | | | 1.43% | | | | 1.32% | | | | 1.36% | |
| |
| | | CLASS C | |
| | | (Unaudited)
Six Months
Ended
April 30, | | | Year Ended October 31, | |
| | | 2016 | | | 2015 | | | 2014 | | | 2013 | | | 2012 | | | 2011 | |
Net asset value, beginning of period | | | $16.41 | | | | $18.43 | | | | $18.87 | | | | $17.57 | | | | $19.15 | | | | $19.51 | |
Income from investment operations: | | | | | | | | | | | | | | | | | | | | | | | | |
Net investment income (loss)(a) | | | 0.19 | | | | 0.31 | | | | 0.26 | | | | 0.25 | | | | 0.23 | | | | 0.25 | |
Net realized and unrealized gain (loss) | | | (0.79 | ) | | | (1.00 | ) | | | 1.11 | | | | 2.61 | | | | (0.32 | ) | | | 0.14 | |
Total from investment operations | | | (0.60 | ) | | | (0.69 | ) | | | 1.37 | | | | 2.86 | | | | (0.09 | ) | | | 0.39 | |
Distributions: | | | | | | | | | | | | | | | | | | | | | | | | |
Dividends from net investment income | | | (0.24 | ) | | | (0.45 | ) | | | (0.48 | ) | | | — | | | | (0.01 | ) | | | (0.14 | ) |
Dividends from net realized gains | | | (0.27 | ) | | | (0.88 | ) | | | (1.33 | ) | | | (1.56 | ) | | | (1.48 | ) | | | (0.61 | ) |
Total distributions | | | (0.51 | ) | | | (1.33 | ) | | | (1.81 | ) | | | (1.56 | ) | | | (1.49 | ) | | | (0.75 | ) |
Net asset value, end of period | | | $15.30 | | | | $16.41 | | | | $18.43 | | | | $18.87 | | | | $17.57 | | | | $19.15 | |
Ratios and supplemental data: | | | | | | | | | | | | | | | | | | | | | | | | |
Total return(b) | | | (3.73% | ) | | | (4.01% | ) | | | 7.86% | | | | 17.62% | | | | (0.24% | ) | | | 1.99% | |
Net assets, end of period (000) | | | $218,214 | | | | $265,686 | | | | $319,654 | | | | $325,823 | | | | $390,649 | | | | $584,428 | |
Ratio of net expenses to average net assets | | | 1.91% | (c) | | | 1.88% | | | | 1.86% | | | | 1.86% | | | | 1.85% | | | | 1.82% | |
Ratio of gross expenses to average net assets prior to expense reductions | | | 1.91% | (c) | | | 1.88% | | | | 1.86% | | | | 1.86% | | | | 1.85% | | | | 1.82% | |
Ratio of net investment income (loss) to average net assets | | | 2.52% | (c) | | | 1.78% | | | | 1.43% | | | | 1.43% | | | | 1.32% | | | | 1.26% | |
| ** | Amounts are less than $0.005. |
| (a) | Net investment income (loss) allocated based on average shares method. |
| (b) | Total return measures net investment income (loss) and capital gain or loss from portfolio investments assuming reinvestment of dividends and capital gains distributions. Total return is not annualized for periods that are less than a full year, does not reflect the effect of sales charge for Class A shares nor the contingent deferred sales charge for Class B and C shares and does not reflect the deduction of taxes that a shareholder would pay on fund distributions or the redemption of fund shares. |
Calamos Convertible Fund Financial Highlights
| | | | | | | | | | | | | | | | | | | | | | | | |
| | | CLASS I | |
| | | (Unaudited)
Six Months
Ended
April 30, | | | Year Ended October 31, | |
| | | 2016 | | | 2015 | | | 2014 | | | 2013 | | | 2012 | | | 2011 | |
Net asset value, beginning of period | | | $15.03 | | | | $17.02 | | | | $17.74 | | | | $16.51 | | | | $18.10 | | | | $18.44 | |
Income from investment operations: | | | | | | | | | | | | | | | | | | | | | | | | |
Net investment income (loss)(a) | | | 0.25 | | | | 0.44 | | | | 0.41 | | | | 0.40 | | | | 0.39 | | | | 0.42 | |
Net realized and unrealized gain (loss) | | | (0.72 | ) | | | (0.93 | ) | | | 1.04 | | | | 2.44 | | | | (0.30 | ) | | | 0.14 | |
Total from investment operations | | | (0.47 | ) | | | (0.49 | ) | | | 1.45 | | | | 2.84 | | | | 0.09 | | | | 0.56 | |
Distributions: | | | | | | | | | | | | | | | | | | | | | | | | |
Dividends from net investment income | | | (0.32 | ) | | | (0.62 | ) | | | (0.84 | ) | | | (0.05 | ) | | | (0.20 | ) | | | (0.29 | ) |
Dividends from net realized gains | | | (0.27 | ) | | | (0.88 | ) | | | (1.33 | ) | | | (1.56 | ) | | | (1.48 | ) | | | (0.61 | ) |
Total distributions | | | (0.59 | ) | | | (1.50 | ) | | | (2.17 | ) | | | (1.61 | ) | | | (1.68 | ) | | | (0.90 | ) |
Net asset value, end of period | | | $13.97 | | | | $15.03 | | | | $17.02 | | | | $17.74 | | | | $16.51 | | | | $18.10 | |
Ratios and supplemental data: | | | | | | | | | | | | | | | | | | | | | | | | |
Total return(b) | | | (3.18% | ) | | | (3.11% | ) | | | 8.99% | | | | 18.78% | | | | 0.81% | | | | 3.00% | |
Net assets, end of period (000) | | | $331,109 | | | | $455,702 | | | | $553,594 | | | | $349,512 | | | | $475,526 | | | | $759,415 | |
Ratio of net expenses to average net assets | | | 0.91% | (c) | | | 0.88% | | | | 0.85% | | | | 0.86% | | | | 0.85% | | | | 0.82% | |
Ratio of gross expenses to average net assets prior to expense reductions | | | 0.91% | (c) | | | 0.88% | | | | 0.85% | | | | 0.86% | | | | 0.85% | | | | 0.82% | |
Ratio of net investment income (loss) to average net assets | | | 3.54% | (c) | | | 2.77% | | | | 2.46% | | | | 2.43% | | | | 2.33% | | | | 2.26% | |
| |
| | | CLASS R | |
| | | (Unaudited)
Six Months
Ended
April 30, | | | Year Ended October 31, | |
| | | 2016 | | | 2015 | | | 2014 | | | 2013 | | | 2012 | | | 2011 | |
Net asset value, beginning of period | | | $16.50 | | | | $18.52 | | | | $19.03 | | | | $17.63 | | | | $19.21 | | | | $19.55 | |
Income from investment operations: | | | | | | | | | | | | | | | | | | | | | | | | |
Net investment income (loss)(a) | | | 0.23 | | | | 0.40 | | | | 0.35 | | | | 0.34 | | | | 0.32 | | | | 0.34 | |
Net realized and unrealized gain (loss) | | | (0.79 | ) | | | (1.01 | ) | | | 1.13 | | | | 2.62 | | | | (0.32 | ) | | | 0.14 | |
Total from investment operations | | | (0.56 | ) | | | (0.61 | ) | | | 1.48 | | | | 2.96 | | | | — | | | | 0.48 | |
Distributions: | | | | | | | | | | | | | | | | | | | | | | | | |
Dividends from net investment income | | | (0.28 | ) | | | (0.53 | ) | | | (0.66 | ) | | | (0.00 | )** | | | (0.10 | ) | | | (0.21 | ) |
Dividends from net realized gains | | | (0.27 | ) | | | (0.88 | ) | | | (1.33 | ) | | | (1.56 | ) | | | (1.48 | ) | | | (0.61 | ) |
Total distributions | | | (0.55 | ) | | | (1.41 | ) | | | (1.99 | ) | | | (1.56 | ) | | | (1.58 | ) | | | (0.82 | ) |
Net asset value, end of period | | | $15.39 | | | | $16.50 | | | | $18.52 | | | | $19.03 | | | | $17.63 | | | | $19.21 | |
Ratios and supplemental data: | | | | | | | | | | | | | | | | | | | | | | | | |
Total return(b) | | | (3.45% | ) | | | (3.53% | ) | | | 8.44% | | | | 18.18% | | | | 0.29% | | | | 2.46% | |
Net assets, end of period (000) | | | $1,811 | | | | $2,147 | | | | $2,988 | | | | $3,074 | | | | $3,253 | | | | $4,134 | |
Ratio of net expenses to average net assets | | | 1.41% | (c) | | | 1.38% | | | | 1.36% | | | | 1.36% | | | | 1.35% | | | | 1.32% | |
Ratio of gross expenses to average net assets prior to expense reductions | | | 1.41% | (c) | | | 1.38% | | | | 1.36% | | | | 1.36% | | | | 1.35% | | | | 1.32% | |
Ratio of net investment income (loss) to average net assets | | | 3.02% | (c) | | | 2.26% | | | | 1.92% | | | | 1.93% | | | | 1.82% | | | | 1.72% | |
| ** | Amounts are less than $0.005. |
| (a) | Net investment income (loss) allocated based on average shares method. |
| (b) | Total return measures net investment income (loss) and capital gain or loss from portfolio investments assuming reinvestment of dividends and capital gains distributions. Total return is not annualized for periods that are less than a full year, does not reflect the effect of sales charge for Class A shares nor the contingent deferred sales charge for Class B and C shares and does not reflect the deduction of taxes that a shareholder would pay on fund distributions or the redemption of fund shares. |
| | | | |
| 234 | | CALAMOS OPEN-END FAMILY OF FUNDS SEMIANNUAL REPORT | | |
Calamos Global Convertible Fund Financial Highlights
Selected data for a share outstanding throughout each period were as follows:
| | | | | | | | |
| | | CLASS A | |
| | | (Unaudited)
Six Months
Ended
April 30, | | | December 31, 2014*
through October 31, | |
| | | 2016 | | | 2015 | |
Net asset value, beginning of period | | | $9.93 | | | | $10.00 | |
Income from investment operations: | | | | | | | | |
Net investment income (loss)(a) | | | 0.13 | | | | 0.13 | |
Net realized and unrealized gain (loss) | | | (0.27 | ) | | | (0.13 | ) |
Total from investment operations | | | (0.14 | ) | | | — | |
Distributions: | | | | | | | | |
Dividends from net investment income | | | (0.08 | ) | | | (0.07 | ) |
Dividends from net realized gains | | | — | | | | — | |
Total distributions | | | (0.08 | ) | | | (0.07 | ) |
Net asset value, end of period | | | $9.71 | | | | $9.93 | |
Ratios and supplemental data: | | | | | | | | |
Total return(b) | | | (1.39% | ) | | | —% | |
Net assets, end of period (000) | | | $30,052 | | | | $20,550 | |
Ratio of net expenses to average net assets | | | 1.35% | (c) | | | 1.35% | (c) |
Ratio of gross expenses to average net assets prior to expense reductions | | | 1.49% | (c) | | | 2.30% | (c) |
Ratio of net investment income (loss) to average net assets | | | 2.73% | (c) | | | 1.56% | (c) |
| | |
| | | (Unaudited)
Six Months
Ended
April 30, | | | December 31, 2014*
through October 31, | |
| | | 2016 | | | 2015 | |
Portfolio turnover rate | | | 19.1% | | | | 28.2% | |
| * | Commencement of operations. |
| (a) | Net investment income (loss) allocated based on average shares method. |
| (b) | Total return measures net investment income (loss) and capital gain or loss from portfolio investments assuming reinvestment of dividends and capital gains distributions. Total return is not annualized for periods that are less than a full year, does not reflect the effect of sales charge for Class A shares nor the contingent deferred sales charge for Class B and C shares and does not reflect the deduction of taxes that a shareholder would pay on fund distributions or the redemption of fund shares. |
Calamos Global Convertible Fund Financial Highlights
| | | | | | | | |
| | | CLASS C | |
| | | (Unaudited)
Six Months
Ended
April 30, | | | December 31, 2014*
through October 31, | |
| | | 2016 | | | 2015 | |
Net asset value, beginning of period | | | $9.90 | | | | $10.00 | |
Income from investment operations: | | | | | | | | |
Net investment income (loss)(a) | | | 0.09 | | | | 0.07 | |
Net realized and unrealized gain (loss) | | | (0.28 | ) | | | (0.12 | ) |
Total from investment operations | | | (0.19 | ) | | | (0.05 | ) |
Distributions: | | | | | | | | |
Dividends from net investment income | | | (0.05 | ) | | | (0.05 | ) |
Dividends from net realized gains | | | — | | | | — | |
Total distributions | | | (0.05 | ) | | | (0.05 | ) |
Net asset value, end of period | | | $9.66 | | | | $9.90 | |
Ratios and supplemental data: | | | | | | | | |
Total return(b) | | | (1.87% | ) | | | (0.52% | ) |
Net assets, end of period (000) | | | $2,436 | | | | $1,259 | |
Ratio of net expenses to average net assets | | | 2.10% | (c) | | | 2.10% | (c) |
Ratio of gross expenses to average net assets prior to expense reductions | | | 2.24% | (c) | | | 2.88% | (c) |
Ratio of net investment income (loss) to average net assets | | | 1.98% | (c) | | | 0.84% | (c) |
| |
| | | CLASS I | |
| | | (Unaudited)
Six Months
Ended
April 30, | | | December 31, 2014*
through October 31, | |
| | | 2016 | | | 2015 | |
Net asset value, beginning of period | | | $9.95 | | | | $10.00 | |
Income from investment operations: | | | | | | | | |
Net investment income (loss)(a) | | | 0.14 | | | | 0.15 | |
Net realized and unrealized gain (loss) | | | (0.27 | ) | | | (0.12 | ) |
Total from investment operations | | | (0.13 | ) | | | 0.03 | |
Distributions: | | | | | | | | |
Dividends from net investment income | | | (0.09 | ) | | | (0.08 | ) |
Dividends from net realized gains | | | — | | | | — | |
Total distributions | | | (0.09 | ) | | | (0.08 | ) |
Net asset value, end of period | | | $9.73 | | | | $9.95 | |
Ratios and supplemental data: | | | | | | | | |
Total return(b) | | | (1.28% | ) | | | 0.29% | |
Net assets, end of period (000) | | | $41,992 | | | | $23,054 | |
Ratio of net expenses to average net assets | | | 1.10% | (c) | | | 1.10% | (c) |
Ratio of gross expenses to average net assets prior to expense reductions | | | 1.23% | (c) | | | 1.80% | (c) |
Ratio of net investment income (loss) to average net assets | | | 2.96% | (c) | | | 1.81% | (c) |
| * | Commencement of operations. |
| (a) | Net investment income allocated based on average shares method. |
| (b) | Total return measures net investment income (loss) and capital gain or loss from portfolio investments assuming reinvestment of dividends and capital gains distributions. Total return is not annualized for periods that are less than a full year, does not reflect the effect of sales charge for Class A shares nor the contingent deferred sales charge for Class B and C shares and does not reflect the deduction of taxes that a shareholder would pay on fund distributions or the redemption of fund shares. |
| | | | |
| 236 | | CALAMOS OPEN-END FAMILY OF FUNDS SEMIANNUAL REPORT | | |
Calamos Global Convertible Fund Financial Highlights
| | | | | | | | |
| | | CLASS R | |
| | | (Unaudited)
Six Months
Ended
April 30, | | | December 31, 2014*
through October 31, | |
| | | 2016 | | | 2015 | |
Net asset value, beginning of period | | | $9.92 | | | | $10.00 | |
Income from investment operations: | | | | | | | | |
Net investment income (loss)(a) | | | 0.11 | | | | 0.11 | |
Net realized and unrealized gain (loss) | | | (0.26 | ) | | | (0.13 | ) |
Total from investment operations | | | (0.15 | ) | | | (0.02 | ) |
Distributions: | | | | | | | | |
Dividends from net investment income | | | (0.07 | ) | | | (0.06 | ) |
Dividends from net realized gains | | | — | | | | — | |
Total distributions | | | (0.07 | ) | | | (0.06 | ) |
Net asset value, end of period | | | $9.70 | | | | $9.92 | |
Ratios and supplemental data: | | | | | | | | |
Total return(b) | | | (1.52% | ) | | | (0.20% | ) |
Net assets, end of period (000) | | | $176 | | | | $190 | |
Ratio of net expenses to average net assets | | | 1.60% | (c) | | | 1.60% | (c) |
Ratio of gross expenses to average net assets prior to expense reductions | | | 1.73% | (c) | | | 2.93% | (c) |
Ratio of net investment income (loss) to average net assets | | | 2.38% | (c) | | | 1.35% | (c) |
| * | Commencement of operations. |
| (a) | Net investment income allocated based on average shares method. |
| (b) | Total return measures net investment income (loss) and capital gain or loss from portfolio investments assuming reinvestment of dividends and capital gains distributions. Total return is not annualized for periods that are less than a full year, does not reflect the effect of sales charge for Class A shares nor the contingent deferred sales charge for Class B and C shares and does not reflect the deduction of taxes that a shareholder would pay on fund distributions or the redemption of fund shares. |
Calamos Total Return Bond Fund Financial Highlights
Selected data for a share outstanding throughout each period were as follows:
| | | | | | | | | | | | | | | | | | | | | | | | |
| | | CLASS A | |
| | | (Unaudited)
Six Months
Ended
April 30, | | | Year Ended October 31, | |
| | | 2016 | | | 2015 | | | 2014 | | | 2013 | | | 2012 | | | 2011 | |
Net asset value, beginning of period | | | $10.51 | | | | $10.70 | | | | $10.89 | | | | $11.15 | | | | $11.14 | | | | $11.23 | |
Income from investment operations: | | | | | | | | | | | | | | | | | | | | | | | | |
Net investment income (loss)(a) | | | 0.12 | | | | 0.26 | | | | 0.26 | | | | 0.22 | | | | 0.22 | | | | 0.26 | |
Net realized and unrealized gain (loss) | | | 0.15 | | | | (0.05 | ) | | | 0.12 | | | | (0.17 | ) | | | 0.15 | | | | 0.02 | |
Total from investment operations | | | 0.27 | | | | 0.21 | | | | 0.38 | | | | 0.05 | | | | 0.37 | | | | 0.28 | |
Distributions: | | | | | | | | | | | | | | | | | | | | | | | | |
Dividends from net investment income | | | (0.16 | ) | | | (0.28 | ) | | | (0.53 | ) | | | (0.26 | ) | | | (0.32 | ) | | | (0.28 | ) |
Dividends from net realized gains | | | (0.13 | ) | | | (0.12 | ) | | | (0.04 | ) | | | (0.05 | ) | | | (0.04 | ) | | | (0.09 | ) |
Total distributions | | | (0.29 | ) | | | (0.40 | ) | | | (0.57 | ) | | | (0.31 | ) | | | (0.36 | ) | | | (0.37 | ) |
Net asset value, end of period | | | $10.49 | | | | $10.51 | | | | $10.70 | | | | $10.89 | | | | $11.15 | | | | $11.14 | |
Ratios and supplemental data: | | | | | | | | | | | | | | | | | | | | | | | | |
Total return(b) | | | 2.73% | | | | 2.04% | | | | 3.71% | | | | 0.48% | | | | 3.35% | | | | 2.64% | |
Net assets, end of period (000) | | | $60,895 | | | | $51,462 | | | | $67,287 | | | | $93,691 | | | | $137,672 | | | | $115,090 | |
Ratio of net expenses to average net assets | | | 0.90% | (c) | | | 0.90% | | | | 0.90% | | | | 0.90% | | | | 0.90% | | | | 0.90% | |
Ratio of gross expenses to average net assets prior to expense reductions | | | 1.09% | (c) | | | 1.13% | | | | 1.05% | | | | 0.99% | | | | 0.98% | | | | 0.97% | |
Ratio of net investment income (loss) to average net assets | | | 2.36% | (c) | | | 2.49% | | | | 2.47% | | | | 1.97% | | | | 1.98% | | | | 2.37% | |
| | |
| | | (Unaudited)
Six Months
Ended
April 30, | | | Year Ended October 31, | |
| | | 2016 | | | 2015 | | | 2014 | | | 2013 | | | 2012 | | | 2011 | |
Portfolio turnover rate | | | 21.1% | | | | 80.0% | | | | 35.3% | | | | 32.5% | | | | 34.4% | | | | 41.5% | |
| (a) | Net investment income (loss) allocated based on average shares method. |
| (b) | Total return measures net investment income (loss) and capital gain or loss from portfolio investments assuming reinvestment of dividends and capital gains distributions. Total return is not annualized for periods that are less than a full year, does not reflect the effect of sales charge for Class A shares nor the contingent deferred sales charge for Class B and C shares and does not reflect the deduction of taxes that a shareholder would pay on fund distributions or the redemption of fund shares. |
| | | | |
| 238 | | CALAMOS��OPEN-END FAMILY OF FUNDS SEMIANNUAL REPORT | | |
Calamos Total Return Bond Fund Financial Highlights
| | | | | | | | | | | | | | | | | | | | | | | | |
| | | CLASS B | |
| | | (Unaudited)
Six Months
Ended
April 30, | | | Year Ended October 31, | |
| | | 2016 | | | 2015 | | | 2014 | | | 2013 | | | 2012 | | | 2011 | |
Net asset value, beginning of period | | | $10.51 | | | | $10.70 | | | | $10.89 | | | | $11.15 | | | | $11.14 | | | | $11.23 | |
Income from investment operations: | | | | | | | | | | | | | | | | | | | | | | | | |
Net investment income (loss)(a) | | | 0.08 | | | | 0.19 | | | | 0.18 | | | | 0.13 | | | | 0.14 | | | | 0.19 | |
Net realized and unrealized gain (loss) | | | 0.15 | | | | (0.06 | ) | | | 0.12 | | | | (0.16 | ) | | | 0.14 | | | | 0.01 | |
Total from investment operations | | | 0.23 | | | | 0.13 | | | | 0.30 | | | | (0.03 | ) | | | 0.28 | | | | 0.20 | |
Distributions: | | | | | | | | | | | | | | | | | | | | | | | | |
Dividends from net investment income | | | (0.13 | ) | | | (0.20 | ) | | | (0.45 | ) | | | (0.18 | ) | | | (0.23 | ) | | | (0.20 | ) |
Dividends from net realized gains | | | (0.13 | ) | | | (0.12 | ) | | | (0.04 | ) | | | (0.05 | ) | | | (0.04 | ) | | | (0.09 | ) |
Total distributions | | | (0.26 | ) | | | (0.32 | ) | | | (0.49 | ) | | | (0.23 | ) | | | (0.27 | ) | | | (0.29 | ) |
Net asset value, end of period | | | $10.48 | | | | $10.51 | | | | $10.70 | | | | $10.89 | | | | $11.15 | | | | $11.14 | |
Ratios and supplemental data: | | | | | | | | | | | | | | | | | | | | | | | | |
Total return(b) | | | 2.26% | | | | 1.29% | | | | 2.94% | | | | (0.27% | ) | | | 2.59% | | | | 1.88% | |
Net assets, end of period (000) | | | $823 | | | | $1,031 | | | | $1,879 | | | | $5,319 | | | | $9,108 | | | | $14,193 | |
Ratio of net expenses to average net assets | | | 1.65% | (c) | | | 1.65% | | | | 1.65% | | | | 1.65% | | | | 1.65% | | | | 1.65% | |
Ratio of gross expenses to average net assets prior to expense reductions | | | 1.84% | (c) | | | 1.88% | | | | 1.80% | | | | 1.74% | | | | 1.73% | | | | 1.72% | |
Ratio of net investment income (loss) to average net assets | | | 1.62% | (c) | | | 1.76% | | | | 1.72% | | | | 1.22% | | | | 1.25% | | | | 1.67% | |
| |
| | | CLASS C | |
| | | (Unaudited)
Six Months
Ended
April 30, | | | Year Ended October 31, | |
| | | 2016 | | | 2015 | | | 2014 | | | 2013 | | | 2012 | | | 2011 | |
Net asset value, beginning of period | | | $10.51 | | | | $10.70 | | | | $10.89 | | | | $11.15 | | | | $11.13 | | | | $11.22 | |
Income from investment operations: | | | | | | | | | | | | | | | | | | | | | | | | |
Net investment income (loss)(a) | | | 0.08 | | | | 0.18 | | | | 0.18 | | | | 0.13 | | | | 0.14 | | | | 0.18 | |
Net realized and unrealized gain (loss) | | | 0.15 | | | | (0.05 | ) | | | 0.12 | | | | (0.16 | ) | | | 0.15 | | | | 0.02 | |
Total from investment operations | | | 0.23 | | | | 0.13 | | | | 0.30 | | | | (0.03 | ) | | | 0.29 | | | | 0.20 | |
Distributions: | | | | | | | | | | | | | | | | | | | | | | | | |
Dividends from net investment income | | | (0.13 | ) | | | (0.20 | ) | | | (0.45 | ) | | | (0.18 | ) | | | (0.23 | ) | | | (0.20 | ) |
Dividends from net realized gains | | | (0.13 | ) | | | (0.12 | ) | | | (0.04 | ) | | | (0.05 | ) | | | (0.04 | ) | | | (0.09 | ) |
Total distributions | | | (0.26 | ) | | | (0.32 | ) | | | (0.49 | ) | | | (0.23 | ) | | | (0.27 | ) | | | (0.29 | ) |
Net asset value, end of period | | | $10.48 | | | | $10.51 | | | | $10.70 | | | | $10.89 | | | | $11.15 | | | | $11.13 | |
Ratios and supplemental data: | | | | | | | | | | | | | | | | | | | | | | | | |
Total return(b) | | | 2.26% | | | | 1.28% | | | | 2.94% | | | | (0.27% | ) | | | 2.68% | | | | 1.88% | |
Net assets, end of period (000) | | | $16,475 | | | | $15,898 | | | | $17,818 | | | | $25,964 | | | | $43,823 | | | | $48,612 | |
Ratio of net expenses to average net assets | | | 1.65% | (c) | | | 1.65% | | | | 1.65% | | | | 1.65% | | | | 1.65% | | | | 1.65% | |
Ratio of gross expenses to average net assets prior to expense reductions | | | 1.84% | (c) | | | 1.88% | | | | 1.80% | | | | 1.74% | | | | 1.73% | | | | 1.72% | |
Ratio of net investment income (loss) to average net assets | | | 1.62% | (c) | | | 1.74% | | | | 1.73% | | | | 1.23% | | | | 1.25% | | | | 1.63% | |
| (a) | Net investment income (loss) allocated based on average shares method. |
| (b) | Total return measures net investment income (loss) and capital gain or loss from portfolio investments assuming reinvestment of dividends and capital gains distributions. Total return is not annualized for periods that are less than a full year, does not reflect the effect of sales charge for Class A shares nor the contingent deferred sales charge for Class B and C shares and does not reflect the deduction of taxes that a shareholder would pay on fund distributions or the redemption of fund shares. |
Calamos Total Return Bond Fund Financial Highlights
| | | | | | | | | | | | | | | | | | | | | | | | |
| | | CLASS I | |
| | | (Unaudited)
Six Months
Ended
April 30, | | | Year Ended October 31, | |
| | | 2016 | | | 2015 | | | 2014 | | | 2013 | | | 2012 | | | 2011 | |
Net asset value, beginning of period | | | $10.51 | | | | $10.70 | | | | $10.89 | | | | $11.15 | | | | $11.13 | | | | $11.22 | |
Income from investment operations: | | | | | | | | | | | | | | | | | | | | | | | | |
Net investment income (loss)(a) | | | 0.13 | | | | 0.29 | | | | 0.29 | | | | 0.24 | | | | 0.25 | | | | 0.29 | |
Net realized and unrealized gain (loss) | | | 0.15 | | | | (0.05 | ) | | | 0.12 | | | | (0.16 | ) | | | 0.15 | | | | 0.02 | |
Total from investment operations | | | 0.28 | | | | 0.24 | | | | 0.41 | | | | 0.08 | | | | 0.40 | | | | 0.31 | |
Distributions: | | | | | | | | | | | | | | | | | | | | | | | | |
Dividends from net investment income | | | (0.18 | ) | | | (0.31 | ) | | | (0.56 | ) | | | (0.29 | ) | | | (0.34 | ) | | | (0.31 | ) |
Dividends from net realized gains | | | (0.13 | ) | | | (0.12 | ) | | | (0.04 | ) | | | (0.05 | ) | | | (0.04 | ) | | | (0.09 | ) |
Total distributions | | | (0.31 | ) | | | (0.43 | ) | | | (0.60 | ) | | | (0.34 | ) | | | (0.38 | ) | | | (0.40 | ) |
Net asset value, end of period | | | $10.48 | | | | $10.51 | | | | $10.70 | | | | $10.89 | | | | $11.15 | | | | $11.13 | |
Ratios and supplemental data: | | | | | | | | | | | | | | | | | | | | | | | | |
Total return(b) | | | 2.76% | | | | 2.30% | | | | 3.97% | | | | 0.73% | | | | 3.70% | | | | 2.90% | |
Net assets, end of period (000) | | | $22,624 | | | | $16,561 | | | | $13,347 | | | | $41,109 | | | | $43,464 | | | | $41,639 | |
Ratio of net expenses to average net assets | | | 0.65% | (c) | | | 0.65% | | | | 0.65% | | | | 0.65% | | | | 0.65% | | | | 0.65% | |
Ratio of gross expenses to average net assets prior to expense reductions | | | 0.84% | (c) | | | 0.88% | | | | 0.80% | | | | 0.74% | | | | 0.73% | | | | 0.72% | |
Ratio of net investment income (loss) to average net assets | | | 2.60% | (c) | | | 2.73% | | | | 2.70% | | | | 2.22% | | | | 2.24% | | | | 2.64% | |
| |
| | | CLASS R | |
| | | (Unaudited)
Six Months
Ended
April 30, | | | Year Ended October 31, | |
| | | 2016 | | | 2015 | | | 2014 | | | 2013 | | | 2012 | | | 2011 | |
Net asset value, beginning of period | | | $10.51 | | | | $10.70 | | | | $10.89 | | | | $11.15 | | | | $11.14 | | | | $11.23 | |
Income from investment operations: | | | | | | | | | | | | | | | | | | | | | | | | |
Net investment income (loss)(a) | | | 0.11 | | | | 0.23 | | | | 0.23 | | | | 0.19 | | | | 0.19 | | | | 0.23 | |
Net realized and unrealized gain (loss) | | | 0.15 | | | | (0.04 | ) | | | 0.13 | | | | (0.17 | ) | | | 0.15 | | | | 0.02 | |
Total from investment operations | | | 0.26 | | | | 0.19 | | | | 0.36 | | | | 0.02 | | | | 0.34 | | | | 0.25 | |
Distributions: | | | | | | | | | | | | | | | | | | | | | | | | |
Dividends from net investment income | | | (0.15 | ) | | | (0.26 | ) | | | (0.51 | ) | | | (0.23 | ) | | | (0.29 | ) | | | (0.25 | ) |
Dividends from net realized gains | | | (0.13 | ) | | | (0.12 | ) | | | (0.04 | ) | | | (0.05 | ) | | | (0.04 | ) | | | (0.09 | ) |
Total distributions | | | (0.28 | ) | | | (0.38 | ) | | | (0.55 | ) | | | (0.28 | ) | | | (0.33 | ) | | | (0.34 | ) |
Net asset value, end of period | | | $10.49 | | | | $10.51 | | | | $10.70 | | | | $10.89 | | | | $11.15 | | | | $11.14 | |
Ratios and supplemental data: | | | | | | | | | | | | | | | | | | | | | | | | |
Total return(b) | | | 2.61% | | | | 1.79% | | | | 3.45% | | | | 0.22% | | | | 3.09% | | | | 2.39% | |
Net assets, end of period (000) | | | $439 | | | | $274 | | | | $234 | | | | $2,248 | | | | $1,756 | | | | $1,638 | |
Ratio of net expenses to average net assets | | | 1.15% | (c) | | | 1.15% | | | | 1.15% | | | | 1.15% | | | | 1.15% | | | | 1.15% | |
Ratio of gross expenses to average net assets prior to expense reductions | | | 1.34% | (c) | | | 1.38% | | | | 1.28% | | | | 1.24% | | | | 1.23% | | | | 1.22% | |
Ratio of net investment income (loss) to average net assets | | | 2.10% | (c) | | | 2.23% | | | | 2.14% | | | | 1.72% | | | | 1.74% | | | | 2.10% | |
| (a) | Net investment income (loss) allocated based on average shares method. |
| (b) | Total return measures net investment income (loss) and capital gain or loss from portfolio investments assuming reinvestment of dividends and capital gains distributions. Total return is not annualized for periods that are less than a full year, does not reflect the effect of sales charge for Class A shares nor the contingent deferred sales charge for Class B and C shares and does not reflect the deduction of taxes that a shareholder would pay on fund distributions or the redemption of fund shares. |
| | | | |
| 240 | | CALAMOS OPEN-END FAMILY OF FUNDS SEMIANNUAL REPORT | | |
Calamos High Income Fund Financial Highlights
Selected data for a share outstanding throughout each period were as follows:
| | | | | | | | | | | | | | | | | | | | | | | | |
| | | CLASS A | |
| | | (Unaudited)
Six Months
Ended
April 30, | | | Year Ended October 31, | |
| | | 2016 | | | 2015 | | | 2014 | | | 2013 | | | 2012 | | | 2011 | |
Net asset value, beginning of period | | | $8.63 | | | | $9.65 | | | | $9.90 | | | | $9.92 | | | | $9.68 | | | | $9.97 | |
Income from investment operations: | | | | | | | | | | | | | | | | | | | | | | | | |
Net investment income (loss)(a) | | | 0.20 | | | | 0.43 | | | | 0.48 | | | | 0.51 | | | | 0.53 | | | | 0.59 | |
Net realized and unrealized gain (loss) | | | (0.27 | ) | | | (0.74 | ) | | | 0.01 | | | | 0.18 | | | | 0.35 | | | | (0.24 | ) |
Total from investment operations | | | (0.07 | ) | | | (0.31 | ) | | | 0.49 | | | | 0.69 | | | | 0.88 | | | | 0.35 | |
Distributions: | | | | | | | | | | | | | | | | | | | | | | | | |
Dividends from net investment income | | | (0.21 | ) | | | (0.47 | ) | | | (0.55 | ) | | | (0.58 | ) | | | (0.51 | ) | | | (0.64 | ) |
Dividends from net realized gains | | | — | | | | (0.24 | ) | | | (0.19 | ) | | | (0.13 | ) | | | (0.13 | ) | | | — | |
Return of capital | | | — | | | | (0.00 | )** | | | — | | | | — | | | | — | | | | — | |
Total distributions | | | (0.21 | ) | | | (0.71 | ) | | | (0.74 | ) | | | (0.71 | ) | | | (0.64 | ) | | | (0.64 | ) |
Net asset value, end of period | | | $8.35 | | | | $8.63 | | | | $9.65 | | | | $9.90 | | | | $9.92 | | | | $9.68 | |
Ratios and supplemental data: | | | | | | | | | | | | | | | | | | | | | | | | |
Total return(b) | | | (0.68% | ) | | | (3.25% | ) | | | 5.11% | | | | 7.21% | | | | 9.39% | | | | 3.62% | |
Net assets, end of period (000) | | | $58,451 | | | | $71,513 | | | | $132,756 | | | | $201,791 | | | | $215,299 | | | | $182,515 | |
Ratio of net expenses to average net assets | | | 1.34% | (c) | | | 1.28% | | | | 1.18% | | | | 1.18% | | | | 1.19% | | | | 1.22% | |
Ratio of gross expenses to average net assets prior to expense reductions | | | 1.34% | (c) | | | 1.28% | | | | 1.18% | | | | 1.18% | | | | 1.19% | | | | 1.22% | |
Ratio of net investment income (loss) to average net assets | | | 4.92% | (c) | | | 4.73% | | | | 4.84% | | | | 5.11% | | | | 5.46% | | | | 6.01% | |
| | |
| | | (Unaudited)
Six Months
Ended
April 30, | | | Year Ended October 31, | |
| | | 2016 | | | 2015 | | | 2014 | | | 2013 | | | 2012 | | | 2011 | |
Portfolio turnover rate | | | 22.6% | | | | 65.3% | | | | 51.2% | | | | 55.1% | | | | 73.9% | | | | 72.6% | |
| ** | Amounts are less than $0.005. |
| (a) | Net investment income (loss) allocated based on average shares method. |
| (b) | Total return measures net investment income (loss) and capital gain or loss from portfolio investments assuming reinvestment of dividends and capital gains distributions. Total return is not annualized for periods that are less than a full year, does not reflect the effect of sales charge for Class A shares nor the contingent deferred sales charge for Class B and C shares and does not reflect the deduction of taxes that a shareholder would pay on fund distributions or the redemption of fund shares. |
Calamos High Income Fund Financial Highlights
| | | | | | | | | | | | | | | | | | | | | | | | |
| | | CLASS B | |
| | | (Unaudited)
Six Months
Ended
April 30, | | | Year Ended October 31, | |
| | | 2016 | | | 2015 | | | 2014 | | | 2013 | | | 2012 | | | 2011 | |
Net asset value, beginning of period | | | $9.13 | | | | $10.16 | | | | $10.38 | | | | $10.36 | | | | $10.09 | | | | $10.37 | |
Income from investment operations: | | | | | | | | | | | | | | | | | | | | | | | | |
Net investment income (loss)(a) | | | 0.18 | | | | 0.38 | | | | 0.42 | | | | 0.46 | | | | 0.48 | | | | 0.54 | |
Net realized and unrealized gain (loss) | | | (0.29 | ) | | | (0.78 | ) | | | 0.02 | | | | 0.18 | | | | 0.36 | | | | (0.26 | ) |
Total from investment operations | | | (0.11 | ) | | | (0.40 | ) | | | 0.44 | | | | 0.64 | | | | 0.84 | | | | 0.28 | |
Distributions: | | | | | | | | | | | | | | | | | | | | | | | | |
Dividends from net investment income | | | (0.18 | ) | | | (0.39 | ) | | | (0.47 | ) | | | (0.49 | ) | | | (0.44 | ) | | | (0.56 | ) |
Dividends from net realized gains | | | — | | | | (0.24 | ) | | | (0.19 | ) | | | (0.13 | ) | | | (0.13 | ) | | | — | |
Return of capital | | | — | | | | (0.00 | )** | | | — | | | | — | | | | — | | | | — | |
Total distributions | | | (0.18 | ) | | | (0.63 | ) | | | (0.66 | ) | | | (0.62 | ) | | | (0.57 | ) | | | (0.56 | ) |
Net asset value, end of period | | | $8.84 | | | | $9.13 | | | | $10.16 | | | | $10.38 | | | | $10.36 | | | | $10.09 | |
Ratios and supplemental data: | | | | | | | | | | | | | | | | | | | | | | | | |
Total return(b) | | | (1.13% | ) | | | (3.93% | ) | | | 4.37% | | | | 6.40% | | | | 8.55% | | | | 2.79% | |
Net assets, end of period (000) | | | $396 | | | | $677 | | | | $2,098 | | | | $3,340 | | | | $5,973 | | | | $9,766 | |
Ratio of net expenses to average net assets | | | 2.10% | (c) | | | 2.03% | | | | 1.93% | | | | 1.93% | | | | 1.95% | | | | 1.96% | |
Ratio of gross expenses to average net assets prior to expense reductions | | | 2.10% | (c) | | | 2.03% | | | | 1.93% | | | | 1.93% | | | | 1.95% | | | | 1.96% | |
Ratio of net investment income (loss) to average net assets | | | 4.23% | (c) | | | 4.00% | | | | 4.10% | | | | 4.39% | | | | 4.73% | | | | 5.28% | |
| |
| | | CLASS C | |
| | | (Unaudited)
Six Months
Ended
April 30, | | | Year Ended October 31, | |
| | | 2016 | | | 2015 | | | 2014 | | | 2013 | | | 2012 | | | 2011 | |
Net asset value, beginning of period | | | $9.03 | | | | $10.06 | | | | $10.29 | | | | $10.28 | | | | $10.01 | | | | $10.29 | |
Income from investment operations: | | | | | | | | | | | | | | | | | | | | | | | | |
Net investment income (loss)(a) | | | 0.18 | | | | 0.38 | | | | 0.42 | | | | 0.45 | | | | 0.48 | | | | 0.54 | |
Net realized and unrealized gain (loss) | | | (0.29 | ) | | | (0.78 | ) | | | 0.01 | | | | 0.19 | | | | 0.36 | | | | (0.25 | ) |
Total from investment operations | | | (0.11 | ) | | | (0.40 | ) | | | 0.43 | | | | 0.64 | | | | 0.84 | | | | 0.29 | |
Distributions: | | | | | | | | | | | | | | | | | | | | | | | | |
Dividends from net investment income | | | (0.18 | ) | | | (0.39 | ) | | | (0.47 | ) | | | (0.50 | ) | | | (0.44 | ) | | | (0.57 | ) |
Dividends from net realized gains | | | — | | | | (0.24 | ) | | | (0.19 | ) | | | (0.13 | ) | | | (0.13 | ) | | | — | |
Return of capital | | | — | | | | (0.00 | )** | | | — | | | | — | | | | — | | | | — | |
Total distributions | | | (0.18 | ) | | | (0.63 | ) | | | (0.66 | ) | | | (0.63 | ) | | | (0.57 | ) | | | (0.57 | ) |
Net asset value, end of period | | | $8.74 | | | | $9.03 | | | | $10.06 | | | | $10.29 | | | | $10.28 | | | | $10.01 | |
Ratios and supplemental data: | | | | | | | | | | | | | | | | | | | | | | | | |
Total return(b) | | | (1.13% | ) | | | (3.94% | ) | | | 4.32% | | | | 6.37% | | | | 8.65% | | | | 2.83% | |
Net assets, end of period (000) | | | $18,628 | | | | $21,149 | | | | $29,333 | | | | $34,146 | | | | $43,141 | | | | $39,764 | |
Ratio of net expenses to average net assets | | | 2.10% | (c) | | | 2.04% | | | | 1.93% | | | | 1.93% | | | | 1.94% | | | | 1.97% | |
Ratio of gross expenses to average net assets prior to expense reductions | | | 2.10% | (c) | | | 2.04% | | | | 1.93% | | | | 1.93% | | | | 1.94% | | | | 1.97% | |
Ratio of net investment income (loss) to average net assets | | | 4.22% | (c) | | | 3.98% | | | | 4.10% | | | | 4.37% | | | | 4.72% | | | | 5.26% | |
| ** | Amounts are less than $0.005. |
| (a) | Net investment income (loss) allocated based on average shares method. |
| (b) | Total return measures net investment income (loss) and capital gain or loss from portfolio investments assuming reinvestment of dividends and capital gains distributions. Total return is not annualized for periods that are less than a full year, does not reflect the effect of sales charge for Class A shares nor the contingent deferred sales charge for Class B and C shares and does not reflect the deduction of taxes that a shareholder would pay on fund distributions or the redemption of fund shares. |
| | | | |
| 242 | | CALAMOS OPEN-END FAMILY OF FUNDS SEMIANNUAL REPORT | | |
Calamos High Income Fund Financial Highlights
| | | | | | | | | | | | | | | | | | | | | | | | |
| | | CLASS I | |
| | | (Unaudited)
Six Months
Ended
April 30, | | | Year Ended October 31, | |
| | | 2016 | | | 2015 | | | 2014 | | | 2013 | | | 2012 | | | 2011 | |
Net asset value, beginning of period | | | $8.63 | | | | $9.65 | | | | $9.90 | | | | $9.92 | | | | $9.68 | | | | $9.97 | |
Income from investment operations: | | | | | | | | | | | | | | | | | | | | | | | | |
Net investment income (loss)(a) | | | 0.21 | | | | 0.45 | | | | 0.50 | | | | 0.53 | | | | 0.56 | | | | 0.62 | |
Net realized and unrealized gain (loss) | | | (0.27 | ) | | | (0.74 | ) | | | 0.02 | | | | 0.19 | | | | 0.34 | | | | (0.24 | ) |
Total from investment operations | | | (0.06 | ) | | | (0.29 | ) | | | 0.52 | | | | 0.72 | | | | 0.90 | | | | 0.38 | |
Distributions: | | | | | | | | | | | | | | | | | | | | | | | | |
Dividends from net investment income | | | (0.22 | ) | | | (0.49 | ) | | | (0.58 | ) | | | (0.61 | ) | | | (0.53 | ) | | | (0.67 | ) |
Dividends from net realized gains | | | — | | | | (0.24 | ) | | | (0.19 | ) | | | (0.13 | ) | | | (0.13 | ) | | | — | |
Return of capital | | | — | | | | (0.00 | )** | | | — | | | | — | | | | — | | | | — | |
Total distributions | | | (0.22 | ) | | | (0.73 | ) | | | (0.77 | ) | | | (0.74 | ) | | | (0.66 | ) | | | (0.67 | ) |
Net asset value, end of period | | | $8.35 | | | | $8.63 | | | | $9.65 | | | | $9.90 | | | | $9.92 | | | | $9.68 | |
Ratios and supplemental data: | | | | | | | | | | | | | | | | | | | | | | | | |
Total return(b) | | | (0.55% | ) | | | (3.00% | ) | | | 5.37% | | | | 7.50% | | | | 9.63% | | | | 3.88% | |
Net assets, end of period (000) | | | $16,971 | | | | $17,452 | | | | $24,342 | | | | $25,103 | | | | $33,271 | | | | $21,424 | |
Ratio of net expenses to average net assets | | | 1.09% | (c) | | | 1.04% | | | | 0.93% | | | | 0.93% | | | | 0.94% | | | | 0.96% | |
Ratio of gross expenses to average net assets prior to expense reductions | | | 1.09% | (c) | | | 1.04% | | | | 0.93% | | | | 0.93% | | | | 0.94% | | | | 0.96% | |
Ratio of net investment income (loss) to average net assets | | | 5.22% | (c) | | | 4.98% | | | | 5.10% | | | | 5.37% | | | | 5.71% | | | | 6.29% | |
| |
| | | CLASS R | |
| | | (Unaudited)
Six Months
Ended
April 30, | | | Year Ended October 31, | |
| | | 2016 | | | 2015 | | | 2014 | | | 2013 | | | 2012 | | | 2011 | |
Net asset value, beginning of period | | | $8.62 | | | | $9.64 | | | | $9.89 | | | | $9.91 | | | | $9.67 | | | | $9.96 | |
Income from investment operations: | | | | | | | | | | | | | | | | | | | | | | | | |
Net investment income (loss)(a) | | | 0.19 | | | | 0.41 | | | | 0.45 | | | | 0.48 | | | | 0.51 | | | | 0.57 | |
Net realized and unrealized gain (loss) | | | (0.28 | ) | | | (0.75 | ) | | | 0.02 | | | | 0.18 | | | | 0.34 | | | | (0.24 | ) |
Total from investment operations | | | (0.09 | ) | | | (0.34 | ) | | | 0.47 | | | | 0.66 | | | | 0.85 | | | | 0.33 | |
Distributions: | | | | | | | | | | | | | | | | | | | | | | | | |
Dividends from net investment income | | | (0.20 | ) | | | (0.44 | ) | | | (0.53 | ) | | | (0.55 | ) | | | (0.48 | ) | | | (0.62 | ) |
Dividends from net realized gains | | | — | | | | (0.24 | ) | | | (0.19 | ) | | | (0.13 | ) | | | (0.13 | ) | | | — | |
Return of capital | | | — | | | | (0.00 | )** | | | — | | | | — | | | | — | | | | — | |
Total distributions | | | (0.20 | ) | | | (0.68 | ) | | | (0.72 | ) | | | (0.68 | ) | | | (0.61 | ) | | | (0.62 | ) |
Net asset value, end of period | | | $8.33 | | | | $8.62 | | | | $9.64 | | | | $9.89 | | | | $9.91 | | | | $9.67 | |
Ratios and supplemental data: | | | | | | | | | | | | | | | | | | | | | | | | |
Total return(b) | | | (0.92% | ) | | | (3.48% | ) | | | 4.87% | | | | 6.92% | | | | 9.17% | | | | 3.37% | |
Net assets, end of period (000) | | | $141 | | | | $154 | | | | $209 | | | | $192 | | | | $373 | | | | $272 | |
Ratio of net expenses to average net assets | | | 1.60% | (c) | | | 1.54% | | | | 1.43% | | | | 1.43% | | | | 1.44% | | | | 1.47% | |
Ratio of gross expenses to average net assets prior to expense reductions | | | 1.60% | (c) | | | 1.54% | | | | 1.43% | | | | 1.43% | | | | 1.44% | | | | 1.47% | |
Ratio of net investment income (loss) to average net assets | | | 4.73% | (c) | | | 4.49% | | | | 4.60% | | | | 4.89% | | | | 5.21% | | | | 5.74% | |
| ** | Amounts are less than $0.005. |
| (a) | Net investment income (loss) allocated based on average shares method. |
| (b) | Total return measures net investment income (loss) and capital gain or loss from portfolio investments assuming reinvestment of dividends and capital gains distributions. Total return is not annualized for periods that are less than a full year, does not reflect the effect of sales charge for Class A shares nor the contingent deferred sales charge for Class B and C shares and does not reflect the deduction of taxes that a shareholder would pay on fund distributions or the redemption of fund shares. |
Calamos Market Neutral Income Fund Financial Highlights
Selected data for a share outstanding throughout each period were as follows:
| | | | | | | | | | | | | | | | | | | | | | | | |
| | | CLASS A | |
| | | (Unaudited)
Six Months
Ended
April 30, | | | Year Ended October 31, | |
| | | 2016 | | | 2015 | | | 2014 | | | 2013 | | | 2012 | | | 2011 | |
Net asset value, beginning of period | | | $13.08 | | | | $13.13 | | | | $13.09 | | | | $12.68 | | | | $12.11 | | | | $11.91 | |
Income from investment operations: | | | | | | | | | | | | | | | | | | | | | | | | |
Net investment income (loss)(a) | | | 0.13 | | | | 0.21 | | | | 0.15 | | | | 0.17 | | | | 0.21 | | | | 0.22 | |
Net realized and unrealized gain (loss) | | | (0.07 | ) | | | — | | | | 0.27 | | | | 0.42 | | | | 0.51 | | | | 0.18 | |
Total from investment operations | | | 0.06 | | | | 0.21 | | | | 0.42 | | | | 0.59 | | | | 0.72 | | | | 0.40 | |
Distributions: | | | | | | | | | | | | | | | | | | | | | | | | |
Dividends from net investment income | | | (0.08 | ) | | | (0.12 | ) | | | (0.12 | ) | | | (0.18 | ) | | | (0.15 | ) | | | (0.20 | ) |
Dividends from net realized gains | | | (0.20 | ) | | | (0.14 | ) | | | (0.26 | ) | | | — | | | | — | | | | — | |
Total distributions | | | (0.28 | ) | | | (0.26 | ) | | | (0.38 | ) | | | (0.18 | ) | | | (0.15 | ) | | | (0.20 | ) |
Net asset value, end of period | | | $12.86 | | | | $13.08 | | | | $13.13 | | | | $13.09 | | | | $12.68 | | | | $12.11 | |
Ratios and supplemental data: | | | | | | | | | | | | | | | | | | | | | | | | |
Total return(b) | | | 0.47% | | | | 1.60% | | | | 3.27% | | | | 4.71% | | | | 6.01% | | | | 3.40% | |
Net assets, end of period (000) | | | $966,777 | | | | $1,051,576 | | | | $1,351,641 | | | | $1,354,180 | | | | $1,155,161 | | | | $1,282,438 | |
Ratio of net expenses to average net assets | | | 1.20% | (c) | | | 1.23% | | | | 1.20% | | | | 1.26% | | | | 1.17% | | | | 1.21% | |
Ratio of gross expenses to average net assets prior to expense reductions | | | 1.20% | (c) | | | 1.23% | | | | 1.20% | | | | 1.26% | | | | 1.17% | | | | 1.21% | |
Ratio of net investment income (loss) to average net assets | | | 2.04% | (c) | | | 1.58% | | | | 1.17% | | | | 1.33% | | | | 1.65% | | | | 1.80% | |
Ratio of net expenses, excluding dividend expense on short positions, to average net assets | | | 1.08% | (c) | | | 1.11% | | | | 1.09% | | | | 1.12% | | | | 1.13% | | | | 1.14% | |
| | |
| | | (Unaudited)
Six Months
Ended
April 30, | | | Year Ended October 31, | |
| | | 2016 | | | 2015 | | | 2014 | | | 2013 | | | 2012 | | | 2011 | |
Portfolio turnover rate | | | 17.2% | | | | 37.6% | | | | 70.5% | | | | 110.6% | | | | 82.8% | | | | 98.5% | |
| (a) | Net investment income (loss) allocated based on average shares method. |
| (b) | Total return measures net investment income (loss) and capital gain or loss from portfolio investments assuming reinvestment of dividends and capital gains distributions. Total return is not annualized for periods that are less than a full year, does not reflect the effect of sales charge for Class A shares nor the contingent deferred sales charge for Class B and C shares and does not reflect the deduction of taxes that a shareholder would pay on fund distributions or the redemption of fund shares. |
| | | | |
| 244 | | CALAMOS OPEN-END FAMILY OF FUNDS SEMIANNUAL REPORT | | |
Calamos Market Neutral Income Fund Financial Highlights
| | | | | | | | | | | | | | | | | | | | | | | | |
| | | CLASS B | |
| | | (Unaudited)
Six Months
Ended
April 30, | | | Year Ended October 31, | |
| | | 2016 | | | 2015 | | | 2014 | | | 2013 | | | 2012 | | | 2011 | |
Net asset value, beginning of period | | | $13.84 | | | | $13.87 | | | | $13.82 | | | | $13.36 | | | | $12.75 | | | | $12.51 | |
Income from investment operations: | | | | | | | | | | | | | | | | | | | | | | | | |
Net investment income (loss)(a) | | | 0.09 | | | | 0.12 | | | | 0.06 | | | | 0.08 | | | | 0.12 | | | | 0.14 | |
Net realized and unrealized gain (loss) | | | (0.07 | ) | | | — | | | | 0.27 | | | | 0.45 | | | | 0.54 | | | | 0.20 | |
Total from investment operations | | | 0.02 | | | | 0.12 | | | | 0.33 | | | | 0.53 | | | | 0.66 | | | | 0.34 | |
Distributions: | | | | | | | | | | | | | | | | | | | | | | | | |
Dividends from net investment income | | | — | | | | (0.01 | ) | | | (0.02 | ) | | | (0.07 | ) | | | (0.05 | ) | | | (0.10 | ) |
Dividends from net realized gains | | | (0.20 | ) | | | (0.14 | ) | | | (0.26 | ) | | | — | | | | — | | | | — | |
Total distributions | | | (0.20 | ) | | | (0.15 | ) | | | (0.28 | ) | | | (0.07 | ) | | | (0.05 | ) | | | (0.10 | ) |
Net asset value, end of period | | | $13.66 | | | | $13.84 | | | | $13.87 | | | | $13.82 | | | | $13.36 | | | | $12.75 | |
Ratios and supplemental data: | | | | | | | | | | | | | | | | | | | | | | | | |
Total return(b) | | | 0.12% | | | | 0.84% | | | | 2.43% | | | | 3.98% | | | | 5.18% | | | | 2.70% | |
Net assets, end of period (000) | | | $853 | | | | $1,832 | | | | $4,436 | | | | $9,117 | | | | $12,940 | | | | $18,147 | |
Ratio of net expenses to average net assets | | | 1.95% | (c) | | | 1.98% | | | | 1.95% | | | | 2.03% | | | | 1.92% | | | | 1.97% | |
Ratio of gross expenses to average net assets prior to expense reductions | | | 1.95% | (c) | | | 1.98% | | | | 1.95% | | | | 2.03% | | | | 1.92% | | | | 1.97% | |
Ratio of net investment income (loss) to average net assets | | | 1.31% | (c) | | | 0.83% | | | | 0.44% | | | | 0.60% | | | | 0.91% | | | | 1.07% | |
Ratio of net expenses, excluding dividend expense on short positions, to average net assets | | | 1.84% | (c) | | | 1.85% | | | | 1.84% | | | | 1.87% | | | | 1.89% | | | | 1.89% | |
| |
| | | CLASS C | |
| | | (Unaudited)
Six Months
Ended
April 30, | | | Year Ended October 31, | |
| | | 2016 | | | 2015 | | | 2014 | | | 2013 | | | 2012 | | | 2011 | |
Net asset value, beginning of period | | | $13.27 | | | | $13.32 | | | | $13.30 | | | | $12.88 | | | | $12.29 | | | | $12.08 | |
Income from investment operations: | | | | | | | | | | | | | | | | | | | | | | | | |
Net investment income (loss)(a) | | | 0.08 | | | | 0.11 | | | | 0.06 | | | | 0.08 | | | | 0.11 | | | | 0.13 | |
Net realized and unrealized gain (loss) | | | (0.06 | ) | | | 0.01 | | | | 0.26 | | | | 0.42 | | | | 0.54 | | | | 0.18 | |
Total from investment operations | | | 0.02 | | | | 0.12 | | | | 0.32 | | | | 0.50 | | | | 0.65 | | | | 0.31 | |
Distributions: | | | | | | | | | | | | | | | | | | | | | | | | |
Dividends from net investment income | | | (0.03 | ) | | | (0.03 | ) | | | (0.04 | ) | | | (0.08 | ) | | | (0.06 | ) | | | (0.10 | ) |
Dividends from net realized gains | | | (0.20 | ) | | | (0.14 | ) | | | (0.26 | ) | | | — | | | | — | | | | — | |
Total distributions | | | (0.23 | ) | | | (0.17 | ) | | | (0.30 | ) | | | (0.08 | ) | | | (0.06 | ) | | | (0.10 | ) |
Net asset value, end of period | | | $13.06 | | | | $13.27 | | | | $13.32 | | | | $13.30 | | | | $12.88 | | | | $12.29 | |
Ratios and supplemental data: | | | | | | | | | | | | | | | | | | | | | | | | |
Total return(b) | | | 0.16% | | | | 0.86% | | | | 2.40% | | | | 3.93% | | | | 5.28% | | | | 2.61% | |
Net assets, end of period (000) | | | $332,218 | | | | $339,054 | | | | $349,791 | | | | $289,520 | | | | $267,646 | | | | $299,733 | |
Ratio of net expenses to average net assets | | | 1.95% | (c) | | | 1.98% | | | | 1.95% | | | | 2.02% | | | | 1.92% | | | | 1.97% | |
Ratio of gross expenses to average net assets prior to expense reductions | | | 1.95% | (c) | | | 1.98% | | | | 1.95% | | | | 2.02% | | | | 1.92% | | | | 1.97% | |
Ratio of net investment income (loss) to average net assets | | | 1.29% | (c) | | | 0.83% | | | | 0.42% | | | | 0.58% | | | | 0.90% | | | | 1.06% | |
Ratio of net expenses, excluding dividend expense on short positions, to average net assets | | | 1.83% | (c) | | | 1.86% | | | | 1.84% | | | | 1.87% | | | | 1.88% | | | | 1.89% | |
| (a) | Net investment income (loss) allocated based on average shares method. |
| (b) | Total return measures net investment income (loss) and capital gain or loss from portfolio investments assuming reinvestment of dividends and capital gains distributions. Total return is not annualized for periods that are less than a full year, does not reflect the effect of sales charge for Class A shares nor the contingent deferred sales charge for Class B and C shares and does not reflect the deduction of taxes that a shareholder would pay on fund distributions or the redemption of fund shares. |
Calamos Market Neutral Income Fund Financial Highlights
| | | | | | | | | | | | | | | | | | | | | | | | |
| | | CLASS I | |
| | | (Unaudited)
Six Months
Ended
April 30, | | | Year Ended October 31, | |
| | | 2016 | | | 2015 | | | 2014 | | | 2013 | | | 2012 | | | 2011 | |
Net asset value, beginning of period | | | $12.94 | | | | $12.99 | | | | $12.97 | | | | $12.56 | | | | $12.00 | | | | $11.80 | |
Income from investment operations: | | | | | | | | | | | | | | | | | | | | | | | | |
Net investment income (loss)(a) | | | 0.14 | | | | 0.24 | | | | 0.18 | | | | 0.20 | | | | 0.23 | | | | 0.24 | |
Net realized and unrealized gain (loss) | | | (0.06 | ) | | | — | | | | 0.25 | | | | 0.42 | | | | 0.51 | | | | 0.19 | |
Total from investment operations | | | 0.08 | | | | 0.24 | | | | 0.43 | | | | 0.62 | | | | 0.74 | | | | 0.43 | |
Distributions: | | | | | | | | | | | | | | | | | | | | | | | | |
Dividends from net investment income | | | (0.10 | ) | | | (0.15 | ) | | | (0.15 | ) | | | (0.21 | ) | | | (0.18 | ) | | | (0.23 | ) |
Dividends from net realized gains | | | (0.20 | ) | | | (0.14 | ) | | | (0.26 | ) | | | — | | | | — | | | | — | |
Total distributions | | | (0.30 | ) | | | (0.29 | ) | | | (0.41 | ) | | | (0.21 | ) | | | (0.18 | ) | | | (0.23 | ) |
Net asset value, end of period | | | $12.72 | | | | $12.94 | | | | $12.99 | | | | $12.97 | | | | $12.56 | | | | $12.00 | |
Ratios and supplemental data: | | | | | | | | | | | | | | | | | | | | | | | | |
Total return(b) | | | 0.60% | | | | 1.89% | | | | 3.40% | | | | 5.01% | | | | 6.25% | | | | 3.70% | |
Net assets, end of period (000) | | | $2,439,772 | | | | $2,377,641 | | | | $2,470,829 | | | | $1,574,197 | | | | $1,040,722 | | | | $738,421 | |
Ratio of net expenses to average net assets | | | 0.95% | (c) | | | 0.98% | | | | 0.95% | | | | 1.01% | | | | 0.92% | | | | 0.96% | |
Ratio of gross expenses to average net assets prior to expense reductions | | | 0.95% | (c) | | | 0.98% | | | | 0.95% | | | | 1.01% | | | | 0.92% | | | | 0.96% | |
Ratio of net investment income (loss) to average net assets | | | 2.29% | (c) | | | 1.83% | | | | 1.41% | | | | 1.57% | | | | 1.88% | | | | 2.04% | |
Ratio of net expenses, excluding dividend expense on short positions, to average net assets | | | 0.83% | (c) | | | 0.86% | | | | 0.84% | | | | 0.87% | | | | 0.88% | | | | 0.89% | |
| (a) | Net investment income (loss) allocated based on average shares method. |
| (b) | Total return measures net investment income (loss) and capital gain or loss from portfolio investments assuming reinvestment of dividends and capital gains distributions. Total return is not annualized for periods that are less than a full year, does not reflect the effect of sales charge for Class A shares nor the contingent deferred sales charge for Class B and C shares and does not reflect the deduction of taxes that a shareholder would pay on fund distributions or the redemption of fund shares. |
| | | | |
| 246 | | CALAMOS OPEN-END FAMILY OF FUNDS SEMIANNUAL REPORT | | |
Calamos Market Neutral Income Fund Financial Highlights
| | | | | | | | | | | | | | | | | | | | | | | | |
| | | CLASS R | |
| | | (Unaudited)
Six Months
Ended
April 30, | | | Year Ended October 31, | |
| | | 2016 | | | 2015 | | | 2014 | | | 2013 | | | 2012 | | | 2011 | |
Net asset value, beginning of period | | | $13.03 | | | | $13.08 | | | | $13.05 | | | | $12.64 | | | | $12.08 | | | | $11.88 | |
Income from investment operations: | | | | | | | | | | | | | | | | | | | | | | | | |
Net investment income (loss)(a) | | | 0.11 | | | | 0.17 | | | | 0.12 | | | | 0.14 | | | | 0.17 | | | | 0.19 | |
Net realized and unrealized gain (loss) | | | (0.06 | ) | | | 0.01 | | | | 0.26 | | | | 0.42 | | | | 0.52 | | | | 0.18 | |
Total from investment operations | | | 0.05 | | | | 0.18 | | | | 0.38 | | | | 0.56 | | | | 0.69 | | | | 0.37 | |
Distributions: | | | | | | | | | | | | | | | | | | | | | | | | |
Dividends from net investment income | | | (0.07 | ) | | | (0.09 | ) | | | (0.09 | ) | | | (0.15 | ) | | | (0.13 | ) | | | (0.17 | ) |
Dividends from net realized gains | | | (0.20 | ) | | | (0.14 | ) | | | (0.26 | ) | | | — | | | | — | | | | — | |
Total distributions | | | (0.27 | ) | | | (0.23 | ) | | | (0.35 | ) | | | (0.15 | ) | | | (0.13 | ) | | | (0.17 | ) |
Net asset value, end of period | | | $12.81 | | | | $13.03 | | | | $13.08 | | | | $13.05 | | | | $12.64 | | | | $12.08 | |
Ratios and supplemental data: | | | | | | | | | | | | | | | | | | | | | | | | |
Total return(b) | | | 0.34% | | | | 1.36% | | | | 2.97% | | | | 4.47% | | | | 5.72% | | | | 3.18% | |
Net assets, end of period (000) | | | $8,200 | | | | $8,464 | | | | $9,099 | | | | $5,408 | | | | $5,199 | | | | $3,114 | |
Ratio of net expenses to average net assets | | | 1.45% | (c) | | | 1.48% | | | | 1.45% | | | | 1.52% | | | | 1.42% | | | | 1.46% | |
Ratio of gross expenses to average net assets prior to expense reductions | | | 1.45% | (c) | | | 1.48% | | | | 1.45% | | | | 1.52% | | | | 1.42% | | | | 1.46% | |
Ratio of net investment income (loss) to average net assets | | | 1.79% | (c) | | | 1.33% | | | | 0.91% | | | | 1.08% | | | | 1.37% | | | | 1.55% | |
Ratio of net expenses, excluding dividend expense on short positions, to average net assets | | | 1.33% | (c) | | | 1.36% | | | | 1.34% | | | | 1.37% | | | | 1.38% | | | | 1.39% | |
| (a) | Net investment income (loss) allocated based on average shares method. |
| (b) | Total return measures net investment income (loss) and capital gain or loss from portfolio investments assuming reinvestment of dividends and capital gains distributions. Total return is not annualized for periods that are less than a full year, does not reflect the effect of sales charge for Class A shares nor the contingent deferred sales charge for Class B and C shares and does not reflect the deduction of taxes that a shareholder would pay on fund distributions or the redemption of fund shares. |
Calamos Hedged Equity Income Fund Financial Highlights
Selected data for a share outstanding throughout each period were as follows:
| | | | | | | | |
| | | CLASS A | |
| | | (Unaudited)
Six Months
Ended
April 30, | | | December 31, 2014*
through October 31, | |
| | | 2016 | | | 2015 | |
Net asset value, beginning of period | | | $10.00 | | | | $10.00 | |
Income from investment operations: | | | | | | | | |
Net investment income (loss)(a) | | | 0.05 | | | | 0.06 | |
Net realized and unrealized gain (loss) | | | (0.07 | ) | | | 0.01 | |
Total from investment operations | | | (0.02 | ) | | | 0.07 | |
Distributions: | | | | | | | | |
Dividends from net investment income | | | (0.11 | ) | | | (0.07 | ) |
Dividends from net realized gains | | | (0.09 | ) | | | — | |
Total distributions | | | (0.20 | ) | | | (0.07 | ) |
Net asset value, end of period | | | $9.78 | | | | $10.00 | |
Ratios and supplemental data: | | | | | | | | |
Total return(b) | | | (0.19% | ) | | | 0.67% | |
Net assets, end of period (000) | | | $9,602 | | | | $5,661 | |
Ratio of net expenses to average net assets | | | 1.25% | (c) | | | 1.25% | (c) |
Ratio of gross expenses to average net assets prior to expense reductions | | | 2.38% | (c) | | | 3.05% | (c) |
Ratio of net investment income (loss) to average net assets | | | 1.01% | (c) | | | 0.78% | (c) |
| | |
| | | (Unaudited)
Six Months
Ended
April 30, | | | December 31, 2014*
through October 31, | |
| | | 2016 | | | 2015 | |
Portfolio turnover rate | | | 8.4% | | | | 29.4% | |
| * | Commencement of operations. |
| (a) | Net investment income (loss) allocated based on average shares method. |
| (b) | Total return measures net investment income (loss) and capital gain or loss from portfolio investments assuming reinvestment of dividends and capital gains distributions. Total return is not annualized for periods that are less than a full year, does not reflect the effect of sales charge for Class A shares nor the contingent deferred sales charge for Class B and C shares and does not reflect the deduction of taxes that a shareholder would pay on fund distributions or the redemption of fund shares. |
| | | | |
| 248 | | CALAMOS OPEN-END FAMILY OF FUNDS SEMIANNUAL REPORT | | |
Calamos Hedged Equity Income Fund Financial Highlights
| | | | | | | | |
| | | CLASS C | |
| | | (Unaudited)
Six Months
Ended
April 30, | | | December 31, 2014*
through October 31, | |
| | | 2016 | | | 2015 | |
Net asset value, beginning of period | | | $9.98 | | | | $10.00 | |
Income from investment operations: | | | | | | | | |
Net investment income (loss)(a) | | | 0.01 | | | | (0.00 | )** |
Net realized and unrealized gain (loss) | | | (0.07 | ) | | | 0.01 | |
Total from investment operations | | | (0.06 | ) | | | 0.01 | |
Distributions: | | | | | | | | |
Dividends from net investment income | | | (0.07 | ) | | | (0.03 | ) |
Dividends from net realized gains | | | (0.09 | ) | | | — | |
Total distributions | | | (0.16 | ) | | | (0.03 | ) |
Net asset value, end of period | | | $9.76 | | | | $9.98 | |
Ratios and supplemental data: | | | | | | | | |
Total return(b) | | | (0.61% | ) | | | 0.09% | |
Net assets, end of period (000) | | | $163 | | | | $100 | |
Ratio of net expenses to average net assets | | | 2.00% | (c) | | | 2.00% | (c) |
Ratio of gross expenses to average net assets prior to expense reductions | | | 3.16% | (c) | | | 3.79% | (c) |
Ratio of net investment income (loss) to average net assets | | | 0.21% | (c) | | | 0.03% | (c) |
| |
| | | CLASS I | |
| | | (Unaudited)
Six Months
Ended
April 30, | | | December 31, 2014*
through October 31, | |
| | | 2016 | | | 2015 | |
Net asset value, beginning of period | | | $10.01 | | | | $10.00 | |
Income from investment operations: | | | | | | | | |
Net investment income (loss)(a) | | | 0.06 | | | | 0.09 | |
Net realized and unrealized gain (loss) | | | (0.07 | ) | | | — | |
Total from investment operations | | | (0.01 | ) | | | 0.09 | |
Distributions: | | | | | | | | |
Dividends from net investment income | | | (0.12 | ) | | | (0.08 | ) |
Dividends from net realized gains | | | (0.09 | ) | | | — | |
Total distributions | | | (0.21 | ) | | | (0.08 | ) |
Net asset value, end of period | | | $9.79 | | | | $10.01 | |
Ratios and supplemental data: | | | | | | | | |
Total return(b) | | | (0.08% | ) | | | 0.89% | |
Net assets, end of period (000) | | | $6,102 | | | | $5,527 | |
Ratio of net expenses to average net assets | | | 1.00% | (c) | | | 1.00% | (c) |
Ratio of gross expenses to average net assets prior to expense reductions | | | 2.13% | (c) | | | 2.80% | (c) |
Ratio of net investment income (loss) to average net assets | | | 1.31% | (c) | | | 1.03% | (c) |
| * | Commencement of operations. |
| ** | Amounts are less than $0.005. |
| (a) | Net investment income (loss) allocated based on average shares method. |
| (b) | Total return measures net investment income (loss) and capital gain or loss from portfolio investments assuming reinvestment of dividends and capital gains distributions. Total return is not annualized for periods that are less than a full year, does not reflect the effect of sales charge for Class A shares nor the contingent deferred sales charge for Class B and C shares and does not reflect the deduction of taxes that a shareholder would pay on fund distributions or the redemption of fund shares. |
Calamos Hedged Equity Income Fund Financial Highlights
| | | | | | | | |
| | | CLASS R | |
| | | (Unaudited)
Six Months
Ended
April 30, | | | December 31, 2014*
through October 31, | |
| | | 2016 | | | 2015 | |
Net asset value, beginning of period | | | $10.00 | | | | $10.00 | |
Income from investment operations: | | | | | | | | |
Net investment income (loss)(a) | | | 0.04 | | | | 0.04 | |
Net realized and unrealized gain (loss) | | | (0.08 | ) | | | 0.01 | |
Total from investment operations | | | (0.04 | ) | | | 0.05 | |
Distributions: | | | | | | | | |
Dividends from net investment income | | | (0.10 | ) | | | (0.05 | ) |
Dividends from net realized gains | | | (0.09 | ) | | | — | |
Total distributions | | | (0.19 | ) | | | (0.05 | ) |
Net asset value, end of period | | | $9.77 | | | | $10.00 | |
Ratios and supplemental data: | | | | | | | | |
Total return(b) | | | (0.43% | ) | | | 0.54% | |
Net assets, end of period (000) | | | $100 | | | | $100 | |
Ratio of net expenses to average net assets | | | 1.50% | (c) | | | 1.50% | (c) |
Ratio of gross expenses to average net assets prior to expense reductions | | | 2.64% | (c) | | | 3.29% | (c) |
Ratio of net investment income (loss) to average net assets | | | 0.83% | (c) | | | 0.53% | (c) |
| * | Commencement of operations. |
| (a) | Net investment income (loss) allocated based on average shares method. |
| (b) | Total return measures net investment income (loss) and capital gain or loss from portfolio investments assuming reinvestment of dividends and capital gains distributions. Total return is not annualized for periods that are less than a full year, does not reflect the effect of sales charge for Class A shares nor the contingent deferred sales charge for Class B and C shares and does not reflect the deduction of taxes that a shareholder would pay on fund distributions or the redemption of fund shares. |
| | | | |
| 250 | | CALAMOS OPEN-END FAMILY OF FUNDS SEMIANNUAL REPORT | | |
Calamos Phineus Long/Short Fund Financial Highlights
Selected data for a share outstanding throughout each period were as follows:
| | | | |
| | | CLASS A | |
| | | (Unaudited)
April 5, 2016*
through
April 30, | |
| | | 2016 | |
Net asset value, beginning of period | | | $10.00 | |
Income from investment operations: | | | | |
Net investment income (loss)(a) | | | 0.00 | ** |
Net realized and unrealized gain (loss) | | | 0.49 | |
Total from investment operations | | | 0.49 | |
Distributions: | | | | |
Dividends from net investment income | | | — | |
Dividends from net realized gains | | | — | |
Total distributions | | | — | |
Net asset value, end of period | | | $10.49 | |
Ratios and supplemental data: | | | | |
Total return(b) | | | 4.90% | |
Net assets, end of period (000) | | | $270 | |
Ratio of net expenses to average net assets | | | 2.10% | (c) |
Ratio of gross expenses to average net assets prior to expense reductions | | | 7.84% | (c) |
Ratio of net investment income (loss) to average net assets | | | (0.43% | )(c) |
Ratio of net expenses, excluding dividend expense on short positions, to average net assets | | | 2.00% | (c) |
| |
| | | (Unaudited)
April 5, 2016*
through
April 30, | |
| | | 2016 | |
Portfolio turnover rate | | | 43.1% | |
| * | Commencement of operations. |
| ** | Amounts are less than $0.005. |
| (a) | Net investment income (loss) allocated based on average shares method. |
| (b) | Total return measures net investment income (loss) and capital gain or loss from portfolio investments assuming reinvestment of dividends and capital gains distributions. Total return is not annualized for periods that are less than a full year, does not reflect the effect of sales charge for Class A shares nor the contingent deferred sales charge for Class B and C shares and does not reflect the deduction of taxes that a shareholder would pay on fund distributions or the redemption of fund shares. |
Calamos Phineus Long/Short Fund Financial Highlights
| | | | |
| | | CLASS C | |
| | | (Unaudited)
April 5, 2016*
through
April 30, | |
| | | 2016 | |
Net asset value, beginning of period | | | $10.00 | |
Income from investment operations: | | | | |
Net investment income (loss)(a) | | | (0.01 | ) |
Net realized and unrealized gain (loss) | | | 0.50 | |
Total from investment operations | | | 0.49 | |
Distributions: | | | | |
Dividends from net investment income | | | — | |
Dividends from net realized gains | | | — | |
Total distributions | | | — | |
Net asset value, end of period | | | $10.49 | |
Ratios and supplemental data: | | | | |
Total return(b) | | | 4.90% | |
Net assets, end of period (000) | | | $120 | |
Ratio of net expenses to average net assets | | | 2.89% | (c) |
Ratio of gross expenses to average net assets prior to expense reductions | | | 10.67% | (c) |
Ratio of net investment income (loss) to average net assets | | | (1.73% | )(c) |
Ratio of net expenses, excluding dividend expense on short positions, to average net assets | | | 2.75% | (c) |
| |
| | | CLASS I | |
| | | (Unaudited)
April 5, 2016*
through
April 30, | |
| | | 2016 | |
Net asset value, beginning of period | | | $10.00 | |
Income from investment operations: | | | | |
Net investment income (loss)(a) | | | 0.00 | ** |
Net realized and unrealized gain (loss) | | | 0.50 | |
Total from investment operations | | | 0.50 | |
Distributions: | | | | |
Dividends from net investment income | | | — | |
Dividends from net realized gains | | | — | |
Total distributions | | | — | |
Net asset value, end of period | | | $10.50 | |
Ratios and supplemental data: | | | | |
Total return(b) | | | 4.90% | |
Net assets, end of period (000) | | | $12,704 | |
Ratio of net expenses to average net assets | | | 1.92% | (c) |
Ratio of gross expenses to average net assets prior to expense reductions | | | 7.45% | (c) |
Ratio of net investment income (loss) to average net assets | | | (0.28% | )(c) |
Ratio of net expenses, excluding dividend expense on short positions, to average net assets | | | 1.75% | (c) |
| * | Commencement of operations. |
| ** | Amounts are less than $0.005. |
| (a) | Net investment income allocated based on average shares method. |
| (b) | Total return measures net investment income (loss) and capital gain or loss from portfolio investments assuming reinvestment of dividends and capital gains distributions. Total return is not annualized for periods that are less than a full year, does not reflect the effect of sales charge for Class A shares nor the contingent deferred sales charge for Class B and C shares and does not reflect the deduction of taxes that a shareholder would pay on fund distributions or the redemption of fund shares. |
| | | | |
| 252 | | CALAMOS OPEN-END FAMILY OF FUNDS SEMIANNUAL REPORT | | |
Calamos Long/Short Fund Financial Highlights
Selected data for a share outstanding throughout each period were as follows:
| | | | | | | | | | | | | | | | |
| | | CLASS A | |
| | | (Unaudited)
Six Months
Ended
April 30, | | | Year Ended October 31, | | | June 3, 2013*
through
October 31, | |
| | | 2016 | | | 2015 | | | 2014 | | | 2013 | |
Net asset value, beginning of period | | | $10.72 | | | | $10.84 | | | | $10.28 | | | | $10.00 | |
Income from investment operations: | | | | | | | | | | | | | | | | |
Net investment income (loss)(a) | | | (0.05 | ) | | | (0.15 | ) | | | (0.11 | ) | | | (0.06 | ) |
Net realized and unrealized gain (loss) | | | (0.42 | ) | | | 0.16 | | | | 0.76 | | | | 0.34 | |
Total from investment operations | | | (0.47 | ) | | | 0.01 | | | | 0.65 | | | | 0.28 | |
Distributions: | | | | | | | | | | | | | | | | |
Dividends from net investment income | | | — | | | | — | | | | (0.06 | ) | | | — | |
Dividends from net realized gains | | | — | | | | (0.13 | ) | | | (0.03 | ) | | | — | |
Total distributions | | | — | | | | (0.13 | ) | | | (0.09 | ) | | | — | |
Net asset value, end of period | | | $10.25 | | | | $10.72 | | | | $10.84 | | | | $10.28 | |
Ratios and supplemental data: | | | | | | | | | | | | | | | | |
Total return(b) | | | (4.38% | ) | | | 0.09% | | | | 6.33% | | | | 2.80% | |
Net assets, end of period (000) | | | $14,459 | | | | $30,304 | | | | $39,722 | | | | $9,258 | |
Ratio of net expenses to average net assets | | | 2.58% | (c) | | | 2.26% | | | | 2.57% | | | | 2.42% | (c) |
Ratio of gross expenses to average net assets prior to expense reductions | | | 2.58% | (c) | | | 2.26% | | | | 2.57% | | | | 3.03% | (c) |
Ratio of net investment income (loss) to average net assets | | | (0.97% | )(c) | | | (1.37% | ) | | | (1.07% | ) | | | (1.53% | )(c) |
Ratio of net expenses, excluding dividend expense on short positions, to average net assets | | | 1.88% | (c) | | | 1.78% | | | | 1.79% | | | | 2.00% | (c) |
| | | |
| | | (Unaudited)
Six Months
Ended
April 30, | | | Year Ended October 31, | | | June 3, 2013*
through
October 31, | |
| | | 2016 | | | 2015 | | | 2014 | | | 2013 | |
Portfolio turnover rate | | | 73.3% | | | | 154.9% | | | | 260.4% | | | | 132.1% | |
| * | Commencement of operations. |
| (a) | Net investment income (loss) allocated based on average shares method. |
| (b) | Total return measures net investment income (loss) and capital gain or loss from portfolio investments assuming reinvestment of dividends and capital gains distributions. Total return is not annualized for periods that are less than a full year, does not reflect the effect of sales charge for Class A shares nor the contingent deferred sales charge for Class C shares and does not reflect the deduction of taxes that a shareholder would pay on fund distributions or the redemption of fund shares. |
Calamos Long/Short Fund Financial Highlights
| | | | | | | | | | | | | | | | |
| | | CLASS C | |
| | | (Unaudited)
Six Months
Ended
April 30, | | | Year Ended October 31, | | | June 3, 2013*
through
October 31, | |
| | | 2016 | | | 2015 | | | 2014 | | | 2013 | |
Net asset value, beginning of period | | | $10.54 | | | | $10.74 | | | | $10.24 | | | | $10.00 | |
Income from investment operations: | | | | | | | | | | | | | | | | |
Net investment income (loss)(a) | | | (0.09 | ) | | | (0.23 | ) | | | (0.23 | ) | | | (0.09 | ) |
Net realized and unrealized gain (loss) | | | (0.41 | ) | | | 0.16 | | | | 0.81 | | | | 0.33 | |
Total from investment operations | | | (0.50 | ) | | | (0.07 | ) | | | 0.58 | | | | 0.24 | |
Distributions: | | | | | | | | | | | | | | | | |
Dividends from net investment income | | | — | | | | — | | | | (0.05 | ) | | | — | |
Dividends from net realized gains | | | — | | | | (0.13 | ) | | | (0.03 | ) | | | — | |
Total distributions | | | — | | | | (0.13 | ) | | | (0.08 | ) | | | — | |
Net asset value, end of period | | | $10.04 | | | | $10.54 | | | | $10.74 | | | | $10.24 | |
Ratios and supplemental data: | | | | | | | | | | | | | | | | |
Total return(b) | | | (4.74% | ) | | | (0.66% | ) | | | 5.66% | | | | 2.40% | |
Net assets, end of period (000) | | | $4,269 | | | | $4,986 | | | | $6,489 | | | | $383 | |
Ratio of net expenses to average net assets | | | 3.43% | (c) | | | 3.01% | | | | 3.23% | | | | 3.13% | (c) |
Ratio of gross expenses to average net assets prior to expense reductions | | | 3.43% | (c) | | | 3.01% | | | | 3.23% | | | | 3.52% | (c) |
Ratio of net investment income (loss) to average net assets | | | (1.79% | )(c) | | | (2.11% | ) | | | (2.22% | ) | | | (2.22% | )(c) |
Ratio of net expenses, excluding dividend expense on short positions, to average net assets | | | 2.65% | (c) | | | 2.53% | | | | 2.51% | | | | 2.75% | (c) |
| |
| | | CLASS I | |
| | | (Unaudited)
Six Months
Ended
April 30, | | | Year Ended October 31, | | | June 3, 2013*
through
October 31, | |
| | | 2016 | | | 2015 | | | 2014 | | | 2013 | |
Net asset value, beginning of period | | | $10.78 | | | | $10.87 | | | | $10.29 | | | | $10.00 | |
Income from investment operations: | | | | | | | | | | | | | | | | |
Net investment income (loss)(a) | | | (0.04 | ) | | | (0.12 | ) | | | (0.05 | ) | | | (0.05 | ) |
Net realized and unrealized gain (loss) | | | (0.41 | ) | | | 0.16 | | | | 0.73 | | | | 0.34 | |
Total from investment operations | | | (0.45 | ) | | | 0.04 | | | | 0.68 | | | | 0.29 | |
Distributions: | | | | | | | | | | | | | | | | |
Dividends from net investment income | | | — | | | | — | | | | (0.07 | ) | | | — | |
Dividends from net realized gains | | | — | | | | (0.13 | ) | | | (0.03 | ) | | | — | |
Total distributions | | | — | | | | (0.13 | ) | | | (0.10 | ) | | | — | |
Net asset value, end of period | | | $10.33 | | | | $10.78 | | | | $10.87 | | | | $10.29 | |
Ratios and supplemental data: | | | | | | | | | | | | | | | | |
Total return(b) | | | (4.17% | ) | | | 0.37% | | | | 6.56% | | | | 2.90% | |
Net assets, end of period (000) | | | $26,816 | | | | $47,488 | | | | $83,654 | | | | $36,433 | |
Ratio of net expenses to average net assets | | | 2.38% | (c) | | | 2.01% | | | | 2.10% | | | | 2.09% | (c) |
Ratio of gross expenses to average net assets prior to expense reductions | | | 2.38% | (c) | | | 2.01% | | | | 2.10% | | | | 2.34% | (c) |
Ratio of net investment income (loss) to average net assets | | | (0.78% | )(c) | | | (1.13% | ) | | | (0.43% | ) | | | (1.16% | )(c) |
Ratio of net expenses, excluding dividend expense on short positions, to average net assets | | | 1.64% | (c) | | | 1.52% | | | | 1.55% | | | | 1.75% | (c) |
| * | Commencement of operations. |
| (a) | Net investment income (loss) allocated based on average shares method. |
| (b) | Total return measures net investment income (loss) and capital gain or loss from portfolio investments assuming reinvestment of dividends and capital gains distributions. Total return is not annualized for periods that are less than a full year, does not reflect the effect of sales charge for Class A shares nor the contingent deferred sales charge for Class C shares and does not reflect the deduction of taxes that a shareholder would pay on fund distributions or the redemption of fund shares. |
| | | | |
| 254 | | CALAMOS OPEN-END FAMILY OF FUNDS SEMIANNUAL REPORT | | |
Calamos Long/Short Fund Financial Highlights
| | | | | | | | | | | | | | | | |
| | | CLASS R | |
| | | (Unaudited)
Six Months
Ended
April 30, | | | Year Ended October 31, | | | June 3, 2013*
through
October 31, | |
| | | 2016 | | | 2015 | | | 2014 | | | 2013 | |
Net asset value, beginning of period | | | $10.66 | | | | $10.81 | | | | $10.27 | | | | $10.00 | |
Income from investment operations: | | | | | | | | | | | | | | | | |
Net investment income (loss)(a) | | | (0.06 | ) | | | (0.17 | ) | | | (0.07 | ) | | | (0.07 | ) |
Net realized and unrealized gain (loss) | | | (0.40 | ) | | | 0.15 | | | | 0.69 | | | | 0.34 | |
Total from investment operations | | | (0.46 | ) | | | (0.02 | ) | | | 0.62 | | | | 0.27 | |
Distributions: | | | | | | | | | | | | | | | | |
Dividends from net investment income | | | — | | | | — | | | | (0.05 | ) | | | — | |
Dividends from net realized gains | | | — | | | | (0.13 | ) | | | (0.03 | ) | | | — | |
Total distributions | | | — | | | | (0.13 | ) | | | (0.08 | ) | | | — | |
Net asset value, end of period | | | $10.20 | | | | $10.66 | | | | $10.81 | | | | $10.27 | |
Ratios and supplemental data: | | | | | | | | | | | | | | | | |
Total return(b) | | | (4.40% | ) | | | (0.10% | ) | | | 6.06% | | | | 2.70% | |
Net assets, end of period (000) | | | $26 | | | | $109 | | | | $109 | | | | $103 | |
Ratio of net expenses to average net assets | | | 2.93% | (c) | | | 2.51% | | | | 2.68% | | | | 2.60% | (c) |
Ratio of gross expenses to average net assets prior to expense reductions | | | 2.93% | (c) | | | 2.51% | | | | 2.68% | | | | 3.26% | (c) |
Ratio of net investment income (loss) to average net assets | | | (1.26% | )(c) | | | (1.62% | ) | | | (0.64% | ) | | | (1.68% | )(c) |
Ratio of net expenses, excluding dividend expense on short positions, to average net assets | | | 2.14% | (c) | | | 2.03% | | | | 2.08% | | | | 2.25% | (c) |
| * | Commencement of operations. |
| (a) | Net investment income (loss) allocated based on average shares method. |
| (b) | Total return measures net investment income (loss) and capital gain or loss from portfolio investments assuming reinvestment of dividends and capital gains distributions. Total return is not annualized for periods that are less than a full year, does not reflect the effect of sales charge for Class A shares nor the contingent deferred sales charge for Class C shares and does not reflect the deduction of taxes that a shareholder would pay on fund distributions or the redemption of fund shares. |
Report of Independent Registered Public Accounting Firm
To the Board of Trustees and Shareholders of Calamos Investment Trust
We have reviewed the accompanying statements of assets and liabilities, including the schedules of investments, of Calamos Investment Trust (the “Trust”), including Calamos Growth Fund, Calamos Opportunistic Value Fund, Calamos Focus Growth Fund, Calamos Discovery Growth Fund, Calamos Dividend Growth Fund, Calamos Mid Cap Growth Fund, Calamos International Growth Fund, Calamos Evolving World Growth Fund, Calamos Emerging Market Equity Fund, Calamos Global Equity Fund, Calamos Growth and Income Fund, Calamos Global Growth and Income Fund, Calamos Convertible Fund, Calamos Global Convertible Fund, Calamos Total Return Bond Fund, Calamos High Income Fund, Calamos Market Neutral Income Fund, Calamos Hedged Equity Income Fund, Calamos Phineus Long/Short Fund, and Calamos Long/Short Fund (the “Funds”), as of April 30, 2016, and the related statements of operations and changes in net assets, and the financial highlights for the six month period then ended. These financial statements and financial highlights are the responsibility of the Trust’s management.
We conducted our reviews in accordance with standards of the Public Company Accounting Oversight Board (United States). A review of financial information consists principally of applying analytical procedures and making inquiries of persons responsible for financial and accounting matters. It is substantially less in scope than an audit conducted in accordance with standards of the Public Company Accounting Oversight Board (United States), the objective of which is the expression of an opinion regarding the financial statements and financial highlights taken as a whole. Accordingly, we do not express such an opinion.
Based on our reviews, we are not aware of any material modifications that should be made to such financial statements and financial highlights for them to be in conformity with accounting principles generally accepted in the United States of America.
We have previously audited, in accordance with the standards of the Public Company Accounting Oversight Board (United States), the statements of changes in net assets of the Funds for the year or period ended October 31, 2015 and the financial highlights for each of the periods presented in the period then ended; and in our report dated December 16, 2015, we expressed an unqualified opinion on such statements of changes in net assets and financial highlights.

Chicago, Illinois
June 15, 2016
| | | | |
| 256 | | CALAMOS OPEN-END FAMILY OF FUNDS SEMIANNUAL REPORT | | |
Trustee Approval of Management Agreement (Unaudited)
The Board of Trustees of the Calamos Phineus Long/Short Fund (the “New Fund”) oversees the management of the New Fund, and, as required by law, determines whether to approve the New Fund’s management agreement with Calamos Advisors (the “Adviser”) pursuant to which the Adviser serves as the investment manager and administrator for the New Fund. The “Independent Trustees,” who comprise more than 80% of the Board, have never been affiliated with the Adviser.
In connection with their consideration regarding the approval of the management agreement, the Trustees received and reviewed a substantial amount of information provided by the Adviser in response to detailed requests of the Independent Trustees and their independent legal counsel. In the course of their consideration of the agreement, the Independent Trustees were advised by their counsel and, in addition to meeting with management of the Adviser, they met separately in executive session with their counsel.
At a meeting held on December 15, 2015, based on their evaluation of the information referred to above and other information, the Trustees determined that the overall arrangements between the New Fund and the Adviser were fair and reasonable in light of the nature, extent and quality of the services provided by the Adviser and its affiliates, the fees charged for those services and other matters that the Trustees considered relevant in the exercise of their business judgment. At that meeting, the Trustees, including all of the Independent Trustees, approved the management agreement through July 31, 2016, subject to possible earlier termination as provided in the agreement.
In connection with its consideration of the management agreement, the Board considered, among other things: (i) the nature, extend and quality of the Adviser’s services to be provided, (ii) the fees and other expenses paid by the New Fund as well as expense information for comparable funds, (iii) the expected profitability of the Adviser and its affiliates from their relationship with the New Fund, (iv) whether economies of scale may be realized as the New Fund grows and whether potential economies may be shared, in some measure, with the New Fund’s investors;, and (v) other benefits to the Adviser from its relationship with the New Fund. In the Board’s deliberations, no single factor was responsible for the Board’s decision to approve the management agreement, and each Trustee may have afforded different weight to the various factors.
Nature, Extent and Quality of Services. The Board’s consideration of the nature, extent and quality of the Adviser’s services to be provided to the New Fund took into account the knowledge gained from the Board’s meetings with the Adviser throughout the year. In addition, the Board considered: the Adviser’s long-term history of managing the other Funds in the Calamos fund complex; the consistency of investment approach; the background and experience of the Adviser’s investment personnel responsible for managing the New Fund; and the Adviser’s performance as administrator of the other Funds in the fund complex, including, among other things, in the areas of brokerage selection, trade execution, compliance and shareholder communications. The Board also considered the expertise of the Fund’s portfolio manager and his historical performance results. The Board also reviewed the Adviser’s resources and key personnel expected to provide investment management services to the New Fund. Last, the Board considered compliance reports about the Adviser from the Trust’s Chief Compliance Officer. The Board concluded that the nature, extent and quality of the services to be provided by the Adviser to the New Fund were appropriate and consistent with the management agreement and that the New Fund was likely to benefit from services provided under the management agreement with the Adviser.
Investment Performance of the Fund. Because the New Fund has not yet commenced operations, the Board did not consider the investment performance of the New Fund, though it did consider the portfolio manager’s historical performance record.
Costs of Services Provided and Profits Realized by the Adviser. The Board evaluated the New Fund’s proposed management fee rates and estimated total expense ratios as compared to information provided by the Adviser regarding the median management fee rate and total expense ratios of the New Fund’s Morningstar Peer Group (the New Fund’s “Expense Group”). The Board noted the Adviser’s agreement to reimburse the New Fund for a portion of its expenses if the New Fund’s expense ratio otherwise would exceed a certain level. In light of all the information presented, the Board concluded that it would be in the best interest of the New Fund and its shareholders to approve the management agreement.
Economies of Scale and Fee Levels Reflecting Those Economies. The Board considered whether the New Fund’s proposed management fee shares with shareholders potential economies of scale that may be achieved by the Adviser. The Board recognized that breakpoints in the proposed fee schedule for the New Fund could result in the sharing of economies of scale as the New Fund’s assets increase. The Board also considered the Adviser’s agreement to reimburse the New Fund for a portion of its expenses if the New Fund’s respective expense ratios otherwise would exceed a certain level. The Board concluded that the breakpoints in the
Trustee Approval of Management Agreement (Unaudited)
proposed fee schedules for the New Fund allow shareholder to benefit from potential economies of scale that may be achieved be the Adviser.
Profitability. The Board did not consider information concerning the costs incurred and profits realized by the Adviser as the New Fund had not yet commenced operations.
Other Benefits Derived from the Relationship with the Fund. The Board considered other benefits that could accrue to the Adviser and its affiliates from their relationship with the New Fund. The Board also considered the Adviser’s use of a portion of the commissions paid by the New Fund on its portfolio brokerage transactions to obtain research products and services benefiting the New Fund and/or other clients of the Adviser.
After full consideration of the above factors as well as other factors that were instructive in their consideration, the Trustees, including all of the Independent Trustees, concluded that the proposed amendment to the Trust’s management agreement with the Adviser to add the New Fund was in the best interest of the New Fund and its shareholders.
| | | | |
| 258 | | CALAMOS OPEN-END FAMILY OF FUNDS SEMIANNUAL REPORT | | |
MANAGING YOUR CALAMOS FUNDS INVESTMENTS
Calamos Investments offers several convenient means to monitor, manage and feel confident about your Calamos investment choice.
24-HOUR AUTOMATED SHAREHOLDER ASSISTANCE: 800.823.7386
Through a single toll-free number, Calamos 24-Hour Shareholder Assistance is fast and easy. Get fund prices and account balances, review recent transactions, order statements, literature and more.
PERSONAL ASSISTANCE: 800.582.6959
Dial this toll-free number to speak with a knowledgeable Client Services Representative who can help answer questions or address issues concerning your Calamos Fund.
ONLINE ACCOUNT MANAGEMENT: www.calamos.com
Manage your personal account of Calamos Funds online at www.calamos.com. On your account access page, you can view account history and download data.
YOUR FINANCIAL ADVISOR
We encourage you to talk to your financial advisor to determine how the Calamos Funds can benefit your investment portfolio based on your financial goals, risk tolerance, time horizon and income needs.
This report, including the audited financial statements contained herein, is submitted for general information for the shareholders of the Funds. The report is not authorized for distribution to prospective investors in the Funds unless accompanied by a currently effective prospectus of the Funds and, after July 31, 2016, updated performance data for the most recently completed fiscal quarter. The views expressed in this report reflect those of Calamos Advisors LLC only through April 30, 2016. The managers’ views are subject to change at any time based on market and other conditions.
A description of the Calamos Proxy Voting Policies and Procedures and the Funds’ proxy voting record for the 12-month period ended June 30, 2015 are available free of charge upon request by calling 800.582.6959, by visiting the Calamos Web site at www.calamos.com, or by writing Calamos at: Calamos Investments, Attn: Client Services, 2020 Calamos Court, Naperville, IL 60563. The Funds’ proxy voting record is also available free of charge by visiting the SEC Web site at www.sec.gov.
The Funds file a complete list of their portfolio holdings with the SEC for the first and third quarters each fiscal year on Form N-Q. The Forms N-Q are available free of charge, upon request, by calling or writing Calamos Investments at the phone number or address provided above or by visiting the SEC Web site at www.sec.gov. You may also review or, for a fee, copy the forms at the SEC’s Public Reference Room in Washington, D.C. Information on the operation of the Public Reference Room may be obtained by calling 800.732.0330.
FOR 24-HOUR AUTOMATED SHAREHOLDER ASSISTANCE: 800.823.7386
TO OBTAIN INFORMATION ABOUT YOUR INVESTMENTS: 800.582.6959
VISIT OUR WEB SITE: www.calamos.com
INVESTMENT ADVISER:
Calamos Advisors LLC
2020 Calamos Court
Naperville, IL 60563-2787
CUSTODIAN AND FUND ACCOUNTING AGENT:
State Street Bank and Trust Company
Boston, MA
TRANSFER AGENT:
U.S. Bancorp Fund Services, LLC
615 E. Michigan St., 3rd Floor
Milwaukee, WI 53202
INDEPENDENT REGISTERED PUBLIC ACCOUNTING FIRM:
Deloitte & Touche LLP
Chicago, IL
LEGAL COUNSEL:
Ropes & Gray LLP
Chicago, IL
| | |

| | STAY CONNECTED www.calamos.com/connect |
|
Visit our Web site for timely fund performance, detailed fund profiles, fund news and insightful market commentary. |

2020 Calamos Court
Naperville, IL 60563-2787
800.582.6959
www.calamos.com
© 2016 Calamos Investments LLC. All Rights Reserved.
Calamos® and Calamos Investments® are registered
trademarks of Calamos Investments LLC.
MFSAN 1631 2016
ITEM 2. CODE OF ETHICS.
Not applicable.
ITEM 3. AUDIT COMMITTEE FINANCIAL EXPERT.
Not applicable.
ITEM 4. PRINCIPAL ACCOUNTANT FEES AND SERVICES.
Not applicable.
ITEM 5. AUDIT COMMITTEE OF LISTED REGISTRANTS.
Not applicable.
ITEM 6. SCHEDULE OF INVESTMENTS
Included in the Report to Shareholders in Item 1.
ITEM 7. DISCLOSURE OF PROXY VOTING POLICIES AND PROCEDURES FOR CLOSED-END MANAGEMENT INVESTMENT COMPANIES.
Not applicable.
ITEM 8. PORTFOLIO MANAGERS OF CLOSED-END MANAGEMENT INVESTMENT COMPANIES.
Not applicable.
ITEM 9. PURCHASES OF EQUITY SECURITIES BY CLOSED-END MANAGEMENT INVESTMENT COMPANY AND AFFILIATED PURCHASERS.
Not applicable.
ITEM 10. SUBMISSION OF MATTERS TO A VOTE OF SECURITY HOLDERS.
No material changes.
ITEM 11. CONTROLS AND PROCEDURES.
a) The registrant’s principal executive officer and principal financial officer have evaluated the registrant’s disclosure controls and procedures within 90 days of this filing and have concluded that the registrant’s disclosure controls and procedures were effective, as of that date, in ensuring that information required to be disclosed by the registrant in this Form N-CSR was recorded, processed, summarized, and timely reported.
b) There were no changes in the registrant’s internal controls over financial reporting (as defined in Rule 30a-3(d) under the Investment Company Act of 1940) that occurred during the second fiscal quarter of the period covered by this report that has materially affected, or is reasonably likely to materially affect, the registrant’s internal control over financial reporting.
ITEM 12. EXHIBITS.
(a)(1) Code of Ethics - Not applicable.
(a)(2)(i) Certification of Principal Executive Officer.
(a)(2)(ii) Certification of Principal Financial Officer.
SIGNATURES
Pursuant to the requirements of the Securities Exchange Act of 1934 and the Investment Company Act of 1940, the registrant has duly caused this report to be signed on its behalf by the undersigned, thereunto duly authorized.
Calamos Investment Trust
| | |
| |
| By: | | /s/ John P. Calamos, Sr. |
| Name: | | John P. Calamos, Sr. |
| Title: | | Principal Executive Officer |
| Date: | | June 21, 2016 |
| | |
| |
| By: | | /s/ Nimish S. Bhatt |
| Name: | | Nimish S. Bhatt |
| Title: | | Principal Financial Officer |
| Date: | | June 21, 2016 |
Pursuant to the requirements of the Securities Exchange Act of 1934 and the Investment Company Act of 1940, this report has been signed by the following persons on behalf of the registrant and in the capacities and on the dates indicated.
| | |
| |
| By: | | /s/ John P. Calamos, Sr. |
| Name: | | John P. Calamos, Sr. |
| Title: | | Principal Executive Officer |
| Date: | | June 21, 2016 |
| | |
| |
| By: | | /s/ Nimish S. Bhatt |
| Name: | | Nimish S. Bhatt |
| Title: | | Principal Financial Officer |
| Date: | | June 21, 2016 |