UNITED STATES
SECURITIES AND EXCHANGE COMMISSION
Washington, D.C. 20549
FORM N-CSR
CERTIFIED SHAREHOLDER REPORT OF REGISTERED
MANAGEMENT INVESTMENT COMPANIES
| | |
INVESTMENT COMPANY ACT FILE NUMBER: | | 811-05443 |
| |
| EXACT NAME OF REGISTRANT AS SPECIFIED IN CHARTER: | | Calamos Investment Trust |
| |
ADDRESS OF PRINCIPAL EXECUTIVE OFFICES: | | 2020 Calamos Court, Naperville Illinois 60563-2787 |
| |
NAME AND ADDRESS OF AGENT FOR SERVICE: | | John P Calamos, Sr., Founder, Chairman and Global Chief Investment Officer Calamos Advisors LLC 2020 Calamos Court, Naperville, Illinois 60563-2787 |
REGISTRANT’S TELEPHONE NUMBER, INCLUDING AREA CODE: (630) 245-7200
DATE OF FISCAL YEAR END: October 31, 2018
DATE OF REPORTING PERIOD: November 1, 2017 through October 31, 2018

Experience and Foresight
About Calamos Investments
For over 40 years, we have helped investors like you manage and build wealth to meet long-term objectives. Because investors have different time horizons, risk tolerances and goals, we offer funds to suit a variety of asset allocation needs. Our 17 mutual funds include equity, fixed income, convertible and alternative funds. We offer U.S. funds as well as global and international choices.
We are dedicated to helping our clients build and protect wealth. We understand when you entrust us with your assets, you also entrust us with your achievements, goals and aspirations. We believe we best honor this trust by making investment decisions guided by integrity, discipline and our conscientious research.
We believe an active, risk-conscious approach is essential for wealth creation. In our early years, we pioneered the use of convertible securities as a means to control risk in volatile markets. We followed with strategies that combine convertibles and stocks, with the aim of participating in equity market upside with potentially less volatility than an all-stock portfolio. In the 1990s, we introduced our first stock fund, which invests in growth companies both large and small. Across our funds, our investment process seeks to manage risk at multiple levels and draws upon our experience investing through many market cycles. In a rapidly changing environment, we believe that this active management is essential.
We are global in our perspective. We believe globalization offers tremendous opportunities for countries and companies all over the world. In our U.S., global and international portfolios, we are seeking to capitalize on the potential growth of the global economy.
We believe there are opportunities in all markets. Our history traces back to the 1970s, a period of significant volatility and economic concerns. Since then, we have invested through multiple market cycles, each with its own challenges. Out of this experience comes our belief that the flipside of volatility is opportunity.
Letter to Shareholders

JOHN P. CALAMOS, SR.
Founder, Chairman and Global Chief Investment Officer
Dear Fellow Shareholder:
Welcome to your annual report for the 12-month period ended October 31, 2018. In this report, you will find commentary from the Calamos portfolio management teams, as well as a listing of portfolio holdings, financial statements and highlights, and detailed information about the performance and positioning of the Calamos Funds.
Market Review
The global economy continued to expand during the reporting period, with especially strong fundamentals in the United States. Nonetheless, markets experienced turbulence, with non-U.S. markets facing the greatest pressures. A variety of factors contributed to investor apprehension, including trade policy uncertainty, rising U.S. interest rates, political uncertainties, and fears of softening global growth. In October, anxiety intensified, resulting in a selloff across global financial markets.
For the 12 months overall, U.S. stocks and convertible securities outperformed global averages.1 Within the fixed income market, high yield securities and shorter-term bonds were more resilient than investment-grade and longer-term issues.2
Outlook
The U.S. economy is likely to maintain its growth trajectory through 2019. Unemployment is low, inflation is contained, consumer and small business confidence are strong, and capital spending is increasing. Deregulation and tax reform have already provided a powerful tailwind for U.S. economic activity and corporate earnings, but we believe the full measure of these policies has yet to be fully reflected in the economy. We expect the Federal Reserve to continue raising interest rates slowly in response to healthy economic conditions, but we do not believe these gradual increases represent an imminent threat to the U.S. economy or markets. Political gridlock is likely, which market participants may welcome if the fiscal policies put in place over recent years remain intact.
Outside the U.S., economic fundamentals are less strong on a relative basis and there is a wide range of political unknowns. However, there are a number of potential tailwinds for growth, such more stimulative fiscal policy in China and Europe, and supportive policies from global central banks. Additionally, many global investments are trading at what we believe are attractive prices.
Letter to Shareholders
As we look forward, we see continued opportunities in stocks, as well as in other economically sensitive areas of the market, such as convertible securities and high yield bonds. Selectivity and risk management will remain essential: Political, geopolitical, and interest rate uncertainties are likely to contribute to ongoing market volatility and shifts in market leadership as the economic cycle matures.
We believe the Calamos Funds are well positioned for the environment we expect. Our portfolio management teams are using rigorous research to take advantage of the volatility in the markets, adding to positions when valuations are attractive and locking in gains when prices rise. They remain highly attentive to the interests of the shareholders in the funds, including the need for appropriate levels of downside risk management.
Navigating Volatility: Strategies for Investors
Volatility can be challenging, but it is important to keep a long-term perspective about short-term market moves. Trying to time the day-to-day ups and downs in the markets is nearly impossible. Investors who make many quick moves often catch the downturns, but miss the rebounds.
If you are concerned about volatility, our fund family includes a breadth of strategies positioned with the aim of providing upside market participation with potentially less downside. These more defensive approaches include Calamos Convertible Fund (fund commentary on page 16), Calamos Growth and Income Fund (page 28) and Calamos Global Growth and Income Fund (page 54). Your financial advisor can tell you more about how these funds could support your asset allocation needs.
Your advisor may also discuss enhancing your portfolio’s diversification by adding liquid alternative strategies. For example, Calamos Market Neutral Income Fund (page 4) can serve as an alternative to traditional fixed income strategies. For a defensive equity allocation, our alternatives include Calamos Hedged Equity Income Fund (page 8) and Calamos Phineus Long/Short Fund (page 11).
Introducing Calamos Short-Term Bond Fund
Fixed income funds can play an important role in an asset allocation strategy, providing diversification for stock allocations as well as opportunities for income. This year, we launched Calamos Short-Term Bond Fund for investors who seek high current income but are also concerned with principal preservation. The Fund’s strategy, managed by the Calamos Investment Management team and led by Co-Chief Investment Officer Matt Freund, has the flexibility to invest in a broad investment universe, which I believe provides enhanced opportunities to generate income and manage risk. You can read more about the Fund in the commentary that begins on page 66.
| | | | |
| 2 | | CALAMOS OPEN-END FAMILY OF FUNDS ANNUAL REPORT | | |
Letter to Shareholders
Conclusion
On behalf of all of us at Calamos Investments, thank you for entrusting us with your assets. I encourage you to visit our website, www.calamos.com, on an ongoing basis for updates about the Funds and the markets, as well as additional information about asset allocation.
Sincerely,

John P. Calamos, Sr.
Founder, Chairman and Global Chief Investment Officer
Before investing, carefully consider a fund’s investment objectives, risks, charges and expenses. Please see the prospectus containing this and other information which can be obtained by calling 800.582.6959. Please read the prospectus carefully. Performance data represents past performance, which is no guarantee of future results. Current performance may be lower or higher than the performance quoted. Opinions are as of the publication date, subject to change and may not come to pass. Information is for informational purposes only and should not be considered investment advice.
Diversification and asset allocation do not guarantee a profit or protection against a loss.
| 1 | The MSCI All Country World Index is a measure of global stock market performance, which returned 0.00% for the 12-month period ending October 31, 2018. The S&P 500 Index is an unmanaged index generally considered representative of the U.S. stock market. For the 12-month period, the index returned 7.35%. The ICE BofAML All U.S. Convertibles Ex Mandatory Index represents the U.S. convertible securities market excluding mandatory convertibles. The index returned 4.05% for the 12-month period. The Thomson Reuters Global Convertible Bond Index is designed to broadly represent the global convertible bond market. The index returned -1.36% for the 12-month period. |
| 2 | The Bloomberg Barclays U.S. Aggregate Bond Index is considered generally representative of the investment-grade bond market. For the 12-month period ended October 31, 2018, the index returned -2.05%. The Bloomberg Barclays U.S. High Yield 2% Issuer Capped Index measures the performance of high yield corporate bonds with a maximum allocation of 2% to any one issuer. The index returned 0.98% for the 12-month period ended October 31, 2018. The Bloomberg Barclays U.S. Government/Credit 1-3 Years Index includes all medium and larger issues of U.S. government, investment-grade corporate, and investment-grade international dollar-denominated bonds that have maturities of between 1 and 3 years and are publicly issued. The index returned 0.34% for the 12-month period. The Bloomberg Barclays U.S. Government/Credit Index comprises long-term government and investment grade corporate debt securities and is generally considered representative of the performance of the broad U.S. bond market. The index returned -2.31% for the 12-month period. |
Source: Lipper, Inc. Unmanaged index returns assume reinvestment of any and all distributions and, unlike fund returns, do not reflect fees, expenses or sales charges. Investors cannot invest directly in an index. Investments in overseas markets pose special risks, including currency fluctuation and political risks. These risks are generally intensified for investments in emerging markets. Countries, regions, and sectors mentioned are presented to illustrate countries, regions, and sectors in which a fund may invest. Fund holdings are subject to change daily. The Funds are actively managed. The information contained herein is based on internal research derived from various sources and does not purport to be statements of all material facts relating to the securities mentioned. The information contained herein, while not guaranteed as to accuracy or completeness, has been obtained from sources we believe to be reliable. There are certain risks involved with investing in convertible securities in addition to market risk, such as call risk, dividend risk, liquidity risk and default risk, that should be carefully considered prior to investing.
This information is being provided for informational purposes only and should not be considered investment advice or an offer to buy or sell any security in the portfolio. Investments in alternative strategies may not be suitable for all investors.
Calamos Market Neutral Income Fund
OVERVIEW
The fund’s core market strategies include covered call writing and convertible arbitrage. Together, these strategies intend to provide the fund with an enhanced potential for risk-managed returns due to their differing responses to volatility.
KEY FEATURES
| | ◾ | | One of the first alternative mutual funds capitalizes on more than three decades of experience in the convertible space | |
| | ◾ | | Lower correlation with most fixed income benchmarks provides a means to dampen volatility | |
| | ◾ | | Risk-management focus blends strategies to achieve the most appropriate risk/reward profile | |
PORTFOLIO FIT
The fund may provide potential diversification, particularly in a low-interest-rate environment.
| | |
| FUND NASDAQ SYMBOLS |
A Shares | | CVSIX |
C Shares | | CVSCX |
I Shares | | CMNIX |
| |
|
| FUND CUSIP NUMBERS |
A Shares | | 128119203 |
C Shares | | 128119849 |
I Shares | | 128119880 |
| |
CALAMOS MARKET NEUTRAL INCOME FUND
INVESTMENT TEAM DISCUSSION
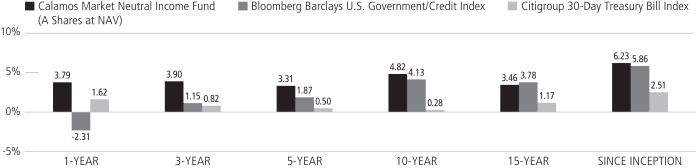
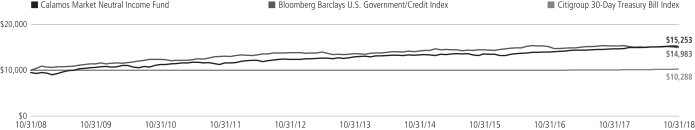
For the 12-month period ended October 31, 2018, Calamos Market Neutral Income Fund returned 3.79% (Class A shares at net asset value), strongly outperforming both the -2.31% loss of the Bloomberg Barclays U.S. Government/Credit Bond Index and the 1.62% increase for the Citigroup 30-Day U.S. Treasury Bill Index.
For both the 5-year and 10-year periods ended October 31, 2018, the Fund’s A shares return ranked in the 15th percentile and 18th percentile, respectively, in the Morningstar Market Neutral category peer group.* Launched more than 25 years ago, the strategy is one of the first liquid alternative mutual funds and blends two main strategies, convertible arbitrage and covered call writing. In addition to offering an attractive historical risk/reward profile, the Fund may enhance long-term portfolio diversification potential, especially versus fixed income securities.
Both strategies utilized in the Fund, convertible arbitrage and covered call writing, contributed positively to performance during a period that included rising interest rates. Since its inception on September 4, 1990, the Fund gained 6.23% on an annualized basis (Class A Shares at net asset value). For the same period, the Bloomberg Barclays U.S. Government/Credit Bond Index gained 5.86%, while the Citigroup 30-Day U.S. Treasury bill Index returned 2.51%.
What factors influenced performance during the reporting period?
The Fund’s fiscal year was characterized by several bouts of volatility that were conducive to the Fund’s ability to “monetize volatility” through frequent rebalancing of our option and convertible arbitrage hedges. The convertible and equity markets began the period (toward the end of 2017) in positive territory as investors cheered strong corporate earnings, the passing of corporate and individual tax reform, a smooth Fed Chairman transition, low unemployment and stronger economic growth. In February 2018, these positive sentiments were challenged by concerns of rising inflation and interest rates, President Trump’s tariffs, and uncertainty regarding the midterm elections. The S&P 500 Index began the period with a 12% gain, corrected 10% in late January and into February 2018, then bounced back 8%, only to see another 7% correction toward the end of March. The markets then rose fairly steadily until October when yet another 7% drop occurred.
As the markets saw significant advances, the profit on long convertible positions outpaced losses on the short common stock positions, while the long call options in our option trading strategy provided positive returns. When the markets declined, the portfolio’s short equity positions delivered larger gains than long convertible losses and the long puts provided downside protection and profits. As the markets swung back and forth, we opportunistically rebalanced our hedges and generated trading profits.
The Fund also performed well against a backdrop of rising interest rates and delivered on its premise of providing bond-like results without taking on bond-like risk exposures. The Federal Reserve hiked its target fed funds rate range by 25 basis points four times during the period to between 2.00% and 2.25%. The 3-year U.S. Treasury yield increased from 1.73% to 2.93%, while the 5-year U.S. Treasury yield moved from 2.01% to 2.98%. The 10-year U.S. Treasury yield increased from 2.38% to 3.15% and traded above 3% for the first time since January 2014.
| * | Data is as of 10/31/18. Morningstar category percentile ranking is based on annualized total return for the 5-year and 10-year periods. Calamos Market Neutral Income Fund Class A Shares were in the 17th, 17th, 15th, and 18th percentiles of 161, 131, 94 and 34 funds for the 1-year, 3-year, 5-year and 10-year periods, respectively, for the Morningstar Market Neutral category. |
| | | | |
| 4 | | CALAMOS OPEN-END FAMILY OF FUNDS ANNUAL REPORT | | |
Calamos Market Neutral Income Fund
The CBOE Volatility Index (VIX) increased from 10.18 at the beginning of the period to 21.23 at period end, but attained a high of 37.32 on February 5, 2018. Elevated option skew† was present during the majority of the reporting period though it declined as volatility spiked. The Credit Suisse “Fear Barometer” Index, an index that compares the relative value of calls versus puts, had begun the period at 32.26 (well above the 20.65 historical average), which indicated that calls were priced relatively cheap when compared to puts. While the index finished the year at 21.99, it maintained an elevated 29.13 level throughout the year. The Fund benefited by using call and put spreads while the option markets had steep skew, which provided an affordable opportunity to construct a favorable upside/downside risk/reward profile.
How is the Fund positioned?
At the end of the reporting period, the Fund had a roughly equal allocation between the convertible arbitrage (47.2%) and covered call writing (52.8%) strategies. Our outlook projects similar though complementary risk-adjusted returns for both strategies going forward. Within convertible arbitrage, robust new convertible issuance has provided opportunities to invest in new convertibles with favorable terms and valuations.
With regard to our call positioning, skew in the options market presented an attractive opportunity to utilize call and put spreads, which benefited the portfolio’s risk/reward. By using slightly closer to the money calls, buying out of the money calls, and adding near the money put spreads, we constructed a more effective hedge with equity sensitivity similar to our historical baseline positioning. More recently, higher volatility and flatter option skew has made our typical baseline positioning look more appealing. We continue to monitor the options market for the best opportunities available and will actively adjust our positioning as conditions warrant.
What closing thoughts do you have for Fund shareholders?
We continue to expect heightened volatility from a variety of sources going forward. President Trump’s recent focus on balancing trade through tariffs may fuel volatility as investors attempt to determine the magnitude and duration of impending tariffs. Additionally, investor speculation on when and to what degree global central banks may join the U.S. Federal Reserve in quantitative tightening should also stoke volatility in both the equity and fixed income markets. We remain enthusiastic about this environment being supportive to the Calamos Market Neutral Income Fund. The Fund derives benefits from “volatility in volatility” whether from the rebalancing opportunities that higher volatility provides within the convertible arbitrage strategy or the potential to receive higher call premiums in the covered call allocation.
As the market moves into the later innings of the economic cycle, investors are facing a dilemma in terms of how to reduce equity sensitivity without embracing the interest rate sensitivity of the bond market. The Fund has historically provided bond-like returns with bond-like risk without having bond-like interest rate sensitivity. The Fund also has provided lower correlations to other asset classes. Therefore, including the Fund in an investment portfolio should provide a means to reduce equity sensitivity and to help ensure stability in a market environment that turns increasingly volatile for both stocks and bonds.
This information is not intended to be a recommendation or investment advice, and does not constitute a solicitation to buy or sell securities. Certain statements in this commentary are forward-looking statements. Discussions of specific investments are for illustration only and are not intended as recommendations of individual investments. The forward looking statements and other views expressed herein are those of the portfolio managers as of the date of this report. Actual future results or occurrence may differ significantly from those anticipated in any forward-looking statements and the views expressed herein are subject to change at any time, due to numerous market and other factors. The Fund disclaims any obligation to update publicly or review any forward-looking statements or views expressed herein.
| † | Skew describes asymmetry from the normal distribution in a set of statistical data. |
| | | | |
| SECTOR WEIGHTINGS | |
Information Technology | | | 29.2 | % |
Health Care | | | 14.8 | |
Consumer Discretionary | | | 9.6 | |
Financials | | | 9.5 | |
Communication Services | | | 8.1 | |
Industrials | | | 6.1 | |
Consumer Staples | | | 4.4 | |
Other | | | 4.3 | |
Energy | | | 3.6 | |
Utilities | | | 3.0 | |
Real Estate | | | 2.7 | |
Materials | | | 2.0 | |
Sector weightings are subject to change daily and are calculated as a percentage of net assets. The table excludes cash or cash equivalents, any government/sovereign bonds or broad based index hedging securities the Fund may hold.
Calamos Market Neutral Income Fund
| | | | |
| 6 | | CALAMOS OPEN-END FAMILY OF FUNDS ANNUAL REPORT | | |
ANNUALIZED RETURN: SINCE INCEPTION (9/4/90) THROUGH 10/31/18
Performance data quoted represents past performance, which is no guarantee of future results. Current performance may be lower or higher than the performance quoted.
The principal value and investment return of an investment will fluctuate so that your shares, when redeemed, may be worth more or less than their original cost. You can obtain performance data current to the most recent month end by visiting www.calamos.com. Average annual total return measures net investment income and capital gain or loss from portfolio investments as an annualized average. All performance shown assumes reinvestment of dividends and capital gains distributions. Performance is for the Fund’s Class A shares at net asset value and does not include the Fund’s maximum front-end sales charge of 2.25%. Had it been included, the Fund’s return would have been lower. The Fund also offers Class C and Class I shares, the performance of which may vary. Source: State Street Corporation, Lipper, Inc., and Mellon Analytical Solutions, LLC.
Calamos Market Neutral Income Fund
GROWTH OF $10,000: FOR THE 10-YEAR PERIOD ENDED 10/31/18
AVERAGE ANNUAL TOTAL RETURN† AS OF 10/31/18
| | | | | | | | | | | | | | | |
| | | 1
YEAR | | 5
YEARS | | 10
YEARS |
Class A Shares – Inception 9/4/90 | | | | | | | | | | | | | | | |
Without Sales Charge | | | | 3.79 | % | | | | 3.31 | % | | | | 4.82 | % |
With Sales Charge | | | | 1.45 | | | | | 2.31 | | | | | 4.31 | |
Class C Shares – Inception 2/16/00 | | | | | | | | | | | | | | | |
Without Sales Charge | | | | 3.03 | | | | | 2.53 | | | | | 4.04 | |
With Sales Charge | | | | 2.03 | | | | | 2.53 | | | | | 4.04 | |
Class I Shares – Inception 5/10/00 | | | | 4.02 | | | | | 3.55 | | | | | 5.08 | |
Performance data quoted represents past performance, which is no guarantee of future results. Current performance may be lower or higher than the performance quoted. The principal value and investment return of an investment will fluctuate so that your shares, when redeemed, may be worth more or less than their original cost.
As of the prospectus dated 3/1/18, the Fund’s gross expense ratio for Class A shares is 1.28%; C shares is 2.03% and Class I shares is 1.02%. The expense ratios shown above may differ from the more recent expense ratios reported in the Financial Highlights section of this report.
| † | Average annual total return measures net investment income and capital gain or loss from portfolio investments as an annualized average assuming reinvestment of dividends and capital gains distributions. Load-adjusted returns are adjusted for the maximum front-end sales load of 2.25% for Class A shares and returns for Class C shares have been adjusted for the contingent deferred sales charge (CDSC). |
NOTES:
The graphs do not reflect the income taxes that you would pay on fund distributions or the redemption of fund shares. Fund performance includes reinvestment of dividends and adjustment for the maximum sales charge for Class A shares. The performance of other classes will vary from the performance of the class shown based on the difference in sales charges and fees paid by shareholders investing in different share classes.
The Bloomberg Barclays U.S. Government/Credit Index is comprised of long-term government and investment-grade corporate debt securities and is generally considered representative of the performance of the broad U.S. bond market. Index data shown for the Annualized Returns Since Inception graph is from 8/31/90, since comparative index data is only available for full monthly periods. Source: Lipper, Inc.
The Citigroup 30-Day Treasury Bill Index is an unmanaged index generally considered representative of the performance of short-term money instruments. U.S. Treasury Bills are backed by the full faith and credit of the U.S. government and offer a guarantee as to the repayment of principal and interest at maturity. Index data shown for the Annualized Returns Since Inception graph is from 8/31/90, since comparative index data is only available for full monthly periods. Source: Mellon Analytical Solutions, LLC
The CBOE Volatility Index (VIX) is a leading measure of market expectations of near-term volatility conveyed by S&P 500 Index (SPX) option prices.
The Morningstar Market Neutral Category represents funds that attempt to eliminate the risks of the market by holding 50% of assets in long positions in stocks and 50% of assets in short positions.
The Credit Suisse Fear Barometer essentially tracks the willingness of investors to pay up for downside protection with collar trades on the S&P 500 Index.
Index returns assume reinvestment of dividends and do not reflect deduction of fees and expenses. It is not possible to invest directly in an index.
The Fund’s use of derivative instruments involves investment risks and transaction costs to which the Fund would not be subject absent the use of these instruments and, accordingly, may result in losses greater than if they had not been used. Derivative instruments can be illiquid, may disproportionately increase losses and may have a potentially large impact on Fund performance.
Calamos Hedged Equity Income Fund
OVERVIEW
The fund is an alternative strategy that invests in equities and sells options with the aim of achieving the total return of equity markets with lower volatility. It utilizes a covered call strategy, which involves investing in a diversified portfolio of equities while using options to generate income and manage risk.
KEY FEATURES
| | ◾ | | Draws upon almost a decade of experience in covered call writing and two decades of equity investing | |
| | ◾ | | Option-based risk-management strategy attempts to lower the volatility of equity investments | |
| | ◾ | | An alternative approach potentially provides upside participation in equity markets while limiting downside exposure | |
PORTFOLIO FIT
The fund provides an alternative strategy that can generate income and provide equity exposure with potentially lower volatility than equities.
| | |
| FUND NASDAQ SYMBOLS |
A Shares | | CAHEX |
C Shares | | CCHEX |
I Shares | | CIHEX |
| | | |
|
| FUND CUSIP NUMBERS |
A Shares | | 128120698 |
C Shares | | 128120680 |
I Shares | | 128120672 |
| | | |
CALAMOS HEDGED EQUITY INCOME FUND
INVESTMENT TEAM DISCUSSION
How has the Fund performed?
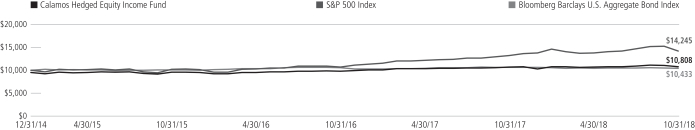
For the 12-month period ended October 31, 2018, Calamos Hedged Equity Income Fund gained 6.08% (Class A shares at net asset value) versus the S&P 500 Index gain of 7.35% and the Bloomberg Barclays U.S. Aggregate Bond Index decline of -2.05%. Since its inception on December 31, 2014, the Fund gained 4.73% on an annualized basis (Class A shares at net asset value), versus 9.67% for the S&P 500 Index and 1.11% for the Bloomberg Barclays U.S. Aggregate Bond Index.
In this strategy, we utilize covered call writing in which we sell call options for income and buy a basket of equities that represents the broad stock market. The selling prices of call options tend to be higher when volatility is higher.
What factors influenced performance during the reporting period?
The Fund’s fiscal year was characterized by several bouts of volatility that were conducive to the Fund’s ability to “monetize volatility” through frequent rebalancing of our option hedges. The equity market began the period (toward the end of 2017) in positive territory as investors cheered strong corporate earnings, the passing of corporate and individual tax reform, a smooth Fed Chairman transition, low unemployment and stronger economic growth. In February 2018, these positive sentiments were challenged by concerns surrounding rising inflation and interest rates, President Trump’s tariffs, and uncertainty regarding the midterm elections. The S&P 500 Index began the period with a 12% gain, corrected 10% in late January and into February, then bounced back 8%, only to see another 7% correction toward the end of March. The markets then rose fairly steadily until October when yet another 7% drop occurred. This was an environment that provided favorable opportunities to monetize volatility as we rebalanced our option hedges, improved risk/reward positioning, and locked in profits.
The CBOE Volatility Index (VIX) increased from 10.18 at the beginning of the period to 21.23 at period end, but attained a high of 37.32 on February 5, 2018. Elevated option skew* was present during the majority of the reporting period though it declined as volatility spiked. The Credit Suisse “Fear Barometer” Index, an index that compares the relative value of calls versus puts, had begun the period at 32.26 (well above the 20.65 historical average), which indicated that calls were priced relatively cheap when compared to puts. While the index finished the year at 21.99, it maintained an elevated 29.13 level throughout the year. The Fund benefited by using call and put spreads while the option markets had steep skew, which provided an affordable opportunity to create a favorable upside/downside risk/reward profile.
The Fund’s use of derivative instruments, including select equity options, index options, and foreign currency forward hedges, had a minimal, non-material impact on the performance figures for the one-year period
How is the Fund positioned?
Option Positioning. Skew in the options market presented an attractive opportunity to utilize call and put spreads, which benefited the portfolio’s risk/reward. By using
| * | Skew describes asymmetry from the normal distribution in a set of statistical data. |
| | | | |
| 8 | | CALAMOS OPEN-END FAMILY OF FUNDS ANNUAL REPORT | | |
Calamos Hedged Equity Income Fund
slightly closer to the money calls, buying out of the money calls, and adding near the money put spreads, we constructed a more effective hedge with equity sensitivity similar to our historical baseline positioning. We frequently adjusted the call and put quantities to maintain a balanced risk/reward. This positioning provided additional protection over and above our typical 40%–50% put notional minimum while adding upside participation potential. The trade-off has been a reduction in the income we received. However, given the low volatility and high skew in the options market, we felt this arrangement was warranted and opportunistic for the Fund.
More recently, however, higher volatility and flatter option skew has made our typical baseline positioning look more appealing. We continue to monitor the options market for the best opportunities available and will actively adjust our positioning as conditions warrant.
At the end of the period, our call spread positioning included calls written of 56% (0.5% in the money) and long calls of 139% (6.9% out of the money, “OTM”). The Fund’s net put protection consisted of 86% long puts (4.3% OTM) and 8% puts sold short (7.8% OTM).
Sector Positioning. At the end of the reporting period and relative to the S&P 500, the equity basket was very slightly overweight to the health care, consumer staples, information technology and utilities sectors. The portfolio had slight underweight positions to the industrials, materials, energy and financials sectors.
Market Cap Positioning. Relative to the S&P 500, the portfolio maintained a heavier relative weight to larger capitalization (>$20 billion) holdings and a lighter weight to small and mid-capitalization ($5 billion to $20 billion) names.
What closing thoughts do you have for Fund shareholders?
We continue to expect heightened volatility from a variety of sources going forward. President Trump’s recent focus on balancing trade through tariffs may continue to fuel volatility as investors attempt to determine the magnitude, duration and retaliatory pain of impending tariffs. Additionally, investor speculation on when and to what degree global central banks may join the U.S. Federal Reserve in quantitative tightening should also stoke volatility. As we continue to expect volatility in the equity markets, we remain enthusiastic about this environment being favorable to our current positioning in the Calamos Hedged Equity Income Fund. Should the equity markets continue to advance, we think the Fund is poised to participate in this upside while also providing income to purchase downside protection. Conversely, should markets retreat, we believe the put protection will serve to provide a measure of downside protection.
This information is not intended to be a recommendation or investment advice, and does not constitute a solicitation to buy or sell securities. Certain statements in this commentary are forward-looking statements. Discussions of specific investments are for illustration only and are not intended as recommendations of individual investments. The forward looking statements and other views expressed herein are those of the portfolio managers as of the date of this report. Actual future results or occurrence may differ significantly from those anticipated in any forward-looking statements and the views expressed herein are subject to change at any time, due to numerous market and other factors. The Fund disclaims any obligation to update publicly or review any forward-looking statements or views expressed herein.
| | | | |
| SECTOR WEIGHTINGS | |
Information Technology | | | 19.8 | % |
Health Care | | | 14.7 | |
Financials | | | 13.3 | |
Communication Services | | | 10.1 | |
Consumer Discretionary | | | 9.5 | |
Industrials | | | 8.7 | |
Consumer Staples | | | 7.2 | |
Energy | | | 5.5 | |
Utilities | | | 3.0 | |
Real Estate | | | 2.7 | |
Other | | | 2.5 | |
Materials | | | 1.9 | |
Sector weightings are subject to change daily and are calculated as a percentage of net assets. The table excludes cash or cash equivalents, any government/sovereign bonds or broad based index hedging securities the Fund may hold.
Calamos Hedged Equity Income Fund
GROWTH OF $10,000: SINCE INCEPTION (12/31/14) THROUGH 10/31/18
AVERAGE ANNUAL TOTAL RETURN† AS OF 10/31/18
| | | | | | | | | | |
| | | 1
YEAR | | SINCE
INCEPTION |
Class A Shares – Inception 12/31/2014 | | | | | | | | | | |
Without Sales Charge | | | | 6.08 | % | | | | 4.73 | % |
With Sales Charge | | | | 1.05 | | | | | 3.40 | |
Class C Shares – Inception 12/31/2014 | | | | | | | | | | |
Without Sales Charge | | | | 5.31 | | | | | 3.97 | |
With Sales Charge | | | | 4.31 | | | | | 3.97 | |
Class I Shares – Inception 12/31/2014 | | | | 6.38 | | | | | 5.02 | |
Performance data quoted represents past performance, which is no guarantee of future results. Current performance may be lower or higher than the performance quoted. The principal value and investment return of an investment will fluctuate so that your shares, when redeemed, may be worth more or less than their original cost.
As of the prospectus dated 3/1/18, the Fund’s gross expense ratio for Class A shares is 2.15%; Class C is 3.04% and Class I is 2.07%. The Fund’s Investment Adviser has contractually agreed to reimburse the Fund expenses through 3/1/22 to the extent necessary so that Total Annual Fund Operating Expenses (excluding taxes, interest, short interest, short dividend expenses, brokerage commissions, acquired fund fees and expenses, and extraordinary expenses, if any) of Class A, Class C, and Class I are limited to 1.25%, 2.00%, 1.00% of average net assets, respectively. Calamos Advisors may recapture previously waived expense amounts within the same fiscal year for any day where the respective Fund’s expense ratio falls below the contractual expense limit up to the expense limit for that day. This undertaking is binding on CALAMOS ADVISORS and any of its successors and assigns. This agreement is not terminable by either party. The expense ratios shown above may differ from the more recent expense ratios reported in the Financial Highlights section of this report.
| † | Average annual total return measures net investment income and capital gain or loss from portfolio investments as an annualized average assuming reinvestment of dividends and capital gains distributions. Performance shown includes the effects of an expense reimbursement that improved results. Load-adjusted returns are adjusted for the maximum front-end sales load of 4.75% for Class A shares and returns for Class C shares have been adjusted for the contingent deferred sales charge (CDSC). |
NOTES:
The S&P 500 Index is an unmanaged index generally considered representative of the U.S. stock market.
The Bloomberg Barclays U.S. Aggregate Bond Index is considered generally representative of the investment-grade bond market. Index data shown for the Since Inception Growth of $10,000 graph is from 6/30/07, since comparative index data is only available for full monthly periods. Source: Lipper, Inc.
The CBOE Volatility Index (VIX) is a leading measure of market expectations of near-term volatility conveyed by S&P 500 Index (SPX) option prices.
The Credit Suisse Fear Barometer essentially tracks the willingness of investors to pay up for downside protection with collar trades on the S&P 500 Index.
Index returns assume reinvestment of dividends and do not reflect deduction of fees and expenses. It is not possible to invest directly in an index.
The Fund’s use of derivative instruments involves investment risks and transaction costs to which the Fund would not be subject absent the use of these instruments and, accordingly, may result in losses greater than if they had not been used. Derivative instruments can be illiquid, may disproportionately increase losses and may have a potentially large impact on Fund performance.
| | | | |
| 10 | | CALAMOS OPEN-END FAMILY OF FUNDS ANNUAL REPORT | | |
Calamos Phineus Long/Short Fund
CALAMOS PHINEUS LONG/SHORT FUND
INVESTMENT TEAM DISCUSSION
What is the essence of the investment approach?
Through a global long/short structure, the Fund invests in publicly listed equity securities. Components of the strategy include:
A fundamental global approach that blends top-down and bottom-up considerations. Company analysis is integrated with industry, thematic and macro research.
An inclusive framework for identifying potential returns and associated risks. The framework accounts for company, industry, style, country and market factors.
Flexible capital allocation allowing for all investment styles, market caps and geographic regions. The investment universe is global, liquid and scalable. Exposure levels and investment styles depend upon market conditions and the economic cycle.
How has the Fund performed?
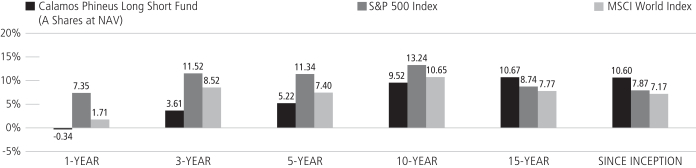
For the 12-month period, ended October 31, 2018, Calamos Phineus Long/Short Fund decreased -0.34% (Class A shares at net asset value). The S&P 500 Index rose 7.35% and the MSCI World Index increased 1.71% over the period.
Our approach in 2018 has been one of caution and patience. This has proven fortuitous, as general market equity losses have accumulated as the year progressed. As we write this note in October, the bear trend has become more substantial, more geographically widespread and nastier with respect to individual stocks than the major U.S. benchmarks. In recent developments, the damage is extending (at last) to the former leaders: U.S. mega-cap growth technology.
We have been selective in the large-cap U.S. growth space since late 2017, partly due to our forecasted reversal of “growth momentum” caused in part by higher long-term interest rates. Another reason was the overcrowding or excess positioning that is typical of a late-stage bull market. Finally, many passive strategies that have influenced equity behavior since 2016 appeared ripe for disruption. With money flows focused on a few mega-cap leaders, our lack of exposure in high-profile names has impacted, both positively and negatively, the Fund’s performance for the reporting period.
Since its inception on May 1, 2002, the Fund has returned 10.60% on an annualized basis (Class A shares at net asset value) and markedly outperformed both the S&P 500 and MSCI World Indexes, which returned 7.87% and 7.17%, respectively, over the same period.
What contributed to performance over the 12-month period under review?
The largest contributors arose from long investments in the information technology and industrials sectors, while long exposure in financials and a short position hedge on the Powershares QQQ hindered performance. Notable contributors during the period
FUND OVERVIEW
The fund seeks strong risk-adjusted and absolute returns across the global equity universe. The fund uses a global long/short strategy to invest in publicly listed equity securities.
KEY FEATURES
| | ◾ | | Fundamental global approach blends top-down and bottom-up considerations | |
| | ◾ | | Flexible asset allocation allows for all investment styles, market caps and geographic regions depending on the market environment | |
| | ◾ | | Comprehensive approach assesses stock, industry, style, country and market factors | |
| | ◾ | | Knowledge-based industry concentration includes technology, communications, media, financials and health care | |
PORTFOLIO FIT
The fund seeks to provide strong risk-adjusted returns via an alternative solution that complements and diversifies a global or U.S. equity allocation.
| | |
| FUND NASDAQ SYMBOLS |
A Shares | | CPLSX |
C Shares | | CPCLX |
I Shares | | CPLIX |
| | | |
|
| FUND CUSIP NUMBERS |
A Shares | | 128120656 |
C Shares | | 128120649 |
I Shares | | 128120631 |
| | | |
Calamos Phineus Long/Short Fund
| | | | |
| SECTOR WEIGHTINGS | |
Financials | | | 38.3 | % |
Consumer Discretionary | | | 12.0 | |
Other | | | 10.7 | |
Health Care | | | 8.6 | |
Industrials | | | 8.4 | |
Communication Services | | | 6.5 | |
Information Technology | | | 5.8 | |
Materials | | | 2.3 | |
Consumer Staples | | | 0.2 | |
| | | | | |
Sector weightings are subject to change daily and are calculated as a percentage of net assets. The table excludes cash or cash equivalents, any government/sovereign bonds or broad based index hedging securities the Fund may hold.
included long positions in United Continental Holdings, Inc.* (Industrials) and Zendesk, Inc.* (information technology). Detractors included a long position in American International Group (financials) and a short position on the Nasdaq Index via QQQ* (market hedge).
The Fund’s use of derivative instruments, including select equity options, index options, and foreign currency forward hedges, had a minimal, non-material impact on the performance figures for the one-year period
How is the Fund positioned in the context of the global economic cycle?
Our largest sector exposure is in financials, where valuations make sense and fundamentals are benefiting from the tailwind of higher rates. This positioning envisions a gradual market transition from higher-momentum growth to domestic cyclical and non-cyclical equity. Financials should be buoyed by rising rates, steady loan growth and benign credit quality. This critical assumption is based on deflation risk ending in Western economies, underpinned by a sound U.S. consumer. As valuations suggest, this is somewhat contrarian and offers insight into our year-to-date attribution.
We slightly increased our exposure to certain areas of industrials. The key with industrials is to avoid businesses exposed to the different economic landscape abroad. We believe industrials that are U.S.-biased with an emphasis on quality and late-cycle businesses will benefit accordingly.
We have maintained a presence in health care, preferring diversified companies rather than traditional pharmaceuticals. We believe they offer more upside for the same types of risk. Drug pricing remains vulnerable to a variety of political clouds that will come more into focus after the November 2018 midterm elections. The industry will struggle to emerge unscathed from the secular spending pressures, which are an outcome of demographic realities. We view the group as a defensive rather than a genuine growth class.
We have exited much of our long exposure in consumer staples. Many of these stocks have performed well of late, as investors have sought more defensive positioning, yet corporate fundamentals remain structurally unattractive. We continue to be selective here, focused on more discretionary names, where we expect a predictable earnings stream and accelerated free cash flow growth.
In Europe, which we believe requires a much more inflationary investment cycle to outperform, our view is more tactical than strategic. That said, we have select holdings that we believe will benefit from the continued strength of the U.S. consumer. The Fund has less than 10% of its long portfolio outside the U.S. And within the U.S., we are sensitive to any overseas exposure, particularly Asian demand or the global producer industries. With respect to the latter, for example, we continue to avoid the energy sector. In September, we closed down the Fund’s shorts in the EM space based on the view that some tactical bounce was overdue.
What are your closing thoughts for the coming year?
The equity bull market is fatigued because the monetary tide in the West is turning. This is confusing to investors who have long relied upon central banks to support economic growth. Instead, financial asset prices are deflating because the paucity of economic growth is no longer the problem. The long path to higher interest rates seems assured, and financial markets face the pain of this adjustment: in other words, the monetary drugs are slowly being withdrawn by the central bankers.
| * | Sold prior to period end. |
| | | | |
| 12 | | CALAMOS OPEN-END FAMILY OF FUNDS ANNUAL REPORT | | |
Calamos Phineus Long/Short Fund
This has been the year of fiscally enhanced, underestimated, late-cycle American expansion. Because we believe much of this strength is sustainable, the significance of the disruptive divergence between U.S. and non-U.S. activity continues to be underestimated. While many view this U.S. robustness as a “sugar high” or the consequence of financial engineering due to the Tax Cuts and Jobs Act, we suspect the U.S. has entered a new investment cycle led by capital spending and the ramifications of trade conflict outside the U.S.
The controversy begins with the macroeconomic repercussions of the tax reform that was signed into law last December. Such a massive transfer of resources from the public to private sector must trigger some kind of investment upswing. These tax cuts are occurring alongside deregulation that has encouraged the highest levels of confidence on record among U.S. small businesses. By boosting corporate profitability and extending the duration of corporate credit, fiscal initiatives have pushed out the cyclical risks for what is widely viewed as an aged expansion.
All of this suggests that the path to slower U.S. growth will not occur spontaneously, if at all in 2019. One caveat to this “stronger for longer” narrative could be weaker external demand due to slower growth of world output and trade. To some degree, domestic U.S. demand should be affected by rising costs and more restrictive monetary policy. But any slowdown in 2019 or 2020 will almost certainly be the consequence, not the cause of financial disruption. In our view, 2019 could well be good for Main Street, but much more problematic for Wall Street. Equity markets are adjusting to a world of less capital subsidization, higher interest rates and higher labor costs. What is confusing to many is that the U.S. engine of profitability may well motor through much of 2019, if not 2020.
Outside the U.S., we are not succumbing to the argument that EM equities must be attractive because they have declined so much. The return of credit risk implies an ongoing monetary squeeze for emerging economies, which remain the weakest links. Europe remains a sorry and sad affair—a multiplicity of political problems. Longer term, we expect the EU will gradually splinter, and political uncertainty could weigh on growth for years.
In summary, our forecast for equities can be described as a valuation reset rather than the emergence of a fundamental economic or earnings dislocation. From the peak of buying frenzy in January, we see a total decline of 20% to 25% into the eventual trough later in 2019. For now, equities can enjoy some respite as the uncertainty of U.S. politics is calmed after the November midterm elections. This will be temporary, and ongoing convulsions will continue to occur as the major economies end their overreliance on monetary opioids.
This information is not intended to be a recommendation or investment advice, and does not constitute a solicitation to buy or sell securities. Certain statements in this commentary are forward-looking statements. Discussions of specific investments are for illustration only and are not intended as recommendations of individual investments. The forward looking statements and other views expressed herein are those of the portfolio managers as of the date of this report. Actual future results or occurrence may differ significantly from those anticipated in any forward-looking statements and the views expressed herein are subject to change at any time, due to numerous market and other factors. The Fund disclaims any obligation to update publicly or review any forward-looking statements or views expressed herein.
Calamos Phineus Long/Short Fund
ANNUALIZED RETURN: SINCE INCEPTION (5/1/02) THROUGH 10/31/18
Performance data quoted represents past performance, which is no guarantee of future results. Current performance may be lower or higher than the performance quoted.
The principal value and investment return of an investment will fluctuate so that your shares, when redeemed, may be worth more or less than their original cost. You can obtain performance data current to the most recent month end by visiting www.calamos.com. Average annual total return measures net investment income and capital gain or loss from portfolio investments as an annualized average. All performance shown assumes reinvestment of dividends and capital gains distributions. Performance is for the Fund’s Class A shares at net asset value and does not include the Fund’s maximum front-end sales charge of 4.75%. Had it been included, the Fund’s return would have been lower. The Fund also offers Class C and Class I shares, the performance of which may vary. Source: Morningstar, Inc.
The performance shown for periods prior to April 6, 2016 is the performance of a predecessor investment vehicle (the “Predecessor Fund”). The Predecessor Fund was reorganized into the Fund on April 6, 2016, the date upon which the Fund commenced operations. On October 1, 2015, the parent company of Calamos Advisors, purchased Phineus Partners LP, the prior investment adviser to the Predecessor Fund (“Phineus”), and Calamos Advisors served as the Predecessor Fund’s investment adviser between October 1, 2015 until it was reorganized into the Fund. Phineus and Calamos Advisors managed the Predecessor Fund using investment policies, objectives, guidelines and restrictions that were in all material respects equivalent to those of the Fund. Phineus and Calamos Advisors managed the Predecessor Fund in this manner either directly or indirectly by investing all of the Predecessor Fund’s assets in a master fund structure. The Predecessor Fund performance information has been adjusted to reflect Class A, Class C and Class I shares, expenses. However, the Predecessor Fund was not a registered mutual fund and thus was not subject to the same investment and tax restrictions as the Fund. If it had been, the Predecessor Fund’s performance may have been lower.
| | | | |
| 14 | | CALAMOS OPEN-END FAMILY OF FUNDS ANNUAL REPORT | | |
Calamos Phineus Long/Short Fund
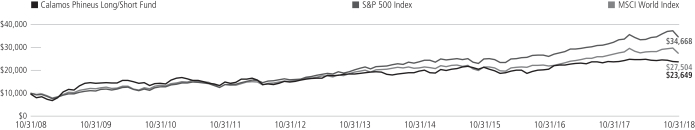
GROWTH OF $10,000: FOR THE 10-YEAR PERIOD ENDED 10/31/18
AVERAGE ANNUAL TOTAL RETURN† AS OF 10/31/18
| | | | | | | | | | | | | | | |
| | | 1
YEAR | | 5
YEAR | | 10
YEARS |
Class A Shares (With Predecessor) – Inception 5/1/2002 | | | | | | | | | | | | | | | |
Without Sales Charge | | | | -0.34 | % | | | | 5.22 | % | | | | 9.52 | % |
With Sales Charge | | | | -5.04 | | | | | 4.20 | | | | | 8.99 | |
Class C Shares (With Predecessor) – Inception 5/1/2002 | | | | | | | | | | | | | | | |
Without Sales Charge | | | | -1.09 | | | | | 4.43 | | | | | 8.71 | |
With Sales Charge | | | | -2.07 | | | | | 4.43 | | | | | 8.71 | |
Class I Shares (With Predecessor) – Inception 5/1/2002 | | | | -0.10 | | | | | 5.49 | | | | | 9.81 | |
Performance data quoted represents past performance, which is no guarantee of future results. Current performance may be lower or higher than the performance quoted. The principal value and investment return of an investment will fluctuate so that your shares, when redeemed, may be worth more or less than their original cost.
As of the prospectus dated 3/1/18, the Fund’s gross expense ratio for Class A shares is 2.80%; Class C shares is 3.55% and Class I shares is 2.54%. The expense ratios shown above may differ from the more recent expense ratios reported in the Financial Highlights section of this report.
| † | Average annual total return measures net investment income and capital gain or loss from portfolio investments as an annualized average assuming reinvestment of dividends and capital gains distributions. Performance shown reflects the effects of an expense reimbursement that improved results and was in effect until October 31, 2016. Load-adjusted returns are adjusted for the maximum front-end sales load of 4.75% for Class A shares. Returns for Class C shares have been adjusted for the contingent deferred sales charge (CDSC). |
NOTES:
The graph does not reflect the income taxes that you would pay on fund distributions or the redemption of fund shares. Fund performance includes reinvestment of dividends and adjustment for the maximum sales charge for Class A shares. The performance of other classes will vary from the performance of the class shown based on the difference in sales charges and fees paid by shareholders investing in different share classes.
The MSCI World Index (U.S. Dollars) is a market-capitalization weighted index composed of companies representative of
the market structure of developed market countries in North America, Europe and the Asia/Pacific region. Since inception data for the index is shown from 4/30/02 since data is only available for full monthly periods. Source: Lipper, Inc.
The S&P 500 Index is an unmanaged index generally considered representative of the U.S. stock market. Source: Lipper, Inc.
Index returns assume reinvestment of dividends and do not reflect deduction of fees and expenses. It is not possible to invest directly in an index.
Calamos Convertible Fund
OVERVIEW
The fund invests primarily in convertible securities of U.S. companies that are diversified across market sector and credit quality.
KEY FEATURES
| | ◾ | | Leverages more than three decades of research and experience in convertible security investing | |
| | ◾ | | Provides diversification across market sectors and credit quality, emphasizing midsize companies with higher-quality balance sheets | |
| | ◾ | | Seeks to provide upside participation in equity markets with less exposure to downside than an equity-only portfolio over a full market cycle | |
PORTFOLIO FIT
When used in conjunction with an equity allocation, the fund offers a way potentially to manage risk by employing securities that engage in upside equity movements with limited downside participation.
| | |
| FUND NASDAQ SYMBOLS |
A Shares | | CCVIX |
C Shares | | CCVCX |
I Shares | | CICVX |
| |
|
| FUND CUSIP NUMBERS |
A Shares | | 128119401 |
C Shares | | 128119823 |
I Shares | | 128119864 |
| |
CALAMOS CONVERTIBLE FUND
INVESTMENT TEAM DISCUSSION
How has the Fund performed?
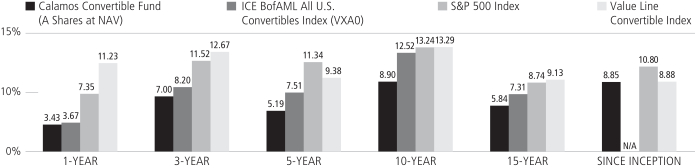
For the 12-month period ended October 31, 2018, Calamos Convertible Fund returned 3.43% (Class A shares at NAV) versus the ICE BofAML All U.S. Convertibles Index increase of 3.67%. For the same period, the S&P 500 Index gained 7.35% and the Value Line Convertible Index rose 11.23%.
Since its inception on June 21, 1985, the Fund returned 8.85% on an annualized basis (Class A Shares at NAV) compared with gains of 10.80% for the S&P 500 Index and 8.88% for the Value Line Convertible Index.
What factors influenced performance?
The Fund’s fiscal year was characterized by several bouts of volatility. The convertible and equity markets began the period in positive territory as investors cheered strong corporate earnings, the passing of corporate and individual tax reform, a smooth Fed Chairman transition, low unemployment and robust economic growth. However, these positive sentiments were then challenged by concerns surrounding rising inflation and interest rates, President Trump’s tariffs, and political uncertainty regarding the midterm elections. The S&P 500 Index corrected 10% in late January/early February, then bounced back 8% only to see another 7% correction before the end of April 2018. The markets then rose fairly steadily until October when investors witnessed another 7% decline. This volatility was conducive to our approach as our positioning allowed the portfolio to participate in some upside as the markets advanced, while also providing a measure of downside protection when the markets fell.
The Fund also performed well against a backdrop of rising interest rates. The Federal Reserve hiked its target Fed Funds rate range by 25 basis points four times during the period to between 2.00% and 2.25%. The 3-year U.S. Treasury yield increased from 1.73% to 2.93%, while the 5-year U.S. Treasury yield moved from 2.01% to 2.98%. The 10-year U.S. Treasury yield increased from 2.38% to 3.15%, trading above 3% for the first time since January, 2014.
The reporting period was most favorable to convertibles displaying balanced risk/reward attributes. Balanced convertibles represented roughly 44% of the U.S. convertible market at the end of the reporting period and were up 7.34% during the 12-month period as measured by the ICE BofAML Total Return U.S. Convertible Index (VTOT). Balanced convertibles outperformed credit sensitive (+4.09%) and equity sensitive (0.00%) convertibles as measured by the ICE BofAML Yield Alternative U.S. Convertible (VYLD) and ICE BofAML Equity Alternative U.S. Convertible (VEQU) indices. Our approach led us to underweight the most equity sensitive convertibles in favor of those with balanced risk-reward attributes.
Economic Sector Contributors
Health Care. Security selection in the health care sector contributed significantly to performance during the period. Positions within the biotechnology, pharmaceuticals and life sciences and tools industries outperformed on a relative basis.
Information Technology. An overweight allocation and security selection in the information technology sector also added value during the period. Portfolio holdings within the application software, systems software, and technology hardware, storage & peripherals finished ahead of their peers in the index.
| | | | |
| 16 | | CALAMOS OPEN-END FAMILY OF FUNDS ANNUAL REPORT | | |
Calamos Convertible Fund
Economic Sector Detractors
Industrials. An overweight position and selection in industrials detracted from the Fund’s return. Portfolio holdings in the air freight & logistics, construction & engineering, and aerospace & defense industries notably underperformed.
Consumer Discretionary. An overweight position and selection within the consumer discretionary sector also held back results, as holdings within the internet & direct marketing retail and movies & entertainment industries lagged. Additionally, the portfolio had a relatively heavy average weight to the underperforming automobiles manufacturers industry.
How is the Fund positioned?
We favor the balanced portion of the convertible bond market, as it offers the most attractive risk/reward profile relative to the convertible’s underlying stock. We have actively rebalanced positions by selling convertibles that became more equity sensitive as their underlying stocks increased and used the proceeds to purchase convertibles with stronger risk/reward characteristics. The new issue market has been strong and has provided ample opportunities for rebalancing.
In the technology sector where our largest allocation resides, we have focused on prospects in internet security, cloud computing, software and big data, while reducing our semiconductors exposure throughout the quarter. We have also maintained an overweight to industrials where we see favorable opportunities in transportation equipment and related services.
We remain underweight to the defensive sectors which include communication services, utilities, real estate and staples. While these sectors have recently performed well as global investors sought defensive positioning in the face of non-U.S. market underperformance and trade war uncertainty, the U.S. convertible market has provided a relatively low allocation to these defensive sectors and the convertibles in these areas offered less attractive opportunities in our view. Longer-term, many defensive positions, which served as bond proxies for the last 10 years, have underperformed with rising interest rates. Since we continue to expect rising rates going forward, our interest in these defensive sectors remains muted.
To a limited extent, we have opportunistically added non-U.S. convertibles that provide attractive risk-adjusted returns.
What are your closing thoughts for Fund shareholders?
We have a positive view on the current economic environment and see no signs of a near-term recession. Excesses that led up to previous recessions are not evident. For example, the banking industry remains in good condition and there does not appear to be overinvestment or significantly tighter financial conditions in the U.S. enduring deregulation efforts and tax cuts made earlier in the year continue to promote strong corporate earnings and a healthy job market. Supporting evidence includes vigorous job growth, low unemployment and the lowest jobless claims since 1969. Improving labor participation rates and subdued wage growth have also contributed to the highest consumer confidence in years and low consumer loan delinquencies. Further, positive economic signs include low inflation, strong small business optimism, strong ISM numbers, and the highest capital spending plans since 2007. There are, however, always risks in any environment. These include increasing oil prices and the potential for increased gasoline prices to act as a tax on the consumer, the possible inversion of the yield curve which historically predates recessions, more rapid-than-expected interest rate or inflation increases, and potential impacts of the changing composition of the U.S. Congress. But
| | | | |
| SECTOR WEIGHTINGS | |
Information Technology | | | 33.4 | % |
Health Care | | | 14.6 | |
Consumer Discretionary | | | 11.1 | |
Financials | | | 10.4 | |
Industrials | | | 6.8 | |
Energy | | | 4.8 | |
Utilities | | | 4.0 | |
Real Estate | | | 4.0 | |
Communication Services | | | 2.2 | |
Materials | | | 1.2 | |
Sector weightings are subject to change daily and are calculated as a percentage of net assets. The table excludes cash or cash equivalents, any government/sovereign bonds or broad based index hedging securities the Fund may hold.
Calamos Convertible Fund
currently the largest market risk is the potential for an escalating global trade war. A recent NAFTA replacement agreement with Mexico and Canada provides an air of hope, and we ultimately believe that negotiations with other nations will lead to better trade agreements for the U.S. In the meantime, the increase in market volatility supports the use of convertible bonds and provides us the opportunity to rebalance the portfolio.
We also have a positive outlook on the convertible market. Convertible bonds generally perform better in a rising rate environment than straight bonds. Most recently, from December 2016 to the end of September 2018, the Federal Reserve raised their target Federal Funds rate seven times and over that period convertible securities outperformed investment grade and high yield bonds. Looking forward, we expect the Federal Reserve to continue to raise its benchmark rate. We expect a 25 basis point increase in December and several more rate hikes in 2019. Our expectation is that convertible securities will outperform bonds in this rising rate environment. Additionally, with last December’s tax reform, we believe that lower corporate tax rates have improved the relative attractiveness of lower-coupon convertible bonds versus straight bonds. The reform also included limits on interest expense deductibility which provided potential to skew corporations in favor of issuing convertible bonds over straight bonds in financing. Finally, lower taxes combined with less regulation in a favorable economic environment contribute to a positive corporate climate where convertible securities make sense for growth. Although we may be in the mid-to-latter part of the business cycle, we still see many firms seeking growth capital for mergers and acquisitions, research and development, or capital spending.
This information is not intended to be a recommendation or investment advice, and does not constitute a solicitation to buy or sell securities. Certain statements in this commentary are forward-looking statements. Discussions of specific investments are for illustration only and are not intended as recommendations of individual investments. The forward looking statements and other views expressed herein are those of the portfolio managers as of the date of this report. Actual future results or occurrence may differ significantly from those anticipated in any forward-looking statements and the views expressed herein are subject to change at any time, due to numerous market and other factors. The Fund disclaims any obligation to update publicly or review any forward-looking statements or views expressed herein.
ANNUALIZED RETURN: SINCE INCEPTION (6/21/85) THROUGH 10/31/18
Performance data quoted represents past performance, which is no guarantee of future results. Current performance may be lower or higher than the performance quoted.
The principal value and investment return of an investment will fluctuate so that your shares, when redeemed, may be worth more or less than their original cost. You can obtain performance data current to the most recent month end by visiting www.calamos.com. Average annual total return measures net investment income and capital gain or loss from portfolio investments as an annualized average. All performance shown assumes reinvestment of dividends and capital gains distributions. Performance is for the Fund’s Class A shares at net asset value and does not include the Fund’s maximum front-end sales charge of 2.25%. Had it been included, the Fund’s return would have been lower. The Fund also offers Class C and Class I shares, the performance of which may vary. Source: State Street Corporation, Lipper, Inc., and Mellon Analytical Solutions, LLC.
| | | | |
| 18 | | CALAMOS OPEN-END FAMILY OF FUNDS ANNUAL REPORT | | |
Calamos Convertible Fund
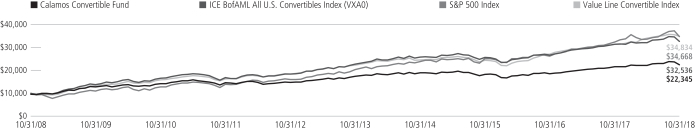
GROWTH OF $10,000: FOR THE 10-YEAR PERIOD ENDED 10/31/18
AVERAGE ANNUAL TOTAL RETURN† AS OF 10/31/18
| | | | | | | | | | | | | | | |
| | | 1
YEAR | | 5
YEARS | | 10
YEARS |
Class A Shares – Inception 6/21/85 | | | | | | | | | | | | | | | |
Without Sales Charge | | | | 3.43 | % | | | | 5.19 | % | | | | 8.90 | % |
With Sales Charge | | | | 1.11 | | | | | 4.18 | | | | | 8.37 | |
Class C Shares – Inception 7/5/96 | | | | | | | | | | | | | | | |
Without Sales Charge | | | | 2.65 | | | | | 4.40 | | | | | 8.08 | |
With Sales Charge | | | | 1.65 | | | | | 4.40 | | | | | 8.08 | |
Class I Shares – Inception 6/25/97 | | | | 3.73 | | | | | 5.46 | | | | | 9.17 | |
Performance data quoted represents past performance, which is no guarantee of future results. Current performance may be lower or higher than the performance quoted. The principal value and investment return of an investment will fluctuate so that your shares, when redeemed, may be worth more or less than their original cost.
As of the prospectus dated 3/1/18, the Fund’s gross expense ratio for Class A shares is 1.18%; Class C is 1.93% and Class I is 0.93%. The expense ratios shown above may differ from the more recent expense ratios reported in the Financial Highlights section of this report.
| † | Average annual total return measures net investment income and capital gain or loss from portfolio investments as an annualized average assuming reinvestment of dividends and capital gains distributions. Load-adjusted returns are adjusted for the maximum front-end sales load of 2.25% for Class A shares and returns for Class C shares have been adjusted for the contingent deferred sales charge (CDSC). |
NOTES:
The graphs do not reflect the income of taxes that you would pay on fund distributions or the redemption of fund shares. Fund performance includes reinvestment of dividends and adjustment for the maximum sales charge for Class A shares. The performance of other classes will vary from the performance of the class shown based on the difference in sales charges and fees paid by shareholders investing in different share classes.
The ICE BofAML All U.S. Convertibles Index is comprised of approximately 700 issues of only convertible bonds and preferreds of all qualities.
The S&P 500 Index is an unmanaged index generally considered representative of the U.S. stock market.
The Value Line Convertible Index is an equally-weighted index of the larger convertibles, representing 90% of the U.S. convertible securities market. Index data shown for the Annualized Returns Since Inception graph is from 6/30/85, since comparative index data is only available for full monthly periods. Source: Mellon Analytical Solutions, LLC.
Due to their structural complexities, the attributes of convertibles may vary. Therefore, they are typically categorized as Yield Alternatives represented by the U.S. CV Index (VYLD), Total Return Alternatives represented by the U.S. CV Index (VTOT), or Equity Alternatives represented by the U.S. CV Index (VEQU).
The ICE BofAML Total Return U.S. Convertibles Index is a subset of ICE BofAML All U.S. Convertibles Index including securities with a delta greater than or equal to 0.4 and less than 0.8 (VTOT).
The ICE BofAML Yield Alternative U.S. Convertibles Index (VYLD) is a subset of ICE BofAML All U.S. Convertibles Index including securities with a delta less than 0.4 (exhibiting bond-like characteristics).
The ICE BofAML Equity Alternative U.S. Convertibles Index (VEQU) is a subset of ICE BofAML All U.S. Convertibles Index including securities with a delta of 0.8 and greater (exhibiting stock-like characteristics).
Index returns assume reinvestment of dividends and do not reflect deduction of fees and expenses. It is not possible to invest directly in an index.
Calamos Global Convertible Fund
OVERVIEW
The fund invests in global convertible securities. It strives to balance risk/reward, while providing growth and income.
KEY FEATURES
| | ◾ | | Provides broadly diversified exposure to the global convertible bond universe | |
| | ◾ | | Leverages more than 30 years of research in convertible security investing | |
| | ◾ | | Seeks to provide upside participation in equity markets with less exposure to downside than an equity-only portfolio over a full market cycle | |
| | ◾ | | Blends global investment themes and fundamental research via active management | |
PORTFOLIO FIT
Consisting of convertible securities that can participate in upside equity movements with potentially limited downside exposure, the fund can provide a means to manage risk in conjunction with an equity allocation. The fund can also serve a role within a fixed income allocation, as convertibles have performed well during periods of rising interest rates and inflation.
| | |
| FUND NASDAQ SYMBOLS |
A Shares | | CAGCX |
C Shares | | CCGCX |
I Shares | | CXGCX |
| |
|
| FUND CUSIP NUMBERS |
A Shares | | 128120748 |
C Shares | | 128120730 |
I Shares | | 128120722 |
| |
CALAMOS GLOBAL CONVERTIBLE FUND
INVESTMENT TEAM DISCUSSION
How has the Fund performed?
For the 12-month period ended October 31, 2018, Calamos Global Convertible Fund returned a flat -0.09% (Class A shares at net asset value) versus the Thomson Reuters Global Convertible Bond Index return of -1.36% and ICE BofAML Global 300 Convertible Index return of 1.95%. Since its inception on December 31, 2014, the Fund increased 3.99% versus a 3.09% gain for the Thomson Reuters Global Convertible Bond Index and 6.51% increase for the ICE BofAML Global 300 Convertible Index.
What factors influenced performance during the reporting period?
The global convertible markets seesawed back and forth during the period. Global equity markets began the period with a strong 11% MSCI World Index return through January as a combination of positive global economic growth, strong corporate earnings, and generally accommodative central bank policies provided support. The markets gave up much of this ground February through March, as investors grew concerned about President Trump’s tariffs, higher market volatility, mixed global economic growth data and the potential for rising interest rates. The markets then climbed a wall of worry into October when the equity markets sold off nearly 8% in the final month of the reporting period amid heightened political risk, ongoing trade disputes, and diverging monetary policy across the globe.
Global interest rates moved higher during the one-year period as illustrated by the Bloomberg Barclays Global Aggregate Bond Index -2.05% return. U.S. Interest rates rose during the period as the Federal Reserve hiked its target fed funds rate range by 25 basis points four times during the period to between 2.00% and 2.25%. The 3-year Treasury yield increased from 1.73% to 2.93%, while the 5-year Treasury yield moved from 2.01% to 2.98%. The 10-year U.S. Treasury yield increased from 2.38% to 3.15% and traded above 3% for the first time since January, 2014. Global high yield credit spreads widened slightly during the period with JPMorgan reporting global spreads widening 36 basis points to 435 basis points above government securities. Wider spreads had a negative impact on the largely below investment grade convertible market and especially on convertibles with CCC implied credit ratings. Consistent with our investment process, we were relatively underweight to these weak credit ratings.
Over the period, the market environment was most favorable to convertibles offering balanced risk/reward attributes. Convertibles with balanced risk/reward attributes were down 0.1% and held up better than those with the most equity sensitivity (-2.7%) and those with the most credit sensitivity (-1.5%). Our approach favored convertibles with balanced risk/reward attributes, while we maintained relative underweights toward the most equity-sensitive and credit-sensitive issues.
| | | | |
| 20 | | CALAMOS OPEN-END FAMILY OF FUNDS ANNUAL REPORT | | |
Calamos Global Convertible Fund
Economic Sector Contributors
| • | | Information Technology. Security selection in the information technology sector supported period results. Specifically, selection in the internet software & services and systems software industries outperformed. The portfolio also benefited from a relatively heavy allocation to the strong-performing application software industry. A relatively light allocation to the semiconductor equipment industry also added value during the period. |
| • | | Energy. Security selection in the energy sector also contributed to return during the period. The portfolio benefited from a relatively heavy weight to the strong performing oil & gas exploration & production industry and our names in this industry strongly outperformed. |
Economic Sector Detractors
| • | | Financials. Security selection in the financials sector detracted from period results. In particular, portfolio holdings in the asset management & custody banks and diversified banks industries lagged. |
| • | | Materials. Security selection in the materials sector also detracted from the Fund’s return. Specifically, the diversified metals & mining, specialty chemicals and diversified chemicals industries underperformed. |
Geographic Influences
| • | | Security selection in the U.S. added significant value during the period. |
| • | | An underweight allocation and security selection within Europe and Emerging Latin America also supported results. |
| • | | An underweight allocation and security selection Japan held back the portfolio return. |
| • | | Security selection in Emerging Europe & South Africa also detracted from results. |
How is the Fund positioned?
We have favored the balanced portion of the convertible bond market and the new issue market has provided ample opportunities for rebalancing. Technology is the largest absolute sector allocation with financials being our largest relative overweight versus the Thomson Reuters Global Convertibles Index. Opportunities in the technology sector have been focused on internet security, cloud computing, software and big data. In financials, we see the best opportunities in diversified and regional banks which should benefit from rising global interest rates, while the convertibles also offer attractive current yield.
We have light absolute allocations to the defensive utilities, communication services and consumer staples sectors. While these sectors performed well during the latter part of the period as global investors sought defensive positioning in the midst of non-U.S. market underperformance and trade war uncertainty, the convertible market had a relatively lower exposure to these defensive sectors and offered less attractive opportunities. Looking longer-term, many defensive positions, which served as bond proxies for the last 10 years, have underperformed with rising interest rates, which we expect to continue. On a relative basis, the portfolio’s largest relative underweight is to health care. We have been especially light in biotechnology where smaller names have not provided attractive risk/reward profiles in our view, especially given that many of these
| | | | |
| SECTOR WEIGHTINGS | |
Information Technology | | | 21.5 | % |
Financials | | | 13.5 | |
Consumer Discretionary | | | 11.2 | |
Industrials | | | 9.5 | |
Real Estate | | | 6.8 | |
Energy | | | 6.3 | |
Health Care | | | 6.2 | |
Communication Services | | | 5.1 | |
Materials | | | 3.1 | |
Consumer Staples | | | 2.0 | |
Utilities | | | 1.4 | |
| | | | | |
Sector weightings are subject to change daily and are calculated as a percentage of net assets. The table excludes cash or cash equivalents, any government/sovereign bonds or broad based index hedging securities the Fund may hold.
Calamos Global Convertible Fund
small biotech names do not even have drugs available to sell on the market. The outcome of these convertibles is heavily dependent on whether the drugs in trial become approved.
From a geographic perspective relative to the Thomson Reuters Global Convertible Bond Index, the portfolio holds an overweight allocation within the United States while being underweight in Europe and Japan. These allocation leanings are mostly the result of bottom-up considerations as we have found more favorable convertible structures in the United States than in the Europe and Japan.
What closing thoughts do you have for Fund shareholders?
Global corporate and macroeconomic data has been mixed versus expectations but, on balance, continues to reflect positive global growth. Global monetary policy remains accommodative overall, though multiple central banks are normalizing policy and we have seen a pivot toward fiscal stimulus. We have a positive outlook on the convertible market reflective of reasonably sound economic data including strong earnings growth, fairly benign inflation and attractive valuations. There is, however, always risk in any environment. These include the potential inversion of the U.S. yield curve which has historically predated recessions, more rapid then expected interest rate or inflation increases, and/or the change in the composition of the U.S. Congress. In our view, the largest market risk is the potential for an escalating and drawn-out global trade war. A recent NAFTA resolution with the United States, Mexico and Canada provides room for optimism. In the meantime, increased market volatility has provided opportunities to rebalance the portfolio into convertibles with attractive risk reward attributes. Convertibles should also perform well relative to straight bonds as they have in the past when global interest rates have increased. We have witnessed a healthy new convertible issuance market that has been supported by rising interest rates and increased volatility. Additionally, convertible issuance should benefit from last December’s tax legislation which capped the amount of interest expense that can be deducted by issuers given that convertibles have lower interest expense given the conversion option. Calendar year 2018 to date through 10/31 has brought over $76 billion of new issuance which is already more than the $74 billion brought to market in 2017.
This information is not intended to be a recommendation or investment advice, and does not constitute a solicitation to buy or sell securities. Certain statements in this commentary are forward-looking statements. Discussions of specific investments are for illustration only and are not intended as recommendations of individual investments. The forward looking statements and other views expressed herein are those of the portfolio managers as of the date of this report. Actual future results or occurrence may differ significantly from those anticipated in any forward-looking statements and the views expressed herein are subject to change at any time, due to numerous market and other factors. The Fund disclaims any obligation to update publicly or review any forward-looking statements or views expressed herein.
| | | | |
| 22 | | CALAMOS OPEN-END FAMILY OF FUNDS ANNUAL REPORT | | |
Calamos Global Convertible Fund
GROWTH OF $10,000: SINCE INCEPTION (12/31/14) THROUGH 10/31/18
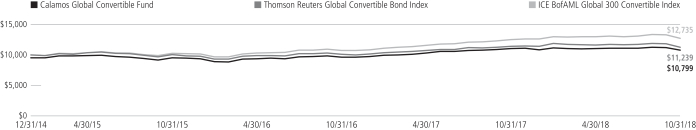
AVERAGE ANNUAL TOTAL RETURN† AS OF 10/31/18
| | | | | | | | | | |
| | | 1
YEAR | | SINCE
INCEPTION |
Class A Shares – Inception 12/31/2014 | | | | | | | | | | |
Without Sales Charge | | | | -0.09 | % | | | | 3.99 | % |
With Sales Charge | | | | -2.35 | | | | | 2.68 | |
Class C Shares – Inception 12/31/2014 | | | | | | | | | | |
Without Sales Charge | | | | -0.77 | | | | | 3.25 | |
With Sales Charge | | | | -1.73 | | | | | 3.25 | |
Class I Shares – Inception 12/31/2014 | | | | 0.24 | | | | | 4.28 | |
Performance data quoted represents past performance, which is no guarantee of future results. Current performance may be lower or higher than the performance quoted. The principal value and investment return of an investment will fluctuate so that your shares, when redeemed, may be worth more or less than their original cost.
As of the prospectus dated 3/1/18, the Fund’s gross expense ratio for Class A shares is 1.46%; Class C is 2.20% and Class I is 1.19%. The Fund’s Investment Adviser has contractually agreed to reimburse the Fund expenses through 3/1/22 to the extent necessary so that Total Annual Fund Operating Expenses (excluding taxes, interest, short interest, short dividend expenses, brokerage commissions, acquired fund fees and expenses, and extraordinary expenses, if any) of Class A, Class C, and Class I are limited to 1.35%, 2.10% and 1.10% of average net assets, respectively. Calamos Advisors may recapture previously waived expense amounts within the same fiscal year for any day where the respective Fund’s expense ratio falls below the contractual expense limit up to the expense limit for that day. This undertaking is binding on CALAMOS ADVISORS and any of its successors and assigns. This agreement is not terminable by either party. The expense ratios shown above may differ from the more recent expense ratios reported in the Financial Highlights section of this report.
| † | Average annual total return measures net investment income and capital gain or loss from portfolio investments as an annualized average assuming reinvestment of dividends and capital gains distributions. Performance shown includes the effects of an expense reimbursement that improved results. Load-adjusted returns are adjusted for the maximum frontend sales load of 2.25% for Class A shares and returns for Class C shares have been adjusted for the contingent deferred sales charge (CDSC). |
NOTES:
On July 1, 2018, the Thomson Reuters Global Convertible Bond Index (USD) replaced the ICE BofAML Global 300 Convertible Index as the Fund’s primary benchmark because it more closely aligns with the Fund’s investment universe. The Thomson Reuters Global Convertible Bond Index (USD) is designed to represent the global convertible market.
The ICE BofAML Global 300 Convertible Index is a global convertible index composed of companies representative of the market structure of countries in North America, Europe and the Asia/Pacific region.
Bloomberg Barclays Global Aggregate Bond Index provides a broad-based measure of the global investment grade fixed-rate debt markets. It is comprised of the U.S. Aggregate, Pan-European Aggregate, and the Asian-Pacific Aggregate Indexes. It also includes a wide range of standard and customized subindices by liquidity constraint, sector, quality and maturity.
Unmanaged index returns assume reinvestment of any and all distributions and, unlike fund returns, do not reflect fees, expenses or sales charges. Investors cannot invest directly in an index.
The Fund’s use of derivative instruments involves investment risks and transaction costs to which the Fund would not be subject absent the use of these instruments and, accordingly, may result in losses greater than if they had not been used. Derivative instruments can be illiquid, may disproportionately increase losses and may have a potentially large impact on Fund performance.
Calamos Growth Fund
OVERVIEW
The fund invests in the equities of U.S. companies from a range of market capitalizations that we believe offer the best potential for growth.
KEY FEATURES
| | ◾ | | Utilizes more than two decades of extensive research experience in growth investing | |
| | ◾ | | Active management focuses on top-down views and bottom-up fundamentals | |
| | ◾ | | Research-driven approach identifies opportunities by combining top-down analysis with a focus on key growth characteristics | |
PORTFOLIO FIT
This actively managed fund seeks to provide attractive returns through its emphasis on higher growth companies primarily in large and mid cap arenas.
| | |
| FUND NASDAQ SYMBOLS |
A Shares | | CVGRX |
C Shares | | CVGCX |
I Shares | | CGRIX |
| |
|
| FUND CUSIP NUMBERS |
A Shares | | 128119302 |
C Shares | | 128119856 |
I Shares | | 128119807 |
| |
CALAMOS GROWTH FUND
INVESTMENT TEAM DISCUSSION
How has the Fund performed?
For the 12-month period ended October 31, 2018, Calamos Growth Fund returned 6.12% (Class A shares at net asset value) versus the S&P Composite 1500 Growth Index return of 10.69%. For the same period, the S&P 500 Index rose 7.35% and the Russell Midcap Growth Index returned 6.14%. The top-three names of the S&P 1500 Growth Index accounted for 54% of index return or 17% of market value. Top-10 names accounted for 74% of return or 32% of market value.
The Fund’s performance reflects continued strength in the U.S. economy, where businesses enjoyed the continuation of strong, double-digit earnings growth (as represented by S&P 500 earnings growth). However, we also saw a slow decline in overall market valuation brought on by concerns of Fed rate hikes and slowing global growth.
Since its inception on September 4, 1990, the Fund has returned 12.61% on an annualized basis (Class A shares at net asset value), demonstrating its ability to outdistance the growth and broad indices over full market cycles. Over the same period, the S&P 500 Index and the Russell Midcap Growth Index returned 10.12% and 10.81%, respectively.
What factors influenced performance over the period?
The U.S. and world equity markets began the period in a state of euphoria. Investors and markets cheered strong global growth, tax reform in the U.S., and accommodative monetary policies around the world. Through January 26, 2018, the S&P 500 Index (as a broad measure of the U.S. equity market) was on pace for a 61% annualized return.
In late January and early February of 2018, U.S. equity markets witnessed their first correction since early 2016. Investor worry centered on strong U.S. economic data, which many believed could lead the Fed to be more hawkish than anticipated. Market volatility was back after being absent for most of 2016 and 2017. Eventually U.S. markets climbed higher on the back of strong U.S. corporate earnings growth. U.S. real GDP growth gained 4.2% in 2Q 2018, and the U.S. equity market regained its stride. The market and growth stocks climbed from early April though the end of August 2018 and attained new highs. After bouncing mostly sideways though September, the market dropped in October, and the culprit again appeared to be angst over rate hikes putting the brakes on future growth.
Equity market performance was extremely narrow during the period, perhaps indicating a crowded trade mentality. Within the S&P 500 Index, the top three stocks by market capitalization (Apple, Microsoft and Amazon) accounted for approximately 55% of the benchmark’s returns. While the S&P 500 Index was up 7.35% for the reporting period, the equally weighted S&P 500 Index was ahead only 4.58%.
The Fund had been outperforming the S&P Composite 1500 Growth Index for much of the first seven months of the reporting period, but Fund performance struggled from mid-May through the end of the reporting period. Our investments within the financials sector struggled most notably in the latter part of the reporting period. Our belief that rising rates and a steepening of the yield curve may provide a strong tailwind for the sector has not come to pass. But we continue to find attractive opportunities within the sector as we examine better capitalized U.S. banking institutions, attractive valuations,
| | | | |
| 24 | | CALAMOS OPEN-END FAMILY OF FUNDS ANNUAL REPORT | | |
Calamos Growth Fund
and solid growth prospects. For the full reporting period, the overweight to the financials sector has been a drag on relative performance, as has company-specific selection within insurance and mortgage finance.
Selection within healthcare has been a drag on relative performance. Individual names within the pharmaceuticals as well as equipment industries underperformed. Additionally, as mentioned, our portfolio has been a bit more cautious around the mega cap names in general. In our view, those names (in aggregate) trade at more expensive valuations and could be a crowded trade. Our stance relative to the top names in the index has detracted from relative performance, as those names generally performed well for the reporting period.
Selection within the industrials sector strongly outperformed their counterparts within the benchmark. The industrials sector was a laggard among the market’s sectors, as concerns about growth outside of the U.S. and ongoing trade disputes seemed to dampen the outlook for cyclical growth opportunities. That being said, individual names within conglomerates, machinery and airlines industries all added significant value during the reporting period. Our stance on some of the more outright defensive sectors of the market, such as real estate and utilities, was also beneficial. Our view that investors would still prefer U.S. secular and cyclical growth names proved accurate.
How is the Fund positioned?
In this all-cap growth equity Fund, we seek to invest in U.S. companies that we believe have the best prospects for sustainable and high relative growth. The Fund offers a diversified approach and participates in long-term growth trends by focusing on companies with solid fundamentals, global brands, and strong growth catalysts, while being mindful of valuations.
Before we discuss positioning changes, it should be noted that during the reporting period, Standard & Poor’s changed the classification of some information technology, consumer discretionary and telecommunications services names, which may render comparisons to the beginning of the period more difficult. Most notably, the telecommunications services sector is now called communication services and is the home for Alphabet and Facebook (both formerly held within the information technology sector). Disney, Netflix, Comcast, Time Warner and Fox came out of the consumer discretionary sector and are now held within the communication services sector as well.
The Fund still favors a combination of secular and cyclical growth opportunities. Information technology, consumer discretionary and communication services are the Fund’s largest sectors in terms of absolute weight, though industrials, financials and health care also each make up more than 10% of portfolio holdings. Even so, our weights to information technology and consumer discretionary decreased over the period, and the increase in communication services was mainly a result of the reclassification mentioned earlier. That leaves real estate, utilities, energy, consumer staples and materials as sectors with smaller weights or, in some cases, no exposure. Despite an increase in volatility, we believe the underpinnings of the U.S. economy remain intact given the strength in corporate earnings, an accommodative monetary policy (despite incremental moves to raise rates), an improved fiscal policy and a more relaxed regulatory environment.
| | | | |
| SECTOR WEIGHTINGS | |
Information Technology | | | 25.5 | % |
Consumer Discretionary | | | 15.9 | |
Communication Services | | | 13.9 | |
Industrials | | | 13.5 | |
Financials | | | 12.7 | |
Health Care | | | 12.2 | |
Materials | | | 3.7 | |
Consumer Staples | | | 2.0 | |
Other | | | 0.6 | |
| | | | | |
Sector weightings are subject to change daily and are calculated as a percentage of net assets. The table excludes cash or cash equivalents, any government/sovereign bonds or broad based index hedging securities the Fund may hold.
Calamos Growth Fund
What closing thoughts do you have for Fund shareholders?
We hold to the view that the U.S. market has not seen the last hurrah of its long, but slower growth recovery initiated many years ago. What can be confusing about the risk outlook is that slowing economic growth is not the problem—the source of market risk may be the turning of the monetary tide in the U.S. However, we remain cautious and patient, believing that the U.S. bull market still has legs. The consensus may have underestimated the impact of the Tax Cuts and Jobs Act, which promoted a massive transfer of resources from the public to the private sector. Along with deregulation, these changes have encouraged high levels of confidence among American small businesses and facilitated an acceleration of bank lending. So long as the U.S. can manage to balance interest rates and inflation, we believe that U.S. equities can continue to offer attractive opportunities.
This information is not intended to be a recommendation or investment advice, and does not constitute a solicitation to buy or sell securities. Certain statements in this commentary are forward-looking statements. Discussions of specific investments are for illustration only and are not intended as recommendations of individual investments. The forward looking statements and other views expressed herein are those of the portfolio managers as of the date of this report. Actual future results or occurrence may differ significantly from those anticipated in any forward-looking statements and the views expressed herein are subject to change at any time, due to numerous market and other factors. The Fund disclaims any obligation to update publicly or review any forward-looking statements or views expressed herein.
ANNUALIZED RETURN: SINCE INCEPTION (9/4/90) THROUGH 10/31/18
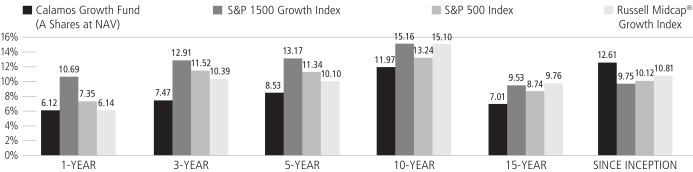
Performance data quoted represents past performance, which is no guarantee of future results. Current performance may be lower or higher than the performance quoted.
The principal value and investment return of an investment will fluctuate so that your shares, when redeemed, may be worth more or less than their original cost. You can obtain performance data current to the most recent month end by visiting www.calamos.com. Average annual total return measures net investment income and capital gain or loss from portfolio investments as an annualized average. All performance shown assumes reinvestment of dividends and capital gains distributions. Performance is for the Fund’s Class A shares at net asset value and does not include the Fund’s maximum front-end sales charge of 4.75%. Had it been included, the Fund’s return would have been lower. The Fund also offers Class C and Class I shares, the performance of which may vary. Source: State Street Corporation and Lipper, Inc.
| | | | |
| 26 | | CALAMOS OPEN-END FAMILY OF FUNDS ANNUAL REPORT | | |
Calamos Growth Fund
GROWTH OF $10,000: FOR THE 10-YEAR PERIOD ENDED 10/31/18
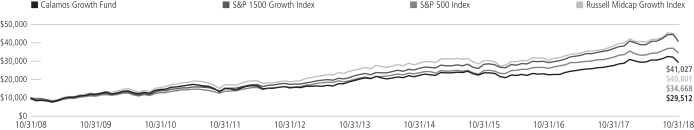
AVERAGE ANNUAL TOTAL RETURN† AS OF 10/31/18
| | | | | | | | | | | | | | | |
| | | 1
YEAR | | 5
YEARS | | 10
YEARS |
Class A Shares – Inception 9/4/90 | | | | | | | | | | | | | | | |
Without Sales Charge | | | | 6.12 | % | | | | 8.53 | % | | | | 11.97 | % |
With Sales Charge | | | | 1.09 | | | | | 7.47 | | | | | 11.43 | |
Class C Shares – Inception 9/3/96 | | | | | | | | | | | | | | | |
Without Sales Charge | | | | 5.34 | | | | | 7.71 | | | | | 11.14 | |
With Sales Charge | | | | 4.48 | | | | | 7.71 | | | | | 11.14 | |
Class I Shares – Inception 9/18/97 | | | | 6.41 | | | | | 8.80 | | | | | 12.26 | |
Performance data quoted represents past performance, which is no guarantee of future results. Current performance may be lower or higher than the performance quoted. The principal value and investment return of an investment will fluctuate so that your shares, when redeemed, may be worth more or less than their original cost.
As of the prospectus dated 3/1/18, the Fund’s gross expense ratio for Class A shares is 1.40%; Class C is 2.15% and Class I is 1.15%. The expense ratios shown above may differ from the more recent expense ratios reported in the Financial Highlights section of this report.
On October 1, 2018, the S&P 1500 Growth Index replaced the Russell Midcap® Growth Index as the Fund’s primary benchmark because the Fund’s portfolio managers believe the S&P 1500 Growth Index more closely represents the Fund’s investment universe. The S&P 1500 Growth Index is designed to provide investors with a measure of the performance of U.S. growth equities.
| † | Average annual total return measures net investment income and capital gain or loss from portfolio investments as an annualized average assuming reinvestment of dividends and capital gains distributions. Performance shown reflects the effects of an expense reimbursement that improved results and was in effect until March 31, 2000. Load-adjusted returns are adjusted for the maximum front-end sales load of 4.75% for Class A shares and returns for Class C have been adjusted for the contingent deferred sales charge (CDSC). |
NOTES:
The graphs do not reflect the income taxes that you would pay on fund distributions or the redemption of fund shares. Fund performance includes reinvestment of dividends and adjustment for the maximum sales charge for Class A shares. The performance of other classes will vary from the performance of the class shown based on the difference in sales charges and fees paid by shareholders investing in different share classes.
The S&P 500 Index is an unmanaged index generally considered representative of the U.S. stock market. Index data shown for the Annualized Return Since Inception graph is from 8/31/90, since comparative index data is only available for full monthly periods. Source: Lipper, Inc.
The Russell Midcap® Growth Index measures the performance of mid-sized companies with growth characteristics. Index data shown for the Annualized Return Since Inception graph is from 8/31/90, since comparative index data is only available for full monthly periods. Source: Lipper, Inc.
Index returns assume reinvestment of dividends and do not reflect deduction of fees and expenses. It is not possible to invest directly in an index.
Calamos Growth and Income Fund
OVERVIEW
The fund invests primarily in U.S. equity and convertible securities in an attempt to balance risk/reward while providing growth and income.
KEY FEATURES
| | ◾ | | Leverages more than three decades of research experience combining equities and convertible holdings to provide equity-like participation | |
| | ◾ | | Provides a core holding option that aims to maintain a consistent risk posture throughout the market cycle | |
| | ◾ | | Research-driven approach identifies opportunities by combining top-down analysis with a focus on key growth characteristics | |
PORTFOLIO FIT
The fund can provide a long-term core equity allocation with the potential for lower volatility.
| | |
| FUND NASDAQ SYMBOLS |
A Shares | | CVTRX |
C Shares | | CVTCX |
I Shares | | CGIIX |
| |
|
| FUND CUSIP NUMBERS |
A Shares | | 128119104 |
C Shares | | 128119831 |
I Shares | | 128119872 |
| |
CALAMOS GROWTH AND INCOME FUND
INVESTMENT TEAM DISCUSSION
How has the Fund performed?
For the 12-month period ended October 31, 2018, Calamos Growth and Income Fund gained 5.20% (Class A Shares at net asset value) versus a return of 7.35% for the S&P 500 Index and a 4.05% increase for the ICE BofAML All U.S. Convertibles ex Mandatory Index.
We manage this Fund with the goal of achieving upside equity participation and potential downside protection over full market cycles. Since its inception on September 22, 1988, the Fund has returned 10.82% on an annualized basis (Class A shares at net asset value) versus a 10.36% gain for the S&P 500 Index and a 9.31% return for the ICE BofAML All U.S. Convertibles ex Mandatory Index.
Please discuss the Fund’s lower-volatility characteristics.
We believe the Fund’s historical lower-volatility characteristics are a byproduct of our investment style and focus on participating in equity market upside with less volatility than the market as a whole. Beta is one popular statistic for measuring volatility. Beta considers a fund’s historic volatility versus the market, which is assigned a beta of 1.0. A fund with half the volatility of the market would have a beta of 0.5, while a fund with a beta of 2.0 would have been twice as volatile as the market.
Since its inception, the Fund has had a beta of 0.73 (Class A shares) versus the S&P 500 Index. The Fund has therefore outperformed the broader equity market, as measured by the S&P 500 Index, over the life of the Fund with less volatility than the equity market. Please note that past performance does not indicate future results and that beta is one of many measures of risk.
What factors influenced performance over the period?
The U.S. and world equity markets began the period in a state of euphoria. Investors and markets cheered strong global growth, tax reform in the U.S., and accommodative monetary policies around the world. Through January 26, 2018, the S&P 500 Index (as a broad measure of the U.S. equity market) was on pace for a 61% annualized return.
In late January and early February of 2018, U.S. equity markets witnessed their first correction since early 2016. Investor worry centered on strong U.S. economic data, which could lead the Fed to be more hawkish than anticipated. Market volatility was back after being absent for most of 2016 and 2017. Eventually U.S. markets climbed higher on the back of strong U.S. corporate earnings growth. U.S. real GDP growth gained 4.2% in 2Q 2018, and the U.S. equity market regained its stride. The S&P 500 Index climbed from early April through the end of August 2018 and attained new highs. After bouncing mostly sideways through September, the market dropped in October, and the culprit again appeared to be angst over rate hikes putting the brakes on future growth.
Equity market performance was extremely narrow during the period, perhaps indicating a crowded trade mentality. Within the S&P 500 Index, the top three stocks by market capitalization (Apple, Microsoft and Amazon) accounted for approximately
| | | | |
| 28 | | CALAMOS OPEN-END FAMILY OF FUNDS ANNUAL REPORT | | |
Calamos Growth and Income Fund
55% of the benchmark’s returns. While the S&P 500 Index was up 7.35% for the reporting period, most of this gain came from a few outsized tech stocks. In fact, the equally weighted* S&P 500 Index was ahead only 4.58% for the 12-month period. This index performance concentration, in our view, exemplifies one of the risks in the marketplace: investors crowding into a handful of names. An approach such as the Growth and Income Fund may help them access equity markets while being more mindful of risk.
Market volatility, while never enjoyable in the midst of it, can be beneficial to our strategy, as it provides opportunities to manage the risk/reward posture within the Fund. While the Fund participated strongly in the initial upward trajectory of the reporting period, the Fund also sustained its value better during the sharp and sudden sell-off in late January and early February. And again, toward the end of the reporting period in late September and October, the Fund’s positioning resulted in reduced downside participation during the equity market’s sell-off.
The Fund benefitted from convertible structures in the earlier part of 2018, as volatility pricing presented opportunities to access markets and securities with attractive risk/reward profiles. As volatility increased, these investments provided positive contributions to portfolio performance. Additionally, the Fund’s investments in the industrials and utilities sectors strongly outperformed those within the S&P 500 Index. While industrials names struggled within the market, Fund holdings within conglomerates as well as railroads performed well and provided strong absolute and relative results. A convertible holding in the electric utilities industry also outperformed to the benefit of Fund performance.
The Fund’s stance within the S&P 500 Index’s top-performing sectors, consumer discretionary, health care and information technology, delivered positive absolute returns, though relative underperformance. Selection within the consumer discretionary sector lagged and was a drag on relative performance. Holdings within the movies & entertainment space performed well overall providing double-digit increases for the reporting period, though trailing their S&P 500 Index peers. Selection within general merchandise stores as well as footwear underperformed. Information technology was one of the market’s leading sectors, but Fund holdings lagged the market’s return. The Fund’s convertible holdings in semiconductor names outperformed their underlying common stocks, though the issuing companies lagged the overall semiconductor industry.
How is the Fund positioned?
Before we discuss positioning changes, it should be noted that during the reporting period, Standard & Poor’s changed the classification of some information technology, consumer discretionary and telecommunications services names, which may render comparisons to the beginning of the period more difficult. Most notably, the telecommunications services sector is now called communication services and is the home for Alphabet and Facebook (both formerly held within the information technology sector). Disney, Netflix, Comcast, Time Warner and Fox came out of the consumer discretionary sector, and are now held within the communication services sector as well. In terms of the portfolio, our weights to information technology and consumer discretionary decreased over the period, and the increase in communication services was mainly a result of the reclassification mentioned above.
Overall, we believe that the U.S. equity market can climb higher on the back of strong fundamentals, a growing economy and improved household/consumer balance sheets. As the Fed has shown concern regarding inflation and responded by raising interest rates, we continue to favor higher-quality growth businesses that have the potential to continue expanding, yet offer strong free cash flow. Conversely, we avoid more
| | | | |
| SECTOR WEIGHTINGS | |
Information Technology | | | 19.7 | % |
Health Care | | | 13.3 | |
Financials | | | 12.1 | |
Consumer Discretionary | | | 11.1 | |
Industrials | | | 9.2 | |
Communication Services | | | 8.7 | |
Consumer Staples | | | 6.3 | |
Energy | | | 5.0 | |
Utilities | | | 3.4 | |
Real Estate | | | 2.4 | |
Other | | | 2.1 | |
Materials | | | 1.4 | |
Sector weightings are subject to change daily and are calculated as a percentage of net assets. The table excludes cash or cash equivalents, any government/sovereign bonds or broad based index hedging securities the Fund may hold.
| * | Equal weighting gives the same weight, or importance, to each stock in a portfolio or index. |
Calamos Growth and Income Fund
outright defensive businesses that may offer cash flows, but have little-to-no growth potential. Despite the Standard & Poor’s reclassification, information technology is still the largest sector within the index, and remains the largest sector within the Fund. Within the tech sector, we favor application software companies who help other businesses remain productive. Within industrials, we favor transportation businesses who are able to wield pricing power in markets that have capacity constraints. We hold less in areas such as REITs and low-growth consumer staples, where businesses may offer stability but not enough growth, in our view.
What closing thoughts do you have for Fund shareholders?
There continues to be a lot of discussion about where the U.S. is situated within its economic cycle and also where the U.S. equity market is located in its progression. As the market has enjoyed a long run of solid market performance since the Great Financial Crisis back in 2008, many are beginning to question how long this might last. The U.S. economic recovery has been lengthy, but growth has also been lower than typical economic expansions of the past. In our view, this gives us reason to believe that the economy may continue to grow, as expansions are not time constrained, but are subject to booms and busts. We will keep a watchful eye on financial conditions and seek to tailor the portfolio’s risk/reward profile as we see changes in market and economic conditions. Volatility has increased over recent years, and we have again seen corrections within the equity market. We believe that the potential benefits of managing risk and volatility may be more timely today than in the recent past.
This information is not intended to be a recommendation or investment advice, and does not constitute a solicitation to buy or sell securities. Certain statements in this commentary are forward-looking statements. Discussions of specific investments are for illustration only and are not intended as recommendations of individual investments. The forward looking statements and other views expressed herein are those of the portfolio managers as of the date of this report. Actual future results or occurrence may differ significantly from those anticipated in any forward-looking statements and the views expressed herein are subject to change at any time, due to numerous market and other factors. The Fund disclaims any obligation to update publicly or review any forward-looking statements or views expressed herein.
ANNUALIZED RETURN: SINCE INCEPTION (9/22/88) THROUGH 10/31/18
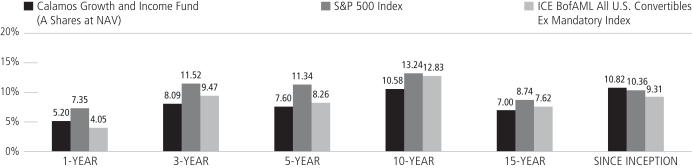
Performance data quoted represents past performance, which is no guarantee of future results. Current performance may be lower or higher than the performance quoted.
The principal value and investment return of an investment will fluctuate so that your shares, when redeemed, may be worth more or less than their original cost. You can obtain performance data current to the most recent month end by visiting www.calamos.com. Average annual total return measures net investment income and capital gain or loss from portfolio investments as an annualized average. All performance shown assumes reinvestment of dividends and capital gains distributions. Performance is for the Fund’s Class A shares at net asset value and does not include the Fund’s maximum front-end sales charge of 4.75%. Had it been included, the Fund’s return would have been lower. The Fund also offers Class C and Class I shares, the performance of which may vary. Source: State Street Corporation and Lipper, Inc.
| | | | |
| 30 | | CALAMOS OPEN-END FAMILY OF FUNDS ANNUAL REPORT | | |
Calamos Growth and Income Fund
GROWTH OF $10,000: FOR 10-YEAR PERIOD ENDED 10/31/18
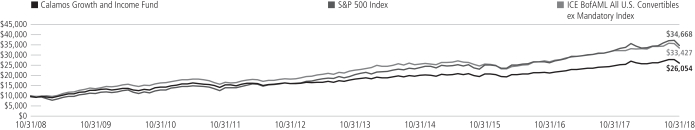
AVERAGE ANNUAL TOTAL RETURN† AS OF 10/31/18
| | | | | | | | | | | | | | | |
| | | 1
YEAR | | 5
YEARS | | 10
YEARS |
Class A Shares – Inception 9/22/88 | | | | | | | | | | | | | | | |
Without Sales Charge | | | | 5.20 | % | | | | 7.60 | % | | | | 10.58 | % |
With Sales Charge | | | | 0.22 | | | | | 6.55 | | | | | 10.05 | |
Class C Shares – Inception 8/5/96 | | | | | | | | | | | | | | | |
Without Sales Charge | | | | 4.42 | | | | | 6.77 | | | | | 9.75 | |
With Sales Charge | | | | 3.44 | | | | | 6.77 | | | | | 9.75 | |
Class I Shares – Inception 9/18/97 | | | | 5.45 | | | | | 7.85 | | | | | 10.85 | |
Performance data quoted represents past performance, which is no guarantee of future results. Current performance may be lower or higher than the performance quoted. The principal value and investment return of an investment will fluctuate so that your shares, when redeemed, may be worth more or less than their original cost.
As of the prospectus dated 3/1/18, the Fund’s gross expense ratio for Class A shares is 1.12%; Class C is 1.87% and Class I is 0.87%. The expense ratios shown above may differ from the more recent expense ratios reported in the Financial Highlights section of this report.
| † | Average annual total return measures net investment income and capital gain or loss from portfolio investments as an annualized average assuming reinvestment of dividends and capital gains distributions. Load-adjusted returns are adjusted for the maximum front-end sales load of 4.75% for Class A shares and returns for Class C shares have been adjusted for the contingent deferred sales charge (CDSC). |
NOTES:
The graphs do not reflect the income taxes that you would pay on fund distributions or the redemption of fund shares. Fund performance includes reinvestment of dividends and adjustment for the maximum sales charge for Class A shares. The performance of other classes will vary from the performance of the class shown based on the difference in sales charges and fees paid by shareholders investing in different share classes.
The S&P 500 Index is an unmanaged index generally considered representative of the U.S. stock market. Source: Lipper, Inc.
The ICE BofAML All U.S. Convertibles ex Mandatory Index represents the U.S. convertibles securities market excluding mandatory convertibles. Index data shown for the Annualized Return Since Inception graph is from 9/30/88, since comparative index data is only available for full monthly periods. Source: Lipper, Inc.
Index returns assume reinvestment of dividends and do not reflect deduction of fees and expenses. It is not possible to invest directly in an index.
Calamos Dividend Growth Fund
OVERVIEW
The fund invests in companies that we believe have the ability to increase dividends over time, either through increasing profits or more efficient use of capital.
KEY FEATURES
| | ◾ | | Utilizes bottom-up stock picking and a benchmark-agnostic approach, which focuses on good businesses with solid cash flow and value prices | |
PORTFOLIO FIT
The fund seeks to provide a regular stream of income and dividend-paying equity investments that tend to be less volatile than non-dividend payers.
| | |
| FUND NASDAQ SYMBOLS |
A Shares | | CADVX |
C Shares | | CCDVX |
I Shares | | CIDVX |
| | | |
|
| FUND CUSIP NUMBERS |
A Shares | | 128120839 |
C Shares | | 128120821 |
I Shares | | 128120813 |
| | | |
CALAMOS DIVIDEND GROWTH FUND
INVESTMENT TEAM DISCUSSION
How has the Fund performed?
For the 12-month period ended October 31, 2018, Calamos Dividend Growth Fund returned 5.26% (Class A shares at net asset value) versus a 7.35% gain for the S&P 500 Index.
The Fund’s performance reflects continued strength in the U.S. economy where businesses enjoyed the continuation of strong double-digit earnings growth (as represented by S&P 500 earnings growth). However, we also saw a slow decline in overall market valuation brought on by concerns of Fed rate hikes and slowing global growth. Market leadership came from areas not typically known as strong dividend growth stories, with consumer discretionary, information technology and health care representing the only sectors to outperform the broad market’s return.
Our screening and fundamental research process favors companies with higher-quality balance sheets rather than those that require additional financing to maintain operations. Our top-down view helped steer us toward cyclical growth companies that may see improving balance sheets in light of a synchronous global-growth environment. However, we also hold traditionally stronger, stable growth companies, avoiding most of the bond-proxy stocks.
What factors influenced performance?
The U.S. and world equity markets began the period in a state of euphoria. Investors and markets cheered strong global growth, tax reform in the U.S., and accommodative monetary policies around the world. Through January 26, 2018, the S&P 500 Index (as a broad measure of the U.S. equity market) was on pace for a 61% annualized return.
In late January and into February of 2018, U.S. equity markets witnessed their first correction since early 2016. Investor worry centered on strong U.S. economic data, which many believed could lead the Fed to be more hawkish than anticipated. Market volatility was back after being absent for most of 2016 and 2017. Eventually U.S. markets climbed higher on the back of strong U.S. corporate earnings growth. U.S. real GDP growth gained 4.2% in 2Q 2018, and the U.S. equity market regained its stride. The S&P 500 Index climbed from early April though the end of August 2018 and attained new highs. After bouncing mostly sideways though September, the market dropped in October, and the culprit again appeared to be angst over rate hikes putting the brakes on future growth.
Equity market performance was extremely narrow during the period, perhaps indicating a crowded trade mentality. Within the S&P 500 Index, the top three stocks by market capitalization (Apple, Microsoft, and Amazon) accounted for approximately 55% of the benchmark’s returns. While the S&P 500 Index was up 7.35% for the reporting period, the equally weighted* S&P 500 Index was ahead only 4.58%.
The Fund’s underweight and selection within both information technology and consumer discretionary detracted from relative performance. Within information technology, the Fund’s holdings collectively had strong double-digit returns, but trailed their S&P 500 Index peers. Selection within the semiconductor and semiconductor equipment industries
| * | Equal weighting gives the same weight, or importance, to each stock in a portfolio or index. |
| | | | |
| 32 | | CALAMOS OPEN-END FAMILY OF FUNDS ANNUAL REPORT | | |
Calamos Dividend Growth Fund
disappointed, as global growth decelerated. Holdings in internet software & services also lagged. In this case, we believed the Fund was better positioned from a valuation perspective, but we still underperformed on a relative basis. Within the consumer discretionary sector, holdings in the movies & entertainment industry lagged, as the Fund missed out on an outsized gain by not owning one highflying stock in the index. Struggles within a discount retailer also detracted from performance, as did missing out on large gains in smaller automotive retailers.
The Fund did see relative outperformance from sectors that trailed the overall market, such as industrials, utilities and real estate. Industrials tended to struggle as global growth disappointed, but the Fund’s selection within aerospace & defense as well as railroads strongly outperformed. Real estate and utilities are commonly viewed as defensive, yield-oriented sectors, and the Fund had lesser weights to each of those sectors as our preference for businesses showing higher growth steered us toward other areas.
How is the Fund positioned?
As always, our focus remains on solid businesses that have sustainable cash flows and are trading at attractive prices. Moreover, our emphasis on companies that are better stewards of capital should help relative performance in the current investment environment. We believe that rising interest rates will prove most difficult for companies heavily reliant on easy access to capital markets to fund their operations. The ability of companies to fund and potentially grow dividends is likely to be a priority among investors as interest rate increases are still modest. Holdings with equity yields and an opportunity for capital appreciation still appear to be an attractive investment allocation.
Before we discuss positioning changes, it should be noted that during the reporting period, Standard and Poor’s changed the classification of some information technology, consumer discretionary and telecommunications services names, which may render comparisons to the beginning of the period more difficult. Most notably, the telecommunications services sector is now called communication services, and is the home for Alphabet and Facebook (both formerly held within the information technology sector). Disney, Netflix, Comcast, Time Warner and Fox came out of the consumer discretionary sector, and are now held within the communication services sector as well. So, in absolute terms, the information technology and consumer discretionary sectors shrank in size, while the former telecommunication services, now communication services is considerably larger.
The Fund holds relatively modest overweights and underweights across the various sectors. The Fund continues to hold a slight overweight to the financials sector where we are finding attractive stocks with much improved balance sheets and growth potential in light of improved economic trends. Rising interest rates and more “normalized” business operations going forward could be a tailwind for financial stocks. The Fund now has a modest underweight to information technology stocks, as some of the blue chip names are no longer categorized as tech. The Fund maintains modest underweights to consumer staples and real estate, as we believe diminished growth prospects have made the sectors broadly less attractive.
| | | | |
| SECTOR WEIGHTINGS | |
Information Technology | | | 19.4 | % |
Financials | | | 14.7 | |
Health Care | | | 14.0 | |
Communication Services | | | 10.2 | |
Industrials | | | 9.5 | |
Consumer Discretionary | | | 9.5 | |
Consumer Staples | | | 6.6 | |
Energy | | | 6.0 | |
Utilities | | | 3.5 | |
Materials | | | 2.5 | |
Real Estate | | | 2.0 | |
Other | | | 1.5 | |
Sector weightings are subject to change daily and are calculated as a percentage of net assets. The table excludes cash or cash equivalents, any government/sovereign bonds or broad based index hedging securities the Fund may hold.
Calamos Dividend Growth Fund
What closing thoughts do you have for Fund shareholders?
There continues to be a lot of discussion about where the U.S. is situated within its economic cycle and also where the U.S. equity market is located in its progression. As the market has enjoyed a long run of solid market performance since the Great Financial Crisis back in 2008, many are beginning to question how long this might last. The U.S. economic recovery has been lengthy, but growth has also been lower than typical economic expansions of the past. In our view, this gives us reason to believe that the economy may continue to grow, as expansions are not time constrained, but are subject to booms and busts. We will keep a watchful eye on financial conditions and seek to tailor the portfolio’s risk/reward profile as we see changes in market and economic conditions. Volatility has increased over recent years, and we have again seen corrections within the equity market. We believe that the potential benefits of managing risk and volatility may be more timely today than in the recent past.
This information is not intended to be a recommendation or investment advice, and does not constitute a solicitation to buy or sell securities. Certain statements in this commentary are forward-looking statements. Discussions of specific investments are for illustration only and are not intended as recommendations of individual investments. The forward looking statements and other views expressed herein are those of the portfolio managers as of the date of this report. Actual future results or occurrence may differ significantly from those anticipated in any forward-looking statements and the views expressed herein are subject to change at any time, due to numerous market and other factors. The Fund disclaims any obligation to update publicly or review any forward-looking statements or views expressed herein.
| | | | |
| 34 | | CALAMOS OPEN-END FAMILY OF FUNDS ANNUAL REPORT | | |
Calamos Dividend Growth Fund
GROWTH OF $10,000: SINCE INCEPTION (8/5/13) THROUGH 10/31/18

AVERAGE ANNUAL TOTAL RETURN† AS OF 10/31/18
| | | | | | | | | | | | | | | |
| | | 1
YEAR | | 5
YEARS | | SINCE
INCEPTION |
Class A Shares – Inception 8/5/2013 | | | | | | | | | | | | | | | |
Without Sales Charge | | | | 5.26 | % | | | | 7.09 | % | | | | 7.48 | % |
With Sales Charge | | | | 0.30 | | | | | 6.05 | | | | | 6.48 | |
Class C Shares – Inception 8/5/2013 | | | | | | | | | | | | | | | |
Without Sales Charge | | | | 4.56 | | | | | 6.31 | | | | | 6.69 | |
With Sales Charge | | | | 3.59 | | | | | 6.31 | | | | | 6.69 | |
Class I Shares – Inception 8/5/2013 | | | | 5.61 | | | | | 7.36 | | | | | 7.75 | |
Performance data quoted represents past performance, which is no guarantee of future results. Current performance may be lower or higher than the performance quoted. The principal value and investment return of an investment will fluctuate so that your shares, when redeemed, may be worth more or less than their original cost.
As of the prospectus dated 3/1/18, the Fund’s gross expense ratio for Class A shares is 1.87%; Class C shares is 2.73% and Class I shares is 1.80%. The Fund’s Investment Adviser has contractually agreed to reimburse Fund expenses through 3/1/22 to the extent necessary so that Total Annual Fund Operating Expenses (excluding taxes, interest, short interest, short dividend expenses, brokerage commissions, acquired fund fees and expenses and extraordinary expenses, if any) of Class A, Class C and Class I shares are limited to 1.35%, 2.10%,1.10% of average net assets, respectively. Calamos Advisors may recapture previously waived expense amounts within the same fiscal year for any day where the respective Fund’s expense ratio falls below the contractual expense limit up to the expense limit for that day. This undertaking is binding on CALAMOS ADVISORS and any of its successors and assigns. This agreement is not terminable by either party. The expense ratios shown above may differ from the more recent expense ratios reported in the Financial Highlights section of this report.
| † | Average annual total return measures net investment income and capital gain or loss from portfolio investments as an annualized average assuming reinvestment of dividends and capital gains distributions. Performance shown reflects the effects of an expense reimbursement that improved results. Load-adjusted returns are adjusted for the maximum frontend sales load of 4.75% for Class A shares. Returns for Class C shares have been adjusted for the contingent deferred sales charge (CDSC). |
NOTES:
The graph does not reflect the income taxes that you would pay on fund distributions or the redemption of fund shares. Fund performance includes reinvestment of dividends and adjustment for the maximum sales charge for Class A shares. The performance of other classes will vary from the performance of the class shown based on the difference in sales charges and fees paid by shareholders investing in different share classes.
The S&P 500 Index is an unmanaged index generally considered representative of the U.S. stock market. Index data shown for the Annualized Return Since Inception graph is from 8/31/13, since comparative index data is only available for full monthly periods. Source: Lipper, Inc.
Index returns assume reinvestment of dividends and do not reflect deduction of fees and expenses. It is not possible to invest directly in an index.
Calamos Opportunistic Value Fund
OVERVIEW
The fund invests in the equities of small, midsize and large U.S. companies that we believe are undervalued according to certain financial measurements of their intrinsic values.
KEY FEATURES
Utilizes bottom-up stock picking and a benchmark-agnostic approach, which focuses on good businesses with solid cash flow and value prices
PORTFOLIO FIT
The fund is a core value option that may balance a growth allocation and complement other value strategies. Our flexibility in analyzing all companies regardless of sector helps us avoid the cyclicality inherent in a deep value strategy or momentum growth strategy.
| | |
| FUND NASDAQ SYMBOLS |
A Shares | | CVAAX |
C Shares | | CVACX |
I Shares | | CVAIX |
| |
|
| FUND CUSIP NUMBERS |
A Shares | | 128119666 |
C Shares | | 128119641 |
I Shares | | 128119633 |
| |
CALAMOS OPPORTUNISTIC VALUE FUND
INVESTMENT TEAM DISCUSSION
How has the Fund performed?
For the 12-month period ended October 31, 2018, Calamos Opportunistic Value Fund returned 4.53% (Class A shares at net asset value) versus a gain of 2.82% for the S&P Composite 1500 Value Index and increase of 3.03% for the Russell 1000 Value Index.
The Fund’s strong absolute and relative performance was a result of actively managing the Fund’s sector weightings and market exposures during a reporting period that witnessed two corrections. The Fund’s performance reflects continued strength in the U.S. economy, where businesses enjoyed the continuation of strong, double-digit earnings growth (as represented by S&P 500 earnings growth). However, we also saw a slow decline in overall market valuation brought on by concerns of Fed rate hikes and slowing global growth.
What factors influenced performance?
The U.S. and world equity markets began the period in a state of euphoria. Investors and markets cheered strong global growth, tax reform in the U.S., and accommodative monetary policies around the world. Through January 26, 2018, the S&P 500 Index (as a broad measure of the U.S. equity market) was on pace for a 61% annualized return.
In late January and into February of 2018, U.S. equity markets witnessed their first correction since early 2016. Investor worry centered on strong U.S. economic data, which many believed could lead the Fed to be more hawkish than anticipated. Market volatility was back after being absent for most of 2016 and 2017. Eventually U.S. markets climbed higher on the back of strong U.S. corporate earnings growth. U.S. real GDP growth gained 4.2% in 2Q 2018, and the U.S. equity market regained its stride. The market climbed from early April through the end of August 2018 and attained new highs. After bouncing mostly sideways through September, the market dropped in October, and the culprit again appeared to be angst over rate hikes putting the brakes on future growth.
The market had a preference for stocks offering higher-growth opportunities, as evidenced by the S&P Composite 1500 Growth Index’s 10.69% gain during the reporting period, which far outstripped the 2.82% gain of the S&P Composite 1500 Value Index. The Fund’s preference for stocks in companies showing stronger growth characteristics, yet trading at attractive valuations, worked well for portfolio performance.
Fund holdings in industrials added considerable value for the 12-month period. While industrials stocks within the benchmark struggled and declined in aggregate for the period, Fund holdings were able to deliver positive returns. Most notably, holdings within aerospace & defense as well as selection within industrial conglomerates provided strong outperformance.
Information technology holdings also strongly outperformed. The portfolio was overweight technology stocks during the period, favoring secular opportunities with the potential for cash flow growth. It was individual selection that was most additive to relative performance. Stock picks within the data processing, hardware, and systems software industries all strongly outperformed.
| | | | |
| 36 | | CALAMOS OPEN-END FAMILY OF FUNDS ANNUAL REPORT | | |
Calamos Opportunistic Value Fund
Energy holdings lagged those of the benchmark and detracted from relative performance. Within the oil and gas exploration and production industry, a mix of holdings underperformed those of the value index. The consumer discretionary sector was a market leading sector within the value benchmark, but Fund holdings within movies & entertainment and luxury goods industries lagged.
How is the Fund positioned?
We believe that the U.S. economy is still in favorable shape and that select businesses may continue to offer free cash flows as well as growth. As such, we continue to underweight the “safety trade” names that typically offer high dividends, but do not offer much opportunity for growth, and certainly trade at premiums relative to their growth potential.
Before we discuss positioning changes, it should be noted that during the reporting period, Standard & Poor’s changed the classification of some information technology, consumer discretionary and telecommunications services names, which may render comparisons to the beginning of the period more difficult. Most notably, the telecommunications services sector is now called communication services.
The Fund’s largest weighting and overweight remains in the information technology sector. The sector is large and diverse and offers varying opportunities for cyclical and secular growth. These IT companies are typically well capitalized and generate high cash flows from operations. We currently favor IT services and software for these reasons. Health care represents the next largest overweight, where the main allocation currently resides in life sciences and equipment rather than biotechnology and pharmaceuticals. The portfolio is most underweight the consumer staples sector, where stability is not enough when other areas of the market continue to offer better growth prospects relative to valuation. With respect to changes, the Fund’s weights to information technology and consumer discretionary decreased over the period, while the increase in communication services was mainly a result of Standard & Poor’s reclassification.
What closing thoughts do you have for Fund shareholders?
There continues to be a lot of discussion about where the U.S. is situated within its economic cycle and also where the U.S. equity market is located in its progression. As the market has enjoyed a long run of solid market performance since the Great Financial Crisis back in 2008, many are beginning to question how long this might last. The U.S. economic recovery has been lengthy, but growth has also been lower than typical economic expansions of the past. In our view, this gives us reason to believe that the economy may continue to grow, as expansions are not time constrained, but are subject to booms and busts. At some point in the economic and market cycles, value stocks will likely regain their relative favor. During the annual period when growth investing primarily led the way, we are pleased that our approach of seeking businesses that are good stewards of capital and trading at attractive valuations relative to their growth and future prospects has delivered outperformance.
This information is not intended to be a recommendation or investment advice, and does not constitute a solicitation to buy or sell securities. Certain statements in this commentary are forward-looking statements. Discussions of specific investments are for illustration only and are not intended as recommendations of individual investments. The forward looking statements and other views expressed herein are those of the portfolio managers as of the date of this report. Actual future results or occurrence may differ significantly from those anticipated in any forward-looking statements and the views expressed herein are subject to change at any time, due to numerous market and other factors. The Fund disclaims any obligation to update publicly or review any forward-looking statements or views expressed herein.
| | | | |
| SECTOR WEIGHTINGS | |
Financials | | | 22.5 | % |
Information Technology | | | 13.3 | |
Health Care | | | 12.6 | |
Energy | | | 11.4 | |
Industrials | | | 9.8 | |
Consumer Staples | | | 7.0 | |
Communication Services | | | 6.3 | |
Consumer Discretionary | | | 5.1 | |
Utilities | | | 4.7 | |
Real Estate | | | 3.1 | |
Materials | | | 2.7 | |
Other | | | 1.2 | |
Sector weightings are subject to change daily and are calculated as a percentage of net assets. The table excludes cash or cash equivalents, any government/sovereign bonds or broad based index hedging securities the Fund may hold.
Calamos Opportunistic Value Fund
ANNUALIZED RETURN: SINCE INCEPTION (10/2/02) THROUGH 10/31/18
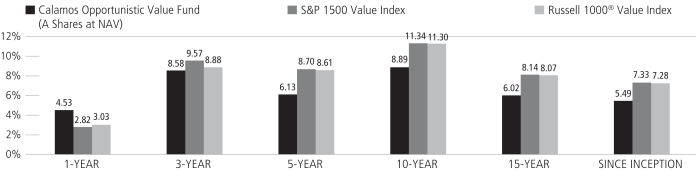
Performance data quoted represents past performance, which is no guarantee of future results. Current performance may be lower or higher than the performance quoted.
The principal value and investment return of an investment will fluctuate so that your shares, when redeemed, may be worth more or less than their original cost. You can obtain performance data current to the most recent month end by visiting www.calamos.com. Average annual total return measures net investment income and capital gain or loss from portfolio investments as an annualized average. All performance shown assumes reinvestment of dividends and capital gains distributions. Performance is for the Fund’s Class A shares at net asset value and does not include the Fund’s maximum front-end sales charge of 4.75%. Had it been included, the Fund’s return would have been lower. The Fund also offers Class C and Class I shares, the performance of which may vary. Performance shown reflects an expense reimbursement that improved results. Source: State Street Corporation and Lipper, Inc.
| | | | |
| 38 | | CALAMOS OPEN-END FAMILY OF FUNDS ANNUAL REPORT | | |
Calamos Opportunistic Value Fund
GROWTH OF $10,000: FOR THE 10-YEAR PERIOD ENDED 10/31/18
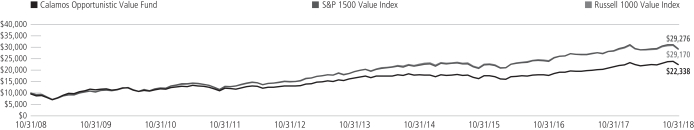
AVERAGE ANNUAL TOTAL RETURN† AS OF 10/31/18
| | | | | | | | | | | | | | | |
| | | 1
YEAR | | 5
YEARS | | 10
YEARS |
Class A Shares – Inception 1/2/02 | | | | | | | | | | | | | | | |
Without Sales Charge | | | | 4.53 | % | | | | 6.13 | % | | | | 8.89 | % |
With Sales Charge | | | | -0.44 | | | | | 5.10 | | | | | 8.37 | |
Class C Shares – Inception 1/2/02 | | | | | | | | | | | | | | | |
Without Sales Charge | | | | 3.77 | | | | | 5.34 | | | | | 8.09 | |
With Sales Charge | | | | 2.77 | | | | | 5.34 | | | | | 8.09 | |
Class I Shares – Inception 3/1/02 | | | | 4.78 | | | | | 6.38 | | | | | 9.17 | |
Performance data quoted represents past performance, which is no guarantee of future results. Current performance may be lower or higher than the performance quoted. The principal value and investment return of an investment will fluctuate so that your shares, when redeemed, may be worth more or less than their original cost.
As of the prospectus dated 3/1/18, the Fund’s gross expense ratio for Class A shares is 1.67%; Class C is 2.42% and Class I is 1.42%. The Fund’s Investment Adviser has contractually agreed to reimburse the Fund expenses through 3/1/22 to the extent necessary so that Total Annual Fund Operating Expenses (excluding taxes, interest, short interest, short dividend expenses, brokerage commissions, acquired fund fees and expenses, and extraordinary expenses, if any) of Class A, Class C, and Class I are limited to 1.15%, 1.90% and 0.90% of average net assets, respectively. Calamos Advisors may recapture previously waived expense amounts within the same fiscal year for any day where the respective Fund’s expense ratio falls below the contractual expense limit up to the expense limit for that day. This undertaking is binding on CALAMOS ADVISORS and any of its successors and assigns. This agreement is not terminable by either party. The expense ratios shown above may differ from the more recent expense ratios reported in the Financial Highlights section of this report.
| † | Average annual total return measures net investment income and capital gain or loss from portfolio investments as an annualized average assuming reinvestment of dividends and capital gains distributions. Performance shown reflects the effects of an expense reimbursement that improved results and was in effect until March 31, 2004. Load-adjusted returns are adjusted for the maximum front-end sales load of 4.75% for Class A shares and returns for Class C shares have been adjusted for the contingent deferred sales charge (CDSC). |
NOTES:
The graphs do not reflect the income taxes that you would pay on fund distributions or the redemption of fund shares. Fund performance includes reinvestment of dividends and adjustment for the maximum sales charge for Class A shares. The performance of other classes will vary from the performance of the class shown based on the difference in sales charges and fees paid by shareholders investing in different share classes.
On October 1, 2018, the S&P 1500 Value Index replaced the Russell 1000 Value Index as the Fund’s primary benchmark because it more closely aligns with the Fund’s investment strategy. The S&P 1500 Value Index is designed to provide investors with a measure of the performance of U.S. value equities.
The Russell 1000® Value Index measures the performance of those companies in the Russell 1000® Index with lower price-to-book ratios and lower forecasted growth values. Index data shown for the Annualized Return Since Inception graph is from 12/31/01, since comparative index data is only available for full monthly periods. Source: Lipper, Inc.
Index returns assume reinvestment of dividends and do not reflect deduction of fees and expenses. It is not possible to invest directly in an index.
Calamos International Growth Fund
OVERVIEW
The fund invests in non-U.S. growth companies. We focus on those firms that we believe demonstrate key growth characteristics, including increasing profit margins and high returns on invested capital.
KEY FEATURES
| | ◾ | | Focuses on growth in an asset class that is mostly defined by core and value offerings | |
| | ◾ | | Stresses company fundamentals, including global presence and strong or accelerated earnings growth | |
| | ◾ | | Investments driven by international sources of revenue for companies, not on location of headquarters | |
PORTFOLIO FIT
Investors tend to underinvest in growth outside the U.S. and emphasize growth with U.S.-oriented equity funds. The fund stands as a potential growth-focused addition to a mostly core- or value-intensive international allocation.
| | |
| FUND NASDAQ SYMBOLS |
A Shares | | CIGRX |
C Shares | | CIGCX |
I Shares | | CIGIX |
| |
| |
| FUND CUSIP NUMBERS | | |
A Shares | | 128119575 |
C Shares | | 128119559 |
I Shares | | 128119542 |
| |
CALAMOS INTERNATIONAL GROWTH FUND
INVESTMENT TEAM DISCUSSION
How has the Fund performed?
For the twelve-month period ended October 31, 2018, Calamos International Growth Fund returned -12.70% (Class A shares at net asset value) versus a -5.66% return for the MSCI EAFE Growth Index and -8.42% return for the MSCI ACWI Ex U.S. Growth Index.
The period gave rise to multiple cross-currents that increasingly challenged equity returns as the year progressed, and stocks were subject to two relatively distinct market environments over the period. International equities finished 2017 with strong gains for the year, synchronized global growth and low volatility by historic standards. As we progressed into 2018, stocks experienced higher volatility and declined over the past six months, in particular, because of escalating trade disputes, mixed economic data, a stronger U.S. dollar, and recurring political risk. For the one-year period, the Fund underperformed, as many of our holdings in companies with higher-growth and higher-quality characteristics trailed the benchmark despite their leading fundamental profiles.
Since its inception on March 16, 2005, the Fund has returned 6.12% on an annualized basis (Class A shares at net asset value) compared to a 5.11% return in the MSCI EAFE Growth Index and 5.20% gain by the MSCI ACWI Ex U.S. Growth Index. We believe this long-term record demonstrates the Fund’s ability to generate excess returns in international growth equities over complete market cycles.
What factors influenced performance during the reporting period?
The Fund underperformed the benchmark as many of our holdings in companies with higher growth and higher return on invested capital characteristics trailed the index. International markets rewarded companies with relatively more defensive growth and more value-oriented fundamentals, including lower price-to-earnings ratios.
From a geographic perspective, the Fund’s relative overweight stance in China and lagging security selection in Japan detracted from return, while Fund holdings in Canada and Sweden generated strong returns and added value to performance.
From a sector perspective, the Fund’s security selection in industrials and financials detracted from performance, as investors expressed concern about slowing global growth and certain holdings in diversified banks, machinery and aerospace industries declined in turn. The Fund’s selection within technology and real estate added to return; select positions in application software and real estate operating companies performed well due to sound fundamentals.
How is the Fund positioned?
The Fund’s regional and country positioning reflects the combined inputs of our top-down global framework and our bottom-up security analysis. Our investment team evaluates macroeconomic factors and growth opportunities and actively integrates these into the investment decision-making process.
The Fund has a modest overweight in Europe versus the MSCI ACWI Ex U.S. Growth Index, where we blend market capitalizations and end markets through a combination
| | | | |
| 40 | | CALAMOS OPEN-END FAMILY OF FUNDS ANNUAL REPORT | | |
Calamos International Growth Fund
of select exporters and companies that address domestic demand. The region offers attractive valuations and supportive liquidity, but we are also evaluating the mixed economic data and multiple political risks. We are underweight in Japan but see certain opportunities tied to the economy’s progress toward sustained growth and its inflation target. Japan’s accommodative policy, reasonable valuations and the potential for margin expansion provide additional enticements for investors.
We continue to be selective in emerging markets positioning, favoring companies exhibiting higher growth and quality fundamentals in key demand areas such as software & services, internet retail, and insurance. We are balancing positive earnings growth and attractive valuations against the negative effects of tighter global liquidity, a strong U.S. dollar, and persistent trade disputes.
From a sector perspective, the Fund has an overweight position in technology. We favor technology positions in software & services, consulting and select hardware areas due to leading growth fundamentals, large addressable markets and alignment with our secular themes. Industrials and consumer discretionary also represent key sector weights in the Fund. The Fund owns a number of positions in diverse industries including aerospace, industrial machinery, apparel and luxury goods, and internet retail.
We have an underweight stance in more defensive, interest rate-sensitive areas such as utilities and traditional telecom companies, while we favor exposure to defensive growth opportunities in health care and consumer staples with more consistent demand opportunities. We own select positions in energy and materials, and see more opportunities developing due to supply and demand fundamentals and earnings growth potential.
What closing thoughts do you have for Fund shareholders?
International macroeconomic data and corporate fundamentals have been divergent and mixed versus expectations but, on balance, reflect continued economic growth and moderate inflation. Global monetary policy remains accommodative overall, though multiple central banks are normalizing policy and we have seen a pivot toward fiscal stimulus. We continue to believe international equities are at a key juncture where important headwinds and tailwinds are colliding, and we will be looking to additional data to provide more confirmation of direction from here. We see opportunities in foreign markets, distinguished by positive earnings growth, fairly benign inflation and attractive valuations.
In terms of Fund positioning, we favor a blend of investments in secular growth and more defensive growth businesses, in addition to a set of more cyclical companies. This positioning reflects our anticipation of moderate growth conditions but also the potential for economic re-acceleration in the coming quarters. We see significant opportunities in companies with earnings growth catalysts, solid cash flow generation and healthy balance sheets. From a thematic and sector perspective, we see opportunities in the information technology sector, consumer and health care companies with targeted areas of demand, and a set of more cyclical companies with sound fundamentals and multiple catalysts. Our active investment approach and long-term perspective positions us well to take advantage of the volatility and opportunities in international equities.
This information is not intended to be a recommendation or investment advice, and does not constitute a solicitation to buy or sell securities. Certain statements in this commentary are forward-looking statements. Discussions of specific investments are for illustration only and are not intended as recommendations of individual investments. The forward looking statements and other views expressed herein are those of the portfolio managers as of the date of this report. Actual future results or occurrence may differ significantly from those anticipated in any forward-looking statements and the views expressed herein are subject to change at any time, due to numerous market and other factors. The Fund disclaims any obligation to update publicly or review any forward-looking statements or views expressed herein.
| | | | |
| SECTOR WEIGHTINGS | |
Information Technology | | | 17.3 | % |
Consumer Discretionary | | | 13.8 | |
Consumer Staples | | | 13.3 | |
Industrials | | | 11.4 | |
Financials | | | 10.6 | |
Health Care | | | 10.2 | |
Communication Services | | | 7.7 | |
Energy | | | 4.9 | |
Materials | | | 3.5 | |
Real Estate | | | 2.0 | |
Other | | | 0.3 | |
| | | | | |
Sector weightings are subject to change daily and are calculated as a percentage of net assets. The table excludes cash or cash equivalents, any government/sovereign bonds or broad based index hedging securities the Fund may hold.
Calamos International Growth Fund
| | | | |
| 42 | | CALAMOS OPEN-END FAMILY OF FUNDS ANNUAL REPORT | | |
ANNUALIZED RETURN: SINCE INCEPTION (3/16/05) THROUGH 10/31/18
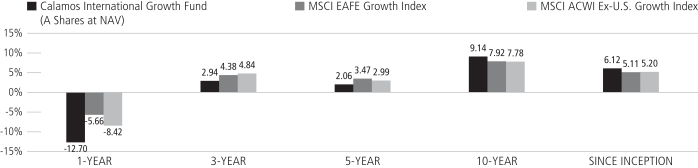
Performance data quoted represents past performance, which is no guarantee of future results. Current performance may be lower or higher than the performance quoted.
The principal value and investment return of an investment will fluctuate so that your shares, when redeemed, may be worth more or less than their original cost. You can obtain performance data current to the most recent month end by visiting www.calamos.com. Average annual total return measures net investment income and capital gain or loss from portfolio investments as an annualized average. All performance shown assumes reinvestment of dividends and capital gains distributions. Performance is for the Fund’s Class A shares at net asset value and does not include the Fund’s maximum front-end sales charge of 4.75%. Had it been included, the Fund’s return would have been lower. The Fund also offers Class C and Class I shares, the performance of which may vary. Source: State Street Corporation and Lipper, Inc.
Calamos International Growth Fund
GROWTH OF $10,000: FOR THE 10-YEAR PERIOD ENDED 10/31/18
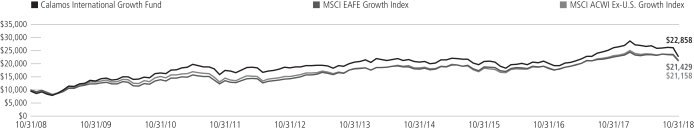
AVERAGE ANNUAL TOTAL RETURN† AS OF 10/31/18
| | | | | | | | | | | | | | | |
| | | 1 YEAR | | 5
YEARS | | 10 YEARS
OR ^SINCE
INCEPTION |
Class A Shares – Inception 3/16/05 | | | | | | | | | | | | | | | |
Without Sales Charge | | | | -12.70 | % | | | | 2.06 | % | | | | 9.14 | % |
With Sales Charge | | | | -16.83 | | | | | 1.07 | | | | | 8.62 | |
Class C Shares – Inception 3/16/05 | | | | | | | | | | | | | | | |
Without Sales Charge | | | | -13.35 | | | | | 1.30 | | | | | 8.34 | |
With Sales Charge | | | | -14.18 | | | | | 1.30 | | | | | 8.34 | |
Class I Shares – Inception 3/16/05 | | | | -12.48 | | | | | 2.32 | | | | | 9.43 | |
Class R6 Shares – Inception 9/17/18^ | | | | | | | | | | | | | | -10.67 | |
Performance data quoted represents past performance, which is no guarantee of future results. Current performance may be lower or higher than the performance quoted. The principal value and investment return of an investment will fluctuate so that your shares, when redeemed, may be worth more or less than their original cost.
As of the prospectus dated 3/1/18, the Fund’s gross expense ratio for Class A shares is 1.46%; Class C is 2.21% and Class I is 1.21%. The Fund’s investment advisor has contractually agreed to reimburse Fund expenses through 3/1/22 to the extent necessary so that Total Annual Fund Operating Expenses (excluding taxes, interest, short interest, short dividend expenses, brokerage commissions, acquired fund fees and expenses, and extraordinary expenses, if any) of Class A, Class C and Class I are limited to 1.10%, 1.85% and 0.85% of average net assets, respectively. Calamos Advisors may recapture previously waived expense amounts within the same fiscal year for any day where the respective Fund’s expense ratio falls below the contractual expense limit up to the expense limit for that day. This undertaking is binding on CALAMOS ADVISORS and any of its successors and assigns. This agreement is not terminable by either party. The expense ratios shown above may differ from the more recent expense ratios reported in the Financial Highlights section of this report.
| † | Average annual total return measures net investment income and capital gain or loss from portfolio investments as an annualized average assuming reinvestment of dividends and capital gains distributions. Performance shown reflects the effects of an expense reimbursement that improved results. Load-adjusted returns are adjusted for the maximum front-end sales load of 4.75% for Class A shares and returns for Class C shares have been adjusted for the contingent deferred sales charge (CDSC). |
NOTES:
The graphs do not reflect the income taxes that you would pay on fund distributions or the redemption of fund shares. Fund performance includes reinvestment of dividends and adjustment for the maximum sales charge for Class A shares. The performance of other classes will vary from the performance of the class shown based on the difference in sales charges and fees paid by shareholders investing in different share classes.
The MSCI EAFE Growth Index measures developed market growth equity performance (excluding the U.S. and Canada). Source: MSCI Barra.
The MSCI ACWI Ex U.S. Growth Index measures equity market performance of companies outside of the United States with higher-growth values in developed and emerging markets.
Index returns assume reinvestment of dividends and do not reflect deduction of fees and expenses. It is not possible to invest directly in an index.
Calamos Evolving World Growth Fund
OVERVIEW
The fund globally invests in growth companies, emphasizing businesses with revenue streams derived within or from emerging markets. The fund is designed to actively manage risk over a full market cycle.
KEY FEATURES
| | ◾ | | Active risk management aims to generate alpha with less downside risk than the benchmark and peers | |
| | ◾ | | Stresses strong or accelerated earnings growth and solid returns on invested capital | |
| | ◾ | | Targets well-positioned global growth companies that may benefit from long-term secular themes in emerging markets such as the rise of the emerging-market consumer | |
PORTFOLIO FIT
Given its focus on risk management, the fund can serve as a long-term emerging market allocation.
| | |
| FUND NASDAQ SYMBOLS |
A Shares | | CNWGX |
C Shares | | CNWDX |
I Shares | | CNWIX |
| |
|
| FUND CUSIP NUMBERS |
A Shares | | 128119161 |
C Shares | | 128119146 |
I Shares | | 128119138 |
| |
CALAMOS EVOLVING WORLD GROWTH FUND
INVESTMENT TEAM DISCUSSION
How has the Fund performed?
For the 12-month period ended October 31, 2018, Calamos Evolving World Growth Fund returned -15.43% (Class A shares at net asset value) versus a -12.19% return for the MSCI Emerging Markets Index. The negative returns reflect the challenging backdrop for emerging market assets and two distinct market environments over the 12-month period. EM equities advanced initially through early 2018 thanks to strong fundamentals, but declined significantly over the final six months of the period due to escalating global trade disputes, slowing economic growth, tightening financial conditions and a stronger U.S. dollar.
As we pursued our risk-managed investment objective, the Fund managed to reduce volatility versus the Index during the period, but the significant outperformance of value-oriented companies in the index challenged the returns of our holdings with their higher-growth, higher-quality characteristics.
What factors influenced performance during the reporting period?
For the period, the Fund’s negative return was primarily a consequence of our positive outlook for emerging market assets in 2017 and into 2018, based on our view that global growth prospects were improving and equity valuations remained compelling. As a result of this outlook, we owned more of our equity holdings in local emerging market positions and raised the equity sensitivity within our convertible bond holdings. From a country perspective, we also invested more in two of our preferred countries: China and India. As the year progressed, both of these allocation decisions came under pressure as we underestimated the degree to which deteriorating U.S.-China trade relations and tighter global liquidity conditions would impact returns.
From a sector perspective, the Fund’s underweight stance and security selection within energy and financials negatively affected performance. Fund holdings in the diversified banks and integrated oil & gas industries lagged, as positions in the benchmark with higher leverage and lower quality outperformed in step with the value-based style leadership for the year.
The Fund’s selection within health care and real estate added value, as select positions in the life & health insurance and real estate development industries performed well due to security-specific factors. In addition, the Fund holdings in convertible bond securities experienced less volatility and added value versus the broad decline in the MSCI Emerging Markets Index, highlighting the benefit of actively investing in convertibles as one aspect of our risk-managed approach.
The Fund’s positioning detracted from performance in terms of select country allocation decisions. In particular, the Fund’s overweight stance in India and China, coupled with underweight allocations in Brazil and Russia, held back performance for the period.
How is the Fund positioned?
Our positioning favors economies benefiting from select domestic demand trends, pro-growth fiscal reforms, and a blend of secular growth and more cyclical opportunities. We favor investments in Emerging Asia, with China and India being two of our larger weights, though we have trimmed the absolute level over the year because of the near-term challenges in these markets. We also see bottom-up opportunities in South Korea,
| | | | |
| 44 | | CALAMOS OPEN-END FAMILY OF FUNDS ANNUAL REPORT | | |
Calamos Evolving World Growth Fund
Taiwan, Brazil and the Philippines among other markets. We have added to weights in relatively more defensive developed market positions (with significant revenue ties to emerging markets) in order to provide diversification and reduce downside volatility.
From a sector perspective, the largest Fund allocations are in technology, financials, consumer discretionary, consumer staples and communication services. The Fund has underweight positions in utilities, materials and financials as many of the larger positions in the index exhibit lower-quality and higher-leverage characteristics than we prefer in our approach.
What closing thoughts to you have for Fund shareholders?
Global liquidity conditions tightened over the period and we are closely monitoring multiple headwinds to emerging markets including persistent trade disputes, the impact of more restrictive Fed policy, a strong dollar, and mixed economic data in China. Emerging market earnings growth remains quite positive, even as investor sentiment and positioning reflect a considerable degree of skepticism, and asset valuations are attractive relative to history. In our view, many companies with higher-quality fundamentals and sustainable-growth characteristics have been excessively punished during this broad sell-off and we believe these fundamental attributes may once again prove more meaningful as we see reduced market emphasis on global trade and policy developments. From a thematic and sector perspective, we see opportunities in information technology, consumer goods and media & entertainment, in addition to healthy financials and a select group of cyclical companies with improving fundamentals and catalysts. We believe our active and risk-managed investment approach will position the Fund to take advantage of the investment opportunities that should emerge in the wake of the widespread decline across emerging markets during the period.
This information is not intended to be a recommendation or investment advice, and does not constitute a solicitation to buy or sell securities. Certain statements in this commentary are forward-looking statements. Discussions of specific investments are for illustration only and are not intended as recommendations of individual investments. The forward looking statements and other views expressed herein are those of the portfolio managers as of the date of this report. Actual future results or occurrence may differ significantly from those anticipated in any forward-looking statements and the views expressed herein are subject to change at any time, due to numerous market and other factors. The Fund disclaims any obligation to update publicly or review any forward-looking statements or views expressed herein.
| | | | |
| SECTOR WEIGHTINGS | |
Financials | | | 19.8 | % |
Communication Services | | | 18.2 | |
Information Technology | | | 16.5 | |
Consumer Staples | | | 9.7 | |
Energy | | | 8.7 | |
Industrials | | | 6.3 | |
Consumer Discretionary | | | 5.5 | |
Materials | | | 5.1 | |
Real Estate | | | 3.1 | |
Health Care | | | 3.1 | |
Other | | | 0.8 | |
| | | | | |
Sector weightings are subject to change daily and are calculated as a percentage of net assets. The table excludes cash or cash equivalents, any government/sovereign bonds or broad based index hedging securities the Fund may hold.
ANNUALIZED RETURN: SINCE INCEPTION (8/15/08) THROUGH 10/31/18
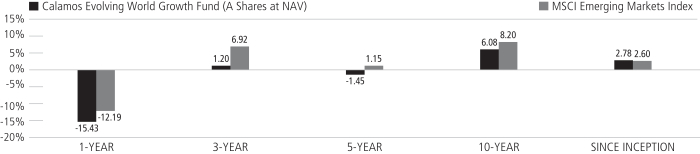
Performance data quoted represents past performance, which is no guarantee of future results. Current performance may be lower or higher than the performance quoted.
The principal value and investment return of an investment will fluctuate so that your shares, when redeemed, may be worth more or less than their original cost. You can obtain performance data current to the most recent month end by visiting www.calamos.com. Average annual total return measures net investment income and capital gain or loss from portfolio investments as an annualized average. All performance shown assumes reinvestment of dividends and capital gains distributions. Performance is for the Fund’s Class A shares at net asset value and does not include the Fund’s maximum front-end sales charge of 4.75%. Had it been included, the Fund’s return would have been lower. The Fund also offers Class C and Class I shares, the performance of which may vary. Source: State Street Corporation and Lipper, Inc.
Calamos Evolving World Growth Fund
GROWTH OF $10,000: FOR THE 10-YEAR PERIOD ENDED 10/31/18
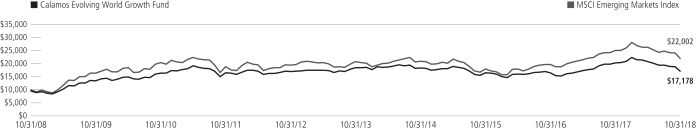
AVERAGE ANNUAL TOTAL RETURN† AS OF 10/31/18
| | | | | | | | | | | | | | | |
| | | 1
YEAR | | 5
YEARS | | 10
YEARS |
Class A Shares – Inception 8/15/08 | | | | | | | | | | | | | | | |
Without Sales Charge | | | | -15.43 | % | | | | -1.45 | % | | | | 6.08 | % |
With Sales Charge | | | | -19.45 | | | | | -2.41 | | | | | 5.56 | |
Class C Shares – Inception 8/15/08 | | | | | | | | | | | | | | | |
Without Sales Charge | | | | -16.04 | | | | | -2.19 | | | | | 5.29 | |
With Sales Charge | | | | -16.88 | | | | | -2.19 | | | | | 5.29 | |
Class I Shares – Inception 8/15/08 | | | | -15.21 | | | | | -1.21 | | | | | 6.35 | |
Performance data quoted represents past performance, which is no guarantee of future results. Current performance may be lower or higher than the performance quoted. The principal value and investment return of an investment will fluctuate so that your shares, when redeemed, may be worth more or less than their original cost.
As of the prospectus dated 3/1/18, the Fund’s gross expense ratio for Class A shares is 1.67%; Class C is 2.41% and Class I is 1.41%. The expense ratios shown above may differ from the more recent expense ratios reported in the Financial Highlights section of this report.
| † | Average annual total return measures net investment income and capital gain or loss from portfolio investments as an annualized average assuming reinvestment of dividends and capital gains distributions. Performance shown reflects the effects of an expense reimbursement that improved results and was in effect until October 31, 2009. Load-adjusted returns are adjusted for the maximum front-end sales load of 4.75% for Class A shares and returns for Class C shares have been adjusted for the contingent deferred sales charge (CDSC). |
NOTES:
The graph does not reflect the income taxes that you would pay on fund distributions or the redemption of fund shares. Fund performance includes reinvestment of dividends and adjustment for the maximum sales charge for Class A shares. The performance of other classes will vary from the performance of the class shown based on the difference in sales charges and fees paid by shareholders investing in different share classes.
The MSCI Emerging Markets Index is a free float-adjusted market capitalization index considered broadly representative of emerging market equity performance. The index represents companies within the constituent emerging markets that are available to investors worldwide. Index data shown for the Since Inception Growth of $10,000 graph is from 8/31/08, since comparative index data is only available for full monthly periods. Source: Lipper, Inc.
Index returns assume reinvestment of dividends and do not reflect deduction of fees and expenses. It is not possible to invest directly in an index.
| | | | |
| 46 | | CALAMOS OPEN-END FAMILY OF FUNDS ANNUAL REPORT | | |
Calamos Emerging Market Equity Fund
CALAMOS EMERGING MARKET
EQUITY FUND
INVESTMENT TEAM DISCUSSION
How has the Fund performed?
For the 12-month period ended October 31, 2018, Calamos Emerging Market Equity Fund returned -19.14% (Class A shares at net asset value) versus the -12.19% return for the MSCI Emerging Markets Index.
The negative return reflects the challenging backdrop for emerging market assets and two distinct market environments over the 12-month period. Emerging market stocks initially advanced through early 2018 thanks to strong fundamentals, but declined significantly over the final six months of the period due to escalating global trade disputes, slowing economic growth, tightening financial conditions and a stronger U.S. dollar. The Fund underperformed the index as many of our holdings in companies with strong growth and higher-quality characteristics lost ground despite their leading fundamentals.
What factors influenced performance during the reporting period?
The Fund underperformed the benchmark as many of our holdings in companies with higher-growth, higher-quality characteristics were out of favor as value-oriented names exerted leadership in the emerging market index. Specifically over the period, the MSCI EM Value Index returned -7.83% versus the -16.53% decline in the MSCI EM Growth Index, reflecting an 8% spread in favor of value stocks.
From a sector perspective, the Fund’s average overweight stance and security selection in technology detracted the most from performance. Specifically, the Fund’s holdings in internet software & services and semiconductors lagged the index due to concerns about global trade tension, increased regulations in China, and a slowdown in earnings growth. Fund positions in energy also detracted value. Holdings in the integrated oil & gas industry underperformed, as higher-beta, value-oriented parts of the index performed better. The Fund’s selection within health care and industrials added value, as select positions in the life & health insurance and industrial machinery industry performed well due to attractive growth and larger available markets.
The Fund’s select country allocation decisions detracted from performance. In particular, the Fund’s underweight allocation in Russia and trailing security selection in South Korea, Taiwan and Thailand held down return, while the Fund’s selection in Brazil, Indonesia and Mexico finished ahead of the index.
The Fund’s use of derivative instruments, including select equity options, index options, and foreign currency forward hedges, had a minimal, non-material impact on the performance figures for the one-year period
How is the Fund positioned?
Our positioning favors economies benefiting from select domestic demand trends, pro-growth fiscal reforms, and a blend of secular growth and more cyclical opportunities. We favor investments in Emerging Asia, with China and India being two of our larger weights, though we remain selective in the quality growth businesses we own in these markets. We also see investment opportunities in South Korea, Brazil, Taiwan, Mexico and Thailand among other markets.
OVERVIEW
The fund globally invests in growth companies, whose principal activities are in a developing market or are economically tied to a developing market country that we believe offers the best opportunities for growth.
KEY FEATURES
| | ◾ | | Stresses company fundamentals, including global presence, strong revenue and earnings growth, solid returns on invested capital, and lower debt-to-capital levels | |
| | ◾ | | Actively seeks growth opportunities by investing in equities with at least 80% emerging-market exposure | |
| | ◾ | | Draws upon decades of Calamos experience investing globally through multiple economic, market and credit cycles | |
PORTFOLIO FIT
This actively managed fund complements emerging-market strategies with a less-pronounced growth orientation, such as those that more closely track the broad EM equity market.
| | |
| FUND NASDAQ SYMBOLS |
A Shares | | CEGAX |
C Shares | | CEGCX |
I Shares | | CIEIX |
| | | |
|
| FUND CUSIP NUMBERS |
A Shares | | 128120789 |
C Shares | | 128120771 |
I Shares | | 128120763 |
| | | |
Calamos Emerging Market Equity Fund
| | | | |
| SECTOR WEIGHTINGS | |
Financials | | | 20.6 | % |
Information Technology | | | 18.6 | |
Consumer Discretionary | | | 12.6 | |
Communication Services | | | 12.1 | |
Consumer Staples | | | 6.7 | |
Materials | | | 6.5 | |
Energy | | | 5.2 | |
Other | | | 4.4 | |
Industrials | | | 4.1 | |
Health Care | | | 2.6 | |
Real Estate | | | 2.2 | |
| | | | | |
Sector weightings are subject to change daily and are calculated as a percentage of net assets. The table excludes cash or cash equivalents, any government/sovereign bonds or broad based index hedging securities the Fund may hold.
From a sector perspective, the Fund’s largest absolute allocations are in technology, financials, consumer discretionary and communication services. The Fund has an underweight position in utilities, energy and financials as many of the larger names in the index exhibit lower-quality and higher-leverage characteristics than we prefer in our growth-oriented investment approach.
From a bottom-up perspective, we favor companies with growth catalysts, stronger balance sheets, and high or increasing ROIC, which are supported by positive views on their competitive positioning and capital efficiency. In line with our process, we emphasize companies benefiting from secular themes that provide a tailwind for potential growth.
What are your closing thoughts for Fund shareholders?
Global liquidity conditions tightened materially over the one-year period and we are closely monitoring the multiple headwinds to emerging markets including persistent trade disputes, the impact of more restrictive Fed policy, a strong U.S. dollar, and slower growth in China. Emerging market corporate earnings remain quite positive, even as investor sentiment and positioning reflect a considerable degree of skepticism, and equity valuations are attractive relative to history.
In our view, many companies with quality fundamentals and sustainable growth have been excessively punished during this broad sell-off, and we believe these fundamental attributes may once again prove more meaningful as we see reduced market emphasis on global trade and policy concerns. From a thematic and sector perspective, we see opportunities in information technology, consumer goods and media & entertainment, in addition to higher quality financials and a select group of cyclical companies with improving fundamentals and catalysts. We believe our active investment approach emphasizing higher quality growth companies will position the Fund to take advantage of the investment opportunities that we expect to emerge following the correction in emerging market stocks.
This information is not intended to be a recommendation or investment advice, and does not constitute a solicitation to buy or sell securities. Certain statements in this commentary are forward-looking statements. Discussions of specific investments are for illustration only and are not intended as recommendations of individual investments. The forward looking statements and other views expressed herein are those of the portfolio managers as of the date of this report. Actual future results or occurrence may differ significantly from those anticipated in any forward-looking statements and the views expressed herein are subject to change at any time, due to numerous market and other factors. The Fund disclaims any obligation to update publicly or review any forward-looking statements or views expressed herein.
| | | | |
| 48 | | CALAMOS OPEN-END FAMILY OF FUNDS ANNUAL REPORT | | |
Calamos Emerging Market Equity Fund
GROWTH OF $10,000: SINCE INCEPTION (12/31/13) THROUGH 10/31/18
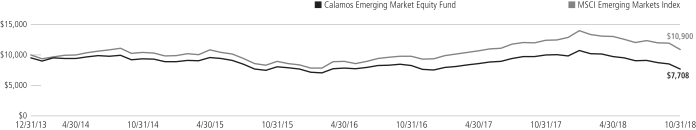
AVERAGE ANNUAL TOTAL RETURN† AS OF 10/31/18
| | | | | | | | | | |
| | | 1
YEAR | | SINCE
INCEPTION |
Class A Shares – Inception 12/31/2013 | | | | | | | | | | |
Without Sales Charge | | | | -19.14 | % | | | | -3.05 | % |
With Sales Charge | | | | -23.00 | | | | | -4.02 | |
Class C Shares – Inception 12/31/2013 | | | | | | | | | | |
Without Sales Charge | | | | -19.79 | | | | | -3.76 | |
With Sales Charge | | | | -20.59 | | | | | -3.76 | |
Class I Shares – Inception 12/31/2013 | | | | -18.96 | | | | | -2.80 | |
Performance data quoted represents past performance, which is no guarantee of future results. Current performance may be lower or higher than the performance quoted. The principal value and investment return of an investment will fluctuate so that your shares, when redeemed, may be worth more or less than their original cost.
As of the prospectus dated 3/1/18, the Fund’s gross expense ratio for Class A shares is 2.70%; Class C shares is 3.45% and Class I shares is 2.45%. The Fund’s Investment Adviser has contractually agreed to reimburse the Fund expenses through 3/1/22, to the extent necessary so that Total annual Fund Operating Expenses (excluding taxes, interest, short interest, short dividend expenses, brokerage commissions, acquired funds fees and expenses and extraordinary expenses, if any) of Class A, Class C and Class I shares are limited to 1.75%, 2.50%, and 1.50% of average net assets, respectively. Calamos Advisors may recapture previously waived expense amounts within the same fiscal year for any day where the respective Fund’s expense ratio falls below the contractual expense limit up to the expense limit for that day. This undertaking is binding on CALAMOS ADVISORS and any of its successors and assigns. This agreement is not terminable by either party. The expense ratios shown above may differ from the more recent expense ratios reported in the Financial Highlights section of this report.
| † | Average annual total return measures net investment income and capital gain or loss from portfolio investments as an annualized average assuming reinvestment of dividends and capital gains distributions. Performance shown reflects the effects of an expense reimbursement that improved results. Load-adjusted returns are adjusted for the maximum front-end sales load of 4.75% for Class A shares and returns for Class C shares have been adjusted for the contingent deferred sales charge (CDSC). |
NOTES:
The graph does not reflect the income taxes that you would pay on fund distributions or the redemption of fund shares. Fund performance includes reinvestment of dividends and adjustment for the maximum sales charge for Class A shares. The performance of other classes will vary from the performance of the class shown based on the difference in sales charges and fees paid by shareholders investing in different share classes.
The MSCI Emerging Markets Index is a free float-adjusted market capitalization index considered broadly representative of emerging market equity performance. The index represents companies within the constituent emerging markets that are available to investors worldwide. Index data shown for the Since Inception Growth of $10,000 graph is from 12/31/13, since comparative index data is only available for full monthly periods. Source: Lipper, Inc.
Index returns assume reinvestment of dividends and do not reflect deduction of fees and expenses. It is not possible to invest directly in an index.
Calamos Global Equity Fund
OVERVIEW
The fund invests in equities of companies around the globe. We focus on those firms that we believe demonstrate key growth characteristics, including increasing profit margins and high returns on invested capital.
KEY FEATURES
| | ◾ | | Flexibly seeks growth globally, searching for the best risk/reward opportunities across countries, market capitalizations and sectors | |
| | ◾ | | Seeks global growth companies that may benefit from long-term secular themes, including a burgeoning global middle class and increasing demand for information and entertainment | |
PORTFOLIO FIT
The fund can serve as a growth-oriented addition to a strategic global equity allocation and may complement or provide an alternative to value or blended styles.
| | |
| FUND NASDAQ SYMBOLS |
A Shares | | CAGEX |
C Shares | | CCGEX |
I Shares | | CIGEX |
| |
|
| FUND CUSIP NUMBERS |
A Shares | | 128119484 |
C Shares | | 128119468 |
I Shares | | 128119450 |
| |
CALAMOS GLOBAL EQUITY FUND
INVESTMENT TEAM DISCUSSION
How has the Fund performed?
For the 12-month period ended October 31, 2018, Calamos Global Equity Fund returned -4.59% (Class A shares at net asset value) versus a 1.71% increase for the MSCI World Index, the Fund’s benchmark, and 1.45% return for the MSCI ACWI Growth Index.
Global markets navigated multiple cross-currents that increasingly challenged stock returns as the period progressed. Global equities finished 2017 with strong gains for the year, amid synchronized global growth and low market volatility by historic standards. As we progressed into 2018, however, stocks experienced higher volatility and declined these past six months, in particular, because of more divergent economic growth and monetary policy, escalating trade disputes and ongoing geopolitical uncertainty.
For the 12-month period, the Fund underperformed as several of its holdings in companies with growth and quality characteristics trailed the benchmark despite their leading fundamental profiles.
Since its inception on March 1, 2007, the Fund has returned 6.80% on an annualized basis (Class A shares at net asset value) compared to 5.46% for the MSCI World Index and a 6.37% gain for the MSCI ACWI Growth Index. We believe this demonstrates the Fund’s ability to generate long-term excess returns over complete market cycles and varied investment environments.
What factors influenced performance over the period?
The Fund underperformed the benchmark, as key holdings in companies with higher growth and higher return on invested capital characteristics trailed the index. Global markets rewarded companies with relatively more defensive or value-oriented fundamentals, including lower price-to-earnings ratios.
From a sector perspective, the Fund’s security selection in technology and industrials detracted from performance as investors expressed concern about slowing global growth and trade tensions. Certain Fund holdings in internet software & services and construction machinery underperformed as a result.
The Fund’s selection within real estate and consumer discretionary added to performance, as our positions in real estate operating companies and apparel performed well thanks to security-specific factors, including better growth and quality assets.
From a geographic perspective, the Fund’s relative underweight stance in the U.S. and overweight positions in emerging markets (China in particular), detracted the most from return in the period. On the other hand, the Fund’s holdings in Canada and Sweden generated strong relative returns and added value to performance.
How is the Fund positioned?
The Fund’s regional and country positioning reflects the combined inputs of our top-down global framework and our bottom-up security analysis. Our investment team evaluates macroeconomic factors and growth opportunities and actively integrates these into the investment decision-making process.
| | | | |
| 50 | | CALAMOS OPEN-END FAMILY OF FUNDS ANNUAL REPORT | | |
Calamos Global Equity Fund
We are emphasizing investments in companies with solid growth in earnings, ample cash flow and quality balance sheets. We have positioned the Fund with an emphasis in information technology, consumer discretionary, financials and health care. We view the valuations of global companies as reasonable by historic standards and we have positioned the Fund in a combination of core and secular growth companies in addition to more cyclical opportunities.
The Fund holds a moderate underweight to the U.S., reflecting our view of tightening liquidity, relatively high valuations, and more challenging margin and earnings comparisons ahead. We favor companies with secular growth tailwinds and a select number of more cyclical opportunities, in addition to companies with more stable and defensive growth characteristics.
The Fund’s weight in Europe is slightly above the index, though we emphasize a blend of market capitalizations, industries and revenue exposures. The region offers attractive valuations and supportive liquidity, though we are also mindful of softer economic data and multiple political risks.
In Japan, we see continued opportunities born out of the economy’s progress toward higher growth and inflation, accommodative policy, reasonable valuations and the potential for margin expansion. We continue to be selective in emerging markets holdings, favoring companies exhibiting higher growth and quality fundamentals in key demand areas such as software & services, internet retail and insurance.
What closing thoughts do you have for Fund shareholders?
Global corporate and macroeconomic data has been mixed versus expectations but, on balance, continues to reflect positive global growth. Global monetary policy remains accommodative overall, though multiple central banks are normalizing policy and we have seen a pivot toward fiscal stimulus. We view global equity markets as at a key juncture where important headwinds and tailwinds are colliding and we will be looking to additional data to provide more confirmation of direction from here. Following the recent market sell-off, we see opportunities in global equities, distinguished by their positive earnings growth, fairly benign inflation and attractive valuations. In terms of portfolio positioning, we favor a blend of investments in secular growth and more defensive growth businesses, in addition to a set of more cyclical companies. This positioning reflects our anticipation of moderate growth conditions but also the potential for economic re-acceleration in the coming quarters. We see significant opportunities in companies with earnings growth catalysts, solid cash flow generation and healthy balance sheets. From a thematic and sector perspective, we see opportunities in the information technology sector, consumer and health care companies with targeted areas of demand, and a set of more cyclical companies with sound fundamentals and multiple catalysts. We believe our active investment approach and long-term perspective positions the Fund to take advantage of the volatility and opportunities in global equities.
This information is not intended to be a recommendation or investment advice, and does not constitute a solicitation to buy or sell securities. Certain statements in this commentary are forward-looking statements. Discussions of specific investments are for illustration only and are not intended as recommendations of individual investments. The forward looking statements and other views expressed herein are those of the portfolio managers as of the date of this report. Actual future results or occurrence may differ significantly from those anticipated in any forward-looking statements and the views expressed herein are subject to change at any time, due to numerous market and other factors. The Fund disclaims any obligation to update publicly or review any forward-looking statements or views expressed herein.
| | | | |
| SECTOR WEIGHTINGS | |
Information Technology | | | 19.5 | % |
Consumer Discretionary | | | 14.0 | |
Financials | | | 13.4 | |
Health Care | | | 12.8 | |
Communication Services | | | 11.7 | |
Consumer Staples | | | 8.7 | |
Industrials | | | 8.7 | |
Energy | | | 4.9 | |
Real Estate | | | 1.4 | |
Materials | | | 0.8 | |
Other | | | 0.2 | |
| | | | | |
Sector weightings are subject to change daily and are calculated as a percentage of net assets. The table excludes cash or cash equivalents, any government/sovereign bonds or broad based index hedging securities the Fund may hold.
Calamos Global Equity Fund
ANNUALIZED RETURN: SINCE INCEPTION (3/1/07) THROUGH 10/31/18
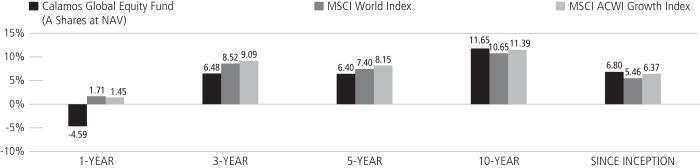
Performance data quoted represents past performance, which is no guarantee of future results. Current performance may be lower or higher than the performance quoted.
The principal value and investment return of an investment will fluctuate so that your shares, when redeemed, may be worth more or less than their original cost. You can obtain performance data current to the most recent month end by visiting www.calamos.com. Average annual total return measures net investment income and capital gain or loss from portfolio investments as an annualized average. All performance shown assumes reinvestment of dividends and capital gains distributions. Performance is for the Fund’s Class A shares at net asset value and does not include the Fund’s maximum front-end sales charge of 4.75%. Had it been included, the Fund’s return would have been lower. The Fund also offers Class C and Class I shares, the performance of which may vary. Source: State Street Corporation and Lipper, Inc.
| | | | |
| 52 | | CALAMOS OPEN-END FAMILY OF FUNDS ANNUAL REPORT | | |
Calamos Global Equity Fund
GROWTH OF $10,000: FOR THE 10-YEAR PERIOD ENDED 10/31/18
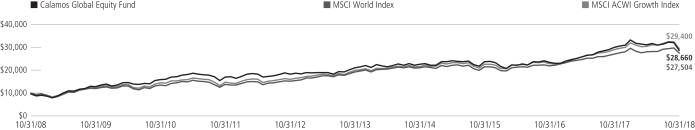
AVERAGE ANNUAL TOTAL RETURN† AS OF 10/31/18
| | | | | | | | | | | | | | | |
| | | 1
YEAR | | 5
YEARS | | 10
YEARS |
Class A Shares – Inception 3/1/07 | | | | | | | | | | | | | | | |
Without Sales Charge | | | | -4.59 | % | | | | 6.40 | % | | | | 11.65 | % |
With Sales Charge | | | | -9.12 | | | | | 5.37 | | | | | 11.10 | |
Class C Shares – Inception 3/1/07 | | | | | | | | | | | | | | | |
Without Sales Charge | | | | -5.31 | | | | | 5.61 | | | | | 10.82 | |
With Sales Charge | | | | -6.17 | | | | | 5.61 | | | | | 10.82 | |
Class I Shares – Inception 3/1/07 | | | | -4.38 | | | | | 6.66 | | | | | 11.93 | |
Performance data quoted represents past performance, which is no guarantee of future results. Current performance may be lower or higher than the performance quoted. The principal value and investment return of an investment will fluctuate so that your shares, when redeemed, may be worth more or less than their original cost.
As of the prospectus dated 3/1/18, the Fund’s gross expense ratio for Class A shares is 1.53%; Class C is 2.27% and Class I is 1.28%. The Fund’s Investment Adviser has contractually agreed to reimburse the Fund expenses through 3/1/22 to the extent necessary so that Total Annual Fund Operating Expenses (excluding taxes, interest, short interest, short dividend expenses, brokerage commissions, acquired fund fees and expenses, and extraordinary expenses, if any) of Class A, Class C, and Class I are limited to 1.40%, 2.15% and 1.15% of average net assets, respectively. Calamos Advisors may recapture previously waived expense amounts within the same fiscal year for any day where the respective Fund’s expense ratio falls below the contractual expense limit up to the expense limit for that day. This undertaking is binding on CALAMOS ADVISORS and any of its successors and assigns. This agreement is not terminable by either party. The expense ratios shown above may differ from the more recent expense ratios reported in the Financial Highlights section of this report.
| † | Average annual total return measures net investment income and capital gain or loss from portfolio investments as an annualized average assuming reinvestment of dividends and capital gains distributions. Performance shown reflects the effects of an expense reimbursement that improved results. Load-adjusted returns are adjusted for the maximum front-end sales load of 4.75% for Class A shares and returns for Class C shares have been adjusted for the contingent deferred sales charge (CDSC). |
NOTES:
The graph does not reflect the income taxes that you would pay on fund distributions or the redemption of fund shares. Fund performance includes reinvestment of dividends and adjustment for the maximum sales charge for Class A shares. The performance of other classes will vary from the performance of the class shown based on the difference in sales charges and fees paid by shareholders investing in different share classes.
The MSCI World Index (U.S. Dollars) is a market-capitalization weighted index composed of companies representative of the market structure of developed market countries in North America, Europe and the Asia/Pacific region. Since inception data for the index is shown from 2/28/07 since data is only available for full monthly periods. Source: Lipper, Inc.
The MSCI ACWI Growth Index is designed to measure the equity performance of companies with higher growth values in developed and emerging markets.
Index returns assume reinvestment of dividends and do not reflect deduction of fees and expenses. It is not possible to invest directly in an index.
The Fund’s use of derivative instruments involves investment risks and transaction costs to which the Fund would not be subject absent the use of these instruments and, accordingly, may result in losses greater than if they had not been used. Derivative instruments can be illiquid, may disproportionately increase losses and may have a potentially large impact on Fund performance.
Calamos Global Growth and Income Fund
OVERVIEW
The fund invests primarily in global equity and convertible securities in an attempt to balance risk/reward while providing growth and income.
KEY FEATURES
| | ◾ | | Combines equity and convertible holdings in order to limit downside risk while potentially capturing upside equity participation | |
| | ◾ | | Provides a core holding option that seeks to maintain a consistent risk posture throughout the market cycle | |
| | ◾ | | Seeks to participate in the upside movements of the global equity market while lessening the impact of down periods | |
PORTFOLIO FIT
The fund can provide a long-term, global-equity core allocation with the potential for lower volatility over a full market cycle.
| | |
| FUND NASDAQ SYMBOLS |
A Shares | | CVLOX |
C Shares | | CVLCX |
I Shares | | CGCIX |
| |
|
| FUND CUSIP NUMBERS |
A Shares | | 128119500 |
C Shares | | 128119708 |
I Shares | | 128119609 |
| |
CALAMOS GLOBAL GROWTH AND INCOME FUND
INVESTMENT TEAM DISCUSSION
How has the Fund performed?
For the 12-month period ended October 31, 2018, Calamos Global Growth and Income Fund returned -2.91% (Class A shares at net asset value), versus a 0.00% return for the MSCI ACWI Index (the “Index”), the Fund’s benchmark, and 1.71% for the MSCI World Index.
Global markets navigated multiple cross-currents that increasingly challenged equity returns as the period progressed. Global equities finished 2017 with strong gains for the year, amid synchronized global growth and low market volatility by historic standards. As we progressed into 2018, however, stocks experienced higher volatility and declined over the past six months, in particular, because of more divergent economic growth and monetary policy, escalating trade disputes and ongoing geopolitical uncertainty.
The Fund experienced lower volatility versus the Index, but underperformed the benchmark return. We position the Fund to capture a majority of equity market upside over complete market cycles, while paying keen attention to mitigating downside risk. For the one-year period, the Fund’s return was below the median level in its category, specifically in the 59th percentile of the Morningstar World Allocation category.* The Fund finished below its category average despite the benefit of our risk-managed global equity approach, which was instrumental in dampening equity volatility during multiple stock market sell-offs over the period.
Since its inception on September 9, 1996, the Fund has returned 7.54% on an annualized basis (Class A shares at net asset value) compared to a 6.78% return for the MSCI ACWI Index and 6.92% gain in the MSCI World Index. We believe this demonstrates the Fund’s ability to generate attractive long-term returns while pursuing an active, risk-managed investment approach over complete market cycles.
What factors influenced performance during the reporting period?
From a sector perspective, the Fund’s security selection in industrials and consumer discretionary detracted from performance, as investors expressed concern about ratcheting trade disputes and slowing global growth conditions. The Fund’s holdings in industrial machinery, autos and internet retail reflected these fundamental concerns and underperformed the benchmark as a result.
The Fund’s underweight position and security selection within financials and utilities supported Fund performance. Fund positions in higher-quality, diversified banks benefited from improved fundamentals, positive earnings growth and fewer regulatory obstacles, while the Fund’s modest weight in electric utilities also outperformed the benchmark and added value for the period.
From a geographic perspective, the Fund’s top-down positioning hampered results over the 12-month period. In terms of country positioning, the Fund’s security selection in Japan and Germany detracted value, in addition to the overweight position in China. The Fund’s individual positions in Canada, Australia and South Korea, with their grounding in sound growth fundamentals and exposure to key secular demand themes, delivered the most value to relative returns in the period.
| * | Data is as of 10/31/18. Morningstar category percentile ranking is based on annualized total return for the 5-year and 10-year periods. Calamos Global Growth & Income Fund Class A Shares were in the 59th, 48th, 26th, and 26th percentiles of 455, 393, 330 and 168 funds for the 1-year, 3-year, 5-year and 10-year periods, respectively, for the Morningstar World Allocation category. |
| | | | |
| 54 | | CALAMOS OPEN-END FAMILY OF FUNDS ANNUAL REPORT | | |
Calamos Global Growth and Income Fund
How is the Fund positioned?
The Fund’s regional and country positioning reflects the combined inputs of our top-down global framework and bottom-up security analysis. Our investment team continually evaluates macroeconomic factors and growth opportunities and actively integrates these into investment decision making.
We have a moderate underweight position in the U.S. based on our view of tightening liquidity, relative valuation and potentially more challenging margin and earnings comparisons ahead. We favor companies with secular growth tailwinds along with more cyclical opportunities, in addition to select companies with more stable and defensive growth characteristics.
The Fund’s weight in Europe is relatively in line with the index, though we emphasize a blend of diverse market capitalizations, industries, and revenue exposures. The region offers attractive valuations and supportive liquidity, though we are also mindful of softer economic data and multiple political risks.
We are underweight to Japan but see continued opportunities born from the economy’s progress toward higher growth and inflation, accommodative policy, reasonable valuations and the potential for margin expansion. We continue to be selective in emerging markets holdings, favoring companies exhibiting higher growth and quality fundamentals in key demand areas such as software & services, internet retail, and insurance.
From a sector perspective, we have positioned the Fund with an emphasis on opportunities in information technology, financials, health care, communication services and consumer staples, among other areas, while we have an underweight stance in industrials and lower quality foreign financials.
What closing thoughts do you have for Fund shareholders?
Global corporate and macroeconomic data has been mixed versus expectations but, on balance, reflects continued global growth. Global monetary policy remains accommodative overall, though multiple central banks are normalizing policy and we have seen a pivot toward fiscal stimulus. We view global equity markets at a key juncture, with a set of important headwinds and tailwinds colliding, and we will be looking to additional data to provide more confirmation of direction. Following the recent sell-offs across global markets, we see opportunities in global equities spurred on by positive earnings growth, fairly benign inflation and attractive valuations, in particular.
In terms of portfolio positioning, we favor a blend of investments in secular growth and more defensive growth businesses, in addition to a set of more cyclical companies. This positioning reflects our anticipation of moderate macroeconomic conditions but also the potential for economic re-acceleration in the coming quarters. We see particular opportunities in companies with earnings growth catalysts, solid cash flow generation and quality balance sheets. From a thematic and sector perspective, we favor a number of investments in the information technology, consumer and health care sectors with targeted areas of demand, and a set of more cyclical companies with potential catalysts. Our active, risk-managed investment approach and long-term perspective positions us to take advantage of the volatility and opportunities in global equities and convertible securities.
This information is not intended to be a recommendation or investment advice, and does not constitute a solicitation to buy or sell securities. Certain statements in this commentary are forward-looking statements. Discussions of specific investments are for illustration only and are not intended as recommendations of individual investments. The forward looking statements and other views expressed herein are those of the portfolio managers as of the date of this report. Actual future results or occurrence may differ significantly from those anticipated in any forward-looking statements and the views expressed herein are subject to change at any time, due to numerous market and other factors. The Fund disclaims any obligation to update publicly or review any forward-looking statements or views expressed herein.
| | | | |
| SECTOR WEIGHTINGS | |
Information Technology | | | 17.3 | % |
Financials | | | 17.1 | |
Communication Services | | | 11.6 | |
Health Care | | | 9.5 | |
Energy | | | 9.1 | |
Consumer Staples | | | 8.7 | |
Industrials | | | 5.3 | |
Consumer Discretionary | | | 4.4 | |
Materials | | | 2.5 | |
Utilities | | | 2.5 | |
Real Estate | | | 1.2 | |
Other | | | 0.5 | |
Sector weightings are subject to change daily and are calculated as a percentage of net assets. The table excludes cash or cash equivalents, any government/sovereign bonds or broad based index hedging securities the Fund may hold.
Calamos Global Growth and Income Fund
| | | | |
| 56 | | CALAMOS OPEN-END FAMILY OF FUNDS ANNUAL REPORT | | |
ANNUALIZED RETURN: SINCE INCEPTION (9/9/96) THROUGH 10/31/18
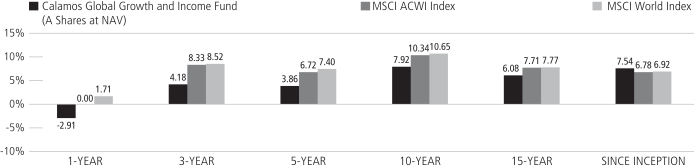
Performance data quoted represents past performance, which is no guarantee of future results. Current performance may be lower or higher than the performance quoted.
The principal value and investment return of an investment will fluctuate so that your shares, when redeemed, may be worth more or less than their original cost. You can obtain performance data current to the most recent month end by visiting www.calamos.com. Average annual total return measures net investment income and capital gain or loss from portfolio investments as an annualized average. All performance shown assumes reinvestment of dividends and capital gains distributions. Performance is for the Fund’s Class A shares at net asset value and does not include the Fund’s maximum front-end sales charge of 4.75%. Had it been included, the Fund’s return would have been lower. The Fund also offers Class C and Class I shares, the performance of which may vary. Source: State Street Corporation and Lipper, Inc.
Calamos Global Growth and Income Fund
GROWTH OF $10,000: FOR THE 10-YEAR PERIOD ENDED 10/31/18
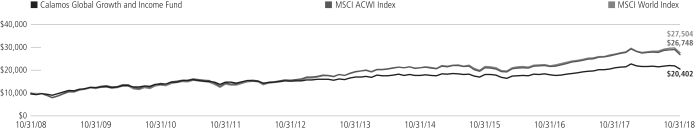
AVERAGE ANNUAL TOTAL RETURN† AS OF 10/31/18
| | | | | | | | | | | | | | | |
| | | 1
YEAR | | 5
YEARS | | 10
YEARS |
Class A Shares – Inception 9/9/96 | | | | | | | | | | | | | | | |
Without Sales Charge | | | | -2.91 | % | | | | 3.86 | % | | | | 7.92 | % |
With Sales Charge | | | | -7.51 | | | | | 2.85 | | | | | 7.39 | |
Class C Shares – Inception 9/24/96 | | | | | | | | | | | | | | | |
Without Sales Charge | | | | -3.61 | | | | | 3.08 | | | | | 7.12 | |
With Sales Charge | | | | -4.52 | | | | | 3.08 | | | | | 7.12 | |
Class I Shares – Inception 9/18/97 | | | | -2.65 | | | | | 4.12 | | | | | 8.20 | |
Performance data quoted represents past performance, which is no guarantee of future results. Current performance may be lower or higher than the performance quoted. The principal value and investment return of an investment will fluctuate so that your shares, when redeemed, may be worth more or less than their original cost.
As of the prospectus dated 3/1/18, the Fund’s gross expense ratio for Class A shares is 1.54%; Class C shares is 2.29% and Class I shares is 1.29%. The expense ratios shown above may differ from the more recent expense ratios reported in the Financial Highlight section of this report.
| † | Average annual total return measures net investment income and capital gain or loss from portfolio investments as an annualized average assuming reinvestment of dividends and capital gains distributions. Load-adjusted returns are adjusted for the maximum front-end sales load of 4.75% for Class A shares and returns for Class C shares have been adjusted for the contingent deferred sales charge (CDSC). |
NOTES:
The graphs do not reflect the income taxes that you would pay on fund distributions or the redemption of fund shares. Fund performance includes reinvestment of dividends and adjustment for the maximum sales charge for Class A shares. The performance of other classes will vary from the performance of the class shown based on the difference in sales charges and fees paid by shareholders investing in different share classes.
The MSCI ACWI Index is a free float-adjusted market capitalization weighted index that is designed to measure the equity market performance of developed and emerging markets.
The MSCI World Index (U.S. Dollars) is a market-capitalization weighted index composed of companies representative of the market structure of developed market countries in North America, Europe and the Asia/Pacific region. Since inception data for the index is shown from 9/30/96 since data is only available for full monthly periods. Source: Lipper, Inc.
Index returns assume reinvestment of dividends and do not reflect deduction of fees and expenses. It is not possible to invest directly in an index.
The Morningstar World Allocation Category comprises funds that seek to provide both capital appreciation and income by investing in three major areas: stocks, bonds and cash. While these portfolios do explore the whole world, most of them focus on the U.S., Canada, Japan and the larger markets in Europe. It is rare for such portfolios to invest more than 10% of their assets in emerging markets. These portfolios typically have at least 10% of assets in bonds, less than 70% of assets in stocks, and at least 40% of assets in non-U.S. stocks or bonds.
The Fund’s use of derivative instruments involves investment risks and transaction costs to which the Fund would not be subject absent the use of these instruments and, accordingly, may result in losses greater than if they had not been used. Derivative instruments can be illiquid, may disproportionately increase losses and may have a potentially large impact on Fund performance.
Calamos Total Return Bond Fund
OVERVIEW
The Fund invests primarily in a diversified portfolio of investment-grade debt securities that generally have a dollar-weighted average portfolio duration between three to ten years.
KEY FEATURES
Dynamically allocates across the broad sectors of the U.S. investment-grade bond market, including corporate debt, U.S. Treasury bonds and agencies, mortgage-backed securities, and asset-backed securities.
| | ◾ | | Opportunistic sector allocations provide greater flexibility in managing risk/reward. | |
| | ◾ | | Complementary allocations may include high-yield securities, international bonds and bank loans. | |
| | ◾ | | Managed by an experienced team, following a time-tested, risk-conscious philosophy. | |
PORTFOLIO FIT
The Fund may be suitable for investors as the cornerstone for a fixed-income allocation, with investments diversified across the major sectors of the U.S. bond market. Complementary allocations to specialized fixed-income strategies seek to enhance return potential and better manage risk.
| | |
| FUND NASDAQ SYMBOLS |
A Shares | | CTRAX |
C Shares | | CTRCX |
I Shares | | CTRIX |
| |
|
| FUND CUSIP NUMBERS |
A Shares | | 128119310 |
C Shares | | 128119286 |
I Shares | | 128119278 |
| |
CALAMOS TOTAL RETURN BOND FUND
INVESTMENT TEAM DISCUSSION
How has the Fund performed?
For the 12-month period ending October 31, 2018, Calamos Total Return Bond Fund returned -2.30% (Class A shares at net asset value), performing in line with the -2.05% return of the Bloomberg Barclays U.S. Aggregate Bond Index.
Since its inception on June 27, 2007, the Fund gained 3.69% on an annualized basis (Class A shares at net asset value) versus a 3.85% return for the Bloomberg Barclays U.S. Aggregate Bond Index.
What factors influenced performance?
During the last 12 months, yields on U.S. Treasuries moved markedly higher as the Federal Reserve Bank continued to raise its benchmark overnight rate. The increase in interest rates was the primary driver of declining performance for the Fund and across the investment-grade bond market. With two-year Treasury yields moving from 1.60% to 2.87%, and 10-year yields increasing from 2.38% to 3.14%, the yield curve flattened from a spread of 78 basis points to 27 basis points, after trading as low as 19 basis points intra-period. In expectation of higher interest rates, the Fund was positioned with a duration shorter than the Bloomberg Barclays U.S. Aggregate Bond Index throughout the annual period, which contributed to performance.
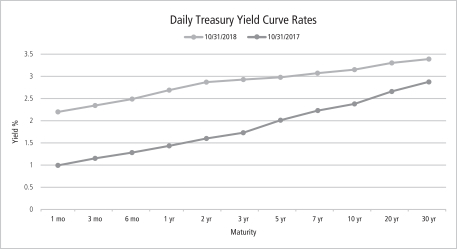
Source: U.S. Department of Treasury
With a -3.02% return, corporate bonds were the worst-performing sector within the index. The Fund held an overweight in corporate debt over the last year, but the Fund’s duration within the sector was shorter than the corporate component of the benchmark. As such, the corporate allocation of the Fund was beneficial in part due to security selection within specific industries, most notably consumer cyclical and non-cyclical. Conversely, both the underweight allocation to Treasuries and our longer duration within that sector detracted from Fund performance. We continue to favor an overweight to corporate bonds held primarily in shorter-than-benchmark duration issues as a means of delivering more income while mitigating the impact of credit-spread volatility.
| | | | |
| 58 | | CALAMOS OPEN-END FAMILY OF FUNDS ANNUAL REPORT | | |
Calamos Total Return Bond Fund
Within the investment grade universe, AAA rated bonds outperformed the overall benchmark, and the Fund’s underweight to AAA rated securities was a detractor. The Fund’s allocation to less interest rate sensitive, high yield bonds and bank loans in both the BB and B rated categories had a positive impact on performance.
How is the Fund positioned?
The Fund has a duration* of 5.8 years versus the 6.0 years duration of the Bloomberg Barclays U.S. Aggregate Bond Index.
The Fund continues to hold an overweight toward corporate bonds in both the investment-grade and out-of-benchmark high yield ratings categories. These overweights have resulted in a lower overall credit quality of A compared to the AA quality of the benchmark. Slowing overseas demand for U.S. corporate bonds have generated headwinds, as credit spreads widened across rating categories. While the Fund remains overweight, our overall exposure to corporate bonds was reduced during the period, as the investment team sought out better relative value opportunities in the asset-backed securities market. These positions can provide diversification of risk and attractive yields versus like rated corporate opportunities. The Fund continues to hold an underweight position in residential mortgage-related debt, though over the last 12 months we have increased the allocation based on improving relative value and greater clarity on how the Federal Reserve Bank’s cutback on its mortgage-backed securities purchase program should impact the sector going forward.
Within the corporate bond allocation, the Fund’s largest overweight allocations are found in the electric utilities, technology, and food and beverage industries. The positions in the electric utilities and food and beverage industries reflect our belief in overweighting corporate bonds in less-cyclical businesses, while the technology positioning is based on our view of idiosyncratic value within the industry.
What are your closing thoughts for Fund shareholders?
Expectations for growth continue to be positive, and no signs of imminent recession are in sight. While we believe that overall corporate credit fundamentals are stable, a multi-year trend that has increased the representation of BBB rated issuers in the investment grade corporate universe to nearly 50% has created a situation where downgrades could be a more substantial driver of total return as the credit cycle continues to age. We continue to monitor company reports and economic data for evidence of how escalating tariffs and the strengthening U.S. dollar could exacerbate stress for emerging market economies.
Volatility in both interest rate and credit spread markets has increased in recent months as investors evaluate the potential outcomes of the 2018 midterm elections and trade tariffs. Additionally, the economy is navigating the effects of an active Fed hiking cycle coupled with quantitative tightening. In the current environment, active management and rigorous fundamental analysis is crucial. Investors should be picking spots wisely to appropriately balance risk and reward.
| * | Duration is useful in measuring a bond fund’s sensitivity to changes in interest rates. The longer the duration, the more a bond fund’s price will fluctuate when interest rates change. |
This information is not intended to be a recommendation or investment advice, and does not constitute a solicitation to buy or sell securities. Certain statements in this commentary are forward-looking statements. Discussions of specific investments are for illustration only and are not intended as recommendations of individual investments. The forward looking statements and other views expressed herein are those of the portfolio managers as of the date of this report. Actual future results or occurrence may differ significantly from those anticipated in any forward-looking statements and the views expressed herein are subject to change at any time, due to numerous market and other factors. The Fund disclaims any obligation to update publicly or review any forward-looking statements or views expressed herein.
| | | | |
| ASSET ALLOCATION | |
Corporate Bonds | | | 55.7 | % |
U.S. Government and Agency Securities | | | 26.1 | |
Asset Backed Securities | | | 12.3 | |
Bank Loans | | | 4.4 | |
Residential Mortgage Backed Security | | | 1.3 | |
| | | | | |
Fund asset allocations are calculated as a percentage of net assets and may vary over time. The table excludes cash or cash equivalents.
Calamos Total Return Bond Fund
| | | | |
| 60 | | CALAMOS OPEN-END FAMILY OF FUNDS ANNUAL REPORT | | |
ANNUALIZED RETURN: SINCE INCEPTION (6/27/07) THROUGH 10/31/18
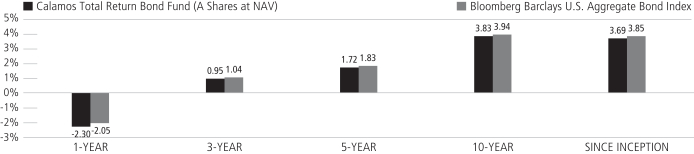
Performance data quoted represents past performance, which is no guarantee of future results. Current performance may be lower or higher than the performance quoted.
The principal value and investment return of an investment will fluctuate so that your shares, when redeemed, may be worth more or less than their original cost. You can obtain performance data current to the most recent month end by visiting www.calamos.com. Average annual total return measures net investment income and capital gain or loss from portfolio investments as an annualized average. All performance shown assumes reinvestment of dividends and capital gains distributions. Performance is for the Fund’s Class A shares at net asset value and does not include the Fund’s maximum front end sales charge of 2.25%. Had it been included, the Fund’s return would have been lower. The Fund also offers Class C and Class I shares, the performance of which may vary. Source: State Street Corporation and Mellon Analytical Solutions, LLC.
Duration is useful in measuring a bond fund’s sensitivity to changes in interest rates. The longer the duration, the more a bond fund’s price will fluctuate when interest rates change.
Calamos Total Return Bond Fund
GROWTH OF $10,000: FOR THE 10-YEAR PERIOD ENDED 10/31/18
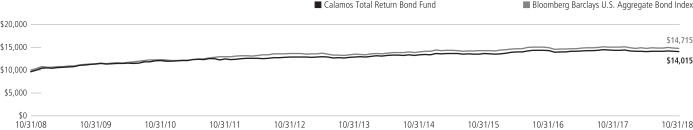
AVERAGE ANNUAL TOTAL RETURN† AS OF 10/31/18
| | | | | | | | | | | | | | | |
| | | 1
YEAR | | 5
YEARS | | 10
YEARS |
Class A Shares – Inception 6/27/07 | | | | | | | | | | | | | | | |
Without Sales Charge | | | | -2.30 | % | | | | 1.72 | % | | | | 3.83 | % |
With Sales Charge | | | | -4.51 | | | | | 0.95 | | | | | 3.43 | |
Class C Shares – Inception 6/27/07 | | | | | | | | | | | | | | | |
Without Sales Charge | | | | -3.03 | | | | | 0.96 | | | | | 3.06 | |
With Sales Charge | | | | -3.97 | | | | | 0.96 | | | | | 3.06 | |
Class I Shares – Inception 6/27/07 | | | | -2.06 | | | | | 1.97 | | | | | 4.09 | |
Performance data quoted represents past performance, which is no guarantee of future results. Current performance may be lower or higher than the performance quoted. The principal value and investment return of an investment will fluctuate so that your shares, when redeemed, may be worth more or less than their original cost.
As of the prospectus dated 3/1/18, the Fund’s gross expense ratio for Class A shares is 1.08%; Class C shares is 1.83% and Class I shares is 0.84%. The Fund’s investment advisor has contractually agreed to reimburse Fund expenses through 3/1/22, to the extent necessary so that Total Annual Fund Operating Expenses (excluding taxes, interest, short interest, short dividend expenses, brokerage commissions, acquired fund fees and expenses, and extraordinary expenses, if any) of Class A, Class C and Class I are limited to 0.90%, 1.65% and 0.65% of average net assets, respectively. Calamos Advisors may recapture previously waived expense amounts within the same fiscal year for any day where the respective Fund’s expense ratio falls below the contractual expense limit up to the expense limit for that day. This undertaking is binding on CALAMOS ADVISORS and any of its successors and assigns. This agreement is not terminable by either party. The expense ratios shown above may differ from the more recent expense ratios reported in the Financial Highlights section of this report.
| † | Average annual total return measures net investment income and capital gain or loss from portfolio investments as an annualized average assuming reinvestment of dividends and capital gains distributions. Performance shown reflects the effects of an expense reimbursement that improved results. Load-adjusted returns are adjusted for the maximum front-end sales load of 2.25% for Class A shares and returns for Class C shares have been adjusted for the contingent deferred sales charge (CDSC). |
NOTES:
The graph does not reflect the income taxes that you would pay on fund distributions or the redemption of fund shares. Fund performance includes reinvestment of dividends and adjustment for the maximum sales charge for Class A shares. The performance of other classes will vary from the performance of the class shown based on the difference in sales charges and fees paid by shareholders investing in different share classes.
The Bloomberg Barclays U.S. Aggregate Bond Index is considered generally representative of the investment-grade bond market. Source: Lipper, Inc.
Index returns assume reinvestment of dividends and do not reflect deduction of fees and expenses. It is not possible to invest directly in an index.
Calamos High Income Opportunities Fund
OVERVIEW
The fund invests primarily in a diversified portfolio of U.S. high yield bonds.
KEY FEATURES
| | ◾ | | Emphasizes total return rather than an exclusive focus on yield; our total-return framework enhances our ability to potentially generate alpha and preserve capital over entire credit cycles | |
| | ◾ | | A disciplined process utilizes proprietary credit research to identify securities most likely to migrate to investment grade, ahead of a rating agency upgrade | |
| | ◾ | | Multi-faceted risk management includes stress testing under various economic assumptions and avoids securities with a high probability of default and low expected recovery from default losses | |
PORTFOLIO FIT
The fund can complement investment-grade credit exposure, providing attractive income and total-return potential for more risk-tolerant investors.
| | |
| FUND NASDAQ SYMBOLS |
A Shares | | CHYDX |
C Shares | | CCHYX |
I Shares | | CIHYX |
| |
|
| FUND CUSIP NUMBERS |
A Shares | | 128119815 |
C Shares | | 128119799 |
I Shares | | 128119781 |
| |
CALAMOS HIGH INCOME OPPORTUNITIES FUND
INVESTMENT TEAM DISCUSSION
How has the Fund performed?
For the 12-month period ended October 31, 2018, Calamos High Income Opportunities Fund returned 0.25% (Class A shares at net asset value) versus a return of 0.98% for the Bloomberg Barclays U.S. High Yield 2% Issuer Capped Index.
Since its inception on August 2, 1999, the Fund gained 5.87% on an annualized basis (Class A share at net asset value) versus a 6.91% return for the Bloomberg Barclays U.S. High Yield 2% Issuer Capped Index.
What factors influenced performance over the period?
Fixed income markets as a whole came under pressure during the annual period, as Treasury yields rose significantly. Two-year Treasury yields increased from 1.60% to 2.87%, while five-year yields moved from 2.02% to 2.98%, each closing the reporting period near the highest levels in over a decade. Paired with the move higher in benchmark interest rates was a slight move toward wider credit spreads in the high yield market, with the option-adjusted spread of the market closing at 3.71%, up from 3.38% a year earlier. Both factors led to negative price returns which were, however, offset by coupon income that helped both the high yield market and the Fund delivered slightly positive returns over the year.
Source: U.S. Department of Treasury
Lower credit quality bonds outperformed, as CCC rated issuers returned 4.07%, while BB rated issuers posted a loss of -0.85%. As a result, our underweight to BB-rated bonds and overweight to CCC rated issuers both buoyed performance, while our security selection within the B rated component of the market offset those gains. Additionally, the out of benchmark allocation to floating-rate bank loans was additive to results.
| | | | |
| 62 | | CALAMOS OPEN-END FAMILY OF FUNDS ANNUAL REPORT | | |
Calamos High Income Opportunities Fund
From an industry perspective, the team’s security selection within the independent energy, supermarkets, and food and beverage industries contributed to return. Conversely, our security selection within the midstream, metals and mining, and chemicals industries detracted from performance.
How is the Fund positioned?
The Fund is currently overweight the pharmaceuticals, midstream, and life insurance industries. The pharmaceutical overweight is a result of idiosyncratic opportunities in three companies. It is an illustration of our investment process, which is grounded in company-level fundamental analysis. The Fund’s largest underweights are in the technology, chemicals, and cable/satellite industries. The Fund’s technology positioning is a function of finding only limited relative value within the industry. The underweight to chemical related companies is a function of increased raw material costs and the corresponding pressure on operating margins. If chemical companies are unable to pass along price increases to customers, we expect the pressure will result in weakened credit metrics.
From a credit-quality perspective, the Fund is positioned with relative underweights in the BB and B rated categories, while currently overweight toward CCC and non-rated issuers. We also have a higher overall duration* (4.0 years) in the portfolio relative to the Bloomberg Barclays U.S.High Yield 2% Issuer Capped Index (3.9 years).
Over the last year, the team has added out-of-benchmark positions in bank loans, which are senior in the capital structure to unsecured high yield debt and have floating rate coupons that benefit from a rising-interest-rate environment. Overall, these positions represent 10% of the portfolio.
What are your closing thoughts for Fund shareholders?
Though the default rate of the high yield market increased to 2.02% from 1.19% a year ago, Calamos expects the default environment to continue to trend below the long-term historical average of 3% until economic activity softens. We do anticipate gradual softening in high yield credit spreads, and we have begun to see signs of weaker underwriting practices in the market. Bond covenants are weakening, providing less protection for creditors, and some issuers are beginning to re-introduce bond structures that are indicative of late-credit-cycle management behavior.
Certainly, the market is experiencing a return of volatility in both interest rate and credit markets. High yield bond spreads are trading below long-run averages, and we see limited opportunity from price appreciation over the next 6 to 12 months. Even so, we continue to view the supply/demand technicals of the market favorably, as net supply year to date is negative (meaning the size of the high yield market is shrinking). In the current environment, it can be tempting to move away from a disciplined investment process. We continue to adhere to our discipline, as active management and rigorous fundamental analysis are crucial. Investors should be picking spots wisely to appropriately balance risk and reward.
| * | Duration is useful in measuring a bond fund’s sensitivity to changes in interest rates. The longer the duration, the more a bond fund’s price will fluctuate when interest rates change. |
This information is not intended to be a recommendation or investment advice, and does not constitute a solicitation to buy or sell securities. Certain statements in this commentary are forward-looking statements. Discussions of specific investments are for illustration only and are not intended as recommendations of individual investments. The forward looking statements and other views expressed herein are those of the portfolio managers as of the date of this report. Actual future results or occurrence may differ significantly from those anticipated in any forward-looking statements and the views expressed herein are subject to change at any time, due to numerous market and other factors. The Fund disclaims any obligation to update publicly or review any forward-looking statements or views expressed herein.
| | | | |
| SECTOR WEIGHTINGS | |
Energy | | | 17.1 | % |
Financials | | | 13.7 | |
Consumer Discretionary | | | 13.4 | |
Health Care | | | 13.4 | |
Communication Services | | | 12.8 | |
Industrials | | | 11.6 | |
Materials | | | 5.8 | |
Consumer Staples | | | 4.2 | |
Information Technology | | | 3.2 | |
Utilities | | | 1.4 | |
Real Estate | | | 1.2 | |
| | | | | |
Sector weightings are subject to change daily and are calculated as a percentage of net assets. The table excludes cash or cash equivalents, any government/sovereign bonds or broad based index hedging securities the Fund may hold.
Calamos High Income Opportunities Fund
| | | | |
| 64 | | CALAMOS OPEN-END FAMILY OF FUNDS ANNUAL REPORT | | |
ANNUALIZED RETURN: SINCE INCEPTION (8/2/99) THROUGH 10/31/18
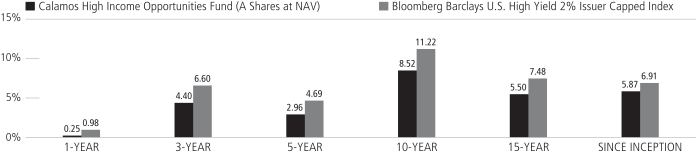
Performance data quoted represents past performance, which is no guarantee of future results. Current performance may be lower or higher than the performance quoted.
The principal value and investment return of an investment will fluctuate so that your shares, when redeemed, may be worth more or less than their original cost. You can obtain performance data current to the most recent month end by visiting www.calamos.com. Average annual total return measures net investment income and capital gain or loss from portfolio investments as an annualized average. All performance shown assumes reinvestment of dividends and capital gains distributions. Performance is for the Fund’s Class A shares at net asset value and does not include the Fund’s maximum front-end sales charge of 2.25%. Had it been included, the Fund’s return would have been lower. The Fund also offers Class C and Class I shares, the performance of which may vary. Source: State Street Corporation and Mellon Analytical Solutions, LLC.
Calamos High Income Opportunities Fund
GROWTH OF $10,000: FOR THE 10-YEAR PERIOD ENDED 10/31/18
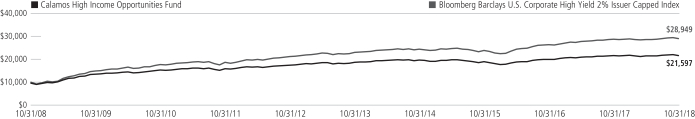
AVERAGE ANNUAL TOTAL RETURN† AS OF 10/31/18
| | | | | | | | | | | | | | | |
| | | 1
YEAR | | 5
YEARS | | 10
YEARS |
Class A Shares – Inception 8/2/99 | | | | | | | | | | | | | | | |
Without Sales Charge | | | | 0.25 | % | | | | 2.96 | % | | | | 8.52 | % |
With Sales Charge | | | | -1.96 | | | | | 1.97 | | | | | 8.00 | |
Class C Shares – Inception 12/21/00 | | | | | | | | | | | | | | | |
Without Sales Charge | | | | -0.42 | | | | | 2.18 | | | | | 7.70 | |
With Sales Charge | | | | -1.36 | | | | | 2.18 | | | | | 7.70 | |
Class I Shares – Inception 3/1/02 | | | | 0.62 | | | | | 3.22 | | | | | 8.78 | |
Performance data quoted represents past performance, which is no guarantee of future results. Current performance may be lower or higher than the performance quoted. The principal value and investment return of an investment will fluctuate so that your shares, when redeemed, may be worth more or less than their original cost.
As of the prospectus dated 3/1/18, the Fund’s gross expense ratio for Class A shares is 1.33%; Class C is 2.08% and Class I is 1.08%. The Fund’s Investment Adviser has contractually agreed to reimburse the Fund expenses through 3/1/22, to the extent necessary so that Total Annual Fund Operating Expenses (excluding taxes, interest, short interest, short dividend expenses, brokerage commissions, acquired fund fees and expenses, and extraordinary expenses, if any) of Class A, Class C, and Class I are limited to 1.00%, 1.75% and 0.75% of average net assets, respectively. Calamos Advisors may recapture previously waived expense amounts within the same fiscal year for any day where the respective Fund’s expense ratio falls below the contractual expenses limit up to the expense limit for that day. This undertaking is binding on CALAMOS ADVISORS and any of its successors and assigns. This agreement is not terminable by either party. The expense ratios shown above may differ from the more recent expense ratios reported in the Financial Highlights section of this report.
| † | Average annual total return measures net investment income and capital gain or loss from portfolio investments as an annualized average assuming reinvestment of dividends and capital gains distributions. Performance shown reflects the effects of an expense reimbursement that improved results. Load-adjusted returns are adjusted for the maximum front-end sales load of 2.25% for Class A shares and returns for Class C shares have been adjusted for the contingent deferred sales charge (CDSC). |
NOTES:
The graphs do not reflect the income taxes that you would pay on fund distributions or the redemption of fund shares. Fund performance includes reinvestment of dividends and adjustment for the maximum sales charge for Class A shares. The performance of other classes will vary from the performance of the class shown based on the difference in sales charges and fees paid by shareholders investing in different share classes.
The Bloomberg Barclays U.S. Corporate High Yield 2% Issuer Capped Index measures the performance of high yield corporate bonds with a maximum allocation of 2% to any one issuer.
Index returns assume reinvestment of dividends and do not reflect deduction of fees and expenses. It is not possible to invest directly in an index.
Calamos Short-Term Bond Fund
OVERVIEW
Through its multi-sector fixed income strategy, the fund invests predominantly in U.S. issuers with the goal of generating a high level of current income consistent with preservation of principal.
KEY FEATURES
| | ◾ | | We construct the portfolio bond-by-bond with a focus on being well compensated for risks taken. | |
| | ◾ | | A broader investable universe including high yield bonds, bank loans and preferreds. | |
| | ◾ | | Fixed income investment process unites quantitative and qualitative analyses into historical and forward-looking models. | |
| | ◾ | | Employs a macro overlay across industries and sectors; considers the business cycle, geopolitical factors, inflation and real rate expectations. | |
PORTFOLIO FIT
The Fund may be suitable for investors seeking current income accompanied by lower volatility over a one-year to two-year time horizon.
| | |
| FUND NASDAQ SYMBOLS |
A Shares | | CSTBX |
I Shares | | CSTIX |
|
| FUND CUSIP NUMBERS |
A Shares | | 128120441 |
I Shares | | 128120433 |
CALAMOS SHORT-TERM BOND FUND
INVESTMENT TEAM DISCUSSION
What is your rationale behind launching the Calamos Short-Term Bond Fund?
The Calamos Short-Term Bond Fund seeks to provide high current income consistent with the preservation of principal. The Fund may be suitable for investors seeking current income accompanied by lower volatility over a one-year to two-year time horizon.
What is the investment approach?
The Fund typically invests at least 80% of its assets in a broad range of investment-grade debt securities that have a dollar-weighted average portfolio maturity of three years or less. The debt securities in which the Fund may invest include, among others, obligations of U.S., state and local governments, their agencies and instrumentalities; mortgage- and asset-backed securities; corporate debt securities, repurchase agreements, convertible securities, money market instruments, and other securities believed to have debt-like characteristics. The Fund may also invest up to 20% of its net assets in below-investment-grade securities (sometimes referred to as high yield or “junk” bonds) and up to 20% in non-U.S. debt securities and emerging markets.
How has the Fund performed?
Since its inception on September 19, 2018, the Fund returned 0.12% (Class A shares at net asset value) performing in line with the 0.34% return of the Bloomberg Barclays 1-3 Year Government/Credit Index and 0.15% return of the the Bloomberg Barclays U.S. 1-3 Year Credit Index.
What factors influenced performance?
During the since inception period, yields on U.S. Treasuries moved higher. The increase in interest rates, which caused the price of bonds to decrease, partially offset the income generated by the Fund’s holdings. One-year Treasury yields moved from 2.56% to 2.66%, and two-year yields increased from 2.79% to 2.87%. Positioned with a shorter duration than the Bloomberg Barclays 1-3 Year Government/Credit Index, the move to higher rates contributed to the Fund’s relative performance. Corporate bond spreads in the one-year to three-year segment of the market moved wider from 50 basis points to 59 basis points at the close of the period, which put pressure on short corporate bond prices. As such, the Fund’s overweight allocation to industrial-related corporate bonds detracted from performance.
How is the Fund positioned?
The Fund has a duration of 1.6 years versus the 1.9 years duration of the Bloomberg Barclays 1-3 Year Government/Credit Index.
The Fund continues to hold an overweight in corporate bonds in both the investment-grade and out-of-benchmark high yield ratings categories. These overweights led to a lower overall credit quality of A when compared to the AA+ quality of the benchmark. The Fund is positioned with overweights across a number of corporate sectors, the largest being consumer non-cyclicals and REITs. The Fund is also overweight to the asset-backed securities sector. The Fund holds an underweight position in U.S. Treasuries.
| | | | |
| 66 | | CALAMOS OPEN-END FAMILY OF FUNDS ANNUAL REPORT | | |
Calamos Short-Term Bond Fund
What are your closing thoughts for Fund shareholders?
The economy and fixed income markets are navigating the impact of an active Fed hiking cycle coupled with quantitative tightening. This has led to a substantial flattening of the yield curve where compensation for extending the duration of fixed income portfolios is at its lowest point in over a decade. Despite this narrowing, expectations for growth continue to be positive, and no signs of imminent recession are in sight. While we believe that overall corporate credit fundamentals are stable, a multi-year trend that has increased the representation of BBB rated issuers in the investment-grade corporate universe to nearly 50% has created a situation where downgrades could be a more substantial driver of total return as the credit cycle continues to age. We continue to monitor company reports and economic data for evidence of impact from the escalations in tariffs and the strength of the U.S. dollar which is creating stress for emerging market economies. In the current environment, active management and rigorous fundamental analysis are crucial. Investors should be picking spots wisely to appropriately balance risk and reward.
This information is not intended to be a recommendation or investment advice, and does not constitute a solicitation to buy or sell securities. Certain statements in this commentary are forward-looking statements. Discussions of specific investments are for illustration only and are not intended as recommendations of individual investments. The forward looking statements and other views expressed herein are those of the portfolio managers as of the date of this report. Actual future results or occurrence may differ significantly from those anticipated in any forward-looking statements and the views expressed herein are subject to change at any time, due to numerous market and other factors. The Fund disclaims any obligation to update publicly or review any forward-looking statements or views expressed herein.
| | | | |
| ASSET ALLOCATION | |
Corporate Bonds | | | 79.0 | % |
Asset Backed Securities | | | 12.0 | |
Bank Loans | | | 3.3 | |
Residential Mortgage Backed Securities | | | 2.1 | |
Municipal Obligations | | | 1.3 | |
| | | | | |
Fund asset allocations are calculated as a percentage of net assets and may vary over time. The table excludes cash or cash equivalents.
Calamos Short-Term Bond Fund
AVERAGE ANNUAL TOTAL RETURN† AS OF 10/31/18
| | | | | |
| | | SINCE
INCEPTION |
Class A Shares – Inception 9/19/18 | | | | | |
Without Sales Charge | | | | 0.12 | % |
With Sales Charge | | | | -2.13 | |
Class I Shares – Inception 9/19/18 | | | | 0.16 | |
Performance data quoted represents past performance, which is no guarantee of future results. Current performance may be lower or higher than the performance quoted. The principal value and investment return of an investment will fluctuate so that your shares, when redeemed, may be worth more or less than their original cost.
As of the prospectus dated 8/29/18, the Fund’s gross expense ratio for Class A shares is 0.95% and Class I is 0.70%. The Fund’s investment advisor has contractually agreed to reimburse Fund expenses through 3/1/22 to the extent necessary so that Total Annual Fund Operating Expenses (excluding taxes, interest, short interest, short dividend expenses, brokerage commissions, acquired fund fees and expenses, and extraordinary expenses, if any) of Class A and Class I are limited to 0.65% and 0.40% of average net assets, respectively. Calamos Advisors may recapture previously waived expense amounts within the same fiscal year for any day where the respective Fund’s expense ratio falls below the contractual expense limit up to the expense limit for that day. This undertaking is binding on CALAMOS ADVISORS and any of its successors and assigns. This agreement is not terminable by either party. The expense ratios shown above may differ from the more recent expense ratios reported in the Financial Highlights section of this report.
| † | Average annual total return measures net investment income and capital gain or loss from portfolio investments as an annualized average assuming reinvestment of dividends and capital gains distributions. Performance shown reflects the effects of an expense reimbursement that improved results. Load-adjusted returns are adjusted for the maximum front-end sales load of 2.25% for Class A shares. |
NOTES:
The Bloomberg Barclays U.S. Government/Credit 1-3 Years Index includes all medium and larger issues of U.S. government, investment-grade corporate, and investment-grade international dollar-denominated bonds that have maturities of between 1 and 3 years and are publicly issued.
The Bloomberg Barclays U.S. 1-3 Year Credit Index measures the investment-grade, U.S. dollar-denominated, fixed-rate, taxable corporate and government-related bond markets. It is composed of the U.S. Corporate Index and a non-corporate component that includes foreign agencies, sovereigns, supranationals and local authorities that have maturities of between 1 and 3 years.
Index returns assume reinvestment of dividends and do not reflect deduction of fees and expenses. It is not possible to invest directly in an index.
| | | | |
| 68 | | CALAMOS OPEN-END FAMILY OF FUNDS ANNUAL REPORT | | |
Expense Overview
EXPENSE OVERVIEW
As a shareholder of a mutual fund, you incur two types of costs. You incur:
1) Transaction costs, including sales charges, or loads, on purchase payment and redemption fees.
2) Ongoing costs, including management fees, distribution and/or service (12b-1) fees and other fund expenses.
The examples in this report are based on an investment of $1,000 made at the beginning of the period and held for the entire period from May 1, 2018 to October 31, 2018. It is intended to help you understand the ongoing costs associated with investing in each mutual fund and to compare these costs with the ongoing costs of investing in other mutual funds.
There are two parts of each Fund’s chart:
Actual
In this part of the chart, you’ll see the actual expenses you would have paid on a $1,000 investment made at the beginning of the period and held for the entire period in each fund from May 1, 2018 to October 31, 2018, the period covered by this report. This chart also shows the actual returns, after expenses, you would have earned during that time. This chart can help you estimate your own expenses. For example, if you invested $8,600 in Class A shares of the fund, simply divide $8,600 by $1,000, then multiply that result by the figure in the Actual Expenses per $1,000 row. In this example, you would multiply 8.6 times the figure.
Hypothetical
In this part of the chart, you’ll see the hypothetical expenses you would have paid on a $1,000 investment from May 1, 2018 to October 31, 2018, and the hypothetical returns, after expenses, you would have earned during that time. The Securities and Exchange Commission (SEC) has established the guidelines for this chart, including the assumed 5% annual rate of return before expenses, which is what you’ll see in the chart. Note that this chart will not help you determine your own expenses, but will help you compare expenses of the fund you own to the expenses of another fund since the information for that fund should be calculated using the same assumptions.
Please note that the expenses shown in the chart are meant to highlight your ongoing costs only and do not include any transactional costs, such as sales charges (loads), redemption fees or exchange fees. Therefore, the second line of the chart is useful in comparing ongoing costs only and will not help you determine the relative total costs of owning different funds. In addition, if these transaction costs were included, your costs would have been higher.
Expense Example
The actual and hypothetical examples shown assume a $1,000 investment at the beginning of the period, May 1, 2018 and held through October 31, 2018.
| | | | | | | | | | | | | | | | |
| | | CLASS A
SHARES | | | CLASS C
SHARES | | | CLASS I
SHARES | | | CLASS R6
SHARES | |
| CALAMOS MARKET NEUTRAL INCOME FUND | | | | | | | | | |
Actual Expenses per $1,000* | | $ | 6.24 | | | $ | 10.02 | | | $ | 4.97 | | | $ | — | |
Actual – Ending Balance | | $ | 1,011.70 | | | $ | 1,007.80 | | | $ | 1,012.30 | | | $ | — | |
| | | | |
Hypothetical Expenses per $1,000* | | $ | 6.26 | | | $ | 10.06 | | | $ | 4.99 | | | $ | — | |
Hypothetical – Ending Value | | $ | 1,019.00 | | | $ | 1,015.22 | | | $ | 1,020.26 | | | $ | — | |
| | | | |
Annualized expense ratio(1) | | | 1.23% | | | | 1.98% | | | | 0.98% | | | | — | |
| CALAMOS HEDGED EQUITY INCOME FUND | | | | | | | | | |
Actual Expenses per $1,000* | | $ | 6.33 | | | $ | 10.11 | | | $ | 5.07 | | | $ | — | |
Actual – Ending Balance | | $ | 1,010.30 | | | $ | 1,006.40 | | | $ | 1,011.50 | | | $ | — | |
| | | | |
Hypothetical Expenses per $1,000* | | $ | 6.36 | | | $ | 10.16 | | | $ | 5.09 | | | $ | — | |
Hypothetical – Ending Value | | $ | 1,018.90 | | | $ | 1,015.12 | | | $ | 1,020.16 | | | $ | — | |
| | | | |
Annualized expense ratio(2) | | | 1.25% | | | | 2.00% | | | | 1.00% | | | | — | |
| CALAMOS PHINEUS LONG/SHORT FUND | | | | | | | | | |
Actual Expenses per $1,000* | | $ | 10.74 | | | $ | 14.45 | | | $ | 9.57 | | | $ | — | |
Actual – Ending Balance | | $ | 954.40 | | | $ | 950.50 | | | $ | 956.20 | | | $ | — | |
| | | | |
Hypothetical Expenses per $1,000* | | $ | 11.07 | | | $ | 14.90 | | | $ | 9.86 | | | $ | — | |
Hypothetical – Ending Value | | $ | 1,014.22 | | | $ | 1,010.38 | | | $ | 1,015.43 | | | $ | — | |
| | | | |
Annualized expense ratio(1) | | | 2.18% | | | | 2.94% | | | | 1.94% | | | | — | |
| CALAMOS CONVERTIBLE FUND | | | | | | | | | |
Actual Expenses per $1,000* | | $ | 5.77 | | | $ | 9.55 | | | $ | 4.51 | | | $ | — | |
Actual – Ending Balance | | $ | 1,008.70 | | | $ | 1,005.10 | | | $ | 1,010.50 | | | $ | — | |
| | | | |
Hypothetical Expenses per $1,000* | | $ | 5.80 | | | $ | 9.60 | | | $ | 4.53 | | | $ | — | |
Hypothetical – Ending Value | | $ | 1,019.46 | | | $ | 1,015.68 | | | $ | 1,020.72 | | | $ | — | |
| | | | |
Annualized expense ratio | | | 1.14% | | | | 1.89% | | | | 0.89% | | | | — | |
| CALAMOS GLOBAL CONVERTIBLE FUND | | | | | | | | | |
Actual Expenses per $1,000* | | $ | 6.73 | | | $ | 10.45 | | | $ | 5.49 | | | $ | — | |
Actual – Ending Balance | | $ | 978.20 | | | $ | 974.80 | | | $ | 979.50 | | | $ | — | |
| | | | |
Hypothetical Expenses per $1,000* | | $ | 6.87 | | | $ | 10.66 | | | $ | 5.60 | | | $ | — | |
Hypothetical – Ending Value | | $ | 1,018.40 | | | $ | 1,014.62 | | | $ | 1,019.66 | | | $ | — | |
| | | | |
Annualized expense ratio(2) | | | 1.35% | | | | 2.10% | | | | 1.10% | | | | — | |
| CALAMOS GROWTH FUND | | | | | | | | | |
Actual Expenses per $1,000* | | $ | 6.23 | | | $ | 9.97 | | | $ | 4.98 | | | $ | — | |
Actual – Ending Balance | | $ | 992.20 | | | $ | 988.20 | | | $ | 993.80 | | | $ | — | |
| | | | |
Hypothetical Expenses per $1,000* | | $ | 6.31 | | | $ | 10.11 | | | $ | 5.04 | | | $ | — | |
Hypothetical – Ending Value | | $ | 1,018.95 | | | $ | 1,015.17 | | | $ | 1,020.21 | | | $ | — | |
| | | | |
Annualized expense ratio | | | 1.24% | | | | 1.99% | | | | 0.99% | | | | — | |
| CALAMOS GROWTH AND INCOME FUND | | | | | | | | | |
Actual Expenses per $1,000* | | $ | 5.44 | | | $ | 9.24 | | | $ | 4.17 | | | $ | — | |
Actual – Ending Balance | | $ | 1,017.10 | | | $ | 1,013.20 | | | $ | 1,018.10 | | | $ | — | |
| | | | |
Hypothetical Expenses per $1,000* | | $ | 5.45 | | | $ | 9.25 | | | $ | 4.18 | | | $ | — | |
Hypothetical – Ending Value | | $ | 1,019.81 | | | $ | 1,016.03 | | | $ | 1,021.07 | | | $ | — | |
| | | | |
Annualized expense ratio | | | 1.07% | | | | 1.82% | | | | 0.82% | | | | — | |
| CALAMOS DIVIDEND GROWTH FUND | | | | | | | | | |
Actual Expenses per $1,000* | | $ | 6.88 | | | $ | 10.68 | | | $ | 5.61 | | | $ | — | |
Actual – Ending Balance | | $ | 1,021.70 | | | $ | 1,017.70 | | | $ | 1,022.90 | | | $ | — | |
| | | | |
Hypothetical Expenses per $1,000* | | $ | 6.87 | | | $ | 10.66 | | | $ | 5.60 | | | $ | — | |
Hypothetical – Ending Value | | $ | 1,018.40 | | | $ | 1,014.62 | | | $ | 1,019.66 | | | $ | — | |
| | | | |
Annualized expense ratio(2) | | | 1.35% | | | | 2.10% | | | | 1.10% | | | | — | |
| * | Expenses for all Fund Classes A, C, and I are equal to the Fund’s annualized expense ratio, multiplied by the average account value over the period, multiplied by 184/365. |
| (1) | Includes 0.18% and 0.61% related to dividend expense on short positions for Market Neutral Income Fund and Phineus Long/Short Fund, respectively. |
| (2) | Annualized Expense Ratios for Hedged Equity Income Fund, Global Convertible Fund, and Dividend Growth Fund are adjusted to reflect fee waiver. |
| | | | |
| 70 | | CALAMOS OPEN-END FAMILY OF FUNDS ANNUAL REPORT | | |
Expense Example
The actual and hypothetical examples shown assume a $1,000 investment at the beginning of the period, May 1, 2018 and held through October 31, 2018.
| | | | | | | | | | | | | | | | |
| | | CLASS A
SHARES | | | CLASS C
SHARES | | | CLASS I
SHARES | | | CLASS R6
SHARES | |
| CALAMOS OPPORTUNISTIC VALUE FUND | | | | | | | | | |
Actual Expenses per $1,000* | | $ | 5.83 | | | $ | 9.62 | | | $ | 4.57 | | | $ | — | |
Actual – Ending Balance | | $ | 1,012.50 | | | $ | 1,008.80 | | | $ | 1,013.50 | | | $ | — | |
| | | | |
Hypothetical Expenses per $1,000* | | $ | 5.85 | | | $ | 9.65 | | | $ | 4.58 | | | $ | — | |
Hypothetical – Ending Value | | $ | 1,019.41 | | | $ | 1,015.63 | | | $ | 1,020.67 | | | $ | — | |
| | | | |
Annualized expense ratio(2) | | | 1.15% | | | | 1.90% | | | | 0.90% | | | | — | |
| CALAMOS INTERNATIONAL GROWTH FUND(a) | | | | | | | | | |
Actual Expenses per $1,000* | | $ | 5.80 | | | $ | 9.15 | | | $ | 4.49 | | | $ | 0.87 | |
Actual – Ending Balance | | $ | 854.60 | | | $ | 851.40 | | | $ | 855.60 | | | $ | 893.30 | |
| | | | |
Hypothetical Expenses per $1,000* | | $ | 6.31 | | | $ | 9.96 | | | $ | 4.89 | | | $ | 0.92 | |
Hypothetical – Ending Value | | $ | 1,018.95 | | | $ | 1,015.32 | | | $ | 1,020.37 | | | $ | 1,005.11 | |
| | | | |
Annualized expense ratio(2) | | | 1.24% | | | | 1.96% | | | | 0.96% | | | | 0.76% | |
| CALAMOS EVOLVING WORLD GROWTH FUND | | | | | | | | | |
Actual Expenses per $1,000* | | $ | 7.31 | | | $ | 10.69 | | | $ | 6.12 | | | $ | — | |
Actual – Ending Balance | | $ | 823.40 | | | $ | 820.30 | | | $ | 824.40 | | | $ | — | |
| | | | |
Hypothetical Expenses per $1,000* | | $ | 8.08 | | | $ | 11.82 | | | $ | 6.77 | | | $ | — | |
Hypothetical – Ending Value | | $ | 1,017.19 | | | $ | 1,013.46 | | | $ | 1,018.50 | | | $ | — | |
| | | | |
Annualized expense ratio | | | 1.59% | | | | 2.33% | | | | 1.33% | | | | — | |
| CALAMOS EMERGING MARKET EQUITY FUND | | | | | | | | | |
Actual Expenses per $1,000* | | $ | 7.90 | | | $ | 11.26 | | | $ | 6.78 | | | $ | — | |
Actual – Ending Balance | | $ | 790.70 | | | $ | 787.70 | | | $ | 792.20 | | | $ | — | |
| | | | |
Hypothetical Expenses per $1,000* | | $ | 8.89 | | | $ | 12.68 | | | $ | 7.63 | | | $ | — | |
Hypothetical – Ending Value | | $ | 1,016.38 | | | $ | 1,012.60 | | | $ | 1,017.64 | | | $ | — | |
| | | | |
Annualized expense ratio(2) | | | 1.75% | | | | 2.50% | | | | 1.50% | | | | — | |
| CALAMOS GLOBAL EQUITY FUND | | | | | | | | | |
Actual Expenses per $1,000* | | $ | 6.78 | | | $ | 10.40 | | | $ | 5.57 | | | $ | — | |
Actual – Ending Balance | | $ | 922.70 | | | $ | 918.80 | | | $ | 923.10 | | | $ | — | |
| | | | |
Hypothetical Expenses per $1,000* | | $ | 7.12 | | | $ | 10.92 | | | $ | 5.85 | | | $ | — | |
Hypothetical – Ending Value | | $ | 1,018.15 | | | $ | 1,014.37 | | | $ | 1,019.41 | | | $ | — | |
| | | | |
Annualized expense ratio(2) | | | 1.40% | | | | 2.15% | | | | 1.15% | | | | — | |
| CALAMOS GLOBAL GROWTH AND INCOME FUND | | | | | | | | | |
Actual Expenses per $1,000* | | $ | 7.22 | | | $ | 10.89 | | | $ | 6.00 | | | $ | — | |
Actual – Ending Balance | | $ | 948.50 | | | $ | 945.50 | | | $ | 950.10 | | | $ | — | |
| | | | |
Hypothetical Expenses per $1,000* | | $ | 7.48 | | | $ | 11.27 | | | $ | 6.21 | | | $ | — | |
Hypothetical – Ending Value | | $ | 1,017.79 | | | $ | 1,014.01 | | | $ | 1,019.05 | | | $ | — | |
| | | | |
Annualized expense ratio | | | 1.47% | | | | 2.22% | | | | 1.22% | | | | — | |
| * | Expenses for all Fund Classes A, C, and I are equal to the Fund’s annualized expense ratio, multiplied by the average account value over the period, multiplied by 184/365. |
| (2) | Annualized Expense Ratios for Opportunistic Value Fund, International Growth Fund, Emerging Markets Equity Fund, and Global Equity Fund are adjusted to reflect fee waiver. |
| (a) | September 17, 2018 (commencement of operations) through October 31, 2018. Expenses for Class R6 of the International Growth Fund are equal to the Fund’s annualized expense ratio, multiplied by the average account value from inception to period end, multiplied by 44/365. |
Expense Example
The actual and hypothetical examples shown assume a $1,000 investment at the beginning of the period, May 1, 2018 and held through October 31, 2018.
| | | | | | | | | | | | | | | | |
| | | CLASS A
SHARES | | | CLASS C
SHARES | | | CLASS I
SHARES | | | CLASS R6
SHARES | |
| CALAMOS TOTAL RETURN BOND FUND | | | | | | | | | |
Actual Expenses per $1,000* | | $ | 4.54 | | | $ | 8.30 | | | $ | 3.28 | | | $ | — | |
Actual – Ending Balance | | $ | 999.40 | | | $ | 994.60 | | | $ | 999.60 | | | $ | — | |
| | | | |
Hypothetical Expenses per $1,000* | | $ | 4.58 | | | $ | 8.39 | | | $ | 3.31 | | | $ | — | |
Hypothetical – Ending Value | | $ | 1,020.67 | | | $ | 1,016.89 | | | $ | 1,021.93 | | | $ | — | |
| | | | |
Annualized expense ratio(2) | | | 0.90% | | | | 1.65% | | | | 0.65% | | | | — | |
| CALAMOS HIGH INCOME OPPORTUNITIES FUND | | | | | | | | | |
Actual Expenses per $1,000* | | $ | 5.06 | | | $ | 8.84 | | | $ | 3.80 | | | $ | — | |
Actual – Ending Balance | | $ | 1,009.30 | | | $ | 1,004.80 | | | $ | 1,010.60 | | | $ | — | |
| | | | |
Hypothetical Expenses per $1,000* | | $ | 5.09 | | | $ | 8.89 | | | $ | 3.82 | | | $ | — | |
Hypothetical – Ending Value | | $ | 1,020.16 | | | $ | 1,016.38 | | | $ | 1,021.42 | | | $ | — | |
| | | | |
Annualized expense ratio(2) | | | 1.00% | | | | 1.75% | | | | 0.75% | | | | — | |
| CALAMOS SHORT-TERM BOND FUND(b) | | | | | | | | | |
Actual Expenses per $1,000 | | $ | 0.76 | | | $ | — | | | $ | 0.48 | | | $ | — | |
Actual – Ending Balance | | $ | 1,001.20 | | | $ | — | | | $ | 1,001.60 | | | $ | — | |
| | | | |
Hypothetical Expenses per $1,000 | | $ | 0.76 | | | $ | — | | | $ | 0.48 | | | $ | — | |
Hypothetical – Ending Value | | $ | 1,004.99 | | | $ | — | | | $ | 1,005.27 | | | $ | — | |
| | | | |
Annualized expense ratio(2) | | | 0.66% | | | | — | | | | 0.42% | | | | — | |
| * | Expenses for all Fund Classes A, C, and I are equal to the Fund’s annualized expense ratio, multiplied by the average account value over the period, multiplied by 184/365. |
| (2) | Annualized Expense Ratios for Total Return Bond Fund, High Income Opportunities Fund, and Short-Term Bond Fund are adjusted to reflect fee waiver. |
| (b) | September 19, 2018 (commencement of operations) through October 31, 2018. Expenses for all Fund Classes of the Short-Term Bond Fund are equal to the Fund’s annualized expense ratio, multiplied by the average account value from inception to period end, multiplied by 42/365. |
| | | | |
| 72 | | CALAMOS OPEN-END FAMILY OF FUNDS ANNUAL REPORT | | |
Market Neutral Income Fund Schedule of Investments October 31, 2018
| | | | | | | | | | |
PRINCIPAL
AMOUNT | | | | | | | VALUE | |
| | CONVERTIBLE BONDS (39.1%) | |
| | | | | | Communication Services (1.9%) | |
| | 7,000,000 | | | | | Boingo Wireless, Inc.*
1.000%, 10/01/23 | | $ | 7,063,770 | |
| | 1,000,000,000 | | | JPY | | CyberAgent, Inc.
0.000%, 02/19/25 | | | 9,854,877 | |
| | 267,000 | | | | | Live Nation Entertainment, Inc.
2.500%, 05/15/19 | | | 405,044 | |
| | 10,000,000 | | | | | Momo, Inc.*
1.250%, 07/01/25 | | | 8,774,550 | |
| | 5,833,000 | | | | | Sea, Ltd.*
2.250%, 07/01/23 | | | 5,439,768 | |
| | | | | | Twitter, Inc. | | | | |
| | 25,000,000 | | | | | 0.250%, 06/15/24* | | | 23,410,500 | |
| | 15,000,000 | | | | | 1.000%, 09/15/21~ | | | 13,956,450 | |
| | 15,000,000 | | | | | Weibo Corp.*^
1.250%, 11/15/22 | | | 13,397,175 | |
| | 13,000,000 | | | | | World Wrestling Entertainment, Inc.*~
3.375%, 12/15/23 | | | 38,252,890 | |
| | 8,500,000 | | | | | Zillow Group, Inc.^
2.000%, 12/01/21 | | | 9,004,518 | |
| | | | | | | | | | |
| | | | | | | | | 129,559,542 | |
| | | | | | | | | | |
| | | | | | Consumer Discretionary (4.8%) | |
| | 30,000,000 | | | | | Booking Holdings, Inc.~
0.350%, 06/15/20 | | | 43,512,000 | |
| | 5,000,000 | | | | | Chegg, Inc.*
0.250%, 05/15/23 | | | 5,914,800 | |
| | | | | | Ctrip.com International, Ltd. | | | | |
| | 29,827,000 | | | | | 1.990%, 07/01/25~^ | | | 29,723,500 | |
| | 10,500,000 | | | | | 1.000%, 07/01/20 | | | 9,977,415 | |
| | 13,500,000 | | | | | Etsy, Inc.*
0.000%, 03/01/23 | | | 18,010,755 | |
| | 11,000,000 | | | | | Gannett Company, Inc.*~
4.750%, 04/15/24 | | | 11,411,180 | |
| | 4,000,000 | | | | | GNC Holdings, Inc.
1.500%, 08/15/20 | | | 3,102,200 | |
| | 1,400,000 | | | | | LGI Homes, Inc.
4.250%, 11/15/19 | | | 2,809,765 | |
| | 5,000,000 | | | | | Liberty Media Corp. / Liberty Formula One
1.000%, 01/30/23 | | | 5,427,675 | |
| | 25,000,000 | | | | | MercadoLibre, Inc.*~^
2.000%, 08/15/28 | | | 24,042,375 | |
| | 7,500,000 | | | | | RH~
0.000%, 06/15/19 | | | 8,349,825 | |
| | 5,250,000 | | | | | TAL Education Group~
2.500%, 05/15/19 | | | 34,930,193 | |
| | | | | | Tesla, Inc.^ | | | | |
| | 32,500,000 | | | | | 1.250%, 03/01/21~ | | | 36,473,287 | |
| | 30,000,000 | | | | | 2.375%, 03/15/22~ | | | 36,574,200 | |
| | 15,000,000 | | | | | 0.250%, 03/01/19 | | | 16,041,600 | |
| | 12,500,000 | | | | | Wayfair, Inc.
0.375%, 09/01/22 | | | 15,486,938 | |
| | | | | | | | | | |
PRINCIPAL
AMOUNT | | | | | | | VALUE | |
| | 2,000,000,000 | | | JPY | | Yamada Denki Company, Ltd.
0.000%, 06/28/19 | | $ | 18,488,678 | |
| | | | | | | | | | |
| | | | | | | | | 320,276,386 | |
| | | | | | | | | | |
| | | | | | Consumer Staples (0.8%) | |
| | 25,000,000 | | | | | Herbalife Nutrition Ltd.^
2.000%, 08/15/19 | | | 31,895,375 | |
| | 15,000,000 | | | GBP | | J Sainsbury, PLC
1.250%, 11/21/19 | | | 20,994,632 | |
| | | | | | | | | | |
| | | | | | | | | 52,890,007 | |
| | | | | | | | | | |
| | | | | | Energy (0.8%) | |
| | 15,000,000 | | | | | Chesapeake Energy Corp.^
5.500%, 09/15/26 | | | 14,078,625 | |
| | 5,000,000 | | | | | Golar LNG, Ltd.
2.750%, 02/15/22 | | | 5,141,800 | |
| | 5,000,000 | | | | | Nabors Industries, Inc.^
0.750%, 01/15/24 | | | 3,732,825 | |
| | 5,000,000 | | | | | Oasis Petroleum, Inc.~^
2.625%, 09/15/23 | | | 5,656,725 | |
| | 4,000,000 | | | | | Renewable Energy Group, Inc.
4.000%, 06/15/36 | | | 11,722,080 | |
| | 4,000,000 | | | | | SEACOR Holdings, Inc.
3.250%, 05/15/30 | | | 3,791,020 | |
| | 10,000,000 | | | | | Whiting Petroleum Corp.~
1.250%, 04/01/20 | | | 9,556,150 | |
| | | | | | | | | | |
| | | | | | | | | 53,679,225 | |
| | | | | | | | | | |
| | | | | | Financials (2.2%) | |
| | 5,000,000 | | | | | Apollo Commercial Real Estate Finance, Inc.
4.750%, 08/23/22 | | | 4,898,625 | |
| | 21,120,000 | | | | | AXA, SA*~
7.250%, 05/15/21 | | | 21,665,741 | |
| | 3,500,000 | | | | | Cowen, Inc.~
3.000%, 03/15/19 | | | 3,518,182 | |
| | 15,000,000 | | | EUR | | Credit Agricole, SA
0.000%, 10/03/19 | | | 12,604,275 | |
| | 10,000,000 | | | | | Goldman Sachs BDC, Inc.
4.500%, 04/01/22 | | | 10,092,400 | |
| | 5,000,000 | | | | | Heritage Insurance Holdings, Inc.
5.875%, 08/01/37 | | | 5,668,075 | |
| | 15,000,000 | | | | | IAC FinanceCo, Inc.*~^
0.875%, 10/01/22 | | | 20,962,575 | |
| | 25,000,000 | | | | | LendingTree, Inc.~
0.625%, 06/01/22 | | | 29,396,625 | |
| | 5,000,000 | | | | | PRA Group, Inc.
3.500%, 06/01/23 | | | 4,741,000 | |
| | | | | | Redwood Trust, Inc. | | | | |
| | 5,000,000 | | | | | 5.625%, 07/15/24 | | | 4,955,750 | |
| | 5,000,000 | | | | | 4.750%, 08/15/23 | | | 4,793,100 | |
| | 1,500,000,000 | | | JPY | | SBI Holdings, Inc.
0.000%, 09/14/20 | | | 22,936,633 | |
| | | | | | | | | | |
| | | | | | | | | 146,232,981 | |
| | | | | | | | | | |
| | | | | | |
| See accompanying Notes to Schedule of Investments | | www.calamos.com | | | 73 | |
Market Neutral Income Fund Schedule of Investments October 31, 2018
| | | | | | | | | | |
PRINCIPAL
AMOUNT | | | | | | | VALUE | |
| | | | | | | | | | |
| | | | | | Health Care (6.8%) | |
| | 5,000,000 | | | | | Allscripts Healthcare Solutions, Inc.~^
1.250%, 07/01/20 | | $ | 4,997,225 | |
| | 10,000,000 | | | | | AMAG Pharmaceuticals, Inc.~
3.250%, 06/01/22 | | | 10,796,300 | |
| | 20,000,000 | | | EUR | | Bayer Capital Corp., BV
5.625%, 11/22/19 | | | 18,929,985 | |
| | 10,000,000 | | | EUR | | Bayer, AG
0.050%, 06/15/20 | | | 11,724,687 | |
| | 7,500,000 | | | | | Dermira, Inc.
3.000%, 05/15/22 | | | 6,396,263 | |
| | 12,953,000 | | | | | DexCom, Inc.
0.750%, 05/15/22 | | | 18,839,232 | |
| | 5,000,000 | | | | | Evolent Health, Inc.*
1.500%, 10/15/25 | | | 4,837,575 | |
| | 5,000,000 | | | | | Flexion Therapeutics, Inc.
3.375%, 05/01/24 | | | 4,401,150 | |
| | 45,000,000 | | | | | Illumina, Inc.~
0.000%, 06/15/19 | | | 56,827,575 | |
| | 2,500,000 | | | | | Immunomedics, Inc.
4.750%, 02/15/20 | | | 11,203,300 | |
| | 12,500,000 | | | | | Innoviva, Inc.
2.500%, 08/15/25 | | | 13,142,625 | |
| | 13,333,000 | | | | | Insmed, Inc.
1.750%, 01/15/25 | | | 10,131,480 | |
| | | | | | Insulet Corp. | | | | |
| | 15,000,000 | | | | | 1.250%, 09/15/21~ | | | 23,323,200 | |
| | 1,280,000 | | | | | 1.375%, 11/15/24* | | | 1,450,368 | |
| | 5,000,000 | | | | | Intercept Pharmaceuticals, Inc.
3.250%, 07/01/23 | | | 4,662,450 | |
| | 3,000,000 | | | | | Invacare Corp.
4.500%, 06/01/22 | | | 3,154,980 | |
| | 15,000,000 | | | | | Ionis Pharmaceuticals, Inc.
1.000%, 11/15/21 | | | 15,631,425 | |
| | 8,000,000 | | | | | Ironwood Pharmaceuticals, Inc.^
2.250%, 06/15/22 | | | 8,455,040 | |
| | 9,000,000 | | | | | Ligand Pharmaceuticals, Inc.*^
0.750%, 05/15/23 | | | 8,596,845 | |
| | | | | | Medicines Company | | | | |
| | 12,500,000 | | | | | 2.750%, 07/15/23 | | | 10,610,625 | |
| | 7,500,000 | | | | | 2.500%, 01/15/22~^ | | | 7,282,613 | |
| | 6,855,000 | | | | | Molina Healthcare, Inc.~
1.125%, 01/15/20 | | | 21,356,375 | |
| | 15,000,000 | | | | | Neurocrine Biosciences, Inc.~
2.250%, 05/15/24 | | | 23,053,950 | |
| | 20,000,000 | | | | | NuVasive, Inc.
2.250%, 03/15/21 | | | 22,328,700 | |
| | 5,000,000 | | | | | Pacira Pharmaceuticals, Inc.~^
2.375%, 04/01/22 | | | 5,261,950 | |
| | 6,661,000 | | | | | Quidel Corp.~
3.250%, 12/15/20 | | | 13,722,759 | |
| | 5,000,000 | | | | | Radius Health, Inc.
3.000%, 09/01/24 | | | 3,895,300 | |
| | | | | | | | | | |
PRINCIPAL
AMOUNT | | | | | | | VALUE | |
| | 3,500,000 | | | | | Retrophin, Inc.
2.500%, 09/15/25 | | $ | 3,386,408 | |
| | 20,000,000 | | | | | Sarepta Therapeutics, Inc.*~
1.500%, 11/15/24 | | | 39,505,400 | |
| | 10,000,000 | | | | | Supernus Pharmaceuticals, Inc.*^
0.625%, 04/01/23 | | | 10,867,050 | |
| | | | | | Teladoc Health, Inc. | | | | |
| | 8,050,000 | | | | | 1.375%, 05/15/25*^ | | | 11,632,813 | |
| | 8,000,000 | | | | | 3.000%, 12/15/22 | | | 13,855,760 | |
| | 5,000,000 | | | | | Theravance Biopharma, Inc.~
3.250%, 11/01/23 | | | 5,041,775 | |
| | 5,000,000 | | | | | Tilray, Inc.*
5.000%, 10/01/23 | | | 4,162,850 | |
| | 11,461,000 | | | | | Wright Medical Group, Inc.*^
1.625%, 06/15/23 | | | 11,633,259 | |
| | 7,500,000 | | | | | Wright Medical Group, NV
2.250%, 11/15/21 | | | 10,271,212 | |
| | | | | | | | | | |
| | | | | | | | | 455,370,504 | |
| | | | | | | | | | |
| | | | | | Industrials (1.3%) | |
| | 17,500,000 | | | | | 51job, Inc.~
3.250%, 04/15/19 | | | 26,245,450 | |
| | 5,000,000 | | | | | Aerojet Rocketdyne Holdings, Inc.~
2.250%, 12/15/23 | | | 7,361,700 | |
| | 5,385,000 | | | | | Air Transport Services Group, Inc.^
1.125%, 10/15/24 | | | 4,931,368 | |
| | 10,000,000 | | | EUR | | Airbus, SE
0.000%, 06/14/21 | | | 13,445,466 | |
| | 11,250,000 | | | | | FTI Consulting, Inc.*
2.000%, 08/15/23 | | | 10,723,556 | |
| | 1,000,000,000 | | | JPY | | Nagoya Railroad Company, Ltd.
0.000%, 12/11/24 | | | 9,708,335 | |
| | 7,500,000 | | | | | Navistar International Corp.
4.750%, 04/15/19 | | | 7,525,838 | |
| | 3,667,000 | | | | | Patrick Industries, Inc.*
1.000%, 02/01/23 | | | 3,110,624 | |
| | 3,000,000 | | | | | Tesla Energy Operations, Inc.^
1.625%, 11/01/19 | | | 2,825,790 | |
| | | | | | | | | | |
| | | | | | | | | 85,878,127 | |
| | | | | | | | | | |
| | | | | | Information Technology (18.4%) | |
| | 20,000,000 | | | | | Advanced Micro Devices, Inc.~
2.125%, 09/01/26 | | | 47,686,400 | |
| | 30,000,000 | | | | | Akamai Technologies, Inc.~
0.000%, 02/15/19 | | | 29,791,800 | |
| | 12,500,000 | | | | | Altaba, Inc.~
0.000%, 12/01/18 | | | 14,065,000 | |
| | 12,500,000 | | | | | Alteryx, Inc.*
0.500%, 06/01/23 | | | 16,935,687 | |
| | 4,000,000 | | | | | Apptio, Inc.*
0.875%, 04/01/23 | | | 3,846,140 | |
| | 36,000,000 | | | | | Atlassian, Inc.*~^
0.625%, 05/01/23 | | | 41,267,880 | |
| | 5,000,000 | | | | | Avaya Holdings Corp.*
2.250%, 06/15/23 | | | 4,433,800 | |
| | | | |
| 74 | | CALAMOS OPEN-END FAMILY OF FUNDS ANNUAL REPORT | | See accompanying Notes to Schedule of Investments |
Market Neutral Income Fund Schedule of Investments October 31, 2018
| | | | | | | | | | |
PRINCIPAL
AMOUNT | | | | | | | VALUE | |
| | | | | | CalAmp Corp. | | | | |
| | 7,500,000 | | | | | 1.625%, 05/15/20 | | $ | 7,492,763 | |
| | 5,000,000 | | | | | 2.000%, 08/01/25* | | | 4,585,550 | |
| | 7,000,000 | | | | | Carbonite, Inc.
2.500%, 04/01/22 | | | 10,159,870 | |
| | 8,800,000 | | | | | Cardtronics, Inc.~
1.000%, 12/01/20 | | | 8,207,232 | |
| | 20,000,000 | | | | | Citrix Systems, Inc.~
0.500%, 04/15/19 | | | 28,312,400 | |
| | 11,000,000 | | | | | CSG Systems International, Inc.
4.250%, 03/15/36 | | | 11,279,730 | |
| | 15,000,000 | | | | | Cypress Semiconductor Corp.~^
4.500%, 01/15/22 | | | 17,738,025 | |
| | 10,000,000 | | | | | DocuSign, Inc.*
0.500%, 09/15/23 | | | 9,374,850 | |
| | 10,500,000 | | | | | Electronics For Imaging, Inc.
0.750%, 09/01/19 | | | 10,317,353 | |
| | 10,000,000 | | | | | Envestnet, Inc.
1.750%, 12/15/19 | | | 10,351,600 | |
| | 5,000,000 | | | | | Euronet Worldwide, Inc.~
1.500%, 10/01/44 | | | 7,657,125 | |
| | 17,500,000 | | | | | Finisar Corp.~^
0.500%, 12/15/33 | | | 17,436,300 | |
| | | | | | FireEye, Inc. | | | | |
| | 15,000,000 | | | | | 0.875%, 06/01/24*^ | | | 15,767,775 | |
| | 5,000,000 | | | | | 1.625%, 06/01/35^ | | | 4,599,550 | |
| | 5,000,000 | | | | | 1.000%, 06/01/35~ | | | 4,827,675 | |
| | 4,999,000 | | | | | Guidewire Software, Inc.^
1.250%, 03/15/25 | | | 5,043,641 | |
| | 15,000,000 | | | | | HubSpot, Inc.~^
0.250%, 06/01/22 | | | 22,792,125 | |
| | 15,000,000 | | | | | Infinera Corp.
2.125%, 09/01/24 | | | 13,236,600 | |
| | | | | | Inphi Corp. | | | | |
| | 5,000,000 | | | | | 1.125%, 12/01/20 | | | 5,263,575 | |
| | 3,975,000 | | | | | 0.750%, 09/01/21 | | | 3,720,580 | |
| | 20,000,000 | | | | | Integrated Device Technology, Inc.~
0.875%, 11/15/22 | | | 29,955,100 | |
| | 15,000,000 | | | | | Intel Corp.~
3.250%, 08/01/39 | | | 34,377,600 | |
| | 25,000,000 | | | | | j2 Global, Inc.~^
3.250%, 06/15/29 | | | 29,636,250 | |
| | 17,500,000 | | | | | Lumentum Holdings, Inc.^
0.250%, 03/15/24 | | | 19,962,512 | |
| | | | | | Microchip Technology, Inc. | | | | |
| | 20,000,000 | | | | | 1.625%, 02/15/25~ | | | 26,024,800 | |
| | 19,903,000 | | | | | 1.625%, 02/15/27~^ | | | 18,863,466 | |
| | 7,500,000 | | | | | 2.250%, 02/15/37 | | | 6,818,363 | |
| | 25,000,000 | | | | | Micron Technology, Inc.~
3.125%, 05/01/32 | | | 95,067,625 | |
| | 9,000,000 | | | | | MongoDB, Inc.*^
0.750%, 06/15/24 | | | 11,998,440 | |
| | 10,000,000 | | | | | New Relic, Inc.*^
0.500%, 05/01/23 | | | 10,543,200 | |
| | | | | | | | | | |
PRINCIPAL
AMOUNT | | | | | | | VALUE | |
| | 10,000,000 | | | | | Nice Systems, Inc.^
1.250%, 01/15/24 | | $ | 13,432,000 | |
| | 10,000,000 | | | | | Nuance Communications, Inc.~
1.000%, 12/15/35 | | | 9,405,950 | |
| | 11,500,000 | | | | | Nutanix, Inc.*
0.000%, 01/15/23 | | | 12,683,177 | |
| | 15,000,000 | | | | | NXP Semiconductors, NV~^
1.000%, 12/01/19 | | | 15,196,050 | |
| | 17,500,000 | | | | | Okta, Inc.*~^
0.250%, 02/15/23 | | | 23,845,325 | |
| | 25,000,000 | | | | | ON Semiconductor Corp.~^
1.625%, 10/15/23 | | | 27,222,250 | |
| | 10,000,000 | | | | | OSI Systems, Inc.
1.250%, 09/01/22 | | | 9,136,800 | |
| | | | | | Palo Alto Networks, Inc.~ | | | | |
| | 30,000,000 | | | | | 0.750%, 07/01/23* | | | 29,172,450 | |
| | 20,600,000 | | | | | 0.000%, 07/01/19 | | | 34,206,506 | |
| | 7,500,000 | | | | | Pandora Media, Inc.
1.750%, 12/01/20 | | | 7,175,925 | |
| | 10,000,000 | | | | | Pure Storage, Inc.*^
0.125%, 04/15/23 | | | 10,271,850 | |
| | 8,000,000 | | | | | Q2 Holdings, Inc.*
0.750%, 02/15/23 | | | 8,803,800 | |
| | 9,000,000 | | | | | Quotient Technology, Inc.*
1.750%, 12/01/22 | | | 9,209,160 | |
| | 20,000,000 | | | | | RealPage, Inc.~
1.500%, 11/15/22 | | | 27,508,700 | |
| | 10,000,000 | | | | | Red Hat, Inc.~
0.250%, 10/01/19 | | | 23,248,450 | |
| | 23,000,000 | | | | | RingCentral, Inc.*~^
0.000%, 03/15/23 | | | 26,043,820 | |
| | 7,500,000 | | | | | Rovi Corp.
0.500%, 03/01/20 | | | 7,028,700 | |
| | 15,000,000 | | | | | Silicon Laboratories, Inc.^
1.375%, 03/01/22 | | | 16,203,150 | |
| | 10,000,000 | | | | | SINA Corp.
1.000%, 12/01/18 | | | 9,950,750 | |
| | | | | | Splunk, Inc.*~ | | | | |
| | 25,000,000 | | | | | 1.125%, 09/15/25^ | | | 23,692,000 | |
| | 25,000,000 | | | | | 0.500%, 09/15/23 | | | 23,925,250 | |
| | | | | | Square, Inc.~ | | | | |
| | 25,000,000 | | | | | 0.375%, 03/01/22 | | | 79,900,000 | |
| | 20,000,000 | | | | | 0.500%, 05/15/23*^ | | | 23,966,900 | |
| | 12,500,000 | | | | | Synaptics, Inc.^
0.500%, 06/15/22 | | | 11,198,313 | |
| | 5,000,000 | | | | | Teradyne, Inc.^
1.250%, 12/15/23 | | | 6,277,450 | |
| | 15,000,000 | | | | | TTM Technologies, Inc.~
1.750%, 12/15/20 | | | 19,919,175 | |
| | 15,000,000 | | | | | Twilio, Inc.*
0.250%, 06/01/23 | | | 18,744,600 | |
| | 10,000,000 | | | | | Vishay Intertechnology, Inc.*^
2.250%, 06/15/25 | | | 9,005,550 | |
| | | | | | |
| See accompanying Notes to Schedule of Investments | | www.calamos.com | | | 75 | |
Market Neutral Income Fund Schedule of Investments October 31, 2018
| | | | | | | | | | |
PRINCIPAL
AMOUNT | | | | | | | VALUE | |
| | 15,000,000 | | | | | Wix.com, Ltd.*^
0.000%, 07/01/23 | | $ | 14,748,075 | |
| | 7,500,000 | | | | | Workday, Inc.~
1.500%, 07/15/20 | | | 12,552,375 | |
| | 10,000,000 | | | | | Zendesk, Inc.*
0.250%, 03/15/23 | | | 10,968,750 | |
| | | | | | | | | | |
| | | | | | | | | 1,234,081,633 | |
| | | | | | | | | | |
| | | | | | Materials (0.8%) | |
| | 10,000,000 | | | | | Allegheny Technologies, Inc.~^
4.750%, 07/01/22 | | | 19,429,500 | |
| | 10,000,000 | | | | | Arconic, Inc.^
1.625%, 10/15/19 | | | 10,080,050 | |
| | 3,000,000 | | | | | Pretium Resources, Inc.
2.250%, 03/15/22 | | | 2,749,140 | |
| | 5,000,000 | | | | | TimkenSteel Corp.
6.000%, 06/01/21 | | | 6,192,850 | |
| | 10,000,000 | | | GBP | | Volcan Holdings, PLC
4.125%, 04/11/20 | | | 16,137,087 | |
| | | | | | | | | | |
| | | | | | | | | 54,588,627 | |
| | | | | | | | | | |
| | | | | | Real Estate (1.1%) | |
| | 13,000,000 | | | | | American Residential Properties OP, LP*~
3.250%, 11/15/18 | | | 15,305,810 | |
| | 31,500,000 | | | | | Extra Space Storage, LP*~^
3.125%, 10/01/35 | | | 33,864,705 | |
| | 6,000,000 | | | | | Forestar Group, Inc.
3.750%, 03/01/20 | | | 5,896,800 | |
| | | | | | IH Merger Sub, LLC | | | | |
| | 7,700,000 | | | | | 3.500%, 01/15/22 | | | 8,251,974 | |
| | 6,000,000 | | | | | 3.000%, 07/01/19 | | | 7,214,640 | |
| | 5,000,000 | | | | | iStar, Inc.*
3.125%, 09/15/22 | | | 4,718,100 | |
| | | | | | | | | | |
| | | | | | | | | 75,252,029 | |
| | | | | | | | | | |
| | | | | | Utilities (0.2%) | |
| | | | | | Chugoku Electric Power Company, Inc. | | | | |
| | 500,000,000 | | | JPY | | 0.000%, 01/24/20 | | | 4,762,529 | |
| | 500,000,000 | | | JPY | | 0.000%, 01/25/22 | | | 4,861,767 | |
| | | | | | | | | | |
| | | | | | | | | 9,624,296 | |
| | | | | | | | | | |
| | | | | | TOTAL CONVERTIBLE BONDS
(Cost $2,478,765,056) | | | 2,617,433,357 | |
| | | | | | | | | | |
| | | | | | | | | | |
NUMBER OF
SHARES | | | | | | | VALUE | |
| | CONVERTIBLE PREFERRED STOCKS (4.6%) | |
| | | | | | Communication Services (1.2%) | |
| | 500,000 | | | | | Alibaba Exchangeable (Softbank)*§
5.750%, 06/01/19 | | | 80,642,250 | |
| | | | | | | | | | |
| | | | | | Financials (0.6%) | |
| | 200,000 | | | | | 2017 Mandatory Exchangeable Trust*
5.188%, 12/01/20 | | | 26,390,000 | |
| | | | | | | | | | |
NUMBER OF
SHARES | | | | | | | VALUE | |
| | 122,820 | | | | | Assurant, Inc.
6.500%, 03/15/21 | | $ | 13,088,313 | |
| | 50,000 | | | | | Virtus Investment Partners, Inc.
7.250%, 02/01/20 | | | 4,558,000 | |
| | | | | | | | | | |
| | | | | | | | | 44,036,313 | |
| | | | | | | | | | |
| | | | | | Health Care (0.5%) | |
| | 314,735 | | | | | Becton Dickinson and Company~
6.125%, 05/01/20 | | | 18,465,503 | |
| | 35,000 | | | | | Teva Pharmaceutical Industries, Ltd.~
7.000%, 12/15/18 | | | 12,950,000 | |
| | | | | | | | | | |
| | | | | | | | | 31,415,503 | |
| | | | | | | | | | |
| | | | | | Industrials (0.4%) | |
| | 10,500 | | | | | Fortive Corp.
5.000%, 07/01/21 | | | 10,313,205 | |
| | 300,000 | | | | | Rexnord Corp.
5.750%, 11/15/19 | | | 17,151,000 | |
| | | | | | | | | | |
| | | | | | | | | 27,464,205 | |
| | | | | | | | | | |
| | | | | | Information Technology (0.2%) | |
| | 65,000 | | | | | Belden, Inc.~
6.750%, 07/15/19 | | | 4,828,850 | |
| | 100,000 | | | | | MTS Systems Corp.
8.750%, 07/01/19 | | | 10,587,500 | |
| | | | | | | | | | |
| | | | | | | | | 15,416,350 | |
| | | | | | | | | | |
| | | | | | Materials (0.2%) | |
| | 242,647 | | | | | International Flavors & Fragrances, Inc.
6.000%, 09/15/21 | | | 13,971,614 | |
| | | | | | | | | | |
| | | | | | Real Estate (0.2%) | |
| | 12,856 | | | | | Crown Castle International Corp.
6.875%, 08/01/20 | | | 13,434,520 | |
| | | | | | | | | | |
| | | | | | Utilities (1.3%) | |
| | 400,000 | | | | | CenterPoint Energy, Inc.
7.000%, 09/01/21 | | | 19,848,000 | |
| | 60,597 | | | | | Dominion Energy, Inc.
6.750%, 08/15/19 | | | 2,905,626 | |
| | 130,000 | | | | | DTE Energy Company^
6.500%, 10/01/19 | | | 6,932,900 | |
| | | | | | Sempra Energy | | | | |
| | 147,059 | | | | | 6.000%, 01/15/21 | | | 14,582,370 | |
| | 135,000 | | | | | 6.750%, 07/15/21^ | | | 13,460,850 | |
| | 88,235 | | | | | South Jersey Industries, Inc.
7.250%, 04/15/21 | | | 4,436,456 | |
| | 250,000 | | | | | Vistra Energy Corp.
7.000%, 07/01/19 | | | 22,937,500 | |
| | | | | | | | | | |
| | | | | | | | | 85,103,702 | |
| | | | | | | | | | |
| | | | | | TOTAL CONVERTIBLE PREFERRED STOCKS
(Cost $282,640,436) | | | 311,484,457 | |
| | | | | | | | | | |
| | | | |
| 76 | | CALAMOS OPEN-END FAMILY OF FUNDS ANNUAL REPORT | | See accompanying Notes to Schedule of Investments |
Market Neutral Income Fund Schedule of Investments October 31, 2018
| | | | | | | | | | |
NUMBER OF
SHARES | | | | | | | VALUE | |
| | COMMON STOCKS (49.2%) | |
| | | | | | Communication Services (5.0%) | |
| | 98,182 | | | | | Activision Blizzard, Inc. | | $ | 6,779,467 | |
| | 42,668 | | | | | Alphabet, Inc. - Class A~# | | | 46,532,868 | |
| | 43,265 | | | | | Alphabet, Inc. - Class C~# | | | 46,586,454 | |
| | 1,054,418 | | | | | AT&T, Inc.~ | | | 32,349,544 | |
| | 197,692 | | | | | CenturyLink, Inc.~ | | | 4,080,363 | |
| | 28,255 | | | | | Charter Communications, Inc. - Class A# | | | 9,052,054 | |
| | 697,004 | | | | | Comcast Corp. - Class A~ | | | 26,583,733 | |
| | 419,793 | | | | | Facebook, Inc. - Class A~# | | | 63,720,380 | |
| | 61,398 | | | | | Netflix, Inc.# | | | 18,528,689 | |
| | 266,045 | | | | | Twenty-First Century Fox, Inc. - Class A~ | | | 12,110,368 | |
| | 259,395 | | | | | Twitter, Inc.# | | | 9,013,976 | |
| | 602,524 | | | | | Verizon Communications, Inc.~ | | | 34,398,095 | |
| | 229,874 | | | | | Walt Disney Company~^ | | | 26,396,431 | |
| | | | | | | | | | |
| | | | | | | | | 336,132,422 | |
| | | | | | | | | | |
| | | | | | Consumer Discretionary (4.8%) | |
| | 60,010 | | | | | Amazon.com, Inc.~# | | | 95,896,580 | |
| | 97,484 | | | | | Aptiv, PLC | | | 7,486,771 | |
| | 5,579 | | | | | Booking Holdings, Inc.~# | | | 10,458,282 | |
| | 83,231 | | | | | Carnival Corp.~ | | | 4,664,265 | |
| | 158,354 | | | | | D.R. Horton, Inc.~ | | | 5,694,410 | |
| | 42,581 | | | | | Darden Restaurants, Inc.~ | | | 4,537,005 | |
| | 54,716 | | | | | Dollar General Corp.~ | | | 6,094,268 | |
| | 148,905 | | | | | eBay, Inc.# | | | 4,322,712 | |
| | 58,697 | | | | | Expedia Group, Inc. | | | 7,362,365 | |
| | 578,328 | | | | | Ford Motor Company~ | | | 5,523,032 | |
| | 154,054 | | | | | General Motors Company | | | 5,636,836 | |
| | 177,894 | | | | | Home Depot, Inc.~ | | | 31,287,997 | |
| | 111,777 | | | | | Leggett & Platt, Inc.^ | | | 4,058,623 | |
| | 136,185 | | | | | Lowe’s Companies, Inc.~ | | | 12,967,536 | |
| | 143,981 | | | | | McDonald’s Corp.~ | | | 25,470,239 | |
| | 252,812 | | | | | MGM Resorts International | | | 6,745,024 | |
| | 54,783 | | | | | Mohawk Industries, Inc.~# | | | 6,833,084 | |
| | 192,522 | | | | | Nike, Inc. - Class B~ | | | 14,446,851 | |
| | 17,510 | | | | | O’Reilly Automotive, Inc.# | | | 5,616,332 | |
| | 35,193 | | | | | PVH Corp.~ | | | 4,250,962 | |
| | 73,528 | | | | | Ross Stores, Inc.~ | | | 7,279,272 | |
| | 38,749 | | | | | Royal Caribbean Cruises, Ltd. | | | 4,058,183 | |
| | 178,579 | | | | | Starbucks Corp.~ | | | 10,405,798 | |
| | 94,483 | | | | | Tapestry, Inc.~ | | | 3,997,576 | |
| | 97,630 | | | | | Target Corp.~ | | | 8,164,797 | |
| | 114,924 | | | | | TJX Companies, Inc.~ | | | 12,627,849 | |
| | 65,893 | | | | | VF Corp. | | | 5,461,212 | |
| | | | | | | | | | |
| | | | | | | | | 321,347,861 | |
| | | | | | | | | | |
| | | | | | | | | | |
NUMBER OF
SHARES | | | | | | | VALUE | |
| | | | | | | | | | |
| | | | | | Consumer Staples (3.6%) | |
| | 299,337 | | | | | Altria Group, Inc.~ | | $ | 19,468,878 | |
| | 97,395 | | | | | Archer-Daniels-Midland Company~ | | | 4,601,914 | |
| | 92,756 | | | | | Church & Dwight Company, Inc. | | | 5,506,924 | |
| | 535,351 | | | | | Coca-Cola Company | | | 25,632,606 | |
| | 120,651 | | | | | Colgate-Palmolive Company~ | | | 7,184,767 | |
| | 24,980 | | | | | Constellation Brands, Inc. - Class A | | | 4,976,765 | |
| | 60,003 | | | | | Costco Wholesale Corp.~ | | | 13,718,486 | |
| | 131,962 | | | | | General Mills, Inc. | | | 5,779,936 | |
| | 64,795 | | | | | Kellogg Company~ | | | 4,242,777 | |
| | 61,362 | | | | | Kimberly-Clark Corp. | | | 6,400,057 | |
| | 87,148 | | | | | Kraft Heinz Company | | | 4,790,526 | |
| | 173,762 | | | | | Kroger Company | | | 5,171,157 | |
| | 337,131 | | | | | Mondelez International, Inc. - Class A | | | 14,152,759 | |
| | 75,327 | | | | | Monster Beverage Corp.# | | | 3,981,032 | |
| | 202,064 | | | | | PepsiCo, Inc.~ | | | 22,707,952 | |
| | 299,754 | | | | | Philip Morris International, Inc.~ | | | 26,399,335 | |
| | 360,916 | | | | | Procter & Gamble Company | | | 32,006,031 | |
| | 85,056 | | | | | Sysco Corp. | | | 6,067,044 | |
| | 122,420 | | | | | Walgreens Boots Alliance, Inc. | | | 9,765,443 | |
| | 209,036 | | | | | Walmart, Inc.~ | | | 20,962,130 | |
| | | | | | | | | | |
| | | | | | | | | 243,516,519 | |
| | | | | | | | | | |
| | | | | | Energy (2.8%) | |
| | 102,051 | | | | | Anadarko Petroleum Corp.~ | | | 5,429,113 | |
| | 273,990 | | | | | Chevron Corp.~ | | | 30,590,983 | |
| | 65,433 | | | | | Concho Resources, Inc.~# | | | 9,101,076 | |
| | 161,103 | | | | | ConocoPhillips~ | | | 11,261,100 | |
| | 70,215 | | | | | EOG Resources, Inc.~ | | | 7,396,448 | |
| | 512,875 | | | | | Exxon Mobil Corp.~ | | | 40,865,880 | |
| | 296,629 | | | | | Halliburton Company | | | 10,287,094 | |
| | 412,919 | | | | | Kinder Morgan, Inc. | | | 7,027,881 | |
| | 129,729 | | | | | Marathon Petroleum Corp. | | | 9,139,408 | |
| | 112,067 | | | | | Occidental Petroleum Corp. | | | 7,516,334 | |
| | 82,775 | | | | | ONEOK, Inc. | | | 5,430,040 | |
| | 58,097 | | | | | Phillips 66~ | | | 5,973,534 | |
| | 74,456 | | | | | Pioneer Natural Resources Company | | | 10,965,135 | |
| | 280,661 | | | | | Schlumberger, Ltd. | | | 14,400,716 | |
| | 68,386 | | | | | Valero Energy Corp.~ | | | 6,229,281 | |
| | 208,342 | | | | | Williams Companies, Inc. | | | 5,068,961 | |
| | | | | | | | | | |
| | | | | | | | | 186,682,984 | |
| | | | | | | | | | |
| | | | | | Financials (6.7%) | |
| | 43,737 | | | | | Affiliated Managers Group, Inc. | | | 4,971,147 | |
| | 102,635 | | | | | Aflac, Inc.~ | | | 4,420,489 | |
| | 80,072 | | | | | Allstate Corp.~ | | | 7,664,492 | |
| | 102,008 | | | | | American Express Company~ | | | 10,479,282 | |
| | | | | | |
| See accompanying Notes to Schedule of Investments | | www.calamos.com | | | 77 | |
Market Neutral Income Fund Schedule of Investments October 31, 2018
| | | | | | | | | | |
NUMBER OF
SHARES | | | | | | | VALUE | |
| | 292,772 | | | | | American International Group, Inc.~ | | $ | 12,088,556 | |
| | 100,578 | | | | | Arthur J. Gallagher & Company | | | 7,443,778 | |
| | 60,181 | | | | | Assurant, Inc. | | | 5,850,195 | |
| | 1,627,219 | | | | | Bank of America Corp.~ | | | 44,748,522 | |
| | 149,418 | | | | | Bank of New York Mellon Corp. | | | 7,071,954 | |
| | 127,047 | | | | | BB&T Corp.~ | | | 6,245,631 | |
| | 274,301 | | | | | Berkshire Hathaway, Inc. - Class B~# | | | 56,308,509 | |
| | 15,503 | | | | | BlackRock, Inc.~ | | | 6,378,244 | |
| | 207,463 | | | | | Capital One Financial Corp.~ | | | 18,526,446 | |
| | 102,980 | | | | | Cboe Global Markets, Inc. | | | 11,621,293 | |
| | 136,582 | | | | | Charles Schwab Corp.~ | | | 6,315,552 | |
| | 66,832 | | | | | Chubb Corp.~ | | | 8,347,985 | |
| | 363,633 | | | | | Citigroup, Inc.~ | | | 23,803,416 | |
| | 32,242 | | | | | CME Group, Inc. | | | 5,908,024 | |
| | 70,779 | | | | | Discover Financial Services | | | 4,931,173 | |
| | 186,515 | | | | | E*TRADE Financial Corp. | | | 9,217,571 | |
| | 182,920 | | | | | Fifth Third Bancorp~ | | | 4,937,011 | |
| | 86,917 | | | | | Goldman Sachs Group, Inc.~ | | | 19,588,484 | |
| | 531,704 | | | | | JPMorgan Chase & Company~ | | | 57,966,370 | |
| | 196,751 | | | | | KeyCorp | | | 3,572,998 | |
| | 145,559 | | | | | MetLife, Inc.~ | | | 5,995,575 | |
| | 93,145 | | | | | Morgan Stanley~ | | | 4,253,001 | |
| | 65,650 | | | | | PNC Financial Services Group, Inc.~ | | | 8,435,369 | |
| | 48,008 | | | | | Prudential Financial, Inc.~ | | | 4,502,190 | |
| | 337,106 | | | | | Regions Financial Corp.~ | | | 5,720,689 | |
| | 41,673 | | | | | S&P Global, Inc. | | | 7,597,821 | |
| | 60,333 | | | | | State Street Corp.~ | | | 4,147,894 | |
| | 83,268 | | | | | SunTrust Banks, Inc.~ | | | 5,217,573 | |
| | 53,512 | | | | | Travelers Companies, Inc.~ | | | 6,695,957 | |
| | 240,150 | | | | | US Bancorp | | | 12,552,641 | |
| | 531,258 | | | | | Wells Fargo & Company~ | | | 28,278,863 | |
| | 192,560 | | | | | Zions Bancorporation, N.A. ^ | | | 9,059,948 | |
| | | | | | | | | | |
| | | | | | | | | 450,864,643 | |
| | | | | | | | | | |
| | | | | | Health Care (7.5%) | |
| | 251,519 | | | | | Abbott Laboratories~ | | | 17,339,720 | |
| | 235,113 | | | | | AbbVie, Inc.~ | | | 18,303,547 | |
| | 42,421 | | | | | Aetna, Inc.~ | | | 8,416,326 | |
| | 176,168 | | | | | Agilent Technologies, Inc. | | | 11,413,925 | |
| | 105,732 | | | | | Alexion Pharmaceuticals, Inc.~# | | | 11,849,385 | |
| | 49,546 | | | | | Allergan, PLC | | | 7,828,764 | |
| | 52,990 | | | | | Amgen, Inc.~ | | | 10,215,942 | |
| | 188,059 | | | | | Baxter International, Inc. | | | 11,755,568 | |
| | 27,050 | | | | | Becton Dickinson and Company | | | 6,235,025 | |
| | 34,764 | | | | | Biogen, Inc.~# | | | 10,577,642 | |
| | 211,850 | | | | | Bristol-Myers Squibb Company~ | | | 10,706,899 | |
| | | | | | | | | | |
NUMBER OF
SHARES | | | | | | | VALUE | |
| | 170,217 | | | | | Celgene Corp.# | | $ | 12,187,537 | |
| | 72,814 | | | | | Cerner Corp.~# | | | 4,170,786 | |
| | 39,012 | | | | | Cigna Corp. | | | 8,341,156 | |
| | 161,541 | | | | | CVS Health Corp.~ | | | 11,693,953 | |
| | 76,405 | | | | | Danaher Corp. | | | 7,594,657 | |
| | 90,801 | | | | | Edwards Lifesciences Corp.~# | | | 13,402,228 | |
| | 120,293 | | | | | Eli Lilly and Company~ | | | 13,044,573 | |
| | 81,438 | | | | | Express Scripts Holding Company~# | | | 7,897,043 | |
| | 254,746 | | | | | Gilead Sciences, Inc. | | | 17,368,582 | |
| | 40,648 | | | | | HCA Healthcare, Inc. | | | 5,427,727 | |
| | 47,684 | | | | | Humana, Inc. | | | 15,278,431 | |
| | 17,407 | | | | | IDEXX Laboratories, Inc.# | | | 3,692,373 | |
| | 22,416 | | | | | Illumina, Inc.# | | | 6,974,738 | |
| | 11,032 | | | | | Intuitive Surgical, Inc.# | | | 5,749,658 | |
| | 422,209 | | | | | Johnson & Johnson~ | | | 59,105,038 | |
| | 44,999 | | | | | Laboratory Corp. of America Holdings~# | | | 7,224,590 | |
| | 37,478 | | | | | McKesson Corp. | | | 4,675,755 | |
| | 195,389 | | | | | Medtronic, PLC | | | 17,549,840 | |
| | 383,408 | | | | | Merck & Company, Inc. | | | 28,222,663 | |
| | 833,649 | | | | | Pfizer, Inc.~ | | | 35,896,926 | |
| | 48,784 | | | | | Quest Diagnostics, Inc.~ | | | 4,591,062 | |
| | 9,909 | | | | | Regeneron Pharmaceuticals, Inc.~# | | | 3,361,529 | |
| | 50,649 | | | | | Stryker Corp.~ | | | 8,216,281 | |
| | 44,922 | | | | | Thermo Fisher Scientific, Inc.~ | | | 10,496,025 | |
| | 170,827 | | | | | UnitedHealth Group, Inc.~ | | | 44,645,637 | |
| | 50,293 | | | | | Varian Medical Systems, Inc.# | | | 6,003,475 | |
| | 32,227 | | | | | Vertex Pharmaceuticals, Inc.# | | | 5,461,187 | |
| | 38,214 | | | | | Zimmer Biomet Holdings, Inc. | | | 4,340,728 | |
| | 49,274 | | | | | Zoetis, Inc. | | | 4,442,051 | |
| | | | | | | | | | |
| | | | | | | | | 501,698,972 | |
| | | | | | | | | | |
| | | | | | Industrials (4.4%) | |
| | 85,919 | | | | | 3M Company | | | 16,346,949 | |
| | 53,347 | | | | | Allegion, PLC^ | | | 4,573,438 | |
| | 78,045 | | | | | Boeing Company~ | | | 27,695,049 | |
| | 123,080 | | | | | Caterpillar, Inc.~ | | | 14,932,066 | |
| | 202,421 | | | | | CSX Corp.~ | | | 13,938,710 | |
| | 82,785 | | | | | Deere & Company | | | 11,212,400 | |
| | 182,999 | | | | | Delta Air Lines, Inc.~ | | | 10,015,535 | |
| | 61,440 | | | | | Eaton Corp., PLC | | | 4,403,405 | |
| | 162,836 | | | | | Emerson Electric Company~ | | | 11,053,308 | |
| | 30,786 | | | | | FedEx Corp. | | | 6,783,387 | |
| | 88,752 | | | | | Fortune Brands Home & Security, Inc. | | | 3,978,752 | |
| | 35,790 | | | | | General Dynamics Corp. | | | 6,176,638 | |
| | 106,449 | | | | | Honeywell International, Inc. | | | 15,415,944 | |
| | 51,058 | | | | | Illinois Tool Works, Inc.~ | | | 6,513,469 | |
| | | | |
| 78 | | CALAMOS OPEN-END FAMILY OF FUNDS ANNUAL REPORT | | See accompanying Notes to Schedule of Investments |
Market Neutral Income Fund Schedule of Investments October 31, 2018
| | | | | | | | | | |
NUMBER OF
SHARES | | | | | | | VALUE | |
| | 140,193 | | | | | Johnson Controls International, PLC | | $ | 4,481,970 | |
| | 29,261 | | | | | Lockheed Martin Corp. | | | 8,598,345 | |
| | 23,577 | | | | | Norfolk Southern Corp. | | | 3,956,928 | |
| | 42,470 | | | | | Northrop Grumman Corp. | | | 11,125,017 | |
| | 84,782 | | | | | PACCAR, Inc. | | | 4,850,378 | |
| | 144,081 | | | | | Pentair, PLC | | | 5,784,852 | |
| | 173,351 | | | | | Quanta Services, Inc.# | | | 5,408,551 | |
| | 67,305 | | | | | Raytheon Company | | | 11,781,067 | |
| | 1 | | | | | Resideo Technologies, Inc.# | | | 11 | |
| | 51,124 | | | | | Rockwell Collins, Inc. | | | 6,544,894 | |
| | 106,246 | | | | | Southwest Airlines Company~ | | | 5,216,679 | |
| | 59,412 | | | | | Stanley Black & Decker, Inc. | | | 6,922,686 | |
| | 11,730 | | | | | TransDigm Group, Inc.# | | | 3,873,833 | |
| | 146,293 | | | | | Union Pacific Corp.~ | | | 21,390,962 | |
| | 97,204 | | | | | United Parcel Service, Inc. - Class B | | | 10,356,114 | |
| | 88,589 | | | | | United Technologies Corp.~ | | | 11,003,640 | |
| | 55,289 | | | | | Verisk Analytics, Inc.# | | | 6,625,834 | |
| | 75,525 | | | | | Waste Management, Inc. | | | 6,757,222 | |
| | 66,874 | | | | | Xylem, Inc. | | | 4,385,597 | |
| | | | | | | | | | |
| | | | | | | | | 292,103,630 | |
| | | | | | | | | | |
| | | | | | Information Technology (10.5%) | |
| | 64,553 | | | | | Accenture, PLC - Class A~ | | | 10,174,844 | |
| | 69,552 | | | | | Adobe, Inc.# | | | 17,093,100 | |
| | 435,393 | | | | | Advanced Micro Devices, Inc.^# | | | 7,928,507 | |
| | 55,513 | | | | | Akamai Technologies, Inc.~# | | | 4,010,814 | |
| | 78,179 | | | | | Amphenol Corp. - Class A~ | | | 6,997,020 | |
| | 700,477 | | | | | Apple, Inc.~ | | | 153,306,396 | |
| | 347,393 | | | | | Applied Materials, Inc.~ | | | 11,422,282 | |
| | 40,803 | | | | | Autodesk, Inc.# | | | 5,273,788 | |
| | 58,646 | | | | | Automatic Data Processing, Inc. | | | 8,449,716 | |
| | 40,737 | | | | | Broadcom, Inc. | | | 9,104,312 | |
| | 795,519 | | | | | Cisco Systems, Inc.~ | | | 36,394,994 | |
| | 104,715 | | | | | Cognizant Technology Solutions Corp. - Class A~ | | | 7,228,476 | |
| | 52,221 | | | | | DXC Technology Company | | | 3,803,255 | |
| | 107,011 | | | | | Fiserv, Inc.# | | | 8,485,972 | |
| | 81,909 | | | | | FLIR Systems, Inc. | | | 3,793,206 | |
| | 261,645 | | | | | Hewlett Packard Enterprise Company | | | 3,990,086 | |
| | 203,775 | | | | | HP, Inc. | | | 4,919,128 | |
| | 669,404 | | | | | Intel Corp.~ | | | 31,381,660 | |
| | 63,522 | | | | | International Business Machines Corp. | | | 7,332,344 | |
| | 32,414 | | | | | Intuit, Inc. | | | 6,839,354 | |
| | 130,668 | | | | | MasterCard, Inc. - Class A | | | 25,829,144 | |
| | 94,623 | | | | | Microchip Technology, Inc.^ | | | 6,224,301 | |
| | 265,411 | | | | | Micron Technology, Inc.~# | | | 10,011,303 | |
| | 1,094,965 | | | | | Microsoft Corp.~ | | | 116,953,212 | |
| | | | | | | | | | |
NUMBER OF
SHARES | | | | | | | VALUE | |
| | 105,614 | | | | | NVIDIA Corp. | | $ | 22,266,600 | |
| | 437,984 | | | | | Oracle Corp. | | | 21,391,139 | |
| | 151,338 | | | | | PayPal Holdings, Inc.# | | | 12,741,146 | |
| | 174,325 | | | | | QUALCOMM, Inc.^ | | | 10,963,299 | |
| | 43,127 | | | | | Red Hat, Inc.~# | | | 7,402,318 | |
| | 134,961 | | | | | Salesforce.com, Inc.# | | | 18,522,048 | |
| | 243,790 | | | | | ServiceNow, Inc.# | | | 44,135,726 | |
| | 52,475 | | | | | TE Connectivity, Ltd. | | | 3,957,664 | |
| | 142,313 | | | | | Texas Instruments, Inc.~ | | | 13,210,916 | |
| | 292,290 | | | | | Visa, Inc. - Class A~ | | | 40,292,176 | |
| | 106,688 | | | | | Xilinx, Inc. | | | 9,107,955 | |
| | | | | | | | | | |
| | | | | | | | | 710,938,201 | |
| | | | | | | | | | |
| | | | | | Materials (1.0%) | |
| | 83,944 | | | | | Air Products & Chemicals, Inc.~ | | | 12,956,756 | |
| | 39,146 | | | | | Avery Dennison Corp. | | | 3,551,325 | |
| | 129,425 | | | | | Ball Corp.^ | | | 5,798,240 | |
| | 409,345 | | | | | DowDuPont, Inc. | | | 22,071,883 | |
| | 297,486 | | | | | Freeport-McMoRan, Inc. | | | 3,465,712 | |
| | 32,751 | | | | | Linde, PLC^ | | | 5,419,308 | |
| | 68,133 | | | | | PPG Industries, Inc. | | | 7,160,097 | |
| | 12,664 | | | | | Sherwin-Williams Company | | | 4,982,904 | |
| | | | | | | | | | |
| | | | | | | | | 65,406,225 | |
| | | | | | | | | | |
| | | | | | Real Estate (1.4%) | | | | |
| | 49,248 | | | | | Alexandria Real Estate Equities, Inc. | | | 6,019,583 | |
| | 56,174 | | | | | American Tower Corp.~ | | | 8,752,471 | |
| | 142,486 | | | | | Apartment Investment & Management Company - Class A | | | 6,132,597 | |
| | 16,653 | | | | | AvalonBay Communities, Inc.~ | | | 2,920,603 | |
| | 51,899 | | | | | Crown Castle International Corp. | | | 5,643,497 | |
| | 44,436 | | | | | Digital Realty Trust, Inc. | | | 4,588,461 | |
| | 10,762 | | | | | Equinix, Inc. | | | 4,076,000 | |
| | 50,610 | | | | | Federal Realty Investment Trust | | | 6,278,171 | |
| | 84,582 | | | | | Macerich Company | | | 4,366,123 | |
| | 76,282 | | | | | Prologis, Inc.~ | | | 4,917,901 | |
| | 20,597 | | | | | Public Storage~ | | | 4,232,066 | |
| | 111,380 | | | | | Realty Income Corp. | | | 6,712,873 | |
| | 61,305 | | | | | Simon Property Group, Inc. | | | 11,250,694 | |
| | 167,344 | | | | | UDR, Inc.^ | | | 6,558,211 | |
| | 81,235 | | | | | Welltower, Inc.^ | | | 5,367,196 | |
| | 181,611 | | | | | Weyerhaeuser Company | | | 4,836,301 | |
| | | | | | | | | | |
| | | | | | | | | 92,652,748 | |
| | | | | | | | | | |
| | | | | | Utilities (1.5%) | | | | |
| | 437,606 | | | | | AES Corp.~ | | | 6,380,295 | |
| | 128,180 | | | | | American Electric Power Company, Inc.~ | | | 9,403,285 | |
| | 145,448 | | | | | CMS Energy Corp.~ | | | 7,202,585 | |
| | 59,993 | | | | | Consolidated Edison, Inc. | | | 4,559,468 | |
| | | | | | |
| See accompanying Notes to Schedule of Investments | | www.calamos.com | | | 79 | |
Market Neutral Income Fund Schedule of Investments October 31, 2018
| | | | | | | | | | |
NUMBER OF
SHARES | | | | | | | VALUE | |
| | 90,712 | | | | | Dominion Energy, Inc.~^ | | $ | 6,478,651 | |
| | 161,280 | | | | | Duke Energy Corp.~ | | | 13,326,566 | |
| | 69,348 | | | | | Edison International | | | 4,812,058 | |
| | 88,119 | | | | | Entergy Corp. | | | 7,397,590 | |
| | 97,089 | | | | | Exelon Corp.~ | | | 4,253,469 | |
| | 172,172 | | | | | FirstEnergy Corp.~ | | | 6,418,572 | |
| | 59,608 | | | | | NextEra Energy, Inc. | | | 10,282,380 | |
| | 239,894 | | | | | NiSource, Inc. | | | 6,083,712 | |
| | 83,267 | | | | | PG&E Corp.# | | | 3,897,728 | |
| | 93,364 | | | | | Public Service Enterprise Group, Inc.~ | | | 4,988,439 | |
| | 147,508 | | | | | Xcel Energy, Inc. | | | 7,229,367 | |
| | | | | | | | | | |
| | | | | | | | | 102,714,165 | |
| | | | | | | | | | |
| | | | | | TOTAL COMMON STOCKS
(Cost $3,059,316,808) | | | 3,304,058,370 | |
| | | | | | | | | | |
| | | | | | | | | | |
| | EXCHANGE-TRADED FUND (4.3%) | |
| | | | | | Other (4.3%) | | | | |
| | 1,056,085 | | | | | SPDR S&P 500 ETF Trust^
(Cost $294,009,453) | | | 285,808,283 | |
| | | | | | | | | | |
| | | | | | | | | | |
NUMBER OF
CONTRACTS/
NOTIONAL
AMOUNT | | | | | | | VALUE | |
| | PURCHASED OPTIONS (0.9%)# | |
| | | | | | Communication Services (0.0%) | |
| 450
6,830,550 |
| | | | Facebook, Inc.
Call, 01/18/19, Strike $170.00 | | | 105,300 | |
| 250
7,544,500 |
| | | | Netflix, Inc.
Put, 03/15/19, Strike $310.00 | | | 881,250 | |
| 1,400
4,865,000 |
| | | | Twitter, Inc.
Call, 01/18/19, Strike $32.00 | | | 665,000 | |
| | | | | | | | | | |
| | | | | | | | | 1,651,550 | |
| | | | | | | | | | |
| | | | | | Consumer Discretionary (0.0%) | |
| 1,180
4,243,280 |
| | | | D.R. Horton, Inc.
Call, 11/16/18, Strike $43.00 | | | 7,080 | |
| 350
4,390,050 |
| | | | Expedia Group, Inc.
Call, 11/16/18, Strike $125.00 | | | 124,250 | |
| 750
13,267,500 |
| | | | McDonald’s Corp.
Call, 12/21/18, Strike $165.00 | | | 1,014,375 | |
| 1,500
4,002,000 |
| | | | MGM Resorts International
Call, 12/21/18, Strike $28.00 | | | 127,500 | |
| 500
7,675,000 |
| | EUR | | Moncler S.p.A
Call, 03/15/19, Strike 38.00 | | | 100,976 | |
| 7,500
3,645,000 |
| | | | Vipshop Holdings, Ltd.
Call, 01/18/19, Strike $12.00 | | | 18,750 | |
| | | | | | | | | | |
| | | | | | | | | 1,392,931 | |
| | | | | | | | | | |
| | | | | | Energy (0.0%) | |
| 1,250
621,250 |
| | | | Nabors Industries, Inc.
Call, 01/18/19, Strike $8.00 | | | 3,125 | |
| | | | | | | | | | |
| | | | | | | | | | |
NUMBER OF
CONTRACTS/
NOTIONAL
AMOUNT | | | | | | | VALUE | |
| | | | | | | | | | |
| | | | | | Financials (0.0%) | |
| 500
11,268,500 |
| | | | Goldman Sachs Group, Inc.
Call, 12/21/18, Strike $230.00 | | $ | 316,250 | |
| | | | | | | | | | |
| | | | | | Health Care (0.0%) | |
| | | | | | Illumina, Inc. | | | | |
| 250
7,778,750 |
| | | | Put, 12/21/18, Strike $290.00 | | | 171,250 | |
| 150
4,667,250 |
| | | | Call, 12/21/18, Strike $360.00 | | | 39,000 | |
| 300
5,083,800 |
| | | | Vertex Pharmaceuticals, Inc.
Put, 04/18/19, Strike $175.00 | | | 535,500 | |
| | | | | | | | | | |
| | | | | | | | | 745,750 | |
| | | | | | | | | | |
| | | | | | Industrials (0.0%) | |
| 350
12,420,100 |
| | | | Boeing Company
Call, 12/21/18, Strike $375.00 | | | 242,375 | |
| 1,250
4,186,250 |
| | | | Navistar International Corp.
Call, 01/18/19, Strike $35.00 | | | 300,000 | |
| | | | | | | | | | |
| | | | | | | | | 542,375 | |
| | | | | | | | | | |
| | | | | | Information Technology (0.1%) | |
| | | | | | Advanced Micro Devices, Inc. | | | | |
| 900
1,638,900 |
| | | | Call, 11/16/18, Strike $36.00 | | | 450 | |
| 900
1,638,900 |
| | | | Put, 11/16/18, Strike $28.00 | | | 879,750 | |
| 3,000
21,675,000 |
| | | | Akamai Technologies, Inc. Call, 01/18/19, Strike $70.00 | | | 1,830,000 | |
| | | | | | | | | | |
| | | | | | | | | 2,710,200 | |
| | | | | | | | | | |
| | | | | | Other (0.8%) | | | | |
| | | | | | S&P 500 Index | | | | |
| 4,500
1,220,283,000 |
| | | | Put, 12/31/18, Strike $2,700.00 | | | 32,692,500 | |
| 3,750
1,016,902,500 |
| | | | Put, 11/14/18, Strike $2,650.00 | | | 9,862,500 | |
| 3,000
813,522,000 |
| | | | Call, 11/16/18, Strike $2,900.00 | | | 270,000 | |
| 2,500
677,935,000 |
| | | | Call, 11/07/18, Strike $2,850.00 | | | 118,750 | |
| 2,500
677,935,000 |
| | | | Call, 11/16/18, Strike $2,950.00 | | | 100,000 | |
| 2,500
677,935,000 |
| | | | Put, 12/31/18, Strike $2,300.00 | | | 2,275,000 | |
| 2,000
542,348,000 |
| | | | Call, 12/31/18, Strike $2,825.00 | | | 5,500,000 | |
| 500
135,587,000 |
| | | | Put, 11/12/18, Strike $2,725.00 | | | 2,500,000 | |
| | | | | | | | | | |
| | | | | | | | | 53,318,750 | |
| | | | | | | | | | |
| | | | | | TOTAL PURCHASED OPTIONS
(Cost $70,253,393) | | | 60,680,931 | |
| | | | | | | | | | |
| | | | | | | | | | |
| | | | |
| 80 | | CALAMOS OPEN-END FAMILY OF FUNDS ANNUAL REPORT | | See accompanying Notes to Schedule of Investments |
Market Neutral Income Fund Schedule of Investments October 31, 2018
| | | | | | | | | | |
NUMBER OF
SHARES | | | | | | | VALUE | |
| | SHORT TERM INVESTMENTS (2.0%) | |
| | 65,833,786 | | | | | Fidelity Prime Money Market Fund - Institutional Class, 2.240%*** | | $ | 65,853,536 | |
| | 66,793,640 | | | | | Morgan Stanley Institutional Liquidity Funds - Government Portfolio, 2.050%*** | | | 66,793,640 | |
| | | | | | | | | | |
| | | | | | TOTAL SHORT TERM INVESTMENTS
(Cost $132,647,176) | | | 132,647,176 | |
| | | | | | | | | | |
| | | | | | | | | | |
NUMBER OF
SHARES/
PRINCIPAL
AMOUNT | | | | | | | VALUE | |
| INVESTMENT OF CASH COLLATERAL FOR SECURITIES
LOANED (6.0%) |
|
| | 188,136,315 | | | | | Fidelity Prime Money Market Fund - Institutional Class, 2.240%***† | | | 188,136,315 | |
| | 214,279,301 | | | | | State Street Navigator Securities Lending Government Money Market Portfolio† | | | 214,279,301 | |
| | | | | | | | | | |
| | | | | | TOTAL INVESTMENT OF CASH COLLATERAL FOR SECURITIES LOANED
(Cost $402,415,616) | | | 402,415,616 | |
| | | | | | | | | | |
| TOTAL INVESTMENTS (106.1%)
(Cost $6,720,047,938) | | | 7,114,528,190 | |
| | | | | | | | | | |
| |
| | PAYABLE UPON RETURN OF SECURITIES ON LOAN (-6.0%) | | | (402,415,616 | ) |
| | | | | | | | | | |
| |
| | LIABILITIES, LESS OTHER ASSETS (-0.1%) | | | (6,271,370 | ) |
| | | | | | | | | | |
| |
| | NET ASSETS (100.0%) | | $ | 6,705,841,204 | |
| | | | | | | | | | |
| | | | | | | | | | |
NUMBER OF
SHARES | | | | | | | VALUE | |
| | COMMON STOCKS SOLD SHORT (-28.7%)# | |
| | | | | | Communication Services (-1.2%) | |
| | (109,000 | ) | | | | Boingo Wireless, Inc. | | | (3,414,970 | ) |
| | (81,600 | ) | | JPY | | CyberAgent, Inc. | | | (3,472,338 | ) |
| | (83,500 | ) | | | | IAC/InterActive Corp. | | | (16,415,265 | ) |
| | (7,600 | ) | | | | Live Nation Entertainment, Inc. | | | (397,480 | ) |
| | (82,500 | ) | | | | Momo, Inc. | | | (2,769,525 | ) |
| | (203,000 | ) | | | | Sea, Ltd. | | | (2,649,150 | ) |
| | (271,400 | ) | | | | Twitter, Inc. | | | (9,431,150 | ) |
| | (29,000 | ) | | | | Weibo Corp. | | | (1,711,290 | ) |
| | (499,500 | ) | | | | World Wrestling Entertainment, Inc. - Class A | | | (36,258,705 | ) |
| | (82,900 | ) | | | | Zillow Group, Inc. - Class C | | | (3,337,554 | ) |
| | | | | | | | | | |
| | | | | | | | | (79,857,427 | ) |
| | | | | | | | | | |
| | | | | | Consumer Discretionary (-4.5%) | |
| | (539,350 | ) | | | | Alibaba Group Holding, Ltd. | | | (76,738,718 | ) |
| | (20,100 | ) | | | | Booking Holdings, Inc. | | | (37,679,058 | ) |
| | | | | | | | | | |
NUMBER OF
SHARES | | | | | | | VALUE | |
| | (138,300 | ) | | | | Chegg, Inc. | | $ | (3,772,824 | ) |
| | (220,000 | ) | | | | Ctrip.com International, Ltd. | | | (7,321,600 | ) |
| | (304,000 | ) | | | | Etsy, Inc. | | | (12,926,080 | ) |
| | (500,000 | ) | | | | Gannett Company, Inc. | | | (4,850,000 | ) |
| | (65,100 | ) | | | | LGI Homes, Inc. | | | (2,785,629 | ) |
| | (103,000 | ) | | | | Liberty Media Corp. / Liberty Formula One | | | (3,407,240 | ) |
| | (45,204 | ) | | | | MercadoLibre, Inc. | | | (14,668,698 | ) |
| | (939,000 | ) | | | | New York Times Company - Class A | | | (24,789,600 | ) |
| | (55,000 | ) | | | | RH | | | (6,364,050 | ) |
| | (1,203,222 | ) | | | | TAL Education Group | | | (34,869,374 | ) |
| | (138,594 | ) | | | | Tesla, Inc. | | | (46,750,528 | ) |
| | (90,400 | ) | | | | Wayfair, Inc. - Class A | | | (9,970,216 | ) |
| | (2,509,300 | ) | | JPY | | Yamada Denki Company, Ltd. | | | (11,832,225 | ) |
| | | | | | | | | | |
| | | | | | | | | (298,725,840 | ) |
| | | | | | | | | | |
| | | | | | Consumer Staples (-0.6%) | |
| | (509,000 | ) | | | | Herbalife Nutrition Ltd. | | | (27,109,340 | ) |
| | (2,915,031 | ) | | GBP | | J Sainsbury, PLC | | | (11,581,617 | ) |
| | | | | | | | | | |
| | | | | | | | | (38,690,957 | ) |
| | | | | | | | | | |
| | | | | | Energy (-0.3%) | |
| | (676,400 | ) | | | | Chesapeake Energy Corp. | | | (2,374,164 | ) |
| | (88,000 | ) | | | | Golar LNG, Ltd. | | | (2,356,640 | ) |
| | (364,400 | ) | | | | Renewable Energy Group, Inc. | | | (11,325,552 | ) |
| | (35,000 | ) | | | | SEACOR Holdings, Inc. | | | (1,679,650 | ) |
| | | | | | | | | | |
| | | | | | | | | (17,736,006 | ) |
| | | | | | | | | | |
| | | | | | Financials (-1.2%) | |
| | (104,397 | ) | | | | Assurant, Inc. | | | (10,148,432 | ) |
| | (816,000 | ) | | | | AXA Equitable Holdings, Inc. | | | (16,556,640 | ) |
| | (118,650 | ) | | EUR | | Eurazeo, SE | | | (8,664,710 | ) |
| | (276,100 | ) | | | | Heritage Insurance Holdings, Inc. | | | (3,854,356 | ) |
| | (88,200 | ) | | | | LendingTree, Inc. | | | (17,789,058 | ) |
| | (68,000 | ) | | | | PRA Group, Inc. | | | (2,097,120 | ) |
| | (817,300 | ) | | JPY | | SBI Holdings, Inc. | | | (21,342,163 | ) |
| | (34,000 | ) | | | | Virtus Investment Partners, Inc. | | | (3,377,560 | ) |
| | | | | | | | | | |
| | | | | | | | | (83,830,039 | ) |
| | | | | | | | | | |
| | | | | | Health Care (-4.7%) | |
| | (160,000 | ) | | | | Allscripts Healthcare Solutions, Inc. | | | (1,905,600 | ) |
| | (246,000 | ) | | | | AMAG Pharmaceuticals, Inc. | | | (5,289,000 | ) |
| | (169,000 | ) | | EUR | | Bayer, AG | | | (12,954,260 | ) |
| | (70,000 | ) | | | | Becton Dickinson and Company | | | (16,135,000 | ) |
| | (110,000 | ) | | | | DexCom, Inc. | | | (14,604,700 | ) |
| | (98,379 | ) | | | | Evolent Health, Inc. - Class A | | | (2,184,014 | ) |
| | (120,000 | ) | | | | Flexion Therapeutics, Inc. | | | (1,624,800 | ) |
| | (148,326 | ) | | | | Illumina, Inc. | | | (46,151,635 | ) |
| | (182,500 | ) | | | | Immunomedics, Inc. | | | (4,111,725 | ) |
| | (94,500 | ) | | | | Innoviva, Inc. | | | (2,293,515 | ) |
| | | | | | |
| See accompanying Notes to Schedule of Investments | | www.calamos.com | | | 81 | |
Market Neutral Income Fund Schedule of Investments October 31, 2018
| | | | | | | | | | |
NUMBER OF
SHARES | | | | | | | VALUE | |
| | (579,600 | ) | | | | Innoviva, Inc. | | $ | (8,091,216 | ) |
| | (150,431 | ) | | | | Insmed, Inc. | | | (2,196,292 | ) |
| | (231,600 | ) | | | | Insulet Corp. | | | (20,429,436 | ) |
| | (12,000 | ) | | | | Intercept Pharmaceuticals, Inc. | | | (1,152,120 | ) |
| | (128,000 | ) | | | | Invacare Corp. | | | (1,653,760 | ) |
| | (134,600 | ) | | | | Ionis Pharmaceuticals, Inc. | | | (6,669,430 | ) |
| | (342,000 | ) | | | | Ironwood Pharmaceuticals, Inc. | | | (4,480,200 | ) |
| | (22,100 | ) | | | | Ligand Pharmaceuticals, Inc. | | | (3,642,301 | ) |
| | (252,000 | ) | | | | Medicines Company | | | (5,861,520 | ) |
| | (168,040 | ) | | | | Molina Healthcare, Inc. | | | (21,302,431 | ) |
| | (182,371 | ) | | | | Neurocrine Biosciences, Inc. | | | (19,541,053 | ) |
| | (202,000 | ) | | | | NuVasive, Inc. | | | (11,346,340 | ) |
| | (37,500 | ) | | | | Pacira Pharmaceuticals, Inc. | | | (1,833,375 | ) |
| | (199,773 | ) | | | | Quidel Corp. | | | (12,857,390 | ) |
| | (63,137 | ) | | | | Retrophin, Inc. | | | (1,620,095 | ) |
| | (245,000 | ) | | | | Sarepta Therapeutics, Inc. | | | (32,771,200 | ) |
| | (114,000 | ) | | | | Supernus Pharmaceuticals, Inc. | | | (5,421,840 | ) |
| | (300,200 | ) | | | | Teladoc Health, Inc. | | | (20,815,868 | ) |
| | (500,000 | ) | | | | Teva Pharmaceutical Industries, Ltd. | | | (9,990,000 | ) |
| | (540,717 | ) | | | | Wright Medical Group, NV | | | (14,588,545 | ) |
| | | | | | | | | | |
| | | | | | | | | (313,518,661 | ) |
| | | | | | | | | | |
| | | | | | Industrials (-1.0%) | |
| | (364,918 | ) | | | | 51job, Inc. | | | (22,409,614 | ) |
| | (162,159 | ) | | | | Aerojet Rocketdyne Holdings, Inc. | | | (5,727,456 | ) |
| | (116,500 | ) | | | | Air Transport Services Group, Inc. | | | (2,283,400 | ) |
| | (1 | ) | | | | Altra Industrial Motion Corp. | | | (29 | ) |
| | (5,100 | ) | | EUR | | Dassault Aviation, SA | | | (8,462,597 | ) |
| | (101,500 | ) | | | | Fortive Corp. | | | (7,536,375 | ) |
| | (66,050 | ) | | | | FTI Consulting, Inc. | | | (4,564,716 | ) |
| | (165,000 | ) | | JPY | | Nagoya Railroad Company, Ltd. | | | (3,984,964 | ) |
| | (17,000 | ) | | | | Patrick Industries, Inc. | | | (739,670 | ) |
| | (535,000 | ) | | | | Rexnord Corp. | | | (14,343,350 | ) |
| | | | | | | | | | |
| | | | | | | | | (70,052,171 | ) |
| | | | | | | | | | |
| | | | | | Information Technology (-12.8%) | |
| | (2,373,100 | ) | | | | Advanced Micro Devices, Inc. | | | (43,214,151 | ) |
| | (148,703 | ) | | | | Altaba, Inc. | | | (8,937,050 | ) |
| | (227,500 | ) | | | | Alteryx, Inc. - Class A | | | (12,055,225 | ) |
| | (64,100 | ) | | | | Apptio, Inc. - Class A | | | (1,660,190 | ) |
| | (331,350 | ) | | | | Atlassian Corp., PLC - Class A | | | (25,152,779 | ) |
| | (115,000 | ) | | | | Avaya Holdings Corp. | | | (1,888,300 | ) |
| | (75,000 | ) | | | | Belden, Inc. | | | (4,053,750 | ) |
| | (250,231 | ) | | | | CalAmp Corp. | | | (4,989,606 | ) |
| | (238,400 | ) | | | | Carbonite, Inc. | | | (8,155,664 | ) |
| | (56,610 | ) | | | | Cardtronics, PLC - Class A | | | (1,537,528 | ) |
| | (271,966 | ) | | | | Citrix Systems, Inc. | | | (27,868,356 | ) |
| | (55,000 | ) | | | | CSG Systems International, Inc. | | | (1,930,500 | ) |
| | | | | | | | | | |
NUMBER OF
SHARES | | | | | | | VALUE | |
| | (744,000 | ) | | | | Cypress Semiconductor Corp. | | $ | (9,627,360 | ) |
| | (70,770 | ) | | | | DocuSign, Inc. | | | (2,968,094 | ) |
| | (40,000 | ) | | | | Electronics For Imaging, Inc. | | | (1,218,000 | ) |
| | (77,050 | ) | | | | Envestnet, Inc. | | | (4,008,141 | ) |
| | (69,267 | ) | | | | Euronet Worldwide, Inc. | | | (7,701,105 | ) |
| | (423,500 | ) | | | | FireEye, Inc. | | | (7,830,515 | ) |
| | (29,500 | ) | | | | Guidewire Software, Inc. | | | (2,624,615 | ) |
| | (137,000 | ) | | | | HubSpot, Inc. | | | (18,584,050 | ) |
| | (1,043,000 | ) | | | | Infinera Corp. | | | (5,778,220 | ) |
| | (104,100 | ) | | | | Inphi Corp. | | | (3,331,200 | ) |
| | (532,900 | ) | | | | Integrated Device Technology, Inc. | | | (24,945,049 | ) |
| | (676,850 | ) | | | | Intel Corp. | | | (31,730,728 | ) |
| | (278,000 | ) | | | | j2 Global, Inc. | | | (20,249,520 | ) |
| | (224,500 | ) | | | | Lumentum Holdings, Inc. | | | (12,268,925 | ) |
| | (663,000 | ) | | | | Microchip Technology, Inc. | | | (43,612,140 | ) |
| | (2,492,300 | ) | | | | Micron Technology, Inc. | | | (94,009,556 | ) |
| | (120,000 | ) | | | | MongoDB, Inc. | | | (9,780,000 | ) |
| | (190,500 | ) | | | | MTS Systems Corp. | | | (9,020,175 | ) |
| | (62,000 | ) | | | | New Relic, Inc. | | | (5,533,500 | ) |
| | (110,000 | ) | | | | Nice, Ltd. | | | (11,653,400 | ) |
| | (176,470 | ) | | | | Nuance Communications, Inc. | | | (3,068,813 | ) |
| | (163,900 | ) | | | | Nutanix, Inc. - Class A | | | (6,803,489 | ) |
| | (25,773 | ) | | | | NXP Semiconductors, NV | | | (1,932,717 | ) |
| | (295,800 | ) | | | | Okta, Inc. | | | (17,262,888 | ) |
| | (838,000 | ) | | | | ON Semiconductor Corp. | | | (14,246,000 | ) |
| | (45,100 | ) | | | | OSI Systems, Inc. | | | (3,119,116 | ) |
| | (245,800 | ) | | | | Palo Alto Networks, Inc. | | | (44,991,232 | ) |
| | (30,000 | ) | | | | Pandora Media, Inc. | | | (255,000 | ) |
| | (269,973 | ) | | | | Pure Storage, Inc. - Class A | | | (5,448,055 | ) |
| | (104,800 | ) | | | | Q2 Holdings, Inc. | | | (5,578,504 | ) |
| | (315,500 | ) | | | | Quotient Technology, Inc. | | | (4,060,485 | ) |
| | (418,800 | ) | | | | RealPage, Inc. | | | (22,196,400 | ) |
| | (125,000 | ) | | | | Red Hat, Inc. | | | (21,455,000 | ) |
| | (212,900 | ) | | | | RingCentral, Inc. - Class A | | | (16,548,717 | ) |
| | (243,795 | ) | | | | ServiceNow, Inc. | | | (44,136,647 | ) |
| | (100,600 | ) | | | | Silicon Laboratories, Inc. | | | (8,201,918 | ) |
| | (205,000 | ) | | | | Splunk, Inc. | | | (20,467,200 | ) |
| | (1,243,500 | ) | | | | Square, Inc. - Class A | | | (91,335,075 | ) |
| | (69,000 | ) | | | | Synaptics, Inc. | | | (2,590,260 | ) |
| | (119,800 | ) | | | | Teradyne, Inc. | | | (4,127,110 | ) |
| | (17,500 | ) | | | | TiVo Corp. | | | (192,500 | ) |
| | (1,348,100 | ) | | | | TTM Technologies, Inc. | | | (15,772,770 | ) |
| | (163,500 | ) | | | | Twilio, Inc. - Class A | | | (12,298,470 | ) |
| | (161,000 | ) | | | | Vishay Intertechnology, Inc. | | | (2,946,300 | ) |
| | (58,400 | ) | | | | Wix.com, Ltd. | | | (5,685,240 | ) |
| | (84,847 | ) | | | | Workday, Inc. - Class A | | | (11,286,348 | ) |
| | (116,000 | ) | | | | Zendesk, Inc. | | | (6,376,520 | ) |
| | | | | | | | | | |
| | | | | | | | | (860,300,166 | ) |
| | | | | | | | | | |
| | | | |
| 82 | | CALAMOS OPEN-END FAMILY OF FUNDS ANNUAL REPORT | | See accompanying Notes to Schedule of Investments |
Market Neutral Income Fund Schedule of Investments October 31, 2018
| | | | | | | | | | |
NUMBER OF
SHARES | | | | | | | VALUE | |
| | | | | | | | | | |
| | | | | | Materials (-0.8%) | | | | |
| | (652,000 | ) | | | | Allegheny Technologies, Inc. | | $ | (16,880,280 | ) |
| | (725,000 | ) | | GBP | | Anglo American, PLC | | | (15,473,948 | ) |
| | (106,615 | ) | | | | Arconic, Inc. | | | (2,167,483 | ) |
| | (20,000 | ) | | EUR | | Covestro, AG* | | | (1,289,776 | ) |
| | (71,000 | ) | | | | International Flavors & Fragrances, Inc. | | | (10,270,860 | ) |
| | (85,500 | ) | | | | Pretium Resources, Inc. | | | (681,435 | ) |
| | (325,000 | ) | | | | TimkenSteel Corp. | | | (3,779,750 | ) |
| | | | | | | | | | |
| | | | | | | | | (50,543,532 | ) |
| | | | | | | | | | |
| | | | | | Real Estate (-0.6%) | | | | |
| | (143,706 | ) | | | | American Homes 4 Rent - Class A | | | (3,027,886 | ) |
| | (90,000 | ) | | | | Crown Castle International Corp. | | | (9,786,600 | ) |
| | (157,700 | ) | | | | Extra Space Storage, Inc. | | | (14,202,462 | ) |
| | (504,499 | ) | | | | Invitation Homes, Inc. | | | (11,038,438 | ) |
| | (112,900 | ) | | | | iStar, Inc. | | | (1,185,450 | ) |
| | | | | | | | | | |
| | | | | | | | | (39,240,836 | ) |
| | | | | | | | | | |
| | | | | | Utilities (-1.0%) | | | | |
| | (575,000 | ) | | | | CenterPoint Energy, Inc. | | | (15,530,750 | ) |
| | (385,000 | ) | | JPY | | Chugoku Electric Power Company, Inc. | | | (4,952,134 | ) |
| | (30,000 | ) | | | | Dominion Energy, Inc. | | | (2,142,600 | ) |
| | (42,000 | ) | | | | DTE Energy Company | | | (4,720,800 | ) |
| | (188,000 | ) | | | | Sempra Energy | | | (20,702,560 | ) |
| | (114,706 | ) | | | | South Jersey Industries, Inc. | | | (3,388,415 | ) |
| | (808,480 | ) | | | | Vistra Energy Corp. | | | (18,295,903 | ) |
| | | | | | | | | | |
| | | | | | | | | (69,733,162 | ) |
| | | | | | | | | | |
| | | | | | TOTAL COMMON STOCKS SOLD SHORT
(Proceeds $1,620,440,640) | | | (1,922,228,797 | ) |
| | | | | | | | | | |
| | | | | | | | | | |
NUMBER OF
CONTRACTS/
NOTIONAL
AMOUNT | | | | | | | VALUE | |
| | WRITTEN OPTIONS (-2.3%)# | |
| | | | | | Communication Services (0.0%) | |
| | | | | | Facebook, Inc. | | | | |
| 900
13,661,100 |
| | | | Put, 11/16/18, Strike $135.00 | | | (52,200 | ) |
| 900
13,661,100 |
| | | | Call, 01/18/19, Strike $185.00 | | | (56,700 | ) |
| 450
6,830,550 |
| | | | Put, 03/15/19, Strike $120.00 | | | (120,825 | ) |
| 500
15,089,000 |
| | | | Netflix, Inc.
Put, 03/15/19, Strike $270.00 | | | (907,500 | ) |
| 2,800
9,730,000 |
| | | | Twitter, Inc.
Call, 01/18/19, Strike $36.00 | | | (728,000 | ) |
| | | | | | | | | | |
| | | | | | | | | (1,865,225 | ) |
| | | | | | | | | | |
| | | | | | | | | | |
NUMBER OF
CONTRACTS/
NOTIONAL
AMOUNT | | | | | | | VALUE | |
| | | | | | | | | | |
| | | | | | Consumer Discretionary (-0.1%) | |
| 2,360
8,486,560 |
| | | | D.R. Horton, Inc.
Call, 11/16/18, Strike $47.00 | | $ | (3,540 | ) |
| | | | | | Expedia Group, Inc. | | | | |
| 700
8,780,100 |
| | | | Call, 11/16/18, Strike $140.00 | | | (7,000 | ) |
| 350
4,390,050 |
| | | | Put, 11/16/18, Strike $100.00 | | | (1,750 | ) |
| 1,500
26,535,000 |
| | | | McDonald’s Corp.
Call, 12/21/18, Strike $175.00 | | | (885,000 | ) |
| 1,500
4,002,000 |
| | | | MGM Resorts International
Put, 01/18/19, Strike $22.00 | | | (54,000 | ) |
| | | | | | RH | | | | |
| 375
4,339,125 |
| | | | Put, 01/18/19, Strike $95.00 | | | (204,375 | ) |
| 175
2,024,925 |
| | | | Put, 01/18/19, Strike $100.00 | | | (122,500 | ) |
| 305
10,288,260 |
| | | | Tesla, Inc.
Call, 01/17/20, Strike $325.00 | | | (2,623,763 | ) |
| 7,500
3,645,000 |
| | | | Vipshop Holdings, Ltd.
Call, 01/18/19, Strike $17.00 | | | (18,750 | ) |
| | | | | | | | | | |
| | | | | | | | | (3,920,678 | ) |
| | | | | | | | | | |
| | | | | | Energy (0.0%) | | | | |
| 1,250
621,250 |
| | | | Nabors Industries, Inc.
Call, 01/18/19, Strike $12.00 | | | (3,125 | ) |
| 3,000
3,018,000 |
| | | | Oasis Petroleum, Inc.
Call, 01/17/20, Strike $12.00 | | | (510,000 | ) |
| | | | | | | | | | |
| | | | | | | | | (513,125 | ) |
| | | | | | | | | | |
| | | | | | Financials (0.0%) | |
| 1,000
22,537,000 |
| | | | Goldman Sachs Group, Inc.
Call, 12/21/18, Strike $240.00 | | | (286,500 | ) |
| | | | | | | | | | |
| | | | | | Health Care (-0.1%) | |
| | | | | | Illumina, Inc. | | | | |
| 300
9,334,500 |
| | | | Call, 12/21/18, Strike $380.00 | | | (29,250 | ) |
| 250
7,778,750 |
| | | | Put, 12/21/18, Strike $310.00 | | | (348,750 | ) |
| 3,000
6,759,000 |
| | | | Immunomedics, Inc.
Call, 01/18/19, Strike $10.00 | | | (3,990,000 | ) |
| 800
1,266,400 |
| | | | Radius Health, Inc.
Call, 01/18/19, Strike $40.00 | | | (4,000 | ) |
| | | | | | Tilray, Inc | | | | |
| 100
947,900 |
| | | | Call, 01/17/20, Strike $175.00 | | | (96,500 | ) |
| 50
473,950 |
| | | | Call, 01/15/21, Strike $185.00 | | | (70,000 | ) |
| 45
426,555 |
| | | | Call, 01/15/21, Strike $210.00 | | | (59,625 | ) |
| 600
10,167,600 |
| | | | Vertex Pharmaceuticals, Inc.
Put, 04/18/19, Strike $155.00 | | | (576,000 | ) |
| | | | | | | | | | |
| | | | | | | | | (5,174,125 | ) |
| | | | | | | | | | |
| | | | | | |
| See accompanying Notes to Schedule of Investments | | www.calamos.com | | | 83 | |
Market Neutral Income Fund Schedule of Investments October 31, 2018
| | | | | | | | | | |
NUMBER OF
CONTRACTS/
NOTIONAL
AMOUNT | | | | | | | VALUE | |
| | | | | | | | | | |
| | | | | | Industrials (0.0%) | |
| 700
24,840,200 |
| | | | Boeing Company
Call, 12/21/18, Strike $390.00 | | $ | (236,250 | ) |
| 2,500
8,372,500 |
| | | | Navistar International Corp.
Call, 01/18/19, Strike $45.00 | | | (75,000 | ) |
| | | | | | | | | | |
| | | | | | | | | (311,250 | ) |
| | | | | | | | | | |
| | | | | | Information Technology (0.0%) | |
| | | | | | Advanced Micro Devices, Inc. | | | | |
| 3,500
6,373,500 |
| | | | Put, 01/17/20, Strike $10.00 | | | (339,500 | ) |
| 1,200
2,185,200 |
| | | | Call, 11/16/18, Strike $32.00 | | | (600 | ) |
| 113
205,773 |
| | | | Put, 11/16/18, Strike $32.00 | | | (151,420 | ) |
| 6,000
43,350,000 |
| | | | Akamai Technologies, Inc.
Call, 01/18/19, Strike $80.00 | | | (1,044,000 | ) |
| 360
5,102,280 |
| | | | Lam Research Corp.
Put, 03/15/19, Strike $135.00 | | | (333,000 | ) |
| | | | | | | | | | |
| | | | | | | | | (1,868,520 | ) |
| | | | | | | | | | |
| | | | | | Other (-2.1%) | |
| | | | | | S&P 500 Index | | | | |
| 3,000
813,522,000 |
| | | | Call, 12/21/18, Strike $2,600.00 | | | (44,910,000 | )�� |
| 3,000
813,522,000 |
| | | | Call, 06/28/19, Strike $2,700.00 | | | (50,265,000 | ) |
| 2,700
732,169,800 |
| | | | Call, 12/21/18, Strike $2,700.00 | | | (21,613,500 | ) |
| 2,100
569,465,400 |
| | | | Call, 12/31/18, Strike $2,700.00 | | | (18,154,500 | ) |
| 1,000
271,174,000 |
| | | | Put, 12/31/18, Strike $2,500.00 | | | (2,505,000 | ) |
| 750
203,380,500 |
| | | | Call, 12/31/18, Strike $2,775.00 | | | (3,487,500 | ) |
| | | | | | | | | | |
| | | | | | | | | (140,935,500 | ) |
| | | | | | | | | | |
| | | | | | TOTAL WRITTEN OPTIONS
(Premium $211,332,844) | | | (154,874,923 | ) |
| | | | | | | | | | |
FORWARD FOREIGN CURRENCY CONTRACTS
| | | | | | | | | | | | | | | | |
COUNTER
PARTY | | LONG CONTRACTS | | SETTLEMENT DATE | | LOCAL CURRENCY | | | CURRENT
VALUE | | | UNREALIZED
GAIN/LOSS | |
| State Street Bank and Trust | | European Monetary Unit | | 01/24/19 | | | 4,851,000 | | | $ | 5,536,972 | | | $ | (27,925 | ) |
| Bank of New York | | Japanese Yen | | 01/24/19 | | | 588,440,000 | | | | 5,253,290 | | | | (16,217 | ) |
| | | | | | | | | | | | | | | | |
| | | | | | | | | | | | | | $ | (44,142 | ) |
| | | | | | | | | | | | | | | | |
| | | | | |
COUNTER
PARTY | | SHORT CONTRACTS | | SETTLEMENT DATE | | LOCAL CURRENCY | | | CURRENT
VALUE | | | UNREALIZED
GAIN/LOSS | |
| Northern Trust Company | | British Pound Sterling | | 01/24/19 | | | 28,387,000 | | | $ | 36,445,110 | | | $ | 1,235,567 | |
| State Street Bank and Trust | | European Monetary Unit | | 01/24/19 | | | 67,324,000 | | | | 76,844,172 | | | | 1,775,381 | |
| Bank of New York | | Japanese Yen | | 01/24/19 | | | 8,247,817,000 | | | | 73,632,266 | | | | 467,116 | |
| | | | | | | | | | | | | | | | |
| | | | | | | | | | | | | | $ | 3,478,064 | |
| | | | | | | | | | | | | | | | |
NOTES TO SCHEDULE OF INVESTMENTS
| * | Securities issued and sold pursuant to a Rule 144A transaction are excepted from the registration requirement of the Securities Act of 1933, as amended. These securities may only be sold to qualified institutional buyers (“QIBs”), such as the Fund. Any resale of these securities must generally be effected through a sale that is registered under the Act or otherwise exempted from such registration requirements. |
| ~ | Security, or portion of security, is segregated as collateral (or collateral for potential future transactions) for written options and securities sold short. The aggregate value of such securities is $1,305,259,534. |
| ^ | Security, or portion of security, is on loan. |
| § | Securities exchangeable or convertible into securities of one or more entities that are different than the issuer. Each entity is identified in the parenthetical. |
| # | Non-income producing security. |
| *** | The rate disclosed is the 7 day net yield as of October 31, 2018. |
| † | Represents investment of cash collateral received from securities on loan as of October 31, 2018. |
FOREIGN CURRENCY ABBREVIATION
| | |
| EUR | | European Monetary Unit |
| GBP | | British Pound Sterling |
| JPY | | Japanese Yen |
Note: Value for securities denominated in foreign currencies is shown in U.S. dollars. The principal amount for such securities is shown in the respective foreign currency. The date on options represents the expiration date of the option contract. The option contract may be exercised at any date on or before the date shown.
| | | | |
| 84 | | CALAMOS OPEN-END FAMILY OF FUNDS ANNUAL REPORT | | See accompanying Notes to Financial Statements |
Hedged Equity Income Fund Schedule of Investments October 31, 2018
| | | | | | | | | | |
NUMBER OF
SHARES | | | | | | | VALUE | |
| | COMMON STOCKS (96.3%) | |
| | | | | | Communication Services (10.0%) | |
| | 2,842 | | | | | Activision Blizzard, Inc. | | $ | 196,240 | |
| | 1,231 | | | | | Alphabet, Inc. - Class A#~ | | | 1,342,504 | |
| | 1,252 | | | | | Alphabet, Inc. - Class C#~ | | | 1,348,116 | |
| | 30,510 | | | | | AT&T, Inc.~ | | | 936,047 | |
| | 5,708 | | | | | CenturyLink, Inc. | | | 117,813 | |
| | 818 | | | | | Charter Communications, Inc. - Class A# | | | 262,063 | |
| | 20,282 | | | | | Comcast Corp. - Class A~ | | | 773,555 | |
| | 12,277 | | | | | Facebook, Inc. - Class A#~ | | | 1,863,526 | |
| | 1,787 | | | | | Netflix, Inc.# | | | 539,281 | |
| | 7,693 | | | | | Twenty-First Century Fox, Inc. - Class A | | | 350,185 | |
| | 5,847 | | | | | Twitter, Inc.# | | | 203,183 | |
| | 17,420 | | | | | Verizon Communications, Inc. | | | 994,508 | |
| | 6,654 | | | | | Walt Disney Company~^ | | | 764,079 | |
| | | | | | | | | | |
| | | | | | | | | 9,691,100 | |
| | | | | | | | | | |
| | | | | | Consumer Discretionary (9.5%) | |
| | 1,735 | | | | | Amazon.com, Inc.#~ | | | 2,772,547 | |
| | 2,815 | | | | | Aptiv, PLC | | | 216,192 | |
| | 160 | | | | | Booking Holdings, Inc.# | | | 299,933 | |
| | 2,493 | | | | | Carnival Corp. | | | 139,708 | |
| | 4,339 | | | | | D.R. Horton, Inc. | | | 156,030 | |
| | 1,236 | | | | | Darden Restaurants, Inc. | | | 131,696 | |
| | 1,586 | | | | | Dollar General Corp. | | | 176,649 | |
| | 4,312 | | | | | eBay, Inc.# | | | 125,177 | |
| | 1,712 | | | | | Expedia Group, Inc. | | | 214,736 | |
| | 16,770 | | | | | Ford Motor Company | | | 160,153 | |
| | 4,464 | | | | | General Motors Company | | | 163,338 | |
| | 5,145 | | | | | Home Depot, Inc.~ | | | 904,903 | |
| | 3,234 | | | | | Leggett & Platt, Inc. | | | 117,427 | |
| | 3,938 | | | | | Lowe’s Companies, Inc. | | | 374,976 | |
| | 4,187 | | | | | McDonald’s Corp.~ | | | 740,680 | |
| | 7,302 | | | | | MGM Resorts International | | | 194,817 | |
| | 1,582 | | | | | Mohawk Industries, Inc.# | | | 197,323 | |
| | 5,565 | | | | | Nike, Inc. - Class B | | | 417,598 | |
| | 506 | | | | | O’Reilly Automotive, Inc.# | | | 162,299 | |
| | 1,025 | | | | | PVH Corp. | | | 123,810 | |
| | 2,129 | | | | | Ross Stores, Inc. | | | 210,771 | |
| | 1,130 | | | | | Royal Caribbean Cruises, Ltd. | | | 118,345 | |
| | 5,163 | | | | | Starbucks Corp. | | | 300,848 | |
| | 2,733 | | | | | Tapestry, Inc. | | | 115,633 | |
| | 2,820 | | | | | Target Corp. | | | 235,837 | |
| | 3,326 | | | | | TJX Companies, Inc. | | | 365,461 | |
| | 1,905 | | | | | VF Corp. | | | 157,886 | |
| | | | | | | | | | |
| | | | | | | | | 9,294,773 | |
| | | | | | | | | | |
| | | | | | Consumer Staples (7.2%) | |
| | 8,204 | | | | | Altria Group, Inc.~ | | | 533,588 | |
| | 2,826 | | | | | Archer-Daniels-Midland Company | | | 133,528 | |
| | | | | | | | | | |
NUMBER OF
SHARES | | | | | | | VALUE | |
| | 2,524 | | | | | Church & Dwight Company, Inc. | | $ | 149,850 | |
| | 15,495 | | | | | Coca-Cola Company~ | | | 741,901 | |
| | 3,495 | | | | | Colgate-Palmolive Company | | | 208,127 | |
| | 698 | | | | | Constellation Brands, Inc. - Class A | | | 139,063 | |
| | 1,671 | | | | | Costco Wholesale Corp. | | | 382,041 | |
| | 3,816 | | | | | General Mills, Inc. | | | 167,141 | |
| | 1,876 | | | | | Kellogg Company^ | | | 122,840 | |
| | 1,772 | | | | | Kimberly-Clark Corp. | | | 184,820 | |
| | 2,375 | | | | | Kraft Heinz Company | | | 130,554 | |
| | 5,018 | | | | | Kroger Company | | | 149,336 | |
| | 9,826 | | | | | Mondelez International, Inc. - Class A | | | 412,495 | |
| | 2,179 | | | | | Monster Beverage Corp.# | | | 115,160 | |
| | 5,843 | | | | | PepsiCo, Inc.~ | | | 656,636 | |
| | 8,724 | | | | | Philip Morris International, Inc.~ | | | 768,323 | |
| | 10,442 | | | | | Procter & Gamble Company~ | | | 925,997 | |
| | 2,464 | | | | | Sysco Corp. | | | 175,757 | |
| | 3,542 | | | | | Walgreens Boots Alliance, Inc.~ | | | 282,545 | |
| | 6,046 | | | | | Walmart, Inc.~ | | | 606,293 | |
| | | | | | | | | | |
| | | | | | | | | 6,985,995 | |
| | | | | | | | | | |
| | | | | | Energy (5.5%) | |
| | 2,955 | | | | | Anadarko Petroleum Corp. | | | 157,206 | |
| | 7,929 | | | | | Chevron Corp.~ | | | 885,273 | |
| | 1,893 | | | | | Concho Resources, Inc.# | | | 263,297 | |
| | 4,664 | | | | | ConocoPhillips | | | 326,014 | |
| | 2,029 | | | | | EOG Resources, Inc. | | | 213,735 | |
| | 14,831 | | | | | Exxon Mobil Corp.~ | | | 1,181,734 | |
| | 8,635 | | | | | Halliburton Company | | | 299,462 | |
| | 11,957 | | | | | Kinder Morgan, Inc. | | | 203,508 | |
| | 3,758 | | | | | Marathon Petroleum Corp. | | | 264,751 | |
| | 3,059 | | | | | Occidental Petroleum Corp. | | | 205,167 | |
| | 2,397 | | | | | ONEOK, Inc. | | | 157,243 | |
| | 1,681 | | | | | Phillips 66 | | | 172,841 | |
| | 2,155 | | | | | Pioneer Natural Resources Company | | | 317,367 | |
| | 8,123 | | | | | Schlumberger, Ltd. | | | 416,791 | |
| | 1,815 | | | | | Valero Energy Corp.~ | | | 165,328 | |
| | 6,033 | | | | | Williams Companies, Inc. | | | 146,783 | |
| | | | | | | | | | |
| | | | | | | | | 5,376,500 | |
| | | | | | | | | | |
| | | | | | Financials (13.3%) | |
| | 1,262 | | | | | Affiliated Managers Group, Inc. | | | 143,439 | |
| | 2,478 | | | | | Aflac, Inc. | | | 106,728 | |
| | 1,903 | | | | | Allstate Corp. | | | 182,155 | |
| | 2,956 | | | | | American Express Company | | | 303,670 | |
| | 8,475 | | | | | American International Group, Inc. | | | 349,933 | |
| | 2,936 | | | | | Arthur J. Gallagher & Company | | | 217,293 | |
| | 1,751 | | | | | Assurant, Inc.~ | | | 170,215 | |
| | 47,084 | | | | | Bank of America Corp.~ | | | 1,294,810 | |
| | 4,320 | | | | | Bank of New York Mellon Corp. | | | 204,466 | |
| | 3,470 | | | | | BB&T Corp. | | | 170,585 | |
| | | | | | |
| See accompanying Notes to Schedule of Investments | | www.calamos.com | | | 85 | |
Hedged Equity Income Fund Schedule of Investments October 31, 2018
| | | | | | | | | | |
NUMBER OF
SHARES | | | | | | | VALUE | |
| | 7,936 | | | | | Berkshire Hathaway, Inc. - Class B#~ | | $ | 1,629,102 | |
| | 449 | | | | | BlackRock, Inc. | | | 184,728 | |
| | 6,017 | | | | | Capital One Financial Corp. | | | 537,318 | |
| | 2,980 | | | | | Cboe Global Markets, Inc. | | | 336,293 | |
| | 3,981 | | | | | Charles Schwab Corp. | | | 184,081 | |
| | 1,932 | | | | | Chubb Corp. | | | 241,326 | |
| | 10,588 | | | | | Citigroup, Inc.~ | | | 693,091 | |
| | 934 | | | | | CME Group, Inc. | | | 171,146 | |
| | 1,903 | | | | | Discover Financial Services | | | 132,582 | |
| | 5,403 | | | | | E*TRADE Financial Corp. | | | 267,016 | |
| | 5,013 | | | | | Fifth Third Bancorp | | | 135,301 | |
| | 2,515 | | | | | Goldman Sachs Group, Inc.~ | | | 566,806 | |
| | 15,477 | | | | | JPMorgan Chase & Company~ | | | 1,687,303 | |
| | 5,696 | | | | | KeyCorp | | | 103,439 | |
| | 4,238 | | | | | MetLife, Inc. | | | 174,563 | |
| | 2,705 | | | | | Morgan Stanley | | | 123,510 | |
| | 1,911 | | | | | PNC Financial Services Group, Inc. | | | 245,544 | |
| | 1,390 | | | | | Prudential Financial, Inc. | | | 130,354 | |
| | 9,221 | | | | | Regions Financial Corp. | | | 156,480 | |
| | 1,206 | | | | | S&P Global, Inc. | | | 219,878 | |
| | 1,636 | | | | | State Street Corp. | | | 112,475 | |
| | 2,274 | | | | | SunTrust Banks, Inc. | | | 142,489 | |
| | 1,549 | | | | | Travelers Companies, Inc. | | | 193,826 | |
| | 6,435 | | | | | US Bancorp | | | 336,358 | |
| | 15,361 | | | | | Wells Fargo & Company~ | | | 817,666 | |
| | 5,564 | | | | | Zions Bancorporation, N.A. | | | 261,786 | |
| | | | | | | | | | |
| | | | | | | | | 12,927,755 | |
| | | | | | | | | | |
| | | | | | Health Care (14.7%) | |
| | 7,283 | | | | | Abbott Laboratories~ | | | 502,090 | |
| | 6,799 | | | | | AbbVie, Inc.~ | | | 529,302 | |
| | 1,229 | | | | | Aetna, Inc.~ | | | 243,834 | |
| | 5,125 | | | | | Agilent Technologies, Inc. | | | 332,049 | |
| | 2,736 | | | | | Alexion Pharmaceuticals, Inc.# | | | 306,624 | |
| | 1,435 | | | | | Allergan, PLC | | | 226,744 | |
| | 1,024 | | | | | Amgen, Inc. | | | 197,417 | |
| | 5,443 | | | | | Baxter International, Inc. | | | 340,242 | |
| | 782 | | | | | Becton Dickinson and Company | | | 180,251 | |
| | 992 | | | | | Biogen, Inc.#~ | | | 301,836 | |
| | 6,123 | | | | | Bristol-Myers Squibb Company~ | | | 309,456 | |
| | 4,956 | | | | | Celgene Corp.# | | | 354,850 | |
| | 1,966 | | | | | Cerner Corp.# | | | 112,612 | |
| | 1,116 | | | | | Cigna Corp. | | | 238,612 | |
| | 4,668 | | | | | CVS Health Corp.~ | | | 337,916 | |
| | 2,214 | | | | | Danaher Corp. | | | 220,072 | |
| | 2,624 | | | | | Edwards Lifesciences Corp.# | | | 387,302 | |
| | 3,382 | | | | | Eli Lilly and Company | | | 366,744 | |
| | 2,346 | | | | | Express Scripts Holding Company# | | | 227,492 | |
| | 7,367 | | | | | Gilead Sciences, Inc. | | | 502,282 | |
| | | | | | | | | | |
NUMBER OF
SHARES | | | | | | | VALUE | |
| | 1,178 | | | | | HCA Healthcare, Inc. | | $ | 157,298 | |
| | 1,390 | | | | | Humana, Inc. | | | 445,370 | |
| | 503 | | | | | IDEXX Laboratories, Inc.# | | | 106,696 | |
| | 648 | | | | | Illumina, Inc.# | | | 201,625 | |
| | 319 | | | | | Intuitive Surgical, Inc.# | | | 166,256 | |
| | 12,290 | | | | | Johnson & Johnson~ | | | 1,720,477 | |
| | 1,304 | | | | | Laboratory Corp. of America Holdings# | | | 209,357 | |
| | 1,083 | | | | | McKesson Corp. | | | 135,115 | |
| | 5,656 | | | | | Medtronic, PLC | | | 508,022 | |
| | 11,092 | | | | | Merck & Company, Inc.~ | | | 816,482 | |
| | 24,103 | | | | | Pfizer, Inc.~ | | | 1,037,875 | |
| | 1,345 | | | | | Quest Diagnostics, Inc. | | | 126,578 | |
| | 287 | | | | | Regeneron Pharmaceuticals, Inc.# | | | 97,362 | |
| | 1,462 | | | | | Stryker Corp. | | | 237,166 | |
| | 1,301 | | | | | Thermo Fisher Scientific, Inc. | | | 303,979 | |
| | 4,974 | | | | | UnitedHealth Group, Inc.~ | | | 1,299,955 | |
| | 1,345 | | | | | Varian Medical Systems, Inc.# | | | 160,553 | |
| | 931 | | | | | Vertex Pharmaceuticals, Inc.#~ | | | 157,767 | |
| | 1,045 | | | | | Zimmer Biomet Holdings, Inc. | | | 118,702 | |
| | 1,421 | | | | | Zoetis, Inc. | | | 128,103 | |
| | | | | | | | | | |
| | | | | | | | | 14,352,465 | |
| | | | | | | | | | |
| | | | | | Industrials (8.7%) | |
| | 2,483 | | | | | 3M Company | | | 472,416 | |
| | 1,549 | | | | | Allegion, PLC | | | 132,796 | |
| | 2,256 | | | | | Boeing Company | | | 800,564 | |
| | 3,562 | | | | | Caterpillar, Inc. | | | 432,142 | |
| | 5,889 | | | | | CSX Corp. | | | 405,517 | |
| | 2,394 | | | | | Deere & Company | | | 324,243 | |
| | 5,335 | | | | | Delta Air Lines, Inc. | | | 291,985 | |
| | 1,648 | | | | | Eaton Corp., PLC | | | 118,112 | |
| | 4,715 | | | | | Emerson Electric Company | | | 320,054 | |
| | 897 | | | | | FedEx Corp. | | | 197,645 | |
| | 2,560 | | | | | Fortune Brands Home & Security, Inc. | | | 114,765 | |
| | 1,043 | | | | | General Dynamics Corp. | | | 180,001 | |
| | 3,079 | | | | | Honeywell International, Inc.~ | | | 445,901 | |
| | 1,486 | | | | | Illinois Tool Works, Inc. | | | 189,569 | |
| | 3,832 | | | | | Johnson Controls International, PLC | | | 122,509 | |
| | 836 | | | | | Lockheed Martin Corp. | | | 245,659 | |
| | 686 | | | | | Norfolk Southern Corp. | | | 115,131 | |
| | 1,230 | | | | | Northrop Grumman Corp. | | | 322,198 | |
| | 2,452 | | | | | PACCAR, Inc. | | | 140,279 | |
| | 4,174 | | | | | Pentair, PLC | | | 167,586 | |
| | 5,019 | | | | | Quanta Services, Inc.# | | | 156,593 | |
| | 1,947 | | | | | Raytheon Company | | | 340,806 | |
| | 1,500 | | | | | Rockwell Collins, Inc. | | | 192,030 | |
| | 3,099 | | | | | Southwest Airlines Company | | | 152,161 | |
| | 1,722 | | | | | Stanley Black & Decker, Inc. | | | 200,647 | |
| | 341 | | | | | TransDigm Group, Inc.# | | | 112,615 | |
| | | | |
| 86 | | CALAMOS OPEN-END FAMILY OF FUNDS ANNUAL REPORT | | See accompanying Notes to Schedule of Investments |
Hedged Equity Income Fund Schedule of Investments October 31, 2018
| | | | | | | | | | |
NUMBER OF
SHARES | | | | | | | VALUE | |
| | 4,255 | | | | | Union Pacific Corp.~ | | $ | 622,166 | |
| | 2,810 | | | | | United Parcel Service, Inc. - Class B~ | | | 299,377 | |
| | 2,577 | | | | | United Technologies Corp.~ | | | 320,089 | |
| | 1,599 | | | | | Verisk Analytics, Inc.# | | | 191,624 | |
| | 2,189 | | | | | Waste Management, Inc. | | | 195,850 | |
| | 1,941 | | | | | Xylem, Inc.~ | | | 127,291 | |
| | | | | | | | | | |
| | | | | | | | | 8,450,321 | |
| | | | | | | | | | |
| | | | | | Information Technology (19.8%) | |
| | 1,868 | | | | | Accenture, PLC - Class A | | | 294,434 | |
| | 2,019 | | | | | Adobe, Inc.# | | | 496,189 | |
| | 12,856 | | | | | Advanced Micro Devices, Inc.# | | | 234,108 | |
| | 1,503 | | | | | Akamai Technologies, Inc.# | | | 108,592 | |
| | 2,132 | | | | | Amphenol Corp. - Class A | | | 190,814 | |
| | 20,261 | | | | | Apple, Inc.~ | | | 4,434,322 | |
| | 10,045 | | | | | Applied Materials, Inc. | | | 330,280 | |
| | 1,189 | | | | | Autodesk, Inc.# | | | 153,678 | |
| | 1,695 | | | | | Automatic Data Processing, Inc. | | | 244,216 | |
| | 1,179 | | | | | Broadcom, Inc.~ | | | 263,495 | |
| | 23,158 | | | | | Cisco Systems, Inc.~ | | | 1,059,478 | |
| | 2,862 | | | | | Cognizant Technology Solutions Corp. - Class A | | | 197,564 | |
| | 1,509 | | | | | DXC Technology Company | | | 109,900 | |
| | 3,095 | | | | | Fiserv, Inc.# | | | 245,434 | |
| | 2,364 | | | | | FLIR Systems, Inc. | | | 109,477 | |
| | 7,553 | | | | | Hewlett Packard Enterprise Company | | | 115,183 | |
| | 5,877 | | | | | HP, Inc. | | | 141,871 | |
| | 19,356 | | | | | Intel Corp.~ | | | 907,409 | |
| | 1,848 | | | | | International Business Machines Corp. | | | 213,315 | |
| | 937 | | | | | Intuit, Inc. | | | 197,707 | |
| | 3,779 | | | | | MasterCard, Inc. - Class A~ | | | 746,995 | |
| | 2,733 | | | | | Microchip Technology, Inc.^ | | | 179,777 | |
| | 7,671 | | | | | Micron Technology, Inc.# | | | 289,350 | |
| | 31,545 | | | | | Microsoft Corp.~ | | | 3,369,321 | |
| | 3,054 | | | | | NVIDIA Corp.~ | | | 643,875 | |
| | 12,581 | | | | | Oracle Corp.~ | | | 614,456 | |
| | 4,348 | | | | | PayPal Holdings, Inc.# | | | 366,058 | |
| | 5,040 | | | | | QUALCOMM, Inc.^ | | | 316,966 | |
| | 1,247 | | | | | Red Hat, Inc.# | | | 214,035 | |
| | 3,903 | | | | | Salesforce.com, Inc.# | | | 535,648 | |
| | 1,531 | | | | | TE Connectivity, Ltd. | | | 115,468 | |
| | 4,114 | | | | | Texas Instruments, Inc. | | | 381,903 | |
| | 8,504 | | | | | Visa, Inc. - Class A~ | | | 1,172,276 | |
| | 3,109 | | | | | Xilinx, Inc. | | | 265,415 | |
| | | | | | | | | | |
| | | | | | | | | 19,259,009 | |
| | | | | | | | | | |
| | | | | | Materials (1.9%) | | | | |
| | 2,430 | | | | | Air Products & Chemicals, Inc. | | | 375,070 | |
| | 1,130 | | | | | Avery Dennison Corp. | | | 102,514 | |
| | | | | | | | | | |
NUMBER OF
SHARES | | | | | | | VALUE | |
| | 3,750 | | | | | Ball Corp.^ | | $ | 168,000 | |
| | 11,836 | | | | | DowDuPont, Inc.~ | | | 638,197 | |
| | 8,608 | | | | | Freeport-McMoRan, Inc. | | | 100,283 | |
| | 955 | | | | | Linde, PLC^ | | | 158,024 | |
| | 1,968 | | | | | PPG Industries, Inc. | | | 206,817 | |
| | 366 | | | | | Sherwin-Williams Company | | | 144,010 | |
| | | | | | | | | | |
| | | | | | | | | 1,892,915 | |
| | | | | | | | | | |
| | | | | | Real Estate (2.7%) | | | | |
| | 1,358 | | | | | Alexandria Real Estate Equities, Inc. | | | 165,988 | |
| | 1,515 | | | | | American Tower Corp. | | | 236,052 | |
| | 4,120 | | | | | Apartment Investment & Management Company - Class A | | | 177,325 | |
| | 473 | | | | | AvalonBay Communities, Inc. | | | 82,955 | |
| | 1,505 | | | | | Crown Castle International Corp. | | | 163,654 | |
| | 1,200 | | | | | Digital Realty Trust, Inc. | | | 123,912 | |
| | 279 | | | | | Equinix, Inc. | | | 105,669 | |
| | 1,464 | | | | | Federal Realty Investment Trust | | | 181,609 | |
| | 2,415 | | | | | Macerich Company | | | 124,662 | |
| | 2,079 | | | | | Prologis, Inc. | | | 134,033 | |
| | 588 | | | | | Public Storage | | | 120,817 | |
| | 3,214 | | | | | Realty Income Corp. | | | 193,708 | |
| | 1,666 | | | | | Simon Property Group, Inc. | | | 305,744 | |
| | 4,833 | | | | | UDR, Inc. | | | 189,405 | |
| | 2,353 | | | | | Welltower, Inc. | | | 155,463 | |
| | 5,256 | | | | | Weyerhaeuser Company | | | 139,967 | |
| | | | | | | | | | |
| | | | | | | | | 2,600,963 | |
| | | | | | | | | | |
| | | | | | Utilities (3.0%) | |
| | 11,872 | | | | | AES Corp. | | | 173,094 | |
| | 3,735 | | | | | American Electric Power Company, Inc.~ | | | 273,999 | |
| | 4,200 | | | | | CMS Energy Corp. | | | 207,984 | |
| | 1,747 | | | | | Consolidated Edison, Inc. | | | 132,772 | |
| | 2,619 | | | | | Dominion Energy, Inc.^ | | | 187,049 | |
| | 4,670 | | | | | Duke Energy Corp. | | | 385,882 | |
| | 1,900 | | | | | Edison International | | | 131,841 | |
| | 2,543 | | | | | Entergy Corp. | | | 213,485 | |
| | 2,646 | | | | | Exelon Corp. | | | 115,921 | |
| | 4,711 | | | | | FirstEnergy Corp. | | | 175,626 | |
| | 1,726 | | | | | NextEra Energy, Inc. | | | 297,735 | |
| | 6,952 | | | | | NiSource, Inc. | | | 176,303 | |
| | 2,274 | | | | | PG&E Corp.# | | | 106,446 | |
| | 2,717 | | | | | Public Service Enterprise Group, Inc. | | | 145,169 | |
| | 4,264 | | | | | Xcel Energy, Inc. | | | 208,979 | |
| | | | | | | | | | |
| | | | | | | | | 2,932,285 | |
| | | | | | | | | | |
| | | | | | TOTAL COMMON STOCKS
(Cost $93,313,072) | | | 93,764,081 | |
| | | | | | | | | | |
| | | | | | | | | | |
| | | | | | |
| See accompanying Notes to Schedule of Investments | | www.calamos.com | | | 87 | |
Hedged Equity Income Fund Schedule of Investments October 31, 2018
| | | | | | | | | | |
NUMBER OF
SHARES | | | | | | | VALUE | |
| | EXCHANGE-TRADED FUND (0.6%) | |
| | | | | | Other (0.6%) | |
| | 2,276 | | | | | SPDR S&P 500 ETF Trust
(Cost $599,145) | | $ | 615,954 | |
| | | | | | | | | | |
| | | | | | | | | | |
NUMBER OF
CONTRACTS/
NOTIONAL
AMOUNT | | | | | | | VALUE | |
| | PURCHASED OPTIONS (2.0%)# | |
| | | | | | Communication Services (0.1%) | |
| 16
242,864 |
| | | | Facebook, Inc.
Call, 01/18/19, Strike $170.00 | | | 3,744 | |
| 6
181,068 |
| | | | Netflix, Inc.
Put, 03/15/19, Strike $310.00 | | | 21,150 | |
| 26
90,350 |
| | | | Twitter, Inc.
Call, 01/18/19, Strike $32.00 | | | 12,350 | |
| | | | | | | | | | |
| | | | | | | | | 37,244 | |
| | | | | | | | | | |
| | | | | | Consumer Discretionary (0.0%) | |
| 19
68,324 |
| | | | D.R. Horton, Inc.
Call, 11/16/18, Strike $43.00 | | | 114 | |
| 7
87,801 |
| | | | Expedia Group, Inc.
Call, 11/16/18, Strike $125.00 | | | 2,485 | |
| 14
247,660 |
| | | | McDonald’s Corp. Call,
12/21/18, Strike $165.00 | | | 18,935 | |
| 44
117,392 |
| | | | MGM Resorts International
Call, 12/21/18, Strike $28.00 | | | 3,740 | |
| | | | | | | | | | |
| | | | | | | | | 25,274 | |
| | | | | | | | | | |
| | | | | | Financials (0.0%) | |
| 17
383,129 |
| | | | Goldman Sachs Group, Inc.
Call, 12/21/18, Strike $230.00 | | | 10,752 | |
| | | | | | | | | | |
| | | | | | Health Care (0.0%) | |
| | | | | | Illumina, Inc. | | | | |
| 7
217,805 |
| | | | Put, 12/21/18, Strike $290.00 | | | 4,795 | |
| 5
155,575 |
| | | | Call, 12/21/18, Strike $360.00 | | | 1,300 | |
| 10
169,460 |
| | | | Vertex Pharmaceuticals, Inc.
Put, 04/18/19, Strike $175.00 | | | 17,850 | |
| | | | | | | | | | |
| | | | | | | | | 23,945 | |
| | | | | | | | | | |
| | | | | | Industrials (0.0%) | |
| 11
390,346 |
| | | | Boeing Company
Call, 12/21/18, Strike $375.00 | | | 7,618 | |
| | | | | | | | | | |
| | | | | | Information Technology (0.0%) | |
| | | | | | Advanced Micro Devices, Inc. | | | | |
| 25
45,525 |
| | | | Call, 11/16/18, Strike $36.00 | | | 13 | |
| 25
45,525 |
| | | | Put, 11/16/18, Strike $28.00 | | | 24,437 | |
| | | | | | | | | | |
| | | | | | | | | 24,450 | |
| | | | | | | | | | |
| | | | | | | | | | |
NUMBER OF
CONTRACTS/
NOTIONAL
AMOUNT | | | | | | | VALUE | |
| | | | | | | | | | |
| | | | | | Other (1.9%) | | | | |
| | | | | | S&P 500 Index | | | | |
| 130
35,252,620 |
| | | | Put, 12/31/18, Strike $2,700.00 | | $ | 944,450 | |
| 125
33,896,750 |
| | | | Call, 11/16/18, Strike $2,900.00 | | | 11,250 | |
| 100
27,117,400 |
| | | | Call, 11/16/18, Strike $2,950.00 | | | 4,000 | |
| 80
21,693,920 |
| | | | Call, 12/31/18, Strike $2,825.00 | | | 220,000 | |
| 75
20,338,050 |
| | | | Call, 11/30/18, Strike $3,000.00 | | | 2,625 | |
| 65
17,626,310 |
| | | | Call, 11/30/18, Strike $2,825.00 | | | 67,600 | |
| 50
13,558,700 |
| | | | Put, 11/07/18, Strike $2,425.00 | | | 6,500 | |
| 50
13,558,700 |
| | | | Put, 12/31/18, Strike $2,675.00 | | | 318,250 | |
| 50
13,558,700 |
| | | | Put, 12/31/18, Strike $2,175.00 | | | 27,750 | |
| 40
10,846,960 |
| | | | Call, 11/07/18, Strike $2,850.00 | | | 1,900 | |
| 40
10,846,960 |
| | | | Put, 11/12/18, Strike $2,725.00 | | | 200,000 | |
| 30
8,135,220 |
| | | | Put, 12/31/18, Strike $2,300.00 | | | 27,300 | |
| | | | | | | | | | |
| | | | | | | | | 1,831,625 | |
| | | | | | | | | | |
| | | | | | TOTAL PURCHASED OPTIONS
(Cost $1,937,035) | | | 1,960,908 | |
| | | | | | | | | | |
| | | | | | | | | | |
NUMBER OF
SHARES | | | | | | | VALUE | |
| | SHORT TERM INVESTMENTS (1.7%) | |
| | 815,525 | | | | | Fidelity Prime Money Market Fund - Institutional Class, 2.240%*** | | | 815,769 | |
| | 815,780 | | | | | Morgan Stanley Institutional Liquidity Funds - Government Portfolio, 2.050%*** | | | 815,780 | |
| | | | | | | | | | |
| | | | | | TOTAL SHORT TERM INVESTMENTS
(Cost $1,631,549) | | | 1,631,549 | |
| | | | | | | | | | |
| | | | |
| 88 | | CALAMOS OPEN-END FAMILY OF FUNDS ANNUAL REPORT | | See accompanying Notes to Schedule of Investments |
Hedged Equity Income Fund Schedule of Investments October 31, 2018
| | | | | | | | | | |
NUMBER OF
SHARES/
PRINCIPAL
AMOUNT | | | | | | | VALUE | |
| INVESTMENT OF CASH COLLATERAL FOR SECURITIES
LOANED (0.6%) |
|
| | 564,146 | | | | | State Street Navigator Securities Lending Government Money Market Portfolio† (Cost $564,146) | | $ | 564,146 | |
| | | | | | | | | | |
| TOTAL INVESTMENTS (101.2%)
(Cost $98,044,947) | | | 98,536,638 | |
| | | | | | | | | | |
| |
| | PAYABLE UPON RETURN OF SECURITIES ON LOAN (-0.6%) | | | (564,146 | ) |
| | | | | | | | | | |
| |
| | LIABILITIES, LESS OTHER ASSETS (-0.6%) | | | (615,981 | ) |
| | | | | | | | | | |
| |
| | NET ASSETS (100.0%) | | $ | 97,356,511 | |
| | | | | | | | | | |
| | | | | | | | | | |
NUMBER OF
CONTRACTS/
NOTIONAL
AMOUNT | | | | | | | VALUE | |
| | WRITTEN OPTIONS (-2.4%)# | |
| | | | | | Communication Services (-0.1%) | |
| | | | | | Facebook, Inc. | | | | |
| 32
485,728 |
| | | | Call, 01/18/19, Strike $185.00 | | | (2,016 | ) |
| 20
303,580 |
| | | | Put, 11/16/18, Strike $135.00 | | | (1,160 | ) |
| 16
242,864 |
| | | | Put, 03/15/19, Strike $120.00 | | | (4,296 | ) |
| 12
362,136 |
| | | | Netflix, Inc.
Put, 03/15/19, Strike $270.00 | | | (21,780 | ) |
| 52
180,700 |
| | | | Twitter, Inc.
Call, 01/18/19, Strike $36.00 | | | (13,520 | ) |
| | | | | | | | | | |
| | | | | | | | | (42,772 | ) |
| | | | | | | | | | |
| | | | | | Consumer Discretionary (0.0%) | |
| 38
136,648 |
| | | | D.R. Horton, Inc.
Call, 11/16/18, Strike $47.00 | | | (57 | ) |
| | | | | | Expedia Group, Inc. | | | | |
| 14
175,602 |
| | | | Call, 11/16/18, Strike $140.00 | | | (140 | ) |
| 7
87,801 |
| | | | Put, 11/16/18, Strike $100.00 | | | (35 | ) |
| 28
495,320 |
| | | | McDonald’s Corp.
Call, 12/21/18, Strike $175.00 | | | (16,520 | ) |
| 44
117,392 |
| | | | MGM Resorts International
Put, 01/18/19, Strike $22.00 | | | (1,584 | ) |
| | | | | | | | | | |
| | | | | | | | | (18,336 | ) |
| | | | | | | | | | |
| | | | | | Financials (0.0%) | |
| 35
788,795 |
| | | | Goldman Sachs Group, Inc. Call, 12/21/18, Strike $240.00 | | | (10,028 | ) |
| | | | | | | | | | |
| | | | | | Health Care (0.0%) | |
| | | | | | Illumina, Inc. | | | | |
| 10
311,150 |
| | | | Call, 12/21/18, Strike $380.00 | | | (975 | ) |
| | | | | | | | | | |
NUMBER OF
CONTRACTS/
NOTIONAL
AMOUNT | | | | | | | VALUE | |
| 7
217,805 |
| | | | Put, 12/21/18, Strike $310.00 | | $ | (9,765 | ) |
| 20
338,920 |
| | | | Vertex Pharmaceuticals, Inc.
Put, 04/18/19, Strike $155.00 | | | (19,200 | ) |
| | | | | | | | | | |
| | | | | | | | | (29,940 | ) |
| | | | | | | | | | |
| | | | | | Industrials (0.0%) | |
| 22
780,692 |
| | | | Boeing Company
Call, 12/21/18, Strike $390.00 | | | (7,425 | ) |
| | | | | | | | | | |
| | | | | | Information Technology (0.0%) | |
| 34
61,914 |
| | | | Advanced Micro Devices, Inc.
Call, 11/16/18, Strike $32.00 | | | (17 | ) |
| 9
127,557 |
| | | | Lam Research Corp.
Put, 03/15/19, Strike $135.00 | | | (8,325 | ) |
| | | | | | | | | | |
| | | | | | | | | (8,342 | ) |
| | | | | | | | | | |
| | | | | | Other (-2.3%) | |
| | | | | | S&P 500 Index | | | | |
| 97
26,303,878 |
| | | | Call, 12/31/18, Strike $2,700.00 | | | (838,565 | ) |
| 75
20,338,050 |
| | | | Put, 12/31/18, Strike $2,425.00 | | | (126,750 | ) |
| 52
14,101,048 |
| | | | Call, 06/28/19, Strike $2,700.00 | | | (871,260 | ) |
| 25
6,779,350 |
| | | | Call, 12/31/18, Strike $2,775.00 | | | (116,250 | ) |
| 21
5,694,654 |
| | | | Call, 12/21/18, Strike $2,600.00 | | | (314,370 | ) |
| | | | | | | | | | |
| | | | | | | | | (2,267,195 | ) |
| | | | | | | | | | |
| | | | | | TOTAL WRITTEN OPTIONS
(Premium $3,297,666) | | $ | (2,384,038 | ) |
| | | | | | | | | | |
NOTES TO SCHEDULE OF INVESTMENTS
| # | Non-income producing security. |
| ~ | Security, or portion of security, is segregated as collateral (or collateral for potential future transactions) for written options. The aggregate value of such securities is $17,725,219. |
| ^ | Security, or portion of security, is on loan. |
| *** | The rate disclosed is the 7 day net yield as of October 31, 2018. |
| † | Represents investment of cash collateral received from securities on loan as of October 31, 2018. |
Note: The date on options represents the expiration date of the option contract. The option contract may be exercised at any date on or before the date shown.
| | | | | | |
| See accompanying Notes to Financial Statements | | www.calamos.com | | | 89 | |
Phineus Long/Short Fund Schedule of Investments October 31, 2018
| | | | | | | | | | |
NUMBER OF
SHARES | | | | | | | VALUE | |
| | COMMON STOCKS (81.6%) | |
| | | | | | Communication Services (6.4%) | |
| | 33,500 | | | | | Alphabet, Inc. - Class A#~ | | $ | 36,534,430 | |
| | 251,000 | | | | | Facebook, Inc. - Class A#~ | | | 38,099,290 | |
| | | | | | | | | | |
| | | | | | | | | 74,633,720 | |
| | | | | | | | | | |
| | | | | | Consumer Discretionary (11.9%) | |
| | 57,500 | | | EUR | | Adidas, AG | | | 13,521,925 | |
| | 5,500 | | | | | Booking Holdings, Inc.# | | | 10,310,190 | |
| | 422,500 | | | | | CarMax, Inc.#~^ | | | 28,691,975 | |
| | 186,500 | | | | | McDonald’s Corp.~ | | | 32,991,850 | |
| | 925,000 | | | | | MGM Resorts International~ | | | 24,679,000 | |
| | 146,000 | | | | | Mohawk Industries, Inc.#~ | | | 18,210,580 | |
| | 37,500 | | | | | Ulta Salon Cosmetics & Fragrance, Inc.#~ | | | 10,294,500 | |
| | | | | | | | | | |
| | | | | | | | | 138,700,020 | |
| | | | | | | | | | |
| | | | | | Financials (38.2%) | |
| | 554,000 | | | | | American International Group, Inc.~ | | | 22,874,660 | |
| | 1,482,000 | | | | | Bank of America Corp.~ | | | 40,755,000 | |
| | 345,000 | | | | | Cboe Global Markets, Inc.~ | | | 38,933,250 | |
| | 510,000 | | | | | Charles Schwab Corp. | | | 23,582,400 | |
| | 345,000 | | | | | Citigroup, Inc.~ | | | 22,583,700 | |
| | 587,800 | | | | | E*TRADE Financial Corp.~ | | | 29,049,076 | |
| | 227,500 | | | | | Goldman Sachs Group, Inc.~ | | | 51,271,675 | |
| | 1,746,000 | | | EUR | | ING Groep, NV | | | 20,656,911 | |
| | 328,000 | | | | | Intercontinental Exchange, Inc.~ | | | 25,269,120 | |
| | 510,000 | | | | | JPMorgan Chase & Company~ | | | 55,600,200 | |
| | 1,173,500 | | | | | Morgan Stanley~ | | | 53,582,010 | |
| | 2,153,000 | | | | | SLM Corp.#~ | | | 21,831,420 | |
| | 1,981,000 | | | | | UBS Group, AG#~^ | | | 27,535,900 | |
| | 300,000 | | | | | Unum Group | | | 10,878,000 | |
| | | | | | | | | | |
| | | | | | | | | 444,403,322 | |
| | | | | | | | | | |
| | | | | | Health Care (8.6%) | |
| | 138,000 | | | | | Agilent Technologies, Inc. | | | 8,941,020 | |
| | 205,000 | | | | | Alexion Pharmaceuticals, Inc.#~ | | | 22,974,350 | |
| | 166,000 | | | | | Johnson & Johnson | | | 23,238,340 | |
| | 200,000 | | | | | Laboratory Corp. of America Holdings#~ | | | 32,110,000 | |
| | 47,500 | | | | | UnitedHealth Group, Inc.~ | | | 12,414,125 | |
| | | | | | | | | | |
| | | | | | | | | 99,677,835 | |
| | | | | | | | | | |
| | | | | | Industrials (8.4%) | |
| | 331,500 | | | | | Air Lease Corp.~ | | | 12,630,150 | |
| | 712,500 | | | | | Delta Air Lines, Inc.~ | | | 38,995,125 | |
| | 346,500 | | | | | Emerson Electric Company | | | 23,520,420 | |
| | 66,000 | | | | | Raytheon Company | | | 11,552,640 | |
| | 80,000 | | | | | Union Pacific Corp.~ | | | 11,697,600 | |
| | | | | | | | | | |
| | | | | | | | | 98,395,935 | |
| | | | | | | | | | |
| | | | | | | | | | |
NUMBER OF
SHARES | | | | | | | VALUE | |
| | | | | | | | | | |
| | | | | | Information Technology (5.8%) | |
| | 719,000 | | | | | Applied Materials, Inc. | | $ | 23,640,720 | |
| | 93,000 | | | | | Ellie Mae, Inc.#^ | | | 6,164,040 | |
| | 615,000 | | | | | First Solar, Inc.#~ | | | 25,707,000 | |
| | 92,500 | | | | | Workday, Inc. - Class A# | | | 12,304,350 | |
| | | | | | | | | | |
| | | | | | | | | 67,816,110 | |
| | | | | | | | | | |
| | | | | | Materials (2.3%) | |
| | 176,500 | | | | | Air Products & Chemicals, Inc.~ | | | 27,242,775 | |
| | | | | | | | | | |
| | | | | | TOTAL COMMON STOCKS
(Cost $1,014,659,606) | | | 950,869,717 | |
| | | | | | | | | | |
| | | | | | | | | | |
| | EXCHANGE-TRADED FUNDS (8.5%) | |
| | | | | | Other (8.5%) | | | | |
| | 2,200,000 | | | | | Financial Select Sector SPDR Fund^ | | | 57,816,000 | |
| | 1,200,000 | | | | | SPDR S&P Homebuilders ETF^ | | | 40,788,000 | |
| | | | | | | | | | |
| | | | | | TOTAL EXCHANGE-TRADED FUNDS
(Cost $110,908,802) | | | 98,604,000 | |
| | | | | | | | | | |
| | | | | | | | | | |
NUMBER OF
CONTRACTS/
NOTIONAL
AMOUNT | | | | | | | VALUE | |
| | PURCHASED OPTIONS (2.7%)# | |
| | | | | | Communication Services (0.1%) | |
| 1,500
32,829,000 |
| | | | Apple, Inc.
Put, 11/02/18, Strike $210.00 | | | 363,000 | |
| 1,150
17,455,850 |
| | | | Facebook, Inc.
Call, 11/02/18, Strike $152.50 | | | 208,725 | |
| | | | | | | | | | |
| | | | | | | | | 571,725 | |
| | | | | | | | | | |
| | | | | | Consumer Discretionary (0.1%) | |
| 6,500
23,783,500 |
| | | | General Motors Company
Call, 11/16/18, Strike $35.00 | | | 1,391,000 | |
| | | | | | | | | | |
| | | | | | Consumer Staples (0.2%) | |
| | | | | | Walmart, Inc. | | | | |
| 6,600
66,184,800 |
| | | | Call, 11/16/18, Strike $100.00 | | | 2,046,000 | |
| 5,400
54,151,200 |
| | | | Call, 11/16/18, Strike $105.00 | | | 569,700 | |
| | | | | | | | | | |
| | | | | | | | | 2,615,700 | |
| | | | | | | | | | |
| | | | | | Financials (0.1%) | |
| 2,770
11,437,330 |
| | | | American International Group I
Put, 11/02/18, Strike $40.00 | | | 260,380 | |
| 2,350
9,703,150 |
| | | | American International Group, Inc.
Call, 11/16/18, Strike $50.00 | | | 12,925 | |
| 6,600
23,931,600 |
| | | | Unum Group
Call, 12/21/18, Strike $40.00 | | | 808,500 | |
| | | | | | | | | | |
| | | | | | | | | 1,081,805 | |
| | | | | | | | | | |
| | | | |
| 90 | | CALAMOS OPEN-END FAMILY OF FUNDS ANNUAL REPORT | | See accompanying Notes to Schedule of Investments |
Phineus Long/Short Fund Schedule of Investments October 31, 2018
| | | | | | | | | | |
NUMBER OF
CONTRACTS/
NOTIONAL
AMOUNT | | | | | | | VALUE | |
| | | | | | | | | | |
| | | | | | Industrials (0.0%) | |
| 2,560
11,228,160 |
| | | | Fluor Corp.
Call, 11/16/18, Strike $45.00 | | $ | 448,000 | |
| | | | | | | | | | |
| | | | | | Other (2.2%) | | | | |
| | | | | | SPDR S&P 500 ETF Trust | | | | |
| 18,500
500,665,500 |
| | | | Call, 11/07/18, Strike $275.00 | | | 2,294,000 | |
| 11,000
297,693,000 |
| | | | Call, 11/16/18, Strike $295.00 | | | 49,500 | |
| 11,000
297,693,000 |
| | | | Call, 11/16/18, Strike $300.00 | | | 27,500 | |
| 9,000
243,567,000 |
| | | | Put, 11/16/18, Strike $270.00 | | | 4,104,000 | |
| 8,500
230,035,500 |
| | | | Put, 11/16/18, Strike $287.00 | | | 14,207,750 | |
| 6,650
179,968,950 |
| | | | Put, 11/16/18, Strike $275.00 | | | 4,674,950 | |
| | | | | | | | | | |
| | | | | | | | | 25,357,700 | |
| | | | | | | | | | |
| | | | | | TOTAL PURCHASED OPTIONS
(Cost $20,066,138) | | | 31,465,930 | |
| | | | | | | | | | |
| | | | | | | | | | |
NUMBER OF
SHARES | | | | | | | VALUE | |
| | SHORT TERM INVESTMENTS (7.0%) | |
| | 40,749,876 | | | | | Fidelity Prime Money Market Fund - Institutional Class, 2.240%*** | | | 40,762,100 | |
| | 40,634,967 | | | | | Morgan Stanley Institutional Liquidity Funds - Government Portfolio, 2.050%*** | | | 40,634,967 | |
| | | | | | | | | | |
| | | | | | TOTAL SHORT TERM INVESTMENTS
(Cost $81,397,067) | | | 81,397,067 | |
| | | | | | | | | | |
| | | | | | | | | | |
NUMBER OF
SHARES/
PRINCIPAL
AMOUNT | | | | | | | VALUE | |
| INVESTMENT OF CASH COLLATERAL FOR SECURITIES
LOANED (7.9%) |
|
| | 35,466,698 | | | | | Fidelity Prime Money Market Fund - Institutional Class, 2.240%***† | | | 35,466,698 | |
| | 55,909,652 | | | | | State Street Navigator Securities Lending Government Money Market Portfolio† | | | 55,909,652 | |
| | | | | | | | | | |
| | | | | | TOTAL INVESTMENT OF
CASH COLLATERAL FOR
SECURITIES LOANED
(Cost $91,376,350) | | | 91,376,350 | |
| | | | | | | | | | |
| TOTAL INVESTMENTS (107.7%)
(Cost $1,318,407,963) | | | 1,253,713,064 | |
| | | | | | | | | | |
| |
| | PAYABLE UPON RETURN OF SECURITIES ON LOAN (-7.8%) | | | (91,376,350 | ) |
| | | | | | | | | | |
| |
| | OTHER ASSETS, LESS LIABILITIES (0.1%) | | | 2,019,270 | |
| | | | | | | | | | |
| |
| | NET ASSETS (100.0%) | | $ | 1,164,355,984 | |
| | | | | | | | | | |
| | | | | | | | | | |
NUMBER OF
SHARES | | | | | | | VALUE | |
| | COMMON STOCK SOLD SHORT (-0.8%)# | |
| | | | | | Health Care (-0.8%) | | | | |
| | (49,000 | ) | | | | Amgen, Inc.
(Proceeds $9,064,869) | | $ | (9,446,710 | ) |
| | | | | | | | | | |
| | EXCHANGE-TRADED FUNDS SOLD SHORT (-31.6%)# | |
| | | | | | Other (-31.6%) | | | | |
| | (289,000 | ) | | | | iShares Edge MSCI Min Vol USA ETF | | | (15,816,970 | ) |
| | (1,300,000 | ) | | | | SPDR S&P 500 ETF Trust | | | (351,819,000 | ) |
| | | | | | | | | | |
| | | | | | TOTAL EXCHANGE-TRADED FUNDS SOLD SHORT
(Proceeds $388,632,841) | | | (367,635,970 | ) |
| | | | | | | | | | |
| TOTAL SECURITIES SOLD SHORT (-32.4%)
(Proceeds $397,697,710) | | | (377,082,680 | ) |
| | | | | | | | | | |
NUMBER OF
CONTRACTS/
NOTIONAL
AMOUNT | | | | | | | VALUE | |
| | WRITTEN OPTIONS (-1.3%)# | |
| | | | | | Communication Services (0.0%) | |
| 1,500
32,829,000 |
| | | | Apple, Inc.
Call, 11/30/18, Strike $240.00 | | | (252,000 | ) |
| 1,150
17,455,850 |
| | | | Facebook, Inc.
Put, 11/02/18, Strike $148.00 | | | (93,150 | ) |
| | | | | | | | | | |
| | | | | | | | | (345,150 | ) |
| | | | | | | | | | |
| | | | | | Financials (-0.1%) | | | | |
| 2,770
11,437,330 |
| | | | American International Group I
Put, 12/21/18, Strike $35.00 | | | (198,055 | ) |
| 3,300
11,965,800 |
| | | | Unum Group
Put, 12/21/18, Strike $35.00 | | | (561,000 | ) |
| | | | | | | | | | |
| | | | | | | | | (759,055 | ) |
| | | | | | | | | | |
| | | | | | Industrials (0.0%) | | | | |
| 2,560
11,228,160 |
| | | | Fluor Corp.
Put, 12/21/18, Strike $37.50 | | | (185,600 | ) |
| | | | | | | | | | |
| | | | | | Other (-1.2%) | | | | |
| | | | | | SPDR S&P 500 ETF Trust | | | | |
| 26,000
703,638,000 |
| | | | Put, 12/31/18, Strike $250.00 | | | (7,150,000 | ) |
| 12,500
338,287,500 |
| | | | Call, 12/07/18, Strike $285.00 | | | (1,168,750 | ) |
| 8,500
230,035,500 |
| | | | Put, 12/31/18, Strike $260.00 | | | (3,969,500 | ) |
| 6,650
179,968,950 |
| | | | Put, 12/21/18, Strike $255.00 | | | (2,134,650 | ) |
| | | | | | | | | | |
| | | | | | | | | (14,422,900 | ) |
| | | | | | | | | | |
| | | | | | TOTAL WRITTEN OPTIONS
(Premium $12,976,517) | | $ | (15,712,705 | ) |
| | | | | | | | | | |
| | | | | | |
| See accompanying Notes to Schedule of Investments | | www.calamos.com | | | 91 | |
Phineus Long/Short Fund Schedule of Investments October 31, 2018
NOTES TO SCHEDULE OF INVESTMENTS
| # | Non-income producing security. |
| ~ | Security, or portion of security, is segregated as collateral (or collateral for potential future transactions) for written options and securities sold short. The aggregate value of such securities is $391,378,862. |
| ^ | Security, or portion of security, is on loan. |
| *** | The rate disclosed is the 7 day net yield as of October 31, 2018. |
| † | Represents investment of cash collateral received from securities on loan as of October 31, 2018. |
FOREIGN CURRENCY ABBREVIATION
| | |
| EUR | | European Monetary Unit |
Note: Value for securities denominated in foreign currencies is shown in U.S. dollars. The date on options represents the expiration date of the option contract. The option contract may be exercised at any date on or before the date shown.
| | | | |
| 92 | | CALAMOS OPEN-END FAMILY OF FUNDS ANNUAL REPORT | | See accompanying Notes to Financial Statements |
Convertible Fund Schedule of Investments October 31, 2018
| | | | | | | | | | |
PRINCIPAL
AMOUNT | | | | | | | VALUE | |
| | CONVERTIBLE BONDS (76.2%) | |
| | | | | | Communication Services (2.1%) | |
| | 6,000,000 | | | | | GCI Liberty, Inc.*
1.750%, 09/30/46 | | $ | 6,507,870 | |
| | 6,785,000 | | | | | Twitter, Inc.*
0.250%, 06/15/24 | | | 6,353,610 | |
| | | | | | | | | | |
| | | | | | | | | 12,861,480 | |
| | | | | | | | | | |
| | | | | | Consumer Discretionary (10.9%) | |
| | 8,750,000 | | | | | Booking Holdings, Inc.~
0.350%, 06/15/20 | | | 12,691,000 | |
| | 2,500,000 | | | | | Ctrip.com International, Ltd.
1.000%, 07/01/20 | | | 2,375,575 | |
| | 11,750,000 | | | | | DISH Network Corp.
2.375%, 03/15/24 | | | 9,939,795 | |
| | | | | | Liberty Media Corp. | | | | |
| | 8,380,000 | | | | | 1.375%, 10/15/23 | | | 9,751,890 | |
| | 7,178,237 | | | | | 2.250%, 09/30/46 | | | 3,845,059 | |
| | 3,250,000 | | | | | Liberty Media Corp. (Sirius XM Holdings, Inc.)*§
2.125%, 03/31/48 | | | 3,161,259 | |
| | 3,000,000 | | | | | Liberty Media Corp. / Liberty Formula One
1.000%, 01/30/23 | | | 3,256,605 | |
| | 3,000,000 | | | | | Marriott Vacations Worldwide Corp.^
1.500%, 09/15/22 | | | 2,808,180 | |
| | 5,500,000 | | | | | RH
0.000%, 07/15/20 | | | 6,282,760 | |
| | 11,500,000 | | | | | Tesla, Inc.
1.250%, 03/01/21 | | | 12,905,932 | |
| | | | | | | | | | |
| | | | | | | | | 67,018,055 | |
| | | | | | | | | | |
| | | | | | Energy (3.9%) | | | | |
| | 2,200,000 | | | | | Helix Energy Solutions Group, Inc.
4.125%, 09/15/23 | | | 2,594,108 | |
| | 4,631,000 | | | | | Oil States International, Inc.*^
1.500%, 02/15/23 | | | 4,268,995 | |
| | 5,750,000 | | | | | PDC Energy, Inc.
1.125%, 09/15/21 | | | 5,418,484 | |
| | 5,750,000 | | | | | SM Energy Company^
1.500%, 07/01/21 | | | 5,777,686 | |
| | 5,600,000 | | | | | TOTAL, SA
0.500%, 12/02/22 | | | 6,094,256 | |
| | | | | | | | | | |
| | | | | | | | | 24,153,529 | |
| | | | | | | | | | |
| | | | | | Financials (5.1%) | | | | |
| | 12,250,000 | | | | | Ares Capital Corp.^
3.750%, 02/01/22 | | | 12,422,296 | |
| | 3,015,000 | | | | | Hope Bancorp, Inc.*
2.000%, 05/15/38 | | | 2,665,516 | |
| | 2,982,000 | | | | | IAC FinanceCo, Inc.*
0.875%, 10/01/22 | | | 4,167,360 | |
| | 6,300,000 | | | | | JPMorgan Chase Bank, N.A.
0.000%, 12/30/20 | | | 6,579,625 | |
| | | | | | | | | | |
PRINCIPAL
AMOUNT | | | | | | | VALUE | |
| | 6,250,000 | | | | | JPMorgan Chase Financial Company, LLC (Voya Financial, Inc.)*§
0.250%, 05/01/23 | | $ | 5,844,688 | |
| | | | | | | | | | |
| | | | | | | | | 31,679,485 | |
| | | | | | | | | | |
| | | | | | Health Care (12.1%) | | | | |
| | 8,000,000 | | | | | BioMarin Pharmaceutical, Inc.^
1.500%, 10/15/20 | | | 9,451,720 | |
| | 3,500,000 | | | | | Evolent Health, Inc.*
1.500%, 10/15/25 | | | 3,386,302 | |
| | 3,250,000 | | | | | Exact Sciences Corp.^
1.000%, 01/15/25 | | | 3,814,297 | |
| | 2,400,000 | | | | | Flexion Therapeutics, Inc.
3.375%, 05/01/24 | | | 2,112,552 | |
| | | | | | Illumina, Inc. | | | | |
| | 4,750,000 | | | | | 0.500%, 06/15/21 | | | 6,429,149 | |
| | 1,364,000 | | | | | 0.000%, 06/15/19~ | | | 1,722,507 | |
| | | | | | Innoviva, Inc. | | | | |
| | 3,250,000 | | | | | 2.125%, 01/15/23 | | | 3,177,330 | |
| | 477,000 | | | | | 2.500%, 08/15/25 | | | 501,523 | |
| | 1,500,000 | | | | | Insmed, Inc.^
1.750%, 01/15/25 | | | 1,139,820 | |
| | 6,000,000 | | | | | Insulet Corp.*
1.375%, 11/15/24 | | | 6,798,600 | |
| | 2,370,000 | | | | | Ironwood Pharmaceuticals, Inc.^
2.250%, 06/15/22 | | | 2,504,806 | |
| | 5,540,000 | | | | | Jazz Investments I, Ltd.^
1.875%, 08/15/21 | | | 5,859,021 | |
| | 3,250,000 | | | | | Ligand Pharmaceuticals, Inc.*
0.750%, 05/15/23 | | | 3,104,416 | |
| | 1,100,000 | | | | | Medicines Company
2.500%, 01/15/22 | | | 1,068,117 | |
| | 1,600,000 | | | | | Neurocrine Biosciences, Inc.
2.250%, 05/15/24 | | | 2,459,088 | |
| | 2,575,000 | | | | | NuVasive, Inc.
2.250%, 03/15/21 | | | 2,874,820 | |
| | 3,000,000 | | | | | Pacira Pharmaceuticals, Inc.^
2.375%, 04/01/22 | | | 3,157,170 | |
| | 2,000,000 | | | | | Sarepta Therapeutics, Inc.*
1.500%, 11/15/24 | | | 3,950,540 | |
| | 2,652,000 | | | | | Supernus Pharmaceuticals, Inc.*^
0.625%, 04/01/23 | | | 2,881,942 | |
| | 3,250,000 | | | | | Teladoc Health, Inc.*
1.375%, 05/15/25 | | | 4,696,477 | |
| | 3,350,000 | | | | | Wright Medical Group, Inc.* 1.625%, 06/15/23 | | | 3,400,350 | |
| | | | | | | | | | |
| | | | | | | | | 74,490,547 | |
| | | | | | | | | | |
| | | | | | Industrials (5.2%) | | | | |
| | 3,500,000 | | | | | Air Transport Services Group, Inc.^
1.125%, 10/15/24 | | | 3,205,160 | |
| | 3,250,000 | | | | | Atlas Air Worldwide Holdings, Inc.^
2.250%, 06/01/22 | | | 3,412,841 | |
| | 4,750,000 | | | | | Dycom Industries, Inc.^
0.750%, 09/15/21 | | | 4,814,624 | |
| | | | | | |
| See accompanying Notes to Schedule of Investments | | www.calamos.com | | | 93 | |
Convertible Fund Schedule of Investments October 31, 2018
| | | | | | | | | | |
PRINCIPAL
AMOUNT | | | | | | | VALUE | |
| | 5,750,000 | | | | | Echo Global Logistics, Inc.
2.500%, 05/01/20 | | $ | 5,717,886 | |
| | 2,501,000 | | | | | FTI Consulting, Inc.*
2.000%, 08/15/23 | | | 2,383,966 | |
| | 4,500,000 | | | | | Greenbrier Companies, Inc.
2.875%, 02/01/24 | | | 4,735,980 | |
| | 2,750,000 | | | | | Meritor, Inc.
3.250%, 10/15/37 | | | 2,529,477 | |
| | 1,711,000 | | | | | Patrick Industries, Inc.*
1.000%, 02/01/23 | | | 1,451,399 | |
| | 4,100,000 | | | | | Tutor Perini Corp.
2.875%, 06/15/21 | | | 3,916,074 | |
| | | | | | | | | | |
| | | | | | | | | 32,167,407 | |
| | | | | | | | | | |
| | | | | | Information Technology (33.3%) | |
| | 2,000,000 | | | | | Advanced Micro Devices, Inc.
2.125%, 09/01/26 | | | 4,768,640 | |
| | 6,004,000 | | | | | Akamai Technologies, Inc.*
0.125%, 05/01/25 | | | 5,872,632 | |
| | 5,500,000 | | | | | Altaba, Inc.
0.000%, 12/01/18 | | | 6,188,600 | |
| | 856,000 | | | | | Apptio, Inc.*
0.875%, 04/01/23 | | | 823,074 | |
| | 3,300,000 | | | | | Atlassian, Inc.*^
0.625%, 05/01/23 | | | 3,782,889 | |
| | 3,350,000 | | | | | Avaya Holdings Corp.*
2.250%, 06/15/23 | | | 2,970,646 | |
| | 4,943,000 | | | | | Citrix Systems, Inc.~
0.500%, 04/15/19 | | | 6,997,410 | |
| | 6,900,000 | | | | | DocuSign, Inc.*^
0.500%, 09/15/23 | | | 6,468,647 | |
| | | | | | Envestnet, Inc. | | | | |
| | 3,285,000 | | | | | 1.750%, 06/01/23*^ | | | 3,302,706 | |
| | 2,750,000 | | | | | 1.750%, 12/15/19 | | | 2,846,690 | |
| | 3,250,000 | | | | | FireEye, Inc.*^
0.875%, 06/01/24 | | | 3,416,351 | |
| | 6,000,000 | | | | | Guidewire Software, Inc.
1.250%, 03/15/25 | | | 6,053,580 | |
| | 5,400,000 | | | | | II-VI, Inc.
0.250%, 09/01/22 | | | 5,558,085 | |
| | 6,100,000 | | | | | Inphi Corp.
0.750%, 09/01/21 | | | 5,709,570 | |
| | 4,250,000 | | | | | Intel Corp.~
3.250%, 08/01/39 | | | 9,740,320 | |
| | 3,750,000 | | | | | Lumentum Holdings, Inc.^ 0.250%, 03/15/24 | | | 4,277,681 | |
| | 13,750,000 | | | | | Microchip Technology, Inc.
1.625%, 02/15/27 | | | 13,031,837 | |
| | 2,500,000 | | | | | Micron Technology, Inc.
3.000%, 11/15/43 | | | 3,261,038 | |
| | 6,200,000 | | | | | New Relic, Inc.*^
0.500%, 05/01/23 | | | 6,536,784 | |
| | | | | | ON Semiconductor Corp. | | | | |
| | 5,800,000 | | | | | 1.000%, 12/01/20 | | | 6,507,107 | |
| | | | | | | | | | |
PRINCIPAL
AMOUNT | | | | | | | VALUE | |
| | 3,000,000 | | | | | 1.625%, 10/15/23^ | | $ | 3,266,670 | |
| | 3,250,000 | | | | | OSI Systems, Inc.
1.250%, 09/01/22 | | | 2,969,460 | |
| | 13,750,000 | | | | | Palo Alto Networks, Inc.*^
0.750%, 07/01/23 | | | 13,370,706 | |
| | 3,350,000 | | | | | Pure Storage, Inc.*^
0.125%, 04/15/23 | | | 3,441,070 | |
| | 1,654,000 | | | | | Q2 Holdings, Inc.*
0.750%, 02/15/23 | | | 1,820,186 | |
| | 3,150,000 | | | | | Quotient Technology, Inc.*
1.750%, 12/01/22 | | | 3,223,206 | |
| | 1,906,000 | | | | | Rapid7, Inc.*
1.250%, 08/01/23 | | | 2,094,856 | |
| | 2,000,000 | | | | | RealPage, Inc.^
1.500%, 11/15/22 | | | 2,750,870 | |
| | 2,500,000 | | | | | Silicon Laboratories, Inc.^
1.375%, 03/01/22 | | | 2,700,525 | |
| | 13,870,000 | | | | | Splunk, Inc.*
1.125%, 09/15/25 | | | 13,144,322 | |
| | 6,620,000 | | | | | Square, Inc.*^
0.500%, 05/15/23 | | | 7,933,044 | |
| | 2,620,000 | | | | | Synaptics, Inc.
0.500%, 06/15/22 | | | 2,347,166 | |
| | 2,500,000 | | | | | Twilio, Inc.*
0.250%, 06/01/23 | | | 3,124,100 | |
| | 5,500,000 | | | | | Viavi Solutions, Inc.^
1.000%, 03/01/24 | | | 5,967,060 | |
| | 6,700,000 | | | | | Wix.com, Ltd.*
0.000%, 07/01/23 | | | 6,587,473 | |
| | 14,250,000 | | | | | Workday, Inc.
0.250%, 10/01/22 | | | 15,840,799 | |
| | 6,000,000 | | | | | Zendesk, Inc.*^
0.250%, 03/15/23 | | | 6,581,250 | |
| | | | | | | | | | |
| | | | | | | | | 205,277,050 | |
| | | | | | | | | | |
| | | | | | Materials (0.6%) | |
| | 3,450,000 | | | | | Royal Gold, Inc.
2.875%, 06/15/19 | | | 3,483,120 | |
| | | | | | | | | | |
| | | | | | Real Estate (2.4%) | |
| | 3,100,000 | | | | | Empire State Realty OP, LP*
2.625%, 08/15/19 | | | 3,078,811 | |
| | 4,700,000 | | | | | IH Merger Sub, LLC
3.000%, 07/01/19 | | | 5,651,468 | |
| | 3,350,000 | | | | | Redfin Corp.
1.750%, 07/15/23 | | | 2,920,480 | |
| | 3,000,000 | | | | | Starwood Property Trust, Inc.^
4.375%, 04/01/23 | | | 3,003,675 | |
| | | | | | | | | | |
| | | | | | | | | 14,654,434 | |
| | | | | | | | | | |
| | | | | | Utilities (0.6%) | |
| | 3,250,000 | | | | | NRG Energy, Inc.*
2.750%, 06/01/48 | | | 3,381,040 | |
| | | | | | | | | | |
| | | | | | TOTAL CONVERTIBLE BONDS
(Cost $466,856,889) | | | 469,166,147 | |
| | | | | | | | | | |
| | | | |
| 94 | | CALAMOS OPEN-END FAMILY OF FUNDS ANNUAL REPORT | | See accompanying Notes to Schedule of Investments |
Convertible Fund Schedule of Investments October 31, 2018
| | | | | | | | | | |
PRINCIPAL
AMOUNT | | | | | | | VALUE | |
| | SYNTHETIC CONVERTIBLE SECURITIES (3.2%)¤ | |
| | U.S. Government and Agency Securities (2.9%) | |
| | | | | | United States Treasury Note | | | | |
| | 6,200,000 | | | | | 2.500%, 06/30/20 | | $ | 6,164,875 | |
| | 6,000,000 | | | | | 2.375%, 03/15/21 | | | 5,928,511 | |
| | 6,000,000 | | | | | 1.875%, 05/31/22 | | | 5,781,171 | |
| | | | | | | | | | |
| | | | | | TOTAL U.S. GOVERNMENT AND AGENCY SECURITIES | | | 17,874,557 | |
| | | | | | | | | | |
NUMBER OF
CONTRACTS/
NOTIONAL
AMOUNT | | | | | | | VALUE | |
| | Purchased Options (0.3%)# | |
| | | | | | Communication Services (0.1%) | | | | |
| 530
6,830,110 |
| | | | Take-Two Interactive Software, Inc.
Call, 01/18/19, Strike $130.00 | | | 604,200 | |
| | | | | | | | | | |
| | | | | | Financials (0.1%) | | | | |
| 3,000
8,250,000 |
| | | | Bank of America Corp. Call, 01/18/19, Strike $27.00 | | | 520,500 | |
| | | | | | | | | | |
| | | | | | Industrials (0.0%) | | | | |
| | | | | | Stanley Black & Decker, Inc. | | | | |
| 835
9,729,420 |
| | | | Call, 04/18/19, Strike $155.00 | | | 41,750 | |
| 420
4,893,840 |
| | | | Call, 01/18/19, Strike $170.00 | | | 3,150 | |
| | | | | | | | | | |
| | | | | | | | | 44,900 | |
| | | | | | | | | | |
| | | | | | Information Technology (0.1%) | |
| 350
6,007,400 |
| | | | Red Hat, Inc.
Call, 01/18/19, Strike $155.00 | | | 651,000 | |
| | | | | | | | | | |
| | | | | | TOTAL PURCHASED OPTIONS | | | 1,820,600 | |
| | | | | | | | | | |
| | | | | | TOTAL SYNTHETIC CONVERTIBLE SECURITIES
(Cost $21,218,690) | | | 19,695,157 | |
| | | | | | | | | | |
NUMBER OF
SHARES | | | | | | | VALUE | |
| | CONVERTIBLE PREFERRED STOCKS (14.2%) | |
| | | | | | Energy (0.9%) | | | | |
| | 86,650 | | | | | Hess Corp.
8.000%, 02/01/19 | | | 5,501,409 | |
| | | | | | | | | | |
| | | | | | Financials (5.2%) | | | | |
| | 10,300 | | | | | Bank of America Corp.
7.250%, 05/01/21 | | | 13,094,390 | |
| | 15,570 | | | | | Virtus Investment Partners, Inc.
7.250%, 02/01/20 | | | 1,419,361 | |
| | 13,900 | | | | | Wells Fargo & Company
7.500%, 11/01/24 | | | 17,680,661 | |
| | | | | | | | | | |
| | | | | | | | | 32,194,412 | |
| | | | | | | | | | |
| | | | | | | | | | |
NUMBER OF
SHARES | | | | | | | VALUE | |
| | | | | | | | | | |
| | | | | | Health Care (0.9%) | | | | |
| | 90,500 | | | | | Becton Dickinson and Company
6.125%, 05/01/20 | | $ | 5,309,635 | |
| | | | | | | | | | |
| | | | | | Industrials (1.6%) | | | | |
| | 6,050 | | | | | Fortive Corp.
5.000%, 07/01/21 | | | 5,942,370 | |
| | 65,400 | | | | | Rexnord Corp.
5.750%, 11/15/19 | | | 3,738,918 | |
| | | | | | | | | | |
| | | | | | | | | 9,681,288 | |
| | | | | | | | | | |
| | | | | | Materials (0.6%) | | | | |
| | 60,662 | | | | | International Flavors & Fragrances, Inc.
6.000% | | | 3,492,918 | |
| | | | | | | | | | |
| | | | | | Real Estate (1.6%) | | | | |
| | 6,200 | | | | | Crown Castle International Corp.
6.875%, 08/01/20 | | | 6,479,000 | |
| | 52,200 | | | | | Welltower, Inc.
6.500%, 11/15/22 | | | 3,215,520 | |
| | | | | | | | | | |
| | | | | | | | | 9,694,520 | |
| | | | | | | | | | |
| | | | | | Utilities (3.4%) | | | | |
| | 69,000 | | | | | DTE Energy Company
6.500%, 10/01/19 | | | 3,679,770 | |
| | 193,000 | | | | | NextEra Energy, Inc.^
6.123%, 09/01/19 | | | 11,194,000 | |
| | | | | | Sempra Energy | | | | |
| | 33,430 | | | | | 6.750%, 07/15/21 | | | 3,333,305 | |
| | 30,000 | | | | | 6.000%, 01/15/21 | | | 2,974,800 | |
| | | | | | | | | | |
| | | | | | | | | 21,181,875 | |
| | | | | | | | | | |
| | | | | | TOTAL CONVERTIBLE PREFERRED STOCKS
(Cost $82,879,023) | | | 87,056,057 | |
| | | | | | | | | | |
| | | | | | | | | | |
| | COMMON STOCKS (1.6%) | |
| | | | | | Health Care (1.6%) | | | | |
| | 24,945 | | | | | Anthem, Inc. | | | 6,874,094 | |
| | 21,660 | | | | | Molina Healthcare, Inc.^# | | | 2,745,838 | |
| | | | | | | | | | |
| | | | | | TOTAL COMMON STOCKS
(Cost $7,496,656) | | | 9,619,932 | |
| | | | | | | | | | |
| | | | | | | | | | |
NUMBER OF
CONTRACTS/
NOTIONAL
AMOUNT | | | | | | | VALUE | |
| | PURCHASED OPTION (0.2%) # | |
| | | | | | Consumer Discretionary (0.2%) | |
| 56
10,497,648 |
| | | | Booking Holdings, Inc.
Put, 01/18/19, Strike $2,100.00
(Cost $680,581) | | | 1,359,960 | |
| | | | | | | | | | |
| | | | | | |
| See accompanying Notes to Schedule of Investments | | www.calamos.com | | | 95 | |
Convertible Fund Schedule of Investments October 31, 2018
| | | | | | | | | | |
NUMBER OF
SHARES | | | | | | | VALUE | |
| | SHORT TERM INVESTMENTS (4.5%) | |
| | 13,865,759 | | | | | Fidelity Prime Money Market Fund - Institutional Class, 2.240%*** | | $ | 13,869,918 | |
| | 13,831,683 | | | | | Morgan Stanley Institutional Liquidity Funds - Government Portfolio, 2.050%*** | | | 13,831,683 | |
| | | | | | | | | | |
| | | | | | TOTAL SHORT TERM INVESTMENTS
(Cost $27,701,889) | | | 27,701,601 | |
| | | | | | | | | | |
| | | | | | | | | | |
NUMBER OF
SHARES/
PRINCIPAL
AMOUNT | | | | | | | VALUE | |
| INVESTMENT OF CASH COLLATERAL FOR SECURITIES
LOANED (9.6%) |
|
| | 43,488,274 | | | | | Fidelity Prime Money Market Fund - Institutional Class, 2.240%***† | | | 43,488,274 | |
| | 15,671,174 | | | | | State Street Navigator Securities Lending Government Money Market Portfolio† | | | 15,671,174 | |
| | | | | | | | | | |
| | | | | | TOTAL INVESTMENT OF
CASH COLLATERAL FOR
SECURITIES LOANED
(Cost $59,159,448) | | | 59,159,448 | |
| | | | | | | | | | |
| TOTAL INVESTMENTS (109.5%)
(Cost $665,993,176) | | | 673,758,302 | |
| | | | | | | | | | |
| |
| | PAYABLE UPON RETURN OF SECURITIES ON LOAN (-9.6%) | | | (59,159,448 | ) |
| | | | | | | | | | |
| |
| | OTHER ASSETS, LESS LIABILITIES (0.2%) | | | 942,315 | |
| | | | | | | | | | |
| |
| | NET ASSETS (100.0%) | | $ | 615,541,169 | |
| | | | | | | | | | |
| | | | | | | | | | |
NUMBER OF
CONTRACTS/
NOTIONAL
AMOUNT | | | | | | | VALUE | |
| | WRITTEN OPTION (-0.1%) # | |
| | | | | | Consumer Discretionary (-0.1%) | |
| 56
10,497,648 |
| | | | Booking Holdings, Inc.
Put, 01/18/19, Strike $1,850.00
(Premium $246,215) | | $ | (509,320 | ) |
| | | | | | | | | | |
FORWARD FOREIGN CURRENCY CONTRACTS
| | | | | | | | | | | | | | | | |
COUNTER
PARTY | | LONG CONTRACTS | | SETTLEMENT DATE | | LOCAL CURRENCY | | | CURRENT
VALUE | | | UNREALIZED
GAIN/LOSS | |
| State Street Bank and Trust | | European Monetary Unit | | 01/24/19 | | | 563,000 | | | $ | 642,613 | | | $ | (3,241 | ) |
| State Street Bank and Trust | | European Monetary Unit | | 01/24/19 | | | 374,000 | | | | 426,887 | | | | (6,273 | ) |
| Northern Trust Company | | Hong Kong Dollar | | 01/24/19 | | | 865,000 | | | | 110,524 | | | | (10 | ) |
| | | | | | | | | | | | | | | | |
| | | | | | | | | | | | | | $ | (9,524 | ) |
| | | | | | | | | | | | | | | | |
| | | | | |
COUNTER
PARTY | | SHORT CONTRACTS | | SETTLEMENT DATE | | LOCAL CURRENCY | | | CURRENT
VALUE | | | UNREALIZED
GAIN/LOSS | |
| State Street Bank and Trust | | European Monetary Unit | | 01/24/19 | | | 3,205,000 | | | $ | 3,658,214 | | | $ | 84,518 | |
| Bank of New York | | Hong Kong Dollar | | 01/24/19 | | | 10,369,000 | | | | 1,324,882 | | | | (104 | ) |
| Bank of New York | | Hong Kong Dollar | | 01/24/19 | | | 13,853,000 | | | | 1,770,045 | | | | 413 | |
| | | | | | | | | | | | | | | | |
| | | | | | | | | | | | | | $ | 84,827 | |
| | | | | | | | | | | | | | | | |
NOTES TO SCHEDULE OF INVESTMENTS
| * | Securities issued and sold pursuant to a Rule 144A transaction are excepted from the registration requirement of the Securities Act of 1933, as amended. These securities may only be sold to qualified institutional buyers (“QIBs”), such as the Fund. Any resale of these securities must generally be effected through a sale that is registered under the Act or otherwise exempted from such registration requirements. |
| ~ | Security, or portion of security, is segregated as collateral (or collateral for potential future transactions) for written options. The aggregate value of such securities is $6,421. |
| § | Securities exchangeable or convertible into securities of one or more entities that are different than the issuer. Each entity is identified in the parenthetical. |
| ^ | Security, or portion of security, is on loan. |
| ¤ | The synthetic convertible securities strategy combines separate securities that together possess the economic characteristics similar to a convertible security. |
| # | Non-income producing security. |
| *** | The rate disclosed is the 7 day net yield as of October 31, 2018. |
| † | Represents investment of cash collateral received from securities on loan as of October 31, 2018. |
Note: The date on options represents the expiration date of the option contract. The option contract may be exercised at any date on or before the date shown.
| | | | |
| 96 | | CALAMOS OPEN-END FAMILY OF FUNDS ANNUAL REPORT | | See accompanying Notes to Financial Statements |
Global Convertible Fund Schedule of Investments October 31, 2018
| | | | | | | | | | |
PRINCIPAL
AMOUNT | | | | | | | VALUE | |
| | CONVERTIBLE BONDS (74.8%) | |
| | | | | | Communication Services (4.9%) | |
| | 2,300,000 | | | EUR | | America Movil, SAB de CV 0.000%, 05/28/20 | | $ | 2,575,124 | |
| | | | | | CyberAgent, Inc. | | | | |
| | 60,000,000 | | | JPY | | 0.000%, 02/17/23 | | | 579,998 | |
| | 60,000,000 | | | JPY | | 0.000%, 02/19/25 | | | 591,293 | |
| | 1,285,000 | | | | | GCI Liberty, Inc.* 1.750%, 09/30/46 | | | 1,393,769 | |
| | 790,000 | | | | | Momo, Inc.* 1.250%, 07/01/25 | | | 693,189 | |
| | 350,000 | | | | | Twitter, Inc.* 0.250%, 06/15/24 | | | 327,747 | |
| | 523,000 | | | | | Weibo Corp.*^ 1.250%, 11/15/22 | | | 467,115 | |
| | | | | | | | | | |
| | | | | | | | | 6,628,235 | |
| | | | | | | | | | |
| | | Consumer Discretionary (9.8%) | | | | |
| | 1,000,000 | | | | | Cie Generale des Etablissements Michelin, SCA 0.000%, 01/10/22 | | | 931,520 | |
| | | | | | Ctrip.com International, Ltd. | | | | |
| | 1,610,000 | | | | | 1.250%, 09/15/22^ | | | 1,559,760 | |
| | 690,000 | | | | | 1.000%, 07/01/20 | | | 655,659 | |
| | 1,210,000 | | | | | DISH Network Corp. 3.375%, 08/15/26 | | | 1,082,387 | |
| | 60,000,000 | | | JPY | | Iida Group Holdings Company, Ltd. 0.000%, 06/18/20 | | | 535,943 | |
| | 425,000 | | | | | Liberty Expedia Holdings, Inc.*^ 1.000%, 06/30/47 | | | 424,513 | |
| | 745,000 | | | | | Liberty Media Corp. 1.375%, 10/15/23 | | | 866,964 | |
| | 695,000 | | | | | Liberty Media Corp. (Sirius XM Holdings, Inc.)*§ 2.125%, 03/31/48 | | | 676,023 | |
| | 510,000 | | | | | Marriott Vacations Worldwide Corp. 1.500%, 09/15/22 | | | 477,391 | |
| | 680,000 | | | | | RH* 0.000%, 06/15/23 | | | 600,525 | |
| | 436,000 | | | EUR | | SEB, SA 0.000%, 11/17/21 | | | 928,297 | |
| | 470,000 | | | | | Shanghai Port Group BVI Holding Company, Ltd. 0.000%, 08/09/22 | | | 481,130 | |
| | 900,000 | | | EUR | | Steinhoff Finance Holding Company 1.250%, 10/21/23 | | | 504,152 | |
| | | | | | Tesla, Inc. | | | | |
| | 2,001,000 | | | | | 1.250%, 03/01/21^ | | | 2,245,632 | |
| | 365,000 | | | | | 2.375%, 03/15/22 | | | 444,986 | |
| | 1,000,000 | | | | | Valeo, SA 0.000%, 06/16/21 | | | 899,305 | |
| | | | | | | | | | |
| | | | | | | | | 13,314,187 | |
| | | | | | | | | | |
| | | | | | Consumer Staples (2.0%) | |
| | 3,000,000 | | | | | Carrefour, SA 0.000%, 03/27/24 | | | 2,802,105 | |
| | | | | | | | | | |
| | | | | | | | | | |
PRINCIPAL
AMOUNT | | | | | | | VALUE | |
| | | | | | | | | | |
| | | | | | Energy (4.8%) | |
| | 405,000 | | | | | Nabors Industries, Inc.^ 0.750%, 01/15/24 | | $ | 302,359 | |
| | 450,000 | | | | | SM Energy Company 1.500%, 07/01/21 | | | 452,167 | |
| | 4,000,000 | | | | | TOTAL, SA 0.500%, 12/02/22 | | | 4,353,040 | |
| | 800,000 | | | | | Tullow Oil Jersey, Ltd. 6.625%, 07/12/21 | | | 958,344 | |
| | 480,000 | | | | | Whiting Petroleum Corp. 1.250%, 04/01/20 | | | 458,695 | |
| | | | | | | | | | |
| | | | | | | | | 6,524,605 | |
| | | | | | | | | | |
| | | | | | Financials (8.2%) | |
| | 95,000,000 | | | JPY | | AEON Financial Service Company, Ltd. 0.000%, 09/13/19 | | | 871,376 | |
| | 1,700,000 | | | EUR | | AURELIUS Equity Opportunities SE & Co. KGaA 1.000%, 12/01/20 | | | 1,964,545 | |
| | 2,700,000 | | | EUR | | Corestate Capital Holding, SA 1.375%, 11/28/22 | | | 2,974,317 | |
| | 1,789,500 | | | EUR | | Credit Agricole, SA 0.000%, 10/03/19 | | | 1,503,690 | |
| | 700,000 | | | EUR | | Cromwell SPV Finance Pty, Ltd. 2.000%, 02/04/20 | | | 791,289 | |
| | 2,000,000 | | | HKD | | Haitong International Securities Group, Ltd. 0.000%, 10/25/21 | | | 245,550 | |
| | 250,000 | | | | | IAC FinanceCo, Inc.* 0.875%, 10/01/22 | | | 349,376 | |
| | 900,000 | | | EUR | | LEG Immobilien, AG 0.875%, 09/01/25 | | | 1,109,713 | |
| | 50,000,000 | | | JPY | | Mitsubishi Chemical Holdings Corp. 0.000%, 03/29/24 | | | 458,043 | |
| | 900,000 | | | | | Yamaguchi Financial Group, Inc.‡ 1.874%, 03/26/20 3 mo. USD LIBOR - 0.50% | | | 905,080 | |
| | | | | | | | | | |
| | | | | | | | | 11,172,979 | |
| | | | | | | | | | |
| | | | | | Health Care (5.7%) | |
| | 1,100,000 | | | EUR | | Bayer Capital Corp., BV 5.625%, 11/22/19 | | | 1,041,149 | |
| | 900,000 | | | EUR | | Bayer, AG 0.050%, 06/15/20 | | | 1,055,222 | |
| | 705,000 | | | | | BioMarin Pharmaceutical, Inc.^ 1.500%, 10/15/20 | | | 832,933 | |
| | 500,000 | | | EUR | | GN Store Nord, A/S 0.000%, 05/31/22 | | | 669,917 | |
| | 620,000 | | | | | Illumina, Inc.^ 0.000%, 06/15/19 | | | 782,958 | |
| | 262,000 | | | | | Innoviva, Inc. 2.500%, 08/15/25 | | | 275,469 | |
| | 540,000 | | | | | Insulet Corp.*^ 1.375%, 11/15/24 | | | 611,874 | |
| | | | | | |
| See accompanying Notes to Schedule of Investments | | www.calamos.com | | | 97 | |
Global Convertible Fund Schedule of Investments October 31, 2018
| | | | | | | | | | |
PRINCIPAL
AMOUNT | | | | | | | VALUE | |
| | 805,000 | | | | | NuVasive, Inc. 2.250%, 03/15/21 | | $ | 898,730 | |
| | 625,000 | | | | | Pacira Pharmaceuticals, Inc. 2.375%, 04/01/22 | | | 657,744 | |
| | 657,000 | | | | | Teladoc Health, Inc.* 1.375%, 05/15/25 | | | 949,411 | |
| | | | | | | | | | |
| | | | | | | | | 7,775,407 | |
| | | | | | | | | | |
| | | | | | Industrials (9.1%) | |
| | 140,000,000 | | | JPY | | ANA Holdings, Inc. 0.000%, 09/19/24 | | | 1,255,304 | |
| | 1,380,000 | | | EUR | | Elis, SA
0.000%, 10/06/23 | | | 495,865 | |
| | 705,000 | | | | | Greenbrier Companies, Inc.
2.875%, 02/01/24 | | | 741,970 | |
| | 13,000,000 | | | HKD | | Harvest International Company
0.000%, 11/21/22 | | | 1,557,946 | |
| | 1,000,000 | | | | | Johnson Electric Holdings, Ltd.
1.000%, 04/02/21 | | | 1,080,315 | |
| | 70,000,000 | | | JPY | | Kandenko Company, Ltd.
0.000%, 03/31/21 | | | 697,001 | |
| | 130,000,000 | | | JPY | | Kansai Paint Company, Ltd.
0.000%, 06/17/19 | | | 1,144,636 | |
| | 2,115,000 | | | | | Larsen & Toubro, Ltd.
0.675%, 10/22/19 | | | 2,078,643 | |
| | 130,000,000 | | | JPY | | LIXIL Group Corp.
0.000%, 03/04/22 | | | 1,127,060 | |
| | 70,000,000 | | | JPY | | Nippon Flour Mills Company, Ltd.
0.000%, 06/20/25 | | | 631,585 | |
| | 400,000 | | | EUR | | Symrise, AG
0.238%, 06/20/24 | | | 511,448 | |
| | 1,000,000 | | | | | Vinci, SA
0.375%, 02/16/22 | | | 1,061,545 | |
| | | | | | | | | | |
| | | | | | | | | 12,383,318 | |
| | | | | | | | | | |
| | | | | | Information Technology (20.8%) | |
| | 1,375,000 | | | | | Akamai Technologies, Inc.*
0.125%, 05/01/25 | | | 1,344,915 | |
| | 1,685,000 | | | | | Altaba, Inc.
0.000%, 12/01/18 | | | 1,895,962 | |
| | 1,814,000 | | | | | Citrix Systems, Inc.^~
0.500%, 04/15/19 | | | 2,567,935 | |
| | 287,000 | | | | | Coupa Software, Inc.*^
0.375%, 01/15/23 | | | 444,025 | |
| | 695,000 | | | | | DocuSign, Inc.*
0.500%, 09/15/23 | | | 651,552 | |
| | | | | | FireEye, Inc. | | | | |
| | 330,000 | | | | | 1.625%, 06/01/35 | | | 303,570 | |
| | 183,000 | | | | | 1.000%, 06/01/35 | | | 176,693 | |
| | 475,000 | | | | | II-VI, Inc.
0.250%, 09/01/22 | | | 488,906 | |
| | 400,000 | | | | | Inphi Corp.
0.750%, 09/01/21 | | | 374,398 | |
| | | | | | | | | | |
PRINCIPAL
AMOUNT | | | | | | | VALUE | |
| | 595,000 | | | | | Lumentum Holdings, Inc.^
0.250%, 03/15/24 | | $ | 678,725 | |
| | 1,480,000 | | | | | Microchip Technology, Inc.
1.625%, 02/15/27 | | | 1,402,700 | |
| | | | | | Micron Technology, Inc. | | | | |
| | 505,000 | | | | | 3.000%, 11/15/43 | | | 658,730 | |
| | 305,000 | | | | | 2.125%, 02/15/33~ | | | 1,049,917 | |
| | 649,000 | | | | | New Relic, Inc.*
0.500%, 05/01/23 | | | 684,254 | |
| | 405,000 | | | | | Nice Systems, Inc.
1.250%, 01/15/24 | | | 543,996 | |
| | 1,423,000 | | | | | NXP Semiconductors, NV
1.000%, 12/01/19 | | | 1,441,599 | |
| | 617,000 | | | | | Okta, Inc.*
0.250%, 02/15/23 | | | 840,718 | |
| | 395,000 | | | | | ON Semiconductor Corp.
1.000%, 12/01/20 | | | 443,156 | |
| | 680,000 | | | | | Palo Alto Networks, Inc.*
0.750%, 07/01/23 | | | 661,242 | |
| | 477,000 | | | | | Q2 Holdings, Inc.*
0.750%, 02/15/23 | | | 524,927 | |
| | 480,000 | | | | | RealPage, Inc.^
1.500%, 11/15/22 | | | 660,209 | |
| | 450,000 | | | | | Silicon Laboratories, Inc.^
1.375%, 03/01/22 | | | 486,094 | |
| | 1,505,000 | | | | | Splunk, Inc.*
1.125%, 09/15/25 | | | 1,426,258 | |
| | 1,335,000 | | | | | Square, Inc.*
0.500%, 05/15/23 | | | 1,599,791 | |
| | 600,000 | | | | | STMicroelectronics, NV
0.000%, 07/03/22 | | | 620,430 | |
| | 221,000 | | | | | Synaptics, Inc.^
0.500%, 06/15/22 | | | 197,986 | |
| | 400,000 | | | | | Teradyne, Inc.^
1.250%, 12/15/23 | | | 502,196 | |
| | 665,000 | | | | | Twilio, Inc.*
0.250%, 06/01/23 | | | 831,011 | |
| | 405,000 | | | | | Veeco Instruments, Inc.
2.700%, 01/15/23 | | | 339,351 | |
| | 680,000 | | | | | Wix.com, Ltd.*^
0.000%, 07/01/23 | | | 668,579 | |
| | 1,730,000 | | | | | Workday, Inc.
0.250%, 10/01/22 | | | 1,923,128 | |
| | 1,415,000 | | | | | Xero Investments, Ltd.
2.375%, 10/04/23 | | | 1,290,890 | |
| | 640,000 | | | | | Zendesk, Inc.*
0.250%, 03/15/23 | | | 702,000 | |
| | | | | | | | | | |
| | | | | | | | | 28,425,843 | |
| | | | | | | | | | |
| | | | | | Materials (3.1%) | |
| | 3,500,000 | | | | | BASF, SE
0.925%, 03/09/23 | | | 3,214,365 | |
| | 300,000 | | | EUR | | Buzzi Unicem, S.p.A.
1.375%, 07/17/19 | | | 383,012 | |
| | | | |
| 98 | | CALAMOS OPEN-END FAMILY OF FUNDS ANNUAL REPORT | | See accompanying Notes to Schedule of Investments |
Global Convertible Fund Schedule of Investments October 31, 2018
| | | | | | | | | | |
PRINCIPAL
AMOUNT | | | | | | | VALUE | |
| | 600,000 | | | | | LG Chem, Ltd.
0.000%, 04/16/21 | | $ | 604,488 | |
| | | | | | | | | | |
| | | | | | | | | 4,201,865 | |
| | | | | | | | | | |
| | | | | | Real Estate (6.4%) | |
| | 2,623,000 | | | | | AYC Finance, Ltd.
0.500%, 05/02/19 | | | 2,637,741 | |
| | 2,000,000 | | | EUR | | Grand City Properties, SA 0.250%, 03/02/22 | | | 2,440,771 | |
| | 1,300,000 | | | | | IH Merger Sub, LLC
3.000%, 07/01/19 | | | 1,563,172 | |
| | 6,000,000 | | | HKD | | Smart Insight International, Ltd.
0.000%, 01/27/19 | | | 757,492 | |
| | 1,179,000 | | | | | Starwood Property Trust, Inc.
4.000%, 01/15/19 | | | 1,308,330 | |
| | | | | | | | | | |
| | | | | | | | | 8,707,506 | |
| | | | | | | | | | |
| | | | | | TOTAL CONVERTIBLE BONDS
(Cost $106,192,028) | | | 101,936,050 | |
| | | | | | | | | | |
| | | | | | | | | | |
| | SYNTHETIC CONVERTIBLE SECURITIES (11.8%) ¤ | |
| | Corporate Bonds (1.9%) | |
| | | | | | Communication Services (0.2%) | |
| | 283,000 | | | | | Sprint Corp.
7.250%, 09/15/21 | | | 296,136 | |
| | | | | | | | | | |
| | | | | | Consumer Discretionary (0.8%) | |
| | 625,000 | | | | | Lennar Corp.^
6.625%, 05/01/20 | | | 647,491 | |
| | 479,000 | | | | | Mediacom Broadband, LLC / Mediacom Broadband Corp.
5.500%, 04/15/21 | | | 482,432 | |
| | | | | | | | | | |
| | | | | | | | | 1,129,923 | |
| | | | | | | | | | |
| | | | | | Health Care (0.5%) | |
| | 630,000 | | | | | HCA Healthcare, Inc. 6.250%, 02/15/21 | | | 655,726 | |
| | | | | | | | | | |
| | | | | | Industrials (0.4%) | |
| | 450,000 | | | | | AerCap Ireland Capital, Ltd. / AerCap Global Aviation Trust
5.000%, 10/01/21 | | | 462,098 | |
| | | | | | | | | | |
| | | | | | TOTAL CORPORATE BONDS | | | 2,543,883 | |
| | | | | | | | | | |
| | | | | | | | | | |
| | U.S. Government and Agency Securities (8.6%) | |
| | | | | | United States Treasury Note | |
| | 4,661,000 | | | | | 1.875%, 05/31/22 | | | 4,491,006 | |
| | 3,719,000 | | | | | 1.000%, 06/30/19 | | | 3,680,999 | |
| | 3,675,000 | | | | | 1.750%, 10/31/20 | | | 3,594,919 | |
| | | | | | | | | | |
| | | | | | TOTAL U.S. GOVERNMENT AND AGENCY SECURITIES | | | 11,766,924 | |
| | | | | | | | | | |
| | | | | | | | | | |
NUMBER OF
CONTRACTS/
NOTIONAL
AMOUNT | | | | | | | VALUE | |
| | Purchased Options (1.3%) # | |
| | | | | | Consumer Discretionary (0.6%) | |
| 166
2,361,848 |
| | | | Alibaba Group Holding, Ltd.
Call, 04/18/19, Strike $155.00 | | $ | 162,680 | |
| 9
1,687,122 |
| | | | Booking Holdings, Inc. Call, 01/17/20, Strike $1,920.00 | | | 220,500 | |
| | | | | | Kering, SA | | | | |
| 45
1,912,896 |
| | EUR | | Call, 12/21/18, Strike 483.37 | | | 4,954 | |
| 43
1,827,878 |
| | EUR | | Call, 12/21/18, Strike 520.55 | | | 1,999 | |
| | | | | | LVMH Moet Hennessy Louis Vuitton, SE | | | | |
| 159
4,273,920 |
| | EUR | | Call, 01/18/19, Strike 260.00 | | | 293,369 | |
| 63
1,693,440 |
| | EUR | | Call, 12/21/18, Strike 290.00 | | | 16,127 | |
| 282
1,526,466 |
| | | | Sony Corp. Call, 04/18/19, Strike $57.50 | | | 88,830 | |
| | | | | | | | | | |
| | | | | | | | | 788,459 | |
| | | | | | | | | | |
| | | | | | Industrials (0.0%) | | | | |
| 150
1,465,650 |
| | EUR | | Airbus, SE
Call, 12/21/18, Strike 100.00 | | | 52,498 | |
| | | | | | | | | | |
| | | | | | Information Technology (0.7%) | |
| 135
1,913,355 |
| | | | Lam Research Corp.
Call, 03/15/19, Strike $150.00 | | | 116,775 | |
| 157
2,694,748 |
| | | | Red Hat, Inc.
Call, 03/15/19, Strike $125.00 | | | 772,440 | |
| | | | | | | | | | |
| | | | | | | | | 889,215 | |
| | | | | | | | | | |
| | | | | | Materials (0.0%) | |
| 297
951,719 |
| | GBP | | Glencore, PLC
Call, 12/21/18, Strike 3.80 | | | 7,630 | |
| | | | | | | | | | |
| | | | | | TOTAL PURCHASED OPTIONS | | | 1,737,802 | |
| | | | | | | | | | |
| | | | | | TOTAL SYNTHETIC
CONVERTIBLE SECURITIES
(Cost $16,322,931) | | | 16,048,609 | |
| | | | | | | | | | |
| | | | | | | | | | |
NUMBER OF
SHARES | | | | | | | VALUE | |
| | CONVERTIBLE PREFERRED STOCKS (8.6%) | |
| | | | | | Energy (1.5%) | |
| | 31,870 | | | | | Hess Corp.
8.000%, 02/01/19 | | | 2,023,426 | |
| | | | | | | | | | |
| | | | | | Financials (5.3%) | | | | |
| | 6,300 | | | | | Assurant, Inc.
6.500%, 03/15/21 | | | 671,360 | |
| | 2,570 | | | | | Bank of America Corp.
7.250%, 12/31/49 | | | 3,267,241 | |
| | 2,615 | | | | | Wells Fargo & Company
7.500%, 12/31/49 | | | 3,326,254 | |
| | | | | | | | | | |
| | | | | | | | | 7,264,855 | |
| | | | | | | | | | |
| | | | | | |
| See accompanying Notes to Schedule of Investments | | www.calamos.com | | | 99 | |
Global Convertible Fund Schedule of Investments October 31, 2018
| | | | | | | | | | |
NUMBER OF
SHARES | | | | | | | VALUE | |
| | | | | | | | | | |
| | | | | | Real Estate (0.4%) | | | | |
| | 440 | | | | | Crown Castle International Corp.
6.875%, 08/01/20 | | $ | 459,800 | |
| | | | | | | | | | |
| | | | | | Utilities (1.4%) | |
| | 10,735 | | | | | DTE Energy Company
6.500%, 10/01/19 | | | 572,497 | |
| | | | | | Sempra Energy | | | | |
| | 6,825 | | | | | 6.750%, 07/15/21 | | | 680,521 | |
| | 6,655 | | | | | 6.000%, 01/15/21 | | | 659,910 | |
| | | | | | | | | | |
| | | | | | | | | 1,912,928 | |
| | | | | | | | | | |
| | | | | | TOTAL CONVERTIBLE
PREFERRED STOCKS
(Cost $11,217,594) | | | 11,661,009 | |
| | | | | | | | | | |
| | | | | | | | | | |
| | SHORT TERM INVESTMENTS (2.5%) | |
| | 1,728,800 | | | | | Fidelity Prime Money Market Fund - Institutional Class, 2.240%*** | | | 1,729,318 | |
| | 1,719,450 | | | | | Morgan Stanley Institutional Liquidity Funds - Government Portfolio, 2.050%*** | | | 1,719,450 | |
| | | | | | | | | | |
| | | | | | TOTAL SHORT TERM
INVESTMENTS
(Cost $3,448,768) | | | 3,448,768 | |
| | | | | | | | | | |
NUMBER OF
SHARES/
PRINCIPAL
AMOUNT | | | | | | | VALUE | |
| INVESTMENT OF CASH COLLATERAL FOR SECURITIES
LOANED (3.9%) |
|
| | | | | | | | | | |
| | 3,555,584 | | | | | Fidelity Prime Money Market Fund - Institutional Class, 2.240%***† | | | 3,555,584 | |
| | 1,773,124 | | | | | State Street Navigator Securities Lending Government Money Market Portfolio† | | | 1,773,124 | |
| | | | | | | | | | |
| | | | | | TOTAL INVESTMENT OF
CASH COLLATERAL FOR
SECURITIES LOANED
(Cost $5,328,708) | | | 5,328,708 | |
| | | | | | | | | | |
| TOTAL INVESTMENTS (101.6%)
(Cost $142,510,029) | | | 138,423,144 | |
| | | | | | | | | | |
| |
| | PAYABLE UPON RETURN OF SECURITIES ON LOAN (-3.9%) | | | (5,328,708 | ) |
| | | | | | | | | | |
| |
| | OTHER ASSETS, LESS LIABILITIES (2.3%) | | | 3,143,561 | |
| | | | | | | | | | |
| |
| | NET ASSETS (100.0%) | | $ | 136,237,997 | |
| | | | | | | | | | |
NOTES TO SCHEDULE OF INVESTMENTS
| * | Securities issued and sold pursuant to a Rule 144A transaction are excepted from the registration requirement of the Securities Act of 1933, as amended. These securities may only be sold to qualified institutional buyers (“QIBs”), such as the Fund. Any resale of these securities must generally be effected through a sale that is registered under the Act or otherwise exempted from such registration requirements. |
| ^ | Security, or portion of security, is on loan. |
| § | Securities exchangeable or convertible into securities of one or more entities that are different than the issuer. Each entity is identified in the parenthetical. |
| ‡ | Variable rate security. The rate shown is the rate in effect at October 31, 2018. |
| ~ | Security, or portion of security, is segregated as collateral (or collateral for potential future transactions) for written options. The aggregate value of such securities is $42,082. |
| ¤ | The synthetic convertible securities strategy combines separate securities that together possess the economic characteristics similar to a convertible security. |
| # | Non-income producing security. |
| *** | The rate disclosed is the 7 day net yield as of October 31, 2018. |
| † | Represents investment of cash collateral received from securities on loan as of October 31, 2018. |
FOREIGN CURRENCY ABBREVIATIONS
| | |
| EUR | | European Monetary Unit |
| GBP | | British Pound Sterling |
| HKD | | Hong Kong Dollar |
| JPY | | Japanese Yen |
Note: Value for securities denominated in foreign currencies is shown in U.S. dollars. The principal amount for such securities is shown in the respective foreign currency. The date on options represents the expiration date of the option contract. The option contract may be exercised at any date on or before the date shown.
CURRENCY EXPOSURE
OCTOBER 31, 2018
| | | | | | | | |
| | | VALUE | | | % of TOTAL
INVESTMENTS | |
| US Dollar | | $ | 108,644,829 | | | | 78.5% | |
| European Monetary Unit | | | 19,317,458 | | | | 14.0% | |
| Japanese Yen | | | 7,892,239 | | | | 5.7% | |
| Hong Kong Dollar | | | 2,560,988 | | | | 1.8% | |
| British Pound Sterling | | | 7,630 | | | | 0.0% | |
| Total Investments | | $ | 138,423,144 | | | | 100.0% | |
Currency exposure may vary over time.
| | | | |
| 100 | | CALAMOS OPEN-END FAMILY OF FUNDS ANNUAL REPORT | | See accompanying Notes to Financial Statements |
Growth Fund Schedule of Investments October 31, 2018
| | | | | | | | | | |
NUMBER OF
SHARES | | | | | | | VALUE | |
| | COMMON STOCKS (99.2%) | |
| | | | | | Communication Services (13.9%) | |
| | 79,000 | | | | | Alphabet, Inc. - Class A#~ | | $ | 86,155,820 | |
| | 5,250 | | | | | Cargurus, Inc.#^ | | | 233,205 | |
| | 415,000 | | | | | Comcast Corp. - Class A~ | | | 15,828,100 | |
| | 519,000 | | | | | Facebook, Inc. - Class A#~ | | | 78,779,010 | |
| | 1,800 | | | | | IAC/InterActive Corp.# | | | 353,862 | |
| | 4,930 | | | | | Match Group, Inc.#^ | | | 254,980 | |
| | 6,640 | | | | | Momo, Inc.# | | | 222,905 | |
| | 23,500 | | | | | Netflix, Inc.# | | | 7,091,830 | |
| | 22,220 | | | | | QuinStreet, Inc.# | | | 353,298 | |
| | 15,230 | | | | | TechTarget, Inc.# | | | 309,473 | |
| | 7,410 | | | | | United States Cellular Corp.# | | | 353,976 | |
| | 121,900 | | | | | Walt Disney Company^ | | | 13,997,777 | |
| | 5,870 | | | | | Yelp, Inc.#^ | | | 251,353 | |
| | | | | | | | | | |
| | | | | | | | | 204,185,589 | |
| | | | | | | | | | |
| | | | | | Consumer Discretionary (15.9%) | |
| | 82,000 | | | EUR | | Adidas, AG | | | 19,283,440 | |
| | 35,300 | | | | | Amazon.com, Inc.#~ | | | 56,409,753 | |
| | 27,700 | | | | | American Axle & Manufacturing Holdings, Inc.#^ | | | 420,209 | |
| | 7,600 | | | | | Booking Holdings, Inc.# | | | 14,246,808 | |
| | 10,490 | | | CAD | | BRP, Inc. | | | 422,006 | |
| | 379,000 | | | | | CarMax, Inc.#^ | | | 25,737,890 | |
| | 5,640 | | | | | Etsy, Inc.#^ | | | 239,813 | |
| | 92,100 | | | | | Home Depot, Inc. | | | 16,198,548 | |
| | 6,520 | | | | | Kohl’s Corp. | | | 493,760 | |
| | 179,000 | | | | | Lowe’s Companies, Inc. | | | 17,044,380 | |
| | 14,100 | | | | | Macy’s, Inc. | | | 483,489 | |
| | 157,000 | | | | | McDonald’s Corp. | | | 27,773,300 | |
| | 839,000 | | | | | MGM Resorts International | | | 22,384,520 | |
| | 136,500 | | | | | Mohawk Industries, Inc.# | | | 17,025,645 | |
| | 7,120 | | | | | Penske Automotive Group, Inc. | | | 315,986 | |
| | 48,500 | | | | | Ulta Salon Cosmetics & Fragrance, Inc.# | | | 13,314,220 | |
| | 6,990 | | | | | Weight Watchers International, Inc.#^ | | | 462,039 | |
| | | | | | | | | | |
| | | | | | | | | 232,255,806 | |
| | | | | | | | | | |
| | | | | | Consumer Staples (1.8%) | |
| | 72,000 | | | | | Constellation Brands, Inc. - Class A | | | 14,344,560 | |
| | 7,100 | | | | | Lamb Weston Holdings, Inc. | | | 554,936 | |
| | 3,950 | | | | | McCormick & Company, Inc. | | | 568,800 | |
| | 207,600 | | | | | Monster Beverage Corp.# | | | 10,971,660 | |
| | 4,700 | | | | | USANA Health Sciences, Inc.# | | | 549,994 | |
| | | | | | | | | | |
| | | | | | | | | 26,989,950 | |
| | | | | | | | | | |
| | | | | | Energy (0.0%) | |
| | 4,660 | | | | | HollyFrontier Corp. | | | 314,270 | |
| | | | | | | | | | |
NUMBER OF
SHARES | | | | | | | VALUE | |
| | 17,900 | | | | | Solaris Oilfield Infrastructure, Inc. - Class A#^ | | $ | 236,280 | |
| | | | | | | | | | |
| | | | | | | | | 550,550 | |
| | | | | | | | | | |
| | | | | | Financials (12.7%) | |
| | 9,000 | | | | | AllianceBernstein Holding, LP | | | 260,190 | |
| | 434,000 | | | | | American International Group, Inc. | | | 17,919,860 | |
| | 5,430 | | | | | Athene Holding, Ltd. - Class A# | | | 248,260 | |
| | 556,500 | | | | | Bank of America Corp. | | | 15,303,750 | |
| | 262,500 | | | | | Cboe Global Markets, Inc. | | | 29,623,125 | |
| | 327,000 | | | | | Charles Schwab Corp. | | | 15,120,480 | |
| | 3,620 | | | | | City Holding Company | | | 267,084 | |
| | 4,160 | | | | | Commerce Bancshares, Inc.^ | | | 264,576 | |
| | 1,280 | | | | | Credit Acceptance Corp.# | | | 543,258 | |
| | 502,730 | | | | | E*TRADE Financial Corp. | | | 24,844,916 | |
| | 4,560 | | | | | East West Bancorp, Inc. | | | 239,126 | |
| | 17,220 | | | | | First Commonwealth Financial Corp. | | | 232,470 | |
| | 109,000 | | | | | Goldman Sachs Group, Inc. | | | 24,565,330 | |
| | 11,560 | | | | | Independent Bank Corp. | | | 255,823 | |
| | 318,000 | | | | | Intercontinental Exchange, Inc.~ | | | 24,498,720 | |
| | 4,290 | | | | | LPL Financial Holdings, Inc. | | | 264,264 | |
| | 6,035 | | | | | Macatawa Bank Corp. | | | 65,480 | |
| | 21,200 | | | | | MGIC Investment Corp.# | | | 258,852 | |
| | 12,120 | | | | | NMI Holdings, Inc. - Class A# | | | 256,217 | |
| | 5,750 | | | | | PacWest Bancorp^ | | | 233,565 | |
| | 1,576,000 | | | | | SLM Corp.# | | | 15,980,640 | |
| | 11,590 | | | | | TCF Financial Corp. | | | 241,999 | |
| | 10,220 | | | | | TriState Capital Holdings, Inc.# | | | 257,748 | |
| | 267,500 | | | | | US Bancorp | | | 13,982,225 | |
| | 3,230 | | | | | Wintrust Financial Corp. | | | 245,932 | |
| | | | | | | | | | |
| | | | | | | | | 185,973,890 | |
| | | | | | | | | | |
| | | | | | Health Care (12.2%) | |
| | 174,000 | | | | | AbbVie, Inc. | | | 13,545,900 | |
| | 132,500 | | | | | Agilent Technologies, Inc. | | | 8,584,675 | |
| | 205,500 | | | | | Alexion Pharmaceuticals, Inc.# | | | 23,030,385 | |
| | 501,000 | | | | | Baxter International, Inc. | | | 31,317,510 | |
| | 19,500 | | | | | Biogen, Inc.# | | | 5,933,265 | |
| | 5,840 | | | | | Genomic Health, Inc.# | | | 418,787 | |
| | 3,600 | | | | | Haemonetics Corp.# | | | 376,092 | |
| | 1,660 | | | | | Inogen, Inc.# | | | 314,686 | |
| | 11,740 | | | | | iRadimed Corp.#^ | | | 293,030 | |
| | 204,500 | | | | | Johnson & Johnson~ | | | 28,627,955 | |
| | 160,000 | | | | | Laboratory Corp. of America Holdings#~ | | | 25,688,000 | |
| | 1,480 | | | | | Ligand Pharmaceuticals, Inc.#^ | | | 243,919 | |
| | 10,670 | | | | | Medpace Holdings, Inc.# | | | 555,907 | |
| | 155,500 | | | | | Medtronic, PLC | | | 13,967,010 | |
| | 2,730 | | | | | Molina Healthcare, Inc.#^ | | | 346,082 | |
| | | | | | |
| See accompanying Notes to Schedule of Investments | | www.calamos.com | | | 101 | |
Growth Fund Schedule of Investments October 31, 2018
| | | | | | | | | | |
NUMBER OF
SHARES | | | | | | | VALUE | |
| | 8,770 | | | | | Myriad Genetics, Inc.# | | $ | 394,913 | |
| | 6,310 | | | | | Quidel Corp.# | | | 406,112 | |
| | 14,490 | | | | | Tenet Healthcare Corp.#^ | | | 372,828 | |
| | 92,000 | | | | | UnitedHealth Group, Inc.~ | | | 24,044,200 | |
| | 1,270 | | | | | WellCare Health Plans, Inc.# | | | 350,507 | |
| | | | | | | | | | |
| | | | | | | | | 178,811,763 | |
| | | | | | | | | | |
| | | | | | Industrials (13.5%) | |
| | 12,870 | | | | | Advanced Drainage Systems, Inc. | | | 357,657 | |
| | 407,500 | | | | | Air Lease Corp. | | | 15,525,750 | |
| | 7,700 | | | | | Allison Transmission Holdings, Inc. | | | 339,416 | |
| | 5,400 | | | | | Applied Industrial Technologies, Inc. | | | 354,942 | |
| | 8,240 | | | | | ArcBest Corp. | | | 305,869 | |
| | 62,500 | | | | | Boeing Company | | | 22,178,750 | |
| | 10,770 | | | | | Continental Building Products, Inc.# | | | 299,514 | |
| | 622,500 | | | | | Delta Air Lines, Inc.~ | | | 34,069,425 | |
| | 286,500 | | | | | Emerson Electric Company | | | 19,447,620 | |
| | 7,230 | | | | | Generac Holdings, Inc.# | | | 366,778 | |
| | 10,810 | | | | | H&E Equipment Services, Inc. | | | 260,413 | |
| | 98,000 | | | | | Harris Corp. | | | 14,573,580 | |
| | 97,500 | | | | | Honeywell International, Inc. | | | 14,119,950 | |
| | 26,460 | | | | | NCI Building Systems, Inc.# | | | 324,135 | |
| | 18,830 | | | | | PGT Innovations, Inc.# | | | 381,496 | |
| | 146,500 | | | | | Raytheon Company | | | 25,643,360 | |
| | 16,250 | | | | | Resideo Technologies, Inc.# | | | 342,062 | |
| | 5,570 | | | | | Ryder System, Inc. | | | 308,077 | |
| | 6,840 | | | | | SkyWest, Inc. | | | 391,863 | |
| | 10,040 | | | | | Terex Corp.^ | | | 335,236 | |
| | 246,500 | | | | | TransUnion~ | | | 16,207,375 | |
| | 103,500 | | | | | Union Pacific Corp. | | | 15,133,770 | |
| | 176,000 | | | | | Waste Management, Inc. | | | 15,746,720 | |
| | | | | | | | | | |
| | | | | | | | | 197,013,758 | |
| | | | | | | | | | |
| | | | | | Information Technology (25.5%) | |
| | 4,030 | | | | | Akamai Technologies, Inc.# | | | 291,167 | |
| | 477,700 | | | | | Apple, Inc.~ | | | 104,549,422 | |
| | 322,000 | | | | | Applied Materials, Inc. | | | 10,587,360 | |
| | 11,180 | | | | | Booz Allen Hamilton Holding Corp. | | | 553,857 | |
| | 6,500 | | | | | Cadence Design Systems, Inc.# | | | 289,705 | |
| | 3,300 | | | | | CDW Corp. | | | 297,033 | |
| | 2,640 | | | | | Citrix Systems, Inc. | | | 270,521 | |
| | 3,710 | | | | | CyberArk Software, Ltd.# | | | 253,245 | |
| | 20,270 | | | | | Cypress Semiconductor Corp.^ | | | 262,294 | |
| | 16,930 | | | | | Electro Scientific Industries, Inc.#^ | | | 490,970 | |
| | 160,500 | | | | | Ellie Mae, Inc.#^ | | | 10,637,940 | |
| | 10,190 | | | | | Entegris, Inc. | | | 270,443 | |
| | 2,920 | | | | | Euronet Worldwide, Inc.# | | | 324,646 | |
| | 202,500 | | | | | Fidelity National Information Services, Inc. | | | 21,080,250 | |
| | | | | | | | | | |
NUMBER OF
SHARES | | | | | | | VALUE | |
| | 339,000 | | | | | First Solar, Inc.# | | $ | 14,170,200 | |
| | 3,180 | | | | | Fortinet, Inc.# | | | 261,332 | |
| | 1,840 | | | | | Gartner, Inc.# | | | 271,437 | |
| | 810,500 | | | | | GreenSky, Inc. - Class A#^ | | | 10,682,390 | |
| | 4,790 | | | | | Lumentum Holdings, Inc.#^ | | | 261,773 | |
| | 127,000 | | | | | Microchip Technology, Inc.^ | | | 8,354,060 | |
| | 663,900 | | | | | Microsoft Corp.~ | | | 70,911,159 | |
| | 7,960 | | | | | Nanometrics, Inc.# | | | 255,198 | |
| | 112,000 | | | | | Paycom Software, Inc.#^ | | | 14,022,400 | |
| | 2,800 | | | | | Proofpoint, Inc.# | | | 254,660 | |
| | 209,400 | | | | | RealPage, Inc.#^ | | | 11,098,200 | |
| | 107,500 | | | | | Salesforce.com, Inc.# | | | 14,753,300 | |
| | 6,320 | | | | | Seagate Technology, PLC^ | | | 254,254 | |
| | 10,150 | | | | | SMART Global Holdings, Inc.#^ | | | 284,301 | |
| | 219,100 | | | | | Total System Services, Inc.~ | | | 19,970,965 | |
| | 1,900 | | | | | Trade Desk, Inc. - Class A# | | | 234,745 | |
| | 9,350 | | | | | Upland Software, Inc.# | | | 294,899 | |
| | 273,000 | | | | | Visa, Inc. - Class A~ | | | 37,633,050 | |
| | 1,470 | | | | | WEX, Inc.# | | | 258,661 | |
| | 2,460 | | | | | Wix.com, Ltd.# | | | 239,481 | |
| | 132,500 | | | | | Workday, Inc. - Class A#~^ | | | 17,625,150 | |
| | 1,640 | | | | | Zebra Technologies Corp- Class A# | | | 272,732 | |
| | | | | | | | | | |
| | | | | | | | | 372,523,200 | |
| | | | | | | | | | |
| | | | | | Materials (3.7%) | |
| | 135,000 | | | | | Air Products & Chemicals, Inc. | | | 20,837,250 | |
| | 2,850 | | | | | Celanese Corp. - Class A | | | 276,279 | |
| | 292,500 | | | | | DowDuPont, Inc. | | | 15,771,600 | |
| | 2,600 | | | | | Ingevity Corp.# | | | 236,808 | |
| | 5,150 | | | | | Nucor Corp. | | | 304,468 | |
| | 3,830 | | | | | Reliance Steel & Aluminum Company | | | 302,264 | |
| | 40,600 | | | | | Sherwin-Williams Company | | | 15,974,882 | |
| | | | | | | | | | |
| | | | | | | | | 53,703,551 | |
| | | | | | | | | | |
| | | | | | Utilities (0.0%) | |
| | 8,990 | | | | | NRG Energy, Inc. | | | 325,348 | |
| | 5,940 | | | | | UGI Corp. | | | 315,176 | |
| | | | | | | | | | |
| | | | | | | | | 640,524 | |
| | | | | | | | | | |
| | | | | | TOTAL COMMON STOCKS
(Cost $1,153,068,154) | | | 1,452,648,581 | |
| | | | | | | | | | |
| | | | | | | | | | |
| | EXCHANGE-TRADED FUNDS (0.6%) | |
| | | | | | Other (0.6%) | |
| | 25,400 | | | | | iShares Core S&P U.S. Growth ETF^ | | | 1,448,308 | |
| | 30,000 | | | | | iShares Russell 2000 Growth ETF | | | 5,636,700 | |
| | 20,570 | | | | | iShares U.S. Real Estate ETF^ | | | 1,606,723 | |
| | | | | | | | | | |
| | | | | | TOTAL EXCHANGE-TRADED FUNDS
(Cost $8,575,583) | | | 8,691,731 | |
| | | | | | | | | | |
| | | | | | | | | | |
| | | | |
| 102 | | CALAMOS OPEN-END FAMILY OF FUNDS ANNUAL REPORT | | See accompanying Notes to Schedule of Investments |
Growth Fund Schedule of Investments October 31, 2018
| | | | | | | | | | |
NUMBER OF
CONTRACTS/
NOTIONAL
AMOUNT | | | | | | | VALUE | |
| | PURCHASED OPTIONS (0.2%)# | |
| | | | | | Financials (0.0%) | |
| 2,170
8,959,930 |
| | | | American International Group I
Put, 11/02/18, Strike $40.00 | | $ | 203,980 | |
| | | | | | | | | | |
| | | | | | Information Technology (0.0%) | |
| 1,380
30,202,680 |
| | | | Apple, Inc.
Put, 11/02/18, Strike $207.50 | | | 253,230 | |
| | | | | | | | | | |
| | | | | | Consumer Staples (0.2%) | |
| | | | | | Walmart, Inc. | | | | |
| 6,500
65,182,000 |
| | | | Call, 11/16/18, Strike $105.00 | | | 685,750 | |
| 4,500
45,126,000 |
| | | | Call, 11/16/18, Strike $100.00 | | | 1,395,000 | |
| | | | | | | | | | |
| | | | | | | | | 2,080,750 | |
| | | | | | | | | | |
| | | | | | TOTAL PURCHASED OPTIONS
(Cost $2,428,564) | | | 2,537,960 | |
| | | | | | | | | | |
| | | | | | | | | | |
NUMBER OF
SHARES | | | | | | | VALUE | |
| | SHORT TERM INVESTMENTS (1.7%) | |
| | 12,335,927 | | | | | Fidelity Prime Money Market Fund - Institutional Class, 2.240%*** | | | 12,339,628 | |
| | 12,292,625 | | | | | Morgan Stanley Institutional Liquidity Funds - Government Portfolio, 2.050%*** | | | 12,292,625 | |
| | | | | | | | | | |
| | | | | | TOTAL SHORT TERM INVESTMENTS
(Cost $24,632,253) | | | 24,632,253 | |
| | | | | | | | | | |
| | | | | | | | | | |
NUMBER OF
SHARES/
PRINCIPAL
AMOUNT | | | | | | | VALUE | |
| INVESTMENT OF CASH COLLATERAL FOR SECURITIES
LOANED (2.0%) |
|
| | 11,446,773 | | | | | Fidelity Prime Money Market Fund - Institutional Class, 2.240%***† | | | 11,446,773 | |
| | 17,752,578 | | | | | State Street Navigator Securities Lending Government Money Market Portfolio† | | | 17,752,578 | |
| | | | | | | | | | |
| | | | | | TOTAL INVESTMENT OF
CASH COLLATERAL FOR
SECURITIES LOANED
(Cost $29,199,351) | | | 29,199,351 | |
| | | | | | | | | | |
| TOTAL INVESTMENTS (103.7%)
(Cost $1,217,903,905) | | | 1,517,709,876 | |
| | | | | | | | | | |
| |
| | PAYABLE UPON RETURN OF SECURITIES ON LOAN (-2.0%) | | | (29,199,351 | ) |
| | | | | | | | | | |
| |
| | LIABILITIES, LESS OTHER ASSETS (-1.7%) | | | (24,975,450 | ) |
| | | | | | | | | | |
| |
| | NET ASSETS (100.0%) | | $ | 1,463,535,075 | |
| | | | | | | | | | |
| | | | | | | | | | |
| | | | | | | | | | |
NUMBER OF
CONTRACTS/
NOTIONAL
AMOUNT | | | | | | | VALUE | |
| | WRITTEN OPTIONS (0.0%) # | |
| | | | | | Financials (0.0%) | |
| 2,170
8,959,930 |
| | | | American International Group I
Put, 12/21/18, Strike $35.00 | | $ | (155,155 | ) |
| | | | | | | | | | |
| | | | | | Information Technology (0.0%) | |
| 460
10,067,560 |
| | | | Apple, Inc.
Call, 11/02/18, Strike $217.50 | | | (293,250 | ) |
| | | | | | | | | | |
| | | | | | TOTAL WRITTEN OPTIONS
(Premium $374,781) | | $ | (448,405 | ) |
| | | | | | | | | | |
NOTES TO SCHEDULE OF INVESTMENTS
| # | Non-income producing security. |
| ~ | Security, or portion of security, is segregated as collateral (or collateral for potential future transactions) for written options. The aggregate value of such securities is $2,756,575. |
| ^ | Security, or portion of security, is on loan. |
| *** | The rate disclosed is the 7 day net yield as of October 31, 2018. |
| † | Represents investment of cash collateral received from securities on loan as of October 31, 2018. |
FOREIGN CURRENCY ABBREVIATIONS
| | |
| CAD | | Canadian Dollar |
| EUR | | European Monetary Unit |
Note: Value for securities denominated in foreign currencies is shown in U.S. dollars. The date on options represents the expiration date of the option contract. The option contract may be exercised at any date on or before the date shown.
| | | | | | |
| See accompanying Notes to Financial Statements | | www.calamos.com | | | 103 | |
Growth and Income Fund Schedule of Investments October 31, 2018
| | | | | | | | | | |
PRINCIPAL
AMOUNT | | | | | | | VALUE | |
| | CONVERTIBLE BONDS (12.9%) | |
| | | | | | Communication Services (0.7%) | |
| | 6,600,000 | | | | | GCI Liberty, Inc.*
1.750%, 09/30/46 | | $ | 7,158,657 | |
| | 2,090,000 | | | | | Live Nation Entertainment, Inc.*^
2.500%, 03/15/23 | | | 2,236,864 | |
| | 5,150,000 | | | | | Twitter, Inc.*
0.250%, 06/15/24 | | | 4,822,563 | |
| | | | | | | | | | |
| | | | | | | | | 14,218,084 | |
| | | | | | | | | | |
| | | | | | Consumer Discretionary (2.7%) | |
| | 7,300,000 | | | | | Booking Holdings, Inc.
0.350%, 06/15/20 | | | 10,587,920 | |
| | | | | | Ctrip.com International, Ltd. | | | | |
| | 2,130,000 | | | | | 1.000%, 07/01/20 | | | 2,023,990 | |
| | 2,010,000 | | | | | 1.990%, 07/01/25 | | | 2,003,025 | |
| | 2,150,000 | | | | | DISH Network Corp.
3.375%, 08/15/26 | | | 1,923,250 | |
| | | | | | Liberty Media Corp. | | | | |
| | 9,655,726 | | | | | 2.250%, 09/30/46 | | | 5,172,138 | |
| | 6,963,000 | | | | | 1.375%, 10/15/23 | | | 8,102,913 | |
| | 5,125,000 | | | | | Liberty Media Corp. (Sirius XM Holdings, Inc.)*§
2.125%, 03/31/48 | | | 4,985,062 | |
| | 4,550,000 | | | | | Liberty Media Corp. / Liberty Formula One
1.000%, 01/30/23 | | | 4,939,184 | |
| | 3,100,000 | | | | | Marriott Vacations Worldwide Corp.
1.500%, 09/15/22 | | | 2,901,786 | |
| | 5,200,000 | | | | | RH*
0.000%, 06/15/23 | | | 4,592,250 | |
| | 5,885,000 | | | | | Tesla, Inc.
1.250%, 03/01/21 | | | 6,604,471 | |
| | | | | | | | | | |
| | | | | | | | | 53,835,989 | |
| | | | | | | | | | |
| | | | | | Energy (0.3%) | |
| | 1,593,000 | | | | | Oil States International, Inc.*^
1.500%, 02/15/23 | | | 1,468,475 | |
| | 5,000,000 | | | | | TOTAL, SA
0.500%, 12/02/22 | | | 5,441,300 | |
| | | | | | | | | | |
| | | | | | | | | 6,909,775 | |
| | | | | | | | | | |
| | | | | | Financials (0.5%) | |
| | 6,600,000 | | | | | JPMorgan Chase Bank, N.A.
0.000%, 12/30/20 | | | 6,892,941 | |
| | 4,000,000 | | | | | JPMorgan Chase Financial Company, LLC (Voya Financial, Inc.)*§
0.250%, 05/01/23 | | | 3,740,600 | |
| | | | | | | | | | |
| | | | | | | | | 10,633,541 | |
| | | | | | | | | | |
| | | | | | Health Care (1.4%) | | | | |
| | 1,750,000 | | | | | BioMarin Pharmaceutical, Inc.^
1.500%, 10/15/20 | | | 2,067,564 | |
| | 2,045,000 | | | | | Evolent Health, Inc.*
1.500%, 10/15/25 | | | 1,978,568 | |
| | | | | | | | | | |
PRINCIPAL
AMOUNT | | | | | | | VALUE | |
| | | | | | Illumina, Inc. | | | | |
| | 7,172,000 | | | | | 0.000%, 08/15/23*^ | | $ | 7,491,907 | |
| | 4,149,000 | | | | | 0.000%, 06/15/19 | | | 5,239,502 | |
| | 4,135,000 | | | | | Insulet Corp.*
1.375%, 11/15/24 | | | 4,685,368 | |
| | 2,425,000 | | | | | Teladoc Health, Inc.*
1.375%, 05/15/25 | | | 3,504,295 | |
| | 2,050,000 | | | | | Wright Medical Group, Inc.*^
1.625%, 06/15/23 | | | 2,080,812 | |
| | | | | | | | | | |
| | | | | | | | | 27,048,016 | |
| | | | | | | | | | |
| | | | | | Industrials (0.2%) | |
| | 2,050,000 | | | | | Air Transport Services Group, Inc.
1.125%, 10/15/24 | | | 1,877,308 | |
| | 2,930,000 | | | | | Meritor, Inc.
3.250%, 10/15/37 | | | 2,695,043 | |
| | | | | | | | | | |
| | | | | | | | | 4,572,351 | |
| | | | | | | | | | |
| | | | | | Information Technology (5.7%) | |
| | 1,727,000 | | | | | Akamai Technologies, Inc.*
0.125%, 05/01/25 | | | 1,689,213 | |
| | 4,350,000 | | | | | Altaba, Inc.~
0.000%, 12/01/18 | | | 4,894,620 | |
| | 2,050,000 | | | | | Citrix Systems, Inc.
0.500%, 04/15/19 | | | 2,902,021 | |
| | 2,060,000 | | | | | Cypress Semiconductor Corp.*
2.000%, 02/01/23 | | | 1,968,588 | |
| | 5,250,000 | | | | | DocuSign, Inc.*
0.500%, 09/15/23 | | | 4,921,796 | |
| | 2,000,000 | | | | | Envestnet, Inc.
1.750%, 12/15/19 | | | 2,070,320 | |
| | 2,100,000 | | | | | Guidewire Software, Inc.
1.250%, 03/15/25 | | | 2,118,753 | |
| | 1,760,000 | | | | | II-VI, Inc.
0.250%, 09/01/22 | | | 1,811,524 | |
| | 7,000,000 | | | | | Intel Corp.
3.250%, 08/01/39 | | | 16,042,880 | |
| | 4,285,000 | | | | | Lumentum Holdings, Inc.
0.250%, 03/15/24 | | | 4,887,964 | |
| | 6,200,000 | | | | | Microchip Technology, Inc.
1.625%, 02/15/27 | | | 5,876,174 | |
| | 3,998,000 | | | | | New Relic, Inc.*
0.500%, 05/01/23 | | | 4,215,171 | |
| | 3,775,000 | | | | | NXP Semiconductors, NV
1.000%, 12/01/19 | | | 3,824,339 | |
| | 6,184,000 | | | | | ON Semiconductor Corp.
1.000%, 12/01/20 | | | 6,937,922 | |
| | 6,125,000 | | | | | Palo Alto Networks, Inc.*
0.750%, 07/01/23 | | | 5,956,042 | |
| | 2,000,000 | | | | | Pure Storage, Inc.*
0.125%, 04/15/23 | | | 2,054,370 | |
| | 2,000,000 | | | | | RealPage, Inc.^
1.500%, 11/15/22 | | | 2,750,870 | |
| | 4,375,000 | | | | | Silicon Laboratories, Inc.^
1.375%, 03/01/22 | | | 4,725,919 | |
| | | | |
| 104 | | CALAMOS OPEN-END FAMILY OF FUNDS ANNUAL REPORT | | See accompanying Notes to Schedule of Investments |
Growth and Income Fund Schedule of Investments October 31, 2018
| | | | | | | | | | |
PRINCIPAL
AMOUNT | | | | | | | VALUE | |
| | 5,165,000 | | | | | Splunk, Inc.*
0.500%, 09/15/23 | | $ | 4,942,957 | |
| | 1,650,000 | | | | | Twilio, Inc. - Class A*
0.250%, 06/01/23 | | | 2,061,906 | |
| | 5,100,000 | | | | | Wix.com, Ltd.*
0.000%, 07/01/23 | | | 5,014,346 | |
| | 12,000,000 | | | | | Workday, Inc.
0.250%, 10/01/22 | | | 13,339,620 | |
| | 7,320,000 | | | | | Zendesk, Inc.*
0.250%, 03/15/23 | | | 8,029,125 | |
| | | | | | | | | | |
| | | | | | | | | 113,036,440 | |
| | | | | | | | | | |
| | | | | | Materials (0.3%) | | | | |
| | 5,150,000 | | | | | Royal Gold, Inc.^
2.875%, 06/15/19 | | | 5,199,440 | |
| | | | | | | | | | |
| | | | | | Real Estate (0.8%) | |
| | 7,345,000 | | | | | Empire State Realty OP, LP*
2.625%, 08/15/19 | | | 7,294,797 | |
| | 3,440,000 | | | | | IH Merger Sub, LLC
3.500%, 01/15/22 | | | 3,686,597 | |
| | 3,950,000 | | | | | Starwood Property Trust, Inc.^
4.000%, 01/15/19 | | | 4,383,295 | |
| | | | | | | | | | |
| | | | | | | | | 15,364,689 | |
| | | | | | | | | | |
| | | | | | Utilities (0.3%) | |
| | 5,100,000 | | | | | NRG Energy, Inc.*^
2.750%, 06/01/48 | | | 5,305,632 | |
| | | | | | | | | | |
| | | | | | TOTAL CONVERTIBLE BONDS
(Cost $247,333,536) | | | 256,123,957 | |
| | | | | | | | | | |
| | | | | | | | | | |
| | SYNTHETIC CONVERTIBLE SECURITIES (5.4%)¤ | |
| | Corporate Bonds (3.2%) | |
| | | | | | Communication Services (0.5%) | |
| | 9,865,000 | | | | | Alphabet, Inc.
3.375%, 02/25/24 | | | 9,850,696 | |
| | | | | | | | | | |
| | | | | | Consumer Discretionary (1.6%) | |
| | 5,153,000 | | | | | Dana, Inc.
5.500%, 12/15/24 | | | 4,967,492 | |
| | 4,235,000 | | | | | GameStop Corp.*^
6.750%, 03/15/21 | | | 4,272,332 | |
| | 9,900,000 | | | | | Home Depot, Inc.
2.700%, 04/01/23 | | | 9,598,000 | |
| | 10,000,000 | | | | | L Brands, Inc.
5.625%, 02/15/22 | | | 10,160,200 | |
| | 2,429,000 | | | | | Lowe’s Companies, Inc.^
3.875%, 09/15/23 | | | 2,461,111 | |
| | | | | | | | | | |
| | | | | | | | | 31,459,135 | |
| | | | | | | | | | |
| | | | | | Consumer Staples (0.5%) | |
| | 9,865,000 | | | | | Walmart, Inc.
3.300%, 04/22/24 | | | 9,784,206 | |
| | | | | | | | | | |
| | | | | | | | | | |
PRINCIPAL
AMOUNT | | | | | | | VALUE | |
| | | | | | | | | | |
| | | | | | Financials (0.2%) | |
| | 4,950,000 | | | | | Berkshire Hathaway, Inc.
2.750%, 03/15/23 | | $ | 4,809,469 | |
| | | | | | | | | | |
| | | | | | Health Care (0.2%) | | | | |
| | 3,000,000 | | | | | Universal Health Services, Inc.*
4.750%, 08/01/22 | | | 3,015,870 | |
| | | | | | | | | | |
| | | | | | Information Technology (0.2%) | |
| | 4,935,000 | | | | | Apple, Inc.
3.450%, 05/06/24 | | | 4,888,710 | |
| | | | | | | | | | |
| | | | | | TOTAL CORPORATE BONDS | | | 63,808,086 | |
| | | | | | | | | | |
| | U.S. Government and Agency Securities (2.1%) | |
| | | | | | United States Treasury Note | | | | |
| | 11,600,000 | | | | | 1.125%, 06/30/21 | | | 11,072,566 | |
| | 10,800,000 | | | | | 2.000%, 01/31/20 | | | 10,698,138 | |
| | 8,450,000 | | | | | 2.750%, 02/15/19 | | | 8,458,598 | |
| | 5,800,000 | | | | | 1.625%, 05/15/26^ | | | 5,231,835 | |
| | 5,500,000 | | | | | 2.000%, 11/15/26 | | | 5,068,381 | |
| | | | | | | | | | |
| | | | | | TOTAL U.S. GOVERNMENT AND AGENCY SECURITIES | | | 40,529,518 | |
| | | | | | | | | | |
| | | | | | | | | | |
NUMBER OF
CONTRACTS/
NOTIONAL
AMOUNT | | | | | | | VALUE | |
| | Purchased Options (0.1%)# | |
| | | | | | Information Technology (0.0%) | |
| 460
3,872,740 |
| | | | Paypal Holdings, Inc. Call, 01/18/19, Strike $90.00 | | | 120,060 | |
| | | | | | | | | | |
| | | | | | Other (0.1%) | |
| | | | | | iShares China Large-Cap ETF | | | | |
| 3,800
14,930,200 |
| | | | Call, 12/21/18, Strike $42.00 | | | 180,500 | |
| 3,600
14,144,400 |
| | | | Call, 11/16/18, Strike $44.00 | | | 7,200 | |
| 8,800
54,964,800 |
| | | | iShares MSCI EAFE ETF
Call, 12/21/18, Strike $67.00 | | | 110,000 | |
| 3,740
14,645,840 |
| | | | iShares MSCI Emerging Markets
Call, 12/21/18, Strike $43.00 | | | 57,970 | |
| 975
14,627,925 |
| | | | iShares Russell 2000 ETF
Call, 02/15/19, Strike $148.00 | | | 832,163 | |
| | | | | | | | | | |
| | | | | | | | | 1,187,833 | |
| | | | | | | | | | |
| | | | | | TOTAL PURCHASED OPTIONS | | | 1,307,893 | |
| | | | | | | | | | |
| TOTAL SYNTHETIC CONVERTIBLE
SECURITIES
(Cost $112,007,143) | | | 105,645,497 | |
| | | | | | | | | | |
| | | | | | | | | | |
| | | | | | |
| See accompanying Notes to Schedule of Investments | | www.calamos.com | | | 105 | |
Growth and Income Fund Schedule of Investments October 31, 2018
| | | | | | | | | | |
NUMBER OF
SHARES | | | | | | | VALUE | |
| | CONVERTIBLE PREFERRED STOCKS (5.8%) | |
| | | | | | Energy (0.4%) | |
| | 113,330 | | | | | Hess Corp.
8.000%, 02/01/19 | | $ | 7,195,322 | |
| | | | | | | | | | |
| | | | | | Financials (0.2%) | |
| | 80,250 | | | | | AMG Capital Trust II^
5.150%, 10/15/37 | | | 4,384,338 | |
| | | | | | | | | | |
| | | | | | Health Care (0.3%) | |
| | 104,250 | | | | | Becton Dickinson and Company
6.125%, 05/01/20 | | | 6,116,348 | |
| | | | | | | | | | |
| | | | | | Industrials (1.7%) | |
| | 10,100 | | | | | Fortive Corp.
5.000%, 07/01/21 | | | 9,920,321 | |
| | 204,910 | | | | | Rexnord Corp.
5.750%, 11/15/19 | | | 11,714,704 | |
| | 122,025 | | | | | Stanley Black & Decker, Inc.^
5.375%, 05/15/20 | | | 11,195,794 | |
| | | | | | | | | | |
| | | | | | | | | 32,830,819 | |
| | | | | | | | | | |
| | | | | | Materials (0.2%) | |
| | 83,500 | | | | | International Flavors & Fragrances, Inc.
6.000%, 09/15/21 | | | 4,807,930 | |
| | | | | | | | | | |
| | | | | | Real Estate (0.7%) | |
| | 14,350 | | | | | Crown Castle International Corp.
6.875%, 08/01/20 | | | 14,995,750 | |
| | | | | | | | | | |
| | | | | | Utilities (2.3%) | |
| | 80,675 | | | | | CenterPoint Energy, Inc. (Warner Media, LLC, Charter Communications Time, Inc.)§**
3.399%, 09/15/29 | | | 3,505,813 | |
| | 39,953 | | | | | Dominion Energy, Inc.
6.750%, 08/15/19 | | | 1,915,746 | |
| | 180,700 | | | | | DTE Energy Company
6.500%, 10/01/19 | | | 9,636,731 | |
| | 395,600 | | | | | NextEra Energy, Inc.
6.123%, 09/01/19 | | | 22,944,800 | |
| | | | | | Sempra Energy | | | | |
| | 41,640 | | | | | 6.750%, 07/15/21 | | | 4,151,925 | |
| | 30,200 | | | | | 6.000%, 01/15/21 | | | 2,994,632 | |
| | | | | | | | | | |
| | | | | | | | | 45,149,647 | |
| | | | | | | | | | |
| | | | | | TOTAL CONVERTIBLE PREFERRED STOCKS
(Cost $114,136,371) | | | 115,480,154 | |
| | | | | | | | | | |
| | | | | | | | | | |
| | COMMON STOCKS (70.7%) | |
| | | | | | Communication Services (7.5%) | |
| | 45,055 | | | | | Alphabet, Inc. - Class A# | | | 49,136,082 | |
| | 271,175 | | | | | AT&T, Inc. | | | 8,319,649 | |
| | | | | | | | | | |
NUMBER OF
SHARES | | | | | | | VALUE | |
| | 321,635 | | | | | Comcast Corp. - Class A | | $ | 12,267,159 | |
| | 182,000 | | | | | Facebook, Inc. - Class A# | | | 27,625,780 | |
| | 39,830 | | | | | Netflix, Inc.# | | | 12,019,897 | |
| | 319,000 | | | | | Verizon Communications, Inc. | | | 18,211,710 | |
| | 173,000 | | | | | Walt Disney Company^ | | | 19,865,590 | |
| | | | | | | | | | |
| | | | | | | | | 147,445,867 | |
| | | | | | | | | | |
| | | | | | Consumer Discretionary (6.8%) | |
| | 32,625 | | | | | Amazon.com, Inc.# | | | 52,135,076 | |
| | 46,230 | | | | | Aptiv, PLC | | | 3,550,464 | |
| | 69,680 | | | | | Dollar Tree, Inc.# | | | 5,874,024 | |
| | 16,650 | | | | | Expedia Group, Inc. | | | 2,088,410 | |
| | 110,420 | | | | | General Motors Company | | | 4,040,268 | |
| | 141,235 | | | | | Home Depot, Inc. | | | 24,840,412 | |
| | 72,300 | | | | | Lowe’s Companies, Inc. | | | 6,884,406 | |
| | 62,615 | | | | | McDonald’s Corp. | | | 11,076,593 | |
| | 100,640 | | | | | Nike, Inc. - Class B | | | 7,552,026 | |
| | 27,775 | | | | | PVH Corp. | | | 3,354,942 | |
| | 38,060 | | | | | Royal Caribbean Cruises, Ltd. | | | 3,986,024 | |
| | 80,305 | | | | | Starbucks Corp. | | | 4,679,372 | |
| | 50,060 | | | | | TJX Companies, Inc. | | | 5,500,593 | |
| | | | | | | | | | |
| | | | | | | | | 135,562,610 | |
| | | | | | | | | | |
| | | | | | Consumer Staples (5.8%) | |
| | 438,800 | | | | | Coca-Cola Company | | | 21,009,744 | |
| | 63,700 | | | | | Costco Wholesale Corp. | | | 14,563,731 | |
| | 69,700 | | | | | Kroger Company | | | 2,074,272 | |
| | 253,435 | | | | | Mondelez International, Inc. - Class A | | | 10,639,201 | |
| | 138,150 | | | | | PepsiCo, Inc. | | | 15,525,297 | |
| | 159,000 | | | | | Philip Morris International, Inc. | | | 14,003,130 | |
| | 208,455 | | | | | Procter & Gamble Company | | | 18,485,789 | |
| | 61,015 | | | | | Walgreens Boots Alliance, Inc. | | | 4,867,167 | |
| | 131,200 | | | | | Walmart, Inc. | | | 13,156,736 | |
| | | | | | | | | | |
| | | | | | | | | 114,325,067 | |
| | | | | | | | | | |
| | | | | | Energy (4.3%) | |
| | 192,360 | | | | | Chevron Corp. | | | 21,476,994 | |
| | 101,580 | | | | | ConocoPhillips | | | 7,100,442 | |
| | 110,600 | | | | | EOG Resources, Inc. | | | 11,650,604 | |
| | 304,530 | | | | | Exxon Mobil Corp. | | | 24,264,950 | |
| | 86,245 | | | | | Halliburton Company | | | 2,990,977 | |
| | 92,435 | | | | | Marathon Petroleum Corp. | | | 6,512,046 | |
| | 37,275 | | | | | Pioneer Natural Resources Company | | | 5,489,489 | |
| | 124,000 | | | | | Schlumberger, Ltd. | | | 6,362,440 | |
| | | | | | | | | | |
| | | | | | | | | 85,847,942 | |
| | | | | | | | | | |
| | | | | | Financials (11.2%) | |
| | 201,860 | | | | | American International Group, Inc. | | | 8,334,799 | |
| | 1,168,755 | | | | | Bank of America Corp.~ | | | 32,140,762 | |
| | | | |
| 106 | | CALAMOS OPEN-END FAMILY OF FUNDS ANNUAL REPORT | | See accompanying Notes to Schedule of Investments |
Growth and Income Fund Schedule of Investments October 31, 2018
| | | | | | | | | | |
NUMBER OF
SHARES | | | | | | | VALUE | |
| | 101,675 | | | | | Capital One Financial Corp. | | $ | 9,079,577 | |
| | 42,480 | | | | | Cboe Global Markets, Inc. | | | 4,793,868 | |
| | 83,850 | | | | | Chubb Corp. | | | 10,473,703 | |
| | 195,500 | | | | | Citigroup, Inc. | | | 12,797,430 | |
| | 44,000 | | | | | Discover Financial Services | | | 3,065,480 | |
| | 190,500 | | | | | E*TRADE Financial Corp. | | | 9,414,510 | |
| | 51,670 | | | | | Goldman Sachs Group, Inc. | | | 11,644,868 | |
| | 155,565 | | | | | Intercontinental Exchange, Inc. | | | 11,984,728 | |
| | 362,535 | | | | | JPMorgan Chase & Company | | | 39,523,566 | |
| | 299,725 | | | | | KeyCorp | | | 5,443,006 | |
| | 122,180 | | | | | Marsh & McLennan Companies, Inc. | | | 10,354,755 | |
| | 88,905 | | | | | MetLife, Inc. | | | 3,661,997 | |
| | 103,375 | | | | | Morgan Stanley | | | 4,720,103 | |
| | 82,600 | | | | | Northern Trust Corp. | | | 7,770,182 | |
| | 56,450 | | | | | PNC Financial Services Group, Inc. | | | 7,253,260 | |
| | 89,829 | | | | | Prudential Financial, Inc. | | | 8,424,164 | |
| | 152,895 | | | | | US Bancorp | | | 7,991,822 | |
| | 167,345 | | | | | Wells Fargo & Company | | | 8,907,774 | |
| | 72,550 | | | | | Zions Bancorporation, N.A. ^ | | | 3,413,478 | |
| | | | | | | | | | |
| | | | | | | | | 221,193,832 | |
| | | | | | | | | | |
| | | | | | Health Care (11.4%) | |
| | 118,790 | | | | | AbbVie, Inc. | | | 9,247,801 | |
| | 119,860 | | | | | Agilent Technologies, Inc. | | | 7,765,729 | |
| | 34,325 | | | | | Alexion Pharmaceuticals, Inc.# | | | 3,846,803 | |
| | 48,145 | | | | | Anthem, Inc. | | | 13,267,318 | |
| | 236,885 | | | | | Baxter International, Inc. | | | 14,807,681 | |
| | 13,900 | | | | | Biogen, Inc.# | | | 4,229,353 | |
| | 75,420 | | | | | Bristol-Myers Squibb Company | | | 3,811,727 | |
| | 85,840 | | | | | Celgene Corp.# | | | 6,146,144 | |
| | 24,100 | | | | | Edwards Lifesciences Corp.# | | | 3,557,160 | |
| | 83,040 | | | | | Gilead Sciences, Inc. | | | 5,661,667 | |
| | 26,750 | | | | | Humana, Inc. | | | 8,570,967 | |
| | 5,875 | | | | | Intuitive Surgical, Inc.# | | | 3,061,933 | |
| | 288,240 | | | | | Johnson & Johnson | | | 40,350,718 | |
| | 27,900 | | | | | Laboratory Corp. of America Holdings# | | | 4,479,345 | |
| | 131,210 | | | | | Medtronic, PLC | | | 11,785,282 | |
| | 222,685 | | | | | Merck & Company, Inc. | | | 16,391,843 | |
| | 28,317 | | | | | Molina Healthcare, Inc.^# | | | 3,589,746 | |
| | 487,630 | | | | | Pfizer, Inc. | | | 20,997,348 | |
| | 31,390 | | | | | Stryker Corp. | | | 5,092,086 | |
| | 7,500 | | | | | Teleflex, Inc. | | | 1,805,550 | |
| | 36,935 | | | | | Thermo Fisher Scientific, Inc. | | | 8,629,863 | |
| | 111,850 | | | | | UnitedHealth Group, Inc. | | | 29,231,997 | |
| | | | | | | | | | |
| | | | | | | | | 226,328,061 | |
| | | | | | | | | | |
| | | | | | Industrials (7.3%) | |
| | 47,150 | | | | | Boeing Company | | | 16,731,649 | |
| | 98,265 | | | | | Caterpillar, Inc. | | | 11,921,510 | |
| | | | | | | | | | |
NUMBER OF
SHARES | | | | | | | VALUE | |
| | 220,325 | | | | | CSX Corp. | | $ | 15,171,579 | |
| | 416,000 | | | | | Delta Air Lines, Inc. | | | 22,767,680 | |
| | 128,475 | | | | | Emerson Electric Company | | | 8,720,883 | |
| | 472,245 | | | | | General Electric Company | | | 4,769,675 | |
| | 138,300 | | | | | Honeywell International, Inc. | | | 20,028,606 | |
| | 34,300 | | | | | Lockheed Martin Corp. | | | 10,079,055 | |
| | 60,350 | | | | | Northrop Grumman Corp. | | | 15,808,682 | |
| | 23,050 | | | | | Resideo Technologies, Inc.# | | | 485,203 | |
| | 122,000 | | | | | Union Pacific Corp. | | | 17,838,840 | |
| | | | | | | | | | |
| | | | | | | | | 144,323,362 | |
| | | | | | | | | | |
| | | | | | Information Technology (13.8%) | |
| | 67,175 | | | | | Accenture, PLC - Class A | | | 10,588,123 | |
| | 26,280 | | | | | Adobe, Inc.# | | | 6,458,573 | |
| | 400,735 | | | | | Apple, Inc.~ | | | 87,704,862 | |
| | 35,450 | | | | | Broadcom, Inc. | | | 7,922,721 | |
| | 353,500 | | | | | Cisco Systems, Inc. | | | 16,172,625 | |
| | 21,300 | | | | | Fidelity National Information Services, Inc. | | | 2,217,330 | |
| | 47,891 | | | | | Lam Research Corp. | | | 6,787,591 | |
| | 92,725 | | | | | MasterCard, Inc. - Class A | | | 18,328,951 | |
| | 632,505 | | | | | Microsoft Corp.~ | | | 67,557,859 | |
| | 51,750 | | | | | NVIDIA Corp. | | | 10,910,452 | |
| | 113,400 | | | | | Oracle Corp. | | | 5,538,456 | |
| | 60,370 | | | | | Salesforce.com, Inc.# | | | 8,285,179 | |
| | 179,460 | | | | | Visa, Inc. - Class A | | | 24,738,561 | |
| | | | | | | | | | |
| | | | | | | | | 273,211,283 | |
| | | | | | | | | | |
| | | | | | Materials (0.9%) | |
| | 248,750 | | | | | DowDuPont, Inc. | | | 13,412,600 | |
| | 70,000 | | | | | Nucor Corp. | | | 4,138,400 | |
| | | | | | | | | | |
| | | | | | | | | 17,551,000 | |
| | | | | | | | | | |
| | | | | | Real Estate (0.9%) | |
| | 96,520 | | | | | American Tower Corp. | | | 15,038,781 | |
| | 49,000 | | | | | Welltower, Inc. | | | 3,237,430 | |
| | | | | | | | | | |
| | | | | | | | | 18,276,211 | |
| | | | | | | | | | |
| | | | | | Utilities (0.8%) | |
| | 345,213 | | | | | Exelon Corp. | | | 15,123,782 | |
| | | | | | | | | | |
| | | | | | TOTAL COMMON STOCKS
(Cost $994,329,367) | | | 1,399,189,017 | |
| | | | | | | | | | |
| | | | | | | | | | |
| | EXCHANGE-TRADED FUNDS (1.9%) | |
| | | | | | Other (1.9%) | |
| | 281,135 | | | | | iShares MSCI EAFE ETF^ | | | 17,559,692 | |
| | 108,250 | | | | | iShares MSCI Emerging Markets ETF | | | 4,239,070 | |
| | 123,400 | | | | | iShares Russell 2000 Value ETF^ | | | 14,949,910 | |
| | | | | | | | | | |
| | | | | | TOTAL EXCHANGE-TRADED FUNDS
(Cost $39,461,997) | | | 36,748,672 | |
| | | | | | | | | | |
| | | | | | |
| See accompanying Notes to Schedule of Investments | | www.calamos.com | | | 107 | |
Growth and Income Fund Schedule of Investments October 31, 2018
| | | | | | | | | | |
NUMBER OF
CONTRACTS/
NOTIONAL
AMOUNT | | | | | | | VALUE | |
| | PURCHASED OPTION (0.1%)# | |
| | | | | | Other (0.1%) | |
| 109
29,557,966 |
| | | | S&P 500 Index
Put, 12/21/18, Strike $2,900.00
(Cost $592,223) | | $ | 2,132,040 | |
| | | | | | | | | | |
| | | | | | | | | | |
NUMBER OF
SHARES | | | | | | | VALUE | |
| | SHORT TERM INVESTMENTS (3.0%) | |
| | 29,731,925 | | | | | Fidelity Prime Money Market Fund - Institutional Class, 2.240%*** | | | 29,740,845 | |
| | 29,579,464 | | | | | Morgan Stanley Institutional Liquidity Funds - Government Portfolio, 2.050%*** | | | 29,579,464 | |
| | | | | | | | | | |
| | | | | | TOTAL SHORT TERM INVESTMENTS
(Cost $59,322,573) | | | 59,320,309 | |
| | | | | | | | | | |
NUMBER OF
SHARES/
PRINCIPAL
AMOUNT | | | | | | | VALUE | |
| INVESTMENT OF CASH COLLATERAL FOR SECURITIES
LOANED (2.7%) |
|
| | 32,421,164 | | | | | Fidelity Prime Money Market Fund - Institutional Class, 2.240%***† | | | 32,421,164 | |
| | 20,136,793 | | | | | State Street Navigator Securities Lending Government Money Market Portfolio† | | | 20,136,793 | |
| | | | | | | | | | |
| | | | | | TOTAL INVESTMENT OF
CASH COLLATERAL FOR
SECURITIES LOANED
(Cost $52,557,957) | | | 52,557,957 | |
| | | | | | | | | | |
| TOTAL INVESTMENTS (102.5%)
(Cost $1,619,741,167) | | | 2,027,197,603 | |
| | | | | | | | | | |
| |
| | PAYABLE UPON RETURN OF SECURITIES ON LOAN (-2.7%) | | | (52,557,957 | ) |
| | | | | | | | | | |
| |
| | OTHER ASSETS, LESS LIABILITIES (0.2%) | | | 3,809,089 | |
| | | | | | | | | | |
| |
| | NET ASSETS (100.0%) | | $ | 1,978,448,735 | |
| | | | | | | | | | |
FORWARD FOREIGN CURRENCY CONTRACTS
| | | | | | | | | | | | | | | | |
COUNTER
PARTY | | LONG
CONTRACTS | | SETTLEMENT
DATE | | LOCAL
CURRENCY | | | CURRENT
VALUE | | | UNREALIZED
GAIN/LOSS | |
| State Street Bank and Trust | | European Monetary Unit | | 01/24/19 | | | 503,000 | | | $ | 574,128 | | | $ | (2,896 | ) |
| State Street Bank and Trust | | European Monetary Unit | | 01/24/19 | | | 334,000 | | | | 381,230 | | | | (5,602 | ) |
| Northern Trust Company | | Hong Kong Dollar | | 01/24/19 | | | 665,000 | | | | 84,969 | | | | (8 | ) |
| | | | | | | | | | | | | | | | |
| | | | | | | | | | | | | | $ | (8,506 | ) |
| | | | | | | | | | | | | | | | |
| | | | | |
COUNTER
PARTY | | SHORT
CONTRACTS | | SETTLEMENT
DATE | | LOCAL
CURRENCY | | | CURRENT
VALUE | | | UNREALIZED
GAIN/LOSS | |
| State Street Bank and Trust | | European Monetary Unit | | 01/24/19 | | | 2,862,000 | | | $ | 3,266,711 | | | $ | 75,473 | |
| Bank of New York | | Hong Kong Dollar | | 01/24/19 | | | 10,656,000 | | | | 1,361,553 | | | | 318 | |
| Bank of New York | | Hong Kong Dollar | | 01/24/19 | | | 14,478,000 | | | | 1,849,903 | | | | (145 | ) |
| | | | | | | | | | | | | | | | |
| | | | | | | | | | | | | | $ | 75,646 | |
| | | | | | | | | | | | | | | | |
NOTES TO SCHEDULE OF INVESTMENTS
| * | Securities issued and sold pursuant to a Rule 144A transaction are excepted from the registration requirement of the Securities Act of 1933, as amended. These securities may only be sold to qualified institutional buyers (“QIBs”), such as the Fund. Any resale of these securities must generally be effected through a sale that is registered under the Act or otherwise exempted from such registration requirements. |
| ^ | Security, or portion of security, is on loan. |
| § | Securities exchangeable or convertible into securities of one or more entities that are different than the issuer. Each entity is identified in the parenthetical. |
| ~ | Security, or portion of security, is segregated as collateral (or collateral for potential future transactions) for written options. The aggregate value of such securities is $2,100,282. |
| ¤ | The synthetic convertible securities strategy combines separate securities that together possess the economic characteristics similar to a convertible security. |
| # | Non-income producing security. |
| ** | Step coupon security. Coupon changes periodically based upon a predetermined schedule. The rate shown is the rate in effect at October 31, 2018. |
| *** | The rate disclosed is the 7 day net yield as of October 31, 2018. |
| † | Represents investment of cash collateral received from securities on loan as of October 31, 2018. |
Note: The principal amount for such securities is shown in the respective foreign currency. The date on options represents the expiration date of the option contract. The option contract may be exercised at any date on or before the date shown.
| | | | |
| 108 | | CALAMOS OPEN-END FAMILY OF FUNDS ANNUAL REPORT | | See accompanying Notes to Financial Statements |
Dividend Growth Fund Schedule of Investments October 31, 2018
| | | | | | | | | | |
NUMBER OF
SHARES | | | | | | | VALUE | |
| | COMMON STOCKS (97.9%) | |
| | | | | | Communication Services (10.2%) | |
| | 95 | | | | | Alphabet, Inc. - Class A# | | $ | 103,605 | |
| | 560 | | | | | Alphabet, Inc. - Class C# | | | 602,991 | |
| | 9,471 | | | | | AT&T, Inc. | | | 290,570 | |
| | 235 | | | | | Charter Communications, Inc. - Class A# | | | 75,287 | |
| | 4,410 | | | | | Comcast Corp. - Class A | | | 168,197 | |
| | 765 | | | | | Electronic Arts, Inc.# | | | 69,600 | |
| | 2,860 | | | | | Facebook, Inc. - Class A# | | | 434,120 | |
| | 490 | | | | | Netflix, Inc.# | | | 147,872 | |
| | 5,105 | | | | | Verizon Communications, Inc. | | | 291,445 | |
| | 2,160 | | | | | Walt Disney Company^ | | | 248,033 | |
| | | | | | | | | | |
| | | | | | | | | 2,431,720 | |
| | | | | | | | | | |
| | | | | | Consumer Discretionary (9.5%) | |
| | 465 | | | | | Amazon.com, Inc.# | | | 743,075 | |
| | 580 | | | | | Aptiv, PLC | | | 44,544 | |
| | 70 | | | | | Booking Holdings, Inc.# | | | 131,221 | |
| | 950 | | | | | Dollar Tree, Inc.# | | | 80,085 | |
| | 310 | | | | | Expedia Group, Inc. | | | 38,883 | |
| | 1,385 | | | | | General Motors Company | | | 50,677 | |
| | 1,765 | | | | | Home Depot, Inc. | | | 310,428 | |
| | 863 | | | | | Lowe’s Companies, Inc. | | | 82,175 | |
| | 1,660 | | | | | McDonald’s Corp. | | | 293,654 | |
| | 1,595 | | | | | Nike, Inc. - Class B | | | 119,689 | |
| | 345 | | | | | PVH Corp. | | | 41,673 | |
| | 700 | | | | | Royal Caribbean Cruises, Ltd. | | | 73,311 | |
| | 1,235 | | | | | Starbucks Corp. | | | 71,963 | |
| | 1,080 | | | | | Target Corp. | | | 90,320 | |
| | 855 | | | | | TJX Companies, Inc. | | | 93,947 | |
| | | | | | | | | | |
| | | | | | | | | 2,265,645 | |
| | | | | | | | | | |
| | | | | | Consumer Staples (6.6%) | |
| | 1,050 | | | | | Altria Group, Inc. | | | 68,292 | |
| | 5,745 | | | | | Coca-Cola Company | | | 275,071 | |
| | 920 | | | | | Costco Wholesale Corp. | | | 210,340 | |
| | 1,790 | | | | | Kroger Company | | | 53,270 | |
| | 3,150 | | | | | Mondelez International, Inc. - Class A | | | 132,237 | |
| | 1,717 | | | | | PepsiCo, Inc. | | | 192,956 | |
| | 1,950 | | | | | Philip Morris International, Inc. | | | 171,736 | |
| | 2,790 | | | | | Procter & Gamble Company | | | 247,417 | |
| | 950 | | | | | Walgreens Boots Alliance, Inc. | | | 75,782 | |
| | 1,645 | | | | | Walmart, Inc. | | | 164,961 | |
| | | | | | | | | | |
| | | | | | | | | 1,592,062 | |
| | | | | | | | | | |
| | | | | | Energy (6.0%) | | | | |
| | 3,255 | | | | | Chevron Corp. | | | 363,421 | |
| | 2,915 | | | | | ConocoPhillips | | | 203,758 | |
| | 880 | | | | | EOG Resources, Inc. | | | 92,699 | |
| | | | | | | | | | |
NUMBER OF
SHARES | | | | | | | VALUE | |
| | 4,720 | | | | | Exxon Mobil Corp. | | $ | 376,090 | |
| | 1,060 | | | | | Halliburton Company | | | 36,761 | |
| | 1,500 | | | | | Marathon Petroleum Corp. | | | 105,675 | |
| | 1,020 | | | | | Phillips 66 | | | 104,876 | |
| | 460 | | | | | Pioneer Natural Resources Company | | | 67,744 | |
| | 1,725 | | | | | Schlumberger, Ltd. | | | 88,510 | |
| | | | | | | | | | |
| | | | | | | | | 1,439,534 | |
| | | | | | | | | | |
| | | | | | Financials (14.7%) | |
| | 945 | | | | | American Express Company | | | 97,080 | |
| | 2,938 | | | | | American International Group, Inc. | | | 121,310 | |
| | 16,135 | | | | | Bank of America Corp. | | | 443,712 | |
| | 2,095 | | | | | Berkshire Hathaway, Inc. - Class B# | | | 430,062 | |
| | 1,270 | | | | | Capital One Financial Corp. | | | 113,411 | |
| | 535 | | | | | Cboe Global Markets, Inc. | | | 60,375 | |
| | 1,120 | | | | | Charles Schwab Corp. | | | 51,789 | |
| | 1,050 | | | | | Chubb Corp. | | | 131,156 | |
| | 2,415 | | | | | Citigroup, Inc. | | | 158,086 | |
| | 550 | | | | | Discover Financial Services | | | 38,319 | |
| | 1,770 | | | | | E*TRADE Financial Corp. | | | 87,473 | |
| | 610 | | | | | Goldman Sachs Group, Inc. | | | 137,476 | |
| | 1,910 | | | | | Intercontinental Exchange, Inc. | | | 147,146 | |
| | 4,745 | | | | | JPMorgan Chase & Company | | | 517,300 | |
| | 3,740 | | | | | KeyCorp | | | 67,918 | |
| | 915 | | | | | Marsh & McLennan Companies, Inc. | | | 77,546 | |
| | 1,095 | | | | | MetLife, Inc. | | | 45,103 | |
| | 1,535 | | | | | Morgan Stanley | | | 70,088 | |
| | 1,150 | | | | | Northern Trust Corp. | | | 108,181 | |
| | 820 | | | | | PNC Financial Services Group, Inc. | | | 105,362 | |
| | 1,545 | | | | | Prudential Financial, Inc. | | | 144,890 | |
| | 685 | | | | | Travelers Companies, Inc. | | | 85,714 | |
| | 2,360 | | | | | US Bancorp | | | 123,357 | |
| | 2,375 | | | | | Wells Fargo & Company~ | | | 126,421 | |
| | 905 | | | | | Zions Bancorporation, N.A. | | | 42,580 | |
| | | | | | | | | | |
| | | | | | | | | 3,531,855 | |
| | | | | | | | | | |
| | | | | | Health Care (14.0%) | | | | |
| | 2,100 | | | | | Abbott Laboratories | | | 144,774 | |
| | 1,710 | | | | | AbbVie, Inc. | | | 133,123 | |
| | 350 | | | | | Aetna, Inc. | | | 69,440 | |
| | 1,505 | | | | | Agilent Technologies, Inc. | | | 97,509 | |
| | 425 | | | | | Alexion Pharmaceuticals, Inc.# | | | 47,630 | |
| | 170 | | | | | Allergan, PLC | | | 26,862 | |
| | 380 | | | | | Anthem, Inc. | | | 104,717 | |
| | 2,310 | | | | | Baxter International, Inc. | | | 144,398 | |
| | 170 | | | | | Biogen, Inc.# | | | 51,726 | |
| | 935 | | | | | Bristol-Myers Squibb Company | | | 47,255 | |
| | 830 | | | | | Celgene Corp.# | | | 59,428 | |
| | | | | | |
| See accompanying Notes to Schedule of Investments | | www.calamos.com | | | 109 | |
Dividend Growth Fund Schedule of Investments October 31, 2018
| | | | | | | | | | |
NUMBER OF
SHARES | | | | | | | VALUE | |
| | 305 | | | | | Edwards Lifesciences Corp.# | | $ | 45,018 | |
| | 1,360 | | | | | Gilead Sciences, Inc. | | | 92,725 | |
| | 335 | | | | | Humana, Inc. | | | 107,337 | |
| | 255 | | | | | Illumina, Inc.# | | | 79,343 | |
| | 70 | | | | | Intuitive Surgical, Inc.# | | | 36,483 | |
| | 4,165 | | | | | Johnson & Johnson~ | | | 583,058 | |
| | 760 | | | | | Laboratory Corp. of America Holdings# | | | 122,018 | |
| | 1,835 | | | | | Medtronic, PLC | | | 164,820 | |
| | 3,215 | | | | | Merck & Company, Inc. | | | 236,656 | |
| | 7,210 | | | | | Pfizer, Inc. | | | 310,462 | |
| | 390 | | | | | Stryker Corp. | | | 63,266 | |
| | 95 | | | | | Teleflex, Inc. | | | 22,870 | |
| | 875 | | | | | Thermo Fisher Scientific, Inc. | | | 204,444 | |
| | 1,400 | | | | | UnitedHealth Group, Inc. | | | 365,890 | |
| | | | | | | | | | |
| | | | | | | | | 3,361,252 | |
| | | | | | | | | | |
| | | | | | Industrials (9.5%) | | | | |
| | 740 | | | | | Boeing Company | | | 262,596 | |
| | 1,195 | | | | | Caterpillar, Inc. | | | 144,977 | |
| | 2,740 | | | | | CSX Corp. | | | 188,676 | |
| | 4,720 | | | | | Delta Air Lines, Inc. | | | 258,326 | |
| | 1,575 | | | | | Emerson Electric Company | | | 106,911 | |
| | 7,760 | | | | | General Electric Company | | | 78,376 | |
| | 2,649 | | | | | Honeywell International, Inc. | | | 383,628 | |
| | 1,285 | | | | | Ingersoll-Rand, PLC | | | 123,283 | |
| | 705 | | | | | Lockheed Martin Corp. | | | 207,164 | |
| | 355 | | | | | Northrop Grumman Corp. | | | 92,992 | |
| | 442 | | | | | Resideo Technologies, Inc.# | | | 9,294 | |
| | 1,225 | | | | | Southwest Airlines Company | | | 60,148 | |
| | 1,125 | | | | | Stanley Black & Decker, Inc. | | | 131,085 | |
| | 1,600 | | | | | Union Pacific Corp. | | | 233,952 | |
| | | | | | | | | | |
| | | | | | | | | 2,281,408 | |
| | | | | | | | | | |
| | | | | | Information Technology (19.4%) | |
| | 950 | | | | | Accenture, PLC - Class A | | | 149,739 | |
| | 320 | | | | | Adobe, Inc.# | | | 78,643 | |
| | 5,385 | | | | | Apple, Inc. | | | 1,178,561 | |
| | 2,465 | | | | | Applied Materials, Inc. | | | 81,049 | |
| | 510 | | | | | Broadcom, Inc. | | | 113,980 | |
| | 5,360 | | | | | Cisco Systems, Inc. | | | 245,220 | |
| | 275 | | | | | Fidelity National Information Services, Inc. | | | 28,628 | |
| | 5,800 | | | | | Intel Corp. | | | 271,904 | |
| | 510 | | | | | International Business Machines Corp. | | | 58,869 | |
| | 590 | | | | | Lam Research Corp. | | | 83,621 | |
| | 1,150 | | | | | MasterCard, Inc. - Class A | | | 227,320 | |
| | 1,025 | | | | | Microchip Technology, Inc.^ | | | 67,424 | |
| | 8,790 | | | | | Microsoft Corp. | | | 938,860 | |
| | 755 | | | | | NVIDIA Corp. | | | 159,177 | |
| | 1,900 | | | | | Oracle Corp. | | | 92,796 | |
| | | | | | | | | | |
NUMBER OF
SHARES | | | | | | | VALUE | |
| | 185 | | | | | Red Hat, Inc.# | | $ | 31,753 | |
| | 1,490 | | | | | Salesforce.com, Inc.# | | | 204,488 | |
| | 1,530 | | | | | Texas Instruments, Inc. | | | 142,030 | |
| | 3,660 | | | | | Visa, Inc. - Class A | | | 504,531 | |
| | | | | | | | | | |
| | | | | | | | | 4,658,593 | |
| | | | | | | | | | |
| | | | | | Materials (2.5%) | | | | |
| | 710 | | | | | Avery Dennison Corp. | | | 64,411 | |
| | 3,790 | | | | | DowDuPont, Inc. | | | 204,357 | |
| | 1,200 | | | | | LyondellBasell Industries, NV - Class A | | | 107,124 | |
| | 975 | | | | | Nucor Corp. | | | 57,642 | |
| | 400 | | | | | Sherwin-Williams Company | | | 157,388 | |
| | | | | | | | | | |
| | | | | | | | | 590,922 | |
| | | | | | | | | | |
| | | | | | Real Estate (2.0%) | |
| | 1,170 | | | | | American Tower Corp. | | | 182,298 | |
| | 615 | | | | | Crown Castle International Corp. | | | 66,875 | |
| | 3,300 | | | | | Welltower, Inc. | | | 218,031 | |
| | | | | | | | | | |
| | | | | | | | | 467,204 | |
| | | | | | | | | | |
| | | | | | Utilities (3.5%) | |
| | 1,800 | | | | | Duke Energy Corp. | | | 148,734 | |
| | 5,825 | | | | | Exelon Corp. | | | 255,193 | |
| | 2,315 | | | | | NextEra Energy, Inc. | | | 399,338 | |
| | 225 | | | | | Sempra Energy^ | | | 24,777 | |
| | | | | | | | | | |
| | | | | | | | | 828,042 | |
| | | | | | | | | | |
| | | | | | TOTAL COMMON STOCKS
(Cost $17,774,332) | | | 23,448,237 | |
| | | | | | | | | | |
| | | | | | | | | | |
| | EXCHANGE-TRADED FUNDS (1.5%) | |
| | | | | | Other (1.5%) | | | | |
| | 560 | | | | | iShares NASDAQ Biotechnology ETF^ | | | 58,279 | |
| | 865 | | | | | iShares Russell 2000 ETF | | | 129,776 | |
| | 1,500 | | | | | iShares Russell 2000 Value ETF^ | | | 181,725 | |
| | | | | | | | | | |
| | | | | | | | | 369,780 | |
| | | | | | | | | | |
| | | | | | TOTAL EXCHANGE-TRADED FUNDS
(Cost $372,708) | | | 369,780 | |
| | | | | | | | | | |
| | | | | | | | | | |
| | SHORT TERM INVESTMENTS (0.3%) | |
| | 31,608 | | | | | Fidelity Prime Money Market Fund - Institutional Class, 2.240%*** | | | 31,618 | |
| | 31,614 | | | | | Morgan Stanley Institutional Liquidity Funds - Government Portfolio, 2.050%*** | | | 31,614 | |
| | | | | | | | | | |
| | | | | | TOTAL SHORT TERM INVESTMENTS
(Cost $63,232) | | | 63,232 | |
| | | | | | | | | | |
| TOTAL INVESTMENTS (99.7%)
(Cost $18,210,272) | | | 23,881,249 | |
| | | | | | | | | | |
| |
| | OTHER ASSETS, LESS LIABILITIES (0.3%) | | | 78,787 | |
| | | | | | | | | | |
| |
| | NET ASSETS (100.0%) | | $ | 23,960,036 | |
| | | | | | | | | | |
| | | | |
| 110 | | CALAMOS OPEN-END FAMILY OF FUNDS ANNUAL REPORT | | See accompanying Notes to Schedule of Investments |
Dividend Growth Fund Schedule of Investments October 31, 2018
NOTES TO SCHEDULE OF INVESTMENTS
| # | Non-income producing security. |
| ^ | Security, or portion of security, is on loan. |
| ~ | Security, or portion of security, is segregated as collateral (or collateral for potential future transactions) for written options. The aggregate value of such securities is $278,430. |
| *** | The rate disclosed is the 7 day net yield as of October 31, 2018. |
| | | | | | |
| See accompanying Notes to Financial Statements | | www.calamos.com | | | 111 | |
Opportunistic Value Fund Schedule of Investments October 31, 2018
| | | | | | | | | | |
NUMBER OF
SHARES | | | | | | | VALUE | |
| | COMMON STOCKS (98.5%) | |
| | | | | | Communication Services (6.3%) | |
| | 375 | | | | | Alphabet, Inc. - Class A# | | $ | 408,968 | |
| | 7,625 | | | | | AT&T, Inc. | | | 233,935 | |
| | 2,600 | | | | | CBS Corp. - Class B Non Voting | | | 149,110 | |
| | 495 | | | | | Charter Communications, Inc. - Class A# | | | 158,583 | |
| | 10,600 | | | | | Comcast Corp. - Class A | | | 404,284 | |
| | 5,340 | | | | | Discovery, Inc. - Class A# | | | 172,963 | |
| | 17,905 | | | | | Verizon Communications, Inc. | | | 1,022,196 | |
| | 3,840 | | | | | Walt Disney Company^ | | | 440,947 | |
| | | | | | | | | | |
| | | | | | | | | 2,990,986 | |
| | | | | | | | | | |
| | | | | | Consumer Discretionary (5.1%) | |
| | 325 | | | | | Amazon.com, Inc.# | | | 519,353 | |
| | 1,800 | | | | | Best Buy Company, Inc. | | | 126,288 | |
| | 1,000 | | | | | Burlington Stores, Inc.# | | | 171,490 | |
| | 975 | | | | | Home Depot, Inc. | | | 171,483 | |
| | 2,055 | | | | | Kohl’s Corp. | | | 155,625 | |
| | 3,500 | | | | | Macy’s, Inc. | | | 120,015 | |
| | 3,850 | | | | | MCBC Holdings, Inc.# | | | 114,268 | |
| | 2,110 | | | | | Michael Kors Holdings, Ltd.# | | | 116,915 | |
| | 1,865 | | | | | Nike, Inc. - Class B | | | 139,950 | |
| | 2,100 | | | | | Nordstrom, Inc. | | | 138,117 | |
| | 570 | | | | | O’Reilly Automotive, Inc.# | | | 182,828 | |
| | 3,000 | | | | | Target Corp. | | | 250,890 | |
| | 1,175 | | | | | TJX Companies, Inc. | | | 129,109 | |
| | 1,400 | | | | | VF Corp. | | | 116,032 | |
| | | | | | | | | | |
| | | | | | | | | 2,452,363 | |
| | | | | | | | | | |
| | | | | | Consumer Staples (7.0%) | |
| | 2,215 | | | | | Altria Group, Inc. | | | 144,064 | |
| | 2,400 | | | | | Church & Dwight Company, Inc. | | | 142,488 | |
| | 1,100 | | | | | Clorox Company | | | 163,295 | |
| | 5,370 | | | | | Coca-Cola Company | | | 257,116 | |
| | 2,100 | | | | | Energizer Holdings, Inc. | | | 123,417 | |
| | 1,530 | | | | | Hershey Company | | | 163,939 | |
| | 2,365 | | | | | Kellogg Company | | | 154,860 | |
| | 5,790 | | | | | Kroger Company | | | 172,310 | |
| | 1,630 | | | | | Lamb Weston Holdings, Inc. | | | 127,401 | |
| | 1,075 | | | | | McCormick & Company, Inc. | | | 154,800 | |
| | 5,300 | | | | | Mondelez International, Inc. - Class A | | | 222,494 | |
| | 2,190 | | | | | PepsiCo, Inc. | | | 246,112 | |
| | 1,610 | | | | | Post Holdings, Inc.# | | | 142,356 | |
| | 3,920 | | | | | Procter & Gamble Company | | | 347,626 | |
| | 2,400 | | | | | Sysco Corp. | | | 171,192 | |
| | 3,600 | | | | | Walgreens Boots Alliance, Inc. | | | 287,172 | |
| | 3,105 | | | | | Walmart, Inc. | | | 311,369 | |
| | | | | | | | | | |
| | | | | | | | | 3,332,011 | |
| | | | | | | | | | |
| | | | | | | | | | |
NUMBER OF
SHARES | | | | | | | VALUE | |
| | | | | | | | | | |
| | | | | | Energy (11.4%) | | | | |
| | 3,950 | | | | | Anadarko Petroleum Corp. | | $ | 210,140 | |
| | 3,690 | | | | | Cheniere Energy, Inc.# | | | 222,913 | |
| | 6,750 | | | | | Chevron Corp. | | | 753,637 | |
| | 6,660 | | | | | ConocoPhillips | | | 465,534 | |
| | 2,400 | | | | | Continental Resources, Inc.#^ | | | 126,432 | |
| | 2,780 | | | | | EOG Resources, Inc. | | | 292,845 | |
| | 16,925 | | | | | Exxon Mobil Corp. | | | 1,348,584 | |
| | 2,600 | | | | | HollyFrontier Corp. | | | 175,344 | |
| | 7,500 | | | | | Marathon Oil Corp. | | | 142,425 | |
| | 3,810 | | | | | Marathon Petroleum Corp. | | | 268,415 | |
| | 4,680 | | | | | Occidental Petroleum Corp. | | | 313,888 | |
| | 2,350 | | | | | ONEOK, Inc. | | | 154,160 | |
| | 4,500 | | | | | PBF Energy, Inc. - Class A | | | 188,325 | |
| | 1,050 | | | | | Phillips 66 | | | 107,961 | |
| | 23,500 | | | | | Southwestern Energy Company# | | | 125,490 | |
| | 3,850 | | | | | Valero Energy Corp. | | | 350,696 | |
| | 4,550 | | | | | Whiting Petroleum Corp.# | | | 169,715 | |
| | | | | | | | | | |
| | | | | | | | | 5,416,504 | |
| | | | | | | | | | |
| | | | | | Financials (22.5%) | | | | |
| | 1,705 | | | | | Allstate Corp. | | | 163,203 | |
| | 2,900 | | | | | American Express Company | | | 297,917 | |
| | 5,000 | | | | | Arch Capital Group, Ltd.# | | | 141,850 | |
| | 6,325 | | | | | Associated Banc-Corp | | | 146,614 | |
| | 1,410 | | | | | Assurant, Inc. | | | 137,066 | |
| | 19,800 | | | | | Bank of America Corp. | | | 544,500 | |
| | 7,890 | | | | | Berkshire Hathaway, Inc. - Class B# | | | 1,619,659 | |
| | 5,550 | | | | | Brown & Brown, Inc. | | | 156,399 | |
| | 2,635 | | | | | Capital One Financial Corp. | | | 235,305 | |
| | 10,350 | | | | | Citigroup, Inc. | | | 677,511 | |
| | 2,085 | | | | | Comerica, Inc. | | | 170,053 | |
| | 2,350 | | | | | Commerce Bancshares, Inc.^ | | | 149,460 | |
| | 425 | | | | | Credit Acceptance Corp.# | | | 180,378 | |
| | 2,400 | | | | | Discover Financial Services | | | 167,208 | |
| | 2,430 | | | | | E*TRADE Financial Corp. | | | 120,091 | |
| | 1,010 | | | | | Goldman Sachs Group, Inc. | | | 227,624 | |
| | 1,750 | | | | | Green Dot Corp. - Class A# | | | 132,545 | |
| | 1,300 | | | | | Hanover Insurance Group, Inc. | | | 144,794 | |
| | 13,950 | | | | | JPMorgan Chase & Company | | | 1,520,829 | |
| | 3,000 | | | | | LPL Financial Holdings, Inc. | | | 184,800 | |
| | 6,150 | | | | | Morgan Stanley | | | 280,809 | |
| | 1,025 | | | | | MSCI, Inc. - Class A | | | 154,139 | |
| | 1,700 | | | | | NASDAQ, Inc. | | | 147,407 | |
| | 1,400 | | | | | Northern Trust Corp. | | | 131,698 | |
| | 9,450 | | | | | OFG Bancorp | | | 161,500 | |
| | 1,550 | | | | | PNC Financial Services Group, Inc. | | | 199,159 | |
| | 2,985 | | | | | Popular, Inc. | | | 155,250 | |
| | | | |
| 112 | | CALAMOS OPEN-END FAMILY OF FUNDS ANNUAL REPORT | | See accompanying Notes to Schedule of Investments |
Opportunistic Value Fund Schedule of Investments October 31, 2018
| | | | | | | | | | |
NUMBER OF
SHARES | | | | | | | VALUE | |
| | 4,890 | | | | | Progressive Corp. | | $ | 340,833 | |
| | 13,700 | | | | | Regions Financial Corp. | | | 232,489 | |
| | 930 | | | | | S&P Global, Inc. | | | 169,558 | |
| | 3,430 | | | | | SunTrust Banks, Inc. | | | 214,924 | |
| | 500 | | | | | SVB Financial Group# | | | 118,615 | |
| | 6,000 | | | | | TCF Financial Corp. | | | 125,280 | |
| | 5,650 | | | | | US Bancorp | | | 295,325 | |
| | 2,350 | | | | | Webster Financial Corp. | | | 138,274 | |
| | 13,465 | | | | | Wells Fargo & Company | | | 716,742 | |
| | | | | | | | | | |
| | | | | | | | | 10,699,808 | |
| | | | | | | | | | |
| | | | | | Health Care (12.6%) | | | | |
| | 2,230 | | | | | Abbott Laboratories | | | 153,736 | |
| | 920 | | | | | Allergan, PLC | | | 145,369 | |
| | 1,630 | | | | | Amgen, Inc. | | | 314,248 | |
| | 755 | | | | | Anthem, Inc. | | | 208,055 | |
| | 500 | | | | | Becton Dickinson and Company | | | 115,250 | |
| | 365 | | | | | Biogen, Inc.# | | | 111,059 | |
| | 3,750 | | | | | Boston Scientific Corp.# | | | 135,525 | |
| | 1,000 | | | | | Centene Corp.# | | | 130,320 | |
| | 1,150 | | | | | Charles River Laboratories International, Inc.# | | | 140,093 | |
| | 1,140 | | | | | Cigna Corp. | | | 243,743 | |
| | 3,845 | | | | | CVS Health Corp. | | | 278,340 | |
| | 1,780 | | | | | Danaher Corp. | | | 176,932 | |
| | 2,420 | | | | | Eli Lilly and Company | | | 262,425 | |
| | 1,925 | | | | | Encompass Health Corp. | | | 129,553 | |
| | 1,430 | | | | | HCA Healthcare, Inc. | | | 190,948 | |
| | 720 | | | | | Humana, Inc. | | | 230,695 | |
| | 260 | | | | | Intuitive Surgical, Inc.# | | | 135,507 | |
| | 5,085 | | | | | Johnson & Johnson | | | 711,849 | |
| | 2,975 | | | | | Medtronic, PLC | | | 267,214 | |
| | 7,075 | | | | | Merck & Company, Inc. | | | 520,791 | |
| | 13,000 | | | | | Pfizer, Inc. | | | 559,780 | |
| | 1,425 | | | | | PRA Health Sciences, Inc.# | | | 138,040 | |
| | 1,030 | | | | | Thermo Fisher Scientific, Inc. | | | 240,659 | |
| | 510 | | | | | UnitedHealth Group, Inc. | | | 133,289 | |
| | 600 | | | | | WellCare Health Plans, Inc.# | | | 165,594 | |
| | 1,675 | | | | | Zoetis, Inc. | | | 151,001 | |
| | | | | | | | | | |
| | | | | | | | | 5,990,015 | |
| | | | | | | | | | |
| | | | | | Industrials (9.8%) | | | | |
| | 2,630 | | | | | Allison Transmission Holdings, Inc. | | | 115,930 | |
| | 1,785 | | | | | Ametek, Inc. | | | 119,738 | |
| | 2,410 | | | | | Armstrong World Industries, Inc.# | | | 148,818 | |
| | 555 | | | | | Boeing Company | | | 196,947 | |
| | 1,590 | | | | | C.H. Robinson Worldwide, Inc. | | | 141,558 | |
| | 1,295 | | | | | Caterpillar, Inc. | | | 157,109 | |
| | 2,410 | | | | | Clean Harbors, Inc.# | | | 163,976 | |
| | | | | | | | | | |
NUMBER OF
SHARES | | | | | | | VALUE | |
| | 1,800 | | | | | CSX Corp. | | $ | 123,948 | |
| | 2,600 | | | | | Delta Air Lines, Inc. | | | 142,298 | |
| | 2,165 | | | | | Fortive Corp. | | | 160,751 | |
| | 4,000 | | | | | HD Supply Holdings, Inc.# | | | 150,280 | |
| | 1,565 | | | | | HEICO Corp.^ | | | 131,194 | |
| | 1,330 | | | | | Honeywell International, Inc. | | | 192,611 | |
| | 1,065 | | | | | IDEX Corp. | | | 135,063 | |
| | 2,850 | | | | | IHS Markit, Ltd.# | | | 149,711 | |
| | 1,650 | | | | | Ingersoll-Rand, PLC | | | 158,301 | |
| | 2,100 | | | | | Jacobs Engineering Group, Inc. | | | 157,689 | |
| | 2,430 | | | | | KAR Auction Services, Inc. | | | 138,364 | |
| | 1,450 | | | | | Norfolk Southern Corp. | | | 243,353 | |
| | 975 | | | | | Parker-Hannifin Corp. | | | 147,839 | |
| | 222 | | | | | Resideo Technologies, Inc.# | | | 4,666 | |
| | 1,855 | | | | | Robert Half International, Inc. | | | 112,283 | |
| | 610 | | | | | Roper Industries, Inc. | | | 172,569 | |
| | 2,300 | | | | | TransUnion | | | 151,225 | |
| | 1,750 | | | | | Union Pacific Corp. | | | 255,885 | |
| | 2,250 | | | | | United Continental Holdings, Inc.# | | | 192,398 | |
| | 1,330 | | | | | United Parcel Service, Inc. - Class B | | | 141,698 | |
| | 2,035 | | | | | United Technologies Corp. | | | 252,767 | |
| | 1,850 | | | | | Waste Management, Inc. | | | 165,520 | |
| | 450 | | | | | WW Grainger, Inc. | | | 127,787 | |
| | | | | | | | | | |
| | | | | | | | | 4,652,276 | |
| | | | | | | | | | |
| | | | | | Information Technology (13.3%) | |
| | 1,300 | | | | | Accenture, PLC - Class A | | | 204,906 | |
| | 580 | | | | | Adobe, Inc.# | | | 142,541 | |
| | 2,790 | | | | | Apple, Inc. | | | 610,619 | |
| | 1,070 | | | | | Automatic Data Processing, Inc. | | | 154,166 | |
| | 3,055 | | | | | Booz Allen Hamilton Holding Corp. | | | 151,345 | |
| | 1,305 | | | | | Broadridge Financial Solutions, Inc. | | | 152,607 | |
| | 2,000 | | | | | CDW Corp. | | | 180,020 | |
| | 16,465 | | | | | Cisco Systems, Inc. | | | 753,274 | |
| | 820 | | | | | F5 Networks, Inc.# | | | 143,730 | |
| | 2,020 | | | | | Fiserv, Inc.# | | | 160,186 | |
| | 800 | | | | | FleetCor Technologies, Inc.# | | | 160,024 | |
| | 2,600 | | | | | Fortinet, Inc.# | | | 213,668 | |
| | 6,415 | | | | | Intel Corp. | | | 300,735 | |
| | 700 | | | | | Intuit, Inc. | | | 147,700 | |
| | 2,110 | | | | | MasterCard, Inc. - Class A | | | 417,084 | |
| | 6,420 | | | | | Microsoft Corp. | | | 685,720 | |
| | 2,395 | | | | | NetApp, Inc. | | | 187,983 | |
| | 4,825 | | | | | Oracle Corp. | | | 235,653 | |
| | 1,370 | | | | | Texas Instruments, Inc. | | | 127,177 | |
| | 1,350 | | | | | Total System Services, Inc. | | | 123,052 | |
| | 3,975 | | | | | Visa, Inc. - Class A | | | 547,954 | |
| | 1,245 | | | | | VMware, Inc. - Class A# | | | 176,031 | |
| | | | | | |
| See accompanying Notes to Schedule of Investments | | www.calamos.com | | | 113 | |
Opportunistic Value Fund Schedule of Investments October 31, 2018
| | | | | | | | | | |
NUMBER OF
SHARES | | | | | | | VALUE | |
| | 1,800 | | | | | Worldpay, Inc. - Class A# | | $ | 165,312 | |
| | 1,025 | | | | | Zebra Technologies Corp- Class A# | | | 170,457 | |
| | | | | | | | | | |
| | | | | | | | | 6,311,944 | |
| | | | | | | | | | |
| | | | | | Materials (2.7%) | | | | |
| | 1,650 | | | | | Avery Dennison Corp. | | | 149,688 | |
| | 1,725 | | | | | Celanese Corp. - Class A | | | 167,222 | |
| | 2,872 | | | | | CF Industries Holdings, Inc. | | | 137,942 | |
| | 5,450 | | | | | DowDuPont, Inc. | | | 293,864 | |
| | 1,225 | | | | | Ingevity Corp.# | | | 111,573 | |
| | 5,000 | | | | | Mosaic Company | | | 154,700 | |
| | 2,050 | | | | | Nucor Corp. | | | 121,196 | |
| | 2,750 | | | | | Sonoco Products Company | | | 150,095 | |
| | | | | | | | | | |
| | | | | | | | | 1,286,280 | |
| | | | | | | | | | |
| | | | | | Real Estate (3.1%) | | | | |
| | 3,050 | | | | | Equity Residential | | | 198,128 | |
| | 1,560 | | | | | Extra Space Storage, Inc. | | | 140,494 | |
| | 6,200 | | | | | GEO Group, Inc. | | | 137,082 | |
| | 2,800 | | | | | National Retail Properties, Inc. | | | 130,900 | |
| | 2,250 | | | | | Prologis, Inc. | | | 145,058 | |
| | 6,625 | | | | | Sabra Health Care REIT, Inc. | | | 143,431 | |
| | 700 | | | | | Simon Property Group, Inc. | | | 128,464 | |
| | 5,350 | | | | | STORE Capital Corp. | | | 155,310 | |
| | 3,900 | | | | | UDR, Inc.^ | | | 152,841 | |
| | 2,375 | | | | | Welltower, Inc. | | | 156,916 | |
| | | | | | | | | | |
| | | | | | | | | 1,488,624 | |
| | | | | | | | | | |
| | | | | | Utilities (4.7%) | | | | |
| | 11,700 | | | | | AES Corp. | | | 170,586 | |
| | 2,000 | | | | | Ameren Corp. | | | 129,160 | |
| | 2,100 | | | | | American Electric Power Company, Inc. | | | 154,056 | |
| | 5,070 | | | | | CenterPoint Energy, Inc. | | | 136,941 | |
| | 2,600 | | | | | CMS Energy Corp. | | | 128,752 | |
| | 2,550 | | | | | Dominion Energy, Inc.^ | | | 182,121 | |
| | 1,150 | | | | | DTE Energy Company^ | | | 129,260 | |
| | 1,800 | | | | | Duke Energy Corp. | | | 148,734 | |
| | 1,550 | | | | | Entergy Corp. | | | 130,123 | |
| | 3,950 | | | | | Exelon Corp. | | | 173,049 | |
| | 4,630 | | | | | FirstEnergy Corp. | | | 172,606 | |
| | 900 | | | | | NextEra Energy, Inc. | | | 155,250 | |
| | 3,950 | | | | | NRG Energy, Inc. | | | 142,950 | |
| | 3,300 | | | | | Southern Company | | | 148,599 | |
| | 2,615 | | | | | UGI Corp. | | | 138,752 | |
| | | | | | | | | | |
| | | | | | | | | 2,240,939 | |
| | | | | | | | | | |
| | | | | | TOTAL COMMON STOCKS
(Cost $43,605,709) | | | 46,861,750 | |
| | | | | | | | | | |
| | | | | | | | | | |
| | | | | | | | | | |
NUMBER OF
SHARES | | | | | | | VALUE | |
| | EXCHANGE-TRADED FUND (0.5%) | |
| | | | | | Other (0.5%) | | | | |
| | 4,370 | | | | | Utilities Select Sector SPDR Fund^
(Cost $237,848) | | $ | 234,625 | |
| | | | | | | | | | |
| | | | | | | | | | |
NUMBER OF
CONTRACTS/
NOTIONAL
AMOUNT | | | | | | | VALUE | |
| | PURCHASED OPTIONS (0.7%)# | |
| | | | | | Other (0.7%) | | | | |
| 75
1,273,650 |
| | | | Invesco QQQ Trust Series
Put, 12/31/18, Strike $185.00 | | | 123,113 | |
| 10
2,711,740 |
| | | | S&P 500 Index Put, 12/31/18, Strike $2,900.00 | | | 195,450 | |
| | | | | | | | | | |
| | | | | | TOTAL PURCHASED OPTIONS
(Cost $98,559) | | | 318,563 | |
| | | | | | | | | | |
| | | | | | | | | | |
NUMBER OF
SHARES | | | | | | | VALUE | |
| | SHORT TERM INVESTMENTS (0.6%) | |
| | 137,606 | | | | | Fidelity Prime Money Market Fund - Institutional Class, 2.240%*** | | | 137,647 | |
| | 137,563 | | | | | Morgan Stanley Institutional Liquidity Funds - Government Portfolio, 2.050%*** | | | 137,563 | |
| | | | | | | | | | |
| | | | | | TOTAL SHORT TERM INVESTMENTS
(Cost $275,210) | | | 275,210 | |
| | | | | | | | | | |
| | | | | | | | | | |
NUMBER OF
SHARES/
PRINCIPAL
AMOUNT | | | | | | | VALUE | |
| INVESTMENT OF CASH COLLATERAL FOR SECURITIES
LOANED (2.0%) |
|
| | 966,475 | | | | | State Street Navigator Securities Lending Government Money Market Portfolio†
(Cost $966,475) | | | 966,475 | |
| | | | | | | | | | |
| | | | | | TOTAL INVESTMENTS (102.3%)
(Cost $45,183,801) | | | 48,656,623 | |
| | | | | | | | | | |
| |
| | PAYABLE UPON RETURN OF SECURITIES ON LOAN (-2.0%) | | | (966,475 | ) |
| | | | | | | | | | |
| |
| | LIABILITIES, LESS OTHER ASSETS (-0.3%) | | | (131,305 | ) |
| | | | | | | | | | |
| |
| | NET ASSETS (100.0%) | | $ | 47,558,843 | |
| | | | | | | | | | |
| | | | | | | | | | |
| | | | |
| 114 | | CALAMOS OPEN-END FAMILY OF FUNDS ANNUAL REPORT | | See accompanying Notes to Schedule of Investments |
Opportunistic Value Fund Schedule of Investments October 31, 2018
| | | | | | | | | | |
NUMBER OF
CONTRACTS/
NOTIONAL
AMOUNT | | | | | | | VALUE | |
| | WRITTEN OPTIONS (-0.3%)# | |
| | | | | | Other (-0.3%) | | | | |
| 75
1,273,650 |
| | | | Invesco QQQ Trust Series Put, 12/31/18, Strike $170.00 | | $ | (51,525 | ) |
| 10
2,711,740 |
| | | | S&P 500 Index Put, 12/31/18, Strike $2,750.00 | | | (94,400 | ) |
| | | | | | | | | | |
| | | | | | TOTAL WRITTEN OPTIONS
(Premium $42,474) | | $ | (145,925 | ) |
| | | | | | | | | | |
NOTES TO SCHEDULE OF INVESTMENTS
| # | Non-income producing security. |
| ^ | Security, or portion of security, is on loan. |
| *** | The rate disclosed is the 7 day net yield as of October 31, 2018. |
| † | Represents investment of cash collateral received from securities on loan as of October 31, 2018. |
Note: The date on options represents the expiration date of the option contract. The option contract may be exercised at any date on or before the date shown.
| | | | | | |
| See accompanying Notes to Financial Statements | | www.calamos.com | | | 115 | |
International Growth Fund Schedule of Investments October 31, 2018
| | | | | | | | | | |
NUMBER OF
SHARES | | | | | | | VALUE | |
| | COMMON STOCKS (94.6%) | |
| | | | | | Communication Services (7.7%) | |
| | 27,300 | | | JPY | | CyberAgent, Inc. | | $ | 1,161,701 | |
| | 14,300 | | | JPY | | Nintendo Company, Ltd. | | | 4,464,500 | |
| | 55,900 | | | | | SoftBank Group Corp.^~ | | | 2,195,752 | |
| | 228,700 | | | HKD | | Tencent Holdings, Ltd. | | | 7,835,093 | |
| | 24,600 | | | EUR | | Ubisoft Entertainment, SA# | | | 2,206,682 | |
| | | | | | | | | | |
| | | | | | | | | 17,863,728 | |
| | | | | | | | | | |
| | | | | | Consumer Discretionary (13.8%) | |
| | 74,402 | | | | | Alibaba Group Holding, Ltd.^# | | | 10,585,917 | |
| | 30,300 | | | | | Aptiv, PLC | | | 2,327,040 | |
| | 125,000 | | | CAD | | Aritzia, Inc.# | | | 1,839,227 | |
| | 1,650 | | | | | Booking Holdings, Inc.~# | | | 3,093,057 | |
| | 3,727 | | | EUR | | Kering, SA | | | 1,656,608 | |
| | 34,540 | | | | | Lululemon Athletica, Inc.~# | | | 4,860,814 | |
| | 17,600 | | | | | Michael Kors Holdings, Ltd.# | | | 975,216 | |
| | 46,600 | | | EUR | | Moncler, S.p.A. | | | 1,618,315 | |
| | 6,250 | | | EUR | | Puma, SE | | | 3,213,870 | |
| | 421,000 | | | HKD | | Techtronic Industries Company, Ltd. | | | 1,982,391 | |
| | | | | | | | | | |
| | | | | | | | | 32,152,455 | |
| | | | | | | | | | |
| | | | | | Consumer Staples (13.3%) | |
| | 77,200 | | | GBP | | British American Tobacco, PLC | | | 3,346,641 | |
| | 150,800 | | | GBP | | Diageo, PLC | | | 5,213,385 | |
| | 16,200 | | | GBP | | Fevertree Drinks, PLC | | | 575,112 | |
| | 35,700 | | | EUR | | Kerry Group, PLC - Class A | | | 3,653,358 | |
| | 3,100 | | | EUR | | Kerry Group, PLC - Class A | | | 317,765 | |
| | 8,000 | | | JPY | | Kose Corp. | | | 1,195,575 | |
| | 19,454 | | | CNY | | Kweichow Moutai Company, Ltd. - Class A | | | 1,540,971 | |
| | 41,700 | | | | | Nestle, SA | | | 3,514,476 | |
| | 90,400 | | | SEK | | Swedish Match, AB | | | 4,604,857 | |
| | 483,800 | | | AUD | | Treasury Wine Estates, Ltd. | | | 5,207,410 | |
| | 760,000 | | | MXN | | Wal-Mart de Mexico, SAB de CV | | | 1,943,283 | |
| | | | | | | | | | |
| | | | | | | | | 31,112,833 | |
| | | | | | | | | | |
| | | | | | Energy (4.9%) | | | | |
| | 48,300 | | | NOK | | Aker BP, ASA | | | 1,583,986 | |
| | 83,900 | | | | | BP, PLC | | | 3,638,743 | |
| | 10,900 | | | | | CNOOC, Ltd. | | | 1,844,825 | |
| | 43,700 | | | | | Schlumberger, Ltd. | | | 2,242,247 | |
| | 780,000 | | | GBP | | Tullow Oil, PLC# | | | 2,237,870 | |
| | | | | | | | | | |
| | | | | | | | | 11,547,671 | |
| | | | | | | | | | |
| | | | | | Financials (10.6%) | | | | |
| | 375,800 | | | HKD | | AIA Group, Ltd. | | | 2,858,727 | |
| | 208,381 | | | CHF | | Credit Suisse Group, AG# | | | 2,724,302 | |
| | 75,000 | | | SGD | | DBS Group Holdings, Ltd. | | | 1,272,556 | |
| | | | | | | | | | |
NUMBER OF
SHARES | | | | | | | VALUE | |
| | 37,150 | | | EUR | | Deutsche Böerse, AG | | $ | 4,694,739 | |
| | 145,800 | | | INR | | HDFC Bank, Ltd. | | | 3,774,386 | |
| | 2,525 | | | CHF | | Partners Group Holding, AG | | | 1,797,685 | |
| | 227,500 | | | HKD | | Ping An Insurance Group Company of China, Ltd. - Class H | | | 2,150,791 | |
| | 120,600 | | | GBP | | Prudential, PLC | | | 2,414,850 | |
| | 57,000 | | | CAD | | Toronto-Dominion Bank | | | 3,162,072 | |
| | | | | | | | | | |
| | | | | | | | | 24,850,108 | |
| | | | | | | | | | |
| | | | | | Health Care (10.2%) | | | | |
| | 69,000 | | | GBP | | AstraZeneca, PLC | | | 5,277,784 | |
| | 29,500 | | | CAD | | Canopy Growth Corp.^# | | | 1,085,256 | |
| | 36,800 | | | AUD | | CSL, Ltd. | | | 4,912,695 | |
| | 22,600 | | | | | ICON, PLC# | | | 3,120,608 | |
| | 21,625 | | | EUR | | Ipsen, SA | | | 2,998,379 | |
| | 16,150 | | | | | LivaNova, PLC# | | | 1,808,638 | |
| | 7,000 | | | CHF | | Lonza Group, AG# | | | 2,201,076 | |
| | 27,400 | | | CHF | | Novartis, AG | | | 2,399,481 | |
| | | | | | | | | | |
| | | | | | | | | 23,803,917 | |
| | | | | | | | | | |
| | | | | | Industrials (11.4%) | | | | |
| | 74,800 | | | SEK | | Alfa Laval, AB | | | 1,908,529 | |
| | 480,200 | | | CAD | | Bombardier, Inc. - Class B# | | | 1,163,613 | |
| | 21,000 | | | CAD | | Canadian Pacific Railway, Ltd. | | | 4,306,559 | |
| | 48,900 | | | JPY | | en-japan, Inc. | | | 1,950,477 | |
| | 50,300 | | | GBP | | Experian, PLC | | | 1,156,860 | |
| | 10,800 | | | JPY | | FANUC Corp. | | | 1,878,843 | |
| | 62,400 | | | JPY | | Japan Airport Terminal Company, Ltd. | | | 2,403,512 | |
| | 72,100 | | | JPY | | Komatsu, Ltd. | | | 1,877,660 | |
| | 153,000 | | | BRL | | Localiza Rent a Car, SA | | | 1,181,983 | |
| | 65,100 | | | JPY | | Recruit Holdings Company, Ltd. | | | 1,747,257 | |
| | 14,000 | | | EUR | | Safran, SA | | | 1,809,190 | |
| | 41,000 | | | EUR | | Thales, SA | | | 5,236,439 | |
| | | | | | | | | | |
| | | | | | | | | 26,620,922 | |
| | | | | | | | | | |
| | | | | | Information Technology (17.2%) | |
| | 23,000 | | | | | Accenture, PLC - Class A | | | 3,625,260 | |
| | 3,655 | | | EUR | | Adyen, NV#* | | | 2,364,261 | |
| | 28,300 | | | EUR | | ASML Holding, NV | | | 4,874,506 | |
| | 6,950 | | | CAD | | Constellation Software, Inc. | | | 4,783,144 | |
| | 44,400 | | | | | CyberArk Software, Ltd.# | | | 3,030,744 | |
| | 20,000 | | | JPY | | GMO Payment Gateway, Inc.^ | | | 968,921 | |
| | 4,700 | | | JPY | | Keyence Corp. | | | 2,296,042 | |
| | 158,179 | | | GBP | | Keywords Studios, PLC | | | 2,769,924 | |
| | 590,000 | | | SEK | | LM Ericsson Telephone Company - Class B | | | 5,136,987 | |
| | 958,000 | | | TWD | | Taiwan Semiconductor Manufacturing Company, Ltd. | | | 7,192,072 | |
| | 9,300 | | | CHF | | Temenos, AG# | | | 1,278,164 | |
| | | | |
| 116 | | CALAMOS OPEN-END FAMILY OF FUNDS ANNUAL REPORT | | See accompanying Notes to Schedule of Investments |
International Growth Fund Schedule of Investments October 31, 2018
| | | | | | | | | | |
NUMBER OF
SHARES | | | | | | | VALUE | |
| | 6,600 | | | EUR | | Wirecard, AG | | $ | 1,234,576 | |
| | 18,400 | | | AUD | | Xero, Ltd.# | | | 521,604 | |
| | | | | | | | | | |
| | | | | | | | | 40,076,205 | |
| | | | | | | | | | |
| | | | | | Materials (3.5%) | | | | |
| | 500,000 | | | GBP | | Glencore, PLC# | | | 2,034,830 | |
| | 960,000 | | | AUD | | Lynas Corp., Ltd.# | | | 1,420,574 | |
| | 445,000 | | | AUD | | Northern Star Resources, Ltd. | | | 2,780,013 | |
| | 120,500 | | | | | Vale, SA^ | | | 1,819,550 | |
| | | | | | | | | | |
| | | | | | | | | 8,054,967 | |
| | | | | | | | | | |
| | | | | | Real Estate (2.0%) | |
| | 558,900 | | | EUR | | Aroundtown, SA | | | 4,631,391 | |
| | | | | | | | | | |
| | | | | | TOTAL COMMON STOCKS
(Cost $211,368,156) | | | 220,714,197 | |
| | | | | | | | | | |
| | | | | | | | | | |
NUMBER OF
CONTRACTS/
NOTIONAL
AMOUNT | | | | | | | VALUE | |
| | PURCHASED OPTIONS (0.4%)# | |
| | | | | | Consumer Discretionary (0.0%) | |
| 450
2,435,850 |
| | | | Sony Corp.
Call, 01/18/19, Strike $62.50 | | | 27,000 | |
| | | | | | | | | | |
| | | | | | Information Technology (0.1%) | |
| 285
4,912,260 |
| | | | ASML Holding, NV
Put, 01/18/19, Strike $170.00 | | | 277,875 | |
| | | | | | | | | | |
| | | | | | Other (0.3%) | | | | |
| 1,055
11,982,690 |
| | | | iShares 20+ Year Treasury Bond
Call, 03/15/19, Strike $120.00 | | | 81,235 | |
| 2,482
9,751,778 |
| | | | iShares China Large-Cap ETF
Put, 01/18/19, Strike $39.00 | | | 476,544 | |
| | | | | | | | | | |
| | | | | | | | | 557,779 | |
| | | | | | | | | | |
| | | | | | TOTAL PURCHASED OPTIONS
(Cost $947,344) | | | 862,654 | |
| | | | | | | | | | |
| | | | | | | | | | |
NUMBER OF
SHARES | | | | | | | VALUE | |
| | SHORT TERM INVESTMENTS (5.4%) | |
| | 6,308,107 | | | | | Fidelity Prime Money Market Fund - Institutional Class, 2.240%*** | | | 6,310,000 | |
| | 6,309,081 | | | | | Morgan Stanley Institutional Liquidity Funds - Government Portfolio, 2.050%*** | | | 6,309,081 | |
| | | | | | | | | | |
| | | | | | TOTAL SHORT TERM INVESTMENTS
(Cost $12,619,081) | | | 12,619,081 | |
| | | | | | | | | | |
| | | | | | | | | | |
| | | | | | | | | | |
NUMBER OF
SHARES/
PRINCIPAL
AMOUNT | | | | | | | VALUE | |
| INVESTMENT OF CASH COLLATERAL FOR SECURITIES
LOANED (0.3%) |
|
| | 735,881 | | | | | State Street Navigator Securities Lending Government Money Market Portfolio†
(Cost $735,881) | | $ | 735,881 | |
| | | | | | | | | | |
| | | | | | TOTAL INVESTMENTS (100.7%)
(Cost $225,670,462) | | | 234,931,813 | |
| | | | | | | | | | |
| |
| | PAYABLE UPON RETURN OF SECURITIES ON LOAN (-0.3%) | | | (735,881 | ) |
| | | | | | | | | | |
| |
| | LIABILITIES, LESS OTHER ASSETS (-0.4%) | | | (845,862 | ) |
| | | | | | | | | | |
| |
| | NET ASSETS (100.0%) | | $ | 233,350,070 | |
| | | | | | | | | | |
FORWARD FOREIGN CURRENCY CONTRACTS
| | | | | | | | | | | | | | | | |
COUNTER
PARTY | | LONG
CONTRACTS | | SETTLEMENT
DATE | | LOCAL
CURRENCY | | | CURRENT
VALUE | | | UNREALIZED
GAIN/LOSS | |
| State Street Bank and Trust | | European Monetary Unit | | 11/30/18 | | | 11,425,000 | | | $ | 12,968,488 | | | $ | (301,672 | ) |
| State Street Bank and Trust | | European Monetary Unit | | 11/30/18 | | | 3,000,000 | | | | 3,405,292 | | | | (4,220 | ) |
| State Street Bank and Trust | | Swiss Franc | | 11/30/18 | | | 5,160,000 | | | | 5,135,938 | | | | (91,805 | ) |
| | | | | | | | | | | | | | | | |
| | | | | | | | | | | | | | $ | (397,697 | ) |
| | | | | | | | | | | | | | | | |
| | | | | |
COUNTER
PARTY | | SHORT
CONTRACTS | | SETTLEMENT
DATE | | LOCAL
CURRENCY | | | CURRENT
VALUE | | | UNREALIZED
GAIN/LOSS | |
| State Street Bank and Trust | | Swiss Franc | | 11/30/18 | | | 3,425,000 | | | $ | 3,409,029 | | | $ | 5,161 | |
| | | | | | | | | | | | | | | | |
NOTES TO SCHEDULE OF INVESTMENTS
| ^ | Security, or portion of security, is on loan. |
| ~ | Security, or portion of security, is segregated as collateral (or collateral for potential future transactions) for written options. The aggregate value of such securities is $395,385. |
| # | Non-income producing security. |
| * | Securities issued and sold pursuant to a Rule 144A transaction are excepted from the registration requirement of the Securities Act of 1933, as amended. These securities may only be sold to qualified institutional buyers (“QIBs”), such as the Fund. Any resale of these securities must generally be effected through a sale that is registered under the Act or otherwise exempted from such registration requirements. |
| *** | The rate disclosed is the 7 day net yield as of October 31, 2018. |
| † | Represents investment of cash collateral received from securities on loan as of October 31, 2018. |
| | | | | | |
| See accompanying Notes to Financial Statements | | www.calamos.com | | | 117 | |
International Growth Fund Schedule of Investments October 31, 2018
FOREIGN CURRENCY ABBREVIATIONS
| | |
| AUD | | Australian Dollar |
| BRL | | Brazilian Real |
| CAD | | Canadian Dollar |
| CHF | | Swiss Franc |
| CNY | | Chinese Yuan Renminbi |
| EUR | | European Monetary Unit |
| GBP | | British Pound Sterling |
| HKD | | Hong Kong Dollar |
| INR | | Indian Rupee |
| JPY | | Japanese Yen |
| MXN | | Mexican Peso |
| NOK | | Norwegian Krone |
| SEK | | Swedish Krona |
| SGD | | Singapore Dollar |
| TWD | | New Taiwan Dollar |
Note: Value for securities denominated in foreign currencies is shown in U.S. dollars. The date on options represents the expiration date of the option contract. The option contract may be exercised at any date on or before the date shown.
CURRENCY EXPOSURE OCTOBER 31, 2018
| | | | | | | | |
| | | VALUE | | | % OF TOTAL
INVESTMENTS | |
| US Dollar | | $ | 62,900,503 | | | | 26.8% | |
| European Monetary Unit | | | 40,510,079 | | | | 17.2% | |
| British Pound Sterling | | | 25,027,256 | | | | 10.6% | |
| Japanese Yen | | | 19,944,488 | | | | 8.5% | |
| Canadian Dollar | | | 16,339,871 | | | | 7.0% | |
| Australian Dollar | | | 14,842,296 | | | | 6.3% | |
| Hong Kong Dollar | | | 14,827,002 | | | | 6.3% | |
| Swedish Krona | | | 11,650,373 | | | | 5.0% | |
| Swiss Franc | | | 10,400,708 | | | | 4.4% | |
| New Taiwan Dollar | | | 7,192,072 | | | | 3.1% | |
| Indian Rupee | | | 3,774,386 | | | | 1.6% | |
| Mexican Peso | | | 1,943,283 | | | | 0.8% | |
| Norwegian Krone | | | 1,583,986 | | | | 0.7% | |
| Chinese Yuan Renminbi | | | 1,540,971 | | | | 0.7% | |
| Singapore Dollar | | | 1,272,556 | | | | 0.5% | |
| Brazilian Real | | | 1,181,983 | | | | 0.5% | |
| Total Investments | | $ | 234,931,813 | | | | 100.0% | |
Currency exposure may vary over time.
| | | | |
| 118 | | CALAMOS OPEN-END FAMILY OF FUNDS ANNUAL REPORT | | See accompanying Notes to Financial Statements |
Evolving World Growth Fund Schedule of Investments October 31, 2018
| | | | | | | | | | |
PRINCIPAL
AMOUNT | | | | | | | VALUE | |
| | CONVERTIBLE BONDS (21.5%) | |
| | | | | | Communication Services (1.9%) | |
| | 2,380,000 | | | | | Momo, Inc.*^
1.250%, 07/01/25 | | $ | 2,088,343 | |
| | 1,870,000 | | | | | Sea, Ltd.*~
2.250%, 07/01/23 | | | 1,743,934 | |
| | | | | | | | | | |
| | | | | | | | | 3,832,277 | |
| | | | | | | | | | |
| | | | | | Consumer Discretionary (2.9%) | |
| | 2,265,000 | | | | | Ctrip.com International, Ltd.^
1.990%, 07/01/25 | | | 2,257,141 | |
| | 3,565,000 | | | | | Shanghai Port Group BVI Holding Company, Ltd.
0.000%, 08/09/22 | | | 3,649,419 | |
| | | | | | | | | | |
| | | | | | | | | 5,906,560 | |
| | | | | | | | | | |
| | | | | | Energy (3.9%) | |
| | 4,400,000 | | | | | TOTAL, SA
0.500%, 12/02/22 | | | 4,788,344 | |
| | 2,600,000 | | | | | Tullow Oil Jersey, Ltd.
6.625%, 07/12/21 | | | 3,114,618 | |
| | | | | | | | | | |
| | | | | | | | | 7,902,962 | |
| | | | | | | | | | |
| | | | | | Financials (4.8%) | |
| | 9,400,000 | | | | | JPMorgan Chase Bank, N.A.
0.000%, 12/30/20 | | | 9,817,219 | |
| | | | | | | | | | |
| | | | | | Health Care (1.4%) | |
| | 36,000,000 | | | THB | | Bangkok Dusit Medical Services, PCL
0.000%, 09/18/19 | | | 1,267,927 | |
| | 1,800,000 | | | | | NMC Health Jersey, Ltd.
1.875%, 04/30/25 | | | 1,630,935 | |
| | | | | | | | | | |
| | | | | | | | | 2,898,862 | |
| | | | | | | | | | |
| | | | | | Industrials (3.1%) | |
| | 2,000,000 | | | | | China Railway Construction Corp, Ltd.
0.000%, 01/29/21 | | | 2,202,550 | |
| | 4,320,000 | | | | | Larsen & Toubro, Ltd.
0.675%, 10/22/19 | | | 4,245,739 | |
| | | | | | | | | | |
| | | | | | | | | 6,448,289 | |
| | | | | | | | | | |
| | | | | | Materials (1.2%) | |
| | 2,800,000 | | | | | Glencore Funding, LLC
0.000%, 03/27/25 | | | 2,521,890 | |
| | | | | | | | | | |
| | | | | | Real Estate (2.3%) | |
| | 4,732,000 | | | | | AYC Finance, Ltd.
0.500%, 05/02/19 | | | 4,758,594 | |
| | | | | | | | | | |
| | | | | | TOTAL CONVERTIBLE BONDS
(Cost $46,096,235) | | | 44,086,653 | |
| | | | | | | | | | |
| | | | | | | | | | |
NUMBER OF SHARES | | | | | | | VALUE | |
| | CONVERTIBLE PREFERRED STOCK (7.3%) | |
| | | | | | Communication Services (7.3%) | |
| | 92,748 | | | | | Alibaba Exchangeable (Softbank)*§
5.750%, 06/01/19
(Cost $12,074,296) | | | 14,958,815 | |
| | | | | | | | | | |
| | | | | | | | | | |
NUMBER OF SHARES | | | | | | | VALUE | |
| | COMMON STOCKS (66.8%) | |
| | | | | | Communication Services (8.9%) | |
| | 142,900 | | | | | America Movil, SAB de CV - Class L^ | | $ | 2,056,331 | |
| | 8,280 | | | | | Baidu, Inc.# | | | 1,573,697 | |
| | 16,240 | | | ZAR | | Naspers, Ltd. - Class N | | | 2,848,510 | |
| | 34,972 | | | | | Telekomunikasi Indonesia Persero, Tbk PT | | | 881,294 | |
| | 313,900 | | | HKD | | Tencent Holdings, Ltd. | | | 10,753,982 | |
| | | | | | | | | | |
| | | | | | | | | 18,113,814 | |
| | | | | | | | | | |
| | | | | | Consumer Discretionary (2.5%) | |
| | 131,000 | | | TWD | | Eclat Textile Company, Ltd. | | | 1,559,778 | |
| | 181,500 | | | INR | | Mahindra & Mahindra, Ltd. | | | 1,878,086 | |
| | 355,100 | | | HKD | | Techtronic Industries Company, Ltd. | | | 1,672,084 | |
| | | | | | | | | | |
| | | | | | | | | 5,109,948 | |
| | | | | | | | | | |
| | | | | | Consumer Staples (9.7%) | |
| | 349,000 | | | | | Ambev, SA | | | 1,511,170 | |
| | 48,400 | | | GBP | | British American Tobacco, PLC | | | 2,098,152 | |
| | 848,200 | | | THB | | CP ALL, PCL | | | 1,695,121 | |
| | 100,700 | | | GBP | | Diageo, PLC | | | 3,481,352 | |
| | 22,319 | | | CNY | | Kweichow Moutai Company, Ltd. - Class A | | | 1,767,911 | |
| | 1,580 | | | KRW | | LG Household & Health Care, Ltd. | | | 1,452,976 | |
| | 7,600 | | | INR | | Nestlé India, Ltd. | | | 1,040,447 | |
| | 24,700 | | | CHF | | Nestlé, SA | | | 2,085,250 | |
| | 1,811,200 | | | MXN | | Wal-Mart de Mexico, SAB de CV | | | 4,631,151 | |
| | | | | | | | | | |
| | | | | | | | | 19,763,530 | |
| | | | | | | | | | |
| | | | | | Energy (4.7%) | |
| | 285,000 | | | GBP | | BP, PLC | | | 2,058,760 | |
| | 23,700 | | | | | CNOOC, Ltd. | | | 4,011,225 | |
| | 110,600 | | | INR | | Reliance Industries, Ltd. | | | 1,583,240 | |
| | 37,300 | | | | | Schlumberger, Ltd. | | | 1,913,863 | |
| | | | | | | | | | |
| | | | | | | | | 9,567,088 | |
| | | | | | | | | | |
| | | | | | Financials (15.0%) | | | | |
| | 317,600 | | | HKD | | AIA Group, Ltd. | | | 2,415,997 | |
| | 231,500 | | | BRL | | Banco do Brasil, SA | | | 2,659,311 | |
| | 1,286,900 | | | IDR | | Bank Central Asia, Tbk PT | | | 2,003,781 | |
| | 5,612,000 | | | HKD | | China Construction Bank Corp. - Class H | | | 4,453,384 | |
| | 101,200 | | | ZAR | | Discovery, Ltd. | | | 1,086,109 | |
| | 252,900 | | | ZAR | | FirstRand, Ltd. | | | 1,104,582 | |
| | 90,600 | | | KRW | | Hana Financial Group, Inc. | | | 3,051,917 | |
| | 190,500 | | | INR | | HDFC Bank, Ltd. | | | 4,931,554 | |
| | 103,000 | | | INR | | Housing Development Finance Corp., Ltd. | | | 2,461,268 | |
| | 88,700 | | | INR | | ICICI Lombard General Insurance Company, Ltd.* | | | 968,565 | |
| | | | | | |
| See accompanying Notes to Schedule of Investments | | www.calamos.com | | | 119 | |
Evolving World Growth Fund Schedule of Investments October 31, 2018
| | | | | | | | | | |
NUMBER OF SHARES | | | | | | | VALUE | |
| | 92,600 | | | BRL | | IRB Brasil Resseguros, SA | | $ | 1,802,982 | |
| | 290,400 | | | | | Itau Unibanco Holding, SA^ | | | 3,824,568 | |
| | | | | | | | | | |
| | | | | | | | | 30,764,018 | |
| | | | | | | | | | |
| | | | | | Health Care (1.7%) | |
| | 60,900 | | | | | AstraZeneca, PLC | | | 2,361,702 | |
| | 129,900 | | | INR | | Sun Pharmaceutical Industries, Ltd. | | | 1,017,857 | |
| | | | | | | | | | |
| | | | | | | | | 3,379,559 | |
| | | | | | | | | | |
| | | | | | Industrials (3.2%) | |
| | 1,324,000 | | | HKD | | CIMC Enric Holdings, Ltd. | | | 1,017,770 | |
| | 134,000 | | | BRL | | Localiza Rent a Car, SA | | | 1,035,201 | |
| | 514,300 | | | BRL | | Randon, SA Implementos e Participacoes | | | 1,097,284 | |
| | 27,300 | | | EUR | | Thales, SA | | | 3,486,702 | |
| | | | | | | | | | |
| | | | | | | | | 6,636,957 | |
| | | | | | | | | | |
| | | | | | Information Technology (16.4%) | |
| | 60,200 | | | | | Advanced Micro Devices, Inc.~# | | | 1,096,242 | |
| | 7,700 | | | | | Apple, Inc.~ | | | 1,685,222 | |
| | 80,000 | | | TWD | | ASMedia Technology, Inc. | | | 1,107,516 | |
| | 23,500 | | | KRW | | Koh Young Technology, Inc. | | | 1,862,086 | |
| | 87,100 | | | INR | | Larsen & Toubro Infotech, Ltd.* | | | 2,066,659 | |
| | 365,000 | | | SEK | | LM Ericsson Telephone Company - Class B | | | 3,177,966 | |
| | 40,500 | | | | | Pagseguro Digital, Ltd - Class A^# | | | 1,093,095 | |
| | 134,500 | | | KRW | | Samsung Electronics Company, Ltd. | | | 5,035,114 | |
| | 1,380,649 | | | TWD | | Taiwan Semiconductor Manufacturing Company, Ltd. | | | 10,365,060 | |
| | 232,100 | | | INR | | Tata Consultancy Services, Ltd. | | | 6,073,459 | |
| | | | | | | | | | |
| | | | | | | | | 33,562,419 | |
| | | | | | | | | | |
| | | | | | Materials (3.9%) | |
| | 286,600 | | | HKD | | Anhui Conch Cement Company, Ltd. - Class H | | | 1,485,488 | |
| | 154,800 | | | | | Cia de Minas Buenaventura, SAA | | | 2,142,432 | |
| | 1,031,900 | | | MYR | | Petronas Chemicals Group, Bhd | | | 2,307,273 | |
| | 141,700 | | | | | Vale, SA^ | | | 2,139,670 | |
| | | | | | | | | | |
| | | | | | | | | 8,074,863 | |
| | | | | | | | | | |
| | | | | | Real Estate (0.8%) | |
| | 643,500 | | | HKD | | Longfor Group Holdings, Ltd. | | | 1,563,824 | |
| | | | | | | | | | |
| | | | | | TOTAL COMMON STOCKS
(Cost $126,413,173) | | | 136,536,020 | |
| | | | | | | | | | |
| | | | | | | | | | |
NUMBER OF
CONTRACTS/
NOTIONAL
AMOUNT | | | | | | | VALUE | |
| | PURCHASED OPTIONS (1.2%)# | |
| | | | | | Communication Services (0.1%) | |
| 100
1,900,600 |
| | | | Baidu, Inc.
Call, 01/17/20, Strike $250.00 | | | 114,750 | |
| | | | | | | | | | |
| | | | | | | | | | |
NUMBER OF
CONTRACTS/
NOTIONAL
AMOUNT | | | | | | | VALUE | |
| | | | | | | | | | |
| | | | | | | | | | |
| | | | | | Consumer Discretionary (0.1%) | |
| 145
2,063,060 |
| | | | Alibaba Group Holding, Ltd.
Call, 01/17/20, Strike $175.00 | | $ | 183,062 | |
| | | | | | | | | | |
| | | | | | Energy (0.1%) | |
| 660
4,930,200 |
| | | | Lukoil, PJSC
Call, 03/15/19, Strike $75.00 | | | 244,200 | |
| | | | | | | | | | |
| | | | | | Information Technology (0.1%) | |
| 275
2,347,675 |
| | | | Xilinx, Inc.
Call, 01/18/19, Strike $85.00 | | | 159,500 | |
| 675
2,033,775 |
| | | | Yandex, NV
Call, 11/16/18, Strike $40.00 | | | 1,688 | |
| | | | | | | | | | |
| | | | | | | | | 161,188 | |
| | | | | | | | | | |
| | | | | | Other (0.8%) | |
| 930
10,562,940 |
| | | | iShares 20+ Year Treasury Bond
Call, 03/15/19, Strike $120.00 | | | 71,610 | |
| 2,710
10,647,590 |
| | | | iShares China Large-Cap ETF
Put, 01/18/19, Strike $39.00 | | | 520,320 | |
| 5,360
20,989,760 |
| | | | iShares MSCI Emerging Markets ETF
Call, 01/18/19, Strike $40.00 | | | 594,960 | |
| 3,400
7,072,000 |
| | | | Vaneck Vectors Russia ETF
Call, 02/15/19, Strike $21.00 | | | 258,400 | |
| | | | | | Xtrackers Harvest CSI 300 China A Shares ETF | | | | |
| 1,770
4,111,710 |
| | | | Call, 01/18/19, Strike $25.00 | | | 104,430 | |
| 1,770
4,111,710 |
| | | | Call, 01/17/20, Strike $27.00 | | | 237,180 | |
| | | | | | | | | | |
| | | | | | | | | 1,786,900 | |
| | | | | | | | | | |
| | | | | | TOTAL PURCHASED OPTIONS
(Cost $2,887,456) | | | 2,490,100 | |
| | | | | | | | | | |
| | | | | | | | | | |
NUMBER OF
SHARES | | | | | | | VALUE | |
| | SHORT TERM INVESTMENTS (3.5%) | |
| | 3,534,974 | | | | | Fidelity Prime Money Market Fund - Institutional Class, 2.240%*** | | | 3,536,035 | |
| | 3,535,416 | | | | | Morgan Stanley Institutional Liquidity Funds - Government Portfolio, 2.050%*** | | | 3,535,416 | |
| | | | | | | | | | |
| | | | | | TOTAL SHORT TERM INVESTMENTS
(Cost $7,071,451) | | | 7,071,451 | |
| | | | | | | | | | |
| | | | | | | | | | |
NUMBER OF
SHARES/
PRINCIPAL
AMOUNT | | | | | | | VALUE | |
| INVESTMENT OF CASH COLLATERAL FOR SECURITIES
LOANED (2.7%) |
|
| | 5,380,487 | | | | | Fidelity Prime Money Market Fund - Institutional Class, 2.240%***† | | | 5,380,487 | |
| | | | |
| 120 | | CALAMOS OPEN-END FAMILY OF FUNDS ANNUAL REPORT | | See accompanying Notes to Schedule of Investments |
Evolving World Growth Fund Schedule of Investments October 31, 2018
| | | | | | | | | | |
NUMBER OF
SHARES/
PRINCIPAL
AMOUNT | | | | | | | VALUE | |
| | 229,706 | | | | | State Street Navigator Securities Lending Government Money Market Portfolio† | | $ | 229,706 | |
| | | | | | | | | | |
| | | | | | TOTAL INVESTMENT OF CASH COLLATERAL FOR SECURITIES LOANED
(Cost $5,610,193) | | | 5,610,193 | |
| | | | | | | | | | |
| TOTAL INVESTMENTS (103.0%)
(Cost $200,152,804) | | | 210,753,232 | |
| | | | | | | | | | |
| |
| | PAYABLE UPON RETURN OF SECURITIES ON LOAN (-2.7%) | | | (5,610,193 | ) |
| | | | | | | | | | |
| |
| | LIABILITIES, LESS OTHER ASSETS (-0.3%) | | | (611,834 | ) |
| | | | | | | | | | |
| |
| | NET ASSETS (100.0%) | | $ | 204,531,205 | |
| | | | | | | | | | |
NOTES TO SCHEDULE OF INVESTMENTS
| * | Securities issued and sold pursuant to a Rule 144A transaction are excepted from the registration requirement of the Securities Act of 1933, as amended. These securities may only be sold to qualified institutional buyers (“QIBs”), such as the Fund. Any resale of these securities must generally be effected through a sale that is registered under the Act or otherwise exempted from such registration requirements. |
| ^ | Security, or portion of security, is on loan. |
| ~ | Security, or portion of security, is segregated as collateral (or collateral for potential future transactions) for written options. The aggregate value of such securities is $493,519. |
| § | Securities exchangeable or convertible into securities of one or more entities that are different than the issuer. Each entity is identified in the parenthetical. |
| # | Non-income producing security. |
| *** | The rate disclosed is the 7 day net yield as of October 31, 2018. |
| † | Represents investment of cash collateral received from securities on loan as of October 31, 2018. |
FOREIGN CURRENCY ABBREVIATIONS
| | |
| BRL | | Brazilian Real |
| CHF | | Swiss Franc |
| CNY | | Chinese Yuan Renminbi |
| EUR | | European Monetary Unit |
| GBP | | British Pound Sterling |
| HKD | | Hong Kong Dollar |
| IDR | | Indonesian Rupiah |
| INR | | Indian Rupee |
| KRW | | South Korean Won |
| MXN | | Mexican Peso |
| MYR | | Malaysian Ringgit |
| SEK | | Swedish Krona |
| THB | | Thai Baht |
| TWD | | New Taiwan Dollar |
| ZAR | | South African Rand |
Note: Value for securities denominated in foreign currencies is shown in U.S. dollars. The principal amount for such securities is shown in the respective foreign currency. The date on options represents the expiration date of the option contract. The option contract may be exercised at any date on or before the date shown.
CURRENCY EXPOSURE
OCTOBER 31, 2018
| | | | | | | | |
| | | VALUE | | | % OF TOTAL
INVESTMENTS | |
| US Dollar | | $ | 99,239,796 | | | | 47.1% | |
| Hong Kong Dollar | | | 23,362,529 | | | | 11.1% | |
| Indian Rupee | | | 22,021,135 | | | | 10.4% | |
| New Taiwan Dollar | | | 13,032,354 | | | | 6.2% | |
| South Korean Won | | | 11,402,093 | | | | 5.4% | |
| British Pound Sterling | | | 7,638,264 | | | | 3.6% | |
| Brazilian Real | | | 6,594,778 | | | | 3.1% | |
| South African Rand | | | 5,039,201 | | | | 2.4% | |
| Mexican Peso | | | 4,631,151 | | | | 2.2% | |
| European Monetary Unit | | | 3,486,702 | | | | 1.7% | |
| Swedish Krona | | | 3,177,966 | | | | 1.5% | |
| Thai Baht | | | 2,963,048 | | | | 1.4% | |
| Malaysian Ringgit | | | 2,307,273 | | | | 1.1% | |
| Swiss Franc | | | 2,085,250 | | | | 1.0% | |
| Indonesian Rupiah | | | 2,003,781 | | | | 1.0% | |
| Chinese Yuan Renminbi | | | 1,767,911 | | | | 0.8% | |
| Total Investments | | $ | 210,753,232 | | | | 100.0% | |
Currency exposure may vary over time.
| | | | | | |
| See accompanying Notes to Financial Statements | | www.calamos.com | | | 121 | |
Emerging Market Equity Fund Schedule of Investments October 31, 2018
| | | | | | | | | | |
NUMBER OF
SHARES | | | | | | | VALUE | |
| | COMMON STOCKS (91.1%) | |
| | | | | | Communication Services (12.1%) | |
| | 14,400 | | | | | America Movil, SAB de CV - Class L | | $ | 207,216 | |
| | 915 | | | | | Baidu, Inc.# | | | 173,905 | |
| | 1,800 | | | PLN | | CD Projekt, SA# | | | 74,100 | |
| | 1,293 | | | ZAR | | Naspers, Ltd. - Class N | | | 226,793 | |
| | 6,100 | | | | | Sea, Ltd.#^ | | | 79,605 | |
| | 5,307 | | | | | Telekomunikasi Indonesia Persero, Tbk PT^ | | | 133,736 | |
| | 23,300 | | | HKD | | Tencent Holdings, Ltd. | | | 798,241 | |
| | | | | | | | | | |
| | | | | | | | | 1,693,596 | |
| | | | | | | | | | |
| | | | | | Consumer Discretionary (12.6%) | |
| | 7,425 | | | | | Alibaba Group Holding, Ltd.#^ | | | 1,056,429 | |
| | 134,000 | | | IDR | | Astra International, Tbk PT | | | 69,702 | |
| | 15,000 | | | TWD | | Eclat Textile Company, Ltd. | | | 178,600 | |
| | 1,800 | | | | | Geely Automobile Holdings, Ltd. | | | 68,724 | |
| | 2,250 | | | BRL | | Magazine Luiza, SA | | | 102,056 | |
| | 16,800 | | | | | Mahindra & Mahindra, Ltd. | | | 173,880 | |
| | 25,500 | | | HKD | | Techtronic Industries Company, Ltd. | | | 120,074 | |
| | | | | | | | | | |
| | | | | | | | | 1,769,465 | |
| | | | | | | | | | |
| | | | | | Consumer Staples (6.7%) | |
| | 24,900 | | | | | Ambev, SA | | | 107,817 | |
| | 70,900 | | | THB | | CP ALL, PCL | | | 141,693 | |
| | 28,000 | | | | | ITC, Ltd.# | | | 105,840 | |
| | 2,292 | | | CNY | | Kweichow Moutai Company, Ltd. - Class A | | | 181,552 | |
| | 108 | | | KRW | | LG Household & Health Care, Ltd. | | | 99,317 | |
| | 120,900 | | | MXN | | Wal-Mart de Mexico, SAB de CV | | | 309,136 | |
| | | | | | | | | | |
| | | | | | | | | 945,355 | |
| | | | | | | | | | |
| | | | | | Energy (5.1%) | |
| | 1,620 | | | | | CNOOC, Ltd.^ | | | 274,185 | |
| | 4,500 | | | | | Ecopetrol, SA^ | | | 104,670 | |
| | 24,800 | | | THB | | PTT Exploration & Production, PCL | | | 103,873 | |
| | 4,700 | | | | | Reliance Industries, Ltd.* | | | 134,158 | |
| | 33,900 | | | GBP | | Tullow Oil, PLC# | | | 97,261 | |
| | | | | | | | | | |
| | | | | | | | | 714,147 | |
| | | | | | | | | | |
| | | | | | Financials (20.6%) | |
| | 24,800 | | | HKD | | AIA Group, Ltd. | | | 188,655 | |
| | 21,000 | | | BRL | | Banco do Brasil, SA | | | 241,233 | |
| | 139,513 | | | IDR | | Bank Central Asia, Tbk PT | | | 217,230 | |
| | 569,000 | | | HKD | | China Construction Bank Corp. - Class H | | | 451,528 | |
| | 7,000 | | | ZAR | | Discovery, Ltd. | | | 75,126 | |
| | 16,100 | | | ZAR | | FirstRand, Ltd. | | | 70,319 | |
| | 6,650 | | | KRW | | Hana Financial Group, Inc. | | | 224,009 | |
| | 5,700 | | | | | HDFC Bank, Ltd.~ | | | 506,787 | |
| | 14,600 | | | | | ICICI Bank, Ltd.^ | | | 138,554 | |
| | | | | | | | | | |
NUMBER OF
SHARES | | | | | | | VALUE | |
| | 8,700 | | | BRL | | IRB Brasil Resseguros, SA | | $ | 169,395 | |
| | 19,700 | | | | | Itau Unibanco Holding, SA^ | | | 259,449 | |
| | 35,600 | | | HKD | | Ping An Insurance Group Company of China, Ltd. - Class H | | | 336,564 | |
| | | | | | | | | | |
| | | | | | | | | 2,878,849 | |
| | | | | | | | | | |
| | | | | | Health Care (2.6%) | |
| | 105,000 | | | THB | | Bangkok Dusit Medical Services, PCL - Class F | | | 77,602 | |
| | 1,000 | | | KRW | | Dentium Company, Ltd. | | | 63,537 | |
| | 3,100 | | | | | Dr. Reddy’s Laboratories, Ltd.^ | | | 105,493 | |
| | 2,550 | | | GBP | | NMC Health, PLC | | | 114,978 | |
| | | | | | | | | | |
| | | | | | | | | 361,610 | |
| | | | | | | | | | |
| | | | | | Industrials (4.1%) | |
| | 88,000 | | | HKD | | China Railway Construction Corp., Ltd. - Class H | | | 111,761 | |
| | 90,000 | | | HKD | | CIMC Enric Holdings, Ltd. | | | 69,184 | |
| | 11,450 | | | | | Larsen & Toubro, Ltd. | | | 200,451 | |
| | 9,100 | | | BRL | | Localiza Rent a Car, SA | | | 70,301 | |
| | 57,300 | | | BRL | | Randon, SA Implementos e Participacoes | | | 122,252 | |
| | | | | | | | | | |
| | | | | | | | | 573,949 | |
| | | | | | | | | | |
| | | | | | Information Technology (18.6%) | |
| | 5,000 | | | TWD | | ASMedia Technology, Inc. | | | 69,220 | |
| | 2,500 | | | | | Fabrinet# | | | 108,300 | |
| | 48,600 | | | | | Infosys, Ltd.^ | | | 460,242 | |
| | 72,000 | | | HKD | | Kingdee International Software Group Company, Ltd. | | | 59,045 | |
| | 1,720 | | | KRW | | Koh Young Technology, Inc. | | | 136,289 | |
| | 1,000 | | | TWD | | Largan Precision Company, Ltd. | | | 109,263 | |
| | 4,100 | | | | | Pagseguro Digital, Ltd - Class A#^ | | | 110,659 | |
| | 1,140 | | | KRW | | Samsung Electro-Mechanics Company, Ltd. | | | 118,998 | |
| | 14,750 | | | KRW | | Samsung Electronics Company, Ltd. | | | 552,178 | |
| | 1,820 | | | KRW | | SK Hynix, Inc. | | | 109,610 | |
| | 93,000 | | | TWD | | Taiwan Semiconductor Manufacturing Company, Ltd. | | | 698,186 | |
| | 46,200 | | | HKD | | Xiaomi Corp. - Class B#* | | | 72,248 | |
| | | | | | | | | | |
| | | | | | | | | 2,604,238 | |
| | | | | | | | | | |
| | | | | | Materials (6.5%) | |
| | 25,800 | | | HKD | | Anhui Conch Cement Company, Ltd. - Class H | | | 133,725 | |
| | 12,600 | | | | | Cia de Minas Buenaventura, SAA | | | 174,384 | |
| | 472 | | | KRW | | LG Chem, Ltd. | | | 144,232 | |
| | 89,700 | | | MYR | | Petronas Chemicals Group, Bhd | | | 200,564 | |
| | 308 | | | KRW | | POSCO | | | 70,499 | |
| | 12,000 | | | | | Vale, SA^ | | | 181,200 | |
| | | | | | | | | | |
| | | | | | | | | 904,604 | |
| | | | | | | | | | |
| | | | |
| 122 | | CALAMOS OPEN-END FAMILY OF FUNDS ANNUAL REPORT | | See accompanying Notes to Schedule of Investments |
Emerging Market Equity Fund Schedule of Investments October 31, 2018
| | | | | | | | | | |
NUMBER OF
SHARES | | | | | | | VALUE | |
| | | | | | | | | | |
| | | | | | Real Estate (2.2%) | |
| | 268,500 | | | PHP | | Ayala Land, Inc. | | $ | 199,228 | |
| | 43,500 | | | HKD | | Longfor Group Holdings, Ltd. | | | 105,714 | |
| | | | | | | | | | |
| | | | | | | | | 304,942 | |
| | | | | | | | | | |
| | | | | | TOTAL COMMON STOCKS
(Cost $12,349,829) | | | 12,750,755 | |
| | | | | | | | | | |
| | | | | | | | | | |
| | EXCHANGE-TRADED FUNDS (3.9%) | |
| | | | | | Other (3.9%) | |
| | 5,600 | | | | | iShares MSCI Qatar ETF | | | 104,216 | |
| | 3,750 | | | | | iShares MSCI Saudi Arabia Capped ETF | | | 111,450 | |
| | 7,000 | | | | | iShares MSCI UAE ETF | | | 106,260 | |
| | 14,400 | | | | | VanEck Vectors Vietnam ETF^ | | | 218,592 | |
| | | | | | | | | | |
| | | | | | TOTAL EXCHANGE-TRADED FUNDS
(Cost $588,052) | | | 540,518 | |
| | | | | | | | | | |
| | | | | | | | | | |
NUMBER OF
CONTRACTS/
NOTIONAL
AMOUNT | | | | | | | VALUE | |
| | PURCHASED OPTIONS (0.6%) # | |
| | | | | | Energy (0.1%) | |
| 45
336,150 |
| | | | Lukoil, PJSC
Call, 03/15/19, Strike $75.00 | | | 16,650 | |
| | | | | | | | | | |
| | | | | | Information Technology (0.0%) | |
| 45
135,585 |
| | | | Yandex, NV
Call, 11/16/18, Strike $40.00 | | | 112 | |
| | | | | | | | | | |
| | | | | | Other (0.5%) | |
| 65
738,270 |
| | | | iShares 20+ Year Treasury Bond
Call, 03/15/19, Strike $120.00 | | | 5,005 | |
| 145
569,705 |
| | | | iShares China Large-Cap ETF
Put, 01/18/19, Strike $39.00 | | | 27,840 | |
| 235
488,800 |
| | | | Vaneck Vectors Russia ETF
Call, 02/15/19, Strike $21.00 | | | 17,860 | |
| | | | | | Xtrackers Harvest CSI 300 China A Shares ETF | | | | |
| 120
278,760 |
| | | | Call, 01/18/19, Strike $25.00 | | | 7,080 | |
| 120
278,760 |
| | | | Call, 01/17/20, Strike $27.00 | | | 16,080 | |
| | | | | | | | | | |
| | | | | | | | | 73,865 | |
| | | | | | | | | | |
| | | | | | TOTAL PURCHASED OPTIONS
(Cost $111,590) | | | 90,627 | |
| | | | | | | | | | |
| | | | | | | | | | |
NUMBER OF
SHARES | | | | | | | VALUE | |
| | SHORT TERM INVESTMENTS (6.3%) | |
| | 443,689 | | | | | Fidelity Prime Money Market Fund - Institutional Class, 2.240%*** | | | 443,822 | |
| | | | | | | | | | |
NUMBER OF
SHARES | | | | | | | VALUE | |
| | 442,997 | | | | | Morgan Stanley Institutional Liquidity Funds - Government Portfolio, 2.050%*** | | $ | 442,997 | |
| | | | | | | | | | |
| | | | | | TOTAL SHORT TERM INVESTMENTS
(Cost $886,819) | | | 886,819 | |
| | | | | | | | | | |
| | | | | | | | | | |
NUMBER OF
SHARES/
PRINCIPAL
AMOUNT | | | | | | | VALUE | |
| INVESTMENT OF CASH COLLATERAL FOR SECURITIES
LOANED (18.2%) |
|
| | 1,447,195 | | | | | Fidelity Prime Money Market Fund - Institutional Class, 2.240%***† | | | 1,447,195 | |
| | 1,096,193 | | | | | State Street Navigator Securities Lending Government Money Market Portfolio† | | | 1,096,193 | |
| | | | | | | | | | |
| | | �� | | | TOTAL INVESTMENT OF CASH COLLATERAL FOR SECURITIES LOANED
(Cost $2,543,388) | | | 2,543,388 | |
| | | | | | | | | | |
| TOTAL INVESTMENTS (120.1%)
(Cost $16,479,678) | | | 16,812,107 | |
| | | | | | | | | | |
| |
| | PAYABLE UPON RETURN OF SECURITIES ON LOAN (-18.2%) | | | (2,543,388 | ) |
| | | | | | | | | | |
| |
| | LIABILITIES, LESS OTHER ASSETS (-1.9%) | | | (269,294 | ) |
| | | | | | | | | | |
| |
| | NET ASSETS (100.0%) | | $ | 13,999,425 | |
| | | | | | | | | | |
NOTES TO SCHEDULE OF INVESTMENTS
| # | Non-income producing security. |
| ^ | Security, or portion of security, is on loan. |
| * | Securities issued and sold pursuant to a Rule 144A transaction are excepted from the registration requirement of the Securities Act of 1933, as amended. These securities may only be sold to qualified institutional buyers (“QIBs”), such as the Fund. Any resale of these securities must generally be effected through a sale that is registered under the Act or otherwise exempted from such registration requirements. |
| ~ | Security, or portion of security, is segregated as collateral (or collateral for potential future transactions) for written options. The aggregate value of such securities is $17,782. |
| *** | The rate disclosed is the 7 day net yield as of October 31, 2018. |
| † | Represents investment of cash collateral received from securities on loan as of October 31, 2018. |
| | | | | | |
| See accompanying Notes to Financial Statements | | www.calamos.com | | | 123 | |
Emerging Market Equity Fund Schedule of Investments October 31, 2018
FOREIGN CURRENCY ABBREVIATIONS
| | |
| BRL | | Brazilian Real |
| CNY | | Chinese Yuan Renminbi |
| GBP | | British Pound Sterling |
| HKD | | Hong Kong Dollar |
| IDR | | Indonesian Rupiah |
| KRW | | South Korean Won |
| MXN | | Mexican Peso |
| MYR | | Malaysian Ringgit |
| PHP | | Philippine Peso |
| PLN | | Polish Zloty |
| THB | | Thai Baht |
| TWD | | New Taiwan Dollar |
| ZAR | | South African Rand |
Note: Value for securities denominated in foreign currencies is shown in U.S. dollars. The date on options represents the expiration date of the option contract. The option contract may be exercised at any date on or before the date shown.
CURRENCY EXPOSURE
OCTOBER 31, 2018
| | | | | | | | |
| | | VALUE | | | % OF TOTAL
INVESTMENTS | |
| US Dollar | | $ | 8,927,036 | | | | 53.1% | |
| Hong Kong Dollar | | | 2,446,739 | | | | 14.6% | |
| South Korean Won | | | 1,518,669 | | | | 9.0% | |
| New Taiwan Dollar | | | 1,055,269 | | | | 6.3% | |
| Brazilian Real | | | 705,237 | | | | 4.2% | |
| South African Rand | | | 372,238 | | | | 2.2% | |
| Thai Baht | | | 323,168 | | | | 1.9% | |
| Mexican Peso | | | 309,136 | | | | 1.8% | |
| Indonesian Rupiah | | | 286,932 | | | | 1.7% | |
| British Pound Sterling | | | 212,239 | | | | 1.3% | |
| Malaysian Ringgit | | | 200,564 | | | | 1.2% | |
| Philippine Peso | | | 199,228 | | | | 1.2% | |
| Chinese Yuan Renminbi | | | 181,552 | | | | 1.1% | |
| Polish Zloty | | | 74,100 | | | | 0.4% | |
| Total Investments | | $ | 16,812,107 | | | | 100.0% | |
Currency exposure may vary over time.
| | | | |
| 124 | | CALAMOS OPEN-END FAMILY OF FUNDS ANNUAL REPORT | | See accompanying Notes to Financial Statements |
Global Equity Fund Schedule of Investments October 31, 2018
| | | | | | | | | | |
NUMBER OF
SHARES | | | | | | | VALUE | |
| | COMMON STOCKS (95.9%) | |
| | | | | | Communication Services (11.7%) | |
| | 2,835 | | | | | Alphabet, Inc. - Class A# | | $ | 3,091,794 | |
| | 10,720 | | | | | Facebook, Inc. - Class A# | | | 1,627,189 | |
| | 5,800 | | | JPY | | Nintendo Company, Ltd. | | | 1,810,776 | |
| | 80,500 | | | HKD | | Tencent Holdings, Ltd. | | | 2,757,870 | |
| | 17,420 | | | | | Walt Disney Company^ | | | 2,000,339 | |
| | | | | | | | | | |
| | | | | | | | | 11,287,968 | |
| | | | | | | | | | |
| | | | | | Consumer Discretionary (14.0%) | |
| | 22,850 | | | | | Alibaba Group Holding, Ltd.#^ | | | 3,251,098 | |
| | 1,905 | | | | | Amazon.com, Inc.#~ | | | 3,044,209 | |
| | 12,300 | | | | | Aptiv, PLC | | | 944,640 | |
| | 7,600 | | | | | Lowe’s Companies, Inc. | | | 723,672 | |
| | 14,300 | | | | | Lululemon Athletica, Inc.# | | | 2,012,439 | |
| | 20,800 | | | EUR | | Moncler, S.p.A. | | | 722,338 | |
| | 3,000 | | | | | O’Reilly Automotive, Inc.# | | | 962,250 | |
| | 1,950 | | | EUR | | Puma, SE | | | 1,002,727 | |
| | 172,000 | | | HKD | | Techtronic Industries Company, Ltd. | | | 809,908 | |
| | | | | | | | | | |
| | | | | | | | | 13,473,281 | |
| | | | | | | | | | |
| | | | | | Consumer Staples (8.7%) | |
| | 28,713 | | | GBP | | Diageo, PLC | | | 992,652 | |
| | 8,360 | | | EUR | | Kerry Group, PLC - Class A | | | 855,520 | |
| | 8,100 | | | CNY | | Kweichow Moutai Company, Ltd. - Class A | | | 641,609 | |
| | 7,100 | | | | | McCormick & Company, Inc.^ | | | 1,022,400 | |
| | 13,200 | | | | | Philip Morris International, Inc. | | | 1,162,524 | |
| | 23,100 | | | SEK | | Swedish Match, AB | | | 1,176,684 | |
| | 173,000 | | | AUD | | Treasury Wine Estates, Ltd. | | | 1,862,096 | |
| | 7,000 | | | | | Walmart, Inc. | | | 701,960 | |
| | | | | | | | | | |
| | | | | | | | | 8,415,445 | |
| | | | | | | | | | |
| | | | | | Energy (4.9%) | |
| | 20,000 | | | NOK | | Aker BP, ASA | | | 655,895 | |
| | 12,600 | | | | | Marathon Petroleum Corp. | | | 887,670 | |
| | 6,220 | | | | | Pioneer Natural Resources Company | | | 916,019 | |
| | 35,250 | | | EUR | | Royal Dutch Shell, PLC - Class A | | | 1,119,591 | |
| | 21,540 | | | | | Schlumberger, Ltd. | | | 1,105,218 | |
| | | | | | | | | | |
| | | | | | | | | 4,684,393 | |
| | | | | | | | | | |
| | | | | | Financials (13.4%) | |
| | 46,000 | | | | | Bank of America Corp. | | | 1,265,000 | |
| | 11,000 | | | | | Cboe Global Markets, Inc. | | | 1,241,350 | |
| | 84,324 | | | CHF | | Credit Suisse Group, AG# | | | 1,102,423 | |
| | 12,100 | | | EUR | | Deutsche Böerse, AG | | | 1,529,107 | |
| | 12,780 | | | | | E*TRADE Financial Corp. | | | 631,588 | |
| | 5,400 | | | | | Goldman Sachs Group, Inc. | | | 1,216,998 | |
| | 54,520 | | | INR | | HDFC Bank, Ltd. | | | 1,411,382 | |
| | 11,760 | | | | | JPMorgan Chase & Company | | | 1,282,075 | |
| | | | | | | | | | |
NUMBER OF
SHARES | | | | | | | VALUE | |
| | 60,500 | | | HKD | | Ping An Insurance Group Company of China, Ltd. - Class H | | $ | 571,969 | |
| | 61,420 | | | GBP | | Prudential, PLC | | | 1,229,851 | |
| | 4,040 | | | | | S&P Global, Inc. | | | 736,573 | |
| | 13,600 | | | | | US Bancorp | | | 710,872 | |
| | | | | | | | | | |
| | | | | | | | | 12,929,188 | |
| | | | | | | | | | |
| | | | | | Health Care (12.8%) | |
| | 12,560 | | | | | Alexion Pharmaceuticals, Inc.# | | | 1,407,599 | |
| | 15,400 | | | GBP | | AstraZeneca, PLC | | | 1,177,940 | |
| | 17,640 | | | | | Baxter International, Inc. | | | 1,102,676 | |
| | 12,100 | | | CAD | | Canopy Growth Corp.#^ | | | 445,139 | |
| | 8,500 | | | | | Edwards Lifesciences Corp.# | | | 1,254,600 | |
| | 7,200 | | | | | HealthEquity, Inc.#~ | | | 660,960 | |
| | 3,420 | | | | | Humana, Inc. | | | 1,095,802 | |
| | 5,200 | | | EUR | | Ipsen, SA | | | 720,998 | |
| | 12,940 | | | | | Johnson & Johnson | | | 1,811,471 | |
| | 7,700 | | | | | Laboratory Corp. of America Holdings# | | | 1,236,235 | |
| | 2,800 | | | CHF | | Lonza Group, AG# | | | 880,430 | |
| | 7,400 | | | | | Teladoc Health, Inc.# | | | 513,116 | |
| | | | | | | | | | |
| | | | | | | | | 12,306,966 | |
| | | | | | | | | | |
| | | | | | Industrials (8.7%) | |
| | 29,900 | | | SEK | | Alfa Laval, AB | | | 762,901 | |
| | 15,450 | | | | | CSX Corp. | | | 1,063,887 | |
| | 19,210 | | | | | Delta Air Lines, Inc. | | | 1,051,363 | |
| | 20,200 | | | JPY | | en-japan, Inc. | | | 805,719 | |
| | 7,000 | | | JPY | | FANUC Corp. | | | 1,217,768 | |
| | 26,900 | | | JPY | | Komatsu, Ltd. | | | 700,542 | |
| | 63,000 | | | BRL | | Localiza Rent a Car, SA | | | 486,699 | |
| | 5,250 | | | | | Raytheon Company | | | 918,960 | |
| | 10,900 | | | EUR | | Thales, SA | | | 1,392,127 | |
| | | | | | | | | | |
| | | | | | | | | 8,399,966 | |
| | | | | | | | | | |
| | | | | | Information Technology (19.5%) | |
| | 6,170 | | | | | Accenture, PLC - Class A | | | 972,515 | |
| | 30,500 | | | | | Advanced Micro Devices, Inc.# | | | 555,405 | |
| | 20,198 | | | | | Apple, Inc.~ | | | 4,420,534 | |
| | 7,280 | | | EUR | | ASML Holding, NV | | | 1,253,937 | |
| | 6,500 | | | | | Atlassian Corp., PLC - Class A# | | | 493,415 | |
| | 2,590 | | | CAD | | Constellation Software, Inc. | | | 1,782,495 | |
| | 14,500 | | | | | CyberArk Software, Ltd.# | | | 989,770 | |
| | 54,131 | | | GBP | | Keywords Studios, PLC | | | 947,906 | |
| | 110,900 | | | SEK | | LM Ericsson Telephone Company - Class B | | | 965,579 | |
| | 10,810 | | | | | MasterCard, Inc. - Class A | | | 2,136,813 | |
| | 3,220 | | | | | NVIDIA Corp. | | | 678,873 | |
| | 9,300 | | | | | PayPal Holdings, Inc.# | | | 782,967 | |
| | 264,000 | | | TWD | | Taiwan Semiconductor Manufacturing Company, Ltd. | | | 1,981,949 | |
| | | | | | |
| See accompanying Notes to Schedule of Investments | | www.calamos.com | | | 125 | |
Global Equity Fund Schedule of Investments October 31, 2018
| | | | | | | | | | |
NUMBER OF
SHARES | | | | | | | VALUE | |
| | 8,800 | | | | | Worldpay, Inc. - Class A# | | $ | 808,192 | |
| | | | | | | | | | |
| | | | | | | | | 18,770,350 | |
| | | | | | | | | | |
| | | | | | Materials (0.8%) | |
| | 192,540 | | | GBP | | Glencore, PLC# | | | 783,572 | |
| | | | | | | | | | |
| | | | | | Real Estate (1.4%) | |
| | 168,800 | | | EUR | | Aroundtown, SA | | | 1,398,781 | |
| | | | | | | | | | |
| | | | | | TOTAL COMMON STOCKS
(Cost $76,108,369) | | | 92,449,910 | |
| | | | | | | | | | |
| | | | | | | | | | |
NUMBER OF
CONTRACTS/
NOTIONAL
AMOUNT | | | | | | | VALUE | |
| | PURCHASED OPTION (0.2%) # | |
| | | | | | Other (0.2%) | | | | |
| 1,028
4,039,012 |
| | | | iShares China Large-Cap ETF
Put, 01/18/19, Strike $39.00
(Cost $210,664) | | | 197,376 | |
| | | | | | | | | | |
| | | | | | | | | | |
NUMBER OF
SHARES | | | | | | | VALUE | |
| | SHORT TERM INVESTMENTS (5.5%) | |
| | 2,663,376 | | | | | Fidelity Prime Money Market Fund - Institutional Class, 2.240%*** | | | 2,664,175 | |
| | 2,662,079 | | | | | Morgan Stanley Institutional Liquidity Funds - Government Portfolio, 2.050%*** | | | 2,662,079 | |
| | | | | | | | | | |
| | | | | | TOTAL SHORT TERM INVESTMENTS
(Cost $5,326,254) | | | 5,326,254 | |
| | | | | | | | | | |
| | | | | | | | | | |
NUMBER OF
SHARES/
PRINCIPAL
AMOUNT | | | | | | | VALUE | |
| INVESTMENT OF CASH COLLATERAL FOR SECURITIES
LOANED (0.4%) |
|
| | 404,808 | | | | | State Street Navigator Securities Lending Government Money Market Portfolio† (Cost $404,808) | | | 404,808 | |
| | | | | | | | | | |
| TOTAL INVESTMENTS (102.0%)
(Cost $82,050,095) | | | 98,378,348 | |
| | | | | | | | | | |
| |
| | PAYABLE UPON RETURN OF SECURITIES ON LOAN (-0.4%) | | | (404,808 | ) |
| | | | | | | | | | |
| |
| | LIABILITIES, LESS OTHER ASSETS (-1.6%) | | | (1,519,950 | ) |
| | | | | | | | | | |
| |
| | NET ASSETS (100.0%) | | $ | 96,453,590 | |
| | | | | | | | | | |
NOTES TO SCHEDULE OF INVESTMENTS
| # | Non-income producing security. |
| ^ | Security, or portion of security, is on loan. |
| ~ | Security, or portion of security, is segregated as collateral (or collateral for potential future transactions) for written options. The aggregate value of such securities is $118,384. |
| *** | The rate disclosed is the 7 day net yield as of October 31, 2018. |
| † | Represents investment of cash collateral received from securities on loan as of October 31, 2018. |
FOREIGN CURRENCY ABBREVIATIONS
| | |
| AUD | | Australian Dollar |
| BRL | | Brazilian Real |
| CAD | | Canadian Dollar |
| CHF | | Swiss Franc |
| CNY | | Chinese Yuan Renminbi |
| EUR | | European Monetary Unit |
| GBP | | British Pound Sterling |
| HKD | | Hong Kong Dollar |
| INR | | Indian Rupee |
| JPY | | Japanese Yen |
| NOK | | Norwegian Krone |
| SEK | | Swedish Krona |
| TWD | | New Taiwan Dollar |
Note: Value for securities denominated in foreign currencies is shown in U.S. dollars. The date on options represents the expiration date of the option contract. The option contract may be exercised at any date on or before the date shown.
CURRENCY EXPOSURE
OCTOBER 31, 2018 (UNAUDITED)
| | | | | | | | |
| | | VALUE | | | % OF TOTAL
INVESTMENTS | |
| US Dollar | | $ | 60,421,468 | | | | 61.4% | |
| European Monetary Unit | | | 9,995,126 | | | | 10.2% | |
| British Pound Sterling | | | 5,131,921 | | | | 5.2% | |
| Japanese Yen | | | 4,534,805 | | | | 4.6% | |
| Hong Kong Dollar | | | 4,139,747 | | | | 4.2% | |
| Swedish Krona | | | 2,905,164 | �� | | | 3.0% | |
| Canadian Dollar | | | 2,227,634 | | | | 2.3% | |
| Swiss Franc | | | 1,982,853 | | | | 2.0% | |
| New Taiwan Dollar | | | 1,981,949 | | | | 2.0% | |
| Australian Dollar | | | 1,862,096 | | | | 1.9% | |
| Indian Rupee | | | 1,411,382 | | | | 1.4% | |
| Norwegian Krone | | | 655,895 | | | | 0.7% | |
| Chinese Yuan Renminbi | | | 641,609 | | | | 0.6% | |
| Brazilian Real | | | 486,699 | | | | 0.5% | |
| Total Investments | | $ | 98,378,348 | | | | 100.0% | |
Currency exposure may vary over time.
| | | | |
| 126 | | CALAMOS OPEN-END FAMILY OF FUNDS ANNUAL REPORT | | See accompanying Notes to Financial Statements |
Global Growth and Income Fund Schedule of Investments October 31, 2018
| | | | | | | | | | |
PRINCIPAL
AMOUNT | | | | | | | VALUE | |
| | CONVERTIBLE BONDS (27.0%) | |
| | | | | | Communication Services (1.4%) | |
| | 100,000,000 | | | JPY | | CyberAgent, Inc.
0.000%, 02/19/25 | | $ | 985,488 | |
| | 1,600,000 | | | | | GCI Liberty, Inc.*
1.750%, 09/30/46 | | | 1,735,432 | |
| | | | | | | | | | |
| | | | | | | | | 2,720,920 | |
| | | | | | | | | | |
| | | | | | Consumer Discretionary (1.6%) | |
| | 1,530,000 | | | | | Ctrip.com International, Ltd.^
1.990%, 07/01/25 | | | 1,524,691 | |
| | 447,500 | | | | | LVMH Moet Hennessy Louis Vuitton, SE
0.000%, 02/16/21 | | | 1,462,663 | |
| | | | | | | | | | |
| | | | | | | | | 2,987,354 | |
| | | | | | | | | | |
| | | | | | Energy (3.7%) | |
| | 3,800,000 | | | | | TOTAL, SA
0.500%, 12/02/22 | | | 4,135,388 | |
| | 2,400,000 | | | | | Tullow Oil Jersey, Ltd.
6.625%, 07/12/21 | | | 2,875,032 | |
| | | | | | | | | | |
| | | | | | | | | 7,010,420 | |
| | | | | | | | | | |
| | | | | | Financials (6.0%) | |
| | 1,100,000 | | | EUR | | AURELIUS Equity Opportunities SE & Co. KGaA
1.000%, 12/01/20 | | | 1,271,176 | |
| | 1,800,000 | | | EUR | | Corestate Capital Holding, SA
1.375%, 11/28/22 | | | 1,982,878 | |
| | | | | | JPMorgan Chase Bank, N.A. | | | | |
| | 14,000,000 | | | HKD | | 0.000%, 10/29/20* | | | 1,854,253 | |
| | 4,200,000 | | | | | 0.000%, 12/30/20 | | | 4,386,417 | |
| | 220,000,000 | | | JPY | | Mitsubishi Chemical Holdings Corp.
0.000%, 03/29/24 | | | 2,015,388 | |
| | | | | | | | | | |
| | | | | | | | | 11,510,112 | |
| | | | | | | | | | |
| | | | | | Health Care (1.6%) | |
| | 1,800,000 | | | EUR | | Bayer Capital Corp., BV
5.625%, 11/22/19 | | | 1,703,698 | |
| | 1,326,000 | | | CAD | | Canopy Growth Corp.*
4.250%, 07/15/23 | | | 1,329,576 | |
| | | | | | | | | | |
| | | | | | | | | 3,033,274 | |
| | | | | | | | | | |
| | | | | | Industrials (2.9%) | |
| | 2,350,000 | | | | | Echo Global Logistics, Inc.
2.500%, 05/01/20 | | | 2,336,875 | |
| | 3,270,000 | | | | | Larsen & Toubro, Ltd.
0.675%, 10/22/19 | | | 3,213,789 | |
| | | | | | | | | | |
| | | | | | | | | 5,550,664 | |
| | | | | | | | | | |
| | | | | | Information Technology (7.0%) | |
| | 840,000 | | | | | Atlassian, Inc.*
0.625%, 05/01/23 | | | 962,917 | |
| | 1,035,000 | | | | | DocuSign, Inc.*
0.500%, 09/15/23 | | | 970,297 | |
| | 1,000,000 | | | | | Envestnet, Inc.
1.750%, 12/15/19 | | | 1,035,160 | |
| | 60,000,000 | | | JPY | | GMO Payment Gateway, Inc.
0.000%, 06/19/23 | | | 572,317 | |
| | | | | | | | | | |
PRINCIPAL
AMOUNT | | | | | | | VALUE | |
| | 3,060,000 | | | | | Palo Alto Networks, Inc.*
0.750%, 07/01/23 | | $ | 2,975,590 | |
| | 2,045,000 | | | | | Splunk, Inc.*^
0.500%, 09/15/23 | | | 1,957,085 | |
| | 790,000 | | | | | Twilio, Inc.*
0.250%, 06/01/23 | | | 987,216 | |
| | 1,780,000 | | | | | Workday, Inc.^
0.250%, 10/01/22 | | | 1,978,710 | |
| | 2,050,000 | | | | | Xero Investments, Ltd.
2.375%, 10/04/23 | | | 1,870,195 | |
| | | | | | | | | | |
| | | | | | | | | 13,309,487 | |
| | | | | | | | | | |
| | | | | | Materials (2.5%) | |
| | 1,560,000 | | | | | Cemex, SAB de CV
3.720%, 03/15/20 | | | 1,537,505 | |
| | 3,600,000 | | | | | Glencore Funding, LLC
0.000%, 03/27/25 | | | 3,242,430 | |
| | | | | | | | | | |
| | | | | | | | | 4,779,935 | |
| | | | | | | | | | |
| | | | | | Real Estate (0.3%) | |
| | 558,000 | | | | | AYC Finance, Ltd.
0.500%, 05/02/19 | | | 561,136 | |
| | | | | | | | | | |
| | | | | | TOTAL CONVERTIBLE BONDS
(Cost $54,382,992) | | | 51,463,302 | |
| | | | | | | | | | |
| | SYNTHETIC CONVERTIBLE SECURITIES (6.7%)¤ | |
| | Corporate Bond (0.6%) | |
| | | | | | Information Technology (0.6%) | |
| | 1,080,000 | | | | | Apple, Inc.
2.000%, 11/13/20 | | | 1,057,039 | |
| | | | | | | | | | |
| | U.S. Government and Agency Securities (5.5%) | |
| | | | | | United States Treasury Note | | | | |
| | 2,205,000 | | | | | 1.875%, 05/31/22 | | | 2,124,580 | |
| | 2,200,000 | | | | | 1.875%, 10/31/22 | | | 2,110,004 | |
| | 2,125,000 | | | | | 1.750%, 10/31/20 | | | 2,078,695 | |
| | 2,095,000 | | | | | 2.625%, 08/15/20^ | | | 2,086,022 | |
| | 2,080,000 | | | | | 2.625%, 11/15/20 | | | 2,069,327 | |
| | | | | | | | | | |
| | | | | | TOTAL U.S. GOVERNMENT AND AGENCY SECURITIES | | | 10,468,628 | |
| | | | | | | | | | |
NUMBER OF
CONTRACTS/
NOTIONAL
AMOUNT | | | | | | | VALUE | |
| | Purchased Options (0.6%)# | |
| | | | | | Consumer Discretionary (0.2%) | |
| 34
5,433,234 |
| | | | Amazon.com, Inc.
Call, 11/16/18, Strike $1,900.00 | | | 4,709 | |
| 8
1,499,664 |
| | | | Booking Holdings, Inc.
Call, 01/17/20, Strike $1,920.00 | | | 196,000 | |
| 280
2,357,320 |
| | | | Paypal Holdings, Inc.
Call, 01/18/19, Strike $90.00 | | | 73,080 | |
| 350
1,894,550 |
| | | | Sony Corp.
Call, 01/18/19, Strike $62.50 | | | 21,000 | |
| | | | | | | | | | |
| | | | | | | | | 294,789 | |
| | | | | | | | | | |
| | | | | | |
| See accompanying Notes to Schedule of Investments | | www.calamos.com | | | 127 | |
Global Growth and Income Fund Schedule of Investments October 31, 2018
| | | | | | | | | | |
NUMBER OF
CONTRACTS/
NOTIONAL
AMOUNT | | | | | | | VALUE | |
| | | | | | | | | | |
| | | | | | Health Care (0.0%) | |
| 66
2,053,590 |
| | | | Illumina, Inc.
Call, 12/21/18, Strike $330.00 | | $ | 51,150 | |
| | | | | | | | | | |
| | | | | | Industrials (0.0%) | | | | |
| 285
1,962,510 |
| | | | CSX Corp.
Call, 01/18/19, Strike $75.00 | | | 34,200 | |
| | | | | | | | | | |
| | | | | | Information Technology (0.1%) | |
| 250
2,296,000 |
| | | | Worldpay, Inc.
Call, 01/18/19, Strike $95.00 | | | 103,750 | |
| 250
2,134,250 |
| | | | Xilinx, Inc.
Call, 01/18/19, Strike $85.00 | | | 145,000 | |
| | | | | | | | | | |
| | | | | | | | | 248,750 | |
| | | | | | | | | | |
| | | | | | Other (0.3%) | | | | |
| | | | | | iShares 20+ Year Treasury Bond | | | | |
| 865
9,824,670 |
| | | | Call, 01/18/19, Strike $125.00 | | | 11,245 | |
| 840
9,540,720 |
| | | | Call, 03/15/19, Strike $120.00 | | | 64,680 | |
| 720
3,948,480 |
| | | | iShares MSCI Japan ETF
Call, 01/18/19, Strike $60.00 | | | 10,440 | |
| 475
12,854,925 |
| | | | SPDR S&P 500 ETF Trust
Call, 01/18/19, Strike $267.00 | | | 531,762 | |
| | | | | | | | | | |
| | | | | | | | | 618,127 | |
| | | | | | | | | | |
| | | | | | TOTAL PURCHASED OPTIONS | | | 1,247,016 | |
| | | | | | | | | | |
| | | | | | TOTAL SYNTHETIC CONVERTIBLE SECURITIES
(Cost $14,003,883) | | | 12,772,683 | |
| | | | | | | | | | |
| | | | | | | | | | |
NUMBER OF
SHARES | | | | | | | VALUE | |
| | CONVERTIBLE PREFERRED STOCKS (6.7%) | |
| | | | | | Communication Services (2.7%) | |
| | 32,160 | | | | | Alibaba Exchangeable (Softbank)*§
5.750%, 06/01/19 | | | 5,186,910 | |
| | | | | | | | | | |
| | | | | | Industrials (0.6%) | |
| | 20,300 | | | | | Rexnord Corp.
5.750%, 11/15/19 | | | 1,160,551 | |
| | | | | | | | | | |
| | | | | | Real Estate (0.9%) | | | | |
| | 1,580 | | | | | Crown Castle International Corp.
6.875%, 08/01/20 | | | 1,651,100 | |
| | | | | | | | | | |
| | | | | | Utilities (2.5%) | | | | |
| | 43,500 | | | | | DTE Energy Company
6.500%, 10/01/19 | | | 2,319,855 | |
| | 41,100 | | | | | NextEra Energy, Inc.^
6.123%, 09/01/19 | | | 2,383,800 | |
| | | | | | | | | | |
| | | | | | | | | 4,703,655 | |
| | | | | | | | | | |
| | | | | | TOTAL CONVERTIBLE PREFERRED STOCKS
(Cost $10,849,203) | | | 12,702,216 | |
| | | | | | | | | �� | |
| | | | | | | | | | |
NUMBER OF
SHARES | | | | | | | VALUE | |
| | COMMON STOCKS (54.5%) | |
| | | | | | Communication Services (7.5%) | |
| | 2,670 | | | | | Alphabet, Inc. - Class A# | | $ | 2,911,849 | |
| | 9,800 | | | | | Facebook, Inc. - Class A# | | | 1,487,542 | |
| | 5,800 | | | JPY | | Nintendo Company, Ltd. | | | 1,810,776 | |
| | 74,800 | | | HKD | | Tencent Holdings, Ltd. | | | 2,562,593 | |
| | 24,600 | | | | | Verizon Communications, Inc. | | | 1,404,414 | |
| | 35,100 | | | | | Walt Disney Company^ | | | 4,030,533 | |
| | | | | | | | | | |
| | | | | | | | | 14,207,707 | |
| | | | | | | | | | |
| | | | | | Consumer Discretionary (2.6%) | |
| | 12,400 | | | | | Aptiv, PLC | | | 952,320 | |
| | 32,100 | | | EUR | | Daimler, AG | | | 1,901,495 | |
| | 3,900 | | | EUR | | Puma, SE | | | 2,005,455 | |
| | | | | | | | | | |
| | | | | | | | | 4,859,270 | |
| | | | | | | | | | |
| | | | | | Consumer Staples (8.7%) | |
| | 49,800 | | | | | Coca-Cola Company | | | 2,384,424 | |
| | 14,000 | | | EUR | | Danone, SA | | | 991,387 | |
| | 55,700 | | | GBP | | Diageo, PLC | | | 1,925,633 | |
| | 19,200 | | | EUR | | Kerry Group, PLC - Class A | | | 1,964,831 | |
| | 38,500 | | | CHF | | Nestlé, SA | | | 3,250,289 | |
| | 10,500 | | | | | Philip Morris International, Inc. | | | 924,735 | |
| | 18,900 | | | JPY | | Pigeon Corp. | | | 799,323 | |
| | 19,083 | | | EUR | | Unilever, NV | | | 1,025,425 | |
| | 32,600 | | | | | Walmart, Inc. | | | 3,269,128 | |
| | | | | | | | | | |
| | | | | | | | | 16,535,175 | |
| | | | | | | | | | |
| | | | | | Energy (5.4%) | | | | |
| | 12,800 | | | | | Chevron Corp. | | | 1,429,120 | |
| | 5,300 | | | | | CNOOC, Ltd. | | | 897,025 | |
| | 24,500 | | | | | Exxon Mobil Corp. | | | 1,952,160 | |
| | 18,400 | | | | | Marathon Petroleum Corp. | | | 1,296,280 | |
| | 81,800 | | | EUR | | Royal Dutch Shell, PLC - Class A | | | 2,598,086 | |
| | 42,800 | | | | | Schlumberger, Ltd. | | | 2,196,068 | |
| | | | | | | | | | |
| | | | | | | | | 10,368,739 | |
| | | | | | | | | | |
| | | | | | Financials (11.1%) | | | | |
| | 113,900 | | | | | Bank of America Corp. | | | 3,132,250 | |
| | 10,500 | | | | | Cboe Global Markets, Inc. | | | 1,184,925 | |
| | 133,563 | | | CHF | | Credit Suisse Group, AG# | | | 1,746,157 | |
| | 19,350 | | | EUR | | Deutsche Böerse, AG | | | 2,445,308 | |
| | 11,000 | | | | | Goldman Sachs Group, Inc. | | | 2,479,070 | |
| | 75,100 | | | INR | | HDFC Bank, Ltd. | | | 1,944,145 | |
| | 29,200 | | | | | JPMorgan Chase & Company | | | 3,183,384 | |
| | 111,675 | | | GBP | | Prudential, PLC | | | 2,236,139 | |
| | 7,950 | | | | | S&P Global, Inc. | | | 1,449,444 | |
| | 27,200 | | | | | US Bancorp | | | 1,421,744 | |
| | | | | | | | | | |
| | | | | | | | | 21,222,566 | |
| | | | | | | | | | |
| | | | |
| 128 | | CALAMOS OPEN-END FAMILY OF FUNDS ANNUAL REPORT | | See accompanying Notes to Schedule of Investments |
Global Growth and Income Fund Schedule of Investments October 31, 2018
| | | | | | | | | | |
NUMBER OF
SHARES | | | | | | | VALUE | |
| | | | | | | | | | |
| | | | | | Health Care (7.9%) | |
| | 19,500 | | | | | Alexion Pharmaceuticals, Inc.# | | $ | 2,185,365 | |
| | 5,234 | | | | | Anthem, Inc. | | | 1,442,333 | |
| | 21,400 | | | GBP | | AstraZeneca, PLC | | | 1,636,878 | |
| | 14,000 | | | | | Baxter International, Inc. | | | 875,140 | |
| | 6,600 | | | | | Edwards Lifesciences Corp.# | | | 974,160 | |
| | 5,000 | | | | | Humana, Inc. | | | 1,602,050 | |
| | 34,300 | | | | | Johnson & Johnson | | | 4,801,657 | |
| | 9,300 | | | | | Laboratory Corp. of America Holdings# | | | 1,493,115 | |
| | | | | | | | | | |
| | | | | | | | | 15,010,698 | |
| | | | | | | | | | |
| | | | | | Industrials (1.8%) | | | | |
| | 27,500 | | | | | Delta Air Lines, Inc. | | | 1,505,075 | |
| | 11,500 | | | JPY | | FANUC Corp. | | | 2,000,619 | |
| | | | | | | | | | |
| | | | | | | | | 3,505,694 | |
| | | | | | | | | | |
| | | | | | Information Technology (9.5%) | |
| | 59,000 | | | | | Advanced Micro Devices, Inc.# | | | 1,074,390 | |
| | 19,000 | | | | | Apple, Inc. | | | 4,158,340 | |
| | 8,425 | | | EUR | | ASML Holding, NV | | | 1,451,156 | |
| | 2,100 | | | CAD | | Constellation Software, Inc. | | | 1,445,266 | |
| | 117,000 | | | SEK | | LM Ericsson Telephone Company - Class B | | | 1,018,691 | |
| | 15,700 | | | | | MasterCard, Inc. - Class A | | | 3,103,419 | |
| | 28,500 | | | | | Microsoft Corp. | | | 3,044,085 | |
| | 374,000 | | | TWD | | Taiwan Semiconductor Manufacturing Company, Ltd. | | | 2,807,761 | |
| | | | | | | | | | |
| | | | | | | | | 18,103,108 | |
| | | | | | | | | | |
| | | | | | TOTAL COMMON STOCKS
(Cost $88,912,553) | | | 103,812,957 | |
| | | | | | | | | | |
| | | | | | | | | | |
NUMBER OF
CONTRACTS/
NOTIONAL
AMOUNT | | | | | | | VALUE | |
| | PURCHASED OPTIONS (0.3%)# | |
| | | | | | Other (0.3%) | | | | |
| 280
4,754,960 |
| | | | Invesco QQQ Trust Series
Put, 01/18/19, Strike $170.00 | | | 211,120 | |
| 500
1,964,500 |
| | | | iShares China Large-Cap ETF
Put, 01/18/19, Strike $39.00 | | | 96,000 | |
| 770
4,809,420 |
| | | | iShares MSCI EAFE ETF
Put, 01/18/19, Strike $62.00 | | | 138,215 | |
| 485
1,899,260 |
| | | | iShares MSCI Emerging Markets ETF Put, 01/18/19, Strike $39.00 | | | 87,300 | |
| | | | | | | | | | |
| | | | | | TOTAL PURCHASED OPTIONS
(Cost $442,412) | | | 532,635 | |
| | | | | �� | | | | | |
| | | | | | | | | | |
| | | | | | | | | | |
NUMBER OF
SHARES | | | | | | | VALUE | |
| | SHORT TERM INVESTMENTS (5.5%) | |
| | 5,194,930 | | | | | Fidelity Prime Money Market Fund - Institutional Class, 2.240%*** | | $ | 5,196,489 | |
| | 5,191,962 | | | | | Morgan Stanley Institutional Liquidity Funds - Government Portfolio, 2.050%*** | | | 5,191,962 | |
| | | | | | | | | | |
| | | | | | TOTAL SHORT TERM INVESTMENTS
(Cost $10,388,451) | | | 10,388,451 | |
| | | | | | | | | | |
| | | | | | | | | | |
NUMBER OF
SHARES/
PRINCIPAL
AMOUNT | | | | | | | VALUE | |
| INVESTMENT OF CASH COLLATERAL FOR SECURITIES
LOANED (1.1%) |
|
| | 2,140,313 | | | | | Fidelity Prime Money Market Fund - Institutional Class, 2.240%***† (Cost $2,140,313) | | | 2,140,313 | |
| | | | | | | | | | |
| TOTAL INVESTMENTS (101.8%)
(Cost $181,119,807) | | | 193,812,557 | |
| | | | | | | | | | |
| |
| | PAYABLE UPON RETURN OF SECURITIES ON LOAN (-1.1%) | | | (2,140,313 | ) |
| | | | | | | | | | |
| |
| | LIABILITIES, LESS OTHER ASSETS (-0.7%) | | | (1,335,716 | ) |
| | | | | | | | | | |
| |
| | NET ASSETS (100.0%) | | $ | 190,336,528 | |
| | | | | | | | | | |
NOTES TO SCHEDULE OF INVESTMENTS
| * | Securities issued and sold pursuant to a Rule 144A transaction are excepted from the registration requirement of the Securities Act of 1933, as amended. These securities may only be sold to qualified institutional buyers (“QIBs”), such as the Fund. Any resale of these securities must generally be effected through a sale that is registered under the Act or otherwise exempted from such registration requirements. |
| ^ | Security, or portion of security, is on loan. |
| # | Non-income producing security. |
| ¤ | The synthetic convertible securities strategy combines separate securities that together possess the economic characteristics similar to a convertible security. |
| § | Securities exchangeable or convertible into securities of one or more entities that are different than the issuer. Each entity is identified in the parenthetical. |
| *** | The rate disclosed is the 7 day net yield as of October 31, 2018. |
| † | Represents investment of cash collateral received from securities on loan as of October 31, 2018. |
| | | | | | |
| See accompanying Notes to Financial Statements | | www.calamos.com | | | 129 | |
Global Growth and Income Fund Schedule of Investments October 31, 2018
FOREIGN CURRENCY ABBREVIATIONS
| | |
| CAD | | Canadian Dollar |
| CHF | | Swiss Franc |
| EUR | | European Monetary Unit |
| GBP | | British Pound Sterling |
| HKD | | Hong Kong Dollar |
| INR | | Indian Rupee |
| JPY | | Japanese Yen |
| SEK | | Swedish Krona |
| TWD | | New Taiwan Dollar |
Note: Value for securities denominated in foreign currencies is shown in U.S. dollars. The principal amount for such securities is shown in the respective foreign currency. The date on options represents the expiration date of the option contract. The option contract may be exercised at any date on or before the date shown.
CURRENCY EXPOSURE
OCTOBER 31, 2018
| | | | | | | | |
| | | VALUE | | | % OF TOTAL
INVESTMENTS | |
| US Dollar | | $ | 142,530,370 | | | | 73.5% | |
| European Monetary Unit | | | 19,340,895 | | | | 10.0% | |
| Japanese Yen | | | 8,183,911 | | | | 4.2% | |
| British Pound Sterling | | | 5,798,650 | | | | 3.0% | |
| Swiss Franc | | | 4,996,446 | | | | 2.6% | |
| Hong Kong Dollar | | | 4,416,846 | | | | 2.3% | |
| New Taiwan Dollar | | | 2,807,761 | | | | 1.5% | |
| Canadian Dollar | | | 2,774,842 | | | | 1.4% | |
| Indian Rupee | | | 1,944,145 | | | | 1.0% | |
| Swedish Krona | | | 1,018,691 | | | | 0.5% | |
| Total Investments | | $ | 193,812,557 | | | | 100.0% | |
Currency exposure may vary over time.
| | | | |
| 130 | | CALAMOS OPEN-END FAMILY OF FUNDS ANNUAL REPORT | | See accompanying Notes to Financial Statements |
Total Return Bond Fund Schedule of Investments October 31, 2018
| | | | | | | | | | |
PRINCIPAL
AMOUNT | | | | | | | VALUE | |
| | CORPORATE BONDS (55.7%) | |
| | | | | | Communication Services (3.3%) | |
| | 250,000 | | | | | British Telecommunications, PLC
2.350%, 02/14/19 | | $ | 249,510 | |
| | 250,000 | | | | | Comcast Corp.
3.900%, 03/01/38 | | | 223,901 | |
| | 110,000 | | | | | Crown Castle Towers, LLC*
3.720%, 07/15/23 | | | 109,600 | |
| | 300,000 | | | | | Electronic Arts, Inc.
4.800%, 03/01/26 | | | 308,716 | |
| | 150,000 | | | | | Embarq Corp.
7.995%, 06/01/36 | | | 143,277 | |
| | 110,000 | | | | | Hughes Satellite Systems Corp.
5.250%, 08/01/26 | | | 105,079 | |
| | 150,000 | | | | | Sprint Corp.
7.125%, 06/15/24 | | | 153,436 | |
| | 200,000 | | | | | Sprint Spectrum Company, LLC / Sprint Spectrum Company II, LLC / Sprint Spectrum Company III, LLC*
4.738%, 03/20/25 | | | 200,331 | |
| | 125,000 | | | | | United States Cellular Corp.
6.700%, 12/15/33 | | | 128,023 | |
| | 250,000 | | | | | Verizon Communications, Inc.
3.500%, 11/01/24 | | | 244,919 | |
| | | | | | | | | | |
| | | | | | | | | 1,866,792 | |
| | | | | | | | | | |
| | | | | | Consumer Discretionary (6.7%) | |
| | 200,000 | | | | | Allergan Funding SCS^
3.800%, 03/15/25 | | | 193,022 | |
| | 350,000 | | | | | BMW US Capital, LLC*
3.100%, 04/12/21 | | | 346,748 | |
| | 275,000 | | | | | Cargill, Inc.*
3.250%, 03/01/23 | | | 270,385 | |
| | 150,000 | | | | | CCO Holdings, LLC / CCO Holdings Capital Corp.*^
5.750%, 02/15/26 | | | 148,898 | |
| | 250,000 | | | | | D.R. Horton, Inc.
4.750%, 02/15/23 | | | 254,491 | |
| | 150,000 | | | | | DISH DBS Corp.^
7.750%, 07/01/26 | | | 133,261 | |
| | 250,000 | | | | | Expedia Group, Inc.
5.950%, 08/15/20 | | | 259,750 | |
| | 250,000 | | | | | Ford Motor Credit Company, LLC
5.875%, 08/02/21 | | | 258,645 | |
| | 250,000 | | | | | General Motors Financial Company, Inc.^
3.700%, 05/09/23 | | | 242,309 | |
| | 250,000 | | | | | Harley-Davidson Financial Services, Inc.*
2.150%, 02/26/20 | | | 245,859 | |
| | 250,000 | | | | | Hasbro, Inc.
3.150%, 05/15/21 | | | 246,949 | |
| | 150,000 | | | | | L Brands, Inc.
5.625%, 02/15/22 | | | 152,403 | |
| | 150,000 | | | | | Lennar Corp.
4.750%, 11/15/22 | | | 148,972 | |
| | | | | | | | | | |
PRINCIPAL
AMOUNT | | | | | | | VALUE | |
| | 200,000 | | | | | Mattel, Inc.*^
6.750%, 12/31/25 | | $ | 191,505 | |
| | 250,000 | | | | | Starbucks Corp.
3.100%, 03/01/23 | | | 243,951 | |
| | 180,904 | | | | | US Airways Series 2012-2, Class B Pass Through Trust
6.750%, 06/03/21 | | | 189,708 | |
| | 250,000 | | | | | Warner Media, LLC
3.600%, 07/15/25 | | | 237,143 | |
| | | | | | | | | | |
| | | | | | | | | 3,763,999 | |
| | | | | | | | | | |
| | | | | | Consumer Staples (3.6%) | |
| | 250,000 | | | | | Anheuser-Busch InBev Finance, Inc.
3.650%, 02/01/26 | | | 237,595 | |
| | 200,000 | | | | | Brown-Forman Corp.
3.500%, 04/15/25 | | | 196,453 | |
| | 250,000 | | | | | Conagra Brands, Inc.
3.800%, 10/22/21 | | | 250,659 | |
| | 400,000 | | | | | General Mills, Inc.
2.600%, 10/12/22 | | | 382,292 | |
| | 250,000 | | | | | Hershey Company
3.375%, 05/15/23 | | | 248,706 | |
| | 250,000 | | | | | JBS USA LUX, SA / JBS USA Finance, Inc.*
7.250%, 06/01/21 | | | 253,434 | |
| | 250,000 | | | | | Mondelez International Holdings Netherlands, BV*
2.000%, 10/28/21 | | | 238,127 | |
| | 250,000 | | | | | WM Wrigley Jr. Company*^
3.375%, 10/21/20 | | | 250,199 | |
| | | | | | | | | | |
| | | | | | | | | 2,057,465 | |
| | | | | | | | | | |
| | | | | | Energy (2.6%) | | | | |
| | 200,000 | | | | | Buckeye Partners, LP‡
6.375%, 01/22/78
3 mo. USD LIBOR + 4.02% | | | 183,465 | |
| | 150,000 | | | | | CenterPoint Energy Houston Electric, LLC^
3.950%, 03/01/48 | | | 139,915 | |
| | 150,000 | | | | | Continental Resources, Inc.^
4.500%, 04/15/23 | | | 150,592 | |
| | 175,000 | | | | | Energy Transfer, LP‡
5.559%, 11/01/66
3 mo. USD LIBOR + 3.02% | | | 150,934 | |
| | 250,000 | | | | | Enterprise Products Operating, LLC^‡
4.875%, 08/16/77
3 mo. USD LIBOR + 2.99% | | | 233,475 | |
| | 175,000 | | | | | Plains All American Pipeline, LP‡
6.125%, 11/15/22
3 mo. USD LIBOR + 4.11% | | | 164,034 | |
| | 190,000 | | | | | Rochester Gas & Electric Corp.*
3.100%, 06/01/27 | | | 179,857 | |
| | 250,000 | | | | | Schlumberger Investment, SA*^
3.300%, 09/14/21 | | | 248,699 | |
| | | | | | | | | | |
| | | | | | | | | 1,450,971 | |
| | | | | | | | | | |
| | | | | | |
| See accompanying Notes to Schedule of Investments | | www.calamos.com | | | 131 | |
Total Return Bond Fund Schedule of Investments October 31, 2018
| | | | | | | | | | |
PRINCIPAL
AMOUNT | | | | | | | VALUE | |
| | | | | | | | | | |
| | | | | | Financials (17.6%) | | | | |
| | 100,000 | | | | | Ally Financial, Inc.
8.000%, 11/01/31 | | $ | 120,379 | |
| | 250,000 | | | | | American Express Company
3.000%, 10/30/24 | | | 236,945 | |
| | 250,000 | | | | | AON Corp.
5.000%, 09/30/20 | | | 257,164 | |
| | 350,000 | | | | | Axis Specialty Finance, PLC^
4.000%, 12/06/27 | | | 328,305 | |
| | 450,000 | | | | | Bank of America Corp.‡
3.366%, 01/23/26
3 mo. USD LIBOR + 0.81% | | | 430,186 | |
| | 300,000 | | | | | Bank of Montreal
1.900%, 08/27/21 | | | 287,696 | |
| | 300,000 | | | | | Bank of Nova Scotia
2.450%, 09/19/22 | | | 288,211 | |
| | 350,000 | | | | | Capital One Financial Corp.^
3.200%, 01/30/23 | | | 338,562 | |
| | 350,000 | | | | | Charles Schwab Corp.‡
5.000%, 12/01/27
3 mo. USD LIBOR + 2.58% | | | 333,102 | |
| | 250,000 | | | | | CIT Group, Inc.
4.125%, 03/09/21 | | | 249,606 | |
| | 250,000 | | | | | Citigroup, Inc.‡
3.520%, 10/27/28
3 mo. USD LIBOR + 1.15% | | | 231,829 | |
| | 140,000 | | | | | Dell International, LLC / EMC Corp.*
6.020%, 06/15/26 | | | 145,241 | |
| | 350,000 | | | | | Discover Bank
3.450%, 07/27/26 | | | 322,507 | |
| | 250,000 | | | | | EPR Properties
4.950%, 04/15/28 | | | 242,389 | |
| | 250,000 | | | | | Franklin Resources, Inc.
2.850%, 03/30/25 | | | 234,061 | |
| | 400,000 | | | | | Goldman Sachs Group, Inc.‡
3.814%, 04/23/29
3 mo. USD LIBOR + 1.16% | | | 376,352 | |
| | 250,000 | | | | | ILFC E-Capital Trust II*‡
5.030%, 12/21/65
3 mo. USD LIBOR + 1.80% | | | 222,623 | |
| | 150,000 | | | | | Iron Mountain, Inc.*
5.250%, 03/15/28 | | | 135,220 | |
| | 300,000 | | | | | JPMorgan Chase & Company^‡
3.220%, 03/01/25
3 mo. USD LIBOR + 1.16% | | | 288,871 | |
| | 350,000 | | | | | Macquarie Group, Ltd.*‡
4.150%, 03/27/24
3 mo. USD LIBOR + 1.33% | | | 347,424 | |
| | 250,000 | | | | | Markel Corp.^
3.500%, 11/01/27 | | | 230,979 | |
| | 400,000 | | | | | MetLife, Inc.
6.400%, 12/15/36 | | | 415,998 | |
| | 250,000 | | | | | Morgan Stanley
2.500%, 04/21/21 | | | 243,619 | |
| | | | | | | | | | |
PRINCIPAL
AMOUNT | | | | | | | VALUE | |
| | 250,000 | | | | | Nuveen, LLC*
4.000%, 11/01/28 | | $ | 250,300 | |
| | 300,000 | | | | | Oil Insurance, Ltd.*‡
5.378%, 12/03/18
3 mo. USD LIBOR + 2.98% | | | 290,671 | |
| | 250,000 | | | | | PNC Bank NA
3.500%, 06/08/23 | | | 248,479 | |
| | 850,000 | | | | | Private Export Funding Corp.*
2.650%, 02/16/21 | | | 841,814 | |
| | 250,000 | | | | | RenaissanceRe Finance, Inc.
3.450%, 07/01/27 | | | 233,826 | |
| | 250,000 | | | | | Torchmark Corp.^
4.550%, 09/15/28 | | | 249,074 | |
| | 250,000 | | | | | Toronto-Dominion Bank
2.125%, 04/07/21 | | | 243,078 | |
| | 200,000 | | | | | Travelers Companies, Inc.^
4.050%, 03/07/48 | | | 186,956 | |
| | 250,000 | | | | | US Bancorp
3.600%, 09/11/24 | | | 246,470 | |
| | 350,000 | | | | | USAA Capital Corp.*
2.000%, 06/01/21 | | | 337,470 | |
| | 250,000 | | | | | Ventas Realty, LP^
4.000%, 03/01/28 | | | 239,441 | |
| | 250,000 | | | | | Wells Fargo & Company^
4.400%, 06/14/46 | | | 226,906 | |
| | | | | | | | | | |
| | | | | | | | | 9,901,754 | |
| | | | | | | | | | |
| | | | | | Health Care (3.9%) | |
| | 250,000 | | | | | AbbVie, Inc.
2.850%, 05/14/23 | | | 239,136 | |
| | 200,000 | | | | | Aetna, Inc.
2.750%, 11/15/22 | | | 192,072 | |
| | 150,000 | | | | | CVS Health Corp.^
4.780%, 03/25/38 | | | 144,531 | |
| | 150,000 | | | | | DaVita, Inc.^
5.125%, 07/15/24 | | | 143,477 | |
| | 150,000 | | | | | HCA, Inc.^
4.500%, 02/15/27 | | | 146,092 | |
| | 200,000 | | | | | Humana, Inc.
3.850%, 10/01/24 | | | 196,921 | |
| | 250,000 | | | | | Johnson & Johnson
3.400%, 01/15/38 | | | 225,076 | |
| | 100,000 | | | | | Magellan Health, Inc.
4.400%, 09/22/24 | | | 96,143 | |
| | 400,000 | | | | | Teva Pharmaceutical Finance IV, BV^
3.650%, 11/10/21 | | | 383,274 | |
| | 200,000 | | | | | Thermo Fisher Scientific, Inc.
3.150%, 01/15/23 | | | 195,127 | |
| | 250,000 | | | | | UnitedHealth Group, Inc.
2.875%, 03/15/22 | | | 245,455 | |
| | | | | | | | | | |
| | | | | | | | | 2,207,304 | |
| | | | | | | | | | |
| | | | |
| 132 | | CALAMOS OPEN-END FAMILY OF FUNDS ANNUAL REPORT | | See accompanying Notes to Schedule of Investments |
Total Return Bond Fund Schedule of Investments October 31, 2018
| | | | | | | | | | |
PRINCIPAL
AMOUNT | | | | | | | VALUE | |
| | | | | | | | | | |
| | | | | | Industrials (3.9%) | |
| | 205,000 | | | | | Aircastle, Ltd.^
5.000%, 04/01/23 | | $ | 208,068 | |
| | 400,000 | | | | | Delta Air Lines, Inc.
3.625%, 03/15/22 | | | 393,874 | |
| | 250,000 | | | | | General Dynamics Corp.
3.375%, 05/15/23 | | | 249,231 | |
| | 95,253 | | | | | Hawaiian Airlines Series 2013-1,
Class B Pass Through Certificates
4.950%, 01/15/22 | | | 95,291 | |
| | 200,000 | | | | | IHO Verwaltungs GmbH*
4.125%, 09/15/21
4.875% PIK rate | | | 194,311 | |
| | 200,000 | | | | | Rockwell Collins, Inc.
2.800%, 03/15/22 | | | 194,143 | |
| | 250,000 | | | | | Southwest Airlines Company
2.750%, 11/06/19 | | | 248,905 | |
| | 200,000 | | | | | United Airlines Series 2018-1,
Class B Pass Through Trust
4.600%, 03/01/26 | | | 200,981 | |
| | 175,000 | | | | | United Parcel Service, Inc.^
2.500%, 04/01/23 | | | 168,168 | |
| | 250,000 | | | | | Verisk Analytics, Inc.
4.125%, 09/12/22 | | | 252,435 | |
| | | | | | | | | | |
| | | | | | | | | 2,205,407 | |
| | | | | | | | | | |
| | | | | | Information Technology (3.8%) | |
| | 200,000 | | | | | Alliance Data Systems Corp.*
5.875%, 11/01/21 | | | 203,899 | |
| | 250,000 | | | | | Amphenol Corp.
4.000%, 02/01/22 | | | 252,631 | |
| | 500,000 | | | | | Apple, Inc.
4.375%, 05/13/45 | | | 499,655 | |
| | 250,000 | | | | | Fiserv, Inc.
3.500%, 10/01/22 | | | 247,866 | |
| | 250,000 | | | | | Hewlett Packard Enterprise Company^
4.900%, 10/15/25 | | | 254,321 | |
| | 250,000 | | | | | Microsoft Corp.
4.100%, 02/06/37 | | | 250,955 | |
| | 185,000 | | | | | Nuance Communications, Inc.^
6.000%, 07/01/24 | | | 188,006 | |
| | 250,000 | | | | | NXP, BV / NXP Funding, LLC*
4.125%, 06/01/21 | | | 249,295 | |
| | | | | | | | | | |
| | | | | | | | | 2,146,628 | |
| | | | | | | | | | |
| | | | | | Materials (1.4%) | |
| | 200,000 | | | | | Alcoa Nederland Holding, BV*
6.750%, 09/30/24 | | | 209,952 | |
| | 175,000 | | | | | ArcelorMittal, SA^
7.000%, 10/15/39 | | | 194,137 | |
| | 250,000 | | | | | Georgia-Pacific, LLC*^
3.600%, 03/01/25 | | | 245,925 | |
| | 140,000 | | | | | Kinross Gold Corp.
4.500%, 07/15/27 | | | 125,521 | |
| | | | | | | | | | |
| | | | | | | | | 775,535 | |
| | | | | | | | | | |
| | | | | | | | | | |
PRINCIPAL
AMOUNT | | | | | | | VALUE | |
| | | | | | | | | | |
| | | | | | Real Estate (4.1%) | |
| | 500,000 | | | | | American Tower Corp.
5.900%, 11/01/21 | | $ | 529,947 | |
| | 250,000 | | | | | Federal Realty Investment Trust^
3.250%, 07/15/27 | | | 232,783 | |
| | 250,000 | | | | | HCP, Inc.
4.200%, 03/01/24 | | | 248,275 | |
| | 300,000 | | | | | Hospitality Properties Trust
3.950%, 01/15/28 | | | 269,962 | |
| | 100,000 | | | | | MPT Operating Partnership, LP / MPT Finance Corp.
5.000%, 10/15/27 | | | 94,122 | |
| | 300,000 | | | | | SL Green Operating Partnership, LP
3.250%, 10/15/22 | | | 289,791 | |
| | 100,000 | | | | | Starwood Property Trust, Inc.^
4.750%, 03/15/25 | | | 96,163 | |
| | 400,000 | | | | | Tanger Properties, LP
3.875%, 07/15/27 | | | 372,044 | |
| | 200,000 | | | | | UDR, Inc.
4.625%, 01/10/22 | | | 204,219 | |
| | | | | | | | | | |
| | | | | | | | | 2,337,306 | |
| | | | | | | | | | |
| | | | | | Utilities (4.8%) | |
| | 250,000 | | | | | AES Corp.^
4.000%, 03/15/21 | | | 248,250 | |
| | 500,000 | | | | | Alabama Power Company
2.450%, 03/30/22 | | | 482,630 | |
| | 150,000 | | | | | Berkshire Hathaway Energy Company^
3.800%, 07/15/48 | | | 130,738 | |
| | 250,000 | | | | | CenterPoint Energy, Inc.
3.850%, 02/01/24 | | | 250,141 | |
| | | | | | Duke Energy Carolinas, LLC | | | | |
| | 200,000 | | | | | 3.050%, 03/15/23 | | | 196,828 | |
| | 150,000 | | | | | 3.700%, 12/01/47 | | | 132,278 | |
| | 250,000 | | | | | Exelon Corp.
2.450%, 04/15/21 | | | 243,220 | |
| | 100,000 | | | | | NGPL PipeCo, LLC*
4.875%, 08/15/27 | | | 96,793 | |
| | 150,000 | | | | | Northern States Power Co.
3.750%, 12/01/47 | | | 133,922 | |
| | 150,000 | | | | | PECO Energy Company
3.900%, 03/01/48 | | | 138,198 | |
| | 175,000 | | | | | PPL Capital Funding, Inc.^‡
5.051%, 03/30/67 3 mo. USD LIBOR + 2.67% | | | 170,612 | |
| | 150,000 | | | | | Public Service Electric & Gas Company
3.600%, 12/01/47 | | | 133,625 | |
| | 350,000 | | | | | Southern California Edison Company 3.400%, 06/01/23 | | | 345,751 | |
| | | | | | | | | | |
| | | | | | | | | 2,702,986 | |
| | | | | | | | | | |
| | | | | | Total Corporate Bonds
(Cost $32,309,181) | | | 31,416,147 | |
| | | | | | | | | | |
| | | | | | | | | | |
| | | | | | |
| See accompanying Notes to Schedule of Investments | | www.calamos.com | | | 133 | |
Total Return Bond Fund Schedule of Investments October 31, 2018
| | | | | | | | | | |
PRINCIPAL
AMOUNT | | | | | | | VALUE | |
| | BANK LOANS (4.4%) ‡ | |
| | | | | | Communication Services (0.6%) | |
| | 348,250 | | | | | CSC Holdings, LLC
4.780%, 01/25/26 1 mo. LIBOR + 2.50% | | $ | 348,522 | |
| | | | | | | | | | |
| | | | | | Financials (1.3%) | | | | |
| | 250,000 | | | | | Resideo Funding, Inc.
4.490%, 10/24/25 1 mo. LIBOR + 2.00% | | | 251,095 | |
| | 250,000 | | | | | Level 3 Financing, Inc.!
0.000%, 02/22/24 | | | 250,488 | |
| | 222,727 | | | | | GLP Financing, LLC
3.780%, 04/28/21 1 mo. LIBOR + 1.50% | | | 221,057 | |
| | | | | | | | | | |
| | | | | | | | | 722,640 | |
| | | | | | | | | | |
| | | | | | Health Care (1.0%) | |
| | 297,733 | | | | | Mallinckrodt International Finance, SA
5.136%, 09/24/24 1 mo. LIBOR + 2.75% | | | 294,267 | |
| | 274,249 | | | | | Amneal Pharmaceuticals, LLC
5.813%, 05/04/25 1 mo. LIBOR + 3.50% | | | 276,340 | |
| | | | | | | | | | |
| | | | | | | | | 570,607 | |
| | | | | | | | | | |
| | | | | | Industrials (1.0%) | |
| | 297,750 | | | | | TransDigm, Inc.
4.802%, 08/22/24 1 mo. LIBOR + 2.50% | | | 296,852 | |
| | 273,625 | | | | | Scientific Games International, Inc.
5.046%, 08/14/24 1 mo. LIBOR + 2.75% | | | 271,353 | |
| | | | | | | | | | |
| | | | | | | | | 568,205 | |
| | | | | | | | | | |
| | | | | | Information Technology (0.5%) | |
| | 275,000 | | | | | First Data Corp.
4.287%, 04/26/24 1 mo. LIBOR + 2.00% | | | 273,826 | |
| | | | | | | | | | |
| | | | | | TOTAL BANK LOANS
(Cost $2,495,829) | | | 2,483,800 | |
| | | | | | | | | | |
| | U.S. GOVERNMENT AND AGENCY SECURITIES (26.1%) | |
| | 564,027 | | | | | Federal Home Loan Mortgage Corp.
3.500%, 11/01/47 | | | 549,495 | |
| | | | | | Federal National Mortgage Association | | | | |
| | 1,071,278 | | | | | 3.000%, 07/01/46 | | | 1,014,877 | |
| | 916,185 | | | | | 3.500%, 08/01/47 | | | 892,399 | |
| | 674,090 | | | | | 4.000%, 04/01/48 | | | 674,435 | |
| | 561,232 | | | | | 4.500%, 04/01/48 | | | 575,207 | |
| | 489,927 | | | | | 4.000%, 03/01/47 | | | 490,684 | |
| | 458,850 | | | | | 3.000%, 02/01/33 | | | 450,507 | |
| | 836,061 | | | | | Freddie Mac Multifamily Structured Class A1 Pass Through Certificates
2.892%, 06/25/27 | | | 812,259 | |
| | 460,000 | | | | | Freddie Mac Multifamily Structured Class A2 Pass Through Certificates
3.350%, 01/25/28 | | | 445,412 | |
| | | | | | | | | | |
PRINCIPAL
AMOUNT | | | | | | | VALUE | |
| | | | | | Government National Mortgage Association II Pool | | | | |
| | 841,464 | | | | | 3.500%, 10/20/47 | | $ | 827,218 | |
| | 561,457 | | | | | 3.000%, 10/20/47 | | | 537,062 | |
| | | | | | United States Treasury Bond | | | | |
| | 1,850,000 | | | | | 2.750%, 08/15/47^ | | | 1,632,311 | |
| | 1,250,000 | | | | | 3.500%, 02/15/39 | | | 1,286,692 | |
| | 750,000 | | | | | 2.875%, 11/15/46^ | | | 680,188 | |
| | 600,000 | | | | | 3.000%, 05/15/47 | | | 557,339 | |
| | 250,000 | | | | | 3.125%, 05/15/48 | | | 237,688 | |
| | | | | | United States Treasury Inflation Indexed Note | | | | |
| | 1,277,750 | | | | | 0.500%, 01/15/28 | | | 1,208,157 | |
| | 531,620 | | | | | 0.375%, 07/15/25 | | | 509,434 | |
| | | | | | United States Treasury Note | | | | |
| | 600,000 | | | | | 2.875%, 07/31/25 | | | 593,153 | |
| | 500,000 | | | | | 2.125%, 03/31/24 | | | 478,117 | |
| | 250,000 | | | | | 2.875%, 05/31/25 | | | 247,293 | |
| | | | | | | | | | |
| | | | | | TOTAL U.S. GOVERNMENT AND AGENCY SECURITIES
(Cost $15,483,564) | | | 14,699,927 | |
| | | | | | | | | | |
| | | | | | | | | | |
| | ASSET BACKED SECURITIES (12.3%) | |
| | 680,000 | | | | | Ally Master Owner Trust Series 2018-1, Class A2
2.700%, 01/17/23 | | | 670,667 | |
| | 500,000 | | | | | American Express Credit Account Master Trust Series 2017-6, Class A
2.040%, 05/15/23 | | | 489,348 | |
| | 500,000 | | | | | BMW Floorplan Master Owner Trust Series 2018-1, Class A1*
3.150%, 05/15/23 | | | 497,684 | |
| | 250,000 | | | | | Credit Acceptance Auto Loan Trust Series 2018-3A, Class A*
3.550%, 08/15/27 | | | 249,615 | |
| | 534,000 | | | | | Dell Equipment Finance Trust Series 2017-2, Class A3*
2.190%, 10/24/22 | | | 528,671 | |
| | 235,000 | | | | | Dell Equipment Finance Trust Series 2017-2, Class B*
2.470%, 10/24/22 | | | 231,467 | |
| | 200,000 | | | | | Enterprise Fleet Financing, LLC Series 2018-1, Class A2*
2.870%, 10/20/23 | | | 199,148 | |
| | 500,000 | | | | | Ford Credit Floorplan Master Owner Trust Series 2018-1, Class A1
2.950%, 05/15/23 | | | 495,586 | |
| | 500,000 | | | | | Golden Credit Card Trust Series 2018-1A, Class A*
2.620%, 01/15/23 | | | 492,350 | |
| | 350,000 | | | | | Hertz Fleet Lease Funding, LP Series 2018-1, Class A2*
3.230%, 05/10/32 | | | 349,395 | |
| | | | |
| 134 | | CALAMOS OPEN-END FAMILY OF FUNDS ANNUAL REPORT | | See accompanying Notes to Schedule of Investments |
Total Return Bond Fund Schedule of Investments October 31, 2018
| | | | | | | | | | |
PRINCIPAL
AMOUNT | | | | | | | VALUE | |
| | 500,000 | | | | | Hyundai Auto Lease Securitization Trust Series 2018-B, Class A3*
3.040%, 10/15/21 | | $ | 498,701 | |
| | 300,000 | | | | | OSCAR US Funding Trust IX, LLC Series 2018-2A, Class A3*
3.390%, 09/12/22 | | | 298,590 | |
| | 400,000 | | | | | SoFi Professional Loan Program LLC Series 2016-C, Class A2B*
2.360%, 12/27/32 | | | 389,847 | |
| | 500,000 | | | | | SoFi Professional Loan Program LLC Series 2017-F, Class A2FX*
2.840%, 01/25/41 | | | 480,964 | |
| | 400,000 | | | | | Verizon Owner Trust Series 2018-1A, Class A1A*
2.820%, 09/20/22 | | | 397,000 | |
| | 200,000 | | | | | Verizon Owner Trust Series 2018-A, Class A1A
3.230%, 04/20/23 | | | 199,560 | |
| | 492,000 | | | | | World Financial Network Credit Card Master Trust Series 2017-A, Class A
2.120%, 03/15/24 | | | 483,359 | |
| | | | | | | | | | |
| | | | | | TOTAL ASSET BACKED SECURITIES
(Cost $7,031,953) | | | 6,951,952 | |
| | | | | | | | | | |
| | | | | | | | | | |
| | RESIDENTIAL MORTGAGE BACKED SECURITY (1.3%) | |
| | 741,865 | | | | | SBA Small Business Investment Companies Series 2017-10B, Class 1
2.518%, 09/10/27
(Cost $741,865) | | | 705,131 | |
| | | | | | | | | | |
NUMBER OF
SHARES | | | | | | | VALUE | |
| | | | | | | | | | |
| | SHORT TERM INVESTMENTS (0.4%) | |
| | 122,761 | | | | | Fidelity Prime Money Market Fund - Institutional Class, 2.240%*** | | | 122,798 | |
| | 122,770 | | | | | Morgan Stanley Institutional Liquidity Funds - Government Portfolio,
2.050%*** | | | 122,770 | |
| | | | | | | | | | |
| | | | | | TOTAL SHORT TERM INVESTMENTS
(Cost $245,568) | | | 245,568 | |
| | | | | | | | | | |
| | | | | | | | | | |
NUMBER OF
SHARES/
PRINCIPAL
AMOUNT | | | | | | | VALUE | |
| INVESTMENT OF CASH COLLATERAL FOR SECURITIES
LOANED (9.8%) |
|
| | 3,061,405 | | | | | Fidelity Prime Money Market Fund - Institutional Class, 2.240%***† | | $ | 3,061,405 | |
| | 2,472,422 | | | | | State Street Navigator Securities Lending Government Money Market Portfolio† | | | 2,472,422 | |
| | | | | | | | | | |
| | | | | | TOTAL INVESTMENT OF CASH COLLATERAL FOR SECURITIES LOANED
(Cost $5,533,827) | | | 5,533,827 | |
| | | | | | | | | | |
| TOTAL INVESTMENTS (110.0%)
(Cost $63,841,787) | | | 62,036,352 | |
| | | | | | | | | | |
| |
| | PAYABLE UPON RETURN OF SECURITIES ON LOAN (-9.8%) | | | (5,533,827 | ) |
| | | | | | | | | | |
| |
| | LIABILITIES, LESS OTHER ASSETS (-0.2%) | | | (93,139 | ) |
| | | | | | | | | | |
| |
| | NET ASSETS (100.0%) | | $ | 56,409,386 | |
| | | | | | | | | | |
NOTES TO SCHEDULE OF INVESTMENTS
| * | Securities issued and sold pursuant to a Rule 144A transaction are excepted from the registration requirement of the Securities Act of 1933, as amended. These securities may only be sold to qualified institutional buyers (“QIBs”), such as the Fund. Any resale of these securities must generally be effected through a sale that is registered under the Act or otherwise exempted from such registration requirements. |
| ^ | Security, or portion of security, is on loan. |
| ‡ | Variable rate security. The rate shown is the rate in effect at October 31, 2018. |
| ! | This position represents an unsettled loan commitment at period end. Certain details associated with this purchase are not known prior to the settlement date, including coupon rate, which will be adjusted on settlement date. |
| *** | The rate disclosed is the 7 day net yield as of October 31, 2018. |
| † | Represents investment of cash collateral received from securities on loan as of October 31, 2018. |
| | | | | | |
| See accompanying Notes to Financial Statements | | www.calamos.com | | | 135 | |
High Income Opportunities Fund Schedule of Investments October 31, 2018
| | | | | | | | | | |
PRINCIPAL
AMOUNT | | | | | | | VALUE | |
| | CORPORATE BONDS (83.7%) | |
| | | | | | Communication Services (10.5%) | |
| | 200,000 | | | | | Altice Financing, SA*^
7.500%, 05/15/26 | | $ | 189,353 | |
| | 300,000 | | | | | Altice France, SA*
7.375%, 05/01/26 | | | 288,001 | |
| | 200,000 | | | | | Cequel Communications Holdings I, LLC / Cequel Capital Corp.*^
7.500%, 04/01/28 | | | 207,472 | |
| | 145,000 | | | | | Cincinnati Bell, Inc.*
8.000%, 10/15/25 | | | 132,046 | |
| | 80,000 | | | | | Consolidated Communications, Inc.^
6.500%, 10/01/22 | | | 73,710 | |
| | 335,000 | | | | | CSC Holdings, LLC*^
5.500%, 04/15/27 | | | 322,677 | |
| | 682,000 | | | | | Embarq Corp.
7.995%, 06/01/36 | | | 651,433 | |
| | | | | | Frontier Communications Corp.^ | | | | |
| | 355,000 | | | | | 11.000%, 09/15/25 | | | 261,271 | |
| | 265,000 | | | | | 7.625%, 04/15/24 | | | 159,723 | |
| | 60,000 | | | | | 8.500%, 04/01/26* | | | 55,864 | |
| | | | | | Hughes Satellite Systems Corp. | | | | |
| | 170,000 | | | | | 6.625%, 08/01/26^ | | | 162,205 | |
| | 30,000 | | | | | 5.250%, 08/01/26 | | | 28,658 | |
| | 300,000 | | | | | Inmarsat Finance, PLC*^
4.875%, 05/15/22 | | | 294,487 | |
| | | | | | Intelsat Jackson Holdings, SA | | | | |
| | 195,000 | | | | | 9.750%, 07/15/25* | | | 204,383 | |
| | 140,000 | | | | | 8.000%, 02/15/24*^ | | | 146,593 | |
| | 118,000 | | | | | 7.500%, 04/01/21^ | | | 119,475 | |
| | 75,000 | | | | | 8.500%, 10/15/24* | | | 74,140 | |
| | 65,000 | | | | | MDC Partners, Inc.*^
6.500%, 05/01/24 | | | 53,446 | |
| | 155,000 | | | | | Qwest Corp.
6.875%, 09/15/33 | | | 150,255 | |
| | | | | | Sprint Corp. | | | | |
| | 595,000 | | | | | 7.875%, 09/15/23^ | | | 635,829 | |
| | 425,000 | | | | | 7.125%, 06/15/24 | | | 434,737 | |
| | 140,000 | | | | | T-Mobile USA, Inc.^
4.750%, 02/01/28 | | | 130,035 | |
| | 25,000 | | | | | Telecom Italia Capital, SA
6.000%, 09/30/34 | | | 22,583 | |
| | 231,000 | | | | | United States Cellular Corp. 6.700%, 12/15/33 | | | 236,586 | |
| | | | | | Windstream Services, LLC / Windstream Finance Corp. | | | | |
| | 135,000 | | | | | 8.625%, 10/31/25* | | | 126,306 | |
| | 42,000 | | | | | 7.750%, 10/01/21 | | | 26,602 | |
| | 24,000 | | | | | 10.500%, 06/30/24* | | | 19,592 | |
| | | | | | | | | | |
| | | | | | | | | 5,207,462 | |
| | | | | | | | | | |
| | | | | | Consumer Discretionary (11.5%) | |
| | 70,000 | | | | | American Greetings Corp.*
7.875%, 02/15/25 | | | 62,378 | |
| | | | | | | | | | |
PRINCIPAL
AMOUNT | | | | | | | VALUE | |
| | 195,000 | | | | | Beverages & More, Inc.*
11.500%, 06/15/22 | | $ | 153,218 | |
| | 140,000 | | | | | Boyd Gaming Corp. 6.000%, 08/15/26 | | | 136,086 | |
| | 155,000 | | | | | Caesars Resort Collection, LLC / CRC Finco, Inc.*
5.250%, 10/15/25 | | | 144,434 | |
| | | | | | CCO Holdings, LLC / CCO Holdings Capital Corp. | | | | |
| | 365,000 | | | | | 5.125%, 05/01/27* | | | 344,237 | |
| | 110,000 | | | | | 5.750%, 09/01/23^ | | | 111,049 | |
| | 80,000 | | | | | 5.000%, 02/01/28*^ | | | 74,794 | |
| | | | | | Century Communities, Inc. | | | | |
| | 259,000 | | | | | 6.875%, 05/15/22 | | | 259,449 | |
| | 85,000 | | | | | 5.875%, 07/15/25 | | | 77,032 | |
| | 263,000 | | | | | Dana, Inc.
5.500%, 12/15/24 | | | 253,532 | |
| | | | | | DISH DBS Corp.^ | | | | |
| | 200,000 | | | | | 5.875%, 11/15/24 | | | 170,254 | |
| | 150,000 | | | | | 7.750%, 07/01/26 | | | 133,261 | |
| | 270,000 | | | | | Eldorado Resorts, Inc.^
6.000%, 04/01/25 | | | 267,709 | |
| | 375,000 | | | | | ESH Hospitality, Inc.*
5.250%, 05/01/25 | | | 355,500 | |
| | 20,000 | | | | | GameStop Corp.*^
6.750%, 03/15/21 | | | 20,176 | |
| | 110,000 | | | | | goeasy, Ltd.*
7.875%, 11/01/22 | | | 114,125 | |
| | 135,000 | | | | | Guitar Center Escrow Issuer, Inc.*
9.500%, 10/15/21 | | | 132,391 | |
| | 200,000 | | | | | International Game Technology, PLC*^
6.250%, 01/15/27 | | | 197,694 | |
| | 380,000 | | | | | L Brands, Inc.^
6.875%, 11/01/35 | | | 323,129 | |
| | 170,000 | | | | | M/I Homes, Inc.
5.625%, 08/01/25 | | | 157,050 | |
| | 305,000 | | | | | Mattel, Inc.*^
6.750%, 12/31/25 | | | 292,045 | |
| | 200,000 | | | | | Mclaren Finance, PLC*
5.750%, 08/01/22 | | | 189,757 | |
| | 155,000 | | | | | Meritage Homes Corp.
6.000%, 06/01/25 | | | 151,254 | |
| | 285,000 | | | | | Penske Automotive Group, Inc.^
5.375%, 12/01/24 | | | 276,684 | |
| | | | | | PetSmart, Inc.*^ | | | | |
| | 175,000 | | | | | 5.875%, 06/01/25 | | | 137,577 | |
| | 35,000 | | | | | 8.875%, 06/01/25 | | | 24,523 | |
| | | | | | Rite Aid Corp. | | | | |
| | 325,000 | | | | | 7.700%, 02/15/27 | | | 227,705 | |
| | 85,000 | | | | | 6.125%, 04/01/23*^ | | | 72,409 | |
| | 320,000 | | | | | Salem Media Group, Inc.*
6.750%, 06/01/24 | | | 288,109 | |
| | 135,000 | | | | | Sally Holdings, LLC / Sally Capital, Inc.^
5.625%, 12/01/25 | | | 125,551 | |
| | | | |
| 136 | | CALAMOS OPEN-END FAMILY OF FUNDS ANNUAL REPORT | | See accompanying Notes to Schedule of Investments |
High Income Opportunities Fund Schedule of Investments October 31, 2018
| | | | | | | | | | |
PRINCIPAL
AMOUNT | | | | | | | VALUE | |
| | 150,000 | | | | | Sotheby’s*
4.875%, 12/15/25 | | $ | 139,094 | |
| | 140,000 | | | | | Taylor Morrison Communities Corp.
6.625%, 05/15/22 | | | 141,805 | |
| | 50,832 | | | | | US Airways Series 2012-2, Class B Pass Through Trust
6.750%, 06/03/21 | | | 53,306 | |
| | 120,000 | | | | | VOC Escrow, Ltd.*^
5.000%, 02/15/28 | | | 112,907 | |
| | | | | | | | | | |
| | | | | | | | | 5,720,224 | |
| | | | | | | | | | |
| | | | | | Consumer Staples (4.2%) | |
| | 150,000 | | | | | Albertsons Companies, LLC / Safeway, Inc. / New Albertson’s, Inc. / Albertson’s, LLC
5.750%, 03/15/25 | | | 133,345 | |
| | 160,000 | | | | | Fresh Market, Inc.*
9.750%, 05/01/23 | | | 117,400 | |
| | | | | | JBS USA LUX, SA / JBS USA Finance, Inc.* | | | | |
| | 765,000 | | | | | 7.250%, 06/01/21 | | | 775,507 | |
| | 205,000 | | | | | 6.750%, 02/15/28 | | | 200,134 | |
| | | | | | New Albertson’s, Inc. | | | | |
| | 145,000 | | | | | 7.450%, 08/01/29 | | | 122,280 | |
| | 90,000 | | | | | 7.750%, 06/15/26 | | | 79,325 | |
| | 70,000 | | | | | 8.000%, 05/01/31 | | | 60,310 | |
| | | | | | Pilgrim’s Pride Corp.* | | | | |
| | 220,000 | | | | | 5.875%, 09/30/27 | | | 200,342 | |
| | 60,000 | | | | | 5.750%, 03/15/25^ | | | 56,073 | |
| | | | | | Post Holdings, Inc.* | | | | |
| | 170,000 | | | | | 5.750%, 03/01/27 | | | 162,581 | |
| | 30,000 | | | | | 5.625%, 01/15/28 | | | 28,263 | |
| | | | | | Simmons Foods, Inc.*^ | | | | |
| | 84,000 | | | | | 7.750%, 01/15/24 | | | 85,226 | |
| | 65,000 | | | | | 5.750%, 11/01/24 | | | 47,653 | |
| | | | | | | | | | |
| | | | | | | | | 2,068,439 | |
| | | | | | | | | | |
| | | | | | Energy (13.6%) | | | | |
| | 45,000 | | | | | Berry Petroleum Company, LLC*
7.000%, 02/15/26 | | | 44,811 | |
| | 82,000 | | | | | Bruin E&P Partners, LLC*
8.875%, 08/01/23 | | | 80,928 | |
| | 145,000 | | | | | Buckeye Partners, LP‡
6.375%, 01/22/78 3 mo. USD LIBOR + 4.02% | | | 133,012 | |
| | 275,000 | | | | | Calfrac Holdings, LP*
8.500%, 06/15/26 | | | 247,908 | |
| | 205,000 | | | | | California Resources Corp.*^
8.000%, 12/15/22 | | | 182,893 | |
| | 375,000 | | | | | Carrizo Oil & Gas, Inc.^
6.250%, 04/15/23 | | | 369,127 | |
| | 145,000 | | | | | Chaparral Energy, Inc.*
8.750%, 07/15/23 | | | 139,853 | |
| | 110,000 | | | | | Cheniere Energy Partners, LP*
5.625%, 10/01/26 | | | 108,384 | |
| | | | | | Chesapeake Energy Corp. | | | | |
| | 150,000 | | | | | 8.000%, 01/15/25^ | | | 152,144 | |
| | | | | | | | | | |
PRINCIPAL
AMOUNT | | | | | | | VALUE | |
| | 120,000 | | | | | 7.000%, 10/01/24 | | $ | 117,667 | |
| | 85,000 | | | | | Comstock Escrow Corp.*
9.750%, 08/15/26 | | | 82,171 | |
| | 365,000 | | | | | DCP Midstream Operating, LP*‡
5.850%, 05/21/43 3 mo. USD LIBOR + 3.85% | | | 326,784 | |
| | 75,000 | | | | | DCP Midstream, LP‡
7.375%, 12/15/22 3 mo. USD LIBOR + 5.15% | | | 71,948 | |
| | | | | | Denbury Resources, Inc. | | | | |
| | 120,000 | | | | | 5.500%, 05/01/22^ | | | 104,308 | |
| | 80,000 | | | | | 9.250%, 03/31/22*^ | | | 83,510 | |
| | 55,000 | | | | | 7.500%, 02/15/24* | | | 53,994 | |
| | 75,000 | | | | | Diamond Offshore Drilling, Inc.^
7.875%, 08/15/25 | | | 74,113 | |
| | 555,000 | | | | | Energy Transfer, LP‡
5.559%, 11/01/66 3 mo. USD LIBOR + 3.02% | | | 478,676 | |
| | | | | | Enterprise Products Operating, LLC‡ | | | | |
| | 225,000 | | | | | 4.875%, 08/16/77^ 3 mo. USD LIBOR + 2.99% | | | 210,128 | |
| | 55,000 | | | | | 5.375%, 02/15/78 3 mo. USD LIBOR + 2.57% | | | 49,271 | |
| | | | | | EP Energy, LLC / Everest Acquisition Finance, Inc.* | | | | |
| | 105,000 | | | | | 7.750%, 05/15/26^ | | | 104,768 | |
| | 100,000 | | | | | 9.375%, 05/01/24 | | | 76,143 | |
| | | | | | Genesis Energy, LP / Genesis Energy Finance Corp. | | | | |
| | 150,000 | | | | | 6.500%, 10/01/25 | | | 139,369 | |
| | 150,000 | | | | | 6.250%, 05/15/26 | | | 136,325 | |
| | | | | | Gulfport Energy Corp.^ | | | | |
| | 130,000 | | | | | 6.375%, 05/15/25 | | | 123,297 | |
| | 100,000 | | | | | 6.000%, 10/15/24 | | | 94,104 | |
| | 110,000 | | | | | Halcon Resources Corp.
6.750%, 02/15/25 | | | 100,356 | |
| | 183,000 | | | | | Lonestar Resources America, Inc.*
11.250%, 01/01/23 | | | 198,540 | |
| | 135,000 | | | | | Magnolia Oil & Gas Operating, LLC / Magnolia Oil & Gas Finance Corp.*
6.000%, 08/01/26 | | | 133,553 | |
| | 110,000 | | | | | McDermott Technologies Americas, Inc. / McDermott Technology U.S., Inc.*
10.625%, 05/01/24 | | | 99,078 | |
| | 50,000 | | | | | Moss Creek Resources Holdings, Inc.*
7.500%, 01/15/26 | | | 48,198 | |
| | 15,000 | | | | | Nabors Industries, Inc.^
5.750%, 02/01/25 | | | 13,845 | |
| | 80,000 | | | | | Nine Energy Service, Inc.*
8.750%, 11/01/23 | | | 81,293 | |
| | 15,000 | | | | | Northern Oil and Gas, Inc.*
9.500%, 05/15/23 9.500% PIK rate | | | 15,492 | |
| | 95,000 | | | | | Oasis Petroleum, Inc.*^
6.250%, 05/01/26 | | | 93,387 | |
| | | | | | |
| See accompanying Notes to Schedule of Investments | | www.calamos.com | | | 137 | |
High Income Opportunities Fund Schedule of Investments October 31, 2018
| | | | | | | | | | |
PRINCIPAL
AMOUNT | | | | | | | VALUE | |
| | 150,000 | | | | | Par Petroleum, LLC / Par Petroleum Finance Corp.*
7.750%, 12/15/25 | | $ | 148,642 | |
| | 150,000 | | | | | PDC Energy, Inc.
5.750%, 05/15/26 | | | 137,882 | |
| | 125,000 | | | | | Petroleum Geo-Services, ASA*
7.375%, 12/15/20 | | | 125,252 | |
| | 150,000 | | | | | Plains All American Pipeline, LP‡
6.125%, 11/15/22 3 mo. USD LIBOR + 4.11% | | | 140,601 | |
| | 55,000 | | | | | QEP Resources, Inc.^
5.625%, 03/01/26 | | | 51,856 | |
| | 205,000 | | | | | SESI, LLC^
7.750%, 09/15/24 | | | 201,635 | |
| | 60,000 | | | | | SM Energy Company^
6.750%, 09/15/26 | | | 60,176 | |
| | 135,000 | | | | | Southwestern Energy Company
7.500%, 04/01/26 | | | 137,481 | |
| | 100,000 | | | | | Sunoco, LP / Sunoco Finance Corp.*^
5.500%, 02/15/26 | | | 95,788 | |
| | 30,000 | | | | | Targa Resources Partners, LP / Targa Resources Partners Finance Corp.*
5.875%, 04/15/26 | | | 30,247 | |
| | 30,000 | | | | | TransMontaigne Partners, LP / TLP Finance Corp.
6.125%, 02/15/26 | | | 28,212 | |
| | 27,000 | | | | | Transocean Pontus, Ltd.*
6.125%, 08/01/25 | | | 26,877 | |
| | 145,000 | | | | | Transocean, Inc.*^
7.500%, 01/15/26 | | | 142,586 | |
| | 150,000 | | | | | Vine Oil & Gas, LP / Vine Oil & Gas Finance Corp.*^
8.750%, 04/15/23 | | | 139,439 | |
| | 215,000 | | | | | W&T Offshore, Inc.*
9.750%, 11/01/23 | | | 208,349 | |
| | 285,000 | | | | | Weatherford International, Ltd.^
8.250%, 06/15/23 | | | 218,395 | |
| | 150,000 | | | | | Whiting Petroleum Corp.^
6.625%, 01/15/26 | | | 150,050 | |
| | 145,000 | | | | | WildHorse Resource Development Corp.
6.875%, 02/01/25 | | | 144,471 | |
| | | | | | | | | | |
| | | | | | | | | 6,757,317 | |
| | | | | | | | | | |
| | | | | | Financials (12.4%) | | | | |
| | 295,000 | | | | | Acrisure, LLC / Acrisure Finance, Inc.*
7.000%, 11/15/25 | | | 264,385 | |
| | 510,000 | | | | | Ally Financial, Inc.
8.000%, 11/01/31 | | | 613,930 | |
| | 145,000 | | | | | Amwins Group, Inc.*
7.750%, 07/01/26 | | | 149,170 | |
| | 275,000 | | | | | Ardonagh Midco 3, PLC*
8.625%, 07/15/23 | | | 256,708 | |
| | 315,000 | | | | | AssuredPartners, Inc.*
7.000%, 08/15/25 | | | 310,214 | |
| | | | | | | | | | |
PRINCIPAL
AMOUNT | | | | | | | VALUE | |
| | 150,000 | | | | | Bank of America Corp.‡
5.875%, 03/15/28 3 mo. USD LIBOR + 2.93% | | $ | 145,782 | |
| | 145,000 | | | | | Bank of Nova Scotia‡ 4.650%, 10/12/22 3 mo. USD LIBOR + 2.65% | | | 134,573 | |
| | 285,000 | | | | | Charles Schwab Corp.‡
5.000%, 12/01/27 3 mo. USD LIBOR + 2.58% | | | 271,240 | |
| | 120,000 | | | | | Dell International, LLC / EMC Corp.*
6.020%, 06/15/26 | | | 124,492 | |
| | 150,000 | | | | | Discover Financial Services‡
5.500%, 10/30/27 3 mo. USD LIBOR + 3.08% | | | 142,013 | |
| | 65,000 | | | | | Greystar Real Estate Partners, LLC*
5.750%, 12/01/25 | | | 63,643 | |
| | 135,000 | | | | | HUB International, Ltd.*^
7.000%, 05/01/26 | | | 132,039 | |
| | 160,000 | | | | | ILFC E-Capital Trust II*‡
5.030%, 12/21/65 3 mo. USD LIBOR + 1.80% | | | 142,478 | |
| | 305,000 | | | | | Iron Mountain, Inc.*
5.250%, 03/15/28 | | | 274,947 | |
| | 625,000 | | | | | Jefferies Finance, LLC*
7.250%, 08/15/24 | | | 611,259 | |
| | 140,000 | | | | | Ladder Capital Finance Holdings LLLP / Ladder Capital Finance Corp.*
5.250%, 10/01/25 | | | 130,032 | |
| | 150,000 | | | | | Level 3 Financing, Inc.^
5.375%, 05/01/25 | | | 147,045 | |
| | 175,000 | | | | | LPL Holdings, Inc.*
5.750%, 09/15/25 | | | 170,010 | |
| | | | | | MetLife, Inc. | | | | |
| | 260,000 | | | | | 6.400%, 12/15/36 | | | 270,399 | |
| | 15,000 | | | | | 5.875%, 03/15/28‡ 3 mo. USD LIBOR + 2.96% | | | 14,992 | |
| | 285,000 | | | | | Nationstar Mortgage, LLC / Nationstar Capital Corp.
6.500%, 07/01/21 | | | 285,023 | |
| | | | | | Navient Corp.^ | | | | |
| | 225,000 | | | | | 6.750%, 06/25/25 | | | 220,244 | |
| | 89,000 | | | | | 6.500%, 06/15/22 | | | 90,867 | |
| | 400,000 | | | | | Oil Insurance, Ltd.*‡
5.378%, 12/03/18 3 mo. USD LIBOR + 2.98% | | | 387,562 | |
| | 270,000 | | | | | Quicken Loans, Inc.*
5.750%, 05/01/25 | | | 260,682 | |
| | | | | | Springleaf Finance Corp. | | | | |
| | 185,000 | | | | | 6.875%, 03/15/25 | | | 177,341 | |
| | 140,000 | | | | | 7.125%, 03/15/26 | | | 132,826 | |
| | 310,000 | | | | | Tronox Finance, PLC*^
5.750%, 10/01/25 | | | 272,197 | |
| | | | | | | | | | |
| | | | | | | | | 6,196,093 | |
| | | | | | | | | | |
| | | | |
| 138 | | CALAMOS OPEN-END FAMILY OF FUNDS ANNUAL REPORT | | See accompanying Notes to Schedule of Investments |
High Income Opportunities Fund Schedule of Investments October 31, 2018
| | | | | | | | | | |
PRINCIPAL
AMOUNT | | | | | | | VALUE | |
| | | | | | | | | | |
| | | | | | Health Care (10.2%) | | | | |
| | 180,000 | | | | | Acadia Healthcare Company, Inc.
6.500%, 03/01/24 | | $ | 183,640 | |
| | | | | | Bausch Health Cos., Inc.* | | | | |
| | 300,000 | | | | | 9.000%, 12/15/25 | | | 313,414 | |
| | 275,000 | | | | | 8.500%, 01/31/27 | | | 281,484 | |
| | 135,000 | | | | | 9.250%, 04/01/26 | | | 141,944 | |
| | 125,000 | | | | | 7.500%, 07/15/21^ | | | 126,988 | |
| | | | | | Community Health Systems, Inc. | | | | |
| | 388,000 | | | | | 8.125%, 06/30/24*^ | | | 305,503 | |
| | 40,000 | | | | | 6.875%, 02/01/22 | | | 20,302 | |
| | 500,000 | | | | | DaVita, Inc.^
5.125%, 07/15/24 | | | 478,255 | |
| | 525,000 | | | | | Endo DAC / Endo Finance, LLC / Endo Finco, Inc.*^
6.000%, 07/15/23 | | | 453,477 | |
| | | | | | HCA, Inc. | | | | |
| | 785,000 | | | | | 5.375%, 02/01/25 | | | 791,190 | |
| | 130,000 | | | | | 7.500%, 11/06/33 | | | 141,142 | |
| | 200,000 | | | | | Horizon Pharma, Inc. / Horizon Pharma USA, Inc.*^
8.750%, 11/01/24 | | | 210,578 | |
| | 150,000 | | | | | Magellan Health, Inc.
4.400%, 09/22/24 | | | 144,214 | |
| | 175,000 | | | | | Mallinckrodt International Finance, SA / Mallinckrodt CB, LLC*^
5.625%, 10/15/23 | | | 150,760 | |
| | 60,000 | | | | | Team Health Holdings, Inc.*^
6.375%, 02/01/25 | | | 51,725 | |
| | | | | | Tenet Healthcare Corp. | | | | |
| | 435,000 | | | | | 6.750%, 06/15/23^ | | | 434,239 | |
| | 300,000 | | | | | 4.625%, 07/15/24 | | | 289,341 | |
| | 190,000 | | | | | Teva Pharmaceutical Finance Company, BV
2.950%, 12/18/22 | | | 172,758 | |
| | | | | | Teva Pharmaceutical Finance Netherlands III, BV | | | | |
| | 200,000 | | | | | 6.000%, 04/15/24 | | | 199,239 | |
| | 95,000 | | | | | 2.800%, 07/21/23 | | | 83,942 | |
| | 125,000 | | | | | West Street Merger Sub, Inc.*^
6.375%, 09/01/25 | | | 117,788 | |
| | | | | | | | | | |
| | | | | | | | | 5,091,923 | |
| | | | | | | | | | |
| | | | | | Industrials (10.5%) | | | | |
| | 200,000 | | | | | ACCO Brands Corp.*
5.250%, 12/15/24 | | | 187,766 | |
| | 175,000 | | | | | Allison Transmission, Inc.*
4.750%, 10/01/27 | | | 160,872 | |
| | 85,000 | | | | | Apergy Corp.*
6.375%, 05/01/26 | | | 86,352 | |
| | 209,138 | | | | | ARD Securities Finance Sarl*^
8.750%, 01/31/23 8.750% PIK rate | | | 201,493 | |
| | 150,000 | | | | | Beacon Roofing Supply, Inc.*^
4.875%, 11/01/25 | | | 134,821 | |
| | 220,000 | | | | | Bombardier, Inc.*^
7.500%, 03/15/25 | | | 220,608 | |
| | | | | | | | | | |
PRINCIPAL
AMOUNT | | | | | | | VALUE | |
| | | | | | Covanta Holding Corp. | | | | |
| | 160,000 | | | | | 5.875%, 03/01/24 | | $ | 160,338 | |
| | 45,000 | | | | | 5.875%, 07/01/25^ | | | 43,991 | |
| | 155,000 | | | | | Delphi Technologies, PLC*
5.000%, 10/01/25 | | | 139,960 | |
| | 85,000 | | | | | Energizer Gamma Acquisition, Inc.*^
6.375%, 07/15/26 | | | 85,113 | |
| | 200,000 | | | | | Fly Leasing, Ltd.
5.250%, 10/15/24 | | | 191,496 | |
| | 30,000 | | | | | FXI Holdings, Inc.*^
7.875%, 11/01/24 | | | 28,119 | |
| | 257,000 | | | | | Garda World Security Corp.*
7.250%, 11/15/21 | | | 255,112 | |
| | 265,000 | | | | | Golden Nugget, Inc.*
6.750%, 10/15/24 | | | 264,821 | |
| | 130,000 | | | | | Gray Television, Inc.*^
5.875%, 07/15/26 | | | 125,127 | |
| | 155,000 | | | | | Great Lakes Dredge & Dock Corp.
8.000%, 05/15/22 | | | 159,426 | |
| | 255,000 | | | | | H&E Equipment Services, Inc.^
5.625%, 09/01/25 | | | 243,046 | |
| | | | | | Hertz Corp.^ | | | | |
| | 140,000 | | | | | 7.375%, 01/15/21 | | | 137,527 | |
| | 40,000 | | | | | 7.625%, 06/01/22* | | | 38,356 | |
| | | | | | Icahn Enterprises, LP | | | | |
| | 182,000 | | | | | 6.750%, 02/01/24 | | | 183,294 | |
| | 160,000 | | | | | 6.375%, 12/15/25 | | | 159,160 | |
| | 200,000 | | | | | James Hardie International Finance, Ltd.*^
4.750%, 01/15/25 | | | 186,366 | |
| | 150,000 | | | | | Jeld-Wen, Inc.*
4.625%, 12/15/25 | | | 134,859 | |
| | 80,000 | | | | | JPW Industries Holding Corp.*
9.000%, 10/01/24 | | | 81,556 | |
| | 205,000 | | | | | Meritor, Inc.^
6.250%, 02/15/24 | | | 202,034 | |
| | 145,000 | | | | | Multi-Color Corp.*^
4.875%, 11/01/25 | | | 134,332 | |
| | 210,000 | | | | | Navistar International Corp.*^
6.625%, 11/01/25 | | | 214,495 | |
| | | | | | Park Aerospace Holdings, Ltd.* | | | | |
| | 90,000 | | | | | 4.500%, 03/15/23 | | | 85,944 | |
| | 65,000 | | | | | 5.500%, 02/15/24^ | | | 64,487 | |
| | 315,000 | | | | | Park-Ohio Industries, Inc.^
6.625%, 04/15/27 | | | 316,840 | |
| | 140,000 | | | | | Scientific Games International, Inc.*^
5.000%, 10/15/25 | | | 130,396 | |
| | 105,000 | | | | | Tennant Company
5.625%, 05/01/25 | | | 104,548 | |
| | 25,000 | | | | | Titan Acquisition, Ltd. / Titan Co-Borrower, LLC*
7.750%, 04/15/26 | | | 20,845 | |
| | | | | | United Rentals North America, Inc. | | | | |
| | 125,000 | | | | | 5.875%, 09/15/26 | | | 122,469 | |
| | 105,000 | | | | | 4.875%, 01/15/28 | | | 94,786 | |
| | | | | | |
| See accompanying Notes to Schedule of Investments | | www.calamos.com | | | 139 | |
High Income Opportunities Fund Schedule of Investments October 31, 2018
| | | | | | | | | | |
PRINCIPAL
AMOUNT | | | | | | | VALUE | |
| | 55,000 | | | | | 6.500%, 12/15/26^ | | $ | 55,598 | |
| | 75,000 | | | | | Waste Pro USA, Inc.*
5.500%, 02/15/26 | | | 71,826 | |
| | | | | | | | | | |
| | | | | | | | | 5,228,179 | |
| | | | | | | | | | |
| | | | | | Information Technology (2.7%) | |
| | 210,000 | | | | | Alliance Data Systems Corp.*
5.875%, 11/01/21 | | | 214,094 | |
| | | | | | Cardtronics, Inc. | | | | |
| | 67,000 | | | | | 5.125%, 08/01/22 | | | 65,422 | |
| | 55,000 | | | | | 5.500%, 05/01/25* | | | 51,488 | |
| | 205,000 | | | | | CBS Radio, Inc.*^
7.250%, 11/01/24 | | | 193,982 | |
| | 280,000 | | | | | Clear Channel Worldwide Holdings, Inc.^
7.625%, 03/15/20 | | | 280,254 | |
| | 130,000 | | | | | CommScope Technologies, LLC*
6.000%, 06/15/25 | | | 126,602 | |
| | 145,000 | | | | | Harland Clarke Holdings Corp.*
8.375%, 08/15/22 | | | 131,172 | |
| | 130,000 | | | | | Nuance Communications, Inc.^
5.625%, 12/15/26 | | | 126,601 | |
| | 155,000 | | | | | VFH Parent, LLC*
6.750%, 06/15/22 | | | 158,342 | |
| | | | | | | | | | |
| | | | | | | | | 1,347,957 | |
| | | | | | | | | | |
| | | | | | Materials (5.8%) | | | | |
| | 308,000 | | | | | AK Steel Corp.^
6.375%, 10/15/25 | | | 274,975 | |
| | 200,000 | | | | | Alcoa Nederland Holding, BV*
7.000%, 09/30/26 | | | 210,720 | |
| | 565,000 | | | | | ArcelorMittal, SA
7.000%, 10/15/39 | | | 626,785 | |
| | 335,000 | | | | | Ardagh Packaging Finance, PLC / Ardagh Holdings USA, Inc.*^
6.000%, 02/15/25 | | | 314,064 | |
| | 55,000 | | | | | Baffinland Iron Mines Corp. / Baffinland Iron Mines, LP*
8.750%, 07/15/26 | | | 55,542 | |
| | 200,000 | | | | | First Quantum Minerals, Ltd.*
7.250%, 04/01/23 | | | 184,731 | |
| | 200,000 | | | | | INEOS Group Holdings, SA*^
5.625%, 08/01/24 | | | 191,552 | |
| | 85,000 | | | | | JW Aluminum Continuous Cast Company*^
10.250%, 06/01/26 | | | 85,077 | |
| | 110,000 | | | | | Kinross Gold Corp.
4.500%, 07/15/27 | | | 98,623 | |
| | 140,000 | | | | | New Gold, Inc.*^
6.375%, 05/15/25 | | | 112,296 | |
| | 400,000 | | | | | PBF Holding Company, LLC / PBF Finance Corp.
7.250%, 06/15/25 | | | 413,540 | |
| | | | | | United States Steel Corp. | | | | |
| | 290,000 | | | | | 6.875%, 08/15/25^ | | | 284,774 | |
| | 55,000 | | | | | 6.250%, 03/15/26 | | | 51,896 | |
| | | | | | | | | | |
| | | | | | | | | 2,904,575 | |
| | | | | | | | | | |
| | | | | | | | | | |
PRINCIPAL
AMOUNT | | | | | | | VALUE | |
| | | | | | | | | | |
| | | | | | Real Estate (0.9%) | | | | |
| | 310,000 | | | | | MPT Operating Partnership, LP / MPT Finance Corp.
5.000%, 10/15/27 | | $ | 291,778 | |
| | 150,000 | | | | | Starwood Property Trust, Inc.^
4.750%, 03/15/25 | | | 144,245 | |
| | | | | | | | | | |
| | | | | | | | | 436,023 | |
| | | | | | | | | | |
| | | | | | Utilities (1.4%) | | | | |
| | 85,000 | | | | | NGPL PipeCo, LLC*
4.875%, 08/15/27 | | | 82,274 | |
| | 150,000 | | | | | NRG Energy, Inc.^
6.625%, 01/15/27 | | | 155,433 | |
| | 265,000 | | | | | PPL Capital Funding, Inc.^‡
5.051%, 03/30/67 3 mo. USD LIBOR + 2.67% | | | 258,355 | |
| | 90,000 | | | | | Talen Energy Supply, LLC*
10.500%, 01/15/26 | | | 79,356 | |
| | 150,000 | | | | | TerraForm Power Operating, LLC*^
5.000%, 01/31/28 | | | 134,605 | |
| | | | | | | | | | |
| | | | | | | | | 710,023 | |
| | | | | | | | | | |
| | | | | | TOTAL CORPORATE BONDS
(Cost $43,759,051) | | | 41,668,215 | |
| | | | | | | | | | |
| | CONVERTIBLE BONDS (0.7%) | |
| | | | | | Consumer Discretionary (0.7%) | |
| | | | | | Liberty Interactive, LLC | | | | |
| | 255,000 | | | | | 3.750%, 02/15/30 | | | 174,590 | |
| | 253,963 | | | | | 4.000%, 11/15/29 | | | 175,010 | |
| | | | | | | | | | |
| | | | | | TOTAL CONVERTIBLE BONDS
(Cost $362,356) | | | 349,600 | |
| | | | | | | | | | |
| | BANK LOANS (10.0%)‡ | |
| | | | | | Communication Services (2.2%) | | | | |
| | 275,000 | | | | | Cincinnati Bell, Inc.
5.552%, 10/02/24 1 mo. LIBOR + 3.25% | | | 275,393 | |
| | 248,750 | | | | | CSC Holdings, LLC
4.780%, 01/25/26 1 mo. LIBOR + 2.50% | | | 248,944 | |
| | 206,296 | | | | | Cumulus Media, Inc.
6.810%, 05/15/22 1 mo. LIBOR + 4.50% | | | 204,105 | |
| | 150,000 | | | | | Intelsat Jackson Holdings, SA
6.625%, 01/02/24 | | | 154,339 | |
| | 193,157 | | | | | New Media Holdings II, LLC
8.552%, 07/14/22 1 mo. LIBOR + 6.25% | | | 194,606 | |
| | | | | | | | | | |
| | | | | | | | | 1,077,387 | |
| | | | | | | | | | |
| | | | | | Consumer Discretionary (1.2%) | |
| | 69,825 | | | | | American Greetings Corp.
6.804%, 04/06/24 1 mo. LIBOR + 4.50% | | | 70,043 | |
| | 250,000 | | | | | R.R. Donnelley & Sons Company
7.280%, 01/15/24 1 mo. LIBOR + 5.00% | | | 248,437 | |
| | | | |
| 140 | | CALAMOS OPEN-END FAMILY OF FUNDS ANNUAL REPORT | | See accompanying Notes to Schedule of Investments |
High Income Opportunities Fund Schedule of Investments October 31, 2018
| | | | | | | | | | |
PRINCIPAL
AMOUNT | | | | | | | VALUE | |
| | 288,750 | | | | | Weight Watchers International, Inc.
7.150%, 11/29/24 1 mo. LIBOR + 4.75% | | $ | 290,871 | |
| | | | | | | | | | |
| | | | | | | | | 609,351 | |
| | | | | | | | | | |
| | | | | | Energy (0.2%) | | | | |
| | 119,400 | | | | | McDermott Tech Americas, Inc.
7.302%, 05/12/25 1 mo. LIBOR + 5.00% | | | 118,176 | |
| | | | | | | | | | |
| | | | | | Financials (1.3%) | | | | |
| | 54,725 | | | | | AssuredPartners, Inc.
5.552%, 10/22/24 1 mo. LIBOR + 3.25% | | | 54,663 | |
| | 273,625 | | | | | Genworth Financial, Inc.
6.831%, 03/07/23 1 mo. LIBOR + 4.50% | | | 279,783 | |
| | 89,091 | | | | | GLP Financing, LLC
3.780%, 04/28/21 1 mo. LIBOR + 1.50% | | | 88,423 | |
| | 199,500 | | | | | HUB International, Ltd.
5.490%, 04/25/25 1 mo. LIBOR + 3.00% | | | 199,188 | |
| | | | | | | | | | |
| | | | | | | | | 622,057 | |
| | | | | | | | | | |
| | | | | | Health Care (3.2%) | | | | |
| | 274,249 | | | | | Amneal Pharmaceuticals, LLC
5.813%, 05/04/25 1 mo. LIBOR + 3.50% | | | 276,340 | |
| | 268,125 | | | | | Bausch Health Cos., Inc.
5.274%, 06/02/25 1 mo. LIBOR + 3.00% | | | 268,597 | |
| | 150,000 | | | | | Gentiva Health Services, Inc.
9.313%, 07/02/26 1 mo. LIBOR + 7.00% | | | 153,656 | |
| | 68,416 | | | | | Gentiva Health Services, Inc.
6.063%, 07/02/25 1 mo. LIBOR + 3.75% | | | 68,801 | |
| | 272,922 | | | | | Mallinckrodt International Finance, SA
5.136%, 09/24/24 1 mo. LIBOR + 2.75% | | | 269,745 | |
| | 272,250 | | | | | Ortho Clinical Diagnostics, SA
5.544%, 06/30/25 1 mo. LIBOR + 3.25% | | | 271,706 | |
| | 272,922 | | | | | Team Health Holdings, Inc.
5.052%, 02/06/24 1 mo. LIBOR + 2.75% | | | 258,935 | |
| | | | | | | | | | |
| | | | | | | | | 1,567,780 | |
| | | | | | | | | | |
| | | | | | Industrials (1.1%) | | | | |
| | 273,625 | | | | | Scientific Games International, Inc.
5.046%, 08/14/24 1 mo. LIBOR + 2.75% | | | 271,353 | |
| | 297,750 | | | | | TransDigm, Inc.
4.802%, 08/22/24 1 mo. LIBOR + 2.50% | | | 296,852 | |
| | | | | | | | | | |
| | | | | | | | | 568,205 | |
| | | | | | | | | | |
| | | | | | Information Technology (0.5%) | | | | |
| | 250,000 | | | | | BMC Software Finance, Inc.!
0.000%, 10/02/25 | | | 251,172 | |
| | | | | | | | | | |
| | | | | | Real Estate (0.3%) | | | | |
| | 144,637 | | | | | iStar, Inc.
5.028%, 06/28/23 1 mo. LIBOR + 2.75% | | | 144,909 | |
| | | | | | | | | | |
| | | | | | TOTAL BANK LOANS
(Cost $4,941,731) | | | 4,959,037 | |
| | | | | | | | | | |
| | | | | | | | | | |
NUMBER OF
SHARES | | | | | | | VALUE | |
| | CONVERTIBLE PREFERRED STOCKS (1.5%) | |
| | | | | | Energy (1.5%) | | | | |
| | | | | | NuStar Energy, LP‡ | | | | |
| | 25,350 | | | | | 7.625%, 06/15/22 3 mo. USD LIBOR + 5.64% | | $ | 531,336 | |
| | 8,552 | | | | | 8.500%, 12/15/21 3 mo. USD LIBOR + 6.77% | | | 197,380 | |
| | | | | | | | | | |
| | | | | | TOTAL CONVERTIBLE PREFERRED STOCKS
(Cost $862,664) | | | 728,716 | |
| | | | | | | | | | |
| | COMMON STOCKS (1.9%) | |
| | | | | | Communication Services (0.1%) | |
| | 1,527 | | | | | Cumulus Media, Inc. - Class A# | | | 22,233 | |
| | | | | | | | | | |
| | | | | | Energy (1.8%) | | | | |
| | 215 | | | | | Chevron Corp. | | | 24,005 | |
| | 4,645 | | | | | Enterprise Products Partners, LP | | | 124,579 | |
| | 1,525 | | | | | GasLog, Ltd. | | | 31,202 | |
| | 2,915 | | | | | Gulfmark Offshore, Inc.# | | | 98,206 | |
| | 1,421 | | | | | Gulfmark Offshore, Inc.^# | | | 47,873 | |
| | 2,955 | | | | | Magellan Midstream Partners, LP | | | 182,264 | |
| | 3,413 | | | | | Ocean Rig UDW, Inc. - Class A# | | | 103,380 | |
| | 790 | | | | | Schlumberger, Ltd. | | | 40,535 | |
| | 3,465 | | | | | Spectra Energy Partners, LP | | | 119,543 | |
| | 2,200 | | | | | Targa Resources Corp.^ | | | 113,674 | |
| | 965 | | | | | Williams Companies, Inc. | | | 23,479 | |
| | | | | | | | | | |
| | | | | | | | | 908,740 | |
| | | | | | | | | | |
| | | | | | TOTAL COMMON STOCKS
(Cost $1,100,842) | | | 930,973 | |
| | | | | | | | | | |
| | SHORT TERM INVESTMENTS (0.9%) | |
| | 225,883 | | | | | Fidelity Prime Money Market Fund - Institutional Class, 2.240%*** | | | 225,951 | |
| | 225,900 | | | | | Morgan Stanley Institutional Liquidity Funds - Government Portfolio, 2.050%*** | | | 225,900 | |
| | | | | | | | | | |
| | | | | | TOTAL SHORT TERM INVESTMENTS
(Cost $451,851) | | | 451,851 | |
| | | | | | | | | | |
| | | | | | |
| See accompanying Notes to Schedule of Investments | | www.calamos.com | | | 141 | |
High Income Opportunities Fund Schedule of Investments October 31, 2018
| | | | | | | | | | |
NUMBER OF
SHARES/
PRINCIPAL
AMOUNT | | | | | | | VALUE | |
| INVESTMENT OF CASH COLLATERAL FOR SECURITIES
LOANED (25.3%) |
|
| | 5,920,293 | | | | | Fidelity Prime Money Market Fund - Institutional Class, 2.240%***† | | $ | 5,920,293 | |
| | 6,662,931 | | | | | State Street Navigator Securities Lending Government Money Market Portfolio† | | | 6,662,931 | |
| | | | | | | | | | |
| | | | | | TOTAL INVESTMENT OF
CASH COLLATERAL FOR
SECURITIES LOANED
(Cost $12,583,224) | | | 12,583,224 | |
| | | | | | | | | | |
| TOTAL INVESTMENTS (124.0%)
(Cost $64,061,719) | | | 61,671,616 | |
| | | | | | | | | | |
| |
| | PAYABLE UPON RETURN OF SECURITIES ON LOAN (-25.3%) | | | (12,583,224 | ) |
| | | | | | | | | | |
| |
| | OTHER ASSETS, LESS LIABILITIES (1.3%) | | | 671,744 | |
| | | | | | | | | | |
| |
| | NET ASSETS (100.0%) | | $ | 49,760,136 | |
| | | | | | | | | | |
NOTES TO SCHEDULE OF INVESTMENTS
| * | Securities issued and sold pursuant to a Rule 144A transaction are excepted from the registration requirement of the Securities Act of 1933, as amended. These securities may only be sold to qualified institutional buyers (“QIBs”), such as the Fund. Any resale of these securities must generally be effected through a sale that is registered under the Act or otherwise exempted from such registration requirements. |
| ^ | Security, or portion of security, is on loan. |
| ‡ | Variable rate security. The rate shown is the rate in effect at October 31, 2018. |
| ! | This position represents an unsettled loan commitment at period end. Certain details associated with this purchase are not known prior to the settlement date, including coupon rate, which will be adjusted on settlement date. |
| # | Non-income producing security. |
| *** | The rate disclosed is the 7 day net yield as of October 31, 2018. |
| † | Represents investment of cash collateral received from securities on loan as of October 31, 2018. |
| | | | |
| 142 | | CALAMOS OPEN-END FAMILY OF FUNDS ANNUAL REPORT | | See accompanying Notes to Financial Statements |
Short-Term Bond Fund Schedule of Investments October 31, 2018
| | | | | | | | | | |
PRINCIPAL
AMOUNT | | | | | | | VALUE | |
| | CORPORATE BONDS (79.0%) | |
| | | | | | Communication Services (5.6%) | |
| | 225,000 | | | | | AT&T, Inc.
2.450%, 06/30/20 | | $ | 221,532 | |
| | 200,000 | | | | | Charter Communications Operating, LLC / Charter Communications Operating Capital
4.464%, 07/23/22 | | | 202,576 | |
| | 225,000 | | | | | Comcast Corp.
3.300%, 10/01/20 | | | 224,950 | |
| | 100,000 | | | | | Electronic Arts, Inc.
3.700%, 03/01/21 | | | 100,575 | |
| | 100,000 | | | | | Hughes Satellite Systems Corp.
6.500%, 06/15/19 | | | 101,477 | |
| | | | | | | | | | |
| | | | | | | | | 851,110 | |
| | | | | | | | | | |
| | | | | | Consumer Discretionary (5.0%) | |
| | 75,000 | | | | | Allergan Funding SCS^
2.450%, 06/15/19 | | | 74,789 | |
| | 100,000 | | | | | American Honda Finance Corp.
2.000%, 02/14/20 | | | 98,622 | |
| | 100,000 | | | | | D.R. Horton, Inc.
4.000%, 02/15/20 | | | 100,372 | |
| | 47,009 | | | | | Delta Air Lines Series 2010-2, Class A Pass Through Trust
4.950%, 05/23/19 | | | 47,206 | |
| | 100,000 | | | | | General Motors Financial Company, Inc.
3.150%, 01/15/20 | | | 99,559 | |
| | 75,000 | | | | | Lennar Corp.
4.500%, 11/15/19 | | | 75,463 | |
| | 75,000 | | | | | Toll Brothers Finance Corp.
6.750%, 11/01/19 | | | 77,002 | |
| | 100,000 | | | | | Toyota Motor Credit Corp.
2.950%, 04/13/21 | | | 99,248 | |
| | 72,511 | | | | | US Airways Series 2012-2, Class B Pass Through Trust
6.750%, 06/03/21 | | | 76,040 | |
| | | | | | | | | | |
| | | | | | | | | 748,301 | |
| | | | | | | | | | |
| | | | | | Consumer Staples (2.9%) | |
| | 100,000 | | | | | Anheuser-Busch InBev Finance, Inc.^
2.650%, 02/01/21 | | | 98,081 | |
| | 100,000 | | | | | Conagra Brands, Inc.‡
2.908%, 10/09/20
3 mo. USD LIBOR + .50% | | | 99,801 | |
| | 100,000 | | | | | Constellation Brands, Inc.
2.000%, 11/07/19 | | | 98,728 | |
| | 150,000 | | | | | Unilever Capital Corp.
3.000%, 03/07/22 | | | 148,294 | |
| | | | | | | | | | |
| | | | | | | | | 444,904 | |
| | | | | | | | | | |
| | | | | | Energy (5.9%) | |
| | 225,000 | | | | | Chevron Corp.
2.100%, 05/16/21 | | | 218,524 | |
| | | | | | | | | | |
PRINCIPAL
AMOUNT | | | | | | | VALUE | |
| | | | | | Enterprise Products Operating, LLC
| | | | |
| | 125,000 | | | | | 2.850%, 04/15/21 | | $ | 123,046 | |
| | 100,000 | | | | | 2.550%, 10/15/19 | | | 99,434 | |
| | 225,000 | | | | | Magellan Midstream Partners, LP
4.250%, 02/01/21 | | | 228,040 | |
| | 225,000 | | | | | TransCanada PipeLines, Ltd.
3.800%, 10/01/20 | | | 226,617 | |
| | | | | | | | | | |
| | | | | | | | | 895,661 | |
| | | | | | | | | | |
| | | | | | Financials (25.6%) | |
| | 100,000 | | | | | American Express Credit Corp.
2.375%, 05/26/20 | | | 98,633 | |
| | 29,000 | | | | | AON Corp.
5.000%, 09/30/20 | | | 29,831 | |
| | 100,000 | | | | | AXIS Specialty Finance, LLC
5.875%, 06/01/20 | | | 103,356 | |
| | 100,000 | | | | | Bank of America Corp.‡
2.369%, 07/21/21
3 mo. USD LIBOR + .66% | | | 98,126 | |
| | 100,000 | | | | | Bank of Montreal
2.100%, 06/15/20 | | | 98,287 | |
| | 100,000 | | | | | Bank of Nova Scotia
2.500%, 01/08/21 | | | 98,209 | |
| | 100,000 | | | | | BB&T Corp.
3.200%, 09/03/21 | | | 99,420 | |
| | 100,000 | | | | | BP Capital Markets, PLC
2.315%, 02/13/20 | | | 98,980 | |
| | 100,000 | | | | | Capital One Financial Corp.
3.450%, 04/30/21 | | | 99,600 | |
| | 100,000 | | | | | Caterpillar Financial Services Corp.^
2.100%, 01/10/20 | | | 98,858 | |
| | 100,000 | | | | | Charles Schwab Corp.
3.250%, 05/21/21 | | | 99,676 | |
| | 100,000 | | | | | Chubb INA Holdings, Inc.
2.300%, 11/03/20 | | | 98,092 | |
| | 100,000 | | | | | Citigroup, Inc.
2.400%, 02/18/20 | | | 98,924 | |
| | 225,000 | | | | | ERP Operating, LP
4.625%, 12/15/21 | | | 231,914 | |
| | 225,000 | | | | | Goldman Sachs Group, Inc.
2.625%, 04/25/21 | | | 220,074 | |
| | 100,000 | | | | | Hartford Financial Services Group, Inc.
6.000%, 01/15/19 | | | 100,619 | |
| | 100,000 | | | | | International Lease Finance Corp.
4.625%, 04/15/21 | | | 101,957 | |
| | 100,000 | | | | | John Deere Capital Corp.
2.050%, 03/10/20 | | | 98,524 | |
| | 100,000 | | | | | JPMorgan Chase & Company
2.250%, 01/23/20 | | | 98,839 | |
| | 100,000 | | | | | KeyCorp
2.900%, 09/15/20 | | | 99,119 | |
| | 100,000 | | | | | Markel Corp.
5.350%, 06/01/21 | | | 104,020 | |
| | | | | | |
| See accompanying Notes to Schedule of Investments | | www.calamos.com | | | 143 | |
Short-Term Bond Fund Schedule of Investments October 31, 2018
| | | | | | | | | | |
PRINCIPAL
AMOUNT | | | | | | | VALUE | |
| | 100,000 | | | | | Marsh & McLennan Companies, Inc.
2.350%, 03/06/20 | | $ | 98,631 | |
| | 100,000 | | | | | MetLife, Inc.
4.750%, 02/08/21 | | | 102,757 | |
| | 100,000 | | | | | Morgan Stanley
2.650%, 01/27/20 | | | 99,379 | |
| | 100,000 | | | | | Prudential Financial, Inc.
2.350%, 08/15/19 | | | 99,473 | |
| | 100,000 | | | | | Royal Bank of Canada
2.500%, 01/19/21 | | | 98,231 | |
| | 125,000 | | | | | Shell International Finance, BV
1.875%, 05/10/21 | | | 120,887 | |
| | 100,000 | | | | | SunTrust Banks, Inc.
2.900%, 03/03/21 | | | 98,519 | |
| | | | | | Toronto-Dominion Bank | | | | |
| | 150,000 | | | | | 3.150%, 09/17/20 | | | 149,904 | |
| | 100,000 | | | | | 2.550%, 01/25/21 | | | 98,382 | |
| | 100,000 | | | | | Travelers Companies, Inc.
3.900%, 11/01/20 | | | 101,243 | |
| | 100,000 | | | | | US Bancorp
2.350%, 01/29/21 | | | 97,906 | |
| | 150,000 | | | | | USAA Capital Corp.*
2.000%, 06/01/21 | | | 144,630 | |
| | 100,000 | | | | | Ventas Realty, LP / Ventas Capital Corp.
2.700%, 04/01/20 | | | 98,962 | |
| | 100,000 | | | | | Weingarten Realty Investors
3.375%, 10/15/22 | | | 98,027 | |
| | 100,000 | | | | | Wells Fargo & Company
2.500%, 03/04/21 | | | 97,608 | |
| | | | | | | | | | |
| | | | | | | | | 3,879,597 | |
| | | | | | | | | | |
| | | | | | Health Care (10.2%) | |
| | | | | | AbbVie, Inc. | | | | |
| | 125,000 | | | | | 3.375%, 11/14/21 | | | 124,384 | |
| | 100,000 | | | | | 2.500%, 05/14/20 | | | 98,741 | |
| | 100,000 | | | | | Amgen, Inc.
2.125%, 05/01/20 | | | 98,383 | |
| | 100,000 | | | | | Anthem, Inc.
2.250%, 08/15/19 | | | 99,388 | |
| | 100,000 | | | | | CVS Health Corp.
3.125%, 03/09/20 | | | 99,755 | |
| | 100,000 | | | | | Gilead Sciences, Inc.
2.350%, 02/01/20 | | | 99,056 | |
| | 100,000 | | | | | GlaxoSmithKline Capital, PLC‡
2.669%, 05/14/21
3 mo. USD LIBOR + .35% | | | 100,218 | |
| | 225,000 | | | | | HCA, Inc.
6.500%, 02/15/20 | | | 232,404 | |
| | 100,000 | | | | | Medtronic, Inc.
2.500%, 03/15/20 | | | 99,113 | |
| | 200,000 | | | | | Teva Pharmaceutical Finance Netherlands III, BV
2.200%, 07/21/21 | | | 187,019 | |
| | | | | | | | | | |
PRINCIPAL
AMOUNT | | | | | | | VALUE | |
| | | | | | UnitedHealth Group, Inc. | | | | |
| | 100,000 | | | | | 2.594%, 06/15/21‡
3 mo. USD LIBOR + .26% | | $ | 100,019 | |
| | 100,000 | | | | | 2.300%, 12/15/19 | | | 99,168 | |
| | 100,000 | | | | | Zoetis, Inc.^
3.250%, 08/20/21 | | | 99,488 | |
| | | | | | | | | | |
| | | | | | | | | 1,537,136 | |
| | | | | | | | | | |
| | | | | | Industrials (6.9%) | |
| | 200,000 | | | | | 3M Company^
3.000%, 09/14/21 | | | 199,434 | |
| | | | | | Air Lease Corp. | | | | |
| | 200,000 | | | | | 3.500%, 01/15/22 | | | 197,666 | |
| | 100,000 | | | | | 2.125%, 01/15/20 | | | 98,352 | |
| | 75,000 | | | | | Aircastle, Ltd.
6.250%, 12/01/19 | | | 77,040 | |
| | 100,000 | | | | | GATX Corp.‡
3.061%, 11/05/21
3 mo. USD LIBOR + .72% | | | 100,002 | |
| | 100,000 | | | | | General Dynamics Corp.‡
2.718%, 05/11/21
3 mo. USD LIBOR + .38% | | | 100,438 | |
| | 76,202 | | | | | Hawaiian Airlines Series 2013-1, Class B Pass Through Certificates
4.950%, 01/15/22 | | | 76,233 | |
| | 100,000 | | | | | United Technologies Corp.
3.350%, 08/16/21 | | | 99,626 | |
| | 100,000 | | | | | Vulcan Materials Company‡
2.971%, 03/01/21
3 mo. USD LIBOR + .65% | | | 100,074 | |
| | | | | | | | | | |
| | | | | | | | | 1,048,865 | |
| | | | | | | | | | |
| | | | | | Information Technology (2.1%) | |
| | 225,000 | | | | | Hewlett Packard Enterprise Company
3.500%, 10/05/21 | | | 224,439 | |
| | 100,000 | | | | | QUALCOMM, Inc.
2.250%, 05/20/20 | | | 98,626 | |
| | | | | | | | | | |
| | | | | | | | | 323,065 | |
| | | | | | | | | | |
| | | | | | Materials (1.2%) | |
| | 75,000 | | | | | ArcelorMittal, SA
5.125%, 06/01/20 | | | 76,734 | |
| | 100,000 | | | | | EI du Pont de Nemours & Company
2.200%, 05/01/20 | | | 98,889 | |
| | | | | | | | | | |
| | | | | | | | | 175,623 | |
| | | | | | | | | | |
| | | | | | Real Estate (6.2%) | |
| | 100,000 | | | | | AvalonBay Communities, Inc.
3.625%, 10/01/20 | | | 100,458 | |
| | 225,000 | | | | | Boston Properties, LP
5.625%, 11/15/20 | | | 233,545 | |
| | 100,000 | | | | | Federal Realty Investment Trust
2.550%, 01/15/21 | | | 98,037 | |
| | 100,000 | | | | | Kimco Realty Corp.
3.200%, 05/01/21 | | | 98,943 | |
| | | | |
| 144 | | CALAMOS OPEN-END FAMILY OF FUNDS ANNUAL REPORT | | See accompanying Notes to Schedule of Investments |
Short-Term Bond Fund Schedule of Investments October 31, 2018
| | | | | | | | | | |
PRINCIPAL
AMOUNT | | | | | | | VALUE | |
| | 100,000 | | | | | Public Storage
2.370%, 09/15/22 | | $ | 95,991 | |
| | 100,000 | | | | | Realty Income Corp.
5.750%, 01/15/21 | | | 104,314 | |
| | 100,000 | | | | | Simon Property Group, LP
2.500%, 09/01/20 | | | 98,636 | |
| | 100,000 | | | | | UDR, Inc.
4.625%, 01/10/22 | | | 102,109 | |
| | | | | | | | | | |
| | | | | | | | | 932,033 | |
| | | | | | | | | | |
| | | | | | Utilities (7.4%) | |
| | 225,000 | | | | | CenterPoint Energy, Inc.
3.600%, 11/01/21 | | | 225,143 | |
| | 100,000 | | | | | Consolidated Edison Company of New York, Inc.‡
2.773%, 06/25/21
3 mo. USD LIBOR + .40% | | | 100,391 | |
| | 100,000 | | | | | Consolidated Edison, Inc.
2.000%, 03/15/20 | | | 98,372 | |
| | 100,000 | | | | | Dominion Energy, Inc.**
2.962%, 07/01/19 | | | 99,943 | |
| | 100,000 | | | | | Exelon Generation Company, LLC
2.950%, 01/15/20 | | | 99,389 | |
| | 100,000 | | | | | Georgia Power Company
4.250%, 12/01/19 | | | 101,116 | |
| | 100,000 | | | | | Nevada Power Company
2.750%, 04/15/20 | | | 99,553 | |
| | 100,000 | | | | | PPL Capital Funding, Inc.‡
5.051%, 03/30/67
3 mo. USD LIBOR + 2.67% | | | 97,493 | |
| | 100,000 | | | | | Sempra Energy‡
2.784%, 03/15/21
3 mo. USD LIBOR + .45% | | | 100,029 | |
| | 100,000 | | | | | WEC Energy Group, Inc.
3.375%, 06/15/21 | | | 99,818 | |
| | | | | | | | | | |
| | | | | | | | | 1,121,247 | |
| | | | | | | | | | |
| | | | | | TOTAL CORPORATE BONDS
(Cost $11,983,994) | | | 11,957,542 | |
| | | | | | | | | | |
| | | | | | | | | | |
| | BANK LOANS (3.3%)‡ | |
| | | | | | Financials (3.3%) | |
| | 250,000 | | | | | Level 3 Financing, Inc.!
0.000%, 02/22/24 | | | 250,489 | |
| | 250,000 | | | | | Resideo Funding, Inc.
4.490%, 10/04/25
1 mo. LIBOR + 2.00% | | | 251,095 | |
| | | | | | | | | | |
| | | | | | TOTAL BANK LOANS
(Cost $501,563) | | | 501,584 | |
| | | | | | | | | | |
| | | | | | | | | | |
| | ASSET BACKED SECURITIES (12.0%) | |
| | 150,000 | | | | | BA Credit Card Trust Series 2017-A1, Class A1
1.950%, 08/15/22 | | | 147,760 | |
| | | | | | | | | | |
PRINCIPAL
AMOUNT | | | | | | | VALUE | |
| | 150,000 | | | | | Capital One Multi-Asset Execution Trust Series 2016-A6, Class A6
1.820%, 09/15/22 | | $ | 148,248 | |
| | 150,000 | | | | | CarMax Auto Owner Trust Series 2018-3, Class A2A
2.880%, 10/15/21 | | | 149,690 | |
| | 200,000 | | | | | Dell Equipment Finance Trust Series 2018-2, Class A2*
3.160%, 02/22/21 | | | 199,760 | |
| | 200,000 | | | | | Discover Card Execution Note Trust Series 2012-A6, Class A6
1.670%, 01/18/22 | | | 198,372 | |
| | 50,000 | | | | | Ford Credit Auto Lease Trust Series 2017-A, Class A4
2.020%, 06/15/20 | | | 49,738 | |
| | 155,000 | | | | | Ford Credit Floorplan Master Owner Trust Series 2016-1, Class A1
1.760%, 02/15/21 | | | 154,571 | |
| | 150,000 | | | | | GE Capital Credit Card Master Note Trust Series 2012-7, Class A
1.760%, 09/15/22 | | | 148,410 | |
| | 150,000 | | | | | GM Financial Consumer Automobile Receivables Series 2018-3, Class A3
3.020%, 05/16/23 | | | 149,344 | |
| | 150,000 | | | | | Hertz Vehicle Financing II, LP Series 2015-1A, Class A*
2.730%, 03/25/21 | | | 148,468 | |
| | 155,000 | | | | | Verizon Owner Trust Series 2017-1A, Class A*
2.060%, 09/20/21 | | | 153,621 | |
| | 30,000 | | | | | World Financial Network Credit Card Master Trust Series 2015-B, Class A
2.550%, 06/17/24 | | | 29,576 | |
| | 140,000 | | | | | World Financial Network Credit Card Master Trust Series 2017-A, Class A
2.120%, 03/15/24 | | | 137,541 | |
| | | | | | | | | | |
| | | | | | TOTAL ASSET BACKED SECURITIES
(Cost $1,817,627) | | | 1,815,099 | |
| | | | | | | | | | |
| | | | | | | | | | |
| | RESIDENTIAL MORTGAGE BACKED SECURITIES (2.2%) | |
| | 145,344 | | | | | Federal National Mortgage Association
2.761%, 04/01/21 | | | 143,924 | |
| | 24,639 | | | | | Morgan Stanley Bank of America Merrill Lynch Trust, Series 2016-C29, Class A1
1.597%, 05/15/49 | | | 24,199 | |
| | 25,686 | | | | | Morgan Stanley Capital I Trust, Series 2015-UBS8, Class A1
1.966%, 12/15/48 | | | 25,564 | |
| | 144,759 | | | | | Morgan Stanley Capital I Trust, Series 2018-H3, Class A1
3.176%, 07/15/51 | | | 144,046 | |
| | | | | | | | | | |
| | | | | | TOTAL RESIDENTIAL MORTGAGE BACKED SECURITIES
(Cost $345,587) | | | 337,733 | |
| | | | | | | | | | |
| | | | | | | | | | |
| | | | | | |
| See accompanying Notes to Schedule of Investments | | www.calamos.com | | | 145 | |
Short-Term Bond Fund Schedule of Investments October 31, 2018
| | | | | | | | | | |
PRINCIPAL
AMOUNT | | | | | | | VALUE | |
| | MUNICIPAL OBLIGATIONS (1.3%) | |
| | | | | | Financials (0.6%) | |
| | 95,000 | | | | | Massachusetts Housing Finance Agency
2.313%, 12/01/19 | | $ | 94,365 | |
| | | | | | | | | | |
| | | | | | Industrials (0.7%) | |
| | 100,000 | | | | | Metropolitan Transportation Authority
5.269%, 11/15/20 | | | 103,790 | |
| | | | | | | | | | |
| | | | | | TOTAL MUNICIPAL OBLIGATIONS
(Cost $198,386) | | | 198,155 | |
| | | | | | | | | | |
| | | | | | | | | | |
NUMBER OF
SHARES | | | | | | | VALUE | |
| | SHORT TERM INVESTMENTS (3.5%) | |
| | 263,403 | | | | | Fidelity Prime Money Market Fund - Institutional Class, 2.240%*** | | | 263,482 | |
| | 263,437 | | | | | Morgan Stanley Institutional Liquidity Funds - Government Portfolio, 2.050%*** | | | 263,437 | |
| | | | | | | | | | |
| | | | | | TOTAL SHORT TERM INVESTMENTS
(Cost $526,919) | | | 526,919 | |
| | | | | | | | | | |
NUMBER OF
SHARES/
PRINCIPAL
AMOUNT | | | | | | | VALUE | |
| INVESTMENT OF CASH COLLATERAL FOR SECURITIES
LOANED (3.1%) |
|
| | 472,778 | | | | | State Street Navigator Securities Lending Government Money Market Portfolio†
(Cost $472,778) | | | 472,778 | |
| | | | | | | | | | |
| TOTAL INVESTMENTS (104.4%)
(Cost $15,846,854)
| | | 15,809,810 | |
| | | | | | | | | | |
| |
| | PAYABLE UPON RETURN OF SECURITIES ON LOAN (-3.1%) | | | (472,778 | ) |
| | | | | | | | | | |
| |
| | LIABILITIES, LESS OTHER ASSETS (-1.3%) | | | (194,057 | ) |
| | | | | | | | | | |
| |
| | NET ASSETS (100.0%) | | $ | 15,142,975 | |
| | | | | | | | | | |
NOTES TO SCHEDULE OF INVESTMENTS
| ^ | Security, or portion of security, is on loan. |
| ‡ | Variable rate security. The rate shown is the rate in effect at October 31, 2018. |
| * | Securities issued and sold pursuant to a Rule 144A transaction are excepted from the registration requirement of the Securities Act of 1933, as amended. These securities may only be sold to qualified institutional buyers (“QIBs”), such as the Fund. Any resale of these securities must generally be effected through a sale that is registered under the Act or otherwise exempted from such registration requirements. |
| ** | Step coupon security. Coupon changes periodically based upon a predetermined schedule. The rate shown is the rate in effect at October 31, 2018. |
| ! | This position represents an unsettled loan commitment at period end. Certain details associated with this purchase are not known prior to the settlement date, including coupon rate, which will be adjusted on settlement date. |
| *** | The rate disclosed is the 7 day net yield as of October 31, 2018. |
| † | Represents investment of cash collateral received from securities on loan as of October 31, 2018. |
| | | | |
| 146 | | CALAMOS OPEN-END FAMILY OF FUNDS ANNUAL REPORT | | See accompanying Notes to Financial Statements |
Statements of Assets and Liabilities October 31, 2018
| | | | | | | | | | | | | | | | | | | | |
| | | MARKET NEUTRAL
INCOME FUND | | | HEDGED EQUITY
INCOME FUND | | | PHINEUS
LONG/SHORT
FUND | | | CONVERTIBLE
FUND | | | GLOBAL
CONVERTIBLE
FUND | |
ASSETS | | | | | | | | | | | | | | | | | | | | |
Investments in securities, at cost | | $ | 6,720,047,938 | | | $ | 98,044,947 | | | $ | 1,318,407,963 | | | $ | 665,993,176 | | | $ | 142,510,029 | |
Investment in securities, at value | | $ | 7,114,528,190 | | | $ | 98,536,638 | | | $ | 1,253,713,064 | | | $ | 673,758,302 | | | $ | 138,423,144 | |
Cash with custodian (interest bearing) | | | 13,274,217 | | | | — | | | | 6,490,610 | | | | — | | | | 337,078 | |
Restricted cash for short positions (interest bearing) | | | 1,775,272,010 | | | | — | | | | 433,089,798 | | | | — | | | | — | |
Restricted foreign currency for short positions (cost $127,658,885) | | | 123,591,676 | | | | — | | | | — | | | | — | | | | — | |
Foreign currency (cost $10,241,099) | | | 10,241,099 | | | | — | | | | — | | | | — | | | | — | |
Unrealized appreciation on forward foreign currency contracts | | | 3,478,064 | | | | — | | | | — | | | | 84,931 | | | | — | |
Receivables: | | | | | | | | | | | | | | | | | | | | |
Accrued interest and dividends | | | 13,256,948 | | | | 96,127 | | | | 783,238 | | | | 1,902,158 | | | | 380,650 | |
Investments sold | | | 140,274,467 | | | | 718,745 | | | | 15,792,923 | | | | 17,332,871 | | | | 2,650,435 | |
Fund shares sold | | | 33,872,082 | | | | 1,971,223 | | | | 3,677,796 | | | | 1,376,099 | | | | 510,936 | |
Due from investment advisor | | | — | | | | 15,271 | | | | — | | | | — | | | | 1,514 | |
Prepaid expenses | | | 142,409 | | | | 6,294 | | | | 56,897 | | | | 29,536 | | | | 5,305 | |
Other assets | | | 173,858 | | | | 103,154 | | | | 177 | | | | 160,487 | | | | 214,864 | |
Total assets | | | 9,228,105,020 | | | | 101,447,452 | | | | 1,713,604,503 | | | | 694,644,384 | | | | 142,523,926 | |
LIABILITIES | | | | | | | | | | | | | | | | | | | | |
Due to custodian bank | | | — | | | | 98,420 | | | | — | | | | 277,826 | | | | 337,078 | |
Collateral for securities loaned | | | 402,415,616 | | | | 564,146 | | | | 91,376,350 | | | | 59,159,448 | | | | 5,328,708 | |
Foreign currency overdraft (cost $209,216) | | | — | | | | — | | | | — | | | | — | | | | 209,219 | |
Securities sold short, at value (proceeds $1,620,440,640, and $397,697,710) | | | 1,922,228,797 | | | | — | | | | 377,082,680 | | | | — | | | | — | |
Options written, at value (premium $211,332,844, $3,297,666, $12,976,517, and $246,215) | | | 154,874,923 | | | | 2,384,038 | | | | 15,712,705 | | | | 509,320 | | | | — | |
Unrealized depreciation on forward foreign currency contracts | | | 44,142 | | | | — | | | | — | | | | 9,628 | | | | — | |
Payables: | | | | | | | | | | | | | | | | | | | | |
Investments purchased | | | 30,170,179 | | | | 843,827 | | | | 60,420,027 | | | | 17,509,150 | | | | — | |
Fund shares redeemed | | | 7,060,808 | | | | 76,034 | | | | 3,199,462 | | | | 911,964 | | | | 258,056 | |
Dividends payable | | | 469 | | | | — | | | | — | | | | 16 | | | | — | |
Affiliates: | | | | | | | | | | | | | | | | | | | | |
Investment advisory fees | | | 3,694,884 | | | | 69,764 | | | | 1,217,416 | | | | 392,101 | | | | 100,740 | |
Distribution fees | | | 26,672 | | | | 103 | | | | 4,274 | | | | 9,806 | | | | 362 | |
Deferred compensation to trustees | | | 150,048 | | | | 4,734 | | | | — | | | | 160,487 | | | | 4,825 | |
Financial accounting fees | | | 64,302 | | | | 1,070 | | | | 11,547 | | | | 6,098 | | | | 1,364 | |
Trustees’ fees and officer compensation | | | 48,943 | | | | 1,904 | | | | 6,411 | | | | 6,636 | | | | 2,574 | |
Other accounts payable and accrued liabilities | | | 1,484,033 | | | | 46,901 | | | | 217,647 | | | | 150,735 | | | | 43,003 | |
Total liabilities | | | 2,522,263,816 | | | | 4,090,941 | | | | 549,248,519 | | | | 79,103,215 | | | | 6,285,929 | |
NET ASSETS | | $ | 6,705,841,204 | | | $ | 97,356,511 | | | $ | 1,164,355,984 | | | $ | 615,541,169 | | | $ | 136,237,997 | |
COMPOSITION OF NET ASSETS | | | | | | | | | | | | | | | | | | | | |
Paid in capital | | $ | 6,457,503,118 | | | $ | 96,349,727 | | | $ | 1,183,584,817 | | | $ | 525,022,516 | | | $ | 130,659,723 | |
Undistributed net investment income (loss) | | | 24,117,951 | | | | 108,525 | | | | (22,441 | ) | | | 6,332,351 | | | | 2,114,331 | |
Accumulated net realized gain (loss) on investments, foreign currency transactions, written options, short positions and total return swaps | | | 75,755,196 | | | | (507,060 | ) | | | 27,611,846 | | | | 76,608,978 | | | | 7,566,065 | |
Unrealized appreciation (depreciation) of investments, foreign currency translations, written options and short positions | | | 148,464,939 | | | | 1,405,319 | | | | (46,818,238 | ) | | | 7,577,324 | | | | (4,102,122 | ) |
NET ASSETS | | $ | 6,705,841,204 | | | $ | 97,356,511 | | | $ | 1,164,355,984 | | | $ | 615,541,169 | | | $ | 136,237,997 | |
CLASS A SHARES† | | | | | | | | | | | | | | | | | | | | |
Net assets applicable to shares outstanding | | $ | 743,925,258 | | | $ | 5,151,139 | | | $ | 108,730,042 | | | $ | 210,845,026 | | | $ | 11,184,254 | |
Shares outstanding | | | 55,033,805 | | | | 450,127 | | | | 8,952,488 | | | | 11,643,468 | | | | 1,034,537 | |
Net asset value and redemption price per share | | $ | 13.52 | | | $ | 11.44 | | | $ | 12.15 | | | $ | 18.11 | | | $ | 10.81 | |
Maximum offering price per share (Net asset value, plus 4.75% of offering price) | | $ | 13.83 | # | | $ | 12.01 | | | $ | 12.76 | | | $ | 18.53 | # | | $ | 11.06 | # |
CLASS C SHARES†** | | | | | | | | | | | | | | | | | | | | |
Net assets applicable to shares outstanding | | $ | 303,416,818 | | | $ | 616,231 | | | $ | 52,168,892 | | | $ | 128,919,801 | | | $ | 3,884,088 | |
Shares outstanding | | | 22,106,509 | | | | 54,306 | | | | 4,378,330 | | | | 7,194,587 | | | | 363,177 | |
Net asset value and redemption price per share | | $ | 13.73 | | | $ | 11.35 | | | $ | 11.92 | | | $ | 17.92 | | | $ | 10.69 | |
CLASS I SHARES† | | | | | | | | | | | | | | | | | | | | |
Net assets applicable to shares outstanding | | $ | 5,658,499,128 | | | $ | 91,589,141 | | | $ | 1,003,457,050 | | | $ | 275,776,342 | | | $ | 121,169,655 | |
Shares outstanding | | | 423,460,684 | | | | 7,997,596 | | | | 82,034,370 | | | | 16,994,170 | | | | 11,201,616 | |
Net asset value and redemption price per share | | $ | 13.36 | | | $ | 11.45 | | | $ | 12.23 | | | $ | 16.23 | | | $ | 10.82 | |
| † | No par value; unlimited number of shares authorized. |
| ** | Redemption price may be reduced by contingent deferred sales charge. |
| # | For Market Neutral Income Fund, Convertible Fund and Global Convertible Fund, maximum offering price per share is Net asset value plus 2.25% of offering price. |
| | | | | | |
| See accompanying Notes to Financial Statements | | www.calamos.com | | | 147 | |
Statements of Assets and Liabilities October 31, 2018
| | | | | | | | | | | | | | | | |
| | | GROWTH FUND | | | GROWTH AND
INCOME FUND | | | DIVIDEND
GROWTH FUND | | | OPPORTUNISTIC
VALUE FUND | |
ASSETS | | | | | | | | | | | | | | | | |
Investments in securities, at cost | | $ | 1,217,903,905 | | | $ | 1,619,741,167 | | | $ | 18,210,272 | | | $ | 45,183,801 | |
Investment in securities, at value | | $ | 1,517,709,876 | | | $ | 2,027,197,603 | | | $ | 23,881,249 | | | $ | 48,656,623 | |
Restricted cash for short positions (interest bearing) | | | 29,798 | | | | — | | | | — | | | | — | |
Unrealized appreciation on forward foreign currency contracts | | | — | | | | 75,791 | | | | — | | | | — | |
Receivables: | | | | | | | | | | | | | | | | |
Accrued interest and dividends | | | 821,077 | | | | 3,291,529 | | | | 20,248 | | | | 40,332 | |
Investments sold | | | 1,579,594 | | | | 4,346,049 | | | | 113,750 | | | | 1,199,478 | |
Fund shares sold | | | 101,535 | | | | 1,662,621 | | | | — | | | | 10,108 | |
Due from investment advisor | | | — | | | | — | | | | — | | | | 14,119 | |
Prepaid expenses | | | 39,304 | | | | 51,047 | | | | 20,761 | | | | 7,036 | |
Other assets | | | 638,091 | | | | 445,175 | | | | 8,859 | | | | 10,006 | |
Total assets | | | 1,520,919,275 | | | | 2,037,069,815 | | | | 24,044,867 | | | | 49,937,702 | |
LIABILITIES | | | | | | | | | | | | | | | | |
Due to Investment advisor | | | — | | | | — | | | | 10,124 | | | | — | |
Collateral for securities loaned | | | 29,199,351 | | | | 52,557,957 | | | | — | | | | 966,475 | |
Foreign currency overdraft | | | — | | | | — | | | | — | | | | — | |
Options written, at value (premium $374,781, and $42,474) | | | 448,405 | | | | — | | | | — | | | | 145,925 | |
Unrealized depreciation on forward foreign currency contracts | | | — | | | | 8,651 | | | | — | | | | — | |
Payables: | | | | | | | | | | | | | | | | |
Investments purchased | | | 24,043,654 | | | | 2,318,490 | | | | 20,781 | | | | 1,174,102 | |
Fund shares redeemed | | | 1,318,630 | | | | 1,502,951 | | | | — | | | | 12,664 | |
Affiliates: | | | | | | | | | | | | | | | | |
Investment advisory fees | | | 1,166,037 | | | | 1,184,687 | | | | 21,009 | | | | 41,497 | |
Distribution fees | | | 29,095 | | | | 38,301 | | | | 87 | | | | 521 | |
Deferred compensation to trustees | | | 604,438 | | | | 445,175 | | | | 8,859 | | | | 10,006 | |
Financial accounting fees | | | 14,944 | | | | 19,851 | | | | 241 | | | | 478 | |
Trustees’ fees and officer compensation | | | 17,075 | | | | 20,861 | | | | 1,988 | | | | 2,184 | |
Other accounts payable and accrued liabilities | | | 542,571 | | | | 524,156 | | | | 21,742 | | | | 25,007 | |
Total liabilities | | | 57,384,200 | | | | 58,621,080 | | | | 84,831 | | | | 2,378,859 | |
NET ASSETS | | $ | 1,463,535,075 | | | $ | 1,978,448,735 | | | $ | 23,960,036 | | | $ | 47,558,843 | |
COMPOSITION OF NET ASSETS | | | | | | | | | | | | | | | | |
Paid in capital | | $ | 960,041,688 | | | $ | 1,454,091,089 | | | $ | 17,382,394 | | | $ | 37,080,584 | |
Undistributed net investment income (loss) | | | (614,598 | ) | | | 3,120,200 | | | | 31,765 | | | | 189,191 | |
Accumulated net realized gain (loss) on investments, foreign currency transactions and written options | | | 204,377,017 | | | | 113,713,870 | | | | 874,900 | | | | 6,919,697 | |
Unrealized appreciation (depreciation) of investments, foreign currency translations and written options | | | 299,730,968 | | | | 407,523,576 | | | | 5,670,977 | | | | 3,369,371 | |
NET ASSETS | | $ | 1,463,535,075 | | | $ | 1,978,448,735 | | | $ | 23,960,036 | | | $ | 47,558,843 | |
CLASS A SHARES† | | | | | | | | | | | | | | | | |
Net assets applicable to shares outstanding | | $ | 851,590,424 | | | $ | 832,433,350 | | | $ | 2,346,710 | | | $ | 21,348,663 | |
Shares outstanding | | | 25,699,009 | | | | 25,586,136 | | | | 190,135 | | | | 1,389,080 | |
Net asset value and redemption price per share | | $ | 33.14 | | | $ | 32.53 | | | $ | 12.34 | | | $ | 15.37 | |
Maximum offering price per share (Net asset value, plus 4.75% of offering price) | | $ | 34.79 | | | $ | 34.15 | | | $ | 12.96 | | | $ | 16.14 | |
CLASS C SHARES†** | | | | | | | | | | | | | | | | |
Net assets applicable to shares outstanding | | $ | 329,883,455 | | | $ | 502,593,146 | | | $ | 1,027,915 | | | $ | 4,318,188 | |
Shares outstanding | | | 15,708,699 | | | | 15,372,522 | | | | 85,038 | | | | 313,485 | |
Net asset value and redemption price per share | | $ | 21.00 | | | $ | 32.69 | | | $ | 12.09 | | | $ | 13.77 | |
CLASS I SHARES† | | | | | | | | | | | | | | | | |
Net assets applicable to shares outstanding | | $ | 282,061,196 | | | $ | 643,422,239 | | | $ | 20,585,411 | | | $ | 21,891,992 | |
Shares outstanding | | | 6,487,434 | | | | 20,570,125 | | | | 1,669,637 | | | | 1,385,706 | |
Net asset value and redemption price per share | | $ | 43.48 | | | $ | 31.28 | | | $ | 12.33 | | | $ | 15.80 | |
| † | No par value; unlimited number of shares authorized. |
| ** | Redemption price may be reduced by contingent deferred sales charge. |
| | | | |
| 148 | | CALAMOS OPEN-END FAMILY OF FUNDS ANNUAL REPORT | | See accompanying Notes to Financial Statements |
Statements of Assets and Liabilities October 31, 2018
| | | | | | | | | | | | | | | | | | | | |
| | | INTERNATIONAL
GROWTH FUND | | | EVOLVING
WORLD GROWTH
FUND | | | EMERGING
MARKET EQUITY
FUND | | | GLOBAL EQUITY
FUND | | | GLOBAL GROWTH
AND INCOME
FUND | |
ASSETS | | | | | | | | | | | | | | | | | | | | |
Investments in securities, at cost | | $ | 225,670,462 | | | $ | 200,152,804 | | | $ | 16,479,678 | | | $ | 82,050,095 | | | $ | 181,119,807 | |
Investment in securities, at value | | $ | 234,931,813 | | | $ | 210,753,232 | | | $ | 16,812,107 | | | $ | 98,378,348 | | | $ | 193,812,557 | |
Foreign currency (cost $2) | | | — | | | | 2 | | | | — | | | | — | | | | — | |
Restricted cash for open forward foreign currency contracts | | | 320,000 | | | | — | | | | — | | | | — | | | | — | |
Unrealized depreciation on forward foreign currency contracts | | | 5,161 | | | | — | | | | — | | | | — | | | | — | |
Receivables: | | | | | | | | | | | | | | | | | | | | |
Accrued interest and dividends | | | 924,553 | | | | 378,296 | | | | 10,072 | | | | 126,034 | | | | 567,938 | |
Investments sold | | | 2,939,683 | | | | 3,309,899 | | | | 35,037 | | | | 461,767 | | | | 2,488,308 | |
Fund shares sold | | | 187,297 | | | | 259,897 | | | | — | | | | 69,815 | | | | 31,505 | |
Due from investment advisor | | | 96,669 | | | | — | | | | 6,529 | | | | 7,610 | | | | — | |
Prepaid expenses | | | 25,788 | | | | 25,851 | | | | 2,688 | | | | 15,075 | | | | 25,206 | |
Other assets | | | 9,273 | | | | — | | | | 8,857 | | | | 76,675 | | | | 213,596 | |
Total assets | | | 239,440,237 | | | | 214,727,177 | | | | 16,875,290 | | | | 99,135,324 | | | | 197,139,110 | |
LIABILITIES | | | | | | | | | | | | | | | | | | | | |
Collateral for securities loaned | | | 735,881 | | | | 5,610,193 | | | | 2,543,388 | | | | 404,808 | | | | 1,965,061 | |
Foreign currency overdraft | | | — | | | | — | | | | — | | | | — | | | | — | |
Foreign currency overdraft (cost $603,635) | | | 602,887 | | | | — | | | | — | | | | — | | | | — | |
Unrealized depreciation on forward foreign currency contracts | | | 397,697 | | | | — | | | | — | | | | — | | | | — | |
Payables: | | | | | | | | | | | | | | | | | | | | |
Investments purchased | | | 3,748,629 | | | | 4,022,914 | | | | 282,464 | | | | 1,995,543 | | | | 4,048,408 | |
Fund shares redeemed | | | 262,637 | | | | 225,952 | | | | 79 | | | | 69,980 | | | | 304,654 | |
Affiliates: | | | | | | | | | | | | | | | | | | | | |
Investment advisory fees | | | 210,054 | | | | 199,490 | | | | 13,531 | | | | 86,196 | | | | 167,567 | |
Distribution fees | | | 1,898 | | | | 1,418 | | | | 75 | | | | 949 | | | | 3,788 | |
Deferred compensation to trustees | | | 9,273 | | | | — | | | | 8,857 | | | | 76,675 | | | | 213,596 | |
Financial accounting fees | | | 2,418 | | | | 2,087 | | | | 142 | | | | 992 | | | | 1,929 | |
Trustees’ fees and officer compensation | | | 3,825 | | | | 4,591 | | | | 1,934 | | | | 2,759 | | | | 3,404 | |
Other accounts payable and accrued liabilities | | | 114,968 | | | | 129,327 | | | | 25,395 | | | | 43,832 | | | | 94,175 | |
Total liabilities | | | 6,090,167 | | | | 10,195,972 | | | | 2,875,865 | | | | 2,681,734 | | | | 6,802,582 | |
NET ASSETS | | $ | 233,350,070 | | | $ | 204,531,205 | | | $ | 13,999,425 | | | $ | 96,453,590 | | | $ | 190,336,528 | |
COMPOSITION OF NET ASSETS | | | | | | | | | | | | | | | | | | | | |
Paid in capital | | $ | 201,089,079 | | | $ | 215,091,637 | | | $ | 16,228,241 | | | $ | 61,626,799 | | | $ | 158,985,607 | |
Undistributed net investment income (loss) | | | 78,000 | | | | (76,789 | ) | | | (8,030 | ) | | | (125,369 | ) | | | 374,066 | |
Accumulated net realized gain (loss) on investments, foreign currency transactions and written options | | | 23,330,088 | | | | (21,066,073 | ) | | | (2,553,383 | ) | | | 18,623,777 | | | | 18,292,485 | |
Unrealized appreciation (depreciation) of investments and foreign currency translations | | | 8,852,903 | | | | 10,582,430 | | | | 332,597 | | | | 16,328,383 | | | | 12,684,370 | |
NET ASSETS | | $ | 233,350,070 | | | $ | 204,531,205 | | | $ | 13,999,425 | | | $ | 96,453,590 | | | $ | 190,336,528 | |
CLASS A SHARES† | | | | | | | | | | | | | | | | | | | | |
Net assets applicable to shares outstanding | | $ | 59,566,410 | | | $ | 34,677,501 | | | $ | 4,479,256 | | | $ | 27,489,059 | | | $ | 63,068,906 | |
Shares outstanding | | | 3,290,745 | | | | 2,765,404 | | | | 524,358 | | | | 2,019,973 | | | | 7,015,778 | |
Net asset value and redemption price per share | | $ | 18.10 | | | $ | 12.54 | | | $ | 8.54 | | | $ | 13.61 | | | $ | 8.99 | |
Maximum offering price per share (Net asset value, plus 4.75% of offering price) | | $ | 19.00 | | | $ | 13.17 | | | $ | 8.97 | | | $ | 14.29 | | | $ | 9.44 | |
CLASS C SHARES†** | | | | | | | | | | | | | | | | | | | | |
Net assets applicable to shares outstanding | | $ | 20,448,956 | | | $ | 17,739,468 | | | $ | 284,445 | | | $ | 10,886,601 | | | $ | 54,424,905 | |
Shares outstanding | | | 1,248,449 | | | | 1,506,320 | | | | 34,214 | | | | 882,510 | | | | 6,821,924 | |
Net asset value and redemption price per share | | $ | 16.38 | | | $ | 11.78 | | | $ | 8.31 | | | $ | 12.34 | | | $ | 7.98 | |
CLASS I SHARES† | | | | | | | | | | | | | | | | | | | | |
Net assets applicable to shares outstanding | | $ | 153,312,371 | | | $ | 152,114,236 | | | $ | 9,235,724 | | | $ | 58,077,930 | | | $ | 72,842,717 | |
Shares outstanding | | | 8,265,807 | | | | 12,041,177 | | | | 1,076,616 | | | | 4,168,603 | | | | 7,873,836 | |
Net asset value and redemption price per share | | $ | 18.55 | | | $ | 12.63 | | | $ | 8.58 | | | $ | 13.93 | | | $ | 9.25 | |
CLASS R6 SHARES† | | | | | | | | | | | | | | | | | | | | |
Net assets applicable to shares outstanding | | $ | 22,333 | | | $ | — | | | $ | — | | | $ | — | | | $ | — | |
Shares Outstanding | | | 1,197 | | | | — | | | | — | | | | — | | | | — | |
Net asset value and redemption price per share | | $ | 18.66 | | | $ | — | | | $ | — | | | $ | — | | | $ | — | |
| † | No par value; unlimited number of shares authorized. |
| ** | Redemption price may be reduced by contingent deferred sales charge. |
| | | | | | |
| See accompanying Notes to Financial Statements | | www.calamos.com | | | 149 | |
Statements of Assets and Liabilities October 31, 2018
| | | | | | | | | | | | |
| | | TOTAL RETURN
BOND FUND | | | HIGH INCOME
OPPORTUNITIES
FUND | | | SHORT-TERM
BOND FUND | |
ASSETS | | | | | | | | | | | | |
Investments in securities, at cost | | $ | 63,841,787 | | | $ | 64,061,719 | | | $ | 15,846,854 | |
Investment in securities, at value | | $ | 62,036,352 | | | $ | 61,671,616 | | | $ | 15,809,810 | |
Cash with custodian (interest bearing) | | | 2,981 | | | | 6,675 | | | | 456 | |
Receivables: | | | | | | | | | | | | |
Accrued interest and dividends | | | 403,113 | | | | 833,132 | | | | 106,780 | |
Investments sold | | | — | | | | 369,801 | | | | — | |
Fund shares sold | | | 10,427 | | | | 5,414 | | | | — | |
Due from investment advisor | | | — | | | | — | | | | 20,760 | |
Prepaid expenses | | | 18,975 | | | | 19,380 | | | | 38 | |
Deferred offering costs | | | — | | | | — | | | | 105,681 | |
Other assets | | | 74,973 | | | | 104,075 | | | | — | |
Total assets | | | 62,546,821 | | | | 63,010,093 | | | | 16,043,525 | |
LIABILITIES | | | | | | | | | | | | |
Due to Investment advisor | | | 16,003 | | | | 1,600 | | | | — | |
Collateral for securities loaned | | | 5,533,827 | | | | 12,583,224 | | | | 472,778 | |
Foreign currency overdraft | | | — | | | | — | | | | — | |
Payables: | | | | | | | | | | | | |
Investments purchased | | | 376,875 | | | | 250,313 | | | | 376,875 | |
Fund shares redeemed | | | 70,320 | | | | 189,100 | | | | 1,899 | |
Dividends payable | | | 12,665 | | | | 14,908 | | | | 2 | |
Affiliates: | | | | | | | | | | | | |
Investment advisory fees | | | 21,995 | | | | 25,841 | | | | 3,848 | |
Distribution fees | | | 587 | | | | 980 | | | | — | |
Deferred compensation to trustees | | | 74,973 | | | | 104,075 | | | | — | |
Financial accounting fees | | | 563 | | | | 495 | | | | 147 | |
Trustees’ fees and officer compensation | | | 2,315 | | | | 2,231 | | | | 45 | |
Other accounts payable and accrued liabilities | | | 27,312 | | | | 77,190 | | | | 44,956 | |
Total liabilities | | | 6,137,435 | | | | 13,249,957 | | | | 900,550 | |
NET ASSETS | | $ | 56,409,386 | | | $ | 49,760,136 | | | $ | 15,142,975 | |
COMPOSITION OF NET ASSETS | | | | | | | | | | | | |
Paid in capital | | $ | 59,123,205 | | | $ | 61,170,267 | | | $ | 15,179,104 | |
Undistributed net investment income (loss) | | | (71,478 | ) | | | (197,961 | ) | | | 6,246 | |
Accumulated net realized gain (loss) on investments and written options | | | (836,906 | ) | | | (8,822,067 | ) | | | (5,331 | ) |
Unrealized appreciation (depreciation) of investments | | | (1,805,435 | ) | | | (2,390,103 | ) | | | (37,044 | ) |
NET ASSETS | | $ | 56,409,386 | | | $ | 49,760,136 | | | $ | 15,142,975 | |
CLASS A SHARES† | | | | | | | | | | | | |
Net assets applicable to shares outstanding | | $ | 17,108,643 | | | $ | 32,282,362 | | | $ | 25,021 | |
Shares outstanding | | | 1,744,558 | | | | 3,855,568 | | | | 2,508 | |
Net asset value and redemption price per share | | $ | 9.81 | | | $ | 8.37 | | | $ | 9.98 | |
Maximum offering price per share (Net asset value, plus 4.75% of offering price) | | $ | 10.04 | # | | $ | 8.56 | # | | $ | 10.21 | # |
CLASS C SHARES†** | | | | | | | | | | | | |
Net assets applicable to shares outstanding | | $ | 6,412,530 | | | $ | 9,772,019 | | | $ | — | |
Shares outstanding | | | 653,746 | | | | 1,107,550 | | | | — | |
Net asset value and redemption price per share | | $ | 9.81 | | | $ | 8.82 | | | $ | — | |
CLASS I SHARES† | | | | | | | | | | | | |
Net assets applicable to shares outstanding | | $ | 32,888,213 | | | $ | 7,705,755 | | | $ | 15,117,954 | |
Shares outstanding | | | 3,353,061 | | | | 920,316 | | | | 1,515,411 | |
Net asset value and redemption price per share | | $ | 9.81 | | | $ | 8.37 | | | $ | 9.98 | |
| † | No par value; unlimited number of shares authorized. |
| ** | Redemption price may be reduced by contingent deferred sales charge. |
| # | For Total Return Bond Fund, High Income Opportunities Fund, and Short-Term Bond Fund, maximum offering price per share is Net asset value plus 2.25% of offering price. |
| | | | |
| 150 | | CALAMOS OPEN-END FAMILY OF FUNDS ANNUAL REPORT | | See accompanying Notes to Financial Statements |
Statements of Operations Year Ended October 31, 2018
| | | | | | | | | | | | | | | | | | | | |
| | | MARKET NEUTRAL
INCOME FUND | | | HEDGED EQUITY
INCOME FUND | | | PHINEUS
LONG/SHORT
FUND | | | CONVERTIBLE
FUND | | | GLOBAL
CONVERTIBLE
FUND | |
INVESTMENT INCOME | | | | | | | | | | | | | | | | | | | | |
Interest | | $ | 114,118,878 | | | $ | — | | | $ | 5,142,147 | | | $ | 16,949,390 | | | $ | 4,720,103 | |
Dividends | | | 71,116,947 | | | | 940,249 | | | | 14,429,731 | | | | 5,597,740 | | | | 773,237 | |
Securities lending income | | | 8,016,792 | | | | 598 | | | | 261,494 | | | | 177,667 | | | | 26,872 | |
Dividend taxes withheld | | | (91,875 | ) | | | — | | | | (288,459 | ) | | | — | | | | — | |
Total investment income | | | 193,160,742 | | | | 940,847 | | | | 19,544,913 | | | | 22,724,797 | | | | 5,520,212 | |
| | | | | |
EXPENSES | | | | | | | | | | | | | | | | | | | | |
Investment advisory fees | | | 36,719,872 | | | | 370,507 | | | | 11,698,243 | | | | 4,499,419 | | | | 1,087,399 | |
Distribution fees | |
Class A | | | 1,750,351 | | | | 48,436 | | | | 260,870 | | | | 548,829 | | | | 35,398 | |
Class C | | | 2,868,764 | | | | 2,787 | | | | 459,750 | | | | 1,410,422 | | | | 36,495 | |
Class R | | | 9,734 | (a) | | | — | | | | — | | | | 2,651 | (a) | | | 13 | (a) |
Dividend or interest expense on short positions | | | 9,895,777 | | | | — | | | | 5,850,632 | | | | — | | | | — | |
Transfer agent fees | | | 5,318,144 | | | | 52,576 | | | | 922,158 | | | | 596,003 | | | | 120,098 | |
Financial accounting fees | | | 638,634 | | | | 5,695 | | | | 110,593 | | | | 70,069 | | | | 14,765 | |
Printing and mailing fees | | | 575,130 | | | | 21,367 | | | | 134,812 | | | | 70,571 | | | | 18,678 | |
Accounting fees | | | 341,543 | | | | 16,412 | | | | 62,307 | | | | 45,305 | | | | 21,409 | |
Trustees’ fees and officer compensation | | | 258,859 | | | | 13,224 | | | | 55,803 | | | | 37,429 | | | | 17,592 | |
Legal fees | | | 239,293 | | | | 14,567 | | | | 49,749 | | | | 32,126 | | | | 17,002 | |
Audit fees | | | 191,785 | | | | 10,324 | | | | 46,839 | | | | 25,759 | | | | 12,582 | |
Custodian fees | | | 183,540 | | | | 46,596 | | | | 114,312 | | | | 3,618 | | | | 10,784 | |
Registration fees | | | 181,771 | | | | 57,360 | | | | 109,758 | | | | 89,642 | | | | 71,357 | |
Other | | | 427,003 | | | | 5,021 | | | | 38,060 | | | | 41,926 | | | | 13,343 | |
Total expenses | | | 59,600,200 | | | | 664,872 | | | | 19,913,886 | | | | 7,473,769 | | | | 1,476,915 | |
Less expense reductions | | | — | | | | (119,218 | ) | | | — | | | | — | | | | (6,281 | ) |
Net expenses | | | 59,600,200 | | | | 545,654 | | | | 19,913,886 | | | | 7,473,769 | | | | 1,470,634 | |
NET INVESTMENT INCOME (LOSS) | | | 133,560,542 | | | | 395,193 | | | | (368,973 | ) | | | 15,251,028 | | | | 4,049,578 | |
| | | | | |
REALIZED AND UNREALIZED GAIN (LOSS) | | | | | | | | | | | | | | | | | | | | |
Net realized gain (loss) from: | | | | | | | | | | | | | | | | | | | | |
Investments, excluding purchased options | | | 214,898,013 | | | | (639,916 | ) | | | 44,885,627 | | | | 63,470,706 | | | | 3,550,790 | |
Purchased options | | | 21,132,553 | | | | 504,582 | | | | (34,366,637 | ) | | | (763,474 | ) | | | 883,944 | |
Foreign currency transactions | | | 922,460 | | | | — | | | | 182,802 | | | | (11,094 | ) | | | 2,039 | |
Forward foreign currency contracts | | | 5,773,601 | | | | — | | | | — | | | | 45,996 | | | | — | |
Written options | | | (187,900,559 | ) | | | (212,872 | ) | | | 35,796,730 | | | | 1,060,537 | | | | 120,855 | |
Short positions | | | (136,694,531 | ) | | | — | | | | (12,907,467 | ) | | | — | | | | — | |
Total return swaps | | | (2,219,363 | ) | | | — | | | | — | | | | — | | | | — | |
Change in net unrealized appreciation/(depreciation) on: | |
Investments, excluding purchased options | | | (78,519,724 | ) | | | (1,862,513 | ) | | | (112,820,443 | ) | | | (60,673,798 | ) | | | (9,072,434 | ) |
Purchased options | | | 9,204,625 | | | | 119,174 | | | | 12,508,825 | | | | (182,248 | ) | | | (158,638 | ) |
Foreign currency translations | | | (5,961,858 | ) | | | — | | | | 44,413 | | | | 1,109 | | | | (16,258 | ) |
Forward foreign currency contracts | | | 2,979,532 | | | | — | | | | — | | | | 75,303 | | | | — | |
Written options | | | 150,754,188 | | | | 1,408,721 | | | | (2,897,828 | ) | | | (263,105 | ) | | | — | |
Short positions | | | 72,106,452 | | | | — | | | | 38,249,392 | | | | — | | | | — | |
NET GAIN (LOSS) | | | 66,475,389 | | | | (682,824 | ) | | | (31,324,586 | ) | | | 2,759,932 | | | | (4,689,702 | ) |
NET INCREASE (DECREASE) IN NET ASSETS RESULTING FROM OPERATIONS | | $ | 200,035,931 | | | $ | (287,631 | ) | | $ | (31,693,559 | ) | | $ | 18,010,960 | | | $ | (640,124 | ) |
| (a) | Class R shares were converted into Class A shares at the close of business on February 22, 2018. |
| | | | | | |
| See accompanying Notes to Financial Statements | | www.calamos.com | | | 151 | |
Statements of Operations Year Ended October 31, 2018
| | | | | | | | | | | | | | | | |
| | | GROWTH FUND | | | GROWTH AND
INCOME FUND | | | DIVIDEND
GROWTH FUND | | | OPPORTUNISTIC
VALUE FUND | |
INVESTMENT INCOME | | | | | | | | | | | | | | | | |
Interest | | $ | — | | | $ | (716,546 | ) | | $ | — | | | $ | — | |
Dividends | | | 17,538,898 | | | | 38,449,433 | | | | 490,114 | | | | 920,827 | |
Securities lending income | | | 153,655 | | | | 480,483 | | | | 667 | | | | 4,204 | |
Dividend taxes withheld | | | (54,038 | ) | | | — | | | | — | | | | (131 | ) |
Total investment income | | | 17,638,515 | | | | 38,213,370 | | | | 490,781 | | | | 924,900 | |
| | | | |
EXPENSES | | | | | | | | | | | | | | | | |
Investment advisory fees | | | 14,646,119 | | | | 14,159,993 | | | | 255,827 | | | | 514,206 | |
Distribution fees | |
Class A | | | 2,391,612 | | | | 2,259,188 | | | | 5,750 | | | | 55,781 | |
Class C | | | 3,809,336 | | | | 5,549,698 | | | | 10,634 | | | | 46,335 | |
Class R | | | 8,365 | (a) | | | 18,433 | (a) | | | — | | | | 257 | (a) |
Transfer agent fees | | | 2,018,766 | | | | 2,060,743 | | | | 14,677 | | | | 37,529 | |
Financial accounting fees | | | 189,686 | | | | 238,139 | | | | 2,953 | | | | 5,936 | |
Printing and mailing fees | | | 251,596 | | | | 193,302 | | | | 12,627 | | | | 11,603 | |
Accounting fees | | | 99,404 | | | | 123,966 | | | | 12,532 | | | | 15,677 | |
Trustees’ fees and officer compensation | | | 81,977 | | | | 100,929 | | | | 12,942 | | | | 14,096 | |
Legal fees | | | (455,370 | )(b) | | | 72,185 | | | | 30,208 | | | | 13,380 | |
Audit fees | | | 53,402 | | | | 67,342 | | | | 8,598 | | | | 9,346 | |
Custodian fees | | | 35,597 | | | | 35,959 | | | | 1,325 | | | | 4,543 | |
Registration fees | | | 81,025 | | | | 96,068 | | | | 53,907 | | | | 64,629 | |
Other | | | 110,541 | | | | 123,689 | | | | 3,416 | | | | 5,741 | |
Total expenses | | | 23,322,056 | | | | 25,099,634 | | | | 425,396 | | | | 799,059 | |
Less expense reductions | | | — | | | | — | | | | (127,483 | ) | | | (233,598 | ) |
Net expenses | | | 23,322,056 | | | | 25,099,634 | | | | 297,913 | | | | 565,461 | |
NET INVESTMENT INCOME (LOSS) | | | (5,683,541 | ) | | | 13,113,736 | | | | 192,868 | | | | 359,439 | |
| | | | |
REALIZED AND UNREALIZED GAIN (LOSS) | | | | | | | | | | | | | | | | |
Net realized gain (loss) from: | | | | | | | | | | | | | | | | |
Investments, excluding purchased options | | | 246,667,600 | | | | 119,406,100 | | | | 1,005,910 | | | | 7,244,846 | |
Purchased options | | | (7,427,911 | ) | | | 5,666,108 | | | | — | | | | 31,569 | |
Foreign currency transactions | | | (8,332 | ) | | | (8,412 | ) | | | — | | | | — | |
Forward foreign currency contracts | | | — | | | | 74,180 | | | | — | | | | — | |
Written options | | | 7,574,821 | | | | 781,477 | | | | — | | | | (8,505 | ) |
Change in net unrealized appreciation/(depreciation) on: | |
Investments, excluding purchased options | | | (135,388,940 | ) | | | (34,083,946 | ) | | | 197,081 | | | | (5,345,006 | ) |
Purchased options | | | 383,529 | | | | (1,693,147 | ) | | | — | | | | 275,966 | |
Foreign currency translations | | | (1,379 | ) | | | — | | | | — | | | | — | |
Forward foreign currency contracts | | | — | | | | 67,140 | | | | — | | | | — | |
Written options | | | 796,351 | | | | 53,679 | | | | — | | | | (103,451 | ) |
NET GAIN (LOSS) | | | 112,595,739 | | | | 90,263,179 | | | | 1,202,991 | | | | 2,095,419 | |
NET INCREASE (DECREASE) IN NET ASSETS RESULTING FROM OPERATIONS | | $ | 106,912,198 | | | $ | 103,376,915 | | | $ | 1,395,859 | | | $ | 2,454,858 | |
| (a) | Class R shares were converted into Class A shares at the close of business on February 22, 2018. |
| (b) | Includes insurance proceeds received of approximately $1.0 million in current year for expenses in prior fiscal year. |
| | | | |
| 152 | | CALAMOS OPEN-END FAMILY OF FUNDS ANNUAL REPORT | | See accompanying Notes to Financial Statements |
Statements of Operations Year Ended October 31, 2018
| | | | | | | | | | | | | | | | | | | | |
| | | INTERNATIONAL GROWTH FUND(a) | | | EVOLVING
WORLD GROWTH
FUND | | | EMERGING
MARKET EQUITY
FUND | | | GLOBAL EQUITY
FUND | | | GLOBAL GROWTH
AND INCOME
FUND | |
INVESTMENT INCOME | | | | | | | | | | | | | | | | | | | | |
Interest | | $ | — | | | $ | 743 | | | $ | — | | | $ | — | | | $ | 2,017,128 | |
Dividends | | | 6,528,908 | | | | 4,568,987 | | | | 334,562 | | | | 1,665,223 | | | | 3,531,712 | |
Securities lending income | | | 131,960 | | | | 9,770 | | | | 3,184 | | | | 27,658 | | | | 23,523 | |
Dividend taxes withheld | | | (608,150 | ) | | | (370,518 | ) | | | (31,653 | ) | | | (109,715 | ) | | | (254,491 | ) |
Total investment income | | | 6,052,718 | | | | 4,208,982 | | | | 306,093 | | | | 1,583,166 | | | | 5,317,872 | |
| | | | | |
EXPENSES | | | | | | | | | | | | | | | | | | | | |
Investment advisory fees | | | 3,109,789 | | | | 3,036,128 | | | | 191,580 | | | | 1,165,867 | | | | 2,186,845 | |
Performance fees | | | 22,237 | | | | — | | | | — | | | | 22,589 | | | | — | |
Distribution fees | |
Class A | | | 257,695 | | | | 119,815 | | | | 13,767 | | | | 76,269 | | | | 185,347 | |
Class C | | | 262,207 | | | | 235,504 | | | | 3,732 | | | | 132,339 | | | | 656,240 | |
Class R | | | 10,824 | (b) | | | 3,947 | (b) | | | — | | | | 8,251 | (b) | | | 1,861 | (b) |
Transfer agent fees | | | 360,693 | | | | 339,327 | | | | 11,380 | | | | 123,005 | | | | 245,097 | |
Financial accounting fees | | | 35,904 | | | | 31,866 | | | | 2,011 | | | | 13,459 | | | | 25,265 | |
Printing and mailing fees | | | 33,342 | | | | 40,082 | | | | 9,540 | | | | 15,428 | | | | 54,513 | |
Accounting fees | | | 27,944 | | | | 27,055 | | | | 12,401 | | | | 17,610 | | | | 24,071 | |
Trustees’ fees and officer compensation | | | 24,689 | | | | 23,939 | | | | 12,841 | | | | 16,924 | | | | 20,164 | |
Legal fees | | | 89,238 | | | | 25,333 | | | | 13,183 | | | | 26,258 | | | | 25,121 | |
Audit fees | | | 15,937 | | | | 15,023 | | | | 8,477 | | | | 11,323 | | | | 14,089 | |
Custodian fees | | | 83,692 | | | | 145,223 | | | | 22,278 | | | | 26,746 | | | | 33,910 | |
Registration fees | | | 70,832 | | | | 75,316 | | | | 57,474 | | | | 60,109 | | | | 72,961 | |
Other | | | 41,583 | | | | 61,296 | | | | 11,914 | | | | 32,756 | | | | 32,699 | |
Total expenses | | | 4,446,606 | | | | 4,179,854 | | | | 370,578 | | | | 1,748,933 | | | | 3,578,183 | |
Less expense reductions | | | (598,153 | ) | | | — | | | | (91,696 | ) | | | (187,877 | ) | | | — | |
Net expenses | | | 3,848,453 | | | | 4,179,854 | | | | 278,882 | | | | 1,561,056 | | | | 3,578,183 | |
NET INVESTMENT INCOME (LOSS) | | | 2,204,265 | | | | 29,128 | | | | 27,211 | | | | 22,110 | | | | 1,739,689 | |
| | | | | |
REALIZED AND UNREALIZED GAIN (LOSS) | | | | | | | | | | | | | | | | | | | | |
Net realized gain (loss) from: | | | | | | | | | | | | | | | | | | | | |
Investments, excluding purchased options | | | 29,113,757 | (c) | | | 33,716,498 | (c) | | | 440,027 | | | | 23,815,847 | (c) | | | 16,232,339 | (c) |
Purchased options | | | (1,164,907 | ) | | | 1,785,949 | | | | (190,638 | ) | | | (758,785 | ) | | | 3,972,513 | |
Foreign currency transactions | | | (84,554 | ) | | | (310,200 | ) | | | (14,091 | ) | | | (14,128 | ) | | | 4,963 | |
Forward foreign currency contracts | | | (917,906 | ) | | | 1,618 | | | | (377 | ) | | | (224,327 | ) | | | (248,834 | ) |
Written options | | | (261,658 | ) | | | (1,777,103 | ) | | | (3,121 | ) | | | 48,128 | | | | (965,151 | ) |
Change in net unrealized appreciation/(depreciation) on: | |
Investments, excluding purchased options | | | (62,772,571 | )(d) | | | (70,248,286 | )(d) | | | (3,667,477 | ) | | | (24,922,585 | )(d) | | | (24,443,012 | )(d) |
Purchased options | | | (84,690 | ) | | | 748,526 | | | | (20,962 | ) | | | (13,288 | ) | | | (1,573,078 | ) |
Foreign currency translations | | | (16,258 | ) | | | (16,181 | ) | | | (93 | ) | | | 2,304 | | | | (461 | ) |
Forward foreign currency contracts | | | (189,660 | ) | | | — | | | | — | | | | 28,974 | | | | 77,062 | |
Written options | | | — | | | | (151,944 | ) | | | — | | | | — | | | | — | |
NET GAIN (LOSS) | | | (36,378,447 | ) | | | (36,251,123 | ) | | | (3,456,732 | ) | | | (2,037,860 | ) | | | (6,943,659 | ) |
NET INCREASE (DECREASE) IN NET ASSETS RESULTING FROM OPERATIONS | | $ | (34,174,182 | ) | | $ | (36,221,995 | ) | | $ | (3,429,521 | ) | | $ | (2,015,750 | ) | | $ | (5,203,970 | ) |
| (a) | International Growth Fund Class R6 commenced operations on September 17, 2018. |
| (b) | Class R shares were converted into Class A shares at the close of business on February 22, 2018. |
| (c) | Net of foreign capital gains tax of $155,131, $1,018,322, $102,925, and $178,283, respectively. |
| (d) | Net of change of $1,077,929, $2,039,376, $369,437 and $274,943, respectively in deferred capital gains tax. |
| | | | | | |
| See accompanying Notes to Financial Statements | | www.calamos.com | | | 153 | |
Statements of Operations Year Ended October 31, 2018
| | | | | | | | | | | | |
| | | TOTAL RETURN
BOND FUND | | | HIGH INCOME
OPPORTUNITIES
FUND | | | SHORT-TERM
BOND FUND(a) | |
INVESTMENT INCOME | | | | | | | | | | | | |
Interest | | $ | 2,171,190 | | | $ | 3,281,898 | | | $ | 60,754 | |
Dividends | | | 13,016 | | | | 154,400 | | | | 1,102 | |
Securities lending income | | | 8,888 | | | | 55,873 | | | | — | |
Foreign Taxes Withheld | | | (197 | ) | | | — | | | | — | |
Total investment income | | | 2,192,897 | | | | 3,492,171 | | | | 61,856 | |
| | | |
EXPENSES | | | | | | | | | | | | |
Investment advisory fees | | | 295,133 | | | | 326,715 | | | | 5,094 | |
Distribution fees | |
Class A | | | 48,837 | | | | 85,802 | | | | 8 | |
Class C | | | 75,779 | | | | 114,819 | | | | — | |
Class R | | | 727 | (b) | | | 188 | (b) | | | — | |
Transfer agent fees | | | 57,987 | | | | 64,156 | | | | 630 | |
Financial accounting fees | | | 7,572 | | | | 6,286 | | | | 277 | |
Printing and mailing fees | | | 12,877 | | | | 102,298 | | | | 420 | |
Accounting fees | | | 18,985 | | | | 22,115 | | | | 1,801 | |
Trustees’ fees and officer compensation | | | 14,439 | | | | 14,219 | | | | 2,856 | |
Legal fees | | | 22,534 | | | | 21,465 | | | | 3,570 | |
Audit fees | | | 9,531 | | | | 11,444 | | | | 6,090 | |
Custodian fees | | | 3,049 | | | | 6,389 | | | | 630 | |
Registration fees | | | 69,470 | | | | 67,861 | | | | — | |
Organization expense | | | — | | | | — | | | | 2,210 | |
Offering costs | | | — | | | | — | | | | 13,776 | |
Other | | | 10,856 | | | | 18,145 | | | | 209 | |
Total expenses | | | 647,776 | | | | 861,902 | | | | 37,571 | |
Less expense reductions | | | (95,007 | ) | | | (251,715 | ) | | | (30,444 | ) |
Net expenses | | | 552,769 | | | | 610,187 | | | | 7,127 | |
NET INVESTMENT INCOME (LOSS) | | | 1,640,128 | | | | 2,881,984 | | | | 54,729 | |
| | | |
REALIZED AND UNREALIZED GAIN (LOSS) | | | | | | | | | | | | |
Net realized gain (loss) from: | | | | | | | | | | | | |
Investments | | | (587,926 | ) | | | (556,924 | ) | | | 356 | |
Purchased options | | | — | | | | (24,477 | ) | | | — | |
Written options | | | — | | | | 33,542 | | | | — | |
Change in net unrealized appreciation/(depreciation) on: | |
Investments | | | (2,567,811 | ) | | | (2,175,869 | ) | | | (37,044 | ) |
Purchased options | | | — | | | | 4,977 | | | | — | |
Written options | | | — | | | | (1,949 | ) | | | — | |
NET GAIN (LOSS) | | | (3,155,737 | ) | | | (2,720,700 | ) | | | (36,688 | ) |
NET INCREASE (DECREASE) IN NET ASSETS RESULTING FROM OPERATIONS | | $ | (1,515,609 | ) | | $ | 161,284 | | | $ | 18,041 | |
| (a) | Short-Term Bond Fund commenced operations on September 19, 2018. |
| (b) | Class R shares were converted into Class A shares at the close of business on February 22, 2018. |
| | | | |
| 154 | | CALAMOS OPEN-END FAMILY OF FUNDS ANNUAL REPORT | | See accompanying Notes to Financial Statements |
Statements of Changes in Net Assets
| | | | | | | | | | | | | | | | | | | | | | | | |
| | | MARKET NEUTRAL INCOME FUND | | | HEDGED EQUITY INCOME FUND | | | PHINEUS LONG/SHORT FUND | |
| | | YEAR ENDED
OCTOBER 31,
2018 | | | YEAR ENDED
OCTOBER 31,
2017 | | | YEAR ENDED
OCTOBER 31,
2018 | | | YEAR ENDED
OCTOBER 31,
2017 | | | YEAR ENDED
OCTOBER 31,
2018 | | | YEAR ENDED
OCTOBER 31,
2017 | |
OPERATIONS | |
Net investment income (loss) | | $ | 133,560,542 | | | $ | 91,247,432 | | | $ | 395,193 | | | $ | 181,655 | | | $ | (368,973 | ) | | $ | (2,917,066 | ) |
Net realized gain (loss) | | | (84,087,826 | ) | | | 159,536,884 | | | | (348,206 | ) | | | 57,097 | | | | 33,591,055 | | | | 6,751,755 | |
Change in unrealized appreciation/(depreciation) | | | 150,563,215 | | | | (44,791,816 | ) | | | (334,618 | ) | | | 1,125,060 | | | | (64,915,641 | ) | | | 16,710,433 | |
Net increase (decrease) in net assets resulting from operations | | | 200,035,931 | | | | 205,992,500 | | | | (287,631 | ) | | | 1,363,812 | | | | (31,693,559 | ) | | | 20,545,122 | |
|
DISTRIBUTIONS TO SHAREHOLDERS | |
Class A | | | (19,790,489 | ) | | | (22,723,555 | ) | | | (98,050 | ) | | | (43,240 | ) | | | (963,926 | ) | | | (181,954 | ) |
Class B | | | — | | | | (4,845 | )(a) | | | — | | | | — | | | | — | | | | — | (a) |
Class C | | | (6,104,800 | ) | | | (5,494,616 | ) | | | (87 | ) | | | (425 | ) | | | (403,405 | ) | | | (55,519 | ) |
Class I | | | (132,167,069 | ) | | | (81,753,034 | ) | | | (196,116 | ) | | | (113,498 | ) | | | (4,970,781 | ) | | | (623,093 | ) |
Class R | | | (126,158 | )(b) | | | (189,266 | ) | | | — | | | | (322 | ) | | | — | | | | — | |
Class T(c) | | | — | | | | (186 | ) | | | — | | | | (128 | ) | | | — | | | | — | |
Total distributions | | | (158,188,516 | ) | | | (110,165,502 | )(d) | | | (294,253 | ) | | | (157,613 | )(e) | | | (6,338,112 | ) | | | (860,566 | )(f) |
| | | | | | | |
CAPITAL SHARE TRANSACTIONS | | | 1,958,907,302 | | | | 722,732,603 | | | | 84,875,022 | | | | (6,711,161 | ) | | | 757,759,541 | | | | 348,980,675 | |
TOTAL INCREASE (DECREASE) IN NET ASSETS | | | 2,000,754,717 | | | | 818,559,601 | | | | 84,293,138 | | | | (5,504,962 | ) | | | 719,727,870 | | | | 368,665,231 | |
|
NET ASSETS | |
Beginning of year | | $ | 4,705,086,487 | | | $ | 3,886,526,886 | | | $ | 13,063,373 | | | $ | 18,568,335 | | | $ | 444,628,114 | | | $ | 75,962,883 | |
End of year | | $ | 6,705,841,204 | | | $ | 4,705,086,487 | | | $ | 97,356,511 | | | $ | 13,063,373 | | | $ | 1,164,355,984 | | | $ | 444,628,114 | |
| (a) | Class B shares were converted into Class A shares at the close of business on July 3, 2017. |
| (b) | Class R shares were converted into Class A shares at the close of business on February 22, 2018. |
| (c) | Class T commenced operations on February 28, 2017 and shares were liquidated on October 26, 2017. |
| (d) | Included in total distributions for net investment income and net realized gains, respectively, as of the year ended October 31, 2017 was $(8,322,047) and $(14,401,508) for Class A, $(178) and $(4,667) for Class B, $(790,382) and $(4,704,234) for Class C, $(40,383,844) and $(41,369,190) for Class I, $(61,200) and $(128,066) for Class R, and $(186) and $— for Class T. The undistributed net investment income (loss) was $(2,241,712) as of the year ended October 31, 2017. |
| (e) | Included in total distributions for net investment income and net realized gains, respectively, as of the year ended October 31, 2017 was $(43,240) and $— for Class A, $— and $— for Class B, $(425) and $— for Class C, $(113,498) and $— for Class I, $(322) and $— for Class R, and $(128) and $— for Class T. The undistributed net investment income (loss) was $21,782 as of the year ended October 31, 2017. |
| (f) | Included in total distributions for net investment income and net realized gains, respectively, as of the year ended October 31, 2017 was $— and $(181,954) for Class A, $— and $— for Class B, $— and $(55,519) for Class C, $— and $(623,093) for Class I, $— and $— for Class R, and $— and $— for Class T. The undistributed net investment income (loss) was $284,868 as of the year ended October 31, 2017. |
| | | | | | |
| See accompanying Notes to Financial Statements | | www.calamos.com | | | 155 | |
Statements of Changes in Net Assets
| | | | | | | | | | | | | | | | | | | | | | | | |
| | | CONVERTIBLE FUND | | | GLOBAL CONVERTIBLE FUND | | | GROWTH FUND | |
| | | YEAR ENDED
OCTOBER 31,
2018 | | | YEAR ENDED
OCTOBER 31,
2017 | | | YEAR ENDED
OCTOBER 31,
2018 | | | YEAR ENDED
OCTOBER 31,
2017 | | | YEAR ENDED
OCTOBER 31,
2018 | | | YEAR ENDED
OCTOBER 31,
2017 | |
OPERATIONS | |
Net investment income (loss) | | $ | 15,251,028 | | | $ | 16,917,797 | | | $ | 4,049,578 | | | $ | 2,056,449 | | | $ | (5,683,541 | ) | | $ | (11,734,027 | ) |
Net realized gain (loss) | | | 63,802,671 | | | | 23,515,846 | | | | 4,557,628 | | | | 4,789,067 | | | | 246,806,178 | | | | 284,205,717 | |
Change in unrealized appreciation/(depreciation) | | | (61,042,739 | ) | | | 54,024,384 | | | | (9,247,330 | ) | | | 4,879,632 | | | | (134,210,439 | ) | | | 83,347,904 | |
Net increase (decrease) in net assets resulting from operations | | | 18,010,960 | | | | 94,458,027 | | | | (640,124 | ) | | | 11,725,148 | | | | 106,912,198 | | | | 355,819,594 | |
|
DISTRIBUTIONS TO SHAREHOLDERS | |
Class A | | | (9,096,274 | ) | | | (4,208,641 | ) | | | (486,775 | ) | | | (252,762 | ) | | | (118,711,102 | ) | | | (38,507,349 | ) |
Class B | | | — | | | | (15,118 | )(a) | | | — | | | | — | | | | — | | | | (202,787 | )(a) |
Class C | | | (5,028,361 | ) | | | (2,193,115 | ) | | | (95,051 | ) | | | (18,025 | ) | | | (70,806,265 | ) | | | (28,962,503 | ) |
Class I | | | (11,800,923 | ) | | | (5,189,389 | ) | | | (3,913,214 | ) | | | (834,620 | ) | | | (28,576,842 | ) | | | (9,770,431 | ) |
Class R | | | (52,590 | )(b) | | | (27,025 | ) | | | (245 | )(b) | | | (4,701 | ) | | | (690,251 | )(b) | | | (308,256 | ) |
Class T(c) | | | — | | | | (247 | ) | | | — | | | | (135 | ) | | | — | | | | — | |
Total distributions | | | (25,978,148 | ) | | | (11,633,535 | )(d) | | | (4,495,285 | ) | | | (1,110,243 | )(e) | | | (218,784,460 | ) | | | (77,751,326 | )(f) |
| | | | | | |
CAPITAL SHARE TRANSACTIONS | | | 19,548,691 | | | | (144,483,552 | ) | | | 34,679,408 | | | | 16,514,728 | | | | (97,019,944 | ) | | | (504,896,240 | ) |
TOTAL INCREASE (DECREASE) IN NET ASSETS | | | 11,581,503 | | | | (61,659,060 | ) | | | 29,543,999 | | | | 27,129,633 | | | | (208,892,206 | ) | | | (226,827,972 | ) |
|
NET ASSETS | |
Beginning of year | | $ | 603,959,666 | | | $ | 665,618,726 | | | $ | 106,693,998 | | | $ | 79,564,365 | | | $ | 1,672,427,281 | | | $ | 1,899,255,253 | |
End of year | | $ | 615,541,169 | | | $ | 603,959,666 | | | $ | 136,237,997 | | | $ | 106,693,998 | | | $ | 1,463,535,075 | | | $ | 1,672,427,281 | |
| (a) | Class B shares were converted into Class A shares at the close of business on July 3, 2017. |
| (b) | Class R shares were converted into Class A shares at the close of business on February 22, 2018. |
| (c) | Class T commenced operations on February 28, 2017 and shares were liquidated on October 26, 2017. |
| (d) | Included in total distributions for net investment income and net realized gains, respectively, as of the year ended October 31, 2017 was $(4,208,641) and $— for Class A, $(15,118) and $— for Class B, $(2,193,115) and $— for Class C, $(5,189,389) and $— for Class I, $(27,025) and $— for Class R, and $(247) and $— for Class T. The undistributed net investment income (loss) was $(3,961,053) as of the year ended October 31, 2017. |
| (e) | Included in total distributions for net investment income and net realized gains, respectively, as of the year ended October 31, 2017 was $(252,762) and $— for Class A, $— and $— for Class B, $(18,025) and $— for Class C, $(834,620) and $— for Class I, $(4,701) and $— for Class R, and $(135) and $— for Class T. The undistributed net investment income (loss) was $(34,049) as of the year ended October 31, 2017. |
| (f) | Included in total distributions for net investment income and net realized gains, respectively, as of the year ended October 31, 2017 was $— and $(38,507,349) for Class A, $— and $(202,787) for Class B, $— and $(28,962,503) for Class C, $— and $(9,770,431) for Class I, $— and $(308,256) for Class R, and $— and $— for Class T. The undistributed net investment income (loss) was $(607,467) as of the year ended October 31, 2017. |
| | | | |
| 156 | | CALAMOS OPEN-END FAMILY OF FUNDS ANNUAL REPORT | | See accompanying Notes to Financial Statements |
Statements of Changes in Net Assets
| | | | | | | | | | | | | | | | | | | | | | | | |
| | | GROWTH AND INCOME FUND | | | DIVIDEND GROWTH FUND | | | OPPORTUNISTIC VALUE FUND | |
| | | YEAR ENDED
OCTOBER 31, 2018 | | | YEAR ENDED
OCTOBER 31,
2017 | | | YEAR ENDED
OCTOBER 31,
2018 | | | YEAR ENDED
OCTOBER 31,
2017 | | | YEAR ENDED
OCTOBER 31,
2018 | | | YEAR ENDED
OCTOBER 31,
2017 | |
OPERATIONS | |
Net investment income (loss) | | $ | 13,113,736 | | | $ | 29,767,679 | | | $ | 192,868 | | | $ | 260,519 | | | $ | 359,439 | | | $ | 610,984 | |
Net realized gain (loss) | | | 125,919,453 | | | | 151,411,720 | | | | 1,005,910 | | | | 2,499,431 | | | | 7,267,910 | | | | 3,541,761 | |
Change in unrealized appreciation/(depreciation) | | | (35,656,274 | ) | | | 154,924,702 | | | | 197,081 | | | | 3,602,591 | | | | (5,172,491 | ) | | | 6,612,973 | |
Net increase (decrease) in net assets resulting from operations | | | 103,376,915 | | | | 336,104,101 | | | | 1,395,859 | | | | 6,362,541 | | | | 2,454,858 | | | | 10,765,718 | |
|
DISTRIBUTIONS TO SHAREHOLDERS | |
Class A | | | (61,831,918 | ) | | | (60,595,884 | ) | | | (163,449 | ) | | | (79,969 | ) | | | (737,994 | ) | | | (242,435 | ) |
Class B | | | — | | | | (128,610 | )(a) | | | — | | | | — | | | | — | | | | — | (a) |
Class C | | | (34,200,058 | ) | | | (40,963,374 | ) | | | (79,037 | ) | | | (2,236 | ) | | | (155,577 | ) | | | (3,013 | ) |
Class I | | | (41,414,931 | ) | | | (35,933,951 | ) | | | (1,856,416 | ) | | | (155,496 | ) | | | (917,598 | ) | | | (176,657 | ) |
Class R | | | (687,487 | )(c) | | | (833,217 | ) | | | — | | | | (231 | )(b) | | | (5,402 | )(c) | | | (637 | ) |
Class T(d) | | | — | | | | (348 | ) | | | — | | | | (125 | ) | | | — | | | | — | |
Total distributions | | | (138,134,394 | ) | | | (138,455,384 | )(e) | | | (2,098,902 | ) | | | (238,057 | )(f) | | | (1,816,571 | ) | | | (422,742 | )(g) |
| | | | | | |
CAPITAL SHARE TRANSACTIONS | | | (46,306,586 | ) | | | (338,922,418 | ) | | | (607,473 | ) | | | (13,080,377 | ) | | | (5,531,659 | ) | | | (12,041,288 | ) |
TOTAL INCREASE (DECREASE) IN NET ASSETS | | | (81,064,065 | ) | | | (141,273,701 | ) | | | (1,310,516 | ) | | | (6,955,893 | ) | | | (4,893,372 | ) | | | (1,698,312 | ) |
|
NET ASSETS | |
Beginning of year | | $ | 2,059,512,800 | | | $ | 2,200,786,501 | | | $ | 25,270,552 | | | $ | 32,226,445 | | | $ | 52,452,215 | | | $ | 54,150,527 | |
End of year | | $ | 1,978,448,735 | | | $ | 2,059,512,800 | | | $ | 23,960,036 | | | $ | 25,270,552 | | | $ | 47,558,843 | | | $ | 52,452,215 | |
| (a) | Class B shares were converted into Class A shares at the close of business on July 3, 2017. |
| (b) | Class R shares were liquidated on January 23, 2017. |
| (c) | Class R shares were converted into Class A shares at the close of business on February 22, 2018. |
| (d) | Class T commenced operations on February 28, 2017 and shares were liquidated on October 26, 2017. |
| (e) | Included in total distributions for net investment income and net realized gains, respectively, as of the year ended October 31, 2017 was $(24,704,286) and $(35,891,598) for Class A, $(31,165) and $(97,445) for Class B, $(13,019,794) and $(27,943,580) for Class C, $(15,691,834) and $(20,242,117) for Class I, $(320,852) and $(512,365) for Class R, and $(348) and $— for Class T. The undistributed net investment income (loss) was $(5,247,530) as of the year ended October 31, 2017. |
| (f) | Included in total distributions for net investment income and net realized gains, respectively, as of the year ended October 31, 2017 was $(79,969) and $— for Class A, $— and $— for Class B, $(2,236) and $— for Class C, $(155,496) and $— for Class I, $(231) and $— for Class R, and $(125) and $— for Class T. The undistributed net investment income (loss) was $5,843 as of the year ended October 31, 2017. |
| (g) | Included in total distributions for net investment income and net realized gains, respectively, as of the year ended October 31, 2017 was $(242,435) and $— for Class A, $— and $— for Class B, $(3,013) and $— for Class C, $(176,657) and $— for Class I, $(637) and $— for Class R, and $— and $— for Class T. The undistributed net investment income (loss) was $139,246 as of the year ended October 31, 2017. |
| | | | | | |
| See accompanying Notes to Financial Statements | | www.calamos.com | | | 157 | |
Statements of Changes in Net Assets
| | | | | | | | | | | | | | | | | | | | | | | | |
| | | INTERNATIONAL GROWTH FUND | | | EVOLVING WORLD GROWTH FUND | | | EMERGING MARKET EQUITY FUND | |
| | | YEAR ENDED
OCTOBER 31,
2018(a) | | | YEAR ENDED
OCTOBER 31,
2017 | | | YEAR ENDED
OCTOBER 31,
2018 | | | YEAR ENDED
OCTOBER 31,
2017 | | | YEAR ENDED
OCTOBER 31,
2018 | | | YEAR ENDED
OCTOBER 31,
2017 | |
OPERATIONS | |
Net investment income (loss) | | $ | 2,204,265 | | | $ | 1,434,072 | | | $ | 29,128 | | | $ | 1,850,583 | | | $ | 27,211 | | | $ | 29,239 | |
Net realized gain (loss) | | | 26,684,732 | | | | 26,314,392 | | | | 33,416,762 | | | | 7,440,607 | | | | 231,800 | | | | 118,973 | |
Change in unrealized appreciation/(depreciation) | | | (63,063,179 | ) | | | 43,017,368 | | | | (69,667,885 | ) | | | 51,679,465 | | | | (3,688,532 | ) | | | 3,167,683 | |
Net increase (decrease) in net assets resulting from operations | | | (34,174,182 | ) | | | 70,765,832 | | | | (36,221,995 | ) | | | 60,970,655 | | | | (3,429,521 | ) | | | 3,315,895 | |
|
DISTRIBUTIONS TO SHAREHOLDERS | |
Class A | | | (4,300,922 | ) | | | — | | | | (8,575 | ) | | | — | | | | (9,319 | ) | | | — | |
Class C | | | (1,129,875 | ) | | | — | | | | — | | | | — | | | | — | | | | — | |
Class I | | | (6,458,775 | ) | | | — | | | | (954,899 | ) | | | — | | | | (45,343 | ) | | | — | |
Class R | | | (267,543 | )(b) | | | — | | | | — | (b) | | | — | | | | — | | | | — | |
Total distributions | | | (12,157,115 | ) | | | — | (c) | | | (963,474 | ) | | | — | (d) | | | (54,662 | ) | | | — | (e) |
| | | | | | | |
Return of capital | | | | | | | | | | | | | | | | | | | | | | | | |
Class A | | | — | | | | — | | | | (1 | ) | | | — | | | | (1 | ) | | | — | |
Class I | | | — | | | | — | | | | (109 | ) | | | — | | | | (7 | ) | | | — | |
Total return of capital | | | — | | | | — | | | | (110 | ) | | | — | | | | (8 | ) | | | — | |
| | | | | | |
CAPITAL SHARE TRANSACTIONS | | | (2,477,933 | ) | | | (154,256,115 | ) | | | (79,460,414 | ) | | | (132,140,928 | ) | | | 399,376 | | | | (119,656 | ) |
TOTAL INCREASE (DECREASE) IN NET ASSETS | | | (48,809,230 | ) | | | (83,490,283 | ) | | | (116,645,993 | ) | | | (71,170,273 | ) | | | (3,084,815 | ) | | | 3,196,239 | |
|
NET ASSETS | |
Beginning of year | | $ | 282,159,300 | | | $ | 365,649,583 | | | $ | 321,177,198 | | | $ | 392,347,471 | | | $ | 17,084,240 | | | $ | 13,888,001 | |
End of year | | $ | 233,350,070 | | | $ | 282,159,300 | | | $ | 204,531,205 | | | $ | 321,177,198 | | | $ | 13,999,425 | | | $ | 17,084,240 | |
| (a) | International Growth Fund Class R6 commenced operations on September 17, 2018. |
| (b) | Class R shares were converted into Class A shares at the close of business on February 22, 2018. |
| (c) | Included in total distributions for net investment income and net realized gains, respectively, as of the year ended October 31, 2017 was $— and $— for Class A, $— and $— for Class B, $— and $— for Class C, $— and $— for Class I, $— and $— for Class R, and $— and $— for Class T. The undistributed net investment income (loss) was $116,038 as of the year ended October 31, 2017. |
| (d) | Included in total distributions for net investment income and net realized gains, respectively, as of the year ended October 31, 2017 was $— and $— for Class A, $— and $— for Class B, $— and $— for Class C, $— and $— for Class I, $— and $— for Class R, and $— and $— for Class T. The undistributed net investment income (loss) was $281,214 as of the year ended October 31, 2017. |
| (e) | Included in total distributions for net investment income and net realized gains, respectively, as of the year ended October 31, 2017 was $— and $— for Class A, $— and $— for Class B, $— and $— for Class C, $— and $— for Class I, $— and $— for Class R, and $— and $— for Class T. The undistributed net investment income (loss) was $4,877 as of the year ended October 31, 2017. |
| | | | |
| 158 | | CALAMOS OPEN-END FAMILY OF FUNDS ANNUAL REPORT | | See accompanying Notes to Financial Statements |
Statements of Changes in Net Assets
| | | | | | | | | | | | | | | | | | | | | | | | |
| | | GLOBAL EQUITY FUND | | | GLOBAL GROWTH AND INCOME FUND | | | TOTAL RETURN BOND FUND | |
| | | YEAR ENDED
OCTOBER 31,
2018 | | | YEAR ENDED
OCTOBER 31,
2017 | | | YEAR ENDED
OCTOBER 31,
2018 | | | YEAR ENDED
OCTOBER 31,
2017 | | | YEAR ENDED
OCTOBER 31,
2018 | | | YEAR ENDED
OCTOBER 31,
2017 | |
OPERATIONS | |
Net investment income (loss) | | $ | 22,110 | | | $ | 61,317 | | | $ | 1,739,689 | | | $ | 2,379,096 | | | $ | 1,640,128 | | | $ | 1,715,310 | |
Net realized gain (loss) | | | 22,866,735 | | | | 13,692,064 | | | | 18,995,830 | | | | 11,646,069 | | | | (587,926 | ) | | | 728,527 | |
Change in unrealized appreciation/(depreciation) | | | (24,904,595 | ) | | | 17,340,054 | | | | (25,939,489 | ) | | | 21,181,925 | | | | (2,567,811 | ) | | | (1,965,302 | ) |
Net increase (decrease) in net assets resulting from operations | | | (2,015,750 | ) | | | 31,093,435 | | | | (5,203,970 | ) | | | 35,207,090 | | | | (1,515,609 | ) | | | 478,535 | |
|
DISTRIBUTIONS TO SHAREHOLDERS | |
Class A | | | (2,369,038 | ) | | | (1,256,480 | ) | | | (4,633,084 | ) | | | (587,603 | ) | | | (628,147 | ) | | | (952,087 | ) |
Class B | | | — | | | | (6,812 | )(a) | | | — | | | | (3,262 | )(a) | | | — | | | | (3,929 | )(a) |
Class C | | | (1,306,602 | ) | | | (732,328 | ) | | | (4,392,776 | ) | | | (631,481 | ) | | | (192,264 | ) | | | (208,350 | ) |
Class I | | | (7,611,885 | ) | | | (3,617,965 | ) | | | (4,640,349 | ) | | | (1,258,741 | ) | | | (1,298,630 | ) | | | (768,586 | ) |
Class R | | | (472,463 | )(b) | | | (195,399 | ) | | | (74,198 | )(b) | | | (8,328 | ) | | | (5,977 | )(b) | | | (7,703 | ) |
Class T(c) | | | — | | | | — | | | | — | | | | (19 | ) | | | — | | | | (338 | ) |
Total distributions | | | (11,759,988 | ) | | | (5,808,984 | )(d) | | | (13,740,407 | ) | | | (2,489,434 | )(e) | | | (2,125,018 | ) | | | (1,940,993 | )(f) |
| | | | | | |
Return of capital | | | | | | | | | | | | | | | | | | | | | | | | |
Class A | | | — | | | | — | | | | — | | | | — | | | | (52,753 | ) | | | — | |
Class C | | | — | | | | — | | | | — | | | | — | | | | (15,293 | ) | | | — | |
Class I | | | — | | | | — | | | | — | | | | — | | | | (111,460 | ) | | | — | |
Class R | | | — | | | | — | | | | — | | | | — | | | | (414 | ) | | | — | |
Total return of capital | | | — | | | | — | | | | — | | | | — | | | | (179,920 | ) | | | — | |
| | | | | | |
CAPITAL SHARE TRANSACTIONS | | | (22,045,459 | ) | | | (30,788,750 | ) | | | (13,750,518 | ) | | | (110,935,787 | ) | | | (11,492,890 | ) | | | (23,691,788 | ) |
TOTAL INCREASE (DECREASE) IN NET ASSETS | | | (35,821,197 | ) | | | (5,504,299 | ) | | | (32,694,895 | ) | | | (78,218,131 | ) | | | (15,313,437 | ) | | | (25,154,246 | ) |
|
NET ASSETS | |
Beginning of year | | $ | 132,274,787 | | | $ | 137,779,086 | | | $ | 223,031,423 | | | $ | 301,249,554 | | | $ | 71,722,823 | | | $ | 96,877,069 | |
End of year | | $ | 96,453,590 | | | $ | 132,274,787 | | | $ | 190,336,528 | | | $ | 223,031,423 | | | $ | 56,409,386 | | | $ | 71,722,823 | |
| (a) | Class B shares were converted into Class A shares at the close of business on July 3, 2017. |
| (b) | Class R shares were converted into Class A shares at the close of business on February 22, 2018. |
| (c) | Class T commenced operations on February 28, 2017 and shares were liquidated on October 26, 2017. |
| (d) | Included in total distributions for net investment income and net realized gains, respectively, as of the year ended October 31, 2017 was $— and $(1,256,480) for Class A, $— and $(6,812) for Class B, $— and $(732,328) for Class C, $— and $(3,617,965) for Class I, $— and $(195,399) for Class R, and $— and $— for Class T. The undistributed net investment income (loss) was $61,718 as of the year ended October 31, 2017. |
| (e) | Included in total distributions for net investment income and net realized gains, respectively, as of the year ended October 31, 2017 was $(62,313) and $(525,290) for Class A, $— and $(3,262) for Class B, $— and $(631,481) for Class C, $(490,123) and $(768,618) for Class I, $(201) and $(8,127) for Class R, and $(19) and $— for Class T. The undistributed net investment income (loss) was $(321,787) as of the year ended October 31, 2017. |
| (f) | Included in total distributions for net investment income and net realized gains, respectively, as of the year ended October 31, 2017 was $(905,067) and $(47,020) for Class A, $(3,434) and $(495) for Class B, $(195,065) and $(13,285) for Class C, $(750,341) and $(18,245) for Class I, $(7,392) and $(311) for Class R, and $(338) and $— for Class T. The undistributed net investment income (loss) was $6,037 as of the year ended October 31, 2017. |
| | | | | | |
| See accompanying Notes to Financial Statements | | www.calamos.com | | | 159 | |
Statements of Changes in Net Assets
| | | | | | | | | | | | |
| | | HIGH INCOME OPPORTUNITIES FUND | | | SHORT-TERM BOND FUND | |
| | | YEAR ENDED
OCTOBER 31,
2018 | | | YEAR ENDED
OCTOBER 31,
2017 | | | PERIOD ENDED
OCTOBER 31,
2018(a) | |
OPERATIONS | |
Net investment income (loss) | | $ | 2,881,984 | | | $ | 2,830,872 | | | $ | 54,729 | |
Net realized gain (loss) | | | (547,859 | ) | | | 298,201 | | | | 356 | |
Change in unrealized appreciation/(depreciation) | | | (2,172,841 | ) | | | 1,517,692 | | | | (37,044 | ) |
Net increase (decrease) in net assets resulting from operations | | | 161,284 | | | | 4,646,765 | | | | 18,041 | |
|
DISTRIBUTIONS TO SHAREHOLDERS | |
Class A | | | (2,078,697 | ) | | | (1,791,822 | ) | | | (81 | ) |
Class B | | | — | | | | (3,444 | )(b) | | | — | |
Class C | | | (565,261 | ) | | | (562,447 | ) | | | — | |
Class I | | | (537,734 | ) | | | (487,920 | ) | | | (54,089 | ) |
Class R | | | (1,704 | )(c) | | | (7,164 | ) | | | — | |
Class T | | | — | | | | (702 | )(d) | | | — | |
Total distributions | | | (3,183,396 | ) | | | (2,853,499 | ) | | | (54,170 | ) |
| | | |
CAPITAL SHARE TRANSACTIONS | | | (7,003,095 | ) | | | (16,247,787 | )(e) | | | 15,179,104 | |
TOTAL INCREASE (DECREASE) IN NET ASSETS | | | (10,025,207 | ) | | | (14,454,521 | ) | | | 15,142,975 | |
|
NET ASSETS | |
Beginning of year | | $ | 59,785,343 | | | $ | 74,239,864 | | | $ | — | |
End of year | | $ | 49,760,136 | | | $ | 59,785,343 | | | $ | 15,142,975 | |
| (a) | Short-Term Bond Fund commenced operations on September 19, 2018. |
| (b) | Class B shares were converted into Class A shares at the close of business on July 3, 2017. |
| (c) | Class R shares were converted into Class A shares at the close of business on February 22, 2018. |
| (d) | Class T commenced operations on February 28, 2017 and shares were liquidated on October 26, 2017. |
| (e) | Included in total distributions for net investment income and net realized gains, respectively, as of the year ended October 31, 2017 was $(1,791,822) and $— for Class A, $(3,444) and $— for Class B, $(562,447) and $— for Class C, $(487,920) and $— for Class I, $(7,164) and $— for Class R, and $(702) and $— for Class T. The undistributed net investment income (loss) was $27,892 as of the year ended October 31, 2017. |
| | | | |
| 160 | | CALAMOS OPEN-END FAMILY OF FUNDS ANNUAL REPORT | | See accompanying Notes to Financial Statements |
Notes to Financial Statements
Note 1 ��� Organization and Significant Accounting Policies
Organization. CALAMOS INVESTMENT TRUST, a Massachusetts business trust organized December 21, 1987 (the “Trust”), consists of seventeen series, Market Neutral Income Fund, Hedged Equity Income Fund, Phineus Long/Short Fund, Convertible Fund, Global Convertible Fund, Growth Fund, Growth and Income Fund, Dividend Growth Fund, Opportunistic Value Fund, International Growth Fund, Evolving World Growth Fund, Emerging Market Equity Fund, Global Equity Fund, Global Growth and Income Fund, Total Return Bond Fund, High Income Opportunities Fund, and Short-Term Bond Fund (commenced operations on September 19, 2018), (each a “Fund” and collectively the “Funds”). The Trust is registered under the Investment Company Act of 1940 as amended (the “1940 Act”) as an open-end management investment company. The Trust currently offers Class A, Class C, and Class I shares of each of the Funds. Class R6 shares are offered in International Growth Fund only.
Significant Accounting Policies. The financial statements have been prepared in conformity with accounting principles generally accepted in the United States of America (U.S. GAAP), and the Funds’ are each considered an investment company under U.S. GAAP and follow the accounting and reporting guidance applicable to investment companies. The Funds adhere to the accounting and reporting requirements set forth in ASU 2013-08 and ASC 946. Under U.S. GAAP, management is required to make certain estimates and assumptions at the date of the financial statements and actual results may differ from those estimates. Subsequent events, if any, through the date that the financial statements were issued, have been evaluated in the preparation of the financial statements. The following summarizes the significant accounting policies of the Fund:
Fund Valuation. The valuation of the Funds’ investments is in accordance with policies and procedures adopted by and under the ultimate supervision of the board of trustees.
Fund securities that are traded on U.S. securities exchanges, except option securities, are valued at the official closing price, which is the last current reported sales price on its principal exchange at the time each Fund determines its net asset value (“NAV”). Securities traded in the over-the-counter market and quoted on The NASDAQ Stock Market are valued at the NASDAQ Official Closing Price, as determined by NASDAQ, or lacking a NASDAQ Official Closing Price, the last current reported sale price on NASDAQ at the time a Fund determines its NAV. When a last sale or closing price is not available, equity securities, other than option securities, that are traded on a U.S. securities exchange and other equity securities traded in the over-the-counter market are valued at the mean between the most recent bid and asked quotations on its principal exchange in accordance with guidelines adopted by the board of trustees. Each option security traded on a U.S. securities exchange is valued at the mid-point of the consolidated bid/ask quote for the option security, also in accordance with guidelines adopted by the board of trustees. Each over-the-counter option that is not traded through the Options Clearing Corporation is valued either by an independent pricing agent or based on a quotation provided by the counterparty to such option under the ultimate supervision of the board of trustees.
Fixed income securities, certain convertible preferred securities, and non-exchange traded derivatives are normally valued by independent pricing services or by dealers or brokers who make markets in such securities. Valuations of such fixed income securities, certain convertible preferred securities and non-exchange traded derivatives consider yield or price of equivalent securities of comparable quality, coupon rate, maturity, type of issue, trading characteristics and other market data and do not rely exclusively upon exchange or over-the-counter prices.
Trading on European and Far Eastern exchanges and over-the-counter markets is typically completed at various times before the close of business on each day on which the New York Stock Exchange (“NYSE”) is open. Each security trading on these exchanges or in over-the-counter markets may be valued utilizing a systematic fair valuation model provided by an independent pricing service approved by the board of trustees. The valuation of each security that meets certain criteria in relation to the valuation model is systematically adjusted to reflect the impact of movement in the U.S. market after the foreign markets close. Securities that do not meet the criteria, or that are principally traded in other foreign markets, are valued as of the last reported sale price at the time the respective Fund determines its NAV, or when reliable market prices or quotations are not readily available, at the mean between the most recent bid and asked quotations as of the close of the appropriate exchange or other designated time. Trading of foreign securities may not take place on every NYSE business day. In addition, trading may take place in various foreign markets on Saturdays or on other days when the NYSE is not open and on which the respective Fund’s NAV is not calculated.
If the pricing committee determines that the valuation of a security in accordance with the methods described above is not reflective of a fair value for such security, the security is valued at a fair value by the pricing committee, under the ultimate supervision of the board of trustees, following the guidelines and/or procedures adopted by the board of trustees.
Notes to Financial Statements
Each Fund also may use fair value pricing, pursuant to guidelines adopted by the board of trustees and under the ultimate supervision of the board of trustees, if trading in the security is halted or if the value of a security it holds is materially affected by events occurring before the Fund’s pricing time but after the close of the primary market or exchange on which the security is listed. Those procedures may utilize valuations furnished by pricing services approved by the board of trustees, which may be based on market transactions for comparable securities and various relationships between securities that are generally recognized by institutional traders, a computerized matrix system, or appraisals derived from information concerning the securities or similar securities received from recognized dealers in those securities.
When fair value pricing of securities is employed, the prices of securities used by the Fund to calculate its NAV may differ from market quotations or official closing prices. In light of the judgment involved in fair valuations, there can be no assurance that a fair value assigned to a particular security is accurate.
Investment Transactions. Investment transactions are recorded on a trade date basis as of October 31, 2018. Net realized gains and losses from investment transactions are reported on an identified cost basis. Interest income is recognized using the accrual method and includes accretion of original issue and market discount and amortization of premium. Dividend income is recognized on the ex-dividend date, except that certain dividends from foreign securities are recorded as soon as the information becomes available after the ex-dividend date.
Foreign Currency Translation. Values of investments and other assets and liabilities denominated in foreign currencies are translated into U.S. dollars using a rate quoted by a major bank or dealer in the particular currency market, as reported by a recognized quotation dissemination service.
The Funds do not isolate that portion of the results of operations resulting from changes in foreign exchange rates on investments from the fluctuations arising from changes in market prices of securities held. Such fluctuations are included with the net realized and unrealized gain or loss from investments.
Reported net realized foreign currency gains or losses arise from disposition of foreign currency, the difference in the foreign exchange rates between the trade and settlement dates on securities transactions, and the difference between the amounts of dividends, interest and foreign withholding taxes recorded on the ex-date or accrual date and the U.S. dollar equivalent of the amounts actually received or paid. Net unrealized foreign exchange gains and losses arise from changes (due to the changes in the exchange rate) in the value of foreign currency and other assets and liabilities denominated in foreign currencies held at period end.
Allocation of Expenses Among Funds and Classes. Expenses directly attributable to a Fund are charged to that Fund; certain other common expenses of the Trust, Calamos Advisors Trust, Calamos Convertible Opportunities and Income Fund, Calamos Convertible and High Income Fund, Calamos Strategic Total Return Fund, Calamos Global Total Return Fund, Calamos Global Dynamic Income Fund and Calamos Dynamic Convertible and Income Fund are allocated proportionately among each Fund to which the expenses relate in relation to the net assets of each Fund or on another reasonable basis. Expenses directly attributable to a particular class of a fund in the Trust are charged directly to such class. In calculating the net asset value per share of each class, investment income, realized and unrealized gains and losses and expenses other than class specific expenses are allocated daily to each class of shares based upon the proportion of net assets of each class at the beginning of each day plus current day fund share activity.
Income Taxes. No provision has been made for U.S. income taxes because the Trust’s policy is to continue to qualify as a regulated investment company under the Internal Revenue Code of 1986, as amended, and distribute to shareholders substantially all of the Funds’ taxable income and net realized gains.
Dividends and distributions paid to shareholders are recorded on the ex-dividend date. The amount of dividends and distributions from net investment income and net realized capital gains is determined in accordance with federal income tax regulations, which may differ from U.S. generally accepted accounting principles. To the extent these “book/tax” differences are permanent in nature, such amounts are reclassified within the capital accounts based on their federal tax-basis treatment. These differences are primarily due to differing treatments for foreign currency transactions, contingent payment debt instruments and methods of amortizing and accreting for fixed income securities. The financial statements are not adjusted for temporary differences.
The Fund recognized no liability for uncertain tax positions. A reconciliation is not provided as the beginning and ending amounts of unrecognized benefits are zero, with no interim additions, reductions or settlements. Tax years 2014—2017 remain subject to
| | | | |
| 162 | | CALAMOS OPEN-END FAMILY OF FUNDS ANNUAL REPORT | | |
Notes to Financial Statements
examination by the U.S. and the State of Illinois tax jurisdictions for those Funds that have been in existence during that time, and for all years since inception for those Funds created subsequent to October 31, 2013.
Indemnifications. Under the Trust’s organizational documents, the Trust is obligated to indemnify its officers and trustees against certain liabilities incurred by them by reason of having been an officer or trustee of the Trust. In addition, in the normal course of business, the Trust may enter into contracts that provide general indemnifications to other parties. Each Fund’s maximum exposure under these arrangements is unknown as this would involve future claims that may be made against the Fund that have not yet occurred. Currently, the Funds’ management expects the risk of material loss in connection to a potential claim to be remote.
Note 2 – Investment Adviser and Transactions With Affiliates Or Certain Other Parties
Pursuant to an investment advisory agreement with Calamos Advisors LLC (“Calamos Advisors”), each Fund pays a monthly investment advisory fee based on the average daily net assets of the Fund, as shown below:
| | | | | | | | | | | | | | | | |
| AVERAGE DAILY NET ASSETS | | GROWTH FUND
ANNUAL RATE | | | EVOLVING WORLD
GROWTH FUND,
EMERGING MARKET
EQUITY FUND
ANNUAL RATE | | | TOTAL RETURN
BOND FUND
ANNUAL RATE | | | OPPORTUNISTIC VALUE FUND,
DIVIDEND GROWTH FUND,
INTERNATIONAL GROWTH FUND*,
GLOBAL EQUITY FUND*, GLOBAL GROWTH AND INCOME FUND
ANNUAL RATE | |
| First $500 million | | | 1.00% | | | | 1.10% | | | | 0.45% | | | | 1.00% | |
| | | | |
| Next $500 million | | | 0.90% | | | | 1.05% | | | | 0.43% | | | | 0.95% | |
| | | | |
| Next $5 billion | | | 0.80% | | | | 1.00% | | | | 0.41% | | | | 0.90% | |
| | | | |
| Over $6 billion | | | 0.70% | | | | 0.90% | | | | 0.35% | | | | 0.80% | |
| | | | |
| * | International Growth Fund and Global Equity Fund are subject to a possible adjustment based on performance as described below. |
| | | | | | | | | | | | | | | | | | | | |
| AVERAGE DAILY NET ASSETS | | GLOBAL CONVERTIBLE
FUND
ANNUAL RATE | | | SHORT-TERM
BOND FUND
ANNUAL RATE | | | GROWTH AND INCOME FUND,
CONVERTIBLE FUND, MARKET NEUTRAL INCOME FUND,
HEDGED EQUITY INCOME FUND
ANNUAL RATE | | | HIGH INCOME
OPPORTUNITIES
FUND ANNUAL RATE | | | PHINEUS
LONG/SHORT FUND
ANNUAL RATE | |
| First $500 million | | | 0.85% | | | | 0.30% | | | | 0.75% | | | | 0.60% | | | | 1.25% | |
| | | | |
| Next $500 million | | | 0.80% | | | | 0.27% | | | | 0.70% | | | | 0.55% | | | | 1.20% | |
| | | | |
| Over $1 billion | | | 0.75% | | | | 0.25% | | | | 0.65% | | | | 0.50% | | | | 1.15% | |
| | | | |
The average investment advisory fee as of the year or period ended October 31, 2018 was as follows:
| | | | |
| FUND | | PERCENTAGE | |
| Market Neutral Income Fund | | | 0.66 | % |
| Hedged Equity Income Fund | | | 0.75 | |
| Phineus Long/Short Fund | | | 1.22 | |
| Convertible Fund | | | 0.74 | |
| Global Convertible Fund | | | 0.85 | |
| Growth Fund | | | 0.89 | |
| Growth and Income Fund | | | 0.69 | |
| Dividend Growth Fund | | | 1.00 | |
| Opportunistic Value Fund | | | 1.00 | |
| International Growth Fund | | | 1.01 | |
| Evolving World Growth Fund | | | 1.10 | |
| Emerging Market Equity Fund | | | 1.10 | |
| Global Equity Fund | | | 1.01 | |
| Global Growth and Income Fund | | | 1.00 | |
| Total Return Bond Fund | | | 0.45 | |
| High Income Opportunities Fund | | | 0.60 | |
| Short-Term Bond Fund | | | 0.30 | * |
Notes to Financial Statements
Each of the International Growth and Global Equity Funds pays a fee based on average daily net assets of the Fund that is accrued daily and paid on a monthly basis, subject to possible adjustment based on the Fund’s investment performance (since March 2006 for International Growth Fund and since February 2008 for Global Equity Fund). The performance adjustment increases or decreases the management fee, on a monthly basis, by 1/12 of 0.03% of a Fund’s average daily net assets over the performance period for each full 1% increment amount by which a Fund outperforms or underperforms the benchmark index (“Index”), on an annualized basis, over the performance measurement period. The benchmark indexes are the MSCI EAFE Growth Index and the MSCI World Index for the International Growth Fund and Global Equity Fund, respectively.
The base fee is shown in the table above. The performance adjustment rate is calculated by comparing over the performance measurement period the Fund’s Class A share performance to that of the respective Index. The performance measurement period commenced at the beginning of each Fund’s first full month of operation (April 2005 and March 2007 for the International Growth Fund and Global Equity Fund, respectively). The first performance adjustment was applied to the advisory fee at the end of the twelfth month. Each month subsequent to the twelfth month, a new month is added to the performance measurement period until the performance measurement period includes 36 months. Thereafter, the performance measurement period consists of the most recent month plus the previous 35 months.
The performance comparison is made at the end of each month. The maximum annualized performance adjustment rate is +/- 0.30% of the Fund’s average daily net assets over the performance measurement period. The performance adjustment rate is divided by twelve and multiplied by the Fund’s average daily net assets over the performance measurement period, and the resulting dollar amount is then added to or subtracted from the base fee. Calamos Advisors may receive a positive performance adjustment even if the Fund has a negative return over a performance measurement period if it otherwise outperforms the Index during that period.
Pursuant to a financial accounting services agreement, during the year the Funds paid Calamos Advisors a fee for financial accounting services payable monthly at the annual rate of 0.0175% on the first $1 billion of combined assets, 0.0150% on the next $1 billion of combined assets and 0.0110% on combined assets above $2 billion (for purposes of this calculation “combined assets” means the sum of the total average daily net assets of Calamos Investment Trust and Calamos Advisors Trust and the total average weekly managed assets of Calamos Convertible and High Income Fund, Calamos Strategic Total Return Fund, Calamos Convertible Opportunities and Income Fund, Calamos Global Total Return Fund, Calamos Global Dynamic Income Fund and Calamos Dynamic Convertible and Income Fund). Financial accounting services include, but are not limited to, the following: managing expenses and expense payment processing; monitoring the calculation of expense accrual amounts; calculating, tracking and reporting tax adjustments on all assets; and monitoring trustee deferred compensation plan accruals and valuations. The Funds pay their pro rata share of the financial accounting services fee payable to Calamos Advisors based on their relative portion of combined assets used in calculating the fee. On October 12, 2018, the Board of Trustees approved terminating the financial accounting services agreement between the Funds and Calamos Advisors effective November 1, 2018. Effective November 1, 2018, the Funds entered into an agreement with Ernst & Young LLP (“EY”) to provide certain tax services to the Funds. The tax services include the following: calculating, tracking and reporting tax adjustments on all assets of each Fund, including but not limited to contingent debt and preferred trust obligations; preparing excise tax and fiscal year distribution schedules; preparing tax information required for financial statement footnotes; preparing state and federal income tax returns; preparing specialized calculations of amortization on convertible securities; preparing year-end dividend disclosure information; providing treaty-based foreign withholding tax reclaim services; providing certain global compliance and reporting services; providing a match service and analysis of the “passive foreign investment company status of foreign corporate entities; and providing services related to corporate actions that may or may not have a tax impact on the Funds’ holdings. Effective November 1, 2018, the Funds entered into an agreement with State Street pursuant to which State Street provides certain administration treasury services to the Funds. These services include: monitoring the calculation of expense accrual amounts for each Fund and making any necessary modifications; managing the Fund’s expenses and expense payment processing; coordinating any expense reimbursement calculations and payment; calculating net investment income dividends and capital gain distributions; coordinating the audits for each Fund; preparing financial reporting statements for each Fund; preparing certain regulatory filings; and calculating asset coverage tests for certain Calamos Funds.
The Funds reimburses Calamos Advisors for a portion of compensation paid to the Trust’s Chief Compliance Officer. This compensation is reported as part of the “Trustees’ fees and officer compensation” expense on the Statements of Operations.
| | | | |
| 164 | | CALAMOS OPEN-END FAMILY OF FUNDS ANNUAL REPORT | | |
Notes to Financial Statements
Calamos Advisors has contractually agreed to limit the annual ordinary operating expenses of each Fund as a percentage of the average daily net assets as follows:
| | | | | | | | | | | | | | | | |
| Fund | | CLASS A
SHARES | | | CLASS C
SHARES | | | CLASS I
SHARES | | | CLASS R6
SHARES | |
| Market Neutral Income Fund | | | 1.75% | | | | 2.50% | | | | 1.50% | | | | — | |
| Hedged Equity Income Fund | | | 1.25% | | | | 2.00% | | | | 1.00% | | | | — | |
| Phineus Long/Short Fund | | | 2.00% | | | | 2.75% | | | | 1.75% | | | | — | |
| Convertible Fund | | | 1.75% | | | | 2.50% | | | | 1.50% | | | | — | |
| Global Convertible Fund | | | 1.35% | | | | 2.10% | | | | 1.10% | | | | — | |
| Growth Fund | | | 1.75% | | | | 2.50% | | | | 1.50% | | | | — | |
| Growth and Income Fund | | | 1.75% | | | | 2.50% | | | | 1.50% | | | | — | |
| Dividend Growth Fund | | | 1.35% | | | | 2.10% | | | | 1.10% | | | | — | |
| Opportunistic Value Fund | | | 1.15% | | | | 1.90% | | | | 0.90% | | | | — | |
| International Growth Fund | | | 1.10% | | | | 1.85% | | | | 0.85% | | |
| 0.85% less
the annual
sub-transfer
agency
ratio |
* |
| Evolving World Growth Fund | | | 1.75% | | | | 2.50% | | | | 1.50% | | | | — | |
| Emerging Market Equity Fund | | | 1.75% | | | | 2.50% | | | | 1.50% | | | | — | |
| Global Equity Fund | | | 1.40% | | | | 2.15% | | | | 1.15% | | | | — | |
| Global Growth and Income Fund | | | 1.75% | | | | 2.50% | | | | 1.50% | | | | — | |
| Total Return Bond Fund | | | 0.90% | | | | 1.65% | | | | 0.65% | | | | — | |
| High Income Opportunities Fund | | | 1.00% | | | | 1.75% | | | | 0.75% | | | | — | |
| Short-Term Bond Fund | | | 0.65% | | | | — | | | | 0.40% | | | | — | |
| * | The annual sub-transfer agency ratio is equal to the aggregate sub-transfer agency expenses common to the other share classes of the Fund divided by the aggregated average annual net assets of the Fund’s other share classes. |
These agreements are binding on Calamos Advisors through March 1, 2022.
For the year or period ended October 31, 2018, Calamos Advisors waived or absorbed the following expenses:
| | | | |
| FUND | | AMOUNT | |
| Hedged Equity Income Fund | | $ | 119,218 | |
| Global Convertible Fund | | | 6,281 | |
| Dividend Growth Fund | | | 127,483 | |
| Opportunistic Value Fund | | | 233,598 | |
| International Growth Fund | | | 598,153 | |
| Emerging Market Equity Fund | | | 91,696 | |
| Global Equity Fund | | | 187,877 | |
| Total Return Bond Fund | | | 95,007 | |
| High Income Opportunities Fund | | | 251,715 | |
| Short-Term Bond Fund | | | 30,444 | |
These amounts are included in the Statements of Operations under the caption “Expense reductions”.
As Distributor, Calamos Financial Services LLC (“CFS”) assumed all expenses of personnel, office space, office facilities and equipment incidental to such service. Each Fund has adopted a Distribution Plan pursuant to Rule 12b-1 under the 1940 Act whereby the Fund pays to CFS a distribution and/or service fee at the annual rate of 0.25% of the average daily net assets of the Fund’s Class A shares; a service fee at the annual rate of 0.25% and a distribution fee at the rate of 0.75% of the average daily net assets of the Fund’s Class B and Class C shares; a service fee at the annual rate of 0.25% and a distribution fee of 0.25% of the average daily net assets of the Fund’s Class R shares. No such fees are paid on each Fund’s Class I or Class R6 shares.
Notes to Financial Statements
CFS also receives a sales commission and/or an underwriting fee on certain sales of each Fund’s Class A shares. During the year or period ended October 31, 2018, CFS received commissions and underwriting fees as follows:
| | | | |
| FUND | | AMOUNT | |
| Market Neutral Income Fund | | $ | 34,016 | |
| Hedged Equity Income Fund | | | 2,382 | |
| Phineus Long/Short Fund | | | 139,413 | |
| Convertible Fund | | | 10,996 | |
| Global Convertible Fund | | | 880 | |
| Growth Fund | | | 40,057 | |
| Growth and Income Fund | | | 84,218 | |
| Dividend Growth Fund | | | 446 | |
| Opportunistic Value Fund | | | 1,548 | |
| International Growth Fund | | | 11,862 | |
| Evolving World Growth Fund | | | 12,506 | |
| Emerging Market Equity Fund | | | 62 | |
| Global Equity Fund | | | 3,988 | |
| Global Growth and Income Fund | | | 6,112 | |
| Total Return Bond Fund | | | 78 | |
| High Income Opportunities Fund | | | 616 | |
| Short-Term Bond Fund | | | — | |
A trustee and certain officers of the Trust are also officers and directors of CFS and Calamos Advisors. Such trustee and officers serve without direct compensation from the Trust. The Trust’s Statement of Additional Information contains additional information about the Trust’s Trustees and Officers and is available without charge, upon request, at www.calamos.com or by calling 800.582.6959.
As of October 31, 2018, certain affiliates of Calamos Advisors hold material investments in the Funds as follows:
| | | | |
| FUND | | PERCENTAGE | |
| Hedged Equity Income Fund | | | 33 | % |
| Opportunistic Value Fund | | | 40 | |
| Emerging Market Equity Fund | | | 88 | |
The Trust has adopted a deferred compensation plan (the “Plan”). Under the Plan, a trustee who is not an “interested person” (as defined in the 1940 Act) and has elected to participate in the Plan (a “participating trustee”) may defer receipt of all or a portion of his compensation from the Trust. The deferred compensation payable to the participating trustee is credited to the trustee’s deferral account as of the business day such compensation would have been paid to the participating trustee. The value of amounts deferred for a participating trustee is determined by reference to the change in value of Class I shares of one or more funds of the Trust designated by the participant. The value of the account increases with contributions to the account or with increases in the value of the measuring shares, and the value of the account decreases with withdrawals from the account or with declines in the value of the measuring shares.
| | | | |
| 166 | | CALAMOS OPEN-END FAMILY OF FUNDS ANNUAL REPORT | | |
Notes to Financial Statements
At October 31, 2018, the Funds had deferred compensation balances, which are included in “Other assets” on the Statements of Assets and Liabilities, as follows:
| | | | |
| FUND | | AMOUNT | |
| Market Neutral Income Fund | | $ | 150,048 | |
| Hedged Equity Income Fund | | | 4,734 | |
| Convertible Fund | | | 160,487 | |
| Global Convertible Fund | | | 4,825 | |
| Growth Fund | | | 604,438 | |
| Growth and Income Fund | | | 445,175 | |
| Dividend Growth Fund | | | 8,859 | |
| Opportunistic Value Fund | | | 10,006 | |
| International Growth Fund | | | 9,273 | |
| Emerging Market Equity Fund | | | 8,857 | |
| Global Equity Fund | | | 76,675 | |
| Global Growth and Income Fund | | | 213,596 | |
| Total Return Bond Fund | | | 74,973 | |
| High Income Opportunities Fund | | | 104,075 | |
Each Fund’s obligation to make payments under the Plan is a general obligation of the Fund and is included in “Payable for deferred compensation to trustees” on the Statements of Assets and Liabilities at October 31, 2018.
Note 3 – Investments
The cost of purchases and proceeds from sales of long-term investments for the year or period ended October 31, 2018 were as follows:
| | | | | | | | | | | | | | | | |
| | | COST OF PURCHASES | | | PROCEEDS FROM SALES | |
| FUND | | U.S. GOV’T
SECURITIES | | | OTHER | | | U.S. GOV’T
SECURITIES | | | OTHER | |
| Market Neutral Income Fund | | $ | — | | | $ | 6,206,300,392 | | | $ | — | | | $ | 4,958,056,241 | |
| Hedged Equity Income Fund | | | — | | | | 151,069,518 | | | | — | | | | 69,492,498 | |
| Phineus Long/Short Fund | | | — | | | | 3,505,622,364 | | | | — | | | | 2,837,386,869 | |
| Convertible Fund | | | 18,124,102 | | | | 403,722,139 | | | | — | | | | 419,880,335 | |
| Global Convertible Fund | | | 2,518,980 | | | | 63,828,445 | | | | — | | | | 37,606,618 | |
| Growth Fund | | | — | | | | 1,142,876,010 | | | | — | | | | 1,391,200,569 | |
| Growth and Income Fund | | | 19,289,840 | | | | 475,066,473 | | | | — | | | | 637,315,502 | |
| Dividend Growth Fund | | | — | | | | 2,685,657 | | | | — | | | | 4,818,454 | |
| Opportunistic Value Fund | | | — | | | | 60,458,204 | | | | — | | | | 66,439,848 | |
| International Growth Fund | | | — | | | | 330,431,169 | | | | — | | | | 358,659,567 | |
| Evolving World Growth Fund | | | — | | | | 256,821,404 | | | | — | | | | 339,792,848 | |
| Emerging Market Equity Fund | | | — | | | | 16,705,683 | | | | — | | | | 17,050,062 | |
| Global Equity Fund | | | — | | | | 92,616,607 | | | | — | | | | 129,441,096 | |
| Global Growth and Income Fund | | | 6,260,406 | | | | 150,857,685 | | | | — | | | | 187,393,019 | |
| Total Return Bond Fund | | | 11,959,355 | | | | 29,422,113 | | | | 22,190,660 | | | | 29,970,034 | |
| High Income Opportunities Fund | | | — | | | | 29,380,387 | | | | — | | | | 40,698,304 | |
| Short-Term Bond Fund | | | — | | | | 14,738,915 | | | | — | | | | 455,334 | |
The following information is presented on a federal income tax basis as of October 31, 2018. Differences between the cost basis under U.S. generally accepted accounting principles and federal income tax purposes are primarily due to temporary differences.
Notes to Financial Statements
The cost basis of investments for federal income tax purposes at October 31, 2018 was as follows:
| | | | | | | | | | | | | | | | |
| FUND | | COST BASIS OF
INVESTMENTS | | | GROSS UNREALIZED
APPRECIATION | | | GROSS UNREALIZED
DEPRECIATION | | | NET UNREALIZED
APPRECIATION
(DEPRECIATION) | |
| Market Neutral Income Fund | | $ | 4,864,991,101 | | | $ | 855,071,101 | | | $ | (682,637,732 | ) | | $ | 172,433,369 | |
| Hedged Equity Income Fund | | | 97,759,499 | | | | 4,923,324 | | | | (6,530,223 | ) | | | (1,606,899 | ) |
| Phineus Long/Short Fund | | | 917,532,516 | | | | 55,720,058 | | | | (112,334,896 | ) | | | (56,614,838 | ) |
| Convertible Fund | | | 654,080,389 | | | | 34,907,286 | | | | (15,738,693 | ) | | | 19,168,593 | |
| Global Convertible Fund | | | 138,835,834 | | | | 5,712,180 | | | | (6,124,870 | ) | | | (412,690 | ) |
| Growth Fund | | | 1,217,721,980 | | | | 372,978,470 | | | | (73,438,979 | ) | | | 299,539,491 | |
| Growth and Income Fund | | | 1,629,247,247 | | | | 468,078,711 | | | | (70,128,355 | ) | | | 397,950,356 | |
| Dividend Growth Fund | | | 18,209,189 | | | | 6,402,073 | | | | (730,013 | ) | | | 5,672,060 | |
| Opportunistic Value Fund | | | 45,207,012 | | | | 4,517,169 | | | | (1,213,483 | ) | | | 3,303,686 | |
| International Growth Fund | | | 226,471,614 | | | | 20,394,026 | | | | (11,933,827 | ) | | | 8,460,199 | |
| Evolving World Growth Fund | | | 200,152,869 | | | | 22,159,823 | | | | (11,559,460 | ) | | | 10,600,363 | |
| Emerging Market Equity Fund | | | 16,497,190 | | | | 1,322,710 | | | | (1,007,793 | ) | | | 314,917 | |
| Global Equity Fund | | | 82,144,725 | | | | 19,289,155 | | | | (3,055,532 | ) | | | 16,233,623 | |
| Global Growth and Income Fund | | | 180,354,001 | | | | 22,285,144 | | | | (8,826,588 | ) | | | 13,458,556 | |
| Total Return Bond Fund | | | 63,919,807 | | | | 70,427 | | | | (1,953,881 | ) | | | (1,883,455 | ) |
| High Income Opportunities Fund | | | 64,269,183 | | | | 335,045 | | | | (2,932,612 | ) | | | (2,597,567 | ) |
| Short-Term Bond Fund | | | 15,852,553 | | | | 1,647 | | | | (44,390 | ) | | | (42,743 | ) |
Note 4 – Income Taxes
For the fiscal year ended October 31, 2018, the Fund recorded the following permanent reclassifications to reflect tax character. The results of operations and net assets were not affected by these reclassifications.
| | | | | | | | | | | | |
| FUND | | PAID-IN
CAPITAL | | | ACCUMULATED
UNDISTRIBUTED/
(OVERDISTRIBUTED)
NET INVESTMENT
INCOME | | | ACCUMULATED
NET REALIZED
GAIN/(LOSS) ON
INVESTMENTS | |
| Market Neutral Income Fund | | $ | (8,253,322 | ) | | $ | (29,821,727 | ) | | $ | 38,075,049 | |
| Hedged Equity Income Fund | | | 223 | | | | (14,197 | ) | | | 13,974 | |
| Phineus Long/Short Fund | | | 2,033,187 | | | | 77,019 | | | | (2,110,206 | ) |
| Convertible Fund | | | (3,651,486 | ) | | | 2,943,900 | | | | 707,586 | |
| Global Convertible Fund | | | (1,116,980 | ) | | | (693,030 | ) | | | 1,810,010 | |
| Growth Fund | | | 34,957,588 | | | | 5,676,410 | | | | (40,633,998 | ) |
| Growth and Income Fund | | | 5,451,665 | | | | 16,455,457 | | | | (21,907,122 | ) |
| Dividend Growth Fund | | | 141,265 | | | | (9,799 | ) | | | (131,466 | ) |
| Opportunistic Value Fund | | | 460,104 | | | | (89,747 | ) | �� | | (370,357 | ) |
| International Growth Fund | | | 5,383,046 | | | | (2,242,303 | ) | | | (3,140,743 | ) |
| Evolving World Growth Fund | | | (1,445,506 | ) | | | 576,453 | | | | 869,053 | |
| Emerging Market Equity Fund | | | (31,691 | ) | | | 14,552 | | | | 17,139 | |
| Global Equity Fund | | | 4,332,420 | | | | (116,280 | ) | | | (4,216,140 | ) |
| Global Growth and Income Fund | | | 1,877,276 | | | | (393,551 | ) | | | (1,483,725 | ) |
| Total Return Bond Fund | | | (179,920 | ) | | | 234,914 | | | | (54,994 | ) |
| High Income Opportunities Fund | | | — | | | | 75,559 | | | | (75,559 | ) |
| Short-Term Bond Fund | | | — | | | | 5,687 | | | | (5,687 | ) |
| | | | |
| 168 | | CALAMOS OPEN-END FAMILY OF FUNDS ANNUAL REPORT | | |
Notes to Financial Statements
Distributions were characterized for federal income tax purposes as follows:
| | | | | | | | | | | | | | | | | | | | |
| | | YEAR OR PERIOD ENDED
October 31, 2018 | | | YEAR ENDED
October 31, 2017 | |
| FUND | | ORDINARY
INCOME | | | LONG-TERM
CAPITAL GAIN | | | RETURN OF
CAPITAL | | | ORDINARY
INCOME | | | LONG-TERM
CAPITAL GAIN | |
| Market Neutral Income Fund | | $ | 77,379,152 | | | $ | 80,809,364 | | | $ | — | | | $ | 73,358,003 | | | $ | 36,807,499 | |
| Hedged Equity Income Fund | | | 294,253 | | | | 223 | | | | — | | | | 157,613 | | | | — | |
| Phineus Long/Short Fund | | | 4,847,673 | | | | 3,469,521 | | | | — | | | | 817,252 | | | | 153,764 | |
| Convertible Fund | | | 10,520,105 | | | | 18,076,624 | | | | — | | | | 11,633,535 | | | | 2,859,294 | |
| Global Convertible Fund | | | 1,935,321 | | | | 2,717,363 | | | | — | | | | 1,110,243 | | | | — | |
| Growth Fund | | | 34,957,588 | | | | 218,784,460 | | | | — | | | | 43,408,854 | | | | 87,653,493 | |
| Growth and Income Fund | | | 30,462,496 | | | | 116,932,931 | | | | — | | | | 52,285,501 | | | | 100,114,190 | |
| Dividend Growth Fund | | | 157,148 | | | | 2,083,020 | | | | — | | | | 342,454 | | | | 417,354 | |
| Opportunistic Value Fund | | | 679,851 | | | | 1,596,824 | | | | — | | | | 632,156 | | | | — | |
| International Growth Fund | | | 2,007,704 | | | | 16,295,738 | | | | — | | | | 1,751,387 | | | | 942,337 | |
| Evolving World Growth Fund | | | 2,351,175 | | | | — | | | | 110 | | | | 1,217,623 | | | | — | |
| Emerging Market Equity Fund | | | 86,283 | | | | — | | | | 8 | | | | 28,948 | | | | — | |
| Global Equity Fund | | | 2,634,875 | | | | 13,457,533 | | | | — | | | | 1,929,356 | | | | 5,808,984 | |
| Global Growth and Income Fund | | | 2,786,565 | | | | 13,090,122 | | | | — | | | | 1,594,228 | | | | 2,623,228 | |
| Total Return Bond Fund | | | 1,692,483 | | | | 352,324 | | | | 179,920 | | | | 1,822,895 | | | | 261,144 | |
| High Income Opportunities Fund | | | 3,181,977 | | | | — | | | | — | | | | 2,867,566 | | | | — | |
| Short-Term Bond Fund | | | 54,170 | | | | — | | | | — | | | | — | | | | — | |
As of October 31, 2018, the components of accumulated earnings/(loss) on tax basis were as follows:
| | | | | | | | | | | | | | | | | | | | |
| | | MARKET NEUTRAL
INCOME FUND | | | HEDGED EQUITY
INCOME FUND | | | PHINEUS
LONG/SHORT FUND | | | CONVERTIBLE
FUND | | | GLOBAL
CONVERTIBLE FUND | |
| Undistributed ordinary income | | $ | 121,821,134 | | | $ | 115,829 | | | $ | 28,941,168 | | | $ | 19,864,531 | | | $ | 3,197,164 | |
| Undistributed capital gains | | | 123,323,179 | | | | 2,507,493 | | | | 8,774,837 | | | | 51,619,872 | | | | 2,821,799 | |
| | | | |
| Total undistributed earnings | | | 245,144,313 | | | | 2,623,322 | | | | 37,716,005 | | | | 71,484,403 | | | | 6,018,963 | |
| Accumulated capital and other losses | | | — | | | | — | | | | — | | | | — | | | | — | |
| Net unrealized gains/(losses) | | | 171,748,292 | | | | (1,606,899 | ) | | | (56,617,019 | ) | | | 19,243,896 | | | | (427,927 | ) |
| | | | |
| Total accumulated earnings/(losses) | | | 416,892,605 | | | | 1,016,423 | | | | (18,901,014 | ) | | | 90,728,299 | | | | 5,591,036 | |
| Other | | | (168,554,519 | ) | | | (9,639 | ) | | | (327,819 | ) | | | (209,646 | ) | | | (12,762 | ) |
| Paid-in-capital | | | 6,457,503,118 | | | | 96,349,727 | | | | 1,183,584,817 | | | | 525,022,516 | | | | 130,659,723 | |
| | | | |
| Net assets applicable to common shareholders | | $ | 6,705,841,204 | | | $ | 97,356,511 | | | $ | 1,164,355,984 | | | $ | 615,541,169 | | | $ | 136,237,997 | |
| | | | |
| | | | | |
| | | GROWTH FUND | | | GROWTH AND
INCOME FUND | | | DIVIDEND
GROWTH FUND | | | OPPORTUNISTIC
VALUE FUND | | | | |
| Undistributed ordinary income | | $ | 55,750,632 | | | $ | 20,038,784 | | | $ | 39,753 | | | $ | 1,883,295 | | | | | |
| Undistributed capital gains | | | 148,820,107 | | | | 106,596,572 | | | | 873,817 | | | | 5,369,753 | | | | | |
| | | | | | | | |
| Total undistributed earnings | | | 204,570,739 | | | | 126,635,356 | | | | 913,570 | | | | 7,253,048 | | | | | |
| Accumulated capital and other losses | | | — | | | | — | | | | — | | | | — | | | | | |
| Net unrealized gains/(losses) | | | 299,538,112 | | | | 398,017,496 | | | | 5,672,060 | | | | 3,303,686 | | | | | |
| | | | | | | | |
| Total accumulated earnings/(losses) | | | 504,108,851 | | | | 524,652,852 | | | | 6,585,630 | | | | 10,556,734 | | | | | |
| Other | | | (615,464 | ) | | | (295,206 | ) | | | (7,988 | ) | | | (78,475 | ) | | | | |
| Paid-in-capital | | | 960,041,688 | | | | 1,454,091,089 | | | | 17,382,394 | | | | 37,080,584 | | | | | |
| | | | | | | | |
| Net assets applicable to common shareholders | | $ | 1,463,535,075 | | | $ | 1,978,448,735 | | | $ | 23,960,036 | | | $ | 47,558,843 | | | | | |
| | | | | | | | |
Notes to Financial Statements
| | | | | | | | | | | | | | | | | | | | |
| | | INTERNATIONAL
GROWTH FUND | | | EVOLVING WORLD
GROWTH FUND | | | EMERGING
MARKET EQUITY
FUND | | | GLOBAL EQUITY
FUND | | | GLOBAL GROWTH
AND INCOME
FUND | |
| Undistributed ordinary income | | $ | — | | | $ | — | | | $ | — | | | $ | — | | | $ | 3,498,839 | |
| Undistributed capital gains | | | 23,806,913 | | | | — | | | | — | | | | 18,654,809 | | | | 14,609,164 | |
| | | | |
| Total undistributed earnings | | | 23,806,913 | | | | — | | | | — | | | | 18,654,809 | | | | 18,108,003 | |
| Accumulated capital and other losses | | | — | | | | (21,066,008 | ) | | | (2,535,659 | ) | | | — | | | | — | |
| Net unrealized gains/(losses) | | | 8,051,751 | | | | 10,582,365 | | | | 315,085 | | | | 16,233,753 | | | | 13,450,176 | |
| | | | |
| Total accumulated earnings/(losses) | | | 31,858,664 | | | | (10,483,643 | ) | | | (2,220,574 | ) | | | 34,888,562 | | | | 31,558,179 | |
| Other | | | 402,327 | | | | (76,789 | ) | | | (8,242 | ) | | | (61,771 | ) | | | (207,258 | ) |
| Paid-in-capital | | | 201,089,079 | | | | 215,091,637 | | | | 16,228,241 | | | | 61,626,799 | | | | 158,985,607 | |
| | | | |
| Net assets applicable to common shareholders | | $ | 233,350,070 | | | $ | 204,531,205 | | | $ | 13,999,425 | | | $ | 96,453,590 | | | $ | 190,336,528 | |
| | | | |
| | | | | |
| | | TOTAL RETURN
BOND FUND | | | HIGH INCOME
OPPORTUNITIES
FUND | | | SHORT-TERM
BOND FUND | | | | | | | |
| Undistributed ordinary income | | $ | — | | | $ | 10,982 | | | $ | 8,807 | | | | | | | | | |
| Undistributed capital gains | | | — | | | | — | | | | — | | | | | | | | | |
| | | | | | | | | | | | |
| Total undistributed earnings | | | — | | | | 10,982 | | | | 8,807 | | | | | | | | | |
| Accumulated capital and other losses | | | (758,886 | ) | | | (8,722,495 | ) | | | — | | | | | | | | | |
| Net unrealized gains/(losses) | | | (1,883,455 | ) | | | (2,597,567 | ) | | | (42,743 | ) | | | | | | | | |
| | | | | | | | | | | | |
| Total accumulated earnings/(losses) | | | (2,642,341 | ) | | | (11,309,080 | ) | | | (33,936 | ) | | | | | | | | |
| Other | | | (71,478 | ) | | | (101,051 | ) | | | (2,193 | ) | | | | | | | | |
| Paid-in-capital | | | 59,123,205 | | | | 61,170,267 | | | | 15,179,104 | | | | | | | | | |
| | | | | | | | | | | | |
| Net assets applicable to common shareholders | | $ | 56,409,386 | | | $ | 49,760,136 | | | $ | 15,142,975 | | | | | | | | | |
| | | | | | | | | | | | |
The following Funds had capital loss carryforwards for the year or period ended October 31, 2018, with no expiration date, available to offset future realized capital gains:
| | | | | | | | |
| FUND | | SHORT-TERM | | | LONG-TERM | |
| Evolving World Growth Fund | | $ | (21,066,008 | ) | | $ | — | |
| Emerging Market Equity Fund | | | (2,535,659 | ) | | | — | |
| Total Return Bond Fund | | | (365,302 | ) | | | (393,584 | ) |
| High Income Opportunities Fund | | | (1,130,937 | ) | | | (7,591,558 | ) |
Note 5 – Short Sales
Securities sold short represent obligations to deliver the securities at a future date. A Fund may sell a security it does not own in anticipation of a decline in the value of that security before the delivery date. When the Fund sells a security short, it must borrow the security sold short and deliver it to the broker-dealer through which it made the short sale. Dividends paid on securities sold short are disclosed as an expense on the Statements of Operations. A gain, limited to the price at which the Fund sold the security short, or a loss, unlimited in size, will be realized upon the termination of a short sale.
To secure its obligation to deliver to the broker-dealer the securities sold short, the Fund must segregate an amount of cash or liquid securities with its custodian equal to any excess of the current market value of the securities sold short over any cash or liquid securities deposited as collateral with the broker in connection with the short sale (not including the proceeds of the short sale). As a result of that requirement, the Fund will not gain any leverage merely by selling short, except to the extent that it earns interest or other income or gains on the segregated cash or liquid securities while also being subject to the possibility of gain or loss from the securities sold short.
Note 6 – Derivative Investments
Foreign Currency Risk. Each Fund may engage in portfolio hedging with respect to changes in currency exchange rates by entering into forward foreign currency contracts to purchase or sell currencies. A forward foreign currency contract is a commitment to
| | | | |
| 170 | | CALAMOS OPEN-END FAMILY OF FUNDS ANNUAL REPORT | | |
Notes to Financial Statements
purchase or sell a foreign currency at a future date at a negotiated forward rate. Risks associated with such contracts include, among other things, movement in the value of the foreign currency relative to the U.S. dollar and the ability of the counterparty to perform.
To mitigate the counterparty risk, the Fund may enter into an International Swaps and Derivatives Association, Inc. Master Agreement (“ISDA Master Agreement”) or similar agreement with its derivative contract counterparties. An ISDA Master Agreement is a bilateral agreement between the Fund and a counterparty that governs over-the-counter derivatives and foreign exchange contracts and typically contains, among other things, collateral posting terms and netting provisions in the event of a default and/or termination event. Under an ISDA Master Agreement, the Fund may, under certain circumstances, offset with the counterparty certain derivative financial instrument’s payables and/or receivables with collateral held and/or posted and create one single net payment. The provisions of the ISDA Master Agreement typically permit a single net payment in the event of default (close-out netting) including the bankruptcy or insolvency of the counterparty. Generally, collateral is exchanged between the Fund and the counterparty and the amount of collateral due from the Fund or to a counterparty has to exceed a minimum transfer amount threshold before a transfer has to be made. To the extent amounts due to the Fund from its counterparties are not fully collateralized, contractually or otherwise, the Fund bears the risk of loss from counterparty nonperformance. When a Fund is required to post collateral under the terms of a derivatives transaction and master netting agreement, the Fund’s custodian holds the collateral in a segregated account, subject to the terms of a tri-party agreement among the Fund, the custodian and the counterparty. The master netting agreement and tri-party agreement provide, in relevant part, that the counterparty may have rights to the amounts in the segregated account in the event that the Fund defaults in its obligation with respect to the derivative instrument that is subject to the collateral requirement. When a counterparty is required to post collateral under the terms of a derivatives transaction and master netting agreement, the counterparty delivers such amount to the Fund’s custodian. The master netting agreement provides, in relevant part, that the Fund may have rights to such collateral in the event that the counterparty defaults in its obligation with respect to the derivative instrument that is subject to the collateral requirement.
For financial reporting purposes, the Funds do not offset derivative assets and derivative liabilities that are subject to netting arrangements in the Statements of Assets and Liabilities. The Fund’s net counterparty exposure is reflected in the counterparty table below. The net unrealized gain, if any, represents the credit risk to the respective Fund on a forward foreign currency contract. The contracts are valued daily at forward foreign exchange rates. The Funds realize a gain or loss when a position is closed or upon settlement of the contracts. Please see the disclosure regarding ISDA Master Agreements under Foreign Currency Risk within this note.
As of October 31, 2018, the Funds had outstanding forward foreign currency contracts listed on the Schedules of Investments.
Equity Risk. Each Fund may engage in option transactions and in doing so achieves similar objectives to what it would achieve through the sale or purchase of individual securities. A call option, upon payment of a premium, gives the purchaser of the option the right to buy, and the seller of the option the obligation to sell, the underlying security, index or other instrument at the exercise price. A put option gives the purchaser of the option, upon payment of a premium, the right to sell, and the seller the obligation to buy, the underlying security, index, or other instrument at the exercise price.
To seek to offset some of the risk of a potential decline in value of certain long positions, each Fund may also purchase put options on individual securities, broad-based securities indexes or certain exchange-traded funds (“ETFs”). Each Fund may also seek to generate income from option premiums by writing (selling) options on a portion of the equity securities (including securities that are convertible into equity securities) in the Fund’s portfolio, on broad-based securities indexes, or certain ETFs.
When the Fund purchases an option, it pays a premium and an amount equal to that premium is recorded as an asset. When the Fund writes an option, it receives a premium and an amount equal to that premium is recorded as a liability. The asset or liability is adjusted daily to reflect the current market value of the option. If an option expires unexercised, the Fund realizes a gain or loss to the extent of the premium received or paid. If an option is exercised, the premium received or paid is recorded as an adjustment to the proceeds from the sale or the cost basis of the purchase. The difference between the premium and the amount received or paid on a closing purchase or sale transaction is also treated as a realized gain or loss. The cost of securities acquired through the exercise of call options is increased by premiums paid. The proceeds from securities sold through the exercise of put options are decreased by the premiums paid. Gain or loss on written options and purchased options is presented separately as net realized gain or loss on written options and net realized gain or loss on purchased options, respectively.
Notes to Financial Statements
Options written by each Fund do not typically give rise to counterparty credit risk since options written obligate each Fund and not the counterparty to perform. Exchange traded purchased options have minimal counterparty credit risk to each Fund since the exchange’s clearinghouse, as counterparty to such instruments, guarantees against a possible default.
As of October 31, 2018, the Fund had outstanding purchased options and/or written options as listed on the Schedules of Investments.
As of October 31, 2018, the Funds had outstanding derivative contracts which are reflected on the Statements of Assets and Liabilities as follows:
| | | | | | | | |
| | | ASSET
DERIVATIVES | | | LIABILITY
DERIVATIVES | |
| |
| | | MARKET NEUTRAL INCOME FUND | |
| Gross amounts at fair value: | | | | | | | | |
| Forward foreign currency contracts(1) | | $ | 3,478,064 | | | $ | 44,142 | |
| Purchased options(2) | | | 60,680,931 | | | | — | |
| Written options(3) | | | — | | | | 154,874,923 | |
| | | | |
| | $ | 64,158,995 | | | $ | 154,919,065 | |
| | | | |
| |
| | | HEDGED EQUITY INCOME FUND | |
| Gross amounts at fair value: | | | | | | | | |
| Purchased options(2) | | $ | 1,960,908 | | | $ | — | |
| Written options(3) | | | — | | | | 2,384,038 | |
| | | | |
| | $ | 1,960,908 | | | $ | 2,384,038 | |
| | | | |
| |
| | | PHINEUS LONG/SHORT FUND | |
| Gross amounts at fair value: | | | | | | | | |
| Purchased options(2) | | $ | 31,465,930 | | | $ | — | |
| Written options(3) | | | — | | | | 15,712,705 | |
| | | | |
| | $ | 31,465,930 | | | $ | 15,712,705 | |
| | | | |
| |
| | | CONVERTIBLE FUND | |
| Gross amounts at fair value: | | | | | | | | |
| Forward foreign currency contracts(1) | | $ | 84,931 | | | $ | 9,628 | |
| Purchased options(2) | | | 3,180,560 | | | | — | |
| Written options(3) | | | — | | | | 509,320 | |
| | | | |
| | $ | 3,265,491 | | | $ | 518,948 | |
| | | | |
| |
| | | GLOBAL CONVERTIBLE FUND | |
| Gross amounts at fair value: | | | | | | | | |
| Purchased options(2) | | $ | 1,737,802 | | | $ | — | |
| | | | |
| | $ | 1,737,802 | | | $ | — | |
| | | | |
| |
| | | GROWTH FUND | |
| Gross amounts at fair value: | | | | | | | | |
| Purchased options(2) | | $ | 2,537,960 | | | $ | — | |
| Written options(3) | | | — | | | | 448,405 | |
| | | | |
| | $ | 2,537,960 | | | $ | 448,405 | |
| | | | |
| | | | |
| 172 | | CALAMOS OPEN-END FAMILY OF FUNDS ANNUAL REPORT | | |
Notes to Financial Statements
| | | | | | | | |
| | | ASSET
DERIVATIVES | | | LIABILITY
DERIVATIVES | |
| |
| | | GROWTH AND INCOME FUND | |
| Gross amounts at fair value: | | | | | | | | |
| Forward foreign currency contracts(1) | | $ | 75,791 | | | $ | 8,651 | |
| Purchased options(2) | | | 3,439,933 | | | | — | |
| | | | |
| | $ | 3,515,724 | | | $ | 8,651 | |
| | | | |
| |
| | | OPPORTUNISTIC VALUE FUND | |
| Gross amounts at fair value: | | | | | | | | |
| Purchased options(2) | | $ | 318,563 | | | $ | — | |
| Written options(3) | | | — | | | | 145,925 | |
| | | | |
| | $ | 318,563 | | | $ | 145,925 | |
| | | | |
| |
| | | INTERNATIONAL GROWTH FUND | |
| Gross amounts at fair value: | | | | | | | | |
| Forward foreign currency contracts(1) | | $ | 5,161 | | | $ | 397,697 | |
| Purchased options(2) | | | 862,654 | | | | — | |
| | | | |
| | $ | 867,815 | | | $ | 397,697 | |
| | | | |
| |
| | | EVOLVING WORLD GROWTH FUND | |
| Gross amounts at fair value: | | | | | | | | |
| Purchased options(2) | | $ | 2,490,100 | | | $ | — | |
| | | | |
| | $ | 2,490,100 | | | $ | — | |
| | | | |
| |
| | | EMERGING MARKET EQUITY FUND | |
| Gross amounts at fair value: | | | | | | | | |
| Purchased options(2) | | $ | 90,627 | | | $ | — | |
| | | | |
| | $ | 90,627 | | | $ | — | |
| | | | |
| |
| | | GLOBAL EQUITY FUND | |
| Gross amounts at fair value: | | | | | | | | |
| Purchased options(2) | | $ | 197,376 | | | $ | — | |
| | | | |
| | $ | 197,376 | | | $ | — | |
| | | | |
| |
| | | GLOBAL GROWTH AND INCOME FUND | |
| Gross amounts at fair value: | | | | | | | | |
| Purchased options(2) | | $ | 1,779,651 | | | $ | — | |
| | | | |
| | $ | 1,779,651 | | | $ | — | |
| | | | |
The following tables present the outstanding derivative contracts, organized by counterparty, that are subject to enforceable master netting agreements as of October 31, 2018.
| | | | | | | | | | | | | | | | | | | | | | | | |
| | | GROSS AMOUNTS NOT OFFSET
IN THE STATEMENT OF ASSETS AND LIABILITIES | |
| MARKET NEUTRAL INCOME FUND | | GROSS AMOUNTS PRESENTED IN THE
STATEMENT OF ASSETS AND LIABILITIES | | | COLLATERAL PLEDGED | | | NET AMOUNT
RECEIVABLE IN
THE EVENT OF DEFAULT | | | NET AMOUNT
PAYABLE IN
THE EVENT OF DEFAULT | |
| Counterparty | | | | | ASSETS | | | LIABILITIES | |
| Bank of New York | | | ISDA | | | $ | 467,116 | | | $ | 16,217 | | | $ | — | | | $ | 450,899 | | | $ | — | |
| Northern Trust Company | | | ISDA | | | | 1,235,567 | | | | — | | | | — | | | | 1,235,567 | | | | — | |
| State Street Bank and Trust | | | ISDA | | | | 1,775,381 | | | | 27,925 | | | | — | | | | 1,747,456 | | | | — | |
| | | | |
| | | $ | 3,478,064 | | | $ | 44,142 | | | $ | — | | | $ | 3,433,922 | | | $ | — | |
| | | | |
Notes to Financial Statements
| | | | | | | | | | | | | | | | | | | | | | | | |
| CONVERTIBLE FUND | | GROSS AMOUNTS PRESENTED IN THE
STATEMENT OF ASSETS AND LIABILITIES | | | COLLATERAL PLEDGED | | | NET AMOUNT
RECEIVABLE
IN THE EVENT OF DEFAULT | | | NET AMOUNT
PAYABLE IN
THE EVENT OF DEFAULT | |
| Counterparty | | | | | ASSETS | | | LIABILITIES | |
| Bank of New York | | | ISDA | | | $ | 413 | | | $ | 104 | | | $ | — | | | $ | 309 | | | $ | — | |
| Northern Trust Company | | | ISDA | | | | — | | | | 10 | | | | — | | | | — | | | | 10 | |
| State Street Bank and Trust | | | ISDA | | | | 84,518 | | | | 9,514 | | | | — | | | | 75,004 | | | | — | |
| | | | |
| | | $ | 84,931 | | | $ | 9,628 | | | $ | — | | | $ | 75,313 | | | $ | 10 | |
| | | | |
| | | | |
| GROWTH AND INCOME FUND | | GROSS AMOUNTS PRESENTED IN THE
STATEMENT OF ASSETS AND LIABILITIES | | | COLLATERAL PLEDGED | | | NET AMOUNT
RECEIVABLE
IN THE EVENT OF DEFAULT | | | NET AMOUNT
PAYABLE IN
THE EVENT OF DEFAULT | |
| Counterparty | | | | | ASSETS | | | LIABILITIES | |
| Bank of New York | | | ISDA | | | $ | 318 | | | $ | 145 | | | $ | — | | | $ | 173 | | | $ | — | |
| Northern Trust Company | | | ISDA | | | | — | | | | 8 | | | | — | | | | — | | | | 8 | |
| State Street Bank and Trust | | | ISDA | | | | 75,473 | | | | 8,498 | | | | — | | | | 66,975 | | | | — | |
| | | | |
| | | $ | 75,791 | | | $ | 8,651 | | | $ | — | | | $ | 67,148 | | | $ | 8 | |
| | | | |
| | | | |
| INTERNATIONAL GROWTH FUND | | GROSS AMOUNTS PRESENTED IN THE
STATEMENT OF ASSETS AND LIABILITIES | | | COLLATERAL PLEDGED | | | NET AMOUNT
RECEIVABLE
IN THE EVENT OF DEFAULT | | | NET AMOUNT
PAYABLE IN
THE EVENT OF DEFAULT | |
| Counterparty | | | | | ASSETS | | | LIABILITIES | |
| State Street Bank and Trust | | | ISDA | | | $ | 5,161 | | | $ | 397,697 | | | $ | — | | | $ | — | | | $ | 392,536 | |
| | | | |
| | | $ | 5,161 | | | $ | 397,697 | | | $ | — | | | $ | — | | | $ | 392,536 | |
| | | | |
For the year or period ended October 31, 2018, the volume of derivative activity for the Fund is reflected below:*
| | | | | | | | | | | | | | | | |
| FUND | | FORWARD CONTRACTS(1) | | | PURCHASED OPTIONS(2) | | | WRITTEN OPTIONS(3) | | | TOTAL RETURN SWAPS(4) | |
| Market Neutral Income Fund | | | 516,442,438 | | | | 361,397 | | | | 184,388 | | | | 994,800 | |
| Hedged Equity Income Fund | | | — | | | | 6,121 | | | | 2,749 | | | | — | |
| Phineus Long/Short Fund | | | — | | | | 1,008,957 | | | | 1,068,624 | | | | — | |
| Convertible Fund | | | 18,585,797 | | | | 14,403 | | | | 1,698 | | | | — | |
| Global Convertible Fund | | | — | | | | 7,467 | | | | 153 | | | | — | |
| Growth Fund | | | — | | | | 83,040 | | | | 72,157 | | | | — | |
| Growth and Income Fund | | | 19,796,768 | | | | 376,783 | | | | 6,085 | | | | — | |
| Dividend Growth Fund | | | — | | | | — | | | | — | | | | — | |
| Opportunistic Value Fund | | | — | | | | 2,640 | | | | 425 | | | | — | |
| International Growth Fund | | | 136,594,900 | | | | 26,958 | | | | 7,754 | | | | — | |
| Evolving World Growth Fund | | | 186,280 | | | | 220,175 | | | | 97,550 | | | | — | |
| Emerging Market Equity Fund | | | 65,073 | | | | 4,293 | | | | 371 | | | | — | |
| Global Equity Fund | | | 31,671,004 | | | | 9,604 | | | | 4,572 | | | | — | |
| Global Growth and Income Fund | | | 47,862,989 | | | | 65,212 | | | | 20,452 | | | | — | |
| Total Return Bond Fund | | | — | | | | — | | | | — | | | | — | |
| High Income Opportunities Fund | | | — | | | | 80 | | | | 40 | | | | — | |
| Short-Term Bond Fund | | | — | | | | — | | | | — | | | | — | |
| * | Activity during the period is measured by opened number of contracts for options purchased or written, opened foreign currency contracts (measured in notional), and opened total return swaps (measured in notional). |
| (1) | Generally, the Statement of Assets and Liabilities location for Forward contracts is Unrealized appreciation on forward foreign currency contracts for asset derivatives and Unrealized depreciation on forward foreign currency contracts for liability derivatives. |
| (2) | Generally, the Statement of Assets and Liabilities location for Purchased Options is Investments in securities, at value. |
| (3) | Generally, the Statement of Assets and Liabilities location for Written Options is Options written, at value. |
| (4) | Generally, the Statement of Assets and Liabilities location for Swap contracts is Unrealized appreciation on total return swaps for asset derivatives and Unrealized depreciation on total return swaps for liability derivatives. |
| | | | |
| 174 | | CALAMOS OPEN-END FAMILY OF FUNDS ANNUAL REPORT | | |
Notes to Financial Statements
Note 7 – Securities Lending
The Funds may loan one or more of their securities to broker-dealers and banks. Any such loan must be secured by collateral in cash or cash equivalents maintained on a current basis in an amount at least equal to the value of the securities loaned by the Funds. The Funds continue to receive the equivalent of the interest or dividends paid by the issuer on the securities loaned and also receive an additional return that may be in the form of a fixed fee or a percentage of the collateral. The additional return is disclosed on a net basis as Securities lending income in the Statement of Operations. Upon receipt of cash or cash equivalent collateral, the Funds’ securities lending agent invests the collateral into short term investments following investment guidelines approved by Calamos Advisors. The Funds record the investment of collateral as an asset and the value of the collateral as a liability on the Statements of Assets and Liabilities. If the value of the invested collateral declines below the value of the collateral deposited by the borrower, the Funds will record unrealized depreciation equal to the decline in value of the invested collateral. The Funds will pay reasonable fees to persons unaffiliated with the Funds for services in arranging these loans. The Funds have the right to call a loan and obtain the securities loaned at any time. The Funds do not have the right to vote the securities during the existence of the loan but could call the loan in an attempt to permit voting of the securities in certain circumstances. Upon return of the securities loaned, the cash or cash equivalent collateral will be returned to the borrower. In the event of bankruptcy or other default of the borrower, the Funds could experience both delays in liquidating the loan collateral or recovering the loaned securities and losses, including (a) possible decline in the value of the collateral or in the value of the securities loaned during the period while the Funds seek to enforce its rights thereto, (b) possible subnormal levels of income and lack of access to income during this period, and (c) the expenses of enforcing their rights. In an effort to reduce these risks, the Funds’ security lending agent monitors and reports to Calamos Advisors on the creditworthiness of the firms to which a Fund lends securities.
The following table indicates the total amount of securities loaned by asset class, reconciled to the gross liability payable upon return of the securities loaned by the Funds as of October 31, 2018.
| | | | | | | | | | | | | | | | | | | | |
| | | VALUE OF COLLATERAL
FROM
BROKER-DEALERS
AND BANKS | | | AMOUNT OF COLLATERAL HELD IN SHORT TERM INVESTMENTS
AND RESTRICTED CASH BY ASSET CLASS ON LOAN | | | EXCESS AMOUNT
DUE TO/FROM
COUNTERPARTY | |
| FUND | | EQUITY | | | FIXED
INCOME | | | TOTAL | |
| Market Neutral Income Fund | | $ | 402,415,616 | | | $ | 298,400,273 | | | $ | 141,248,666 | | | $ | 439,648,939 | | | $ | 37,233,323 | |
| Hedged Equity Income Fund | | | 564,146 | | | | 1,620,424 | | | | — | | | | 1,620,424 | | | | 1,056,278 | |
| Phineus Long/Short Fund | | | 91,376,350 | | | | 99,260,032 | | | | — | | | | 99,260,032 | | | | 7,883,682 | |
| Convertible Fund | | | 59,159,448 | | | | 11,608,238 | | | | 51,126,474 | | | | 62,734,712 | | | | 3,575,264 | |
| Global Convertible Fund | | | 5,328,708 | | | | — | | | | 5,289,342 | | | | 5,289,342 | | | | (39,366 | ) |
| Growth Fund | | | 29,199,351 | | | | 76,300,087 | | | | — | | | | 76,300,087 | | | | 47,100,736 | |
| Growth and Income Fund | | | 52,557,957 | | | | 68,305,414 | | | | 25,464,618 | | | | 93,770,032 | | | | 41,212,075 | |
| Dividend Growth Fund | | | — | | | | — | | | | — | | | | — | | | | — | |
| Opportunistic Value Fund | | | 966,475 | | | | 1,306,894 | | | | — | | | | 1,306,894 | | | | 340,419 | |
| International Growth Fund | | | 735,881 | | | | 15,744,594 | | | | — | | | | 15,744,594 | | | | 15,008,713 | |
| Evolving World Growth Fund | | | 5,610,193 | | | | 3,894,584 | | | | 2,789,756 | | | | 6,684,340 | | | | 1,074,147 | |
| Emerging Market Equity Fund | | | 2,543,388 | | | | 2,732,250 | | | | — | | | | 2,732,250 | | | | 188,862 | |
| Global Equity Fund | | | 404,808 | | | | 6,332,745 | | | | — | | | | 6,332,745 | | | | 5,927,937 | |
| Global Growth and Income Fund | | | 1,965,061 | | | | 4,035,521 | | | | 4,045,990 | | | | 8,081,511 | | | | 6,116,450 | |
| Total Return Bond Fund | | | 5,533,827 | | | | — | | | | 8,260,134 | | | | 8,260,134 | | | | 2,726,307 | |
| High Income Opportunities Fund | | | 12,583,224 | | | | 161,547 | | | | 13,644,222 | | | | 13,805,769 | | | | 1,222,545 | |
| Short-Term Bond Fund | | | 472,778 | | | | — | | | | 460,453 | | | | 460,453 | | | | (12,325 | ) |
Notes to Financial Statements
Note 8 – Fair Value Measurements
Various inputs are used to determine the value of the Funds’ investments. These inputs are categorized into three broad levels as follows:
| | • | | Level 1 – Prices are determined using inputs from unadjusted quoted prices from active markets (including securities actively traded on a securities exchange) for identical assets. |
| | • | | Level 2 – Prices are determined using significant observable market inputs other than unadjusted quoted prices, including quoted prices of similar securities, fair value adjustments to quoted foreign securities, interest rates, credit risk, prepayment speeds, and other relevant data. |
| | • | | Level 3 – Prices reflect unobservable market inputs (including the Funds’ own judgments about assumptions market participants would use in determining fair value) when observable inputs are unavailable. |
Debt securities are valued based upon evaluated prices received from an independent pricing service or from a dealer or broker who makes markets in such securities. Pricing services utilize various observable market data and as such, debt securities are generally categorized as Level 2. The levels are not necessarily an indication of the risk or liquidity of the Fund’s investments.
The following is a summary of the inputs used in valuing the Funds’ holdings at fair value:
| | | | | | | | | | | | | | | | |
| | | MARKET NEUTRAL INCOME FUND | |
| | | LEVEL 1 | | | LEVEL 2 | | | LEVEL 3 | | | TOTAL | |
| Assets: | | | | | | | | | | | | | | | | |
Convertible Bonds | | $ | — | | | $ | 2,617,433,357 | | | $ | — | | | $ | 2,617,433,357 | |
Convertible Preferred Stocks | | | 193,864,707 | | | | 117,619,750 | | | | — | | | | 311,484,457 | |
Common Stocks U.S. | | | 3,304,058,370 | | | | — | | | | — | | | | 3,304,058,370 | |
Exchange-Traded Funds | | | 285,808,283 | | | | — | | | | — | | | | 285,808,283 | |
Purchased Options | | | 60,680,931 | | | | — | | | | — | | | | 60,680,931 | |
Short Term Investments | | | 132,647,176 | | | | — | | | | — | | | | 132,647,176 | |
Investment of Cash Collateral For Securities Loaned | | | 188,136,315 | | | | 214,279,301 | | | | — | | | | 402,415,616 | |
Forward Foreign Currency Contracts | | | — | | | | 3,478,064 | | | | — | | | | 3,478,064 | |
| | | | |
Total | | $ | 4,165,195,782 | | | $ | 2,952,810,472 | | | $ | — | | | $ | 7,118,006,254 | |
| | | | |
| Liabilities: | | | | | | | | | | | | | | | | |
Common Stocks Sold Short U.S. | | $ | 1,818,218,065 | | | $ | — | | | $ | — | | | $ | 1,818,218,065 | |
Common Stocks Sold Short Foreign | | | 8,462,597 | | | | 95,548,135 | | | | — | | | | 104,010,732 | |
Written Options | | | 154,874,923 | | | | — | | | | — | | | | 154,874,923 | |
Forward Foreign Currency Contracts | | | — | | | | 44,142 | | | | — | | | | 44,142 | |
| | | | |
Total | | $ | 1,981,555,585 | | | $ | 95,592,277 | | | $ | — | | | $ | 2,077,147,862 | |
| | | | |
| |
| | | HEDGED EQUITY INCOME FUND | |
| | | LEVEL 1 | | | LEVEL 2 | | | LEVEL 3 | | | TOTAL | |
| Assets: | | | | | | | | | | | | | | | | |
Common Stocks U.S. | | $ | 93,764,081 | | | $ | — | | | $ | — | | | $ | 93,764,081 | |
Exchange-Traded Funds | | | 615,954 | | | | — | | | | — | | | | 615,954 | |
Purchased Options | | | 1,960,908 | | | | — | | | | — | | | | 1,960,908 | |
Short Term Investments | | | 1,631,549 | | | | — | | | | — | | | | 1,631,549 | |
Investment of Cash Collateral For Securities Loaned | | | — | | | | 564,146 | | | | — | | | | 564,146 | |
| | | | |
Total | | $ | 97,972,492 | | | $ | 564,146 | | | $ | — | | | $ | 98,536,638 | |
| | | | |
| Liabilities: | | | | | | | | | | | | | | | | |
Written Options | | $ | 2,384,038 | | | $ | — | | | $ | — | | | $ | 2,384,038 | |
| | | | |
Total | | $ | 2,384,038 | | | $ | — | | | $ | — | | | $ | 2,384,038 | |
| | | | |
| | | | |
| 176 | | CALAMOS OPEN-END FAMILY OF FUNDS ANNUAL REPORT | | |
Notes to Financial Statements
| | | | | | | | | | | | | | | | |
| | | PHINEUS LONG/SHORT FUND | |
| | | LEVEL 1 | | | LEVEL 2 | | | LEVEL 3 | | | TOTAL | |
| Assets: | | | | | | | | | | | | | | | | |
Common Stocks U.S. | | $ | 916,690,881 | | | $ | — | | | $ | — | | | $ | 916,690,881 | |
Common Stocks Foreign | | | — | | | | 34,178,836 | | | | — | | | | 34,178,836 | |
Exchange-Traded Funds | | | 98,604,000 | | | | — | | | | — | | | | 98,604,000 | |
Purchased Options | | | 31,465,930 | | | | — | | | | — | | | | 31,465,930 | |
Short Term Investments | | | 81,397,067 | | | | — | | | | — | | | | 81,397,067 | |
Investment of Cash Collateral For Securities Loaned | | | 35,466,698 | | | | 55,909,652 | | | | — | | | | 91,376,350 | |
| | | | |
Total | | $ | 1,163,624,576 | | | $ | 90,088,488 | | | $ | — | | | $ | 1,253,713,064 | |
| | | | |
| Liabilities: | | | | | | | | | | | | | | | | |
Common Stocks Sold Short U.S. | | $ | 9,446,710 | | | $ | — | | | $ | — | | | $ | 9,446,710 | |
Exchange-Traded Funds Sold Short | | | 367,635,970 | | | | — | | | | — | | | | 367,635,970 | |
Written Options | | | 15,712,705 | | | | — | | | | — | | | | 15,712,705 | |
| | | | |
Total | | $ | 392,795,385 | | | $ | — | | | $ | — | | | $ | 392,795,385 | |
| | | | |
| |
| | | CONVERTIBLE FUND | |
| | | LEVEL 1 | | | LEVEL 2 | | | LEVEL 3 | | | TOTAL | |
| Assets: | | | | | | | | | | | | | | | | |
Convertible Bonds | | $ | — | | | $ | 469,166,147 | | | $ | — | | | $ | 469,166,147 | |
Synthetic Convertible Securities (U.S. Government and Agency Security) | | | — | | | | 17,874,557 | | | | — | | | | 17,874,557 | |
Synthetic Convertible Securities (Purchased Options) | | | 1,820,600 | | | | — | | | | — | | | | 1,820,600 | |
Convertible Preferred Stocks | | | 87,056,057 | | | | — | | | | — | | | | 87,056,057 | |
Common Stocks U.S. | | | 9,619,932 | | | | — | | | | — | | | | 9,619,932 | |
Purchased Options | | | 1,359,960 | | | | — | | | | — | | | | 1,359,960 | |
Short Term Investments | | | 27,701,601 | | | | — | | | | — | | | | 27,701,601 | |
Investment of Cash Collateral For Securities Loaned | | | 43,488,274 | | | | 15,671,174 | | | | — | | | | 59,159,448 | |
Forward Foreign Currency Contracts | | | — | | | | 84,931 | | | | — | | | | 84,931 | |
| | | | |
Total | | $ | 171,046,424 | | | $ | 502,796,809 | | | $ | — | | | $ | 673,843,233 | |
| | | | |
| Liabilities: | | | | | | | | | | | | | | | | |
Written Options | | $ | 509,320 | | | $ | — | | | $ | — | | | $ | 509,320 | |
Forward Foreign Currency Contracts | | | — | | | | 9,628 | | | | — | | | | 9,628 | |
| | | | |
Total | | $ | 509,320 | | | $ | 9,628 | | | $ | — | | | $ | 518,948 | |
| | | | |
| |
| | | GLOBAL CONVERTIBLE FUND | |
| | | LEVEL 1 | | | LEVEL 2 | | | LEVEL 3 | | | TOTAL | |
| Assets: | | | | | | | | | | | | | | | | |
Convertible Bonds | | $ | — | | | $ | 101,936,050 | | | $ | — | | | $ | 101,936,050 | |
Synthetic Convertible Securities (Corporate Bonds) | | | — | | | | 2,543,883 | | | | — | | | | 2,543,883 | |
Synthetic Convertible Securities (U.S. Government and Agency Securities) | | | — | | | | 11,766,924 | | | | — | | | | 11,766,924 | |
Synthetic Convertible Securities (Purchased Options) | | | 1,737,802 | | | | — | | | | — | | | | 1,737,802 | |
Convertible Preferred Stocks | | | 11,661,009 | | | | — | | | | — | | | | 11,661,009 | |
Short Term Investments | | | 3,448,768 | | | | — | | | | — | | | | 3,448,768 | |
Investment of Cash Collateral For Securities Loaned | | | 3,555,584 | | | | 1,773,124 | | | | — | | | | 5,328,708 | |
| | | | |
Total | | $ | 20,403,163 | | | $ | 118,019,981 | | | $ | — | | | $ | 138,423,144 | |
| | | | |
Notes to Financial Statements
| | | | | | | | | | | | | | | | |
| | | GROWTH FUND | |
| | | LEVEL 1 | | | LEVEL 2 | | | LEVEL 3 | | | TOTAL | |
| Assets: | | | | | | | | | | | | | | | | |
Common Stocks U.S. | | $ | 1,432,943,135 | | | $ | — | | | $ | — | | | $ | 1,432,943,135 | |
Common Stocks Foreign | | | 422,006 | | | | 19,283,440 | | | | — | | | | 19,705,446 | |
Exchange-Traded Funds | | | 8,691,731 | | | | — | | | | — | | | | 8,691,731 | |
Purchased Options | | | 2,537,960 | | | | — | | | | — | | | | 2,537,960 | |
Short Term Investments | | | 24,632,253 | | | | — | | | | — | | | | 24,632,253 | |
Investment of Cash Collateral For Securities Loaned | | | 11,446,773 | | | | 17,752,578 | | | | — | | | | 29,199,351 | |
| | | | |
Total | | $ | 1,480,673,858 | | | $ | 37,036,018 | | | $ | — | | | $ | 1,517,709,876 | |
| | | | |
| Liabilities: | | | | | | | | | | | | | | | | |
Written Options | | $ | 448,405 | | | $ | — | | | $ | — | | | $ | 448,405 | |
| | | | |
Total | | $ | 448,405 | | | $ | — | | | $ | — | | | $ | 448,405 | |
| | | | |
| |
| | | GROWTH AND INCOME FUND | |
| | | LEVEL 1 | | | LEVEL 2 | | | LEVEL 3 | | | TOTAL | |
| Assets: | | | | | | | | | | | | | | | | |
Convertible Bonds | | $ | — | | | $ | 256,123,957 | | | $ | — | | | $ | 256,123,957 | |
Synthetic Convertible Securities (Corporate Bonds) | | | — | | | | 63,808,086 | | | | — | | | | 63,808,086 | |
Synthetic Convertible Securities (U.S. Government and Agency Security) | | | — | | | | 40,529,518 | | | | — | | | | 40,529,518 | |
Synthetic Convertible Securities (Purchased Options) | | | 1,307,893 | | | | — | | | | — | | | | 1,307,893 | |
Convertible Preferred Stocks | | | 107,590,003 | | | | 7,890,151 | | | | — | | | | 115,480,154 | |
Common Stocks U.S. | | | 1,399,189,017 | | | | — | | | | — | | | | 1,399,189,017 | |
Exchange-Traded Funds | | | 36,748,672 | | | | — | | | | — | | | | 36,748,672 | |
Purchased Options | | | 2,132,040 | | | | — | | | | — | | | | 2,132,040 | |
Short Term Investments | | | 59,320,309 | | | | — | | | | — | | | | 59,320,309 | |
Investment of Cash Collateral For Securities Loaned | | | 32,421,164 | | | | 20,136,793 | | | | — | | | | 52,557,957 | |
Forward Foreign Currency Contracts | | | — | | | | 75,791 | | | | — | | | | 75,791 | |
| | | | |
Total | | $ | 1,638,709,098 | | | $ | 388,564,296 | | | $ | — | | | $ | 2,027,273,394 | |
| | | | |
| Liabilities: | | | | | | | | | | | | | | | | |
Forward Foreign Currency Contracts | | $ | — | | | $ | 8,651 | | | $ | — | | | $ | 8,651 | |
| | | | |
Total | | $ | — | | | $ | 8,651 | | | $ | — | | | $ | 8,651 | |
| | | | |
| |
| | | DIVIDEND GROWTH FUND | |
| | | LEVEL 1 | | | LEVEL 2 | | | LEVEL 3 | | | TOTAL | |
| Assets: | | | | | | | | | | | | | | | | |
Common Stocks U.S. | | $ | 23,448,237 | | | $ | — | | | $ | — | | | $ | 23,448,237 | |
Exchange-Traded Funds | | | 369,780 | | | | — | | | | — | | | | 369,780 | |
Short Term Investments | | | 63,232 | | | | — | | | | — | | | | 63,232 | |
| | | | |
Total | | $ | 23,881,249 | | | $ | — | | | $ | — | | | $ | 23,881,249 | |
| | | | |
| | | | |
| 178 | | CALAMOS OPEN-END FAMILY OF FUNDS ANNUAL REPORT | | |
Notes to Financial Statements
| | | | | | | | | | | | | | | | |
| | | OPPORTUNISTIC VALUE FUND | |
| | | LEVEL 1 | | | LEVEL 2 | | | LEVEL 3 | | | TOTAL | |
| Assets: | | | | | | | | | | | | | | | | |
Common Stocks U.S. | | $ | 46,861,750 | | | $ | — | | | $ | — | | | $ | 46,861,750 | |
Exchange-Traded Funds | | | 234,625 | | | | — | | | | — | | | | 234,625 | |
Purchased Options | | | 318,563 | | | | — | | | | — | | | | 318,563 | |
Short Term Investments | | | 275,210 | | | | — | | | | — | | | | 275,210 | |
Investment of Cash Collateral For Securities Loaned | | | — | | | | 966,475 | | | | — | | | | 966,475 | |
| | | | |
Total | | $ | 47,690,148 | | | $ | 966,475 | | | $ | — | | | $ | 48,656,623 | |
| | | | |
| Liabilities: | | | | | | | | | | | | | | | | |
Written Options | | $ | 145,925 | | | $ | — | | | $ | — | | | $ | 145,925 | |
| | | | |
Total | | $ | 145,925 | | | $ | — | | | $ | — | | | $ | 145,925 | |
| | | | |
| |
| | | INTERNATIONAL GROWTH FUND | |
| | | LEVEL 1 | | | LEVEL 2 | | | LEVEL 3 | | | TOTAL | |
| Assets: | | | | | | | | | | | | | | | | |
Common Stocks Foreign | | $ | 25,800,521 | | | $ | 146,230,789 | | | $ | — | | | $ | 172,031,310 | |
Common Stocks U.S. | | | 48,682,887 | | | | — | | | | — | | | | 48,682,887 | |
Forward Foreign Currency Contracts | | | — | | | | 5,161 | | | | — | | | | 5,161 | |
Purchased Options | | | 862,654 | | | | — | | | | — | | | | 862,654 | |
Short Term Investments | | | 12,619,081 | | | | — | | | | — | | | | 12,619,081 | |
Investment of Cash Collateral For Securities Loaned | | | — | | | | 735,881 | | | | — | | | | 735,881 | |
| | | | |
Total | | $ | 87,965,143 | | | $ | 146,971,831 | | | $ | — | | | $ | 234,936,974 | |
| | | | |
| Liabilities: | | | | | | | | | | | | | | | | |
Forward Foreign Currency Contracts | | $ | — | | | $ | 397,697 | | | $ | — | | | $ | 397,697 | |
| | | | |
Total | | $ | — | | | $ | 397,697 | | | $ | — | | | $ | 397,697 | |
| | | | |
| |
| | | EVOLVING WORLD GROWTH FUND | |
| | | LEVEL 1 | | | LEVEL 2 | | | LEVEL 3 | | | TOTAL | |
| Assets: | | | | | | | | | | | | | | | | |
Convertible Bonds | | $ | — | | | $ | 44,086,653 | | | $ | — | | | $ | 44,086,653 | |
Convertible Preferred Stocks | | | — | | | | 14,958,815 | | | | — | | | | 14,958,815 | |
Common Stocks U.S. | | | 26,290,511 | | | | — | | | | — | | | | 26,290,511 | |
Common Stocks Foreign | | | 12,921,050 | | | | 97,324,459 | | | | — | | | | 110,245,509 | |
Purchased Options | | | 2,490,100 | | | | — | | | | — | | | | 2,490,100 | |
Short Term Investments | | | 7,071,451 | | | | — | | | | — | | | | 7,071,451 | |
Investment of Cash Collateral For Securities Loaned | | | 5,380,487 | | | | 229,706 | | | | — | | | | 5,610,193 | |
| | | | |
Total | | $ | 54,153,599 | | | $ | 156,599,633 | | | $ | — | | | $ | 210,753,232 | |
| | | | |
| |
| | | EMERGING MARKET EQUITY FUND | |
| | | LEVEL 1 | | | LEVEL 2 | | | LEVEL 3 | | | TOTAL | |
| Assets: | | | | | | | | | | | | | | | | |
Common Stocks U.S. | | $ | 4,462,351 | | | $ | 403,333 | | | $ | — | | | $ | 4,865,684 | |
Common Stocks Foreign | | | 1,233,668 | | | | 6,651,403 | | | | — | | | | 7,885,071 | |
Exchange-Traded Funds | | | 540,518 | | | | — | | | | — | | | | 540,518 | |
Purchased Options | | | 90,627 | | | | — | | | | — | | | | 90,627 | |
Short Term Investments | | | 886,819 | | | | — | | | | — | | | | 886,819 | |
Investment of Cash Collateral For Securities Loaned | | | 1,447,195 | | | | 1,096,193 | | | | — | | | | 2,543,388 | |
| | | | |
Total | | $ | 8,661,178 | | | $ | 8,150,929 | | | $ | — | | | $ | 16,812,107 | |
| | | | |
Notes to Financial Statements
| | | | | | | | | | | | | | | | |
| | | GLOBAL EQUITY FUND | |
| | | LEVEL 1 | | | LEVEL 2 | | | LEVEL 3 | | | TOTAL | |
| Assets: | | | | | | | | | | | | | | | | |
Common Stocks U.S. | | $ | 54,493,030 | | | $ | — | | | $ | — | | | $ | 54,493,030 | |
Common Stocks Foreign | | | 3,569,853 | | | | 34,387,027 | | | | — | | | | 37,956,880 | |
Purchased Options | | | 197,376 | | | | — | | | | — | | | | 197,376 | |
Short Term Investments | | | 5,326,254 | | | | — | | | | — | | | | 5,326,254 | |
Investment of Cash Collateral For Securities Loaned | | | — | | | | 404,808 | | | | — | | | | 404,808 | |
| | | | |
Total | | $ | 63,586,513 | | | $ | 34,791,835 | | | $ | — | | | $ | 98,378,348 | |
| | | | |
| |
| | | GLOBAL GROWTH AND INCOME FUND | |
| | | LEVEL 1 | | | LEVEL 2 | | | LEVEL 3 | | | TOTAL | |
| Assets: | | | | | | | | | | | | | | | | |
Convertible Bonds | | $ | — | | | $ | 51,463,302 | | | $ | — | | | $ | 51,463,302 | |
Synthetic Convertible Securities (Corporate Bonds) | | | — | | | | 1,057,039 | | | | — | | | | 1,057,039 | |
Synthetic Convertible Securities (U.S. Government and Agency Security) | | | — | | | | 10,468,628 | | | | — | | | | 10,468,628 | |
Synthetic Convertible Securities (Purchased Options) | | | 1,247,016 | | | | — | | | | — | | | | 1,247,016 | |
Convertible Preferred Stocks | | | 7,515,306 | | | | 5,186,910 | | | | — | | | | 12,702,216 | |
Common Stocks U.S. | | | 64,245,544 | | | | — | | | | — | | | | 64,245,544 | |
Common Stocks Foreign | | | 3,410,097 | | | | 36,157,316 | | | | — | | | | 39,567,413 | |
Purchased Options | | | 532,635 | | | | — | | | | — | | | | 532,635 | |
Short Term Investments | | | 10,388,451 | | | | — | | | | — | | | | 10,388,451 | |
Investment of Cash Collateral For Securities Loaned | | | 2,140,313 | | | | — | | | | — | | | | 2,140,313 | |
| | | | |
Total | | $ | 89,479,362 | | | $ | 104,333,195 | | | $ | — | | | $ | 193,812,557 | |
| | | | |
| |
| | | TOTAL RETURN BOND FUND | |
| | | LEVEL 1 | | | LEVEL 2 | | | LEVEL 3 | | | TOTAL | |
| Assets: | | | | | | | | | | | | | | | | |
Corporate Bonds | | $ | — | | | $ | 31,416,147 | | | $ | — | | | $ | 31,416,147 | |
Bank Loans | | | — | | | | 2,483,800 | | | | — | | | | 2,483,800 | |
U.S. Government and Agency Securities | | | — | | | | 14,699,927 | | | | — | | | | 14,699,927 | |
Asset Backed Securities | | | — | | | | 6,951,952 | | | | — | | | | 6,951,952 | |
Residential Mortgage Backed Security | | | — | | | | 705,131 | | | | — | | | | 705,131 | |
Short Term Investments | | | 245,568 | | | | — | | | | — | | | | 245,568 | |
Investment of Cash Collateral For Securities Loaned | | | 3,061,405 | | | | 2,472,422 | | | | — | | | | 5,533,827 | |
| | | | |
Total | | $ | 3,306,973 | | | $ | 58,729,379 | | | $ | — | | | $ | 62,036,352 | |
| | | | |
| |
| | | HIGH INCOME OPPORTUNITIES FUND | |
| | | LEVEL 1 | | | LEVEL 2 | | | LEVEL 3 | | | TOTAL | |
| Assets: | | | | | | | | | | | | | | | | |
Corporate Bonds | | $ | — | | | $ | 41,668,215 | | | $ | — | | | $ | 41,668,215 | |
Convertible Bonds | | | — | | | | 349,600 | | | | — | | | | 349,600 | |
Bank Loans | | | — | | | | 4,959,037 | | | | — | | | | 4,959,037 | |
Convertible Preferred Stocks | | | 728,716 | | | | — | | | | — | | | | 728,716 | |
Common Stocks U.S. | | | 832,767 | | | | 98,206 | | | | — | | | | 930,973 | |
Short Term Investments | | | 451,851 | | | | — | | | | — | | | | 451,851 | |
Investment of Cash Collateral For Securities Loaned | | | 5,920,293 | | | | 6,662,931 | | | | — | | | | 12,583,224 | |
| | | | |
Total | | $ | 7,933,627 | | | $ | 53,737,989 | | | $ | — | | | $ | 61,671,616 | |
| | | | |
| | | | |
| 180 | | CALAMOS OPEN-END FAMILY OF FUNDS ANNUAL REPORT | | |
Notes to Financial Statements
| | | | | | | | | | | | | | | | |
| | | SHORT-TERM BOND FUND | |
| | | LEVEL 1 | | | LEVEL 2 | | | LEVEL 3 | | | TOTAL | |
| Assets: | | | | | | | | | | | | | | | | |
Corporate Bonds | | $ | — | | | $ | 11,957,542 | | | $ | — | | | $ | 11,957,542 | |
Bank Loans | | | — | | | | 501,584 | | | | — | | | | 501,584 | |
Asset Backed Securities | | | — | | | | 1,815,099 | | | | — | | | | 1,815,099 | |
Residential Mortgage Backed Securities | | | — | | | | 337,733 | | | | — | | | | 337,733 | |
Municipal Obligations | | | — | | | | 198,155 | | | | — | | | | 198,155 | |
Short Term Investments | | | 526,919 | | | | — | | | | — | | | | 526,919 | |
Investment of Cash Collateral For Securities Loaned | | | — | | | | 472,778 | | | | — | | | | 472,778 | |
| | | | |
Total | | $ | 526,919 | | | $ | 15,282,891 | | | $ | — | | | $ | 15,809,810 | |
| | | | |
Note 9 – Capital Share Transactions
The following table summarizes the activity in capital shares of the Funds for the year or period ended October 31, 2018:
| | | | | | | | | | | | | | | | | | | | | | | | |
| | | MARKET NEUTRAL
INCOME FUND | | | HEDGED EQUITY
INCOME FUND | | | PHINEUS LONG/SHORT FUND | |
| Class A | | Shares | | | Dollars | | | Shares | | | Dollars | | | Shares | | | Dollars | |
| Shares sold | | | 23,304,729 | | | $ | 313,766,420 | | | | 3,026,723 | | | $ | 34,707,585 | | | | 6,488,594 | | | $ | 81,785,520 | |
| Shares issued as reinvestment of distributions | | | 1,389,035 | | | | 18,438,255 | | | | 8,436 | | | | 98,050 | | | | 77,219 | | | | 962,149 | |
| Shares converted from class R | | | 456,993 | | | | 6,105,427 | | | | – | | | | – | | | | – | | | | – | |
| Less shares redeemed | | | (20,993,918 | ) | | | (282,581,777 | ) | | | (2,677,841 | ) | | | (30,489,455 | ) | | | (3,035,625 | ) | | | (38,072,768 | ) |
| | | | |
| Net increase (decrease) | | | 4,156,839 | | | $ | 55,728,325 | | | | 357,318 | | | $ | 4,316,180 | | | | 3,530,188 | | | $ | 44,674,901 | |
| | | | |
| | | | | | |
| Class C | | Shares | | | Dollars | | | Shares | | | Dollars | | | Shares | | | Dollars | |
| Shares sold | | | 5,044,232 | | | $ | 69,003,246 | | | | 41,040 | | | $ | 471,929 | | | | 2,677,188 | | | $ | 33,309,114 | |
| Shares issued as reinvestment of distributions | | | 410,720 | | | | 5,529,317 | | | | 8 | | | | 87 | | | | 32,298 | | | | 397,268 | |
| Less shares redeemed | | | (4,056,839 | ) | | | (55,404,303 | ) | | | (2,778 | ) | | | (30,004 | ) | | | (704,983 | ) | | | (8,639,555 | ) |
| | | | |
| Net increase (decrease) | | | 1,398,113 | | | $ | 19,128,260 | | | | 38,270 | | | $ | 442,012 | | | | 2,004,503 | | | $ | 25,066,827 | |
| | | | |
| | | | | | |
| Class I | | Shares | | | Dollars | | | Shares | | | Dollars | | | Shares | | | Dollars | |
| Shares sold | | | 201,073,177 | | | $ | 2,677,721,119 | | | | 7,299,401 | | | $ | 84,667,799 | | | | 72,928,696 | | | $ | 926,283,927 | |
| Shares issued as reinvestment of distributions | | | 8,642,306 | | | | 113,598,391 | | | | 16,925 | | | | 196,116 | | | | 392,138 | | | | 4,909,564 | |
| Less shares redeemed | | | (67,773,139 | ) | | | (900,807,963 | ) | | | (414,839 | ) | | | (4,747,085 | ) | | | (19,452,058 | ) | | | (243,175,678 | ) |
| | | | |
| Net increase (decrease) | | | 141,942,344 | | | $ | 1,890,511,547 | | | | 6,901,487 | | | $ | 80,116,830 | | | | 53,868,776 | | | $ | 688,017,813 | |
| | | | |
| | | | | | |
| Class R(a) | | Shares | | | Dollars | | | Shares | | | Dollars | | | Shares | | | Dollars | |
| Shares sold | | | 25,000 | | | $ | 332,597 | | | | — | | | $ | — | | | | — | | | $ | — | |
| Shares issued as reinvestment of distributions | | | 7,310 | | | | 96,131 | | | | — | | | | — | | | | — | | | | — | |
| Less shares redeemed | | | (58,819 | ) | | | (784,131 | ) | | | — | | | | — | | | | — | | | | — | |
| Shares converted to class A | | | (458,875 | ) | | | (6,105,427 | ) | | | — | | | | — | | | | — | | | | — | |
| | | | |
| Net increase (decrease) | | | (485,384 | ) | | $ | (6,460,830 | ) | | | — | | | $ | — | | | | — | | | $ | — | |
| | | | |
| | | | | | |
| Class R6 | | Shares | | | Dollars | | | Shares | | | Dollars | | | Shares | | | Dollars | |
| Shares sold | | | — | | | $ | — | | | | — | | | $ | — | | | | — | | | $ | — | |
| Shares issued as reinvestment of distributions | | | — | | | | — | | | | — | | | | — | | | | — | | | | — | |
| Less shares redeemed | | | — | | | | — | | | | — | | | | — | | | | — | | | | — | |
| | | | |
| Net increase (decrease) | | | — | | | $ | — | | | | — | | | $ | — | | | | — | | | $ | — | |
| | | | |
| (a) | Class R shares were converted into Class A shares at the close of business on February 22, 2018. |
Notes to Financial Statements
| | | | | | | | | | | | | | | | | | | | | | | | |
| | | CONVERTIBLE FUND | | | GLOBAL CONVERTIBLE FUND | | | GROWTH FUND | |
| Class A | | Shares | | | Dollars | | | Shares | | | Dollars | | | Shares | | | Dollars | |
| Shares sold | | | 2,490,392 | | | $ | 46,027,206 | | | | 769,987 | | | $ | 8,556,786 | | | | 1,045,901 | | | $ | 35,392,030 | |
| Shares issued as reinvestment of distributions | | | 445,294 | | | | 7,973,633 | | | | 44,303 | | | | 483,005 | | | | 3,302,766 | | | | 106,811,442 | |
| Shares converted from class R | | | 94,626 | | | | 1,692,856 | | | | 743 | | | | 8,253 | | | | 160,063 | | | | 5,406,928 | |
| Less shares redeemed | | | (3,539,359 | ) | | | (65,339,068 | ) | | | (911,638 | ) | | | (10,154,591 | ) | | | (6,039,038 | ) | | | (208,488,738 | ) |
| | | | |
| Net increase (decrease) | | | (509,047 | ) | | $ | (9,645,373 | ) | | | (96,605 | ) | | $ | (1,106,547 | ) | | | (1,530,308 | ) | | $ | (60,878,338 | ) |
| | | | |
| | | | | | |
| Class C | | Shares | | | Dollars | | | Shares | | | Dollars | | | Shares | | | Dollars | |
| Shares sold | | | 451,525 | | | $ | 8,239,481 | | | | 147,136 | | | $ | 1,617,477 | | | | 239,855 | | | $ | 5,182,517 | |
| Shares issued as reinvestment of distributions | | | 263,210 | | | | 4,631,349 | | | | 8,538 | | | | 91,739 | | | | 3,338,958 | | | | 68,882,701 | |
| Less shares redeemed | | | (1,653,755 | ) | | | (30,141,422 | ) | | | (51,663 | ) | | | (566,118 | ) | | | (4,283,795 | ) | | | (95,076,494 | ) |
| | | | |
| Net increase (decrease) | | | (939,020 | ) | | $ | (17,270,592 | ) | | | 104,011 | | | $ | 1,143,098 | | | | (704,982 | ) | | $ | (21,011,276 | ) |
| | | | |
| | | | | | |
| Class I | | Shares | | | Dollars | | | Shares | | | Dollars | | | Shares | | | Dollars | |
| Shares sold | | | 7,786,551 | | | $ | 129,978,184 | | | | 5,534,311 | | | $ | 61,616,069 | | | | 759,645 | | | $ | 34,701,111 | |
| Shares issued as reinvestment of distributions | | | 716,667 | | | | 11,544,487 | | | | 357,579 | | | | 3,907,030 | | | | 658,057 | | | | 27,862,157 | |
| Less shares redeemed | | | (5,674,347 | ) | | | (93,339,101 | ) | | | (2,791,104 | ) | | | (30,872,234 | ) | | | (1,597,541 | ) | | | (72,616,037 | ) |
| | | | |
| Net increase (decrease) | | | 2,828,871 | | | $ | 48,183,570 | | | | 3,100,786 | | | $ | 34,650,865 | | | | (179,839 | ) | | $ | (10,052,769 | ) |
| | | | |
| | | | | | |
| Class R(a) | | Shares | | | Dollars | | | Shares | | | Dollars | | | Shares | | | Dollars | |
| Shares sold | | | 2,804 | | | $ | 50,132 | | | | — | | | $ | — | | | | 14,470 | | | $ | 457,344 | |
| Shares issued as reinvestment of distributions | | | 2,260 | | | | 39,597 | | | | 23 | | | | 245 | | | | 19,006 | | | | 574,749 | |
| Less shares redeemed | | | (6,421 | ) | | | (115,787 | ) | | | — | | | | — | | | | (21,840 | ) | | | (702,726 | ) |
| Shares converted to class A | | | (95,040 | ) | | | (1,692,856 | ) | | | (747 | ) | | | (8,253 | ) | | | (171,252 | ) | | | (5,406,928 | ) |
| | | | |
| Net increase (decrease) | | | (96,397 | ) | | $ | (1,718,914 | ) | | | (724 | ) | | $ | (8,008 | ) | | | (159,616 | ) | | $ | (5,077,561 | ) |
| | | | |
| | | | | | |
| Class R6 | | Shares | | | Dollars | | | Shares | | | Dollars | | | Shares | | | Dollars | |
| Shares sold | | | — | | | $ | — | | | | — | | | $ | — | | | | — | | | $ | — | |
| Shares issued as reinvestment of distributions | | | — | | | | — | | | | — | | | | — | | | | — | | | | — | |
| Less shares redeemed | | | — | | | | — | | | | — | | | | — | | | | — | | | | — | |
| | | | |
| Net increase (decrease) | | | — | | | $ | — | | | | — | | | $ | — | | | | — | | | $ | — | |
| | | | |
| (a) | Class R shares were converted into Class A shares at the close of business on February 22, 2018. |
| | | | |
| 182 | | CALAMOS OPEN-END FAMILY OF FUNDS ANNUAL REPORT | | |
Notes to Financial Statements
| | | | | | | | | | | | | | | | | | | | | | | | |
| | | GROWTH AND INCOME FUND | | | DIVIDEND GROWTH FUND | | | OPPORTUNISTIC VALUE FUND | |
| Class A | | Shares | | | Dollars | | | Shares | | | Dollars | | | Shares | | | Dollars | |
| Shares sold | | | 1,828,279 | | | $ | 60,648,514 | | | | 36,621 | | | $ | 457,419 | | | | 68,060 | | | $ | 1,062,665 | |
| Shares issued as reinvestment of distributions | | | 1,668,011 | | | | 53,417,704 | | | | 13,502 | | | | 163,449 | | | | 47,295 | | | | 712,264 | |
| Shares converted from class R | | | 348,363 | | | | 11,447,223 | | | | — | | | | — | | | | 9,856 | | | | 151,294 | |
| Less shares redeemed | | | (5,973,982 | ) | | | (199,006,475 | ) | | | (19,572 | ) | | | (247,248 | ) | | | (175,440 | ) | | | (2,724,491 | ) |
| | | | |
| Net increase (decrease) | | | (2,129,329 | ) | | $ | (73,493,034 | ) | | | 30,551 | | | $ | 373,620 | | | | (50,229 | ) | | $ | (798,268 | ) |
| | | | |
| | | | | | |
| Class C | | Shares | | | Dollars | | | Shares | | | Dollars | | | Shares | | | Dollars | |
| Shares sold | | | 620,929 | | | $ | 20,716,983 | | | | 9,121 | | | $ | 111,383 | | | | 3,505 | | | $ | 49,331 | |
| Shares issued as reinvestment of distributions | | | 1,010,250 | | | | 32,400,402 | | | | 6,653 | | | | 79,037 | | | | 10,988 | | | | 149,333 | |
| Less shares redeemed | | | (3,510,401 | ) | | | (117,073,601 | ) | | | (13,712 | ) | | | (170,222 | ) | | | (45,143 | ) | | | (637,684 | ) |
| | | | |
| Net increase (decrease) | | | (1,879,222 | ) | | $ | (63,956,216 | ) | | | 2,062 | | | $ | 20,198 | | | | (30,650 | ) | | $ | (439,020 | ) |
| | | | |
| | | | | | |
| Class I | | Shares | | | Dollars | | | Shares | | | Dollars | | | Shares | | | Dollars | |
| Shares sold | | | 5,419,973 | | | $ | 174,411,586 | | | | 131,156 | | | $ | 1,670,092 | | | | 29,642 | | | $ | 473,387 | |
| Shares issued as reinvestment of distributions | | | 1,302,327 | | | | 40,205,524 | | | | 153,479 | | | | 1,856,415 | | | | 57,863 | | | | 893,972 | |
| Less shares redeemed | | | (3,503,146 | ) | | | (111,683,122 | ) | | | (361,307 | ) | | | (4,527,798 | ) | | | (344,243 | ) | | | (5,499,472 | ) |
| | | | |
| Net increase (decrease) | | | 3,219,154 | | | $ | 102,933,988 | | | | (76,672 | ) | | $ | (1,001,291 | ) | | | (256,738 | ) | | $ | (4,132,113 | ) |
| | | | |
| | | | | | |
| Class R(a) | | Shares | | | Dollars | | | Shares | | | Dollars | | | Shares | | | Dollars | |
| Shares sold | | | 15,639 | | | $ | 506,978 | | | | — | | | $ | — | | | | 291 | | | $ | 4,471 | |
| Shares issued as reinvestment of distributions | | | 19,246 | | | | 606,450 | | | | — | | | | — | | | | 80 | | | | 1,186 | |
| Less shares redeemed | | | (44,626 | ) | | | (1,457,529 | ) | | | — | | | | — | | | | (1,114 | ) | | | (16,621 | ) |
| Shares converted to class A | | | (351,366 | ) | | | (11,447,223 | ) | | | — | | | | — | | | | (9,994 | ) | | | (151,294 | ) |
| | | | |
| Net increase (decrease) | | | (361,107 | ) | | $ | (11,791,324 | ) | | | — | | | $ | — | | | | (10,737 | ) | | $ | (162,258 | ) |
| | | | |
| | | | | | |
| Class R6 | | Shares | | | Dollars | | | Shares | | | Dollars | | | Shares | | | Dollars | |
| Shares sold | | | — | | | $ | — | | | | — | | | $ | — | | | | — | | | $ | — | |
| Shares issued as reinvestment of distributions | | | — | | | | — | | | | — | | | | — | | | | — | | | | — | |
| Less shares redeemed | | | — | | | | — | | | | — | | | | — | | | | — | | | | — | |
| | | | |
| Net increase (decrease) | | | — | | | $ | — | | | | — | | | $ | — | | | | — | | | $ | — | |
| | | | |
| (a) | Class R shares were converted into Class A shares at the close of business on February 22, 2018. |
Notes to Financial Statements
| | | | | | | | | | | | | | | | | | | | | | | | |
| | | INTERNATIONAL GROWTH FUND | | | EVOLVING WORLD GROWTH FUND | | | EMERGING MARKET EQUITY FUND | |
| Class A | | Shares | | | Dollars | | | Shares | | | Dollars | | | Shares | | | Dollars | |
| Shares sold | | | 3,560,783 | | | $ | 77,582,022 | | | | 793,820 | | | $ | 12,006,694 | | | | 16,938 | | | $ | 182,579 | |
| Shares issued as reinvestment of distributions | | | 188,722 | | | | 3,940,528 | | | | 550 | | | | 8,122 | | | | 887 | | | | 9,320 | |
| Shares converted from class R | | | 312,475 | | | | 6,808,822 | | | | 145,134 | | | | 2,303,279 | | | | — | | | | — | |
| Less shares redeemed | | | (4,134,915 | ) | | | (87,647,764 | ) | | | (2,769,557 | ) | | | (41,240,663 | ) | | | (12,255 | ) | | | (126,537 | ) |
| | | | |
| Net increase (decrease) | | | (72,935 | ) | | $ | 683,608 | | | | (1,830,053 | ) | | $ | (26,922,568 | ) | | | 5,570 | | | $ | 65,362 | |
| | | | |
| | | | | | |
| Class C | | Shares | | | Dollars | | | Shares | | | Dollars | | | Shares | | | Dollars | |
| Shares sold | | | 77,422 | | | $ | 1,510,861 | | | | 175,178 | | | $ | 2,500,143 | | | | 4,210 | | | $ | 41,438 | |
| Shares issued as reinvestment of distributions | | | 54,710 | | | | 1,040,583 | | | | — | | | | — | | | | — | | | | — | |
| Less shares redeemed | | | (295,417 | ) | | | (5,656,723 | ) | | | (440,136 | ) | | | (6,102,909 | ) | | | (7,248 | ) | | | (71,644 | ) |
| | | | |
| Net increase (decrease) | | | (163,285 | ) | | $ | (3,105,279 | ) | | | (264,958 | ) | | $ | (3,602,766 | ) | | | (3,038 | ) | | $ | (30,206 | ) |
| | | | |
| | | | | | |
| Class I | | Shares | | | Dollars | | | Shares | | | Dollars | | | Shares | | | Dollars | |
| Shares sold | | | 1,908,475 | | | $ | 41,551,059 | | | | 3,062,969 | | | $ | 46,063,386 | | | | 109,133 | | | $ | 1,222,231 | |
| Shares issued as reinvestment of distributions | | | 295,866 | | | | 6,316,729 | | | | 59,671 | | | | 885,521 | | | | 4,307 | | | | 45,350 | |
| Less shares redeemed | | | (1,893,024 | ) | | | (41,115,312 | ) | | | (6,143,599 | ) | | | (92,860,230 | ) | | | (91,379 | ) | | | (903,361 | ) |
| | | | |
| Net increase (decrease) | | | 311,317 | | | $ | 6,752,476 | | | | (3,020,959 | ) | | $ | (45,911,323 | ) | | | 22,061 | | | $ | 364,220 | |
| | | | |
| | | | | | |
| Class R(a) | | Shares | | | Dollars | | | Shares | | | Dollars | | | Shares | | | Dollars | |
| Shares sold | | | 26,978 | | | $ | 574,860 | | | | 11,039 | | | $ | 168,394 | | | | — | | | $ | — | |
| Shares issued as reinvestment of distributions | | | 9,239 | | | | 188,200 | | | | — | | | | — | | | | — | | | | — | |
| Less shares redeemed | | | (36,825 | ) | | | (787,976 | ) | | | (58,709 | ) | | | (888,872 | ) | | | — | | | | — | |
| Shares converted to class A | | | (320,427 | ) | | | (6,808,822 | ) | | | (147,156 | ) | | | (2,303,279 | ) | | | — | | | | — | |
| | | | |
| Net increase (decrease) | | | (321,035 | ) | | $ | (6,833,738 | ) | | | (194,826 | ) | | $ | (3,023,757 | ) | | | — | | | $ | — | |
| | | | |
| | | | | | |
| Class R6(b) | | Shares | | | Dollars | | | Shares | | | Dollars | | | Shares | | | Dollars | |
| Shares sold | | | 1,197 | | | $ | 25,000 | | | | — | | | $ | — | | | | — | | | $ | — | |
| Shares issued as reinvestment of distributions | | | — | | | | — | | | | — | | | | — | | | | — | | | | — | |
| Less shares redeemed | | | — | | | | — | | | | — | | | | — | | | | — | | | | — | |
| | | | |
| Net increase (decrease) | | | 1,197 | | | $ | 25,000 | | | | — | | | $ | — | | | | — | | | $ | — | |
| | | | |
| (a) | Class R shares were converted into Class A shares at the close of business on February 22, 2018. |
| (b) | International Growth Fund Class R6 commenced operations on September 17, 2018. |
| | | | |
| 184 | | CALAMOS OPEN-END FAMILY OF FUNDS ANNUAL REPORT | | |
Notes to Financial Statements
| | | | | | | | | | | | | | | | | | | | | | | | |
| | | GLOBAL EQUITY FUND | | | GLOBAL GROWTH AND INCOME FUND | | | TOTAL RETURN BOND FUND | |
| Class A | | Shares | | | Dollars | | | Shares | | | Dollars | | | Shares | | | Dollars | |
| Shares sold | | | 346,836 | | | $ | 5,221,585 | | | | 544,702 | | | $ | 5,257,205 | | | | 168,855 | | | $ | 1,706,191 | |
| Shares issued as reinvestment of distributions | | | 126,959 | | | | 1,837,097 | | | | 420,944 | | | | 3,955,552 | | | | 51,227 | | | | 517,633 | |
| Shares converted from class R | | | 357,072 | | | | 5,398,935 | | | | 104,769 | | | | 1,016,255 | | | | 61,291 | | | | 614,140 | |
| Less shares redeemed | | | (535,449 | ) | | | (8,085,122 | ) | | | (1,993,126 | ) | | | (19,270,396 | ) | | | (626,257 | ) | | | (6,288,448 | ) |
| | | | |
| Net increase (decrease) | | | 295,418 | | | $ | 4,372,495 | | | | (922,711 | ) | | $ | (9,041,384 | ) | | | (344,884 | ) | | $ | (3,450,484 | ) |
| | | | |
| | | | | | |
| Class C | | Shares | | | Dollars | | | Shares | | | Dollars | | | Shares | | | Dollars | |
| Shares sold | | | 83,432 | | | $ | 1,145,132 | | | | 291,472 | | | $ | 2,491,887 | | | | 67,659 | | | $ | 686,541 | |
| Shares issued as reinvestment of distributions | | | 86,016 | | | | 1,135,416 | | | | 489,662 | | | | 4,088,680 | | | | 18,552 | | | | 187,881 | |
| Less shares redeemed | | | (243,411 | ) | | | (3,334,186 | ) | | | (1,901,384 | ) | | | (16,249,536 | ) | | | (330,688 | ) | | | (3,351,059 | ) |
| | | | |
| Net increase (decrease) | | | (73,963 | ) | | $ | (1,053,638 | ) | | | (1,120,250 | ) | | $ | (9,668,969 | ) | | | (244,477 | ) | | $ | (2,476,637 | ) |
| | | | |
| | | | | | |
| Class I | | Shares | | | Dollars | | | Shares | | | Dollars | | | Shares | | | Dollars | |
| Shares sold | | | 1,007,980 | | | $ | 15,534,006 | | | | 2,678,700 | | | $ | 26,661,221 | | | | 1,193,049 | | | $ | 12,036,831 | |
| Shares issued as reinvestment of distributions | | | 506,670 | | | | 7,488,587 | | | | 429,390 | | | | 4,152,611 | | | | 137,422 | | | | 1,386,984 | |
| Less shares redeemed | | | (2,764,474 | ) | | | (43,444,918 | ) | | | (2,487,651 | ) | | | (24,606,215 | ) | | | (1,854,902 | ) | | | (18,617,344 | ) |
| | | | |
| Net increase (decrease) | | | (1,249,824 | ) | | $ | (20,422,325 | ) | | | 620,439 | | | $ | 6,207,617 | | | | (524,431 | ) | | $ | (5,193,529 | ) |
| | | | |
| | | | | | |
| Class R(a) | | Shares | | | Dollars | | | Shares | | | Dollars | | | Shares | | | Dollars | |
| Shares sold | | | 61,091 | | | $ | 901,022 | | | | 5,432 | | | $ | 51,418 | | | | 25,219 | | | $ | 257,282 | |
| Shares issued as reinvestment of distributions | | | 28,155 | | | | 394,456 | | | | 5,692 | | | | 52,426 | | | | 162 | | | | 1,666 | |
| Less shares redeemed | | | (57,612 | ) | | | (838,534 | ) | | | (34,928 | ) | | | (335,371 | ) | | | (1,672 | ) | | | (17,048 | ) |
| Shares converted to class A | | | (368,961 | ) | | | (5,398,935 | ) | | | (106,802 | ) | | | (1,016,255 | ) | | | (61,421 | ) | | | (614,140 | ) |
| | | | |
| Net increase (decrease) | | | (337,327 | ) | | $ | (4,941,991 | ) | | | (130,606 | ) | | $ | (1,247,782 | ) | | | (37,712 | ) | | $ | (372,240 | ) |
| | | | |
| | | | | | |
| Class R6 | | Shares | | | Dollars | | | Shares | | | Dollars | | | Shares | | | Dollars | |
| Shares sold | | | — | | | $ | — | | | | — | | | $ | — | | | | — | | | $ | — | |
| Shares issued as reinvestment of distributions | | | — | | | | — | | | | — | | | | — | | | | — | | | | — | |
| Less shares redeemed | | | — | | | | — | | | | — | | | | — | | | | — | | | | — | |
| | | | |
| Net increase (decrease) | | | — | | | $ | — | | | | — | | | $ | — | | | | — | | | $ | — | |
| | | | |
| (a) | Class R shares were converted into Class A shares at the close of business on February 22, 2018. |
Notes to Financial Statements
| | | | | | | | | | | | | | | | |
| | | HIGH INCOME OPPORTUNITIES FUND | | | SHORT-TERM BOND FUND(b) | |
| Class A | | Shares | | | Dollars | | | Shares | | | Dollars | |
| Shares sold | | | 995,944 | | | $ | 8,579,913 | | | | 2,500 | | | $ | 25,000 | |
| Shares issued as reinvestment of distributions | | | 221,549 | | | | 1,906,178 | | | | 8 | | | | 81 | |
| Shares converted from class R | | | 13,166 | | | | 114,548 | | | | — | | | | — | |
| Less shares redeemed | | | (1,475,277 | ) | | | (12,733,842 | ) | | | — | | | | — | |
| | | | |
| Net increase (decrease) | | | (244,618 | ) | | $ | (2,133,203 | ) | | | 2,508 | | | $ | 25,081 | |
| | | | |
| | | | |
| Class C | | Shares | | | Dollars | | | Shares | | | Dollars | |
| Shares sold | | | 21,467 | | | $ | 198,026 | | | | — | | | $ | — | |
| Shares issued as reinvestment of distributions | | | 61,066 | | | | 553,202 | | | | — | | | | — | |
| Less shares redeemed | | | (401,593 | ) | | | (3,653,160 | ) | | | — | | | | — | |
| | | | |
| Net increase (decrease) | | | (319,060 | ) | | $ | (2,901,932 | ) | | | — | | | $ | — | |
| | | | |
| | | | |
| Class I | | Shares | | | Dollars | | | Shares | | | Dollars | |
| Shares sold | | | 348,933 | | | $ | 3,017,151 | | | | 3,015 | | | $ | 30,140 | |
| Shares acquired through In-Kind purchases | | | — | | | | — | | | | 1,507,400 | | | | 15,074,001 | |
| Shares issued as reinvestment of distributions | | | 55,269 | | | | 475,680 | | | | 5,418 | | | | 54,087 | |
| Less shares redeemed | | | (614,914 | ) | | | (5,339,800 | ) | | | (422 | ) | | | (4,205 | ) |
| | | | |
| Net increase (decrease) | | | (210,712 | ) | | $ | (1,846,969 | ) | | | 1,515,411 | | | $ | 15,154,023 | |
| | | | |
| | | | |
| Class R(a) | | Shares | | | Dollars | | | Shares | | | Dollars | |
| Shares sold | | | 646 | | | $ | 5,668 | | | | — | | | $ | — | |
| Shares issued as reinvestment of distributions | | | 174 | | | | 1,527 | | | | — | | | | — | |
| Less shares redeemed | | | (1,543 | ) | | | (13,638 | ) | | | — | | | | — | �� |
| Shares converted to class A | | | (13,211 | ) | | | (114,548 | ) | | | — | | | | — | |
| | | | |
| Net increase (decrease) | | | (13,934 | ) | | $ | (120,991 | ) | | | — | | | $ | — | |
| | | | |
| | | | |
| Class R6 | | Shares | | | Dollars | | | Shares | | | Dollars | |
| Shares sold | | | — | | | $ | — | | | | — | | | $ | — | |
| Shares issued as reinvestment of distributions | | | — | | | | — | | | | — | | | | — | |
| Less shares redeemed | | | — | | | | — | | | | — | | | | — | |
| | | | |
| Net increase (decrease) | | | — | | | $ | — | | | | — | | | $ | — | |
| | | | |
| (a) | Class R shares were converted into Class A shares at the close of business on February 22, 2018. |
| (b) | Short-Term Bond Fund commenced operations on September 19, 2018. |
| | | | |
| 186 | | CALAMOS OPEN-END FAMILY OF FUNDS ANNUAL REPORT | | |
Notes to Financial Statements
The following table summarizes the activity in capital shares of the Funds for the year ended October 31, 2017:
| | | | | | | | | | | | | | | | | | | | | | | | |
| | | MARKET NEUTRAL INCOME FUND | | | HEDGED EQUITY INCOME FUND | | | PHINEUS LONG/SHORT FUND | |
| Class A | | Shares | | | Dollars | | | Shares | | | Dollars | | | Shares | | | Dollars | |
| Shares sold | | | 21,809,752 | | | $ | 288,217,457 | | | | 229,714 | | | $ | 2,379,482 | | | | 5,918,551 | | | $ | 71,210,101 | |
| Shares issued as reinvestment of distributions | | | 1,654,029 | | | | 21,633,797 | | | | 4,200 | | | | 43,240 | | | | 15,592 | | | | 181,954 | |
| Shares converted from class B | | | 11,244 | | | | 149,539 | | | | — | | | | — | | | | — | | | | — | |
| Less shares redeemed | | | (46,555,325 | ) | | | (615,948,605 | ) | | | (1,165,890 | ) | | | (12,155,368 | ) | | | (1,876,910 | ) | | | (22,474,406 | ) |
| | | | |
| Net increase (decrease) | | | (23,080,300 | ) | | $ | (305,947,812 | ) | | | (931,976 | ) | | $ | (9,732,646 | ) | | | 4,057,233 | | | $ | 48,917,649 | |
| | | | |
| | | | | | |
| Class B(a) | | Shares | | | Dollars | | | Shares | | | Dollars | | | Shares | | | Dollars | |
| Shares sold | | | 34 | | | $ | 472 | | | | — | | | $ | — | | | | — | | | $ | — | |
| Shares issued as reinvestment of distributions | | | 313 | | | | 4,353 | | | | — | | | | — | | | | — | | | | — | |
| Shares converted to class A | | | (10,542 | ) | | | (149,539 | ) | | | — | | | | — | | | | — | | | | — | |
| Less shares redeemed | | | (25,818 | ) | | | (361,652 | ) | | | — | | | | — | | | | — | | | | — | |
| | | | |
| Net increase (decrease) | | | (36,013 | ) | | $ | (506,366 | ) | | | — | | | $ | — | | | | — | | | $ | — | |
| | | | |
| | | | | | |
| Class C | | Shares | | | Dollars | | | Shares | | | Dollars | | | Shares | | | Dollars | |
| Shares sold | | | 3,546,155 | | | $ | 47,603,403 | | | | 1,392 | | | $ | 14,704 | | | | 2,057,953 | | | $ | 24,608,557 | |
| Shares issued as reinvestment of distributions | | | 342,645 | | | | 4,544,452 | | | | 41 | | | | 425 | | | | 4,605 | | | | 53,460 | |
| Less shares redeemed | | | (7,104,810 | ) | | | (95,465,679 | ) | | | (966 | ) | | | (10,085 | ) | | | (148,737 | ) | | | (1,754,869 | ) |
| | | | |
| Net increase (decrease) | | | (3,216,010 | ) | | $ | (43,317,824 | ) | | | 467 | | | $ | 5,044 | | | | 1,913,821 | | | $ | 22,907,148 | |
| | | | |
| | | | | | |
| Class I | | Shares | | | Dollars | | | Shares | | | Dollars | | | Shares | | | Dollars | |
| Shares sold | | | 141,201,499 | | | $ | 1,847,652,277 | | | | 658,780 | | | $ | 6,979,240 | | | | 26,382,480 | | | $ | 319,010,843 | |
| Shares issued as reinvestment of distributions | | | 5,468,217 | | | | 70,919,796 | | | | 10,792 | | | | 113,498 | | | | 50,070 | | | | 585,816 | |
| Less shares redeemed | | | (64,456,477 | ) | | | (843,868,311 | ) | | | (373,898 | ) | | | (3,971,061 | ) | | | (3,483,664 | ) | | | (42,439,648 | ) |
| | | | |
| Net increase (decrease) | | | 82,213,239 | | | $ | 1,074,703,762 | | | | 295,674 | | | $ | 3,121,677 | | | | 22,948,886 | | | $ | 277,157,011 | |
| | | | |
| | | | | | |
| Class R(b) | | Shares | | | Dollars | | | Shares | | | Dollars | | | Shares | | | Dollars | |
| Shares sold | | | 185,761 | | | $ | 2,444,666 | | | | — | | | $ | — | | | | — | | | $ | — | |
| Shares issued as reinvestment of distributions | | | 10,348 | | | | 134,876 | | | | — | | | | — | | | | — | | | | — | |
| Less shares redeemed | | | (361,746 | ) | | | (4,778,397 | ) | | | (10,223 | ) | | | (104,618 | ) | | | — | | | | — | |
| | | | |
| Net increase (decrease) | | | (165,637 | ) | | $ | (2,198,855 | ) | | | (10,223 | ) | | $ | (104,618 | ) | | | — | | | $ | — | |
| | | | |
| | | | | | |
| Class T(c) | | Shares | | | Dollars | | | Shares | | | Dollars | | | Shares | | | Dollars | |
| Shares sold | | | 1,891 | | | $ | 25,000 | | | | 2,376 | | | $ | 25,000 | | | | 2,119 | | | $ | 25,000 | |
| Less shares redeemed | | | (1,891 | ) | | | (25,302 | ) | | | (2,376 | ) | | | (25,618 | ) | | | (2,119 | ) | | | (26,133 | ) |
| | | | |
| Net increase (decrease) | | | — | | | $ | (302 | ) | | | — | | | $ | (618 | ) | | | — | | | $ | (1,133 | ) |
| | | | |
| (a) | Class B shares were converted into Class A shares at the close of business on July 3, 2017. |
| (b) | Class R shares were liquidated on January 23, 2017. |
| (c) | Class T commenced operations on February 28, 2017 and shares were liquidated on October 26, 2017. |
Notes to Financial Statements
| | | | | | | | | | | | | | | | | | | | | | | | |
| | | CONVERTIBLE FUND | | | GLOBAL CONVERTIBLE FUND | | | GROWTH FUND | |
| Class A | | Shares | | | Dollars | | | Shares | | | Dollars | | | Shares | | | Dollars | |
| Shares sold | | | 3,984,897 | | | $ | 67,754,277 | | | | 1,550,252 | | | $ | 16,157,712 | | | | 2,601,224 | | | $ | 85,169,257 | |
| Shares issued as reinvestment of distributions | | | 228,135 | | | | 3,777,198 | | | | 25,305 | | | | 251,672 | | | | 1,224,344 | | | | 36,216,101 | |
| Shares converted from class B | | | 30,017 | | | | 519,892 | | | | — | | | | — | | | | 32,025 | | | | 1,066,420 | |
| Less shares redeemed | | | (6,421,325 | ) | | | (108,531,659 | ) | | | (3,378,936 | ) | | | (35,740,967 | ) | | | (10,407,382 | ) | | | (331,020,189 | ) |
| | | | |
| Net increase (decrease) | | | (2,178,276 | ) | | $ | (36,480,292 | ) | | | (1,803,379 | ) | | $ | (19,331,583 | ) | | | (6,549,789 | ) | | $ | (208,568,411 | ) |
| | | | |
| | | | | | |
| Class B(a) | | Shares | | | Dollars | | | Shares | | | Dollars | | | Shares | | | Dollars | |
| Shares sold | | | 67 | | | $ | 1,413 | | | | — | | | $ | — | | | | 234 | | | $ | 6,234 | |
| Shares issued as reinvestment of distributions | | | 613 | | | | 12,855 | | | | — | | | | — | | | | 7,229 | | | | 192,505 | |
| Shares converted to class A | | | (23,067 | ) | | | (519,892 | ) | | | — | | | | — | | | | (35,721 | ) | | | (1,066,420 | ) |
| Less shares redeemed | | | (168,336 | ) | | | (3,602,455 | ) | | | — | | | | — | | | | (191,968 | ) | | | (5,356,510 | ) |
| | | | |
| Net increase (decrease) | | | (190,723 | ) | | $ | (4,108,079 | ) | | | — | | | $ | — | | | | (220,226 | ) | | $ | (6,224,191 | ) |
| | | | |
| | | | | | |
| Class C | | Shares | | | Dollars | | | Shares | | | Dollars | | | Shares | | | Dollars | |
| Shares sold | | | 288,413 | | | $ | 4,836,026 | | | | 126,493 | | | $ | 1,340,655 | | | | 559,366 | | | $ | 11,618,420 | |
| Shares issued as reinvestment of distributions | | | 108,187 | | | | 1,759,129 | | | | 1,739 | | | | 17,384 | | | | 1,177,543 | | | | 23,927,671 | |
| Less shares redeemed | | | (4,508,178 | ) | | | (75,412,207 | ) | | | (116,735 | ) | | | (1,203,798 | ) | | | (10,958,232 | ) | | | (241,650,900 | ) |
| | | | |
| Net increase (decrease) | | | (4,111,578 | ) | | $ | (68,817,052 | ) | | | 11,497 | | | $ | 154,241 | | | | (9,221,323 | ) | | $ | (206,104,809 | ) |
| | | | |
| | | | | | |
| Class I | | Shares | | | Dollars | | | Shares | | | Dollars | | | Shares | | | Dollars | |
| Shares sold | | | 5,735,409 | | | $ | 87,769,797 | | | | 6,238,579 | | | $ | 66,840,028 | | | | 1,771,306 | | | $ | 71,841,735 | |
| Shares issued as reinvestment of distributions | | | 319,581 | | | | 4,786,811 | | | | 80,483 | | | | 832,389 | | | | 240,850 | | | | 9,039,128 | |
| Less shares redeemed | | | (8,457,705 | ) | | | (127,450,124 | ) | | | (3,022,710 | ) | | | (31,481,137 | ) | | | (3,999,585 | ) | | | (161,794,781 | ) |
| | | | |
| Net increase (decrease) | | | (2,402,715 | ) | | $ | (34,893,516 | ) | | | 3,296,352 | | | $ | 36,191,280 | | | | (1,987,429 | ) | | $ | (80,913,918 | ) |
| | | | |
| | | | | | |
| Class R | | Shares | | | Dollars | | | Shares | | | Dollars | | | Shares | | | Dollars | |
| Shares sold | | | 18,593 | | | $ | 316,073 | | | | 12,378 | | | $ | 125,851 | | | | 42,737 | | | $ | 1,273,403 | |
| Shares issued as reinvestment of distributions | | | 1,248 | | | | 20,524 | | | | 462 | | | | 4,665 | | | | 9,051 | | | | 253,058 | |
| Less shares redeemed | | | (31,304 | ) | | | (519,535 | ) | | | (57,696 | ) | | | (627,440 | ) | | | (152,007 | ) | | | (4,608,645 | ) |
| | | | |
| Net increase (decrease) | | | (11,463 | ) | | $ | (182,938 | ) | | | (44,856 | ) | | $ | (496,924 | ) | | | (100,219 | ) | | $ | (3,082,184 | ) |
| | | | |
| | | | | | |
| Class T(b) | | Shares | | | Dollars | | | Shares | | | Dollars | | | Shares | | | Dollars | |
| Shares sold | | | 1,484 | | | $ | 25,000 | | | | 2,456 | | | $ | 25,000 | | | | 792 | | | $ | 25,000 | |
| Less shares redeemed | | | (1,484 | ) | | | (26,675 | ) | | | (2,456 | ) | | | (27,286 | ) | | | (792 | ) | | | (27,727 | ) |
| | | | |
| Net increase (decrease) | | | — | | | $ | (1,675 | ) | | | — | | | $ | (2,286 | ) | | | — | | | $ | (2,727 | ) |
| | | | |
| (a) | Class B shares were converted into Class A shares at the close of business on July 3, 2017. |
| (b) | Class T commenced operations on February 28, 2017 and shares were liquidated on October 26, 2017. |
| | | | |
| 188 | | CALAMOS OPEN-END FAMILY OF FUNDS ANNUAL REPORT | | |
Notes to Financial Statements
| | | | | | | | | | | | | | | | | | | | | | | | |
| | | GROWTH AND INCOME FUND | | | DIVIDEND GROWTH FUND | | | OPPORTUNISTIC VALUE FUND | |
| Class A | | Shares | | | Dollars | | | Shares | | | Dollars | | | Shares | | | Dollars | |
| Shares sold | | | 3,777,741 | | | $ | 119,020,123 | | | | 509,052 | | | $ | 5,513,492 | | | | 230,979 | | | $ | 3,128,149 | |
| Shares issued as reinvestment of distributions | | | 1,805,326 | | | | 54,495,015 | | | | 7,189 | | | | 79,969 | | | | 17,447 | | | | 238,151 | |
| Shares converted from class B | | | 25,222 | | | | 796,749 | | | | — | | | | — | | | | 1,608 | | | | 22,776 | |
| Less shares redeemed | | | (8,742,755 | ) | | | (272,081,567 | ) | | | (2,587,636 | ) | | | (30,126,760 | ) | | | (1,378,663 | ) | | | (19,132,359 | ) |
| | | | |
| Net increase (decrease) | | | (3,134,466 | ) | | $ | (97,769,680 | ) | | | (2,071,395 | ) | | $ | (24,533,299 | ) | | | (1,128,629 | ) | | $ | (15,743,283 | ) |
| | | | |
| | | | | | |
| Class B(a) | | Shares | | | Dollars | | | Shares | | | Dollars | | | Shares | | | Dollars | |
| Shares sold | | | 1,234 | | | $ | 46,381 | | | | — | | | $ | — | | | | — | | | $ | — | |
| Shares issued as reinvestment of distributions | | | 3,326 | | | | 121,506 | | | | — | | | | — | | | | — | | | | — | |
| Shares converted to class A | | | (20,587 | ) | | | (796,749 | ) | | | — | | | | — | | | | (1,741 | ) | | | (22,776 | ) |
| Less shares redeemed | | | (80,438 | ) | | | (3,007,950 | ) | | | — | | | | — | | | | (6,220 | ) | | | (79,099 | ) |
| | | | |
| Net increase (decrease) | | | (96,465 | ) | | $ | (3,636,812 | ) | | | — | | | $ | — | | | | (7,961 | ) | | $ | (101,875 | ) |
| | | | |
| | | | | | |
| Class C | | Shares | | | Dollars | | | Shares | | | Dollars | | | Shares | | | Dollars | |
| Shares sold | | | 688,905 | | | $ | 21,218,249 | | | | 25,198 | | | $ | 267,584 | | | | 68,958 | | | $ | 845,613 | |
| Shares issued as reinvestment of distributions | | | 1,093,204 | | | | 33,026,832 | | | | 200 | | | | 2,236 | | | | 212 | | | | 2,636 | |
| Less shares redeemed | | | (8,959,162 | ) | | | (280,900,715 | ) | | | (36,816 | ) | | | (410,532 | ) | | | (156,467 | ) | | | (1,981,119 | ) |
| | | | |
| Net increase (decrease) | | | (7,177,053 | ) | | $ | (226,655,634 | ) | | | (11,418 | ) | | $ | (140,712 | ) | | | (87,297 | ) | | $ | (1,132,870 | ) |
| | | | |
| | | | | | |
| Class I | | Shares | | | Dollars | | | Shares | | | Dollars | | | Shares | | | Dollars | |
| Shares sold | | | 6,605,429 | | | $ | 198,145,185 | | | | 1,843,292 | | | $ | 21,833,354 | | | | 937,119 | | | $ | 13,399,501 | |
| Shares issued as reinvestment of distributions | | | 1,102,432 | | | | 32,173,200 | | | | 13,088 | | | | 155,496 | | | | 11,927 | | | | 166,853 | |
| Less shares redeemed | | | (7,973,494 | ) | | | (238,550,682 | ) | | | (878,906 | ) | | | (10,274,906 | ) | | | (594,707 | ) | | | (8,641,485 | ) |
| | | | |
| Net increase (decrease) | | | (265,633 | ) | | $ | (8,232,297 | ) | | | 977,474 | | | $ | 11,713,944 | | | | 354,339 | | | $ | 4,924,869 | |
| | | | |
| | | | | | |
| Class R(b) | | Shares | | | Dollars | | | Shares | | | Dollars | | | Shares | | | Dollars | |
| Shares sold | | | 134,902 | | | $ | 4,209,111 | | | | — | | | $ | — | | | | 1,204 | | | $ | 16,815 | |
| Shares issued as reinvestment of distributions | | | 24,431 | | | | 731,321 | | | | — | | | | — | | | | 6 | | | | 86 | |
| Less shares redeemed | | | (241,126 | ) | | | (7,566,968 | ) | | | (10,725 | ) | | | (118,095 | ) | | | (224 | ) | | | (3,186 | ) |
| | | | |
| Net increase (decrease) | | | (81,793 | ) | | $ | (2,626,536 | ) | | | (10,725 | ) | | $ | (118,095 | ) | | | 986 | | | $ | 13,715 | |
| | | | |
| | | | | | |
| Class T(c) | | Shares | | | Dollars | | | Shares | | | Dollars | | | Shares | | | Dollars | |
| Shares sold | | | 805 | | | $ | 25,000 | | | | 2,161 | | | $ | 25,000 | | | | 1,782 | | | $ | 25,000 | |
| Less shares redeemed | | | (805 | ) | | | (26,459 | ) | | | (2,161 | ) | | | (27,215 | ) | | | (1,782 | ) | | | (26,844 | ) |
| | | | |
| Net increase (decrease) | | | — | | | $ | (1,459 | ) | | | — | | | $ | (2,215 | ) | | | — | | | $ | (1,844 | ) |
| | | | |
| (a) | Class B shares were converted into Class A shares at the close of business on July 3, 2017. |
| (b) | Class R shares were liquidated on January 23, 2017. |
| (c) | Class T commenced operations on February 28, 2017 and shares were liquidated on October 26, 2017. |
Notes to Financial Statements
| | | | | | | | | | | | | | | | | | | | | | | | |
| | | INTERNATIONAL GROWTH FUND | | | EVOLVING WORLD GROWTH FUND | | | EMERGING MARKET EQUITY FUND | |
| Class A | | Shares | | | Dollars | | | Shares | | | Dollars | | | Shares | | | Dollars | |
| Shares sold | | | 560,732 | | | $ | 10,124,084 | | | | 1,782,311 | | | $ | 22,421,073 | | | | 8,664 | | | $ | 83,325 | |
| Shares issued as reinvestment of distributions | | | — | | | | — | | | | — | | | | — | | | | — | | | | — | |
| Shares converted from class B | | | 4,402 | | | | 83,068 | | | | 900 | | | | 11,846 | | | | — | | | | — | |
| Less shares redeemed | | | (3,869,634 | ) | | | (67,455,152 | ) | | | (5,652,041 | ) | | | (69,446,509 | ) | | | (10,779 | ) | | | (99,614 | ) |
| | | | |
| Net increase (decrease) | | | (3,304,500 | ) | | $ | (57,248,000 | ) | | | (3,868,830 | ) | | $ | (47,013,590 | ) | | | (2,115 | ) | | $ | (16,289 | ) |
| | | | |
| | | | | | |
| Class B(a) | | Shares | | | Dollars | | | Shares | | | Dollars | | | Shares | | | Dollars | |
| Shares sold | | | — | | | $ | — | | | | — | | | $ | — | | | | — | | | $ | — | |
| Shares issued as reinvestment of distributions | | | — | | | | — | | | | — | | | | — | | | | — | | | | — | |
| Shares converted to class A | | | (4,792 | ) | | | (83,068 | ) | | | (948 | ) | | | (11,846 | ) | | | — | | | | — | |
| Less shares redeemed | | | (12,779 | ) | | | (201,214 | ) | | | (7,763 | ) | | | (90,417 | ) | | | — | | | | — | |
| | | | |
| Net increase (decrease) | | | (17,571 | ) | | $ | (284,282 | ) | | | (8,711 | ) | | $ | (102,263 | ) | | | — | | | $ | — | |
| | | | |
| | | | | | |
| Class C | | Shares | | | Dollars | | | Shares | | | Dollars | | | Shares | | | Dollars | |
| Shares sold | | | 98,595 | | | $ | 1,545,542 | | | | 202,511 | | | $ | 2,402,717 | | | | 14,548 | | | $ | 117,959 | |
| Shares issued as reinvestment of distributions | | | — | | | | — | | | | — | | | | — | | | | — | | | | — | |
| Less shares redeemed | | | (1,001,646 | ) | | | (15,982,257 | ) | | | (1,135,941 | ) | | | (13,390,513 | ) | | | (10,325 | ) | | | (83,904 | ) |
| | | | |
| Net increase (decrease) | | | (903,051 | ) | | $ | (14,436,715 | ) | | | (933,430 | ) | | $ | (10,987,796 | ) | | | 4,223 | | | $ | 34,055 | |
| | | | |
| | | | | | |
| Class I | | Shares | | | Dollars | | | Shares | | | Dollars | | | Shares | | | Dollars | |
| Shares sold | | | 2,573,836 | | | $ | 47,547,037 | | | | 6,018,155 | | | $ | 75,924,899 | | | | 125,136 | | | $ | 1,064,962 | |
| Shares issued as reinvestment of distributions | | | — | | | | — | | | | — | | | | — | | | | — | | | | — | |
| Less shares redeemed | | | (7,185,952 | ) | | | (129,403,658 | ) | | | (11,949,210 | ) | | | (149,762,320 | ) | | | (119,149 | ) | | | (1,114,299 | ) |
| | | | |
| Net increase (decrease) | | | (4,612,116 | ) | | $ | (81,856,621 | ) | | | (5,931,055 | ) | | $ | (73,837,421 | ) | | | 5,987 | | | $ | (49,337 | ) |
| | | | |
| | | | | | |
| Class R(b) | | Shares | | | Dollars | | | Shares | | | Dollars | | | Shares | | | Dollars | |
| Shares sold | | | 108,018 | | | $ | 1,880,088 | | | | 80,220 | | | $ | 1,023,973 | | | | — | | | $ | — | |
| Shares issued as reinvestment of distributions | | | — | | | | — | | | | — | | | | — | | | | — | | | | — | |
| Less shares redeemed | | | (132,890 | ) | | | (2,304,444 | ) | | | (94,450 | ) | | | (1,218,511 | ) | | | (10,017 | ) | | | (82,398 | ) |
| | | | |
| Net increase (decrease) | | | (24,872 | ) | | $ | (424,356 | ) | | | (14,230 | ) | | $ | (194,538 | ) | | | (10,017 | ) | | $ | (82,398 | ) |
| | | | |
| | | | | | |
| Class T(c) | | Shares | | | Dollars | | | Shares | | | Dollars | | | Shares | | | Dollars | |
| Shares sold | | | 1,472 | | | $ | 25,000 | | | | 2,073 | | | $ | 25,000 | | | | 2,938 | | | $ | 25,000 | |
| Less shares redeemed | | | (1,472 | ) | | | (31,141 | ) | | | (2,073 | ) | | | (30,320 | ) | | | (2,938 | ) | | | (30,687 | ) |
| | | | |
| Net increase (decrease) | | | — | | | $ | (6,141 | ) | | | — | | | $ | (5,320 | ) | | | — | | | $ | (5,687 | ) |
| | | | |
| (a) | Class B shares were converted into Class A shares at the close of business on July 3, 2017. |
| (b) | Class R shares were liquidated on January 23, 2017. |
| (c) | Class T commenced operations on February 28, 2017 and shares were liquidated on October 26, 2017. |
| | | | |
| 190 | | CALAMOS OPEN-END FAMILY OF FUNDS ANNUAL REPORT | | |
Notes to Financial Statements
| | | | | | | | | | | | | | | | | | | | | | | | |
| | | GLOBAL EQUITY FUND | | | GLOBAL GROWTH AND INCOME FUND | | | TOTAL RETURN BOND FUND | |
| Class A | | Shares | | | Dollars | | | Shares | | | Dollars | | | Shares | | | Dollars | |
| Shares sold | | | 267,886 | | | $ | 3,631,787 | | | | 1,271,007 | | | $ | 11,536,491 | | | | 616,675 | | | $ | 6,401,692 | |
| Shares issued as reinvestment of distributions | | | 82,310 | | | | 994,304 | | | | 62,980 | | | | 534,014 | | | | 81,886 | | | | 845,848 | |
| Shares converted from class B | | | 1,461 | | | | 20,314 | | | | 3,521 | | | | 32,254 | | | | 2,756 | | | | 28,576 | |
| Less shares redeemed | | | (928,684 | ) | | | (12,069,159 | ) | | | (3,398,601 | ) | | | (29,999,159 | ) | | | (4,051,289 | ) | | | (41,987,744 | ) |
| | | | |
| Net increase (decrease) | | | (577,027 | ) | | $ | (7,422,754 | ) | | | (2,061,093 | ) | | $ | (17,896,400 | ) | | | (3,349,972 | ) | | $ | (34,711,628 | ) |
| | | | |
| | | | | | |
| Class B(a) | | Shares | | | Dollars | | | Shares | | | Dollars | | | Shares | | | Dollars | |
| Shares sold | | | 88 | | | $ | 1,043 | | | | 33 | | | $ | 276 | | | | — | | | $ | — | |
| Shares issued as reinvestment of distributions | | | 607 | | | | 6,812 | | | | 352 | | | | 2,986 | | | | 370 | | | | 3,802 | |
| Shares converted to class A | | | (1,579 | ) | | | (20,314 | ) | | | (3,514 | ) | | | (32,254 | ) | | | (2,754 | ) | | | (28,576 | ) |
| Less shares redeemed | | | (13,353 | ) | | | (161,512 | ) | | | (59,827 | ) | | | (523,560 | ) | | | (54,904 | ) | | | (566,190 | ) |
| | | | |
| Net increase (decrease) | | | (14,237 | ) | | $ | (173,971 | ) | | | (62,956 | ) | | $ | (552,552 | ) | | | (57,288 | ) | | $ | (590,964 | ) |
| | | | |
| | | | | | |
| Class C | | Shares | | | Dollars | | | Shares | | | Dollars | | | Shares | | | Dollars | |
| Shares sold | | | 79,865 | | | $ | 1,020,183 | | | | 392,300 | | | $ | 3,098,222 | | | | 85,621 | | | $ | 884,124 | |
| Shares issued as reinvestment of distributions | | | 52,717 | | | | 590,436 | | | | 69,000 | | | | 524,399 | | | | 14,688 | | | | 151,828 | |
| Less shares redeemed | | | (556,903 | ) | | | (6,824,659 | ) | | | (4,362,066 | ) | | | (34,932,226 | ) | | | (752,710 | ) | | | (7,787,857 | ) |
| | | | |
| Net increase (decrease) | | | (424,321 | ) | | $ | (5,214,040 | ) | | | (3,900,766 | ) | | $ | (31,309,605 | ) | | | (652,401 | ) | | $ | (6,751,905 | ) |
| | | | |
| | | | | | |
| Class I | | Shares | | | Dollars | | | Shares | | | Dollars | | | Shares | | | Dollars | |
| Shares sold | | | 842,940 | | | $ | 11,438,592 | | | | 1,904,954 | | | $ | 17,526,653 | | | | 2,931,151 | | | $ | 30,402,823 | |
| Shares issued as reinvestment of distributions | | | 290,431 | | | | 3,572,303 | | | | 134,938 | | | | 1,169,624 | | | | 71,487 | | | | 741,606 | |
| Less shares redeemed | | | (2,477,622 | ) | | | (32,885,172 | ) | | | (9,061,190 | ) | | | (79,702,176 | ) | | | (1,218,817 | ) | | | (12,652,880 | ) |
| | | | |
| Net increase (decrease) | | | (1,344,251 | ) | | $ | (17,874,277 | ) | | | (7,021,298 | ) | | $ | (61,005,899 | ) | | | 1,783,821 | | | $ | 18,491,549 | |
| | | | |
| | | | | | |
| Class R | | Shares | | | Dollars | | | Shares | | | Dollars | | | Shares | | | Dollars | |
| Shares sold | | | 66,830 | | | $ | 893,328 | | | | 18,580 | | | $ | 164,274 | | | | 5,384 | | | $ | 55,765 | |
| Shares issued as reinvestment of distributions | | | 13,200 | | | | 155,231 | | | | 714 | | | | 5,930 | | | | 206 | | | | 2,125 | |
| Less shares redeemed | | | (90,324 | ) | | | (1,147,337 | ) | | | (38,431 | ) | | | (338,695 | ) | | | (18,061 | ) | | | (186,669 | ) |
| | | | |
| Net increase (decrease) | | | (10,294 | ) | | $ | (98,778 | ) | | | (19,137 | ) | | $ | (168,491 | ) | | | (12,471 | ) | | $ | (128,779 | ) |
| | | | |
| | | | | | |
| Class T(b) | | Shares | | | Dollars | | | Shares | | | Dollars | | | Shares | | | Dollars | |
| Shares sold | | | 1,953 | | | $ | 25,000 | | | | 2,867 | | | $ | 25,000 | | | | 2,418 | | | $ | 25,000 | |
| Less shares redeemed | | | (1,953 | ) | | | (29,930 | ) | | | (2,867 | ) | | | (27,840 | ) | | | (2,418 | ) | | | (25,061 | ) |
| | | | |
| Net increase (decrease) | | | — | | | $ | (4,930 | ) | | | — | | | $ | (2,840 | ) | | | — | | | $ | (61 | ) |
| | | | |
| (a) | Class B shares were converted into Class A shares at the close of business on July 3, 2017. |
| (b) | Class T commenced operations on February 28, 2017 and shares were liquidated on October 26, 2017. |
Notes to Financial Statements
| | | | | | | | |
| | | HIGH INCOME OPPORTUNITIES FUND | |
| Class A | | Shares | | | Dollars | |
| Shares sold | | | 1,414,032 | | | $ | 12,403,213 | |
| Shares issued as reinvestment of distributions | | | 188,421 | | | | 1,655,641 | |
| Shares converted from class B | | | 2,831 | | | | 24,971 | |
| Less shares redeemed | | | (2,267,440 | ) | | | (19,857,958 | ) |
| | | | |
| Net increase (decrease) | | | (662,156 | ) | | $ | (5,774,133 | ) |
| | | | |
| | |
| Class B(a) | | Shares | | | Dollars | |
| Shares sold | | | 10 | | | $ | 93 | |
| Shares issued as reinvestment of distributions | | | 330 | | | | 3,051 | |
| Shares converted to class A | | | (2,661 | ) | | | (24,971 | ) |
| Less shares redeemed | | | (26,145 | ) | | | (242,613 | ) |
| | | | |
| Net increase (decrease) | | | (28,466 | ) | | $ | (264,440 | ) |
| | | | |
| | |
| Class C | | Shares | | | Dollars | |
| Shares sold | | | 104,430 | | | $ | 958,954 | |
| Shares issued as reinvestment of distributions | | | 54,380 | | | | 501,112 | |
| Less shares redeemed | | | (667,377 | ) | | | (6,147,863 | ) |
| | | | |
| Net increase (decrease) | | | (508,567 | ) | | $ | (4,687,797 | ) |
| | | | |
| | |
| Class I | | Shares | | | Dollars | |
| Shares sold | | | 782,434 | | | $ | 6,895,841 | |
| Shares issued as reinvestment of distributions | | | 48,476 | | | | 426,255 | |
| Less shares redeemed | | | (1,462,485 | ) | | | (12,688,275 | ) |
| | | | |
| Net increase (decrease) | | | (631,575 | ) | | $ | (5,366,179 | ) |
| | | | |
| | |
| Class R | | Shares | | | Dollars | |
| Shares sold | | | 753 | | | $ | 6,580 | |
| Shares issued as reinvestment of distributions | | | 630 | | | | 5,517 | |
| Less shares redeemed | | | (19,095 | ) | | | (167,180 | ) |
| | | | |
| Net increase (decrease) | | | (17,712 | ) | | $ | (155,083 | ) |
| | | | |
| | |
| Class T(b) | | Shares | | | Dollars | |
| Shares sold | | | 2,818 | | | $ | 25,000 | |
| Less shares redeemed | | | (2,818 | ) | | | (25,155 | ) |
| | | | |
| Net increase (decrease) | | | — | | | $ | (155 | ) |
| | | | |
| (a) | Class B shares were converted into Class A shares at the close of business on July 3, 2017. |
| (b) | Class T commenced operations on February 28, 2017 and shares were liquidated on October 26, 2017. |
| | | | |
| 192 | | CALAMOS OPEN-END FAMILY OF FUNDS ANNUAL REPORT | | |
Calamos Market Neutral Income Fund Financial Highlights
Selected data for a share outstanding throughout each year were as follows:
| | | | | | | | | | | | | | | | | | | | |
| | | CLASS A | |
| | | Year Ended October 31, | |
| | | 2018 | | | 2017 | | | 2016 | | | 2015 | | | 2014 | |
Net asset value, beginning of year | | | $13.41 | | | | $13.13 | | | | $13.08 | | | | $13.13 | | | | $13.09 | |
Income from investment operations: | | | | | | | | | | | | | | | | | | | | |
Net investment income (loss)(a) | | | 0.30 | | | | 0.26 | | | | 0.25 | | | | 0.21 | | | | 0.15 | |
Net realized and unrealized gain (loss) | | | 0.19 | | | | 0.35 | | | | 0.16 | | | | — | | | | 0.27 | |
Total from investment operations | | | 0.49 | | | | 0.61 | | | | 0.41 | | | | 0.21 | | | | 0.42 | |
Distributions: | | | | | | | | | | | | | | | | | | | | |
Dividends from net investment income | | | (0.16 | ) | | | (0.13 | ) | | | (0.16 | ) | | | (0.12 | ) | | | (0.12 | ) |
Dividends from net realized gains | | | (0.22 | ) | | | (0.20 | ) | | | (0.20 | ) | | | (0.14 | ) | | | (0.26 | ) |
Total distributions | | | (0.38 | ) | | | (0.33 | ) | | | (0.36 | ) | | | (0.26 | ) | | | (0.38 | ) |
Net asset value, end of year | | | $13.52 | | | | $13.41 | | | | $13.13 | | | | $13.08 | | | | $13.13 | �� |
Ratios and supplemental data: | | | | | | | | | | | | | | | | | | | | |
Total return(b) | | | 3.79% | | | | 4.74% | | | | 3.16% | | | | 1.60% | | | | 3.27% | |
Net assets, end of year (000) | | | $743,925 | | | | $682,451 | | | | $970,737 | | | | $1,051,576 | | | | $1,351,641 | |
Ratio of net expenses to average net assets | | | 1.25% | (c) | | | 1.28% | (d) | | | 1.22% | (e) | | | 1.23% | | | | 1.20% | |
Ratio of gross expenses to average net assets prior to expense reductions | | | 1.25% | | | | 1.28% | | | | 1.22% | | | | 1.23% | | | | 1.20% | |
Ratio of net investment income (loss) to average net assets | | | 2.26% | | | | 1.96% | | | | 1.91% | | | | 1.58% | | | | 1.17% | |
| |
| | | Year Ended October 31, | |
| | | 2018 | | | 2017 | | | 2016 | | | 2015 | | | 2014 | |
Portfolio turnover rate | | | 66.8% | | | | 81.1% | | | | 37.5% | | | | 37.6% | | | | 70.5% | |
| |
| | | CLASS C | |
| | | Year Ended October 31, | |
| | | 2018 | | | 2017 | | | 2016 | | | 2015 | | | 2014 | |
Net asset value, beginning of year | | | $13.62 | | | | $13.33 | | | | $13.27 | | | | $13.32 | | | | $13.30 | |
Income from investment operations: | | | | | | | | | | | | | | | | | | | | |
Net investment income (loss)(a) | | | 0.21 | | | | 0.16 | | | | 0.15 | | | | 0.11 | | | | 0.06 | |
Net realized and unrealized gain (loss) | | | 0.19 | | | | 0.36 | | | | 0.17 | | | | 0.01 | | | | 0.26 | |
Total from investment operations | | | 0.40 | | | | 0.52 | | | | 0.32 | | | | 0.12 | | | | 0.32 | |
Distributions: | | | | | | | | | | | | | | | | | | | | |
Dividends from net investment income | | | (0.07 | ) | | | (0.03 | ) | | | (0.06 | ) | | | (0.03 | ) | | | (0.04 | ) |
Dividends from net realized gains | | | (0.22 | ) | | | (0.20 | ) | | | (0.20 | ) | | | (0.14 | ) | | | (0.26 | ) |
Total distributions | | | (0.29 | ) | | | (0.23 | ) | | | (0.26 | ) | | | (0.17 | ) | | | (0.30 | ) |
Net asset value, end of year | | | $13.73 | | | | $13.62 | | | | $13.33 | | | | $13.27 | | | | $13.32 | |
Ratios and supplemental data: | | | | | | | | | | | | | | | | | | | | |
Total return(b) | | | 3.03% | | | | 3.98% | | | | 2.41% | | | | 0.86% | | | | 2.40% | |
Net assets, end of year (000) | | | $303,417 | | | | $282,115 | | | | $318,853 | | | | $339,054 | | | | $349,791 | |
Ratio of net expenses to average net assets | | | 2.00% | (c) | | | 2.03% | (d) | | | 1.97% | (e) | | | 1.98% | | | | 1.95% | |
Ratio of gross expenses to average net assets prior to expense reductions | | | 2.00% | | | | 2.03% | | | | 1.97% | | | | 1.98% | | | | 1.95% | |
Ratio of net investment income (loss) to average net assets | | | 1.51% | | | | 1.22% | | | | 1.16% | | | | 0.83% | | | | 0.42% | |
| (a) | Net investment income (loss) allocated based on average shares method. |
| (b) | Total return measures net investment income (loss) and capital gain or loss from portfolio investments assuming reinvestment of dividends and capital gains distributions. Total return is not annualized for periods that are less than a full year, does not reflect the effect of sales charge for Class A shares nor the contingent deferred sales charge for Class C shares and does not reflect the deduction of taxes that a shareholder would pay on fund distributions or the redemption of fund shares. |
| (c) | Ratio of net expenses, excluding dividend expense on short positions, to average net assets was 1.07% and 1.81% for the year ended October 31, 2018. |
| (d) | Ratio of net expenses, excluding dividend expense on short positions, to average net assets was 1.08% and 1.83% for the year ended October 31, 2017. |
| (e) | Ratio of net expenses, excluding dividend expense on short positions, to average net assets was 1.08% and 1.84% for the year ended October 31, 2016. |
Calamos Market Neutral Income Fund Financial Highlights
| | | | | | | | | | | | | | | | | | | | |
| | | CLASS I | |
| | | Year Ended October 31, | |
| | | 2018 | | | 2017 | | | 2016 | | | 2015 | | | 2014 | |
Net asset value, beginning of year | | | $13.26 | | | | $12.98 | | | | $12.94 | | | | $12.99 | | | | $12.97 | |
Income from investment operations: | | | | | | | | | | | | | | | | | | | | |
Net investment income (loss)(a) | | | 0.33 | | | | 0.29 | | | | 0.27 | | | | 0.24 | | | | 0.18 | |
Net realized and unrealized gain (loss) | | | 0.19 | | | | 0.36 | | | | 0.16 | | | | — | | | | 0.25 | |
Total from investment operations | | | 0.52 | | | | 0.65 | | | | 0.43 | | | | 0.24 | | | | 0.43 | |
Distributions: | | | | | | | | | | | | | | | | | | | | |
Dividends from net investment income | | | (0.20 | ) | | | (0.17 | ) | | | (0.19 | ) | | | (0.15 | ) | | | (0.15 | ) |
Dividends from net realized gains | | | (0.22 | ) | | | (0.20 | ) | | | (0.20 | ) | | | (0.14 | ) | | | (0.26 | ) |
Total distributions | | | (0.42 | ) | | | (0.37 | ) | | | (0.39 | ) | | | (0.29 | ) | | | (0.41 | ) |
Net asset value, end of year | | | $13.36 | | | | $13.26 | | | | $12.98 | | | | $12.94 | | | | $12.99 | |
Ratios and supplemental data: | | | | | | | | | | | | | | | | | | | | |
Total return(b) | | | 4.02% | | | | 5.07% | | | | 3.38% | | | | 1.89% | | | | 3.40% | |
Net assets, end of year (000) | | | $5,658,499 | | | | $3,734,035 | | | | $2,587,922 | | | | $2,377,641 | | | | $2,470,829 | |
Ratio of net expenses to average net assets | | | 0.99% | (c) | | | 1.02% | (d) | | | 0.97% | (e) | | | 0.98% | | | | 0.95% | |
Ratio of gross expenses to average net assets prior to expense reductions | | | 0.99% | | | | 1.02% | | | | 0.97% | | | | 0.98% | | | | 0.95% | |
Ratio of net investment income (loss) to average net assets | | | 2.49% | | | | 2.22% | | | | 2.15% | | | | 1.83% | | | | 1.41% | |
| (a) | Net investment income (loss) allocated based on average shares method. |
| (b) | Total return measures net investment income (loss) and capital gain or loss from portfolio investments assuming reinvestment of dividends and capital gains distributions. Total return is not annualized for periods that are less than a full year, does not reflect the effect of sales charge for Class A shares nor the contingent deferred sales charge for Class C shares and does not reflect the deduction of taxes that a shareholder would pay on fund distributions or the redemption of fund shares. |
| (c) | Ratio of net expenses, excluding dividend expense on short positions, to average net assets was 0.81% for the year ended October 31, 2018. |
| (d) | Ratio of net expenses, excluding dividend expense on short positions, to average net assets was 0.83% for the year ended October 31, 2017. |
| (e) | Ratio of net expenses, excluding dividend expense on short positions, to average net assets was 0.84% for the year ended October 31, 2016. |
| | | | |
| 194 | | CALAMOS OPEN-END FAMILY OF FUNDS ANNUAL REPORT | | |
Calamos Hedged Equity Income Fund Financial Highlights
Selected data for a share outstanding throughout each year were as follows:
| | | | | | | | | | | | | | | | |
| | | CLASS A | |
| | | Year Ended October 31, | | | December 31, 2014• through
October 31, | |
| | | 2018 | | | 2017 | | | 2016 | | | 2015 | |
Net asset value, beginning of year | | | $10.85 | | | | $10.03 | | | | $10.00 | | | | $10.00 | |
Income from investment operations: | | | | | | | | | | | | | | | | |
Net investment income (loss)(a) | | | 0.08 | | | | 0.12 | | | | 0.10 | | | | 0.06 | |
Net realized and unrealized gain (loss) | | | 0.57 | | | | 0.76 | | | | 0.17 | | | | 0.01 | |
Total from investment operations | | | 0.65 | | | | 0.88 | | | | 0.27 | | | | 0.07 | |
Distributions: | | | | | | | | | | | | | | | | |
Dividends from net investment income | | | (0.06 | ) | | | (0.06 | ) | | | (0.15 | ) | | | (0.07 | ) |
Dividends from net realized gains | | | — | | | | — | | | | (0.09 | ) | | | — | |
Total distributions | | | (0.06 | ) | | | (0.06 | ) | | | (0.24 | ) | | | (0.07 | ) |
Net asset value, end of year | | | $11.44 | | | | $10.85 | | | | $10.03 | | | | $10.00 | |
Ratios and supplemental data: | | | | | | | | | | | | | | | | |
Total return(b) | | | 6.08% | | | | 8.77% | | | | 2.79% | | | | 0.67% | |
Net assets, end of year (000) | | | $5,151 | | | | $1,007 | | | | $10,275 | | | | $5,661 | |
Ratio of net expenses to average net assets | | | 1.25% | | | | 1.25% | | | | 1.22% | | | | 1.25% | (c) |
Ratio of gross expenses to average net assets prior to expense reductions | | | 1.47% | | | | 2.14% | | | | 2.03% | | | | 3.05% | (c) |
Ratio of net investment income (loss) to average net assets | | | 0.65% | | | | 1.12% | | | | 1.01% | | | | 0.78% | (c) |
| | |
| | | Year Ended October 31, | | | December 31, 2014• through
October 31, | |
| | | 2018 | | | 2017 | | | 2016 | | | 2015 | |
Portfolio turnover rate | | | 140.8% | | | | 49.2% | | | | 19.6% | | | | 29.4% | |
| |
| | | CLASS C | |
| | | Year Ended October 31, | | | December 31, 2014• through
October 31, | |
| | | 2018 | | | 2017 | | | 2016 | | | 2015 | |
Net asset value, beginning of year | | | $10.78 | | | | $10.00 | | | | $9.98 | | | | $10.00 | |
Income from investment operations: | | | | | | | | | | | | | | | | |
Net investment income (loss)(a) | | | (0.01 | ) | | | 0.02 | | | | 0.03 | | | | (0.00 | )* |
Net realized and unrealized gain (loss) | | | 0.58 | | | | 0.79 | | | | 0.16 | | | | 0.01 | |
Total from investment operations | | | 0.57 | | | | 0.81 | | | | 0.19 | | | | 0.01 | |
Distributions: | | | | | | | | | | | | | | | | |
Dividends from net investment income | | | (0.00 | )* | | | (0.03 | ) | | | (0.08 | ) | | | (0.03 | ) |
Dividends from net realized gains | | | — | | | | — | | | | (0.09 | ) | | | — | |
Total distributions | | | (0.00 | )* | | | (0.03 | ) | | | (0.17 | ) | | | (0.03 | ) |
Net asset value, end of year | | | $11.35 | | | | $10.78 | | | | $10.00 | | | | $9.98 | |
Ratios and supplemental data: | | | | | | | | | | | | | | | | |
Total return(b) | | | 5.31% | | | | 8.09% | | | | 1.92% | | | | 0.09% | |
Net assets, end of year (000) | | | $616 | | | | $173 | �� | | | $156 | | | | $100 | |
Ratio of net expenses to average net assets | | | 2.00% | | | | 2.00% | | | | 1.97% | | | | 2.00% | (c) |
Ratio of gross expenses to average net assets prior to expense reductions | | | 2.30% | | | | 3.03% | | | | 2.79% | | | | 3.79% | (c) |
Ratio of net investment income (loss) to average net assets | | | (0.07% | ) | | | 0.24% | | | | 0.26% | | | | 0.03% | (c) |
| • | Commencement of operations. |
| * | Amounts are less than $0.005. |
| (a) | Net investment income (loss) allocated based on average shares method. |
| (b) | Total return measures net investment income (loss) and capital gain or loss from portfolio investments assuming reinvestment of dividends and capital gains distributions. Total return is not annualized for periods that are less than a full year, does not reflect the effect of sales charge for Class A shares nor the contingent deferred sales charge for Class C shares and does not reflect the deduction of taxes that a shareholder would pay on fund distributions or the redemption of fund shares. |
Calamos Hedged Equity Income Fund Financial Highlights
| | | | | | | | | | | | | | | | |
| | | CLASS I | |
| | | Year Ended October 31, | | | December 31, 2014• through
October 31, | |
| | | 2018 | | | 2017 | | | 2016 | | | 2015 | |
Net asset value, beginning of year | | | $10.84 | | | | $10.04 | | | | $10.01 | | | | $10.00 | |
Income from investment operations: | | | | | | | | | | | | | | | | |
Net investment income (loss)(a) | | | 0.10 | | | | 0.13 | | | | 0.13 | | | | 0.09 | |
Net realized and unrealized gain (loss) | | | 0.59 | | | | 0.78 | | | | 0.17 | | | | — | |
Total from investment operations | | | 0.69 | | | | 0.91 | | | | 0.30 | | | | 0.09 | |
Distributions: | | | | | | | | | | | | | | | | |
Dividends from net investment income | | | (0.08 | ) | | | (0.11 | ) | | | (0.18 | ) | | | (0.08 | ) |
Dividends from net realized gains | | | — | | | | — | | | | (0.09 | ) | | | — | |
Total distributions | | | (0.08 | ) | | | (0.11 | ) | | | (0.27 | ) | | | (0.08 | ) |
Net asset value, end of year | | | $11.45 | | | | $10.84 | | | | $10.04 | | | | $10.01 | |
Ratios and supplemental data: | | | | | | | | | | | | | | | | |
Total return(b) | | | 6.38% | | | | 9.12% | | | | 3.02% | | | | 0.89% | |
Net assets, end of year (000) | | | $91,589 | | | | $11,883 | | | | $8,035 | | | | $5,527 | |
Ratio of net expenses to average net assets | | | 1.00% | | | | 1.00% | | | | 0.97% | | | | 1.00% | (c) |
Ratio of gross expenses to average net assets prior to expense reductions | | | 1.26% | | | | 2.06% | | | | 1.81% | | | | 2.80% | (c) |
Ratio of net investment income (loss) to average net assets | | | 0.91% | | | | 1.22% | | | | 1.27% | | | | 1.03% | (c) |
| • | Commencement of operations. |
| (a) | Net investment income (loss) allocated based on average shares method. |
| (b) | Total return measures net investment income (loss) and capital gain or loss from portfolio investments assuming reinvestment of dividends and capital gains distributions. Total return is not annualized for periods that are less than a full year, does not reflect the effect of sales charge for Class A shares nor the contingent deferred sales charge for Class C shares and does not reflect the deduction of taxes that a shareholder would pay on fund distributions or the redemption of fund shares. |
| | | | |
| 196 | | CALAMOS OPEN-END FAMILY OF FUNDS ANNUAL REPORT | | |
Calamos Phineus Long/Short Fund Financial Highlights
Selected data for a share outstanding throughout each year were as follows:
| | | | | | | | | | | | |
| | | CLASS A | |
| | | Year Ended
October 31, | | | April 5, 2016•
through
October 31, | |
| | | 2018 | | | 2017 | | | 2016 | |
Net asset value, beginning of year | | | $12.33 | | | | $10.77 | | | | $10.00 | |
Income from investment operations: | | | | | | | | | | | | |
Net investment income (loss)(a) | | | (0.03 | ) | | | (0.16 | ) | | | (0.10 | ) |
Net realized and unrealized gain (loss) | | | — | | | | 1.82 | | | | 0.87 | |
Total from investment operations | | | (0.03 | ) | | | 1.66 | | | | 0.77 | |
Distributions: | | | | | | | | | | | | |
Dividends from net investment income | | | — | | | | — | | | | — | |
Dividends from net realized gains | | | (0.15 | ) | | | (0.10 | ) | | | — | |
Total distributions | | | (0.15 | ) | | | (0.10 | ) | | | — | |
Net asset value, end of year | | | $12.15 | | | | $12.33 | | | | $10.77 | |
Ratios and supplemental data: | | | | | | | | | | | | |
Total return(b) | | | (0.34% | ) | | | 15.46% | | | | 7.70% | |
Net assets, end of year (000) | | | $108,730 | | | | $66,854 | | | | $14,708 | |
Ratio of net expenses to average net assets | | | 2.28% | (d) | | | 2.71% | (e) | | | 2.99% | (c)(f) |
Ratio of gross expenses to average net assets prior to expense reductions | | | 2.28% | | | | 2.71% | | | | 4.04% | (c) |
Ratio of net investment income (loss) to average net assets | | | (0.27% | ) | | | (1.34% | ) | | | (1.77% | )(c) |
| | |
| | | Year Ended
October 31, | | | April 5, 2016•
through
October 31, | |
| | | 2018 | | | 2017 | | | 2016 | |
Portfolio turnover rate | | | 228.6% | | | | 167.8% | | | | 177.6% | |
| |
| | | CLASS C | |
| | | Year Ended
October 31, | | | April 5, 2016•
through
October 31, | |
| | | 2018 | | | 2017 | | | 2016 | |
Net asset value, beginning of year | | | $12.19 | | | | $10.73 | | | | $10.00 | |
Income from investment operations: | | | | | | | | | | | | |
Net investment income (loss)(a) | | | (0.13 | ) | | | (0.25 | ) | | | (0.15 | ) |
Net realized and unrealized gain (loss) | | | 0.01 | | | | 1.81 | | | | 0.88 | |
Total from investment operations | | | (0.12 | ) | | | 1.56 | | | | 0.73 | |
Distributions: | | | | | | | | | | | | |
Dividends from net investment income | | | — | | | | — | | | | — | |
Dividends from net realized gains | | | (0.15 | ) | | | (0.10 | ) | | | — | |
Total distributions | | | (0.15 | ) | | | (0.10 | ) | | | — | |
Net asset value, end of year | | | $11.92 | | | | $12.19 | | | | $10.73 | |
Ratios and supplemental data: | | | | | | | | | | | | |
Total return(b) | | | (1.09% | ) | | | 14.58% | | | | 7.30% | |
Net assets, end of year (000) | | | $52,169 | | | | $28,933 | | | | $4,936 | |
Ratio of net expenses to average net assets | | | 3.03% | (d) | | | 3.46% | (e) | | | 3.69% | (c)(f) |
Ratio of gross expenses to average net assets prior to expense reductions | | | 3.03% | | | | 3.46% | | | | 4.82% | (c) |
Ratio of net investment income (loss) to average net assets | | | (1.02% | ) | | | (2.11% | ) | | | (2.54% | )(c) |
| • | Commencement of operations. |
| (a) | Net investment income (loss) allocated based on average shares method. |
| (b) | Total return measures net investment income (loss) and capital gain or loss from portfolio investments assuming reinvestment of dividends and capital gains distributions. Total return is not annualized for periods that are less than a full year, does not reflect the effect of sales charge for Class A shares nor the contingent deferred sales charge for Class C shares and does not reflect the deduction of taxes that a shareholder would pay on fund distributions or the redemption of fund shares. |
| (d) | Ratio of net expenses, excluding dividend expense on short positions, to average net assets was 1.64% and 2.39% for the year ended October 31, 2018. |
| (e) | Ratio of net expenses, excluding dividend expense on short positions, to average net assets was 1.73% and 2.47% for the year ended October 31, 2017. |
| (f) | Ratio of net expenses, excluding dividend expense on short positions, to average net assets was 2.01% and 2.67% for the period ended October 31, 2016. |
Calamos Phineus Long/Short Fund Financial Highlights
| | | | | | | | | | | | |
| | | CLASS I | |
| | | Year Ended
October 31, | | | April 5, 2016•
through
October 31, | |
| | | 2018 | | | 2017 | | | 2016 | |
Net asset value, beginning of year | | | $12.39 | | | | $10.80 | | | | $10.00 | |
Income from investment operations: | | | | | | | | | | | | |
Net investment income (loss)(a) | | | 0.01 | | | | (0.13 | ) | | | (0.08 | ) |
Net realized and unrealized gain (loss) | | | (0.02 | ) | | | 1.82 | | | | 0.88 | |
Total from investment operations | | | (0.01 | ) | | | 1.69 | | | | 0.80 | |
Distributions: | | | | | | | | | | | | |
Dividends from net investment income | | | — | | | | — | | | | — | |
Dividends from net realized gains | | | (0.15 | ) | | | (0.10 | ) | | | — | |
Total distributions | | | (0.15 | ) | | | (0.10 | ) | | | — | |
Net asset value, end of year | | | $12.23 | | | | $12.39 | | | | $10.80 | |
Ratios and supplemental data: | | | | | | | | | | | | |
Total return(b) | | | (0.10% | ) | | | 15.70% | | | | 8.00% | |
Net assets, end of year (000) | | | $1,003,457 | | | | $348,840 | | | | $56,319 | |
Ratio of net expenses to average net assets | | | 2.00% | (d) | | | 2.45% | (e) | | | 2.77% | (c)(f) |
Ratio of gross expenses to average net assets prior to expense reductions | | | 2.00% | | | | 2.45% | | | | 4.04% | (c) |
Ratio of net investment income (loss) to average net assets | | | 0.05% | | | | (1.09% | ) | | | (1.33% | )(c) |
| • | Commencement of operations. |
| (a) | Net investment income (loss) allocated based on average shares method. |
| (b) | Total return measures net investment income (loss) and capital gain or loss from portfolio investments assuming reinvestment of dividends and capital gains distributions. Total return is not annualized for periods that are less than a full year, does not reflect the effect of sales charge for Class A shares nor the contingent deferred sales charge for Class C shares and does not reflect the deduction of taxes that a shareholder would pay on fund distributions or the redemption of fund shares. |
| (d) | Ratio of net expenses, excluding dividend expense on short positions, to average net assets was 1.39% for the year ended October 31, 2018. |
| (e) | Ratio of net expenses, excluding dividend expense on short positions, to average net assets was 1.47% for the year ended October 31, 2017. |
| (f) | Ratio of net expenses, excluding dividend expense on short positions, to average net assets was 1.76% for the period ended October 31, 2016. |
| | | | |
| 198 | | CALAMOS OPEN-END FAMILY OF FUNDS ANNUAL REPORT | | |
Calamos Convertible Fund Financial Highlights
Selected data for a share outstanding throughout each year were as follows:
| | | | | | | | | | | | | | | | | | | | |
| | | CLASS A | |
| | | Year Ended October 31, | |
| | | 2018 | | | 2017 | | | 2016 | | | 2015 | | | 2014 | |
Net asset value, beginning of year | | | $18.27 | | | | $15.93 | | | | $16.56 | | | | $18.59 | | | | $19.14 | |
Income from investment operations: | | | | | | | | | | | | | | | | | | | | |
Net investment income (loss)(a) | | | 0.48 | | | | 0.49 | | | | 0.50 | | | | 0.44 | | | | 0.40 | |
Net realized and unrealized gain (loss) | | | 0.13 | | | | 2.16 | | | | (0.30 | ) | | | (1.01 | ) | | | 1.14 | |
Total from investment operations | | | 0.61 | | | | 2.65 | | | | 0.20 | | | | (0.57 | ) | | | 1.54 | |
Distributions: | | | | | | | | | | | | | | | | | | | | |
Dividends from net investment income | | | (0.24 | ) | | | (0.31 | ) | | | (0.56 | ) | | | (0.58 | ) | | | (0.76 | ) |
Dividends from net realized gains | | | (0.53 | ) | | | — | | | | (0.27 | ) | | | (0.88 | ) | | | (1.33 | ) |
Total distributions | | | (0.77 | ) | | | (0.31 | ) | | | (0.83 | ) | | | (1.46 | ) | | | (2.09 | ) |
Net asset value, end of year | | | $18.11 | | | | $18.27 | | | | $15.93 | | | | $16.56 | | | | $18.59 | |
Ratios and supplemental data: | | | | | | | | | | | | | | | | | | | | |
Total return(b) | | | 3.43% | | | | 16.88% | | | | 1.33% | | | | (3.31% | ) | | | 8.74% | |
Net assets, end of year (000) | | | $210,845 | | | | $222,017 | | | | $228,334 | | | | $385,844 | | | | $488,842 | |
Ratio of net expenses to average net assets | | | 1.16% | | | | 1.18% | | | | 1.15% | | | | 1.13% | | | | 1.10% | |
Ratio of gross expenses to average net assets prior to expense reductions | | | 1.16% | | | | 1.18% | | | | 1.15% | | | | 1.13% | | | | 1.10% | |
Ratio of net investment income (loss) to average net assets | | | 2.58% | | | | 2.87% | | | | 3.17% | | | | 2.53% | | | | 2.18% | |
| |
| | | Year Ended October 31, | |
| | | 2017 | | | 2016 | | | 2015 | | | 2014 | | | 2013 | |
Portfolio turnover rate | | | 73.2% | | | | 55.7% | | | | 43.8% | | | | 63.0% | | | | 68.1% | |
| |
| | | CLASS C | |
| | | Year Ended October 31, | |
| | | 2018 | | | 2017 | | | 2016 | | | 2015 | | | 2014 | |
Net asset value, beginning of year | | | $18.09 | | | | $15.79 | | | | $16.41 | | | | $18.43 | | | | $18.87 | |
Income from investment operations: | | | | | | | | | | | | | | | | | | | | |
Net investment income (loss)(a) | | | 0.34 | | | | 0.36 | | | | 0.37 | | | | 0.31 | | | | 0.26 | |
Net realized and unrealized gain (loss) | | | 0.12 | | | | 2.14 | | | | (0.28 | ) | | | (1.00 | ) | | | 1.11 | |
Total from investment operations | | | 0.46 | | | | 2.50 | | | | 0.09 | | | | (0.69 | ) | | | 1.37 | |
Distributions: | | | | | | | | | | | | | | | | | | | | |
Dividends from net investment income | | | (0.10 | ) | | | (0.20 | ) | | | (0.44 | ) | | | (0.45 | ) | | | (0.48 | ) |
Dividends from net realized gains | | | (0.53 | ) | | | — | | | | (0.27 | ) | | | (0.88 | ) | | | (1.33 | ) |
Total distributions | | | (0.63 | ) | | | (0.20 | ) | | | (0.71 | ) | | | (1.33 | ) | | | (1.81 | ) |
Net asset value, end of year | | | $17.92 | | | | $18.09 | | | | $15.79 | | | | $16.41 | | | | $18.43 | |
Ratios and supplemental data: | | | | | | | | | | | | | | | | | | | | |
Total return(b) | | | 2.65% | | | | 15.99% | | | | 0.62% | | | | (4.01% | ) | | | 7.86% | |
Net assets, end of year (000) | | | $128,920 | | | | $147,112 | | | | $193,339 | | | | $265,686 | | | | $319,654 | |
Ratio of net expenses to average net assets | | | 1.91% | | | | 1.93% | | | | 1.90% | | | | 1.88% | | | | 1.86% | |
Ratio of gross expenses to average net assets prior to expense reductions | | | 1.91% | | | | 1.93% | | | | 1.90% | | | | 1.88% | | | | 1.86% | |
Ratio of net investment income (loss) to average net assets | | | 1.85% | | | | 2.14% | | | | 2.40% | | | | 1.78% | | | | 1.43% | |
| (a) | Net investment income (loss) allocated based on average shares method. |
| (b) | Total return measures net investment income (loss) and capital gain or loss from portfolio investments assuming reinvestment of dividends and capital gains distributions. Total return is not annualized for periods that are less than a full year, does not reflect the effect of sales charge for Class A shares nor the contingent deferred sales charge for Class C shares and does not reflect the deduction of taxes that a shareholder would pay on fund distributions or the redemption of fund shares. |
Calamos Convertible Fund Financial Highlights
| | | | | | | | | | | | | | | | | | | | |
| | | CLASS I | |
| | | Year Ended October 31, | |
| | | 2018 | | | 2017 | | | 2016 | | | 2015 | | | 2014 | |
Net asset value, beginning of year | | | $16.45 | | | | $14.38 | | | | $15.03 | | | | $17.02 | | | | $17.74 | |
Income from investment operations: | | | | | | | | | | | | | | | | | | | | |
Net investment income (loss)(a) | | | 0.47 | | | | 0.48 | | | | 0.49 | | | | 0.44 | | | | 0.41 | |
Net realized and unrealized gain (loss) | | | 0.13 | | | | 1.95 | | | | (0.27 | ) | | | (0.93 | ) | | | 1.04 | |
Total from investment operations | | | 0.60 | | | | 2.43 | | | | 0.22 | | | | (0.49 | ) | | | 1.45 | |
Distributions: | | | | | | | | | | | | | | | | | | | | |
Dividends from net investment income | | | (0.29 | ) | | | (0.36 | ) | | | (0.60 | ) | | | (0.62 | ) | | | (0.84 | ) |
Dividends from net realized gains | | | (0.53 | ) | | | — | | | | (0.27 | ) | | | (0.88 | ) | | | (1.33 | ) |
Total distributions | | | (0.82 | ) | | | (0.36 | ) | | | (0.87 | ) | | | (1.50 | ) | | | (2.17 | ) |
Net asset value, end of year | | | $16.23 | | | | $16.45 | | | | $14.38 | | | | $15.03 | | | | $17.02 | |
Ratios and supplemental data: | | | | | | | | | | | | | | | | | | | | |
Total return(b) | | | 3.73% | | | | 17.14% | | | | 1.64% | | | | (3.11% | ) | | | 8.99% | |
Net assets, end of year (000) | | | $275,776 | | | | $233,077 | | | | $238,309 | | | | $455,702 | | | | $553,594 | |
Ratio of net expenses to average net assets | | | 0.91% | | | | 0.93% | | | | 0.90% | | | | 0.88% | | | | 0.85% | |
Ratio of gross expenses to average net assets prior to expense reductions | | | 0.91% | | | | 0.93% | | | | 0.90% | | | | 0.88% | | | | 0.85% | |
Ratio of net investment income (loss) to average net assets | | | 2.83% | | | | 3.12% | | | | 3.48% | | | | 2.77% | | | | 2.46% | |
| (a) | Net investment income (loss) allocated based on average shares method. |
| (b) | Total return measures net investment income (loss) and capital gain or loss from portfolio investments assuming reinvestment of dividends and capital gains distributions. Total return is not annualized for periods that are less than a full year, does not reflect the effect of sales charge for Class A shares nor the contingent deferred sales charge for Class C shares and does not reflect the deduction of taxes that a shareholder would pay on fund distributions or the redemption of fund shares. |
| | | | |
| 200 | | CALAMOS OPEN-END FAMILY OF FUNDS ANNUAL REPORT | | |
Calamos Global Convertible Fund Financial Highlights
Selected data for a share outstanding throughout each year were as follows:
| | | | | | | | | | | | | | | | |
| | | CLASS A | |
| | | Year Ended October 31, | | | December 31, 2014•
through
October 31, | |
| | | 2018 | | | 2017 | | | 2016 | | | 2015 | |
Net asset value, beginning of year | | | $11.24 | | | | $9.89 | | | | $9.93 | | | | $10.00 | |
Income from investment operations: | | | | | | | | | | | | | | | | |
Net investment income (loss)(a) | | | 0.33 | | | | 0.25 | | | | 0.26 | | | | 0.13 | |
Net realized and unrealized gain (loss) | | | (0.34 | ) | | | 1.21 | | | | (0.14 | ) | | | (0.13 | ) |
Total from investment operations | | | (0.01 | ) | | | 1.46 | | | | 0.12 | | | | — | |
Distributions: | | | | | | | | | | | | | | | | |
Dividends from net investment income | | | (0.08 | ) | | | (0.11 | ) | | | (0.16 | ) | | | (0.07 | ) |
Dividends from net realized gains | | | (0.34 | ) | | | — | | | | — | | | | — | |
Total distributions | | | (0.42 | ) | | | (0.11 | ) | | | (0.16 | ) | | | (0.07 | ) |
Net asset value, end of year | | | $10.81 | | | | $11.24 | | | | $9.89 | | | | $9.93 | |
Ratios and supplemental data: | | | | | | | | | | | | | | | | |
Total return(b) | | | (0.09% | ) | | | 14.86% | | | | 1.27% | | | | —% | |
Net assets, end of year (000) | | | $11,184 | | | | $12,713 | | | | $29,037 | | | | $20,550 | |
Ratio of net expenses to average net assets | | | 1.34% | | | | 1.35% | | | | 1.35% | | | | 1.35% | (c) |
Ratio of gross expenses to average net assets prior to expense reductions | | | 1.35% | | | | 1.45% | | | | 1.46% | | | | 2.30% | (c) |
Ratio of net investment income (loss) to average net assets | | | 2.98% | | | | 2.46% | | | | 2.64% | | | | 1.56% | (c) |
| | |
| | | Year Ended October 31, | | | December 31, 2014*
through
October 31, | |
| | | 2018 | | | 2017 | | | 2016 | | | 2015 | |
Portfolio turnover rate | | | 32.0% | | | | 52.2% | | | | 38.4% | | | | 28.2% | |
| |
| | | CLASS C | |
| | | Year Ended October 31, | | | December 31, 2014•
through
October 31, | |
| | | 2018 | | | 2017 | | | 2016 | | | 2015 | |
Net asset value, beginning of year | | | $11.14 | | | | $9.85 | | | | $9.90 | | | | $10.00 | |
Income from investment operations: | | | | | | | | | | | | | | | | |
Net investment income (loss)(a) | | | 0.24 | | | | 0.16 | | | | 0.18 | | | | 0.07 | |
Net realized and unrealized gain (loss) | | | (0.33 | ) | | | 1.21 | | | | (0.13 | ) | | | (0.12 | ) |
Total from investment operations | | | (0.09 | ) | | | 1.37 | | | | 0.05 | | | | (0.05 | ) |
Distributions: | | | | | | | | | | | | | | | | |
Dividends from net investment income | | | (0.02 | ) | | | (0.08 | ) | | | (0.10 | ) | | | (0.05 | ) |
Dividends from net realized gains | | | (0.34 | ) | | | — | | | | — | | | | — | |
Total distributions | | | (0.36 | ) | | | (0.08 | ) | | | (0.10 | ) | | | (0.05 | ) |
Net asset value, end of year | | | $10.69 | | | | $11.14 | | | | $9.85 | | | | $9.90 | |
Ratios and supplemental data: | | | | | | | | | | | | | | | | |
Total return(b) | | | (0.77% | ) | | | 13.95% | | | | 0.50% | | | | (0.52% | ) |
Net assets, end of year (000) | | | $3,884 | | | | $2,887 | | | | $2,440 | | | | $1,259 | |
Ratio of net expenses to average net assets | | | 2.09% | | | | 2.10% | | | | 2.10% | | | | 2.10% | (c) |
Ratio of gross expenses to average net assets prior to expense reductions | | | 2.10% | | | | 2.19% | | | | 2.21% | | | | 2.88% | (c) |
Ratio of net investment income (loss) to average net assets | | | 2.21% | | | | 1.54% | | | | 1.89% | | | | 0.84% | (c) |
| • | Commencement of operations. |
| (a) | Net investment income (loss) allocated based on average shares method. |
| (b) | Total return measures net investment income (loss) and capital gain or loss from portfolio investments assuming reinvestment of dividends and capital gains distributions. Total return is not annualized for periods that are less than a full year, does not reflect the effect of sales charge for Class A shares nor the contingent deferred sales charge for Class C shares and does not reflect the deduction of taxes that a shareholder would pay on fund distributions or the redemption of fund shares. |
Calamos Global Convertible Fund Financial Highlights
| | | | | | | | | | | | | | | | |
| | | CLASS I | |
| | | Year Ended October 31, | | | December 31, 2014•
through
October 31, | |
| | | 2018 | | | 2017 | | | 2016 | | | 2015 | |
Net asset value, beginning of year | | | $11.24 | | | | $9.92 | | | | $9.95 | | | | $10.00 | |
Income from investment operations: | | | | | | | | | | | | | | | | |
Net investment income (loss)(a) | | | 0.36 | | | | 0.26 | | | | 0.28 | | | | 0.15 | |
Net realized and unrealized gain (loss) | | | (0.33 | ) | | | 1.21 | | | | (0.13 | ) | | | (0.12 | ) |
Total from investment operations | | | 0.03 | | | | 1.47 | | | | 0.15 | | | | 0.03 | |
Distributions: | | | | | | | | | | | | | | | | |
Dividends from net investment income | | | (0.11 | ) | | | (0.15 | ) | | | (0.18 | ) | | | (0.08 | ) |
Dividends from net realized gains | | | (0.34 | ) | | | — | | | | — | | | | — | |
Total distributions | | | (0.45 | ) | | | (0.15 | ) | | | (0.18 | ) | | | (0.08 | ) |
Net asset value, end of year | | | $10.82 | | | | $11.24 | | | | $9.92 | | | | $9.95 | |
Ratios and supplemental data: | | | | | | | | | | | | | | | | |
Total return(b) | | | 0.24% | | | | 14.98% | | | | 1.60% | | | | 0.29% | |
Net assets, end of year (000) | | | $121,170 | | | | $91,086 | | | | $47,637 | | | | $23,054 | |
Ratio of net expenses to average net assets | | | 1.09% | | | | 1.10% | | | | 1.10% | | | | 1.10% | (c) |
Ratio of gross expenses to average net assets prior to expense reductions | | | 1.10% | | | | 1.18% | | | | 1.21% | | | | 1.80% | (c) |
Ratio of net investment income (loss) to average net assets | | | 3.22% | | | | 2.47% | | | | 2.88% | | | | 1.81% | (c) |
| • | Commencement of operations. |
| (a) | Net investment income (loss) allocated based on average shares method. |
| (b) | Total return measures net investment income (loss) and capital gain or loss from portfolio investments assuming reinvestment of dividends and capital gains distributions. Total return is not annualized for periods that are less than a full year, does not reflect the effect of sales charge for Class A shares nor the contingent deferred sales charge for Class C shares and does not reflect the deduction of taxes that a shareholder would pay on fund distributions or the redemption of fund shares. |
| | | | |
| 202 | | CALAMOS OPEN-END FAMILY OF FUNDS ANNUAL REPORT | | |
Calamos Growth Fund Financial Highlights
Selected data for a share outstanding throughout each year were as follows:
| | | | | | | | | | | | | | | | | | | | |
| | | CLASS A | |
| | | Year Ended October 31, | |
| | | 2018 | | | 2017 | | | 2016 | | | 2015 | | | 2014 | |
Net asset value, beginning of year | | | $35.54 | | | | $30.12 | | | | $42.80 | | | | $50.16 | | | | $58.75 | |
Income from investment operations: | | | | | | | | | | | | | | | | | | | | |
Net investment income (loss)(a) | | | (0.08 | ) | | | (0.17 | ) | | | (0.07 | ) | | | (0.07 | ) | | | (0.20 | ) |
Net realized and unrealized gain (loss) | | | 2.15 | | | | 6.79 | | | | (1.67 | ) | | | 2.84 | | | | 6.90 | |
Total from investment operations | | | 2.07 | | | | 6.62 | | | | (1.74 | ) | | | 2.77 | | | | 6.70 | |
Distributions: | | | | | | | | | | | | | | | | | | | | |
Dividends from net investment income | | | — | | | | — | | | | — | | | | — | | | | — | |
Dividends from net realized gains | | | (4.47 | ) | | | (1.20 | ) | | | (10.94 | ) | | | (10.13 | ) | | | (15.29 | ) |
Total distributions | | | (4.47 | ) | | | (1.20 | ) | | | (10.94 | ) | | | (10.13 | ) | | | (15.29 | ) |
Net asset value, end of year | | | $33.14 | | | | $35.54 | | | | $30.12 | | | | $42.80 | | | | $50.16 | |
Ratios and supplemental data: | | | | | | | | | | | | | | | | | | | | |
Total return(b) | | | 6.12% | | | | 22.79% | | | | (4.76% | ) | | | 6.55% | | | | 13.84% | |
Net assets, end of year (000) | | | $851,590 | | | | $967,725 | | | | $1,017,541 | | | | $1,424,967 | | | | $1,718,674 | |
Ratio of net expenses to average net assets | | | 1.29% | | | | 1.39% | | | | 1.34% | | | | 1.31% | | | | 1.26% | |
Ratio of gross expenses to average net assets prior to expense reductions | | | 1.29% | | | | 1.39% | | | | 1.34% | | | | 1.31% | | | | 1.26% | |
Ratio of net investment income (loss) to average net assets | | | (0.22% | ) | | | (0.52% | ) | | | (0.21% | ) | | | (0.17% | ) | | | (0.42% | ) |
| |
| | | Year Ended October 31, | |
| | | 2018 | | | 2017 | | | 2016 | | | 2015 | | | 2014 | |
Portfolio turnover rate | | | 71.7% | | | | 104.4% | | | | 90.0% | | | | 60.0% | | | | 41.8% | |
| |
| | | CLASS C | |
| | | Year Ended October 31, | |
| | | 2018 | | | 2017 | | | 2016 | | | 2015 | | | 2014 | |
Net asset value, beginning of year | | | $24.26 | | | | $21.08 | | | | $33.48 | | | | $41.66 | | | | $51.58 | |
Income from investment operations: | | | | | | | | | | | | | | | | | | | | |
Net investment income (loss)(a) | | | (0.22 | ) | | | (0.28 | ) | | | (0.21 | ) | | | (0.32 | ) | | | (0.48 | ) |
Net realized and unrealized gain (loss) | | | 1.43 | | | | 4.66 | | | | (1.25 | ) | | | 2.27 | | | | 5.85 | |
Total from investment operations | | | 1.21 | | | | 4.38 | | | | (1.46 | ) | | | 1.95 | | | | 5.37 | |
Distributions: | | | | | | | | | | | | | | | | | | | | |
Dividends from net investment income | | | — | | | | — | | | | — | | | | — | | | | — | |
Dividends from net realized gains | | | (4.47 | ) | | | (1.20 | ) | | | (10.94 | ) | | | (10.13 | ) | | | (15.29 | ) |
Total distributions | | | (4.47 | ) | | | (1.20 | ) | | | (10.94 | ) | | | (10.13 | ) | | | (15.29 | ) |
Net asset value, end of year | | | $21.00 | | | | $24.26 | | | | $21.08 | | | | $33.48 | | | | $41.66 | |
Ratios and supplemental data: | | | | | | | | | | | | | | | | | | | | |
Total return(b) | | | 5.34% | | | | 21.85% | | | | (5.45% | ) | | | 5.75% | | | | 12.97% | |
Net assets, end of year (000) | | | $329,883 | | | | $398,115 | | | | $540,422 | | | | $792,046 | | | | $959,445 | |
Ratio of net expenses to average net assets | | | 2.04% | | | | 2.14% | | | | 2.09% | | | | 2.06% | | | | 2.01% | |
Ratio of gross expenses to average net assets prior to expense reductions | | | 2.04% | | | | 2.14% | | | | 2.09% | | | | 2.06% | | | | 2.01% | |
Ratio of net investment income (loss) to average net assets | | | (0.97% | ) | | | (1.26% | ) | | | (0.96% | ) | | | (0.92% | ) | | | (1.17% | ) |
| (a) | Net investment income (loss) allocated based on average shares method. |
| (b) | Total return measures net investment income (loss) and capital gain or loss from portfolio investments assuming reinvestment of dividends and capital gains distributions. Total return is not annualized for periods that are less than a full year, does not reflect the effect of sales charge for Class A shares nor the contingent deferred sales charge for Class C shares and does not reflect the deduction of taxes that a shareholder would pay on fund distributions or the redemption of fund shares. |
Calamos Growth Fund Financial Highlights
| | | | | | | | | | | | | | | | | | | | |
| | | CLASS I | |
| | | Year Ended October 31, | |
| | | 2018 | | | 2017 | | | 2016 | | | 2015 | | | 2014 | |
Net asset value, beginning of year | | | $45.18 | | | | $37.88 | | | | $50.84 | | | | $57.59 | | | | $65.15 | |
Income from investment operations: | | | | | | | | | | | | | | | | | | | | |
Net investment income (loss)(a) | | | 0.02 | | | | (0.11 | ) | | | 0.02 | | | | 0.05 | | | | (0.10 | ) |
Net realized and unrealized gain (loss) | | | 2.75 | | | | 8.61 | | | | (2.04 | ) | | | 3.33 | | | | 7.83 | |
Total from investment operations | | | 2.77 | | | | 8.50 | | | | (2.02 | ) | | | 3.38 | | | | 7.73 | |
Distributions: | | | | | | | | | | | | | | | | | | | | |
Dividends from net investment income | | | — | | | | — | | | | — | | | | — | | | | — | |
Dividends from net realized gains | | | (4.47 | ) | | | (1.20 | ) | | | (10.94 | ) | | | (10.13 | ) | | | (15.29 | ) |
Total distributions | | | (4.47 | ) | | | (1.20 | ) | | | (10.94 | ) | | | (10.13 | ) | | | (15.29 | ) |
Net asset value, end of year | | | $43.48 | | | | $45.18 | | | | $37.88 | | | | $50.84 | | | | $57.59 | |
Ratios and supplemental data: | | | | | | | | | | | | | | | | | | | | |
Total return(b) | | | 6.41% | | | | 23.09% | | | | (4.51% | ) | | | 6.80% | | | | 14.12% | |
Net assets, end of year (000) | | | $282,061 | | | | $301,237 | | | | $327,872 | | | | $480,028 | | | | $759,432 | |
Ratio of net expenses to average net assets | | | 1.04% | | | | 1.14% | | | | 1.09% | | | | 1.06% | | | | 1.01% | |
Ratio of gross expenses to average net assets prior to expense reductions | | | 1.04% | | | | 1.14% | | | | 1.09% | | | | 1.06% | | | | 1.01% | |
Ratio of net investment income (loss) to average net assets | | | 0.03% | | | | (0.27% | ) | | | 0.04% | | | | 0.09% | | | | (0.18% | ) |
| (a) | Net investment income (loss) allocated based on average shares method. |
| (b) | Total return measures net investment income (loss) and capital gain or loss from portfolio investments assuming reinvestment of dividends and capital gains distributions. Total return is not annualized for periods that are less than a full year, does not reflect the effect of sales charge for Class A shares nor the contingent deferred sales charge for Class C shares and does not reflect the deduction of taxes that a shareholder would pay on fund distributions or the redemption of fund shares. |
| | | | |
| 204 | | CALAMOS OPEN-END FAMILY OF FUNDS ANNUAL REPORT | | |
Calamos Growth and Income Fund Financial Highlights
Selected data for a share outstanding throughout each year were as follows:
| | | | | | | | | | | | | | | | | | | | |
| | | CLASS A | |
| | | Year Ended October 31, | |
| | | 2018 | | | 2017 | | | 2016 | | | 2015 | | | 2014 | |
Net asset value, beginning of year | | | $33.15 | | | | $30.17 | | | | $31.68 | | | | $35.22 | | | | $35.84 | |
Income from investment operations: | | | | | | | | | | | | | | | | | | | | |
Net investment income (loss)(a) | | | 0.25 | | | | 0.49 | | | | 0.48 | | | | 0.60 | | | | 0.60 | |
Net realized and unrealized gain (loss) | | | 1.41 | | | | 4.53 | | | | 0.16 | | | | 0.51 | | | | 2.78 | |
Total from investment operations | | | 1.66 | | | | 5.02 | | | | 0.64 | | | | 1.11 | | | | 3.38 | |
Distributions: | | | | | | | | | | | | | | | | | | | | |
Dividends from net investment income | | | (0.38 | ) | | | (0.84 | ) | | | (0.84 | ) | | | (0.89 | ) | | | (0.80 | ) |
Dividends from net realized gains | | | (1.90 | ) | | | (1.20 | ) | | | (1.31 | ) | | | (3.76 | ) | | | (3.20 | ) |
Total distributions | | | (2.28 | ) | | | (2.04 | ) | | | (2.15 | ) | | | (4.65 | ) | | | (4.00 | ) |
Net asset value, end of year | | | $32.53 | | | | $33.15 | | | | $30.17 | | | | $31.68 | | | | $35.22 | |
Ratios and supplemental data: | | | | | | | | | | | | | | | | | | | | |
Total return(b) | | | 5.20% | | | | 17.39% | | | | 2.26% | | | | 3.50% | | | | 10.33% | |
Net assets, end of year (000) | | | $832,433 | | | | $918,695 | | | | $930,625 | | | | $1,105,102 | | | | $1,316,498 | |
Ratio of net expenses to average net assets | | | 1.09% | | | | 1.11% | | | | 1.11% | | | | 1.10% | | | | 1.09% | |
Ratio of gross expenses to average net assets prior to expense reductions | | | 1.09% | | | | 1.11% | | | | 1.11% | | | | 1.10% | | | | 1.09% | |
Ratio of net investment income (loss) to average net assets | | | 0.77% | | | | 1.58% | | | | 1.59% | | | | 1.86% | | | | 1.76% | |
| |
| | | Year Ended October 31, | |
| | | 2018 | | | 2017 | | | 2016 | | | 2015 | | | 2014 | |
Portfolio turnover rate | | | 25.3% | | | | 31.6% | | | | 23.5% | | | | 23.8% | | | | 32.8% | |
| |
| | | CLASS C | |
| | | Year Ended October 31, | |
| | | 2018 | | | 2017 | | | 2016 | | | 2015 | | | 2014 | |
Net asset value, beginning of year | | | $33.30 | | | | $30.28 | | | | $31.81 | | | | $35.34 | | | | $35.78 | |
Income from investment operations: | | | | | | | | | | | | | | | | | | | | |
Net investment income (loss)(a) | | | 0.01 | | | | 0.27 | | | | 0.25 | | | | 0.36 | | | | 0.35 | |
Net realized and unrealized gain (loss) | | | 1.41 | | | | 4.54 | | | | 0.14 | | | | 0.51 | | | | 2.77 | |
Total from investment operations | | | 1.42 | | | | 4.81 | | | | 0.39 | | | | 0.87 | | | | 3.12 | |
Distributions: | | | | | | | | | | | | | | | | | | | | |
Dividends from net investment income | | | (0.13 | ) | | | (0.59 | ) | | | (0.61 | ) | | | (0.64 | ) | | | (0.36 | ) |
Dividends from net realized gains | | | (1.90 | ) | | | (1.20 | ) | | | (1.31 | ) | | | (3.76 | ) | | | (3.20 | ) |
Total distributions | | | (2.03 | ) | | | (1.79 | ) | | | (1.92 | ) | | | (4.40 | ) | | | (3.56 | ) |
Net asset value, end of year | | | $32.69 | | | | $33.30 | | | | $30.28 | | | | $31.81 | | | | $35.34 | |
Ratios and supplemental data: | | | | | | | | | | | | | | | | | | | | |
Total return(b) | | | 4.42% | | | | 16.54% | | | | 1.39% | | | | 2.73% | | | | 9.48% | |
Net assets, end of year (000) | | | $502,593 | | | | $574,455 | | | | $739,780 | | | | $889,516 | | | | $1,009,029 | |
Ratio of net expenses to average net assets | | | 1.84% | | | | 1.86% | | | | 1.86% | | | | 1.85% | | | | 1.84% | |
Ratio of gross expenses to average net assets prior to expense reductions | | | 1.84% | | | | 1.86% | | | | 1.86% | | | | 1.85% | | | | 1.84% | |
Ratio of net investment income (loss) to average net assets | | | 0.02% | | | | 0.85% | | | | 0.84% | | | | 1.11% | | | | 1.02% | |
| (a) | Net investment income (loss) allocated based on average shares method. |
| (b) | Total return measures net investment income (loss) and capital gain or loss from portfolio investments assuming reinvestment of dividends and capital gains distributions. Total return is not annualized for periods that are less than a full year, does not reflect the effect of sales charge for Class A shares nor the contingent deferred sales charge for Class C shares and does not reflect the deduction of taxes that a shareholder would pay on fund distributions or the redemption of fund shares. |
Calamos Growth and Income Fund Financial Highlights
| | | | | | | | | | | | | | | | | | | | |
| | | CLASS I | |
| | | Year Ended October 31, | |
| | | 2018 | | | 2017 | | | 2016 | | | 2015 | | | 2014 | |
Net asset value, beginning of year | | | $31.96 | | | | $29.15 | | | | $30.71 | | | | $34.28 | | | | $35.07 | |
Income from investment operations: | | | | | | | | | | | | | | | | | | | | |
Net investment income (loss)(a) | | | 0.32 | | | | 0.55 | | | | 0.53 | | | | 0.66 | | | | 0.68 | |
Net realized and unrealized gain (loss) | | | 1.37 | | | | 4.38 | | | | 0.14 | | | | 0.50 | | | | 2.69 | |
Total from investment operations | | | 1.69 | | | | 4.93 | | | | 0.67 | | | | 1.16 | | | | 3.37 | |
Distributions: | | | | | | | | | | | | | | | | | | | | |
Dividends from net investment income | | | (0.47 | ) | | | (0.92 | ) | | | (0.92 | ) | | | (0.97 | ) | | | (0.96 | ) |
Dividends from net realized gains | | | (1.90 | ) | | | (1.20 | ) | | | (1.31 | ) | | | (3.76 | ) | | | (3.20 | ) |
Total distributions | | | (2.37 | ) | | | (2.12 | ) | | | (2.23 | ) | | | (4.73 | ) | | | (4.16 | ) |
Net asset value, end of year | | | $31.28 | | | | $31.96 | | | | $29.15 | | | | $30.71 | | | | $34.28 | |
Ratios and supplemental data: | | | | | | | | | | | | | | | | | | | | |
Total return(b) | | | 5.45% | | | | 17.71% | | | | 2.43% | | | | 3.79% | | | | 10.60% | |
Net assets, end of year (000) | | | $643,422 | | | | $554,490 | | | | $513,604 | | | | $577,449 | | | | $688,258 | |
Ratio of net expenses to average net assets | | | 0.84% | | | | 0.86% | | | | 0.86% | | | | 0.85% | | | | 0.84% | |
Ratio of gross expenses to average net assets prior to expense reductions | | | 0.84% | | | | 0.86% | | | | 0.86% | | | | 0.85% | | | | 0.84% | |
Ratio of net investment income (loss) to average net assets | | | 1.01% | | | | 1.83% | | | | 1.84% | | | | 2.11% | | | | 2.04% | |
| (a) | Net investment income (loss) allocated based on average shares method. |
| (b) | Total return measures net investment income (loss) and capital gain or loss from portfolio investments assuming reinvestment of dividends and capital gains distributions. Total return is not annualized for periods that are less than a full year, does not reflect the effect of sales charge for Class A shares nor the contingent deferred sales charge for Class C shares and does not reflect the deduction of taxes that a shareholder would pay on fund distributions or the redemption of fund shares. |
| | | | |
| 206 | | CALAMOS OPEN-END FAMILY OF FUNDS ANNUAL REPORT | | |
Calamos Dividend Growth Fund Financial Highlights
Selected data for a share outstanding throughout each year were as follows:
| | | | | | | | | | | | | | | | | | | | |
| | | CLASS A | |
| | | Year Ended October 31, | |
| | | 2018 | | | 2017 | | | 2016 | | | 2015 | | | 2014 | |
Net asset value, beginning of year | | | $12.73 | | | | $10.38 | | | | $10.52 | | | | $10.78 | | | | $10.36 | |
Income from investment operations: | | | | | | | | | | | | | | | | | | | | |
Net investment income (loss)(a) | | | 0.07 | | | | 0.10 | | | | 0.10 | | | | 0.17 | | | | 0.39 | |
Net realized and unrealized gain (loss) | | | 0.57 | | | | 2.30 | | | | 0.11 | | | | (0.15 | ) | | | 0.24 | |
Total from investment operations | | | 0.64 | | | | 2.40 | | | | 0.21 | | | | 0.02 | | | | 0.63 | |
Distributions: | | | | | | | | | | | | | | | | | | | | |
Dividends from net investment income | | | (0.05 | ) | | | (0.05 | ) | | | (0.08 | ) | | | (0.15 | ) | | | (0.18 | ) |
Dividends from net realized gains | | | (0.98 | ) | | | — | | | | (0.27 | ) | | | (0.13 | ) | | | (0.03 | ) |
Total distributions | | | (1.03 | ) | | | (0.05 | ) | | | (0.35 | ) | | | (0.28 | ) | | | (0.21 | ) |
Net asset value, end of year | | | $12.34 | | | | $12.73 | | | | $10.38 | | | | $10.52 | | | | $10.78 | |
Ratios and supplemental data: | | | | | | | | | | | | | | | | | | | | |
Total return(b) | | | 5.26% | | | | 23.17% | | | | 2.17% | | | | 0.21% | | | | 6.12% | |
Net assets, end of year (000) | | | $2,347 | | | | $2,031 | | | | $23,157 | | | | $28,030 | | | | $28,365 | |
Ratio of net expenses to average net assets | | | 1.35% | | | | 1.35% | | | | 1.33% | | | | 1.35% | | | | 1.35% | |
Ratio of gross expenses to average net assets prior to expense reductions | | | 1.83% | | | | 1.87% | | | | 1.73% | | | | 1.74% | | | | 1.73% | |
Ratio of net investment income (loss) to average net assets | | | 0.55% | | | | 0.93% | | | | 0.95% | | | | 1.66% | | | | 3.68% | |
| |
| | | Year Ended October 31, | |
| | | 2018 | | | 2017 | | | 2016 | | | 2015 | | | 2014 | |
Portfolio turnover rate | | | 10.7% | | | | 15.3% | | | | 11.5% | | | | 107.6% | | | | 130.0% | |
| |
| | | CLASS C | |
| | | Year Ended October 31, | |
| | | 2018 | | | 2017 | | | 2016 | | | 2015 | | | 2014 | |
Net asset value, beginning of year | | | $12.52 | | | | $10.26 | | | | $10.41 | | | | $10.74 | | | | $10.34 | |
Income from investment operations: | | | | | | | | | | | | | | | | | | | | |
Net investment income (loss)(a) | | | (0.02 | ) | | | 0.00 | * | | | 0.02 | | | | 0.08 | | | | 0.31 | |
Net realized and unrealized gain (loss) | | | 0.57 | | | | 2.28 | | | | 0.12 | | | | (0.15 | ) | | | 0.25 | |
Total from investment operations | | | 0.55 | | | | 2.28 | | | | 0.14 | | | | (0.07 | ) | | | 0.56 | |
Distributions: | | | | | | | | | | | | | | | | | | | | |
Dividends from net investment income | | | — | | | | (0.02 | ) | | | (0.02 | ) | | | (0.13 | ) | | | (0.13 | ) |
Dividends from net realized gains | | | (0.98 | ) | | | — | | | | (0.27 | ) | | | (0.13 | ) | | | (0.03 | ) |
Total distributions | | | (0.98 | ) | | | (0.02 | ) | | | (0.29 | ) | | | (0.26 | ) | | | (0.16 | ) |
Net asset value, end of year | | | $12.09 | | | | $12.52 | | | | $10.26 | | | | $10.41 | | | | $10.74 | |
Ratios and supplemental data: | | | | | | | | | | | | | | | | | | | | |
Total return(b) | | | 4.56% | | | | 22.26% | | | | 1.42% | | | | (0.63% | ) | | | 5.40% | |
Net assets, end of year (000) | | | $1,028 | | | | $1,039 | | | | $969 | | | | $702 | | | | $418 | |
Ratio of net expenses to average net assets | | | 2.10% | | | | 2.10% | | | | 2.08% | | | | 2.10% | | | | 2.10% | |
Ratio of gross expenses to average net assets prior to expense reductions | | | 2.59% | | | | 2.73% | | | | 2.48% | | | | 2.51% | | | | 2.44% | |
Ratio of net investment income (loss) to average net assets | | | (0.19% | ) | | | 0.00% | ** | | | 0.17% | | | | 0.77% | | | | 2.90% | |
| * | Amounts are less than $0.005. |
| ** | Amounts are less than 0.005%. |
| (a) | Net investment income (loss) allocated based on average shares method. |
| (b) | Total return measures net investment income (loss) and capital gain or loss from portfolio investments assuming reinvestment of dividends and capital gains distributions. Total return is not annualized for periods that are less than a full year, does not reflect the effect of sales charge for Class A shares nor the contingent deferred sales charge for Class C shares and does not reflect the deduction of taxes that a shareholder would pay on fund distributions or the redemption of fund shares. |
Calamos Dividend Growth Fund Financial Highlights
| | | | | | | | | | | | | | | | | | | | |
| | | CLASS I | |
| | | Year Ended October 31, | |
| | | 2018 | | | 2017 | | | 2016 | | | 2015 | | | 2014 | |
Net asset value, beginning of year | | | $12.71 | | | | $10.39 | | | | $10.55 | | | | $10.79 | | | | $10.37 | |
Income from investment operations: | | | | | | | | | | | | | | | | | | | | |
Net investment income (loss)(a) | | | 0.10 | | | | 0.11 | | | | 0.12 | | | | 0.20 | | | | 0.42 | |
Net realized and unrealized gain (loss) | | | 0.58 | | | | 2.32 | | | | 0.12 | | | | (0.16 | ) | | | 0.23 | |
Total from investment operations | | | 0.68 | | | | 2.43 | | | | 0.24 | | | | 0.04 | | | | 0.65 | |
Distributions: | | | | | | | | | | | | | | | | | | | | |
Dividends from net investment income | | | (0.08 | ) | | | (0.11 | ) | | | (0.13 | ) | | | (0.15 | ) | | | (0.20 | ) |
Dividends from net realized gains | | | (0.98 | ) | | | — | | | | (0.27 | ) | | | (0.13 | ) | | | (0.03 | ) |
Total distributions | | | (1.06 | ) | | | (0.11 | ) | | | (0.40 | ) | | | (0.28 | ) | | | (0.23 | ) |
Net asset value, end of year | | | $12.33 | | | | $12.71 | | | | $10.39 | | | | $10.55 | | | | $10.79 | |
Ratios and supplemental data: | | | | | | | | | | | | | | | | | | | | |
Total return(b) | | | 5.61% | | | | 23.46% | | | | 2.39% | | | | 0.47% | | | | 6.33% | |
Net assets, end of year (000) | | | $20,585 | | | | $22,201 | | | | $7,989 | | | | $7,375 | | | | $8,020 | |
Ratio of net expenses to average net assets | | | 1.10% | | | | 1.10% | | | | 1.08% | | | | 1.10% | | | | 1.10% | |
Ratio of gross expenses to average net assets prior to expense reductions | | | 1.60% | | | | 1.80% | | | | 1.48% | | | | 1.49% | | | | 1.48% | |
Ratio of net investment income (loss) to average net assets | | | 0.82% | | | | 0.89% | | | | 1.17% | | | | 1.91% | | | | 3.97% | |
| (a) | Net investment income (loss) allocated based on average shares method. |
| (b) | Total return measures net investment income (loss) and capital gain or loss from portfolio investments assuming reinvestment of dividends and capital gains distributions. Total return is not annualized for periods that are less than a full year, does not reflect the effect of sales charge for Class A shares nor the contingent deferred sales charge for Class C shares and does not reflect the deduction of taxes that a shareholder would pay on fund distributions or the redemption of fund shares. |
| | | | |
| 208 | | CALAMOS OPEN-END FAMILY OF FUNDS ANNUAL REPORT | | |
Calamos Opportunistic Value Fund Financial Highlights
Selected data for a share outstanding throughout each year were as follows:
| | | | | | | | | | | | | | | | | | | | |
| | | CLASS A | |
| | | Year Ended October 31, | |
| | | 2018 | | | 2017 | | | 2016 | | | 2015 | | | 2014 | |
Net asset value, beginning of year | | | $15.21 | | | | $12.60 | | | | $13.61 | | | | $15.07 | | | | $15.22 | |
Income from investment operations: | | | | | | | | | | | | | | | | | | | | |
Net investment income (loss)(a) | | | 0.10 | | | | 0.15 | | | | 0.21 | | | | 0.19 | | | | 0.18 | |
Net realized and unrealized gain (loss) | | | 0.58 | | | | 2.56 | | | | (0.15 | ) | | | (0.52 | ) | | | 0.92 | |
Total from investment operations | | | 0.68 | | | | 2.71 | | | | 0.06 | | | | (0.33 | ) | | | 1.10 | |
Distributions: | | | | | | | | | | | | | | | | | | | | |
Dividends from net investment income | | | (0.05 | ) | | | (0.10 | ) | | | (0.16 | ) | | | (0.14 | ) | | | (0.14 | ) |
Dividends from net realized gains | | | (0.47 | ) | | | — | | | | (0.91 | ) | | | (0.99 | ) | | | (1.11 | ) |
Total distributions | | | (0.52 | ) | | | (0.10 | ) | | | (1.07 | ) | | | (1.13 | ) | | | (1.25 | ) |
Net asset value, end of year | | | $15.37 | | | | $15.21 | | | | $12.60 | | | | $13.61 | | | | $15.07 | |
Ratios and supplemental data: | | | | | | | | | | | | | | | | | | | | |
Total return(b) | | | 4.53% | | | | 21.56% | | | | 0.76% | | | | (2.32% | ) | | | 7.67% | |
Net assets, end of year (000) | | | $21,349 | | | | $21,894 | | | | $32,350 | | | | $44,792 | | | | $58,419 | |
Ratio of net expenses to average net assets | | | 1.15% | | | | 1.15% | | | | 1.12% | | | | 1.15% | | | | 1.15% | |
Ratio of gross expenses to average net assets prior to expense reductions | | | 1.60% | | | | 1.67% | | | | 1.57% | | | | 1.61% | | | | 1.50% | |
Ratio of net investment income (loss) to average net assets | | | 0.64% | | | | 1.10% | | | | 1.67% | | | | 1.38% | | | | 1.19% | |
| |
| | | Year Ended October 31, | |
| | | 2018 | | | 2017 | | | 2016 | | | 2015 | | | 2014 | |
Portfolio turnover rate | | | 119.3% | | | | 104.7% | | | | 40.7% | | | | 139.8% | | | | 165.4% | |
| |
| | | CLASS C | |
| | | Year Ended October 31, | |
| | | 2018 | | | 2017 | | | 2016 | | | 2015 | | | 2014 | |
Net asset value, beginning of year | | | $13.74 | | | | $11.39 | | | | $12.38 | | | | $13.79 | | | | $14.09 | |
Income from investment operations: | | | | | | | | | | | | | | | | | | | | |
Net investment income (loss)(a) | | | (0.01 | ) | | | 0.04 | | | | 0.10 | | | | 0.08 | | | | 0.06 | |
Net realized and unrealized gain (loss) | | | 0.51 | | | | 2.32 | | | | (0.13 | ) | | | (0.47 | ) | | | 0.85 | |
Total from investment operations | | | 0.50 | | | | 2.36 | | | | (0.03 | ) | | | (0.39 | ) | | | 0.91 | |
Distributions: | | | | | | | | | | | | | | | | | | | | |
Dividends from net investment income | | | — | | | | (0.01 | ) | | | (0.05 | ) | | | (0.03 | ) | | | (0.10 | ) |
Dividends from net realized gains | | | (0.47 | ) | | | — | | | | (0.91 | ) | | | (0.99 | ) | | | (1.11 | ) |
Total distributions | | | (0.47 | ) | | | (0.01 | ) | | | (0.96 | ) | | | (1.02 | ) | | | (1.21 | ) |
Net asset value, end of year | | | $13.77 | | | | $13.74 | | | | $11.39 | | | | $12.38 | | | | $13.79 | |
Ratios and supplemental data: | | | | | | | | | | | | | | | | | | | | |
Total return(b) | | | 3.77% | | | | 20.70% | | | | (0.04% | ) | | | (3.01% | ) | | | 6.82% | |
Net assets, end of year (000) | | | $4,318 | | | | $4,728 | | | | $4,915 | | | | $5,738 | | | | $9,964 | |
Ratio of net expenses to average net assets | | | 1.90% | | | | 1.90% | | | | 1.87% | | | | 1.90% | | | | 1.90% | |
Ratio of gross expenses to average net assets prior to expense reductions | | | 2.35% | | | | 2.42% | | | | 2.32% | | | | 2.35% | | | | 2.25% | |
Ratio of net investment income (loss) to average net assets | | | (0.10% | ) | | | 0.31% | | | | 0.91% | | | | 0.64% | | | | 0.44% | |
| (a) | Net investment income (loss) allocated based on average shares method. |
| (b) | Total return measures net investment income (loss) and capital gain or loss from portfolio investments assuming reinvestment of dividends and capital gains distributions. Total return is not annualized for periods that are less than a full year, does not reflect the effect of sales charge for Class A shares nor the contingent deferred sales charge for Class C shares and does not reflect the deduction of taxes that a shareholder would pay on fund distributions or the redemption of fund shares. |
Calamos Opportunistic Value Fund Financial Highlights
| | | | | | | | | | | | | | | | | | | | |
| | | CLASS I | |
| | | Year Ended October 31, | |
| | | 2018 | | | 2017 | | | 2016 | | | 2015 | | | 2014 | |
Net asset value, beginning of year | | | $15.63 | | | | $12.94 | | | | $13.96 | | | | $15.44 | | | | $15.57 | |
Income from investment operations: | | | | | | | | | | | | | | | | | | | | |
Net investment income (loss)(a) | | | 0.14 | | | | 0.18 | | | | 0.24 | | | | 0.23 | | | | 0.22 | |
Net realized and unrealized gain (loss) | | | 0.59 | | | | 2.64 | | | | (0.14 | ) | | | (0.53 | ) | | | 0.94 | |
Total from investment operations | | | 0.73 | | | | 2.82 | | | | 0.10 | | | | (0.30 | ) | | | 1.16 | |
Distributions: | | | | | | | | | | | | | | | | | | | | |
Dividends from net investment income | | | (0.09 | ) | | | (0.13 | ) | | | (0.21 | ) | | | (0.19 | ) | | | (0.18 | ) |
Dividends from net realized gains | | | (0.47 | ) | | | — | | | | (0.91 | ) | | | (0.99 | ) | | | (1.11 | ) |
Total distributions | | | (0.56 | ) | | | (0.13 | ) | | | (1.12 | ) | | | (1.18 | ) | | | (1.29 | ) |
Net asset value, end of year | | | $15.80 | | | | $15.63 | | | | $12.94 | | | | $13.96 | | | | $15.44 | |
Ratios and supplemental data: | | | | | | | | | | | | | | | | | | | | |
Total return(b) | | | 4.78% | | | | 21.92% | | | | 0.98% | | | | (2.08% | ) | | | 7.87% | |
Net assets, end of year (000) | | | $21,892 | | | | $25,669 | | | | $16,672 | | | | $19,583 | | | | $32,147 | |
Ratio of net expenses to average net assets | | | 0.90% | | | | 0.90% | | | | 0.87% | | | | 0.90% | | | | 0.90% | |
Ratio of gross expenses to average net assets prior to expense reductions | | | 1.36% | | | | 1.42% | | | | 1.32% | | | | 1.36% | | | | 1.25% | |
Ratio of net investment income (loss) to average net assets | | | 0.90% | | | | 1.28% | | | | 1.91% | | | | 1.63% | | | | 1.45% | |
| (a) | Net investment income (loss) allocated based on average shares method. |
| (b) | Total return measures net investment income (loss) and capital gain or loss from portfolio investments assuming reinvestment of dividends and capital gains distributions. Total return is not annualized for periods that are less than a full year, does not reflect the effect of sales charge for Class A shares nor the contingent deferred sales charge for Class C shares and does not reflect the deduction of taxes that a shareholder would pay on fund distributions or the redemption of fund shares. |
| | | | |
| 210 | | CALAMOS OPEN-END FAMILY OF FUNDS ANNUAL REPORT | | |
Calamos International Growth Fund Financial Highlights
Selected data for a share outstanding throughout each year were as follows:
| | | | | | | | | | | | | | | | | | | | |
| | | CLASS A | |
| | | Year Ended October 31, | |
| | | 2018 | | | 2017 | | | 2016 | | | 2015 | | | 2014 | |
Net asset value, beginning of year | | | $21.55 | | | | $16.65 | | | | $17.27 | | | | $19.27 | | | | $19.24 | |
Income from investment operations: | | | | | | | | | | | | | | | | | | | | |
Net investment income (loss)(a) | | | 0.15 | | | | 0.07 | | | | 0.05 | | | | 0.09 | | | | 0.09 | |
Net realized and unrealized gain (loss) | | | (2.78 | ) | | | 4.83 | | | | (0.65 | ) | | | 0.02 | | | | 0.02 | |
Total from investment operations | | | (2.63 | ) | | | 4.90 | | | | (0.60 | ) | | | 0.11 | | | | 0.11 | |
Distributions: | | | | | | | | | | | | | | | | | | | | |
Dividends from net investment income | | | — | | | | — | | | | — | | | | — | | | | (0.08 | ) |
Dividends from net realized gains | | | (0.82 | ) | | | — | | | | (0.02 | ) | | | (2.11 | ) | | | — | |
Return of capital | | | — | | | | — | | | | (0.00 | )* | | | — | | | | — | |
Total distributions | | | (0.82 | ) | | | — | | | | (0.02 | ) | | | (2.11 | ) | | | (0.08 | ) |
Net asset value, end of year | | | $18.10 | | | | $21.55 | | | | $16.65 | | | | $17.27 | | | | $19.27 | |
Ratios and supplemental data: | | | | | | | | | | | | | | | | | | | | |
Total return(b) | | | (12.70% | ) | | | 29.43% | | | | (3.46% | ) | | | 0.94% | | | | 0.57% | |
Net assets, end of year (000) | | | $59,566 | | | | $72,491 | | | | $111,036 | | | | $209,548 | | | | $254,400 | |
Ratio of net expenses to average net assets | | | 1.33% | | | | 1.40% | | | | 1.38% | | | | 1.31% | | | | 1.39% | |
Ratio of gross expenses to average net assets prior to expense reductions | | | 1.51% | | | | 1.46% | | | | 1.39% | | | | 1.31% | | | | 1.39% | |
Ratio of net investment income (loss) to average net assets | | | 0.71% | | | | 0.41% | | | | 0.32% | | | | 0.52% | | | | 0.43% | |
| |
| | | Year Ended October 31, | |
| | | 2018 | | | 2017 | | | 2016 | | | 2015 | | | 2014 | |
Portfolio turnover rate | | | 111.8% | | | | 100.4% | | | | 69.0% | | | | 65.0% | | | | 81.6% | |
| |
| | | CLASS C | |
| | | Year Ended October 31, | |
| | | 2018 | | | 2017 | | | 2016 | | | 2015 | | | 2014 | |
Net asset value, beginning of year | | | $19.72 | | | | $15.35 | | | | $16.04 | | | | $18.18 | | | | $18.21 | |
Income from investment operations: | | | | | | | | | | | | | | | | | | | | |
Net investment income (loss)(a) | | | (0.03 | ) | | | (0.05 | ) | | | (0.07 | ) | | | (0.04 | ) | | | (0.06 | ) |
Net realized and unrealized gain (loss) | | | (2.49 | ) | | | 4.42 | | | | (0.60 | ) | | | 0.01 | | | | 0.03 | |
Total from investment operations | | | (2.52 | ) | | | 4.37 | | | | (0.67 | ) | | | (0.03 | ) | | | (0.03 | ) |
Distributions: | | | | | | | | | | | | | | | | | | | | |
Dividends from net investment income | | | — | | | | — | | | | — | | | | — | | | | — | |
Dividends from net realized gains | | | (0.82 | ) | | | — | | | | (0.02 | ) | | | (2.11 | ) | | | — | |
Return of capital | | | — | | | | — | | | | (0.00 | )* | | | — | | | | — | |
Total distributions | | | (0.82 | ) | | | — | | | | (0.02 | ) | | | (2.11 | ) | | | — | |
Net asset value, end of year | | | $16.38 | | | | $19.72 | | | | $15.35 | | | | $16.04 | | | | $18.18 | |
Ratios and supplemental data: | | | | | | | | | | | | | | | | | | | | |
Total return(b) | | | (13.35% | ) | | | 28.47% | | | | (4.16% | ) | | | 0.15% | | | | (0.16% | ) |
Net assets, end of year (000) | | | $20,449 | | | | $27,840 | | | | $35,537 | | | | $47,996 | | | | $59,756 | |
Ratio of net expenses to average net assets | | | 2.06% | | | | 2.15% | | | | 2.13% | | | | 2.06% | | | | 2.13% | |
Ratio of gross expenses to average net assets prior to expense reductions | | | 2.26% | | | | 2.21% | | | | 2.14% | | | | 2.06% | | | | 2.13% | |
Ratio of net investment income (loss) to average net assets | | | (0.17% | ) | | | (0.33% | ) | | | (0.46% | ) | | | (0.23% | ) | | | (0.32% | ) |
| * | Amounts are less than $0.005. |
| (a) | Net investment income (loss) allocated based on average shares method. |
| (b) | Total return measures net investment income (loss) and capital gain or loss from portfolio investments assuming reinvestment of dividends and capital gains distributions. Total return is not annualized for periods that are less than a full year, does not reflect the effect of sales charge for Class A shares nor the contingent deferred sales charge for Class C shares and does not reflect the deduction of taxes that a shareholder would pay on fund distributions or the redemption of fund shares. |
Calamos International Growth Fund Financial Highlights
| | | | | | | | | | | | | | | | | | | | |
| | | CLASS I | |
| | | Year Ended October 31, | |
| | | 2018 | | | 2017 | | | 2016 | | | 2015 | | | 2014 | |
Net asset value, beginning of year | | | $22.01 | | | | $16.96 | | | | $17.54 | | | | $19.50 | | | | $19.48 | |
Income from investment operations: | | | | | | | | | | | | | | | | | | | | |
Net investment income (loss)(a) | | | 0.18 | | | | 0.12 | | | | 0.09 | | | | 0.14 | | | | 0.13 | |
Net realized and unrealized gain (loss) | | | (2.82 | ) | | | 4.93 | | | | (0.65 | ) | | | 0.01 | | | | 0.03 | |
Total from investment operations | | | (2.64 | ) | | | 5.05 | | | | (0.56 | ) | | | 0.15 | | | | 0.16 | |
Distributions: | | | | | | | | | | | | | | | | | | | | |
Dividends from net investment income | | | — | | | | — | | | | — | | | | — | | | | (0.14 | ) |
Dividends from net realized gains | | | (0.82 | ) | | | — | | | | (0.02 | ) | | | (2.11 | ) | | | — | |
Return of capital | | | — | | | | — | | | | (0.00 | )* | | | — | | | | — | |
Total distributions | | | (0.82 | ) | | | — | | | | (0.02 | ) | | | (2.11 | ) | | | (0.14 | ) |
Net asset value, end of year | | | $18.55 | | | | $22.01 | | | | $16.96 | | | | $17.54 | | | | $19.50 | |
Ratios and supplemental data: | | | | | | | | | | | | | | | | | | | | |
Total return(b) | | | (12.48% | ) | | | 29.78% | | | | (3.18% | ) | | | 1.16% | | | | 0.80% | |
Net assets, end of year (000) | | | $153,312 | | | | $175,070 | | | | $213,166 | | | | $339,909 | | | | $410,485 | |
Ratio of net expenses to average net assets | | | 1.06% | | | | 1.15% | | | | 1.13% | | | | 1.06% | | | | 1.14% | |
Ratio of gross expenses to average net assets prior to expense reductions | | | 1.26% | | | | 1.21% | | | | 1.14% | | | | 1.06% | | | | 1.14% | |
Ratio of net investment income (loss) to average net assets | | | 0.85% | | | | 0.66% | | | | 0.53% | | | | 0.78% | | | | 0.66% | |
| | | | |
| | | CLASS R6 | |
| | | September 17, 2018•
through
October 31, | |
| | | 2018 | |
Net asset value, beginning of period | | | $20.89 | |
Income from investment operations: | |
Net investment income (loss)(a) | | | 0.01 | |
Net realized and unrealized gain (loss) | | | (2.24 | ) |
Total from investment operations | | | (2.23 | ) |
Distributions: | |
Dividends from net investment income | | | — | |
Net asset value, end of period | | | $18.66 | |
Ratios and supplemental data: | |
Total return(b) | | | (10.67% | ) |
Net assets, end of period (000) | | | $22 | |
Ratio of net expenses to average net assets | | | 0.76% | (c) |
Ratio of gross expenses to average net assets prior to expense reductions | | | 1.21% | (c) |
Ratio of net investment income (loss) to average net assets | | | 0.34% | (c) |
| * | Amounts are less than $0.005. |
| • | Commencement of operations. |
| (a) | Net investment income (loss) allocated based on average shares method. |
| (b) | Total return measures net investment income (loss) and capital gain or loss from portfolio investments assuming reinvestment of dividends and capital gains distributions. Total return is not annualized for periods that are less than a full year, does not reflect the effect of sales charge for Class A shares nor the contingent deferred sales charge for Class C shares and does not reflect the deduction of taxes that a shareholder would pay on fund distributions or the redemption of fund shares. |
| | | | |
| 212 | | CALAMOS OPEN-END FAMILY OF FUNDS ANNUAL REPORT | | |
Calamos Evolving World Growth Fund Financial Highlights
Selected data for a share outstanding throughout each year were as follows:
| | | | | | | | | | | | | | | | | | | | |
| | | CLASS A | |
| | | Year Ended October 31, | |
| | | 2018 | | | 2017 | | | 2016 | | | 2015 | | | 2014 | |
Net asset value, beginning of year | | | $14.83 | | | | $12.11 | | | | $12.11 | | | | $13.73 | | | | $13.97 | |
Income from investment operations: | | | | | | | | | | | | | | | | | | | | |
Net investment income (loss)(a) | | | (0.01 | ) | | | 0.05 | | | | 0.03 | | | | 0.02 | | | | 0.06 | |
Net realized and unrealized gain (loss) | | | (2.28 | ) | | | 2.67 | | | | (0.02 | ) | | | (1.31 | ) | | | (0.18 | ) |
Total from investment operations | | | (2.29 | ) | | | 2.72 | | | | 0.01 | | | | (1.29 | ) | | | (0.12 | ) |
Distributions: | | | | | | | | | | | | | | | | | | | | |
Dividends from net investment income | | | (0.00 | )* | | | — | | | | (0.01 | ) | | | (0.03 | ) | | | (0.01 | ) |
Dividends from net realized gains | | | — | | | | — | | | | — | | | | (0.30 | ) | | | (0.11 | ) |
Return of capital | | | (0.00 | )* | | | — | | | | (0.00 | )* | | | (0.00 | )* | | | — | |
Total distributions | | | (0.00 | )* | | | — | | | | (0.01 | ) | | | (0.33 | ) | | | (0.12 | ) |
Net asset value, end of year | | | $12.54 | | | | $14.83 | | | | $12.11 | | | | $12.11 | | | | $13.73 | |
Ratios and supplemental data: | | | | | | | | | | | | | | | | | | | | |
Total return(b) | | | (15.43% | ) | | | 22.46% | | | | 0.08% | | | | (9.56% | ) | | | (0.84% | ) |
Net assets, end of year (000) | | | $34,678 | | | | $68,142 | | | | $102,545 | | | | $121,946 | | | | $168,332 | |
Ratio of net expenses to average net assets | | | 1.63% | | | | 1.67% | | | | 1.64% | | | | 1.65% | | | | 1.61% | |
Ratio of gross expenses to average net assets prior to expense reductions | | | 1.63% | | | | 1.67% | | | | 1.64% | | | | 1.65% | | | | 1.61% | |
Ratio of net investment income (loss) to average net assets | | | (0.08% | ) | | | 0.40% | | | | 0.23% | | | | 0.14% | | | | 0.45% | |
| |
| | | Year Ended October 31, | |
| | | 2018 | | | 2017 | | | 2016 | | | 2015 | | | 2014 | |
Portfolio turnover rate | | | 97.3% | | | | 104.8% | | | | 87.4% | | | | 58.8% | | | | 99.9% | |
| |
| | | CLASS C | |
| | | Year Ended October 31, | |
| | | 2018 | | | 2017 | | | 2016 | | | 2015 | | | 2014 | |
Net asset value, beginning of year | | | $14.03 | | | | $11.55 | | | | $11.62 | | | | $13.26 | | | | $13.59 | |
Income from investment operations: | | | | | | | | | | | | | | | | | | | | |
Net investment income (loss)(a) | | | (0.12 | ) | | | (0.03 | ) | | | (0.06 | ) | | | (0.07 | ) | | | (0.04 | ) |
Net realized and unrealized gain (loss) | | | (2.13 | ) | | | 2.51 | | | | (0.01 | ) | | | (1.27 | ) | | | (0.18 | ) |
Total from investment operations | | | (2.25 | ) | | | 2.48 | | | | (0.07 | ) | | | (1.34 | ) | | | (0.22 | ) |
Distributions: | | | | | | | | | | | | | | | | | | | | |
Dividends from net investment income | | | — | | | | — | | | | — | | | | — | | | | — | |
Dividends from net realized gains | | | — | | | | — | | | | — | | | | (0.30 | ) | | | (0.11 | ) |
Return of capital | | | — | | | | — | | | | (0.00 | )* | | | (0.00 | )* | | | — | |
Total distributions | | | — | | | | — | | | | — | | | | (0.30 | ) | | | (0.11 | ) |
Net asset value, end of year | | | $11.78 | | | | $14.03 | | | | $11.55 | | | | $11.62 | | | | $13.26 | |
Ratios and supplemental data: | | | | | | | | | | | | | | | | | | | | |
Total return(b) | | | (16.04% | ) | | | 21.47% | | | | (0.60% | ) | | | (10.25% | ) | | | (1.59% | ) |
Net assets, end of year (000) | | | $17,739 | | | | $24,846 | | | | $31,231 | | | | $36,532 | | | | $44,611 | |
Ratio of net expenses to average net assets | | | 2.38% | | | | 2.41% | | | | 2.39% | | | | 2.40% | | | | 2.37% | |
Ratio of gross expenses to average net assets prior to expense reductions | | | 2.38% | | | | 2.41% | | | | 2.39% | | | | 2.40% | | | | 2.37% | |
Ratio of net investment income (loss) to average net assets | | | (0.85% | ) | | | (0.29% | ) | | | (0.54% | ) | | | (0.59% | ) | | | (0.33% | ) |
| * | Amounts are less than $0.005. |
| (a) | Net investment income (loss) allocated based on average shares method. |
| (b) | Total return measures net investment income (loss) and capital gain or loss from portfolio investments assuming reinvestment of dividends and capital gains distributions. Total return is not annualized for periods that are less than a full year, does not reflect the effect of sales charge for Class A shares nor the contingent deferred sales charge for Class C shares and does not reflect the deduction of taxes that a shareholder would pay on fund distributions or the redemption of fund shares. |
Calamos Evolving World Growth Fund Financial Highlights
| | | | | | | | | | | | | | | | | | | | |
| | | CLASS I | |
| | | Year Ended October 31, | |
| | | 2018 | | | 2017 | | | 2016 | | | 2015 | | | 2014 | |
Net asset value, beginning of year | | | $14.96 | | | | $12.19 | | | | $12.19 | | | | $13.83 | | | | $14.07 | |
Income from investment operations: | | | | | | | | | | | | | | | | | | | | |
Net investment income (loss)(a) | | | 0.02 | | | | 0.09 | | | | 0.06 | | | | 0.05 | | | | 0.09 | |
Net realized and unrealized gain (loss) | | | (2.29 | ) | | | 2.68 | | | | (0.01 | ) | | | (1.32 | ) | | | (0.18 | ) |
Total from investment operations | | | (2.27 | ) | | | 2.77 | | | | 0.05 | | | | (1.27 | ) | | | (0.09 | ) |
Distributions: | | | | | | | | | | | | | | | | | | | | |
Dividends from net investment income | | | (0.06 | ) | | | — | | | | (0.05 | ) | | | (0.07 | ) | | | (0.04 | ) |
Dividends from net realized gains | | | — | | | | — | | | | — | | | | (0.30 | ) | | | (0.11 | ) |
Return of capital | | | (0.00 | )* | | | — | | | | (0.00 | )* | | | (0.00 | )* | | | — | |
Total distributions | | | (0.06 | ) | | | — | | | | (0.05 | ) | | | (0.37 | ) | | | (0.15 | ) |
Net asset value, end of year | | | $12.63 | | | | $14.96 | | | | $12.19 | | | | $12.19 | | | | $13.83 | |
Ratios and supplemental data: | | | | | | | | | | | | | | | | | | | | |
Total return(b) | | | (15.21% | ) | | | 22.72% | | | | 0.38% | | | | (9.35% | ) | | | (0.60% | ) |
Net assets, end of year (000) | | | $152,114 | | | | $225,339 | | | | $255,965 | | | | $351,571 | | | | $436,546 | |
Ratio of net expenses to average net assets | | | 1.38% | | | | 1.41% | | | | 1.39% | | | | 1.40% | | | | 1.37% | |
Ratio of gross expenses to average net assets prior to expense reductions | | | 1.38% | | | | 1.41% | | | | 1.39% | | | | 1.40% | | | | 1.37% | |
Ratio of net investment income (loss) to average net assets | | | 0.14% | | | | 0.72% | | | | 0.50% | | | | 0.42% | | | | 0.65% | |
| * | Amounts are less than $0.005. |
| (a) | Net investment income (loss) allocated based on average shares method. |
| (b) | Total return measures net investment income (loss) and capital gain or loss from portfolio investments assuming reinvestment of dividends and capital gains distributions. Total return is not annualized for periods that are less than a full year, does not reflect the effect of sales charge for Class A shares nor the contingent deferred sales charge for Class C shares and does not reflect the deduction of taxes that a shareholder would pay on fund distributions or the redemption of fund shares. |
| | | | |
| 214 | | CALAMOS OPEN-END FAMILY OF FUNDS ANNUAL REPORT | | |
Calamos Emerging Market Equity Fund Financial Highlights
Selected data for a share outstanding throughout each year were as follows:
| | | | | | | | | | | | | | | | | | | | |
| | | CLASS A | |
| | | Year Ended October 31, | | | December 31, 2013•
through
October 31, | |
| | | 2018 | | | 2017 | | | 2016 | | | 2015 | | | 2014 | |
Net asset value, beginning of year | | | $10.58 | | | | $8.61 | | | | $8.41 | | | | $9.84 | | | | $10.00 | |
Income from investment operations: | | | | | | | | | | | | | | | | | | | | |
Net investment income (loss)(a) | | | 0.00 | * | | | 0.00 | * | | | (0.02 | ) | | | (0.01 | ) | | | 0.02 | |
Net realized and unrealized gain (loss) | | | (2.02 | ) | | | 1.97 | | | | 0.23 | | | | (1.37 | ) | | | (0.18 | ) |
Total from investment operations | | | (2.02 | ) | | | 1.97 | | | | 0.21 | | | | (1.38 | ) | | | (0.16 | ) |
Distributions: | | | | | | | | | | | | | | | | | | | | |
Dividends from net investment income | | | (0.02 | ) | | | — | | | | (0.01 | ) | | | (0.05 | ) | | | — | |
Dividends from net realized gains | | | — | | | | — | | | | — | | | | — | | | | — | |
Return of capital | | | (0.00 | )* | | | — | | | | — | | | | — | | | | — | |
Total distributions | | | (0.02 | ) | | | — | | | | (0.01 | ) | | | (0.05 | ) | | | — | |
Net asset value, end of year | | | $8.54 | | | | $10.58 | | | | $8.61 | | | | $8.41 | | | | $9.84 | |
Ratios and supplemental data: | | | | | | | | | | | | | | | | | | | | |
Total return(b) | | | (19.14% | ) | | | 22.88% | | | | 2.49% | | | | (14.09% | ) | | | (1.60% | ) |
Net assets, end of year (000) | | | $4,479 | | | | $5,491 | | | | $4,483 | | | | $4,465 | | | | $5,360 | |
Ratio of net expenses to average net assets | | | 1.75% | | | | 1.75% | | | | 1.67% | | | | 1.75% | | | | 1.75% | (c) |
Ratio of gross expenses to average net assets prior to expense reductions | | | 2.28% | | | | 2.67% | | | | 2.49% | | | | 2.43% | | | | 3.45% | (c) |
Ratio of net investment income (loss) to average net assets | | | (0.01% | ) | | | 0.04% | | | | (0.23% | ) | | | (0.14% | ) | | | 0.24% | (c) |
| | |
| | | Year Ended October 31, | | | December 31, 2013•
through
October 31, | |
| | | 2018 | | | 2017 | | | 2016 | | | 2015 | | | 2014 | |
Portfolio turnover rate | | | 99.8% | | | | 104.0% | | | | 74.8% | | | | 68.0% | | | | 109.2% | |
| |
| | | CLASS C | |
| | | Year Ended October 31, | | | December 31, 2013•
through
October 31, | |
| | | 2018 | | | 2017 | | | 2016 | | | 2015 | | | 2014 | |
Net asset value, beginning of year | | | $10.36 | | | | $8.49 | | | | $8.34 | | | | $9.78 | | | | $10.00 | |
Income from investment operations: | | | | | | | | | | | | | | | | | | | | |
Net investment income (loss)(a) | | | (0.08 | ) | | | (0.06 | ) | | | (0.08 | ) | | | (0.07 | ) | | | (0.04 | ) |
Net realized and unrealized gain (loss) | | | (1.97 | ) | | | 1.93 | | | | 0.23 | | | | (1.37 | ) | | | (0.18 | ) |
Total from investment operations | | | (2.05 | ) | | | 1.87 | | | | 0.15 | | | | (1.44 | ) | | | (0.22 | ) |
Distributions: | | | | | | | | | | | | | | | | | | | | |
Dividends from net investment income | | | — | | | | — | | | | — | | | | — | | | | — | |
Dividends from net realized gains | | | — | | | | — | | | | — | | | | — | | | | — | |
Total distributions | | | — | | | | — | | | | — | | | | — | | | | — | |
Net asset value, end of year | | | $8.31 | | | | $10.36 | | | | $8.49 | | | | $8.34 | | | | $9.78 | |
Ratios and supplemental data: | | | | | | | | | | | | | | | | | | | | |
Total return(b) | | | (19.79% | ) | | | 22.03% | | | | 1.80% | | | | (14.72% | ) | | | (2.20% | ) |
Net assets, end of year (000) | | | $284 | | | | $386 | | | | $280 | | | | $241 | | | | $288 | |
Ratio of net expenses to average net assets | | | 2.50% | | | | 2.50% | | | | 2.43% | | | | 2.50% | | | | 2.50% | (c) |
Ratio of gross expenses to average net assets prior to expense reductions | | | 3.03% | | | | 3.42% | | | | 3.24% | | | | 3.22% | | | | 4.08% | (c) |
Ratio of net investment income (loss) to average net assets | | | (0.77% | ) | | | (0.69% | ) | | | (0.98% | ) | | | (0.80% | ) | | | (0.45% | )(c) |
| • | Commencement of operations. |
| * | Amounts are less than $0.005. |
| (a) | Net investment income (loss) allocated based on average shares method. |
| (b) | Total return measures net investment income (loss) and capital gain or loss from portfolio investments assuming reinvestment of dividends and capital gains distributions. Total return is not annualized for periods that are less than a full year, does not reflect the effect of sales charge for Class A shares nor the contingent deferred sales charge for Class C shares and does not reflect the deduction of taxes that a shareholder would pay on fund distributions or the redemption of fund shares. |
Calamos Emerging Market Equity Fund Financial Highlights
| | | | | | | | | | | | | | | | | | | | |
| | | CLASS I | |
| | | Year Ended October 31, | | | December 31, 2013•
through
October 31, | |
| | | 2018 | | | 2017 | | | 2016 | | | 2015 | | | 2014 | |
Net asset value, beginning of year | | | $10.63 | | | | $8.62 | | | | $8.43 | | | | $9.86 | | | | $10.00 | |
Income from investment operations: | | | | | | | | | | | | | | | | | | | | |
Net investment income (loss)(a) | | | 0.03 | | | | 0.03 | | | | 0.00 | * | | | 0.02 | | | | 0.04 | |
Net realized and unrealized gain (loss) | | | (2.04 | ) | | | 1.98 | | | | 0.23 | | | | (1.39 | ) | | | (0.18 | ) |
Total from investment operations | | | (2.01 | ) | | | 2.01 | | | | 0.23 | | | | (1.37 | ) | | | (0.14 | ) |
Distributions: | | | | | | | | | | | | | | | | | | | | |
Dividends from net investment income | | | (0.04 | ) | | | — | | | | (0.04 | ) | | | (0.06 | ) | | | — | |
Dividends from net realized gains | | | — | | | | — | | | | — | | | | — | | | | — | |
Return of capital | | | (0.00 | )* | | | — | | | | 0.00 | * | | | — | | | | — | |
Total distributions | | | (0.04 | ) | | | — | | | | (0.04 | ) | | | (0.06 | ) | | | — | |
Net asset value, end of year | | | $8.58 | | | | $10.63 | | | | $8.62 | | | | $8.43 | | | | $9.86 | |
Ratios and supplemental data: | | | | | | | | | | | | | | | | | | | | |
Total return(b) | | | (18.96% | ) | | | 23.32% | | | | 2.75% | | | | (13.92% | ) | | | (1.40% | ) |
Net assets, end of year (000) | | | $9,236 | | | | $11,207 | | | | $9,039 | | | | $8,763 | | | | $9,701 | |
Ratio of net expenses to average net assets | | | 1.50% | | | | 1.50% | | | | 1.42% | | | | 1.50% | | | | 1.50% | (c) |
Ratio of gross expenses to average net assets prior to expense reductions | | | 2.03% | | | | 2.42% | | | | 2.24% | | | | 2.23% | | | | 3.04% | (c) |
Ratio of net investment income (loss) to average net assets | | | 0.26% | | | | 0.30% | | | | 0.02% | | | | 0.21% | | | | 0.50% | (c) |
| • | Commencement of operations. |
| * | Amounts are less than $0.005. |
| (a) | Net investment income (loss) allocated based on average shares method. |
| (b) | Total return measures net investment income (loss) and capital gain or loss from portfolio investments assuming reinvestment of dividends and capital gains distributions. Total return is not annualized for periods that are less than a full year, does not reflect the effect of sales charge for Class A shares nor the contingent deferred sales charge for Class C shares and does not reflect the deduction of taxes that a shareholder would pay on fund distributions or the redemption of fund shares. |
| | | | |
| 216 | | CALAMOS OPEN-END FAMILY OF FUNDS ANNUAL REPORT | | |
Calamos Global Equity Fund Financial Highlights
Selected data for a share outstanding throughout each year were as follows:
| | | | | | | | | | | | | | | | | | | | |
| | | CLASS A | |
| | | Year Ended October 31, | |
| | | 2018 | | | 2017 | | | 2016 | | | 2015 | | | 2014 | |
Net asset value, beginning of year | | | $15.63 | | | | $12.74 | | | | $13.19 | | | | $15.67 | | | | $14.97 | |
Income from investment operations: | | | | | | | | | | | | | | | | | | | | |
Net investment income (loss)(a) | | | 0.00 | * | | | 0.00 | * | | | 0.01 | | | | 0.00 | * | | | (0.01 | ) |
Net realized and unrealized gain (loss) | | | (0.63 | ) | | | 3.45 | | | | (0.21 | ) | | | 0.62 | | | | 1.08 | |
Total from investment operations | | | (0.63 | ) | | | 3.45 | | | | (0.20 | ) | | | 0.62 | | | | 1.07 | |
Distributions: | | | | | | | | | | | | | | | | | | | | |
Dividends from net investment income | | | — | | | | — | | | | — | | | | — | | | | (0.10 | ) |
Dividends from net realized gains | | | (1.39 | ) | | | (0.56 | ) | | | (0.25 | ) | | | (3.10 | ) | | | (0.27 | ) |
Total distributions | | | (1.39 | ) | | | (0.56 | ) | | | (0.25 | ) | | | (3.10 | ) | | | (0.37 | ) |
Net asset value, end of year | | | $13.61 | | | | $15.63 | | | | $12.74 | | | | $13.19 | | | | $15.67 | |
Ratios and supplemental data: | | | | | | | | | | | | | | | | | | | | |
Total return(b) | | | (4.59% | ) | | | 28.42% | | | | (1.47% | ) | | | 5.33% | | | | 7.25% | |
Net assets, end of year (000) | | | $27,489 | | | | $26,957 | | | | $29,314 | | | | $67,141 | | | | $87,989 | |
Ratio of net expenses to average net assets | | | 1.40% | | | | 1.40% | | | | 1.38% | | | | 1.34% | | | | 1.40% | |
Ratio of gross expenses to average net assets prior to expense reductions | | | 1.56% | | | | 1.53% | | | | 1.50% | | | | 1.34% | | | | 1.40% | |
Ratio of net investment income (loss) to average net assets | | | 0.03% | | | | (0.02% | ) | | | 0.06% | | | | 0.00% | ** | | | (0.10% | ) |
| |
| | | Year Ended October 31, | |
| | | 2018 | | | 2017 | | | 2016 | | | 2015 | | | 2014 | |
Portfolio turnover rate | | | 81.3% | | | | 102.0% | | | | 64.6% | | | | 43.0% | | | | 53.3% | |
| |
| | | CLASS C | |
| | | Year Ended October 31, | |
| | | 2018 | | | 2017 | | | 2016 | | | 2015 | | | 2014 | |
Net asset value, beginning of year | | | $14.40 | | | | $11.86 | | | | $12.39 | | | | $15.00 | | | | $14.36 | |
Income from investment operations: | | | | | | | | | | | | | | | | | | | | |
Net investment income (loss)(a) | | | (0.10 | ) | | | (0.09 | ) | | | (0.08 | ) | | | (0.09 | ) | | | (0.12 | ) |
Net realized and unrealized gain (loss) | | | (0.57 | ) | | | 3.19 | | | | (0.20 | ) | | | 0.58 | | | | 1.03 | |
Total from investment operations | | | (0.67 | ) | | | 3.10 | | | | (0.28 | ) | | | 0.49 | | | | 0.91 | |
Distributions: | | | | | | | | | | | | | | | | | | | | |
Dividends from net investment income | | | — | | | | — | | | | — | | | | — | | | | — | |
Dividends from net realized gains | | | (1.39 | ) | | | (0.56 | ) | | | (0.25 | ) | | | (3.10 | ) | | | (0.27 | ) |
Total distributions | | | (1.39 | ) | | | (0.56 | ) | | | (0.25 | ) | | | (3.10 | ) | | | (0.27 | ) |
Net asset value, end of year | | | $12.34 | | | | $14.40 | | | | $11.86 | | | | $12.39 | | | | $15.00 | |
Ratios and supplemental data: | | | | | | | | | | | | | | | | | | | | |
Total return(b) | | | (5.31% | ) | | | 27.53% | | | | (2.23% | ) | | | 4.55% | | | | 6.43% | |
Net assets, end of year (000) | | | $10,887 | | | | $13,769 | | | | $16,375 | | | | $21,227 | | | | $28,811 | |
Ratio of net expenses to average net assets | | | 2.15% | | | | 2.15% | | | | 2.13% | | | | 2.09% | | | | 2.14% | |
Ratio of gross expenses to average net assets prior to expense reductions | | | 2.32% | | | | 2.27% | | | | 2.25% | | | | 2.09% | | | | 2.14% | |
Ratio of net investment income (loss) to average net assets | | | (0.76% | ) | | | (0.76% | ) | | | (0.68% | ) | | | (0.76% | ) | | | (0.82% | ) |
| * | Amounts are less than $0.005. |
| ** | Amounts are less than 0.005%. |
| (a) | Net investment income (loss) allocated based on average shares method. |
| (b) | Total return measures net investment income (loss) and capital gain or loss from portfolio investments assuming reinvestment of dividends and capital gains distributions. Total return is not annualized for periods that are less than a full year, does not reflect the effect of sales charge for Class A shares nor the contingent deferred sales charge for Class C shares and does not reflect the deduction of taxes that a shareholder would pay on fund distributions or the redemption of fund shares. |
Calamos Global Equity Fund Financial Highlights
| | | | | | | | | | | | | | | | | | | | |
| | | CLASS I | |
| | | Year Ended October 31, | |
| | | 2018 | | | 2017 | | | 2016 | | | 2015 | | | 2014 | |
Net asset value, beginning of year | | | $15.95 | | | | $12.95 | | | | $13.38 | | | | $15.81 | | | | $15.11 | |
Income from investment operations: | | | | | | | | | | | | | | | | | | | | |
Net investment income (loss)(a) | | | 0.03 | | | | 0.03 | | | | 0.04 | | | | 0.04 | | | | 0.02 | |
Net realized and unrealized gain (loss) | | | (0.64 | ) | | | 3.53 | | | | (0.22 | ) | | | 0.63 | | | | 1.09 | |
Total from investment operations | | | (0.61 | ) | | | 3.56 | | | | (0.18 | ) | | | 0.67 | | | | 1.11 | |
Distributions: | | | | | | | | | | | | | | | | | | | | |
Dividends from net investment income | | | (0.02 | ) | | | — | | | | — | | | | — | | | | (0.14 | ) |
Dividends from net realized gains | | | (1.39 | ) | | | (0.56 | ) | | | (0.25 | ) | | | (3.10 | ) | | | (0.27 | ) |
Total distributions | | | (1.41 | ) | | | (0.56 | ) | | | (0.25 | ) | | | (3.10 | ) | | | (0.41 | ) |
Net asset value, end of year | | | $13.93 | | | | $15.95 | | | | $12.95 | | | | $13.38 | | | | $15.81 | |
Ratios and supplemental data: | | | | | | | | | | | | | | | | | | | | |
Total return(b) | | | (4.38% | ) | | | 28.82% | | | | (1.30% | ) | | | 5.64% | | | | 7.48% | |
Net assets, end of year (000) | | | $58,078 | | | | $86,429 | | | | $87,605 | | | | $96,390 | | | | $101,511 | |
Ratio of net expenses to average net assets | | | 1.15% | | | | 1.15% | | | | 1.13% | | | | 1.09% | | | | 1.15% | |
Ratio of gross expenses to average net assets prior to expense reductions | | | 1.31% | | | | 1.28% | | | | 1.25% | | | | 1.09% | | | | 1.15% | |
Ratio of net investment income (loss) to average net assets | | | 0.18% | | | | 0.23% | | | | 0.33% | | | | 0.26% | | | | 0.15% | |
| (a) | Net investment income (loss) allocated based on average shares method. |
| (b) | Total return measures net investment income (loss) and capital gain or loss from portfolio investments assuming reinvestment of dividends and capital gains distributions. Total return is not annualized for periods that are less than a full year, does not reflect the effect of sales charge for Class A shares nor the contingent deferred sales charge for Class C shares and does not reflect the deduction of taxes that a shareholder would pay on fund distributions or the redemption of fund shares. |
| | | | |
| 218 | | CALAMOS OPEN-END FAMILY OF FUNDS ANNUAL REPORT | | |
Calamos Global Growth and Income Fund Financial Highlights
Selected data for a share outstanding throughout each year were as follows:
| | | | | | | | | | | | | | | | | | | | |
| | | CLASS A | |
| | | Year Ended October 31, | |
| | | 2018 | | | 2017 | | | 2016 | | | 2015 | | | 2014 | |
Net asset value, beginning of year | | | $9.85 | | | | $8.47 | | | | $8.63 | | | | $10.22 | | | | $11.78 | |
Income from investment operations: | | | | | | | | | | | | | | | | | | | | |
Net investment income (loss)(a) | | | 0.09 | | | | 0.10 | | | | 0.09 | | | | 0.10 | | | | 0.11 | |
Net realized and unrealized gain (loss) | | | (0.35 | ) | | | 1.35 | | | | (0.14 | ) | | | 0.06 | | | | 0.36 | |
Total from investment operations | | | (0.26 | ) | | | 1.45 | | | | (0.05 | ) | | | 0.16 | | | | 0.47 | |
Distributions: | | | | | | | | | | | | | | | | | | | | |
Dividends from net investment income | | | (0.03 | ) | | | (0.01 | ) | | | — | | | | (0.04 | ) | | | (0.29 | ) |
Dividends from net realized gains | | | (0.57 | ) | | | (0.06 | ) | | | (0.11 | ) | | | (1.71 | ) | | | (1.74 | ) |
Total distributions | | | (0.60 | ) | | | (0.07 | ) | | | (0.11 | ) | | | (1.75 | ) | | | (2.03 | ) |
Net asset value, end of year | | | $8.99 | | | | $9.85 | | | | $8.47 | | | | $8.63 | | | | $10.22 | |
Ratios and supplemental data: | | | | | | | | | | | | | | | | | | | | |
Total return(b) | | | (2.91% | ) | | | 17.16% | | | | (0.59% | ) | | | 2.02% | | | | 4.77% | |
Net assets, end of year (000) | | | $63,069 | | | | $78,196 | | | | $84,648 | | | | $111,615 | | | | $146,431 | |
Ratio of net expenses to average net assets | | | 1.50% | | | | 1.54% | | | | 1.46% | | | | 1.49% | | | | 1.44% | |
Ratio of gross expenses to average net assets prior to expense reductions | | | 1.50% | | | | 1.54% | | | | 1.46% | | | | 1.49% | | | | 1.44% | |
Ratio of net investment income (loss) to average net assets | | | 0.93% | | | | 1.16% | | | | 1.09% | | | | 1.18% | | | | 1.01% | |
| | |
| | | Year Ended October 31, | | | | |
| | | 2018 | | | 2017 | | | 2016 | | | 2015 | | | 2014 | |
Portfolio turnover rate | | | 75.0% | | | | 100.2% | | | | 58.0% | | | | 54.7% | | | | 72.6% | |
| |
| | | CLASS C | |
| | | Year Ended October 31, | |
| | | 2018 | | | 2017 | | | 2016 | | | 2015 | | | 2014 | |
Net asset value, beginning of year | | | $8.84 | | | | $7.65 | | | | $7.87 | | | | $9.50 | | | | $11.06 | |
Income from investment operations: | | | | | | | | | | | | | | | | | | | | |
Net investment income (loss)(a) | | | 0.02 | | | | 0.04 | | | | 0.03 | | | | 0.03 | | | | 0.03 | |
Net realized and unrealized gain (loss) | | | (0.31 | ) | | | 1.21 | | | | (0.14 | ) | | | 0.05 | | | | 0.33 | |
Total from investment operations | | | (0.29 | ) | | | 1.25 | | | | (0.11 | ) | | | 0.08 | | | | 0.36 | |
Distributions: | | | | | | | | | | | | | | | | | | | | |
Dividends from net investment income | | | — | | | | — | | | | — | | | | — | | | | (0.18 | ) |
Dividends from net realized gains | | | (0.57 | ) | | | (0.06 | ) | | | (0.11 | ) | | | (1.71 | ) | | | (1.74 | ) |
Total distributions | | | (0.57 | ) | | | (0.06 | ) | | | (0.11 | ) | | | (1.71 | ) | | | (1.92 | ) |
Net asset value, end of year | | | $7.98 | | | | $8.84 | | | | $7.65 | | | | $7.87 | | | | $9.50 | |
Ratios and supplemental data: | | | | | | | | | | | | | | | | | | | | |
Total return(b) | | | (3.61% | ) | | | 16.41% | | | | (1.42% | ) | | | 1.19% | | | | 3.98% | |
Net assets, end of year (000) | | | $54,425 | | | | $70,210 | | | | $90,640 | | | | $119,620 | | | | $151,091 | |
Ratio of net expenses to average net assets | | | 2.25% | | | | 2.29% | | | | 2.21% | | | | 2.24% | | | | 2.19% | |
Ratio of gross expenses to average net assets prior to expense reductions | | | 2.25% | | | | 2.29% | | | | 2.21% | | | | 2.24% | | | | 2.19% | |
Ratio of net investment income (loss) to average net assets | | | 0.18% | | | | 0.44% | | | | 0.34% | | | | 0.43% | | | | 0.27% | |
| (a) | Net investment income (loss) allocated based on average shares method. |
| (b) | Total return measures net investment income (loss) and capital gain or loss from portfolio investments assuming reinvestment of dividends and capital gains distributions. Total return is not annualized for periods that are less than a full year, does not reflect the effect of sales charge for Class A shares nor the contingent deferred sales charge for Class C shares and does not reflect the deduction of taxes that a shareholder would pay on fund distributions or the redemption of fund shares. |
Calamos Global Growth and Income Fund Financial Highlights
| | | | | | | | | | | | | | | | | | | | |
| | | CLASS I | |
| | | Year Ended October 31, | |
| | | 2018 | | | 2017 | | | 2016 | | | 2015 | | | 2014 | |
Net asset value, beginning of year | | | $10.11 | | | | $8.70 | | | | $8.84 | | | | $10.43 | | | | $11.99 | |
Income from investment operations: | | | | | | | | | | | | | | | | | | | | |
Net investment income (loss)(a) | | | 0.12 | | | | 0.13 | | | | 0.11 | | | | 0.13 | | | | 0.14 | |
Net realized and unrealized gain (loss) | | | (0.36 | ) | | | 1.38 | | | | (0.14 | ) | | | 0.05 | | | | 0.36 | |
Total from investment operations | | | (0.24 | ) | | | 1.51 | | | | (0.03 | ) | | | 0.18 | | | | 0.50 | |
Distributions: | | | | | | | | | | | | | | | | | | | | |
Dividends from net investment income | | | (0.05 | ) | | | (0.04 | ) | | | — | | | | (0.06 | ) | | | (0.32 | ) |
Dividends from net realized gains | | | (0.57 | ) | | | (0.06 | ) | | | (0.11 | ) | | | (1.71 | ) | | | (1.74 | ) |
Total distributions | | | (0.62 | ) | | | (0.10 | ) | | | (0.11 | ) | | | (1.77 | ) | | | (2.06 | ) |
Net asset value, end of year | | | $9.25 | | | | $10.11 | | | | $8.70 | | | | $8.84 | | | | $10.43 | |
Ratios and supplemental data: | | | | | | | | | | | | | | | | | | | | |
Total return(b) | | | (2.65% | ) | | | 17.51% | | | | (0.35% | ) | | | 2.23% | | | | 4.99% | |
Net assets, end of year (000) | | | $72,843 | | | | $73,361 | | | | $124,175 | | | | $146,241 | | | | $182,064 | |
Ratio of net expenses to average net assets | | | 1.25% | | | | 1.29% | | | | 1.21% | | | | 1.24% | | | | 1.19% | |
Ratio of gross expenses to average net assets prior to expense reductions | | | 1.25% | | | | 1.29% | | | | 1.21% | | | | 1.24% | | | | 1.19% | |
Ratio of net investment income (loss) to average net assets | | | 1.18% | | | | 1.43% | | | | 1.34% | | | | 1.43% | | | | 1.29% | |
| (a) | Net investment income (loss) allocated based on average shares method. |
| (b) | Total return measures net investment income (loss) and capital gain or loss from portfolio investments assuming reinvestment of dividends and capital gains distributions. Total return is not annualized for periods that are less than a full year, does not reflect the effect of sales charge for Class A shares nor the contingent deferred sales charge for Class C shares and does not reflect the deduction of taxes that a shareholder would pay on fund distributions or the redemption of fund shares. |
| | | | |
| 220 | | CALAMOS OPEN-END FAMILY OF FUNDS ANNUAL REPORT | | |
Calamos Total Return Bond Fund Financial Highlights
Selected data for a share outstanding throughout each year were as follows:
| | | | | | | | | | | | | | | | | | | | |
| | | CLASS A | |
| | | Year Ended October 31, | |
| | | 2018 | | | 2017 | | | 2016 | | | 2015 | | | 2014 | |
Net asset value, beginning of year | | | $10.39 | | | | $10.54 | | | | $10.51 | | | | $10.70 | | | | $10.89 | |
Income from investment operations: | | | | | | | | | | | | | | | | | | | | |
Net investment income (loss)(a) | | | 0.25 | | | | 0.22 | | | | 0.24 | | | | 0.26 | | | | 0.26 | |
Net realized and unrealized gain (loss) | | | (0.49 | ) | | | (0.13 | ) | | | 0.20 | | | | (0.05 | ) | | | 0.12 | |
Total from investment operations | | | (0.24 | ) | | | 0.09 | | | | 0.44 | | | | 0.21 | | | | 0.38 | |
Distributions: | | | | | | | | | | | | | | | | | | | | |
Dividends from net investment income | | | (0.26 | ) | | | (0.23 | ) | | | (0.28 | ) | | | (0.28 | ) | | | (0.53 | ) |
Dividends from net realized gains | | | (0.05 | ) | | | (0.01 | ) | | | (0.13 | ) | | | (0.12 | ) | | | (0.04 | ) |
Return of capital | | | (0.03 | ) | | | — | | | | — | | | | — | | | | — | |
Total distributions | | | (0.34 | ) | | | (0.24 | ) | | | (0.41 | ) | | | (0.40 | ) | | | (0.57 | ) |
Net asset value, end of year | | | $9.81 | | | | $10.39 | | | | $10.54 | | | | $10.51 | | | | $10.70 | |
Ratios and supplemental data: | | | | | | | | | | | | | | | | | | | | |
Total return(b) | | | (2.30% | ) | | | 0.92% | | | | 4.35% | | | | 2.04% | | | | 3.71% | |
Net assets, end of year (000) | | | $17,109 | | | | $21,707 | | | | $57,339 | | | | $51,462 | | | | $67,287 | |
Ratio of net expenses to average net assets | | | 0.90% | | | | 0.90% | | | | 0.88% | | | | 0.90% | | | | 0.90% | |
Ratio of gross expenses to average net assets prior to expense reductions | | | 1.05% | | | | 1.14% | | | | 1.07% | | | | 1.13% | | | | 1.05% | |
Ratio of net investment income (loss) to average net assets | | | 2.44% | | | | 2.14% | | | | 2.25% | | | | 2.49% | | | | 2.47% | |
| | |
| | | Year Ended October 31, | | | | |
| | | 2018 | | | 2017 | | | 2016 | | | 2015 | | | 2014 | |
Portfolio turnover rate | | | 64.3% | | | | 79.1% | | | | 54.0% | | | | 80.0% | | | | 35.3% | |
| |
| | | CLASS C | |
| | | Year Ended October 31, | |
| | | 2018 | | | 2017 | | | 2016 | | | 2015 | | | 2014 | |
Net asset value, beginning of year | | | $10.39 | | | | $10.54 | | | | $10.51 | | | | $10.70 | | | | $10.89 | |
Income from investment operations: | | | | | | | | | | | | | | | | | | | | |
Net investment income (loss)(a) | | | 0.17 | | | | 0.14 | | | | 0.16 | | | | 0.18 | | | | 0.18 | |
Net realized and unrealized gain (loss) | | | (0.48 | ) | | | (0.12 | ) | | | 0.20 | | | | (0.05 | ) | | | 0.12 | |
Total from investment operations | | | (0.31 | ) | | | 0.02 | | | | 0.36 | | | | 0.13 | | | | 0.30 | |
Distributions: | | | | | | | | | | | | | | | | | | | | |
Dividends from net investment income | | | (0.20 | ) | | | (0.16 | ) | | | (0.20 | ) | | | (0.20 | ) | | | (0.45 | ) |
Dividends from net realized gains | | | (0.05 | ) | | | (0.01 | ) | | | (0.13 | ) | | | (0.12 | ) | | | (0.04 | ) |
Return of capital | | | (0.02 | ) | | | — | | | | — | | | | — | | | | — | |
Total distributions | | | (0.27 | ) | | | (0.17 | ) | | | (0.33 | ) | | | (0.32 | ) | | | (0.49 | ) |
Net asset value, end of year | | | $9.81 | | | | $10.39 | | | | $10.54 | | | | $10.51 | | | | $10.70 | |
Ratios and supplemental data: | | | | | | | | | | | | | | | | | | | | |
Total return(b) | | | (3.03% | ) | | | 0.17% | | | | 3.57% | | | | 1.28% | | | | 2.94% | |
Net assets, end of year (000) | | | $6,413 | | | | $9,334 | | | | $16,340 | | | | $15,898 | | | | $17,818 | |
Ratio of net expenses to average net assets | | | 1.65% | | | | 1.65% | | | | 1.63% | | | | 1.65% | | | | 1.65% | |
Ratio of gross expenses to average net assets prior to expense reductions | | | 1.80% | | | | 1.89% | | | | 1.82% | | | | 1.88% | | | | 1.80% | |
Ratio of net investment income (loss) to average net assets | | | 1.69% | | | | 1.38% | | | | 1.51% | | | | 1.74% | | | | 1.73% | |
| (a) | Net investment income (loss) allocated based on average shares method. |
| (b) | Total return measures net investment income (loss) and capital gain or loss from portfolio investments assuming reinvestment of dividends and capital gains distributions. Total return is not annualized for periods that are less than a full year, does not reflect the effect of sales charge for Class A shares nor the contingent deferred sales charge for Class C shares and does not reflect the deduction of taxes that a shareholder would pay on fund distributions or the redemption of fund shares. |
Calamos Total Return Bond Fund Financial Highlights
| | | | | | | | | | | | | | | | | | | | |
| | | CLASS I | |
| | | Year Ended October 31, | |
| | | 2018 | | | 2017 | | | 2016 | | | 2015 | | | 2014 | |
Net asset value, beginning of year | | | $10.39 | | | | $10.54 | | | | $10.51 | | | | $10.70 | | | | $10.89 | |
Income from investment operations: | | | | | | | | | | | | | | | | | | | | |
Net investment income (loss)(a) | | | 0.27 | | | | 0.24 | | | | 0.26 | | | | 0.29 | | | | 0.29 | |
Net realized and unrealized gain (loss) | | | (0.48 | ) | | | (0.12 | ) | | | 0.21 | | | | (0.05 | ) | | | 0.12 | |
Total from investment operations | | | (0.21 | ) | | | 0.12 | | | | 0.47 | | | | 0.24 | | | | 0.41 | |
Distributions: | | | | | | | | | | | | | | | | | | | | |
Dividends from net investment income | | | (0.29 | ) | | | (0.26 | ) | | | (0.31 | ) | | | (0.31 | ) | | | (0.56 | ) |
Dividends from net realized gains | | | (0.05 | ) | | | (0.01 | ) | | | (0.13 | ) | | | (0.12 | ) | | | (0.04 | ) |
Return of capital | | | (0.03 | ) | | | — | | | | — | | | | — | | | | — | |
Total distributions | | | (0.37 | ) | | | (0.27 | ) | | | (0.44 | ) | | | (0.43 | ) | | | (0.60 | ) |
Net asset value, end of year | | | $9.81 | | | | $10.39 | | | | $10.54 | | | | $10.51 | | | | $10.70 | |
Ratios and supplemental data: | | | | | | | | | | | | | | | | | | | | |
Total return(b) | | | (2.06% | ) | | | 1.18% | | | | 4.60% | | | | 2.30% | | | | 3.97% | |
Net assets, end of year (000) | | | $32,888 | | | | $40,290 | | | | $22,067 | | | | $16,561 | | | | $13,347 | |
Ratio of net expenses to average net assets | | | 0.65% | | | | 0.65% | | | | 0.63% | | | | 0.65% | | | | 0.65% | |
Ratio of gross expenses to average net assets prior to expense reductions | | | 0.80% | | | | 0.90% | | | | 0.82% | | | | 0.88% | | | | 0.80% | |
Ratio of net investment income (loss) to average net assets | | | 2.69% | | | | 2.32% | | | | 2.49% | | | | 2.73% | | | | 2.70% | |
| (a) | Net investment income (loss) allocated based on average shares method. |
| (b) | Total return measures net investment income (loss) and capital gain or loss from portfolio investments assuming reinvestment of dividends and capital gains distributions. Total return is not annualized for periods that are less than a full year, does not reflect the effect of sales charge for Class A shares nor the contingent deferred sales charge for Class C shares and does not reflect the deduction of taxes that a shareholder would pay on fund distributions or the redemption of fund shares. |
| | | | |
| 222 | | CALAMOS OPEN-END FAMILY OF FUNDS ANNUAL REPORT | | |
Calamos High Income Opportunities Fund Financial Highlights
Selected data for a share outstanding throughout each year were as follows:
| | | | | | | | | | | | | | | | | | | | |
| | | CLASS A | |
| | | Year Ended October 31, | |
| | | 2018 | | | 2017 | | | 2016 | | | 2015 | | | 2014 | |
Net asset value, beginning of year | | | $8.87 | | | | $8.62 | | | | $8.63 | | | | $9.65 | | | | $9.90 | |
Income from investment operations: | | | | | | | | | | | | | | | | | | | | |
Net investment income (loss)(a) | | | 0.47 | | | | 0.40 | | | | 0.40 | | | | 0.43 | | | | 0.48 | |
Net realized and unrealized gain (loss) | | | (0.45 | ) | | | 0.26 | | | | 0.03 | | | | (0.74 | ) | | | 0.01 | |
Total from investment operations | | | 0.02 | | | | 0.66 | | | | 0.43 | | | | (0.31 | ) | | | 0.49 | |
Distributions: | | | | | | | | | | | | | | | | | | | | |
Dividends from net investment income | | | (0.52 | ) | | | (0.41 | ) | | | (0.44 | ) | | | (0.47 | ) | | | (0.55 | ) |
Dividends from net realized gains | | | — | | | | — | | | | — | | | | (0.24 | ) | | | (0.19 | ) |
Return of capital | | | — | | | | — | | | | — | | | | (0.00 | )* | | | — | |
Total distributions | | | (0.52 | ) | | | (0.41 | ) | | | (0.44 | ) | | | (0.71 | ) | | | (0.74 | ) |
Net asset value, end of year | | | $8.37 | | | | $8.87 | | | | $8.62 | | | | $8.63 | | | | $9.65 | |
Ratios and supplemental data: | | | | | | | | | | | | | | | | | | | | |
Total return(b) | | | 0.25% | | | | 7.82% | | | | 5.26% | | | | (3.25% | ) | | | 5.11% | |
Net assets, end of year (000) | | | $32,282 | | | | $36,351 | | | | $41,046 | | | | $71,513 | | | | $132,756 | |
Ratio of net expenses to average net assets | | | 1.00% | | | | 1.29% | | | | 1.33% | | | | 1.28% | | | | 1.18% | |
Ratio of gross expenses to average net assets prior to expense reductions | | | 1.46% | | | | 1.43% | | | | 1.33% | | | | 1.28% | | | | 1.18% | |
Ratio of net investment income (loss) to average net assets | | | 5.41% | | | | 4.57% | | | | 4.81% | | | | 4.73% | | | | 4.84% | |
| |
| | | Year Ended October 31, | |
| | | 2018 | | | 2017 | | | 2016 | | | 2015 | | | 2014 | |
Portfolio turnover rate | | | 55.5% | | | | 93.1% | | | | 44.4% | | | | 65.3% | | | | 51.2% | |
| |
| | | CLASS C | |
| | | Year Ended October 31, | |
| | | 2018 | | | 2017 | | | 2016 | | | 2015 | | | 2014 | |
Net asset value, beginning of year | | | $9.31 | | | | $9.03 | | | | $9.03 | | | | $10.06 | | | | $10.29 | |
Income from investment operations: | | | | | | | | | | | | | | | | | | | | |
Net investment income (loss)(a) | | | 0.42 | | | | 0.35 | | | | 0.36 | | | | 0.38 | | | | 0.42 | |
Net realized and unrealized gain (loss) | | | (0.46 | ) | | | 0.27 | | | | 0.01 | | | | (0.78 | ) | | | 0.01 | |
Total from investment operations | | | (0.04 | ) | | | 0.62 | | | | 0.37 | | | | (0.40 | ) | | | 0.43 | |
Distributions: | | | | | | | | | | | | | | | | | | | | |
Dividends from net investment income | | | (0.45 | ) | | | (0.34 | ) | | | (0.37 | ) | | | (0.39 | ) | | | (0.47 | ) |
Dividends from net realized gains | | | — | | | | — | | | | — | | | | (0.24 | ) | | | (0.19 | ) |
Return of capital | | | — | | | | — | | | | — | | | | (0.00 | )* | | | — | |
Total distributions | | | (0.45 | ) | | | (0.34 | ) | | | (0.37 | ) | | | (0.63 | ) | | | (0.66 | ) |
Net asset value, end of year | | | $8.82 | | | | $9.31 | | | | $9.03 | | | | $9.03 | | | | $10.06 | |
Ratios and supplemental data: | | | | | | | | | | | | | | | | | | | | |
Total return(b) | | | (0.42% | ) | | | 6.97% | | | | 4.35% | | | | (3.94% | ) | | | 4.32% | |
Net assets, end of year (000) | | | $9,772 | | | | $13,286 | | | | $17,479 | | | | $21,149 | | | | $29,333 | |
Ratio of net expenses to average net assets | | | 1.75% | | | | 2.05% | | | | 2.08% | | | | 2.04% | | | | 1.93% | |
Ratio of gross expenses to average net assets prior to expense reductions | | | 2.22% | | | | 2.18% | | | | 2.08% | | | | 2.04% | | | | 1.93% | |
Ratio of net investment income (loss) to average net assets | | | 4.66% | | | | 3.80% | | | | 4.07% | | | | 3.98% | | | | 4.10% | |
| * | Amounts are less than $0.005. |
| (a) | Net investment income (loss) allocated based on average shares method. |
| (b) | Total return measures net investment income (loss) and capital gain or loss from portfolio investments assuming reinvestment of dividends and capital gains distributions. Total return is not annualized for periods that are less than a full year, does not reflect the effect of sales charge for Class A shares nor the contingent deferred sales charge for Class C shares and does not reflect the deduction of taxes that a shareholder would pay on fund distributions or the redemption of fund shares. |
Calamos High Income Opportunities Fund Financial Highlights
| | | | | | | | | | | | | | | | | | | | |
| | | CLASS I | |
| | | Year Ended October 31, | |
| | | 2018 | | | 2017 | | | 2016 | | | 2015 | | | 2014 | |
Net asset value, beginning of year | | | $8.86 | | | | $8.61 | | | | $8.63 | | | | $9.65 | | | | $9.90 | |
Income from investment operations: | | | | | | | | | | | | | | | | | | | | |
Net investment income (loss)(a) | | | 0.49 | | | | 0.43 | | | | 0.42 | | | | 0.45 | | | | 0.50 | |
Net realized and unrealized gain (loss) | | | (0.44 | ) | | | 0.25 | | | | 0.02 | | | | (0.74 | ) | | | 0.02 | |
Total from investment operations | | | 0.05 | | | | 0.68 | | | | 0.44 | | | | (0.29 | ) | | | 0.52 | |
Distributions: | | | | | | | | | | | | | | | | | | | | |
Dividends from net investment income | | | (0.54 | ) | | | (0.43 | ) | | | (0.46 | ) | | | (0.49 | ) | | | (0.58 | ) |
Dividends from net realized gains | | | — | | | | — | | | | — | | | | (0.24 | ) | | | (0.19 | ) |
Return of capital | | | — | | | | — | | | | — | | | | (0.00 | )* | | | — | |
Total distributions | | | (0.54 | ) | | | (0.43 | ) | | | (0.46 | ) | | | (0.73 | ) | | | (0.77 | ) |
Net asset value, end of year | | | $8.37 | | | | $8.86 | | | | $8.61 | | | | $8.63 | | | | $9.65 | |
Ratios and supplemental data: | | | | | | | | | | | | | | | | | | | | |
Total return(b) | | | 0.62% | | | | 8.09% | | | | 5.41% | | | | (3.00% | ) | | | 5.37% | |
Net assets, end of year (000) | | | $7,706 | | | | $10,026 | | | | $15,183 | | | | $17,452 | | | | $24,342 | |
Ratio of net expenses to average net assets | | | 0.75% | | | | 1.02% | | | | 1.08% | | | | 1.04% | | | | 0.93% | |
Ratio of gross expenses to average net assets prior to expense reductions | | | 1.21% | | | | 1.18% | | | | 1.08% | | | | 1.04% | | | | 0.93% | |
Ratio of net investment income (loss) to average net assets | | | 5.65% | | | | 4.84% | | | | 5.07% | | | | 4.98% | | | | 5.10% | |
| * | Amounts are less than $0.005. |
| (a) | Net investment income (loss) allocated based on average shares method. |
| (b) | Total return measures net investment income (loss) and capital gain or loss from portfolio investments assuming reinvestment of dividends and capital gains distributions. Total return is not annualized for periods that are less than a full year, does not reflect the effect of sales charge for Class A shares nor the contingent deferred sales charge for Class C shares and does not reflect the deduction of taxes that a shareholder would pay on fund distributions or the redemption of fund shares. |
| | | | |
| 224 | | CALAMOS OPEN-END FAMILY OF FUNDS ANNUAL REPORT | | |
Calamos Short-Term Bond Fund Financial Highlights
Selected data for a share outstanding throughout each year were as follows:
| | | | |
| | | CLASS A | |
| | | September 19, 2018•
through
October 31, | |
| | | 2018 | |
Net asset value, beginning of period | | | $10.00 | |
Income from investment operations: | |
Net investment income (loss)(a) | | | 0.03 | |
Net realized and unrealized gain (loss) | | | (0.02 | ) |
Total from investment operations | | | 0.01 | |
Distributions: | |
Dividends from net investment income | | | (0.03 | ) |
Dividends from net realized gains | | | — | |
Total distributions | | | (0.03 | ) |
Net asset value, end of period | | | $9.98 | |
Ratios and supplemental data: | | | | |
Total return(b) | | | 0.12% | |
Net assets, end of period (000) | | | $25 | |
Ratio of net expenses to average net assets | | | 0.66% | (c) |
Ratio of gross expenses to average net assets prior to expense reductions | | | 48.01% | (c) |
Ratio of net investment income (loss) to average net assets | | | 2.55% | (c) |
| |
| | | September 19, 2018•
through
October 31, | |
| | | 2018 | |
Portfolio turnover rate | | | 3.3% | |
| • | Commencement of operations. |
| (a) | Net investment income (loss) allocated based on average shares method. |
| (b) | Total return measures net investment income (loss) and capital gain or loss from portfolio investments assuming reinvestment of dividends and capital gains distributions. Total return is not annualized for periods that are less than a full year, does not reflect the effect of sales charge for Class A shares nor the contingent deferred sales charge for Class C shares and does not reflect the deduction of taxes that a shareholder would pay on fund distributions or the redemption of fund shares. |
Calamos Short-Term Bond Fund Financial Highlights
| | | | |
| | | CLASS I | |
| | | September 19, 2018•
through
October 31, | |
| | | 2018 | |
Net asset value, beginning of period | | | $10.00 | |
Income from investment operations: | |
Net investment income (loss)(a) | | | 0.04 | |
Net realized and unrealized gain (loss) | | | (0.02 | ) |
Total from investment operations | | | 0.02 | |
Distributions: | |
Dividends from net investment income | | | (0.04 | ) |
Dividends from net realized gains | | | — | |
Total distributions | | | (0.04 | ) |
Net asset value, end of period | | | $9.98 | |
Ratios and supplemental data: | | | | |
Total return(b) | | | 0.16% | |
Net assets, end of period (000) | | | $15,118 | |
Ratio of net expenses to average net assets | | | 0.42% | (c) |
Ratio of gross expenses to average net assets prior to expense reductions | | | 2.13% | (c) |
Ratio of net investment income (loss) to average net assets | | | 3.22% | (c) |
| • | Commencement of operations. |
| (a) | Net investment income (loss) allocated based on average shares method. |
| (b) | Total return measures net investment income (loss) and capital gain or loss from portfolio investments assuming reinvestment of dividends and capital gains distributions. Total return is not annualized for periods that are less than a full year, does not reflect the effect of sales charge for Class A shares nor the contingent deferred sales charge for Class C shares and does not reflect the deduction of taxes that a shareholder would pay on fund distributions or the redemption of fund shares. |
| | | | |
| 226 | | CALAMOS OPEN-END FAMILY OF FUNDS ANNUAL REPORT | | |
Report of Independent Registered Public Accounting Firm
To the shareholders and the Board of Trustees of Calamos Investment Trust
Opinion on the Financial Statements and Financial Highlights
We have audited the accompanying statements of assets and liabilities of Calamos Investment Trust comprising Calamos Growth Fund, Calamos Opportunistic Value Fund, Calamos Dividend Growth Fund, Calamos International Growth Fund, Calamos Evolving World Growth Fund, Calamos Emerging Market Equity Fund, Calamos Global Equity Fund, Calamos Growth and Income Fund, Calamos Global Growth and Income Fund, Calamos Convertible Fund, Calamos Global Convertible Fund, Calamos Total Return Bond Fund, Calamos High Income Opportunities Fund, Calamos Market Neutral Income Fund, Calamos Hedged Equity Income Fund, Calamos Phineus Long/Short Fund, and Calamos Short-Term Bond Fund (the “Funds”), including the schedules of investments, as of October 31, 2018; the related statements of operations and cash flows for the year then ended, the statements of changes in net assets for each of the two years in the period then ended, and the financial highlights for each of the five years in the period then ended for the Funds, except for Calamos Emerging Market Equity Fund, Calamos Hedged Equity Income Fund, Calamos Global Convertible Fund, Calamos Phineus Long/Short Fund, and Calamos Short-Term Bond Fund; the related statements of operations, cash flows, changes in net assets, and the financial highlights for the periods indicated in the table below for Calamos Emerging Market Equity Fund, Calamos Hedged Equity Income Fund, Calamos Global Convertible Fund, Calamos Phineus Long/Short Fund, and Calamos Short-Term Bond Fund; and the related notes. In our opinion, the financial statements and financial highlights present fairly, in all material respects, the financial position of each of the funds listed above constituting Calamos Investment Trust as of October 31, 2018, and the results of their operations and their cash flows for the year then ended (or for the period listed in the table below), the changes in their net assets for each of the two years in the period then ended (or for the period listed in the table below), and the financial highlights for each of the five years in the period then ended (or for the period listed in the table below), in conformity with accounting principles generally accepted in the United States of America.
| | | | | | |
Individual Fund Comprising the
Calamos Investment Trust | | Statement of
Operations and
Cash Flows | | Statements of
Changes in
Net Assets | | Financial Highlights |
| Calamos Emerging Market Equity Fund | | For the year ended October 31, 2018 | | For the years ended October 31, 2018 and 2017 | | For the years ended October 31, 2018, 2017, 2016, 2015, and the period from December 31, 2013 (commencement of operations) through October 31, 2014
|
Calamos Hedged Equity Income Fund
Calamos Global Convertible Fund | | For the year ended October 31, 2018 | | For the years ended October 31, 2018 and 2017 | | For the years ended October 31, 2018, 2017, 2016, and the period from December 31, 2014 (commencement of operations) through October 31, 2015 |
| Calamos Phineus Long/Short Fund | | For the year ended October 31, 2018 | | For the years ended October 31, 2018 and 2017 | | For the years ended October 31, 2018, 2017, and the period from April 5, 2016 (commencement of operations) through October 31, 2016
|
| Calamos Short-Term Bond Fund | | For the period from September 19, 2018 (commencement of operations) through October 31, 2018
|
Basis for Opinion
These financial statements and financial highlights are the responsibility of the Funds’ management. Our responsibility is to express an opinion on the Funds’ financial statements and financial highlights based on our audits. We are a public accounting firm registered with the Public Company Accounting Oversight Board (United States) (PCAOB) and are required to be independent with respect to the Funds in accordance with the U.S. federal securities laws and the applicable rules and regulations of the Securities and Exchange Commission and the PCAOB.
We conducted our audits in accordance with the standards of the PCAOB. Those standards require that we plan and perform the audit to obtain reasonable assurance about whether the financial statements and financial highlights are free of material misstatement, whether due to error or fraud. The Funds are not required to have, nor were we engaged to perform, an audit of their internal control over financial reporting. As part of our audits we are required to obtain an understanding of internal control over financial reporting but not for the purpose of expressing an opinion on the effectiveness of the Funds’ internal control over financial reporting. Accordingly, we express no such opinion.
Our audits included performing procedures to assess the risks of material misstatement of the financial statements and financial highlights, whether due to error or fraud, and performing procedures that respond to those risks. Such procedures included examining, on a test basis, evidence regarding the amounts and disclosures in the financial statements and financial highlights. Our
Report of Independent Registered Public Accounting Firm
audits also included evaluating the accounting principles used and significant estimates made by management, as well as evaluating the overall presentation of the financial statements and financial highlights. Our procedures included confirmation of securities owned as of October 31, 2018, by correspondence with the custodian and brokers; when replies were not received from brokers, we performed other auditing procedures. We believe that our audits provide a reasonable basis for our opinion.

Chicago, Illinois
December 17, 2018
We have served as the auditor of one or more Calamos Advisors LLC investment companies since 2003.
| | | | |
| 228 | | CALAMOS OPEN-END FAMILY OF FUNDS ANNUAL REPORT | | |
Trustee Approval of Management Agreement (Unaudited)
The Board of Trustees (“Board” or the “Trustees”) of the Trust oversees the management of each of the Funds, and, as required by law, determines annually whether to continue the Trust’s management agreement with Calamos Advisors LLC (“Adviser”) pursuant to which the Adviser serves as the investment manager and administrator for each of the Funds. The “Independent Trustees,” who comprise more than 80% of the Board, have never been affiliated with the Adviser.
In connection with their most recent consideration regarding the continuation of the management agreement, the Trustees received and reviewed a substantial amount of information provided by the Adviser in response to detailed requests of the Independent Trustees and their independent legal counsel. In the course of their consideration of the agreement, the Independent Trustees were advised by their counsel, and in addition to meeting with management of the Adviser, they met separately in executive session with their counsel.
At a meeting held on June 29, 2018, based on their evaluation of the information referred to above and other information provided in this and previous meetings, the Trustees determined that the overall arrangements between the Trust and the Adviser on behalf of the Funds were fair in light of the nature, quality and extent of the services provided by the Adviser and its affiliates, the fees charged for those services and other matters that the Trustees considered relevant in the exercise of their business judgment. At that meeting, the Trustees, including all of the Independent Trustees, approved the continuation of the management agreement with respect to all of the Funds through July 31, 2019, subject to possible earlier termination as provided in the agreement.
In connection with its consideration of the management agreement, the Board considered, among other things: (i) the nature, quality and extent of the Adviser’s services, (ii) the investment performance of each Fund as well as performance information for comparable funds and other, comparable clients of the Adviser, (iii) the fees and other expenses paid by each Fund as well as expense information for comparable funds and for other, comparable clients of the Adviser, (iv) the profitability of the Adviser and its affiliates from their relationship with each Fund, (v) whether economies of scale may be realized as each Fund grows and whether potential economies may be shared, in some measure, with Fund investors and (vi) other benefits to the Adviser from its relationship with the Funds. In the Board’s deliberations, no single factor was responsible for the Board’s decision to approve continuation of the management agreements, and each Trustee may have afforded different weight to the various factors.
Nature, Quality and Extent of Services. The Board’s consideration of the nature, quality and extent of the Adviser’s services to the Funds took into account the knowledge gained from the Board’s meetings with the Adviser throughout the years. In addition, the Board considered: the Adviser’s long-term history of managing the Funds; the consistency of investment approach; the background and experience of the Adviser’s investment personnel responsible for managing the Funds; and the Adviser’s performance as administrator of the Funds, including, among other things, in the areas of brokerage selection, trade execution, compliance and shareholder communications. The Board also reviewed the Adviser’s resources and key personnel involved in providing investment management services to the Funds. The Board noted the personal investments that the Adviser’s key investment personnel have made in the Funds, which further aligns the interests of the Adviser and its personnel with those of the Funds’ shareholders. In addition, the Board considered compliance reports about the Adviser from the Funds’ Chief Compliance Officer.
The Board also considered the information provided by the Adviser regarding the Funds’ performance and the steps the Adviser is taking to improve performance. In particular, the Board noted the additional personnel added to the investment teams, which includes portfolio managers, research analysts, research associates and risk management personnel. The Board also noted the Adviser’s significant investment into its infrastructure and investment processes.
Investment Performance of the Funds. The Board considered each Fund’s investment performance over various time periods, including how the Fund performed compared to the median performance of a group of comparable funds (the Fund’s “Category”) selected by an independent third-party service provider. In certain instances noted below, the Category represents a custom group of comparable funds, also selected by an independent third-party service provider. The performance periods considered by the Board ended on March 31, 2018, except where otherwise noted. Where available, the Board considered one-, three-, five- and ten-year performance. To the extent the Board considered data for periods other than those ending on March 31, 2018 or considered comparative data in addition to that of the Category, the data was still produced by the independent third-party service provider.
Further detail considered by the Board regarding the investment performance of each Fund is set forth below:
Calamos Growth Fund. The Board considered that the Fund outperformed its custom Category median for the one- and five-year periods, though it underperformed for the other periods. The Board noted the Adviser’s recent changes to the Fund’s management
Trustee Approval of Management Agreement (Unaudited)
team and portfolio positioning, including its appointment of a new lead portfolio manager in February 2017. The Board further considered the Fund’s improved performance since then.
Calamos Opportunistic Value Fund. The Board considered that the Fund outperformed its custom Category median for the one- and three-year periods, though it underperformed for the other periods. The Board noted the Adviser’s assertion that the recent changes to the positioning of the Fund have contributed to the Fund’s improved performance. The Board also considered the Adviser’s assertion that a majority of the Fund’s long-term underperformance was not attributable to the Fund’s current portfolio management team, which only assumed responsibility in January 2015.
Calamos Dividend Growth Fund. The Board considered that the Fund outperformed its custom Category median for all periods.
Calamos International Growth Fund. The Board considered that the Fund outperformed its Category median for the one-, three- and ten-year periods, though it underperformed for the five-year period.
Calamos Evolving World Growth Fund. The Board considered that the Fund outperformed its Category median for the one-year period, though it underperformed for the longer periods. The Board noted the Adviser’s assertion that the Fund ranked in the 23rd percentile since its inception and that the Fund ranked in the 49th percentile for the year-to-date period ended May 31, 2018. In light of the Fund’s improved short-term performance and long-term record over multiple market cycles, the Board considered that it would be prudent to allow the Fund’s investment team time to further develop its performance record.
Calamos Emerging Market Equity Fund. The Board considered that the Fund outperformed its Category median for the one-year period, though it underperformed for the three-year period.
Calamos Global Equity Fund. The Board considered that the Fund outperformed its Category median for all periods.
Calamos Growth and Income Fund. The Board considered that the Fund outperformed its custom Category median for all periods.
Calamos Global Growth and Income Fund. The Board considered that the Fund outperformed its custom Category median for the one-, three- and five-year periods, though it underperformed for the ten-year period.
Calamos Convertible Fund. The Board considered that the Fund outperformed its Category median for the one-year period, though it underperformed for the longer periods. The Board noted that the Fund ranked in the 24th percentile for the year-to-date period ended May 31, 2018. In light of the Fund’s improved short-term performance, the Board considered that it would be prudent to allow the Fund’s investment team time to further develop its long-term performance record.
Calamos Global Convertible Fund. The Board considered that the Fund outperformed its Category median for the one-year period, though it underperformed for the three-year period. In light of the Fund’s improving performance, the Board considered that it would be prudent to allow the Fund’s investment team time to further develop its long-term performance record.
Calamos Total Return Bond Fund. The Board considered that the Fund outperformed its Category median for the three- and five-year periods, though it underperformed for the one- and five-year periods. To this end, the Board considered the Adviser’s expectation of improvements in performance as a result of its significant additions to the Fund’s fixed income investment management team that occurred in 2016 and 2017. In light of the foregoing, the Board concluded that it would be prudent to allow the investment team time to develop its performance record and noted that it would continue to closely monitor performance.
Calamos High Income Opportunities Fund. The Board considered that, while the Fund underperformed its Category median for all periods, the Adviser had recently made significant changes to the portfolio management team. To this end, the Board noted that the Adviser hired a new lead portfolio manager in November 2016 and also added four additional investment team members in June 2017. The Board further noted that the Adviser’s new investment team recently repositioned the Fund’s portfolio. The Board also noted that the Fund ranked in the 47th percentile for the year-to-date period ended May 31, 2018 and that it ranked in the 10th percentile for the quarter ended on the same date. The Board determined that, in light of the Fund’s improving short-term performance, its recent portfolio repositioning and recent changes to the Adviser’s management team, it would be prudent to allow the Adviser’s restructured team more time to continue to develop its performance record. The Board noted that it would continue to closely monitor performance.
Calamos Market Neutral Income Fund. The Board considered that the Fund outperformed its Category median for all periods.
| | | | |
| 230 | | CALAMOS OPEN-END FAMILY OF FUNDS ANNUAL REPORT | | |
Trustee Approval of Management Agreement (Unaudited)
Calamos Hedged Equity Income Fund. The Board considered that the Fund outperformed its Category median for all periods.
Calamos Phineus Long/Short Fund. The Board considered that the Fund outperformed its Category median for all periods.
Costs of Services Provided and Profits Realized by the Adviser. Using information provided by an independent third-party service provider, the Board evaluated each Fund’s actual management fee rate compared to the median management fee rate for other mutual funds similar in size, character and investment strategy (the Fund’s “Expense Group”), and the Fund’s total expense ratio compared to the median total expense ratio of the Fund’s Expense Group.
The Board also reviewed the Adviser’s management fee rates for its institutional separate accounts and noted the Adviser’s assertion that the Adviser no longer manages sub-advisory accounts. The Board took into account that although, generally, the rates of fees paid by institutional clients were lower than the rates of fees paid by the Funds, the differences reflected the Adviser’s greater level of responsibilities and significantly broader scope of services regarding the Funds, the more extensive regulatory obligations and risks associated with managing the Funds, and other financial considerations with respect to creation and sponsorship of the Funds. The Board considered factors that lead to more expenses for registered funds including but not limited to: (i) capital expenditures to establish a fund, (ii) length of time to reach critical mass, and the related expenses, (iii) higher servicing costs of intermediaries and shareholders, (iv) higher redemption rates of assets under management, (v) entrepreneurial risk assumed by the Adviser and (vi) greater exposure to “make whole” errors.
The Board also considered the Adviser’s costs in serving as the Funds’ investment adviser and manager, including but not limited to costs associated with technology, infrastructure and compliance necessary to manage the Funds. The Board reviewed the Adviser’s methodology for allocating costs among the Adviser’s lines of business. The Board also considered information regarding the structure of the Adviser’s compensation program for portfolio managers, analysts and certain other employees, and the relationship of such compensation to the attraction and retention of quality personnel. Finally, the Board reviewed information on the profitability of the Adviser in serving as each Fund’s investment manager and of the Adviser and its affiliates in all of their relationships with each Fund, as well as an explanation of the methodology utilized in allocating various expenses among the Funds and the Adviser’s other business units. Data was provided to the Board with respect to profitability, both on a pre- and post-marketing cost basis. The Board reviewed the financial statements of the Adviser’s parent company and discussed its corporate structure.
Further detail considered by the Board regarding the management fee rate and total expense ratio of each Fund is set forth below:
Calamos Growth Fund. The Board considered that, while the Fund’s management fee rate and total expense ratio are higher than the respective medians of the Fund’s Expense Group, the Adviser continues to invest resources in the Fund to address performance.
Calamos Opportunistic Value Fund. The Board considered that the Fund’s management fee rate is lower than the median of the Fund’s Expense Group, though the Fund’s total expense ratio is equal to the Expense Group median.
Calamos Dividend Growth Fund. The Board considered that the Fund’s management fee rate is lower than the median of the Fund’s Expense Group, though the Fund’s total expense ratio is higher than its Expense Group median.
Calamos International Growth Fund. The Board considered that, while the Fund’s management fee rate and total expense ratio are higher than the respective medians of the Fund’s Expense Group, the Fund’s management fee is subject to a performance adjustment, which serves to lower the management fee during periods of underperformance. In addition, the Board took into account the Adviser’s decision to lower the Fund’s expense cap by 30 basis points, effective July 1, 2018. To this end, the Board noted that had the revised expense cap been in effect during the one-year period ended March 31, 2018, the Fund’s total expense ratio would have been the lowest in its Expense Group. The Board also reviewed the Fund’s expenses in light of its performance record.
Calamos Evolving World Growth Fund. The Board considered that, while the Fund’s management fee rate and total expense ratio are higher than the respective medians of the Fund’s Expense Group, the Adviser continues to invest resources in the Fund to address performance. The Board also noted that the Adviser hired a new strategy analyst in May 2017.
Calamos Emerging Market Equity Fund. The Board considered that the Fund’s management fee rate is lower than the median of the Fund’s Expense Group, though the Fund’s total expense ratio is higher than its Expense Group median.
Trustee Approval of Management Agreement (Unaudited)
Calamos Global Equity Fund. The Board considered that, while the Fund’s management fee rate and total expense ratio are higher than the respective medians of the Fund’s Expense Group, the Fund’s management fee is subject to a performance adjustment, which serves to lower the management fee during periods of underperformance. The Board also reviewed the Fund’s expenses in light of its performance record.
Calamos Growth and Income Fund. The Board considered that the Fund’s management fee rate and total expense ratio are higher than the respective medians of the Fund’s Expense Group. The Board reviewed the Fund’s expenses in light of its performance record.
Calamos Global Growth and Income Fund. The Board considered that the Fund’s management fee rate and total expense ratio are higher than the respective medians of the Fund’s Expense Group. The Board reviewed the Fund’s expenses in light of its performance record.
Calamos Convertible Fund. The Board considered that the Fund’s management fee rate and total expense ratio are higher than the respective medians of the Fund’s Expense Group. The Board reviewed the Fund’s expenses in light of its improving performance record and the Adviser’s appointment of a new co-portfolio manager in February 2017.
Calamos Global Convertible Fund. The Board considered that the Fund’s management fee rate and total expense ratio are higher than the respective medians of the Fund’s Expense Group. The Board reviewed the Fund’s expenses in light of its improving performance record.
Calamos Total Return Bond Fund. The Board considered that the Fund’s management fee rate is equal to the median of the Fund’s Expense Group, though the Fund’s total expense ratio is higher than its Expense Group median. The Board noted that the Adviser continues to invest resources in the Fund to address performance.
Calamos High Income Opportunities Fund. The Board considered that the Fund’s management fee rate is lower than the median of the Fund’s Expense Group, though the Fund’s total expense ratio is higher than its Expense Group median. The Board noted that the Adviser continues to invest resources in the Fund to address performance.
Calamos Market Neutral Income Fund. The Board considered that the Fund’s management fee rate and total expense ratio are lower than the respective medians of the Fund’s Expense Group.
Calamos Hedged Equity Income Fund. The Board considered that the Fund’s management fee rate and total expense ratio are lower than the respective medians of the Fund’s Expense Group.
Calamos Phineus Long/Short Fund. The Board considered that the Fund’s total expense ratio is lower than the median of the Fund’s Expense Group and the Fund’s management fee rate is equal to its Expense Group median.
Economies of Scale. The Board considered whether each Fund’s management fee shares with shareholders potential economies of scale that may be achieved by the Adviser. The Board recognized that breakpoints in the fee schedule for each open-end Fund could result in the sharing of economies of scale as Fund assets increase. Based on the Board’s feedback, the Adviser agreed to rationalize breakpoint schedules for certain Funds so that such Funds will achieve scheduled reductions in fees earlier than otherwise would have been the case. The Board also considered the Adviser’s agreement to reimburse each open-end Fund for a portion of its expenses if the Fund’s expense ratio otherwise would exceed a certain level. The Board also considered the benefits accruing to shareholders from the Adviser’s investments into its infrastructure and investment processes. The Board concluded that the breakpoints in the fee schedule for each open-end Fund allow shareholders to benefit from potential economies of scale that may be achieved by the Adviser.
Other Benefits Derived from the Relationship with the Funds. The Board also considered other benefits that accrue to the Adviser and its affiliates from their relationship with the Funds. The Board concluded that while the Adviser may potentially benefit from its relationship with the Funds in ways other than the fees payable by the Funds, the Funds also may benefit from their relationship with the Adviser in ways other than the services to be provided by the Adviser and its affiliates pursuant to their agreement with the Funds and the fees payable by the Funds.
The Board also considered the Adviser’s use of a portion of the commissions paid by the Funds on their portfolio brokerage transactions to obtain research products and services benefiting the Funds and/or other clients of the Adviser and concluded, based on
| | | | |
| 232 | | CALAMOS OPEN-END FAMILY OF FUNDS ANNUAL REPORT | | |
Trustee Approval of Management Agreement (Unaudited)
reports from the Funds’ Chief Compliance Officer, that the Adviser’s use of “soft” commission dollars to obtain research products and services was consistent with regulatory requirements.
After full consideration of the above factors as well as other factors that were instructive in their consideration, the Trustees, including all of the Independent Trustees, concluded that the continuation of the management agreement for each Fund with the Adviser was in the best interest of each respective Fund and its shareholders.
Calamos Short-Term Bond Fund. The Board of Trustees (“Board” or the “Trustees”) of Calamos Investment Trust (“Trust”), on behalf of its new series, Calamos Short-Term Bond Fund (the “New Fund”), oversees the management of the New Fund, and, as required by law, determines whether to approve or (annually thereafter) continue the New Fund’s management agreement with Calamos Advisors LLC (“Adviser”) pursuant to which the Adviser serves as the investment manager and administrator for the New Fund. The “Independent Trustees,” who comprise more than 80% of the Board, have never been affiliated with the Adviser.
In connection with their consideration regarding the initial approval of the management agreement for the New Fund, the Trustees received and reviewed a substantial amount of information provided by the Adviser in response to detailed requests of the Independent Trustees and their independent legal counsel. In the course of their consideration of the agreement, the Independent Trustees were advised by their counsel and, in addition to meeting with management of the Adviser, they met separately in executive session with their counsel.
At a meeting held on June 29, 2018, the Trustees determined, based on their evaluation of the information referred to above, and other information, that the overall arrangements between the New Fund and the Adviser were fair and reasonable in light of the nature, quality and extent of the services to be provided by the Adviser and its affiliates, the proposed fees charged for those services, and other matters that the Trustees considered relevant in the exercise of their business judgment. At that meeting, the Trustees, including all of the Independent Trustees, approved the management agreement with respect to the New Fund through July 1, 2020, subject to possible earlier termination as provided in the management agreement.
In connection with its consideration of the management agreement with respect to the New Fund, the Board considered, among other things: (i) the nature, quality and extent of the Adviser’s services to be provided, (ii) the fees and other expenses to be paid by the New Fund as well as expense information for comparable funds, (iii) the expected profitability of the Adviser and its affiliates from their relationship with the New Fund, (iv) whether economies of scale may be realized as the New Fund grows and whether potential economies may be shared, in some measure, with the New Fund’s investors; and (v) other benefits to the Adviser from its relationship with the New Fund. In the Board’s deliberations, no single factor was responsible for the Board’s decision to approve the management agreement, and each Trustee may have afforded different weight to the various factors.
Nature, Quality and Extent of Services. The Board’s consideration of the nature, quality and extent of the Adviser’s services to be provided to the New Fund took into account the knowledge that may be gained from the Board’s meetings with the Adviser throughout the year. In addition, the Board considered: the Adviser’s long-term history of managing the other Funds in the Calamos fund complex; the consistency of the Adviser’s investment approach; the background and experience of the Adviser’s investment personnel that will be responsible for managing the New Fund; and the Adviser’s performance as administrator of the other Funds in the Calamos fund complex, including, among other things, in the areas of brokerage selection, trade execution, compliance and shareholder communications. The Board also reviewed the Adviser’s resources and key personnel expected to be involved in providing investment management services to the New Fund, including the expertise of the New Fund’s portfolio managers. The Board also considered compliance reports about the Adviser from the Trust’s Chief Compliance Officer. The Board concluded that the nature, quality and extent of the services to be provided by the Adviser to the New Fund were appropriate and consistent with the management agreement and that the New Fund was likely to benefit from services provided under the management agreement with the Adviser.
Investment Performance of the New Fund. Because the New Fund has not yet commenced operations, the Board did not consider the investment performance of the New Fund.
Costs of Services Provided and Profits Realized by the Adviser. Using information provided by an independent third-party service provider, the Board evaluated the New Fund’s proposed management fee rate compared to the median management fee rate for other mutual funds similar in size, character and investment strategy (the New Fund’s “Expense Group”) and estimated total expense
Trustee Approval of Management Agreement (Unaudited)
ratio compared to the median total expense ratio of the Fund’s Expense Group. The Board considered that the New Fund’s estimated total net expense ratio and proposed contractual management fee rate are both lower than the respective medians of the New Fund’s Expense Group and that the New Fund’s proposed net management fee rate is within two basis points of its Expense Group median. In light of all the information presented, the Board concluded that it would be in the best interest of the New Fund and its shareholders to approve the management agreement.
Economies of Scale. The Board considered whether the New Fund’s proposed management fee shares with shareholders potential economies of scale that may be achieved by the Adviser. The Board recognized that breakpoints in the proposed fee schedule for the New Fund could result in the sharing of economies of scale as the New Fund’s assets increase. The Board also considered the Adviser’s agreement to reimburse the New Fund for a portion of its expenses if the New Fund’s expense ratio otherwise would exceed a certain level. The Board concluded that the breakpoints in the proposed fee schedule for the New Fund allow shareholders to benefit from potential economies of scale that may be achieved by the Adviser.
Profitability. The Board did not consider information concerning the costs incurred and profits realized by the Adviser as the New Fund had not yet commenced operations.
Other Benefits Derived from the Relationship with the New Fund. The Board considered other benefits that could accrue to the Adviser and its affiliates from their relationship with the New Fund. The Board concluded that while the Adviser may potentially benefit from its relationship with the New Fund in ways other than the proposed fees payable by the New Fund, the New Fund also may benefit from its relationship with the Adviser in ways other than the services to be provided by the Adviser and its affiliates pursuant to its agreement with the New Fund and the proposed fees payable by the New Fund.
The Board also considered the Adviser’s proposed use of a portion of the commissions to be paid by the New Fund on its portfolio brokerage transactions to obtain research products and services benefiting the New Fund and/or other clients of the Adviser and concluded, based on reports from the New Fund’s Chief Compliance Officer, that the Adviser’s use of “soft” commission dollars to obtain research products and services is consistent with regulatory requirements.
After full consideration of the above factors as well as other factors that were instructive in their consideration, the Trustees, including all of the Independent Trustees, concluded that the proposed amendment to the Trust’s management agreement with the Adviser to add the New Fund was in the best interest of the New Fund and its shareholders.
| | | | |
| 234 | | CALAMOS OPEN-END FAMILY OF FUNDS ANNUAL REPORT | | |
Trustees and Officers (Unaudited)
The management of the Trust, including general supervision of the duties performed for the Trust under the investment management agreement between the Trust and Calamos Advisors, is the responsibility of its board of trustees. Each trustee elected will hold office for the lifetime of the Trust or until such trustee’s earlier resignation, death or removal; however, each trustee who is not an interested person of the Trust shall retire as a trustee at the end of the calendar year in which the trustee attains the age of 75 years.
The following table sets forth each trustee’s name, year of birth, position(s) with the Trust, number of portfolios in the Calamos Fund Complex overseen, principal occupation(s) during the past five years and other directorships held, and date first elected or appointed. Each Trustee oversees each Fund of the Trust.
| | | | | | |
| NAME AND YEAR OF BIRTH | | POSITION(S) AND
LENGTH OF TIME
WITH THE TRUST | | PORTFOLIOS IN
FUND COMPLEX^
OVERSEEN | | PRINCIPAL OCCUPATION(S) DURING THE PAST 5 YEARS AND OTHER DIRECTORSHIPS |
| Trustees who are interested persons of the Trust: |
| | | |
John P. Calamos, Sr. (1940)* | | Chairman, Trustee and President (since 1988) | | 24 | | Founder, Chairman and Global Chief Investment Officer, Calamos Asset Management, Inc. (“CAM”), Calamos Investments LLC (“CILLC”), Calamos Advisors LLC and its predecessor (“Calamos Advisors”) and Calamos Wealth Management LLC (“CWM”), Director CAM; and previously Chief Executive Officer, Calamos Financial Services LLC and its predecessor (“CFS”), CAM, CILLC, Calamos Advisors, and CWM |
|
| Trustees who are not interested persons of the Trust: |
| | | |
John E. Neal (1950) | | Trustee (since 2001) | | 24 | | Private investor; Director, Equity Residential Trust (publicly-owned REIT); Director, Creation Investments (private international microfinance company); Director, Centrust Bank (Northbrook Illinois community bank); Director, Neuro-ID (private company providing prescriptive analytics for the risk industry); Partner, Linden LLC (health care private equity) (until October 31, 2018) |
| | | |
William R. Rybak (1951) | | Trustee (since 2002) | | 24 | | Private investor; Chairman (since February 2016) and Director (since February 2010), Christian Brothers Investment Services Inc.; Trustee, JNL Series Trust, JNL Investors Series Trust and JNL Variable Fund LLC (since 2007), JNL Strategic Income Fund LLC (2007-2018) and Jackson Variable Series Trust (open-end mutual funds) (since January 2018)**; Trustee, Lewis University (since 2012); formerly Director, Private Bancorp (2003-2017); Executive Vice President and Chief Financial Officer, Van Kampen Investments, Inc. and subsidiaries (investment manager) |
| | | |
Stephen B. Timbers (1944) | | Trustee (since 2004); Lead Independent Trustee (since 2005) | | 24 | | Private investor |
| | | |
David D. Tripple (1944) | | Trustee (since 2006) | | 24 | | Private investor; Trustee, Century Growth Opportunities Fund (open-end mutual fund) (since 2010), Century Shares Trust and Century Small Cap Select Fund (open-end mutual funds) (since January 2004)*** |
| | | |
Virginia G. Breen (1964) | | Trustee (since 2015) | | 24 | | Private Investor, Trustee, Neuberger Berman Private Equity Registered Funds (registered private equity funds) (since 2015)****; Trustee, Jones Lang LaSalle Income Property Trust, Inc. (REIT) (since 2004); Director, UBS A&Q Fund Complex (closed-end funds) (since 2008)*****; Director, Bank of America/US Trust Company (until 2015); Director of Modus Link Global Solutions, Inc. (until 2013) |
Trustees and Officers (Unaudited)
| | | | | | |
| NAME AND YEAR OF BIRTH | | POSITION(S) AND
LENGTH OF TIME
WITH THE TRUST | | PORTFOLIOS IN
FUND COMPLEX^
OVERSEEN | | PRINCIPAL OCCUPATION(S) DURING THE PAST 5 YEARS AND OTHER DIRECTORSHIPS |
| Lloyd A. Wennlund (1957) | | Trustee (since 2018) | | 24 | | Expert Affiliate, Bates Group, LLC (since 2018); Executive Vice President, The Northern Trust Company (1989-2017); President and Business Unit Head of Northern Funds and Northern Institutional Funds (1994-2017); Director, Northern Trust Investments (1998-2017); Governor (2004-2017) and Executive Committee member (2011-2017), Investment Company Institute Board of Governors; Member, Securities Industry Financial Markets Association (SIFMA) Advisory Council, Private Client Services Committee and Private Client Steering Group (2006-2017); Board Member, Chicago Advisory Board of the Salvation Army (since 2011) |
| * | Mr. Calamos is an “interested person” of the Trust as defined in the 1940 Act because he is an officer of the Trust and an affiliate of Calamos Advisors and CFS. |
| ** | Overseeing 163 portfolios in fund complex. |
| *** | Overseeing two portfolios in fund complex. |
| **** | Overseeing five portfolios in fund complex. |
| ***** | Overseeing five portfolios in fund complex. |
| ^ | The Fund Complex consists of Calamos Investment Trust, Calamos Advisors Trust, Calamos Convertible Opportunities and Income Fund, Calamos Convertible and High Income Fund, Calamos Strategic Total Return Fund, Calamos Global Total Return Fund, Calamos Global Dynamic Income Fund and Calamos Dynamic Convertible and Income Fund. |
The address of each trustee is 2020 Calamos Court, Naperville, Illinois 60563.
| | | | |
| 236 | | CALAMOS OPEN-END FAMILY OF FUNDS ANNUAL REPORT | | |
Trustees and Officers (Unaudited)
Officers. The preceding table gives information about John P. Calamos, Sr., who is Chairman, Trustee and President of the Trust. The following table sets forth each other officer’s name, year of birth, position with the Trust and date first appointed to that position, and principal occupation(s) during the past five years. Each officer serves until his or her successor is chosen and qualified or until his or her resignation or removal by the board of trustees.
| | | | |
| NAME AND YEAR OF BIRTH | | POSITION(S) WITH TRUST | | PRINCIPAL OCCUPATION(S)
DURING THE PAST 5 YEARS |
| John S. Koudounis, (1966) | | Vice President (since 2016) | | Chief Executive Officer, CAM, CILLC, Calamos Advisors, CWM and CFS (since 2016); Director CAM (since 2016); President and Chief Executive Officer (2010-2016), Mizuho Securities USA Inc. |
| | |
| Thomas Herman, (1961) | | Vice President (since 2016); prior thereto Chief Financial Officer (2016-2017) | | Chief Financial Officer, CAM, CILLC, Calamos Advisors, and CWM (since 2016); Chief Financial Officer and Treasurer, Harris Associates (2010-2016) |
| | |
| Curtis Holloway, (1967) | | Chief Financial Officer (since 2017) and Treasurer (since 2010), Prior thereto Assistant Treasurer (2007-2010) | | Senior Vice President, Head of Fund Administration (since 2017), Calamos Advisors; prior thereto Vice President, Fund Administration (2010-2017) |
| | |
| Robert Behan, (1964) | | Vice President (since 2013) | | President (since 2015), Head of Global Distribution (since 2013), CAM, CILLC, Calamos Advisors, and CFS; prior thereto Executive Vice President (2013-2015); Senior Vice President (2009-2013), Head of US Intermediary Distribution (2010-2013) |
| | |
| J. Christopher Jackson, (1951) | | Vice President and Secretary (since 2010) | | Senior Vice President, General Counsel and Secretary, CAM, CILLC, Calamos Advisors, CWM and CFS (since 2010); Director, Calamos Global Funds plc (since 2011) |
| | |
| Mark J. Mickey, (1951) | | Chief Compliance Officer (since 2005) | | Chief Compliance Officer, Calamos Funds (since 2005) |
The address of each officer is 2020 Calamos Court, Naperville, Illinois 60563.
Tax Information (Unaudited)
We are providing this information as required by the Internal Revenue Code (Code). The amounts shown may differ from those elsewhere in this report due to differences between tax and financial reporting requirements. In January 2019, shareholders will receive Form 1099-DIV which will include their share of qualified dividends and capital gains distributed during the calendar year 2018. Shareholders are advised to check with their tax advisors for information on the treatment of these amounts on their individual income tax returns.
Under Section 852(b)(3)(C) of the Code, the Funds hereby designate the following amounts as capital gain dividends for the fiscal period ended October 31, 2018:
| | | | | | |
MARKET NEUTRAL
INCOME FUND | | HEDGED EQUITY
INCOME FUND | | PHINEUS LONG/SHORT
FUND | | CONVERTIBLE
FUND |
| $80,809,364 | | $223 | | $3,469,521 | | $18,076,624 |
| | | |
GLOBAL
CONVERTIBLE FUND | | GROWTH
FUND | | GROWTH AND
INCOME FUND | | DIVIDEND GROWTH
FUND |
| $2,717,363 | | $218,784,460 | | $116,932,931 | | $2,083,020 |
| | | |
OPPORTUNISTIC VALUE
FUND | | INTERNATIONAL
GROWTH FUND | | GLOBAL EQUITY
FUND | | GLOBAL GROWTH
AND INCOME FUND |
| $1,596,824 | | $16,295,738 | | $13,457,533 | | $13,090,122 |
| | | |
TOTAL RETURN
BOND FUND | | | | | | |
| $352,324 | | | | | | |
Under Section 854(b)(2) of the Code, the Funds hereby designate the following amounts, or the maximum amount allowable under the Code, as qualified dividends for the fiscal period ended October 31, 2018:
| | | | | | |
MARKET NEUTRAL
INCOME FUND | | HEDGED EQUITY
INCOME FUND | | PHINEUS LONG/SHORT
FUND | | CONVERTIBLE
FUND |
| $59,611,241 | | $822,860 | | $10,681,835 | | $4,321,040 |
| | | |
GLOBAL
CONVERTIBLE FUND | | GROWTH
FUND | | GROWTH AND
INCOME FUND | | DIVIDEND GROWTH
FUND |
| $560,458 | | $15,771,274 | | $32,133,656 | | $453,553 |
| | | |
OPPORTUNISTIC VALUE
FUND | | INTERNATIONAL
GROWTH FUND | | EVOLVING WORLD
GROWTH FUND | | EMERGING MARKET
EQUITY FUND |
| 848,813 | | $5,085,556 | | $3,017,962 | | $183,554 |
| | | |
GLOBAL EQUITY
FUND | | GLOBAL GROWTH
AND INCOME FUND | | HIGH INCOME
OPPORTUNITIES FUND | | |
| $1,394,240 | | $3,106,186 | | $88,164 | | |
| | | | |
| 238 | | CALAMOS OPEN-END FAMILY OF FUNDS ANNUAL REPORT | | |
Tax Information (Unaudited)
Under Section 854(b)(2) of the Code, the Funds hereby designate the following percentage amounts of the ordinary income dividends as income qualifying for the dividends received deduction for the period ended October 31, 2018:
| | | | | | |
MARKET NEUTRAL
INCOME FUND | | HEDGED EQUITY
INCOME FUND | | PHINEUS LONG/SHORT
FUND | | CONVERTIBLE
FUND |
| 40% | | 100% | | 58% | | 17% |
| | | |
GLOBAL
CONVERTIBLE FUND | | GROWTH
FUND | | GROWTH AND
INCOME FUND | | DIVIDEND GROWTH
FUND |
| 22% | | 17% | | 61% | | 100% |
| | | |
OPPORTUNISTIC VALUE
FUND | | INTERNATIONAL
GROWTH FUND | | EVOLVING WORLD
GROWTH FUND | | EMERGING MARKET
EQUITY FUND |
| 56% | | 0% | | 34% | | 9% |
| | | |
GLOBAL EQUITY
FUND | | GLOBAL GROWTH
AND INCOME FUND | | HIGH INCOME
OPPORTUNITIES FUND | | |
| 17% | | 21% | | 3% | | |
At October 31, 2018, more than 50% of each of International Growth Fund, Evolving World Growth Fund and Emerging Market Equity Fund total assets were invested in securities of foreign issuers. In most instances, foreign taxes were withheld from income paid to each fund on these investments. International Growth Fund, Evolving World Growth Fund and Emerging Market Equity Fund elect to treat foreign taxes paid as allowed under Section 853 of the Code. This election will allow shareholders of record as of the 2018 distribution date to treat the proportionate share of foreign taxes paid by International Growth Fund, Evolving World Growth Fund and Emerging Market Equity Fund as having been paid directly by them. The shareholder shall consider these amounts as foreign taxes paid in the tax year in which they receive the distribution.
MANAGING YOUR CALAMOS FUNDS INVESTMENTS
Calamos Investments offers several convenient means to monitor, manage and feel confident about your Calamos investment choice.
24-HOUR AUTOMATED SHAREHOLDER ASSISTANCE: 800.823.7386
Through a single toll-free number, Calamos 24-Hour Shareholder Assistance is fast and easy. Get fund prices and account balances, review recent transactions, order statements, literature and more.
PERSONAL ASSISTANCE: 800.582.6959
Dial this toll-free number to speak with a knowledgeable Client Services Representative who can help answer questions or address issues concerning your Calamos Fund.
ONLINE ACCOUNT MANAGEMENT: www.calamos.com
Manage your personal account of Calamos Funds online at www.calamos.com. On your account access page, you can view account history and download data.
YOUR FINANCIAL ADVISOR
We encourage you to talk to your financial advisor to determine how the Calamos Funds can benefit your investment portfolio based on your financial goals, risk tolerance, time horizon and income needs.
This report, including the audited financial statements contained herein, is submitted for general information for the shareholders of the Funds. The report is not authorized for distribution to prospective investors in the Funds unless accompanied by a currently effective prospectus of the Funds and, after January 31, 2019, updated performance data for the most recently completed fiscal quarter. The views expressed in this report reflect those of Calamos Advisors LLC only through October 31, 2018. The managers’ views are subject to change at any time based on market and other conditions.
A description of the Calamos Proxy Voting Policies and Procedures and the Funds’ proxy voting record for the 12-month period ended June 30, 2018 are available free of charge upon request by calling 800.582.6959, by visiting the Calamos Web site at www.calamos.com, or by writing Calamos at: Calamos Investments, Attn: Client Services, 2020 Calamos Court, Naperville, IL 60563. The Funds’ proxy voting record is also available free of charge by visiting the SEC Web site at www.sec.gov.
The Funds file a complete list of their portfolio holdings with the SEC for the first and third quarters each fiscal year on Form N-Q. The Forms N-Q are available free of charge, upon request, by calling or writing Calamos Investments at the phone number or address provided above or by visiting the SEC Web site at www.sec.gov. You may also review or, for a fee, copy the forms at the SEC’s Public Reference Room in Washington, D.C. Information on the operation of the Public Reference Room may be obtained by calling 800.732.0330.
FOR 24-HOUR AUTOMATED SHAREHOLDER ASSISTANCE: 800.823.7386
TO OBTAIN INFORMATION ABOUT YOUR INVESTMENTS: 800.582.6959
VISIT OUR WEB SITE: www.calamos.com
INVESTMENT ADVISER:
Calamos Advisors LLC
2020 Calamos Court
Naperville, IL 60563-2787
CUSTODIAN AND FUND ACCOUNTING AGENT:
State Street Bank and Trust Company
Boston, MA
TRANSFER AGENT:
U.S. Bancorp Fund Services, LLC
615 E. Michigan St., 3rd Floor
Milwaukee, WI 53202
INDEPENDENT REGISTERED PUBLIC ACCOUNTING FIRM:
Deloitte & Touche LLP
Chicago, IL
LEGAL COUNSEL:
Ropes & Gray LLP
Chicago, IL
| | |

| | STAY CONNECTED www.calamos.com/connect |
|
Visit our Web site for timely fund performance, detailed fund profiles, fund news and insightful market commentary. |

2020 Calamos Court
Naperville, IL 60563-2787
800.582.6959
www.calamos.com
© 2018 Calamos Investments LLC. All Rights Reserved.
Calamos® and Calamos Investments® are registered
trademarks of Calamos Investments LLC.
MFANR 1631 2018
ITEM 2. CODE OF ETHICS.
(a) As of the end of the period covered by this report, the registrant has adopted a code of ethics (the “Code of Ethics”) that applies to its principal executive officer, principal financial officer, principal accounting officer or controller, or person performing similar functions.
(b) No response required.
(c) The registrant has not amended its Code of Ethics as it relates to any element of the code of ethics definition enumerated in paragraph (b) of this Item 2 during the period covered by this report.
(d) The registrant has not granted a waiver or an implicit waiver from its Code of Ethics during the period covered by this report.
(e) Not applicable.
(f) (1) The registrant’s Code of Ethics is attached as an Exhibit hereto.
ITEM 3. AUDIT COMMITTEE FINANCIAL EXPERT.
The registrant’s Board of Trustees has determined that, for the period covered by the shareholder report presented in Item 1 hereto, it has five audit committee financial experts serving on its audit committee, each of whom is an independent Trustee for purpose of this N-CSR item: John E. Neal, William R. Rybak, Virginia G. Breen, Stephen B. Timbers and David D. Tripple. Under applicable securities laws, a person who is determined to be an audit committee financial expert will not be deemed an “expert” for any purpose, including without limitation for the purposes of Section 11 of the Securities Act of 1933, as a result of being designated or identified as an audit committee financial expert pursuant to this Item. The designation or identification of a person as an audit committee financial expert does not impose on such person any duties, obligations, or liabilities that are greater than the duties, obligations and liabilities imposed on such person as a member of audit committee and board of directors in the absence of such designation or identification. The designation or identification of a person as an audit committee financial expert pursuant to this Item does not affect the duties, obligations, or liabilities of any other member of the audit committee or board of directors.
ITEM 4. PRINCIPAL ACCOUNTANT FEES AND SERVICES.
| | | | | | | | |
Fiscal Years Ended | | 10/31/2017 | | | 10/31/2018 | |
Audit Fees (a) | | $ | 384,000 | | | $ | 384,000 | |
Audit-Related Fees (b) | | $ | 127,800 | | | $ | 127,800 | |
Tax Fees (c) | | $ | 28,230 | | | $ | — | |
All Other Fees (d) | | $ | — | | | $ | — | |
| | | | | | | | |
Total | | $ | 540,030 | | | $ | 511,800 | |
| | | | | | | | |
(a) Audit fees are the aggregate fees billed in each of the last two fiscal years for professional services rendered by the principal accountant to the registrant for the audit of the registrant’s annual financial statements or services that are normally provided by the accountant in connection with statutory and regulatory filings or engagements for those fiscal years.
(b) Audit-related fees are the aggregate fees billed in each of the last two fiscal years for assurance and related services rendered by the principal accountant to the registrant that are reasonably related to the performance of the audit of the registrant’s financial statements and are not reported under paragraph (a) of this Item 4.
(c) Tax fees are the aggregate fees billed in each of the last two fiscal years for professional services rendered by the principal accountant to the registrant for tax compliance, tax advice and tax planning.
(d) All other fees are the aggregate fees billed in each of the last two fiscal years for products and services provided by the principal accountant to the registrant, other than the services reported in paragraph (a)-(c) of this Item 4.
(e) (1) Registrant’s audit committee meets with the principal accountants and management to review and pre-approve all audit services to be provided by the principal accountants.
The audit committee shall pre-approve all non-audit services to be provided by the principal accountants to the registrant, including the fees and other compensation to be paid to the principal accountants; provided that the pre-approval of non-audit services is waived if (i) the services were not recognized by management at the time of the engagement as non-audit services,(ii) the aggregate fees for all non-audit services provided to the registrant are less than 5% of the total fees paid by the registrant to its principal accountants during the fiscal year in which the non-audit services are provided, and (iii) such services are promptly brought to the attention of the audit committee by management and the audit committee approves them prior to the completion of the audit.
The audit committee shall pre-approve all non-audit services to be provided by the principal accountants to the investment adviser or any entity controlling, controlled by or under common control with the adviser that provides ongoing services to the registrant if the engagement relates directly to the operations or financial reporting of the registrant, including the fees and other compensation to be paid to the principal accountants; provided that pre-approval of non-audit services to the adviser or an affiliate of the adviser is not required if (i) the services were not recognized by management at the time of the engagement as non-audit services, (ii) the aggregate fees for all non-audit services provided to the adviser and all entities controlling, controlled by or under common control with the adviser are less than 5% of the total fees for non-audit services requiring pre-approval under paragraph (e)(1)of this Item 4 paid by the registrant, the adviser or its affiliates to the registrant’s principal accountants during the fiscal year in which the non-audit services are provided, and (iii) such services are promptly brought to the attention of the audit committee by management and the audit committee approves them prior to the completion of the audit.
(e)(2) No percentage of the principal accountant’s fees or services described in each of paragraphs (b)—(d) of this Item were approved pursuant to the waiver provision paragraph (c)(7)(i)(C) of Rule 2-01 of Regulation S-X.
(f) No disclosures are required by this Item 4(f).
(g) The following table presents the aggregate non-audit fees billed in each of the last two fiscal years for services rendered by the principal accountant to the registrant and the aggregate non-audit fees billed in each of the last two fiscal years for services rendered by the principal accountant to the investment adviser or any entity controlling, controlled by or under common control of the adviser.
| | | | | | | | |
Fiscal Years Ended | | 10/31/2017 | | | 10/31/2018 | |
Registrant | | $ | — | | | $ | — | |
Investment Adviser | | $ | — | | | $ | — | |
| (h) | No disclosures are required by this Item 4(h). |
ITEM 5. AUDIT COMMITTEE OF LISTED REGISTRANTS.
Not applicable.
ITEM 6. SCHEDULE OF INVESTMENTS
Included in the Report to Shareholders in Item 1.
ITEM 7. DISCLOSURE OF PROXY VOTING POLICIES AND PROCEDURES FOR CLOSED-END MANAGEMENT INVESTMENT COMPANIES.
Not applicable.
ITEM 8. PORTFOLIO MANAGERS OF CLOSED-END MANAGEMENT INVESTMENT COMPANIES.
Not applicable.
ITEM 9. PURCHASES OF EQUITY SECURITIES BY CLOSED-END MANAGEMENT INVESTMENT COMPANY AND AFFILIATED PURCHASERS.
Not applicable.
ITEM 10. SUBMISSION OF MATTERS TO A VOTE OF SECURITY HOLDERS.
No material changes.
ITEM 11. CONTROLS AND PROCEDURES.
a) The registrant’s principal executive officer and principal financial officer have evaluated the registrant’s disclosure controls and procedures within 90 days of this filing and have concluded that the registrant’s disclosure controls and procedures were effective, as of that date, in ensuring that information required to be disclosed by the registrant in this Form N-CSR was recorded, processed, summarized, and timely reported.
b) There were no changes in the registrant’s internal controls over financial reporting (as defined in Rule 30a-3(d) under the Investment Company Act of 1940) that occurred during the most recent fiscal quarter of the period covered by this report that has materially affected, or is reasonably likely to materially affect, the registrant’s internal control over financial reporting.
ITEM 12. DISCLOSURE OF SECURITIES LENDING ACTIVITIES FOR CLOSED-END MANAGEMENT INVESTMENT COMPANIES.
Not applicable.
ITEM 13. EXHIBITS.
(a)(1) Code of Ethics
(a)(2)(i) Certification of Principal Executive Officer.
(a)(2)(ii) Certification of Principal Financial Officer.
SIGNATURES
Pursuant to the requirements of the Securities Exchange Act of 1934 and the Investment Company Act of 1940, the registrant has duly caused this report to be signed on its behalf by the undersigned, thereunto duly authorized.
Calamos Investment Trust
| | |
| |
| By: | | /s/ John P. Calamos, Sr. |
| Name: | | John P. Calamos, Sr. |
| Title: | | Principal Executive Officer |
| Date: | | December 21, 2018 |
| | |
| |
| By: | | /s/ Curtis Holloway |
| Name: | | Curtis Holloway |
| Title: | | Principal Financial Officer |
| Date: | | December 21, 2018 |
Pursuant to the requirements of the Securities Exchange Act of 1934 and the Investment Company Act of 1940, this report has been signed by the following persons on behalf of the registrant and in the capacities and on the dates indicated.
| | |
| |
| By: | | /s/ John P. Calamos, Sr. |
| Name: | | John P. Calamos, Sr. |
| Title: | | Principal Executive Officer |
| Date: | | December 21, 2018 |
| | |
| |
| By: | | /s/ Curtis Holloway |
| Name: | | Curtis Holloway |
| Title: | | Principal Financial Officer |
| Date: | | December 21, 2018 |