UNITED STATES
SECURITIES AND EXCHANGE COMMISSION
Washington, D.C. 20549
FORMN-CSR
CERTIFIED SHAREHOLDER REPORT OF REGISTERED
MANAGEMENT INVESTMENT COMPANIES
| | |
INVESTMENT COMPANY ACT FILE NUMBER: | | 811-05443 |
| |
| EXACT NAME OF REGISTRANT AS SPECIFIED IN CHARTER: | | Calamos Investment Trust |
| |
ADDRESS OF PRINCIPAL EXECUTIVE OFFICES: | | 2020 Calamos Court, Naperville Illinois 60563-2787 |
| |
NAME AND ADDRESS OF AGENT FOR SERVICE: | | John P Calamos, Sr., Founder, Chairman and Global Chief Investment Officer Calamos Advisors LLC 2020 Calamos Court, Naperville, Illinois 60563-2787 |
REGISTRANT’S TELEPHONE NUMBER, INCLUDING AREA CODE: (630) 245-7200
DATE OF FISCAL YEAR END: October 31, 2019
DATE OF REPORTING PERIOD: November 1, 2018 through October 31, 2019
ITEM 1. REPORT TO SHAREHOLDERS.

Experience and Foresight
About Calamos Investments
For over 40 years, we have helped investors like you manage and build wealth to meet long-term objectives. Because investors have different time horizons, risk tolerances and goals, we offer funds to suit a variety of asset allocation needs. Our 18 mutual funds include equity, fixed income, convertible and alternative funds. We offer U.S. funds as well as global and international choices.
We are dedicated to helping our clients build and protect wealth. We understand when you entrust us with your assets, you also entrust us with your achievements, goals and aspirations. We believe we best honor this trust by making investment decisions guided by integrity, discipline and our conscientious research.
We believe an active, risk-conscious approach is essential for wealth creation. In our early years, we pioneered the use of convertible securities as a means to control risk in volatile markets. We followed with strategies that combine convertibles and stocks, with the aim of participating in equity market upside with potentially less volatility than anall-stock portfolio. In the 1990s, we introduced our first stock fund, which invests in growth companies both large and small. Across our funds, our investment process seeks to manage risk at multiple levels and draws upon our experience investing through many market cycles. In a rapidly changing environment, we believe that this active management is essential.
We are global in our perspective. We believe globalization offers tremendous opportunities for countries and companies all over the world. In our U.S., global and international portfolios, we are seeking to capitalize on the potential growth of the global economy.
We believe there are opportunities in all markets. Our history traces back to the 1970s, a period of significant volatility and economic concerns. Since then, we have invested through multiple market cycles, each with its own challenges. Out of this experience comes our belief that the flipside of volatility is opportunity.
Letter to Shareholders

JOHN P. CALAMOS, SR.
Founder, Chairman and Global Chief Investment Officer
Dear Fellow Shareholder:
Welcome to your annual report for the 12-month period ended October 31, 2019. In this report, you will find commentary from the Calamos portfolio management teams, as well as a listing of portfolio holdings, financial statements and highlights, and detailed information about the performance and positioning of the Calamos Funds.
Market Review
Global stock, convertible security and fixed income markets posted solid gains during the annual reporting period.1 These advances were earned against a backdrop of volatility, sharp selloffs, and shifts in market leadership. Throughout the period, market sentiment fluctuated due to political uncertainties, concerns about the global economy and trade, and fears about the direction of monetary policy.
Market conditions were particularly inhospitable during the final months of 2018, as investors grew increasingly anxious that the Federal Reserve would raise short-term rates too quickly, potentially upending the U.S. economic expansion and slowing global growth. However, these concerns gave way to better sentiment as Federal Reserve comments soothed worries about additional short-term rate increases. As 2019 began, investors were in an upbeat frame of mind, encouraged not only by a dovish Fed, but also by earnings announcements, economic stimulus in China, a contained U.S. dollar, and hopes for a resolution to the U.S.-China trade dispute. Markets came under increased pressure again in May, but recovered in June as the Federal Reserve validated market expectations of renewed monetary accommodation.
During the third quarter of 2019, investor confidence faltered once again. Stocks struggled and bond yields fell as the Fed cut rates and market participants focused on political uncertainty, sluggish global economic data, and trade policy tensions. Against this backdrop, the market rotated away from higher growth stocks into cheaper stocks and yield oriented names. Volatility continued as the reporting period came to a close, as investors grappled with weaker-than-expected U.S. manufacturing data, softer U.S. retail sales and geopolitical challenges.
Outlook
We believe the global economy can expand further, although the pace is likely to be subdued. Political uncertainties, the trade dispute, and recessionary conditions in industrial
Letter to Shareholders
sectors create headwinds, but there are also tailwinds, such as accommodative monetary policy, low inflation, resilient U.S. consumption, and economic stimulus in China. We believe the probability of a near-term U.S. recession is low. While we are attentive to weakness in the U.S. manufacturing sector and the yield curve, the positives are more compelling: Unemployment is low, consumer balance sheets are healthy, and business-friendly fiscal policies such as deregulation continue to contribute to healthy earnings.
These conditions can set the stage for continued upside in the markets. Additionally, valuations for many securities remain attractive, in our view. Nevertheless, volatility will remain elevated through this phase of the cycle. Markets are likely to experience additional selloffs due to any number of headlines relating to a slowing global growth outlook, evolving central bank policies and an increasingly contentious political climate in the U.S.
In this environment, our teams are taking a highly selective, risk-managed approach, paying close attention to company fundamentals and valuations, as well as macroeconomic conditions and secular themes. As we have throughout the decades, we look through short-term market noise as we seek to capitalize on long-term opportunities in the markets.
Thoughts on Asset Allocation
Short-term volatility and uncertainty can be challenging, but it’s important to stay focused on your long-term goals. Investors who have a short-term mindset and shift their asset allocations in response to daily headlines may end up capturing the downside in the markets and missing the upside. The dangers of “timing” strategies may be especially pronounced in the sideways markets that we expect.
A far better approach is to work with your financial advisor to establish—and maintain—an asset allocation that is appropriately diversified to reflect your long-term goals and risk tolerance. If you are concerned about the potential impact of stock market volatility on your portfolio, your advisor may recommend funds that seek lower volatility participation in the stock market (like Calamos Convertible Fund or Calamos Growth and Income Fund) or short-duration bond strategies (such as Calamos Short-Term Bond Fund).
Your financial advisor may also propose using liquid alternative funds to enhance the risk/reward characteristics of your portfolio. Equity alternatives, such as Calamos Hedged Equity Fund and Calamos Phineus Long/Short Fund, employ a number of strategies to manage stock market risk. Fixed income alternatives, such as Calamos Market Neutral Income Fund, can offer potential benefits that traditional bond strategies cannot.
New Investment Choices to Enhance Diversification
A well-diversified portfolio also includes investments in companies from different countries, sectors and sizes. To help investors achieve diversification across the market capitalization spectrum, we acquired Timpani Capital
| | | | |
| 2 | | CALAMOS OPEN-END FAMILY OF FUNDS ANNUAL REPORT | | |
Letter to Shareholders
Management, a boutique small-and small/mid-cap (“smid”) manager with a time-tested process for sourcing compelling growth opportunities. We are excited to have grown the ranks of our investment organization with the seasoned Timpani team and believe their active, risk-conscious approach is an excellent fit for our investment culture. I invite you to learn more about our newest offerings by reading the commentaries for Calamos Timpani Small Cap Growth Fund and Calamos Timpani SMID Growth Fund.
Conclusion
As always, thank you for your continued trust in Calamos Investments. We are honored you have chosen us to help you pursue your financial objectives and we look forward to serving you in the years to come.
Sincerely,

John P. Calamos, Sr.
Founder, Chairman and Global Chief Investment Officer
Before investing, carefully consider the fund’s investment objectives, risks, charges and expenses. Please see the prospectus and summary prospectus containing this and other information which can be obtained by calling 1-800-582-6959. Read it carefully before investing. Performance data represents past performance, which is no guarantee of future results. Current performance may be lower or higher than the performance quoted. Opinions are as of the publication date, subject to change and may not come to pass. Information is for informational purposes only and shouldn’t be considered investment advice.
Diversification and asset allocation do not guarantee a profit or protection against a loss.
| 1 | The MSCI All Country World Index is a measure of global stock market performance, which returned 13.22% for the 12-month period ending October 31, 2019. The S&P 500 Index is an unmanaged index generally considered representative of the U.S. stock market. For the 12-month period, the index returned 14.33%. |
| | The ICE BofAML All U.S. Convertibles ex Mandatory Index represents the U.S. convertible securities market excluding mandatory convertibles. The index returned 12.39% for the 12-month period. The Thomson Reuters Global Convertible Bond Index is designed to broadly represent the global convertible bond market. The index returned 9.44% for the 12-month period. |
| | The Bloomberg Barclays U.S. Aggregate Bond Index is considered generally representative of the investment-grade bond market. For the 12-month period ending October 31, 2019, the index returned 11.51%. The Bloomberg Barclays U.S. Corporate High Yield 2% Issuer Capped Index measures the performance of high yield corporate bonds with a maximum allocation of 2% to any one issuer. The index returned 8.38% for the 12-month period. The Bloomberg Barclays U.S. Government/Credit 1-3 Years Index includes all medium and larger issues of U.S. government, investment-grade corporate, and investment-grade international dollar-denominated bonds that have maturities of between 1 and 3 years and are publicly issued. The index returned 4.89% for the 12-month period. |
Duration is a measure of interest rate sensitivity.
Source: Lipper, Inc and Mellon Analytical Solutions, LLC. Unmanaged index returns assume reinvestment of any and all distributions and, unlike fund returns, do not reflect fees, expenses or sales charges. Investors cannot invest directly in an index. Investments in overseas markets pose special risks, including currency fluctuation and political risks. These risks are generally intensified for investments in emerging markets. Countries, regions, and sectors mentioned are presented to illustrate countries, regions, and sectors in which a fund may invest. Fund holdings are subject to change daily. The Funds are actively managed. The information contained herein is based on internal research derived from various sources and does not purport to be statements of all material facts relating to the securities mentioned. The information contained herein, while not guaranteed as to accuracy or completeness, has been obtained from sources we believe to be reliable. There are certain risks involved with investing in convertible securities in addition to market risk, such as call risk, dividend risk, liquidity risk and default risk, which should be carefully considered prior to investing.
This information is being provided for informational purposes only and should not be considered investment advice or an offer to buy or sell any security in the portfolio. Investments in alternative strategies may not be suitable for all investors.
Calamos Market Neutral Income Fund
OVERVIEW
The Fund combines two complementary strategies with different responses to volatility: convertible arbitrage seeks alpha and uncorrelated returns, while hedged equity provides income from options writing and upside participation.
KEY FEATURES
| | ◾ | | Generates returns not dependent on interest rates, a key differentiator from traditional bond strategies. | |
| | ◾ | | Employs an absolute-return strategy with historically lower beta to fixed income and equity markets as well as lower volatility and limited drawdowns. | |
| | ◾ | | As one of the first alternative mutual funds, capitalizes on more than four decades of experience in the convertible space. | |
PORTFOLIO FIT
The fund may provide potential diversification, particularly in a low-interest-rate environment.
| | |
| FUND NASDAQ SYMBOLS |
| |
A Shares | | CVSIX |
C Shares | | CVSCX |
| |
I Shares | | CMNIX |
| |
|
| FUND CUSIP NUMBERS |
| |
A Shares | | 128119203 |
C Shares | | 128119849 |
| |
I Shares | | 128119880 |
| |
CALAMOS MARKET NEUTRAL INCOME FUND
INVESTMENT TEAM DISCUSSION
Please discuss the Fund’s strategy and role within an asset allocation.
Launched more than 25 years ago, the strategy is one of the first liquid alternative mutual funds and blends two main strategies—convertible arbitrage and hedged equity—with the aim of monetizing volatility. In addition to offering an attractive historical risk/reward profile, the Fund may enhance long-term portfolio diversification potential, especially in relation to fixed income securities.
Recently, bouts of elevated equity volatility underscore the value of diversification. Calamos Market Neutral Income Fund seeks to:
| • | | Potentially enhance an investor’s fixed income allocation. |
| • | | Actively pursue equity market upside while hedging downside risk. |
The end goal is consistent absolute total return over varying market cycles.
How has the Fund performed?
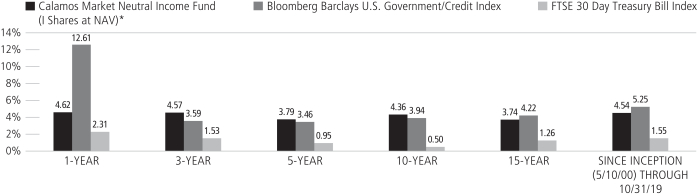
For the12-month period ended October 31, 2019, Calamos Market Neutral Income Fund returned 4.62% (Class I Shares at net asset value) versus a 12.61% return for the Bloomberg Barclays U.S. Government/Credit Bond Index and the 2.31% increase for the FTSE30-Day U.S. Treasury Bill Index.
For the1-year,3-year,5-year and10-year periods ended October 31, 2019, the Fund’s I Shares return ranked in the 33rd, 19th, 6th and 1st percentile, respectively, in the Morningstar Market Neutral category peer group.*
Both strategies utilized in the Fund, convertible arbitrage and hedged equity, contributed positively to performance during a period. Since the inception of Class I shares on May 10, 2000, the Fund gained 4.54% on an annualized basis. For the same period, the Bloomberg Barclays U.S. Government/Credit Bond Index gained 5.25%, while the FTSE30-Day U.S. Treasury Bill Index returned 1.55%.
What factors influenced performance?
The reporting period began with increased volatility, as investors grappled with Federal Reserve policy changes, global growth deceleration and heightened geopolitical risks. However, sentiment improved as the Federal Reserve became increasingly dovish, intermittent progress was reported on the U.S.-China trade imbroglio, and improved economic data provided encouragement. The Fund seeks to provide bond-like returns and bond-like volatility without bond-like risk exposures. The Fund seeks to “monetize volatility” though a combination of convertible arbitrage and hedged equity strategies.
The Cboe Volatility Index (VIX) declined from 22.23 at the beginning of the reporting period to 13.11 by the end, hitting a high of 36.07 on December 24, 2018. The increase in volatility was beneficial to the Fund because it afforded increased opportunities for
| * | Data is as of 10/31/19. Morningstar category percentile ranking is based on annualized total return for the1-year,3-year,5-year and10-year periods. Calamos Market Neutral Income Fund Class I Shares were in the 33rd, 19th, 6th, and 1st percentiles of 131, 110, 89 and 26 funds for the1-year,3-year,5-year and10-year periods, respectively, for the Morningstar Market Neutral category. |
| | | | |
| 4 | | CALAMOS OPEN-END FAMILY OF FUNDS ANNUAL REPORT | | |
Calamos Market Neutral Income Fund
rebalancing both the convertible arbitrage and hedged equity strategies. The convertible arbitrage portion of the Fund contributed positive monthly results, even when the market dropped dramatically in December 2018.
Elevated option skew1 was present during the majority of the reporting period, though it declined as volatility spiked in December. The elevated option skew provided an affordable opportunity to use call and put spreads to create a favorable upside/downside risk/reward profile.
After hiking interest rates four times during the previous fiscal year, the Federal Reserve hiked interest rates once in December before pausing. As investors grew wary of a Fed that might overtighten, the Fed announced that it had changed its expectation for zero additional 2019 rate increases and that it would reduce the amount of balance sheet normalization. In this environment, the3-year Treasury yield declined from 2.93% to 2.24%, while the5-year Treasury yield moved from 2.98% to 2.28%. The10-year U.S. Treasury yield decreased from 3.15% to 2.51%. While the Fund doesn’t have significant interest rate exposure, this may also mean that we do not have interest rate opportunity either. Declining interest rates over the reporting period supported the Bloomberg Barclay’s U.S. Government/Credit Index outperformance relative to the Fund. However, the Fund has outperformed the index over the past five years with a lower standard deviation2 and a negative correlation to bonds.
How is the Fund positioned?
At the end of the reporting period, the Fund had a roughly equal allocation between the convertible arbitrage (52.6%) and hedged equity (47.4%) strategies. Our outlook projects similar though complementary risk-adjusted returns for both strategies going forward. Within convertible arbitrage, robust new convertible issuance has provided opportunities to invest in many new convertibles with favorable terms and valuations.
In regards to our call positioning, skew in the options market presented an attractive opportunity to utilize call and put spreads, which provided a positive impact on the portfolio’s risk/reward. By using slightlycloser-to-the-money calls, buyingout-of-the-money calls, and addingnear-the-money put spreads we are able to construct a more effective hedge that still has a delta3 and profile similar to our historical baseline positioning. When volatility and flatter option skew becomes more prevalent in the market, our typical baseline positioning looks more appealing. We continue to monitor the options market for the best opportunities available and will actively adjust our positioning as conditions warrant.
What are your closing thoughts for Fund shareholders?
The latter stages of the economic cycle are generally accompanied by increased bouts of volatility and this certainly appears to be the case at this point highlighted by the 13.5% fourth quarter 2018 decline for the S&P 500 Index followed by the 13.7% rebound in the first quarter of 2019. The Fund derives benefits from “volatility in volatility,” and heightened periods of volatility are expected from a variety of potential sources. Trade disputes, global growth concerns, geopolitical tensions, and speculation surrounding an inverted yield curve are just a few of the factors that may stoke
| 1 | Volatility Skew is the difference in implied volatility between out-of-the-money options, at-the-money options, and in-the-money options. Volatility skew, which is affected by sentiment and the supply-and-demand relationship, helps fund managers determine whether to write calls or puts. |
| 2 | Standard Deviation is a measure of volatility. |
| 3 | Delta is the ratio of the change in price of an option to the change in price of the underlying asset. |
| | | | |
| SECTOR WEIGHTINGS | |
| |
Information Technology | | | 33.1 | % |
Health Care | | | 12.9 | |
| |
Consumer Discretionary | | | 12.2 | |
Financials | | | 9.8 | |
| |
Communication Services | | | 9.6 | |
Industrials | | | 6.1 | |
| |
Consumer Staples | | | 4.5 | |
Utilities | | | 3.5 | |
| |
Real Estate | | | 3.3 | |
Energy | | | 2.6 | |
| |
Other | | | 2.2 | |
Materials | | | 2.0 | |
Asset Allocation weightings are subject to change daily and are calculated as a percentage of net assets. The table excludes cash or cash equivalents, any government/sovereign bonds or broad based index hedging securities the Fund may hold.
Calamos Market Neutral Income Fund
volatility. A backdrop of rising interest rates has diminished given the Federal Reserve’s recent dovish policy pivot but we continue to see diversification benefits of including the Fund within a fixed income allocation. Investors likely are not owning bonds based
on the amount of yield provided. Rather, investors look to the stability of bonds during increased market volatility. Given the uncertainty over global central bank interest rate policies, including the Fund in an investment portfolio should provide a means of reducing equity sensitivity. An allocation to the Fund can also provide stability in a market environment that turns increasingly volatile for both stocks and bonds. Investors are facing a dilemma in terms of how to reduce equity sensitivity without embracing the interest rate sensitivity of the bond market. Calamos Market Neutral Income Fund has historically provided bond-like returns and bond-like risk without having bond-like interest rate sensitivity. The Fund also has demonstrated lower correlations to other asset classes.
Opinions, estimates, forecasts, and statements of financial market trends that are based on current market conditions constitute our judgment and are subject to change without notice. The views and strategies described may not be suitable for all investors. References to specific securities, asset classes and financial markets are for illustrative purposes only and are not intended to be, and should not be interpreted as, recommendations.
ANNUALIZED RETURN: SINCE INCEPTION (5/10/00) THROUGH 10/31/19
Performance data quoted represents past performance, which is no guarantee of future results. Current performance may be lower or higher than the performance quoted.
The principal value and investment return of an investment will fluctuate so that your shares, when redeemed, may be worth more or less than their original cost. You can obtain performance data current to the most recent month end by visiting www.calamos.com. Average annual total return measures net investment income and capital gain or loss from portfolio investments as an annualized average. All performance shown assumes reinvestment of dividends and capital gains distributions. Performance is for the Fund’s Class I shares at net asset value. The Fund also offers Class A and Class C shares, the performance of which may vary. Source: State Street Corporation, Lipper, Inc., and Mellon Analytical Solutions, LLC.
| * | Annual returns for Class I shares are provided because Class I shares represent the largest percentage of assets in the Calamos Family of Funds. |
| | | | |
| 6 | | CALAMOS OPEN-END FAMILY OF FUNDS ANNUAL REPORT | | |
Calamos Market Neutral Income Fund
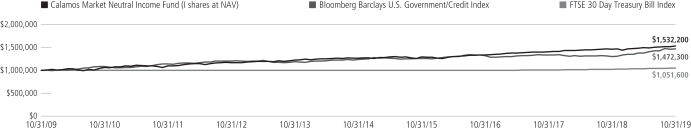
GROWTH OF $1,000,000: FOR THE 10-YEAR PERIOD ENDED 10/31/19
AVERAGE ANNUAL TOTAL RETURN† AS OF 10/31/19
| | | | | | | | | | | | | | | |
| | | 1
YEAR | | 5
YEARS | | 10 YEARS |
Class A Shares – Inception 9/4/90 | | | | | | | | | | | | | | | |
Without Sales Charge | | | | 4.32 | % | | | | 3.52 | % | | | | 4.10 | % |
With Sales Charge | | | | 1.98 | | | | | 2.52 | | | | | 3.59 | |
Class C Shares – Inception 2/16/00 | | | | | | | | | | | | | | | |
Without Sales Charge | | | | 3.56 | | | | | 2.76 | | | | | 3.33 | |
With Sales Charge | | | | 2.56 | | | | | 2.76 | | | | | 3.33 | |
Class I Shares – Inception 5/10/00 | | | | 4.62 | | | | | 3.79 | | | | | 4.36 | |
Performance data quoted represents past performance, which is no guarantee of future results. Current performance may be lower or higher than the performance quoted. The principal value and investment return of an investment will fluctuate so that your shares, when redeemed, may be worth more or less than their original cost.
As of the prospectus dated 3/1/19, the Fund’s gross expense ratio for Class A shares is 1.26%; C shares is 2.01% and Class I shares is 1.00%. The expense ratios shown above may differ from the more recent expense ratios reported in the Financial Highlights section of this report.
| † | Average annual total return measures net investment income and capital gain or loss from portfolio investments as an annualized average assuming reinvestment of dividends and capital gains distributions. Performance shown reflects the effects of an expense reimbursement that improved results and was in effect until March 31, 2000. Load-adjusted returns are adjusted for the maximum front-end sales load of 2.25% for Class A shares and returns for Class C shares have been adjusted for the contingent deferred sales charge (CDSC). |
NOTES:
The graphs do not reflect the income taxes that you would pay on fund distributions or the redemption of fund shares. Fund performance includes reinvestment of dividends and adjustment for the maximum sales charge for Class A shares. The performance of other classes will vary from the performance of the class shown based on the difference in sales charges and fees paid by shareholders investing in different share classes.
The Bloomberg Barclays U.S. Government/Credit Index is comprised of long-term government and investment-grade corporate debt securities and is generally considered representative of the performance of the broad U.S. bond market.
The FTSE 30 Day Treasury Bill Index is an unmanaged index generally considered representative of the performance of short-term money instruments. U.S. Treasury Bills are backed by the full faith and credit of the U.S. government and offer a guarantee as to the repayment of principal and interest at maturity.
The Cboe Volatility Index (VIX) is a leading measure of market expectations of near-term volatility conveyed by S&P 500 Index (SPX) option prices.
The Morningstar Market Neutral Category represents funds that attempt to eliminate the risks of the market by holding 50% of assets in long positions in stocks and 50% of assets in short positions.
Index returns assume reinvestment of dividends and do not reflect deduction of fees and expenses. It is not possible to invest directly in an index.
The Fund’s use of derivative instruments involves investment risks and transaction costs to which the Fund would not be subject absent the use of these instruments and, accordingly, may result in losses greater than if they had not been used. Derivative instruments can be illiquid, may disproportionately increase losses and may have a potentially large impact on Fund performance.
Calamos Hedged Equity Fund
OVERVIEW
The Fund blends a core long-equity portfolio with an actively managed option overlay. Tactical management creates opportunities to add alpha from option market dynamics and equity market volatility.
KEY FEATURES
| | ◾ | | Our investment approach is highly responsive to dynamic market conditions, unlike many less active option-based strategies. | |
| | ◾ | | The investment team seeks to take advantage of opportunities the market presents, with a focus on being favorably positioned for as many outcomes as possible. | |
PORTFOLIO FIT
The Fund’s options-based risk-management strategy can provide upside participation in equity markets while limiting downside exposure, thereby improving the quality of the ride.
| | |
| FUND NASDAQ SYMBOLS |
| |
A Shares | | CAHEX |
C Shares | | CCHEX |
| |
I Shares | | CIHEX |
| | | |
|
| FUND CUSIP NUMBERS |
| |
A Shares | | 128120698 |
C Shares | | 128120680 |
| |
I Shares | | 128120672 |
| | | |
CALAMOS HEDGED EQUITY FUND
INVESTMENT TEAM DISCUSSION
Please discuss the Fund’s strategy and role within an asset allocation.
Calamos Hedged Equity Fund is designed to dampen volatility within an equity allocation.
| • | | The Fund’s investment approach is highly responsive to dynamic market conditions, a key differentiator versus many less-active option-based strategies. |
| • | | The Fund’s strategy blends a core long equity portfolio with an actively managed option overlay. Tactical management creates opportunities to add alpha from option market dynamics and equity market volatility. |
| • | | As an equity substitute, the strategy seeks to provide better upside/downside asymmetry than long-only equities. |
| • | | The Fund seeks to take advantage of market opportunities by being favorably positioned for as many outcomes as possible. |
How has the Fund performed?
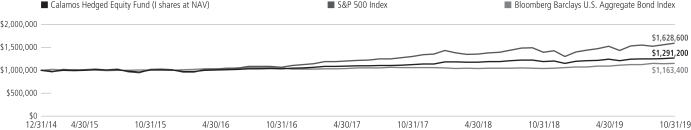
For the12-month period ended October 31, 2019, Calamos Hedged Equity Fund gained 7.01% (Class I shares at net asset value) versus the S&P 500 Index gain of 14.33% and the Bloomberg Barclays U.S. Aggregate Bond Index 11.51% increase. Since its inception on December 31, 2014, the Fund gained 5.43% on an annualized basis (Class I shares at net asset value) versus 10.62% for the S&P 500 Index and 3.18% for the Bloomberg Barclays U.S. Aggregate Bond Index.
In this strategy, we utilize covered call writing, protective puts, as well as put and call spreads for income and protection on our proprietary basket of equities that represents the broad stock market. Through active management, we are attempting to derive better risk-adjusted returns versus holding the index passively.
What factors influenced performance during the reporting period?
The Fund’s fiscal year was characterized by several bouts of volatility in January, May, August and October. This was conducive to the Fund’s actively managed approach, whereby we had the ability to “monetize volatility” through frequent rebalancing of our option hedges. The equity market began 2019 in negative territory, as investors had growing concerns regarding lower corporate earnings revisions, growing trade tensions with global trading partners, specifically China and the EU, as well as a pivoting Fed looking to now claw back the rate hike of late 2018. What also challenged the markets throughout 2019 were worries surrounding negative global interest rates and uncertainty regarding the midterm elections. The S&P 500 Index shook this off and bounced off its low of January 3 at 2447.89 to the new high of 3037.56 on October 31. This environment provided favorable opportunities to monetize volatility, as we rebalanced our option hedges, improved risk/reward positioning, and locked in profits.
The Cboe Volatility Index (VIX) decreased from its January 2 high of 28.53 to a low of 13.22 on October 31. Elevated option skew1 was present through the first, second and fourth quarters, where we had the Cboe SKEW Index above 125, which indicated that the market was pricing in a higher probability of outlier returns to the downside as more significant during those periods. Skew describes asymmetry from the normal distribution in a set of statistical data.
| 1 | Volatility Skew is the difference in implied volatility between out-of-the-money options, at-the-money options, and in-the-money options. Volatility skew, which is affected by sentiment and the supply-and-demand relationship, provides information that helps fund managers determine whether to write calls or puts. |
| | | | |
| 8 | | CALAMOS OPEN-END FAMILY OF FUNDS ANNUAL REPORT | | |
Calamos Hedged Equity Fund
The Fund benefited by using call and put spreads while the option markets had steep skew, which provided an affordable opportunity to create a favorable upside/downside risk/reward profile.
The Fund’s use of derivative instruments, including select equity options, index options, and foreign currency forward hedges, had minimal impact on the performance figures for the12-month period
How is the Fund positioned?
Option Positioning. Skew in the options market presented an attractive opportunity to utilize call and put spreads, which benefited the portfolio’s risk/reward. By using slightlycloser-to-the-money calls, buyingout-of-the-money calls, and adding near the money put spreads, we constructed a more effective hedge with equity sensitivity similar to our historical baseline positioning. Moreover, we frequently adjusted the call and put quantities to maintain a balanced risk/reward. This positioning provided additional protection over and above our typical 40% to 50% put notional minimum while adding upside participation potential. Thetrade-off has been a reduction in the income we received. However, given the low volatility and high skew in the options market, we felt this arrangement was warranted and opportunistic for the Fund.
More recently, however, lower volatility and heightened option skew has made our baseline positioning look more challenging. We continue to monitor the options market for the best opportunities available and will actively adjust our positioning as conditions warrant.
At the end of October, our call spread positioning included calls written of 78% (10% in the money) and long calls of 48% (0.17% out of the money “OTM”). The Fund’s net put protection consisted of 70% long puts (10% OTM) and 6% puts sold short (7% OTM).
Sector Positioning. At the end of the reporting period and relative to the S&P 500 Index, the equity basket was slightly overweight to information technology, consumer discretionary and communication services. The portfolio had slight underweight positions to utilities, real estate and materials.
Market Cap Positioning. Relative to the S&P 500 Index, the portfolio maintained a heavier relative weight to larger-capitalization (>$20 billion) holdings and a lighter weight to small andmid-capitalization ($5 billion to $20 billion) names.
What closing thoughts do you have for Fund shareholders?
We expect heightened volatility from a variety of sources going forward. President Trump’s recent focus on balancing trade through tariffs may continue to fuel volatility as investors attempt to determine the magnitude, duration and retaliatory pain of impending tariffs. In addition, investor speculation on when and to what degree global central banks and U.S. Federal Reserve stall quantitative easing could stoke volatility. As we continue to expect volatility in the equity markets, we remain enthusiastic about this environment being favorable to our current positioning in the Calamos Hedged Equity Fund. Should the equity markets continue to advance, we think the Fund is poised to participate in this upside while providing income to purchase downside protection. Conversely, should markets retreat, we believe the put protection will serve to provide a measure of downside protection and resilience.
Opinions, estimates, forecasts, and statements of financial market trends that are based on current market conditions constitute our judgment and are subject to change without notice. The views and strategies described may not be suitable for all investors. References to specific securities, asset classes and financial markets are for illustrative purposes only and are not intended to be, and should not be interpreted as, recommendations.
| | | | |
| SECTOR WEIGHTINGS | | | |
| |
Information Technology | | | 22.8 | % |
Health Care | | | 14.2 | |
| |
Financials | | | 13.5 | |
Communication Services | | | 10.7 | |
| |
Consumer Discretionary | | | 10.5 | |
Industrials | | | 9.2 | |
| |
Consumer Staples | | | 7.4 | |
Other | | | 5.2 | |
| |
Energy | | | 4.4 | |
Utilities | | | 3.4 | |
| |
Real Estate | | | 3.2 | |
Materials | | | 2.4 | |
Asset Allocation weightings are subject to change daily and are calculated as a percentage of net assets. The table excludes cash or cash equivalents, any government/sovereign bonds or broad based index hedging securities the Fund may hold.
Calamos Hedged Equity Fund
GROWTH OF $1,000,000: SINCE INCEPTION (12/31/14) THROUGH 10/31/19
AVERAGE ANNUAL TOTAL RETURN† AS OF 10/31/19
| | | | | | | | | | |
| | | 1
YEAR | | SINCE
INCEPTION |
Class A Shares – Inception 12/31/2014 | | | | | | | | | | |
Without Sales Charge | | | | 6.65 | % | | | | 5.12 | % |
With Sales Charge | | | | 1.59 | | | | | 4.07 | |
Class C Shares – Inception 12/31/2014 | | | | | | | | | | |
Without Sales Charge | | | | 5.88 | | | | | 4.36 | |
With Sales Charge | | | | 4.88 | | | | | 4.36 | |
Class I Shares – Inception 12/31/2014 | | | | 7.01 | | | | | 5.43 | |
Performance data quoted represents past performance, which is no guarantee of future results. Current performance may be lower or higher than the performance quoted. The principal value and investment return of an investment will fluctuate so that your shares, when redeemed, may be worth more or less than their original cost.
As of the prospectus dated 3/1/19, the Fund’s gross expense ratio for Class A shares is 1.48%; Class C is 2.31% and Class I is 1.27%. The Fund’s Investment Adviser has contractually agreed to reimburse the Fund expenses through 3/1/22 to the extent necessary so that Total Annual Fund Operating Expenses (excluding taxes, interest, short interest, short dividend expenses, brokerage commissions, acquired fund fees and expenses, and extraordinary expenses, if any) of Class A, Class C, and Class I are limited to 1.25%, 2.00%, 1.00% of average net assets, respectively. Calamos Advisors may recapture previously waived expense amounts within the same fiscal year for any day where the respective Fund’s expense ratio falls below the contractual expense limit up to the expense limit for that day. This undertaking is binding on Calamos Advisors and any of its successors and assigns. This agreement is not terminable by either party. The expense ratios shown above may differ from the more recent expense ratios reported in the Financial Highlights section of this report.
| † | Average annual total return measures net investment income and capital gain or loss from portfolio investments as an annualized average assuming reinvestment of dividends and capital gains distributions. Performance shown includes the effects of an expense reimbursement that improved results. Load-adjusted returns are adjusted for the maximum front-end sales load of 4.75% for Class A shares and returns for Class C shares have been adjusted for the contingent deferred sales charge (CDSC). |
NOTES:
The S&P 500 Index is an unmanaged index generally considered representative of the U.S. stock market.
The Bloomberg Barclays U.S. Aggregate Bond Index is considered generally representative of the investment-grade bond market.
The Cboe Volatility Index (VIX) is a leading measure of market expectations of near-term volatility conveyed by S&P 500 Index (SPX) option prices.
The Cboe SKEW Index essentially tracks the willingness of investors to pay up for downside protection on the S&P 500 Index.
Index returns assume reinvestment of dividends and do not reflect deduction of fees and expenses. It is not possible to invest directly in an index.
The Fund’s use of derivative instruments involves investment risks and transaction costs to which the Fund would not be subject absent the use of these instruments and, accordingly, may result in losses greater than if they had not been used. Derivative instruments can be illiquid, may disproportionately increase losses and may have a potentially large impact on Fund performance.
| | | | |
| 10 | | CALAMOS OPEN-END FAMILY OF FUNDS ANNUAL REPORT | | |
Calamos Phineus Long/Short Fund
CALAMOS PHINEUS LONG/SHORT FUND
INVESTMENT TEAM DISCUSSION
What is the essence of the investment approach?
Through a global long/short structure, the Fund invests in publicly listed equity securities. Components of the strategy include:
A fundamental global approach that blendstop-down andbottom-up considerations. Company analysis is integrated with industry, thematic and macro research.
An inclusive frameworkfor identifying potential returns and associated risks. The framework accounts for company, industry, style, country and market factors.
Flexible capital allocation allowing for all investment styles, market caps and geographic regions. The investment universe is global, liquid and scalable. Exposure levels and investment styles depend upon market conditions and the economic cycle.
How has the Fund performed?
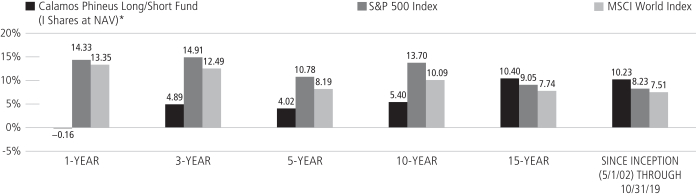
For the12-month period ended October 31, 2019, Calamos Phineus Long/Short Fund returned-0.16% (Class I shares at net asset value). The MSCI World Index rose 13.35% and the S&P 500 Index gained 14.33% over the same period.
Our approach in 2019 has been consistent with our view that equities face an environment of intensifying fundamental vulnerabilities. This view is based on a U.S. economy that was about to encounter the effects of tight monetary policy, slowing or contracting leading economic indicators, an uncertain trade environment, unwinding global supply chains, and tough year-over-year comparisons versus a 2018 buoyed by tax reform. The Fund’s long and short exposures have been roughly balanced for the majority of the year, which helped our relative performance into calendaryear-end 2018, but detracted from performance in 2019 through period end, as the market has shrugged off deteriorating economic data in favor of a dovish Fed and ashort-term trade truce.
Since its inception on May 1, 2002, the Fund has returned 10.23% on an annualized basis (Class I shares at net asset value), markedly outperforming both the MSCI World and S&P 500 Indexes, which returned 7.51% and 8.23%, respectively, over the same period.
What factors influenced performance during the reporting period?
The Fund’s largest contributors were long investments in the information technology and financials sectors, while long exposure in energy and a short position hedge on the SPDR S&P 500 ETF TRUST hindered performance. Notable contributors during the period included long positions in First Solar, Inc. (Information Technology), Facebook (Communication Services), and Air Products & Chemicals (Materials). Detractors included short positions in an S&P 500 ETF (Market Hedge) and Flour Corp. (Industrials) as well as a short call position on the SPY US 02/15/19 C265.
FUND OVERVIEW
The Fund seeks strong risk-adjusted and absolute returns across the global equity universe. The Fund uses a global long/short strategy to invest in publicly listed equity securities.
KEY FEATURES
| | ◾ | | Fundamental global approach blends top-down and bottom-up considerations. | |
| | ◾ | | Flexible asset allocation allows for all investment styles, market caps and geographic regions depending on the market environment. | |
| | ◾ | | Comprehensive approach assesses stock, industry, style, country and market factors. | |
| | ◾ | | Includes knowledge-based sectors such as technology, communications, media, financials and health care. | |
PORTFOLIO FIT
The Fund seeks to provide strong risk-adjusted returns via an alternative solution that complements and diversifies a global or U.S. equity allocation.
| | |
| FUND NASDAQ SYMBOLS |
| |
A Shares | | CPLSX |
C Shares | | CPCLX |
| |
I Shares | | CPLIX |
| | | |
|
| FUND CUSIP NUMBERS |
| |
A Shares | | 128120656 |
C Shares | | 128120649 |
| |
I Shares | | 128120631 |
| | | |
Calamos Phineus Long/Short Fund
| | | | |
| SECTOR WEIGHTINGS | |
| |
Financials | | | 26.9 | % |
Health Care | | | 16.3 | |
| |
Industrials | | | 13.9 | |
Communication Services | | | 12.0 | |
| |
Consumer Discretionary | | | 6.5 | |
Information Technology | | | 5.7 | |
| |
Other | | | 4.8 | |
Materials | | | 3.3 | |
| |
Consumer Staples | | | 2.7 | |
Energy | | | 2.2 | |
Asset Allocation weightings are subject to change daily and are calculated as a percentage of net assets. The table excludes cash or cash equivalents, any government/sovereign bonds or broad based index hedging securities the Fund may hold.
How is the Fund positioned in the context of the global economic cycle?
Our largest sector exposure remains in financials, a sector with many high-quality attractively valued names that are rapidly returning cash to shareholders. After a period of underperformance relative to the broader market due to the extraordinary decline in longer-dated rates, we believe that bond prices have climaxed and financials will be a primary beneficiary going forward. The group’s beta is relatively high because of exposure to cyclical factors such as loan growth and credit quality, but this has been an area of strength for the U.S. economy—particularly as it relates to the U.S. consumer.
Regarding industrials, we have been selective and have favored companies within the aerospace and defense industry, which benefited from increased defense spending by the government and the “defensive” nature of their businesses. We continue to emphasize businesses less exposed outside the U.S. due to the recessionary conditions that have reared up in recent months.
We have maintained a presence in health care, though are conscious of the rising political and litigation concerns that will be an overhang in 2020. We have been tactical and selective in our exposure, preferring those companies less exposed to drug pricing pressures—a risk that we do not see abating in the foreseeable future. This has led us to favor diversified and health services companies. We have also tactically added to managed care stocks that have suffered from overly bearish sentiment related to unlikely tail risks such as a single payer “Medicare for All” system completely supplanting the current system.
We are incrementally negative on the consumer staples sector, where valuations have become too high relative to underlying earnings prospects. They should perform well as long as investors remain obsessed with recession risk. However, it is too late to favor defensives, and we look to reduce them in coming months. We continue to be focused on more discretionary names that are inearly-to-middle innings of turnarounds.
Europe has been a zone of instability for investors for quite some time, but political tensions are reaching the end game and we expect a positive resolution: a workable (not “hard”) exit for the UK. We have bought call options on a UK equity index on the view that the removal of the “no deal” threat effectively eliminates the chances of a consumer recession in Europe and should broadly favor sterling and UK equities. With respect to emerging markets, outperformance is reliant on a weaker USD—which is unlikely unless we see further easing from the Federal Reserve. We maintain no direct exposure in the area.
What are your closing thoughts for the coming year?
Through 2019, investor sentiment has been dour with theend-cycle themes of global industrial recession and weakened corporate profitability in addition to the U.S.-China trade confrontation. Remarkably, U.S. equities have again approached their former highs at the top of our 2400 to 3000 trading range within the S&P 500 Index. Amid broadening signs of economic vulnerability, the obvious explanation for this resilience relates to the belief that neither the Federal Reserve nor Trump will accept any deflation in financial asset prices.
We should consider how the fundamental landscape might unfold positively in 2020 and thus, justify this resilience of U.S. equities. Investors are hoping for some reflation led by an improved global output cycle, which could imply an imminent trough in the earnings cycle. This expectation seems premature as there are no signs of actual reflation, just “expectations of reflation.” The latest improvement in investor sentiment has been partial and fragile; the best-performing sectors since the prior peak in July have been defensive rather than risk on.
| | | | |
| 12 | | CALAMOS OPEN-END FAMILY OF FUNDS ANNUAL REPORT | | |
Calamos Phineus Long/Short Fund
For now, the slowdown in world growth and the downward revisions in profits remain very apparent. The “China problem” appears intractable and has broad implications for the global economy including the corporate sector. Without a tangible improvement in the U.S.-China relationship, it is hard to imagine a genuine recovery of global growth in 2020. Active investors are defensively positioned, yet are inclined to look to the new year with the hope that the worst is past.
The important message for clients is one of discontinuity, creating an unattractive asymmetry of risk across the Developed equity markets. Central banks have again proven supportive of financial assets, yet economic vulnerabilities will stay high in coming quarters. We believe equities will be vulnerable in early 2020 to the realization that the structural themes of thisend-cycle will prevent a global cyclical recovery of any significance in 2020. We think this will be the key debate in coming months.
Reflecting these crosscurrents, our strategy has not changed and we believe low net equity exposures are warranted for now. The S&P 500 Index remains near the top of our 2400 to 3000 trading range. This remains a zone of major resistance for further gains and we see little evidence that the earning cycle can trough before Q1 2020.
Opinions, estimates, forecasts, and statements of financial market trends that are based on current market conditions constitute our judgment and are subject to change without notice. The views and strategies described may not be suitable for all investors. References to specific securities, asset classes and financial markets are for illustrative purposes only and are not intended to be, and should not be interpreted as, recommendations.
ANNUALIZED RETURN: SINCE INCEPTION (5/1/02) THROUGH 10/31/19
Performance data quoted represents past performance, which is no guarantee of future results. Current performance may be lower or higher than the performance quoted.
The principal value and investment return of an investment will fluctuate so that your shares, when redeemed, may be worth more or less than their original cost. You can obtain performance data current to the most recent month end by visiting www.calamos.com. Average annual total return measures net investment income and capital gain or loss from portfolio investments as an annualized average. All performance shown assumes reinvestment of dividends and capital gains distributions. Performance is for the Fund’s Class I shares at net asset value. The Fund also offers Class A and Class C shares, the performance of which may vary. Source: Morningstar, Inc.
The performance shown for periods prior to April 6, 2016 is the performance of a predecessor investment vehicle (the “Predecessor Fund”). The Predecessor Fund was reorganized into the Fund on April 6, 2016, the date upon which the Fund commenced operations. On October 1, 2015, the parent company of Calamos Advisors, purchased Phineus Partners LP, the prior investment adviser to the Predecessor Fund (“Phineus”), and Calamos Advisors served as the Predecessor Fund’s investment adviser between October 1, 2015 until it was reorganized into the Fund. Phineus and Calamos Advisors managed the Predecessor Fund using investment policies, objectives, guidelines and restrictions that were in all material respects equivalent to those of the Fund. Phineus and Calamos Advisors managed the Predecessor Fund in this manner either directly or indirectly by investing all of the Predecessor Fund’s assets in a master fund structure. The Predecessor Fund performance information has been adjusted to reflect Class A, Class C and Class I shares, expenses. However, the Predecessor Fund was not a registered mutual fund and thus was not subject to the same investment and tax restrictions as the Fund. If it had been, the Predecessor Fund’s performance may have been lower.
| * | Annual returns for Class I shares are provided because Class I shares represent the largest percentage of assets in the Calamos Family of Funds. |
Calamos Phineus Long/Short Fund
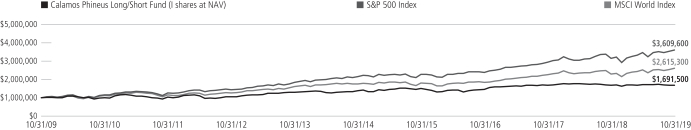
GROWTH OF $1,000,000: FOR THE 10-YEAR PERIOD ENDED 10/31/19
AVERAGE ANNUAL TOTAL RETURN† AS OF 10/31/19
| | | | | | | | | | | | | | | |
| | | 1
YEAR | | 5
YEAR | | 10 YEARS |
Class A Shares (With Predecessor) – Inception 5/1/2002 | | | | | | | | | | | | | | | |
Without Sales Charge | | | | -0.45 | % | | | | 3.74 | % | | | | 5.12 | % |
With Sales Charge | | | | -5.21 | | | | | 2.73 | | | | | 4.61 | |
Class C Shares (With Predecessor) – Inception 5/1/2002 | | | | | | | | | | | | | | | |
Without Sales Charge | | | | -1.15 | | | | | 2.98 | | | | | 4.35 | |
With Sales Charge | | | | -2.10 | | | | | 2.98 | | | | | 4.35 | |
Class I Shares (With Predecessor) – Inception 5/1/2002 | | | | -0.16 | | | | | 4.02 | | | | | 5.40 | |
Performance data quoted represents past performance, which is no guarantee of future results. Current performance may be lower or higher than the performance quoted. The principal value and investment return of an investment will fluctuate so that your shares, when redeemed, may be worth more or less than their original cost.
As of the prospectus dated 3/1/19, the Fund’s gross expense ratio for Class A shares is 2.32%; Class C shares is 3.07% and Class I shares is 2.04%. The expense ratios shown above may differ from the more recent expense ratios reported in the Financial Highlights section of this report.
| † | Average annual total return measures net investment income and capital gain or loss from portfolio investments as an annualized average assuming reinvestment of dividends and capital gains distributions. Performance shown reflects the effects of an expense reimbursement that improved results and was in effect until October 31, 2016. Load-adjusted returns are adjusted for the maximum front-end sales load of 4.75% for Class A shares. Returns for Class C shares have been adjusted for the contingent deferred sales charge (CDSC). |
NOTES:
The graph does not reflect the income taxes that you would pay on fund distributions or the redemption of fund shares. Fund performance includes reinvestment of dividends and adjustment for the maximum sales charge for Class A shares. The performance of other classes will vary from the performance of the class shown based on the difference in sales charges and fees paid by shareholders investing in different share classes.
The S&P 500 Index is an unmanaged index generally considered representative of the U.S. stock market. Source: Lipper, Inc.
The MSCI World Index (U.S. Dollars) is a market-capitalization weighted index composed of companies representative of
the market structure of developed market countries in North America, Europe and the Asia/Pacific region.
Index returns assume reinvestment of dividends and do not reflect deduction of fees and expenses. It is not possible to invest directly in an index.
| | | | |
| 14 | | CALAMOS OPEN-END FAMILY OF FUNDS ANNUAL REPORT | | |
Calamos Convertible Fund
CALAMOS CONVERTIBLE FUND
INVESTMENT TEAM DISCUSSION
How has the Fund performed?
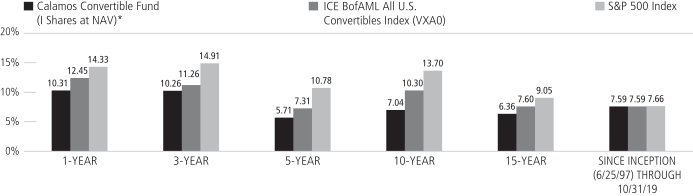
For the12-month period ended October 31, 2019, Calamos Convertible Fund had a positive return of 10.31% (Class I shares at net asset value) versus the ICE BofAML All U.S. Convertibles Index, the Fund’s benchmark, increase of 12.45%. Given our focus on convertibles displaying balanced risk/reward attributes, the Fund was significantly underweight to convertibles displaying the most equity sensitivity, which outperformed during the period. For the same period, the S&P 500 Index gained 14.33%.
Since Class I shares inception on June 25, 1997, the Fund returned 7.59% on an annualized basis compared with an annualized gain of 7.59% for the ICE BofAML All U.S. Convertibles Index and a 7.66% annualized return for the S&P 500 Index.
What factors influenced performance during the reporting period?
Convertibles and equities rose through a market environment characterized by periods of volatility spurred by investor concerns regarding Federal Reserve policy changes, heightened geopolitical risk, the U.S.-China trade dispute, and global growth deceleration. Nevertheless, the markets seemed to shake off such concerns as the Federal Reserve became increasingly dovish and cut interest rates three times during the last four months of the reporting period. As interest rates declined, investors favored equities from defensive sectors over growth sectors, especially defensive areas offering relatively high dividend yields. This was prevalent over the last two months of the reporting period and challenged the convertible market relative to the broader equity market because of the low percentage of convertible assets in these defensive areas.
While the Fund captured 70% of the S&P 500 Index’s 14.33%one-year return, the Fund also demonstrated attractive risk/reward attributes during significant drawdowns. Two market declines exceeded 5% during the reporting period. When the market, as measured by the S&P 500 Index, dropped 14.72% from December 3 to December 24, the Fund’s I shares held up well and declined 7.03% (48% downside participation). When the market declined 5.32% from July 15 to August 24, the Fund I shares declined just 2.18% (representing 41% downside participation).
The Fund did lag the ICE BofAML All U.S. Convertibles Index during the period driven largely by trailing security selection and the cash allocation that we maintain for investing in new opportunities and providing daily liquidity.
Our preference for balanced convertibles led us to be relatively underweight to the most equity sensitive convertibles in the market. Equity-sensitive convertibles as measured by the ICE BofAML Equity Alternative U.S. Convertible Index (VEQU) returned 17.4% and strongly outperformed convertibles with more balanced risk/reward attributes (+14.6%), as measured by the ICE BofAML Total Return U.S. Convertibles Index, and those with the most credit sensitivity (+8.5%), the ICE BofAML Yield Alternative U.S. Convertibles Index.
OVERVIEW
The Fund invests primarily in convertible securities of U.S. companies that are diversified across market sectors and credit quality.
KEY FEATURES
| | ◾ | | Leverages more than four decades of research and experience in convertible security investing. | |
| | ◾ | | Provides diversification across market sectors and credit quality, emphasizing midsize companies with higher-quality balance sheets. | |
| | ◾ | | Seeks to provide upside participation in equity markets with less exposure to downside than an equity-only portfolio over a full market cycle. | |
| | ◾ | | Takes environmental, social and governance (ESG) factors into account, evaluating whether they impact a company’s cash flow, risk profile and long-term returns. | |
PORTFOLIO FIT
When used in conjunction with an equity allocation, the Fund offers a way potentially to manage risk by employing securities that engage in upside equity movements with limited downside participation.
| | |
| FUND NASDAQ SYMBOLS |
| |
A Shares | | CCVIX |
C Shares | | CCVCX |
| |
I Shares | | CICVX |
| |
|
| FUND CUSIP NUMBERS |
| |
A Shares | | 128119401 |
C Shares | | 128119823 |
| |
I Shares | | 128119864 |
| |
Calamos Convertible Fund
| | | | |
| SECTOR WEIGHTINGS | |
| |
Information Technology | | | 37.6 | % |
Health Care | | | 17.4 | |
| |
Communication Services | | | 11.0 | |
Consumer Discretionary | | | 10.1 | |
| |
Financials | | | 8.4 | |
Utilities | | | 5.0 | |
| |
Industrials | | | 3.1 | |
Real Estate | | | 2.6 | |
| |
Energy | | | 0.4 | |
| | | | | |
Asset Allocation weightings are subject to change daily and are calculated as a percentage of net assets. The table excludes cash or cash equivalents, any government/sovereign bonds or broad based index hedging securities the Fund may hold.
Economic Sector Contributors
Energy. Security selection in the energy sector provided support to performance. Energy was the worst-performing sector in the convertible market during the period and our selection within the oil & gas exploration and oil & gas equipment & services industries held up much better than names in the benchmark index.
Consumer Staples.A lack of participation in the consumer staples sector also lifted portfolio results. The sector is relatively small within the U.S. convertible market (just 1.2% of the index on average during the reporting period) and securities in the sector lagged.
Economic Sector Detractors
Information Technology. Security selection within the information technology sector held back return, as portfolio holdings within the semiconductors, semiconductor equipment, and systems software industries lagged.
Consumer Discretionary. Security selection in consumer discretionary also detracted from Fund return. Portfolio holdings in automobile manufacturers notably underperformed.
How is the fund positioned?
From a sector standpoint, the fund’s largest absolute weights are within information technology and health care where we believe thematic tailwinds coupled with solid demand promote outperformance. The smallest weights are in energy, materials and consumer staples. We have been selective to cyclical areas given deteriorating economic data and their policy dependent outcome. We maintain relative overweight positions in the application software and health care equipment industries. Relative to the convertible index, the fund holds underweight allocations to financials and real estate, with mortgage REITs (financials) and specialized REITs (real estate) among the underweight industries. We continue to actively manage the portfolio and remain selective within the most equity-sensitive portion of the market, while allocating the majority of capital to the balanced portion where we see the optimal risk/reward tradeoff. Balanced convertible structures also help protect against shorter-term uncertainty.
What are your closing thoughts for Fund shareholders?
Volatility in the financial markets is likely to continue driven by geopolitical headlines, the outlook for global growth, central bank policies and the upcoming U.S. election. We continue to view convertibles as an attractive way to manage through the risk with lower volatility and shallower drawdowns. The resurgence of new convertible issuance has demonstrated that the convertible market continues to be a preferred source for accessing capital for growth companies. While we are monitoring the recent market rotations between growth and value, the accompanying volatility can provide compellingbottom-up opportunities in select companies, which can outperform regardless of the economic cycle.
Opinions, estimates, forecasts, and statements of financial market trends that are based on current market conditions constitute our judgment and are subject to change without notice. The views and strategies described may not be suitable for all investors. References to specific securities, asset classes and financial markets are for illustrative purposes only and are not intended to be, and should not be interpreted as, recommendations.
| | | | |
| 16 | | CALAMOS OPEN-END FAMILY OF FUNDS ANNUAL REPORT | | |
Calamos Convertible Fund
ANNUALIZED RETURN: SINCE INCEPTION (6/25/97) THROUGH 10/31/19
Performance data quoted represents past performance, which is no guarantee of future results. Current performance may be lower or higher than the performance quoted.
The principal value and investment return of an investment will fluctuate so that your shares, when redeemed, may be worth more or less than their original cost. You can obtain performance data current to the most recent month end by visiting www.calamos.com. Average annual total return measures net investment income and capital gain or loss from portfolio investments as an annualized average. All performance shown assumes reinvestment of dividends and capital gains distributions. Performance is for the Fund’s Class I shares at net asset value. The Fund also offers Class A and Class C shares, the performance of which may vary. Source: State Street Corporation, Lipper, Inc., and Mellon Analytical Solutions, LLC.
| * | Annual returns for Class I shares are provided because Class I shares represent the largest percentage of assets in the Calamos Family of Funds. |
Calamos Convertible Fund
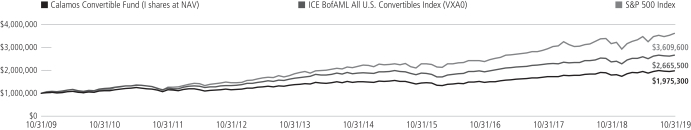
GROWTH OF $1,000,000: FOR THE 10-YEAR PERIOD ENDED 10/31/19
AVERAGE ANNUAL TOTAL RETURN† AS OF 10/31/19
| | | | | | | | | | | | | | | |
| | | 1
YEAR | | 5
YEARS | | 10 YEARS |
Class A Shares – Inception 6/21/85 | | | | | | | | | | | | | | | |
Without Sales Charge | | | | 10.02 | % | | | | 5.44 | % | | | | 6.77 | % |
With Sales Charge | | | | 7.52 | | | | | 4.41 | | | | | 6.25 | |
Class C Shares – Inception 7/5/96 | | | | | | | | | | | | | | | |
Without Sales Charge | | | | 9.21 | | | | | 4.66 | | | | | 5.97 | |
With Sales Charge | | | | 8.25 | | | | | 4.66 | | | | | 5.97 | |
Class I Shares – Inception 6/25/97 | | | | 10.31 | | | | | 5.71 | | | | | 7.04 | |
Performance data quoted represents past performance, which is no guarantee of future results. Current performance may be lower or higher than the performance quoted. The principal value and investment return of an investment will fluctuate so that your shares, when redeemed, may be worth more or less than their original cost.
As of the prospectus dated 3/1/19, the Fund’s gross expense ratio for Class A shares is 1.17%; Class C is 1.92% and Class I is 0.92%. The expense ratios shown above may differ from the more recent expense ratios reported in the Financial Highlights section of this report.
| † | Average annual total return measures net investment income and capital gain or loss from portfolio investments as an annualized average assuming reinvestment of dividends and capital gains distributions. Load-adjusted returns are adjusted for the maximum front-end sales load of 2.25% for Class A shares and returns for Class C shares have been adjusted for the contingent deferred sales charge (CDSC). |
NOTES:
The graphs do not reflect the income of taxes that you would pay on fund distributions or the redemption of fund shares. Fund performance includes reinvestment of dividends and adjustment for the maximum sales charge for Class A shares. The performance of other classes will vary from the performance of the class shown based on the difference in sales charges and fees paid by shareholders investing in different share classes.
The ICE BofAML All U.S. Convertibles Index is comprised of approximately 700 issues of only convertible bonds and preferreds of all qualities. Since inception data for the index is shown from 6/30/97, since data is only available for full monthly periods. Source: Lipper, Inc.
The S&P 500 Index is an unmanaged index generally considered representative of the U.S. stock market.
Due to their structural complexities, the attributes of convertibles may vary. Therefore, they are typically categorized as Yield Alternatives represented by the U.S. CV Index (VYLD), Total Return Alternatives represented by the U.S. CV Index (VTOT), or Equity Alternatives represented by the U.S. CV Index (VEQU).
The ICE BofAML Total Return U.S. Convertibles Index is a subset of ICE BofAML All U.S. Convertibles Index including securities with a delta greater than or equal to 0.4 and less than 0.8 (VTOT).
The ICE BofAML Yield Alternative U.S. Convertibles Index (VYLD) is a subset of ICE BofAML All U.S. Convertibles Index including securities with a delta less than 0.4 (exhibiting bond-like characteristics).
The ICE BofAML Equity Alternative U.S. Convertibles Index (VEQU) is a subset of ICE BofAML All U.S. Convertibles Index including securities with a delta of 0.8 and greater (exhibiting stock-like characteristics).
Index returns assume reinvestment of dividends and do not reflect deduction of fees and expenses. It is not possible to invest directly in an index.
| | | | |
| 18 | | CALAMOS OPEN-END FAMILY OF FUNDS ANNUAL REPORT | | |
Calamos Global Convertible Fund
CALAMOS GLOBAL CONVERTIBLE FUND
INVESTMENT TEAM DISCUSSION
How has the Fund performed?
For the12-month period ended October 31, 2019, Calamos Global Convertible Fund returned 8.09% (Class I shares at net asset value) versus the Thomson Reuters Global Convertible Bond Index return of 9.44%. We believe balanced convertibles offer the most attractive investment opportunity, given their combination of upside potential and downside protection. This approach led us to underweight the most equity-sensitive and credit-sensitive convertibles in favor of those with balanced risk/reward attributes. Although this tack held back relative return during the period, we believe the Fund’s longer-term performance affirms this strategy. Since its inception on December 31, 2014, the Fund increased 5.06% (Class I shares at net asset value) annualized versus a 4.38% gain for the Thomson Reuters Global Convertible Bond Index.
What factors influenced performance during the reporting period?
Convertibles and equities rose through a market environment characterized by periods of volatility spurred by investor concerns regarding Federal Reserve policy changes, heightened geopolitical risk, the U.S.-China trade dispute, and global growth deceleration. Nevertheless, the markets seemed to shake off such concerns as the Federal Reserve became increasingly dovish and cut interest rates three times during the last four months of the reporting period. As interest rates declined, investors favored equities from defensive sectors over growth sectors, especially defensive areas offering relatively high dividend yields. This was prevalent over the last two months of the reporting period and challenged the convertible market relative to the broader equity market because of the low percentage of convertible assets in these defensive areas.
The reporting period saw three greater than 4% declines in the MSCI World index, representing the developed market, during the reporting period before bouncing back each time. From November 10 to December 20, 2018, the MSCI World Index fell 9.5%. From May 5 to May 29, the index fell 4.9%. And from July 24 to August 25, the index fell 5.0%. While the Fund captured 59% of the MSCI World Index’s 13.35%one-year return, the Fund averaged just 36% downside during the above-mentioned period declines.
The volatile market environment was most conducive to global convertibles with balanced risk/reward characteristics. These convertibles rose 14.8% on average and outperformed those with the most credit sensitivity (+6.3%) and the most equity sensitivity (+11.0%), based on delta1 ranges within the benchmark index. Our approach led us to underweight the most equity-sensitive and credit-sensitive convertibles in favor of those with balanced risk/reward attributes and this tack somewhat hindered the Fund’s relative performance during the period.
Economic Sector Contributors
Health Care.An underweight allocation and security selection in the sector boosted performance during the period. The portfolio benefited from strong relative performance in the life sciences tools & services and health care equipment industries. The portfolio also held a relatively light allocation to the underperforming biotechnology industry.
| 1 | Delta is the ratio of the change in price of a convertible to the change in price of the underlying stock. |
OVERVIEW
The Fund invests in global convertible securities, striving to balance risk/reward while providing growth and income.
KEY FEATURES
| | ◾ | | Provides broadly diversified exposure to the global convertible bond universe. | |
| | ◾ | | Leverages more than 40 years of research in convertible security investing. | |
| | ◾ | | Seeks to provide upside participation in equity markets with less exposure to downside than an equity-only portfolio over a full market cycle. | |
| | ◾ | | Blends global investment themes and fundamental research via active management. | |
| | ◾ | | Takes environmental, social and governance (ESG) factors into account, evaluating whether they impact a company’s cash flow, risk profile and long-term returns. | |
PORTFOLIO FIT
Consisting of convertible securities that can participate in upside equity movements with potentially limited downside exposure, the Fund can provide a means to manage risk in conjunction with an equity allocation. The Fund can also serve a role within a fixed income allocation, as convertibles have performed well during periods of rising interest rates and inflation.
| | |
| FUND NASDAQ SYMBOLS |
| |
A Shares | | CAGCX |
C Shares | | CCGCX |
| |
I Shares | | CXGCX |
| |
|
| FUND CUSIP NUMBERS |
| |
A Shares | | 128120748 |
C Shares | | 128120730 |
| |
I Shares | | 128120722 |
| |
Calamos Global Convertible Fund
| | | | |
| SECTOR WEIGHTINGS | | | |
| |
Information Technology | | | 27.3 | % |
Financials | | | 12.7 | |
| |
Communication Services | | | 10.3 | |
Consumer Discretionary | | | 10.0 | |
| |
Health Care | | | 8.0 | |
Energy | | | 4.5 | |
| |
Industrials | | | 3.8 | |
Materials | | | 3.7 | |
| |
Consumer Staples | | | 3.2 | |
Real Estate | | | 3.1 | |
| |
Utilities | | | 2.8 | |
| | | | | |
Sector weightings are subject to change daily and are calculated as a percentage of net assets. The table excludes cash or cash equivalents, any government/sovereign bonds or broad based index hedging securities the Fund may hold.
Information Technology. An overweight allocation and security selection in information technology was also supportive to period results. Selection in application software outperformed, and the portfolio benefited from a relatively heavy weight to the strong-performing internet services & infrastructure industry.
Economic Sector Detractors
Consumer Discretionary. Security selection in consumer discretionary detracted from the Fund’s period return. Holdings in the automobile manufacturers and the apparel, accessories & luxury goods industries lagged.
Real Estate. Security selection in real estate also hindered the12-month result. The portfolio held a relatively heavy allocation to the underperforming real estate operating companies industry and selection in this area was also disappointing.
Geographic Influences
Regionally, the best performance within the Thomson Reuters Global Convertible Bond Index occurred in Emerging Europe & South Africa, the U.S. and Emerging Latin America. Canada, Europe and Japan saw lackluster period results. A heavier positioning and security selection within the U.S. added value, as did an underweight allocation to Europe and security selection in Emerging Asia. Conversely, an underweight allocation and selection in emerging Latin America held back the period result.
How is the Fund positioned?
The volatility that arose during the period provided opportunities to rebalance the portfolio. We were able to reduce convertibles that had become overly equity sensitive with convertibles offering improved risk/reward attributes. We continue to believe that balanced convertibles offer the most attractive opportunity, given their combination of upside potential and downside protection, and have positioned the portfolio accordingly.
From a sector standpoint, information technology and communication services represent the largest weights, while utilities and industrials represent the smallest weights. Within the information technology sector, we are seeing the best opportunities in application software (especially cloud-based technologies) as well as semiconductors. In communication services, we have favored companies specializing in interactive media and cable and satellite. In industrials, we have utilized synthetic convertible structures in aerospace where we have partnered LEAPs with U.S. Treasury notes. Consumer staples represents a very small allocation within the convertible market. Relative to the Thomson Reuters Global Convertible Bond Index, the largest overweight allocations are information technology and financials, while industrials and health care represent the most significant underweights.
From a regional standpoint, the Fund’s largest allocations are assigned to the U.S. and Europe. Conversely, EMEA and Canada represent the smallest absolute weights. Relative to the Thomson Reuters Global Convertible Bond Index, the portfolio has an overweight allocation in the U.S., while the Fund has underweight stances in Europe and Japan.
| | | | |
| 20 | | CALAMOS OPEN-END FAMILY OF FUNDS ANNUAL REPORT | | |
Calamos Global Convertible Fund
What are your closing thoughts for Fund shareholders?
Looking forward, we expect volatility in financial markets to continue, driven by geopolitical headlines, the outlook for global growth, central bank policies and upcoming elections. The latter stages of the economic cycle can provide meaningful opportunities for return, and we see convertibles as an attractive way to manage through the volatility. As witnessed by the resurgence of new convertible issuance, the convertible market continues to be a preferred source of capital for growth companies. We are monitoring the recent market rotations between growth and value but see the expected market volatility as providing compellingbottom-up opportunities in select companies that can outperform regardless of the economic cycle. We continue to use market volatility to actively manage the portfolio and rebalance risk with the objective of optimizing for upside participation with principal protection. We favor investments in companies with earnings growth catalysts, solid cash flow generation and healthy balance sheets. Our active, risk-managed investment approach and long-term perspective positions us to take advantage of the volatility and opportunities in global markets.
Opinions, estimates, forecasts, and statements of financial market trends that are based on current market conditions constitute our judgment and are subject to change without notice. The views and strategies described may not be suitable for all investors. References to specific securities, asset classes and financial markets are for illustrative purposes only and are not intended to be, and should not be interpreted as, recommendations.
Calamos Global Convertible Fund
GROWTH OF $1,000,000: SINCE INCEPTION (12/31/14) THROUGH 10/31/19
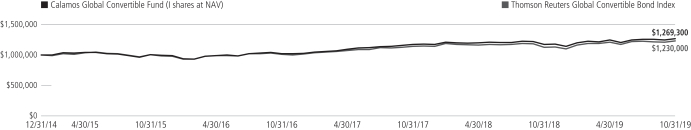
AVERAGE ANNUAL TOTAL RETURN† AS OF 10/31/19
| | | | | | | | | | |
| | | 1
YEAR | | SINCE
INCEPTION |
Class A Shares – Inception 12/31/2014 | | | | | | | | | | |
Without Sales Charge | | | | 7.90 | % | | | | 4.79 | % |
With Sales Charge | | | | 5.47 | | | | | 3.74 | |
Class C Shares – Inception 12/31/2014 | | | | | | | | | | |
Without Sales Charge | | | | 7.01 | | | | | 4.01 | |
With Sales Charge | | | | 6.01 | | | | | 4.01 | |
Class I Shares – Inception 12/31/2014 | | | | 8.09 | | | | | 5.06 | |
Performance data quoted represents past performance, which is no guarantee of future results. Current performance may be lower or higher than the performance quoted. The principal value and investment return of an investment will fluctuate so that your shares, when redeemed, may be worth more or less than their original cost.
As of the prospectus dated 3/1/19, the Fund’s gross expense ratio for Class A shares is 1.36%; Class C is 2.11% and Class I is 1.11%. The expense ratios shown above may differ from the more recent expense ratios reported in the Financial Highlights section of this report.
| † | Average annual total return measures net investment income and capital gain or loss from portfolio investments as an annualized average assuming reinvestment of dividends and capital gains distributions. Performance shown includes the effects of an expense reimbursement that improved results and was in effect until October 31, 2017. Load-adjusted returns are adjusted for the maximum frontend sales load of 2.25% for Class A shares and returns for Class C shares have been adjusted for the contingent deferred sales charge (CDSC). |
NOTES:
The Thomson Reuters Global Convertible Bond Index (USD) is designed to represent the global convertible market.
Unmanaged index returns assume reinvestment of any and all distributions and, unlike fund returns, do not reflect fees, expenses or sales charges. Investors cannot invest directly in an index.
The Fund’s use of derivative instruments involves investment risks and transaction costs to which the Fund would not be subject absent the use of these instruments and, accordingly, may result in losses greater than if they had not been used. Derivative instruments can be illiquid, may disproportionately increase losses and may have a potentially large impact on Fund performance.
| | | | |
| 22 | | CALAMOS OPEN-END FAMILY OF FUNDS ANNUAL REPORT | | |
Calamos Timpani Small Cap Growth Fund
CALAMOS TIMPANI SMALL CAP GROWTH FUND
INVESTMENT TEAM DISCUSSION
How has the Fund performed?
For the 12-month period ended October 31, 2019, Calamos Timpani Small Cap Growth Fund gained 0.78% (Class I Shares at net asset value), underperforming the Russell 2000 Growth Index return of 6.40%.
The Fund’s performance was affected by a combination of security selection and sector positioning during a rapid market rotation that occurred near the end of the reporting period.
Since Class I shares inception on March 23, 2011, the Fund has returned 11.22% on an annualized basis, while the Russell 2000 Growth Index returned 10.32% over the same period. We believe these comparisons demonstrate the Fund’s ability to outdistance its benchmark over full market cycles.
What factors influenced performance over the period?
Market performance over the full reporting period was in a word “erratic,” with rotations in leadership testing investors. The small-cap universe technically experienced a bear market in the fourth quarter of 2018, with the Russell 2000 Growth Index plummeting -20.73% from November 7 through December 24. As with the broad market, the small-cap growth market raced back, gaining 29.26% from December 24 through March 1, 2019.
From the beginning of the reporting period through August 2019, the Fund had been outperforming the Russell 2000 Growth Index. However, the Fund’s relative performance was acutely affected by a sharp and sudden rotation away from higher priced, higher growth stocks toward cyclical and cheap stocks that began in late August 2019. Several measures of this change from previous winners toward cheap and cyclical stocks have calculated a seven standard deviation1 move in late August/early September.
Here is another way to look at the change in investor sentiment. While growth stocks beat value stocks over the full course of the reporting period, value stocks strongly led for the final three months. The Russell 2000 Value Index gained 1.67%, beating the Russell 2000 Growth Index by 407 basis points, as it declined -2.40% for the three months ended October 31, 2019.
Detailed attribution analysis of the portfolio suggests stock selection drove most of the relative underperformance, while sector allocation was a more modest detractor during the period. The Fund has been underweight industrials, preferring higher, secular growth businesses rather than more cyclical growth. Selection within the industrials sector was a drag on relative performance, with weakness in industrial machinery and electrical components hindering performance. The Fund’s underweight detracted as industrials surged when the market turned more confident in a global growth recovery. Selection within the health care sector was a drag on relative performance, with two positions mostly weighing down performance. Ligand Pharmaceuticals (biotechnology) and Inogen (health care equipment) both disappointed and have been sold out of the portfolio. The Fund transitioned from an overweight to an underweight during the reporting period, but the overweight earlier in the period was a negative to relative performance.
| 1 | Standard Deviation is a measure of volatility. |
OVERVIEW
The fund invests in the equity securities of small-capitalization companies with high, sustainable growth potential, which may exceed market expectations.
KEY FEATURES
| | ◾ | | Combines fundamental research with the analysis of market estimates to identify the underestimated growth differential between a company’s business strength and market expectations of that strength. | |
| | ◾ | | Pursues active management in a less followed investment space. | |
| | ◾ | | Analyzes secular trends to uncover exploitable investment opportunities specific to small-cap companies. | |
PORTFOLIO FIT
Investing in small-cap companies is an important component of a diversified investment strategy. Smaller companies tend to experience greater growth and outperform larger companies.
| | |
| FUND NASDAQ SYMBOLS |
| |
A Shares | | CTASX |
I Shares | | CTSIX |
| |
R6 Shares | | CTSOX |
| |
|
| FUND CUSIP NUMBERS |
| |
A Shares | | 128120417 |
I Shares | | 128120391 |
| |
R6 Shares | | 128120383 |
| |
Calamos Timpani Small Cap Growth Fund
| | | | |
| SECTOR WEIGHTINGS | | | |
| |
Information Technology | | | 25.4 | % |
Health Care | | | 22.9 | |
| |
Consumer Discretionary | | | 21.3 | |
Industrials | | | 11.2 | |
| |
Financials | | | 5.4 | |
Energy | | | 3.9 | |
| |
Consumer Staples | | | 1.8 | |
Communication Services | | | 1.6 | |
| |
Materials | | | 0.8 | |
Real Estate | | | 0.7 | |
| |
Utilities | | | 0.6 | |
| | | | | |
Asset Allocation weightings are subject to change daily and are calculated as a percentage of net assets. The table excludes cash or cash equivalents, any government/sovereign bonds or broad based index hedging securities the Fund may hold.
The Fund’s strong selection in energy was additive to relative performance, as names in oil & gas refining and marketing strongly outperformed. The portfolio’s energy holdings in aggregate gained over 20% for the period, while the sector retreated -38% in the index. Selection within financials, along with an underweight to the sector, added to performance as well. Strong selection within insurance brokers and well-timed investments in consumer finance were significant winners. Overall sector performance strongly outperformed that of the index, gaining 21% compared to the index’s 4% sector gain.
How is the Fund positioned?
At period end, the Fund maintained overweights to higher growth sectors such as information technology and consumer discretionary, while the most significant underweights remain in industrials and real estate. The Fund’s investment in health care was reduced significantly during the period as the sector came under pressure. Along with struggles amongst higher growth names, litigation and political risks have dogged the sector. We added to energy investments on weakness that makes their risk/reward profiles more attractive.
We are not in the camp that a recession is imminent, nor are we of the opinion that global growth is set to accelerate higher. The recent change in market opinion that deflation is no longer a risk has punished long-duration assets such as high-growth businesses whose value comes from future cash flows and growth. This has hurt businesses that in our opinion are fundamentally sound and offer better growth dynamics, which tend to be the driver of business value. While these changes in investor sentiment can be painful in the short term, we are confident that our long-term approach to evaluating businesses and stock potential will work out. We have been a bit more conscious toward valuation in light of market sentiment, but have not abandoned our focus on sustainable and underestimated growth opportunities.
What closing thoughts do you have for Fund shareholders?
Markets have exhibited more volatility of late, highlighting investors’ concerns regarding the future impact of political upheaval on certain economic areas. While we do not see recession as the logical next step for the U.S. economy, we believe market sentiment may be more on edge today. However, we also continue to believe there are ample opportunities to realize strong absolute and relative performance. Therefore, we continue to focus portfolio investments in areas where we see strength, and a major guidepost points to the U.S. consumer, who is enjoying strong employment, gains in household net worth, and favorable debt-coverage ratios. We have experienced rapid swings in investor sentiment many times throughout our tenure as small-cap growth investors. We believe that fundamental strength wins in the long term and the most recent downward re-rating of fundamentally strong small-cap growth businesses may create a better opportunity going forward.
Opinions, estimates, forecasts, and statements of financial market trends that are based on current market conditions constitute our judgment and are subject to change without notice. The views and strategies described may not be suitable for all investors. References to specific securities, asset classes and financial markets are for illustrative purposes only and are not intended to be, and should not be interpreted as, recommendations.
| | | | |
| 24 | | CALAMOS OPEN-END FAMILY OF FUNDS ANNUAL REPORT | | |
Calamos Timpani Small Cap Growth Fund
GROWTH OF $1,000,000: SINCE INCEPTION THROUGH 10/31/19
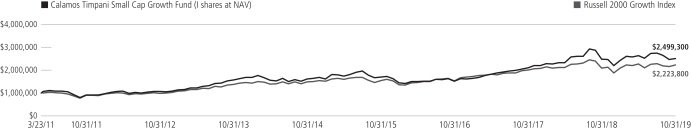
AVERAGE ANNUAL TOTAL RETURN† AS OF 10/31/19
| | | | | | | | | | | | | | | |
| | | 1
YEAR | | 5
YEAR | | SINCE INCEPTION |
Class A Shares (With Predecessor) – Inception 1/6/2014 | | | | | | | | | | | | | | | |
Without Sales Charge | | | | 0.44 | % | | | | 8.76 | % | | | | 6.77 | % |
With Sales Charge | | | | -4.34 | | | | | 7.71 | | | | | 5.87 | |
Class I Shares (With Predecessor) – Inception 3/23/2011 | | | | | | | | | | | | | | | |
Without Sales Charge | | | | 0.78 | | | | | 9.17 | | | | | 11.22 | |
With Sales Charge | | | | 0.78 | | | | | 9.17 | | | | | 11.22 | |
Class R6 Shares – Inception 6/1/2019 | | | | | | | | | | | | | | -0.70 | |
Performance data quoted represents past performance, which is no guarantee of future results. Current performance may be lower or higher than the performance quoted. The principal value and investment return of an investment will fluctuate so that your shares, when redeemed, may be worth more or less than their original cost.
As of the prospectus dated 4/15/19 as supplemented 5/31/19, the Fund’s gross expense ratio for Class A shares is 1.47%, Class I shares is 1.22% and Class R6 shares is 1.12%. The Fund’s investment advisor has contractually agreed to reimburse Fund expenses through March 1, 2022, to the extent necessary so that Total Annual Fund Operating Expenses of Class A shares and Class I shares are limited to 1.30% and 1.05% of average net assets, respectively. The Fund’s investment advisor has contractually agreed to limit the Fund’s annual ordinary operating expenses for Class R6 shares (as a percentage of average net assets) to 1.05% less the Fund’s annual sub-transfer agency ratio (the aggregate sub-transfer agency fees of the Fund’s other share classes divided by the aggregate average annual net assets of the Fund’s other share classes). For purposes of these expense limitations, operating expenses do not include taxes, interest, short interest, short dividend expenses, brokerage commissions, acquired fund fees and expenses, and extraordinary expenses, if any. Calamos Advisors may recapture previously waived expense amounts within the same fiscal year for any day where the respective share class’s expense ratio falls below the contractual expense limit up to the expense limit for that day. This undertaking is binding on Calamos Advisors and any of its successors and assigns. This agreement is not terminable by either party. The expense ratios shown above may differ from the more recent expense ratios reported in the Financial Highlight section of this report.
| † | Average annual total return measures net investment income and capital gain or loss from portfolio investments as an annualized average assuming reinvestment of dividends and capital gains distributions. Load-adjusted returns are adjusted for the maximumfront-end sales load of 4.75% for Class A shares. |
NOTES:
Effective as of the close of business on May 31, 2019, the Fund acquired all of the assets, subject to the liabilities, of the Timpani Small Cap Growth Fund (the “Predecessor Fund”) through a tax-free reorganization (the “Reorganization”). Pursuant to the Reorganization of the Predecessor Fund into the Fund, Class Y shareholders of the Predecessor Fund received Class A shares of the Fund, and Service Class and Institutional Class shareholders of the Predecessor Fund each received Class I shares of the Fund. As a result of the Reorganization, the Fund adopted the performance and financial history of the Predecessor Fund. Accordingly, the performance shown in the average annual total return table above for periods prior to the commencement of the Fund’s operations on June 1, 2019 is the performance of the Predecessor Fund. The Fund has the same investment objective, strategy and portfolio manager as the Predecessor Fund. As a result, the performance of the Fund would have been substantially similar to that of the Predecessor Fund.
The graphs do not reflect the income taxes that you would pay on fund distributions or the redemption of fund shares. Fund performance includes reinvestment of dividends and adjustment for the maximum sales charge for Class A shares. The performance of other classes will vary from the performance of the class shown based on the difference in sales charges and fees paid by shareholders investing in different share classes.
The Russell 2000 Growth Index is a composite of small cap companies located in the U.S. that also exhibit a growth probability.
Index returns assume reinvestment of dividends and do not reflect deduction of fees and expenses. It is not possible to invest directly in an index.
Calamos Timpani SMID Growth Fund
OVERVIEW
The fund invests in the equity securities of small- and mid-capitalization (SMID) companies with high, sustainable growth potential, which may exceed market expectations.
KEY FEATURES
| | ◾ | | Combines fundamental research with the analysis of market estimates to identify the underestimated growth differential between a company’s business strength and market expectations of that strength. | |
| | ◾ | | Pursues active management in a less followed investment space. | |
| | ◾ | | Analyzes secular trends to uncover exploitable investment opportunities specific to small- andmid-cap companies. | |
PORTFOLIO FIT
Investing in SMID companies is an important component of a diversified investment strategy.Small-to-midsize companies tend to experience greater growth and outperform larger companies.
| | |
| FUND NASDAQ SYMBOLS |
| |
A Shares | | CTAGX |
I Shares | | CTIGX |
| |
R6 Shares | | CTOGX |
| |
|
| FUND CUSIP NUMBERS |
| |
A Shares | | 128120375 |
I Shares | | 128120367 |
| |
R6 Shares | | 128120359 |
| |
CALAMOS TIMPANI SMID GROWTH FUND
INVESTMENT TEAM DISCUSSION
How has the Fund performed?
For the three-month period ended October 31, 2019, Calamos Timpani SMID Growth Fund declined -9.80% (Class I Shares at net asset value), underperforming the Russell 2500 Growth Index return of -2.22%.
The Fund’s performance was affected by a combination of security selection and sector positioning during a rapid market rotation that began around the time of the Fund’s launch, encompassing the brief reporting period.
What factors influenced performance over the period?
Market performance for this brief window can be characterized as a sharp and dramatic rotation away from higher growth, longer-duration assets toward yield and cyclical investments.
The Fund’s relative performance was acutely affected by a sharp and sudden rotation away from higher priced, higher-growth stocks toward lower volatility and cheap stocks that began in late August 2019. Several measures of this change from previous winners toward cheap and low-vol stocks calculated a seven standard deviation1 move in late August/early September.
Here is another way to look at the change in investor sentiment. While growth stocks beat value stocks over the trailing 12-months, value stocks strongly led for the past three months. The Russell 2500 Value Index2 gained 0.92%, beating the Russell 2500 Growth Index by 314 basis points, as it declined -2.22% for the three months ended October 31.
Detailed attribution analysis of the portfolio suggests stock selection drove most of the relative underperformance, while sector allocation was a modest detractor during the period.
The Fund’s selection within the information technology sector was a significant drag on performance as the sector held many of the long-duration3 assets that the market rejected on short notice. Selection within application software and systems software particularly struggled along with growthier industries inside the tech sector. The Fund’s average sector overweight was not helpful. Stock selection within the consumer discretionary sector was a drag on relative performance, as a few high growth names in education services, distributors, and leisure facilities pulled down performance. However, a steady overweight to the consumer discretionary sector was modestly additive to relative performance.
The Fund’s strong selection in energy was beneficial to relative performance, notably in oil & gas refining and marketing. The portfolio’s energy holdings in aggregate gained approximately 4% for the period, while the sector dropped -10% in the index. Selection within financials, along with an underweight to the sector, added to performance as well.
| 1 | Standard Deviation is a measure of volatility. |
| 2 | The Russell 2500 Value Index measures the performance of the small to mid-cap value segment of the U.S. equity universe. It includes those Russell 2500 companies with lower price-to-book ratios and lower forecasted growth values. The Russell 2500 Value Index is published and maintained by FTSE Russell. |
| 3 | Duration provides a measure of the Fund’s interest rate sensitivity. The longer a fund’s duration, the more sensitive it is to shifts in interest rates. |
| | | | |
| 26 | | CALAMOS OPEN-END FAMILY OF FUNDS ANNUAL REPORT | | |
Calamos Timpani SMID Growth Fund
How is the Fund positioned?
At period end, the Fund maintained overweights to higher growth sectors such as information technology and consumer discretionary, while the most significant underweights remain in industrials and real estate. The Fund’s investment in health care was reduced significantly during the period as the sector came under pressure. Along with struggles amongst higher growth names, litigation and political risks have dogged the sector. We added to energy investments on weakness that makes their risk/reward profiles more attractive.
We are not in the camp that a recession is imminent, nor are we of the opinion that global growth is set to accelerate higher. The recent change in market opinion that deflation is no longer a risk has punished long-duration assets such as high-growth businesses whose value comes from future cash flows and growth. This has hurt businesses that in our opinion are fundamentally sound and should offer better growth dynamics, which tend to be the driver of business value. While these changes in investor sentiment can be painful in the short term, we are confident that our long-term approach to evaluating businesses and stock potential will work out. We have been a bit more conscious toward valuation in light of market sentiment, but have not abandoned our focus on sustainable and underestimated growth opportunities.
What closing thoughts do you have for Fund shareholders?
Markets have exhibited more volatility of late, highlighting investors’ concerns regarding the future impact of political upheaval on certain economic areas. While we do not see recession as the logical next step for the U.S. economy, we believe market sentiment may be more on edge today. However, we also continue to believe there are ample opportunities to realize strong absolute and relative performance. Therefore, we continue to focus portfolio investments in areas where we see strength, and a major guidepost points to the U.S. consumer, who is enjoying strong employment, gains in household net worth, and favorable debt-coverage ratios. We have experienced rapid swings in investor sentiment many times throughout our tenure as small-cap growth investors. We believe that fundamental strength wins in the long term and the most recent downward re-rating of fundamentally strong small-cap growth businesses may create a better opportunity going forward.
Opinions, estimates, forecasts, and statements of financial market trends that are based on current market conditions constitute our judgment and are subject to change without notice. The views and strategies described may not be suitable for all investors. References to specific securities, asset classes and financial markets are for illustrative purposes only and are not intended to be, and should not be interpreted as, recommendations.
| | | | |
| SECTOR WEIGHTINGS | |
| |
Information Technology | | | 29.5 | % |
Consumer Discretionary | | | 21.3 | |
| |
Health Care | | | 17.8 | |
Industrials | | | 13.6 | |
| |
Financials | | | 6.8 | |
Energy | | | 3.7 | |
| |
Consumer Staples | | | 1.8 | |
Communication Services | | | 1.0 | |
| |
Materials | | | 0.6 | |
Real Estate | | | 0.6 | |
| |
Utilities | | | 0.5 | |
| | | | | |
Asset Allocation weightings are subject to change daily and are calculated as a percentage of net assets. The table excludes cash or cash equivalents, any government/sovereign bonds or broad based index hedging securities the Fund may hold.
Calamos Timpani SMID Growth Fund
AVERAGE ANNUAL TOTAL RETURN† AS OF 10/31/19
| | | | |
| | | SINCE
INCEPTION | |
Class A Shares – Inception 7/31/2019 | | | | |
Without Sales Charge | | | -9.90 | % |
With Sales Charge | | | -14.19 | |
Class I Shares – Inception 7/31/2019 | | | | |
Without Sales Charge | | | -9.80 | |
With Sales Charge | | | -9.80 | |
Class R6 Shares – Inception 7/31/2019 | | | -9.80 | |
Performance data quoted represents past performance, which is no guarantee of future results. Current performance may be lower or higher than the performance quoted. The principal value and investment return of an investment will fluctuate so that your shares, when redeemed, may be worth more or less than their original cost.
As of the prospectus dated 7/31/19, the Fund’s gross expense ratio for Class A shares is 2.54%; Class I shares is 2.29% and Class R6 shares is 2.28%. The Fund’s investment advisor has contractually agreed to reimburse Fund expenses through March 1, 2022 to the extent necessary so that Total Annual Fund Operating Expenses of Class A shares and Class I shares are limited to 1.35% and 1.10% of average net assets, respectively. The Fund’s investment advisor has contractually agreed to limit the Fund’s annual ordinary operating expenses for Class R6 shares (as a percentage of average net assets) to 1.10% less the Fund’s annual sub-transfer agency ratio (the aggregate sub-transfer agency fees of the Fund’s other share classes divided by the aggregate average annual net assets of the Fund’s other share classes). For purposes of these expense limitations, operating expenses do not include taxes, interest, short interest, short dividend expenses, brokerage commissions, acquired fund fees and expenses, and extraordinary expenses, if any. Calamos Advisors may recapture previously waived expense amounts within the same fiscal year for any day where the respective share class’s expense ratio falls below the contractual expense limit up to the expense limit for that day. This undertaking is binding on Calamos Advisors and any of its successors and assigns. This agreement is not terminable by either party. The expense ratios shown above may differ from the more recent expense ratios reported in the Financial Highlight section of this report.
| † | Average annual total return measures net investment income and capital gain or loss from portfolio investments as an annualized average assuming reinvestment of dividends and capital gains distributions. Load-adjusted returns are adjusted for the maximumfront-end sales load of 4.75% for Class A shares. |
NOTES:
The graphs do not reflect the income taxes that you would pay on fund distributions or the redemption of fund shares. Fund performance includes reinvestment of dividends and adjustment for the maximum sales charge for Class A shares. The performance of other classes will vary from the performance of the class shown based on the difference in sales charges and fees paid by shareholders investing in different share classes.
The Russell 2500 Growth Index measures the performance of the small to mid-cap growth segment of the U.S. equity universe. It includes those Russell 2500 companies with higher growth earning potential. The Russell 2500 Growth Index is published and maintained by FTSE Russell.
Index returns assume reinvestment of dividends and do not reflect deduction of fees and expenses. It is not possible to invest directly in an index.
| | | | |
| 28 | | CALAMOS OPEN-END FAMILY OF FUNDS ANNUAL REPORT | | |
Calamos Growth Fund
CALAMOS GROWTH FUND
INVESTMENT TEAM DISCUSSION
How has the Fund performed?
For the12-month period ended October 31, 2019, Calamos Growth Fund gained 14.24% (Class I Shares at net asset value), outperforming the S&P 1500 Growth Index return of 13.67%. The Fund outperformed through a combination of strong security selection and beneficial sector positioning during an incredibly volatile period for the U.S. and global equity markets.
Since Class I shares inception on September 18, 1997, the Fund has returned 10.86% on an annualized basis. The S&P 1500 Growth Index, the primary benchmark, returned 7.88% over the same period, and the S&P 500 Index returned 7.41%. We believe these comparisons demonstrate the Fund’s ability to outdistance the growth and broad indices over full market cycles.
What factors influenced performance over the period?
Market performance over the full reporting period was in a word “erratic,” with rotations in leadership testing investors. U.S. growth equities declined approximately 15% early in the period through December 24, 2018, yet recovered quickly and found new highs by April 2019. In May 2019 the benchmark saw a 5.4% drop, followed up by a 6.2% comeback in June.
It is notable that investors have shown a preference for cyclical and more value-oriented stocks more recently, resulting in full-period growth and value returns ending in a near draw. The S&P 1500 Growth Index return of 13.67% versus a 13.69% gain for the S&P 1500 Value Index1. The broad market, as measured by the S&P 500 Index, saw a 14.33% gain with a slight preference forlarger-cap names during the period.
Sector leadership decisively rotated toward higher-yielding and cyclical-growth stocks, which are often found in value-oriented sectors. Seven sectors (of eleven) outperformed the S&P 1500 Growth Index 13.67% return: utilities (+30%), real estate (+25%), materials (+23%), information technology (+18%), industrials (+16%), consumer staples (+16%) and consumer discretionary (+15%). Four sectors lagged: communication services (+12%), financials (+12%), health care (+10%) and energy(-22%).
The Fund benefited from strong stock selection within the information technology sector. Fund holdings in application software, data processing and semiconductors all contributed significantly during the period. While underweight on average over the period, the Fund was temporarily overweight information technology on the heels of significant weakness at the end of 2018, and the net contribution from our sector allocation was positive.
The Fund also benefited from selection and its weighting in the industrials sector. The Fund has been selectively positioned in industrials, emphasizing U.S. domestic exposure rather than dependence on overseas economies. Selection was strong and represented an overweight. The aerospace and defense industry was additive, but the Fund also benefited from holdings and trading within the industrial conglomerates industry. The Fund’s overweight was also beneficial, as the sector performed well within the market’s leadership rotation toward cyclical growth.
| 1 | The S&P 1500 Value Index is designed to provide investors with a measure of the performance of U.S. value equities. |
OVERVIEW
The Fund invests in the equities of U.S. companies from a range of market capitalizations that we believe offer the best potential for growth.
KEY FEATURES
| | ◾ | | Utilizes more than two decades of extensive research experience in growth investing. | |
| | ◾ | | Active management focuses on top-down views and bottom-up fundamentals. | |
| | ◾ | | Research-driven approach identifies opportunities by combining top-down analysis with a focus on key growth characteristics. | |
PORTFOLIO FIT
This actively managed Fund seeks to provide attractive returns through its emphasis on higher growth companies primarily in large and mid-cap arenas.
| | |
| FUND NASDAQ SYMBOLS |
| |
A Shares | | CVGRX |
C Shares | | CVGCX |
| |
I Shares | | CGRIX |
| |
|
| FUND CUSIP NUMBERS |
| |
A Shares | | 128119302 |
C Shares | | 128119856 |
| |
I Shares | | 128119807 |
| |
Calamos Growth Fund
| | | | |
| SECTOR WEIGHTINGS | | | |
| |
Information Technology | | | 23.2 | % |
Health Care | | | 15.0 | |
| |
Communication Services | | | 14.7 | |
Consumer Discretionary | | | 13.8 | |
| |
Industrials | | | 13.7 | |
Financials | | | 5.6 | |
| |
Consumer Staples | | | 3.6 | |
Materials | | | 2.6 | |
| |
Energy | | | 1.9 | |
Other | | | 0.6 | |
Asset Allocation weightings are subject to change daily and are calculated as a percentage of net assets. The table excludes cash or cash equivalents, any government/sovereign bonds or broad based index hedging securities the Fund may hold.
Selection within financials, along with an overweight to the sector, detracted from performance. Our view that cheaper valuations, healthy balance sheets and a U.S. consumer focus would benefit select names did not play out over the reporting period; holdings in investment banking and consumer finance were notable detractors. While we still favor high-quality U.S. financials, the Fund’s overweight position has been reduced, and this risk-management decision has been beneficial over the period. An underweight to the real estate sector was a drag to relative performance. In our view, investors’ preference for names within real estate was driven more by the search for yield rather than fundamental growth.
How is the Fund positioned?
At the end of the reporting period, the Fund maintained underweights to the outright defensive sectors such as real estate, utilities and consumer staples. The Fund also remains underweight the struggling energy sector. The Fund has significantly reduced its financials overweight to market weight, paring on strength earlier in 2019. The Fund is selectively overweight industrials, where we see opportunities in aerospace and defense as well as airlines. Notably, the Fund is underweight technology due to concerns around crowded trades and vulnerable market sentiment concerning the longest-duration growth names. Nevertheless, the sector overall has been avalue-add to relative performance for the reporting period.
We do not believe that U.S. recession is imminent, but investors remain acutely sensitive toend-of-cycle vulnerabilities. Monetary policy has been seemingly pushed to its limits, which has long favored the highest-duration growth names. This explains the rising preference for quality, sensitivity to valuation and narrowing breadth. Therefore, we view the early 2019 outperformance of high beta/low quality/high cyclicality as a ‘trade’ rather than the beginning of a sustainable trend. Companies that may offer growth in a lower-growth world should continue to be attractive to investors, but sensitivity to valuation and profitability will be paramount.
What closing thoughts do you have for Fund shareholders?
Markets have exhibited more volatility of late, highlighting investors’ concerns regarding the future impact of political upheaval on certain economic conditions. While we do not see recession as the logical next step for the U.S. economy, we do believe that markets are more fragile today than they have been in recent history. Therefore, we continue to focus portfolio investments in areas where we see strength, and a major guidepost points to the U.S. consumer, who is enjoying strong employment, gains in household net worth, and favorable debt-coverage ratios. In our view, companies that offer attractive growth attributes in alow-growth world remain compelling investment opportunities. In light of more fragile markets, we continue to favor higher-quality and reasonably valued growth businesses at this juncture of the market cycle.
Opinions, estimates, forecasts, and statements of financial market trends that are based on current market conditions constitute our judgment and are subject to change without notice. The views and strategies described may not be suitable for all investors. References to specific securities, asset classes and financial markets are for illustrative purposes only and are not intended to be, and should not be interpreted as, recommendations.
| | | | |
| 30 | | CALAMOS OPEN-END FAMILY OF FUNDS ANNUAL REPORT | | |
Calamos Growth Fund
ANNUALIZED RETURN: SINCE INCEPTION (9/18/97) THROUGH 10/31/19
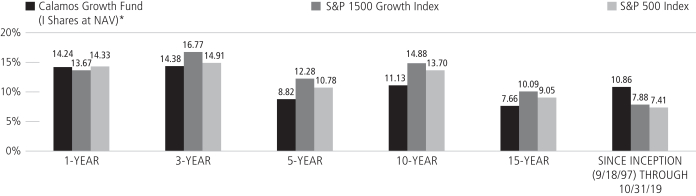
Performance data quoted represents past performance, which is no guarantee of future results. Current performance may be lower or higher than the performance quoted.
The principal value and investment return of an investment will fluctuate so that your shares, when redeemed, may be worth more or less than their original cost. You can obtain performance data current to the most recent month end by visiting www.calamos.com. Average annual total return measures net investment income and capital gain or loss from portfolio investments as an annualized average. All performance shown assumes reinvestment of dividends and capital gains distributions. Performance is for the Fund’s Class I shares at net asset value. The Fund also offers Class A and Class C shares, the performance of which may vary. Source: State Street Corporation and Lipper, Inc.
| * | Annual returns for Class I shares are provided because Class I shares represent the largest percentage of assets in the Calamos Family of Funds. |
Calamos Growth Fund
GROWTH OF $1,000,000: FOR THE 10-YEAR PERIOD ENDED 10/31/19
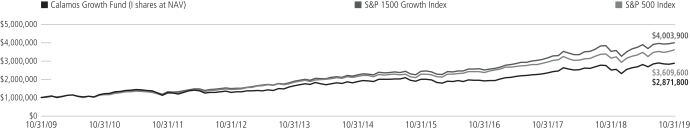
AVERAGE ANNUAL TOTAL RETURN† AS OF 10/31/19
| | | | | | | | | | | | | | | |
| | | 1
YEAR | | 5
YEARS | | 10 YEARS
|
Class A Shares – Inception 9/4/90 | | | | | | | | | | | | | | | |
Without Sales Charge | | | | 13.97 | % | | | | 8.55 | % | | | | 10.85 | % |
With Sales Charge | | | | 8.56 | | | | | 7.50 | | | | | 10.31 | |
Class C Shares – Inception 9/3/96 | | | | | | | | | | | | | | | |
Without Sales Charge | | | | 13.18 | | | | | 7.75 | | | | | 10.03 | |
With Sales Charge | | | | 12.31 | | | | | 7.75 | | | | | 10.03 | |
Class I Shares – Inception 9/18/97 | | | | 14.24 | | | | | 8.82 | | | | | 11.13 | |
Performance data quoted represents past performance, which is no guarantee of future results. Current performance may be lower or higher than the performance quoted. The principal value and investment return of an investment will fluctuate so that your shares, when redeemed, may be worth more or less than their original cost.
As of the prospectus dated 3/1/19, the Fund’s gross expense ratio for Class A shares is 1.29%; Class C is 2.04% and Class I is 1.04%. The expense ratios shown above may differ from the more recent expense ratios reported in the Financial Highlights section of this report.
| † | Average annual total return measures net investment income and capital gain or loss from portfolio investments as an annualized average assuming reinvestment of dividends and capital gains distributions. Performance shown reflects the effects of an expense reimbursement that improved results and was in effect until March 31, 2000. Load-adjusted returns are adjusted for the maximumfront-end sales load of 4.75% for Class A shares and returns for Class C have been adjusted for the contingent deferred sales charge (CDSC). |
NOTES:
The graphs do not reflect the income taxes that you would pay on fund distributions or the redemption of fund shares. Fund performance includes reinvestment of dividends and adjustment for the maximum sales charge for Class A shares. The performance of other classes will vary from the performance of the class shown based on the difference in sales charges and fees paid by shareholders investing in different share classes.
The S&P 1500 Growth Index consists of the growth segment of the securities found in the S&P 1500 Index. The S&P 1500 combines the S&P 500, S&P MidCap 400 and the S&P SmallCap 600.
The S&P 500 Index is an unmanaged index generally considered representative of the U.S. stock market.
Index returns assume reinvestment of dividends and do not reflect deduction of fees and expenses. It is not possible to invest directly in an index.
| | | | |
| 32 | | CALAMOS OPEN-END FAMILY OF FUNDS ANNUAL REPORT | | |
Calamos Growth and Income Fund
CALAMOS GROWTH AND INCOME FUND
INVESTMENT TEAM DISCUSSION
How has the Fund performed?
During the12-month period ended October 31, 2019, Calamos Growth and Income Fund gained 11.81% (Class I Shares at net asset value), capturing 82% of the all equity S&P 500 Index’s 14.33% return. The ICE BofAML All U.S. Convertibles ex Mandatory Index gained 12.39% for the period. We manage the Fund with the goal of achieving upside equity participation and potential downside protection over full market cycles. Since its Class I shares inception on September 18, 1997, the Fund returned 9.40% on an annualized basis versus a 7.41% gain for the S&P 500 Index and 7.61% return for the ICE BofAML All U.S. Convertibles ex Mandatory Index.
Please discuss the Fund’s lower-volatility characteristics.
We believe the Fund’s historical lower-volatility characteristics are a byproduct of our investment style and focus on participating in equity market upside with less volatility than the market as a whole. Beta is one popular statistic for measuring volatility. Beta considers a fund’s historic volatility versus the market, which is assigned a beta of 1.0. A fund with half the volatility of the market would have a beta of 0.5, while a fund with a beta of 2.0 would have been twice as volatile as the market. Since its inception, the Fund has had a beta of 0.73 (Class I shares) versus the S&P 500 Index. The Fund, therefore, outperformed the broader equity market, as measured by the S&P 500 Index, with less volatility than the equity market. Please note that past performance does not indicate future results and that beta is one of many measures of risk.
What factors influenced performance during the reporting period?
Market performance over the full reporting period was in a word “erratic,” with rotations in leadership testing investors. The U.S. equity market declined approximately 15% early in the period through December 24, 2018, yet recovered quickly and found new highs by April 2019. In May 2019 the S&P 500 Index saw a-6.4% drop, followed up by a 7.0% comeback in June. It is notable that investors have shown a preference for higher yielding, cyclically oriented and value stocks more recently, resulting in the full-period growth and value stock returns ending in a near draw. The S&P 500 Value Index’s1 gain of 14.5 slightly edged the S&P 500 Growth Index’s2 return of 14.3%. The Fund is not tied to one particular style of investing, but it is interesting to note a change in leadership and market sentiment as growth has outperformed value for quite some time until this period. In a similar vein, market leadership broadened out during the period. Last year at this time, only three of the S&P 500 Index sectors beat the market for the12-month reporting period: consumer discretionary, information technology and health care. This year, six of the eleven sectors outperformed, led by an eclectic mix of real estate (+27%), utilities (+25%) and information technology (+22%).
For the full reporting period, the well-diversified portfolio was able to provide significant equity market capture by managing risks and outperforming during the sharp pullbacks experienced in December 2018, May 2019 and August 2019. This approach to equity market risk management has been vital to the success of ourlong-term track record.
| 1 | The S&P 500® Pure Value index is a style-concentrated index designed to track the performance of stocks that exhibit the strongest value based on the ratios of book value, earnings, and sales to price. |
| 2 | The S&P 500® Pure Growth index is a style-concentrated index designed to track the performance of stocks that exhibit the strongest growth based on the ratios of book value, earnings, and sales to price. |
OVERVIEW
The Fund invests primarily in U.S. equity and convertible securities in an attempt to balance risk/reward while providing growth and income.
KEY FEATURES
| | ◾ | | Leverages more than four decades of research experience combining equities and convertible holdings to provide equity-like participation. | |
| | ◾ | | Provides a core holding option that aims to maintain a consistent risk posture throughout the market cycle. | |
| | ◾ | | Research-driven approach identifies opportunities by combining top-down analysis with a focus on key growth characteristics. | |
PORTFOLIO FIT
The Fund can provide a long-term core equity allocation, which exhibits potentially lower volatility and delivers attractive income.
| | |
| FUND NASDAQ SYMBOLS |
| |
A Shares | | CVTRX |
C Shares | | CVTCX |
| |
I Shares | | CGIIX |
| |
|
| FUND CUSIP NUMBERS |
| |
A Shares | | 128119104 |
C Shares | | 128119831 |
| |
I Shares | | 128119872 |
| |
Calamos Growth and Income Fund
| | | | |
| SECTOR WEIGHTINGS | | | |
| |
Information Technology | | | 21.8 | % |
Health Care | | | 12.0 | |
| |
Financials | | | 12.0 | |
Communication Services | | | 11.4 | |
| |
Consumer Discretionary | | | 10.2 | |
Industrials | | | 9.5 | |
| |
Consumer Staples | | | 6.5 | |
Utilities | | | 4.0 | |
| |
Energy | | | 3.7 | |
Real Estate | | | 2.7 | |
| |
Other | | | 1.8 | |
Materials | | | 0.9 | |
Asset Allocation weightings are subject to change daily and are calculated as a percentage of net assets. The table excludes cash or cash equivalents, any government/sovereign bonds or broad based index hedging securities the Fund may hold.
Strong issue selection within consumer staples was additive to relative performance. Consumer staples performed well overall within the market, as investors favored perceived quality and lower volatility. However, it was the Fund smartly avoiding disappointments in tobacco and packaged foods that helped contribute to relative performance. The energy sector struggled mightily during the reporting period, and the combination of the Fund’s underweight and better selection within the sector was additive. The Fund utilized convertible securities to access the integrated oil & gas industry as well as equipment services. This strategy helped manage risk and also contributed to relative performance.
Issue selection within consumer discretionary was a detractor to relative performance. Investments in internet & direct marketing retail as well as general merchandise stores lagged those of the benchmark, as our risk-reduction efforts detracted from performance. For the full reporting period, the Fund on average maintained a near-benchmark (S&P 500 Index) weight to the sector. Within information technology, the Fund’s selection detracted from return, and the slight underweight to the market’s third best-performing sector caused a drag as well. The gains achieved by holdings in information technology were significant in absolute and relative terms. However, because information technology is the all equity index’s largest sector and was a solid market outperformer, the net effect was a drag to relative Fund performance. Most notable was the relative effect within semiconductors where a few common stocks significantly outperformed within the S&P 500 Index benchmark, while we blended in convertible securities to help manage risk.
How is the Fund positioned?
While always very risk conscious, the Fund maintains a relatively optimistic positioning relative to equity market risks. Believing that the U.S. equity market may be volatile but upward trending, we continue to position the portfolio with the goal of participating in the U.S. equity market’s upside, while providing resilience during market declines and downside volatility. We believe that actively managing equity market risks by blending equity and convertible securities allows us to construct a portfolio that can provide equity-like returns with significantly less volatility and equity beta over full market cycles. The Fund maintains a diversified portfolio with modest differences in sector weights. Overweights to movies & entertainment as well as industrial machinery include convertible securities to help manage market risk. The most notable underweight is to the pharmaceuticals industry where litigation and political risks are problematic. Our view that investors may favor quality and continue to have an eye toward dividend income has proven beneficial in the reporting period, and we continue to focus our attention toward reasonably priced growth and quality.
What closing thoughts do you have for Fund shareholders?
Markets have exhibited more volatility of late, highlighting investors’ concerns regarding the future impact of political upheaval on economic conditions. While we do not see recession as the logical next step for the U.S. economy, we do believe that markets are more fragile today. Therefore, we continue to focus portfolio investments in areas where we see strength, and a guidepost points to the U.S. consumer, who is enjoying strong employment, gains in household net worth, and favorable debt-coverage ratios. In our view, companies that offer attractive growth attributes in alow-growth world remain compelling investment opportunities. In light of more fragile markets, we continue to favor higher-quality and reasonably valued growth businesses
| | | | |
| 34 | | CALAMOS OPEN-END FAMILY OF FUNDS ANNUAL REPORT | | |
Calamos Growth and Income Fund
at this juncture of the market cycle. Furthermore, we believe our approach of employing convertible securities to manage risk/reward at the total portfolio, sector and individual company levels may be well suited for this market environment.
Opinions, estimates, forecasts, and statements of financial market trends that are based on current market conditions constitute our judgment and are subject to change without notice. The views and strategies described may not be suitable for all investors. References to specific securities, asset classes and financial markets are for illustrative purposes only and are not intended to be, and should not be interpreted as, recommendations.
ANNUALIZED RETURN: SINCE INCEPTION (9/18/97) THROUGH 10/31/19
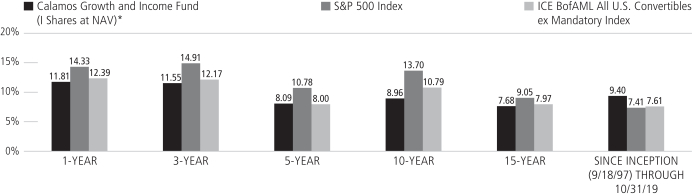
Performance data quoted represents past performance, which is no guarantee of future results. Current performance may be lower or higher than the performance quoted.
The principal value and investment return of an investment will fluctuate so that your shares, when redeemed, may be worth more or less than their original cost. You can obtain performance data current to the most recent month end by visiting www.calamos.com. Average annual total return measures net investment income and capital gain or loss from portfolio investments as an annualized average. All performance shown assumes reinvestment of dividends and capital gains distributions. Performance is for the Fund’s Class I shares at net asset value. The Fund also offers Class A and Class C shares, the performance of which may vary. Source: State Street Corporation and Lipper, Inc.
| * | Annual returns for Class I shares are provided because Class I shares represent the largest percentage of assets in the Calamos Family of Funds. |
Calamos Growth and Income Fund
GROWTH OF $1,000,000: FOR 10-YEAR PERIOD ENDED 10/31/19
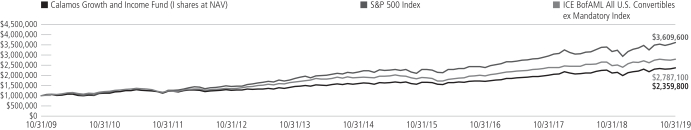
AVERAGE ANNUAL TOTAL RETURN† AS OF 10/31/19
| | | | | | | | | | | | | | | |
| | | 1
YEAR | | 5
YEARS | | 10 YEARS |
Class A Shares – Inception 9/22/88 | | | | | | | | | | | | | | | |
Without Sales Charge | | | | 11.51 | % | | | | 7.83 | % | | | | 8.69 | % |
With Sales Charge | | | | 6.22 | | | | | 6.78 | | | | | 8.17 | |
Class C Shares – Inception 8/5/96 | | | | | | | | | | | | | | | |
Without Sales Charge | | | | 10.68 | | | | | 7.01 | | | | | 7.88 | |
With Sales Charge | | | | 9.68 | | | | | 7.01 | | | | | 7.88 | |
Class I Shares – Inception 9/18/97 | | | | 11.81 | | | | | 8.09 | | | | | 8.96 | |
Performance data quoted represents past performance, which is no guarantee of future results. Current performance may be lower or higher than the performance quoted. The principal value and investment return of an investment will fluctuate so that your shares, when redeemed, may be worth more or less than their original cost.
As of the prospectus dated 3/1/19, the Fund’s gross expense ratio for Class A shares is 1.10%; Class C is 1.85% and Class I is 0.85%. The expense ratios shown above may differ from the more recent expense ratios reported in the Financial Highlights section of this report.
| † | Average annual total return measures net investment income and capital gain or loss from portfolio investments as an annualized average assuming reinvestment of dividends and capital gains distributions. Load-adjusted returns are adjusted for the maximum front-end sales load of 4.75% for Class A shares and returns for Class C shares have been adjusted for the contingent deferred sales charge (CDSC). |
NOTES:
The graphs do not reflect the income taxes that you would pay on fund distributions or the redemption of fund shares. Fund performance includes reinvestment of dividends and adjustment for the maximum sales charge for Class A shares. The performance of other classes will vary from the performance of the class shown based on the difference in sales charges and fees paid by shareholders investing in different share classes.
The S&P 500 Index is an unmanaged index generally considered representative of the U.S. stock market. Source: Lipper, Inc.
The ICE BofAML All U.S. Convertibles ex Mandatory Index represents the U.S. convertibles securities market excluding mandatory convertibles.
Index returns assume reinvestment of dividends and do not reflect deduction of fees and expenses. It is not possible to invest directly in an index.
| | | | |
| 36 | | CALAMOS OPEN-END FAMILY OF FUNDS ANNUAL REPORT | | |
Calamos Dividend Growth Fund
CALAMOS DIVIDEND GROWTH FUND
INVESTMENT TEAM DISCUSSION
How has the Fund performed?
For the12-month period ended October 31, 2019, Calamos Dividend Growth Fund returned 13.93% (Class I shares at net asset value), performing broadly in line with the S&P 500 Index return of 14.33%. The Fund outperformed the Morningstar Large Blend category average of 12.50% and ranked in the 39th percentile.*
What factors influenced performance during the reporting period?
Market performance over the full reporting period can be characterized as erratic, with rotations in leadership testing investors. The U.S. equity market declined approximately-15% early in the period through December 24, 2018, yet recovered quickly and achieved new highs by April 2019. In May 2019 the benchmark saw a-6.4% drop, followed up by a 7.0% gain in June.
It is notable that investors have recently shown an increased preference for value stocks, resulting in full-period style relative returns ending in a near draw. The S&P 500 Growth Index’s1 return of 14.3% slightly trailed the 14.5% gain for the S&P 500 Value Index2. Within the S&P 500 Index, factors such as quality and low volatility outperformed the market for the period, while high dividend trailed.
Market leadership also broadened out. Last year, only three of the S&P 500 Index sectors beat the market for the12-month reporting period: consumer discretionary, information technology, and health care. This fiscal year, six of the eleven sectors outperformed, led by an eclectic mix of real estate (+27%), utilities (+25%) and information technology (+22%).
The Fund had led the S&P 500 Index market for most of the reporting period, but lagged over the last two months as the market steered toward more cyclical and higher beta areas of the market.
The Fund’s relative performance benefited from stock selection in the information technology sector as well as the slight overweight, on average, during the period. The Fund went from an underweight early in the reporting period, to a slight overweight in December 2018. Data processing & outsourced services as well as technology hardware names were the biggest contributors. Strong stock selection within the consumer staples sector contributed to Fund performance. Stock picks within the packaged foods as well as the tobacco industries proved beneficial to relative performance.
Stock selection within health care was a drag on relative performance, with picks in pharmaceuticals and managed health care detracting from return. Sector allocation was a modest negative. Although on average the Fund weight held a modest underweight, the timing of changes detracted significantly. The Fund’s holdings in the
| * | Data is as of 10/31/19. Morningstar category percentile ranking is based on annualized total return for the 1-year, 3-year and 5-year periods. Calamos Dividend Growth Fund Class I Shares were in the 39th, 43rd and 60th percentiles of 1,405, 1,396 and 1,198 funds for the 1-year, 3-year and 5-year periods, respectively, for the Morningstar Large Blend category. |
| 1 | The S&P 500® Pure Growth index is a style-concentrated index designed to track the performance of stocks that exhibit the strongest growth based on the ratios of book value, earnings, and sales to price. |
| 2 | The S&P 500® Pure Value index is a style-concentrated index designed to track the performance of stocks that exhibit the strongest value based on the ratios of book value, earnings, and sales to price. |
OVERVIEW
The Fund invests in companies that we believe have the ability to increase dividends over time, either through increasing profits or more efficient use of capital.
KEY FEATURES
| | ◾ | | Employs bottom-up stock picking and a benchmark-agnostic approach. | |
| | ◾ | | Focuses on good businesses with solid cash flows and value prices. | |
PORTFOLIO FIT
The Fund may be suitable for investors seeking a regular stream of income and dividend-paying equity investments that tend to be less volatile than non-dividend payers.
| | |
| FUND NASDAQ SYMBOLS |
| |
A Shares | | CADVX |
C Shares | | CCDVX |
| |
I Shares | | CIDVX |
| | | |
|
| FUND CUSIP NUMBERS |
| |
A Shares | | 128120839 |
C Shares | | 128120821 |
| |
I Shares | | 128120813 |
| | | |
Calamos Dividend Growth Fund
| | | | |
| SECTOR WEIGHTINGS | |
| |
Information Technology | | | 23.0 | % |
Health Care | | | 12.9 | |
| |
Financials | | | 12.9 | |
Communication Services | | | 10.9 | |
| |
Consumer Discretionary | | | 10.3 | |
Industrials | | | 8.9 | |
| |
Consumer Staples | | | 7.2 | |
Energy | | | 4.5 | |
| |
Utilities | | | 3.0 | |
Real Estate | | | 1.9 | |
| |
Materials | | | 1.7 | |
| | | | | |
Asset Allocation weightings are subject to change daily and are calculated as a percentage of net assets. The table excludes cash or cash equivalents, any government/sovereign bonds or broad based index hedging securities the Fund may hold.
consumer discretionary sector lagged, with selection in general merchandise stores as well as internet & direct marketing retail hampering performance. The Fund’s weighting in the sector was on average a market weight, but due to timing amounted to a modest impediment to relative performance. Consumer discretionary as a sector slightly outperformed the overall market.
How is the Fund positioned?
At period end, the Fund had a modest overweight to information technology, countered by modest underweights to real estate and materials. Concerns about the flow of assets from growth to the more cyclical and value-oriented segments of the market weighed on performance toward the end of the period. However, we don’t see the underlying fundamentals of these segments as being constructive enough to justify the market’s recent migration.
Longer term, we believe our focus on attractively valued businesses with management teams who are effective stewards of capital and seek to increase dividends will work better for performance throughout market cycles.
What closing thoughts do you have for Fund shareholders?
The market’s change as to deflation risks and global growth was a sudden and sharp turn. While a lot of economic data globally has improved, we don’t see a sudden acceleration that recent market activity seems to imply. We are of the view that the economy is not headed for a recession, but is also not poised for high growth rates that have seemingly been absent during this prolonged expansion. Monetary policy seems to have been pushed to its limits, and U.S. consumers and the private sector are in good standing. In light of this view, we will continue to look for relative value opportunities within the equity universe that align with our assessment of the business and macro cycles.
Opinions, estimates, forecasts, and statements of financial market trends that are based on current market conditions constitute our judgment and are subject to change without notice. The views and strategies described may not be suitable for all investors. References to specific securities, asset classes and financial markets are for illustrative purposes only and are not intended to be, and should not be interpreted as, recommendations.
| | | | |
| 38 | | CALAMOS OPEN-END FAMILY OF FUNDS ANNUAL REPORT | | |
Calamos Dividend Growth Fund
GROWTH OF $1,000,000: SINCE INCEPTION (8/5/13) THROUGH 10/31/19
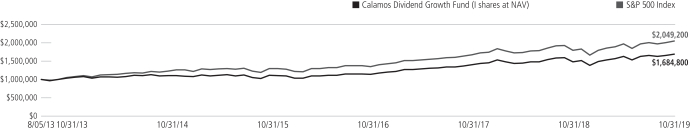
AVERAGE ANNUAL TOTAL RETURN† AS OF 10/31/19
| | | | | | | | | | | | | | | |
| | | 1
YEAR | | 5
YEARS | | SINCE
INCEPTION |
Class A Shares – Inception 8/5/2013 | | | | | | | | | | | | | | | |
Without Sales Charge | | | | 13.63 | % | | | | 8.57 | % | | | | 8.44 | % |
With Sales Charge | | | | 8.20 | | | | | 7.51 | | | | | 7.60 | |
Class C Shares – Inception 8/5/2013 | | | | | | | | | | | | | | | |
Without Sales Charge | | | | 12.74 | | | | | 7.75 | | | | | 7.64 | |
With Sales Charge | | | | 11.74 | | | | | 7.75 | | | | | 7.64 | |
Class I Shares – Inception 8/5/2013 | | | | 13.93 | | | | | 8.85 | | | | | 8.72 | |
Performance data quoted represents past performance, which is no guarantee of future results. Current performance may be lower or higher than the performance quoted. The principal value and investment return of an investment will fluctuate so that your shares, when redeemed, may be worth more or less than their original cost.
As of the prospectus dated 3/1/19, the Fund’s gross expense ratio for Class A shares is 1.84%; Class C shares is 2.60% and Class I shares is 1.61%. The Fund’s Investment Adviser has contractually agreed to reimburse Fund expenses through 3/1/22 to the extent necessary so that Total Annual Fund Operating Expenses (excluding taxes, interest, short interest, short dividend expenses, brokerage commissions, acquired fund fees and expenses and extraordinary expenses, if any) of Class A, Class C and Class I shares are limited to 1.35%, 2.10%,1.10% of average net assets, respectively. Calamos Advisors may recapture previously waived expense amounts within the same fiscal year for any day where the respective Fund’s expense ratio falls below the contractual expense limit up to the expense limit for that day. This undertaking is binding on Calamos Advisors and any of its successors and assigns. This agreement is not terminable by either party. The expense ratios shown above may differ from the more recent expense ratios reported in the Financial Highlights section of this report.
| † | Average annual total return measures net investment income and capital gain or loss from portfolio investments as an annualized average assuming reinvestment of dividends and capital gains distributions. Performance shown reflects the effects of an expense reimbursement that improved results. Load-adjusted returns are adjusted for the maximum frontend sales load of 4.75% for Class A shares. Returns for Class C shares have been adjusted for the contingent deferred sales charge (CDSC). |
NOTES:
The graph does not reflect the income taxes that you would pay on fund distributions or the redemption of fund shares. Fund performance includes reinvestment of dividends and adjustment for the maximum sales charge for Class A shares. The performance of other classes will vary from the performance of the class shown based on the difference in sales charges and fees paid by shareholders investing in different share classes.
The S&P 500 Index is an unmanaged index generally considered representative of the U.S. stock market.
Index returns assume reinvestment of dividends and do not reflect deduction of fees and expenses. It is not possible to invest directly in an index.
Calamos Opportunistic Value Fund
OVERVIEW
The Fund invests in the equities of small, midsize and large U.S. companies that we believe are undervalued according to certain financial measurements of their intrinsic values.
KEY FEATURES
| | ◾ | | Employs bottom-up stock picking and a benchmark-agnostic approach. | |
| | ◾ | | Focuses on good businesses with solid cash flows and value prices. | |
PORTFOLIO FIT
The Fund is a core equity option that may balance a growth allocation and complement other value strategies. Our flexibility in analyzing all companies regardless of sector helps us avoid the cyclicality inherent in a deep value strategy or momentum growth strategy over full market cycles.
| | |
| FUND NASDAQ SYMBOLS |
| |
A Shares | | CVAAX |
C Shares | | CVACX |
| |
I Shares | | CVAIX |
| |
|
| FUND CUSIP NUMBERS |
| |
A Shares | | 128119666 |
C Shares | | 128119641 |
| |
I Shares | | 128119633 |
| |
CALAMOS OPPORTUNISTIC VALUE FUND
INVESTMENT TEAM DISCUSSION
How has the Fund performed?
For12-month period ended October 31, 2019, Calamos Opportunistic Value Fund returned 10.43% (Class I shares at net asset value), underperforming the S&P 1500 Value Index return of 13.69%.
The Fund was delivering strong returns along with the value index for the better part of the reporting period, lagging only when a sharp and sudden shift in investor preference for cyclical stocks detracted from the Fund’s relative performance. Since its Class I shares inception on March 1, 2002, the Fund returned 6.17% on an annualized basis versus a 7.63% gain for the S&P 1500 Value Index
What factors influenced performance?
Market performance over the full reporting period was erratic, with rotations in leadership testing investors. The U.S. equity market declined approximately a-15% early in the period through December 24, 2018, yet recovered quickly and achieved new highs by April 2019. In May 2019 the benchmark saw a-7.8% drop, followed up by an 8.1% comeback in June.
It is notable that investors had recently shown an increased preference for cyclical stocks at the end of the period, resulting in full-period growth and value style returns ending in a near draw. The S&P 1500 Value Index’s return of 13.69% ever so slightly outperformed the 13.67% gain of the S&P 1500 Growth Index. Over the past three months, however, the S&P 1500 Value Index has outperformed the S&P 1500 Growth Index1 by 237 basis points (+3.48% versus +1.11%, respectively) with cyclical areas of the market gaining investor attention.
Large-cap names dominated the market for the reporting period as evidenced by the S&P 500 Index’s 14.33% gain, which far outpaced the 7.17% gain of the S&P 1000 Index. The S&P Composite 1500 Index is a combination of the top 500 names (the S&P 500 Index) and the next 1,000 names (the S&P 1000 Index, which is a combination of the S&P MidCap 400 and the S&P SmallCap 600). Diversification across market capitalization was not beneficial during the reporting period.
Top-performing sectors in the S&P 1500 Value Index were an eclectic mix of information technology (+35%), real estate (+24%), utilities (+21%) and communication services (+21%), with energy(-11%), materials(-0.4%) and health care (+5%) as the notable laggards.
Our macro view and fundamental research led us to favor more stable, lower-volatility names, which was detrimental as investors steered toward more cyclical and higher beta areas of the market in the latter part of the period. From October 31, 2018, through the first few days of September 2019, the Fund ran even with the S&P 1500 Value Index—all of the relative trailing performance occurred in September and October 2019 as investor worries about deflation and slower global growth abated.
The Fund’s energy sector underweight, the benchmark’s worst-performing sector, was a positive contributor to relative performance. Selection was also additive, as strong selection in equipment & services as well as avoiding significant problems in drilling
| 1 | The S&P 1500 Growth Index consists of the growth segment of the securities found in the S&P 1500 Index. The S&P 1500 combines the S&P 500, S&P MidCap 400 and the S&P SmallCap 600. |
| | | | |
| 40 | | CALAMOS OPEN-END FAMILY OF FUNDS ANNUAL REPORT | | |
Calamos Opportunistic Value Fund
contributed to return during the period. The Fund’s selection within the industrials sector also added value, while a slight average underweight to the benchmark detracted value. The Fund benefited by avoiding problems in industrial conglomerates and selecting strong gainers in building products.
Fund holdings within the health care sector lagged those of the benchmark. An overweight at the beginning of the period led to a negative allocation effect, though the relative weighting was reduced to an underweight at period end. Holdings in managed health care, life sciences tools, and health care distributors all performed poorly. Our names within the consumer discretionary sector also lagged benchmark peers. Specifically, an overweight and selection within department stores detracted from relative performance, as did poor selection within restaurants. A modest underweight for the period also detracted from performance, though the underweight was reduced during the period.
How is the Fund positioned?
We are currently most overweight to higher-quality growth businesses trading at attractive relative valuations in information technology, though that overweight has been significantly reduced since the beginning of the reporting period. Our most significant underweights fall within energy and health care, where political risks have increased as the 2020 election season kicks into high gear. The portfolio still offers companies exhibiting superior fundamental growth in our view, and we have reduced our relative valuations in light of market considerations.
What closing thoughts do you have for Fund shareholders?
The market’s dismissal of deflation and global growth risks was surprisingly abrupt. Although a lot of economic data globally has improved, we don’t see any sudden acceleration occurring that recent market activity seems to imply. We believe that the economy is not headed for a recession, but is also not poised for high growth rates. Monetary policy has been pushed to its limits, and U.S. consumers and the private sector are in good standing. In light of this view, we will continue to look for relative value opportunities within the equity universe that align with our assessments of the business and macro cycles.
Opinions, estimates, forecasts, and statements of financial market trends that are based on current market conditions constitute our judgment and are subject to change without notice. The views and strategies described may not be suitable for all investors. References to specific securities, asset classes and financial markets are for illustrative purposes only and are not intended to be, and should not be interpreted as, recommendations.
| | | | |
| SECTOR WEIGHTINGS | | | |
| |
Financials | | | 20.7 | % |
Information Technology | | | 20.6 | |
| |
Industrials | | | 10.4 | |
Consumer Staples | | | 8.6 | |
| |
Health Care | | | 8.4 | |
Consumer Discretionary | | | 8.3 | |
| |
Communication Services | | | 5.4 | |
Utilities | | | 4.8 | |
| |
Energy | | | 4.2 | |
Real Estate | | | 3.7 | |
| |
Materials | | | 3.4 | |
Other | | | 0.7 | |
Asset Allocation weightings are subject to change daily and are calculated as a percentage of net assets. The table excludes cash or cash equivalents, any government/sovereign bonds or broad based index hedging securities the Fund may hold.
Calamos Opportunistic Value Fund
ANNUALIZED RETURN: SINCE INCEPTION (3/1/02) THROUGH 10/31/19
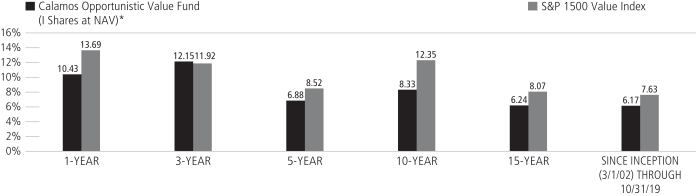
Performance data quoted represents past performance, which is no guarantee of future results. Current performance may be lower or higher than the performance quoted.
The principal value and investment return of an investment will fluctuate so that your shares, when redeemed, may be worth more or less than their original cost. You can obtain performance data current to the most recent month end by visiting www.calamos.com. Average annual total return measures net investment income and capital gain or loss from portfolio investments as an annualized average. All performance shown assumes reinvestment of dividends and capital gains distributions. Performance is for the Fund’s Class I shares at net asset value. The Fund also offers Class A and Class C shares, the performance of which may vary. Performance shown reflects an expense reimbursement that improved results. Source: State Street Corporation and Lipper, Inc.
| * | Annual returns for Class I shares are provided because Class I shares represent the largest percentage of assets in the Calamos Family of Funds. |
| | | | |
| 42 | | CALAMOS OPEN-END FAMILY OF FUNDS ANNUAL REPORT | | |
Calamos Opportunistic Value Fund
GROWTH OF $1,000,000: FOR THE 10-YEAR PERIOD ENDED 10/31/19
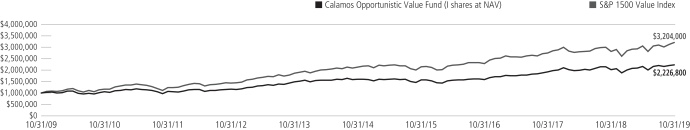
AVERAGE ANNUAL TOTAL RETURN† AS OF 10/31/19
| | | | | | | | | | | | | | | |
| | | 1
YEAR | | 5
YEARS | | 10 YEARS
|
Class A Shares – Inception 1/2/02 | | | | | | | | | | | | | | | |
Without Sales Charge | | | | 10.14 | % | | | | 6.61 | % | | | | 8.07 | % |
With Sales Charge | | | | 4.89 | | | | | 5.58 | | | | | 7.54 | |
Class C Shares – Inception 1/2/02 | | | | | | | | | | | | | | | |
Without Sales Charge | | | | 9.33 | | | | | 5.83 | | | | | 7.27 | |
With Sales Charge | | | | 8.43 | | | | | 5.83 | | | | | 7.27 | |
Class I Shares – Inception 3/1/02 | | | | 10.43 | | | | | 6.88 | | | | | 8.33 | |
Performance data quoted represents past performance, which is no guarantee of future results. Current performance may be lower or higher than the performance quoted. The principal value and investment return of an investment will fluctuate so that your shares, when redeemed, may be worth more or less than their original cost.
As of the prospectus dated 3/1/19, the Fund’s gross expense ratio for Class A shares is 1.61%; Class C shares is 2.36% and Class I shares is 1.37%. The Fund’s investment advisor has contractually agreed to reimburse Fund expenses through March 1, 2022, to the extent necessary so that Total Annual Fund Operating Expenses (excluding taxes, interest, short interest, short dividend expenses, brokerage commissions, acquired fund fees and expenses, and extraordinary expenses, if any) of Class A, Class C, and Class I are limited to 1.15%, 1.90%, and 0.90% of average net assets, respectively. Calamos Advisors may recapture previously waived expense amounts within the same fiscal year for any day where the respective Fund’s expense ratio falls below the contractual expense limit up to the expense limit for that day. This undertaking is binding on Calamos Advisors and any of its successors and assigns. This agreement is not terminable by either party. The expense ratios shown above may differ from the more recent expense ratios reported in the Financial Highlight section of this report.
| † | Average annual total return measures net investment income and capital gain or loss from portfolio investments as an annualized average assuming reinvestment of dividends and capital gains distributions. Load-adjusted returns are adjusted for the maximum front-end sales load of 4.75% for Class A shares and returns for Class C shares have been adjusted for the contingent deferred sales charge (CDSC). |
NOTES:
The graphs do not reflect the income taxes that you would pay on fund distributions or the redemption of fund shares. Fund performance includes reinvestment of dividends and adjustment for the maximum sales charge for Class A shares. The performance of other classes will vary from the performance of the class shown based on the difference in sales charges and fees paid by shareholders investing in different share classes.
The S&P 1500 Value Index is designed to provide investors with a measure of the performance of U.S. value equities.
Index returns assume reinvestment of dividends and do not reflect deduction of fees and expenses. It is not possible to invest directly in an index.
Calamos International Growth Fund
OVERVIEW
The Fund employs a unique blend of quantitative and qualitative processes to build a portfolio characterized by quality businesses with durable growth, competitive advantages and healthy, flexible balance sheets.
KEY FEATURES
| | ◾ | | Identifies companies that possess competitive advantages and financial strength as defined by our proprietary data analysis of ROIC1 and near-term quantitative catalysts. | |
| | ◾ | | Employs deep and targeted qualitative analysis to scrutinize a company’s business model, competitive landscape and growth drivers, factors important in weighing a company’s durability over time. | |
| | ◾ | | Invests in a universe that spans geographies and market caps, providing a wide breadth of unique opportunities to investors. | |
| | ◾ | | Emphasizes alignment with key secular themes, such as investing in economies that promote structural reforms and economic freedoms. | |
PORTFOLIO FIT
As an active, true growth offering with a differentiated return profile, the Fund can potentially help investors optimize capital appreciation within their international allocation.
| | |
| FUND NASDAQ SYMBOLS |
| |
A Shares | | CIGRX |
C Shares | | CIGCX |
| |
I Shares | | CIGIX |
R6 Shares | | CIGOX |
| |
| FUND CUSIP NUMBERS | | |
| |
A Shares | | 128119575 |
C Shares | | 128119559 |
| |
I Shares | | 128119542 |
R6 Shares | | 128120425 |
CALAMOS INTERNATIONAL GROWTH FUND
INVESTMENT TEAM DISCUSSION
How has the Fund performed?
For the12-month period ended October 31, 2019, Calamos International Growth Fund returned 13.32% (Class I shares at net asset value) versus a 17.10% gain for the MSCI EAFE Growth Index, the Fund’s benchmark, and 17.12% return for the MSCI ACWI ex U.S. Growth Index. The Fund underperformed as several of our holdings in companies with higher-growth and higher-valuation characteristics lagged despite their leading fundamental profiles.
Since its inception on March 16, 2005, the Fund has returned 6.85% on an annualized basis (Class I shares at net asset value) compared to a 5.89% increase for the MSCI EAFE Growth Index and 5.98% return for the MSCI ACWI ex U.S. Growth Index. We believe this long-term outperformance demonstrates the Fund’s ability to generate excess returns in international growth equities over complete market cycles.
What factors influenced performance during the reporting period?
International stocks confronted multiple crosscurrents over theone-year period, including weaker economic growth, escalating trade disputes, a stronger dollar and recurrent political risk. In the period, the Fund underperformed the benchmark as some of our key holdings in companies with higher growth and higher return on invested capital trailed the index, as global markets rewarded companies with more defensive fundamentals, including lowerprice-to-earnings ratios.
From a sector perspective, the Fund’s security selection in consumer staples and industrials detracted from performance, as holdings in food retail and aerospace lagged benchmark peers. The Fund’s selection within health care and consumer discretionary added to return; select positions in pharmaceuticals and biotechnology performed well due to higher-quality growth fundamentals versus peers. Within the consumer area, investments in footwear and apparel saw strong returns due to consumer demand of key brands.
From a geographic perspective, Fund positions in Europe and Japan detracted value as certain holdings were influenced by prevailing macro headwinds, while positions in Emerging Asia and Canada added considerable value owing to healthy demand and earnings growth.
How is the Fund positioned?
The Fund’s regional and country positioning reflects the combined inputs of ourtop-down global framework and ourbottom-up security analysis. Our investment team evaluates macroeconomic factors and growth opportunities and actively integrates these into the investment decision-making process.
We own a combination of secular growth and select cyclical opportunities with significant weights in technology, consumer discretionary, health care, industrials and financials. We own lower absolute weights or underweights in more defensive market
| 1 | ROIC (Return On Invested Capital) measures how effectively a company uses the money invested in its operations, calculated as a company’s net income minus any dividends divided by the company’s total capital. |
| | | | |
| 44 | | CALAMOS OPEN-END FAMILY OF FUNDS ANNUAL REPORT | | |
Calamos International Growth Fund
areas including utilities, real estate and consumer staples, reflecting our cautious view of relative fundamentals and valuations. We also hold low absolute weights in resources areas, including energy and materials, where we seek select companies benefiting from relatively bettersupply-and-demand fundamentals and earnings-growth potential.
In terms of geographic positioning, we hold a diversified set of positions in Europe, with a blend of market capitalizations and end markets that reflect domestic demand and exporters. We are sensitive to developing political risks and economic data that remains relatively weak. Positioning is largely in global secular growth opportunities and, in some cases, regionally exposed businesses with stable, less-cyclical growth characteristics.
In our emerging markets positioning, we favor companies with the ability to tap into domestic demand, large addressable markets and key secular themes. Examples include positions in interactive media & services, internet retail, insurance and higher-quality banks.
We are underweight in Japan but see certain opportunities with standout growth potential in key demand verticals. Japan’s accommodative monetary policy, potential for margin expansion, and supportive valuations are positive factors at the macro level.
What closing thoughts do you have for Fund shareholders?
International corporate and macroeconomic data remains tepid and reflects moderate global growth conditions, though more recently we have seen figures routinely surpass the low expectations. Global monetary policy remains accommodative and multiple central banks have pivoted toward a more dovish policy stance. Markets continue to confront a set of headwinds and tailwinds, and we have seen developments with respect to corporate earnings and policy that reflect the mixed conditions facing international equities.
We see opportunities in international stocks benefitting from benign inflation, attractive valuations, and the potential for improved earnings growth. In terms of Fund positioning, we favor a blend of investments in secular growth and select defensive growth businesses. This positioning reflects our anticipation of continued moderate economic growth in the coming quarters. We favor investments in companies with earnings growth catalysts, solid cash flow generation and healthy balance sheets. From a thematic and sector perspective, we see opportunities in technology, communications services, consumer discretionary and health care companies with targeted areas of demand, as well as a set of more cyclical companies with catalysts and potential upside in fundamentals. Our active investment approach and long-term perspective positions us to take advantage of the volatility and opportunities in international markets.
Opinions, estimates, forecasts, and statements of financial market trends that are based on current market conditions constitute our judgment and are subject to change without notice. The views and strategies described may not be suitable for all investors. References to specific securities, asset classes and financial markets are for illustrative purposes only and are not intended to be, and should not be interpreted as, recommendations.
| | | | |
| SECTOR WEIGHTINGS | | | |
| |
Information Technology | | | 21.1 | % |
Consumer Discretionary | | | 20.0 | |
| |
Industrials | | | 16.4 | |
Health Care | | | 13.2 | |
| |
Financials | | | 11.7 | |
Consumer Staples | | | 6.2 | |
| |
Energy | | | 4.4 | |
Communication Services | | | 3.8 | |
| |
Materials | | | 2.2 | |
Real Estate | | | 0.8 | |
| |
Other | | | 0.1 | |
| | | | | |
Sector weightings are subject to change daily and are calculated as a percentage of net assets. The table excludes cash or cash equivalents, any government/sovereign bonds or broad based index hedging securities the Fund may hold.
Calamos International Growth Fund
ANNUALIZED RETURN: SINCE INCEPTION (3/16/05) THROUGH 10/31/19
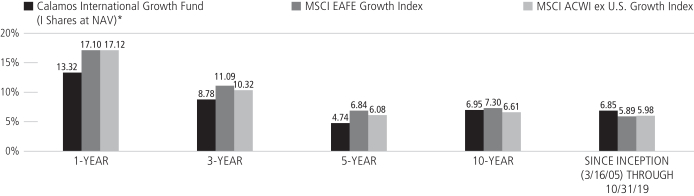
Performance data quoted represents past performance, which is no guarantee of future results. Current performance may be lower or higher than the performance quoted.
The principal value and investment return of an investment will fluctuate so that your shares, when redeemed, may be worth more or less than their original cost. You can obtain performance data current to the most recent month end by visiting www.calamos.com. Average annual total return measures net investment income and capital gain or loss from portfolio investments as an annualized average. All performance shown assumes reinvestment of dividends and capital gains distributions. Performance is for the Fund’s Class I shares at net asset value. The Fund also offers Class A, Class C and Class R6 shares, the performance of which may vary. Source: State Street Corporation and Lipper, Inc.
| * | Annual returns for Class I shares are provided because Class I shares represent the largest percentage of assets in the Calamos Family of Funds. |
| | | | |
| 46 | | CALAMOS OPEN-END FAMILY OF FUNDS ANNUAL REPORT | | |
Calamos International Growth Fund
GROWTH OF $1,000,000: FOR THE 10-YEAR PERIOD ENDED 10/31/19
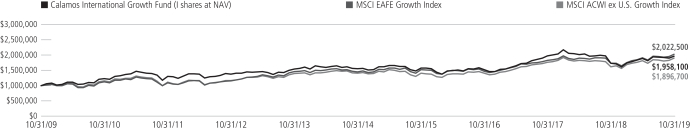
AVERAGE ANNUAL TOTAL RETURN† AS OF 10/31/19
| | | | | | | | | | | | | | | |
| | | 1
YEAR | | 5
YEARS | | 10 YEARS
OR ^SINCE
INCEPTION |
Class A Shares – Inception 3/16/05 | | | | | | | | | | | | | | | |
Without Sales Charge | | | | 13.07 | % | | | | 4.48 | % | | | | 6.68 | % |
With Sales Charge | | | | 7.71 | | | | | 3.47 | | | | | 6.17 | |
Class C Shares – Inception 3/16/05 | | | | | | | | | | | | | | | |
Without Sales Charge | | | | 12.21 | | | | | 3.69 | | | | | 5.89 | |
With Sales Charge | | | | 11.23 | | | | | 3.69 | | | | | 5.89 | |
Class I Shares – Inception 3/16/05 | | | | 13.32 | | | | | 4.74 | | | | | 6.95 | |
Class R6 Shares – Inception 9/17/18^ | | | | 13.41 | | | | | | | | | | 1.16 | |
Performance data quoted represents past performance, which is no guarantee of future results. Current performance may be lower or higher than the performance quoted. The principal value and investment return of an investment will fluctuate so that your shares, when redeemed, may be worth more or less than their original cost.
As of the prospectus dated 3/1/19, the Fund’s gross expense ratio for Class A shares is 1.51%; Class C shares is 2.26%, Class I shares is 1.26% and Class R6 shares is 1.21%. The Fund’s investment advisor has contractually agreed to reimburse Fund expenses through March 1, 2022 to the extent necessary so that Total Annual Fund Operating Expenses (excluding taxes, interest, short interest, short dividend expenses, brokerage commissions, acquired fund fees and expenses, and extraordinary expenses, if any) of Class A, Class C, and Class I are limited to 1.10%, 1.85%, and 0.85% of average net assets, respectively. The Fund’s investment adviser has contractually agreed to limit the Fund’s annual ordinary operating expenses for Class R6 shares (as a percentage of average net assets) to 0.85% less the annual sub-transfer agency ratio for the Fund. The annual sub-transfer agency ratio is equal to the aggregate subtransfer agency expenses common to the other share classes of the Fund divided by the aggregate average annual net assets of the Fund’s other share classes. For purposes of these expense limitations, operating expenses do not include taxes, interest, short interest, short dividend expenses, all commissions and other normal charges incident to the purchase and sale of portfolio securities, and extraordinary expenses, if any. Calamos Advisors may recapture previously waived expense amounts within the same fiscal year for any day where the respective Fund’s expense ratio falls below the contractual expense limit up to the expense limit for that day. This undertaking is binding on Calamos Advisors and any of its successors and assigns. This agreement is not terminable by either party. The expense ratios shown above may differ from the more recent expense ratios reported in the Financial Highlight section of this report. The expense ratios shown above may differ from the more recent expense ratios reported in the Financial Highlight section of this report.
| † | Average annual total return measures net investment income and capital gain or loss from portfolio investments as an annualized average assuming reinvestment of dividends and capital gains distributions. Load-adjusted returns are adjusted for the maximum front-end sales load of 4.75% for Class A shares and returns for Class C shares have been adjusted for the contingent deferred sales charge (CDSC). |
NOTES:
The graphs do not reflect the income taxes that you would pay on fund distributions or the redemption of fund shares. Fund performance includes reinvestment of dividends and adjustment for the maximum sales charge for Class A shares. The performance of other classes will vary from the performance of the class shown based on the difference in sales charges and fees paid by shareholders investing in different share classes.
The MSCI EAFE Growth Index measures developed market growth equity performance (excluding the U.S. and Canada). Source: Lipper, Inc.
The MSCI ACWI ex U.S. Growth Index measures equity market performance of companies outside of the United States with higher-growth values in developed and emerging markets.
Index returns assume reinvestment of dividends and do not reflect deduction of fees and expenses. It is not possible to invest directly in an index.
Calamos Evolving World Growth Fund
OVERVIEW
The fund globally invests in growth companies, emphasizing businesses with revenue streams derived within or from emerging markets. The fund is designed to actively manage risk over full market cycles.
KEY FEATURES
| | ◾ | | Active risk management aims to generate alpha with less downside risk than the benchmark and peers | |
| | ◾ | | Company fundamentals emphasis stresses strong or accelerated earnings growth and solid returns on invested capital | |
| | ◾ | | Targets well-positioned global growth companies that may benefit from long-term secular themes in emerging markets such as the rise of the emerging-market consumer | |
PORTFOLIO FIT
Because of its focus on risk management, the fund can serve as a long-term emerging market allocation.
| | |
| FUND NASDAQ SYMBOLS |
| |
A Shares | | CNWGX |
C Shares | | CNWDX |
| |
I Shares | | CNWIX |
| |
|
| FUND CUSIP NUMBERS |
| |
A Shares | | 128119161 |
C Shares | | 128119146 |
| |
I Shares | | 128119138 |
| |
CALAMOS EVOLVING WORLD GROWTH FUND
INVESTMENT TEAM DISCUSSION
How has the Fund performed?
For the12-month period ended October 31, 2019, Calamos Evolving World Growth Fund returned 12.91% (Class I shares at net asset value) versus the 12.29% return for the MSCI Emerging Markets Index, the Fund’s benchmark. The Fund experienced lower volatility versus the index and outperformed due to leading security selection and active risk-management measures. As a reminder, we position the Fund with the goal of capturing a majority of emerging market upside over the complete market cycle, while diligently mitigating downside risk.
For the12-month period, the Fund finished above the median level, specifically in the 46th percentile of the Morningstar Diversified Emerging Markets category. We believe this validates the benefit of our risk-managed investment approach, which was instrumental in dampening volatility during multiple sell-offs in the context of geopolitical tensions over the period.
Since its inception on August 15, 2008, the Fund has returned 3.88% on an annualized basis (Class I shares at net asset value) compared to a 3.43% return for the MSCI Emerging Markets Index. We think this demonstrates the Fund’s ability to generate competitive long-term returns while pursuing an active, risk-managed investment approach to emerging market opportunities over multiple market cycles.
What factors influenced performance during the reporting period?
Emerging markets navigated multiple challenges over the period, including rising trade tensions, slowing global growth, a stronger dollar, and recurrent political risks. In the period, the Fund outperformed the benchmark as some of our key holdings with higher-growth characteristics outpaced the index, as markets rewarded companies with superior quality and earnings growth attributes.
From a sector perspective, the Fund’s security selection within financials and health care added the most value, as holdings in the diversified banks, life & health insurance, and pharmaceuticals industries outperformed due to a combination ofhigher-quality and attainable growth prospects. The Fund’s security selection within technology and energy detracted value, with holdings in the technology hardware and oil & gas exploration and production industries trailing the index over the period.
In terms of geographic returns, the Fund’s security selection in EM Asia and Latin America both added significant value from a regional perspective, while holdings in EM Europe and South Africa lagged the benchmark. In terms of countries, the Fund’s security selection within Brazil, Singapore and Hong Kong added value, while the Fund’s average underweight allocation in Russia and certain global holdings in France and the UK hampered results.
How is the Fund positioned?
From a sector perspective, the largest allocations are in the consumer discretionary, technology, financials and communication services sectors. We favor businesses in
| | | | |
| 48 | | CALAMOS OPEN-END FAMILY OF FUNDS ANNUAL REPORT | | |
Calamos Evolving World Growth Fund
internet retail, interactive media & services, diversified banks and insurance, and select semiconductor areas that exhibit better growth fundamentals, tap into large addressable markets, and align with our key secular themes.
We favor investments in Emerging Asia across our preferred industries and business areas, with China and India representing two of our larger country weights. We also see significant opportunities in Brazil, Taiwan and Indonesia among other markets. Our positioning favors areas that show a pickup in domestic demand, implementpro-growth reforms, and offer a blend of secular growth and select cyclical opportunities. We also hold increased weights in global multi-national companies based on criteria, including significant EM revenues, attractive company fundamentals, reasonable risk profiles and diversification of returns.
At the individual company level, we favor businesses with growth catalysts, high or increasing ROIC1, and stronger balance sheets supported by competitive positioning. In line with our process, we emphasize companies benefiting from secular themes that provide tailwinds for sustainable growth. We pay close attention to a company’s source of revenues and business catalysts, given the complex crosscurrents in global growth and trade.
What are your closing thoughts for Fund shareholders?
Global corporate and macroeconomic data have been mixed versus expectations and reflect moderate global growth conditions. Global monetary policy remains accommodative, and multiple central banks have pivoted toward a more dovish policy stance. Markets continue to encounter a combination of headwinds and tailwinds, and we have seen developments with respect to earnings and policy that reflect these mixed conditions for global businesses. We are actively monitoring critical issues for emerging markets including global trade negotiations, the path of central bank policy, and data on the industrial economy and consumption in China.
Earnings growth prospects remain positive in emerging markets, stock valuations are attractive, and easing monetary policy has benefited financial conditions in many emerging countries. Companies with higher-quality fundamentals and sustainable growth characteristics have been rewarded overall this year, although a significant focus on global trade and policy issues remains a key determinant of equity returns. From a thematic and sector perspective, we see opportunities in consumer sectors, communication services, and technology, higher-quality financials and a set of more cyclical companies in multiple sectors. We believe our active and risk-managed investment approach positions us well to navigate the headwinds and opportunities in emerging markets.
Opinions, estimates, forecasts, and statements of financial market trends that are based on current market conditions constitute our judgment and are subject to change without notice. The views and strategies described may not be suitable for all investors. References to specific securities, asset classes and financial markets are for illustrative purposes only and are not intended to be, and should not be interpreted as, recommendations.
| 1 | ROIC (Return On Invested Capital) measures how effectively a company uses the money invested in its operations, calculated as a company’s net income minus any dividends divided by the company’s total capital. |
| | | | |
| SECTOR WEIGHTINGS | |
| |
Consumer Discretionary | | | 24.2 | % |
Information Technology | | | 21.9 | |
| |
Financials | | | 18.9 | |
Communication Services | | | 8.7 | |
| |
Energy | | | 5.8 | |
Health Care | | | 4.7 | |
| |
Consumer Staples | | | 4.6 | |
Materials | | | 4.0 | |
| |
Industrials | | | 3.4 | |
Real Estate | | | 2.3 | |
| |
Other | | | 0.5 | |
| | | | | |
Asset Allocation weightings are subject to change daily and are calculated as a percentage of net assets. The table excludes cash or cash equivalents, any government/sovereign bonds or broad based index hedging securities the Fund may hold.
Calamos Evolving World Growth Fund
ANNUALIZED RETURN: SINCE INCEPTION (8/15/08) THROUGH 10/31/19
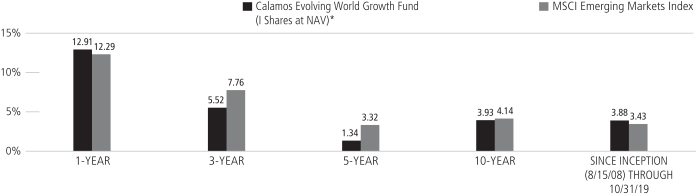
Performance data quoted represents past performance, which is no guarantee of future results. Current performance may be lower or higher than the performance quoted.
The principal value and investment return of an investment will fluctuate so that your shares, when redeemed, may be worth more or less than their original cost. You can obtain performance data current to the most recent month end by visiting www.calamos.com. Average annual total return measures net investment income and capital gain or loss from portfolio investments as an annualized average. All performance shown assumes reinvestment of dividends and capital gains distributions. Performance is for the Fund’s Class I shares at net asset value. The Fund also offers Class A and Class C shares, the performance of which may vary. Source: State Street Corporation and Lipper, Inc.
| * | Annual returns for Class I shares are provided because Class I shares represent the largest percentage of assets in the Calamos Family of Funds. |
| | | | |
| 50 | | CALAMOS OPEN-END FAMILY OF FUNDS ANNUAL REPORT | | |
Calamos Evolving World Growth Fund
GROWTH OF $1,000,000: FOR THE 10-YEAR PERIOD ENDED 10/31/19
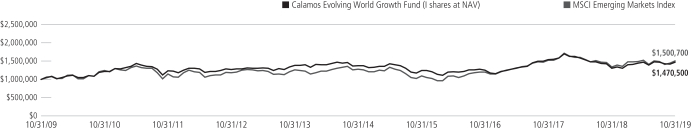
AVERAGE ANNUAL TOTAL RETURN† AS OF 10/31/19
| | | | | | | | | | | | | | | |
| | | 1
YEAR | | 5
YEARS | | 10
YEARS |
Class A Shares – Inception 8/15/08 | | | | | | | | | | | | | | | |
Without Sales Charge | | | | 12.60 | % | | | | 1.09 | % | | | | 3.67 | % |
With Sales Charge | | | | 7.21 | | | | | 0.11 | | | | | 3.17 | |
Class C Shares – Inception 8/15/08 | | | | | | | | | | | | | | | |
Without Sales Charge | | | | 11.71 | | | | | 0.33 | | | | | 2.89 | |
With Sales Charge | | | | 10.71 | | | | | 0.33 | | | | | 2.89 | |
Class I Shares – Inception 8/15/08 | | | | 12.91 | | | | | 1.34 | | | | | 3.93 | |
Performance data quoted represents past performance, which is no guarantee of future results. Current performance may be lower or higher than the performance quoted. The principal value and investment return of an investment will fluctuate so that your shares, when redeemed, may be worth more or less than their original cost.
As of the prospectus dated 3/1/19, the Fund’s gross expense ratio for Class A shares is 1.63%; Class C shares is 2.38% and Class I shares is 1.38%.The expense ratios shown above may differ from the more recent expense ratios reported in the Financial Highlight section of this report.
| † | Average annual total return measures net investment income and capital gain or loss from portfolio investments as an annualized average assuming reinvestment of dividends and capital gains distributions. Load-adjusted returns are adjusted for the maximumfront-end sales load of 4.75% for Class A shares and returns for Class C shares have been adjusted for the contingent deferred sales charge (CDSC). |
NOTES:
The graph does not reflect the income taxes that you would pay on fund distributions or the redemption of fund shares. Fund performance includes reinvestment of dividends and adjustment for the maximum sales charge for Class A shares. The performance of other classes will vary from the performance of the class shown based on the difference in sales charges and fees paid by shareholders investing in different share classes.
The MSCI Emerging Markets Index is a free float-adjusted market capitalization index considered broadly representative of emerging market equity performance. The index represents companies within the constituent emerging markets that are available to investors worldwide.
Index returns assume reinvestment of dividends and do not reflect deduction of fees and expenses. It is not possible to invest directly in an index.
Calamos Global Equity Fund
OVERVIEW
The Fund invests in equities of companies around the globe. We seek firms demonstrating what we believe to be key growth characteristics, including increasing profit margins and high returns on invested capital.
KEY FEATURES
| | ◾ | | Flexibly seeks growth globally, searching for the best risk/reward opportunities across countries, market capitalizations and sectors. | |
| | ◾ | | Seeks global growth companies that may benefit from long-term secular themes, including a burgeoning global middle class and increasing demand for information and entertainment. | |
PORTFOLIO FIT
The Fund can serve as a growth-oriented addition to a strategic global equity allocation and may complement or provide an alternative to value or blended styles.
| | |
| FUND NASDAQ SYMBOLS |
| |
A Shares | | CAGEX |
C Shares | | CCGEX |
| |
I Shares | | CIGEX |
| |
|
| FUND CUSIP NUMBERS |
| |
A Shares | | 128119484 |
C Shares | | 128119468 |
| |
I Shares | | 128119450 |
| |
CALAMOS GLOBAL EQUITY FUND
INVESTMENT TEAM DISCUSSION
How has the Fund performed?
For the12-month period ended October 31, 2019, Calamos Global Equity Fund returned 10.52% (Class I shares at net asset value) versus a 13.35% return for the MSCI World Index and 17.42% return for the MSCI ACWI Growth Index. Our emphasis on investments in companies with higher-growth, higher-momentum profiles lagged the indices, as markets dramatically shifted from higher-growth toward yield and cheap stocks near the end of the period.
Since its inception on March 1, 2007, the Fund has returned 7.34% on an annualized basis (Class I shares at net asset value) compared to a 6.06% gain for the MSCI World Index and 7.20% return for the MSCI ACWI Growth Index. We believe this performance edge demonstrates the Fund’s ability to generate long-term excess returns over complete market cycles and varied investment environments.
What factors influenced performance during the reporting period?
Global equities navigated key crosscurrents over theone-year period, including tepid global growth, rising trade tensions, a stronger dollar and recurrent political risk. In the period, the Fund underperformed the MSCI ACWI Growth Index as some of our key holdings in companies with higher growth and higher return on invested capital trailed the index, as global markets rewarded companies with relatively more defensive fundamentals, including lower price-to-earnings ratios.
From a sector perspective, the Fund’s security selection in technology and industrials detracted from performance, as investors acted on concerns of slower global growth and trade tensions. As a result, certain Fund holdings in technology hardware and industrial machinery underperformed. On the flipside, Fund selection within consumer discretionary and communication services contributed to Fund performance as positions in internet retail, apparel, and entertainment performed well due to security-specific factors, including key demand niches and strong earnings growth.
From a geographic perspective, the Fund’s relative underweight stance and security selection in the U.S. detracted value from results in the period. On the other hand, the Fund’s holdings in Emerging Asia and Canada generated strong relative returns and contributed to Fund performance.
How is the Fund positioned?
The Fund’s regional and country positioning reflects the combined inputs from ourtop-down global framework and ourbottom-up security analysis. Our investment team evaluates macroeconomic factors and growth opportunities and actively integrates these into the investment decision-making process.
The Fund is positioned with a combination of core and secular growth companies, in addition to select cyclical opportunities. Technology, consumer discretionary, health care, communication services, and financials are the largest sector weights in the Fund, based on where we see secular growth and attractive demand segments. Key positions are in the interactive media & services, internet retail, entertainment, luxury goods,
| | | | |
| 52 | | CALAMOS OPEN-END FAMILY OF FUNDS ANNUAL REPORT | | |
Calamos Global Equity Fund
biotechnology, diversified banks and insurance industries. We have an underweight stance in more defensive areas including utilities, traditional telecoms, real estate and slower-growth consumer staples due to a combination of high valuation and diminished growth prospects. We hold low absolute weights in energy and materials, with only select companies benefiting from relatively bettersupply-and-demand fundamentals and earnings-growth potential.
From a geographic perspective, we have an underweight position in the U.S., which reflects our view of decelerating growth and relatively less attractive valuation risk-reward. Positions emphasize secular growth and higher quality businesses with defensible business models. We own diversified holdings in Europe, with a blend of end markets, spanning domestic demand and exporters. Positioning is largely in global secular growth opportunities and, in some cases, more regionally exposed businesses with stable, less-cyclical characteristics. We own a select set of investments in emerging markets within key demand areas such as interactive media & services, internet retail, higher-quality banks and insurance. We are underweight in Japan. Monetary conditions remain highly accommodative, and valuations are reasonable, but tepid global growth and reduced export volumes continue to challenge many Japanese companies.
What closing thoughts do you have for Fund shareholders?
Global corporate and macroeconomic data has been relatively better versus expectations and continues to support a narrative of moderate global growth conditions. Global monetary policy remains accommodative, and multiple central banks have pivoted toward a more dovish policy stance. Markets continue to encounter a set of headwinds and tailwinds, and we have seen developments with respect to corporate earnings and policy that reflect the mixed conditions facing global equities.
We see opportunities in global stocks, reflective of better-than-expected earnings results, benign inflation and attractive valuations. In terms of portfolio positioning, we favor a blend of investments in secular growth and select defensive growth businesses. This positioning reflects our anticipation of continued moderate economic growth in the coming quarters. We favor investments in companies with earnings growth catalysts, solid cash flow generation and healthy balance sheets. From a thematic and sector perspective, we see opportunities in technology, communications services, consumer discretionary and health care companies with targeted areas of demand, and a set of more cyclical companies with catalysts and potential upside in fundamentals. Our active investment approach and long-term perspective positions us to take advantage of the volatility and opportunities in global equities.
Opinions, estimates, forecasts, and statements of financial market trends that are based on current market conditions constitute our judgment and are subject to change without notice. The views and strategies described may not be suitable for all investors. References to specific securities, asset classes and financial markets are for illustrative purposes only and are not intended to be, and should not be interpreted as, recommendations.
| | | | |
| SECTOR WEIGHTINGS | | | |
| |
Information Technology | | | 23.6 | % |
Consumer Discretionary | | | 16.3 | |
| |
Financials | | | 13.8 | |
Health Care | | | 13.2 | |
| |
Industrials | | | 10.3 | |
Communication Services | | | 10.3 | |
| |
Consumer Staples | | | 6.1 | |
Energy | | | 3.6 | |
| |
Materials | | | 2.7 | |
Real Estate | | | 0.8 | |
| |
Other | | | 0.0 | |
| | | | | |
Asset Allocation weightings are subject to change daily and are calculated as a percentage of net assets. The table excludes cash or cash equivalents, any government/sovereign bonds or broad based index hedging securities the Fund may hold.
Calamos Global Equity Fund
ANNUALIZED RETURN: SINCE INCEPTION (3/1/07) THROUGH 10/31/19
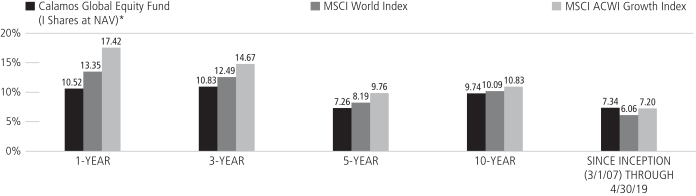
Performance data quoted represents past performance, which is no guarantee of future results. Current performance may be lower or higher than the performance quoted.
The principal value and investment return of an investment will fluctuate so that your shares, when redeemed, may be worth more or less than their original cost. You can obtain performance data current to the most recent month end by visiting www.calamos.com. Average annual total return measures net investment income and capital gain or loss from portfolio investments as an annualized average. All performance shown assumes reinvestment of dividends and capital gains distributions. Performance is for the Fund’s Class I shares at net asset value. The Fund also offers Class A and Class C shares, the performance of which may vary. Source: State Street Corporation and Lipper, Inc.
| * | Annual returns for Class I shares are provided because Class I shares represent the largest percentage of assets in the Calamos Family of Funds. |
| | | | |
| 54 | | CALAMOS OPEN-END FAMILY OF FUNDS ANNUAL REPORT | | |
Calamos Global Equity Fund
GROWTH OF $1,000,000: FOR THE 10-YEAR PERIOD ENDED 10/31/19
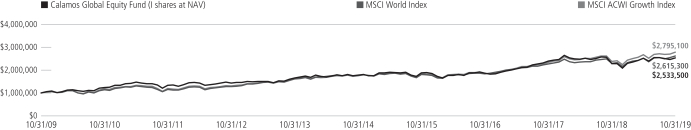
AVERAGE ANNUAL TOTAL RETURN† AS OF 10/31/19
| | | | | | | | | | | | | | | |
| | | 1
YEAR | | 5
YEARS | | 10
YEARS |
Class A Shares – Inception 3/1/07 | | | | | | | | | | | | | | | |
Without Sales Charge | | | | 10.28 | % | | | | 6.99 | % | | | | 9.48 | % |
With Sales Charge | | | | 5.03 | | | | | 5.96 | | | | | 8.95 | |
Class C Shares – Inception 3/1/07 | | | | | | | | | | | | | | | |
Without Sales Charge | | | | 9.36 | | | | | 6.19 | | | | | 8.65 | |
With Sales Charge | | | | 8.54 | | | | | 6.19 | | | | | 8.65 | |
Class I Shares – Inception 3/1/07 | | | | 10.52 | | | | | 7.26 | | | | | 9.74 | |
Performance data quoted represents past performance, which is no guarantee of future results. Current performance may be lower or higher than the performance quoted. The principal value and investment return of an investment will fluctuate so that your shares, when redeemed, may be worth more or less than their original cost.
As of the prospectus dated 3/1/19, the Fund’s gross expense ratio for Class A shares is 1.56%; Class C shares is 2.32% and Class I shares is 1.31%. The Fund’s investment advisor has contractually agreed to reimburse Fund expenses through March 1, 2022 to the extent necessary so that Total Annual Fund Operating Expenses (excluding taxes, interest, short interest, short dividend expenses, brokerage commissions, acquired fund fees and expenses, and extraordinary expenses, if any) of Class A, Class C, and Class I are limited to 1.40%, 2.15%, and 1.15% of average net assets, respectively. Calamos Advisors may recapture previously waived expense amounts within the same fiscal year for any day where the respective Fund’s expense ratio falls below the contractual expense limit up to the expense limit for that day. This undertaking is binding on Calamos Advisors and any of its successors and assigns. This agreement is not terminable by either party. The expense ratios shown above may differ from the more recent expense ratios reported in the Financial Highlight section of this report.
| † | Average annual total return measures net investment income and capital gain or loss from portfolio investments as an annualized average assuming reinvestment of dividends and capital gains distributions. Load-adjusted returns are adjusted for the maximum front-end sales load of 4.75% for Class A shares and returns for Class C shares have been adjusted for the contingent deferred sales charge (CDSC). |
NOTES:
The graph does not reflect the income taxes that you would pay on fund distributions or the redemption of fund shares. Fund performance includes reinvestment of dividends and adjustment for the maximum sales charge for Class A shares. The performance of other classes will vary from the performance of the class shown based on the difference in sales charges and fees paid by shareholders investing in different share classes.
The MSCI World Index (U.S. Dollars) is a market-capitalization weighted index composed of companies representative of the market structure of developed market countries in North America, Europe and the Asia/Pacific region.
The MSCI ACWI Growth Index is designed to measure the equity performance of companies with higher growth values in developed and emerging markets.
Index returns assume reinvestment of dividends and do not reflect deduction of fees and expenses. It is not possible to invest directly in an index.
The Fund’s use of derivative instruments involves investment risks and transaction costs to which the Fund would not be subject absent the use of these instruments and, accordingly, may result in losses greater than if they had not been used. Derivative instruments can be illiquid, may disproportionately increase losses and may have a potentially large impact on Fund performance.
Calamos Global Growth and Income Fund
OVERVIEW
The Fund invests primarily in global equity and convertible securities in an attempt to balance risk/reward while providing growth and income.
KEY FEATURES
| | ◾ | | Combines equity and convertible holdings in order to limit downside risk while potentially capturing upside equity participation. | |
| | ◾ | | Provides a core holding option that seeks to maintain a consistent risk posture throughout the market cycle. | |
| | ◾ | | Seeks to participate in the upside movements of the global equity market while lessening the impact of down periods. | |
PORTFOLIO FIT
The Fund can provide a long-term core allocation to global equities with the potential for lower volatility over full market cycles.
| | |
| FUND NASDAQ SYMBOLS |
| |
A Shares | | CVLOX |
C Shares | | CVLCX |
| |
I Shares | | CGCIX |
| |
|
| FUND CUSIP NUMBERS |
| |
A Shares | | 128119500 |
C Shares | | 128119708 |
| |
I Shares | | 128119609 |
| |
CALAMOS GLOBAL GROWTH AND INCOME FUND
INVESTMENT TEAM DISCUSSION
How has the Fund performed?
For the12-month period ended October 31, 2019, Calamos Global Growth and Income Fund returned 6.95% (Class I shares at net asset value) versus a 13.22% return for the MSCI ACWI Index and 13.35% gain for the MSCI World Index. Although the Fund’s risk-managed global equity approach was instrumental in dampening equity volatility during multiple sell-offs over the period, it underperformed the benchmark indices. Our investments in companies with higher return on invested capital and higher growth expectations lagged the indices despite superior fundamental profiles.
Since Class I shares inception on September 18, 1997, the Fund has returned 6.96% on an annualized basis compared to a 6.20% return for the MSCI ACWI Index and 6.30% gain for the MSCI World Index. We believe this outperformance demonstrates the Fund’s ability to generate attractive long-term performance, while pursuing an active, risk-managed investment approach over complete market cycles.
What factors influenced performance during the reporting period?
Global markets navigated multiple crosscurrents over theone-year period, including tepid economic growth, escalating trade disputes, a stronger dollar and recurrent political risk. In the period, the Fund underperformed the MSCI ACWI Index benchmark, as several of our key holdings with higher growth characteristics trailed the index as global markets rewarded companies with relatively more defensive attributes.
From a sector perspective, the Fund’s positioning in technology and energy sectors hampered results, as security selection within tech hardware and a modest overweight in integrated oil & gas detracted from performance. The Fund’s security selection in consumer discretionary and consumer staples added significant value, as holdings in the internet retail, entertainment, and packaged foods industries outperformed due to leading fundamentals among their peer companies.
From a geographic perspective, the Fund’s relative underweight stance and lagging selection in the U.S. detracted value from return in the period. In particular, Fund holdings in convertible bonds trailed the stronger gains in U.S. stocks, but also served to reduce volatility during multiple selloffs over the year. In terms of contributions, the Fund’s holdings in Emerging Asia and Japan generated strong relative returns and contributed to Fund performance as our picks of better quality businesses outpaced peers.
How is the Fund positioned?
The Fund’s regional and country positioning reflects the combined inputs of ourtop-down global framework andbottom-up security analysis. Our investment team continually evaluates macroeconomic factors and growth opportunities and actively integrates these into investment decision making.
From a geographic perspective, we have an underweight position in the U.S., which reflects our view of decelerating growth and relatively less-attractive valuation risk/reward. Positions emphasize secular growth and higher-quality businesses with defensible
| | | | |
| 56 | | CALAMOS OPEN-END FAMILY OF FUNDS ANNUAL REPORT | | |
Calamos Global Growth and Income Fund
business models. We own diversified holdings in Europe, with a blend of domestic-demand and export end markets. Positioning is largely in global secular growth opportunities and, in some cases, regionally focused businesses with stable, less-cyclical characteristics. We own a select set of investments in emerging markets within key demand areas such as interactive media & services, internet retail, as well as higher-quality banks and insurance. We are positioned underweight in Japan. Monetary conditions remain highly accommodative, and valuations are reasonable, but tepid global growth and reduced export volumes continue to challenge many Japanese companies.
From a sector perspective, we have positioned the Fund with an emphasis on opportunities in information technology, health care, communication services and the consumer sectors, among other areas. Conversely, we have an underweight stance in industrials, utilities, real estate and lower-quality foreign financials.
What closing thoughts do you have for Fund shareholders?
Global corporate and macroeconomic data has been relatively better versus expectations and continues to reflect moderate global growth conditions. Global monetary policy remains accommodative, and multiple central banks have pivoted toward a more dovish policy stance. Markets continue to encounter a set of headwinds and tailwinds, and we have seen developments with respect to corporate earnings and policy that reflect the mixed conditions facing global equities.
We see opportunities in global stocks, benefitting from better-than-expected earnings results, benign inflation and attractive valuations. In terms of portfolio positioning, we favor a blend of investments in secular growth and select defensive growth businesses. This positioning reflects our anticipation of continued moderate economic growth in the coming quarters. We favor investments in companies with earnings growth catalysts, solid cash flow generation and healthy balance sheets. From a thematic and sector perspective, we see opportunities in technology, communications services, consumer discretionary and health care companies with targeted areas of demand, in addition to more cyclical companies with sustaining catalysts and potential upside in fundamentals. Our risk-managed, active investment approach and long-term perspective positions us to take advantage of the volatility and opportunities in global markets.
Opinions, estimates, forecasts, and statements of financial market trends that are based on current market conditions constitute our judgment and are subject to change without notice. The views and strategies described may not be suitable for all investors. References to specific securities, asset classes and financial markets are for illustrative purposes only and are not intended to be, and should not be interpreted as, recommendations.
| | | | |
| SECTOR WEIGHTINGS | | | |
| |
Information Technology | | | 18.8 | % |
Consumer Discretionary | | | 12.5 | |
| |
Financials | | | 12.1 | |
Health Care | | | 11.0 | |
| |
Communication Services | | | 10.5 | |
Consumer Staples | | | 10.0 | |
| |
Industrials | | | 7.1 | |
Energy | | | 6.1 | |
| |
Materials | | | 3.1 | |
Utilities | | | 2.2 | |
| |
Real Estate | | | 1.1 | |
Other | | | 0.3 | |
Asset Allocation weightings are subject to change daily and are calculated as a percentage of net assets. The table excludes cash or cash equivalents, any government/sovereign bonds or broad based index hedging securities the Fund may hold.
Calamos Global Growth and Income Fund
ANNUALIZED RETURN: SINCE INCEPTION (9/18/97) THROUGH 10/31/19
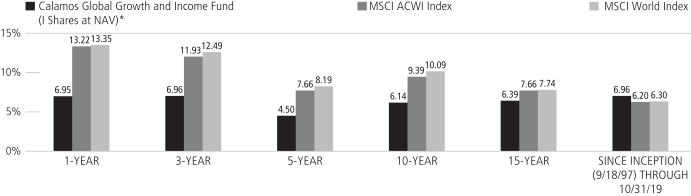
Performance data quoted represents past performance, which is no guarantee of future results. Current performance may be lower or higher than the performance quoted.
The principal value and investment return of an investment will fluctuate so that your shares, when redeemed, may be worth more or less than their original cost. You can obtain performance data current to the most recent month end by visiting www.calamos.com. Average annual total return measures net investment income and capital gain or loss from portfolio investments as an annualized average. All performance shown assumes reinvestment of dividends and capital gains distributions. Performance is for the Fund’s Class I shares at net asset value. The Fund also offers Class A and Class C shares, the performance of which may vary. Source: State Street Corporation and Lipper, Inc.
| * | Annual returns for Class I shares are provided because Class I shares represent the largest percentage of assets in the Calamos Family of Funds. |
| | | | |
| 58 | | CALAMOS OPEN-END FAMILY OF FUNDS ANNUAL REPORT | | |
Calamos Global Growth and Income Fund
GROWTH OF $1,000,000: FOR THE 10-YEAR PERIOD ENDED 10/31/19
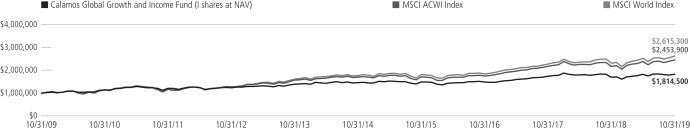
AVERAGE ANNUAL TOTAL RETURN† AS OF 10/31/19
| | | | | | | | | | | | | | | |
| | | 1
YEAR | | 5
YEARS | | 10
YEARS |
Class A Shares – Inception 9/9/96 | | | | | | | | | | | | | | | |
Without Sales Charge | | | | 6.67 | % | | | | 4.24 | % | | | | 5.87 | % |
With Sales Charge | | | | 1.58 | | | | | 3.23 | | | | | 5.36 | |
Class C Shares – Inception 9/24/96 | | | | | | | | | | | | | | | |
Without Sales Charge | | | | 5.87 | | | | | 3.45 | | | | | 5.09 | |
With Sales Charge | | | | 4.93 | | | | | 3.45 | | | | | 5.09 | |
Class I Shares – Inception 9/18/97 | | | | 6.95 | | | | | 4.50 | | | | | 6.14 | |
Performance data quoted represents past performance, which is no guarantee of future results. Current performance may be lower or higher than the performance quoted. The principal value and investment return of an investment will fluctuate so that your shares, when redeemed, may be worth more or less than their original cost.
As of the prospectus dated 3/1/19, the Fund’s gross expense ratio for Class A shares is 1.50%; Class C shares is 2.25% and Class I shares is 1.25%. The expense ratios shown above may differ from the more recent expense ratios reported in the Financial Highlight section of this report.
| † | Average annual total return measures net investment income and capital gain or loss from portfolio investments as an annualized average assuming reinvestment of dividends and capital gains distributions. Performance shown reflects the effects of an expense reimbursement that improved results and was in effect until March 31, 2003. Load-adjusted returns are adjusted for the maximumfront-end sales load of 4.75% for Class A shares and returns for Class C shares have been adjusted for the contingent deferred sales charge (CDSC). |
NOTES:
The graphs do not reflect the income taxes that you would pay on fund distributions or the redemption of fund shares. Fund performance includes reinvestment of dividends and adjustment for the maximum sales charge for Class A shares. The performance of other classes will vary from the performance of the class shown based on the difference in sales charges and fees paid by shareholders investing in different share classes.
The MSCI ACWI Index is a free float-adjusted market capitalization weighted index that is designed to measure the equity market performance of developed and emerging markets.
The MSCI World Index (U.S. Dollars) is a market-capitalization weighted index composed of companies representative of the market structure of developed market countries in North America, Europe and the Asia/Pacific region. Since inception data for the index is shown from 9/30/97 since data is only available for full monthly periods. Source: Lipper, Inc.
Index returns assume reinvestment of dividends and do not reflect deduction of fees and expenses. It is not possible to invest directly in an index.
The Fund’s use of derivative instruments involves investment risks and transaction costs to which the Fund would not be subject absent the use of these instruments and, accordingly, may result in losses greater than if they had not been used. Derivative instruments can be illiquid, may disproportionately increase losses and may have a potentially large impact on Fund performance.
Calamos Total Return Bond Fund
OVERVIEW
Through its multi-sector fixed income strategy, the Fund invests predominantly in U.S. issuers with the goal of generating a high level of both current income and total return in excess of the benchmark over full market cycles.
KEY FEATURES
| | ◾ | | Employsbond-by-bond portfolio construction with a focus on being well compensated for risks taken. We believe a disciplined process, grounded in fundamental research, enables us to achieve higher total returns with less volatility. | |
| | ◾ | | Draws on a broader investable universe to enhance portfolio construction and risk management. The inclusion of high yield bonds, bank loans and preferreds provides additional opportunities. | |
| | ◾ | | Utilizes robust, independent credit research. Our fixed income investment process unites quantitative and qualitative analyses into historical and forward-looking models. The result is a credit rating reflective of where a company is heading. | |
| | ◾ | | Applies a macro overlay to capitalize on misunderstood industries and sectors. The overlay acts as a risk control that also considers the business cycle, geopolitical factors, inflation and real rate expectations. | |
PORTFOLIO FIT
The Fund may be suitable as the cornerstone of a fixed income allocation, with investments diversified across the major sectors of the U.S. bond market. Allocations to specialized fixed income strategies seek to enhance return potential and better manage risk.
| | |
| FUND NASDAQ SYMBOLS |
| |
A Shares | | CTRAX |
C Shares | | CTRCX |
| |
I Shares | | CTRIX |
| |
|
| FUND CUSIP NUMBERS |
| |
A Shares | | 128119310 |
C Shares | | 128119286 |
| |
I Shares | | 128119278 |
| |
CALAMOS TOTAL RETURN BOND FUND
INVESTMENT TEAM DISCUSSION
How has the Fund performed?
For the 12-month period ended October 31, 2019, Calamos Total Return Bond Fund returned 10.62% (Class I shares at net asset value) underperforming the 11.51% return for the Bloomberg Barclays U.S. Aggregate Bond Index.
Since its inception on June 27, 2007, the Fund gained 4.48% on an annualized basis (Class I shares at net asset value) versus a 4.45% return for the Bloomberg Barclays U.S. Aggregate Bond Index.
What factors influenced performance?
The reporting period was marked by two distinct tones in the fixed income market. November and December of 2018 witnessed a continuation of market conditions from earlier in the fourth calendar quarter, which we characterize asrisk-off driven primarily by the Federal Reserve’s messaging that it intended to tighten financial conditions through additional increases to the federal funds rate in 2019 and beyond. The credit and equity markets reacted poorly to that posturing, causing a short-term liquidity crisis as investors and dealers fled to quality assets and credit markets found little sponsorship. Treasury yields across the curve moved lower as prices rallied significantly. High yield spreads toward the end of 2019 moved wider, as investors demanded more compensation for taking on higher levels of credit risk prior toyear-end 2018. Specifically, option-adjusted spreads for the investment-grade credit market moved from 118 basis points to 153 basis points during the months of November and December.
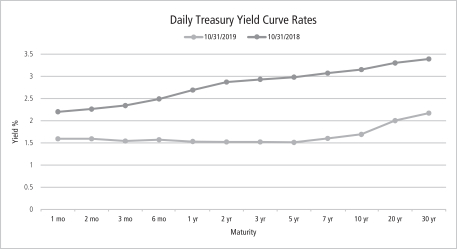
Source: U.S. Department of the Treasury
Following the 2019 new year, Chair Powell pivoted away from his hawkish stance on rates and policy accommodation, acknowledging that external pressures from both ongoing international trade disputes and the risk of a “hard Brexit” posed risks to the domestic economy. After this change in message, liquidity improved and investment-grade spreads improved briskly, tightening from the aforementioned 153 basis points to close the reporting period at 110 basis points. Other investment-grade-risk markets, such as securitized products and government agency debt, followed suit to a lesser degree.
| | | | |
| 60 | | CALAMOS OPEN-END FAMILY OF FUNDS ANNUAL REPORT | | |
Calamos Total Return Bond Fund
With a 15.4% return, corporate bonds were the best-performing sector within the index. The Fund held an overweight in corporate debt over the reporting period, but the Fund’s sector duration was shorter than the corporate component of the benchmark. As a result, the overweight allocation to corporate bonds across financial, industrial and utility related sectors contributed to performance, while security selection in industrials and utilities detracted from performance. We continue to favor an overweight to corporate bonds held primarily in shorter-than-benchmark duration issues as a means of delivering more income while mitigating the impact of credit-spread volatility.
Within the investment-grade universe,AAA-rated bonds were the weakest performer among ratings categories, and the Fund’s underweight toAAA-rated securities buoyed performance, as did security selection within the category owing to the Fund’s longer duration than the AAA universe.1 Security selection within ourBBB-rated holdings detracted from performance, again due to the shorter duration positioning of our more credit-sensitive investment-grade holdings.
How is the Fund positioned?
The Fund has an option-adjusted duration of 5.8 years equal to the 5.8 years duration of the Bloomberg Barclays U.S. Aggregate Bond Index.
The Fund continues to hold an overweight in corporate bonds in both the investment-grade andout-of-benchmark high yield ratings categories. These overweights led to a lower overall credit quality of A+ when compared to the AA quality of the benchmark. The strong rebound in credit spreads across investment-grade ratings categories, coupled with marked declines in Treasury yields, led to strong positive returns during the reporting period. While the Fund remains overweight corporate bonds and asset-backed securities, the weighting of each was reduced during the reporting period, as the team sought to capture returns associated with recent spread tightening. In turn, allocations to Treasuries and mortgage-backed securities both increased, although each sector allocation remains underweight to the benchmark.
Within the corporate bond allocation, our largest overweight allocations are found in the consumernon-cyclical and insurance sectors. The positions in the consumernon-cyclicals and insurance help us establish more of a corporate bond overweight in less-cyclical businesses. Underweight allocations include the capital goods and energy sectors.
What are your closing thoughts for Fund shareholders?
We expect the economy to achieve slow growth, with a low probability of a near-term recession. Despite recent marginal improvements to unresolved geopolitical issues along with positive reactions to Fed policy and guidance, we anticipate continued volatility in interest rate and corporate credit markets. We continue to characterize the economy as being in the late innings of expansion, with corporate credit fundamentals showing early signs of weakness. Thesupply-and-demand technicals continue to provide a favorable environment for corporate debt in theshort-to-intermediate term. There has been ample demand to meet this year’s supply, and we expect this trend to continue in the coming months as investors seek income. As always, we are applying strict discipline to ourbond-by-bond investment approach, as we believe it is critical to appropriately balance risk and reward through active risk management.
| 1 | Ratings are measured using a scale that typically ranges from AAA (highest) to D (lowest). The security’s credit rating does not eliminate risk. |
| | | | |
| ASSET ALLOCATION | |
| |
U.S. Government and Agency Securities | | | 44.6 | |
Corporate Bonds | | | 41.6 | |
| |
Asset Backed Securities | | | 5.9 | |
Bank Loans | | | 2.9 | |
Fund asset allocations are calculated as a percentage of net assets and may vary over time. The table excludes cash or cash equivalents.
Calamos Total Return Bond Fund
Opinions, estimates, forecasts, and statements of financial market trends that are based on current market conditions constitute our judgment and are subject to change without notice. The views and strategies described may not be suitable for all investors. References to specific securities, asset classes and financial markets are for illustrative purposes only and are not intended to be, and should not be interpreted as, recommendations.
ANNUALIZED RETURN: SINCE INCEPTION (6/27/07) THROUGH 10/31/19
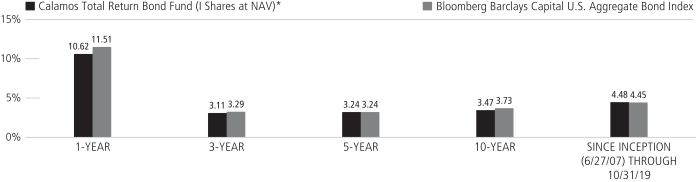
Performance data quoted represents past performance, which is no guarantee of future results. Current performance may be lower or higher than the performance quoted.
The principal value and investment return of an investment will fluctuate so that your shares, when redeemed, may be worth more or less than their original cost. You can obtain performance data current to the most recent month end by visiting www.calamos.com. Average annual total return measures net investment income and capital gain or loss from portfolio investments as an annualized average. All performance shown assumes reinvestment of dividends and capital gains distributions. Performance is for the Fund’s Class I shares at net asset value. The Fund also offers Class A and Class C shares, the performance of which may vary. Source: State Street Corporation and Mellon Analytical Solutions, LLC.
Duration is useful in measuring a bond fund’s sensitivity to changes in interest rates. The longer the duration, the more a bond fund’s price will fluctuate when interest rates change.
| * | Annual returns for Class I shares are provided because Class I shares represent the largest percentage of assets in the Calamos Family of Funds. |
| | | | |
| 62 | | CALAMOS OPEN-END FAMILY OF FUNDS ANNUAL REPORT | | |
Calamos Total Return Bond Fund
GROWTH OF $1,000,000: FOR THE 10-YEAR PERIOD ENDED 10/31/19
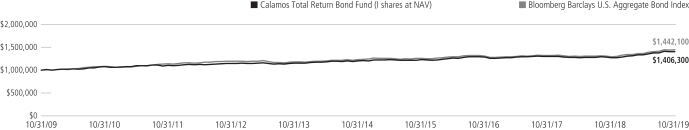
AVERAGE ANNUAL TOTAL RETURN† AS OF 10/31/19
| | | | | | | | | | | | | | | |
| | | 1
YEAR | | 5
YEARS | | 10
YEARS |
Class A Shares – Inception 6/27/07 | | | | | | | | | | | | | | | |
Without Sales Charge | | | | 10.24 | % | | | | 2.97 | % | | | | 3.20 | % |
With Sales Charge | | | | 7.72 | | | | | 2.18 | | | | | 2.81 | |
Class C Shares – Inception 6/27/07 | | | | | | | | | | | | | | | |
Without Sales Charge | | | | 9.42 | | | | | 2.20 | | | | | 2.44 | |
With Sales Charge | | | | 8.42 | | | | | 2.20 | | | | | 2.44 | |
Class I Shares – Inception 6/27/07 | | | | 10.62 | | | | | 3.24 | | | | | 3.47 | |
Performance data quoted represents past performance, which is no guarantee of future results. Current performance may be lower or higher than the performance quoted. The principal value and investment return of an investment will fluctuate so that your shares, when redeemed, may be worth more or less than their original cost.
As of the prospectus dated 3/1/19, the Fund’s gross expense ratio for Class A shares is 1.05%; Class C shares is 1.80% and Class I shares is 0.80%. The Fund’s investment advisor has contractually agreed to reimburse Fund expenses through March 1, 2022 to the extent necessary so that Total Annual Fund Operating Expenses (excluding taxes, interest, short interest, short dividend expenses, brokerage commissions, acquired fund fees and expenses, and extraordinary expenses, if any) of Class A, Class C, and Class I are limited to 0.90%, 1.65%, and 0.65% of average net assets, respectively. Calamos Advisors may recapture previously waived expense amounts within the same fiscal year for any day where the respective Fund’s expense ratio falls below the contractual expense limit up to the expense limit for that day. This undertaking is binding on Calamos Advisors and any of its successors and assigns. This agreement is not terminable by either party. The expense ratios shown above may differ from the more recent expense ratios reported in the Financial Highlight section of this report.
| † | Average annual total return measures net investment income and capital gain or loss from portfolio investments as an annualized average assuming reinvestment of dividends and capital gains distributions. Load-adjusted returns are adjusted for the maximumfront-end sales load of 2.25% for Class A shares and returns for Class C shares have been adjusted for the contingent deferred sales charge (CDSC). |
NOTES:
The graph does not reflect the income taxes that you would pay on fund distributions or the redemption of fund shares. Fund performance includes reinvestment of dividends and adjustment for the maximum sales charge for Class A shares. The performance of other classes will vary from the performance of the class shown based on the difference in sales charges and fees paid by shareholders investing in different share classes.
The Bloomberg Barclays U.S. Aggregate Bond Index is considered generally representative of the investment-grade bond market. Source: Lipper, Inc.
Index returns assume reinvestment of dividends and do not reflect deduction of fees and expenses. It is not possible to invest directly in an index.
Calamos High Income Opportunities Fund
OVERVIEW
Through its multi-sector fixed income strategy, the Fund invests mainly in high yield securities from U.S. issuers with the goal of generating a high level of current income and total return that provides consistent excess returns over full market cycles.
KEY FEATURES
| | ◾ | | Employsbond-by-bond portfolio construction with a focus on being well compensated for risks taken. We believe a disciplined process, grounded in fundamental research, enables us to achieve higher total returns with less volatility. | |
| | ◾ | | Draws on broader investable universe to enhance portfolio construction and risk management. Expanding the universe to include bank loans and preferred securities provides additional opportunities. | |
| | ◾ | | Utilizes robust, independent credit research. Our fixed income investment process unites quantitative and qualitative analyses into historical and forward-looking models. The result is a credit rating that reflects where a company is heading. | |
| | ◾ | | Applies a macro overlay to capitalize on opportunities in misunderstood industries and sectors. The overlay acts as a risk control that also considers the business cycle, geopolitics, inflation and real rate expectations. | |
PORTFOLIO FIT
The Fund can complement investment-grade credit exposure, providing attractive income and total return potential for more risk-tolerant investors.
| | |
| FUND NASDAQ SYMBOLS |
| |
A Shares | | CHYDX |
C Shares | | CCHYX |
| |
I Shares | | CIHYX |
| |
|
| FUND CUSIP NUMBERS |
| |
A Shares | | 128119815 |
C Shares | | 128119799 |
| |
I Shares | | 128119781 |
| |
CALAMOS HIGH INCOME OPPORTUNITIES FUND
INVESTMENT TEAM DISCUSSION
How has the Fund performed?
For the12-month period ended October 31, 2019, Calamos High Income Opportunities Fund returned 6.11% (Class I shares at net asset value) versus a gain of 8.38% for the Bloomberg Barclays U.S. Corporate High Yield 2% Issuer Capped Index.
Since Class I Shares inception on March 1, 2002, the Fund gained 6.34% on an annualized basis (Class I shares at net asset value) versus a 8.14% return for the Bloomberg Barclays U.S. Corporate High Yield 2% Issuer Capped Index.
What factors influenced performance?
Two distinct tones marked the high yield credit market during the annual period. November and December of 2018 witnessed a continuation of market conditions from earlier in the fourth calendar quarter, which we characterize asrisk-off driven primarily by the Federal Reserve’s messaging that it intended to continuing tightening financial conditions by increasing the federal funds rate in 2019 and beyond. The credit and equity markets reacted poorly to that posturing, causing a short-term liquidity crisis as investors and dealers fled to quality assets and high yield bonds found little sponsorship. Treasury yields across the curve moved lower as prices rallied significantly. High yield spreads toward the end of 2018 moved wider, as investors demanded more compensation for taking on higher levels of credit risk. Specifically, option-adjusted spreads for the high yield market moved from 372 basis points to 526 basis points during November and December of 2018.
Performance of the high yield asset class reversed sharply in the first quarter of 2019, as Chair Powell pivoted away from his hawkish stance on rates and accommodation, liquidity regained its health, and spreads tightened from the aforementioned 526 basis points to close the first calendar quarter at 391 basis points. The total return for the Fund’s primary benchmark during the first three months of 2019 was a strong 7.26%.
| | | | |
| 64 | | CALAMOS OPEN-END FAMILY OF FUNDS ANNUAL REPORT | | |
Calamos High Income Opportunities Fund
The months that followed up until the close of the annual period saw a continued rally in Treasury notes and bonds. With all rates beyondone-year maturities on the Treasury yield curve falling by at least 100 basis points during the annual reporting period, high yield credit spreads have been largely range bound.
Despite the rally in risk assets during the period, there was a limit to the generic level of credit risk that attracted investors. Higher-quality, below-investment-grade bonds rated BB delivered returns of 11.6%, whereasCCC-rated issuers delivered a loss of-2.0%.1 Idiosyncratic circumstances drove part of the differential, as default rates increased year-over-year from 2.0% to 2.8%, with much of the increase driven by defaults in the energy sector. As a result, our underweight toBB-rated bonds impacted performance negatively, while our overweight toout-of-benchmark,BBB-rated credits was a positive.
From a sector perspective, the team’s security selection within the basic industry and consumer cyclical sectors contributed to return. Conversely, our security selection within the energy and consumernon-cyclical sectors detracted from performance.
How is the Fund positioned?
The Fund is currently overweight the pharmaceuticals, property and casualty insurance, and brokerage/asset managers industries. The pharmaceutical overweight is a result of idiosyncratic opportunities in three companies, while the property and casualty insurance overweight is connected to favorable consolidation trends in the industry. Our largest underweights are in the metals and mining, banking and chemicals industries. The underweight to metals and mining is driven by our cautious view of cyclical demand for industrial and commercial construction raw materials.
From a credit-quality perspective, the Fund is positioned with a relative underweight in the BB category, while currently overweight both BBB and B issuers. The Fund is positioned short (3.0 years) in comparison to the option-adjusted duration2 of the Bloomberg Barclays U.S. Corporate High Yield 2% Issuer Capped Index (3.1 years).
Over the reporting period, the team has added to positions in the cable/satellite, automotive, and property and casualty insurance industries. In addition, we reduced the portfolio exposure to independent energy, metals and mining, and midstream energy credit. Independent energy and metals & mining are underweight positions, while midstream remains a slight overweight following the reduction of exposure.
What are your closing thoughts for Fund shareholders?
We expect the economy to achieve slow growth, with a low probability of near-term recession. However, the growing list of unresolved geopolitical issues along with market reactions to Fed policy and guidance lead us to anticipate continued volatility in interest rate and corporate credit markets. We continue to characterize the economy as being in the late innings of expansion, with corporate credit fundamentals showing signs of weakness. Thesupply-and-demand technicals continue to provide a favorable environment for corporate debt in theshort-to-intermediate term. There has been ample demand to meet this year’s supply, and we expect that environment to continue in coming months as investors continue to seek income. Given the uptick in the trailing12-month default rate to roughly 2.5%, we believe investors need to be vigilant in the
| 1 | Ratings are measured using a scale that typically ranges from AAA (highest) to D (lowest). The security’s credit rating does not eliminate risk. |
| 2 | Duration provides a measure of the Fund’s interest rate sensitivity. The longer a fund’s duration, the more sensitive it is to changes in interest rates. |
| | | | |
| SECTOR WEIGHTINGS | | | |
| |
Consumer Discretionary | | | 16.2 | % |
Communication Services | | | 15.7 | |
| |
Financials | | | 14.1 | |
Industrials | | | 13.8 | |
| |
Health Care | | | 12.2 | |
Energy | | | 10.1 | |
| |
Consumer Staples | | | 4.1 | |
Materials | | | 3.1 | |
| |
Information Technology | | | 2.1 | |
Utilities | | | 1.3 | |
| |
Real Estate | | | 0.8 | |
| | | | | |
Asset Allocation weightings are subject to change daily and are calculated as a percentage of net assets. The table excludes cash or cash equivalents, any government/sovereign bonds or broad based index hedging securities the Fund may hold.
Calamos High Income Opportunities Fund
selection of high yield credits. As always, we are applying strict discipline to ourbond-by-bond investment approach, as we believe it is critical to balance risk and reward appropriately through active risk management.
Opinions, estimates, forecasts, and statements of financial market trends that are based on current market conditions constitute our judgment and are subject to change without notice. The views and Strategies described may not be suitable for all investors. References to specific securities, asset classes and financial markets are for illustrative purposes only and are not intended to be, and should not be interpreted as, recommendations.
ANNUALIZED RETURN: SINCE INCEPTION (3/1/02) THROUGH 10/31/19
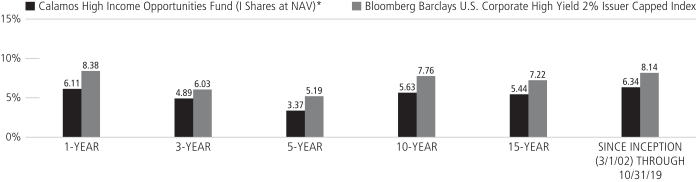
Performance data quoted represents past performance, which is no guarantee of future results.Current performance may be lower or higher than the performance quoted.
The principal value and investment return of an investment will fluctuate so that your shares, when redeemed, may be worth more or less than their original cost. You can obtain performance data current to the most recent month end by visiting www.calamos.com. Average annual total return measures net investment income and capital gain or loss from portfolio investments as an annualized average. All performance shown assumes reinvestment of dividends and capital gains distributions. Performance is for the Fund’s Class I shares at net asset value. The Fund also offers Class A and Class C shares, the performance of which may vary. Source: State Street Corporation and Mellon Analytical Solutions, LLC.
| * | Annual returns for Class I shares are provided because Class I shares represent the largest percentage of assets in the Calamos Family of Funds. |
| | | | |
| 66 | | CALAMOS OPEN-END FAMILY OF FUNDS ANNUAL REPORT | | |
Calamos High Income Opportunities Fund
GROWTH OF $1,000,000: FOR THE 10-YEAR PERIOD ENDED 10/31/19
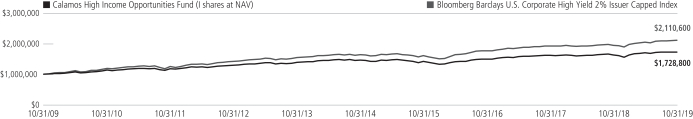
AVERAGE ANNUAL TOTAL RETURN† AS OF 10/31/19
| | | | | | | | | | | | | | | |
| | | 1
YEAR | | 5
YEARS | | 10 YEARS |
Class A Shares – Inception 8/2/99 | | | | | | | | | | | | | | | |
Without Sales Charge | | | | 5.85 | % | | | | 3.11 | % | | | | 5.36 | % |
With Sales Charge | | | | 3.50 | | | | | 2.11 | | | | | 4.86 | |
Class C Shares – Inception 12/21/00 | | | | | | | | | | | | | | | |
Without Sales Charge | | | | 5.04 | | | | | 2.32 | | | | | 4.56 | |
With Sales Charge | | | | 4.04 | | | | | 2.32 | | | | | 4.56 | |
Class I Shares – Inception 3/1/02 | | | | 6.11 | | | | | 3.37 | | | | | 5.63 | |
Performance data quoted represents past performance, which is no guarantee of future results. Current performance may be lower or higher than the performance quoted. The principal value and investment return of an investment will fluctuate so that your shares, when redeemed, may be worth more or less than their original cost.
As of the prospectus dated 3/1/19, the Fund’s gross expense ratio for Class A shares is 1.46%, Class C is 2.22% and Class I is 1.21%. The Fund’s investment advisor has contractually agreed to reimburse Fund expenses through March 1, 2022, to the extent necessary so that Total Annual Fund Operating Expenses (excluding taxes, interest, short interest, short dividend expenses, brokerage commissions, acquired fund fees and expenses, and extraordinary expenses, if any) of Class A, Class C, and Class I are limited to 1.00%, 1.75%, and 0.75% of average net assets, respectively. Calamos Advisors may recapture previously waived expense amounts within the same fiscal year for any day where the respective Fund’s expense ratio falls below the contractual expenses limit up to the expense limit for that day. This undertaking is binding on Calamos Advisors and any of its successors and assigns. This agreement is not terminable by either party. The expense ratios shown above may differ from the more recent expense ratios reported in the Financial Highlight section of this report.
| † | Average annual total return measures net investment income and capital gain or loss from portfolio investments as an annualized average assuming reinvestment of dividends and capital gains distributions. Performance shown reflects the effects of an expense reimbursement that improved results and was in effect until March 31, 2003. Load-adjusted returns are adjusted for the maximum front-end sales load of 2.25% for Class A shares and returns for Class C shares have been adjusted for the contingent deferred sales charge (CDSC). |
NOTES:
The graphs do not reflect the income taxes that you would pay on fund distributions or the redemption of fund shares. Fund performance includes reinvestment of dividends and adjustment for the maximum sales charge for Class A shares. The performance of other classes will vary from the performance of the class shown based on the difference in sales charges and fees paid by shareholders investing in different share classes.
The Bloomberg Barclays U.S. Corporate High Yield 2% Issuer Capped Index measures the performance of high yield corporate bonds with a maximum allocation of 2% to any one issuer.
Index returns assume reinvestment of dividends and do not reflect deduction of fees and expenses. It is not possible to invest directly in an index.
Calamos Short-Term Bond Fund
OVERVIEW
Through its multi-sector fixed income strategy, the fund invests predominantly in U.S. issuers with the goal of generating a high level of current income and total return in excess of the benchmark over full market cycles.
KEY FEATURES
| | ◾ | | Employsbond-by-bond portfolio construction with a focus on being well compensated for risks taken. We believe a disciplined process, grounded in fundamental research, enables us to achieve higher total returns with less volatility. | |
| | ◾ | | Draws on a broader investable universe to enhance portfolio construction and risk management. Expanding the universe to include high yield bonds, bank loans and preferreds provides additional opportunities. | |
| | ◾ | | Utilizes robust, independent credit research. Our fixed income investment process unites quantitative and qualitative analyses into historical and forward-looking models. The result is a credit rating reflective of where a company is heading. | |
| | ◾ | | Applies a macro overlay to capitalize on misunderstood industries and sectors. The overlay acts as a risk control that also considers the business cycle, geopolitics, inflation and real rate expectations. | |
PORTFOLIO FIT
The Fund may be suitable for investors seeking current income accompanied by lower volatility over a one-year to two-year time horizon.
| | |
| FUND NASDAQ SYMBOLS |
| |
A Shares | | CSTBX |
I Shares | | CSTIX |
|
| FUND CUSIP NUMBERS |
| |
A Shares | | 128120441 |
I Shares | | 128120433 |
CALAMOS SHORT-TERM BOND FUND
INVESTMENT TEAM DISCUSSION
How has the Fund performed?
For the12-month period ended October 31, 2019, Calamos Short-Term Bond Fund returned 5.09% (Class I shares at net asset value) slightly outperforming the 4.89% return of the Bloomberg Barclays1-3 Year Government/Credit Index and 5.51% return for the Bloomberg Barclays U.S. 1-3 Year Credit Index.
Since its inception on September 19, 2018, the Fund gained 4.69% on an annualized basis (Class I shares at net asset value) versus a 4.58% return for the Bloomberg Barclays1-3 Year Government/Credit Index and 5.08% return for the Bloomberg Barclays U.S. 1-3 Year Credit Index.
What factors influenced performance?
The reporting period was marked by two distinct tones in the fixed income market. November and December of 2018 witnessed a continuation of market conditions from earlier in the fourth calendar quarter, which we characterize asrisk-off driven primarily by the Federal Reserve’s messaging that it intended to tighten financial conditions through additional increases to the federal funds rate in 2019 and beyond. The credit and equity markets reacted poorly to that posturing, causing a short-term liquidity crisis as investors and dealers fled to quality assets, and credit markets found little sponsorship. Treasury yields across the curve moved lower as prices rallied significantly. Option-adjusted spreads for the short-term investment-grade credit market moved from 59 basis points to 86 basis points during the months of November and December.
Following the new year, Chair Powell pivoted away from his hawkish stance on rates and policy accommodation, acknowledging that external pressures from both ongoing international trade disputes and the risk of a “hard Brexit” posed risks to the U.S. economy. After this change in message, liquidity improved and short-term investment-grade spreads improved briskly, tightening from the aforementioned 86 basis points to close the period at 50 basis points. Other short-term investment grade risk markets, such as securitized products and government agency debt, followed suit to a lesser degree. Both Treasury yield and credit spread factors helped drive positive returns across all major sectors of the Bloomberg Barclays1-3 Year Government/Credit Index.
With a 5.6% return, corporate bonds were the best-performing sector within the index for the 12-month period ended October 31, 2019. The Fund held an overweight in corporate debt over the reporting period. As a result, the overweight allocation and security selection across financial, industrial and utility-related sectors contributed positively to performance. We continue to favor an overweight to corporate bonds and asset-backed securities in the Short-Term Bond Fund, as visibility for company operations and consumer credit performance are high over the life of the securities the Fund holds.
How is the Fund positioned?
The Fund has a neutral duration1 to the 1.8 years duration of the Bloomberg Barclays1-3 Year Government/Credit Index, the Fund’s benchmark.
| 1 | Duration provides a measure of the Fund’s interest rate sensitivity. The longer a fund’s duration, the more sensitive it is to shifts in interest rates. |
| | | | |
| 68 | | CALAMOS OPEN-END FAMILY OF FUNDS ANNUAL REPORT | | |
Calamos Short-Term Bond Fund
The Fund continues to hold an overweight in corporate bonds in both the investment-grade andout-of-benchmark high yield ratings categories. These overweights led to a lower overall credit quality of A when compared to the AA+ quality of the benchmark.
The strong rebound in credit spreads across investment-grade ratings categories, coupled with marked declines in Treasury yields, led to strong positive returns during the reporting period. While the Fund remains overweight corporate bonds and asset-backed securities, the weighting of financial-related corporate bonds was reduced during the reporting period, with a corresponding increase in the allocation to Treasuries, though the Fund continued to be underweight Treasuries and Agencies following the changes.
Within the corporate bond allocation, we are overweight each sector of the market. The largest overweight allocations went toward the consumer cyclical and consumernon-cyclical sectors, with the smallest going to the other industrial and banking sectors.
What are your closing thoughts for Fund shareholders?
We expect the economy to achieve slow growth, with a low probability of near-term recession. Despite recent marginal improvements to unresolved geopolitical issues, along with positive market reactions to Fed policy and guidance, we anticipate continued volatility in interest rate and corporate credit markets. We continue to characterize the economy as being in the late innings of expansion, with corporate credit fundamentals showing early signs of weakness. Thesupply-and-demand technicals continue to provide a favorable environment for corporate debt in the short to intermediate term. There has been ample demand to meet this year’s supply, and we expect this trend to continue in the coming months as investors seek income. As always, we are applying strict discipline to ourbond-by-bond investment approach, as we believe it is critical to appropriately balance risk and reward through active risk management.
Opinions, estimates, forecasts, and statements of financial market trends that are based on current market conditions constitute our judgment and are subject to change without notice. The views and strategies described may not be suitable for all investors. References to specific securities, asset classes and financial markets are for illustrative purposes only and are not intended to be, and should not be interpreted as, recommendations.
| | | | |
| ASSET ALLOCATION | |
| |
Corporate Bonds | | | 71.2 | % |
Asset Backed Securities | | | 14.7 | |
| |
U.S. Government and Agency Securities | | | 7.0 | |
Bank Loans | | | 4.2 | |
| |
Residential Mortgage Backed Securities | | | 1.7 | |
Municipal Obligations | | | 0.3 | |
| |
Convertible Bonds | | | 0.2 | |
| | | | | |
Fund asset allocations are calculated as a percentage of net assets and may vary over time. The table excludes cash or cash equivalents.
Calamos Short-Term Bond Fund
GROWTH OF $1,000,000: SINCE INCEPTION THROUGH 10/31/19
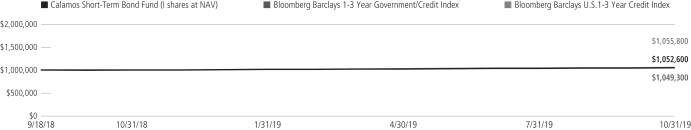
AVERAGE ANNUAL TOTAL RETURN† AS OF 10/31/19
| | | | | | | | | | |
| | | 1
YEAR | | SINCE
INCEPTION |
Class A Shares – Inception 9/19/18 | | | | | | | | | | |
Without Sales Charge | | | | 4.84 | % | | | | 4.43 | % |
With Sales Charge | | | | 2.48 | | | | | 2.33 | |
Class I Shares – Inception 9/19/18 | | | | 5.09 | | | | | 4.69 | |
Performance data quoted represents past performance, which is no guarantee of future results. Current performance may be lower or higher than the performance quoted. The principal value and investment return of an investment will fluctuate so that your shares, when redeemed, may be worth more or less than their original cost.
As of the prospectus dated 3/1/19, the Fund’s gross expense ratio for Class A shares is 0.95% and Class I is 0.70%. The Fund’s investment advisor has contractually agreed to reimburse Fund expenses through 3/1/22 to the extent necessary so that Total Annual Fund Operating Expenses (excluding taxes, interest, short interest, short dividend expenses, brokerage commissions, acquired fund fees and expenses, and extraordinary expenses, if any) of Class A and Class I are limited to 0.65% and 0.40% of average net assets, respectively. Calamos Advisors may recapture previously waived expense amounts within the same fiscal year for any day where the respective Fund’s expense ratio falls below the contractual expense limit up to the expense limit for that day. This undertaking is binding on Calamos Advisors and any of its successors and assigns. This agreement is not terminable by either party. The expense ratios shown above may differ from the more recent expense ratios reported in the Financial Highlights section of this report.
| † | Average annual total return measures net investment income and capital gain or loss from portfolio investments as an annualized average assuming reinvestment of dividends and capital gains distributions. Performance shown reflects the effects of an expense reimbursement that improved results. Load-adjusted returns are adjusted for the maximum front-end sales load of 2.25% for Class A shares. |
NOTES:
The Bloomberg Barclays Government/Credit 1-3 Year Index includes all medium and larger issues of U.S. government, investment-grade corporate, and investment-grade international dollar-denominated bonds that have maturities of between 1 and 3 years and are publicly issued.
The Bloomberg Barclays U.S. 1-3 Year Credit Index measures the investment-grade, U.S. dollar-denominated, fixed-rate, taxable corporate and government-related bond markets. It is composed of the U.S. Corporate Index and a non-corporate component that includes foreign agencies, sovereigns, supranationals and local authorities that have maturities of between 1 and 3 years.
Index returns assume reinvestment of dividends and do not reflect deduction of fees and expenses. It is not possible to invest directly in an index.
| | | | |
| 70 | | CALAMOS OPEN-END FAMILY OF FUNDS ANNUAL REPORT | | |
Expense Overview
EXPENSE OVERVIEW
As a shareholder of a mutual fund, you incur two types of costs. You incur:
1) Transaction costs, including sales charges, or loads, on purchase payment and redemption fees.
2) Ongoing costs, including management fees, distribution and/or service (12b-1) fees and other fund expenses.
The examples in this report are based on an investment of $1,000 made at the beginning of the period and held for the entire period from May 1, 2019 to October 31, 2019. It is intended to help you understand the ongoing costs associated with investing in each mutual fund and to compare these costs with the ongoing costs of investing in other mutual funds.
There are two parts of each Fund’s chart:
Actual
In this part of the chart, you’ll see the actual expenses you would have paid on a $1,000 investment made at the beginning of the period and held for the entire period in each fund from May 1, 2019 to October 31, 2019, the period covered by this report. This chart also shows the actual returns, after expenses, you would have earned during that time. This chart can help you estimate your own expenses. For example, if you invested $8,600 in Class A shares of the fund, simply divide $8,600 by $1,000, then multiply that result by the figure in the Actual Expenses per $1,000 row. In this example, you would multiply 8.6 times the figure.
Hypothetical
In this part of the chart, you’ll see the hypothetical expenses you would have paid on a $1,000 investment from May 1, 2019 to October 31, 2019, and the hypothetical returns, after expenses, you would have earned during that time. The Securities and Exchange Commission (SEC) has established the guidelines for this chart, including the assumed 5% annual rate of return before expenses, which is what you’ll see in the chart. Note that this chart will not help you determine your own expenses, but will help you compare expenses of the fund you own to the expenses of another fund since the information for that fund should be calculated using the same assumptions.
Please note that the expenses shown in the chart are meant to highlight your ongoing costs only and do not include any transactional costs, such as sales charges (loads), redemption fees or exchange fees. Therefore, the second line of the chart is useful in comparing ongoing costs only and will not help you determine the relative total costs of owning different funds. In addition, if these transaction costs were included, your costs would have been higher.
Expense Example
The actual and hypothetical examples shown assume a $1,000 investment at the beginning of the period, May 1, 2019 and held through October 31, 2019.
| | | | | | | | | | | | | | | | |
| | | CLASS A
SHARES | | | CLASS C
SHARES | | | CLASS I
SHARES | | | CLASS R6
SHARES | |
| CALAMOS MARKET NEUTRAL INCOME FUND | | | | | | | | | |
Actual Expenses per $1,000* | | $ | 6.27 | | | $ | 10.07 | | | $ | 5.00 | | | $ | — | |
Actual – Ending Balance | | $ | 1,022.20 | | | $ | 1,018.60 | | | $ | 1,023.70 | | | $ | — | |
| | | | |
Hypothetical Expenses per $1,000* | | $ | 6.26 | | | $ | 10.06 | | | $ | 4.99 | | | $ | — | |
Hypothetical – Ending Value | | $ | 1,019.00 | | | $ | 1,015.22 | | | $ | 1,020.26 | | | $ | — | |
| | | | |
Annualized expense ratio(1),(2) | | | 1.23% | | | | 1.98% | | | | 0.98% | | | | — | |
| CALAMOS HEDGED EQUITY FUND | | | | | | | | | |
Actual Expenses per $1,000* | | $ | 6.12 | | | $ | 9.93 | | | $ | 4.85 | | | $ | — | |
Actual – Ending Balance | | $ | 1,024.80 | | | $ | 1,020.90 | | | $ | 1,025.80 | | | $ | — | |
| | | | |
Hypothetical Expenses per $1,000* | | $ | 6.11 | | | $ | 9.91 | | | $ | 4.84 | | | $ | — | |
Hypothetical – Ending Value | | $ | 1,019.16 | | | $ | 1,015.38 | | | $ | 1,020.42 | | | $ | — | |
| | | | |
Annualized expense ratio(3) | | | 1.20% | | | | 1.95% | | | | 0.95% | | | | — | |
| CALAMOS PHINEUS LONG/SHORT FUND | | | | | | | | | |
Actual Expenses per $1,000* | | $ | 16.45 | | | $ | 20.17 | | | $ | 15.17 | | | $ | — | |
Actual – Ending Balance | | $ | 983.90 | | | $ | 980.90 | | | $ | 985.70 | | | $ | — | |
| | | | |
Hypothetical Expenses per $1,000* | | $ | 16.66 | | | $ | 20.42 | | | $ | 15.35 | | | $ | — | |
Hypothetical – Ending Value | | $ | 1,008.62 | | | $ | 1,004.84 | | | $ | 1,009.93 | | | $ | — | |
| | | | |
Annualized expense ratio(1),(2) | | | 3.29% | | | | 4.04% | | | | 3.03% | | | | — | |
| CALAMOS CONVERTIBLE FUND | | | | | | | | | |
Actual Expenses per $1,000* | | $ | 5.90 | | | $ | 9.69 | | | $ | 4.68 | | | $ | — | |
Actual – Ending Balance | | $ | 1,016.80 | | | $ | 1,013.10 | | | $ | 1,018.60 | | | $ | — | |
| | | | |
Hypothetical Expenses per $1,000* | | $ | 5.90 | | | $ | 9.70 | | | $ | 4.69 | | | $ | — | |
Hypothetical – Ending Value | | $ | 1,019.36 | | | $ | 1,015.58 | | | $ | 1,020.57 | | | $ | — | |
| | | | |
Annualized expense ratio | | | 1.16% | | | | 1.91% | | | | 0.92% | | | | — | |
| CALAMOS GLOBAL CONVERTIBLE FUND | | | | | | | | | |
Actual Expenses per $1,000* | | $ | 6.67 | | | $ | 10.46 | | | $ | 5.40 | | | $ | — | |
Actual – Ending Balance | | $ | 1,019.80 | | | $ | 1,015.40 | | | $ | 1,020.20 | | | $ | — | |
| | | | |
Hypothetical Expenses per $1,000* | | $ | 6.67 | | | $ | 10.46 | | | $ | 5.40 | | | $ | — | |
Hypothetical – Ending Value | | $ | 1,018.60 | | | $ | 1,014.82 | | | $ | 1,019.86 | | | $ | — | |
| | | | |
Annualized expense ratio | | | 1.31% | | | | 2.06% | | | | 1.06% | | | | — | |
| CALAMOS TIMPANI SMALL CAP GROWTH FUND | | | | | | | | | |
Actual Expenses per $1,000** | | $ | 16.65 | | | $ | — | | | $ | 13.60 | | | $ | 4.18 | |
Actual – Ending Balance | | $ | 947.40 | | | $ | — | | | $ | 948.90 | | | $ | 993.00 | |
| | | | |
Hypothetical Expenses per $1,000** | | $ | 17.14 | | | $ | — | | | $ | 14.01 | | | $ | 4.23 | |
Hypothetical – Ending Value | | $ | 1,003.86 | | | $ | — | | | $ | 1,007.00 | | | $ | 1,016.80 | |
| | | | |
Annualized expense ratio(3) | | | 4.08% | | | | — | | | | 3.33% | | | | 1.00% | |
| CALAMOS TIMPANI SMID GROWTH FUND | | | | | | | | | |
Actual Expenses per $1,000** | | $ | 3.28 | | | $ | — | | | $ | 2.64 | | | $ | 2.56 | |
Actual – Ending Balance | | $ | 901.00 | | | $ | — | | | $ | 902.00 | | | $ | 902.00 | |
| | | | |
Hypothetical Expenses per $1,000** | | $ | 3.47 | | | $ | — | | | $ | 2.79 | | | $ | 2.71 | |
Hypothetical – Ending Value | | $ | 1,009.15 | | | $ | — | | | $ | 1,009.83 | | | $ | 1,009.90 | |
| | | | |
Annualized expense ratio(3) | | | 1.37% | | | | — | | | | 1.10% | | | | 1.07% | |
| * | Expenses for all Fund Classes A, C, and I are equal to the Fund’s annualized expense ratio, multiplied by the average account value over the period, multiplied by 184/365. |
| ** | Expenses for all Fund Classes A, I, and R6 are equal to the Fund’s annualized expense ratio, multiplied by the average account value over the period, multiplied by 153/365. |
| (1) | Annualized Expense Ratios for Market Neutral Income Fund and Phineus Long/Short Fund are adjusted to reflect fee waiver related to their investment in an affiliated fund. |
| (2) | Includes 0.18% and 1.29% related to dividend expense on short positions for Market Neutral Income Fund and Phineus Long/Short Fund, respectively. |
| (3) | Annualized Expense Ratios for Hedged Equity Fund, Timpani Small Cap Growth Fund and Timpani SMID Growth Fund are adjusted to reflect an expense limitation agreement. |
| | | | |
| 72 | | CALAMOS OPEN-END FAMILY OF FUNDS ANNUAL REPORT | | |
Expense Example
The actual and hypothetical examples shown assume a $1,000 investment at the beginning of the period, May 1, 2019 and held through October 31, 2019.
| | | | | | | | | | | | | | | | |
| | | CLASS A
SHARES | | | CLASS C
SHARES | | | CLASS I
SHARES | | | CLASS R6
SHARES | |
| CALAMOS GROWTH FUND | | | | | | | | | |
Actual Expenses per $1,000* | | $ | 6.77 | | | $ | 10.58 | | | $ | 5.50 | | | $ | — | |
Actual – Ending Balance | | $ | 1,020.90 | | | $ | 1,017.30 | | | $ | 1,022.20 | | | $ | — | |
| | | | |
Hypothetical Expenses per $1,000* | | $ | 6.77 | | | $ | 10.56 | | | $ | 5.50 | | | $ | — | |
Hypothetical – Ending Value | | $ | 1,018.50 | | | $ | 1,014.72 | | | $ | 1,019.76 | | | $ | — | |
| | | | |
Annualized expense ratio(1) | | | 1.33% | | | | 2.08% | | | | 1.08% | | | | — | |
| CALAMOS GROWTH AND INCOME FUND | | | | | | | | | |
Actual Expenses per $1,000* | | $ | 5.57 | | | $ | 9.39 | | | $ | 4.30 | | | $ | — | |
Actual – Ending Balance | | $ | 1,027.70 | | | $ | 1,023.60 | | | $ | 1,028.90 | | | $ | — | |
| | | | |
Hypothetical Expenses per $1,000* | | $ | 5.55 | | | $ | 9.35 | | | $ | 4.28 | | | $ | — | |
Hypothetical – Ending Value | | $ | 1,019.71 | | | $ | 1,015.93 | | | $ | 1,020.97 | | | $ | — | |
| | | | |
Annualized expense ratio | | | 1.09% | | | | 1.84% | | | | 0.84% | | | | — | |
| CALAMOS DIVIDEND GROWTH FUND | | | | | | | | | |
Actual Expenses per $1,000* | | $ | 6.92 | | | $ | 10.74 | | | $ | 5.64 | | | $ | — | |
Actual – Ending Balance | | $ | 1,034.10 | | | $ | 1,029.90 | | | $ | 1,035.40 | | | $ | — | |
| | | | |
Hypothetical Expenses per $1,000* | | $ | 6.87 | | | $ | 10.66 | | | $ | 5.60 | | | $ | — | |
Hypothetical – Ending Value | | $ | 1,018.40 | | | $ | 1,014.62 | | | $ | 1,019.66 | | | $ | — | |
| | | | |
Annualized expense ratio(2) | | | 1.35% | | | | 2.10% | | | | 1.10% | | | | — | |
| CALAMOS OPPORTUNISTIC VALUE FUND | | | | | | | | | |
Actual Expenses per $1,000* | | $ | 5.89 | | | $ | 9.72 | | | $ | 4.62 | | | $ | — | |
Actual – Ending Balance | | $ | 1,032.70 | | | $ | 1,029.10 | | | $ | 1,034.70 | | | $ | — | |
| | | | |
Hypothetical Expenses per $1,000* | | $ | 5.85 | | | $ | 9.65 | | | $ | 4.58 | | | $ | — | |
Hypothetical – Ending Value | | $ | 1,019.41 | | | $ | 1,015.63 | | | $ | 1,020.67 | | | $ | — | |
| | | | |
Annualized expense ratio(2) | | | 1.15% | | | | 1.90% | | | | 0.90% | | | | — | |
| CALAMOS INTERNATIONAL GROWTH FUND(a) | | | | | | | | | |
Actual Expenses per $1,000* | | $ | 5.64 | | | $ | 9.46 | | | $ | 4.36 | | | $ | 4.05 | |
Actual – Ending Balance | | $ | 1,032.70 | | | $ | 1,028.40 | | | $ | 1,033.50 | | | $ | 1,033.80 | |
| | | | |
Hypothetical Expenses per $1,000* | | $ | 5.60 | | | $ | 9.40 | | | $ | 4.33 | | | $ | 4.02 | |
Hypothetical – Ending Value | | $ | 1,019.66 | | | $ | 1,015.88 | | | $ | 1,020.92 | | | $ | 1,021.20 | |
| | | | |
Annualized expense ratio(2) | | | 1.10% | | | | 1.85% | | | | 0.85% | | | | 0.79% | |
| CALAMOS EVOLVING WORLD GROWTH FUND | | | | | | | | | |
Actual Expenses per $1,000* | | $ | 8.02 | | | $ | 11.78 | | | $ | 6.76 | | | $ | — | |
Actual – Ending Balance | | $ | 1,001.40 | | | $ | 997.70 | | | $ | 1,002.80 | | | $ | — | |
| | | | |
Hypothetical Expenses per $1,000* | | $ | 8.08 | | | $ | 11.88 | | | $ | 6.82 | | | $ | — | |
Hypothetical – Ending Value | | $ | 1,017.19 | | | $ | 1,013.41 | | | $ | 1,018.45 | | | $ | — | |
| | | | |
Annualized expense ratio | | | 1.59% | | | | 2.34% | | | | 1.34% | | | | — | |
| CALAMOS GLOBAL EQUITY FUND | | | | | | | | | |
Actual Expenses per $1,000* | | $ | 7.01 | | | $ | 10.77 | | | $ | 5.75 | | | $ | — | |
Actual – Ending Balance | | $ | 1,000.90 | | | $ | 996.10 | | | $ | 1,001.70 | | | $ | — | |
| | | | |
Hypothetical Expenses per $1,000* | | $ | 7.07 | | | $ | 10.87 | | | $ | 5.80 | | | $ | — | |
Hypothetical – Ending Value | | $ | 1,018.20 | | | $ | 1,014.42 | | | $ | 1,019.46 | | | $ | — | |
| | | | |
Annualized expense ratio(2) | | | 1.39% | | | | 2.14% | | | | 1.14% | | | | — | |
| * | Expenses for all Fund Classes A, C, and I are equal to the Fund’s annualized expense ratio, multiplied by the average account value over the period, multiplied by 184/365. |
| (1) | Annualized Expense Ratios for Growth Fund is adjusted to reflect fee waiver related to its investment in an affiliated fund. |
| (2) | Annualized Expense Ratios for Dividend Growth Fund, Opportunistic Value Fund, International Growth Fund and Global Equity Fund are adjusted to reflect an expense limitation agreement. |
| (a) | Expenses for Fund Class R6 of the International Growth Fund are equal to the Fund’s annualized expense ratio, multiplied by the average account value over the period, multiplied by 184/365. |
Expense Example
The actual and hypothetical examples shown assume a $1,000 investment at the beginning of the period, May 1, 2019 and held through October 31, 2019.
| | | | | | | | | | | | | | | | |
| | | CLASS A
SHARES | | | CLASS C
SHARES | | | CLASS I
SHARES | | | CLASS R6
SHARES | |
| CALAMOS GLOBAL GROWTH AND INCOME FUND | | | | | | | | | |
Actual Expenses per $1,000* | | $ | 7.39 | | | $ | 11.14 | | | $ | 6.14 | | | $ | — | |
Actual – Ending Balance | | $ | 994.70 | | | $ | 990.70 | | | $ | 996.10 | | | $ | — | |
| | | | |
Hypothetical Expenses per $1,000* | | $ | 7.43 | | | $ | 11.27 | | | $ | 6.21 | | | $ | — | |
Hypothetical – Ending Value | | $ | 1,017.85 | | | $ | 1,014.01 | | | $ | 1,019.05 | | | $ | — | |
| | | | |
Annualized expense ratio | | | 1.46% | | | | 2.22% | | | | 1.22% | | | | — | |
| CALAMOS TOTAL RETURN BOND FUND | | | | | | | | | |
Actual Expenses per $1,000* | | $ | 4.65 | | | $ | 8.51 | | | $ | 3.36 | | | $ | — | |
Actual – Ending Balance | | $ | 1,049.80 | | | $ | 1,045.90 | | | $ | 1,052.10 | | | $ | — | |
| | | | |
Hypothetical Expenses per $1,000* | | $ | 4.58 | | | $ | 8.39 | | | $ | 3.31 | | | $ | — | |
Hypothetical – Ending Value | | $ | 1,020.67 | | | $ | 1,016.89 | | | $ | 1,021.93 | | | $ | — | |
| | | | |
Annualized expense ratio(2) | | | 0.90% | | | | 1.65% | | | | 0.65% | | | | — | |
| CALAMOS HIGH INCOME OPPORTUNITIES FUND | | | | | | | | | |
Actual Expenses per $1,000* | | $ | 5.07 | | | $ | 8.85 | | | $ | 3.81 | | | $ | — | |
Actual – Ending Balance | | $ | 1,011.50 | | | $ | 1,006.80 | | | $ | 1,012.80 | | | $ | — | |
| | | | |
Hypothetical Expenses per $1,000* | | $ | 5.09 | | | $ | 8.89 | | | $ | 3.82 | | | $ | — | |
Hypothetical – Ending Value | | $ | 1,020.16 | | | $ | 1,016.38 | | | $ | 1,021.42 | | | $ | — | |
| | | | |
Annualized expense ratio(2) | | | 1.00% | | | | 1.75% | | | | 0.75% | | | | — | |
| CALAMOS SHORT-TERM BOND FUND(b) | | | | | | | | | |
Actual Expenses per $1,000 | | $ | 3.32 | | | $ | — | | | $ | 2.04 | | | $ | — | |
Actual – Ending Balance | | $ | 1,024.40 | | | $ | — | | | $ | 1,025.70 | | | $ | — | |
| | | | |
Hypothetical Expenses per $1,000 | | $ | 3.31 | | | $ | — | | | $ | 2.04 | | | $ | — | |
Hypothetical – Ending Value | | $ | 1,021.93 | | | $ | — | | | $ | 1,023.19 | | | $ | — | |
| | | | |
Annualized expense ratio(2) | | | 0.65% | | | | — | | | | 0.40% | | | | — | |
| * | Expenses for all Fund Classes A, C, and I are equal to the Fund’s annualized expense ratio, multiplied by the average account value over the period, multiplied by 184/365. |
| (2) | Annualized Expense Ratios for Total Return Bond Fund, High Income Opportunities Fund and Short-Term Bond Fund are adjusted to reflect fee waiver. |
| (b) | Expenses for all Fund Classes of the Short-Term Bond Fund are equal to the Fund’s annualized expense ratio, multiplied by the average account value over the period, multiplied by 184/365. |
| | | | |
| 74 | | CALAMOS OPEN-END FAMILY OF FUNDS ANNUAL REPORT | | |
Market Neutral Income Fund Schedule of Investments October 31, 2019
| | | | | | | | | | |
PRINCIPAL AMOUNT | | | | | | | VALUE | |
|
| | CONVERTIBLE BONDS (40.5%) | |
| | | | | | Communication Services (4.0%) | |
| | 12,000,000 | | | | | Bilibili, Inc.*
1.375%, 04/01/26 | | $ | 11,064,480 | |
| | | |
| | 8,000,000 | | | EUR | | Cellnex Telecom, SA
1.500%, 01/16/26 | | | 11,949,276 | |
| | | |
| | 1,000,000,000 | | | JPY | | CyberAgent, Inc.
0.000%, 02/19/25 | | | 9,458,700 | |
| | | |
| | 11,000,000 | | | | | Gannett Company, Inc.
4.750%, 04/15/24 | | | 12,002,485 | |
| | | |
| | 1,500,000 | | | | | Gogo, Inc.*
6.000%, 05/15/22 | | | 1,823,565 | |
| | | |
| | 5,000,000 | | | | | IAC Financeco 3, Inc.*
2.000%, 01/15/30 | | | 5,593,750 | |
| | | |
| | 30,000,000 | | | | | IAC FinanceCo, Inc.*~
0.875%, 10/01/22 | | | 47,742,300 | |
| | | |
| | | | | | iQIYI, Inc.* | | | | |
| | 20,000,000 | | | | | 2.000%, 04/01/25 | | | 18,182,100 | |
| | 10,000,000 | | | | | 3.750%, 12/01/23 | | | 10,259,000 | |
| | | |
| | 5,000,000 | | | | | Liberty Media Corp.*
2.250%, 12/01/48 | | | 5,942,550 | |
| | | |
| | 5,000,000 | | | | | Liberty Media Corp. / Liberty Formula One
1.000%, 01/30/23 | | | 6,336,250 | |
| | | |
| | 15,000,000 | | | | | Momo, Inc.
1.250%, 07/01/25 | | | 13,856,700 | |
| | | |
| | 10,000,000 | | | | | Sea, Ltd.
2.250%, 07/01/23 | | | 16,941,450 | |
| | | |
| | 29,970,000 | | | | | Snap, Inc.*~
0.750%, 08/01/26 | | | 30,397,522 | |
| | | |
| | | | | | Twitter, Inc.~ | | | | |
| | 34,000,000 | | | | | 0.250%, 06/15/24^ | | | 32,499,240 | |
| | 15,000,000 | | | | | 1.000%, 09/15/21 | | | 14,502,000 | |
| | | |
| | 7,500,000 | | | | | Vonage Holdings Corp.*
1.750%, 06/01/24 | | | 7,334,775 | |
| | | |
| | 13,000,000 | | | | | World Wrestling Entertainment, Inc.~
3.375%, 12/15/23 | | | 31,120,895 | |
| | | |
| | | | | | YY, Inc.*^ | | | | |
| | 10,000,000 | | | | | 1.375%, 06/15/26 | | | 9,249,900 | |
| | 10,000,000 | | | | | 0.750%, 06/15/25 | | | 9,250,700 | |
| | | |
| | | | | | Zillow Group, Inc.* | | | | |
| | 11,500,000 | | | | | 0.750%, 09/01/24 | | | 11,548,932 | |
| | 7,500,000 | | | | | 1.375%, 09/01/26 | | | 7,451,475 | |
| | | |
| | 22,500,000 | | | | | Zynga, Inc.*~^
0.250%, 06/01/24 | | | 23,124,375 | |
| | | | | | | | | | |
| | | | 347,632,420 | |
| | | | | |
| | | | | | Consumer Discretionary (6.6%) | |
| | 69,000,000 | | | | | Booking Holdings, Inc.~
0.350%, 06/15/20 | | | 107,578,245 | |
| | | |
| | | | | | Chegg, Inc. | | | | |
| | 15,957,000 | | | | | 0.125%, 03/15/25*^ | | | 14,929,529 | |
| | 15,000,000 | | | | | 0.250%, 05/15/23~ | | | 19,661,925 | |
| | | | | | | | | | |
PRINCIPAL AMOUNT | | | | | | | VALUE | |
| | | |
| | 35,327,000 | | | | | Ctrip.com International, Ltd.~^
1.990%, 07/01/25 | | $ | 37,045,305 | |
| | | |
| | | | | | Etsy, Inc.^ | | | | |
| | 16,000,000 | | | | | 0.000%, 03/01/23~ | | | 22,675,760 | |
| | 10,000,000 | | | | | 0.125%, 10/01/26* | | | 9,141,200 | |
| | | |
| | 15,000,000 | | | | | Guess, Inc.*~
2.000%, 04/15/24 | | | 14,378,925 | |
| | | |
| | 14,050,000 | | | | | LGI Homes, Inc.~
4.250%, 11/15/19 | | | 51,645,903 | |
| | | |
| | 25,000,000 | | | | | MercadoLibre, Inc.~
2.000%, 08/15/28 | | | 35,556,125 | |
| | | |
| | 30,000,000 | | | | | NIO, Inc.*~
4.500%, 02/01/24 | | | 8,605,350 | |
| | | |
| | 20,000,000 | | | | | Pinduoduo, Inc.*^
0.000%, 10/01/24 | | | 23,274,900 | |
| | | |
| | 7,000,000 | | | | | Quotient Technology, Inc.
1.750%, 12/01/22 | | | 6,688,535 | |
| | | |
| | 15,500,000 | | | EUR | | Takeaway.com, NV
2.250%, 01/25/24 | | | 22,297,824 | |
| | | |
| | | | | | Tesla, Inc.~ | | | | |
| | 50,000,000 | | | | | 2.375%, 03/15/22 | | | 58,685,000 | |
| | 50,000,000 | | | | | 2.000%, 05/15/24^ | | | 61,276,000 | |
| | 10,000,000 | | | | | 1.250%, 03/01/21 | | | 10,875,450 | |
| | | |
| | | | | | Wayfair, Inc. | | | | |
| | 35,000,000 | | | | | 1.000%, 08/15/26*~ | | | 30,968,875 | |
| | 25,000,000 | | | | | 1.125%, 11/01/24*~^ | | | 25,629,750 | |
| | 12,500,000 | | | | | 0.375%, 09/01/22^ | | | 13,289,688 | |
| | | |
| | 5,000,000 | | | | | Winnebago Industries, Inc.
1.500%, 04/01/25 | | | 5,100,000 | |
| | | | | | | | | | |
| | | | | | | | | 579,304,289 | |
| | | | | | | | | | |
| | | | | | Consumer Staples (0.4%) | |
| | 10,000,000 | | | | | Herbalife Nutrition, Ltd.
2.625%, 03/15/24 | | | 10,112,450 | |
| | | |
| | 15,000,000 | | | GBP | | J Sainsbury, PLC
1.250%, 11/21/19 | | | 19,422,481 | |
| | | |
| | 4,000,000 | | | | | Turning Point Brands, Inc.*
2.500%, 07/15/24 | | | 3,196,200 | |
| | | | | | | | | | |
| | | | | | | | | 32,731,131 | |
| | | | | | | | | | |
| | | | | | Energy (0.3%) | |
| | 15,000,000 | | | | | Chesapeake Energy Corp.
5.500%, 09/15/26 | | | 8,424,000 | |
| | | |
| | 5,000,000 | | | | | Nabors Industries, Inc.
0.750%, 01/15/24 | | | 3,205,700 | |
| | | |
| | 5,000,000 | | | | | Oasis Petroleum, Inc.~
2.625%, 09/15/23 | | | 3,512,100 | |
| | | |
| | 4,000,000 | | | | | Renewable Energy Group, Inc.
4.000%, 06/15/36 | | | 6,499,840 | |
| | | |
| | 4,000,000 | | | | | SEACOR Holdings, Inc.
3.250%, 05/15/30 | | | 3,664,680 | |
| | | |
| | 4,267,000 | | | | | Whiting Petroleum Corp.
1.250%, 04/01/20 | | | 4,194,376 | |
| | | | | | | | | | |
| | | | | | | | | 29,500,696 | |
| | | | | | | | | | |
| | | | | | |
| See accompanying Notes to Schedule of Investments | | www.calamos.com | | | 75 | |
Market Neutral Income Fund Schedule of Investments October 31, 2019
| | | | | | | | | | |
PRINCIPAL AMOUNT | | | | | | | VALUE | |
| | | | | | | | | | |
| | | | | | Financials (1.6%) | |
| | 3,500,000 | | | | | Apollo Commercial Real Estate Finance, Inc.
4.750%, 08/23/22 | | $ | 3,530,275 | |
| | | |
| | 21,120,000 | | | | | AXA, SA*~
7.250%, 05/15/21 | | | 22,105,354 | |
| | | |
| | 10,000,000 | | | | | Goldman Sachs BDC, Inc.
4.500%, 04/01/22 | | | 10,260,750 | |
| | | |
| | 5,000,000 | | | | | Heritage Insurance Holdings, Inc.
5.875%, 08/01/37 | | | 5,857,250 | |
| | | |
| | 5,000,000 | | | | | Hope Bancorp, Inc.
2.000%, 05/15/38 | | | 4,620,575 | |
| | | |
| | 10,000,000 | | | | | JPMorgan Chase Financial Company, LLC (Voya Financial, Inc.)*^§
0.250%, 05/01/23 | | | 10,201,250 | |
| | | |
| | 30,000,000 | | | | | LendingTree, Inc.~
0.625%, 06/01/22 | | | 54,280,350 | |
| | | |
| | 5,000,000 | | | | | PRA Group, Inc.
3.500%, 06/01/23 | | | 5,080,875 | |
| | | |
| | 7,500,000 | | | | | Qudian, Inc.*
1.000%, 07/01/26 | | | 7,100,775 | |
| | | |
| | | | | | Redwood Trust, Inc. | | | | |
| | 5,000,000 | | | | | 5.625%, 07/15/24 | | | 5,086,100 | |
| | 5,000,000 | | | | | 4.750%, 08/15/23 | | | 5,041,150 | |
| | | |
| | 5,000,000 | | | | | RWT Holdings, Inc.*
5.750%, 10/01/25 | | | 5,081,000 | |
| | | | | | | | | | |
| | | | | | | | | 138,245,704 | |
| | | | | | | | | | |
| | | | | | Health Care (4.9%) | |
| | 5,000,000 | | | | | Aerie Pharmaceuticals, Inc.*
1.500%, 10/01/24 | | | 5,579,050 | |
| | | |
| | 5,000,000 | | | | | Allscripts Healthcare Solutions, Inc.~^
1.250%, 07/01/20 | | | 4,963,500 | |
| | | |
| | 5,000,000 | | | | | AMAG Pharmaceuticals, Inc.~
3.250%, 06/01/22 | | | 3,878,500 | |
| | | |
| | 10,000,000 | | | EUR | | Bayer, AG
0.050%, 06/15/20 | | | 11,141,621 | |
| | | |
| | 5,000,000 | | | | | CONMED Corp.*
2.625%, 02/01/24 | | | 6,850,800 | |
| | | |
| | 22,953,000 | | | | | DexCom, Inc.~
0.750%, 05/15/22 | | | 37,548,927 | |
| | | |
| | 5,000,000 | | | | | Evolent Health, Inc.
1.500%, 10/15/25 | | | 3,304,200 | |
| | | |
| | 5,000,000 | | | | | Flexion Therapeutics, Inc.
3.375%, 05/01/24 | | | 4,844,625 | |
| | | |
| | 2,500,000 | | | | | Immunomedics, Inc.
4.750%, 02/15/20 | | | 7,890,975 | |
| | | |
| | 17,000,000 | | | | | Innoviva, Inc.~
2.500%, 08/15/25 | | | 16,941,605 | |
| | | |
| | 13,333,000 | | | | | Insmed, Inc.~
1.750%, 01/15/25 | | | 11,432,514 | |
| | | |
| | 17,500,000 | | | | | Insulet Corp.*
0.375%, 09/01/26 | | | 16,749,512 | |
| | | | | | | | | | |
PRINCIPAL AMOUNT | | | | | | | VALUE | |
| | | |
| | | | | | Intercept Pharmaceuticals, Inc. | | | | |
| | 5,000,000 | | | | | 3.250%, 07/01/23 | | $ | 4,386,000 | |
| | 5,000,000 | | | | | 2.000%, 05/15/26 | | | 4,719,150 | |
| | | |
| | 3,000,000 | | | | | Invacare Corp.
4.500%, 06/01/22 | | | 2,554,830 | |
| | | |
| | 5,000,000 | | | | | Invitae Corp.*
2.000%, 09/01/24 | | | 4,566,200 | |
| | | |
| | 25,000,000 | | | | | Ionis Pharmaceuticals, Inc.~
1.000%, 11/15/21 | | | 27,596,375 | |
| | | |
| | | | | | Ironwood Pharmaceuticals, Inc. | | | | |
| | 9,500,000 | | | | | 1.500%, 06/15/26* | | | 9,529,498 | |
| | 7,500,000 | | | | | 0.750%, 06/15/24* | | | 7,468,313 | |
| | 2,423,000 | | | | | 2.250%, 06/15/22 | | | 2,550,074 | |
| | | |
| | 15,000,000 | | | | | Ligand Pharmaceuticals, Inc.~
0.750%, 05/15/23 | | | 13,027,875 | |
| | | |
| | | | | | Medicines Company | | | | |
| | 12,500,000 | | | | | 2.750%, 07/15/23 | | | 15,593,188 | |
| | 7,500,000 | | | | | 2.500%, 01/15/22~ | | | 12,100,500 | |
| | 4,000,000 | | | | | 3.500%, 01/15/24* | | | 8,995,720 | |
| | | |
| | 15,000,000 | | | | | Neurocrine Biosciences, Inc.^
2.250%, 05/15/24 | | | 21,915,000 | |
| | | |
| | 22,050,000 | | | | | NuVasive, Inc.~^
2.250%, 03/15/21 | | | 27,662,717 | |
| | | |
| | 5,000,000 | | | | | OPKO Health, Inc.
4.500%, 02/15/25 | | | 3,848,950 | |
| | | |
| | 5,000,000 | | | | | Pacira BioSciences, Inc.^
2.375%, 04/01/22 | | | 5,043,625 | |
| | | |
| | 6,661,000 | | | | | Quidel Corp.~
3.250%, 12/15/20 | | | 12,440,017 | |
| | | |
| | 5,000,000 | | | | | Radius Health, Inc.
3.000%, 09/01/24 | | | 4,741,025 | |
| | | |
| | 5,000,000 | | | | | Retrophin, Inc.^
2.500%, 09/15/25 | | | 3,755,950 | |
| | | |
| | 20,000,000 | | | | | Sarepta Therapeutics, Inc.~
1.500%, 11/15/24 | | | 28,283,400 | |
| | | |
| | 13,000,000 | | | | | Supernus Pharmaceuticals, Inc.^
0.625%, 04/01/23 | | | 12,025,845 | |
| | | |
| | 2,276,000 | | | | | Tabula Rasa HealthCare, Inc.*
1.750%, 02/15/26 | | | 2,368,371 | |
| | | |
| | | | | | Teladoc Health, Inc. | | | | |
| | 8,050,000 | | | | | 1.375%, 05/15/25^ | | | 13,069,296 | |
| | 8,000,000 | | | | | 3.000%, 12/15/22~ | | | 15,020,240 | |
| | | |
| | 5,000,000 | | | | | Theravance Biopharma, Inc.
3.250%, 11/01/23 | | | 4,354,325 | |
| | | |
| | 5,000,000 | | | | | Tilray, Inc.
5.000%, 10/01/23 | | | 2,776,950 | |
| | | |
| | 11,461,000 | | | | | Wright Medical Group, Inc.^
1.625%, 06/15/23 | | | 11,013,219 | |
| | | |
| | 10,000,000 | | | | | Wright Medical Group, NV~
2.250%, 11/15/21 | | | 11,811,450 | |
| | | | | | | | | | |
| | | | | | | | | 424,343,932 | |
| | | | | | | | | | |
| | | | |
| 76 | | CALAMOS OPEN-END FAMILY OF FUNDS ANNUAL REPORT | | See accompanying Notes to Schedule of Investments |
Market Neutral Income Fund Schedule of Investments October 31, 2019
| | | | | | | | | | |
PRINCIPAL AMOUNT | | | | | | | VALUE | |
| | | | | | | | | | |
| | | Industrials (0.3%) | | | | |
| | 5,000,000 | | | | | Aerojet Rocketdyne Holdings, Inc.~
2.250%, 12/15/23 | | $ | 8,713,125 | |
| | | |
| | 11,250,000 | | | | | FTI Consulting, Inc.^
2.000%, 08/15/23 | | | 14,037,525 | |
| | | | | | | | | | |
| | | | | | | | | 22,750,650 | |
| | | | | | | | | | |
| | | | | | Information Technology (20.4%) | |
| | 2,500,000 | | | | | 8x8, Inc.*
0.500%, 02/01/24 | | | 2,548,788 | |
| | | |
| | 38,500,000 | | | | | Advanced Micro Devices, Inc.~
2.125%, 09/01/26 | | | 167,084,032 | |
| | | |
| | 21,500,000 | | | | | Akamai Technologies, Inc.*
0.375%, 09/01/27 | | | 21,437,757 | |
| | | |
| | 10,000,000 | | | | | Altair Engineering, Inc.
0.250%, 06/01/24 | | | 10,397,550 | |
| | | |
| | | | | | Alteryx, Inc. | | | | |
| | 12,500,000 | | | | | 0.500%, 06/01/23~ | | | 27,060,875 | |
| | 10,000,000 | | | | | 1.000%, 08/01/26*^ | | | 9,050,850 | |
| | 10,000,000 | | | | | 0.500%, 08/01/24* | | | 9,269,050 | |
| | | |
| | 38,000,000 | | | | | Atlassian, Inc.~
0.625%, 05/01/23 | | | 60,676,120 | |
| | | |
| | 5,000,000 | | | | | Avaya Holdings Corp.
2.250%, 06/15/23 | | | 4,330,000 | |
| | | |
| | 7,500,000 | | | | | Benefitfocus, Inc.*
1.250%, 12/15/23 | | | 6,402,975 | |
| | | |
| | 14,000,000 | | | | | Blackline, Inc.*
0.125%, 08/01/24 | | | 13,331,150 | |
| | | |
| | 3,000,000 | | | | | CalAmp Corp.
2.000%, 08/01/25 | | | 2,466,660 | |
| | | |
| | 8,800,000 | | | | | Cardtronics, Inc.~
1.000%, 12/01/20 | | | 8,778,704 | |
| | | |
| | 11,376,000 | | | | | Coupa Software, Inc.*~^
0.125%, 06/15/25 | | | 12,980,300 | |
| | | |
| | 11,000,000 | | | | | CSG Systems International, Inc.
4.250%, 03/15/36 | | | 12,923,515 | |
| | | |
| | 20,000,000 | | | | | Cypress Semiconductor Corp.~
4.500%, 01/15/22 | | | 34,718,700 | |
| | | |
| | 10,000,000 | | | | | Envestnet, Inc.
1.750%, 12/15/19 | | | 10,243,650 | |
| | | |
| | | | | | FireEye, Inc. | | | | |
| | 7,500,000 | | | | | 0.875%, 06/01/24 | | | 7,435,088 | |
| | 5,000,000 | | | | | 1.625%, 06/01/35 | | | 4,820,925 | |
| | 5,000,000 | | | | | 1.000%, 06/01/35~ | | | 4,945,150 | |
| | | |
| | 17,000,000 | | | | | Five9, Inc.~^
0.125%, 05/01/23 | | | 25,251,970 | |
| | | |
| | 5,000,000 | | | | | GDS Holdings, Ltd.^
2.000%, 06/01/25 | | | 5,305,625 | |
| | | |
| | 4,999,000 | | | | | Guidewire Software, Inc.
1.250%, 03/15/25 | | | 5,973,005 | |
| | | |
| | 30,000,000 | | | | | HubSpot, Inc.~
0.250%, 06/01/22 | | | 51,324,600 | |
| | | | | | | | | | |
PRINCIPAL AMOUNT | | | | | | | VALUE | |
| | | |
| | 5,000,000 | | | | | II-VI, Inc.
0.250%, 09/01/22 | | $ | 5,047,825 | |
| | | |
| | 15,000,000 | | | | | Infinera Corp.
2.125%, 09/01/24 | | | 13,188,450 | |
| | | |
| | 8,000,000 | | | | | Inphi Corp.
1.125%, 12/01/20 | | | 14,497,920 | |
| | | |
| | 10,000,000 | | | | | Insight Enterprises, Inc.*^
0.750%, 02/15/25 | | | 10,917,900 | |
| | | |
| | 15,000,000 | | | | | Intel Corp.~^
3.250%, 08/01/39 | | | 41,567,325 | |
| | | |
| | 6,300,000 | | | | | InterDigital, Inc.*
2.000%, 06/01/24 | | | 6,232,842 | |
| | | |
| | 25,000,000 | | | | | j2 Global, Inc.~
3.250%, 06/15/29 | | | 36,866,750 | |
| | | |
| | 7,500,000 | | | | | LivePerson, Inc.*^
0.750%, 03/01/24 | | | 9,536,213 | |
| | | |
| | | | | | Microchip Technology, Inc. | | | | |
| | 20,000,000 | | | | | 1.625%, 02/15/25~ | | | 38,574,300 | |
| | 19,903,000 | | | | | 1.625%, 02/15/27~ | | | 26,088,255 | |
| | 7,500,000 | | | | | 2.250%, 02/15/37 | | | 9,849,825 | |
| | | |
| | 23,975,000 | | | | | Micron Technology, Inc.~
3.125%, 05/01/32 | | | 114,348,643 | |
| | | |
| | 15,000,000 | | | | | MongoDB, Inc.~
0.750%, 06/15/24 | | | 29,718,675 | |
| | | |
| | 20,000,000 | | | | | New Relic, Inc.~
0.500%, 05/01/23 | | | 19,274,300 | |
| | | |
| | 15,000,000 | | | | | Nice Systems, Inc.~^
1.250%, 01/15/24 | | | 29,189,550 | |
| | | |
| | 12,229,000 | | | | | Nuance Communications, Inc.~
1.000%, 12/15/35 | | | 11,915,143 | |
| | | |
| | 11,500,000 | | | | | Nutanix, Inc.
0.000%, 01/15/23 | | | 11,042,300 | |
| | | |
| | 31,942,000 | | | | | NXP Semiconductors, NV~^
1.000%, 12/01/19 | | | 35,225,638 | |
| | | |
| | | | | | Okta, Inc. | | | | |
| | 22,500,000 | | | | | 0.250%, 02/15/23~ | | | 52,012,125 | |
| | 22,500,000 | | | | | 0.125%, 09/01/25* | | | 21,348,450 | |
| | | |
| | 25,000,000 | | | | | ON Semiconductor Corp.~^
1.625%, 10/15/23 | | | 31,116,375 | |
| | | |
| | 10,000,000 | | | | | OSI Systems, Inc.~
1.250%, 09/01/22 | | | 11,056,250 | |
| | | |
| | 30,000,000 | | | | | Palo Alto Networks, Inc.~
0.750%, 07/01/23 | | | 32,984,700 | |
| | | |
| | 10,000,000 | | | | | Pluralsight, Inc.*
0.375%, 03/01/24 | | | 8,774,350 | |
| | | |
| | 7,000,000 | | | | | Proofpoint, Inc.*^
0.250%, 08/15/24 | | | 7,262,010 | |
| | | |
| | 5,000,000 | | | | | PROS Holdings, Inc.*
1.000%, 05/15/24 | | | 5,303,225 | |
| | | |
| | 10,000,000 | | | | | Pure Storage, Inc.
0.125%, 04/15/23 | | | 10,488,550 | |
| | | |
| | | | | | Q2 Holdings, Inc. | | | | |
| | 15,000,000 | | | | | 0.750%, 02/15/23~ | | | 20,703,975 | |
| | 5,625,000 | | | | | 0.750%, 06/01/26* | | | 5,983,453 | |
| | | | | | |
| See accompanying Notes to Schedule of Investments | | www.calamos.com | | | 77 | |
Market Neutral Income Fund Schedule of Investments October 31, 2019
| | | | | | | | | | |
PRINCIPAL AMOUNT | | | | | | | VALUE | |
| | | |
| | 20,000,000 | | | | | RealPage, Inc.~
1.500%, 11/15/22 | | $ | 30,689,300 | |
| | | |
| | 23,000,000 | | | | | RingCentral, Inc.~
0.000%, 03/15/23 | | | 46,470,695 | |
| | | |
| | 7,500,000 | | | | | Rovi Corp.^
0.500%, 03/01/20 | | | 7,455,600 | |
| | | |
| | 7,000,000 | | | | | SailPoint Technologies Holding, Inc.*
0.125%, 09/15/24 | | | 6,811,000 | |
| | | |
| | 50,000,000 | | | | | ServiceNow, Inc.~^
0.000%, 06/01/22 | | | 93,763,500 | |
| | | |
| | 15,000,000 | | | | | Silicon Laboratories, Inc.~^
1.375%, 03/01/22 | | | 19,014,900 | |
| | | |
| | | | | | Splunk, Inc. | | | | |
| | 35,000,000 | | | | | 0.500%, 09/15/23~ | | | 38,044,125 | |
| | 25,000,000 | | | | | 1.125%, 09/15/25^ | | | 27,757,000 | |
| | | |
| | | | | | Square, Inc. | | | | |
| | 25,000,000 | | | | | 0.375%, 03/01/22~ | | | 67,749,375 | |
| | 20,000,000 | | | | | 0.500%, 05/15/23^ | | | 22,159,400 | |
| | | |
| | 12,500,000 | | | | | Synaptics, Inc.^
0.500%, 06/15/22 | | | 11,849,312 | |
| | | |
| | 15,000,000 | | | | | Teradyne, Inc.~
1.250%, 12/15/23 | | | 29,825,325 | |
| | | |
| | 15,000,000 | | | | | TTM Technologies, Inc.~
1.750%, 12/15/20 | | | 19,214,700 | |
| | | |
| | 30,000,000 | | | | | Twilio, Inc.~^
0.250%, 06/01/23 | | | 45,627,150 | |
| | | |
| | 6,000,000 | | | | | Viavi Solutions, Inc.~^
1.000%, 03/01/24 | | | 8,102,610 | |
| | | |
| | 10,000,000 | | | | | Vishay Intertechnology, Inc.^
2.250%, 06/15/25 | | | 9,864,500 | |
| | | |
| | 15,000,000 | | | | | Weibo Corp.^
1.250%, 11/15/22 | | | 14,093,025 | |
| | | |
| | | | | | Workday, Inc.~ | | | | |
| | 35,000,000 | | | | | 0.250%, 10/01/22^ | | | 44,617,825 | |
| | 12,500,000 | | | | | 1.500%, 07/15/20 | | | 25,310,750 | |
| | | |
| | 12,500,000 | | | | | Workiva, Inc.*
1.125%, 08/15/26 | | | 11,319,437 | |
| | | |
| | 10,000,000 | | | | | Zendesk, Inc.~
0.250%, 03/15/23 | | | 13,005,600 | |
| | | | | | | | | | |
| | | | | | | | | 1,781,617,485 | |
| | | | | | | | | | |
| | | | | | Materials (0.6%) | |
| | 20,000,000 | | | | | Allegheny Technologies, Inc.~
4.750%, 07/01/22 | | | 32,268,400 | |
| | | |
| | 3,000,000 | | | | | Pretium Resources, Inc.
2.250%, 03/15/22 | | | 3,047,580 | |
| | | |
| | 5,000,000 | | | | | SSR Mining, Inc.*
2.500%, 04/01/39 | | | 5,691,125 | |
| | | |
| | 5,000,000 | | | | | TimkenSteel Corp.
6.000%, 06/01/21 | | | 4,672,225 | |
| | | |
| | 5,000,000 | | | | | United States Steel Corp.*
5.000%, 11/01/26 | | | 5,396,100 | |
| | | | | | | | | | |
| | | | | | | | | 51,075,430 | |
| | | | | | | | | | |
| | | | | | | | | | |
PRINCIPAL AMOUNT | | | | | | | VALUE | |
| | | | | | | | | | |
| | | | | | Real Estate (1.3%) | |
| | 10,000,000 | | | EUR | | Deutsche Wohnen, SE
0.325%, 07/26/24 | | $ | 11,697,263 | |
| | | |
| | 40,000,000 | | | | | Extra Space Storage, LP*~
3.125%, 10/01/35 | | | 49,311,800 | |
| | | |
| | 6,000,000 | | | | | Forestar Group, Inc.
3.750%, 03/01/20 | | | 6,073,560 | |
| | | |
| | 17,700,000 | | | | | IH Merger Sub, LLC
3.500%, 01/15/22 | | | 24,381,042 | |
| | | |
| | 10,500,000 | | | EUR | | IMMOFINANZ, AG
1.500%, 01/24/24 | | | 14,789,493 | |
| | | |
| | 7,500,000 | | | | | iStar, Inc.
3.125%, 09/15/22 | | | 7,991,137 | |
| | | | | | | | | | |
| | | | | | | | | 114,244,295 | |
| | | | | | | | | | |
| | | | | | Utilities (0.1%) | |
| | 500,000,000 | | | JPY | | Chugoku Electric Power Company, Inc.
0.000%, 01/24/20 | | | 4,759,191 | |
| | | | | | | | | | |
| | | |
| | | | | | TOTAL CONVERTIBLE BONDS
(Cost $3,177,104,032) | | | 3,526,205,223 | |
| | | | | | | | | | |
| | | | | | | | | | |
|
| | SYNTHETIC CONVERTIBLE SECURITIES (0.9%)¤ | |
NUMBER OF CONTRACTS/ NOTIONAL AMOUNT | | | | | | | VALUE | |
| | Purchased Options (0.3%)# | |
| | | | | | Communication Services (0.0%) | |
| | | | | | CyberAgent, Inc. | | | | |
| 40
400,000,000 |
| | JPY | | Call, 02/17/23, Strike 95.84 | | | 197,888 | |
| 70
228,838,680 |
| | JPY | | Call, 02/17/23, Strike 95.44 | | | 302,414 | |
| | | |
| 2,640
25,449,600 |
| | | | Electronic Arts, Inc. Call, 12/20/19, Strike $105.00 | | | 233,640 | |
| | | |
| 750
14,373,750 |
| | | | Facebook, Inc. Call, 12/20/19, Strike $225.00 | | | 26,625 | |
| | | |
| 50
500,000,000 |
| | JPY | | Zenrin Company, Ltd. Call, 03/31/23, Strike 96.21 | | | 192,995 | |
| | | | | | | | | | |
| | | | | | | | | 953,562 | |
| | | | | | | | | | |
| | | | | | Consumer Discretionary (0.1%) | |
| 250
44,416,500 |
| | | | Amazon.com, Inc.
Call, 11/15/19, Strike $2,150.00 | | | 5,125 | |
| | | |
| | | | | | DCM Holdings Company, Ltd. | | | | |
| 1,000
1,000,000,000 |
| | JPY | | Call, 12/21/20, Strike 99.13 | | | 1,144,138 | |
| 900
900,000,000 |
| | JPY | | Call, 12/21/20, Strike 99.35 | | | 1,029,724 | |
| | | |
| | | | | | EDION Corp. | | | | |
| 60
600,000,000 |
| | JPY | | Call, 06/19/20, Strike 99.51 | | | 391,675 | |
| 50
500,000,000 |
| | JPY | | Call, 06/19/20, Strike 99.67 | | | 320,411 | |
| | | | |
| 78 | | CALAMOS OPEN-END FAMILY OF FUNDS ANNUAL REPORT | | See accompanying Notes to Schedule of Investments |
Market Neutral Income Fund Schedule of Investments October 31, 2019
| | | | | | | | | | |
NUMBER OF CONTRACTS/ NOTIONAL AMOUNT | | | | | | | VALUE | |
| | | | | | EDION Corp. (cont.) | | | | |
| 50
49,916,650 |
| | JPY | | Call, 06/19/25, Strike 94.30 | | $ | 491,125 | |
| | | |
| 100
1,000,000,000 |
| | JPY | | HIS Company, Ltd.
Call, 11/15/24, Strike 96.54 | | | 230,538 | |
| | | |
| | | | | | Takashimaya Company, Ltd. | | | | |
| 100
116,873,500 |
| | JPY | | Call, 12/06/23, Strike 97.28 | | | 125,631 | |
| 50
58,436,750 |
| | JPY | | Call, 12/06/23, Strike 97.18 | | | 62,816 | |
| 50
58,436,750 |
| | JPY | | Call, 12/06/23, Strike 97.29 | | | 62,816 | |
| | | |
| 250
5,828,750 |
| | | | Ulta Beauty, Inc.
Call, 01/17/20, Strike $265.00 | | | 141,250 | |
| | | |
| 500
6,067,000 |
| | | | Wynn Resorts, Ltd.
Call, 01/17/20, Strike $120.00 | | | 455,000 | |
| | | | | | | | | | |
| | | | | | | | | 4,460,249 | |
| | | | | | | | | | |
| | | | | | Consumer Staples (0.0%) | |
| 1,500
28,549,500 |
| | | | Constellation Brands, Inc. Call, 01/17/20, Strike $200.00 | | | 630,000 | |
| | | |
| | | | | | Ezaki Glico Company, Ltd. | | | | |
| 100
465,827,000 |
| | JPY | | Call, 01/30/24, Strike 97.57 | | | 179,480 | |
| 50
232,913,500 |
| | JPY | | Call, 01/30/24, Strike 96.89 | | | 99,870 | |
| | | |
| 2,000
6,466,000 |
| | | | Kraft Heinz Company
Call, 12/20/19, Strike $32.50 | | | 180,000 | |
| | | | | | | | | | |
| | | | | | | | | 1,089,350 | |
| | | | | | | | | | |
| | | | | | Health Care (0.0%) | |
| 750
22,164,000 |
| | | | Illumina, Inc.
Call, 12/20/19, Strike $330.00 | | | 191,250 | |
| | | |
| 100
117,799,600 |
| | JPY | | Nipro Corp.
Call, 01/29/21, Strike 98.68 | | | 375,566 | |
| | | |
| 50
111,550 |
| | | | Tilray, Inc.
Call, 01/17/20, Strike $170.00 | | | 250 | |
| | | |
| 100
1,000,000,000 |
| | JPY | | Toho Holdings Company, Ltd.
Call, 06/23/23, Strike 98.43 | | | 445,196 | |
| | | | | | | | | | |
| | | | | | | | | 1,012,262 | |
| | | | | | | | | | |
| | | | | | Industrials (0.1%) | |
| 100
67,000,000 |
| | JPY | | ANA Holdings, Inc.
Call, 09/19/24, Strike 96.53 | | | 161,902 | |
| | | |
| 70
700,000,000 |
| | JPY | | Fuji Corp/Aichi
Call, 03/25/21, Strike 98.73 | | | 1,964,071 | |
| | | |
| 45
450,000,000 |
| | JPY | | Maeda Kosen Company, Ltd.
Call, 04/18/22, Strike 97.72 | | | 42 | |
| | | |
| | | | | | Nagoya Railroad Company, Ltd. | | | | |
| 100
1,000,000,000 |
| | JPY | | Call, 12/09/22, Strike 98.92 | | | 2,251,283 | |
| 100
319,503,600 |
| | JPY | | Call, 12/09/22, Strike 97.53 | | | 2,239,834 | |
| | | | | | | | | | |
NUMBER OF CONTRACTS/ NOTIONAL AMOUNT | | | | | | | VALUE | |
| | | | | | Nagoya Railroad Company, Ltd. (cont.) | | | | |
| 28
280,000,000 |
| | JPY | | Call, 12/09/22, Strike 98.77 | | $ | 637,210 | |
| 22
220,000,000 |
| | JPY | | Call, 12/09/22, Strike 98.94 | | | 495,282 | |
| 50
159,751,800 |
| | JPY | | Call, 12/09/22, Strike 98.07 | | | 1,105,162 | |
| | | | | | | | | | |
| | | | | | | | | 8,854,786 | |
| | | | | | | | | | |
| | | | | | Information Technology (0.1%) | |
| 1,000
24,876,000 |
| | | | Apple, Inc.
Call, 11/15/19, Strike $220.00 | | | 2,825,000 | |
| | | |
| | | | | | Digital Garage, Inc. | | | | |
| 150
497,314,350 |
| | JPY | | Call, 09/14/23, Strike 94.68 | | | 1,309,724 | |
| 50
165,771,450 |
| | JPY | | Call, 09/14/23, Strike 94.80 | | | 436,575 | |
| | | |
| 1,600
7,608,000 |
| | | | Micron Technology, Inc.
Call, 01/17/20, Strike $40.00 | | | 1,388,000 | |
| | | | | | | | | | |
| | | | | | | | | 5,959,299 | |
| | | | | | | | | | |
| | | | | | Materials (0.0%) | | | | |
| | | |
| 100
1,000,000,000 |
| | JPY | | Mitsubishi Chemical Holdings Corp.
Call, 03/30/22, Strike 98.83 | | | 201,889 | |
| | | |
| 100
1,000,000,000 |
| | JPY | | Teijin, Ltd.
Call, 12/10/21, Strike 99.18 | | | 1,923,838 | |
| | | | | | | | | | |
| | | | | | | | | 2,125,727 | |
| | | | | | | | | | |
| | | | | | Other (0.0%) | | | | |
| | | | | | S&P 500 Index | | | | |
| 2,000
607,512,000 |
| | | | Call, 11/29/19, Strike $3,100.00 | | | 1,800,000 | |
| 1,000
303,756,000 |
| | | | Call, 12/31/19, Strike $3,100.00 | | | 2,625,000 | |
| | | | | | | | | | |
| | | | | | | | | 4,425,000 | |
| | | | | | | | | | |
| | | | | | Utilities (0.0%) | | | | |
| | | | | | Chugoku Electric Power Company, Inc. | | | | |
| 100
1,000,000,000 |
| | JPY | | Call, 01/25/22, Strike 98.54 | | | 846,248 | |
| 100
1,000,000,000 |
| | JPY | | Call, 01/25/22, Strike 98.97 | | | 846,248 | |
| 50
66,725,300 |
| | JPY | | Call, 01/25/22, Strike 98.22 | | | 423,124 | |
| | | |
| 100
100,203,700 |
| | JPY | | Kyushu Electric Power Company, Inc. Call, 03/31/22, Strike 98.05 | | | 99,835 | |
| | | | | | | | | | |
| | | | | | | | | 2,215,455 | |
| | | | | | | | | | |
| | | |
| | | | | | TOTAL PURCHASED OPTIONS | | | 31,095,690 | |
| | | | | | | | | | |
| | | | | | |
| See accompanying Notes to Schedule of Investments | | www.calamos.com | | | 79 | |
Market Neutral Income Fund Schedule of Investments October 31, 2019
| | | | | | | | | | |
PRINCIPAL AMOUNT | | | | | | | VALUE | |
| | | | | | | | | | |
| | U.S. Government And Agency Securities (0.6%) | |
| | | | | | United States Treasury Note | | | | |
| | 25,000,000 | | | | | 2.875%, 10/31/20 | | $ | 25,312,500 | |
| | 25,000,000 | | | | | 2.375%, 04/30/20 | | | 25,098,633 | |
| | | | | | | | | | |
| | | |
| | | | | | TOTAL U.S. GOVERNMENT AND AGENCY SECURITIES | | | 50,411,133 | |
| | | | | | | | | | |
| | | |
| | | | | | TOTAL SYNTHETIC CONVERTIBLE SECURITIES
(Cost $77,717,235) | | | 81,506,823 | |
| | | | | | | | | | |
| | | | | | | | | | |
NUMBER OF SHARES | | | | | | | VALUE | |
|
| | CONVERTIBLE PREFERRED STOCKS (5.1%) | |
| | | | | | Consumer Staples (0.1%) | |
| | 100,000 | | | | | Energizer Holdings, Inc.
7.500%, 01/15/22 | | | 9,286,000 | |
| | | | | | | | | | |
| | | | | | Financials (1.0%) | |
| | 280,000 | | | | | 2017 Mandatory Exchangeable Trust*
5.188%, 12/01/20 | | | 41,770,400 | |
| | | |
| | 322,820 | | | | | Assurant, Inc.
6.500%, 03/15/21 | | | 40,342,815 | |
| | | |
| | 50,000 | | | | | Virtus Investment Partners, Inc.
7.250%, 02/01/20 | | | 4,719,000 | |
| | | | | | | | | | |
| | | | | | | | | 86,832,215 | |
| | | | | | | | | | |
| | | | | | Health Care (0.5%) | |
| | 614,735 | | | | | Becton Dickinson and Company~
6.125%, 05/01/20 | | | 37,916,855 | |
| | | | | | | | | | |
| | | | | | Industrials (0.8%) | |
| | 230,000 | | | | | Colfax Corp.^
5.750%, 01/15/22 | | | 33,720,300 | |
| | | |
| | 15,500 | | | | | Fortive Corp.
5.000%, 07/01/21 | | | 13,958,525 | |
| | | |
| | 300,000 | | | | | Rexnord Corp.~
5.750%, 11/15/19 | | | 16,743,000 | |
| | | | | | | | | | |
| | | | | | | | | 64,421,825 | |
| | | | | | | | | | |
| | | | | | Information Technology (0.7%) | |
| | 58,000 | | | | | Broadcom, Inc.^
8.000%, 09/30/22 | | | 62,815,160 | |
| | | | | | | | | | |
| | | | | | Materials (0.1%) | | | | |
| | 242,647 | | | | | International Flavors & Fragrances, Inc.
6.000%, 09/15/21 | | | 11,348,600 | |
| | | | | | | | | | |
| | | | | | Real Estate (0.3%) | | | | |
| | 22,856 | | | | | Crown Castle International Corp.
6.875%, 08/01/20 | | | 28,471,491 | |
| | | | | | | | | | |
| | | | | | Utilities (1.6%) | | | | |
| | 99,780 | | | | | American Electric Power Company, Inc.^
6.125%, 03/15/22 | | | 5,486,902 | |
| | | | | | | | | | |
NUMBER OF SHARES | | | | | | | VALUE | |
| | | |
| | 308,881 | | | | | Aqua America, Inc.
6.000%, 04/30/22 | | $ | 18,610,080 | |
| | | |
| | 400,000 | | | | | CenterPoint Energy, Inc. (Warner Media, LLC, Charter Communications Time, Inc.)§
7.000%, 09/01/21 | | | 20,400,000 | |
| | | |
| | 300,000 | | | | | DTE Energy Company
6.250%, 11/01/22 | | | 15,247,500 | |
| | | |
| | 200,000 | | | | | NextEra Energy, Inc.
4.872%, 09/01/22 | | | 10,172,000 | |
| | | |
| | | | | | Sempra Energy | | | | |
| | 247,059 | | | | | 6.000%, 01/15/21 | | | 28,666,256 | |
| | 135,000 | | | | | 6.750%, 07/15/21 | | | 15,685,650 | |
| | | |
| | 88,235 | | | | | South Jersey Industries, Inc.
7.250%, 04/15/21 | | | 4,499,985 | |
| | | |
| | 400,000 | | | | | Southern Company
6.750%, 08/01/22 | | | 21,264,000 | |
| | | | | | | | | | |
| | | | | | | | | 140,032,373 | |
| | | | | | | | | | |
| | | |
| | | | | | TOTAL CONVERTIBLE PREFERRED STOCKS (Cost $402,857,789) | | | 441,124,519 | |
| | | | | | | | | | |
| | | | | | | | | | |
|
| | COMMON STOCKS (53.7%) | |
| | | | | | Communication Services (5.6%) | | | | |
| | 125,531 | | | | | Activision Blizzard, Inc. | | | 7,033,502 | |
| | | |
| | 53,441 | | | | | Alphabet, Inc. - Class A~# | | | 67,271,531 | |
| | | |
| | 55,316 | | | | | Alphabet, Inc. - Class C~# | | | 69,704,245 | |
| | | |
| | 1,348,122 | | | | | AT&T, Inc.~ | | | 51,889,216 | |
| | | |
| | 36,123 | | | | | Charter Communications, Inc. - Class A# | | | 16,900,507 | |
| | | |
| | 891,152 | | | | | Comcast Corp. - Class A~ | | | 39,941,432 | |
| | | |
| | 536,723 | | | | | Facebook, Inc. - Class A~# | | | 102,862,963 | |
| | | |
| | 154,000 | | | | | Fox Corp. - Class A | | | 4,934,160 | |
| | | |
| | 110,848 | | | | | Netflix, Inc.# | | | 31,858,824 | |
| | | |
| | 147,258 | | | | | Twitter, Inc.# | | | 4,413,322 | |
| | | |
| | 793,050 | | | | | Verizon Communications, Inc.~ | | | 47,955,733 | |
| | | |
| | 348,094 | | | | | Walt Disney Company~ | | | 45,224,372 | |
| | | | | | | | | | |
| | | | | | | | | 489,989,807 | |
| | | | | | | | | | |
| | | | | | Consumer Discretionary (5.5%) | |
| | 78,931 | | | | | Amazon.com, Inc.~# | | | 140,233,551 | |
| | | |
| | 124,640 | | | | | Aptiv, PLC | | | 11,161,512 | |
| | | |
| | 7,134 | | | | | Booking Holdings, Inc.~# | | | 14,615,925 | |
| | | |
| | 106,418 | | | | | Carnival Corp.~ | | | 4,564,268 | |
| | | |
| | 165,388 | | | | | D.R. Horton, Inc.~ | | | 8,661,370 | |
| | | |
| | 54,441 | | | | | Darden Restaurants, Inc.~ | | | 6,112,091 | |
| | | |
| | 47,223 | | | | | Dollar General Corp.~ | | | 7,571,736 | |
| | | |
| | 190,384 | | | | | eBay, Inc. | | | 6,711,036 | |
| | | |
| | 75,046 | | | | | Expedia Group, Inc. | | | 10,255,786 | |
| | | |
| | 739,422 | | | | | Ford Motor Company~ | | | 6,351,635 | |
| | | |
| | 196,968 | | | | | General Motors Company | | | 7,319,331 | |
| | | | |
| 80 | | CALAMOS OPEN-END FAMILY OF FUNDS ANNUAL REPORT | | See accompanying Notes to Schedule of Investments |
Market Neutral Income Fund Schedule of Investments October 31, 2019
| | | | | | | | | | |
NUMBER OF SHARES | | | | | | | VALUE | |
| | | |
| | 227,444 | | | | | Home Depot, Inc.~ | | $ | 53,353,814 | |
| | | |
| | 111,673 | | | | | Leggett & Platt, Inc.^ | | | 5,728,825 | |
| | | |
| | 187,169 | | | | | Lowe’s Companies, Inc.~ | | | 20,889,932 | |
| | | |
| | 184,086 | | | | | McDonald’s Corp. | | | 36,209,716 | |
| | | |
| | 323,236 | | | | | MGM Resorts International | | | 9,212,226 | |
| | | |
| | 45,097 | | | | | Mohawk Industries, Inc.~# | | | 6,466,008 | |
| | | |
| | 246,148 | | | | | Nike, Inc. - Class B~ | | | 22,042,553 | |
| | | |
| | 22,387 | | | | | O’Reilly Automotive, Inc.# | | | 9,749,762 | |
| | | |
| | 44,996 | | | | | PVH Corp.~ | | | 3,921,851 | |
| | | |
| | 94,009 | | | | | Ross Stores, Inc.~ | | | 10,309,967 | |
| | | |
| | 97,970 | | | | | Royal Caribbean Cruises, Ltd. | | | 10,662,075 | |
| | | |
| | 228,322 | | | | | Starbucks Corp.~ | | | 19,306,908 | |
| | | |
| | 141,205 | | | | | Target Corp.~ | | | 15,096,227 | |
| | | |
| | 293,871 | | | | | TJX Companies, Inc.~ | | | 16,941,663 | |
| | | |
| | 16,861 | | | | | Ulta Salon Cosmetics & Fragrance, Inc.# | | | 3,931,142 | |
| | | |
| | 99,188 | | | | | VF Corp. | | | 8,162,181 | |
| | | |
| | 50,000 | | | | | Wynn Resorts, Ltd. | | | 6,067,000 | |
| | | | | | | | | | |
| | | | | | | | | 481,610,091 | |
| | | | | | | | | | |
| | | | | | Consumer Staples (4.0%) | |
| | 382,717 | | | | | Altria Group, Inc.~ | | | 17,141,894 | |
| | | |
| | 155,672 | | | | | Archer-Daniels-Midland Company~ | | | 6,544,451 | |
| | | |
| | 100,045 | | | | | Church & Dwight Company, Inc. | | | 6,997,147 | |
| | | |
| | 779,859 | | | | | Coca-Cola Company | | | 42,447,725 | |
| | | |
| | 154,256 | | | | | Colgate-Palmolive Company~ | | | 10,581,962 | |
| | | |
| | 50,474 | | | | | Constellation Brands, Inc. - Class A | | | 9,606,716 | |
| | | |
| | 61,262 | | | | | Costco Wholesale Corp.~ | | | 18,201,553 | |
| | | |
| | 168,722 | | | | | General Mills, Inc. | | | 8,581,201 | |
| | | |
| | 124,356 | | | | | Kellogg Company~ | | | 7,900,337 | |
| | | |
| | 92,685 | | | | | Kimberly-Clark Corp. | | | 12,315,983 | |
| | | |
| | 214,348 | | | | | Kraft Heinz Company | | | 6,929,871 | |
| | | |
| | 222,166 | | | | | Kroger Company | | | 5,474,170 | |
| | | |
| | 357,978 | | | | | Mondelez International, Inc. - Class A | | | 18,775,946 | |
| | | |
| | 96,310 | | | | | Monster Beverage Corp.# | | | 5,405,880 | |
| | | |
| | 258,347 | | | | | PepsiCo, Inc.~ | | | 35,437,458 | |
| | | |
| | 205,409 | | | | | Philip Morris International, Inc.~ | | | 16,728,509 | |
| | | |
| | 461,446 | | | | | Procter & Gamble Company | | | 57,454,642 | |
| | | |
| | 128,707 | | | | | Sysco Corp. | | | 10,279,828 | |
| | | |
| | 156,520 | | | | | Walgreens Boots Alliance, Inc. | | | 8,574,166 | |
| | | |
| | 339,650 | | | | | Walmart, Inc.~ | | | 39,827,359 | |
| | | | | | | | | | |
| | | | | | | | | 345,206,798 | |
| | | | | | | | | | |
| | | | | | Energy (2.3%) | | | | |
| | 421,372 | | | | | Chevron Corp.~ | | | 48,938,144 | |
| | | |
| | 345,771 | | | | | ConocoPhillips~ | | | 19,086,559 | |
| | | |
| | 76,281 | | | | | EOG Resources, Inc.~ | | | 5,287,036 | |
| | | |
| | 468,036 | | | | | Exxon Mobil Corp.~ | | | 31,625,193 | |
| | | | | | | | | | |
NUMBER OF SHARES | | | | | | | VALUE | |
| | | |
| | 178,223 | | | | | Hess Corp. | | $ | 11,718,162 | |
| | | |
| | 527,939 | | | | | Kinder Morgan, Inc. | | | 10,548,221 | |
| | | |
| | 288,236 | | | | | Marathon Petroleum Corp. | | | 18,432,692 | |
| | | |
| | 163,851 | | | | | Occidental Petroleum Corp. | | | 6,635,966 | |
| | | |
| | 105,831 | | | | | ONEOK, Inc. | | | 7,390,179 | |
| | | |
| | 74,281 | | | | | Phillips 66~ | | | 8,677,506 | |
| | | |
| | 95,194 | | | | | Pioneer Natural Resources Company | | | 11,710,766 | |
| | | |
| | 235,475 | | | | | Schlumberger, Ltd. | | | 7,697,678 | |
| | | |
| | 71,864 | | | | | Valero Energy Corp.~ | | | 6,969,371 | |
| | | |
| | 266,379 | | | | | Williams Companies, Inc. | | | 5,942,915 | |
| | | | | | | | | | |
| | | | | | | | | 200,660,388 | |
| | | | | | | | | | |
| | | | | | Financials (7.2%) | |
| | 131,224 | | | | | Aflac, Inc.~ | | | 6,975,868 | |
| | | |
| | 102,375 | | | | | Allstate Corp.~ | | | 10,894,748 | |
| | | |
| | 118,298 | | | | | American Express Company~ | | | 13,873,989 | |
| | | |
| | 374,322 | | | | | American International Group, Inc.~ | | | 19,824,093 | |
| | | |
| | 51,296 | | | | | Ameriprise Financial, Inc. | | | 7,740,053 | |
| | | |
| | 91,515 | | | | | Arthur J. Gallagher & Company | | | 8,347,998 | |
| | | |
| | 76,944 | | | | | Assurant, Inc. | | | 9,700,330 | |
| | | |
| | 2,080,474 | | | | | Bank of America Corp.~ | | | 65,056,422 | |
| | | |
| | 191,042 | | | | | Bank of New York Mellon Corp. | | | 8,931,214 | |
| | | |
| | 338,355 | | | | | Berkshire Hathaway, Inc. - Class B~# | | | 71,927,506 | |
| | | |
| | 19,822 | | | | | BlackRock, Inc.~ | | | 9,151,817 | |
| | | |
| | 265,251 | | | | | Capital One Financial Corp.~ | | | 24,734,656 | |
| | | |
| | 131,665 | | | | | Cboe Global Markets, Inc. | | | 15,161,225 | |
| | | |
| | 144,657 | | | | | Charles Schwab Corp.~ | | | 5,888,986 | |
| | | |
| | 85,446 | | | | | Chubb, Ltd.~ | | | 13,023,679 | |
| | | |
| | 443,318 | | | | | Citigroup, Inc.~ | | | 31,856,832 | |
| | | |
| | 41,224 | | | | | CME Group, Inc. | | | 8,481,838 | |
| | | |
| | 90,493 | | | | | Discover Financial Services | | | 7,262,968 | |
| | | |
| | 94,913 | | | | | First Republic Bank | | | 10,094,947 | |
| | | |
| | 111,127 | | | | | Goldman Sachs Group, Inc.~ | | | 23,712,279 | |
| | | |
| | 679,806 | | | | | JPMorgan Chase & Company~ | | | 84,921,366 | |
| | | |
| | 50,992 | | | | | M&T Bank Corp. | | | 7,981,778 | |
| | | |
| | 141,466 | | | | | Marsh & McLennan Companies, Inc. | | | 14,658,707 | |
| | | |
| | 154,136 | | | | | MetLife, Inc.~ | | | 7,212,023 | |
| | | |
| | 371,264 | | | | | Morgan Stanley~ | | | 17,096,707 | |
| | | |
| | 81,675 | | | | | Northern Trust Corp. | | | 8,141,364 | |
| | | |
| | 61,380 | | | | | Prudential Financial, Inc.~ | | | 5,594,173 | |
| | | |
| | 53,281 | | | | | S&P Global, Inc. | | | 13,745,965 | |
| | | |
| | 77,138 | | | | | State Street Corp.~ | | | 5,096,508 | |
| | | |
| | 106,462 | | | | | SunTrust Banks, Inc.~ | | | 7,275,613 | |
| | | |
| | 68,418 | | | | | Travelers Companies, Inc.~ | | | 8,966,863 | |
| | | |
| | 413,537 | | | | | US Bancorp | | | 23,579,880 | |
| | | | | | |
| See accompanying Notes to Schedule of Investments | | www.calamos.com | | | 81 | |
Market Neutral Income Fund Schedule of Investments October 31, 2019
| | | | | | | | | | |
NUMBER OF SHARES | | | | | | | VALUE | |
| | | |
| | 679,239 | | | | | Wells Fargo & Company~ | | $ | 35,069,110 | |
| | | |
| | 246,201 | | | | | Zions Bancorporation, N.A. ^ | | | 11,933,362 | |
| | | | | | | | | | |
| | | | | | | | | 623,914,867 | |
| | | | | | | | | | |
| | | | | | Health Care (7.5%) | |
| | 265,433 | | | | | Abbott Laboratories~ | | | 22,192,853 | |
| | | |
| | 276,001 | | | | | AbbVie, Inc.~ | | | 21,955,880 | |
| | | |
| | 225,237 | | | | | Agilent Technologies, Inc. | | | 17,061,703 | |
| | | |
| | 135,182 | | | | | Alexion Pharmaceuticals, Inc.~# | | | 14,248,183 | |
| | | |
| | 63,346 | | | | | Allergan, PLC | | | 11,155,864 | |
| | | |
| | 74,639 | | | | | Amgen, Inc.~ | | | 15,916,767 | |
| | | |
| | 240,441 | | | | | Baxter International, Inc. | | | 18,441,825 | |
| | | |
| | 63,796 | | | | | Becton Dickinson and Company | | | 16,331,776 | |
| | | |
| | 38,848 | | | | | Biogen, Inc.~# | | | 11,604,286 | |
| | | |
| | 249,782 | | | | | Boston Scientific Corp.# | | | 10,415,909 | |
| | | |
| | 270,859 | | | | | Bristol-Myers Squibb Company~ | | | 15,539,181 | |
| | | |
| | 217,630 | | | | | Celgene Corp.# | | | 23,510,569 | |
| | | |
| | 51,433 | | | | | Cigna Corp.# | | | 9,178,733 | |
| | | |
| | 227,191 | | | | | CVS Health Corp.~ | | | 15,083,211 | |
| | | |
| | 97,686 | | | | | Danaher Corp. | | | 13,463,085 | |
| | | |
| | 38,100 | | | | | Edwards Lifesciences Corp.~# | | | 9,082,278 | |
| | | |
| | 153,800 | | | | | Eli Lilly and Company | | | 17,525,510 | |
| | | |
| | 261,642 | | | | | Gilead Sciences, Inc. | | | 16,669,212 | |
| | | |
| | 51,970 | | | | | HCA Healthcare, Inc. | | | 6,940,074 | |
| | | |
| | 60,967 | | | | | Humana, Inc. | | | 17,936,491 | |
| | | |
| | 28,659 | | | | | Illumina, Inc.# | | | 8,469,308 | |
| | | |
| | 28,966 | | | | | Intuitive Surgical, Inc.# | | | 16,016,750 | |
| | | |
| | 488,496 | | | | | Johnson & Johnson~ | | | 64,501,012 | |
| | | |
| | 65,986 | | | | | Laboratory Corp. of America Holdings~# | | | 10,872,513 | |
| | | |
| | 47,918 | | | | | McKesson Corp. | | | 6,373,094 | |
| | | |
| | 294,586 | | | | | Medtronic, PLC | | | 32,080,415 | |
| | | |
| | 490,204 | | | | | Merck & Company, Inc. | | | 42,481,079 | |
| | | |
| | 1,063,344 | | | | | Pfizer, Inc.~ | | | 40,800,509 | |
| | | |
| | 62,373 | | | | | Quest Diagnostics, Inc.~ | | | 6,315,266 | |
| | | |
| | 12,668 | | | | | Regeneron Pharmaceuticals, Inc.~# | | | 3,879,955 | |
| | | |
| | 45,187 | | | | | Stryker Corp.~ | | | 9,772,592 | |
| | | |
| | 9,000 | | | | | Teleflex, Inc. | | | 3,126,690 | |
| | | |
| | 57,433 | | | | | Thermo Fisher Scientific, Inc.~ | | | 17,343,617 | |
| | | |
| | 218,409 | | | | | UnitedHealth Group, Inc.~ | | | 55,191,954 | |
| | | |
| | 41,203 | | | | | Vertex Pharmaceuticals, Inc.# | | | 8,054,362 | |
| | | |
| | 35,757 | | | | | WellCare Health Plans, Inc.# | | | 10,605,526 | |
| | | |
| | 48,859 | | | | | Zimmer Biomet Holdings, Inc. | | | 6,753,780 | |
| | | |
| | 62,999 | | | | | Zoetis, Inc. | | | 8,058,832 | |
| | | | | | | | | | |
| | | | | | | | | 654,950,644 | |
| | | | | | | | | | |
| | | | | | Industrials (4.9%) | |
| | 102,988 | | | | | 3M Company | | | 16,991,990 | |
| | | |
| | 53,989 | | | | | Allegion, PLC | | | 6,264,884 | |
| | | | | | | | | | |
NUMBER OF SHARES | | | | | | | VALUE | |
| | | |
| | 99,785 | | | | | Boeing Company~ | | $ | 33,917,919 | |
| | | |
| | 157,363 | | | | | Caterpillar, Inc.~ | | | 21,684,621 | |
| | | |
| | 258,804 | | | | | CSX Corp.~ | | | 18,186,157 | |
| | | |
| | 53,342 | | | | | Deere & Company | | | 9,288,976 | |
| | | |
| | 233,973 | | | | | Delta Air Lines, Inc.~ | | | 12,887,233 | |
| | | |
| | 78,553 | | | | | Eaton Corp., PLC | | | 6,842,752 | |
| | | |
| | 208,193 | | | | | Emerson Electric Company~ | | | 14,604,739 | |
| | | |
| | 39,361 | | | | | FedEx Corp. | | | 6,008,850 | |
| | | |
| | 113,472 | | | | | Fortune Brands Home & Security, Inc. | | | 6,813,994 | |
| | | |
| | 45,759 | | | | | General Dynamics Corp. | | | 8,090,191 | |
| | | |
| | 1,581,246 | | | | | General Electric Company | | | 15,780,835 | |
| | | |
| | 162,804 | | | | | Honeywell International, Inc. | | | 28,121,135 | |
| | | |
| | 65,280 | | | | | Illinois Tool Works, Inc.~ | | | 11,004,902 | |
| | | |
| | 179,245 | | | | | Johnson Controls International, PLC | | | 7,766,686 | |
| | | |
| | 60,724 | | | | | L3Harris Technologies, Inc. | | | 12,527,968 | |
| | | |
| | 37,410 | | | | | Lockheed Martin Corp. | | | 14,091,599 | |
| | | |
| | 154,173 | | | | | Masco Corp. | | | 7,130,501 | |
| | | |
| | 41,067 | | | | | Norfolk Southern Corp. | | | 7,474,194 | |
| | | |
| | 59,147 | | | | | Northrop Grumman Corp. | | | 20,848,135 | |
| | | |
| | 108,397 | | | | | PACCAR, Inc. | | | 8,244,676 | |
| | | |
| | 128,083 | | | | | Pentair, PLC | | | 5,311,602 | |
| | | |
| | 47,478 | | | | | Raytheon Company | | | 10,075,306 | |
| | | |
| | 135,841 | | | | | Southwest Airlines Company~ | | | 7,624,755 | |
| | | |
| | 75,961 | | | | | Stanley Black & Decker, Inc. | | | 11,495,178 | |
| | | |
| | 145,024 | | | | | Union Pacific Corp.~ | | | 23,995,671 | |
| | | |
| | 89,394 | | | | | United Airlines Holdings, Inc.# | | | 8,120,551 | |
| | | |
| | 124,279 | | | | | United Parcel Service, Inc. - Class B | | | 14,313,212 | |
| | 137,791 | | | | | United Technologies Corp.~ | | | 19,784,032 | |
| | | |
| | 60,775 | | | | | Verisk Analytics, Inc. | | | 8,794,143 | |
| | | |
| | 26,287 | | | | | Wabtec Corp.^ | | | 1,823,529 | |
| | | |
| | 116,118 | | | | | Waste Management, Inc. | | | 13,029,601 | |
| | | |
| | 85,501 | | | | | Xylem, Inc. | | | 6,557,072 | |
| | | | | | | | | | |
| | | | | | | | | 425,497,589 | |
| | | | | | | | | | |
| | | | | | Information Technology (11.9%) | |
| | 110,554 | | | | | Accenture, PLC - Class A~ | | | 20,498,923 | |
| | | |
| | 88,925 | | | | | Adobe, Inc.# | | | 24,714,925 | |
| | | |
| | 457,639 | | | | | Advanced Micro Devices, Inc.^# | | | 15,527,691 | |
| | | |
| | 79,138 | | | | | Amphenol Corp. - Class A~ | | | 7,939,916 | |
| | | |
| | 809,393 | | | | | Apple, Inc.~ | | | 201,344,603 | |
| | | |
| | 444,159 | | | | | Applied Materials, Inc.~ | | | 24,100,067 | |
| | | |
| | 52,168 | | | | | Autodesk, Inc.# | | | 7,687,476 | |
| | | |
| | 102,956 | | | | | Automatic Data Processing, Inc. | | | 16,702,552 | |
| | | |
| | 81,618 | | | | | Broadcom, Inc. | | | 23,901,831 | |
| | | |
| | 1,017,108 | | | | | Cisco Systems, Inc.~ | | | 48,322,801 | |
| | | |
| | 67,531 | | | | | Citrix Systems, Inc. | | | 7,351,425 | |
| | | | |
| 82 | | CALAMOS OPEN-END FAMILY OF FUNDS ANNUAL REPORT | | See accompanying Notes to Schedule of Investments |
Market Neutral Income Fund Schedule of Investments October 31, 2019
| | | | | | | | | | |
NUMBER OF SHARES | | | | | | | VALUE | |
| | | |
| | 133,883 | | | | | Cognizant Technology Solutions Corp. - Class A~ | | $ | 8,158,830 | |
| | | |
| | 121,623 | | | | | Fiserv, Inc.# | | | 12,909,065 | |
| | | |
| | 104,725 | | | | | FLIR Systems, Inc. | | | 5,399,621 | |
| | | |
| | 45,212 | | | | | Gartner, Inc.# | | | 6,966,265 | |
| | | |
| | 68,935 | | | | | Global Payments, Inc. | | | 11,662,423 | |
| | | |
| | 260,539 | | | | | HP, Inc. | | | 4,525,562 | |
| | | |
| | 750,020 | | | | | Intel Corp.~ | | | 42,398,631 | |
| | | |
| | 123,761 | | | | | International Business Machines Corp. | | | 16,550,559 | |
| | | |
| | 51,837 | | | | | Intuit, Inc. | | | 13,348,028 | |
| | | |
| | 45,957 | | | | | Jack Henry & Associates, Inc. | | | 6,505,673 | |
| | | |
| | 51,406 | | | | | Lam Research Corp. | | | 13,933,082 | |
| | | |
| | 167,065 | | | | | MasterCard, Inc. - Class A | | | 46,245,263 | |
| | | |
| | 339,342 | | | | | Micron Technology, Inc.~# | | | 16,135,712 | |
| | | |
| | 1,420,341 | | | | | Microsoft Corp.~ | | | 203,634,289 | |
| | | |
| | 135,031 | | | | | NVIDIA Corp. | | | 27,143,932 | |
| | | |
| | 354,388 | | | | | Oracle Corp. | | | 19,310,602 | |
| | | |
| | 96,629 | | | | | Paychex, Inc. | | | 8,082,050 | |
| | | |
| | 193,493 | | | | | PayPal Holdings, Inc.# | | | 20,142,621 | |
| | | |
| | 222,883 | | | | | QUALCOMM, Inc. | | | 17,928,709 | |
| | | |
| | 204,590 | | | | | Salesforce.com, Inc.# | | | 32,016,289 | |
| | | |
| | 67,092 | | | | | TE Connectivity, Ltd. | | | 6,004,734 | |
| | | |
| | 120,568 | | | | | Texas Instruments, Inc.~ | | | 14,225,818 | |
| | | |
| | 373,705 | | | | | Visa, Inc. - Class A~^ | | | 66,840,876 | |
| | | |
| | 67,706 | | | | | Western Digital Corp. | | | 3,497,015 | |
| | | |
| | 310,490 | | | | | Western Union Company | | | 7,780,879 | |
| | | |
| | 136,405 | | | | | Xilinx, Inc. | | | 12,377,390 | |
| | | | | | | | | | |
| | | | | | | | | 1,041,816,128 | |
| | | | | | | | | | |
| | | | | | Materials (1.3%) | |
| | 61,386 | | | | | Air Products & Chemicals, Inc.~ | | | 13,091,178 | |
| | | |
| | 50,049 | | | | | Avery Dennison Corp. | | | 6,399,265 | |
| | | |
| | 138,865 | | | | | Ball Corp. | | | 9,716,384 | |
| | | |
| | 174,458 | | | | | Corteva, Inc.# | | | 4,602,202 | |
| | | |
| | 174,456 | | | | | Dow, Inc.# | | | 8,808,283 | |
| | | |
| | 174,454 | | | | | DuPont de Nemours, Inc. | | | 11,498,263 | |
| | | |
| | 478,033 | | | | | Freeport-McMoRan, Inc. | | | 4,694,284 | |
| | | |
| | 134,104 | | | | | Linde, PLC | | | 26,599,528 | |
| | | |
| | 156,642 | | | | | Newmont Mining Corp. | | | 6,223,387 | |
| | | |
| | 75,379 | | | | | PPG Industries, Inc. | | | 9,431,421 | |
| | | |
| | 15,049 | | | | | Sherwin-Williams Company | | | 8,612,844 | |
| | | | | | | | | | |
| | | | | | | | | 109,677,039 | |
| | | | | | | | | | |
| | | | | | Real Estate (1.7%) | |
| | 52,052 | | | | | Alexandria Real Estate Equities, Inc. | | | 8,263,255 | |
| | | |
| | 71,822 | | | | | American Tower Corp.~ | | | 15,662,942 | |
| | | |
| | 117,150 | | | | | Apartment Investment & Management Company - Class A | | | 6,429,192 | |
| | | | | | | | | | |
NUMBER OF SHARES | | | | | | | VALUE | |
| | | |
| | 47,886 | | | | | AvalonBay Communities, Inc.~ | | $ | 10,422,867 | |
| | | |
| | 66,353 | | | | | Crown Castle International Corp. | | | 9,209,133 | |
| | | |
| | 56,814 | | | | | Digital Realty Trust, Inc.^ | | | 7,217,651 | |
| | | |
| | 13,760 | | | | | Equinix, Inc. | | | 7,798,893 | |
| | | |
| | 46,230 | | | | | Federal Realty Investment Trust | | | 6,287,742 | |
| | | |
| | 62,055 | | | | | Mid-America Apartment Communities, Inc. | | | 8,625,024 | |
| | | |
| | 97,528 | | | | | Prologis, Inc.~ | | | 8,559,057 | |
| | | |
| | 34,171 | | | | | Public Storage~ | | | 7,615,349 | |
| | | |
| | 118,468 | | | | | Realty Income Corp. | | | 9,689,498 | |
| | | |
| | 96,629 | | | | | Regency Centers Corp. | | | 6,497,334 | |
| | | |
| | 78,381 | | | | | Simon Property Group, Inc. | | | 11,810,449 | |
| | | |
| | 150,328 | | | | | UDR, Inc. | | | 7,553,982 | |
| | | |
| | 121,581 | | | | | Welltower, Inc. | | | 11,026,181 | |
| | | |
| | 232,202 | | | | | Weyerhaeuser Company | | | 6,782,620 | |
| | | | | | | | | | |
| | | | | | | | | 149,451,169 | |
| | | | | | | | | | |
| | | | | | Utilities (1.8%) | |
| | 371,494 | | | | | AES Corp.~ | | | 6,333,973 | |
| | | |
| | 145,276 | | | | | American Electric Power Company, Inc.~ | | | 13,712,602 | |
| | | |
| | 134,880 | | | | | CMS Energy Corp.~ | | | 8,621,530 | |
| | | |
| | 112,930 | | | | | Consolidated Edison, Inc. | | | 10,414,404 | |
| | | |
| | 133,484 | | | | | Dominion Energy, Inc.~ | | | 11,019,104 | |
| | | |
| | 184,461 | | | | | Duke Energy Corp.~ | | | 17,387,294 | |
| | | |
| | 88,664 | | | | | Edison International | | | 5,576,966 | |
| | | |
| | 82,576 | | | | | Entergy Corp. | | | 10,031,332 | |
| | | |
| | 124,136 | | | | | Exelon Corp.~ | | | 5,646,947 | |
| | | |
| | 186,928 | | | | | FirstEnergy Corp.~ | | | 9,032,361 | |
| | | |
| | 76,211 | | | | | NextEra Energy, Inc. | | | 18,164,130 | |
| | | |
| | 228,795 | | | | | NiSource, Inc. | | | 6,415,412 | |
| | | |
| | 143,626 | | | | | Public Service Enterprise Group, Inc.~ | | | 9,092,962 | |
| | | |
| | 205,310 | | | | | Southern Company | | | 12,864,724 | |
| | | |
| | 164,330 | | | | | Xcel Energy, Inc. | | | 10,436,598 | |
| | | | | | | | | | |
| | | | | | | | | 154,750,339 | |
| | | | | | | | | | |
| | | |
| | | | | | TOTAL COMMON STOCKS (Cost $4,016,658,118) | | | 4,677,524,859 | |
| | | | | | | | | | |
| | | | | | | | | | |
|
| | EXCHANGE-TRADED FUND (0.3%) | |
| | | | | | Other (0.3%) | |
| | 86,000 | | | | | SPDR S&P 500 ETF Trust (Cost $25,469,733) | | | 26,086,380 | |
| | | | | | | | | | |
|
| | INVESTMENTS IN AFFILIATED FUND (1.7%) | |
| | | | | | Other (1.7%) | |
| | 14,938,002 | | | | | Calamos Short-Term Bond Fund - Class I (Cost $150,000,000) | | | 152,367,617 | |
| | | | | | | | | | |
| | | | | | |
| See accompanying Notes to Schedule of Investments | | www.calamos.com | | | 83 | |
Market Neutral Income Fund Schedule of Investments October 31, 2019
| | | | | | | | | | |
NUMBER OF CONTRACTS/ NOTIONAL AMOUNT | | | | | | | VALUE | |
|
| | PURCHASED OPTIONS (0.2%)# | |
| | | | | | Other (0.2%) | |
| | | | | | S&P 500 Index | | | | |
| 5,500
1,670,658,000 |
| | | | Put, 12/31/19, Strike $2,750.00 | | $ | 6,682,500 | |
| 4,000
1,215,024,000 |
| | | | Put, 03/31/20, Strike $2,500.00 | | | 7,840,000 | |
| 3,500
1,063,146,000 |
| | | | Put, 12/31/19, Strike $2,700.00 | | | 3,237,500 | |
| 2,000
607,512,000 |
| | | | Put, 12/31/19, Strike $2,500.00 | | | 660,000 | |
| 1,000
303,756,000 |
| | | | Put, 11/29/19, Strike $3,000.00 | | | 2,555,000 | |
| 750
227,817,000 |
| | | | Put, 11/29/19, Strike $2,700.00 | | | 166,875 | |
| | | | | | | | | | |
| | | |
| | | | | | TOTAL PURCHASED OPTIONS (Cost $36,513,933) | | | 21,141,875 | |
| | | | | | | | | | |
| | | | | | | | | | |
NUMBER OF SHARES | | | | | | | VALUE | |
|
| | SHORT TERM INVESTMENTS (3.5%) | |
| | 150,928,215 | | | | | Fidelity Prime Money Market Fund - Institutional Class, 1.890%*** | | | 150,988,587 | |
| | | |
| | 151,161,602 | | | | | Morgan Stanley Institutional Liquidity Funds - Government Portfolio, 1.720%*** | | | 151,161,602 | |
| | | | | | | | | | |
| | | |
| | | | | | TOTAL SHORT TERM INVESTMENTS (Cost $302,140,960) | | | 302,150,189 | |
| | | | | | | | | | |
| | | | | | | | | | |
NUMBER OF SHARES/ PRINCIPAL
AMOUNT | | | | | | | VALUE | |
|
| INVESTMENT OF CASH COLLATERAL FOR SECURITIES
LOANED (1.2%) |
|
| | 36,524,248 | | | | | Fidelity Prime Money Market Fund - Institutional Class, 1.890%***† | | | 36,524,248 | |
| | | |
| | 65,845,297 | | | | | State Street Navigator Securities Lending Government Money Market Portfolio† | | | 65,845,297 | |
| | | | | | | | | | |
| | | |
| | | | | | TOTAL INVESTMENT OF CASH COLLATERAL FOR SECURITIES LOANED (Cost $102,369,545) | | | 102,369,545 | |
| | | | | | | | | | |
| |
| TOTAL INVESTMENTS (107.1%)
(Cost $8,290,831,345) | | | 9,330,477,030 | |
| | | | | | | | | | |
| |
| | PAYABLE UPON RETURN OF SECURITIES ON LOAN(-1.2%) | | | (102,369,545 | ) |
| | | | | | | | | | |
| |
| | LIABILITIES, LESS OTHER ASSETS(-5.9%) | | | (512,953,656 | ) |
| | | | | | | | | | |
| |
| | NET ASSETS (100.0%) | | $ | 8,715,153,829 | |
| | | | | | | | | | |
| | | | | | | | | | |
NUMBER OF SHARES | | | | | | | VALUE | |
|
| | COMMON STOCKS SOLD SHORT(-31.5%)# | |
| | | | | | Communication Services(-2.5%) | |
| | (309,000 | ) | | | | Bilibili, Inc. | | $ | (4,879,110 | ) |
| | | |
| | (157,600 | ) | | EUR | | Cellnex Telecom, SA* | | | (6,795,316 | ) |
| | | |
| | (117,000 | ) | | JPY | | CyberAgent, Inc. | | | (3,824,521 | ) |
| | | |
| | (450,000 | ) | | | | Gannett Company, Inc. | | | (4,882,500 | ) |
| | | |
| | (200,000 | ) | | | | Gogo, Inc. | | | (1,230,000 | ) |
| | | |
| | (190,950 | ) | | | | IAC/InterActive Corp. | | | (43,393,387 | ) |
| | | |
| | (610,200 | ) | | | | iQIYI, Inc. | | | (10,635,786 | ) |
| | | |
| | (95,500 | ) | | | | Liberty Media Corp. / Liberty Formula One | | | (4,058,750 | ) |
| | | |
| | (51,000 | ) | | | | Live Nation Entertainment, Inc. | | | (3,595,500 | ) |
| | | |
| | (94,200 | ) | | | | Momo, Inc. | | | (3,157,584 | ) |
| | | |
| | (1,294,000 | ) | | | | New York Times Company - Class A | | | (39,984,600 | ) |
| | | |
| | (451,000 | ) | | | | Sea, Ltd. | | | (13,421,760 | ) |
| | | |
| | (845,000 | ) | | | | Snap, Inc. | | | (12,725,700 | ) |
| | | |
| | (280,175 | ) | | | | Twitter, Inc. | | | (8,396,845 | ) |
| | | |
| | (229,500 | ) | | | | Vonage Holdings Corp. | | | (2,242,215 | ) |
| | | |
| | (494,500 | ) | | | | World Wrestling Entertainment, Inc. - Class A | | | (27,711,780 | ) |
| | | |
| | (119,800 | ) | | | | YY, Inc. | | | (6,809,432 | ) |
| | | |
| | (63,800 | ) | | JPY | | Zenrin Company, Ltd. | | | (1,163,276 | ) |
| | | |
| | (265,800 | ) | | | | Zillow Group, Inc. - Class C | | | (8,657,106 | ) |
| | | |
| | (1,617,700 | ) | | | | Zynga, Inc. - Class A | | | (9,981,209 | ) |
| | | | | | | | | | |
| | | | | | | | | (217,546,377 | ) |
| | | | | | | | | | |
| | | | | | Consumer Discretionary(-4.4%) | |
| | (51,375 | ) | | | | Booking Holdings, Inc. | | | (105,255,559 | ) |
| | | |
| | (660,450 | ) | | | | Chegg, Inc. | | | (20,249,397 | ) |
| | | |
| | (1,436,700 | ) | | JPY | | DCM Holdings Company, Ltd. | | | (14,275,202 | ) |
| | | |
| | (607,600 | ) | | JPY | | EDION Corp. | | | (6,065,310 | ) |
| | | |
| | (426,100 | ) | | | | Etsy, Inc. | | | (18,957,189 | ) |
| | | |
| | (324,080 | ) | | | | Guess, Inc. | | | (5,428,340 | ) |
| | | |
| | (25,600 | ) | | JPY | | HIS Company, Ltd. | | | (667,558 | ) |
| | | |
| | (529,936 | ) | | | | LGI Homes, Inc. | | | (41,589,377 | ) |
| | | |
| | (52,704 | ) | | | | MercadoLibre, Inc. | | | (27,486,190 | ) |
| | | |
| | (335,100 | ) | | | | Pinduoduo, Inc. | | | (13,698,888 | ) |
| | | |
| | (162,500 | ) | | | | Quotient Technology, Inc. | | | (1,399,125 | ) |
| | | |
| | (155,800 | ) | | JPY | | Takashimaya Company, Ltd. | | | (1,820,721 | ) |
| | | |
| | (157,312 | ) | | EUR | | Takeaway.com, NV* | | | (12,807,852 | ) |
| | | |
| | (246,000 | ) | | | | Tesla, Inc. | | | (77,470,320 | ) |
| | | |
| | (217,000 | ) | | | | Trip.com Group Ltd. | | | (7,158,830 | ) |
| | | |
| | (347,627 | ) | | | | Wayfair, Inc. - Class A | | | (28,585,368 | ) |
| | | |
| | (7,800 | ) | | | | Winnebago Industries, Inc. | | | (374,946 | ) |
| | | | | | | | | | |
| | | | | | | | | (383,290,172 | ) |
| | | | | | | | | | |
| | | | | | Consumer Staples(-0.1%) | |
| | (160,108 | ) | | | | Energizer Holdings, Inc. | | | (6,802,989 | ) |
| | | |
| | (43,800 | ) | | JPY | | Ezaki Glico Company, Ltd. | | | (2,040,133 | ) |
| | | | |
| 84 | | CALAMOS OPEN-END FAMILY OF FUNDS ANNUAL REPORT | | See accompanying Notes to Schedule of Investments |
Market Neutral Income Fund Schedule of Investments October 31, 2019
| | | | | | | | | | |
NUMBER OF SHARES | | | | | | | VALUE | |
| | | |
| | (90,200 | ) | | | | Herbalife Nutrition, Ltd. | | $ | (4,029,234 | ) |
| | | |
| | (34,561 | ) | | | | Turning Point Brands, Inc. | | | (721,288 | ) |
| | | | | | | | | | |
| | | | | | | | | (13,593,644 | ) |
| | | | | | | | | | |
| | | | | | Energy(-0.1%) | |
| | (314,400 | ) | | | | Renewable Energy Group, Inc. | | | (5,137,296 | ) |
| | | |
| | (25,000 | ) | | | | SEACOR Holdings, Inc. | | | (1,072,750 | ) |
| | | | | | | | | | |
| | | | | | | | | (6,210,046 | ) |
| | | | | | | | | | |
| | | | | | Financials(-1.4%) | |
| | (287,397 | ) | | | | Assurant, Inc. | | | (36,232,140 | ) |
| | | |
| | (816,000 | ) | | | | AXA Equitable Holdings, Inc. | | | (17,625,600 | ) |
| | | |
| | (276,300 | ) | | | | Heritage Insurance Holdings, Inc. | | | (3,680,316 | ) |
| | | |
| | (59,000 | ) | | | | Hope Bancorp, Inc. | | | (841,930 | ) |
| | | |
| | (134,429 | ) | | | | LendingTree, Inc. | | | (48,374,275 | ) |
| | | |
| | (68,000 | ) | | | | PRA Group, Inc. | | | (2,307,240 | ) |
| | | |
| | (528,000 | ) | | | | Qudian, Inc. | | | (3,659,040 | ) |
| | | |
| | (34,000 | ) | | | | Virtus Investment Partners, Inc. | | | (3,688,320 | ) |
| | | |
| | (58,500 | ) | | | | Voya Financial, Inc. | | | (3,156,660 | ) |
| | | | | | | | | | |
| | | | | | | | | (119,565,521 | ) |
| | | | | | | | | | |
| | | | | | Health Care(-3.0%) | |
| | (50,000 | ) | | | | Allscripts Healthcare Solutions, Inc. | | | (547,000 | ) |
| | | |
| | (138,500 | ) | | | | Becton Dickinson and Company | | | (35,456,000 | ) |
| | | |
| | (48,500 | ) | | | | CONMED Corp. | | | (5,335,970 | ) |
| | | |
| | (195,750 | ) | | | | DexCom, Inc. | | | (30,192,480 | ) |
| | | |
| | (29,700 | ) | | | | Evolent Health, Inc. - Class A | | | (226,314 | ) |
| | | |
| | (120,000 | ) | | | | Flexion Therapeutics, Inc. | | | (2,060,400 | ) |
| | | |
| | (182,500 | ) | | | | Immunomedics, Inc. | | | (2,920,000 | ) |
| | | |
| | (82,000 | ) | | | | Innoviva, Inc. | | | (1,321,840 | ) |
| | | |
| | (754,291 | ) | | | | Innoviva, Inc. | | | (8,764,861 | ) |
| | | |
| | (170,431 | ) | | | | Insmed, Inc. | | | (3,168,312 | ) |
| | | |
| | (53,028 | ) | | | | Insulet Corp. | | | (7,706,029 | ) |
| | | |
| | (39,500 | ) | | | | Intercept Pharmaceuticals, Inc. | | | (2,874,810 | ) |
| | | |
| | (259,600 | ) | | | | Ionis Pharmaceuticals, Inc. | | | (14,464,912 | ) |
| | | |
| | (855,487 | ) | | | | Ironwood Pharmaceuticals, Inc. | | | (8,589,090 | ) |
| | | |
| | (19,600 | ) | | | | Ligand Pharmaceuticals, Inc. | | | (2,132,676 | ) |
| | | |
| | (544,000 | ) | | | | Medicines Company | | | (28,554,560 | ) |
| | | |
| | (174,371 | ) | | | | Neurocrine Biosciences, Inc. | | | (17,348,171 | ) |
| | | |
| | (235,600 | ) | | JPY | | Nipro Corp. | | | (2,775,101 | ) |
| | | |
| | (227,600 | ) | | | | NuVasive, Inc. | | | (16,054,904 | ) |
| | | |
| | (500,000 | ) | | | | OPKO Health, Inc. | | | (710,000 | ) |
| | | |
| | (33,500 | ) | | | | Pacira BioSciences, Inc. | | | (1,356,415 | ) |
| | | |
| | (194,773 | ) | | | | Quidel Corp. | | | (11,082,584 | ) |
| | | |
| | (43,137 | ) | | | | Retrophin, Inc. | | | (517,644 | ) |
| | | |
| | (230,000 | ) | | | | Sarepta Therapeutics, Inc. | | | (19,103,800 | ) |
| | | |
| | (81,000 | ) | | | | Supernus Pharmaceuticals, Inc. | | | (2,250,990 | ) |
| | | |
| | (23,000 | ) | | | | Tabula Rasa HealthCare, Inc. | | | (1,171,620 | ) |
| | | |
| | (285,200 | ) | | | | Teladoc Health, Inc. | | | (21,846,320 | ) |
| | | |
| | (89,600 | ) | | JPY | | Toho Holdings Company, Ltd. | | | (2,289,160 | ) |
| | | | | | | | | | |
NUMBER OF SHARES | | | | | | | VALUE | |
| | | |
| | (530,217 | ) | | | | Wright Medical Group, NV | | $ | (11,028,514 | ) |
| | | | | | | | | | |
| | | | | | | | | (261,850,477 | ) |
| | | | | | | | | | |
| | | | | | Industrials(-1.2%) | |
| | (175,159 | ) | | | | Aerojet Rocketdyne Holdings, Inc. | | | (7,572,124 | ) |
| | | |
| | (57,600 | ) | | JPY | | ANA Holdings, Inc. | | | (1,985,250 | ) |
| | | |
| | (905,000 | ) | | | | Colfax Corp. | | | (30,408,000 | ) |
| | | |
| | (148,500 | ) | | | | Fortive Corp. | | | (10,246,500 | ) |
| | | |
| | (88,850 | ) | | | | FTI Consulting, Inc. | | | (9,673,100 | ) |
| | | |
| | (385,000 | ) | | JPY | | Fuji Corp/Aichi | | | (6,477,868 | ) |
| | | |
| | (27,100 | ) | | JPY | | Maeda Kosen Company, Ltd. | | | (456,727 | ) |
| | | |
| | (711,600 | ) | | JPY | | Nagoya Railroad Company, Ltd. | | | (22,733,772 | ) |
| | | |
| | (595,530 | ) | | | | Rexnord Corp. | | | (16,847,544 | ) |
| | | | | | | | | | |
| | | | | | | | | (106,400,885 | ) |
| | | | | | | | | | |
| | | | | | Information Technology(-15.6%) | |
| | (66,000 | ) | | | | 8x8, Inc. | | | (1,275,120 | ) |
| | | |
| | (4,740,600 | ) | | | | Advanced Micro Devices, Inc. | | | (160,848,558 | ) |
| | | |
| | (119,700 | ) | | | | Akamai Technologies, Inc. | | | (10,354,050 | ) |
| | | |
| | (136,000 | ) | | | | Altair Engineering, Inc. - Class A | | | (5,014,320 | ) |
| | | |
| | (330,800 | ) | | | | Alteryx, Inc. - Class A | | | (30,268,200 | ) |
| | | |
| | (402,750 | ) | | | | Atlassian Corp., PLC - Class A | | | (48,648,172 | ) |
| | | |
| | (40,000 | ) | | | | Avaya Holdings Corp. | | | (483,600 | ) |
| | | |
| | (77,200 | ) | | | | Benefitfocus, Inc. | | | (1,755,142 | ) |
| | | |
| | (98,500 | ) | | | | Blackline, Inc. | | | (4,603,890 | ) |
| | | |
| | (158,400 | ) | | | | Broadcom, Inc. | | | (46,387,440 | ) |
| | | |
| | (48,999 | ) | | | | Cardtronics, PLC - Class A | | | (1,678,706 | ) |
| | | |
| | (52,800 | ) | | | | Coupa Software, Inc. | | | (7,259,472 | ) |
| | | |
| | (95,000 | ) | | | | CSG Systems International, Inc. | | | (5,475,800 | ) |
| | | |
| | (1,309,000 | ) | | | | Cypress Semiconductor Corp. | | | (30,460,430 | ) |
| | | |
| | (104,000 | ) | | JPY | | Digital Garage, Inc. | | | (3,447,727 | ) |
| | | |
| | (54,653 | ) | | | | Envestnet, Inc. | | | (3,415,266 | ) |
| | | |
| | (188,000 | ) | | | | FireEye, Inc. | | | (2,977,920 | ) |
| | | |
| | (332,700 | ) | | | | Five9, Inc. | | | (18,468,177 | ) |
| | | |
| | (73,000 | ) | | | | GDS Holdings, Ltd. | | | (3,042,640 | ) |
| | | |
| | (32,000 | ) | | | | Guidewire Software, Inc. | | | (3,607,680 | ) |
| | | |
| | (285,600 | ) | | | | HubSpot, Inc. | | | (44,296,560 | ) |
| | | |
| | (64,500 | ) | | | | II-VI, Inc. | | | (2,138,175 | ) |
| | | |
| | (738,000 | ) | | | | Infinera Corp. | | | (4,125,420 | ) |
| | | |
| | (182,000 | ) | | | | Inphi Corp. | | | (13,082,160 | ) |
| | | |
| | (96,100 | ) | | | | Insight Enterprises, Inc. | | | (5,898,618 | ) |
| | | |
| | (736,350 | ) | | | | Intel Corp. | | | (41,625,865 | ) |
| | | |
| | (33,800 | ) | | | | InterDigital, Inc. | | | (1,812,694 | ) |
| | | |
| | (319,200 | ) | | | | j2 Global, Inc. | | | (30,311,232 | ) |
| | | |
| | (160,400 | ) | | | | LivePerson, Inc. | | | (6,584,420 | ) |
| | | |
| | (718,000 | ) | | | | Microchip Technology, Inc. | | | (67,700,220 | ) |
| | | |
| | (2,396,615 | ) | | | | Micron Technology, Inc. | | | (113,959,043 | ) |
| | | |
| | (203,350 | ) | | | | MongoDB, Inc. | | | (25,982,029 | ) |
| | | |
| | (84,000 | ) | | | | New Relic, Inc. | | | (5,381,040 | ) |
| | | | | | |
| See accompanying Notes to Schedule of Investments | | www.calamos.com | | | 85 | |
Market Neutral Income Fund Schedule of Investments October 31, 2019
| | | | | | | | | | |
NUMBER OF SHARES | | | | | | | VALUE | |
| | | |
| | (174,900 | ) | | | | Nice, Ltd. | | $ | (27,597,471 | ) |
| | | |
| | (255,699 | ) | | | | Nuance Communications, Inc. | | | (4,173,008 | ) |
| | | |
| | (86,400 | ) | | | | Nutanix, Inc. - Class A | | | (2,524,608 | ) |
| | | |
| | (189,096 | ) | | | | NXP Semiconductors, NV | | | (21,496,433 | ) |
| | | |
| | (510,750 | ) | | | | Okta, Inc. | | | (55,707,503 | ) |
| | | |
| | (888,000 | ) | | | | ON Semiconductor Corp. | | | (18,115,200 | ) |
| | | |
| | (55,100 | ) | | | | OSI Systems, Inc. | | | (5,468,124 | ) |
| | | |
| | (71,741 | ) | | | | Palo Alto Networks, Inc. | | | (16,313,186 | ) |
| | | |
| | (113,175 | ) | | | | Pluralsight, Inc. - Class A | | | (2,046,204 | ) |
| | | |
| | (27,792 | ) | | | | Proofpoint, Inc. | | | (3,206,363 | ) |
| | | |
| | (49,200 | ) | | | | PROS Holdings, Inc. | | | (2,521,008 | ) |
| | | |
| | (219,973 | ) | | | | Pure Storage, Inc. - Class A | | | (4,280,675 | ) |
| | | |
| | (257,800 | ) | | | | Q2 Holdings, Inc. | | | (18,430,122 | ) |
| | | |
| | (428,729 | ) | | | | RealPage, Inc. | | | (25,959,541 | ) |
| | | |
| | (257,900 | ) | | | | RingCentral, Inc. - Class A | | | (41,656,008 | ) |
| | | |
| | (63,426 | ) | | | | SailPoint Technologies Holding, Inc. | | | (1,227,927 | ) |
| | | |
| | (349,450 | ) | | | | ServiceNow, Inc. | | | (86,405,007 | ) |
| | | |
| | (118,600 | ) | | | | Silicon Laboratories, Inc. | | | (12,600,064 | ) |
| | | |
| | (247,000 | ) | | | | Splunk, Inc. | | | (29,630,120 | ) |
| | | |
| | (1,213,500 | ) | | | | Square, Inc. - Class A | | | (74,545,305 | ) |
| | | |
| | (65,288 | ) | | | | Synaptics, Inc. | | | (2,749,278 | ) |
| | | |
| | (430,475 | ) | | | | Teradyne, Inc. | | | (26,353,679 | ) |
| | | |
| | (1,278,617 | ) | | | | TTM Technologies, Inc. | | | (14,972,605 | ) |
| | | |
| | (371,000 | ) | | | | Twilio, Inc. - Class A | | | (35,823,760 | ) |
| | | |
| | (362,400 | ) | | | | Viavi Solutions, Inc. | | | (5,783,904 | ) |
| | | |
| | (131,000 | ) | | | | Vishay Intertechnology, Inc. | | | (2,639,650 | ) |
| | | |
| | (333,997 | ) | | | | Workday, Inc. - Class A | | | (54,160,954 | ) |
| | | |
| | (74,800 | ) | | | | Workiva, Inc. | | | (3,116,916 | ) |
| | | |
| | (127,000 | ) | | | | Zendesk, Inc. | | | (8,972,550 | ) |
| | | | | | | | | | |
| | | | | | | | | (1,360,846,959 | ) |
| | | | | | | | | | |
| | | | | | Materials(-0.6%) | |
| | (1,240,800 | ) | | | | Allegheny Technologies, Inc. | | | (26,069,208 | ) |
| | | |
| | (71,000 | ) | | | | International Flavors & Fragrances, Inc. | | | (8,662,710 | ) |
| | | |
| | (80,200 | ) | | JPY | | Mitsubishi Chemical Holdings Corp. | | | (616,855 | ) |
| | | |
| | (85,500 | ) | | | | Pretium Resources, Inc. | | | (865,260 | ) |
| | | |
| | (180,000 | ) | | | | SSR Mining, Inc. | | | (2,662,200 | ) |
| | | |
| | (394,000 | ) | | JPY | | Teijin, Ltd. | | | (7,960,996 | ) |
| | | |
| | (75,000 | ) | | | | TimkenSteel Corp. | | | (421,500 | ) |
| | | |
| | (270,000 | ) | | | | United States Steel Corp. | | | (3,107,700 | ) |
| | | | | | | | | | |
| | | | | | | | | (50,366,429 | ) |
| | | | | | | | | | |
| | | | | | Real Estate(-1.2%) | |
| | (186,473 | ) | | | | Crown Castle International Corp. | | | (25,880,588 | ) |
| | | |
| | (65,560 | ) | | EUR | | Deutsche Wohnen, SE | | | (2,465,574 | ) |
| | | |
| | (383,200 | ) | | | | Extra Space Storage, Inc. | | | (43,021,864 | ) |
| | | |
| | (270,300 | ) | | EUR | | IMMOFINANZ, AG | | | (7,762,737 | ) |
| | | | | | | | | | |
NUMBER OF SHARES | | | | | | | VALUE | |
| | | |
| | (678,537 | ) | | | | Invitation Homes, Inc. | | $ | (20,892,154 | ) |
| | | |
| | (187,100 | ) | | | | iStar, Inc. | | | (2,434,171 | ) |
| | | | | | | | | | |
| | | | | | | | | (102,457,088 | ) |
| | | | | | | | | | |
| | | | | | Utilities(-1.4%) | |
| | (44,000 | ) | | | | American Electric Power Company, Inc. | | | (4,153,160 | ) |
| | | |
| | (330,733 | ) | | | | Aqua America, Inc. | | | (14,992,127 | ) |
| | | |
| | (575,000 | ) | | | | CenterPoint Energy, Inc. | | | (16,715,250 | ) |
| | | |
| | (1,044,100 | ) | | JPY | | Chugoku Electric Power Company, Inc. | | | (13,932,291 | ) |
| | | |
| | (84,100 | ) | | | | DTE Energy Company | | | (10,707,612 | ) |
| | | |
| | (117,600 | ) | | JPY | | Kyushu Electric Power Company, Inc. | | | (1,178,287 | ) |
| | | |
| | (30,300 | ) | | | | NextEra Energy, Inc. | | | (7,221,702 | ) |
| | | |
| | (248,000 | ) | | | | Sempra Energy | | | (35,838,480 | ) |
| | | |
| | (114,706 | ) | | | | South Jersey Industries, Inc. | | | (3,688,945 | ) |
| | | |
| | (262,500 | ) | | | | Southern Company | | | (16,448,250 | ) |
| | | | | | | | | | |
| | | | | | | | | (124,876,104 | ) |
| | | | | | | | | | |
| | | |
| | | | | | TOTAL COMMON STOCKS SOLD SHORT (Proceeds $2,221,893,032) | | | (2,747,003,702 | ) |
| | | | | | | | | | |
| | | | | | | | | | |
NUMBER OF CONTRACTS/ NOTIONAL AMOUNT | | | | | | | VALUE | |
|
| | WRITTEN OPTIONS(-6.6%)# | |
| | | | | | Communication Services (0.0%) | |
| 800
4,482,400 |
| | | | Activision Blizzard, Inc. Put, 11/15/19, Strike $37.50 | | | (9,200 | ) |
| | | |
| | | | | | Electronic Arts, Inc. | | | | |
| 2,640
25,449,600 |
| | | | Call, 12/20/19, Strike $110.00 | | | (77,880 | ) |
| 1,200
11,568,000 |
| | | | Put, 12/20/19, Strike $80.00 | | | (33,000 | ) |
| | | |
| | | | | | Facebook, Inc. | | | | |
| 750
14,373,750 |
| | | | Call, 12/20/19, Strike $235.00 | | | (9,000 | ) |
| 750
14,373,750 |
| | | | Put, 12/20/19, Strike $155.00 | | | (65,625 | ) |
| | | |
| 2,000
1,230,000 |
| | | | Gogo, Inc. Put, 01/15/21, Strike $5.00 | | | (260,000 | ) |
| | | | | | | | | | |
| | | | | | | | | (454,705 | ) |
| | | | | | | | | | |
| | | | | | Consumer Discretionary (0.0%) | |
| | | | | | Amazon.com, Inc. | | | | |
| 250
44,416,500 |
| | | | Call, 11/15/19, Strike $2,200.00 | | | (1,250 | ) |
| 100
17,766,600 |
| | | | Put, 11/15/19, Strike $1,600.00 | | | (6,400 | ) |
| | | |
| | | | | | Ulta Beauty, Inc. | | | | |
| 250
5,828,750 |
| | | | Call, 01/17/20, Strike $275.00 | | | (97,500 | ) |
| | | | |
| 86 | | CALAMOS OPEN-END FAMILY OF FUNDS ANNUAL REPORT | | See accompanying Notes to Schedule of Investments |
Market Neutral Income Fund Schedule of Investments October 31, 2019
| | | | | | | | | | |
NUMBER OF CONTRACTS/ NOTIONAL AMOUNT | | | | | | | VALUE | |
| | | | | | Ulta Beauty, Inc. (cont.) | | | | |
| 250
5,828,750 |
| | | | Put, 01/17/20, Strike $200.00 | | $ | (111,250 | ) |
| | | |
| 1,000
12,134,000 |
| | | | Wynn Resorts, Ltd. Call, 01/17/20, Strike $130.00 | | | (480,000 | ) |
| | | | | | | | | | |
| | | | | | | | | (696,400 | ) |
| | | | | | | | | | |
| | | | | | Consumer Staples (0.0%) | |
| | | | | | Constellation Brands, Inc. | | | | |
| 1,500
28,549,500 |
| | | | Call, 01/17/20, Strike $205.00 | | | (420,000 | ) |
| 600
11,419,800 |
| | | | Put, 01/17/20, Strike $170.00 | | | (141,000 | ) |
| | | |
| | | | | | Kraft Heinz Company | | | | |
| 2,000
6,466,000 |
| | | | Call, 12/20/19, Strike $35.00 | | | (35,000 | ) |
| 2,000
6,466,000 |
| | | | Put, 12/20/19, Strike $25.00 | | | (15,000 | ) |
| | | | | | | | | | |
| | | | | | | | | (611,000 | ) |
| | | | | | | | | | |
| | | | | | Health Care (0.0%) | |
| 1,400
3,106,600 |
| | | | Aerie Pharmaceuticals, Inc. Call, 02/21/20, Strike $20.00 | | | (742,000 | ) |
| | | |
| 1,000
970,500 |
| | | | AMAG Pharmaceuticals, Inc. Call, 01/15/21, Strike $15.00 | | | (177,500 | ) |
| | | |
| | | | | | Illumina, Inc. | | | | |
| 750
22,164,000 |
| | | | Call, 12/20/19, Strike $340.00 | | | (114,375 | ) |
| 250
7,388,000 |
| | | | Put, 12/20/19, Strike $250.00 | | | (47,500 | ) |
| | | |
| 3,000
4,800,000 |
| | | | Immunomedics, Inc. Call, 01/17/20, Strike $10.00 | | | (1,995,000 | ) |
| | | |
| 500
386,000 |
| | | | Invacare Corp. Call, 11/15/19, Strike $7.50 | | | (56,250 | ) |
| | | |
| 1,350
2,174,850 |
| | | | Invitae Corp. Call, 06/18/21, Strike $30.00 | | | (472,500 | ) |
| | | |
| 50
111,550 |
| | | | Tilray, Inc. Call, 01/17/20, Strike $175.00 | | | (225 | ) |
| | | | | | | | | | |
| | | | | | | | | (3,605,350 | ) |
| | | | | | | | | | |
| | | | | | Information Technology(-0.1%) | |
| 2,500
8,482,500 |
| | | | Advanced Micro Devices, Inc. Put, 03/19/21, Strike $15.00 | | | (220,000 | ) |
| | | |
| 2,000
49,752,000 |
| | | | Apple, Inc. Call, 11/15/19, Strike $230.00 | | | (3,700,000 | ) |
| | | |
| 3,200
15,216,000 |
| | | | Micron Technology, Inc. Call, 01/17/20, Strike $46.00 | | | (1,424,000 | ) |
| | | |
| 500
6,388,500 |
| | | | MongoDB, Inc. Put, 01/15/21, Strike $65.00 | | | (275,000 | ) |
| | | | | | | | | | |
| | | | | | | | | (5,619,000 | ) |
| | | | | | | | | | |
| | | | | | Other(-6.5%) | |
| | | | | | S&P 500 Index | | | | |
| 7,000
2,126,292,000 |
| | | | Call, 12/31/19, Strike $2,500.00 | | | (376,460,000 | ) |
| | | | | | | | | | |
NUMBER OF CONTRACTS/ NOTIONAL AMOUNT | | | | | | | VALUE | |
| | | | | | S&P 500 Index (cont.) | | | | |
| 4,500
1,366,902,000 |
| | | | Call, 12/31/19, Strike $2,700.00 | | $ | (155,070,000 | ) |
| 3,500
1,063,146,000 |
| | | | Call, 12/31/19, Strike $3,000.00 | | | (29,295,000 | ) |
| 2,000
607,512,000 |
| | | | Put, 11/29/19, Strike $2,850.00 | | | (1,370,000 | ) |
| | | | | | | | | | |
| | | | | | | | | (562,195,000 | ) |
| | | | | | | | | | |
| | | |
| | | | | | TOTAL WRITTEN OPTIONS (Premium $330,554,145) | | $ | (573,181,455 | ) |
| | | | | | | | | | |
FORWARD FOREIGN CURRENCY CONTRACTS
| | | | | | | | | | | | | | | | |
COUNTER
PARTY
| | SHORT CONTRACTS | | SETTLEMENT DATE | | LOCAL CURRENCY | | | CURRENT VALUE | | | UNREALIZED GAIN/LOSS | |
| | | | | |
| State Street Bank and Trust | | Japanese Yen | | 01/22/20 | | | 181,951,000 | | | $ | 1,693,926 | | | $ | (8,860 | ) |
| | | | | |
| State Street Bank and Trust | | British Pound Sterling | | 01/22/20 | | | 14,229,000 | | | | 18,480,336 | | | | (80,802 | ) |
| | | | | |
| Northern Trust Company | | Japanese Yen | | 01/22/20 | | | 3,257,621,000 | | | | 30,327,766 | | | | (113,917 | ) |
| | | | | |
| Goldman Sachs & Co. | | European Monetary Unit | | 01/22/20 | | | 61,268,000 | | | | 68,712,537 | | | | (4,145 | ) |
| | | | | | | | | | | | | | | | |
| | | $ | (207,724 | ) |
| | | | | | | | | | | | | | | | |
NOTES TO SCHEDULE OF INVESTMENTS
| * | Securities issued and sold pursuant to a Rule 144A transaction are excepted from the registration requirement of the Securities Act of 1933, as amended. These securities may only be sold to qualified institutional buyers (“QIBs”), such as the Fund. Any resale of these securities must generally be effected through a sale that is registered under the Act or otherwise exempted from such registration requirements. |
| ~ | Security, or portion of security, is segregated as collateral (or collateral for potential future transactions) for written options, swaps, or securities sold short. The aggregate value of such securities is $1,936,059,295. |
| ^ | Security, or portion of security, is on loan. |
| § | Securities exchangeable or convertible into securities of one or more entities that are different than the issuer. Each entity is identified in the parenthetical. |
| ¤ | The synthetic convertible securities strategy combines separate securities that together possess the economic characteristics similar to a convertible security. |
| # | Non-income producing security. |
| *** | The rate disclosed is the 7 day net yield as of October 31, 2019. |
| † | Represents investment of cash collateral received from securities on loan as of October 31, 2019. |
FOREIGN CURRENCY ABBREVIATION
| | |
| |
| EUR | | European Monetary Unit |
| |
| GBP | | British Pound Sterling |
| |
| JPY | | Japanese Yen |
| | | | | | |
| See accompanying Notes to Financial Statements | | www.calamos.com | | | 87 | |
Market Neutral Income Fund Schedule of Investments October 31, 2019
TOTAL RETURN SWAPS
| | | | | | | | | | | | | | | | | | | | | | | | | | | | | | |
COUNTER
PARTY | | UNDERLYING REFERENCE INSTRUMENT | | FIXED RATE (FUND PAYS) | | FLOATING RATE (FUND RECEIVES) | | TERMINATION DATE | | | PERIODIC PAYMENT FREQUENCY | | | NOTIONAL AMOUNT | | | UPFRONT PAYMENTS (PAID)/ RECEIVED | | | MARKET
VALUE | | | UNREALIZED APPRECIATION/ (DEPRECIATION) | |
| | | | | | | | | |
| Goldman Sachs & Co. | | NIO, Inc. | | Equity returns on 1,232,800 shares of NIO, Inc. | | OBFR less 1.500% | | | 01/31/22 | | | | Monthly | | | $ | 1,787,560 | | | $ | — | | | $ | 2,949 | | | $ | 2,949 | |
| | | | | | | | | |
| Morgan Stanley & Co. | | SailPoint Technologies Holdings, Inc. | | Equity returns on 74,003 shares of SailPoint Technologies Holdings, Inc. | | FED Funds Effective Flat | | | 11/12/19 | | | | Monthly | | | | 1,533,314 | | | | (1,868 | ) | | | 98,411 | | | | 100,279 | |
| | | | | | | | | |
| Goldman Sachs & Co. | | Winnebago Industries, Inc. | | Equity returns on 47,000 shares of Winnebago Industries, Inc. | | OBFR Flat | | | 12/02/19 | | | | Monthly | | | | 2,260,700 | | | | — | | | | 1,410 | | | | 1,410 | |
| | | | | | | | | | | | | | | | | | | | | | | | | | | | | | |
| | | $ | (1,868 | ) | | $ | 102,770 | | | $ | 104,638 | |
| | | | | | | | | | | | | | | | | | | | | | | | | | | | | | |
ABBREVIATION
| | |
| |
| OBFR | | Overnight Bank Funding Rate |
Note: Value for securities denominated in foreign currencies is shown in U.S. dollars. The principal amount for such securities is shown in the respective foreign currency. The date on options represents the expiration date of the option contract. The option contract may be exercised at any date on or before the date shown.
| | | | |
| 88 | | CALAMOS OPEN-END FAMILY OF FUNDS ANNUAL REPORT | | See accompanying Notes to Financial Statements |
Hedged Equity Fund Schedule of Investments October 31, 2019
| | | | | | | | | | |
NUMBER OF SHARES | | | | | | | VALUE | |
|
| | COMMON STOCKS (101.6%) | |
| | | | | | Communication Services (10.7%) | |
| | 6,409 | | | | | Activision Blizzard, Inc. | | $ | 359,096 | |
| | | |
| | 2,777 | | | | | Alphabet, Inc. - Class A#~ | | | 3,495,688 | |
| | | |
| | 2,822 | | | | | Alphabet, Inc. - Class C#~ | | | 3,556,030 | |
| | | |
| | 68,808 | | | | | AT&T, Inc.~ | | | 2,648,420 | |
| | | |
| | 1,841 | | | | | Charter Communications, Inc. - Class A#~ | | | 861,330 | |
| | | |
| | 45,741 | | | | | Comcast Corp. - Class A~ | | | 2,050,112 | |
| | | |
| | 27,686 | | | | | Facebook, Inc. - Class A#~ | | | 5,306,022 | |
| | | |
| | 8,054 | | | | | Fox Corp. - Class A | | | 258,050 | |
| | | |
| | 5,604 | | | | | Netflix, Inc.#~ | | | 1,610,646 | |
| | | |
| | 7,712 | | | | | Twitter, Inc.# | | | 231,129 | |
| | | |
| | 41,579 | | | | | Verizon Communications, Inc.~ | | | 2,514,282 | |
| | | |
| | 18,247 | | | | | Walt Disney Company~ | | | 2,370,650 | |
| | | | | | | | | | |
| | | | | | | | | 25,261,455 | |
| | | | | | | | | | |
| | | | | | Consumer Discretionary (10.5%) | |
| | 4,128 | | | | | Amazon.com, Inc.#~ | | | 7,334,053 | |
| | | |
| | 6,347 | | | | | Aptiv, PLC | | | 568,374 | |
| | | |
| | 361 | | | | | Booking Holdings, Inc.#~ | | | 739,606 | |
| | | |
| | 5,623 | | | | | Carnival Corp. | | | 241,170 | |
| | | |
| | 8,660 | | | | | D.R. Horton, Inc. | | | 453,524 | |
| | | |
| | 2,786 | | | | | Darden Restaurants, Inc. | | | 312,784 | |
| | | |
| | 2,519 | | | | | Dollar General Corp. | | | 403,896 | |
| | | |
| | 9,724 | | | | | eBay, Inc. | | | 342,771 | |
| | | |
| | 3,863 | | | | | Expedia Group, Inc. | | | 527,918 | |
| | | |
| | 37,822 | | | | | Ford Motor Company | | | 324,891 | |
| | | |
| | 10,068 | | | | | General Motors Company | | | 374,127 | |
| | | |
| | 11,602 | | | | | Home Depot, Inc.~ | | | 2,721,597 | |
| | | |
| | 5,874 | | | | | Leggett & Platt, Inc.^ | | | 301,336 | |
| | | |
| | 9,816 | | | | | Lowe’s Companies, Inc.~ | | | 1,095,564 | |
| | | |
| | 9,443 | | | | | McDonald’s Corp.~ | | | 1,857,438 | |
| | | |
| | 16,473 | | | | | MGM Resorts International | | | 469,481 | |
| | | |
| | 2,371 | | | | | Mohawk Industries, Inc.# | | | 339,954 | |
| | | |
| | 12,549 | | | | | Nike, Inc. - Class B~ | | | 1,123,763 | |
| | | |
| | 1,141 | | | | | O’Reilly Automotive, Inc.# | | | 496,917 | |
| | | |
| | 2,313 | | | | | PVH Corp. | | | 201,601 | |
| | | |
| | 4,802 | | | | | Ross Stores, Inc. | | | 526,635 | |
| | | |
| | 5,145 | | | | | Royal Caribbean Cruises, Ltd. | | | 559,930 | |
| | | |
| | 11,643 | | | | | Starbucks Corp.~ | | | 984,532 | |
| | | |
| | 7,409 | | | | | Target Corp.~ | | | 792,096 | |
| | | |
| | 15,006 | | | | | TJX Companies, Inc.~ | | | 865,096 | |
| | | |
| | 884 | | | | | Ulta Salon Cosmetics & Fragrance, Inc.# | | | 206,105 | |
| | | |
| | 5,203 | | | | | VF Corp. | | | 428,155 | |
| | | |
| | 2,800 | | | | | Wynn Resorts, Ltd. | | | 339,752 | |
| | | | | | | | | | |
| | | | | | | | | 24,933,066 | |
| | | | | | | | | | |
| | | | | | | | | | |
NUMBER OF SHARES | | | | | | | VALUE | |
| | | | | | | | | | |
| | | | | | Consumer Staples (7.4%) | |
| | 18,503 | | | | | Altria Group, Inc.~ | | $ | 828,749 | |
| | | |
| | 8,156 | | | | | Archer-Daniels-Midland Company | | | 342,878 | |
| | | |
| | 5,233 | | | | | Church & Dwight Company, Inc. | | | 365,996 | |
| | | |
| | 39,840 | | | | | Coca-Cola Company~ | | | 2,168,491 | |
| | | |
| | 7,882 | | | | | Colgate-Palmolive Company | | | 540,705 | |
| | | |
| | 2,526 | | | | | Constellation Brands, Inc. - Class A | | | 480,774 | |
| | | |
| | 3,217 | | | | | Costco Wholesale Corp.~ | | | 955,803 | |
| | | |
| | 8,606 | | | | | General Mills, Inc. | | | 437,701 | |
| | | |
| | 6,530 | | | | | Kellogg Company | | | 414,851 | |
| | | |
| | 4,865 | | | | | Kimberly-Clark Corp. | | | 646,461 | |
| | | |
| | 11,241 | | | | | Kraft Heinz Company | | | 363,422 | |
| | | |
| | 11,322 | | | | | Kroger Company | | | 278,974 | |
| | | |
| | 18,795 | | | | | Mondelez International, Inc. - Class A~ | | | 985,798 | |
| | | |
| | 4,914 | | | | | Monster Beverage Corp.# | | | 275,823 | |
| | | |
| | 13,177 | | | | | PepsiCo, Inc.~ | | | 1,807,489 | |
| | | |
| | 10,558 | | | | | Philip Morris International, Inc.~ | | | 859,844 | |
| | | |
| | 23,549 | | | | | Procter & Gamble Company~ | | | 2,932,086 | |
| | | |
| | 6,736 | | | | | Sysco Corp. | | | 538,004 | |
| | | |
| | 7,986 | | | | | Walgreens Boots Alliance, Inc.~ | | | 437,473 | |
| | | |
| | 16,006 | | | | | Walmart, Inc.~ | | | 1,876,864 | |
| | | | | | | | | | |
| | | | | | | | | 17,538,186 | |
| | | | | | | | | | |
| | | | | | Energy (4.4%) | |
| | 22,152 | | | | | Chevron Corp.~ | | | 2,572,733 | |
| | | |
| | 18,306 | | | | | ConocoPhillips~ | | | 1,010,491 | |
| | | |
| | 4,008 | | | | | EOG Resources, Inc. | | | 277,794 | |
| | | |
| | 24,389 | | | | | Exxon Mobil Corp.~ | | | 1,647,965 | |
| | | |
| | 9,228 | | | | | Hess Corp. | | | 606,741 | |
| | | |
| | 26,969 | | | | | Kinder Morgan, Inc. | | | 538,841 | |
| | | |
| | 14,911 | | | | | Marathon Petroleum Corp.~ | | | 953,558 | |
| | | |
| | 8,007 | | | | | Occidental Petroleum Corp. | | | 324,284 | |
| | | |
| | 5,405 | | | | | ONEOK, Inc. | | | 377,431 | |
| | | |
| | 3,789 | | | | | Phillips 66 | | | 442,631 | |
| | | |
| | 4,862 | | | | | Pioneer Natural Resources Company | | | 598,123 | |
| | | |
| | 11,408 | | | | | Schlumberger, Ltd. | | | 372,928 | |
| | | |
| | 3,768 | | | | | Valero Energy Corp.~ | | | 365,421 | |
| | | |
| | 13,611 | | | | | Williams Companies, Inc. | | | 303,661 | |
| | | | | | | | | | |
| | | | | | | | | 10,392,602 | |
| | | | | | | | | | |
| | | | | | Financials (13.5%) | |
| | 5,592 | | | | | Aflac, Inc. | | | 297,271 | |
| | | |
| | 4,293 | | | | | Allstate Corp. | | | 456,861 | |
| | | |
| | 6,185 | | | | | American Express Company~ | | | 725,377 | |
| | | |
| | 19,114 | | | | | American International Group, Inc.~ | | | 1,012,278 | |
| | | |
| | 2,630 | | | | | Ameriprise Financial, Inc. | | | 396,841 | |
| | | |
| | 4,788 | | | | | Arthur J. Gallagher & Company | | | 436,761 | |
| | | |
| | 3,949 | | | | | Assurant, Inc.~ | | | 497,850 | |
| | | |
| | 106,186 | | | | | Bank of America Corp.~ | | | 3,320,436 | |
| | | | | | |
| See accompanying Notes to Schedule of Investments | | www.calamos.com | | | 89 | |
Hedged Equity Fund Schedule of Investments October 31, 2019
| | | | | | | | | | |
NUMBER OF SHARES | | | | | | | VALUE | |
| | | |
| | 9,743 | | | | | Bank of New York Mellon Corp. | | $ | 455,485 | |
| | | |
| | 17,697 | | | | | Berkshire Hathaway, Inc. - Class B#~ | | | 3,762,028 | |
| | | |
| | 1,011 | | | | | BlackRock, Inc. | | | 466,779 | |
| | | |
| | 13,569 | | | | | Capital One Financial Corp.~ | | | 1,265,309 | |
| | | |
| | 6,719 | | | | | Cboe Global Markets, Inc.~ | | | 773,693 | |
| | | |
| | 7,555 | | | | | Charles Schwab Corp. | | | 307,564 | |
| | | |
| | 4,358 | | | | | Chubb, Ltd. | | | 664,246 | |
| | | |
| | 23,158 | | | | | Citigroup, Inc.~ | | | 1,664,134 | |
| | | |
| | 2,105 | | | | | CME Group, Inc. | | | 433,104 | |
| | | |
| | 4,293 | | | | | Discover Financial Services | | | 344,556 | |
| | | |
| | 4,973 | | | | | First Republic Bank | | | 528,928 | |
| | | |
| | 5,672 | | | | | Goldman Sachs Group, Inc.~ | | | 1,210,291 | |
| | | |
| | 34,905 | | | | | JPMorgan Chase & Company~ | | | 4,360,333 | |
| | | |
| | 2,614 | | | | | M&T Bank Corp. | | | 409,169 | |
| | | |
| | 7,427 | | | | | Marsh & McLennan Companies, Inc.~ | | | 769,586 | |
| | | |
| | 8,098 | | | | | MetLife, Inc. | | | 378,905 | |
| | | |
| | 19,030 | | | | | Morgan Stanley~ | | | 876,332 | |
| | | |
| | 4,187 | | | | | Northern Trust Corp. | | | 417,360 | |
| | | |
| | 3,135 | | | | | Prudential Financial, Inc. | | | 285,724 | |
| | | |
| | 2,720 | | | | | S&P Global, Inc.~ | | | 701,733 | |
| | | |
| | 3,690 | | | | | State Street Corp. | | | 243,798 | |
| | | |
| | 5,126 | | | | | SunTrust Banks, Inc. | | | 350,311 | |
| | | |
| | 3,494 | | | | | Travelers Companies, Inc. | | | 457,924 | |
| | | |
| | 21,692 | | | | | US Bancorp~ | | | 1,236,878 | |
| | | |
| | 34,640 | | | | | Wells Fargo & Company~ | | | 1,788,463 | |
| | | |
| | 12,549 | | | | | Zions Bancorporation, N.A. ^ | | | 608,250 | |
| | | | | | | | | | |
| | | | | | | | | 31,904,558 | |
| | | | | | | | | | |
| | | | | | Health Care (14.2%) | |
| | 13,877 | | | | | Abbott Laboratories~ | | | 1,160,256 | |
| | | |
| | 14,432 | | | | | AbbVie, Inc.~ | | | 1,148,066 | |
| | | |
| | 11,557 | | | | | Agilent Technologies, Inc.~ | | | 875,443 | |
| | | |
| | 6,170 | | | | | Alexion Pharmaceuticals, Inc.# | | | 650,318 | |
| | | |
| | 3,238 | | | | | Allergan, PLC | | | 570,244 | |
| | | |
| | 3,901 | | | | | Amgen, Inc.~ | | | 831,888 | |
| | | |
| | 12,275 | | | | | Baxter International, Inc.~ | | | 941,492 | |
| | | |
| | 3,260 | | | | | Becton Dickinson and Company~ | | | 834,560 | |
| | | |
| | 2,030 | | | | | Biogen, Inc.#~ | | | 606,381 | |
| | | |
| | 12,805 | | | | | Boston Scientific Corp.# | | | 533,969 | |
| | | |
| | 13,807 | | | | | Bristol-Myers Squibb Company~ | | | 792,108 | |
| | | |
| | 11,176 | | | | | Celgene Corp.#~ | | | 1,207,343 | |
| | | |
| | 2,693 | | | | | Cigna Corp.# | | | 480,593 | |
| | | |
| | 11,909 | | | | | CVS Health Corp.~ | | | 790,639 | |
| | | |
| | 4,995 | | | | | Danaher Corp.~ | | | 688,411 | |
| | | |
| | 1,919 | | | | | Edwards Lifesciences Corp.#~ | | | 457,451 | |
| | | |
| | 7,627 | | | | | Eli Lilly and Company~ | | | 869,097 | |
| | | |
| | 13,709 | | | | | Gilead Sciences, Inc.~ | | | 873,400 | |
| | | |
| | 2,656 | | | | | HCA Healthcare, Inc. | | | 354,682 | |
| | | | | | | | | | |
NUMBER OF SHARES | | | | | | | VALUE | |
| | | |
| | 3,135 | | | | | Humana, Inc.~ | | $ | 922,317 | |
| | | |
| | 1,462 | | | | | Illumina, Inc.# | | | 432,050 | |
| | | |
| | 1,515 | | | | | Intuitive Surgical, Inc.#~ | | | 837,719 | |
| | | |
| | 25,622 | | | | | Johnson & Johnson~ | | | 3,383,129 | |
| | | |
| | 3,462 | | | | | Laboratory Corp. of America Holdings# | | | 570,434 | |
| | | |
| | 2,444 | | | | | McKesson Corp. | | | 325,052 | |
| | | |
| | 13,454 | | | | | Medtronic, PLC | | | 1,465,141 | |
| | | |
| | 25,016 | | | | | Merck & Company, Inc.~ | | | 2,167,887 | |
| | | |
| | 55,717 | | | | | Pfizer, Inc.~ | | | 2,137,861 | |
| | | |
| | 3,034 | | | | | Quest Diagnostics, Inc. | | | 307,193 | |
| | | |
| | 648 | | | | | Regeneron Pharmaceuticals, Inc.# | | | 198,469 | |
| | | |
| | 2,368 | | | | | Stryker Corp. | | | 512,127 | |
| | | |
| | 495 | | | | | Teleflex, Inc. | | | 171,968 | |
| | | |
| | 2,934 | | | | | Thermo Fisher Scientific, Inc.~ | | | 886,009 | |
| | | |
| | 11,217 | | | | | UnitedHealth Group, Inc.~ | | | 2,834,536 | |
| | | |
| | 2,100 | | | | | Vertex Pharmaceuticals, Inc.#~ | | | 410,508 | |
| | | |
| | 1,875 | | | | | WellCare Health Plans, Inc.# | | | 556,125 | |
| | | |
| | 2,357 | | | | | Zimmer Biomet Holdings, Inc. | | | 325,808 | |
| | | |
| | 3,207 | | | | | Zoetis, Inc. | | | 410,239 | |
| | | | | | | | | | |
| | | | | | | | | 33,520,913 | |
| | | | | | | | | | |
| | | | | | Industrials (9.2%) | |
| | 5,390 | | | | | 3M Company~ | | | 889,296 | |
| | | |
| | 2,827 | | | | | Allegion, PLC | | | 328,045 | |
| | | |
| | 5,083 | | | | | Boeing Company~ | | | 1,727,762 | |
| | | |
| | 8,033 | | | | | Caterpillar, Inc.~ | | | 1,106,947 | |
| | | |
| | 13,281 | | | | | CSX Corp.~ | | | 933,256 | |
| | | |
| | 2,707 | | | | | Deere & Company~ | | | 471,397 | |
| | | |
| | 12,034 | | | | | Delta Air Lines, Inc. | | | 662,833 | |
| | | |
| | 3,717 | | | | | Eaton Corp., PLC | | | 323,788 | |
| | | |
| | 10,633 | | | | | Emerson Electric Company~ | | | 745,905 | |
| | | |
| | 2,024 | | | | | FedEx Corp. | | | 308,984 | |
| | | |
| | 5,773 | | | | | Fortune Brands Home & Security, Inc. | | | 346,669 | |
| | | |
| | 2,352 | | | | | General Dynamics Corp. | | | 415,834 | |
| | | |
| | 80,160 | | | | | General Electric Company~ | | | 799,997 | |
| | | |
| | 8,540 | | | | | Honeywell International, Inc.~ | | | 1,475,114 | |
| | | |
| | 3,351 | | | | | Illinois Tool Works, Inc. | | | 564,912 | |
| | | |
| | 8,641 | | | | | Johnson Controls International, PLC | | | 374,414 | |
| | | |
| | 3,175 | | | | | L3Harris Technologies, Inc. | | | 655,034 | |
| | | |
| | 1,886 | | | | | Lockheed Martin Corp.~ | | | 710,418 | |
| | | |
| | 7,904 | | | | | Masco Corp. | | | 365,560 | |
| | | |
| | 2,149 | | | | | Norfolk Southern Corp. | | | 391,118 | |
| | | |
| | 3,105 | | | | | Northrop Grumman Corp.~ | | | 1,094,450 | |
| | | |
| | 5,529 | | | | | PACCAR, Inc. | | | 420,536 | |
| | | |
| | 6,700 | | | | | Pentair, PLC | | | 277,849 | |
| | | |
| | 2,544 | | | | | Raytheon Company | | | 539,862 | |
| | | |
| | 6,990 | | | | | Southwest Airlines Company | | | 392,349 | |
| | | |
| | 3,883 | | | | | Stanley Black & Decker, Inc. | | | 587,614 | |
| | | | |
| 90 | | CALAMOS OPEN-END FAMILY OF FUNDS ANNUAL REPORT | | See accompanying Notes to Schedule of Investments |
Hedged Equity Fund Schedule of Investments October 31, 2019
| | | | | | | | | | |
NUMBER OF SHARES | | | | | | | VALUE | |
| | | |
| | 7,610 | | | | | Union Pacific Corp.~ | | $ | 1,259,151 | |
| | | |
| | 4,583 | | | | | United Airlines Holdings, Inc.# | | | 416,320 | |
| | | |
| | 6,338 | | | | | United Parcel Service, Inc. - Class B~ | | | 729,947 | |
| | | |
| | 7,077 | | | | | United Technologies Corp.~ | | | 1,016,116 | |
| | | |
| | 3,180 | | | | | Verisk Analytics, Inc. | | | 460,146 | |
| | | |
| | 1,383 | | | | | Wabtec Corp.^ | | | 95,939 | |
| | | |
| | 6,088 | | | | | Waste Management, Inc.~ | | | 683,134 | |
| | | |
| | 4,375 | | | | | Xylem, Inc.~ | | | 335,519 | |
| | | | | | | | | | |
| | | | | | | | | 21,906,215 | |
| | | | | | | | | | |
| | | | | | Information Technology (22.7%) | |
| | 5,781 | | | | | Accenture, PLC - Class A | | | 1,071,913 | |
| | | |
| | 4,551 | | | | | Adobe, Inc.#~ | | | 1,264,859 | |
| | | |
| | 23,360 | | | | | Advanced Micro Devices, Inc.#^ | | | 792,605 | |
| | | |
| | 4,133 | | | | | Amphenol Corp. - Class A | | | 414,664 | |
| | | |
| | 41,482 | | | | | Apple, Inc.~ | | | 10,319,062 | |
| | | |
| | 22,657 | | | | | Applied Materials, Inc.~ | | | 1,229,369 | |
| | | |
| | 2,680 | | | | | Autodesk, Inc.# | | | 394,925 | |
| | | |
| | 5,384 | | | | | Automatic Data Processing, Inc.~ | | | 873,446 | |
| | | |
| | 4,249 | | | | | Broadcom, Inc.~ | | | 1,244,320 | |
| | | |
| | 52,224 | | | | | Cisco Systems, Inc.~ | | | 2,481,162 | |
| | | |
| | 3,543 | | | | | Citrix Systems, Inc. | | | 385,691 | |
| | | |
| | 6,453 | | | | | Cognizant Technology Solutions Corp. - Class A | | | 393,246 | |
| | | |
| | 6,383 | | | | | Fiserv, Inc.# | | | 677,492 | |
| | | |
| | 5,332 | | | | | FLIR Systems, Inc. | | | 274,918 | |
| | | |
| | 2,378 | | | | | Gartner, Inc.# | | | 366,402 | |
| | | |
| | 3,534 | | | | | Global Payments, Inc. | | | 597,882 | |
| | | |
| | 13,261 | | | | | HP, Inc. | | | 230,343 | |
| | | |
| | 39,348 | | | | | Intel Corp.~ | | | 2,224,342 | |
| | | |
| | 6,490 | | | | | International Business Machines Corp.~ | | | 867,908 | |
| | | |
| | 2,717 | | | | | Intuit, Inc.~ | | | 699,627 | |
| | | |
| | 2,412 | | | | | Jack Henry & Associates, Inc. | | | 341,443 | |
| | | |
| | 2,698 | | | | | Lam Research Corp.~ | | | 731,266 | |
| | | |
| | 8,521 | | | | | MasterCard, Inc. - Class A~ | | | 2,358,698 | |
| | | |
| | 17,300 | | | | | Micron Technology, Inc.#~ | | | 822,615 | |
| | | |
| | 74,004 | | | | | Microsoft Corp.~ | | | 10,609,953 | |
| | | |
| | 6,888 | | | | | NVIDIA Corp.~ | | | 1,384,626 | |
| | | |
| | 18,573 | | | | | Oracle Corp.~ | | | 1,012,043 | |
| | | |
| | 5,064 | | | | | Paychex, Inc. | | | 423,553 | |
| | | |
| | 9,805 | | | | | PayPal Holdings, Inc.#~ | | | 1,020,700 | |
| | | |
| | 11,363 | | | | | QUALCOMM, Inc.~ | | | 914,040 | |
| | | |
| | 10,442 | | | | | Salesforce.com, Inc.#~ | | | 1,634,069 | |
| | | |
| | 3,451 | | | | | TE Connectivity, Ltd. | | | 308,864 | |
| | | |
| | 6,327 | | | | | Texas Instruments, Inc.~ | | | 746,523 | |
| | | |
| | 19,178 | | | | | Visa, Inc. - Class A~ | | | 3,430,177 | |
| | | |
| | 3,503 | | | | | Western Digital Corp. | | | 180,930 | |
| | | |
| | 16,230 | | | | | Western Union Company | | | 406,724 | |
| | | | | | | | | | |
NUMBER OF SHARES | | | | | | | VALUE | |
| | | |
| | 7,013 | | | | | Xilinx, Inc. | | $ | 636,360 | |
| | | | | | | | | | |
| | | | | | | | | 53,766,760 | |
| | | | | | | | | | |
| | | | | | Materials (2.4%) | |
| | 3,125 | | | | | Air Products & Chemicals, Inc.~ | | | 666,437 | |
| | | |
| | 2,550 | | | | | Avery Dennison Corp. | | | 326,043 | |
| | | |
| | 7,260 | | | | | Ball Corp. | | | 507,982 | |
| | | |
| | 8,897 | | | | | Corteva, Inc.# | | | 234,703 | |
| | | |
| | 8,898 | | | | | Dow, Inc.# | | | 449,260 | |
| | | |
| | 8,896 | | | | | DuPont de Nemours, Inc. | | | 586,335 | |
| | | |
| | 25,086 | | | | | Freeport-McMoRan, Inc. | | | 246,345 | |
| | | |
| | 6,979 | | | | | Linde, PLC | | | 1,384,285 | |
| | | |
| | 8,103 | | | | | Newmont Mining Corp. | | | 321,932 | |
| | | |
| | 3,957 | | | | | PPG Industries, Inc. | | | 495,100 | |
| | | |
| | 808 | | | | | Sherwin-Williams Company | | | 462,435 | |
| | | | | | | | | | |
| | | | | | | | | 5,680,857 | |
| | | | | | | | | | |
| | | | | | Real Estate (3.2%) | |
| | 2,720 | | | | | Alexandria Real Estate Equities, Inc. | | | 431,800 | |
| | | |
| | 3,418 | | | | | American Tower Corp. | | | 745,397 | |
| | | |
| | 6,131 | | | | | Apartment Investment & Management Company - Class A | | | 336,469 | |
| | | |
| | 2,501 | | | | | AvalonBay Communities, Inc. | | | 544,368 | |
| | | |
| | 3,393 | | | | | Crown Castle International Corp. | | | 470,915 | |
| | | |
| | 2,704 | | | | | Digital Realty Trust, Inc. | | | 343,516 | |
| | | |
| | 628 | | | | | Equinix, Inc. | | | 355,938 | |
| | | |
| | 2,422 | | | | | Federal Realty Investment Trust | | | 329,416 | |
| | | |
| | 3,256 | | | | | Mid-America Apartment Communities, Inc. | | | 452,551 | |
| | | |
| | 4,687 | | | | | Prologis, Inc. | | | 411,331 | |
| | | |
| | 1,791 | | | | | Public Storage | | | 399,142 | |
| | | |
| | 6,225 | | | | | Realty Income Corp. | | | 509,143 | |
| | | |
| | 5,073 | | | | | Regency Centers Corp. | | | 341,109 | |
| | | |
| | 3,758 | | | | | Simon Property Group, Inc. | | | 566,255 | |
| | | |
| | 7,876 | | | | | UDR, Inc. | | | 395,769 | |
| | | |
| | 6,375 | | | | | Welltower, Inc. | | | 578,149 | |
| | | |
| | 11,860 | | | | | Weyerhaeuser Company | | | 346,431 | |
| | | | | | | | | | |
| | | | | | | | | 7,557,699 | |
| | | | | | | | | | |
| | | | | | Utilities (3.4%) | | | | |
| | | |
| | 19,411 | | | | | AES Corp. | | | 330,958 | |
| | | |
| | 7,602 | | | | | American Electric Power Company, Inc.~ | | | 717,553 | |
| | | |
| | 7,071 | | | | | CMS Energy Corp. | | | 451,978 | |
| | | |
| | 5,920 | | | | | Consolidated Edison, Inc. | | | 545,942 | |
| | | |
| | 7,002 | | | | | Dominion Energy, Inc. | | | 578,015 | |
| | | |
| | 9,684 | | | | | Duke Energy Corp.~ | | | 912,814 | |
| | | |
| | 4,284 | | | | | Edison International | | | 269,464 | |
| | | |
| | 4,334 | | | | | Entergy Corp. | | | 526,494 | |
| | | |
| | 5,969 | | | | | Exelon Corp. | | | 271,530 | |
| | | | | | |
| See accompanying Notes to Schedule of Investments | | www.calamos.com | | | 91 | |
Hedged Equity Fund Schedule of Investments October 31, 2019
| | | | | | | | | | |
NUMBER OF SHARES | | | | | | | VALUE | |
| | | |
| | 9,804 | | | | | FirstEnergy Corp. | | $ | 473,729 | |
| | | |
| | 3,893 | | | | | NextEra Energy, Inc.~ | | | 927,858 | |
| | | |
| | 11,977 | | | | | NiSource, Inc. | | | 335,835 | |
| | | |
| | 7,528 | | | | | Public Service Enterprise Group, Inc. | | | 476,598 | |
| | | |
| | 10,748 | | | | | Southern Company | | | 673,470 | |
| | | |
| | 8,628 | | | | | Xcel Energy, Inc. | | | 547,964 | |
| | | | | | | | | | |
| | | | | | | | | 8,040,202 | |
| | | | | | | | | | |
| | | |
| | | | | | TOTAL COMMON STOCKS (Cost $217,819,757) | �� | | 240,502,513 | |
| | | | | | | | | | |
| | | | | | | | | | |
|
| | EXCHANGE-TRADED FUND (4.7%) | |
| | | | | | Other (4.7%) | | | | |
| | 37,080 | | | | | SPDR S&P 500 ETF Trust (Cost $10,942,988) | | | 11,247,476 | |
| | | | | | | | | | |
| | | | | | | | | | |
NUMBER OF CONTRACTS/ NOTIONAL AMOUNT | | | | | | | VALUE | |
|
| | PURCHASED OPTIONS (0.6%)# | |
| | | | | | Communication Services (0.0%) | |
| 145
1,397,800 |
| | | | Electronic Arts, Inc. Call, 12/20/19, Strike $105.00 | | | 12,832 | |
| | | |
| 43
824,095 |
| | | | Facebook, Inc. Call, 12/20/19, Strike $225.00 | | | 1,527 | |
| | | | | | | | | | |
| | | | | | | | | 14,359 | |
| | | | | | | | | | |
| | | | | | Consumer Discretionary (0.0%) | |
| 15
2,664,990 |
| | | | Amazon.com, Inc. Call, 11/15/19, Strike $2,150.00 | | | 308 | |
| | | |
| 14
326,410 |
| | | | Ulta Beauty, Inc. Call, 01/17/20, Strike $265.00 | | | 7,910 | |
| | | |
| 28
339,752 |
| | | | Wynn Resorts, Ltd. Call, 01/17/20, Strike $120.00 | | | 25,480 | |
| | | | | | | | | | |
| | | | | | | | | 33,698 | |
| | | | | | | | | | |
| | | | | | Consumer Staples (0.0%) | |
| 80
1,522,640 |
| | | | Constellation Brands, Inc. Call, 01/17/20, Strike $200.00 | | | 33,600 | |
| | | |
| 110
355,630 |
| | | | Kraft Heinz Company Call, 12/20/19, Strike $32.50 | | | 9,900 | |
| | | | | | | | | | |
| | | | | | | | | 43,500 | |
| | | | | | | | | | |
| | | | | | Health Care (0.0%) | | | | |
| 39
1,152,528 |
| | | | Illumina, Inc. Call, 12/20/19, Strike $330.00 | | | 9,945 | |
| | | | | | | | | | |
| | | | | | Information Technology (0.1%) | |
| 55
1,368,180 |
| | | | Apple, Inc. Call, 11/15/19, Strike $220.00 | | | 155,375 | |
| | | |
| 82
389,910 |
| | | | Micron Technology, Inc. Call, 01/17/20, Strike $40.00 | | | 71,135 | |
| | | | | | | | | | |
| | | | | | | | | 226,510 | |
| | | | | | | | | | |
| | | | | | | | | | |
NUMBER OF CONTRACTS/ NOTIONAL AMOUNT | | | | | | | VALUE | |
| | | | | | | | | | |
| | | | | | Other (0.5%) | |
| | | | | | S&P 500 Index | | | | |
| 250
75,939,000 |
| | | | Call, 11/29/19, Strike $3,100.00 | | $ | 225,000 | |
| 125
37,969,500 |
| | | | Put, 12/31/19, Strike $2,850.00 | | | 260,000 | |
| 110
33,413,160 |
| | | | Put, 12/31/19, Strike $2,500.00 | | | 36,300 | |
| 100
30,375,600 |
| | | | Call, 12/31/19, Strike $3,100.00 | | | 262,500 | |
| 50
15,187,800 |
| | | | Put, 12/31/19, Strike $2,700.00 | | | 46,250 | |
| 50
15,187,800 |
| | | | Put, 03/31/20, Strike $2,500.00 | | | 98,000 | |
| 25
7,593,900 |
| | | | Put, 11/29/19, Strike $3,000.00 | | | 63,875 | |
| 25
7,593,900 |
| | | | Put, 11/29/19, Strike $2,700.00 | | | 5,562 | |
| 20
6,075,120 |
| | | | Put, 12/31/19, Strike $2,750.00 | | | 24,300 | |
| | | | | | | | | | |
| | | | | | | | | 1,021,787 | |
| | | | | | | | | | |
| | | |
| | | | | | TOTAL PURCHASED OPTIONS (Cost $2,312,617) | | | 1,349,799 | |
| | | | | | | | | | |
| | | | | | | | | | |
NUMBER OF SHARES | | | | | | | VALUE | |
|
| | SHORT TERM INVESTMENTS (1.4%) | |
| | 1,729,836 | | | | | Fidelity Prime Money Market Fund - Institutional Class, 1.890%*** | | | 1,730,528 | |
| | | |
| | 1,729,973 | | | | | Morgan Stanley Institutional Liquidity Funds - Government Portfolio,
1.720%*** | | | 1,729,973 | |
| | | | | | | | | | |
| | | |
| | | | | | TOTAL SHORT TERM INVESTMENTS (Cost $3,460,367) | | | 3,460,501 | |
| | | | | | | | | | |
| |
| TOTAL INVESTMENTS (108.3%)
(Cost $234,535,729) | | | 256,560,289 | |
| | | | | | | | | | |
| |
| | LIABILITIES, LESS OTHER ASSETS(-8.3%) | | | (19,763,262 | ) |
| | | | | | | | | | |
| |
| | NET ASSETS (100.0%) | | $ | 236,797,027 | |
| | | | | | | | | | |
| | | | | | | | | | |
NUMBER OF CONTRACTS/ NOTIONAL AMOUNT | | | | | | | VALUE | |
|
| | WRITTEN OPTIONS(-8.4%)# | |
| | | | | | Communication Services (0.0%) | |
| 40
224,120 |
| | | | Activision Blizzard, Inc. Put, 11/15/19, Strike $37.50 | | | (460 | ) |
| | | |
| | | | | | Electronic Arts, Inc. | | | | |
| 145
1,397,800 |
| | | | Call, 12/20/19, Strike $110.00 | | | (4,278 | ) |
| | | | |
| 92 | | CALAMOS OPEN-END FAMILY OF FUNDS ANNUAL REPORT | | See accompanying Notes to Schedule of Investments |
Hedged Equity Fund Schedule of Investments October 31, 2019
| | | | | | | | | | |
NUMBER OF CONTRACTS/ NOTIONAL AMOUNT | | | | | | | VALUE | |
| 66
636,240 |
| | | | Put, 12/20/19, Strike $80.00 | | $ | (1,815 | ) |
| | | |
| | | | | | Facebook, Inc. | | | | |
| 43
824,095 |
| | | | Call, 12/20/19, Strike $235.00 | | | (516 | ) |
| 43
824,095 |
| | | | Put, 12/20/19, Strike $155.00 | | | (3,762 | ) |
| | | | | | | | | | |
| | | | | | | | | (10,831 | ) |
| | | | | | | | | | |
| | | | | | Consumer Discretionary (0.0%) | |
| | | | | | Amazon.com, Inc. | | | | |
| 15
2,664,990 |
| | | | Call, 11/15/19, Strike $2,200.00 | | | (75 | ) |
| 6
1,065,996 |
| | | | Put, 11/15/19, Strike $1,600.00 | | | (384 | ) |
| | | |
| | | | | | Ulta Beauty, Inc. | | | | |
| 14
326,410 |
| | | | Call, 01/17/20, Strike $275.00 | | | (5,460 | ) |
| 14
326,410 |
| | | | Put, 01/17/20, Strike $200.00 | | | (6,230 | ) |
| | | |
| 56
679,504 |
| | | | Wynn Resorts, Ltd. Call, 01/17/20, Strike $130.00 | | | (26,880 | ) |
| | | | | | | | | | |
| | | | | | | | | (39,029 | ) |
| | | | | | | | | | |
| | | | | | Consumer Staples (0.0%) | |
| | | | | | Constellation Brands, Inc. | | | | |
| 80
1,522,640 |
| | | | Call, 01/17/20, Strike $205.00 | | | (22,400 | ) |
| 32
609,056 |
| | | | Put, 01/17/20, Strike $170.00 | | | (7,520 | ) |
| | | |
| | | | | | Kraft Heinz Company | | | | |
| 110
355,630 |
| | | | Call, 12/20/19, Strike $35.00 | | | (1,925 | ) |
| 110
355,630 |
| | | | Put, 12/20/19, Strike $25.00 | | | (825 | ) |
| | | | | | | | | | |
| | | | | | | | | (32,670 | ) |
| | | | | | | | | | |
| | | | | | Health Care (0.0%) | |
| | | | | | Illumina, Inc. | | | | |
| 39
1,152,528 |
| | | | Call, 12/20/19, Strike $340.00 | | | (5,948 | ) |
| 13
384,176 |
| | | | Put, 12/20/19, Strike $250.00 | | | (2,470 | ) |
| | | | | | | | | | |
| | | | | | | | | (8,418 | ) |
| | | | | | | | | | |
| | | | | | Information Technology(-0.1%) | |
| 110
2,736,360 |
| | | | Apple, Inc. Call, 11/15/19, Strike $230.00 | | | (203,500 | ) |
| | | |
| 164
779,820 |
| | | | Micron Technology, Inc. Call, 01/17/20, Strike $46.00 | | | (72,980 | ) |
| | | | | | | | | | |
| | | | | | | | | (276,480 | ) |
| | | | | | | | | | |
| | | | | | Other(-8.3%) | |
| | | | | | S&P 500 Index | | | | |
| 225
68,345,100 |
| | | | Call, 12/31/19, Strike $2,700.00 | | | (7,753,500 | ) |
| | | | | | | | | | |
NUMBER OF CONTRACTS/ NOTIONAL AMOUNT | | | | | | | VALUE | |
| 185
56,194,860 |
| | | | Call, 12/31/19, Strike $3,000.00 | | $ | (1,548,450 | ) |
| 185
56,194,860 |
| | | | Call, 12/31/19, Strike $2,500.00 | | | (9,949,300 | ) |
| 50
15,187,800 |
| | | | Put, 11/29/19, Strike $2,850.00 | | | (34,250 | ) |
| 50
15,187,800 |
| | | | Call, 12/31/19, Strike $3,050.00 | | | (254,250 | ) |
| | | | | | | | | | |
| | | | | | | | | (19,539,750 | ) |
| | | | | | | | | | |
| | | |
| | | | | | TOTAL WRITTEN OPTIONS (Premium $13,501,497) | | $ | (19,907,178 | ) |
| | | | | | | | | | |
NOTES TO SCHEDULE OF INVESTMENTS
| # | Non-income producing security. |
| ~ | Security, or portion of security, is segregated as collateral (or collateral for potential future transactions) for written options. The aggregate value of such securities is $74,831,140. |
| ^ | Security, or portion of security, is on loan. |
| *** | The rate disclosed is the 7 day net yield as of October 31, 2019. |
Note: The date on options represents the expiration date of the option contract. The option contract may be exercised at any date on or before the date shown.
| | | | | | |
| See accompanying Notes to Financial Statements | | www.calamos.com | | | 93 | |
Phineus Long/Short Fund Schedule of Investments October 31, 2019
| | | | | | | | | | |
NUMBER OF SHARES | | | | | | | VALUE | |
|
| | COMMON STOCKS (89.5%) | |
| | | | | | Communication Services (12.0%) | |
| | 28,100 | | | | | Alphabet, Inc. - Class A#~ | | $ | 35,372,280 | |
| | | |
| | 206,500 | | | | | Facebook, Inc. - Class A#~ | | | 39,575,725 | |
| | | |
| | 92,500 | | | | | Twitter, Inc.#~ | | | 2,772,225 | |
| | | |
| | 137,500 | | | | | Walt Disney Company | | | 17,864,000 | |
| | | | | | | | | | |
| | | | | | | | | 95,584,230 | |
| | | | | | | | | | |
| | | | | | Consumer Discretionary (6.5%) | |
| | 75,000 | | | | | Lowe’s Companies, Inc.~ | | | 8,370,750 | |
| | | |
| | 83,500 | | | | | McDonald’s Corp.~ | | | 16,424,450 | |
| | | |
| | 576,500 | | | | | MGM Resorts International~ | | | 16,430,250 | |
| | | |
| | 67,500 | | | | | Royal Caribbean Cruises, Ltd. | | | 7,346,025 | |
| | | |
| | 151,642 | | | | | Under Armour, Inc., Class A#^ | | | 3,131,407 | |
| | | | | | | | | | |
| | | | | | | | | 51,702,882 | |
| | | | | | | | | | |
| | | | | | Consumer Staples (2.7%) | |
| | 65,500 | | | | | Lamb Weston Holdings, Inc. | | | 5,111,620 | |
| | | |
| | 139,500 | | | | | Walmart, Inc. | | | 16,357,770 | |
| | | | | | | | | | |
| | | | | | | | | 21,469,390 | |
| | | | | | | | | | |
| | | | | | Energy (2.2%) | | | | |
| | 263,000 | | | | | Exxon Mobil Corp. | | | 17,770,910 | |
| | | | | | | | | | |
| | | | | | Financials (26.9%) | | | | |
| | 1,132,000 | | | | | Bank of America Corp.~ | | | 35,397,640 | |
| | | |
| | 209,500 | | | | | Cboe Global Markets, Inc.~ | | | 24,123,925 | |
| | | |
| | 156,000 | | | | | Goldman Sachs Group, Inc.~ | | | 33,287,280 | |
| | | |
| | 1,475,000 | | | EUR | | ING Groep, NV | | | 16,702,142 | |
| | | |
| | 87,500 | | | | | Intercontinental Exchange, Inc.~ | | | 8,253,000 | |
| | | |
| | 311,000 | | | | | JPMorgan Chase & Company~ | | | 38,850,120 | |
| | | |
| | 718,500 | | | | | Morgan Stanley~ | | | 33,086,925 | |
| | | |
| | 1,981,000 | | | | | UBS Group, AG#~^ | | | 23,316,370 | |
| | | | | | | | | | |
| | | | | | | | | 213,017,402 | |
| | | | | | | | | | |
| | | | | | Health Care (16.3%) | | | | |
| | 58,000 | | | | | Alcon, Inc.#^ | | | 3,437,660 | |
| | | |
| | 197,000 | | | | | Alexion Pharmaceuticals, Inc.#~ | | | 20,763,800 | |
| | | |
| | 90,500 | | | | | Humana, Inc. | | | 26,625,100 | |
| | | |
| | 143,500 | | | | | Johnson & Johnson~ | | | 18,947,740 | |
| | | |
| | 143,000 | | | | | Laboratory Corp. of America Holdings#~ | | | 23,562,110 | |
| | | |
| | 77,500 | | | | | Medtronic, PLC | | | 8,439,750 | |
| | | |
| | 350,000 | | | | | Pfizer, Inc. | | | 13,429,500 | |
| | | |
| | 54,400 | | | | | UnitedHealth Group, Inc. | | | 13,746,880 | |
| | | | | | | | | | |
| | | | | | | | | 128,952,540 | |
| | | | | | | | | | |
| | | | | | Industrials (13.9%) | | | | |
| | 265,500 | | | | | Air Lease Corp.~ | | | 11,676,690 | |
| | | |
| | 432,500 | | | | | Delta Air Lines, Inc.~ | | | 23,822,100 | |
| | | |
| | 118,000 | | | | | Emerson Electric Company~ | | | 8,277,700 | |
| | | |
| | 282,000 | | | | | Fluor Corp.~ | | | 4,543,020 | |
| | | | | | | | | | |
NUMBER OF SHARES | | | | | | | VALUE | |
| | | |
| | 55,500 | | | | | Honeywell International, Inc.~ | | $ | 9,586,515 | |
| | | |
| | 96,500 | | | | | L3Harris Technologies, Inc.~ | | | 19,908,915 | |
| | | |
| | 114,000 | | | | | Raytheon Company~ | | | 24,191,940 | |
| | | |
| | 92,000 | | | | | United Airlines Holdings, Inc.# | | | 8,357,280 | |
| | | | | | | | | | |
| | | | | | | | | 110,364,160 | |
| | | | | | | | | | |
| | | | | | Information Technology (5.7%) | | | | |
| | 108,500 | | | | | Fidelity National Information Services, Inc. | | | 14,295,960 | |
| | | |
| | 221,000 | | | | | First Solar, Inc.#~^ | | | 11,445,590 | |
| | | |
| | 59,500 | | | | | NVIDIA Corp. | | | 11,960,690 | |
| | | |
| | 310,500 | | | | | Slack Technologies, Inc. - Class A#^ | | | 6,831,000 | |
| | | |
| | 5,000 | | | | | Twilio, Inc. - Class A# | | | 482,800 | |
| | | | | | | | | | |
| | | | | | | | | 45,016,040 | |
| | | | | | | | | | |
| | | | | | Materials (3.3%) | | | | |
| | 37,700 | | | | | Air Products & Chemicals, Inc. | | | 8,039,902 | |
| | | |
| | 90,000 | | | | | Linde, PLC | | | 17,851,500 | |
| | | | | | | | | | |
| | | | | | | | | 25,891,402 | |
| | | | | | | | | | |
| | | |
| | | | | | TOTAL COMMON STOCKS (Cost $682,580,316) | | | 709,768,956 | |
| | | | | | | | | | |
|
| | INVESTMENTS IN AFFILIATED FUND (4.6%) | |
| | | | | | Other (4.6%) | | | | |
| | 3,535,359 | | | | | Calamos Short-Term Bond Fund - Class I (Cost $35,250,728) | | | 36,060,658 | |
| | | | | | | | | | |
| | | | | | | | | | |
NUMBER OF CONTRACTS/ NOTIONAL AMOUNT | | | | | | | VALUE | |
|
| | PURCHASED OPTIONS (0.2%)# | |
| | | | | | Communication Services (0.0%) | |
| 1,030
19,739,950 |
| | | | Facebook, Inc. Put, 11/01/19, Strike $180.00 | | | 3,605 | |
| | | | | | | | | | |
| | | | | | Other (0.2%) | | | | |
| 17,000
103,972,000 |
| | | | Consumer Staples Select Sector Put, 11/08/19, Strike $59.50 | | | 416,500 | |
| | | |
| 4,500
326,177,100 |
| | GBP | | FTSE 100 Index Call, 11/15/19, Strike 7,400.00 | | | 641,198 | |
| | | |
| 5,205
40,864,455 |
| | | | Industrial Select Sector SPDR Call, 11/01/19, Strike $77.00 | | | 759,930 | |
| | | |
| 5,650
171,381,450 |
| | | | SPDR S&P 500 ETF Trust Put, 11/01/19, Strike $295.00 | | | 8,475 | |
| | | | | | | | | | |
| | | | | | | | | 1,826,103 | |
| | | | | | | | | | |
| | | |
| | | | | | TOTAL PURCHASED OPTIONS (Cost $5,054,088) | | | 1,829,708 | |
| | | | | | | | | | |
| | | | | | | | | | |
| | | | |
| 94 | | CALAMOS OPEN-END FAMILY OF FUNDS ANNUAL REPORT | | See accompanying Notes to Schedule of Investments |
Phineus Long/Short Fund Schedule of Investments October 31, 2019
| | | | | | | | | | |
NUMBER OF SHARES | | | | | | | VALUE | |
|
| | SHORT TERM INVESTMENTS (7.1%) | |
| | 28,051,818 | | | | | Fidelity Prime Money Market Fund - Institutional Class, 1.890%*** | | $ | 28,063,039 | |
| | | |
| | 28,059,069 | | | | | Morgan Stanley Institutional Liquidity Funds - Government Portfolio,
1.720%*** | | | 28,059,069 | |
| | | | | | | | | | |
| | | |
| | | | | | TOTAL SHORT TERM INVESTMENTS (Cost $56,122,108) | | | 56,122,108 | |
| | | | | | | | | | |
| | | | | | | | | | |
NUMBER OF SHARES/ PRINCIPAL
AMOUNT | | | | | | | VALUE | |
|
| INVESTMENT OF CASH COLLATERAL FOR SECURITIES
LOANED (1.5%) |
|
| | 11,962,705 | | | | | State Street Navigator Securities Lending Government Money Market Portfolio† | | | 11,962,705 | |
| | | | | | | | | | |
| | | |
| | | | | | TOTAL INVESTMENT OF CASH COLLATERAL FOR SECURITIES LOANED (Cost $11,962,705) | | | 11,962,705 | |
| | | | | | | | | | |
| |
| TOTAL INVESTMENTS (102.9%)
(Cost $790,969,945) | | | 815,744,135 | |
| | | | | | | | | | |
| |
| | PAYABLE UPON RETURN OF SECURITIES ONLOAN (-1.5%) | | | (11,962,705 | ) |
| | | | | | | | | | |
| |
| | LIABILITIES, LESS OTHER ASSETS(-1.4%) | | | (10,864,133 | ) |
| | | | | | | | | | |
| |
| | NET ASSETS (100.0%) | | $ | 792,917,297 | |
| | | | | | | | | | |
| | | | | | | | | | |
NUMBER OF SHARES | | | | | | | VALUE | |
|
| | COMMON STOCKS SOLD SHORT(-7.4%)# | |
| | | | | | Consumer Discretionary(-0.8%) | |
| | (70,000 | ) | | | | CarMax, Inc. | | | (6,521,900 | ) |
| | | | | | | | | | |
| | | | | | Information Technology(-1.4%) | |
| | (45,000 | ) | | | | Apple, Inc. | | | (11,194,200 | ) |
| | | | | | | | | | |
| | | | | | Other(-5.2%) | | | | |
| | (520,500 | ) | | | | Industrial Select Sector SPDR Fund | | | (40,864,455 | ) |
| | | | | | | | | | |
| | | |
| | | | | | TOTAL COMMON STOCKS SOLD SHORT (Proceeds $52,536,423) | | | (58,580,555 | ) |
| | | | | | | | | | |
| | | | | | | | | | |
|
| | EXCHANGE-TRADED FUND SOLD SHORT(-81.9%)# | |
| | | | | | Other(-81.9%) | | | | |
| | (2,141,400 | ) | | | | SPDR S&P 500 ETF Trust (Proceeds $580,486,031) | | | (649,550,862 | ) |
| | | | | | | | | | |
| |
| TOTAL SECURITIES SOLD SHORT
(Proceeds $633,022,454) | | | (708,131,417 | ) |
| | | | | | | | | | |
| | | | | | | | | | |
| | | | | | | | | | |
NUMBER OF CONTRACTS/ NOTIONAL AMOUNT | | | | | | | VALUE | |
|
| | WRITTEN OPTIONS(-0.5%)# | |
| | | | | | Consumer Discretionary (0.0%) | |
| 120
21,319,920 |
| | | | Amazon.com, Inc. Call, 12/20/19, Strike $2,000.00 | | $ | (35,700 | ) |
| | | | | | | | | | |
| | | | | | Information Technology(-0.2%) | |
| 450
11,194,200 |
| | | | Apple, Inc. Put, 11/01/19, Strike $242.50 | | | (8,325 | ) |
| | | |
| 1,450
14,001,200 |
| | | | Twilio, Inc. Put, 11/01/19, Strike $108.00 | | | (1,660,250 | ) |
| | | | | | | | | | |
| | | | | | | | | (1,668,575 | ) |
| | | | | | | | | | |
| | | | | | Other(-0.3%) | | | | |
| 6,850
41,894,600 |
| | | | Consumer Staples Select Sector Call, 11/08/19, Strike $60.50 | | | (1,781,000 | ) |
| | | |
| 4,500
12,915,000 |
| | | | Financial Select Sector SPDR Fund Put, 11/22/19, Strike $27.00 | | | (24,750 | ) |
| | | |
| 1,000
72,483,800 |
| | GBP | | FTSE 100 Index Put, 12/20/19, Strike 6,500.00 | | | (142,489 | ) |
| | | |
| 5,205
40,864,455 |
| | | | Industrial Select Sector SPDR Fund Put, 12/20/19, Strike $71.00 | | | (156,150 | ) |
| | | |
| 7,070
214,454,310 |
| | | | SPDR S&P 500 ETF Trust Put, 12/20/19, Strike $270.00 | | | (523,180 | ) |
| | | | | | | | | | |
| | | | | | | | | (2,627,569 | ) |
| | | | | | | | | | |
| | | |
| | | | | | TOTAL WRITTEN OPTIONS (Premium $4,795,213) | | $ | (4,331,844 | ) |
| | | | | | | | | | |
NOTES TO SCHEDULE OF INVESTMENTS
| # | Non-income producing security. |
| ~ | Security, or portion of security, is segregated as collateral (or collateral for potential future transactions) for written options. The aggregate value of such securities is $298,684,339. |
| ^ | Security, or portion of security, is on loan. |
| *** | The rate disclosed is the 7 day net yield as of October 31, 2019. |
| † | Represents investment of cash collateral received from securities on loan as of October 31, 2019. |
FOREIGN CURRENCY ABBREVIATIONS
| | |
| |
| EUR | | European Monetary Unit |
| |
| GBP | | British Pound Sterling |
Note: Value for securities denominated in foreign currencies is shown in U.S. dollars. The date on options represents the expiration date of the option contract. The option contract may be exercised at any date on or before the date shown.
| | | | | | |
| See accompanying Notes to Financial Statements | | www.calamos.com | | | 95 | |
Convertible Fund Schedule of Investments October 31, 2019
| | | | | | | | | | |
PRINCIPAL AMOUNT | | | | | | | VALUE | |
|
| | CONVERTIBLE BONDS (77.0%) | |
| | | | | | Communication Services (11.0%) | |
| | 8,900,000 | | | | | GCI Liberty, Inc.*
1.750%, 09/30/46 | | $ | 11,966,272 | |
| | | |
| | 7,750,000 | | | | | IAC Financeco 3, Inc.*
2.000%, 01/15/30 | | | 8,670,312 | |
| | | |
| | | | | | Liberty Media Corp. | | | | |
| | 8,380,000 | | | | | 1.375%, 10/15/23 | | | 10,519,875 | |
| | 7,200,000 | | | | | 2.250%, 09/30/46 | | | 4,217,040 | |
| | 1,750,000 | | | | | 2.250%, 12/01/48* | | | 2,079,893 | |
| | | |
| | 3,250,000 | | | | | Liberty Media Corp. (Sirius XM Holdings, Inc.)*§
2.125%, 03/31/48 | | | 3,356,665 | |
| | | |
| | 6,250,000 | | | | | Liberty Media Corp. / Liberty Formula One
1.000%, 01/30/23 | | | 7,920,313 | |
| | | |
| | 8,000,000 | | | | | Snap, Inc.*
0.750%, 08/01/26 | | | 8,114,120 | |
| | | |
| | 18,250,000 | | | | | Twitter, Inc.~
0.250%, 06/15/24 | | | 17,444,445 | |
| | | |
| | 7,600,000 | | | | | Zynga, Inc.*
0.250%, 06/01/24 | | | 7,810,900 | |
| | | | | | | | | | |
| | | | | | | | | 82,099,835 | |
| | | | | | | | | | |
| | | | | | Consumer Discretionary (10.1%) | | | | |
| | 8,750,000 | | | | | Booking Holdings, Inc.~
0.350%, 06/15/20 | | | 13,642,169 | |
| | | |
| | 4,250,000 | | | | | Caesars Entertainment Corp.
5.000%, 10/01/24 | | | 7,555,012 | |
| | | |
| | 7,093,000 | | | | | Chegg, Inc.*
0.125%, 03/15/25 | | | 6,636,282 | |
| | | |
| | 11,500,000 | | | | | DISH Network Corp.~
3.375%, 08/15/26 | | | 10,739,217 | |
| | | |
| | 4,000,000 | | | | | Etsy, Inc.*
0.125%, 10/01/26 | | | 3,656,480 | |
| | | |
| | 3,800,000 | | | | | Guess, Inc.*
2.000%, 04/15/24 | | | 3,642,661 | |
| | | |
| | 3,250,000 | | | | | RH^
0.000%, 06/15/23 | | | 3,679,569 | |
| | | |
| | | | | | Tesla, Inc. | | | | |
| | 13,000,000 | | | | | 1.250%, 03/01/21~ | | | 14,138,085 | |
| | 7,000,000 | | | | | 2.000%, 05/15/24 | | | 8,578,640 | |
| | | |
| | 3,143,000 | | | | | Winnebago Industries, Inc.
1.500%, 04/01/25 | | | 3,205,860 | |
| | | | | | | | | | |
| | | | | | | | | 75,473,975 | |
| | | | | | | | | | |
| | | | | | Energy (0.4%) | | | | |
| | 2,200,000 | | | | | Helix Energy Solutions Group, Inc.
4.125%, 09/15/23 | | | 2,692,008 | |
| | | | | | | | | | |
| | | | | | Financials (2.7%) | | | | |
| | 3,748,000 | | | | | Hope Bancorp, Inc.
2.000%, 05/15/38 | | | 3,463,583 | |
| | | |
| | 6,300,000 | | | | | JPMorgan Chase Bank, N.A.
0.000%, 12/30/20 | | | 7,259,963 | |
| | | | | | | | | | |
PRINCIPAL AMOUNT | | | | | | | VALUE | |
| | | |
| | 6,250,000 | | | | | JPMorgan Chase Financial Company, LLC (Voya Financial, Inc.)*§~
0.250%, 05/01/23 | | $ | 6,375,781 | |
| | | |
| | 3,000,000 | | | | | Starwood Property Trust, Inc.^
4.375%, 04/01/23 | | | 3,119,130 | |
| | | | | | | | | | |
| | | | | | | | | 20,218,457 | |
| | | | | | | | | | |
| | | | | | Health Care (14.6%) | | | | |
| | 9,500,000 | | | | | BioMarin Pharmaceutical, Inc.
1.500%, 10/15/20 | | | 9,963,980 | |
| | | |
| | 6,250,000 | | | | | CONMED Corp.*
2.625%, 02/01/24 | | | 8,563,500 | |
| | | |
| | 7,631,000 | | | | | DexCom, Inc.*^
0.750%, 12/01/23 | | | 9,142,358 | |
| | | |
| | 6,750,000 | | | | | Exact Sciences Corp.
0.375%, 03/15/27 | | | 7,244,977 | |
| | | |
| | 2,400,000 | | | | | Flexion Therapeutics, Inc.
3.375%, 05/01/24 | | | 2,325,420 | |
| | | |
| | 4,750,000 | | | | | Illumina, Inc.^
0.500%, 06/15/21 | | | 6,183,788 | |
| | | |
| | 1,500,000 | | | | | Insmed, Inc.
1.750%, 01/15/25 | | | 1,286,190 | |
| | | |
| | | | | | Insulet Corp. | | | | |
| | 14,750,000 | | | | | 0.375%, 09/01/26* | | | 14,117,446 | |
| | 4,250,000 | | | | | 1.375%, 11/15/24 | | | 7,053,682 | |
| | | |
| | 7,250,000 | | | | | Invitae Corp.*
2.000%, 09/01/24 | | | 6,620,990 | |
| | | |
| | 5,250,000 | | | | | Ionis Pharmaceuticals, Inc.
1.000%, 11/15/21 | | | 5,795,239 | |
| | | |
| | 1,100,000 | | | | | Medicines Company
2.500%, 01/15/22 | | | 1,774,740 | |
| | | |
| | 2,740,000 | | | | | Neurocrine Biosciences, Inc.
2.250%, 05/15/24 | | | 4,003,140 | |
| | | |
| | 2,575,000 | | | | | NuVasive, Inc.
2.250%, 03/15/21 | | | 3,230,453 | |
| | | |
| | 6,805,000 | | | | | Repligen Corp.
0.375%, 07/15/24 | | | 6,849,539 | |
| | | |
| | 2,000,000 | | | | | Sarepta Therapeutics, Inc.
1.500%, 11/15/24 | | | 2,828,340 | |
| | | |
| | 2,652,000 | | | | | Supernus Pharmaceuticals, Inc.
0.625%, 04/01/23 | | | 2,453,272 | |
| | | |
| | 3,700,000 | | | | | Tabula Rasa HealthCare, Inc.*
1.750%, 02/15/26 | | | 3,850,165 | |
| | | |
| | 3,250,000 | | | | | Teladoc Health, Inc.^
1.375%, 05/15/25 | | | 5,276,424 | |
| | | | | | | | | | |
| | | | | | | | | 108,563,643 | |
| | | | | | | | | | |
| | | | | | Industrials (1.3%) | | | | |
| | 7,000,000 | | | | | Air Transport Services Group, Inc.
1.125%, 10/15/24 | | | 6,468,630 | |
| | | |
| | 2,501,000 | | | | | FTI Consulting, Inc.
2.000%, 08/15/23 | | | 3,120,698 | |
| | | | | | | | | | |
| | | | | | | | | 9,589,328 | |
| | | | | | | | | | |
| | | | |
| 96 | | CALAMOS OPEN-END FAMILY OF FUNDS ANNUAL REPORT | | See accompanying Notes to Schedule of Investments |
Convertible Fund Schedule of Investments October 31, 2019
| | | | | | | | | | |
PRINCIPAL AMOUNT | | | | | | | VALUE | |
| | | | | | | | | | |
| | | | | | Information Technology (34.8%) | | | | |
| | 6,350,000 | | | | | 8x8, Inc.*
0.500%, 02/01/24 | | $ | 6,473,920 | |
| | | |
| | 2,000,000 | | | | | Advanced Micro Devices, Inc.
2.125%, 09/01/26 | | | 8,679,690 | |
| | | |
| | 9,500,000 | | | | | Akamai Technologies, Inc.^
0.125%, 05/01/25 | | | 10,651,210 | |
| | | |
| | 4,445,000 | | | | | Alteryx, Inc.*
0.500%, 08/01/24 | | | 4,120,093 | |
| | | |
| | 8,500,000 | | | | | Coupa Software, Inc.*
0.125%, 06/15/25 | | | 9,698,712 | |
| | | |
| | 3,450,000 | | | | | DocuSign, Inc.^
0.500%, 09/15/23 | | | 4,066,550 | |
| | | |
| | | | | | Envestnet, Inc. | | | | |
| | 3,285,000 | | | | | 1.750%, 06/01/23 | | | 3,719,556 | |
| | 2,750,000 | | | | | 1.750%, 12/15/19 | | | 2,817,004 | |
| | | |
| | 3,180,000 | | | | | Euronet Worldwide, Inc.*^
0.750%, 03/15/49 | | | 3,622,847 | |
| | | |
| | 6,000,000 | | | | | Guidewire Software, Inc.^
1.250%, 03/15/25 | | | 7,169,040 | |
| | | |
| | 5,400,000 | | | | | II-VI, Inc.
0.250%, 09/01/22 | | | 5,451,651 | |
| | | |
| | 6,100,000 | | | | | Inphi Corp.
0.750%, 09/01/21 | | | 8,455,607 | |
| | | |
| | 1,500,000 | | | | | Intel Corp.~
3.250%, 08/01/39 | | | 4,156,733 | |
| | | |
| | 3,750,000 | | | | | LivePerson, Inc.*
0.750%, 03/01/24 | | | 4,768,106 | |
| | | |
| | 3,750,000 | | | | | Lumentum Holdings, Inc.^
0.250%, 03/15/24 | | | 4,730,588 | |
| | | |
| | 15,250,000 | | | | | Microchip Technology, Inc.~
1.625%, 02/15/27 | | | 19,989,242 | |
| | | |
| | 13,750,000 | | | | | NXP Semiconductors, NV~
1.000%, 12/01/19 | | | 15,163,500 | |
| | | |
| | 8,000,000 | | | | | Okta, Inc.*
0.125%, 09/01/25 | | | 7,590,560 | |
| | | |
| | | | | | ON Semiconductor Corp. | | | | |
| | 5,800,000 | | | | | 1.000%, 12/01/20 | | | 7,047,232 | |
| | 3,000,000 | | | | | 1.625%, 10/15/23^ | | | 3,733,965 | |
| | | |
| | 3,250,000 | | | | | OSI Systems, Inc.
1.250%, 09/01/22 | | | 3,593,281 | |
| | | |
| | 16,750,000 | | | | | Palo Alto Networks, Inc.^
0.750%, 07/01/23 | | | 18,416,457 | |
| | | |
| | 14,750,000 | | | | | Proofpoint, Inc.*^
0.250%, 08/15/24 | | | 15,302,092 | |
| | | |
| | 3,350,000 | | | | | Pure Storage, Inc.^
0.125%, 04/15/23 | | | 3,513,664 | |
| | | |
| | | | | | Q2 Holdings, Inc. | | | | |
| | 3,850,000 | | | | | 0.750%, 06/01/26* | | | 4,095,341 | |
| | 1,654,000 | | | | | 0.750%, 02/15/23 | | | 2,282,958 | |
| | | |
| | 1,906,000 | | | | | Rapid7, Inc.
1.250%, 08/01/23 | | | 2,646,805 | |
| | | |
| | 2,500,000 | | | | | Silicon Laboratories, Inc.
1.375%, 03/01/22 | | | 3,169,150 | |
| | | | | | | | | | |
PRINCIPAL AMOUNT | | | | | | | VALUE | |
| | | |
| | 13,870,000 | | | | | Splunk, Inc.^
1.125%, 09/15/25 | | $ | 15,399,584 | |
| | | |
| | 11,100,000 | | | | | Square, Inc.
0.500%, 05/15/23 | | | 12,298,467 | |
| | | |
| | 2,250,000 | | | | | Twilio, Inc.
0.250%, 06/01/23 | | | 3,422,036 | |
| | | |
| | 5,500,000 | | | | | Viavi Solutions, Inc.^
1.000%, 03/01/24 | | | 7,427,393 | |
| | | |
| | 6,700,000 | | | | | Wix.com, Ltd.^
0.000%, 07/01/23 | | | 7,659,608 | |
| | | |
| | 9,500,000 | | | | | Workday, Inc.
0.250%, 10/01/22 | | | 12,110,552 | |
| | | |
| | 4,500,000 | | | | | Zendesk, Inc.
0.250%, 03/15/23 | | | 5,852,520 | |
| | | | | | | | | | |
| | | | | | | | | 259,295,714 | |
| | | | | | | | | | |
| | | | | | Real Estate (1.6%) | | | | |
| | 3,000,000 | | | | | Extra Space Storage, LP*
3.125%, 10/01/35 | | | 3,698,385 | |
| | | |
| | 6,000,000 | | | | | IH Merger Sub, LLC
3.500%, 01/15/22 | | | 8,264,760 | |
| | | | | | | | | | |
| | | | | | | | | 11,963,145 | |
| | | | | | | | | | |
| | | | | | Utilities (0.5%) | | | | |
| | 3,250,000 | | | | | NRG Energy, Inc.
2.750%, 06/01/48 | | | 3,698,533 | |
| | | | | | | | | | |
| | | |
| | | | | | TOTAL CONVERTIBLE BONDS (Cost $531,867,137) | | | 573,594,638 | |
| | | | | | | | | | |
| | | | | | | | | | |
|
| | SYNTHETIC CONVERTIBLE SECURITIES (2.1%)¤ | |
| | U.S. Government and Agency Securities (1.7%) | |
| | | | | | United States Treasury Note | | | | |
| | 6,200,000 | | | | | 2.500%, 06/30/20 | | | 6,236,207 | |
| | 6,000,000 | | | | | 2.375%, 03/15/21 | | | 6,064,336 | |
| | | | | | | | | | |
| | | |
| | | | | | TOTAL U.S. GOVERNMENT AND AGENCY SECURITIES | | | 12,300,543 | |
| | | | | | | | | | |
NUMBER OF CONTRACTS/ NOTIONAL AMOUNT | | | | | | | VALUE | |
| | | | | | | | | | |
| | Purchased Options (0.4%)# | |
| | | | | | Consumer Discretionary (0.0%) | |
| 42
7,461,972 |
| | | | Amazon.com, Inc. Call, 01/17/20, Strike $1,900.00 | | | 104,685 | |
| | | | | | | | | | |
| | | | | | Financials (0.2%) | | | | |
| 3,000
15,489,000 |
| | | | Wells Fargo & Company Call, 01/15/21, Strike $55.00 | | | 952,500 | |
| | | | | | | | | | |
| | | | | | Industrials (0.1%) | | | | |
| 690
10,441,770 |
| | | | Stanley Black & Decker, Inc. Call, 01/17/20, Strike $145.00 | | | 762,450 | |
| | | | | | | | | | |
| | | | | | |
| See accompanying Notes to Schedule of Investments | | www.calamos.com | | | 97 | |
Convertible Fund Schedule of Investments October 31, 2019
| | | | | | | | | | |
NUMBER OF CONTRACTS/ NOTIONAL AMOUNT | | | | | | | VALUE | |
| | | | | | | | | | |
| | | | | | Information Technology (0.1%) | |
| 1,875
8,915,625 |
| | | | Micron Technology, Inc. Call, 01/17/20, Strike $47.00 | | $ | 731,250 | |
| | | | | | | | | | |
| | | |
| | | | | | TOTAL PURCHASED OPTIONS | | | 2,550,885 | |
| | | | | | | | | | |
| | | |
| | | | | | TOTAL SYNTHETIC CONVERTIBLE SECURITIES (Cost $15,374,866) | | | 14,851,428 | |
| | | | | | | | | | |
| | | | | | | | | | |
NUMBER OF SHARES | | | | | | | VALUE | |
|
| | CONVERTIBLE PREFERRED STOCKS (15.8%) | |
| | | | | | Financials (5.6%) | | | | |
| | 30,400 | | | | | Assurant, Inc.
6.500%, 03/15/21 | | | 3,799,088 | |
| | | |
| | 10,300 | | | | | Bank of America Corp.~ ††
7.250% | | | 15,620,877 | |
| | | |
| | 15,570 | | | | | Virtus Investment Partners, Inc.^
7.250%, 02/01/20 | | | 1,469,496 | |
| | | |
| | 13,900 | | | | | Wells Fargo & Company~ ††
7.500% | | | 20,982,050 | |
| | | | | | | | | | |
| | | | | | | | | 41,871,511 | |
| | | | | | | | | | |
| | | | | | Health Care (1.7%) | | | | |
| | 90,500 | | | | | Becton Dickinson and Company
6.125%, 05/01/20 | | | 5,582,040 | |
| | | |
| | 6,755 | | | | | Danaher Corp.^
4.750%, 04/15/22 | | | 7,500,212 | |
| | | | | | | | | | |
| | | | | | | | | 13,082,252 | |
| | | | | | | | | | |
| | | | | | Industrials (1.7%) | | | | |
| | 9,915 | | | | | Fortive Corp.
5.000%, 07/01/21 | | | 8,928,953 | |
| | | |
| | 65,400 | | | | | Rexnord Corp.
5.750%, 11/15/19 | | | 3,649,974 | |
| | | | | | | | | | |
| | | | | | | | | 12,578,927 | |
| | | | | | | | | | |
| | | | | | Information Technology (2.2%) | |
| | 14,855 | | | | | Broadcom, Inc.
8.000%, 09/30/22 | | | 16,088,262 | |
| | | | | | | | | | |
| | | | | | Real Estate (1.0%) | | | | |
| | 6,200 | | | | | Crown Castle International Corp.
6.875%, 08/01/20 | | | 7,723,278 | |
| | | | | | | | | | |
| | | | | | Utilities (3.6%) | | | | |
| | 135,685 | | | | | American Electric Power Company, Inc.~
6.125%, 03/15/22 | | | 7,461,318 | |
| | | |
| | 69,600 | | | | | Aqua America, Inc.
6.000%, 04/30/22 | | | 4,193,400 | |
| | | |
| | 149,730 | | | | | NextEra Energy, Inc.
4.872%, 09/01/22 | | | 7,615,268 | |
| | | | | | | | | | |
NUMBER OF SHARES | | | | | | | VALUE | |
| | | |
| | | | | | Sempra Energy | | | | |
| | 33,430 | | | | | 6.750%, 07/15/21 | | $ | 3,884,232 | |
| | 30,000 | | | | | 6.000%, 01/15/21 | | | 3,480,900 | |
| | | | | | | | | | |
| | | | | | | | | 26,635,118 | |
| | | | | | | | | | |
| | | |
| | | | | | TOTAL CONVERTIBLE PREFERRED STOCKS (Cost $103,687,926) | | | 117,979,348 | |
| | | | | | | | | | |
| | | | | | | | | | |
|
| | COMMON STOCKS (2.3%) | |
| | | | | | Health Care (0.9%) | | | | |
| | 24,945 | | | | | Anthem, Inc.~ (Cost $5,882,662) | | | 6,712,201 | |
| | | | | | | | | | |
| | | | | | Information Technology (0.5%) | |
| | 13,735 | | | | | Lam Research Corp. (Cost $3,693,815) | | | 3,722,734 | |
| | | | | | | | | | |
| | | | | | Utilities (0.9%) | | | | |
| | 52,614 | | | | | DTE Energy Company (Cost $6,977,076) | | | 6,698,814 | |
| | | | | | | | | | |
| | | |
| | | | | | TOTAL COMMON STOCKS (Cost $16,553,553) | | | 17,133,749 | |
| | | | | | | | | | |
| | | | | | | | | | |
NUMBER OF CONTRACTS/ NOTIONAL AMOUNT | | | | | | | VALUE | |
|
| | PURCHASED OPTIONS (0.1%)# | |
| | | | | | Consumer Discretionary (0.0%) | | | | |
| 50
10,243,850 |
| | | | Booking Holdings, Inc. Put, 01/17/20, Strike $2,050.00 | | | 418,750 | |
| | | | | | | | | | |
| | | | | | Health Care (0.1%) | | | | |
| 450
6,539,400 |
| | | | Insulet Corp. Put, 12/20/19, Strike $150.00 | | | 576,000 | |
| | | | | | | | | | |
| | | |
| | | | | | TOTAL PURCHASED_OPTIONS (Cost $971,696) | | | 994,750 | |
| | | | | | | | | | |
| | | | | | | | | | |
NUMBER OF SHARES | | | | | | | VALUE | |
|
| | SHORT TERM INVESTMENTS (2.3%) | |
| | 8,652,636 | | | | | Fidelity Prime Money Market Fund - Institutional Class, 1.890%*** | | | 8,656,097 | |
| | | |
| | 8,595,613 | | | | | Morgan Stanley Institutional Liquidity Funds - Government Portfolio, 1.720%*** | | | 8,595,613 | |
| | | | | | | | | | |
| | | |
| | | | | | TOTAL SHORT TERM INVESTMENTS (Cost $17,251,008) | | | 17,251,710 | |
| | | | | | | | | | |
| | | | |
| 98 | | CALAMOS OPEN-END FAMILY OF FUNDS ANNUAL REPORT | | See accompanying Notes to Schedule of Investments |
Convertible Fund Schedule of Investments October 31, 2019
| | | | | | | | | | |
NUMBER OF SHARES/ PRINCIPAL
AMOUNT | | | | | | | VALUE | |
|
| INVESTMENT OF CASH COLLATERAL FOR SECURITIES
LOANED (5.9%) |
|
| | 20,867,259 | | | | | Fidelity Prime Money Market Fund - Institutional Class, 1.890%***† | | $ | 20,867,259 | |
| | | |
| | 22,913,303 | | | | | State Street Navigator Securities Lending Government Money Market Portfolio† | | | 22,913,303 | |
| | | | | | | | | | |
| | | |
| | | | | | TOTAL INVESTMENT OF CASH COLLATERAL FOR SECURITIES LOANED (Cost $43,780,562) | | | 43,780,562 | |
| | | | | | | | | | |
| |
| TOTAL INVESTMENTS (105.5%)
(Cost $729,486,748) | | | 785,586,185 | |
| | | | | | | | | | |
| |
| | PAYABLE UPON RETURN OF SECURITIES ON LOAN(-5.9%) | | | (43,780,562 | ) |
| | | | | | | | | | |
| |
| | OTHER ASSETS, LESS LIABILITIES (0.4%) | | | 3,118,919 | |
| | | | | | | | | | |
| |
| | NET ASSETS (100.0%) | | $ | 744,924,542 | |
| | | | | | | | | | |
| | | | | | | | | | |
NUMBER OF CONTRACTS/ NOTIONAL AMOUNT | | | | | | | VALUE | |
|
| | WRITTEN OPTION (0.0%)# | |
| | | | | | Health Care (0.0%) | | | | |
| 450
6,539,400 |
| | | | Insulet Corp. Call, 12/20/19, Strike $180.00 (Premium $205,629) | | | (63,000 | ) |
| | | | | | | | | | |
FORWARD FOREIGN CURRENCY CONTRACTS
| | | | | | | | | | | | | | | | |
COUNTER
PARTY | | LONG
CONTRACTS | | SETTLEMENT
DATE | | LOCAL
CURRENCY | | | CURRENT
VALUE | | | UNREALIZED
GAIN/LOSS | |
| | | | | |
State Street
Bank and
Trust | | Hong Kong Dollar | | 01/22/20 | | | 2,525,000 | | | $ | 322,177 | | | $ | (89 | ) |
| | | | | | | | | | | | | | | | |
| | | | | | | | | | | | | | $ | (89 | ) |
| | | | | | | | | | | | | | | | |
| | | | | |
COUNTER
PARTY | | SHORT
CONTRACTS | | SETTLEMENT
DATE | | LOCAL
CURRENCY | | | CURRENT
VALUE | | | UNREALIZED
GAIN/LOSS | |
| | | | | |
State Street
Bank and
Trust | | Hong Kong Dollar | | 01/22/20 | | | 41,290,000 | | | $ | 5,268,390 | | | $ | (1,065 | ) |
| | | | | | | | | | | | | | | | |
| | | | | | | | | | | | | | $ | (1,065 | ) |
| | | | | | | | | | | | | | | | |
NOTES TO SCHEDULE OF INVESTMENTS
| * | Securities issued and sold pursuant to a Rule 144A transaction are excepted from the registration requirement of the Securities Act of 1933, as amended. These securities may only be sold to qualified institutional buyers (“QIBs”), such as the Fund. Any resale of these securities must generally be effected through a sale that is registered under the Act or otherwise exempted from such registration requirements. |
| § | Securities exchangeable or convertible into securities of one or more entities that are different than the issuer. Each entity is identified in the parenthetical. |
| ~ | Security, or portion of security, is segregated as collateral (or collateral for potential future transactions) for written options. The aggregate value of such securities is $16,895,885. |
| ^ | Security, or portion of security, is on loan. |
| ¤ | The synthetic convertible securities strategy combines separate securities that together possess the economic characteristics similar to a convertible security. |
| # | Non-income producing security. |
| *** | The rate disclosed is the 7 day net yield as of October 31, 2019. |
| † | Represents investment of cash collateral received from securities on loan as of October 31, 2019. |
Note: The date on options represents the expiration date of the option contract. The option contract may be exercised at any date on or before the date shown.
| | | | | | |
| See accompanying Notes to Financial Statements | | www.calamos.com | | | 99 | |
Global Convertible Fund Schedule of Investments October 31, 2019
| | | | | | | | | | |
PRINCIPAL AMOUNT | | | | | | | VALUE | |
|
| | CONVERTIBLE BONDS (75.3%) | |
| | | | | | Communication Services (10.3%) | |
| | 600,000 | | | EUR | | Cellnex Telecom, SA
1.500%, 01/16/26 | | $ | 896,196 | |
| | | |
| | | | | | CyberAgent, Inc. | | | | |
| | 50,000,000 | | | JPY | | 0.000%, 02/17/23 | | | 471,678 | |
| | 50,000,000 | | | JPY | | 0.000%, 02/19/25 | | | 472,935 | |
| | | |
| | 2,055,000 | | | | | GCI Liberty, Inc.*
1.750%, 09/30/46 | | | 2,762,999 | |
| | | |
| | 670,000 | | | | | IAC Financeco 3, Inc.*
2.000%, 01/15/30 | | | 749,563 | |
| | | |
| | 760,000 | | | | | iQIYI, Inc.*
2.000%, 04/01/25 | | | 690,920 | |
| | | |
| | 1,400,000,000 | | | KRW | | Kakao Corp.
0.000%, 05/11/21 | | | 1,413,736 | |
| | | |
| | 710,000 | | | | | Liberty Media Corp.
1.375%, 10/15/23 | | | 891,302 | |
| | | |
| | 665,000 | | | | | Liberty Media Corp. (Sirius XM Holdings, Inc.)*§
2.125%, 03/31/48 | | | 686,825 | |
| | | |
| | 750,000 | | | | | Momo, Inc.
1.250%, 07/01/25 | | | 692,835 | |
| | | |
| | 1,975,000 | | | | | Snap, Inc.*
0.750%, 08/01/26 | | | 2,003,173 | |
| | | |
| | 1,340,000 | | | | | Twitter, Inc.
0.250%, 06/15/24 | | | 1,280,852 | |
| | | |
| | 675,000 | | | | | Zynga, Inc.*
0.250%, 06/01/24 | | | 693,731 | |
| | | | | | | | | | |
| | | | | | | | | 13,706,745 | |
| | | | | | | | | | |
| | | | | | Consumer Discretionary (9.7%) | |
| | 613,000 | | | | | Baozun, Inc.*
1.625%, 05/01/24 | | | 654,077 | |
| | | |
| | 600,000 | | | | | Cie Generale des Etablissements Michelin, SCA
0.000%, 01/10/22 | | | 608,250 | |
| | | |
| | 1,241,000 | | | | | Ctrip.com International, Ltd.
1.990%, 07/01/25 | | | 1,301,362 | |
| | | |
| | 1,155,000 | | | | | DISH Network Corp.
3.375%, 08/15/26 | | | 1,078,591 | |
| | | |
| | 665,000 | | | | | Guess, Inc.*
2.000%, 04/15/24 | | | 637,466 | |
| | | |
| | 50,000,000 | | | JPY | | Iida Group Holdings Company, Ltd.
0.000%, 06/18/20 | | | 461,288 | |
| | | |
| | 1,220,000 | | | | | NIO, Inc.*
4.500%, 02/01/24 | | | 349,951 | |
| | | |
| | 1,417,000 | | | | | Pinduoduo, Inc.*
0.000%, 10/01/24 | | | 1,649,027 | |
| | | |
| | 630,000 | | | | | Quotient Technology, Inc.
1.750%, 12/01/22 | | | 601,968 | |
| | | |
| | 650,000 | | | | | RH^
0.000%, 06/15/23 | | | 735,914 | |
| | | |
| | 416,000 | | | EUR | | SEB, SA
0.000%, 11/17/21 | | | 889,492 | |
| | | | | | | | | | |
PRINCIPAL AMOUNT | | | | | | | VALUE | |
| | | |
| | 270,000 | | | | | Shanghai Port Group BVI Holding Company, Ltd.
0.000%, 08/09/22 | | $ | 280,114 | |
| | | |
| | | | | | Tesla, Inc. | | | | |
| | 2,143,000 | | | | | 2.000%, 05/15/24 | | | 2,626,289 | |
| | 934,000 | | | | | 2.375%, 03/15/22 | | | 1,096,236 | |
| | | | | | | | | | |
| | | | | | | | | 12,970,025 | |
| | | | | | | | | | |
| | | | | | Consumer Staples (3.2%) | | | | |
| | 3,800,000 | | | | | Carrefour, SA
0.000%, 03/27/24 | | | 3,671,693 | |
| | | |
| | 729,000 | | | | | Turning Point Brands, Inc.*
2.500%, 07/15/24 | | | 582,507 | |
| | | | | | | | | | |
| | | | | | | | | 4,254,200 | |
| | | | | | | | | | |
| | | | | | Energy (4.5%) | | | | |
| | 390,000 | | | | | Nabors Industries, Inc.
0.750%, 01/15/24 | | | 250,045 | |
| | | |
| | 430,000 | | | | | SM Energy Company
1.500%, 07/01/21 | | | 386,503 | |
| | | |
| | 4,200,000 | | | | | TOTAL, SA
0.500%, 12/02/22 | | | 4,422,453 | |
| | | |
| | 800,000 | | | | | Tullow Oil Jersey, Ltd.
6.625%, 07/12/21 | | | 930,152 | |
| | | | | | | | | | |
| | | | | | | | | 5,989,153 | |
| | | | | | | | | | |
| | | | | | Financials (5.2%) | | | | |
| | 2,300,000 | | | EUR | | AURELIUS Equity Opportunities SE & Co., KGaA
1.000%, 12/01/20 | | | 2,537,191 | |
| | | |
| | 2,700,000 | | | EUR | | Corestate Capital Holding, SA
1.375%, 11/28/22 | | | 2,406,337 | |
| | | |
| | 700,000 | | | EUR | | Cromwell SPV Finance Pty, Ltd.
2.000%, 02/04/20 | | | 803,124 | |
| | | |
| | 900,000 | | | EUR | | LEG Immobilien, AG
0.875%, 09/01/25 | | | 1,154,872 | |
| | | | | | | | | | |
| | | | | | | | | 6,901,524 | |
| | | | | | | | | | |
| | | | | | Health Care (6.9%) | | | | |
| | 1,230,000 | | | | | BioMarin Pharmaceutical, Inc.^
1.500%, 10/15/20 | | | 1,290,073 | |
| | | |
| | 651,000 | | | | | DexCom, Inc.*
0.750%, 12/01/23 | | | 779,934 | |
| | | |
| | 600,000 | | | EUR | | GN Store Nord, A/S
0.000%, 05/21/24 | | | 666,681 | |
| | | |
| | 252,000 | | | | | Innoviva, Inc.
2.500%, 08/15/25 | | | 251,134 | |
| | | |
| | 515,000 | | | | | Insulet Corp.
1.375%, 11/15/24 | | | 854,740 | |
| | | |
| | 525,000 | | | | | Neurocrine Biosciences, Inc.
2.250%, 05/15/24 | | | 767,025 | |
| | | |
| | 765,000 | | | | | NuVasive, Inc.
2.250%, 03/15/21 | | | 959,727 | |
| | | |
| | 595,000 | | | | | Pacira BioSciences, Inc.^
2.375%, 04/01/22 | | | 600,191 | |
| | | | |
| 100 | | CALAMOS OPEN-END FAMILY OF FUNDS ANNUAL REPORT | | See accompanying Notes to Schedule of Investments |
Global Convertible Fund Schedule of Investments October 31, 2019
| | | | | | | | | | |
PRINCIPAL AMOUNT | | | | | | | VALUE | |
| | | |
| | 130,000,000 | | | JPY | | Ship Healthcare Holdings, Inc.
0.000%, 12/13/23 | | $ | 1,293,800 | |
| | | |
| | 630,000 | | | | | Tabula Rasa HealthCare, Inc.*
1.750%, 02/15/26 | | | 655,569 | |
| | | |
| | 627,000 | | | | | Teladoc Health, Inc.^
1.375%, 05/15/25 | | | 1,017,944 | |
| | | | | | | | | | |
| | | | | | | | | 9,136,818 | |
| | | | | | | | | | |
| | | | | | Industrials (3.5%) | | | | |
| | 130,000,000 | | | JPY | | ANA Holdings, Inc.
0.000%, 09/19/24 | | | 1,202,882 | |
| | | |
| | 60,000,000 | | | JPY | | Kandenko Company, Ltd.
0.000%, 03/31/21 | | | 582,601 | |
| | | |
| | 60,000,000 | | | JPY | | Nippon Flour Mills Company, Ltd.
0.000%, 06/20/25 | | | 569,150 | |
| | | |
| | 400,000 | | | EUR | | Symrise, AG
0.238%, 06/20/24 | | | 519,424 | |
| | | |
| | 1,400,000 | | | | | Vinci, SA
0.375%, 02/16/22 | | | 1,727,334 | |
| | | | | | | | | | |
| | | | | | | | | 4,601,391 | |
| | | | | | | | | | |
| | | | | | Information Technology (25.6%) | | | | |
| | 1,205,000 | | | | | 8x8, Inc.*
0.500%, 02/01/24 | | | 1,228,516 | |
| | | |
| | 1,310,000 | | | | | Akamai Technologies, Inc.
0.125%, 05/01/25 | | | 1,468,746 | |
| | | |
| | | | | | Alteryx, Inc.* | | | | |
| | 664,000 | | | | | 0.500%, 08/01/24 | | | 615,465 | |
| | 655,000 | | | | | 1.000%, 08/01/26^ | | | 592,831 | |
| | | |
| | 670,000 | | | | | Coupa Software, Inc.*
0.125%, 06/15/25 | | | 764,487 | |
| | | |
| | 660,000 | | | | | DocuSign, Inc.
0.500%, 09/15/23 | | | 777,949 | |
| | | |
| | | | | | FireEye, Inc. | | | | |
| | 330,000 | | | | | 1.625%, 06/01/35 | | | 318,181 | |
| | 183,000 | | | | | 1.000%, 06/01/35 | | | 180,992 | |
| | | |
| | 455,000 | | | | | II-VI, Inc.
0.250%, 09/01/22 | | | 459,352 | |
| | | |
| | 385,000 | | | | | Inphi Corp.
0.750%, 09/01/21 | | | 533,674 | |
| | | |
| | 1,200,000 | | | | | Lenovo Group, Ltd.
3.375%, 01/24/24 | | | 1,305,042 | |
| | | |
| | 570,000 | | | | | Lumentum Holdings, Inc.^
0.250%, 03/15/24 | | | 719,049 | |
| | | |
| | 1,920,000 | | | | | Microchip Technology, Inc.
1.625%, 02/15/27 | | | 2,516,678 | |
| | | |
| | 291,000 | | | | | Micron Technology, Inc.~
2.125%, 02/15/33 | | | 1,266,719 | |
| | | |
| | 904,000 | | | | | New Relic, Inc.
0.500%, 05/01/23 | | | 871,198 | |
| | | |
| | 2,468,000 | | | | | NXP Semiconductors, NV
1.000%, 12/01/19 | | | 2,721,710 | |
| | | |
| | 1,325,000 | | | | | Okta, Inc.*
0.125%, 09/01/25 | | | 1,257,186 | |
| | | | | | | | | | |
PRINCIPAL AMOUNT | | | | | | | VALUE | |
| | | |
| | 380,000 | | | | | ON Semiconductor Corp.
1.000%, 12/01/20 | | $ | 461,715 | |
| | | |
| | 650,000 | | | | | Palo Alto Networks, Inc.
0.750%, 07/01/23 | | | 714,668 | |
| | | |
| | 305,000 | | | | | Pluralsight, Inc.*
0.375%, 03/01/24 | | | 267,618 | |
| | | |
| | 660,000 | | | | | Proofpoint, Inc.*
0.250%, 08/15/24 | | | 684,704 | |
| | | |
| | 670,000 | | | | | Q2 Holdings, Inc.*
0.750%, 06/01/26 | | | 712,696 | |
| | | |
| | 960,000 | | | | | Silicon Laboratories, Inc.
1.375%, 03/01/22 | | | 1,216,954 | |
| | | |
| | 550,000 | | | EUR | | SOITEC
0.000%, 06/28/23 | | | 754,862 | |
| | | |
| | 1,430,000 | | | | | Splunk, Inc.
1.125%, 09/15/25 | | | 1,587,700 | |
| | | |
| | 1,270,000 | | | | | Square, Inc.
0.500%, 05/15/23 | | | 1,407,122 | |
| | | |
| | 1,000,000 | | | | | STMicroelectronics, NV
0.000%, 07/03/22 | | | 1,244,240 | |
| | | |
| | 359,000 | | | | | Twilio, Inc.
0.250%, 06/01/23 | | | 546,005 | |
| | | |
| | 650,000 | | | | | Wix.com, Ltd.^
0.000%, 07/01/23 | | | 743,096 | |
| | | |
| | 1,870,000 | | | | | Workday, Inc.
0.250%, 10/01/22 | | | 2,383,867 | |
| | | |
| | 680,000 | | | | | Workiva, Inc.*
1.125%, 08/15/26 | | | 615,777 | |
| | | |
| | 1,877,000 | | | | | Xero Investments, Ltd.
2.375%, 10/04/23 | | | 2,315,965 | |
| | | |
| | 610,000 | | | | | Zendesk, Inc.
0.250%, 03/15/23 | | | 793,342 | |
| | | | | | | | | | |
| | | | | | | | | 34,048,106 | |
| | | | | | | | | | |
| | | | | | Materials (3.7%) | | | | |
| | 4,000,000 | | | | | BASF, SE
0.925%, 03/09/23 | | | 3,834,520 | |
| | | |
| | 50,000,000 | | | JPY | | Mitsubishi Chemical Holdings Corp.
0.000%, 03/29/24 | | | 479,630 | |
| | | |
| | 60,000,000 | | | JPY | | Teijin, Ltd.
0.000%, 12/10/21 | | | 663,175 | |
| | | | | | | | | | |
| | | | | | | | | 4,977,325 | |
| | | | | | | | | | |
| | | | | | Real Estate (2.7%) | | | | |
| | 1,900,000 | | | EUR | | Grand City Properties, SA
0.250%, 03/02/22 | | | 2,257,328 | |
| | | |
| | 525,000 | | | | | IH Merger Sub, LLC
3.500%, 01/15/22 | | | 723,167 | |
| | | |
| | 60,000,000 | | | JPY | | Relo Group, Inc.
0.000%, 03/22/21 | | | 575,120 | |
| | | | | | | | | | |
| | | | | | | | | 3,555,615 | |
| | | | | | | | | | |
| | | |
| | | | | | TOTAL CONVERTIBLE BONDS (Cost $98,337,445) | | | 100,140,902 | |
| | | | | | | | | | |
| | | | | | | | | | |
| | | | | | |
| See accompanying Notes to Schedule of Investments | | www.calamos.com | | | 101 | |
Global Convertible Fund Schedule of Investments October 31, 2019
| | | | | | | | | | |
PRINCIPAL AMOUNT | | | | | | | VALUE | |
|
| | SYNTHETIC CONVERTIBLE SECURITIES (8.8%) ¤ | |
| | U.S. Government and Agency Securities (8.1%) | |
| | | | | | United States Treasury Note | | | | |
| | 4,441,000 | | | | | 1.875%, 05/31/22 | | $ | 4,482,114 | |
| | 3,505,000 | | | | | 1.750%, 10/31/20 | | | 3,510,408 | |
| | 2,753,000 | | | | | 1.125%, 12/31/19^ | | | 2,751,011 | |
| | | | | | | | | | |
| | | | | | TOTAL U.S. GOVERNMENT AND AGENCY SECURITIES | | | 10,743,533 | |
| | | | | | | | | | |
NUMBER OF CONTRACTS/ NOTIONAL AMOUNT | | | | | | | VALUE | |
| | | | | | | | | | |
|
| | Purchased Options (0.7%)# | |
| | | | | | Consumer Discretionary (0.3%) | | | | |
| 122
2,155,374 |
| | | | Alibaba Group Holding, Ltd. Call, 03/20/20, Strike $185.00 | | | 127,185 | |
| | | |
| 17
3,482,909 |
| | | | Booking Holdings, Inc. Call, 01/17/20, Strike $1,920.00 | | | 300,050 | |
| | | | | | | | | | |
| | | | | | | | | 427,235 | |
| | | | | | | | | | |
| | | | | | Industrials (0.3%) | | | | |
| | | | | | Airbus, SE | | | | |
| 187
2,401,454 |
| | EUR | | Call, 03/20/20, Strike 130.00 | | | 153,397 | |
| 136
1,746,512 |
| | EUR | | Call, 12/20/19, Strike 120.00 | | | 161,616 | |
| | | |
| 64
1,532,160 |
| | EUR | | MTU Aero Engines Holdings, AG Call, 03/20/20, Strike 240.00 | | | 101,715 | |
| | | | | | | | | | |
| | | | | | | | | 416,728 | |
| | | | | | | | | | |
| | | | | | Information Technology (0.1%) | |
| 77
2,087,008 |
| | | | Lam Research Corp. Call, 01/17/20, Strike $280.00 | | | 82,390 | |
| | | | | | | | | | |
| | | |
| | | | | | TOTAL PURCHASED OPTIONS | | | 926,353 | |
| | | | | | | | | | |
| | | |
| | | | | | TOTAL SYNTHETIC CONVERTIBLE SECURITIES (Cost $11,751,567) | | | 11,669,886 | |
| | | | | | | | | | |
| | | | | | | | | | |
NUMBER OF SHARES | | | | | | | VALUE | |
|
| | CONVERTIBLE PREFERRED STOCKS (13.1%) | |
| | | | | | Financials (7.2%) | | | | |
| | 6,030 | | | | | Assurant, Inc.
6.500%, 03/15/21 | | | 753,569 | |
| | | |
| | 2,487 | | | | | Bank of America Corp.††
7.250% | | | 3,771,759 | |
| | | |
| | 13,755 | | | | | Virtus Investment Partners, Inc.
7.250%, 02/01/20 | | | 1,298,197 | |
| | | |
| | 2,530 | | | | | Wells Fargo & Company††
7.500% | | | 3,819,035 | |
| | | | | | | | | | |
| | | | | | | | | 9,642,560 | |
| | | | | | | | | | |
| | | | | | | | | | |
NUMBER OF SHARES | | | | | | | VALUE | |
| | | | | | | | | | |
| | | | | | Health Care (1.1%) | | | | |
| | 1,295 | | | | | Danaher Corp.
4.750%, 04/15/22 | | $ | 1,437,864 | |
| | | | | | | | | | |
| | | | | | Information Technology (1.6%) | |
| | 1,995 | | | | | Broadcom, Inc.
8.000%, 09/30/22 | | | 2,160,625 | |
| | | | | | | | | | |
| | | | | | Real Estate (0.4%) | | | | |
| | 425 | | | | | Crown Castle International Corp.
6.875%, 08/01/20 | | | 529,418 | |
| | | | | | | | | | |
| | | | | | Utilities (2.8%) | | | | |
| | 12,955 | | | | | American Electric Power Company, Inc.
6.125%, 03/15/22 | | | 712,395 | |
| | | |
| | 13,215 | | | | | Aqua America, Inc.
6.000%, 04/30/22 | | | 796,204 | |
| | | |
| | 13,250 | | | | | DTE Energy Company
6.250%, 11/01/22 | | | 673,431 | |
| | | |
| | | | | | Sempra Energy | | | | |
| | 6,535 | | | | | 6.750%, 07/15/21 | | | 759,302 | |
| | 6,415 | | | | | 6.000%, 01/15/21 | | | 744,333 | |
| | | | | | | | | | |
| | | | | | | | | 3,685,665 | |
| | | | | | | | | | |
| | | |
| | | | | | TOTAL CONVERTIBLE PREFERRED STOCKS (Cost $15,092,841) | | | 17,456,132 | |
| | | | | | | | | | |
| | | | | | | | | | |
PRINCIPAL AMOUNT | | | | | | | VALUE | |
|
| | BANK LOANS (0.3%)‡ | |
| | | | | | Financials (0.3%) | | | | |
| | 964,825 | | | EUR | | Steenbok Lux Finco 1 Sarl 0.000%, 12/31/21 5 mo. EURIBOR + 10.00% | | | 408,906 | |
| | | | | | | | | | |
| | | |
| | | | | | TOTAL BANK LOANS (Cost $453,900) | | | 408,906 | |
| | | | | | | | | | |
| | | | | | | | | | |
NUMBER OF SHARES | | | | | | | VALUE | |
|
| | SHORT TERM INVESTMENTS (2.9%) | |
| | 1,882,497 | | | | | Fidelity Prime Money Market Fund - Institutional Class,1.890%*** | | | 1,883,250 | |
| | | |
| | 1,883,055 | | | | | Morgan Stanley Institutional Liquidity Funds - Government Portfolio,
1.720%*** | | | 1,883,055 | |
| | | | | | | | | | |
| | | |
| | | | | | TOTAL SHORT TERM INVESTMENTS (Cost $3,766,294) | | | 3,766,305 | |
| | | | | | | | | | |
| | | | | | | | | | |
| | | | |
| 102 | | CALAMOS OPEN-END FAMILY OF FUNDS ANNUAL REPORT | | See accompanying Notes to Schedule of Investments |
Global Convertible Fund Schedule of Investments October 31, 2019
| | | | | | | | | | |
NUMBER OF SHARES/ PRINCIPAL
AMOUNT | | | | | | | VALUE | |
|
| INVESTMENT OF CASH COLLATERAL FOR SECURITIES
LOANED (2.8%) |
|
| | 3,755,500 | | | | | State Street Navigator Securities Lending Government Money Market Portfolio† (Cost $3,755,500) | | $ | 3,755,500 | |
| | | | | | | | | | |
| |
| TOTAL INVESTMENTS (103.2%)
(Cost $133,157,547) | | | 137,197,631 | |
| | | | | | | | | | |
| |
| | PAYABLE UPON RETURN OF SECURITIES ON LOAN(-2.8%) | | | (3,755,500 | ) |
| | | | | | | | | | |
| |
| | LIABILITIES, LESS OTHER ASSETS(-0.4%) | | | (508,743 | ) |
| | | | | | | | | | |
| |
| | NET ASSETS (100.0%) | | $ | 132,933,388 | |
| | | | | | | | | | |
NOTES TO SCHEDULE OF INVESTMENTS
| * | Securities issued and sold pursuant to a Rule 144A transaction are excepted from the registration requirement of the Securities Act of 1933, as amended. These securities may only be sold to qualified institutional buyers (“QIBs”), such as the Fund. Any resale of these securities must generally be effected through a sale that is registered under the Act or otherwise exempted from such registration requirements. |
| § | Securities exchangeable or convertible into securities of one or more entities that are different than the issuer. Each entity is identified in the parenthetical. |
| ^ | Security, or portion of security, is on loan. |
| ~ | Security, or portion of security, is segregated as collateral (or collateral for potential future transactions) for written options. The aggregate value of such securities is $17,412. |
| ¤ | The synthetic convertible securities strategy combines separate securities that together possess the economic characteristics similar to a convertible security. |
| # | Non-income producing security. |
| ‡ | Variable rate security. The rate shown is the rate in effect at October 31, 2019. |
| *** | The rate disclosed is the 7 day net yield as of October 31, 2019. |
| † | Represents investment of cash collateral received from securities on loan as of October 31, 2019. |
FOREIGN CURRENCY ABBREVIATIONS
| | |
| |
| EUR | | European Monetary Unit |
| |
| JPY | | Japanese Yen |
| |
| KRW | | South Korean Won |
Note: Value for securities denominated in foreign currencies is shown in U.S. dollars. The principal amount for such securities is shown in the respective foreign currency. The date on options represents the expiration date of the option contract. The option contract may be exercised at any date on or before the date shown. Bank loans generally are subject to mandatory and/or optional prepayment. As a result, the actual remaining maturity of bank loans may be substantially less than the stated maturities shown.
CURRENCY EXPOSURE
OCTOBER 31, 2019
| | | | | | | | |
| | | VALUE | | | % OF TOTAL
INVESTMENTS | |
| | |
| US Dollar | | $ | 115,300,495 | | | | 84.1% | |
| European Monetary Unit | | | 13,711,141 | | | | 10.0% | |
| | |
| Japanese Yen | | | 6,772,259 | | | | 4.9% | |
| South Korean Won | | | 1,413,736 | | | | 1.0% | |
| | |
| Total Investments | | $ | 137,197,631 | | | | 100.0% | |
Currency exposure may vary over time.
| | | | | | |
| See accompanying Notes to Financial Statements | | www.calamos.com | | | 103 | |
Timpani Small Cap Growth Fund Schedule of Investments October 31, 2019
| | | | | | | | | | |
NUMBER OF SHARES | | | | | | | VALUE | |
|
| | COMMON STOCKS (95.6%) | |
| | | | | | Communication Services (1.6%) | |
| | 15,654 | | | | | Cardlytics, Inc.# | | $ | 656,059 | |
| | | |
| | 31,369 | | | | | EverQuote, Inc. - Class A# | | | 636,791 | |
| | | | | | | | | | |
| | | | | | | | | 1,292,850 | |
| | | | | | | | | | |
| | | | | | Consumer Discretionary (21.3%) | |
| | 20,813 | | | | | Aaron’s, Inc. | | | 1,559,518 | |
| | | |
| | 2,306 | | | | | Asbury Automotive Group, Inc.# | | | 237,818 | |
| | | |
| | 43,033 | | | | | Boot Barn Holdings, Inc.# | | | 1,508,307 | |
| | | |
| | 42,495 | | | | | Century Communities, Inc.# | | | 1,282,074 | |
| | | |
| | 46,506 | | | | | Chegg, Inc.# | | | 1,425,874 | |
| | | |
| | 19,630 | | | | | Conn’s, Inc.# | | | 474,850 | |
| | | |
| | 31,939 | | | | | Funko, Inc. - Class A# | | | 574,902 | |
| | | |
| | 6,539 | | | | | Grand Canyon Education, Inc.# | | | 601,326 | |
| | | |
| | 17,827 | | | | | Kura Sushi USA, Inc. - Class A# | | | 328,908 | |
| | | |
| | 13,376 | | | | | LGI Homes, Inc.# | | | 1,049,748 | |
| | | |
| | 9,547 | | | | | Lithia Motors Inc- Class A | | | 1,503,462 | |
| | | |
| | 18,260 | | | | | Lovesac Company# | | | 298,186 | |
| | | |
| | 31,930 | | | | | Noodles & Company# | | | 170,187 | |
| | | |
| | 18,206 | | | | | Planet Fitness Inc- Class A# | | | 1,158,994 | |
| | | |
| | 137,434 | | | | | Rubicon Project, Inc.# | | | 1,168,189 | |
| | | |
| | 2,333 | | | | | Strategic Education, Inc. | | | 287,029 | |
| | | |
| | 19,281 | | | | | TopBuild Corp.# | | | 2,003,874 | |
| | | |
| | 46,010 | | | | | YETI Holdings, Inc.# | | | 1,532,593 | |
| | | | | | | | | | |
| | | | | | | | | 17,165,839 | |
| | | | | | | | | | |
| | | | | | Consumer Staples (1.8%) | |
| | 26,304 | | | | | elf Beauty, Inc.# | | | 441,907 | |
| | | |
| | 41,338 | | | | | Simply Good Foods Company# | | | 1,014,435 | |
| | | | | | | | | | |
| | | | | | | | | 1,456,342 | |
| | | | | | | | | | |
| | | | | | Energy (3.9%) | | | | |
| | 39,572 | | | | | Scorpio Tankers, Inc. | | | 1,258,785 | |
| | | |
| | 45,109 | | | | | World Fuel Services Corp. | | | 1,884,203 | |
| | | | | | | | | | |
| | | | | | | | | 3,142,988 | |
| | | | | | | | | | |
| | | | | | Financials (5.4%) | | | | |
| | 10,739 | | | | | Assetmark Financial Holdings, Inc.# | | | 294,678 | |
| | | |
| | 6,866 | | | | | eHealth, Inc.# | | | 474,029 | |
| | | |
| | 14,649 | | | | | Goosehead Insurance, Inc. - Class A | | | 749,736 | |
| | | |
| | 11,309 | | | | | Kinsale Capital Group, Inc. | | | 1,195,587 | |
| | | |
| | 2,378 | | | | | LendingTree, Inc.# | | | 855,723 | |
| | | |
| | 10,031 | | | | | LPL Financial Holdings, Inc. | | | 810,906 | |
| | | | | | | | | | |
| | | | | | | | | 4,380,659 | |
| | | | | | | | | | |
| | | | | | Health Care (22.9%) | | | | |
| | 18,391 | | | | | Addus HomeCare Corp.# | | | 1,548,706 | |
| | | |
| | 10,119 | | | | | Amedisys, Inc.# | | | 1,300,494 | |
| | | |
| | 11,266 | | | | | ANI Pharmaceuticals, Inc.# | | | 879,987 | |
| | | |
| | 27,349 | | | | | CareDx, Inc.# | | | 716,817 | |
| | | | | | | | | | |
NUMBER OF SHARES | | | | | | | VALUE | |
| | | |
| | 16,481 | | | | | Castle Biosciences, Inc.# | | $ | 387,963 | |
| | | |
| | 11,698 | | | | | Coherus Biosciences, Inc.# | | | 203,194 | |
| | | |
| | 21,136 | | | | | Cutera, Inc.# | | | 665,784 | |
| | | |
| | 5,792 | | | | | Ensign Group, Inc. | | | 244,712 | |
| | | |
| | 37,446 | | | | | Exagen, Inc.# | | | 563,937 | |
| | | |
| | 7,525 | | | | | Inspire Medical Systems, Inc.# | | | 458,875 | |
| | | |
| | 3,137 | | | | | Insulet Corp.# | | | 455,869 | |
| | | |
| | 26,391 | | | | | Joint Corp.# | | | 503,277 | |
| | | |
| | 11,201 | | | | | LHC Group, Inc.# | | | 1,242,975 | |
| | | |
| | 11,765 | | | | | Omnicell, Inc.# | | | 828,138 | |
| | | |
| | 77,777 | | | | | OptimizeRx Corp.# | | | 1,011,101 | |
| | | |
| | 11,368 | | | | | Pennant Group Inc/the Common Stock Usd.001# | | | 204,510 | |
| | | |
| | 2,479 | | | | | Penumbra, Inc.# | | | 386,650 | |
| | | |
| | 9,888 | | | | | PetIQ, Inc.# | | | 244,431 | |
| | | |
| | 8,156 | | | | | Phreesia, Inc.# | | | 241,662 | |
| | | |
| | 47,756 | | | | | R1 RCM, Inc.# | | | 507,646 | |
| | | |
| | 14,991 | | | | | Tactile Systems Technology, Inc.# | | | 680,891 | |
| | | |
| | 20,016 | | | | | Tandem Diabetes Care, Inc.# | | | 1,232,585 | |
| | | |
| | 12,538 | | | | | Teladoc Health, Inc.# | | | 960,411 | |
| | | |
| | 6,096 | | | | | US Physical Therapy, Inc. | | | 862,401 | |
| | | |
| | 14,715 | | | | | Veracyte, Inc.# | | | 337,415 | |
| | | |
| | 52,447 | | | | | Vericel Corp.# | | | 832,334 | |
| | | |
| | 97,010 | | | | | Zynex, Inc. | | | 896,373 | |
| | | | | | | | | | |
| | | | | | | | | 18,399,138 | |
| | | | | | | | | | |
| | | | | | Industrials (11.2%) | | | | |
| | 5,499 | | | | | Aerojet Rocketdyne Holdings, Inc.# | | | 237,722 | |
| | | |
| | 8,711 | | | | | Albany International Corp - Class A | | | 731,550 | |
| | | |
| | 4,560 | | | | | American Woodmark Corp.# | | | 452,170 | |
| | | |
| | 7,866 | | | | | Columbus McKinnon Corp. | | | 295,132 | |
| | | |
| | 14,311 | | | | | Cubic Corp. | | | 1,055,293 | |
| | | |
| | 29,862 | | | | | Federal Signal Corp. | | | 968,723 | |
| | | |
| | 2,254 | | | | | HEICO Corp. | | | 278,008 | |
| | | |
| | 9,189 | | | | | Knoll, Inc. | | | 245,714 | |
| | | |
| | 52,398 | | | | | LiqTech International, Inc.# | | | 379,362 | |
| | | |
| | 26,178 | | | | | MasTec, Inc.# | | | 1,647,643 | |
| | | |
| | 18,008 | | | | | Mercury Systems, Inc.# | | | 1,326,469 | |
| | | |
| | 11,077 | | | | | NV5 Global, Inc.# | | | 802,307 | |
| | | |
| | 6,604 | | | | | Trex Company, Inc.# | | | 580,426 | |
| | | | | | | | | | |
| | | | | | | | | 9,000,519 | |
| | | | | | | | | | |
| | | | | | Information Technology (25.4%) | |
| | 7,787 | | | | | Cabot Microelectronics Corp. | | | 1,176,772 | |
| | | |
| | 108,270 | | | | | Digital Turbine, Inc.# | | | 756,807 | |
| | | |
| | 26,684 | | | | | Diodes, Inc.# | | | 1,244,809 | |
| | | |
| | 4,462 | | | | | Euronet Worldwide, Inc.# | | | 624,992 | |
| | | |
| | 18,168 | | | | | Everbridge, Inc.# | | | 1,262,858 | |
| | | |
| | 29,130 | | | | | Five9, Inc.# | | | 1,617,006 | |
| | | | |
| 104 | | CALAMOS OPEN-END FAMILY OF FUNDS ANNUAL REPORT | | See accompanying Notes to Schedule of Investments |
Timpani Small Cap Growth Fund Schedule of Investments October 31, 2019
| | | | | | | | | | |
NUMBER OF SHARES | | | | | | | VALUE | |
| | | |
| | 28,882 | | | | | GDS Holdings, Ltd.# | | $ | 1,203,802 | |
| | | |
| | 4,301 | | | | | Globant, SA# | | | 401,111 | |
| | | |
| | 8,688 | | | | | Intelligent Systems Corp.# | | | 392,437 | |
| | | |
| | 40,317 | | | | | International Money Express, Inc.# | | | 617,656 | |
| | | |
| | 4,179 | | | | | J2 Global, Inc.# | | | 396,838 | |
| | | |
| | 38,726 | | | | | KEMET Corp. | | | 841,903 | |
| | | |
| | 27,758 | | | | | Knowles Corp.# | | | 599,018 | |
| | | |
| | 59,071 | | | | | Lattice Semiconductor Corp.# | | | 1,157,201 | |
| | | |
| | 2,603 | | | | | NICE-Systems, Ltd.# | | | 410,727 | |
| | | |
| | 10,654 | | | | | OneSpan, Inc.# | | | 199,336 | |
| | | |
| | 3,505 | | | | | Pegasystems, Inc. | | | 263,611 | |
| | | |
| | 14,537 | | | | | RealPage, Inc.# | | | 880,215 | |
| | | |
| | 10,976 | | | | | RingCentral, Inc. - Class A# | | | 1,772,844 | |
| | | |
| | 20,174 | | | | | Sapiens International Corp., NV | | | 426,277 | |
| | | |
| | 10,119 | | | | | ShotSpotter, Inc.# | | | 204,404 | |
| | | |
| | 41,931 | | | | | SVMK, Inc.# | | | 771,530 | |
| | | |
| | 121,117 | | | | | Telaria, Inc.# | | | 916,856 | |
| | | |
| | 16,124 | | | | | Viavi Solutions, Inc.# | | | 257,420 | |
| | | |
| | 22,492 | | | | | WNS Holdings, Ltd.# | | | 1,390,905 | |
| | | |
| | 16,125 | | | | | Workiva, Inc.# | | | 671,929 | |
| | | | | | | | | | |
| | | | | | | | | 20,459,264 | |
| | | | | | | | | | |
| | | | | | Materials (0.8%) | | | | |
| | 7,730 | | | | | Ingevity Corp.# | | | 650,943 | |
| | | | | | | | | | |
| | | | | | Real Estate (0.7%) | | | | |
| | 30,165 | | | | | Redfin Corp.# | | | 524,569 | |
| | | | | | | | | | |
| | | | | | Utilities (0.6%) | | | | |
| | 24,735 | | | | | AquaVenture Holdings, Ltd.# | | | 485,301 | |
| | | | | | | | | | |
| | | |
| | | | | | TOTAL COMMON STOCKS (Cost $60,718,235) | | | 76,958,412 | |
| | | | | | | | | | |
| | | | | | | | | | |
|
| | SHORT TERM INVESTMENTS (2.5%) | |
| | 1,001,923 | | | | | Fidelity Prime Money Market Fund - Institutional Class, 1.890%*** | | | 1,002,324 | |
| | | |
| | 1,001,875 | | | | | Morgan Stanley Institutional Liquidity Funds - Government Portfolio,
1.720%*** | | | 1,001,875 | |
| | | | | | | | | | |
| | | |
| | | | | | TOTAL SHORT TERM INVESTMENTS (Cost $2,004,162) | | | 2,004,199 | |
| | | | | | | | | | |
| |
| TOTAL INVESTMENTS (98.1%)
(Cost $62,722,397) | | | 78,962,611 | |
| | | | | | | | | | |
| |
| | OTHER ASSETS, LESS LIABILITIES (1.9%) | | | 1,496,213 | |
| | | | | | | | | | |
| |
| | NET ASSETS (100.0%) | | $ | 80,458,824 | |
| | | | | | | | | | |
NOTES TO SCHEDULE OF INVESTMENTS
| # | Non-income producing security. |
| *** | The rate disclosed is the 7 day net yield as of October 31, 2019. |
| | | | | | |
| See accompanying Notes to Financial Statements | | www.calamos.com | | | 105 | |
Timpani SMID Growth Fund Schedule of Investments October 31, 2019
| | | | | | | | | | |
NUMBER OF SHARES | | | | | | | VALUE | |
|
| | COMMON STOCKS (97.2%) | |
| | | | | | Communication Services (1.0%) | |
| | 1,594 | | | | | Cardlytics, Inc.# | | $ | 66,805 | |
| | | |
| | 1,280 | | | | | EverQuote, Inc. - Class A# | | | 25,984 | |
| | | | | | | | | | |
| | | | | | | | | 92,789 | |
| | | | | | | | | | |
| | | | | | Consumer Discretionary (21.3%) | |
| | 2,265 | | | | | Aaron’s, Inc. | | | 169,716 | |
| | | |
| | 223 | | | | | Asbury Automotive Group, Inc.# | | | 22,998 | |
| | | |
| | 4,547 | | | | | Boot Barn Holdings, Inc.# | | | 159,372 | |
| | | |
| | 642 | | | | | Bright Horizons Family Solutions, Inc.# | | | 95,350 | |
| | | |
| | 3,618 | | | | | Century Communities, Inc.# | | | 109,155 | |
| | | |
| | 4,943 | | | | | Chegg, Inc.# | | | 151,552 | |
| | | |
| | 2,097 | | | | | Conn’s, Inc.# | | | 50,726 | |
| | | |
| | 3,703 | | | | | Funko, Inc. - Class A# | | | 66,654 | |
| | | |
| | 912 | | | | | Grand Canyon Education, Inc.# | | | 83,868 | |
| | | |
| | 1,552 | | | | | LGI Homes, Inc.# | | | 121,801 | |
| | | |
| | 1,032 | | | | | Lithia Motors Inc- Class A | | | 162,519 | |
| | | |
| | 1,199 | | | | | Lovesac Company# | | | 19,580 | |
| | | |
| | 33 | | | | | NVR, Inc.# | | | 120,008 | |
| | | |
| | 2,482 | | | | | Planet Fitness Inc- Class A# | | | 158,004 | |
| | | |
| | 850 | | | | | Roku, Inc.# | | | 125,120 | |
| | | |
| | 2,649 | | | | | Rubicon Project, Inc.# | | | 22,517 | |
| | | |
| | 204 | | | | | Strategic Education, Inc. | | | 25,098 | |
| | | |
| | 1,589 | | | | | TopBuild Corp.# | | | 165,145 | |
| | | |
| | 5,010 | | | | | YETI Holdings, Inc.# | | | 166,883 | |
| | | | | | | | | | |
| | | | | | | | | 1,996,066 | |
| | | | | | | | | | |
| | | | | | Consumer Staples (1.8%) | | | | |
| | 2,806 | | | | | elf Beauty, Inc.# | | | 47,141 | |
| | | |
| | 4,806 | | | | | Simply Good Foods Company# | | | 117,939 | |
| | | | | | | | | | |
| | | | | | | | | 165,080 | |
| | | | | | | | | | |
| | | | | | Energy (3.7%) | | | | |
| | 4,598 | | | | | Scorpio Tankers, Inc. | | | 146,262 | |
| | | |
| | 4,775 | | | | | World Fuel Services Corp. | | | 199,452 | |
| | | | | | | | | | |
| | | | | | | | | 345,714 | |
| | | | | | | | | | |
| | | | | | Financials (6.8%) | | | | |
| | 1,256 | | | | | Assetmark Financial Holdings, Inc.# | | | 34,465 | |
| | | |
| | 319 | | | | | eHealth, Inc.# | | | 22,024 | |
| | | |
| | 1,266 | | | | | Goosehead Insurance, Inc. - Class A | | | 64,794 | |
| | | |
| | 1,232 | | | | | Kinsale Capital Group, Inc. | | | 130,247 | |
| | | |
| | 306 | | | | | LendingTree, Inc.# | | | 110,114 | |
| | | |
| | 2,108 | | | | | LPL Financial Holdings, Inc. | | | 170,411 | |
| | | |
| | 294 | | | | | MarketAxess Holdings, Inc. | | | 108,365 | |
| | | | | | | | | | |
| | | | | | | | | 640,420 | |
| | | | | | | | | | |
| | | | | | Health Care (17.8%) | | | | |
| | 1,081 | | | | | Addus HomeCare Corp.# | | | 91,031 | |
| | | |
| | 1,107 | | | | | Alnylam Pharmaceuticals, Inc.# | | | 96,021 | |
| | | | | | | | | | |
NUMBER OF SHARES | | | | | | | VALUE | |
| | | |
| | 1,075 | | | | | Amedisys, Inc.# | | $ | 138,159 | |
| | | |
| | 824 | | | | | ANI Pharmaceuticals, Inc.# | | | 64,363 | |
| | | |
| | 1,199 | | | | | CareDx, Inc.# | | | 31,426 | |
| | | |
| | 1,622 | | | | | Coherus Biosciences, Inc.# | | | 28,174 | |
| | | |
| | 1,325 | | | | | Cutera, Inc.# | | | 41,737 | |
| | | |
| | 1,323 | | | | | DexCom, Inc.# | | | 204,060 | |
| | | |
| | 673 | | | | | Ensign Group, Inc. | | | 28,434 | |
| | | |
| | 703 | | | | | Inspire Medical Systems, Inc.# | | | 42,869 | |
| | | |
| | 480 | | | | | Insulet Corp.# | | | 69,754 | |
| | | |
| | 1,056 | | | | | LHC Group, Inc.# | | | 117,184 | |
| | | |
| | 961 | | | | | Omnicell, Inc.# | | | 67,645 | |
| | | |
| | 1,442 | | | | | OptimizeRx Corp.# | | | 18,746 | |
| | | |
| | 1,170 | | | | | Pennant Group Inc/the Common Stock Usd.001# | | | 21,048 | |
| | | |
| | 440 | | | | | Penumbra, Inc.# | | | 68,627 | |
| | | |
| | 961 | | | | | PetIQ, Inc.# | | | 23,756 | |
| | | |
| | 951 | | | | | Phreesia, Inc.# | | | 28,178 | |
| | | |
| | 3,672 | | | | | R1 RCM, Inc.# | | | 39,033 | |
| | | |
| | 1,233 | | | | | Tactile Systems Technology, Inc.# | | | 56,003 | |
| | | |
| | 2,011 | | | | | Tandem Diabetes Care, Inc.# | | | 123,837 | |
| | | |
| | 1,185 | | | | | Teladoc Health, Inc.# | | | 90,771 | |
| | | |
| | 628 | | | | | US Physical Therapy, Inc. | | | 88,843 | |
| | | |
| | 1,074 | | | | | Veracyte, Inc.# | | | 24,627 | |
| | | |
| | 4,084 | | | | | Vericel Corp.# | | | 64,813 | |
| | | | | | | | | | |
| | | | | | | | | 1,669,139 | |
| | | | | | | | | | |
| | | | | | Industrials (13.6%) | | | | |
| | 532 | | | | | Aerojet Rocketdyne Holdings, Inc.# | | | 22,998 | |
| | | |
| | 1,126 | | | | | Albany International Corp - Class A | | | 94,562 | |
| | | |
| | 484 | | | | | American Woodmark Corp.# | | | 47,994 | |
| | | |
| | 1,205 | | | | | Copart, Inc.# | | | 99,581 | |
| | | |
| | 295 | | | | | CoStar Group, Inc.# | | | 162,108 | |
| | | |
| | 1,542 | | | | | Cubic Corp. | | | 113,707 | |
| | | |
| | 3,184 | | | | | Federal Signal Corp. | | | 103,289 | |
| | | |
| | 1,019 | | | | | HEICO Corp. | | | 125,684 | |
| | | |
| | 399 | | | | | Jacobs Engineering Group, Inc. | | | 37,338 | |
| | | |
| | 886 | | | | | Knoll, Inc. | | | 23,692 | |
| | | |
| | 2,800 | | | | | MasTec, Inc.# | | | 176,232 | |
| | | |
| | 2,211 | | | | | Mercury Systems, Inc.# | | | 162,862 | |
| | | |
| | 1,359 | | | | | Quanta Services, Inc. | | | 57,146 | |
| | | |
| | 545 | | | | | Trex Company, Inc.# | | | 47,900 | |
| | | | | | | | | | |
| | | | | | | | | 1,275,093 | |
| | | | | | | | | | |
| | | | | | Information Technology (29.5%) | | | | |
| | 1,018 | | | | | Black Knight, Inc.# | | | 65,356 | |
| | | |
| | 761 | | | | | Cabot Microelectronics Corp. | | | 115,002 | |
| | | |
| | 3,881 | | | | | Digital Turbine, Inc.# | | | 27,128 | |
| | | |
| | 2,863 | | | | | Diodes, Inc.# | | | 133,559 | |
| | | |
| | 394 | | | | | EPAM Systems, Inc.# | | | 69,328 | |
| | | | |
| 106 | | CALAMOS OPEN-END FAMILY OF FUNDS ANNUAL REPORT | | See accompanying Notes to Schedule of Investments |
Timpani SMID Growth Fund Schedule of Investments October 31, 2019
| | | | | | | | | | |
NUMBER OF SHARES | | | | | | | VALUE | |
| | | |
| | 848 | | | | | Euronet Worldwide, Inc.# | | $ | 118,779 | |
| | | |
| | 1,048 | | | | | Everbridge, Inc.# | | | 72,847 | |
| | | |
| | 2,939 | | | | | Five9, Inc.# | | | 163,144 | |
| | | |
| | 3,893 | | | | | GDS Holdings, Ltd.# | | | 162,260 | |
| | | |
| | 5,588 | | | | | Genpact, Ltd. | | | 218,882 | |
| | | |
| | 449 | | | | | Globant, SA# | | | 41,874 | |
| | | |
| | 350 | | | | | Intelligent Systems Corp.# | | | 15,810 | |
| | | |
| | 3,271 | | | | | International Money Express, Inc.# | | | 50,112 | |
| | | |
| | 390 | | | | | J2 Global, Inc.# | | | 37,034 | |
| | | |
| | 3,161 | | | | | KEMET Corp. | | | 68,720 | |
| | | |
| | 2,295 | | | | | Knowles Corp.# | | | 49,526 | |
| | | |
| | 5,951 | | | | | Lattice Semiconductor Corp.# | | | 116,580 | |
| | | |
| | 835 | | | | | Monolithic Power Systems, Inc. | | | 125,183 | |
| | | |
| | 1,141 | | | | | NICE-Systems, Ltd.# | | | 180,038 | |
| | | |
| | 715 | | | | | Okta, Inc.# | | | 77,985 | |
| | | |
| | 950 | | | | | Pegasystems, Inc. | | | 71,450 | |
| | | |
| | 1,203 | | | | | Proofpoint, Inc.# | | | 138,790 | |
| | | |
| | 1,180 | | | | | RealPage, Inc.# | | | 71,449 | |
| | | |
| | 1,902 | | | | | RingCentral, Inc. - Class A# | | | 307,211 | |
| | | |
| | 2,085 | | | | | Sapiens International Corp., NV | | | 44,056 | |
| | | |
| | 2,807 | | | | | SVMK, Inc.# | | | 51,649 | |
| | | |
| | 1,607 | | | | | Viavi Solutions, Inc.# | | | 25,656 | |
| | | |
| | 1,342 | | | | | WNS Holdings, Ltd.# | | | 82,989 | |
| | | |
| | 1,409 | | | | | Workiva, Inc.# | | | 58,713 | |
| | | | | | | | | | |
| | | | | | | | | 2,761,110 | |
| | | | | | | | | | |
| | | | | | Materials (0.6%) | | | | |
| | 647 | | | | | Ingevity Corp.# | | | 54,484 | |
| | | | | | | | | | |
| | | | | | Real Estate (0.6%) | | | | |
| | 2,926 | | | | | Redfin Corp.# | | | 50,883 | |
| | | | | | | | | | |
| | | | | | Utilities (0.5%) | | | | |
| | 2,413 | | | | | AquaVenture Holdings, Ltd.# | | | 47,343 | |
| | | | | | | | | | |
| | | |
| | | | | | TOTAL COMMON STOCKS (Cost $9,199,575) | | | 9,098,121 | |
| | | | | | | | | | |
| | | | | | | | | | |
|
| | SHORT TERM INVESTMENTS (0.2%) | |
| | 10,004 | | | | | Fidelity Prime Money Market Fund - Institutional Class, 1.890%*** | | | 10,008 | |
| | | |
| | 9,934 | | | | | Morgan Stanley Institutional Liquidity Funds - Government Portfolio, 1.720%*** | | | 9,934 | |
| | | | | | | | | | |
| | | |
| | | | | | TOTAL SHORT TERM INVESTMENTS (Cost $19,941) | | | 19,942 | |
| | | | | | | | | | |
| |
| TOTAL INVESTMENTS (97.4%)
(Cost $9,219,516) | | | 9,118,063 | |
| | | | | | | | | | |
| |
| | OTHER ASSETS, LESS LIABILITIES (2.6%) | | | 248,200 | |
| | | | | | | | | | |
| |
| | NET ASSETS (100.0%) | | $ | 9,366,263 | |
| | | | | | | | | | |
NOTES TO SCHEDULE OF INVESTMENTS
| # | Non-income producing security. |
| *** | The rate disclosed is the 7 day net yield as of October 31, 2019. |
| | | | | | |
| See accompanying Notes to Financial Statements | | www.calamos.com | | | 107 | |
Growth Fund Schedule of Investments October 31, 2019
| | | | | | | | | | |
NUMBER OF SHARES | | | | | | | VALUE | |
|
| | COMMON STOCKS (94.1%) | |
| | | | | | Communication Services (14.7%) | |
| | 64,800 | | | | | Alphabet, Inc. - Class A# | | $ | 81,570,240 | |
| | | |
| | 6,100 | | | CAD | | Cogeco Communications, Inc. | | | 527,283 | |
| | | |
| | 304,000 | | | | | Comcast Corp. - Class A~ | | | 13,625,280 | |
| | | |
| | 14,000 | | | | | Discovery, Inc. - Class A#^ | | | 377,370 | |
| | | |
| | 352,000 | | | | | Facebook, Inc. - Class A#~ | | | 67,460,800 | |
| | | |
| | 39,500 | | | | | Netflix, Inc.# | | | 11,352,695 | |
| | | |
| | 124,000 | | | | | Twitter, Inc.# | | | 3,716,280 | |
| | | |
| | 205,000 | | | | | Walt Disney Company | | | 26,633,600 | |
| | | |
| | 45,000 | | | | | Zynga, Inc. - Class A# | | | 277,650 | |
| | | | | | | | | | |
| | | | | | | | | 205,541,198 | |
| | | | | | | | | | |
| | | | | | Consumer Discretionary (13.8%) | |
| | 45,200 | | | | | Amazon.com, Inc.# | | | 80,305,032 | |
| | | |
| | 1,800 | | | | | Churchill Downs, Inc. | | | 233,982 | |
| | | |
| | 15,500 | | | CAD | | Dollarama, Inc. | | | 521,452 | |
| | | |
| | 2,500 | | | | | Expedia Group, Inc. | | | 341,650 | |
| | | |
| | 11,500 | | | | | frontdoor, Inc.# | | | 554,645 | |
| | | |
| | 62,500 | | | | | Home Depot, Inc. | | | 14,661,250 | |
| | | |
| | 3,000 | | | | | Lithia Motors Inc- Class A | | | 472,440 | |
| | | |
| | 125,500 | | | | | Lowe’s Companies, Inc. | | | 14,007,055 | |
| | | |
| | 87,900 | | | | | Lululemon Athletica, Inc.# | | | 17,955,333 | |
| | | |
| | 89,500 | | | | | McDonald’s Corp.~ | | | 17,604,650 | |
| | | |
| | 493,000 | | | | | MGM Resorts International~ | | | 14,050,500 | |
| | | |
| | 5,000 | | | | | New Oriental Education & Technology Group, Inc.# | | | 610,300 | |
| | | |
| | 115,500 | | | | | Nike, Inc. - Class B~ | | | 10,343,025 | |
| | | |
| | 166,500 | | | | | Royal Caribbean Cruises, Ltd. | | | 18,120,195 | |
| | | |
| | 10,600 | | | | | Toll Brothers, Inc. | | | 421,562 | |
| | | |
| | 120,080 | | | | | Under Armour, Inc., Class A#^ | | | 2,479,652 | |
| | | |
| | 7,600 | | | | | Wyndham Destinations, Inc. | | | 352,716 | |
| | | | | | | | | | |
| | | | | | | | | 193,035,439 | |
| | | | | | | | | | |
| | | | | | Consumer Staples (3.6%) | | | | |
| | 188,500 | | | | | Coca-Cola Company | | | 10,260,055 | |
| | | |
| | 72,000 | | | | | Constellation Brands, Inc. - Class A | | | 13,703,760 | |
| | | |
| | 15,000 | | | CAD | | Empire Company, Ltd. | | | 398,261 | |
| | | |
| | 5,600 | | | | | Hershey Company | | | 822,472 | |
| | | |
| | 107,500 | | | | | Lamb Weston Holdings, Inc.~ | | | 8,389,300 | |
| | | |
| | 136,500 | | | | | Walmart, Inc. | | | 16,005,990 | |
| | | | | | | | | | |
| | | | | | | | | 49,579,838 | |
| | | | | | | | | | |
| | | | | | Energy (1.9%) | | | | |
| | 172,000 | | | | | ConocoPhillips | | | 9,494,400 | |
| | | |
| | 3,900 | | | | | CVR Energy, Inc. | | | 184,938 | |
| | | |
| | 242,000 | | | | | Exxon Mobil Corp. | | | 16,351,940 | |
| | | | | | | | | | |
| | | | | | | | | 26,031,278 | |
| | | | | | | | | | |
| | | | | | | | | | |
NUMBER OF SHARES | | | | | | | VALUE | |
| | | | | | | | | | |
| | | | | | Financials (5.6%) | | | | |
| | 20,700 | | | | | Arch Capital Group, Ltd.# | | $ | 864,432 | |
| | | |
| | 36,000 | | | | | Ares Capital Corp.^ | | | 658,800 | |
| | | |
| | 481,500 | | | | | Bank of America Corp. | | | 15,056,505 | |
| | | |
| | 256,500 | | | | | Cboe Global Markets, Inc.~ | | | 29,535,975 | |
| | | |
| | 5,000 | | | | | Cincinnati Financial Corp. | | | 566,050 | |
| | | |
| | 2,200 | | | | | Discover Financial Services | | | 176,572 | |
| | | |
| | 13,900 | | | | | Essent Group, Ltd. | | | 724,051 | |
| | | |
| | 12,500 | | | | | Hartford Financial Services Group, Inc. | | | 713,500 | |
| | | |
| | 144,000 | | | | | Intercontinental Exchange, Inc.~ | | | 13,582,080 | |
| | | |
| | 8,090 | | | | | LPL Financial Holdings, Inc. | | | 653,996 | |
| | | |
| | 18,000 | | | | | Radian Group, Inc. | | | 451,800 | |
| | | |
| | 1,100 | | | | | RenaissanceRe Holdings, Ltd. | | | 205,898 | |
| | | |
| | 267,500 | | | | | US Bancorp | | | 15,252,850 | |
| | | | | | | | | | |
| | | | | | | | | 78,442,509 | |
| | | | | | | | | | |
| | | | | | Health Care (15.0%) | | | | |
| | 93,000 | | | CHF | | Alcon, Inc.# | | | 5,499,845 | |
| | | |
| | 247,000 | | | | | Alexion Pharmaceuticals, Inc.#~ | | | 26,033,800 | |
| | | |
| | 11,000 | | | | | Arrowhead Pharmaceuticals, Inc.#^ | | | 440,550 | |
| | | |
| | 354,000 | | | | | Baxter International, Inc. | | | 27,151,800 | |
| | | |
| | 11,500 | | | | | Bruker Corp. | | | 511,750 | |
| | | |
| | 13,000 | | | | | Horizon Therapeutics, PLC# | | | 375,830 | |
| | | |
| | 121,000 | | | | | Humana, Inc. | | | 35,598,200 | |
| | | |
| | 1,400 | | | | | IDEXX Laboratories, Inc.# | | | 399,014 | |
| | | |
| | 4,700 | | | | | Incyte Corp.# | | | 394,424 | |
| | | |
| | 24,000 | | | | | Inovalon Holdings, Inc. Class A#^ | | | 375,120 | |
| | | |
| | 141,000 | | | | | Johnson & Johnson~ | | | 18,617,640 | |
| | | |
| | 124,500 | | | | | Laboratory Corp. of America Holdings#~ | | | 20,513,865 | |
| | | |
| | 3,000 | | | | | McKesson Corp. | | | 399,000 | |
| | | |
| | 128,500 | | | | | Medtronic, PLC | | | 13,993,650 | |
| | | |
| | 174,000 | | | | | Merck & Company, Inc. | | | 15,078,840 | |
| | | |
| | 535,000 | | | | | Pfizer, Inc.~ | | | 20,527,950 | |
| | | |
| | 1,100 | | | | | Teleflex, Inc. | | | 382,151 | |
| | | |
| | 92,000 | | | | | UnitedHealth Group, Inc.~ | | | 23,248,400 | |
| | | |
| | 3,200 | | | | | Veeva Systems, Inc., Class A# | | | 453,856 | |
| | | | | | | | | | |
| | | | | | | | | 209,995,685 | |
| | | | | | | | | | |
| | | | | | Industrials (13.7%) | | | | |
| | 10,000 | | | | | Aerojet Rocketdyne Holdings, Inc.# | | | 432,300 | |
| | | |
| | 5,000 | | | | | AGCO Corp. | | | 383,450 | |
| | | |
| | 6,500 | | | CAD | | Air Canada# | | | 231,456 | |
| | | |
| | 353,500 | | | | | Air Lease Corp. | | | 15,546,930 | |
| | | |
| | 11,000 | | | | | Arconic, Inc. | | | 302,170 | |
| | | |
| | 74,000 | | | | | Boeing Company | | | 25,153,340 | |
| | | |
| | 3,500 | | | | | Carlisle Companies, Inc. | | | 532,945 | |
| | | |
| | 387,600 | | | | | Delta Air Lines, Inc.~ | | | 21,349,008 | |
| | | | |
| 108 | | CALAMOS OPEN-END FAMILY OF FUNDS ANNUAL REPORT | | See accompanying Notes to Schedule of Investments |
Growth Fund Schedule of Investments October 31, 2019
| | | | | | | | | | |
NUMBER OF SHARES | | | | | | | VALUE | |
| | | |
| | 4,000 | | | | | Dover Corp. | | $ | 415,560 | |
| | | |
| | 161,000 | | | | | Emerson Electric Company~ | | | 11,294,150 | |
| | | |
| | 8,000 | | | | | Herman Miller, Inc. | | | 372,000 | |
| | | |
| | 5,100 | | | | | Hexcel Corp. | | | 380,562 | |
| | | |
| | 83,500 | | | | | Honeywell International, Inc. | | | 14,422,955 | |
| | | |
| | 3,800 | | | | | John Bean Technologies Corp. | | | 390,526 | |
| | | |
| | 150,400 | | | | | L3Harris Technologies, Inc. | | | 31,029,024 | |
| | | |
| | 152,000 | | | | | Lyft, Inc. - Class A#^ | | | 6,298,880 | |
| | | |
| | 6,500 | | | | | MasTec, Inc.# | | | 409,110 | |
| | | |
| | 127,000 | | | | | Raytheon Company~ | | | 26,950,670 | |
| | | |
| | 7,000 | | | | | SkyWest, Inc. | | | 416,850 | |
| | | |
| | 800 | | | | | TransDigm Group, Inc. | | | 421,024 | |
| | | |
| | 172,000 | | | | | TransUnion~ | | | 14,210,640 | |
| | | |
| | 80,700 | | | | | United Airlines Holdings, Inc.# | | | 7,330,788 | |
| | | |
| | 123,000 | | | | | Waste Management, Inc. | | | 13,801,830 | |
| | | | | | | | | | |
| | | | | | | | | 192,076,168 | |
| | | | | | | | | | |
| | | | | | Information Technology (23.2%) | |
| | 8,030 | | | | | Akamai Technologies, Inc.# | | | 694,595 | |
| | | |
| | 3,600 | | | | | Ansys, Inc.# | | | 792,540 | |
| | | |
| | 6,400 | | | | | Aspen Technology, Inc.# | | | 736,704 | |
| | | |
| | 11,180 | | | | | Booz Allen Hamilton Holding Corp. | | | 786,736 | |
| | | |
| | 29,800 | | | | | Broadcom, Inc. | | | 8,726,930 | |
| | | |
| | 2,600 | | | | | CACI International, Inc. - Class A# | | | 581,750 | |
| | | |
| | 12,500 | | | | | Cadence Design Systems, Inc.# | | | 816,875 | |
| | | |
| | 6,300 | | | | | CDW Corp. | | | 805,833 | |
| | | |
| | 3,710 | | | | | CyberArk Software, Ltd.# | | | 376,862 | |
| | | |
| | 131,500 | | | | | DocuSign, Inc.# | | | 8,703,985 | |
| | | |
| | 2,800 | | | | | EPAM Systems, Inc.# | | | 492,688 | |
| | | |
| | 212,500 | | | | | Fidelity National Information Services, Inc. | | | 27,999,000 | |
| | | |
| | 185,500 | | | | | First Solar, Inc.#^ | | | 9,607,045 | |
| | | |
| | 3,180 | | | | | Fortinet, Inc.# | | | 259,361 | |
| | | |
| | 18,800 | | | | | Genpact, Ltd. | | | 736,396 | |
| | | |
| | 62,500 | | | | | Global Payments, Inc. | | | 10,573,750 | |
| | | |
| | 9,200 | | | | | Keysight Technologies, Inc.# | | | 928,372 | |
| | | |
| | 5,000 | | | | | Leidos Holdings, Inc. | | | 431,150 | |
| | | |
| | 79,000 | | | | | Microchip Technology, Inc.^ | | | 7,448,910 | |
| | | |
| | 748,500 | | | | | Microsoft Corp.~ | | | 107,312,445 | |
| | | |
| | 2,300 | | | | | NICE-Systems, Ltd.#^ | | | 362,917 | |
| | | |
| | 85,000 | | | | | NVIDIA Corp. | | | 17,086,700 | |
| | | |
| | 3,600 | | | | | Paylocity Holding Corp.# | | | 369,360 | |
| | | |
| | 66,500 | | | | | PayPal Holdings, Inc.# | | | 6,922,650 | |
| | | |
| | 15,000 | | | | | Perspecta, Inc. | | | 398,100 | |
| | | |
| | 2,800 | | | | | RingCentral, Inc. - Class A# | | | 452,256 | |
| | | |
| | 127,500 | | | | | Salesforce.com, Inc.# | | | 19,952,475 | |
| | | |
| | 524,000 | | | | | Slack Technologies, Inc. - Class A#^ | | | 11,528,000 | |
| | | |
| | 2,100 | | | | | Splunk, Inc.# | | | 251,916 | |
| | | | | | | | | | |
NUMBER OF SHARES | | | | | | | VALUE | |
| | | |
| | 2,100 | | | | | Synopsys, Inc.# | | $ | 285,075 | |
| | | |
| | 15,000 | | | | | Teradyne, Inc. | | | 918,300 | |
| | | |
| | 125,000 | | | | | Twilio, Inc. - Class A#^ | | | 12,070,000 | |
| | | |
| | 2,400 | | | | | Universal Display Corp. | | | 480,432 | |
| | | |
| | 3,700 | | | | | VeriSign, Inc.# | | | 703,074 | |
| | | |
| | 273,000 | | | | | Visa, Inc. - Class A~ | | | 48,828,780 | |
| | | |
| | 1,940 | | | | | Zebra Technologies Corp. - Class A# | | | 461,468 | |
| | | |
| | 201,500 | | | | | Zendesk, Inc.# | | | 14,235,975 | |
| | | | | | | | | | |
| | | | | | | | | 324,119,405 | |
| | | | | | | | | | |
| | | | | | Materials (2.6%) | | | | |
| | 43,000 | | | | | Air Products & Chemicals, Inc. | | | 9,170,180 | |
| | | |
| | 11,500 | | | | | Ardagh Group, SA | | | 214,705 | |
| | | |
| | 54,000 | | | CAD | | Centerra Gold, Inc.# | | | 460,421 | |
| | | |
| | 135,500 | | | | | Linde, PLC | | | 26,876,425 | |
| | | | | | | | | | |
| | | | | | | | | 36,721,731 | |
| | | | | | | | | | |
| | | |
| | | | | | TOTAL COMMON STOCKS (Cost $986,100,559) | | | 1,315,543,251 | |
| | | | | | | | | | |
| | | | | | | | | | |
|
| | EXCHANGE-TRADED FUNDS (0.2%) | |
| | | | | | Other (0.2%) | | | | |
| | 17,000 | | | | | iShares Edge MSCI Min Vol USA ETF^ | | | 1,087,150 | |
| | | |
| | 10,670 | | | | | iShares U.S. Real Estate ETF^ | | | 1,005,754 | |
| | | | | | | | | | |
| | | |
| | | | | | TOTAL EXCHANGE-TRADED FUNDS (Cost $1,970,387) | | | 2,092,904 | |
| | | | | | | | | | |
| | | | | | | | | | |
|
| | INVESTMENTS IN AFFILIATED FUND (0.4%) | |
| | | | | | Other (0.4%) | | | | |
| | 555,115 | | | | | Calamos Short-Term Bond Fund - Class I (Cost $5,540,119) | | | 5,662,175 | |
| | | | | | | | | | |
| | | | | | | | | | |
NUMBER OF CONTRACTS/ NOTIONAL AMOUNT | | | | | | | VALUE | |
|
| | PURCHASED OPTIONS (0.0%)# | |
| | | | | | Communication Services (0.0%) | |
| 1,250
23,956,250 |
| | | | Facebook, Inc. Put, 11/01/19, Strike $180.00 | | | 4,375 | |
| | | | | | | | | | |
| | | | | | Other (0.0%) | | | | |
| | | | | | CBOE Volatility Index | | | | |
| 300
396,600 |
| | | | Call, 01/22/20, Strike $16.00 | | | 93,000 | |
| 210
277,620 |
| | | | Call, 01/22/20, Strike $14.00 | | | 89,250 | |
| | | | | | | | | | |
| | | | | | | | | 182,250 | |
| | | | | | | | | | |
| | | |
| | | | | | TOTAL PURCHASED OPTIONS (Cost $559,328) | | | 186,625 | |
| | | | | | | | | | |
| | | | | | | | | | |
| | | | | | |
| See accompanying Notes to Schedule of Investments | | www.calamos.com | | | 109 | |
Growth Fund Schedule of Investments October 31, 2019
| | | | | | | | | | |
NUMBER OF SHARES | | | | | | | VALUE | |
|
| | SHORT TERM INVESTMENTS (5.5%) | |
| | 38,248,999 | | | | | Fidelity Prime Money Market Fund - Institutional Class, 1.890%*** | | $ | 38,264,298 | |
| | | |
| | 38,212,264 | | | | | Morgan Stanley Institutional Liquidity Funds - Government Portfolio,
1.720%*** | | | 38,212,264 | |
| | | | | | | | | | |
| | | |
| | | | | | TOTAL SHORT TERM INVESTMENTS (Cost $76,475,588) | | | 76,476,562 | |
| | | | | | | | | | |
| | | | | | | | | | |
NUMBER OF SHARES/ PRINCIPAL
AMOUNT | | | | | | | VALUE | |
|
| INVESTMENT OF CASH COLLATERAL FOR SECURITIES
LOANED (2.1%) |
|
| | 8,401,922 | | | | | Fidelity Prime Money Market Fund - Institutional Class, 1.890%***† | | | 8,401,922 | |
| | | |
| | 21,309,227 | | | | | State Street Navigator Securities Lending Government Money Market Portfolio† | | | 21,309,227 | |
| | | | | | | | | | |
| | | |
| | | | | | TOTAL INVESTMENT OF CASH COLLATERAL FOR SECURITIES LOANED (Cost $29,711,149) | | | 29,711,149 | |
| | | | | | | | | | |
| |
| TOTAL INVESTMENTS (102.3%)
(Cost $1,100,357,130) | | | 1,429,672,666 | |
| | | | | | | | | | |
| |
| | PAYABLE UPON RETURN OF SECURITIES ON LOAN(-2.1%) | | | (29,711,149 | ) |
| | | | | | | | | | |
| |
| | LIABILITIES, LESS OTHER ASSETS(-0.2%) | | | (2,286,646 | ) |
| | | | | | | | | | |
| |
| | NET ASSETS (100.0%) | | $ | 1,397,674,871 | |
| | | | | | | | | | |
| | | | | | | | | | |
NUMBER OF CONTRACTS/ NOTIONAL AMOUNT | | | | | | | VALUE | |
|
| | WRITTEN OPTIONS(-0.1%)# | |
| | | | | | Consumer Discretionary (0.0%) | | | | |
| 100
17,766,600 |
| | | | Amazon.com, Inc. Call, 12/20/19, Strike $2,000.00 | | | (29,750 | ) |
| | | | | | | | | | |
| | | | | | Information Technology(-0.1%) | | | | |
| 630
6,083,280 |
| | | | Twilio, Inc. Put, 11/01/19, Strike $108.00 | | | (721,350 | ) |
| | | | | | | | | | |
| | | |
| | | | | | TOTAL WRITTEN OPTIONS (Premium $645,442) | | $ | (751,100 | ) |
| | | | | | | | | | |
NOTES TO SCHEDULE OF INVESTMENTS
| # | Non-income producing security. |
| ~ | Security, or portion of security, is segregated as collateral (or potential collateral for future transactions) for written options. The aggregate value of such securities is $27,436,465. |
| ^ | Security, or portion of security, is on loan. |
| *** | The rate disclosed is the 7 day net yield as of October 31, 2019. |
| † | Represents investment of cash collateral received from securities on loan as of October 31, 2019. |
FOREIGN CURRENCY ABBREVIATIONS
| | |
| |
| CAD | | Canadian Dollar |
| |
| CHF | | Swiss Franc |
Note: Value for securities denominated in foreign currencies is shown in U.S. dollars. The date on options represents the expiration date of the option contract. The option contract may be exercised at any date on or before the date shown.
| | | | |
| 110 | | CALAMOS OPEN-END FAMILY OF FUNDS ANNUAL REPORT | | See accompanying Notes to Financial Statements |
Growth and Income Fund Schedule of Investments October 31, 2019
| | | | | | | | | | |
PRINCIPAL AMOUNT | | | | | | | VALUE | |
|
| | CORPORATE BONDS (3.0%) | |
| | | | | | Communication Services (0.5%) | |
| | 9,865,000 | | | | | Alphabet, Inc.
3.375%, 02/25/24 | | $ | 10,502,871 | |
| | | | | | | | | | |
| | | | | | Consumer Discretionary (1.3%) | |
| | 5,153,000 | | | | | Dana, Inc.
5.500%, 12/15/24 | | | 5,302,669 | |
| | | |
| | 9,900,000 | | | | | Home Depot, Inc.^
2.700%, 04/01/23 | | | 10,196,554 | |
| | | |
| | 6,716,000 | | | | | L Brands, Inc.
5.625%, 02/15/22 | | | 7,114,057 | |
| | | |
| | 2,429,000 | | | | | Lowe’s Companies, Inc.^
3.875%, 09/15/23 | | | 2,582,914 | |
| | | | | | | | | | |
| | | | | | | | | 25,196,194 | |
| | | | | | | | | | |
| | | | | | Consumer Staples (0.5%) | |
| | 9,865,000 | | | | | Walmart, Inc.
3.300%, 04/22/24 | | | 10,439,291 | |
| | | | | | | | | | |
| | | | | | Financials (0.3%) | |
| | 4,950,000 | | | | | Berkshire Hathaway, Inc.
2.750%, 03/15/23 | | | 5,103,103 | |
| | | | | | | | | | |
| | | | | | Health Care (0.1%) | |
| | 3,000,000 | | | | | Universal Health Services, Inc.*
4.750%, 08/01/22 | | | 3,041,715 | |
| | | | | | | | | | |
| | | | | | Information Technology (0.3%) | |
| | 4,935,000 | | | | | Apple, Inc.^
3.450%, 05/06/24 | | | 5,267,644 | |
| | | | | | | | | | |
| | | |
| | | | | | TOTAL CORPORATE BONDS (Cost $57,909,001) | | | 59,550,818 | |
| | | | | | | | | | |
| | | | | | | | | | |
|
| | CONVERTIBLE BONDS (13.1%) | |
| | | | | | Communication Services (3.1%) | |
| | 6,600,000 | | | | | GCI Liberty, Inc.*
1.750%, 09/30/46 | | | 8,873,865 | |
| | | |
| | 3,000,000 | | | | | IAC FinanceCo 2, Inc.^*
0.875%, 06/15/26 | | | 3,230,040 | |
| | | |
| | 2,500,000 | | | | | IAC Financeco 3, Inc.*
2.000%, 01/15/30 | | | 2,796,875 | |
| | | |
| | | | | | Liberty Media Corp. | | | | |
| | 9,685,000 | | | | | 2.250%, 09/30/46 | | | 5,672,505 | |
| | 6,963,000 | | | | | 1.375%, 10/15/23 | | | 8,741,037 | |
| | | |
| | 5,125,000 | | | | | Liberty Media Corp. (Sirius XM Holdings, Inc.)*§
2.125%, 03/31/48 | | | 5,293,203 | |
| | | |
| | 8,050,000 | | | | | Liberty Media Corp. / Liberty Formula One
1.000%, 01/30/23 | | | 10,201,362 | |
| | | |
| | 2,090,000 | | | | | Live Nation Entertainment, Inc.
2.500%, 03/15/23 | | | 2,552,444 | |
| | | |
| | 3,937,000 | | | | | Snap, Inc.*
0.750%, 08/01/26 | | | 3,993,161 | |
| | | | | | | | | | |
PRINCIPAL AMOUNT | | | | | | | VALUE | |
| | | |
| | 5,150,000 | | | | | Twitter, Inc.
0.250%, 06/15/24 | | $ | 4,922,679 | |
| | | |
| | 5,000,000 | | | | | Zynga, Inc.*
0.250%, 06/01/24 | | | 5,138,750 | |
| | | | | | | | | | |
| | | | | | | | | 61,415,921 | |
| | | | | | | | | | |
| | | | | | Consumer Discretionary (1.4%) | |
| | 4,450,000 | | | | | Booking Holdings, Inc.
0.350%, 06/15/20 | | | 6,938,017 | |
| | | |
| | 1,856,000 | | | | | Chegg, Inc.*
0.125%, 03/15/25 | | | 1,736,492 | |
| | | |
| | 2,150,000 | | | | | DISH Network Corp.
3.375%, 08/15/26 | | | 2,007,767 | |
| | | |
| | 4,025,000 | | | | | Etsy, Inc.^*
0.125%, 10/01/26 | | | 3,679,333 | |
| | | |
| | 3,025,000 | | | | | Guess, Inc.*
2.000%, 04/15/24 | | | 2,899,750 | |
| | | |
| | 6,070,000 | | | | | Tesla, Inc.
2.000%, 05/15/24 | | | 7,438,906 | |
| | | |
| | 3,152,000 | | | | | Winnebago Industries, Inc.
1.500%, 04/01/25 | | | 3,215,040 | |
| | | | | | | | | | |
| | | | | | | | | 27,915,305 | |
| | | | | | | | | | |
| | | | | | Energy (0.3%) | |
| | 5,000,000 | | | | | TOTAL, SA
0.500%, 12/02/22 | | | 5,264,825 | |
| | | | | | | | | | |
| | | | | | Financials (1.2%) | |
| | 3,950,000 | | | | | Ares Capital Corp.^
4.625%, 03/01/24 | | | 4,187,040 | |
| | | |
| | 10,300,000 | | | | | JPMorgan Chase Bank, N.A.
0.000%, 12/30/20 | | | 11,869,462 | |
| | | |
| | 7,850,000 | | | | | JPMorgan Chase Financial Company, LLC (Voya Financial, Inc.)*§
0.250%, 05/01/23 | | | 8,007,981 | |
| | | | | | | | | | |
| | | | | | | | | 24,064,483 | |
| | | | | | | | | | |
| | | | | | Health Care (1.1%) | |
| | 1,750,000 | | | | | BioMarin Pharmaceutical, Inc.
1.500%, 10/15/20 | | | 1,835,470 | |
| | | |
| | 4,700,000 | | | | | CONMED Corp.*
2.625%, 02/01/24 | | | 6,439,752 | |
| | | |
| | 4,750,000 | | | | | Exact Sciences Corp.
0.375%, 03/15/27 | | | 5,098,317 | |
| | | |
| | 4,920,000 | | | | | Insulet Corp.*
0.375%, 09/01/26 | | | 4,709,006 | |
| | | |
| | 1,600,000 | | | | | Neurocrine Biosciences, Inc.
2.250%, 05/15/24 | | | 2,337,600 | |
| | | |
| | 2,699,000 | | | | | Repligen Corp.^
0.375%, 07/15/24 | | | 2,716,665 | |
| | | | | | | | | | |
| | | | | | | | | 23,136,810 | |
| | | | | | | | | | |
| | | | | | Industrials (0.2%) | |
| | 3,950,000 | | | | | Air Transport Services Group, Inc.
1.125%, 10/15/24 | | | 3,650,155 | |
| | | | | | | | | | |
| | | | | | |
| See accompanying Notes to Schedule of Investments | | www.calamos.com | | | 111 | |
Growth and Income Fund Schedule of Investments October 31, 2019
| | | | | | | | | | |
PRINCIPAL AMOUNT | | | | | | | VALUE | |
| | | | | | | | | | |
| | | | | | Information Technology (4.8%) | |
| | | | | | Akamai Technologies, Inc. | | | | |
| | 4,605,000 | | | | | 0.375%, 09/01/27* | | $ | 4,591,669 | |
| | 1,727,000 | | | | | 0.125%, 05/01/25^ | | | 1,936,278 | |
| | | |
| | 3,700,000 | | | | | Coupa Software, Inc.*
0.125%, 06/15/25 | | | 4,221,792 | |
| | | |
| | 2,625,000 | | | | | DocuSign, Inc.^
0.500%, 09/15/23 | | | 3,094,114 | |
| | | |
| | 2,000,000 | | | | | Envestnet, Inc.
1.750%, 12/15/19 | | | 2,048,730 | |
| | | |
| | 2,316,000 | | | | | Euronet Worldwide, Inc.^*
0.750%, 03/15/49 | | | 2,638,526 | |
| | | |
| | 1,760,000 | | | | | II-VI, Inc.
0.250%, 09/01/22 | | | 1,776,834 | |
| | | |
| | 6,000,000 | | | | | Intel Corp.
3.250%, 08/01/39 | | | 16,626,930 | |
| | | |
| | 4,285,000 | | | | | Lumentum Holdings, Inc.^
0.250%, 03/15/24 | | | 5,405,485 | |
| | | |
| | 6,200,000 | | | | | Microchip Technology, Inc.
1.625%, 02/15/27 | | | 8,126,774 | |
| | | |
| | 3,775,000 | | | | | NXP Semiconductors, NV
1.000%, 12/01/19 | | | 4,163,070 | |
| | | |
| | 4,920,000 | | | | | Okta, Inc.*
0.125%, 09/01/25 | | | 4,668,194 | |
| | | |
| | 4,285,000 | | | | | ON Semiconductor Corp.
1.000%, 12/01/20 | | | 5,206,446 | |
| | | |
| | 2,780,000 | | | | | Palo Alto Networks, Inc.
0.750%, 07/01/23 | | | 3,056,582 | |
| | | |
| | 4,960,000 | | | | | Proofpoint, Inc.*
0.250%, 08/15/24 | | | 5,145,653 | |
| | | |
| | 2,000,000 | | | | | Pure Storage, Inc.^
0.125%, 04/15/23 | | | 2,097,710 | |
| | | |
| | 1,935,000 | | | | | Q2 Holdings, Inc.*
0.750%, 06/01/26 | | | 2,058,308 | |
| | | |
| | 4,375,000 | | | | | Silicon Laboratories, Inc.
1.375%, 03/01/22 | | | 5,546,012 | |
| | | |
| | 2,655,000 | | | | | Splunk, Inc.
0.500%, 09/15/23 | | | 2,885,919 | |
| | | |
| | 3,430,000 | | | | | Wix.com, Ltd.^
0.000%, 07/01/23 | | | 3,921,262 | |
| | | |
| | 3,470,000 | | | | | Workday, Inc.
0.250%, 10/01/22 | | | 4,423,539 | |
| | | |
| | 2,335,000 | | | | | Zendesk, Inc.
0.250%, 03/15/23 | | | 3,036,808 | |
| | | | | | | | | | |
| | | | | | | | | 96,676,635 | |
| | | | | | | | | | |
| | | | | | Real Estate (0.5%) | |
| | 1,750,000 | | | | | Extra Space Storage, LP*
3.125%, 10/01/35 | | | 2,157,391 | |
| | | |
| | 5,340,000 | | | | | IH Merger Sub, LLC
3.500%, 01/15/22 | | | 7,355,637 | |
| | | | | | | | | | |
| | | | | | | | | 9,513,028 | |
| | | | | | | | | | |
| | | | | | | | | | |
PRINCIPAL AMOUNT | | | | | | | VALUE | |
| | | | | | | | | | |
| | | | | | Utilities (0.5%) | |
| | 9,205,000 | | | | | NRG Energy, Inc.
2.750%, 06/01/48 | | $ | 10,475,382 | |
| | | | | | | | | | |
| | | |
| | | | | | TOTAL CONVERTIBLE BONDS (Cost $233,145,652) | | | 262,112,544 | |
| | | | | | | | | | |
| | | | | | | | | | |
|
| | U.S. GOVERNMENT AND AGENCY SECURITIES (1.7%) | |
| | | | | | United States Treasury Note | | | | |
| | 11,600,000 | | | | | 1.125%, 06/30/21 | | | 11,514,586 | |
| | 10,800,000 | | | | | 2.000%, 01/31/20^ | | | 10,811,813 | |
| | 5,800,000 | | | | | 1.625%, 05/15/26^ | | | 5,811,781 | |
| | 5,500,000 | | | | | 2.000%, 11/15/26 | | | 5,646,953 | |
| | | | | | | | | | |
| | | |
| | | | | | TOTAL U.S. GOVERNMENT AND AGENCY SECURITIES (Cost $33,473,122) | | | 33,785,133 | |
| | | | | | | | | | |
| | | | | | | | | | |
NUMBER OF SHARES | | | | | | | VALUE | |
|
| | CONVERTIBLE PREFERRED STOCKS (7.1%) | |
| | | | | | Financials (0.5%) | |
| | 80,250 | | | | | AMG Capital Trust II^
5.150%, 10/15/37 | | | 3,861,028 | |
| | | |
| | 46,665 | | | | | Assurant, Inc.
6.500%, 03/15/21 | | | 5,831,725 | |
| | | | | | | | | | |
| | | | | | | | | 9,692,753 | |
| | | | | | | | | | |
| | | | | | Health Care (0.8%) | |
| | 104,250 | | | | | Becton Dickinson and Company
6.125%, 05/01/20 | | | 6,430,140 | |
| | | |
| | 9,890 | | | | | Danaher Corp.^
4.750%, 04/15/22 | | | 10,981,065 | |
| | | | | | | | | | |
| | | | | | | | | 17,411,205 | |
| | | | | | | | | | |
| | | | | | Industrials (1.7%) | |
| | 10,740 | | | | | Fortive Corp.
5.000%, 07/01/21 | | | 9,671,907 | |
| | | |
| | 204,910 | | | | | Rexnord Corp.
5.750%, 11/15/19 | | | 11,436,027 | |
| | | |
| | 122,025 | | | | | Stanley Black & Decker, Inc.^
5.375%, 05/15/20 | | | 12,439,229 | |
| | | | | | | | | | |
| | | | | | | | | 33,547,163 | |
| | | | | | | | | | |
| | | | | | Information Technology (0.3%) | |
| | 6,000 | | | | | Broadcom, Inc.
8.000%, 09/30/22 | | | 6,498,120 | |
| | | | | | | | | | |
| | | | | | Real Estate (0.9%) | | | | |
| | 14,350 | | | | | Crown Castle International Corp.
6.875%, 08/01/20 | | | 17,875,651 | |
| | | | | | | | | | |
| | | | | | Utilities (2.9%) | |
| | 197,565 | | | | | American Electric Power Company, Inc.
6.125%, 03/15/22 | | | 10,864,099 | |
| | | | |
| 112 | | CALAMOS OPEN-END FAMILY OF FUNDS ANNUAL REPORT | | See accompanying Notes to Schedule of Investments |
Growth and Income Fund Schedule of Investments October 31, 2019
| | | | | | | | | | |
NUMBER OF SHARES | | | | | | | VALUE | |
| | | |
| | 121,500 | | | | | Aqua America, Inc.
6.000%, 04/30/22 | | $ | 7,320,375 | |
| | | |
| | 80,675 | | | | | CenterPoint Energy, Inc. (Warner Media, LLC, Charter Communications Time, Inc.)§**
4.516%, 09/15/29 | | | 4,706,015 | |
| | | |
| | 157,250 | | | | | DTE Energy Company
6.250%, 11/01/22 | | | 7,992,231 | |
| | | |
| | 371,415 | | | | | NextEra Energy, Inc.
4.872%, 09/01/22 | | | 18,890,167 | |
| | | |
| | | | | | Sempra Energy | | | | |
| | 41,640 | | | | | 6.750%, 07/15/21 | | | 4,838,152 | |
| | 30,200 | | | | | 6.000%, 01/15/21 | | | 3,504,106 | |
| | | | | | | | | | |
| | | | | | | | | 58,115,145 | |
| | | | | | | | | | |
| | | |
| | | | | | TOTAL CONVERTIBLE
PREFERRED STOCKS (Cost $132,230,833) | | | 143,140,037 | |
| | | | | | | | | | |
| | | | | | | | | | |
|
| | COMMON STOCKS (71.5%) | |
| | | | | | Communication Services (7.8%) | |
| | 40,455 | | | | | Alphabet, Inc. - Class A#~ | | | 50,924,754 | |
| | | |
| | 271,175 | | | | | AT&T, Inc. | | | 10,437,526 | |
| | | |
| | 321,635 | | | | | Comcast Corp. - Class A | | | 14,415,681 | |
| | | |
| | 170,250 | | | | | Facebook, Inc. - Class A# | | | 32,628,412 | |
| | | |
| | 27,710 | | | | | Netflix, Inc.# | | | 7,964,131 | |
| | | |
| | 269,540 | | | | | Verizon Communications, Inc. | | | 16,299,084 | |
| | | |
| | 173,000 | | | | | Walt Disney Company | | | 22,476,160 | |
| | | | | | | | | | |
| | | | | | | | | 155,145,748 | |
| | | | | | | | | | |
| | | | | | Consumer Discretionary (7.5%) | |
| | 29,010 | | | | | Alibaba Group Holding, Ltd.# | | | 5,125,197 | |
| | | |
| | 32,625 | | | | | Amazon.com, Inc.# | | | 57,963,532 | |
| | | |
| | 47,325 | | | | | Dollar Tree, Inc.# | | | 5,224,680 | |
| | | |
| | 110,420 | | | | | General Motors Company | | | 4,103,207 | |
| | | |
| | 85,225 | | | | | Home Depot, Inc. | | | 19,992,081 | |
| | | |
| | 91,730 | | | | | Lowe’s Companies, Inc. | | | 10,237,985 | |
| | | |
| | 62,615 | | | | | McDonald’s Corp. | | | 12,316,371 | |
| | | |
| | 100,640 | | | | | Nike, Inc. - Class B | | | 9,012,312 | |
| | | |
| | 38,060 | | | | | Royal Caribbean Cruises, Ltd. | | | 4,142,070 | |
| | | |
| | 66,830 | | | | | Starbucks Corp. | | | 5,651,145 | |
| | | |
| | 105,330 | | | | | Target Corp. | | | 11,260,830 | |
| | | |
| | 100,120 | | | | | TJX Companies, Inc. | | | 5,771,918 | |
| | | | | | | | | | |
| | | | | | | | | 150,801,328 | |
| | | | | | | | | | |
| | | | | | Consumer Staples (6.0%) | |
| | 405,850 | | | | | Coca-Cola Company | | | 22,090,415 | |
| | | |
| | 46,115 | | | | | Costco Wholesale Corp. | | | 13,701,228 | |
| | | |
| | 253,435 | | | | | Mondelez International, Inc. - Class A | | | 13,292,666 | |
| | | |
| | 125,755 | | | | | PepsiCo, Inc. | | | 17,249,813 | |
| | | |
| | 159,000 | | | | | Philip Morris International, Inc. | | | 12,948,960 | |
| | | |
| | 208,455 | | | | | Procter & Gamble Company | | | 25,954,732 | |
| | | | | | | | | | |
NUMBER OF SHARES | | | | | | | VALUE | |
| | | |
| | 131,200 | | | | | Walmart, Inc. | | $ | 15,384,512 | |
| | | | | | | | | | |
| | | | | | | | | 120,622,326 | |
| | | | | | | | | | |
| | | | | | Energy (3.4%) | |
| | 216,685 | | | | | Chevron Corp. | | | 25,165,796 | |
| | | |
| | 114,035 | | | | | ConocoPhillips | | | 6,294,732 | |
| | | |
| | 51,810 | | | | | EOG Resources, Inc. | | | 3,590,951 | |
| | | |
| | 144,810 | | | | | Exxon Mobil Corp. | | | 9,784,812 | |
| | | |
| | 123,654 | | | | | Hess Corp. | | | 8,130,250 | |
| | | |
| | 111,565 | | | | | Marathon Petroleum Corp. | | | 7,134,582 | |
| | | |
| | 61,540 | | | | | Pioneer Natural Resources Company | | | 7,570,651 | |
| | | | | | | | | | |
| | | | | | | | | 67,671,774 | |
| | | | | | | | | | |
| | | | | | Financials (10.0%) | |
| | 299,650 | | | | | American International Group, Inc. | | | 15,869,464 | |
| | | |
| | 789,965 | | | | | Bank of America Corp.~ | | | 24,702,206 | |
| | | |
| | 44,530 | | | | | Berkshire Hathaway, Inc. - Class B# | | | 9,466,187 | |
| | | |
| | 101,675 | | | | | Capital One Financial Corp. | | | 9,481,194 | |
| | | |
| | 42,480 | | | | | Cboe Global Markets, Inc. | | | 4,891,572 | |
| | | |
| | 39,835 | | | | | Chubb, Ltd. | | | 6,071,651 | |
| | | |
| | 214,655 | | | | | Citigroup, Inc. | | | 15,425,108 | |
| | | |
| | 44,000 | | | | | Discover Financial Services | | | 3,531,440 | |
| | | |
| | 133,675 | | | | | E*TRADE Financial Corp. | | | 5,586,278 | |
| | | |
| | 22,055 | | | | | Goldman Sachs Group, Inc. | | | 4,706,096 | |
| | | |
| | 155,565 | | | | | Intercontinental Exchange, Inc. | | | 14,672,891 | |
| | | |
| | 249,625 | | | | | JPMorgan Chase & Company~ | | | 31,183,155 | |
| | | |
| | 299,725 | | | | | KeyCorp | | | 5,386,058 | |
| | | |
| | 122,180 | | | | | Marsh & McLennan Companies, Inc. | | | 12,660,292 | |
| | | |
| | 157,145 | | | | | Morgan Stanley | | | 7,236,527 | |
| | | |
| | 55,825 | | | | | Northern Trust Corp. | | | 5,564,636 | |
| | | |
| | 183,130 | | | | | Starwood Property Trust, Inc.^ | | | 4,504,998 | |
| | | |
| | 217,565 | | | | | US Bancorp | | | 12,405,556 | |
| | | |
| | 119,275 | | | | | Zions Bancorporation, N.A. ^ | | | 5,781,259 | |
| | | | | | | | | | |
| | | | | | | | | 199,126,568 | |
| | | | | | | | | | |
| | | | | | Health Care (10.0%) | |
| | 26,795 | | | | | Abbott Laboratories | | | 2,240,330 | |
| | | |
| | 119,860 | | | | | Agilent Technologies, Inc. | | | 9,079,395 | |
| | | |
| | 46,735 | | | | | Alexion Pharmaceuticals, Inc.# | | | 4,925,869 | |
| | | |
| | 38,070 | | | | | Amgen, Inc. | | | 8,118,428 | |
| | | |
| | 26,095 | | | | | Anthem, Inc. | | | 7,021,643 | |
| | | |
| | 181,725 | | | | | Baxter International, Inc. | | | 13,938,307 | |
| | | |
| | 75,420 | | | | | Bristol-Myers Squibb Company | | | 4,326,845 | |
| | | |
| | 24,100 | | | | | Edwards Lifesciences Corp.# | | | 5,744,958 | |
| | | |
| | 56,825 | | | | | Gilead Sciences, Inc. | | | 3,620,321 | |
| | | |
| | 26,750 | | | | | Humana, Inc. | | | 7,869,850 | |
| | | |
| | 10,955 | | | | | Intuitive Surgical, Inc.# | | | 6,057,567 | |
| | | |
| | 129,370 | | | | | Johnson & Johnson~ | | | 17,082,015 | |
| | | |
| | 61,020 | | | | | Laboratory Corp. of America Holdings# | | | 10,054,265 | |
| | | | | | |
| See accompanying Notes to Schedule of Investments | | www.calamos.com | | | 113 | |
Growth and Income Fund Schedule of Investments October 31, 2019
| | | | | | | | | | |
NUMBER OF SHARES | | | | | | | VALUE | |
| | | |
| | 156,780 | | | | | Medtronic, PLC | | $ | 17,073,342 | |
| | | |
| | 222,685 | | | | | Merck & Company, Inc. | | | 19,297,882 | |
| | | |
| | 487,630 | | | | | Pfizer, Inc. | | | 18,710,363 | |
| | | |
| | 17,665 | | | | | Stryker Corp. | | | 3,820,410 | |
| | | |
| | 7,500 | | | | | Teleflex, Inc. | | | 2,605,575 | |
| | | |
| | 36,935 | | | | | Thermo Fisher Scientific, Inc. | | | 11,153,631 | |
| | | |
| | 111,850 | | | | | UnitedHealth Group, Inc. | | | 28,264,495 | |
| | | | | | | | | | |
| | | | | | | | | 201,005,491 | |
| | | | | | | | | | |
| | | | | | Industrials (7.6%) | |
| | 58,985 | | | | | Boeing Company | | | 20,049,591 | |
| | | |
| | 226,665 | | | | | CSX Corp. | | | 15,927,749 | |
| | | |
| | 247,545 | | | | | Delta Air Lines, Inc. | | | 13,634,779 | |
| | | |
| | 128,475 | | | | | Emerson Electric Company | | | 9,012,521 | |
| | | |
| | 472,245 | | | | | General Electric Company | | | 4,713,005 | |
| | | |
| | 120,840 | | | | | Honeywell International, Inc. | | | 20,872,693 | |
| | | |
| | 34,300 | | | | | Lockheed Martin Corp. | | | 12,920,124 | |
| | | |
| | 413,660 | | | | | Masco Corp. | | | 19,131,775 | |
| | | |
| | 50,445 | | | | | Northrop Grumman Corp. | | | 17,780,854 | |
| | | |
| | 104,460 | | | | | Union Pacific Corp. | | | 17,283,952 | |
| | | | | | | | | | |
| | | | | | | | | 151,327,043 | |
| | | | | | | | | | |
| | | | | | Information Technology (16.4%) | |
| | 67,175 | | | | | Accenture, PLC - Class A | | | 12,455,588 | |
| | | |
| | 26,280 | | | | | Adobe, Inc.# | | | 7,304,000 | |
| | | |
| | 295,345 | | | | | Apple, Inc.~ | | | 73,470,022 | |
| | | |
| | 35,450 | | | | | Broadcom, Inc. | | | 10,381,533 | |
| | | |
| | 317,795 | | | | | Cisco Systems, Inc. | | | 15,098,440 | |
| | | |
| | 86,240 | | | | | Fidelity National Information Services, Inc. | | | 11,362,982 | |
| | | |
| | 37,285 | | | | | Global Payments, Inc. | | | 6,307,876 | |
| | | |
| | 47,891 | | | | | Lam Research Corp. | | | 12,980,377 | |
| | | |
| | 100,500 | | | | | Marvell Technology Group, Ltd. | | | 2,451,195 | |
| | | |
| | 77,215 | | | | | MasterCard, Inc. - Class A | | | 21,373,884 | |
| | | |
| | 87,190 | | | | | Micron Technology, Inc.# | | | 4,145,885 | |
| | | |
| | 624,710 | | | | | Microsoft Corp.~ | | | 89,564,673 | |
| | | |
| | 45,985 | | | | | NVIDIA Corp. | | | 9,243,905 | |
| | | |
| | 113,400 | | | | | Oracle Corp. | | | 6,179,166 | |
| | | |
| | 57,205 | | | | | QUALCOMM, Inc. | | | 4,601,570 | |
| | | |
| | 60,370 | | | | | Salesforce.com, Inc.# | | | 9,447,301 | |
| | | |
| | 179,460 | | | | | Visa, Inc. - Class A | | | 32,098,216 | |
| | | | | | | | | | |
| | | | | | | | | 328,466,613 | |
| | | | | | | | | | |
| | | | | | Materials (0.9%) | |
| | 67,185 | | | | | Corteva, Inc.# | | | 1,772,340 | |
| | | |
| | 67,185 | | | | | DuPont de Nemours, Inc. | | | 4,428,164 | |
| | | |
| | 62,880 | | | | | Linde, PLC | | | 12,472,248 | |
| | | | | | | | | | |
| | | | | | | | | 18,672,752 | |
| | | | | | | | | | |
| | | | | | | | | | |
NUMBER OF SHARES | | | | | | | VALUE | |
| | | | | | | | | | |
| | | | | | Real Estate (1.3%) | |
| | 96,520 | | | | | American Tower Corp. | | $ | 21,049,082 | |
| | | |
| | 49,000 | | | | | Welltower, Inc. | | | 4,443,810 | |
| | | | | | | | | | |
| | | | | | | | | 25,492,892 | |
| | | | | | | | | | |
| | | | | | Utilities (0.6%) | |
| | 260,278 | | | | | Exelon Corp. | | | 11,840,046 | |
| | | | | | | | | | |
| | | |
| | | | | | TOTAL COMMON STOCKS
(Cost $923,612,743) | | | 1,430,172,581 | |
| | | | | | | | | | |
| | | | | | | | | | |
|
| | EXCHANGE-TRADED FUNDS (1.2%) | |
| | | | | | Other (1.2%) | |
| | 281,135 | | | | | iShares MSCI EAFE ETF^ | | | 18,954,122 | |
| | | |
| | 108,250 | | | | | iShares MSCI Emerging Markets ETF^ | | | 4,609,285 | |
| | | | | | | | | | |
| | | |
| | | | | | TOTAL EXCHANGE-TRADED FUNDS
(Cost $24,342,422) | | | 23,563,407 | |
| | | | | | | | | | |
| | | | | | | | | | |
NUMBER OF CONTRACTS/ NOTIONAL AMOUNT | | | | | | | VALUE | |
|
| | PURCHASED OPTIONS (0.6%)# | |
| | | | | | Consumer Discretionary (0.0%) | |
| 700
7,618,100 |
| | | | Royal Caribbean Cruises, Ltd. Call, 12/20/19, Strike $115.00 | | | 113,050 | |
| | | | | | | | | | |
| | | | | | Financials (0.0%) | |
| 2,060
10,909,760 |
| | | | American International Group, Inc. Call, 11/15/19, Strike $53.00 | | | 321,360 | |
| | | | | | | | | | |
| | | | | | Information Technology (0.0%) | |
| 1,450
20,788,650 |
| | | | Microsoft Corp. Put, 11/15/19, Strike $135.00 | | | 34,075 | |
| | | | | | | | | | |
| | | | | | Other (0.6%) | |
| 6,040
35,007,840 |
| | | | Energy Select Sector SPDR Fund Call, 12/20/19, Strike $60.00 | | | 453,000 | |
| | | |
| 5,900
16,933,000 |
| | | | Financial Select Sector SPDR Fund Call, 12/20/19, Strike $28.00 | | | 672,600 | |
| | | |
| | | | | | iShares MSCI EAFE ETF | | | | |
| 14,025
94,556,550 |
| | | | Call, 12/20/19, Strike $65.00 | | | 4,074,263 | |
| 12,320
83,061,440 |
| | | | Call, 03/20/20, Strike $67.00 | | | 2,673,440 | |
| 3,800
25,619,600 |
| | | | Call, 01/17/20, Strike $68.00 | | | 347,700 | |
| | | |
| 10,940
46,582,520 |
| | | | iShares MSCI Emerging Markets ETF Call, 12/20/19, Strike $43.50 | | | 585,290 | |
| | | |
| 1,580
14,893,080 |
| | | | iShares U.S. Real Estate ETF Put, 01/17/20, Strike $92.00 | | | 261,490 | |
| | | |
| | | | | | SPDR S&P 500 ETF Trust | | | | |
| 3,500
106,165,500 |
| | | | Put, 11/22/19, Strike $302.00 | | | 939,750 | |
| 2,830
85,842,390 |
| | | | Put, 12/31/19, Strike $285.00 | | | 624,015 | |
| | | | |
| 114 | | CALAMOS OPEN-END FAMILY OF FUNDS ANNUAL REPORT | | See accompanying Notes to Schedule of Investments |
Growth and Income Fund Schedule of Investments October 31, 2019
| | | | | | | | | | |
NUMBER OF CONTRACTS/ NOTIONAL AMOUNT | | | | | | | VALUE | |
| 3,850
24,736,250 |
| | | | Utilities Select Sector SPDR Fund Put, 01/17/20, Strike $62.00 | | $ | 311,850 | |
| | | |
| 2,350
6,561,200 |
| | | | Xtrackers Harvest CSI 300 China A ETF Call, 01/17/20, Strike $26.71 | | | 386,575 | |
| | | | | | | | | | |
| | | | 11,329,973 | |
| | | | | |
| | | |
| | | | | | TOTAL PURCHASED OPTIONS
(Cost $14,466,662) | | | 11,798,458 | |
| | | | | | | | | | |
| | | | | | | | | | |
NUMBER OF SHARES | | | | | | | VALUE | |
|
| | SHORT TERM INVESTMENTS (2.1%) | |
| | 21,662,855 | | | | | Fidelity Prime Money Market Fund - Institutional Class, 1.890%*** | | | 21,671,521 | |
| | | |
| | 21,667,251 | | | | | Morgan Stanley Institutional Liquidity Funds - Government Portfolio,
1.720%*** | | | 21,667,251 | |
| | | | | | | | | | |
| | | |
| | | | | | TOTAL SHORT TERM INVESTMENTS
(Cost $43,338,747) | | | 43,338,772 | |
| | | | | | | | | | |
| | | | | | | | | | |
NUMBER OF SHARES/ PRINCIPAL
AMOUNT | | | | | | | VALUE | |
|
| INVESTMENT OF CASH COLLATERAL FOR SECURITIES
LOANED (2.4%) |
|
| | 21,197,013 | | | | | Fidelity Prime Money Market Fund - Institutional Class, 1.890%***† | | | 21,197,013 | |
| | | |
| | 26,755,015 | | | | | State Street Navigator Securities Lending Government Money Market Portfolio† | | | 26,755,015 | |
| | | | | | | | | | |
| | | |
| | | | | | TOTAL INVESTMENT OF CASH COLLATERAL FOR SECURITIES LOANED (Cost $47,952,028) | | | 47,952,028 | |
| | | | | | | | | | |
| |
| TOTAL INVESTMENTS (102.7%)
(Cost $1,510,471,210) | | | 2,055,413,778 | |
| | | | | | | | | | |
| |
| | PAYABLE UPON RETURN OF SECURITIES ON LOAN(-2.4%) | | | (47,952,028 | ) |
| | | | | |
| |
| | LIABILITIES, LESS OTHER ASSETS(-0.3%) | | | (6,598,781 | ) |
| | | | | |
| |
| | NET ASSETS (100.0%) | | $ | 2,000,862,969 | |
| | | | | |
| | | | | | | | | | |
NUMBER OF CONTRACTS/ NOTIONAL AMOUNT | | | | | | | VALUE | |
|
| | WRITTEN OPTIONS (0.0%)# | |
| | | | | | Financials (0.0%) | |
| 2,060
10,909,760 |
| | | | American International Group, Inc. Call, 11/15/19, Strike $56.00 | | | (93,730 | ) |
| | | | | | | | | | |
| | | | | | | | | | |
NUMBER OF CONTRACTS/ NOTIONAL AMOUNT | | | | | | | VALUE | |
| | | | | | | | | | |
| | | | | | Information Technology (0.0%) | |
| 1,450
20,788,650 |
| | | | Microsoft Corp. Put, 11/15/19, Strike $125.00 | | $ | (8,700 | ) |
| | | | | | | | | | |
| | | |
| | | | | | TOTAL WRITTEN OPTIONS
(Premium $149,099) | | $ | (102,430 | ) |
| | | | | | | | | | |
FORWARD FOREIGN CURRENCY CONTRACTS
| | | | | | | | | | | | | | | | |
COUNTER
PARTY
| | LONG CONTRACTS | | SETTLEMENT DATE | | LOCAL CURRENCY | | | CURRENT VALUE | | | UNREALIZED GAIN/LOSS | |
| | | | | |
| State Street Bank and Trust | | Hong Kong Dollar | | 01/22/20 | | | 4,127,000 | | | $ | 526,584 | | | $ | (145 | ) |
| | | | | | | | | | | | | | | | |
| | | $ | (145 | ) |
| | | | | | | | | | | | | | | | |
| | | | | |
COUNTER
PARTY
| | SHORT CONTRACTS | | SETTLEMENT DATE | | LOCAL CURRENCY | | | CURRENT VALUE | | | UNREALIZED GAIN/LOSS | |
| | | | | |
| State Street Bank and Trust | | European Monetary Unit | | 01/22/20 | | | 61,000 | | | $ | 68,412 | | | $ | (81 | ) |
| | | | | |
| Goldman Sachs & Co. | | European Monetary Unit | | 01/22/20 | | | 1,078,000 | | | | 1,208,985 | | | | (73 | ) |
| | | | | |
| State Street Bank and Trust | | Hong Kong Dollar | | 01/22/20 | | | 67,505,000 | | | | 8,613,288 | | | | (1,741 | ) |
| | | | | | | | | | | | | | | | |
| | | $ | (1,895 | ) |
| | | | | | | | | | | | | | | | |
Note: The date on options represents the expiration date of the option contract. The option contract may be exercised at any date on or before the date shown.
NOTES TO SCHEDULE OF INVESTMENTS
| ^ | Security, or portion of security, is on loan. |
| * | Securities issued and sold pursuant to a Rule 144A transaction are excepted from the registration requirement of the Securities Act of 1933, as amended. These securities may only be sold to qualified institutional buyers (“QIBs”), such as the Fund. Any resale of these securities must generally be effected through a sale that is registered under the Act or otherwise exempted from such registration requirements. |
| § | Securities exchangeable or convertible into securities of one or more entities that are different than the issuer. Each entity is identified in the parenthetical. |
| # | Non-income producing security. |
| ** | Step coupon security. Coupon changes periodically based upon a predetermined schedule. The rate shown is the rate in effect at October 31, 2019. |
| ~ | Security, or portion of security, is segregated as collateral (or collateral for potential future transactions) for written options. The aggregate value of such securities is $2,440,350. |
| *** | The rate disclosed is the 7 day net yield as of October 31, 2019. |
| † | Represents investment of cash collateral received from securities on loan as of October 31, 2019. |
| | | | | | |
| See accompanying Notes to Financial Statements | | www.calamos.com | | | 115 | |
Dividend Growth Fund Schedule of Investments October 31, 2019
| | | | | | | | | | |
NUMBER OF SHARES | | | | | | | VALUE | |
|
| | COMMON STOCKS (97.1%) | |
| | | | | | Communication Services (10.9%) | |
| | 420 | | | | | Alphabet, Inc. - Class C# | | $ | 529,246 | |
| | | |
| | 5,711 | | | | | AT&T, Inc. | | | 219,816 | |
| | | |
| | 170 | | | | | Charter Communications, Inc. - Class A# | | | 79,536 | |
| | | |
| | 4,350 | | | | | Comcast Corp. - Class A | | | 194,967 | |
| | | |
| | 315 | | | | | Electronic Arts, Inc.# | | | 30,366 | |
| | | |
| | 1,830 | | | | | Facebook, Inc. - Class A# | | | 350,720 | |
| | | |
| | 295 | | | | | Netflix, Inc.# | | | 84,786 | |
| | | |
| | 2,585 | | | | | Verizon Communications, Inc. | | | 156,315 | |
| | | |
| | 1,895 | | | | | Walt Disney Company | | | 246,198 | |
| | | | | | | | | | |
| | | | | | | | | 1,891,950 | |
| | | | | | | | | | |
| | | | | | Consumer Discretionary (10.3%) | |
| | 350 | | | | | Amazon.com, Inc.# | | | 621,831 | |
| | | |
| | 30 | | | | | Booking Holdings, Inc.# | | | 61,463 | |
| | | |
| | 590 | | | | | Dollar Tree, Inc.# | | | 65,136 | |
| | | |
| | 1,385 | | | | | General Motors Company | | | 51,467 | |
| | | |
| | 820 | | | | | Home Depot, Inc. | | | 192,356 | |
| | | |
| | 1,080 | | | | | Lowe’s Companies, Inc. | | | 120,539 | |
| | | |
| | 970 | | | | | McDonald’s Corp. | | | 190,799 | |
| | | |
| | 1,530 | | | | | Nike, Inc. - Class B | | | 137,011 | |
| | | |
| | 650 | | | | | Royal Caribbean Cruises, Ltd. | | | 70,739 | |
| | | |
| | 850 | | | | | Starbucks Corp. | | | 71,876 | |
| | | |
| | 1,045 | | | | | Target Corp. | | | 111,721 | |
| | | |
| | 1,540 | | | | | TJX Companies, Inc. | | | 88,781 | |
| | | | | | | | | | |
| | | | | | | | | 1,783,719 | |
| | | | | | | | | | |
| | | | | | Consumer Staples (7.2%) | | | | |
| | 3,455 | | | | | Coca-Cola Company | | | 188,056 | |
| | | |
| | 350 | | | | | Costco Wholesale Corp. | | | 103,989 | |
| | | |
| | 2,220 | | | | | Mondelez International, Inc. - Class A | | | 116,439 | |
| | | |
| | 1,255 | | | | | PepsiCo, Inc. | | | 172,148 | |
| | | |
| | 1,400 | | | | | Philip Morris International, Inc. | | | 114,016 | |
| | | |
| | 2,420 | | | | | Procter & Gamble Company | | | 301,314 | |
| | | |
| | 2,075 | | | | | Walmart, Inc. | | | 243,314 | |
| | | | | | | | | | |
| | | | | | | | | 1,239,276 | |
| | | | | | | | | | |
| | | | | | Energy (4.5%) | | | | |
| | 2,065 | | | | | Chevron Corp. | | | 239,829 | |
| | | |
| | 2,530 | | | | | ConocoPhillips | | | 139,656 | |
| | | |
| | 225 | | | | | EOG Resources, Inc. | | | 15,595 | |
| | | |
| | 1,810 | | | | | Exxon Mobil Corp. | | | 122,302 | |
| | | |
| | 500 | | | | | Hess Corp. | | | 32,875 | |
| | | |
| | 1,345 | | | | | Marathon Petroleum Corp. | | | 86,013 | |
| | | |
| | 440 | | | | | Phillips 66 | | | 51,401 | |
| | | |
| | 460 | | | | | Pioneer Natural Resources Company | | | 56,589 | |
| | | |
| | 885 | | | | | Schlumberger, Ltd. | | | 28,930 | |
| | | | | | | | | | |
| | | | | | | | | 773,190 | |
| | | | | | | | | | |
| | | | | | | | | | |
NUMBER OF SHARES | | | | | | | VALUE | |
| | | | | | | | | | |
| | | | | | Financials (12.9%) | | | | |
| | 410 | | | | | American Express Company | | $ | 48,085 | |
| | | |
| | 2,905 | | | | | American International Group, Inc. | | | 153,849 | |
| | | |
| | 8,245 | | | | | Bank of America Corp. | | | 257,821 | |
| | | |
| | 1,145 | | | | | Berkshire Hathaway, Inc. - Class B# | | | 243,404 | |
| | | |
| | 935 | | | | | Capital One Financial Corp. | | | 87,189 | |
| | | |
| | 780 | | | | | Cboe Global Markets, Inc. | | | 89,817 | |
| | | |
| | 340 | | | | | Chubb, Ltd. | | | 51,823 | |
| | | |
| | 2,180 | | | | | Citigroup, Inc. | | | 156,655 | |
| | | |
| | 550 | | | | | Discover Financial Services | | | 44,143 | |
| | | |
| | 1,020 | | | | | E*TRADE Financial Corp. | | | 42,626 | |
| | | |
| | 400 | | | | | Goldman Sachs Group, Inc. | | | 85,352 | |
| | | |
| | 1,185 | | | | | Intercontinental Exchange, Inc. | | | 111,769 | |
| | | |
| | 2,555 | | | | | JPMorgan Chase & Company | | | 319,170 | |
| | | |
| | 3,740 | | | | | KeyCorp | | | 67,208 | |
| | | |
| | 1,045 | | | | | Marsh & McLennan Companies, Inc. | | | 108,283 | |
| | | |
| | 2,265 | | | | | Morgan Stanley | | | 104,303 | |
| | | |
| | 475 | | | | | Northern Trust Corp. | | | 47,348 | |
| | | |
| | 2,350 | | | | | US Bancorp | | | 133,997 | |
| | | |
| | 1,630 | | | | | Zions Bancorporation, N.A.^ | | | 79,006 | |
| | | | | | | | | | |
| | | | | | | | | 2,231,848 | |
| | | | | | | | | | |
| | | | | | Health Care (12.9%) | | | | |
| | 1,575 | | | | | Abbott Laboratories | | | 131,686 | |
| | | |
| | 1,080 | | | | | Agilent Technologies, Inc. | | | 81,810 | |
| | | |
| | 255 | | | | | Alexion Pharmaceuticals, Inc.# | | | 26,877 | |
| | | |
| | 405 | | | | | Amgen, Inc. | | | 86,366 | |
| | | |
| | 240 | | | | | Anthem, Inc. | | | 64,579 | |
| | | |
| | 1,585 | | | | | Baxter International, Inc. | | | 121,570 | |
| | | |
| | 1,410 | | | | | Bristol-Myers Squibb Company | | | 80,892 | |
| | | |
| | 365 | | | | | Danaher Corp. | | | 50,304 | |
| | | |
| | 305 | | | | | Edwards Lifesciences Corp.# | | | 72,706 | |
| | | |
| | 700 | | | | | Gilead Sciences, Inc. | | | 44,597 | |
| | | |
| | 198 | | | | | Humana, Inc. | | | 58,252 | |
| | | |
| | 120 | | | | | Illumina, Inc.# | | | 35,462 | |
| | | |
| | 125 | | | | | Intuitive Surgical, Inc.# | | | 69,119 | |
| | | |
| | 1,430 | | | | | Johnson & Johnson | | | 188,817 | |
| | | |
| | 590 | | | | | Laboratory Corp. of America Holdings# | | | 97,214 | |
| | | |
| | 1,710 | | | | | Medtronic, PLC | | | 186,219 | |
| | | |
| | 2,470 | | | | | Merck & Company, Inc. | | | 214,050 | |
| | | |
| | 4,535 | | | | | Pfizer, Inc. | | | 174,008 | |
| | | |
| | 265 | | | | | Stryker Corp. | | | 57,312 | |
| | | |
| | 95 | | | | | Teleflex, Inc. | | | 33,004 | |
| | | |
| | 345 | | | | | Thermo Fisher Scientific, Inc. | | | 104,183 | |
| | | |
| | 1,010 | | | | | UnitedHealth Group, Inc. | | | 255,227 | |
| | | | | | | | | | |
| | | | | | | | | 2,234,254 | |
| | | | | | | | | | |
| | | | |
| 116 | | CALAMOS OPEN-END FAMILY OF FUNDS ANNUAL REPORT | | See accompanying Notes to Schedule of Investments |
Dividend Growth Fund Schedule of Investments October 31, 2019
| | | | | | | | | | |
NUMBER OF SHARES | | | | | | | VALUE | |
| | | | | | | | | | |
| | | | | | Industrials (8.9%) | | | | |
| | 565 | | | | | Boeing Company | | $ | 192,049 | |
| | | |
| | 2,045 | | | | | CSX Corp. | | | 143,702 | |
| | | |
| | 2,575 | | | | | Delta Air Lines, Inc. | | | 141,831 | |
| | | |
| | 1,370 | | | | | Emerson Electric Company | | | 96,106 | |
| | | |
| | 375 | | | | | Fortive Corp. | | | 25,875 | |
| | | |
| | 3,710 | | | | | General Electric Company | | | 37,026 | |
| | | |
| | 1,150 | | | | | Honeywell International, Inc. | | | 198,639 | |
| | | |
| | 445 | | | | | Lockheed Martin Corp. | | | 167,623 | |
| | | |
| | 3,720 | | | | | Masco Corp. | | | 172,050 | |
| | | |
| | 320 | | | | | Northrop Grumman Corp. | | | 112,794 | |
| | | |
| | 650 | | | | | Stanley Black & Decker, Inc. | | | 98,364 | |
| | | |
| | 890 | | | | | Union Pacific Corp. | | | 147,259 | |
| | | | | | | | | | |
| | | | | | | | | 1,533,318 | |
| | | | | | | | | | |
| | | | | | Information Technology (23.0%) | |
| | 690 | | | | | Accenture, PLC - Class A | | | 127,940 | |
| | | |
| | 385 | | | | | Adobe, Inc.# | | | 107,003 | |
| | | |
| | 3,095 | | | | | Apple, Inc. | | | 769,912 | |
| | | |
| | 850 | | | | | Applied Materials, Inc. | | | 46,121 | |
| | | |
| | 445 | | | | | Broadcom, Inc. | | | 130,318 | |
| | | |
| | 3,065 | | | | | Cisco Systems, Inc. | | | 145,618 | |
| | | |
| | 975 | | | | | Fidelity National Information Services, Inc. | | | 128,466 | |
| | | |
| | 540 | | | | | Global Payments, Inc. | | | 91,357 | |
| | | |
| | 3,400 | | | | | Intel Corp. | | | 192,202 | |
| | | |
| | 350 | | | | | International Business Machines Corp. | | | 46,806 | |
| | | |
| | 335 | | | | | Intuit, Inc. | | | 86,262 | |
| | | |
| | 330 | | | | | Lam Research Corp. | | | 89,443 | |
| | | |
| | 1,040 | | | | | Marvell Technology Group, Ltd. | | | 25,366 | |
| | | |
| | 685 | | | | | MasterCard, Inc. - Class A | | | 189,615 | |
| | | |
| | 635 | | | | | Microchip Technology, Inc. | | | 59,874 | |
| | | |
| | 745 | | | | | Micron Technology, Inc.# | | | 35,425 | |
| | | |
| | 6,015 | | | | | Microsoft Corp. | | | 862,371 | |
| | | |
| | 540 | | | | | NVIDIA Corp. | | | 108,551 | |
| | | |
| | 1,650 | | | | | Oracle Corp. | | | 89,908 | |
| | | |
| | 555 | | | | | QUALCOMM, Inc. | | | 44,644 | |
| | | |
| | 1,020 | | | | | Salesforce.com, Inc.# | | | 159,620 | |
| | | |
| | 620 | | | | | Texas Instruments, Inc. | | | 73,154 | |
| | | |
| | 1,940 | | | | | Visa, Inc. - Class A | | | 346,988 | |
| | | |
| | 175 | | | | | Xilinx, Inc. | | | 15,880 | |
| | | | | | | | | | |
| | | | | | | | | 3,972,844 | |
| | | | | | | | | | |
| | | | | | Materials (1.6%) | | | | |
| | 750 | | | | | Corteva, Inc.# | | | 19,785 | |
| | | |
| | 750 | | | | | DuPont de Nemours, Inc. | | | 49,433 | |
| | | |
| | 635 | | | | | Linde, PLC | | | 125,952 | |
| | | |
| | 490 | | | | | LyondellBasell Industries, NV - Class A | | | 43,953 | |
| | | |
| | 85 | | | | | Sherwin-Williams Company | | | 48,647 | |
| | | | | | | | | | |
| | | | | | | | | 287,770 | |
| | | | | | | | | | |
| | | | | | | | | | |
NUMBER OF SHARES | | | | | | | VALUE | |
| | | | | | | | | | |
| | | | | | Real Estate (1.9%) | | | | |
| | 640 | | | | | American Tower Corp. | | $ | 139,571 | |
| | | |
| | 795 | | | | | Crown Castle International Corp. | | | 110,338 | |
| | | |
| | 835 | | | | | Welltower, Inc. | | | 75,726 | |
| | | | | | | | | | |
| | | | | | | | | 325,635 | |
| | | | | | | | | | |
| | | | | | Utilities (3.0%) | | | | |
| | 445 | | | | | Dominion Energy, Inc. | | | 36,735 | |
| | | |
| | 1,380 | | | | | Duke Energy Corp. | | | 130,079 | |
| | | |
| | 2,825 | | | | | Exelon Corp. | | | 128,509 | |
| | | |
| | 780 | | | | | NextEra Energy, Inc. | | | 185,905 | |
| | | |
| | 225 | | | | | Sempra Energy | | | 32,515 | |
| | | | | | | | | | |
| | | | | | | | | 513,743 | |
| | | | | | | | | | |
| | | |
| | | | | | TOTAL COMMON STOCKS (Cost $11,661,939) | | | 16,787,547 | |
| | | | | | | | | | |
| | | | | | | | | | |
|
| | SHORT TERM INVESTMENTS (2.9%) | |
| | 245,339 | | | | | Fidelity Prime Money Market Fund - Institutional Class, 1.890%*** | | | 245,438 | |
| | | |
| | 245,386 | | | | | Morgan Stanley Institutional Liquidity Funds - Government Portfolio,
1.720%*** | | | 245,386 | |
| | | | | | | | | | |
| | | |
| | | | | | TOTAL SHORT TERM INVESTMENTS (Cost $490,810) | | | 490,824 | |
| | | | | | | | | | |
| |
| TOTAL INVESTMENTS (100.0%)
(Cost $12,152,749) | | | 17,278,371 | |
| | | | | | | | | | |
| |
| | OTHER ASSETS, LESS LIABILITIES (0.0%) | | | 4,350 | |
| | | | | | | | | | |
| |
| | NET ASSETS (100.0%) | | $ | 17,282,721 | |
| | | | | | | | | | |
NOTES TO SCHEDULE OF INVESTMENTS
| # | Non-income producing security. |
| ^ | Security, or portion of security, is on loan. |
| *** | The rate disclosed is the 7 day net yield as of October 31, 2019. |
| | | | | | |
| See accompanying Notes to Financial Statements | | www.calamos.com | | | 117 | |
Opportunistic Value Fund Schedule of Investments October 31, 2019
| | | | | | | | | | |
NUMBER OF SHARES | | | | | | | VALUE | |
|
| | COMMON STOCKS (98.5%) | |
| | | | | | Communication Services (5.4%) | |
| | 105 | | | | | Alphabet, Inc. - Class A# | | $ | 132,174 | |
| | | |
| | 28,935 | | | | | AT&T, Inc. | | | 1,113,708 | |
| | | |
| | 320 | | | | | Charter Communications, Inc. - Class A# | | | 149,715 | |
| | | |
| | 11,010 | | | | | Comcast Corp. - Class A | | | 493,468 | |
| | | |
| | 5,340 | | | | | Discovery, Inc. - Class A#^ | | | 143,940 | |
| | | |
| | 720 | | | | | Facebook, Inc. - Class A# | | | 137,988 | |
| | | |
| | 1,980 | | | | | Walt Disney Company | | | 257,242 | |
| | | | | | | | | | |
| | | | | | | | | 2,428,235 | |
| | | | | | | | | | |
| | | | | | Consumer Discretionary (8.3%) | |
| | 75 | | | | | Amazon.com, Inc.# | | | 133,250 | |
| | | |
| | 100 | | | | | AutoZone, Inc.# | | | 114,438 | |
| | | |
| | 1,800 | | | | | Best Buy Company, Inc. | | | 129,294 | |
| | | |
| | 90 | | | | | Booking Holdings, Inc.# | | | 184,389 | |
| | | |
| | 180 | | | | | Chipotle Mexican Grill, Inc.# | | | 140,069 | |
| | | |
| | 975 | | | | | Dollar General Corp. | | | 156,331 | |
| | | |
| | 5,520 | | | | | eBay, Inc. | | | 194,580 | |
| | | |
| | 1,425 | | | | | Hilton Worldwide Holdings, Inc. | | | 138,168 | |
| | | |
| | 2,375 | | | | | Home Depot, Inc. | | | 557,127 | |
| | | |
| | 1,885 | | | | | Lennar Corp. - Class A | | | 112,346 | |
| | | |
| | 2,050 | | | | | Lowe’s Companies, Inc. | | | 228,800 | |
| | | |
| | 2,545 | | | | | Nike, Inc. - Class B | | | 227,905 | |
| | | |
| | 2,385 | | | | | Norwegian Cruise Line Holdings, Ltd.# | | | 121,063 | |
| | | |
| | 35 | | | | | NVR, Inc.# | | | 127,281 | |
| | | |
| | 4,100 | | | | | PulteGroup, Inc. | | | 160,884 | |
| | | |
| | 1,460 | | | | | Ross Stores, Inc. | | | 160,118 | |
| | | |
| | 3,525 | | | | | Starbucks Corp. | | | 298,074 | |
| | | |
| | 2,620 | | | | | Target Corp. | | | 280,104 | |
| | | |
| | 2,350 | | | | | TJX Companies, Inc. | | | 135,478 | |
| | | |
| | 3,100 | | | | | Toll Brothers, Inc. | | | 123,287 | |
| | | | | | | | | | |
| | | | | | | | | 3,722,986 | |
| | | | | | | | | | |
| | | | | | Consumer Staples (8.6%) | | | | |
| | 1,065 | | | | | Altria Group, Inc. | | | 47,701 | |
| | | |
| | 1,740 | | | | | Church & Dwight Company, Inc. | | | 121,696 | |
| | | |
| | 5,100 | | | | | Coca-Cola Company | | | 277,593 | |
| | | |
| | 1,510 | | | | | Colgate-Palmolive Company | | | 103,586 | |
| | | |
| | 1,215 | | | | | Costco Wholesale Corp. | | | 360,989 | |
| | | |
| | 635 | | | | | Estee Lauder Companies, Inc. - Class A | | | 118,281 | |
| | | |
| | 3,550 | | | | | General Mills, Inc. | | | 180,553 | |
| | | |
| | 1,115 | | | | | Hershey Company | | | 163,760 | |
| | | |
| | 790 | | | | | Kimberly-Clark Corp. | | | 104,975 | |
| | | |
| | 1,450 | | | | | Lamb Weston Holdings, Inc. | | | 113,158 | |
| | | |
| | 5,300 | | | | | Mondelez International, Inc. - Class A | | | 277,985 | |
| | | |
| | 2,190 | | | | | PepsiCo, Inc. | | | 300,402 | |
| | | |
| | 1,645 | | | | | Philip Morris International, Inc. | | | 133,969 | |
| | | |
| | 5,225 | | | | | Procter & Gamble Company | | | 650,565 | |
| | | | | | | | | | |
NUMBER OF SHARES | | | | | | | VALUE | |
| | | |
| | 2,400 | | | | | Sysco Corp. | | $ | 191,688 | |
| | | |
| | 1,600 | | | | | Tyson Foods, Inc. - Class A | | | 132,464 | |
| | | |
| | 5,060 | | | | | Walmart, Inc. | | | 593,336 | |
| | | | | | | | | | |
| | | | | | | | | 3,872,701 | |
| | | | | | | | | | |
| | | | | | Energy (4.2%) | | | | |
| | 2,310 | | | | | Cheniere Energy, Inc.# | | | 142,181 | |
| | | |
| | 7,200 | | | | | Chevron Corp. | | | 836,208 | |
| | | |
| | 2,000 | | | | | Hess Corp. | | | 131,500 | |
| | | |
| | 2,515 | | | | | HollyFrontier Corp. | | | 138,174 | |
| | | |
| | 7,700 | | | | | Kinder Morgan, Inc. | | | 153,846 | |
| | | |
| | 2,350 | | | | | ONEOK, Inc. | | | 164,100 | |
| | | |
| | 1,685 | | | | | Phillips 66 | | | 196,842 | |
| | | |
| | 3,500 | | | | | World Fuel Services Corp. | | | 146,195 | |
| | | | | | | | | | |
| | | | | | | | | 1,909,046 | |
| | | | | | | | | | |
| | | | | | Financials (20.7%) | | | | |
| | 2,120 | | | | | Allstate Corp. | | | 225,610 | |
| | | |
| | 2,540 | | | | | American Express Company | | | 297,891 | |
| | | |
| | 3,883 | | | | | American International Group, Inc. | | | 205,644 | |
| | | |
| | 730 | | | | | Ameriprise Financial, Inc. | | | 110,150 | |
| | | |
| | 685 | | | | | AON, PLC | | | 132,315 | |
| | | |
| | 3,900 | | | | | Arch Capital Group, Ltd.# | | | 162,864 | |
| | | |
| | 1,410 | | | | | Assurant, Inc. | | | 177,759 | |
| | | |
| | 31,186 | | | | | Bank of America Corp. | | | 975,186 | |
| | | |
| | 3,195 | | | | | Berkshire Hathaway, Inc. - Class B# | | | 679,193 | |
| | | |
| | 1,700 | | | | | Capital One Financial Corp. | | | 158,525 | |
| | | |
| | 845 | | | | | Chubb, Ltd. | | | 128,795 | |
| | | |
| | 1,270 | | | | | Cincinnati Financial Corp. | | | 143,777 | |
| | | |
| | 7,940 | | | | | Citigroup, Inc. | | | 570,568 | |
| | | |
| | 310 | | | | | Credit Acceptance Corp.#^ | | | 135,721 | |
| | | |
| | 2,400 | | | | | Discover Financial Services | | | 192,624 | |
| | | |
| | 2,270 | | | | | First American Financial Corp. | | | 140,241 | |
| | | |
| | 8,346 | | | | | First Horizon National Corp. | | | 133,286 | |
| | | |
| | 1,740 | | | | | Globe Life, Inc. | | | 169,354 | |
| | | |
| | 220 | | | | | Goldman Sachs Group, Inc. | | | 46,944 | |
| | | |
| | 3,630 | | | | | Hartford Financial Services Group, Inc. | | | 207,200 | |
| | | |
| | 1,420 | | | | | Intercontinental Exchange, Inc. | | | 133,934 | |
| | | |
| | 11,971 | | | | | JPMorgan Chase & Company | | | 1,495,417 | |
| | | |
| | 1,650 | | | | | LPL Financial Holdings, Inc. | | | 133,386 | |
| | | |
| | 1,650 | | | | | Marsh & McLennan Companies, Inc. | | | 170,973 | |
| | | |
| | 580 | | | | | Moody’s Corp. | | | 128,000 | |
| | | |
| | 3,880 | | | | | Morgan Stanley | | | 178,674 | |
| | | |
| | 635 | | | | | MSCI, Inc. - Class A | | | 148,946 | |
| | | |
| | 7,050 | | | | | OFG Bancorp | | | 143,185 | |
| | | |
| | 2,215 | | | | | PNC Financial Services Group, Inc. | | | 324,940 | |
| | | |
| | 2,130 | | | | | Popular, Inc. | | | 116,000 | |
| | | |
| | 1,230 | | | | | Primerica, Inc. | | | 155,201 | |
| | | |
| | 1,960 | | | | | Progressive Corp. | | | 136,612 | |
| | | | |
| 118 | | CALAMOS OPEN-END FAMILY OF FUNDS ANNUAL REPORT | | See accompanying Notes to Schedule of Investments |
Opportunistic Value Fund Schedule of Investments October 31, 2019
| | | | | | | | | | |
NUMBER OF SHARES | | | | | | | VALUE | |
| | | |
| | 700 | | | | | RenaissanceRe Holdings, Ltd. | | $ | 131,026 | |
| | | |
| | 530 | | | | | S&P Global, Inc. | | | 136,735 | |
| | | |
| | 1,900 | | | | | Stifel Financial Corp. | | | 106,362 | |
| | | |
| | 4,200 | | | | | Synchrony Financial | | | 148,554 | |
| | | |
| | 1,220 | | | | | T. Rowe Price Group, Inc. | | | 141,276 | |
| | | |
| | 8,030 | | | | | Wells Fargo & Company | | | 414,589 | |
| | | | | | | | | | |
| | | | | | | | | 9,337,457 | |
| | | | | | | | | | |
| | | | | | Health Care (8.4%) | | | | |
| | 1,630 | | | | | Abbott Laboratories | | | 136,284 | |
| | | |
| | 3,340 | | | | | AbbVie, Inc. | | | 265,697 | |
| | | |
| | 1,770 | | | | | Agilent Technologies, Inc. | | | 134,078 | |
| | | |
| | 1,240 | | | | | AmerisourceBergen Corp. | | | 105,871 | |
| | | |
| | 1,775 | | | | | Baxter International, Inc. | | | 136,143 | |
| | | |
| | 3,750 | | | | | Boston Scientific Corp.# | | | 156,375 | |
| | | |
| | 3,890 | | | | | Bristol-Myers Squibb Company | | | 223,169 | |
| | | |
| | 2,125 | | | | | CVS Health Corp. | | | 141,079 | |
| | | |
| | 915 | | | | | Danaher Corp. | | | 126,105 | |
| | | |
| | 555 | | | | | Edwards Lifesciences Corp.# | | | 132,301 | |
| | | |
| | 1,125 | | | | | Hill-Rom Holdings, Inc. | | | 117,776 | |
| | | |
| | 3,175 | | | | | Hologic, Inc.# | | | 153,384 | |
| | | |
| | 1,125 | | | | | IQVIA Holdings, Inc.# | | | 162,473 | |
| | | |
| | 2,500 | | | | | Johnson & Johnson | | | 330,100 | |
| | | |
| | 1,480 | | | | | McKesson Corp. | | | 196,840 | |
| | | |
| | 1,025 | | | | | Medtronic, PLC | | | 111,623 | |
| | | |
| | 1,884 | | | | | Merck & Company, Inc. | | | 163,267 | |
| | | |
| | 1,665 | | | | | Quest Diagnostics, Inc. | | | 168,581 | |
| | | |
| | 760 | | | | | Stryker Corp. | | | 164,365 | |
| | | |
| | 560 | | | | | Thermo Fisher Scientific, Inc. | | | 169,109 | |
| | | |
| | 1,185 | | | | | UnitedHealth Group, Inc. | | | 299,449 | |
| | | |
| | 1,300 | | | | | Zoetis, Inc. | | | 166,296 | |
| | | | | | | | | | |
| | | | | | | | | 3,760,365 | |
| | | | | | | | | | |
| | | | | | Industrials (10.4%) | | | | |
| | 3,315 | | | | | Aerojet Rocketdyne Holdings, Inc.# | | | 143,307 | |
| | | |
| | 2,155 | | | | | AGCO Corp. | | | 165,267 | |
| | | |
| | 1,785 | | | | | Ametek, Inc. | | | 163,595 | |
| | | |
| | 5,825 | | | | | Arconic, Inc. | | | 160,013 | |
| | | |
| | 1,390 | | | | | Armstrong World Industries, Inc. | | | 130,007 | |
| | | |
| | 955 | | | | | Carlisle Companies, Inc. | | | 145,418 | |
| | | |
| | 580 | | | | | Caterpillar, Inc. | | | 79,924 | |
| | | |
| | 1,795 | | | | | Clean Harbors, Inc.# | | | 148,016 | |
| | | |
| | 2,440 | | | | | Delta Air Lines, Inc. | | | 134,395 | |
| | | |
| | 2,490 | | | | | Fortune Brands Home & Security, Inc. | | | 149,524 | |
| | | |
| | 1,210 | | | | | HEICO Corp. | | | 149,241 | |
| | | |
| | 1,330 | | | | | Honeywell International, Inc. | | | 229,731 | |
| | | |
| | 860 | | | | | Hubbell, Inc. | | | 121,862 | |
| | | |
| | 1,230 | | | | | Ingersoll-Rand, PLC | | | 156,075 | |
| | | |
| | 6,750 | | | | | JetBlue Airways Corp.# | | | 130,275 | |
| | | | | | | | | | |
NUMBER OF SHARES | | | | | | | VALUE | |
| | | |
| | 620 | | | | | L3Harris Technologies, Inc. | | $ | 127,912 | |
| | | |
| | 565 | | | | | Lockheed Martin Corp. | | | 212,824 | |
| | | |
| | 3,775 | | | | | Masco Corp. | | | 174,594 | |
| | | |
| | 2,175 | | | | | MasTec, Inc.# | | | 136,895 | |
| | | |
| | 600 | | | | | Northrop Grumman Corp. | | | 211,488 | |
| | | |
| | 2,150 | | | | | Owens Corning | | | 131,752 | |
| | | |
| | 1,920 | | | | | PACCAR, Inc. | | | 146,035 | |
| | | |
| | 700 | | | | | Raytheon Company | | | 148,547 | |
| | | |
| | 355 | | | | | Roper Industries, Inc. | | | 119,621 | |
| | | |
| | 940 | | | | | Stanley Black & Decker, Inc. | | | 142,250 | |
| | | |
| | 200 | | | | | TransDigm Group, Inc. | | | 105,256 | |
| | | |
| | 1,785 | | | | | TransUnion | | | 147,477 | |
| | | |
| | 2,250 | | | | | United Airlines Holdings, Inc.# | | | 204,390 | |
| | | |
| | 1,355 | | | | | United Technologies Corp. | | | 194,551 | |
| | | |
| | 850 | | | | | Verisk Analytics, Inc. | | | 122,995 | |
| | | |
| | 1,400 | | | | | Waste Management, Inc. | | | 157,094 | |
| | | | | | | | | | |
| | | | | | | | | 4,690,331 | |
| | | | | | | | | | |
| | | | | | Information Technology (20.6%) | |
| | 1,300 | | | | | Accenture, PLC - Class A | | | 241,046 | |
| | | |
| | 580 | | | | | Adobe, Inc.# | | | 161,199 | |
| | | |
| | 1,740 | | | | | Akamai Technologies, Inc.# | | | 150,510 | |
| | | |
| | 16,200 | | | | | Apple, Inc. | | | 4,029,912 | |
| | | |
| | 4,400 | | | | | Applied Materials, Inc. | | | 238,744 | |
| | | |
| | 2,355 | | | | | Booz Allen Hamilton Holding Corp. | | | 165,721 | |
| | | |
| | 520 | | | | | Broadcom, Inc. | | | 152,282 | |
| | | |
| | 600 | | | | | CACI International, Inc. - Class A# | | | 134,250 | |
| | | |
| | 1,900 | | | | | Cadence Design Systems, Inc.# | | | 124,165 | |
| | | |
| | 1,115 | | | | | CDW Corp. | | | 142,620 | |
| | | |
| | 3,070 | | | | | Ciena Corp.# | | | 113,958 | |
| | | |
| | 1,505 | | | | | Fiserv, Inc.# | | | 159,741 | |
| | | |
| | 485 | | | | | FleetCor Technologies, Inc.# | | | 142,697 | |
| | | |
| | 685 | | | | | Global Payments, Inc. | | | 115,888 | |
| | | |
| | 2,770 | | | | | Intel Corp. | | | 156,588 | |
| | | |
| | 530 | | | | | Intuit, Inc. | | | 136,475 | |
| | | |
| | 1,500 | | | | | Keysight Technologies, Inc.# | | | 151,365 | |
| | | |
| | 1,300 | | | | | KLA Corp. | | | 219,752 | |
| | | |
| | 825 | | | | | Lam Research Corp. | | | 223,608 | |
| | | |
| | 1,710 | | | | | Leidos Holdings, Inc. | | | 147,453 | |
| | | |
| | 535 | | | | | MasterCard, Inc. - Class A | | | 148,093 | |
| | | |
| | 1,500 | | | | | Microchip Technology, Inc.^ | | | 141,435 | |
| | | |
| | 2,700 | | | | | Micron Technology, Inc.# | | | 128,385 | |
| | | |
| | 1,155 | | | | | Microsoft Corp. | | | 165,592 | |
| | | |
| | 630 | | | | | Motorola Solutions, Inc. | | | 104,782 | |
| | | |
| | 1,095 | | | | | NVIDIA Corp. | | | 220,117 | |
| | | |
| | 3,910 | | | | | Oracle Corp. | | | 213,056 | |
| | | |
| | 4,080 | | | | | Perficient, Inc.# | | | 159,936 | |
| | | |
| | 1,545 | | | | | Science Applications International Corp. | | | 127,648 | |
| | | | | | |
| See accompanying Notes to Schedule of Investments | | www.calamos.com | | | 119 | |
Opportunistic Value Fund Schedule of Investments October 31, 2019
| | | | | | | | | | |
NUMBER OF SHARES | | | | | | | VALUE | |
| | | |
| | 1,025 | | | | | Take-Two Interactive Software, Inc.# | | $ | 123,359 | |
| | | |
| | 2,885 | | | | | Teradyne, Inc. | | | 176,620 | |
| | | |
| | 1,350 | | | | | Texas Instruments, Inc. | | | 159,286 | |
| | | |
| | 839 | | | | | Visa, Inc. - Class A | | | 150,064 | |
| | | |
| | 580 | | | | | Zebra Technologies Corp.- Class A# | | | 137,965 | |
| | | | | | | | | | |
| | | | | | | | | 9,264,312 | |
| | | | | | | | | | |
| | | | | | Materials (3.4%) | | | | |
| | 1,100 | | | | | Celanese Corp. - Class A | | | 133,265 | |
| | | |
| | 2,575 | | | | | CF Industries Holdings, Inc. | | | 116,776 | |
| | | |
| | 4,555 | | | | | Dow, Inc.# | | | 229,982 | |
| | | |
| | 710 | | | | | Linde, PLC | | | 140,829 | |
| | | |
| | 600 | | | | | Martin Marietta Materials, Inc. | | | 157,146 | |
| | | |
| | 3,950 | | | | | PolyOne Corp. | | | 126,598 | |
| | | |
| | 1,175 | | | | | ScottsMiracle-Gro Company | | | 117,958 | |
| | | |
| | 2,460 | | | | | Sealed Air Corp. | | | 102,754 | |
| | | |
| | 210 | | | | | Sherwin-Williams Company | | | 120,187 | |
| | | |
| | 4,900 | | | | | Silgan Holdings, Inc. | | | 150,773 | |
| | | |
| | 830 | | | | | Vulcan Materials Company | | | 118,582 | |
| | | | | | | | | | |
| | | | | | | | | 1,514,850 | |
| | | | | | | | | | |
| | | | | | Real Estate (3.7%) | | | | |
| | 890 | | | | | Alexandria Real Estate Equities, Inc. | | | 141,287 | |
| | | |
| | 690 | | | | | AvalonBay Communities, Inc. | | | 150,185 | |
| | | |
| | 3,665 | | | | | CBRE Group, Inc. - Class A# | | | 196,261 | |
| | | |
| | 1,310 | | | | | Crown Castle International Corp. | | | 181,815 | |
| | | |
| | 1,815 | | | | | Equity Residential | | | 160,918 | |
| | | |
| | 1,560 | | | | | Extra Space Storage, Inc. | | | 175,141 | |
| | | |
| | 2,800 | | | | | National Retail Properties, Inc. | | | 164,948 | |
| | | |
| | 2,250 | | | | | Prologis, Inc. | | | 197,460 | |
| | | |
| | 3,870 | | | | | STORE Capital Corp. | | | 156,735 | |
| | | |
| | 2,775 | | | | | UDR, Inc. | | | 139,444 | |
| | | | | | | | | | |
| | | | | | | | | 1,664,194 | |
| | | | | | | | | | |
| | | | | | Utilities (4.8%) | | | | |
| | 2,000 | | | | | Ameren Corp. | | | 155,400 | |
| | | |
| | 2,100 | | | | | American Electric Power Company, Inc. | | | 198,219 | |
| | | |
| | 2,600 | | | | | CMS Energy Corp. | | | 166,192 | |
| | | |
| | 1,755 | | | | | Consolidated Edison, Inc. | | | 161,846 | |
| | | |
| | 1,930 | | | | | Dominion Energy, Inc. | | | 159,321 | |
| | | |
| | 1,150 | | | | | DTE Energy Company | | | 146,418 | |
| | | |
| | 2,650 | | | | | Duke Energy Corp. | | | 249,789 | |
| | | |
| | 1,550 | | | | | Entergy Corp. | | | 188,294 | |
| | | |
| | 4,940 | | | | | FirstEnergy Corp. | | | 238,701 | |
| | | |
| | 1,450 | | | | | Pinnacle West Capital Corp. | | | 136,474 | |
| | | |
| | 3,050 | | | | | PNM Resources, Inc. | | | 159,058 | |
| | | |
| | 3,300 | | | | | Southern Company | | | 206,778 | |
| | | | | | | | | | |
| | | | | | | | | 2,166,490 | |
| | | | | | | | | | |
| | | |
| | | | | | TOTAL COMMON STOCKS (Cost $37,696,582) | | | 44,330,967 | |
| | | | | | | | | | |
| | | | | | | | | | |
| | | | | | | | | | |
NUMBER OF SHARES | | | | | | | VALUE | |
|
| | EXCHANGE-TRADED FUND (0.7%) | |
| | | | | | Other (0.7%) | | | | |
| | 5,765 | | | | | Energy Select Sector SPDR Fund^ (Cost $330,881) | | $ | 334,140 | |
| | | | | | | | | | |
| | | | | | | | | | |
|
| | SHORT TERM INVESTMENTS (0.3%) | |
| | 75,832 | | | | | Fidelity Prime Money Market Fund - Institutional Class, 1.890%*** | | | 75,862 | |
| | | |
| | 75,846 | | | | | Morgan Stanley Institutional Liquidity Funds - Government Portfolio,
1.720%*** | | | 75,846 | |
| | | | | | | | | | |
| | | |
| | | | | | TOTAL SHORT TERM INVESTMENTS (Cost $151,708) | | | 151,708 | |
| | | | | | | | | | |
| | | | | | | | | | |
NUMBER OF SHARES/ PRINCIPAL
AMOUNT | | | | | | | VALUE | |
|
| INVESTMENT OF CASH COLLATERAL FOR SECURITIES
LOANED (0.7%) |
|
| | 293,100 | | | | | State Street Navigator Securities Lending Government Money Market Portfolio† (Cost $293,100) | | | 293,100 | |
| | | | | | | | | | |
| |
| TOTAL INVESTMENTS (100.2%)
(Cost $38,472,271) | | | 45,109,915 | |
| | | | | | | | | | |
| |
| | PAYABLE UPON RETURN OF SECURITIES ON LOAN(-0.7%) | | | (293,100 | ) |
| | | | | | | | | | |
| |
| | OTHER ASSETS, LESS LIABILITIES (0.5%) | | | 209,663 | |
| | | | | | | | | | |
| |
| | NET ASSETS (100.0%) | | $ | 45,026,478 | |
| | | | | | | | | | |
NOTES TO SCHEDULE OF INVESTMENTS
| # | Non-income producing security. |
| ^ | Security, or portion of security, is on loan. |
| *** | The rate disclosed is the 7 day net yield as of October 31, 2019. |
| † | Represents investment of cash collateral received from securities on loan as of October 31, 2019. |
| | | | |
| 120 | | CALAMOS OPEN-END FAMILY OF FUNDS ANNUAL REPORT | | See accompanying Notes to Financial Statements |
International Growth Fund Schedule of Investments October 31, 2019
| | | | | | | | | | |
NUMBER OF SHARES | | | | | | | VALUE | |
| |
| | COMMON STOCKS (99.3%) | | | | |
| | | | | | Communication Services (3.8%) | |
| | 193,700 | | | HKD | | Tencent Holdings, Ltd. | | $ | 7,857,036 | |
| | | | | | | | | | |
| | | | | | Consumer Discretionary (19.9%) | |
| | 39,062 | | | | | Alibaba Group Holding, Ltd.#~ | | | 6,901,084 | |
| | | |
| | 39,000 | | | | | Aptiv, PLC | | | 3,492,450 | |
| | | |
| | 59,200 | | | GBP | | Burberry Group, PLC | | | 1,569,804 | |
| | | |
| | 18,100 | | | CHF | | Compagnie Financière Richemont, SA | | | 1,422,319 | |
| | | |
| | 73,500 | | | GBP | | Compass Group, PLC | | | 1,956,871 | |
| | | |
| | 6,600 | | | | | Ferrari, NV | | | 1,056,792 | |
| | | |
| | 29,890 | | | | | Lululemon Athletica, Inc.#~ | | | 6,105,630 | |
| | | |
| | 5,200 | | | EUR | | LVMH Moet Hennessy Louis Vuitton, SE | | | 2,220,689 | |
| | | |
| | 187,400 | | | BRL | | Magazine Luiza, SA | | | 2,085,908 | |
| | | |
| | 3,200 | | | | | MercadoLibre, Inc.# | | | 1,668,864 | |
| | | |
| | 19,960 | | | | | New Oriental Education & Technology Group, Inc.#~ | | | 2,436,318 | |
| | | |
| | 12,200 | | | JPY | | Oriental Land Company, Ltd.^ | | | 1,788,531 | |
| | | |
| | 20,000 | | | ZAR | | Prosus, NV# | | | 1,391,059 | |
| | | |
| | 55,200 | | | EUR | | Puma, SE | | | 4,153,135 | |
| | | |
| | 25,600 | | | | | Sony Corp. | | | 1,557,248 | |
| | | |
| | 181,000 | | | GBP | | Trainline, PLC#* | | | 976,519 | |
| | | | | | | | | | |
| | | | | | | | | 40,783,221 | |
| | | | | | | | | | |
| | | | | | Consumer Staples (6.2%) | | | | |
| | 45,000 | | | EUR | | Danone, SA | | | 3,727,854 | |
| | | |
| | 37,700 | | | GBP | | Diageo, PLC | | | 1,543,098 | |
| | | |
| | 19,700 | | | EUR | | Kerry Group, PLC - Class A | | | 2,385,373 | |
| | | |
| | 37,800 | | | | | Nestlé, SA~ | | | 4,050,648 | |
| | | |
| | 12,000 | | | JPY | | Shiseido Company, Ltd. | | | 996,537 | |
| | | | | | | | | | |
| | | | | | | | | 12,703,510 | |
| | | | | | | | | | |
| | | | | | Energy (4.4%) | | | | |
| | 83,900 | | | | | BP, PLC~ | | | 3,180,649 | |
| | | |
| | 56,000 | | | EUR | | Neste Oyj | | | 2,023,418 | |
| | | |
| | 74,000 | | | INR | | Reliance Industries, Ltd. | | | 1,526,017 | |
| | | |
| | 840,000 | | | GBP | | Tullow Oil, PLC | | | 2,244,749 | |
| | | | | | | | | | |
| | | | | | | | | 8,974,833 | |
| | | | | | | | | | |
| | | | | | Financials (11.6%) | | | | |
| | 14,100 | | | | | AON, PLC | | | 2,723,556 | |
| | | |
| | 711,000 | | | IDR | | Bank Central Asia, Tbk PT | | | 1,591,451 | |
| | | |
| | 10,750 | | | EUR | | Deutsche Böerse, AG | | | 1,664,741 | |
| | | |
| | 291,600 | | | INR | | HDFC Bank, Ltd. | | | 5,050,906 | |
| | | |
| | 45,800 | | | HKD | | Hong Kong Exchanges & Clearing, Ltd. | | | 1,426,854 | |
| | | |
| | 263,000 | | | INR | | ICICI Bank, Ltd. | | | 1,719,132 | |
| | | |
| | 216,600 | | | | | Itau Unibanco Holding, SA~ | | | 1,955,898 | |
| | | |
| | 1,300,000 | | | GBP | | Lloyds Banking Group, PLC | | | 956,288 | |
| | | |
| | 44,500 | | | GBP | | London Stock Exchange Group, PLC | | | 4,010,288 | |
| | | | | | | | | | |
NUMBER OF SHARES | | | | | | | VALUE | |
| | | |
| | 227,500 | | | HKD | | Ping An Insurance Group Company of China, Ltd. - Class H | | $ | 2,625,755 | |
| | | | | | | | | | |
| | | | | | | | | 23,724,869 | |
| | | | | | | | | | |
| | | | | | Health Care (13.2%) | | | | |
| | 68,900 | | | | | Alcon, Inc.#^ | | | 4,083,703 | |
| | | |
| | 6,400 | | | CHF | | Alcon, Inc.# | | | 378,484 | |
| | | |
| | 58,000 | | | GBP | | AstraZeneca, PLC | | | 5,655,998 | |
| | | |
| | 51,300 | | | AUD | | CSL, Ltd. | | | 9,047,076 | |
| | | |
| | 40,600 | | | JPY | | Hoya Corp. | | | 3,588,115 | |
| | | |
| | 9,000 | | | CHF | | Lonza Group, AG# | | | 3,243,892 | |
| | | |
| | 20,400 | | | | | Novo Nordisk, A/S~ | | | 1,126,488 | |
| | | | | | | | | | |
| | | | | | | | | 27,123,756 | |
| | | | | | | | | | |
| | | | | | Industrials (16.4%) | | | | |
| | 29,100 | | | EUR | | Airbus, SE | | | 4,174,635 | |
| | | |
| | 45,000 | | | SEK | | Atlas Copco, AB - Class A | | | 1,588,343 | |
| | | |
| | 154,700 | | | CAD | | CAE, Inc. | | | 3,879,539 | |
| | | |
| | 9,200 | | | CAD | | Canadian Pacific Railway, Ltd. | | | 2,092,090 | |
| | | |
| | 21,400 | | | DKK | | DSV, A/S | | | 2,079,847 | |
| | | |
| | 44,000 | | | GBP | | Experian, PLC | | | 1,386,937 | |
| | | |
| | 45,800 | | | JPY | | Harmonic Drive Systems, Inc.^ | | | 2,124,053 | |
| | | |
| | 32,000 | | | JPY | | Japan Airport Terminal Company, Ltd.^ | | | 1,580,689 | |
| | | |
| | 24,000 | | | EUR | | KION Group, AG | | | 1,596,906 | |
| | | |
| | 77,300 | | | INR | | Larsen & Toubro, Ltd. | | | 1,604,858 | |
| | | |
| | 15,000 | | | JPY | | Nidec Corp. | | | 2,208,387 | |
| | | |
| | 18,600 | | | EUR | | Safran, SA | | | 2,946,052 | |
| | | |
| | 994,014 | | | CNY | | Sany Heavy Industry Company, Ltd. - Class A | | | 1,900,634 | |
| | | |
| | 16,500 | | | EUR | | Schneider Electric, SE | | | 1,533,516 | |
| | | |
| | 13,200 | | | EUR | | Teleperformance | | | 2,994,861 | |
| | | | | | | | | | |
| | | | | | | | | 33,691,347 | |
| | | | | | | | | | |
| | | | | | Information Technology (21.0%) | |
| | 23,000 | | | | | Accenture, PLC - Class A | | | 4,264,660 | |
| | | |
| | 3,125 | | | EUR | | Adyen, NV#* | | | 2,200,047 | |
| | | |
| | 23,950 | | | EUR | | ASML Holding, NV | | | 6,277,637 | |
| | | |
| | 39,700 | | | SEK | | Hexagon, AB - Class B | | | 2,032,557 | |
| | | |
| | 7,300 | | | JPY | | Keyence Corp. | | | 4,615,764 | |
| | | |
| | 28,500 | | | JPY | | Lasertec Corp. | | | 2,048,752 | |
| | | |
| | 45,500 | | | EUR | | SAP, SE | | | 6,028,816 | |
| | | |
| | 4,750 | | | | | Shopify, Inc., Class A#^ | | | 1,489,458 | |
| | | |
| | 27,900 | | | EUR | | SOITEC# | | | 3,077,399 | |
| | | |
| | 473,000 | | | TWD | | Taiwan Semiconductor Manufacturing Company, Ltd. | | | 4,635,304 | |
| | | |
| | 82,550 | | | | | Taiwan Semiconductor Manufacturing Company, Ltd. | | | 4,262,056 | |
| | | |
| | 198,000 | | | TWD | | Win Semiconductors Corp. | | | 2,060,945 | |
| | | | | | | | | | |
| | | | | | | | | 42,993,395 | |
| | | | | | | | | | |
| | | | | | |
| See accompanying Notes to Schedule of Investments | | www.calamos.com | | | 121 | |
International Growth Fund Schedule of Investments October 31, 2019
| | | | | | | | | | |
NUMBER OF SHARES | | | | | | | VALUE | |
| | | | | | | | | | |
| | | | | | Materials (2.0%) | | | | |
| | 12,400 | | | CHF | | Sika, AG | | $ | 2,131,641 | |
| | | |
| | 565,500 | | | CAD | | Yamana Gold, Inc. | | | 2,065,185 | |
| | | | | | | | | | |
| | | | | | | | | 4,196,826 | |
| | | | | | | | | | |
| | | | | | Real Estate (0.8%) | | | | |
| | 113,500 | | | INR | | Godrej Properties, Ltd.# | | | 1,592,929 | |
| | | | | | | | | | |
| | | |
| | | | | | TOTAL COMMON STOCKS (Cost $168,009,828) | | | 203,641,722 | |
| | | | | | | | | | |
| | | | | | | | | | |
NUMBER OF CONTRACTS/ NOTIONAL AMOUNT | | | | | | | VALUE | |
|
| | PURCHASED OPTIONS (0.6%)# | |
| | | | | | Consumer Discretionary (0.1%) | |
| 342
6,042,114 |
| | | | Alibaba Group Holding, Ltd. Put, 01/17/20, Strike $160.00 | | | 109,440 | |
| | | |
| 342
6,986,034 |
| | | | Lululemon Athletica, Inc. Put, 01/17/20, Strike $165.00 | | | 69,597 | |
| | | |
| 31
1,616,712 |
| | | | MercadoLibre, Inc. Put, 11/15/19, Strike $510.00 | | | 79,360 | |
| | | |
| 195
2,380,170 |
| | | | New Oriental Education & Technology Group, Inc. Put, 01/17/20, Strike $95.00 | | | 18,525 | |
| | | | | | | | | | |
| | | | | | | | | 276,922 | |
| | | | | | | | | | |
| | | | | | Financials (0.1%) | | | | |
| | | | | | Estx Banks | | | | |
| 2,165
390,177,383 |
| | EUR | | Call, 12/20/19, Strike 95.00 | | | 141,859 | |
| 1,130
203,649,165 |
| | EUR | | Call, 12/20/19, Strike 105.00 | | | 7,877 | |
| | | |
| 1,645
2,143,435 |
| | | | ICICI Bank, Ltd. Call, 01/17/20, Strike $13.00 | | | 104,458 | |
| | | | | | | | | | |
| | | | | | | | | 254,194 | |
| | | | | | | | | | |
| | | | | | Information Technology (0.1%) | |
| 211
3,912,362 |
| | | | Accenture, PLC Put, 01/17/20, Strike $180.00 | | | 97,060 | |
| | | |
| 189
4,951,233 |
| | | | ASML Holding, NV Put, 01/17/20, Strike $200.00 | | | 13,703 | |
| | | |
| 343
4,510,450 |
| | | | SAP, SE Put, 01/17/20, Strike $110.00 | | | 17,150 | |
| | | |
| 984
5,080,392 |
| | | | Taiwan Semiconductor Manufacturing Company, Ltd. Put, 01/17/20, Strike $38.00 | | | 14,760 | |
| | | | | | | | | | |
| | | | | | | | | 142,673 | |
| | | | | | | | | | |
| | | | | | Materials (0.2%) | | | | |
| 5,567
2,098,759 |
| | | | Cemex, SAB de CV Call, 01/15/21, Strike $4.00 | | | 322,886 | |
| | | |
| 747
3,885,147 |
| | | | Rio Tinto, PLC Call, 04/17/20, Strike $60.00 | | | 61,627 | |
| | | | | | | | | | |
| | | | | | | | | 384,513 | |
| | | | | | | | | | |
| | | | | | | | | | |
NUMBER OF CONTRACTS/ NOTIONAL AMOUNT | | | | | | | VALUE | |
| | | | | | | | | | |
| | | | | | Other (0.1%) | | | | |
| 2,606
6,275,248 |
| | | | VanEck Vectors Russia ETF Call, 01/17/20, Strike $24.00 | | $ | 185,025 | |
| | | | | | | | | | |
| | | |
| | | | | | TOTAL PURCHASED OPTIONS (Cost $2,771,282) | | | 1,243,327 | |
| | | | | | | | | | |
| | | | | | | | | | |
NUMBER OF SHARES | | | | | | | VALUE | |
|
| | SHORT TERM INVESTMENTS (0.0%) | |
| | 758 | | | | | Fidelity Prime Money Market Fund - Institutional Class, 1.890%*** | | | 758 | |
| | | |
| | 697 | | | | | Morgan Stanley Institutional Liquidity Funds - Government Portfolio,
1.720%*** | | | 697 | |
| | | | | | | | | | |
| | | |
| | | | | | TOTAL SHORT TERM INVESTMENTS (Cost $1,455) | | | 1,455 | |
| | | | | | | | | | |
| | | | | | | | | | |
NUMBER OF SHARES/ PRINCIPAL
AMOUNT | | | | | | | VALUE | |
|
| INVESTMENT OF CASH COLLATERAL FOR SECURITIES
LOANED (2.0%) |
|
| | 3,983,662 | | | | | State Street Navigator Securities Lending Government Money Market Portfolio† (Cost $3,983,662) | | | 3,983,662 | |
| | | | | | | | | | |
| |
| TOTAL INVESTMENTS (101.9%)
(Cost $174,766,227) | | | 208,870,166 | |
| | | | | | | | | | |
| |
| | PAYABLE UPON RETURN OF SECURITIES ON LOAN(-1.9%) | | | (3,983,662 | ) |
| | | | | | | | | | |
| |
| | OTHER ASSETS, LESS LIABILITIES (0.0%) | | | 110,768 | |
| | | | | | | | | | |
| |
| | NET ASSETS (100.0%) | | $ | 204,997,272 | |
| | | | | | | | | | |
| | | | | | | | | | |
NUMBER OF CONTRACTS/ NOTIONAL AMOUNT | | | | | | | VALUE | |
|
| | WRITTEN OPTIONS(-0.1%)# | |
| | | | | | Consumer Discretionary(-0.1%) | | | | |
| 195
2,380,170 |
| | | | New Oriental Education & Technology Group, Inc. Put, 01/17/20, Strike $85.00 | | | (9,263 | ) |
| | | |
| 342
6,042,114 |
| | | | Alibaba Group Holding, Ltd. Put, 01/17/20, Strike $145.00 | | | (32,490 | ) |
| | | |
| 342
6,986,034 |
| | | | Lululemon Athletica, Inc. Put, 01/17/20, Strike $145.00 | | | (20,349 | ) |
| | | | | | | | | | |
| | | | | | | | | (62,102 | ) |
| | | | | | | | | | |
| | | | |
| 122 | | CALAMOS OPEN-END FAMILY OF FUNDS ANNUAL REPORT | | See accompanying Notes to Schedule of Investments |
International Growth Fund Schedule of Investments October 31, 2019
| | | | | | | | | | |
NUMBER OF CONTRACTS/ NOTIONAL AMOUNT | | | | | | | VALUE | |
| | | | | | | | | | |
| | | | | | Information Technology (0.0%) | | | | |
| 211
3,912,362 |
| | | | Accenture, PLC Put, 01/17/20, Strike $165.00 | | $ | (33,232 | ) |
| | | |
| 343
4,510,450 |
| | | | SAP, SE Put, 01/17/20, Strike $100.00 | | | (6,860 | ) |
| | | |
| 189
4,951,233 |
| | | | ASML Holding, NV Put, 01/17/20, Strike $180.00 | | | (5,670 | ) |
| | | |
| 984
5,080,392 |
| | | | Taiwan Semiconductor Manufacturing Company, Ltd. Put, 01/17/20, Strike $35.00 | | | (9,840 | ) |
| | | | | | | | | | |
| | | | | | | | | (55,602 | ) |
| | | | | | | | | | |
| | | |
| | | | | | TOTAL WRITTEN OPTIONS (Premium $618,200) | | $ | (117,704 | ) |
| | | | | | | | | | |
FORWARD FOREIGN CURRENCY CONTRACTS
| | | | | | | | | | | | | | | | |
COUNTER
PARTY | | LONG CONTRACTS | | SETTLEMENT DATE | | LOCAL CURRENCY | | | CURRENT VALUE | | | UNREALIZED GAIN/LOSS | |
| | | | | |
| Goldman Sachs & Co. | | European Monetary Unit | | 11/29/19 | | | 14,445,000 | | | $ | 16,136,512 | | | $ | 1,202 | |
| | | | | | | | | | | | | | | | |
NOTES TO SCHEDULE OF INVESTMENTS
| # | Non-income producing security. |
| ~ | Security, or portion of security, is segregated as collateral (or collateral for potential future transactions) for written options. The aggregate value of such securities is $386,901. |
| ^ | Security, or portion of security, is on loan. |
| * | Securities issued and sold pursuant to a Rule 144A transaction are excepted from the registration requirement of the Securities Act of 1933, as amended. These securities may only be sold to qualified institutional buyers (“QIBs”), such as the Fund. Any resale of these securities must generally be effected through a sale that is registered under the Act or otherwise exempted from such registration requirements. |
| *** | The rate disclosed is the 7 day net yield as of October 31, 2019. |
| † | Represents investment of cash collateral received from securities on loan as of October 31, 2019. |
FOREIGN CURRENCY ABBREVIATIONS
| | |
| |
| AUD | | Australian Dollar |
| |
| BRL | | Brazilian Real |
| |
| CAD | | Canadian Dollar |
| |
| CHF | | Swiss Franc |
| |
| CNY | | Chinese Yuan Renminbi |
| |
| DKK | | Danish Krone |
| |
| EUR | | European Monetary Unit |
| |
| GBP | | British Pound Sterling |
| |
| HKD | | Hong Kong Dollar |
| |
| IDR | | Indonesian Rupiah |
| |
| INR | | Indian Rupee |
| |
| JPY | | Japanese Yen |
| |
| SEK | | Swedish Krona |
| |
| TWD | | New Taiwan Dollar |
| |
| ZAR | | South African Rand |
Note: Value for securities denominated in foreign currencies is shown in U.S. dollars. The date on options represents the expiration date of the option contract. The option contract may be exercised at any date on or before the date shown.
CURRENCY EXPOSURE
OCTOBER 31, 2019
| | | | | | | | |
| | | VALUE | | | % OF TOTAL INVESTMENTS | |
| | |
| US Dollar | | $ | 55,316,506 | | | | 26.5% | |
| European Monetary Unit | | | 47,154,815 | | | | 22.6% | |
| | |
| British Pound Sterling | | | 20,300,552 | | | | 9.7% | |
| Japanese Yen | | | 18,950,828 | | | | 9.1% | |
| | |
| Hong Kong Dollar | | | 11,909,645 | | | | 5.7% | |
| Indian Rupee | | | 11,493,842 | | | | 5.5% | |
| | |
| Australian Dollar | | | 9,047,076 | | | | 4.3% | |
| Canadian Dollar | | | 8,036,814 | | | | 3.9% | |
| | |
| Swiss Franc | | | 7,176,336 | | | | 3.4% | |
| New Taiwan Dollar | | | 6,696,249 | | | | 3.2% | |
| | |
| Swedish Krona | | | 3,620,900 | | | | 1.7% | |
| Brazilian Real | | | 2,085,908 | | | | 1.0% | |
| | |
| Danish Krone | | | 2,079,847 | | | | 1.0% | |
| Chinese Yuan Renminbi | | | 1,900,634 | | | | 0.9% | |
| | |
| Indonesian Rupiah | | | 1,591,451 | | | | 0.8% | |
| South African Rand | | | 1,391,059 | | | | 0.7% | |
| | |
| Total Investments | | $ | 208,752,462 | | | | 100.0% | |
Currency exposure may vary over time.
| | | | | | |
| See accompanying Notes to Financial Statements | | www.calamos.com | | | 123 | |
Evolving World Growth Fund Schedule of Investments October 31, 2019
| | | | | | | | | | |
PRINCIPAL AMOUNT | | | | | | | VALUE | |
|
| | CONVERTIBLE BONDS (21.0%) | |
| | | | | | Communication Services (3.7%) | | | | |
| | 2,800,000,000 | | | KRW | | Kakao Corp.
0.000%, 05/11/21 | | $ | 2,827,472 | |
| | | |
| | 1,839,000 | | | | | Sea, Ltd.
2.250%, 07/01/23 | | | 3,115,532 | |
| | | | | | | | | | |
| | | | | | | | | 5,943,004 | |
| | | | | | | | | | |
| | | | | | Consumer Discretionary (7.0%) | |
| | 1,515,000 | | | | | Baozun, Inc.*
1.625%, 05/01/24 | | | 1,616,520 | |
| | | |
| | 6,000,000 | | | HKD | | China Conch Venture Holdings International, Ltd.
0.000%, 09/05/23 | | | 806,391 | |
| | | |
| | 1,145,000 | | | | | Ctrip.com International, Ltd.
1.990%, 07/01/25 | | | 1,200,693 | |
| | | |
| | 3,091,000 | | | | | GOL Equity Finance, SA*
3.750%, 07/15/24 | | | 3,567,555 | |
| | | |
| | 1,386,000 | | | | | Pinduoduo, Inc.*
0.000%, 10/01/24 | | | 1,612,950 | |
| | | |
| | 18,000,000 | | | HKD | | Zhongsheng Group Holdings, Ltd.
0.000%, 05/23/23 | | | 2,517,983 | |
| | | | | | | | | | |
| | | | | | | | | 11,322,092 | |
| | | | | | | | | | |
| | | | | | Energy (2.2%) | |
| | 3,000,000 | | | | | Tullow Oil Jersey, Ltd.
6.625%, 07/12/21 | | | 3,488,070 | |
| | | | | | | | | | |
| | | | | | Financials (4.8%) | |
| | | | | | JPMorgan Chase Bank, N.A. | | | | |
| | 12,000,000 | | | HKD | | 0.000%, 10/29/20* | | | 1,650,700 | |
| | 5,300,000 | | | | | 0.000%, 12/30/20 | | | 6,107,587 | |
| | | | | | | | | | |
| | | | | | | | | 7,758,287 | |
| | | | | | | | | | |
| | | | | | Information Technology (0.9%) | | | | |
| | 1,250,000 | | | | | Semiconductor Manufacturing International Corp.
0.000%, 07/07/22 | | | 1,489,594 | |
| | | | | | | | | | |
| | | | | | Materials (2.4%) | | | | |
| | 1,200,000 | | | CHF | | Sika, AG
3.750%, 01/30/22 | | | 1,567,530 | |
| | | |
| | 2,000,000 | | | | | Taiwan Cement Corp.
0.000%, 12/10/23 | | | 2,384,030 | |
| | | | | | | | | | |
| | | | | | | | | 3,951,560 | |
| | | | | | | | | | |
| | | |
| | | | | | TOTAL CONVERTIBLE BONDS
(Cost $31,541,416) | | | 33,952,607 | |
| | | | | | | | | | |
| | | | | | | | | | |
NUMBER OF SHARES | | | | | | | VALUE | |
|
| | CONVERTIBLE PREFERRED STOCK (1.1%) | |
| | | | | | Information Technology (1.1%) | |
| | 1,650 | | | | | Broadcom, Inc.
8.000%, 09/30/22 (Cost $1,649,889) | | | 1,786,983 | |
| | | | | | | | | | |
| | | | | | | | | | |
NUMBER OF SHARES | | | | | | | VALUE | |
|
| | COMMON STOCKS (75.3%) | |
| | | | | | Communication Services (4.9%) | |
| | 195,600 | | | HKD | | Tencent Holdings, Ltd. | | $ | 7,934,106 | |
| | | | | | | | | | |
| | | | | | Consumer Discretionary (17.1%) | |
| | 54,750 | | | | | Alibaba Group Holding, Ltd.# | | | 9,672,683 | |
| | | |
| | 16,900 | | | | | Aptiv, PLC | | | 1,513,395 | |
| | | |
| | 30,000 | | | | | Arco Platform, Ltd. - Class A#^ | | | 1,245,000 | |
| | | |
| | 97,007 | | | CNY | | China International Travel Service Corp, Ltd. - Class A | | | 1,244,648 | |
| | | |
| | 532,600 | | | HKD | | Li Ning Company, Ltd. | | | 1,805,950 | |
| | | |
| | 96,580 | | | BRL | | Lojas Renner, SA | | | 1,222,151 | |
| | | |
| | 3,150 | | | EUR | | LVMH Moet Hennessy Louis Vuitton, SE | | | 1,345,225 | |
| | | |
| | 154,000 | | | BRL | | Magazine Luiza, SA | | | 1,714,140 | |
| | | |
| | 5,180 | | | | | MercadoLibre, Inc.# | | | 2,701,474 | |
| | | |
| | 8,140 | | | ZAR | | Naspers, Ltd. - Class N | | | 1,151,879 | |
| | | |
| | 21,000 | | | | | New Oriental Education & Technology Group, Inc.# | | | 2,563,260 | |
| | | |
| | 11,110 | | | ZAR | | Prosus, NV# | | | 772,733 | |
| | | |
| | 10,890 | | | EUR | | Prosus, NV# | | | 750,963 | |
| | | | | | | | | | |
| | | | | | | | | 27,703,501 | |
| | | | | | | | | | |
| | | | | | Consumer Staples (4.6%) | |
| | 18,500 | | | EUR | | Danone, SA | | | 1,532,562 | |
| | | |
| | 30,800 | | | PLN | | Dino Polska, SA*# | | | 1,200,275 | |
| | | |
| | 9,719 | | | CNY | | Kweichow Moutai Company, Ltd. - Class A | | | 1,627,612 | |
| | | |
| | 2,127,000 | | | SGD | | Thai Beverage PCL | | | 1,428,043 | |
| | | |
| | 576,600 | | | MXN | | Wal-Mart de Mexico, SAB de CV | | | 1,728,017 | |
| | | | | | | | | | |
| | | | | | | | | 7,516,509 | |
| | | | | | | | | | |
| | | | | | Energy (3.2%) | |
| | 285,000 | | | GBP | | BP, PLC | | | 1,807,288 | |
| | | |
| | 161,100 | | | INR | | Reliance Industries, Ltd. | | | 3,322,181 | |
| | | | | | | | | | |
| | | | | | | | | 5,129,469 | |
| | | | | | | | | | |
| | | | | | Financials (13.9%) | |
| | 110,000 | | | BRL | | B3, SA - Brasil Bolsa Balcao | | | 1,326,966 | |
| | | |
| | 1,166,900 | | | IDR | | Bank Central Asia, Tbk PT | | | 2,611,904 | |
| | | |
| | 381,000 | | | INR | | HDFC Bank, Ltd. | | | 6,599,435 | |
| | | |
| | 38,500 | | | HKD | | Hong Kong Exchanges & Clearing, Ltd. | | | 1,199,430 | |
| | | |
| | 69,500 | | | INR | | Housing Development Finance Corp., Ltd. | | | 2,090,827 | |
| | | |
| | 295,000 | | | INR | | ICICI Bank, Ltd. | | | 1,928,304 | |
| | | |
| | 88,700 | | | INR | | ICICI Lombard General Insurance Company, Ltd.* | | | 1,670,736 | |
| | | |
| | 204,600 | | | BRL | | IRB Brasil Resseguros, SA | | | 1,927,898 | |
| | | |
| | 355,000 | | | | | Itau Unibanco Holding, SA | | | 3,205,650 | |
| | | | | | | | | | |
| | | | | | | | | 22,561,150 | |
| | | | | | | | | | |
| | | | |
| 124 | | CALAMOS OPEN-END FAMILY OF FUNDS ANNUAL REPORT | | See accompanying Notes to Schedule of Investments |
Evolving World Growth Fund Schedule of Investments October 31, 2019
| | | | | | | | | | |
NUMBER OF SHARES | | | | | | | VALUE | |
| | | | | | | | | | |
| | | | | | Health Care (4.7%) | |
| | 246,608 | | | CNY | | Aier Eye Hospital Group Company, Ltd. - Class A | | $ | 1,384,975 | |
| | | |
| | 37,700 | | | | | Alcon, Inc.#^ | | | 2,234,479 | |
| | | |
| | 135,811 | | | CNY | | Hangzhou Tigermed Consulting Company, Ltd. - Class A | | | 1,317,641 | |
| | | |
| | 89,000 | | | BRL | | Notre Dame Intermedica Participacoes, SA | | | 1,331,505 | |
| | | |
| | 110,500 | | | HKD | | Wuxi Biologics Cayman, Inc.*# | | | 1,298,536 | |
| | | | | | | | | | |
| | | | | | | | | 7,567,136 | |
| | | | | | | | | | |
| | | | | | Industrials (3.4%) | |
| | 4,400 | | | | | Boeing Company | | | 1,495,604 | |
| | | |
| | 211,000 | | | HKD | | China Conch Venture Holdings, Ltd. | | | 825,618 | |
| | | |
| | 62,500 | | | INR | | Larsen & Toubro, Ltd. | | | 1,297,589 | |
| | | |
| | 1,008,077 | | | CNY | | Sany Heavy Industry Company, Ltd. - Class A | | | 1,927,524 | |
| | | | | | | | | | |
| | | | | | | | | 5,546,335 | |
| | | | | | | | | | |
| | | | | | Information Technology (19.9%) | |
| | 9,700 | | | | | Accenture, PLC - Class A | | | 1,798,574 | |
| | | |
| | 347,000 | | | TWD | | Accton Technology Corp. | | | 2,064,191 | |
| | | |
| | 14,000 | | | EUR | | ASML Holding, NV | | | 3,669,600 | |
| | | |
| | 3,000 | | | JPY | | Keyence Corp. | | | 1,896,889 | |
| | | |
| | 22,500 | | | JPY | | Lasertec Corp. | | | 1,617,436 | |
| | | |
| | 164,000 | | | TWD | | MediaTek, Inc. | | | 2,190,196 | |
| | | |
| | 12,500 | | | | | Microsoft Corp. | | | 1,792,125 | |
| | | |
| | 18,100 | | | EUR | | SAP, SE | | | 2,398,276 | |
| | | |
| | 13,800 | | | EUR | | SOITEC# | | | 1,522,154 | |
| | | |
| | 811,649 | | | TWD | | Taiwan Semiconductor Manufacturing Company, Ltd. | | | 7,953,996 | |
| | | |
| | 64,500 | | | | | Taiwan Semiconductor Manufacturing Company, Ltd. | | | 3,330,135 | |
| | | |
| | 196,900 | | | TWD | | Win Semiconductors Corp. | | | 2,049,496 | |
| | | | | | | | | | |
| | | | | | | | | 32,283,068 | |
| | | | | | | | | | |
| | | | | | Materials (1.3%) | |
| | 130,000 | | | HKD | | Anhui Conch Cement Company, Ltd. - Class H | | | 776,974 | |
| | | |
| | 360,000 | | | CAD | | Yamana Gold, Inc. | | | 1,314,707 | |
| | | | | | | | | | |
| | | | | | | | | 2,091,681 | |
| | | | | | | | | | |
| | | | | | Real Estate (2.3%) | |
| | 2,080,100 | | | PHP | | Ayala Land, Inc. | | | 1,987,802 | |
| | | |
| | 123,200 | | | INR | | Godrej Properties, Ltd.# | | | 1,729,064 | |
| | | | | | | | | | |
| | | | | | | | | 3,716,866 | |
| | | | | | | | | | |
| | | |
| | | | | | TOTAL COMMON STOCKS
(Cost $93,218,968) | | | 122,049,821 | |
| | | | | | | | | | |
| | | | | | | | | | |
| | | | | | | | | | |
NUMBER OF CONTRACTS/ NOTIONAL AMOUNT | | | | | | | VALUE | |
|
| | PURCHASED OPTIONS (1.6%)# | |
| | | | | | Communication Services (0.1%) | |
| 155
1,578,675 |
| | | | Baidu, Inc. Call, 01/17/20, Strike $250.00 | | $ | 155 | |
| | | |
| 1,143
3,401,568 |
| | | | Sea, Ltd. Put, 01/17/20, Strike $26.00 | | | 125,730 | |
| | | | | | | | | | |
| | | | | | | | | 125,885 | |
| | | | | | | | | | |
| | | | | | Consumer Discretionary (0.1%) | |
| | | | | | Melco Resorts & Entertainment | | | | |
| 1,000
2,154,000 |
| | | | Call, 01/17/20, Strike $25.00 | | | 25,000 | |
| 780
1,680,120 |
| | | | Call, 01/17/20, Strike $27.00 | | | 7,800 | |
| | | |
| 51
2,659,752 |
| | | | MercadoLibre, Inc. Put, 11/15/19, Strike $510.00 | | | 130,560 | |
| | | | | | | | | | |
| | | | | | | | | 163,360 | |
| | | | | | | | | | |
| | | | | | Energy (0.4%) | |
| 487
4,483,322 |
| | | | Lukoil, PJSC Call, 06/19/20, Strike $100.00 | | | 125,403 | |
| | | |
| | | | | | Petroleo Brasileiro, SA | | | | |
| 1,215
1,973,160 |
| | | | Call, 01/15/21, Strike $15.00 | | | 385,762 | |
| 1,150
1,867,600 |
| | | | Call, 01/17/20, Strike $17.00 | | | 71,875 | |
| | | | | | | | | | |
| | | | | | | | | 583,040 | |
| | | | | | | | | | |
| | | | | | Financials (0.2%) | |
| 1,325
1,726,475 |
| | | | ICICI Bank, Ltd. Call, 01/17/20, Strike $13.00 | | | 84,138 | |
| | | |
| 1,795
2,639,099 |
| | | | Sberbank of Russia, PJSC Call, 12/20/19, Strike $14.00 | | | 179,500 | |
| | | | | | | | | | |
| | | | | | | | | 263,638 | |
| | | | | | | | | | |
| | | | | | Industrials (0.0%) | |
| 165
1,678,710 |
| | | | Copa Holdings, SA Call, 02/21/20, Strike $110.00 | | | 63,525 | |
| | | | | | | | | | |
| | | | | | Materials (0.3%) | |
| 4,509
1,699,893 |
| | | | Cemex, SAB de CV Call, 01/15/21, Strike $4.00 | | | 261,522 | |
| | | |
| 609
3,167,409 |
| | | | Rio Tinto, PLC Call, 04/17/20, Strike $60.00 | | | 50,242 | |
| | | |
| 1,492
1,751,608 |
| | | | Vale, SA Call, 01/15/21, Strike $12.00 | | | 249,164 | |
| | | | | | | | | | |
| | | | | | | | | 560,928 | |
| | | | | | | | | | |
| | | | | | Other (0.5%) | |
| 2,100
8,641,500 |
| | | | iShares ChinaLarge-Cap ETF Call, 01/17/20, Strike $46.00 | | | 13,650 | |
| | | |
| 5,000
21,290,000 |
| | | | iShares MSCI Emerging Markets ETF Put, 01/17/20, Strike $38.00 | | | 137,500 | |
| | | |
| 1,391
8,197,163 |
| | | | iShares MSCI South Korea ETF Call, 01/17/20, Strike $57.00 | | | 391,566 | |
| | | |
| 2,122
5,109,776 |
| | | | VanEck Vectors Russia ETF Call, 01/17/20, Strike $24.00 | | | 150,662 | |
| | | | | | |
| See accompanying Notes to Schedule of Investments | | www.calamos.com | | | 125 | |
Evolving World Growth Fund Schedule of Investments October 31, 2019
| | | | | | | | | | |
NUMBER OF CONTRACTS/ NOTIONAL AMOUNT | | | | | | | VALUE | |
| 1,265
3,531,880 |
| | | | Xtrackers Harvest CSI 300 China A Shares ETF Call, 01/15/21, Strike $30.71 | | $ | 194,178 | |
| | | | | | | | | | |
| | | | | | | | | 887,556 | |
| | | | | | | | | | |
| | | |
| | | | | | TOTAL PURCHASED OPTIONS
(Cost $4,585,196) | | | 2,647,932 | |
| | | | | | | | | | |
| | | | | | | | | | |
NUMBER OF SHARES | | | | | | | VALUE | |
|
| | SHORT TERM INVESTMENTS (0.2%) | |
| | 138,631 | | | | | Fidelity Prime Money Market Fund - Institutional Class, 1.890%*** | | | 138,686 | |
| | | |
| | 138,595 | | | | | Morgan Stanley Institutional Liquidity Funds - Government Portfolio,
1.720%*** | | | 138,595 | |
| | | | | | | | | | |
| | | |
| | | | | | TOTAL SHORT TERM INVESTMENTS
(Cost $277,281) | | | 277,281 | |
| | | | | | | | | | |
| | | | | | | | | | |
NUMBER OF SHARES/ PRINCIPAL
AMOUNT | | | | | | | VALUE | |
|
| INVESTMENT OF CASH COLLATERAL FOR SECURITIES
LOANED (0.8%) |
|
| | 1,297,500 | | | | | State Street Navigator Securities Lending Government Money Market Portfolio† (Cost $1,297,500) | | | 1,297,500 | |
| | | | | | | | | | |
| |
| TOTAL INVESTMENTS (100.0%)
(Cost $132,570,250) | | | 162,012,124 | |
| | | | | | | | | | |
| |
| | PAYABLE UPON RETURN OF SECURITIES ON LOAN(-0.8%) | | | (1,297,500 | ) |
| | | | | |
| |
| | OTHER ASSETS, LESS LIABILITIES (0.8%) | | | 1,249,603 | |
| | | | | |
| |
| | NET ASSETS (100.0%) | | $ | 161,964,227 | |
| | | | | |
NOTES TO SCHEDULE OF INVESTMENTS
| * | Securities issued and sold pursuant to a Rule 144A transaction are excepted from the registration requirement of the Securities Act of 1933, as amended. These securities may only be sold to qualified institutional buyers (“QIBs”), such as the Fund. Any resale of these securities must generally be effected through a sale that is registered under the Act or otherwise exempted from such registration requirements. |
| # | Non-income producing security. |
| ^ | Security, or portion of security, is on loan. |
| *** | The rate disclosed is the 7 day net yield as of October 31, 2019. |
| † | Represents investment of cash collateral received from securities on loan as of October 31, 2019. |
FOREIGN CURRENCY ABBREVIATIONS
| | |
| |
| BRL | | Brazilian Real |
| |
| CAD | | Canadian Dollar |
| |
| CHF | | Swiss Franc |
| |
| CNY | | Chinese Yuan Renminbi |
| |
| EUR | | European Monetary Unit |
| |
| GBP | | British Pound Sterling |
| |
| HKD | | Hong Kong Dollar |
| |
| IDR | | Indonesian Rupiah |
| |
| INR | | Indian Rupee |
| |
| JPY | | Japanese Yen |
| |
| KRW | | South Korean Won |
| |
| MXN | | Mexican Peso |
| |
| PHP | | Philippine Peso |
| |
| PLN | | Polish Zloty |
| |
| SGD | | Singapore Dollar |
| |
| TWD | | New Taiwan Dollar |
| |
| ZAR | | South African Rand |
Note: Value for securities denominated in foreign currencies is shown in U.S. dollars. The principal amount for such securities is shown in the respective foreign currency. The date on options represents the expiration date of the option contract. The option contract may be exercised at any date on or before the date shown.
CURRENCY EXPOSURE
OCTOBER 31, 2019
| | | | | | | | |
| | | VALUE | | | % OF TOTAL
INVESTMENTS | |
| | |
| US Dollar | | $ | 62,144,606 | | | | 38.4% | |
| Hong Kong Dollar | | | 18,815,688 | | | | 11.6% | |
| | |
| Indian Rupee | | | 18,638,136 | | | | 11.5% | |
| New Taiwan Dollar | | | 14,257,879 | | | | 8.8% | |
| | |
| European Monetary Unit | | | 11,218,780 | | | | 6.9% | |
| Brazilian Real | | | 7,522,660 | | | | 4.6% | |
| | |
| Chinese Yuan Renminbi | | | 7,502,400 | | | | 4.6% | |
| Japanese Yen | | | 3,514,325 | | | | 2.2% | |
| | |
| South Korean Won | | | 2,827,472 | | | | 1.8% | |
| Indonesian Rupiah | | | 2,611,904 | | | | 1.6% | |
| | |
| Philippine Peso | | | 1,987,802 | | | | 1.2% | |
| South African Rand | | | 1,924,612 | | | | 1.2% | |
| | |
| British Pound Sterling | | | 1,807,288 | | | | 1.1% | |
| Mexican Peso | | | 1,728,017 | | | | 1.1% | |
| | |
| Swiss Franc | | | 1,567,530 | | | | 1.0% | |
| Singapore Dollar | | | 1,428,043 | | | | 0.9% | |
| | |
| Canadian Dollar | | | 1,314,707 | | | | 0.8% | |
| Polish Zloty | | | 1,200,275 | | | | 0.7% | |
| | |
| Total Investments | | $ | 162,012,124 | | | | 100.0% | |
Currency exposure may vary over time.
| | | | |
| 126 | | CALAMOS OPEN-END FAMILY OF FUNDS ANNUAL REPORT | | See accompanying Notes to Financial Statements |
Global Equity Fund Schedule of Investments October 31, 2019
| | | | | | | | | | |
NUMBER OF SHARES | | | | | | | VALUE | |
|
| | COMMON STOCKS (100.6%) | |
| | | | | | Communication Services (10.3%) | |
| | 1,455 | | | | | Alphabet, Inc. - Class A# | | $ | 1,831,554 | |
| | | |
| | 72,000 | | | HKD | | Tencent Holdings, Ltd. | | | 2,920,530 | |
| | | |
| | 27,545 | | | | | Walt Disney Company~ | | | 3,578,646 | |
| | | | | | | | | | |
| | | | | | | | | 8,330,730 | |
| | | | | | | | | | |
| | | | | | Consumer Discretionary (16.2%) | |
| | 11,885 | | | | | Alibaba Group Holding, Ltd.# | | | 2,099,723 | |
| | | |
| | 1,490 | | | | | Amazon.com, Inc.#~ | | | 2,647,223 | |
| | | |
| | 11,155 | | | | | Aptiv, PLC | | | 998,930 | |
| | | |
| | 30,050 | | | GBP | | Compass Group, PLC | | | 800,054 | |
| | | |
| | 11,100 | | | | | Lowe’s Companies, Inc. | | | 1,238,871 | |
| | | |
| | 12,490 | | | | | Lululemon Athletica, Inc.#~ | | | 2,551,332 | |
| | | |
| | 1,140 | | | | | MercadoLibre, Inc.# | | | 594,533 | |
| | | |
| | 858 | | | | | Peloton Interactive, Inc.#^ | | | 20,481 | |
| | | |
| | 16,000 | | | EUR | | Puma, SE | | | 1,203,807 | |
| | | |
| | 3,400 | | | | | Roku, Inc.#^ | | | 500,480 | |
| | | |
| | 1,800 | | | | | Vail Resorts, Inc. | | | 418,266 | |
| | | | | | | | | | |
| | | | | | | | | 13,073,700 | |
| | | | | | | | | | |
| | | | | | Consumer Staples (6.1%) | |
| | 2,860 | | | | | Costco Wholesale Corp. | | | 849,735 | |
| | | |
| | 13,900 | | | EUR | | Danone, SA | | | 1,151,493 | |
| | | |
| | 22,183 | | | GBP | | Diageo, PLC | | | 907,972 | |
| | | |
| | 7,950 | | | EUR | | Kerry Group, PLC - Class A | | | 962,625 | |
| | | |
| | 9,025 | | | | | Walmart, Inc. | | | 1,058,271 | |
| | | | | | | | | | |
| | | | | | | | | 4,930,096 | |
| | | | | | | | | | |
| | | | | | Energy (3.6%) | |
| | 22,600 | | | EUR | | Neste Oyj | | | 816,594 | |
| | | |
| | 5,920 | | | | | Pioneer Natural Resources Company | | | 728,278 | |
| | | |
| | 29,800 | | | INR | | Reliance Industries, Ltd. | | | 614,531 | |
| | | |
| | 25,650 | | | EUR | | Royal Dutch Shell, PLC - Class A | | | 745,058 | |
| | | | | | | | | | |
| | | | | | | | | 2,904,461 | |
| | | | | | | | | | |
| | | | | | Financials (13.8%) | |
| | 6,086 | | | | | AON, PLC | | | 1,175,572 | |
| | | |
| | 38,825 | | | | | Bank of America Corp. | | | 1,214,058 | |
| | | |
| | 97,690 | | | INR | | HDFC Bank, Ltd. | | | 1,692,123 | |
| | | |
| | 53,435 | | | | | ICICI Bank, Ltd. | | | 696,258 | |
| | | |
| | 14,150 | | | | | Intercontinental Exchange, Inc. | | | 1,334,628 | |
| | | |
| | 6,700 | | | | | JPMorgan Chase & Company | | | 836,964 | |
| | | |
| | 526,100 | | | GBP | | Lloyds Banking Group, PLC | | | 387,002 | |
| | | |
| | 15,200 | | | GBP | | London Stock Exchange Group, PLC | | | 1,369,806 | |
| | | |
| | 33,750 | | | | | NMI Holdings, Inc. - Class A# | | | 987,188 | |
| | | |
| | 57,500 | | | HKD | | Ping An Insurance Group Company of China, Ltd. - Class H | | | 663,652 | |
| | | |
| | 11,850 | | | | | Progressive Corp. | | | 825,945 | |
| | | | | | | | | | |
| | | | | | | | | 11,183,196 | |
| | | | | | | | | | |
| | | | | | | | | | |
NUMBER OF SHARES | | | | | | | VALUE | |
| | | | | | | | | | |
| | | | | | Health Care (13.2%) | |
| | 31,075 | | | | | Alcon, Inc.#^ | | $ | 1,841,815 | |
| | | |
| | 13,140 | | | GBP | | AstraZeneca, PLC | | | 1,281,376 | |
| | | |
| | 18,525 | | | AUD | | CSL, Ltd. | | | 3,267,000 | |
| | | |
| | 14,600 | | | JPY | | Hoya Corp. | | | 1,290,308 | |
| | | |
| | 2,235 | | | | | Intuitive Surgical, Inc.# | | | 1,235,843 | |
| | | |
| | 3,710 | | | CHF | | Lonza Group, AG# | | | 1,337,204 | |
| | | |
| | 4,945 | | | | | Repligen Corp.# | | | 393,078 | |
| | | | | | | | | | |
| | | | | | | | | 10,646,624 | |
| | | | | | | | | | |
| | | Industrials (10.3%) | | | | |
| | 8,175 | | | EUR | | Airbus, SE | | | 1,172,771 | |
| | | |
| | 12,000 | | | SEK | | Atlas Copco, AB - Class A | | | 423,558 | |
| | | |
| | 3,950 | | | | | Boeing Company | | | 1,342,645 | |
| | | |
| | 48,600 | | | CAD | | CAE, Inc. | | | 1,218,782 | |
| | | |
| | 9,390 | | | | | CSX Corp. | | | 659,835 | |
| | | |
| | 18,500 | | | JPY | | Harmonic Drive Systems, Inc. | | | 857,969 | |
| | | |
| | 27,000 | | | | | Larsen & Toubro, Ltd. | | | 569,700 | |
| | | |
| | 6,200 | | | JPY | | Nidec Corp. | | | 912,800 | |
| | | |
| | 402,356 | | | CNY | | Sany Heavy Industry Company, Ltd. - Class A | | | 769,337 | |
| | | |
| | 3,800 | | | | | Waste Management, Inc. | | | 426,398 | |
| | | | | | | | | | |
| | | | | | | | | 8,353,795 | |
| | | | | | | | | | |
| | | | | | Information Technology (23.6%) | |
| | 5,870 | | | | | Accenture, PLC - Class A | | | 1,088,415 | |
| | | |
| | 1,325 | | | EUR | | Adyen, NV#* | | | 932,820 | |
| | | |
| | 6,330 | | | EUR | | ASML Holding, NV | | | 1,659,184 | |
| | | |
| | 7,600 | | | | | Coupa Software, Inc.#^ | | | 1,044,924 | |
| | | |
| | 2,700 | | | JPY | | Keyence Corp. | | | 1,707,200 | |
| | | |
| | 5,990 | | | | | Keysight Technologies, Inc.# | | | 604,451 | |
| | | |
| | 1,550 | | | | | Lam Research Corp. | | | 420,112 | |
| | | |
| | 8,600 | | | JPY | | Lasertec Corp. | | | 618,220 | |
| | | |
| | 7,245 | | | | | MasterCard, Inc. - Class A | | | 2,005,488 | |
| | | |
| | 7,600 | | | | | Microsoft Corp. | | | 1,089,612 | |
| | | |
| | 3,060 | | | | | NVIDIA Corp. | | | 615,121 | |
| | | |
| | 8,850 | | | | | PayPal Holdings, Inc.# | | | 921,285 | |
| | | |
| | 18,400 | | | EUR | | SAP, SE | | | 2,438,027 | |
| | | |
| | 2,030 | | | | | Shopify, Inc., Class A# | | | 636,547 | |
| | | |
| | 6,960 | | | EUR | | SOITEC# | | | 767,695 | |
| | | |
| | 118,000 | | | TWD | | Taiwan Semiconductor Manufacturing Company, Ltd. | | | 1,156,376 | |
| | | |
| | 27,300 | | | | | Taiwan Semiconductor Manufacturing Company, Ltd. | | | 1,409,499 | |
| | | | | | | | | | |
| | | | | | | | | 19,114,976 | |
| | | | | | | | | | |
| | | | | | Materials (2.7%) | | | | |
| | 3,100 | | | | | Linde, PLC | | | 614,885 | |
| | | |
| | 5,000 | | | CHF | | Sika, AG | | | 859,532 | |
| | | |
| | 188,300 | | | CAD | | Yamana Gold, Inc. | | | 687,665 | |
| | | | | | | | | | |
| | | | | | | | | 2,162,082 | |
| | | | | | | | | | |
| | | | | | |
| See accompanying Notes to Schedule of Investments | | www.calamos.com | | | 127 | |
Global Equity Fund Schedule of Investments October 31, 2019
| | | | | | | | | | |
NUMBER OF SHARES | | | | | | | VALUE | |
| | | | | | | | | | |
| | | | | | Real Estate (0.8%) | | | | |
| | 46,600 | | | INR | | Godrej Properties, Ltd.# | | $ | 654,013 | |
| | | | | | | | | | |
| | | |
| | | | | | TOTAL COMMON STOCKS
(Cost $64,069,142) | | | 81,353,673 | |
| | | | | | | | | | |
| | | | | | | | | | |
NUMBER OF CONTRACTS/ NOTIONAL AMOUNT | | | | | | | VALUE | |
|
| | PURCHASED OPTIONS (0.1%)# | |
| | | | | | Consumer Discretionary (0.1%) | |
| 106
1,872,702 |
| | | | Alibaba Group Holding, Ltd. Put, 01/17/20, Strike $160.00 | | | 33,920 | |
| | | |
| 59
1,205,193 |
| | | | Lululemon Athletica, Inc. Put, 01/17/20, Strike $165.00 | | | 12,006 | |
| | | |
| 11
573,672 |
| | | | MercadoLibre, Inc. Put, 11/15/19, Strike $510.00 | | | 28,160 | |
| | | | | | | | | | |
| | | | | | | | | 74,086 | |
| | | | | | | | | | |
| | | | | | Information Technology (0.0%) | |
| 29
759,713 |
| | | | ASML Holding, NV Put, 01/17/20, Strike $200.00 | | | 2,103 | |
| | | |
| 142
1,867,300 |
| | | | SAP, SE Put, 01/17/20, Strike $110.00 | | | 7,100 | |
| | | | | | | | | | |
| | | | | | | | | 9,203 | |
| | | | | | | | | | |
| | | | | | Other (0.0%) | |
| 600
7,343,400 |
| | | | iShares Russell 2000 Value ETF Call, 11/15/19, Strike $125.00 | | | 25,500 | |
| | | | | | | | | | |
| | | |
| | | | | | TOTAL PURCHASED OPTIONS
(Cost $348,089) | | | 108,789 | |
| | | | | | | | | | |
| | | | | | | | | | |
NUMBER OF SHARES | | | | | | | VALUE | |
|
| | SHORT TERM INVESTMENTS (0.0%) | |
| | 423 | | | | | Fidelity Prime Money Market Fund - Institutional Class, 1.890%*** | | | 423 | |
| | | |
| | 395 | | | | | Morgan Stanley Institutional Liquidity Funds - Government Portfolio,
1.720%*** | | | 395 | |
| | | | | | | | | | |
| | | |
| | | | | | TOTAL SHORT TERM INVESTMENTS (Cost $818) | | | 818 | |
| | | | | | | | | | |
| | | | | | | | | | |
| | | | | | | | | | |
NUMBER OF SHARES/ PRINCIPAL
AMOUNT | | | | | | | VALUE | |
|
| INVESTMENT OF CASH COLLATERAL FOR SECURITIES
LOANED (0.1%) |
|
| | 72,557 | | | | | State Street Navigator Securities Lending Government Money Market Portfolio† (Cost $72,557) | | $ | 72,557 | |
| | | | | | | | | | |
| |
| TOTAL INVESTMENTS (100.8%)
(Cost $64,490,606) | | | 81,535,837 | |
| | | | | | | | | | |
| |
| | PAYABLE UPON RETURN OF SECURITIES ON LOAN(-0.1%) | | | (72,557 | ) |
| | | | | |
| |
| | LIABILITIES, LESS OTHER ASSETS(-0.7%) | | | (597,797 | ) |
| | | | | |
| |
| | NET ASSETS (100.0%) | | $ | 80,865,483 | |
| | | | | |
| | | | | | | | | | |
NUMBER OF
CONTRACTS/
NOTIONAL
AMOUNT | | | | | | | VALUE | |
|
| | WRITTEN OPTIONS (0.0%)# | |
| | | | | | Consumer Discretionary (0.0%) | | | | |
| 106
1,872,702 |
| | | | Alibaba Group Holding, Ltd. Put, 01/17/20, Strike $145.00 | | | (10,070 | ) |
| | | |
| 59
1,205,193 |
| | | | Lululemon Athletica, Inc. Put, 01/17/20, Strike $145.00 | | | (3,511 | ) |
| | | | | | | | | | |
| | | | | | | | | (13,581 | ) |
| | | | | | | | | | |
| | | | | | Information Technology (0.0%) | |
| 29
759,713 |
| | | | ASML Holding, NV Put, 01/17/20, Strike $180.00 | | | (870 | ) |
| | | |
| 142
1,867,300 |
| | | | SAP, SE Put, 01/17/20, Strike $100.00 | | | (2,840 | ) |
| | | | | | | | | | |
| | | | | | | | | (3,710 | ) |
| | | | | | | | | | |
| | | |
| | | | | | TOTAL WRITTEN OPTIONS
(Premium $97,441) | | $ | (17,291 | ) |
| | | | | | | | | | |
NOTES TO SCHEDULE OF INVESTMENTS
| # | Non-income producing security. |
| ~ | Security, or portion of security, is segregated as collateral (or collateral for potential future transactions) for written options. The aggregate value of such securities is $81,416. |
| ^ | Security, or portion of security, is on loan. |
| * | Securities issued and sold pursuant to a Rule 144A transaction are excepted from the registration requirement of the Securities Act of 1933, as amended. These securities may only be sold to qualified institutional buyers (“QIBs”), such as the Fund. Any resale of these securities must generally be effected through a sale that is registered under the Act or otherwise exempted from such registration requirements. |
| *** | The rate disclosed is the 7 day net yield as of October 31, 2019. |
| † | Represents investment of cash collateral received from securities on loan as of October 31, 2019. |
| | | | |
| 128 | | CALAMOS OPEN-END FAMILY OF FUNDS ANNUAL REPORT | | See accompanying Notes to Financial Statements |
Global Equity Fund Schedule of Investments October 31, 2019
FOREIGN CURRENCY ABBREVIATIONS
| | |
| |
| AUD | | Australian Dollar |
| |
| CAD | | Canadian Dollar |
| |
| CHF | | Swiss Franc |
| |
| CNY | | Chinese Yuan Renminbi |
| |
| EUR | | European Monetary Unit |
| |
| GBP | | British Pound Sterling |
| |
| HKD | | Hong Kong Dollar |
| |
| INR | | Indian Rupee |
| |
| JPY | | Japanese Yen |
| |
| SEK | | Swedish Krona |
| |
| TWD | | New Taiwan Dollar |
Note: Value for securities denominated in foreign currencies is shown in U.S. dollars. The date on options represents the expiration date of the option contract. The option contract may be exercised at any date on or before the date shown.
CURRENCY EXPOSURE
OCTOBER 31, 2019
| | | | | | | | |
| | | VALUE | | | % OF TOTAL
INVESTMENTS | |
| | |
| US Dollar | | $ | 43,271,462 | | | | 53.1% | |
| European Monetary Unit | | | 11,850,074 | | | | 14.5% | |
| | |
| Japanese Yen | | | 5,386,497 | | | | 6.6% | |
| British Pound Sterling | | | 4,746,210 | | | | 5.8% | |
| | |
| Hong Kong Dollar | | | 3,584,182 | | | | 4.4% | |
| Australian Dollar | | | 3,267,000 | | | | 4.0% | |
| | |
| Indian Rupee | | | 2,960,667 | | | | 3.6% | |
| Swiss Franc | | | 2,196,736 | | | | 2.7% | |
| | |
| Canadian Dollar | | | 1,906,447 | | | | 2.4% | |
| New Taiwan Dollar | | | 1,156,376 | | | | 1.4% | |
| | |
| Chinese Yuan Renminbi | | | 769,337 | | | | 1.0% | |
| Swedish Krona | | | 423,558 | | | | 0.5% | |
| | |
| Total Investments Net of Written Options | | $ | 81,518,546 | | | | 100.0% | |
Currency exposure may vary over time.
| | | | | | |
| See accompanying Notes to Financial Statements | | www.calamos.com | | | 129 | |
Global Growth and Income Fund Schedule of Investments October 31, 2019
| | | | | | | | | | |
PRINCIPAL AMOUNT | | | | | | | VALUE | |
|
| | CONVERTIBLE BONDS (23.3%) | |
| | | | | | Communication Services (1.9%) | |
| | 1,015,000 | | | | | GCI Liberty, Inc.*
1.750%, 09/30/46 | | $ | 1,364,693 | |
| | | |
| | 1,511,000 | | | | | Snap, Inc.*
0.750%, 08/01/26 | | | 1,532,554 | |
| | | | | | | | | | |
| | | | | | | | | 2,897,247 | |
| | | | | | | | | | |
| | | | | | Consumer Discretionary (4.6%) | | | | |
| | 835,000 | | | | | Baozun, Inc.*
1.625%, 05/01/24 | | | 890,953 | |
| | | |
| | 6,000,000 | | | HKD | | China Conch Venture Holdings International, Ltd.
0.000%, 09/05/23 | | | 806,391 | |
| | | |
| | 1,340,000 | | | | | GOL Equity Finance, SA*
3.750%, 07/15/24 | | | 1,546,594 | |
| | | |
| | 694,000 | | | | | Pinduoduo, Inc.*
0.000%, 10/01/24 | | | 807,639 | |
| | | |
| | 838,000 | | | | | Tesla, Inc.
2.000%, 05/15/24 | | | 1,026,986 | |
| | | |
| | 689,000 | | | | | Winnebago Industries, Inc.
1.500%, 04/01/25 | | | 702,780 | |
| | | |
| | 9,000,000 | | | HKD | | Zhongsheng Group Holdings, Ltd.
0.000%, 05/23/23 | | | 1,258,992 | |
| | | | | | | | | | |
| | | | | | | | | 7,040,335 | |
| | | | | | | | | | |
| | | | | | Consumer Staples (0.8%) | | | | |
| | | | | | Premium Brands Holdings Corp. | | | | |
| | 732,000 | | | CAD | | 4.650%, 04/30/21 | | | 609,754 | |
| | 780,000 | | | CAD | | 4.600%, 12/31/23 | | | 627,233 | |
| | | | | | | | | | |
| | | | | | | | | 1,236,987 | |
| | | | | | | | | | |
| | | | | | Energy (2.2%) | | | | |
| | 2,800,000 | | | | | Tullow Oil Jersey, Ltd.
6.625%, 07/12/21 | | | 3,255,532 | |
| | | | | | | | | | |
| | | | | | Financials (4.5%) | | | | |
| | 1,100,000 | | | EUR | | AURELIUS Equity Opportunities SE & Co., KGaA
1.000%, 12/01/20 | | | 1,213,439 | |
| | | |
| | | | | | JPMorgan Chase Bank, N.A. | | | | |
| | 2,800,000 | | | | | 0.000%, 12/30/20 | | | 3,226,650 | |
| | 17,000,000 | | | HKD | | 0.000%, 10/29/20* | | | 2,338,491 | |
| | | | | | | | | | |
| | | | | | | | | 6,778,580 | |
| | | | | | | | | | |
| | | | | | Health Care (1.5%) | | | | |
| | 1,021,000 | | | CAD | | Canopy Growth Corp.*
4.250%, 07/15/23 | | | 695,731 | |
| | | |
| | 779,000 | | | | | Insulet Corp.*
0.375%, 09/01/26 | | | 745,593 | |
| | | |
| | 756,000 | | | | | Repligen Corp.
0.375%, 07/15/24 | | | 760,948 | |
| | | | | | | | | | |
| | | | | | | | | 2,202,272 | |
| | | | | | | | | | |
| | | | | | Industrials (1.0%) | | | | |
| | 1,200,000 | | | | | Vinci, SA
0.375%, 02/16/22 | | | 1,480,572 | |
| | | | | | | | | | |
| | | | | | | | | | |
PRINCIPAL AMOUNT | | | | | | | VALUE | |
| | | | | | | | | | |
| | | | | | Information Technology (5.0%) | |
| | 993,000 | | | | | Coupa Software, Inc.*
0.125%, 06/15/25 | | $ | 1,133,038 | |
| | | |
| | 1,360,000 | | | EUR | | SOITEC
0.000%, 06/28/23 | | | 1,866,568 | |
| | | |
| | 741,000 | | | | | Splunk, Inc.
0.500%, 09/15/23 | | | 805,449 | |
| | | |
| | 2,010,000 | | | | | Square, Inc.
0.500%, 05/15/23 | | | 2,227,020 | |
| | | |
| | 1,280,000 | | | | | Xero Investments, Ltd.
2.375%, 10/04/23 | | | 1,579,347 | |
| | | | | | | | | | |
| | | | | | | | | 7,611,422 | |
| | | | | | | | | | |
| | | | | | Materials (1.8%) | | | | |
| | 1,200,000 | | | CHF | | Sika, AG
3.750%, 01/30/22 | | | 1,567,530 | |
| | | |
| | 1,000,000 | | | | | Taiwan Cement Corp.
0.000%, 12/10/23 | | | 1,192,015 | |
| | | | | | | | | | |
| | | | | | | | | 2,759,545 | |
| | | | | | | | | | |
| | | |
| | | | | | TOTAL CONVERTIBLE BONDS (Cost $34,594,676) | | | 35,262,492 | |
| | | | | | | | | | |
| | | | | | | | | | |
|
| | U.S. GOVERNMENT AND AGENCY SECURITIES (3.0%) | |
| | | | | | United States Treasury Note | | | | |
| | 1,507,000 | | | | | 1.750%, 10/31/20 | | | 1,509,325 | |
| | 1,502,000 | | | | | 2.625%, 08/15/20 | | | 1,513,999 | |
| | 1,489,000 | | | | | 2.625%, 11/15/20 | | | 1,504,559 | |
| | | | | | | | | | |
| | | |
| | | | | | TOTAL U.S. GOVERNMENT AND AGENCY SECURITIES (Cost $4,485,025) | | | 4,527,883 | |
| | | | | | | | | | |
| | | | | | | | | | |
NUMBER OF SHARES | | | | | | | VALUE | |
|
| | CONVERTIBLE PREFERRED STOCKS (5.5%) | |
| | | | | | Health Care (1.0%) | | | | |
| | 1,335 | | | | | Danaher Corp.
4.750%, 04/15/22 | | | 1,482,277 | |
| | | | | | | | | | |
| | | | | | Information Technology (1.2%) | |
| | 1,750 | | | | | Broadcom, Inc.
8.000%, 09/30/22 | | | 1,895,285 | |
| | | | | | | | | | |
| | | | | | Real Estate (1.1%) | | | | |
| | 1,360 | | | | | Crown Castle International Corp.
6.875%, 08/01/20 | | | 1,694,138 | |
| | | | | | | | | | |
| | | | | | Utilities (2.2%) | | | | |
| | 16,600 | | | | | American Electric Power Company, Inc.
6.125%, 03/15/22 | | | 912,834 | |
| | | |
| | 47,689 | | | | | NextEra Energy, Inc.
4.872%, 09/01/22 | | | 2,425,463 | |
| | | | | | | | | | |
| | | | | | | | | 3,338,297 | |
| | | | | | | | | | |
| | | |
| | | | | | TOTAL CONVERTIBLE PREFERRED STOCKS (Cost $7,847,331) | | | 8,409,997 | |
| | | | | | | | | | |
| | | | |
| 130 | | CALAMOS OPEN-END FAMILY OF FUNDS ANNUAL REPORT | | See accompanying Notes to Schedule of Investments |
Global Growth and Income Fund Schedule of Investments October 31, 2019
| | | | | | | | | | |
NUMBER OF SHARES | | | | | | | VALUE | |
|
| | COMMON STOCKS (64.9%) | |
| | | | | | Communication Services (8.6%) | |
| | 1,470 | | | | | Alphabet, Inc. - Class A# | | $ | 1,850,436 | |
| | | |
| | 74,800 | | | HKD | | Tencent Holdings, Ltd. | | | 3,034,106 | |
| | | |
| | 16,600 | | | | | Verizon Communications, Inc. | | | 1,003,802 | |
| | | |
| | 54,600 | | | | | Walt Disney Company | | | 7,093,632 | |
| | | | | | | | | | |
| | | | | | | | | 12,981,976 | |
| | | | | | | | | | |
| | | | | | Consumer Discretionary (7.8%) | | | | |
| | 13,780 | | | | | Alibaba Group Holding, Ltd.# | | | 2,434,513 | |
| | | |
| | 530 | | | | | Amazon.com, Inc.# | | | 941,630 | |
| | | |
| | 20,600 | | | | | Aptiv, PLC | | | 1,844,730 | |
| | | |
| | 57,100 | | | GBP | | Compass Group, PLC | | | 1,520,235 | |
| | | |
| | 14,300 | | | | | Lowe’s Companies, Inc. | | | 1,596,023 | |
| | | |
| | 7,400 | | | | | Lululemon Athletica, Inc.# | | | 1,511,598 | |
| | | |
| | 25,700 | | | EUR | | Puma, SE | | | 1,933,615 | |
| | | | | | | | | | |
| | | | | | | | | 11,782,344 | |
| | | | | | | | | | |
| | | | | | Consumer Staples (9.2%) | | | | |
| | 38,240 | | | CAD | | Alimentation Couche-Tard, Inc. - Class B | | | 1,146,823 | |
| | | |
| | 32,800 | | | | | Coca-Cola Company | | | 1,785,304 | |
| | | |
| | 5,250 | | | | | Costco Wholesale Corp. | | | 1,559,827 | |
| | | |
| | 26,000 | | | EUR | | Danone, SA | | | 2,153,871 | |
| | | |
| | 19,100 | | | GBP | | Diageo, PLC | | | 781,782 | |
| | | |
| | 16,000 | | | EUR | | Kerry Group, PLC - Class A | | | 1,937,359 | |
| | | |
| | 14,500 | | | CHF | | Nestlé, SA | | | 1,551,229 | |
| | | |
| | 26,000 | | | | | Walmart, Inc. | | | 3,048,760 | |
| | | | | | | | | | |
| | | | | | | | | 13,964,955 | |
| | | | | | | | | | |
| | | | | | Energy (3.9%) | | | | |
| | 116,800 | | | GBP | | BP, PLC | | | 740,671 | |
| | | |
| | 7,000 | | | | | Chevron Corp. | | | 812,980 | |
| | | |
| | 18,300 | | | | | Exxon Mobil Corp. | | | 1,236,531 | |
| | | |
| | 21,000 | | | EUR | | Neste Oyj | | | 758,781 | |
| | | |
| | 55,000 | | | INR | | Reliance Industries, Ltd. | | | 1,134,202 | |
| | | |
| | 41,500 | | | EUR | | Royal Dutch Shell, PLC - Class A | | | 1,205,454 | |
| | | | | | | | | | |
| | | | | | | | | 5,888,619 | |
| | | | | | | | | | |
| | | | | | Financials (7.3%) | | | | |
| | 9,000 | | | | | AON, PLC | | | 1,738,440 | |
| | | |
| | 98,500 | | | | | Bank of America Corp. | | | 3,080,095 | |
| | | |
| | 150,200 | | | INR | | HDFC Bank, Ltd. | | | 2,601,667 | |
| | | |
| | 12,200 | | | | | JPMorgan Chase & Company | | | 1,524,024 | |
| | | |
| | 968,000 | | | GBP | | Lloyds Banking Group, PLC | | | 712,067 | |
| | | |
| | 20,000 | | | | | Progressive Corp. | | | 1,394,000 | |
| | | | | | | | | | |
| | | | | | | | | 11,050,293 | |
| | | | | | | | | | |
| | | | | | Health Care (8.5%) | | | | |
| | 44,786 | | | | | Alcon, Inc.#^ | | | 2,654,466 | |
| | | |
| | 21,400 | | | GBP | | AstraZeneca, PLC | | | 2,086,868 | |
| | | | | | | | | | |
NUMBER OF SHARES | | | | | | | VALUE | |
| | | |
| | 29,300 | | | AUD | | CSL, Ltd. | | $ | 5,167,238 | |
| | | |
| | 2,550 | | | | | Intuitive Surgical, Inc.# | | | 1,410,023 | |
| | | |
| | 9,200 | | | | | Laboratory Corp. of America Holdings# | | | 1,515,884 | |
| | | | | | | | | | |
| | | | | | | | | 12,834,479 | |
| | | | | | | | | | |
| | | | | | Industrials (5.9%) | | | | |
| | 21,600 | | | SEK | | Atlas Copco, AB - Class A | | | 762,404 | |
| | | |
| | 5,150 | | | | | Boeing Company | | | 1,750,537 | |
| | | |
| | 59,700 | | | CAD | | CAE, Inc. | | | 1,497,146 | |
| | | |
| | 7,100 | | | JPY | | FANUC Corp. | | | 1,400,470 | |
| | | |
| | 17,300 | | | JPY | | Harmonic Drive Systems, Inc.^ | | | 802,317 | |
| | | |
| | 55,200 | | | INR | | Larsen & Toubro, Ltd. | | | 1,146,031 | |
| | | |
| | 11,400 | | | JPY | | Nidec Corp. | | | 1,678,374 | |
| | | | | | | | | | |
| | | | | | | | | 9,037,279 | |
| | | | | | | | | | |
| | | | | | Information Technology (12.4%) | | | | |
| | 2,000 | | | EUR | | Adyen, NV*# | | | 1,408,030 | |
| | | |
| | 8,225 | | | EUR | | ASML Holding, NV | | | 2,155,890 | |
| | | |
| | 4,900 | | | JPY | | Keyence Corp. | | | 3,098,252 | |
| | | |
| | 10,700 | | | JPY | | Lasertec Corp. | | | 769,181 | |
| | | |
| | 7,700 | | | | | MasterCard, Inc. - Class A | | | 2,131,437 | |
| | | |
| | 7,900 | | | | | Micron Technology, Inc.# | | | 375,645 | |
| | | |
| | 15,800 | | | | | Microsoft Corp. | | | 2,265,246 | |
| | | |
| | 1,900 | | | | | NVIDIA Corp. | | | 381,938 | |
| | | |
| | 22,700 | | | EUR | | SAP, SE | | | 3,007,783 | |
| | | |
| | 174,000 | | | TWD | | Taiwan Semiconductor Manufacturing Company, Ltd. | | | 1,705,165 | |
| | | |
| | 29,000 | | | | | Taiwan Semiconductor Manufacturing Company, Ltd. | | | 1,497,270 | |
| | | | | | | | | | |
| | | | | | | | | 18,795,837 | |
| | | | | | | | | | |
| | | | | | Materials (1.3%) | | | | |
| | 5,700 | | | | | Linde, PLC | | | 1,130,595 | |
| | | |
| | 234,000 | | | CAD | | Yamana Gold, Inc. | | | 854,559 | |
| | | | | | | | | | |
| | | | | | | | | 1,985,154 | |
| | | | | | | | | | |
| | | |
| | | | | | TOTAL COMMON STOCKS (Cost $80,006,380) | | | 98,320,936 | |
| | | | | | | | | | |
| | | | | | | | | | |
NUMBER OF CONTRACTS/ NOTIONAL AMOUNT | | | | | | | VALUE | |
|
| | PURCHASED OPTIONS (1.1%) # | |
| | | | | | Consumer Discretionary (0.1%) | | | | |
| 16
2,842,656 |
| | | | Amazon.com, Inc. Call, 06/18/21, Strike $2,200.00 | | | 188,000 | |
| | | | | | | | | | |
| | | | | | Energy (0.0%) | | | | |
| 70
861,140 |
| | | | Pioneer Natural Resources Company Call, 01/17/20, Strike $160.00 | | | 3,500 | |
| | | | | | | | | | |
| | | | | | Financials (0.3%) | | | | |
| 296
2,791,872 |
| | | | Intercontinental Exchange, Inc. Call, 01/15/21, Strike $90.00 | | | 389,240 | |
| | | | | | | | | | |
| | | | | | |
| See accompanying Notes to Schedule of Investments | | www.calamos.com | | | 131 | |
Global Growth and Income Fund Schedule of Investments October 31, 2019
| | | | | | | | | | |
NUMBER OF CONTRACTS/ NOTIONAL AMOUNT | | | | | | | VALUE | |
| | | | | | | | | | |
| | | | | | Industrials (0.2%) | | | | |
| 200
2,568,400 |
| | EUR | | Airbus, SE Call, 12/18/20, Strike 130.00 | | $ | 272,914 | |
| | | |
| 232
1,630,264 |
| | | | CSX Corp. Call, 01/15/21, Strike $85.00 | | | 71,572 | |
| | | | | | | | | | |
| | | | | | | | | 344,486 | |
| | | | | | | | | | |
| | | | | | Information Technology (0.2%) | | | | |
| 63
1,707,552 |
| | | | Lam Research Corp. Call, 01/15/21, Strike $300.00 | | | 180,652 | |
| | | |
| 27
846,639 |
| | | | Shopify, Inc. Call, 01/15/21, Strike $350.00 | | | 149,175 | |
| | | | | | | | | | |
| | | | | | | | | 329,827 | |
| | | | | | | | | | |
| | | | | | Other (0.3%) | | | | |
| 1,100
13,462,900 |
| | | | iShares Russell 2000 Value ETF Call, 11/15/19, Strike $125.00 | | | 46,750 | |
| | | |
| 133
40,399,548 |
| | | | S&P 500 Index Put, 01/17/20, Strike $2,800.00 | | | 301,245 | |
| | | | | | | | | | |
| | | | | | | | | 347,995 | |
| | | | | | | | | | |
| | | |
| | | | | | TOTAL PURCHASED OPTIONS (Cost $2,630,576) | | | 1,603,048 | |
| | | | | | | | | | |
| | | | | | | | | | |
NUMBER OF SHARES | | | | | | | VALUE | |
|
| | SHORT TERM INVESTMENTS (0.5%) | |
| | 374,815 | | | | | Fidelity Prime Money Market Fund - Institutional Class, 1.890%*** | | | 374,965 | |
| | | |
| | 374,370 | | | | | Morgan Stanley Institutional Liquidity Funds - Government Portfolio,
1.720%*** | | | 374,370 | |
| | | | | | | | | | |
| | | |
| | | | | | TOTAL SHORT TERM INVESTMENTS (Cost $749,335) | | | 749,335 | |
| | | | | | | | | | |
| |
| TOTAL INVESTMENTS (98.3%)
(Cost $130,313,323) | | | 148,873,691 | |
| | | | | | | | | | |
| |
| | OTHER ASSETS, LESS LIABILITIES (1.7%) | | | 2,532,105 | |
| | | | | | | | | | |
| |
| | NET ASSETS (100.0%) | | $ | 151,405,796 | |
| | | | | | | | | | |
| | | | | | | | | | |
NUMBER OF CONTRACTS/ NOTIONAL AMOUNT | | | | | | | VALUE | |
|
| | WRITTEN OPTION (0.0%) | |
| | | | | | Other (0.0%) | | | | |
| 33
10,023,948 |
| | | | S&P 500 Index Put, 01/17/20, Strike $2,500.00 (Premium $96,781) | | | (18,645 | ) |
| | | | | | | | | | |
NOTES TO SCHEDULE OF INVESTMENTS
| * | Securities issued and sold pursuant to a Rule 144A transaction are excepted from the registration requirement of the Securities Act of 1933, as amended. These securities may only be sold to qualified institutional buyers (“QIBs”), such as the Fund. Any resale of these securities must generally be effected through a sale that is registered under the Act or otherwise exempted from such registration requirements. |
| # | Non-income producing security. |
| ^ | Security, or portion of security, is on loan. |
| *** | The rate disclosed is the 7 day net yield as of October 31, 2019. |
FOREIGN CURRENCY ABBREVIATIONS
| | |
| |
| AUD | | Australian Dollar |
| |
| CAD | | Canadian Dollar |
| |
| CHF | | Swiss Franc |
| |
| EUR | | European Monetary Unit |
| |
| GBP | | British Pound Sterling |
| |
| HKD | | Hong Kong Dollar |
| |
| INR | | Indian Rupee |
| |
| JPY | | Japanese Yen |
| |
| SEK | | Swedish Krona |
| |
| TWD | | New Taiwan Dollar |
Note: Value for securities denominated in foreign currencies is shown in U.S. dollars. The principal amount for such securities is shown in the respective foreign currency. The date on options represents the expiration date of the option contract. The option contract may be exercised at any date on or before the date shown.
CURRENCY EXPOSURE
OCTOBER 31, 2019
| | | | | | | | |
| | | VALUE | | | % OF TOTAL INVESTMENTS | |
| | |
| US Dollar | | $ | 88,846,433 | | | | 59.7% | |
| European Monetary Unit | | | 17,913,704 | | | | 12.0% | |
| | |
| Japanese Yen | | | 7,748,594 | | | | 5.2% | |
| Hong Kong Dollar | | | 7,437,980 | | | | 5.0% | |
| | |
| British Pound Sterling | | | 5,841,623 | | | | 3.9% | |
| Canadian Dollar | | | 5,431,246 | | | | 3.7% | |
| | |
| Australian Dollar | | | 5,167,238 | | | | 3.5% | |
| Indian Rupee | | | 4,881,900 | | | | 3.3% | |
| | |
| Swiss Franc | | | 3,118,759 | | | | 2.1% | |
| New Taiwan Dollar | | | 1,705,165 | | | | 1.1% | |
| | |
| Swedish Krona | | | 762,404 | | | | 0.5% | |
| Total Investments | | $ | 148,855,046 | | | | 100.0% | |
Currency exposure may vary over time.
| | | | |
| 132 | | CALAMOS OPEN-END FAMILY OF FUNDS ANNUAL REPORT | | See accompanying Notes to Financial Statements |
Total Return Bond Fund Schedule of Investments October 31, 2019
| | | | | | | | | | |
PRINCIPAL AMOUNT | | | | | | | VALUE | |
|
| | CORPORATE BONDS (41.6%) | |
| | | | | | Airlines (0.7%) | | | | |
| | 128,300 | | | | | Air Canada2015-2 Class AA Pass Through Trust*
3.750%, 06/15/29 | | $ | 135,606 | |
| | | |
| | 150,000 | | | | | British Airways Pass Through TrustSeries 2019-1, Class A*
3.350%, 12/15/30 | | | 153,327 | |
| | | |
| | 105,229 | | | | | UAL Pass Through Trust Series2007-1
6.636%, 01/02/24 | | | 111,762 | |
| | | | | | | | | | |
| | | | | | | | | 400,695 | |
| | | | | | | | | | |
| | | | | | Communication Services (3.3%) | |
| | 125,000 | | | | | AT&T, Inc.
3.600%, 07/15/25 | | | 132,246 | |
| | | |
| | 250,000 | | | | | Comcast Corp.
3.900%, 03/01/38 | | | 275,440 | |
| | | |
| | 110,000 | | | | | Crown Castle Towers, LLC*
3.720%, 07/15/43 | | | 113,650 | |
| | | |
| | 200,000 | | | | | CSC Holdings, LLC*
5.500%, 05/15/26 | | | 211,530 | |
| | | |
| | 175,000 | | | | | Electronic Arts, Inc.
4.800%, 03/01/26 | | | 200,022 | |
| | | |
| | 135,000 | | | | | Embarq Corp.
7.995%, 06/01/36 | | | 133,832 | |
| | | |
| | 150,000 | | | | | Fox Corp.*
3.666%, 01/25/22 | | | 155,427 | |
| | | |
| | 110,000 | | | | | Hughes Satellite Systems Corp.
5.250%, 08/01/26 | | | 117,986 | |
| | | |
| | 125,000 | | | | | Inmarsat Finance, PLC*
4.875%, 05/15/22 | | | 126,729 | |
| | | |
| | 125,000 | | | | | T-Mobile USA, Inc.^
4.000%, 04/15/22 | | | 129,236 | |
| | | |
| | 135,000 | | | | | United States Cellular Corp.
6.700%, 12/15/33 | | | 146,700 | |
| | | |
| | 255,000 | | | | | Verizon Communications, Inc.^
4.016%, 12/03/29 | | | 285,725 | |
| | | | | | | | | | |
| | | | | | | | | 2,028,523 | |
| | | | | | | | | | |
| | | | | | Consumer Discretionary (5.8%) | |
| | 200,000 | | | | | Allergan Funding SCS
3.800%, 03/15/25 | | | 210,774 | |
| | | |
| | 250,000 | | | | | BMW US Capital, LLC*^
3.100%, 04/12/21 | | | 254,356 | |
| | | |
| | 275,000 | | | | | Cargill, Inc.*
3.250%, 03/01/23 | | | 285,898 | |
| | | |
| | 150,000 | | | | | CCO Holdings, LLC / CCO Holdings Capital Corp.*
5.750%, 02/15/26 | | | 158,841 | |
| | | |
| | 250,000 | | | | | D.R. Horton, Inc.
4.750%, 02/15/23 | | | 267,227 | |
| | | |
| | 130,000 | | | | | Delta Air Lines Pass Through TrustSeries 2019-1, Class AA
3.204%, 10/25/25 | | | 135,476 | |
| | | | | | | | | | |
PRINCIPAL AMOUNT | | | | | | | VALUE | |
| | | |
| | 100,000 | | | | | DISH DBS Corp.^
7.750%, 07/01/26 | | $ | 101,150 | |
| | | |
| | 250,000 | | | | | Ford Motor Credit Company, LLC
5.875%, 08/02/21 | | | 262,287 | |
| | | |
| | 250,000 | | | | | General Motors Financial Company, Inc.
3.700%, 05/09/23 | | | 256,858 | |
| | | |
| | 250,000 | | | | | Harley-Davidson Financial Services, Inc.*
4.050%, 02/04/22 | | | 258,625 | |
| | | |
| | 250,000 | | | | | Hasbro, Inc.
3.150%, 05/15/21 | | | 253,138 | |
| | | |
| | 125,000 | | | | | International Game Technology, PLC*
6.250%, 02/15/22 | | | 132,369 | |
| | | |
| | 150,000 | | | | | JetBlue2019-1 Class AA Pass Through Trust
2.750%, 11/15/33 | | | 151,708 | |
| | | |
| | 125,000 | | | | | Las Vegas Sands Corp.
3.200%, 08/08/24 | | | 128,021 | |
| | | |
| | 150,000 | | | | | Lennar Corp.
4.750%, 11/15/22 | | | 158,137 | |
| | | |
| | 100,000 | | | | | Mattel, Inc.*
6.750%, 12/31/25 | | | 104,821 | |
| | | |
| | 125,000 | | | | | Newell Brands, Inc.
3.850%, 04/01/23 | | | 129,536 | |
| | | |
| | 125,000 | | | | | Penske Automotive Group, Inc.
3.750%, 08/15/20 | | | 126,213 | |
| | | |
| | 169,000 | | | | | US Airways Pass Through TrustSeries 2012-2, Class B
6.750%, 12/03/22 | | | 177,742 | |
| | | | | | | | | | |
| | | | | | | | | 3,553,177 | |
| | | | | | | | | | |
| | | | | | Consumer Staples (2.5%) | | | | |
| | 200,000 | | | | | Brown-Forman Corp.
3.500%, 04/15/25 | | | 212,912 | |
| | | |
| | 250,000 | | | | | Conagra Brands, Inc.
3.800%, 10/22/21 | | | 258,165 | |
| | | |
| | 250,000 | | | | | General Mills, Inc.
2.600%, 10/12/22 | | | 253,838 | |
| | | |
| | 150,000 | | | | | JBS USA LUX, SA / JBS USA Finance, Inc.*
5.875%, 07/15/24 | | | 154,772 | |
| | | |
| | 150,000 | | | | | Land O’Lakes, Inc.*
6.000%, 11/15/22 | | | 159,692 | |
| | | |
| | 250,000 | | | | | Mondelez International Holdings Netherlands, BV*
2.000%, 10/28/21 | | | 250,031 | |
| | | |
| | 250,000 | | | | | WM Wrigley Jr. Company*
3.375%, 10/21/20 | | | 253,339 | |
| | | | | | | | | | |
| | | | | | | | | 1,542,749 | |
| | | | | | | | | | |
| | | | | | Energy (0.9%) | | | | |
| | 150,000 | | | | | Continental Resources, Inc.
4.500%, 04/15/23 | | | 156,166 | |
| | | |
| | 175,000 | | | | | Energy Transfer Operating, LP‡
4.927%, 11/01/66
3 mo. USD LIBOR + 3.02% | | | 131,656 | |
| | | | | | |
| See accompanying Notes to Schedule of Investments | | www.calamos.com | | | 133 | |
Total Return Bond Fund Schedule of Investments October 31, 2019
| | | | | | | | | | |
PRINCIPAL AMOUNT | | | | | | | VALUE | |
| | | |
| | 250,000 | | | | | Schlumberger Investment, SA*
3.300%, 09/14/21 | | $ | 255,599 | |
| | | | | | | | | | |
| | | | | | | | | 543,421 | |
| | | | | | | | | | |
| | | | | | Financials (12.7%) | | | | |
| | 150,000 | | | | | Ally Financial, Inc.
4.125%, 02/13/22 | | | 155,173 | |
| | | |
| | 250,000 | | | | | American Express Company
3.000%, 10/30/24 | | | 259,909 | |
| | | |
| | 125,000 | | | | | Ares Capital Corp.
4.200%, 06/10/24 | | | 129,863 | |
| | | |
| | 250,000 | | | | | Axis Specialty Finance, PLC
4.000%, 12/06/27 | | | 268,174 | |
| | | |
| | 300,000 | | | | | Bank of America Corp.‡ 3.366%, 01/23/26 3 mo. USD LIBOR + 0.81% | | | 314,178 | |
| | | |
| | 250,000 | | | | | Bank of Montreal^
3.300%, 02/05/24 | | | 261,319 | |
| | | |
| | 125,000 | | | | | Bank of Nova Scotia
2.450%, 09/19/22 | | | 126,903 | |
| | | |
| | 150,000 | | | | | Berkshire Hathaway Finance Corp.
4.250%, 01/15/49 | | | 179,444 | |
| | | |
| | 200,000 | | | | | Capital One Financial Corp.
3.200%, 01/30/23 | | | 205,641 | |
| | | |
| | 250,000 | | | | | CIT Bank NA‡ 2.969%, 09/27/25 SOFR + 1.72% | | | 251,417 | |
| | | |
| | 250,000 | | | | | CIT Group, Inc.
4.125%, 03/09/21 | | | 255,639 | |
| | | |
| | 200,000 | | | | | Danske Bank, A/S*‡ 3.001%, 09/20/22 3 mo. USD LIBOR + 1.25% | | | 201,781 | |
| | | |
| | 350,000 | | | | | Discover Bank
3.450%, 07/27/26 | | | 363,025 | |
| | | |
| | 200,000 | | | | | Fifth Third Bancorp
3.650%, 01/25/24 | | | 211,248 | |
| | | |
| | 125,000 | | | | | Franklin Resources, Inc.
2.850%, 03/30/25 | | | 129,461 | |
| | | |
| | 125,000 | | | | | Goldman Sachs Group, Inc.^‡ 3.814%, 04/23/29 3 mo. USD LIBOR + 1.16% | | | 133,174 | |
| | | |
| | 125,000 | | | | | Huntington Bancshares, Inc.
2.625%, 08/06/24 | | | 126,848 | |
| | | |
| | 250,000 | | | | | ILFCE-Capital Trust II*‡ 4.020%, 12/21/65 3 mo. USD LIBOR + 1.80% | | | 192,102 | |
| | | |
| | 300,000 | | | | | JPMorgan Chase & Company‡ 3.220%, 03/01/25 3 mo. USD LIBOR + 1.16% | | | 311,779 | |
| | | |
| | 125,000 | | | | | Life Storage, LP
4.000%, 06/15/29 | | | 134,417 | |
| | | |
| | 200,000 | | | | | Lloyds Banking Group, PLC‡ 2.858%, 03/17/23 3 mo. USD LIBOR + 1.25% | | | 202,195 | |
| | | | | | | | | | |
PRINCIPAL AMOUNT | | | | | | | VALUE | |
| | | |
| | 200,000 | | | | | Macquarie Group, Ltd.*‡ 4.150%, 03/27/24 3 mo. USD LIBOR + 1.33% | | $ | 211,167 | |
| | | |
| | 250,000 | | | | | Markel Corp.
3.500%, 11/01/27 | | | 259,180 | |
| | | |
| | 200,000 | | | | | MetLife, Inc.
6.400%, 12/15/66 | | | 242,940 | |
| | | |
| | 200,000 | | | | | Morgan Stanley‡ 2.720%, 07/22/25 SOFR + 1.15% | | | 203,126 | |
| | | |
| | 150,000 | | | | | PNC Financial Services Group, Inc.
2.200%, 11/01/24 | | | 150,879 | |
| | | |
| | 125,000 | | | | | Reinsurance Group of America, Inc.
3.900%, 05/15/29 | | | 134,173 | |
| | | |
| | 250,000 | | | | | RenaissanceRe Finance, Inc.^
3.450%, 07/01/27 | | | 265,519 | |
| | | |
| | 125,000 | | | | | Royal Bank of Canada^
2.550%, 07/16/24 | | | 127,086 | |
| | | |
| | 125,000 | | | | | Sabra Health Care, LP / Sabra Capital Corp.
4.800%, 06/01/24 | | | 131,945 | |
| | | |
| | 96,000 | | | | | SBA Tower Trust*
2.877%, 07/15/46 | | | 96,302 | |
| | | |
| | 100,000 | | | | | Starwood Property Trust, Inc.
4.750%, 03/15/25 | | | 104,140 | |
| | | |
| | 150,000 | | | | | State Street Corp.‡ 2.354%, 11/01/25 SOFR + 0.94% | | | 151,019 | |
| | | |
| | 125,000 | | | | | Torchmark Corp.
4.550%, 09/15/28 | | | 140,130 | |
| | | |
| | 170,000 | | | | | Toronto-Dominion Bank^
3.250%, 03/11/24 | | | 178,242 | |
| | | |
| | 200,000 | | | | | Travelers Companies, Inc.
4.050%, 03/07/48 | | | 232,992 | |
| | | |
| | 250,000 | | | | | US Bancorp
3.600%, 09/11/24 | | | 267,096 | |
| | | |
| | 125,000 | | | | | Ventas Realty, LP
4.000%, 03/01/28 | | | 135,419 | |
| | | |
| | | | | | Wells Fargo & Company | | | | |
| | 125,000 | | | | | 4.400%, 06/14/46^ | | | 142,058 | |
| | 125,000 | | | | | 3.196%, 06/17/27‡ 3 mo. USD LIBOR + 1.17% | | | 129,778 | |
| | | | | | | | | | |
| | | | | | | | | 7,716,881 | |
| | | | | | | | | | |
| | | | | | Health Care (2.9%) | | | | |
| | 150,000 | | | | | CVS Health Corp.
4.780%, 03/25/38 | | | 167,033 | |
| | | |
| | 125,000 | | | | | DaVita, Inc.
5.125%, 07/15/24 | | | 128,063 | |
| | | |
| | 150,000 | | | | | DH Europe Finance II Sarl
2.200%, 11/15/24 | | | 150,920 | |
| | | |
| | 92,000 | | | | | Elanco Animal Health, Inc.
3.912%, 08/27/21 | | | 94,448 | |
| | | |
| | 200,000 | | | | | Humana, Inc.
3.850%, 10/01/24 | | | 212,298 | |
| | | | |
| 134 | | CALAMOS OPEN-END FAMILY OF FUNDS ANNUAL REPORT | | See accompanying Notes to Schedule of Investments |
Total Return Bond Fund Schedule of Investments October 31, 2019
| | | | | | | | | | |
PRINCIPAL AMOUNT | | | | | | | VALUE | |
| | | |
| | 250,000 | | | | | Johnson & Johnson
3.400%, 01/15/38 | | $ | 270,694 | |
| | | |
| | 200,000 | | | | | Magellan Health, Inc.
4.900%, 09/22/24 | | | 199,824 | |
| | | |
| | 125,000 | | | | | Tenet Healthcare Corp.*
4.625%, 09/01/24 | | | 128,512 | |
| | | |
| | | | | | Teva Pharmaceutical Finance Netherlands III, BV | | | | |
| | 250,000 | | | | | 6.000%, 04/15/24^ | | | 234,461 | |
| | 50,000 | | | | | 2.200%, 07/21/21 | | | 47,551 | |
| | | |
| | 125,000 | | | | | UnitedHealth Group, Inc.
2.375%, 08/15/24 | | | 126,778 | |
| | | | | | | | | | |
| | | | | | | | | 1,760,582 | |
| | | | | | | | | | |
| | | | | | Industrials (3.4%) | | | | |
| | | | | | Aircastle, Ltd. | | | | |
| | 205,000 | | | | | 5.000%, 04/01/23 | | | 219,939 | |
| | 125,000 | | | | | 5.500%, 02/15/22 | | | 132,927 | |
| | | |
| | 50,000 | | | | | American Airlines Group, Inc.*
5.000%, 06/01/22 | | | 52,191 | |
| | | |
| | 200,000 | | | | | Delta Air Lines, Inc.
3.625%, 03/15/22 | | | 204,951 | |
| | | |
| | 88,188 | | | | | Hawaiian Airlines Pass Through Certificates Series2013-1, Class B
4.950%, 07/15/23 | | | 90,057 | |
| | | |
| | 125,000 | | | | | Hertz Corp.*
7.625%, 06/01/22 | | | 130,219 | |
| | | |
| | 250,000 | | | | | Park Aerospace Holdings, Ltd.*
5.250%, 08/15/22 | | | 266,231 | |
| | | |
| | 200,000 | | | | | Rockwell Collins, Inc.
2.800%, 03/15/22 | | | 203,801 | |
| | | |
| | 125,000 | | | | | Ryder System, Inc.
2.500%, 09/01/24 | | | 126,104 | |
| | | |
| | 183,766 | | | | | United Airlines Pass Through TrustSeries 2018-1, Class B
4.600%, 09/01/27 | | | 191,795 | |
| | | |
| | 250,000 | | | | | Verisk Analytics, Inc.
4.125%, 09/12/22 | | | 263,625 | |
| | | |
| | 200,000 | | | | | Volkswagen Group of America Finance, LLC*^
2.500%, 09/24/21 | | | 201,428 | |
| | | | | | | | | | |
| | | | | | | | | 2,083,268 | |
| | | | | | | | | | |
| | | | | | Information Technology (2.5%) | | | | |
| | 125,000 | | | | | Anixter, Inc.
5.125%, 10/01/21 | | | 129,368 | |
| | | |
| | 250,000 | | | | | Apple, Inc.
4.375%, 05/13/45 | | | 302,035 | |
| | | |
| | 100,000 | | | | | Dell International, LLC / EMC Corp.*
6.020%, 06/15/26 | | | 114,230 | |
| | | |
| | 250,000 | | | | | Fiserv, Inc.
3.500%, 10/01/22 | | | 259,787 | |
| | | |
| | 125,000 | | | | | Hewlett Packard Enterprise Company
4.900%, 10/15/25 | | | 139,611 | |
| | | |
| | 250,000 | | | | | Microsoft Corp.
4.100%, 02/06/37 | | | 296,412 | |
| | | | | | | | | | |
PRINCIPAL AMOUNT | | | | | | | VALUE | |
| | | |
| | 250,000 | | | | | NXP, BV / NXP Funding, LLC*
4.125%, 06/01/21 | | $ | 257,098 | |
| | | | | | | | | | |
| | | | | | | | | 1,498,541 | |
| | | | | | | | | | |
| | | | | | Materials (0.9%) | | | | |
| | 200,000 | | | | | Alcoa Nederland Holding, BV*
6.750%, 09/30/24 | | | 211,126 | |
| | | |
| | 75,000 | | | | | ArcelorMittal, SA^
7.000%, 10/15/39 | | | 91,904 | |
| | | |
| | 250,000 | | | | | Georgia-Pacific, LLC*
3.600%, 03/01/25 | | | 265,760 | |
| | | | | | | | | | |
| | | | | | | | | 568,790 | |
| | | | | | | | | | |
| | | | | | Real Estate (2.4%) | | | | |
| | 250,000 | | | | | American Tower Corp.
5.900%, 11/01/21 | | | 268,640 | |
| | | |
| | 250,000 | | | | | EPR Properties
4.950%, 04/15/28 | | | 274,700 | |
| | | |
| | 125,000 | | | | | Federal Realty Investment Trust
3.200%, 06/15/29 | | | 130,777 | |
| | | |
| | 190,000 | | | | | HCP, Inc.
3.250%, 07/15/26 | | | 198,459 | |
| | | |
| | 125,000 | | | | | Hospitality Properties Trust
3.950%, 01/15/28 | | | 120,723 | |
| | | |
| | 150,000 | | | | | SL Green Operating Partnership, LP
3.250%, 10/15/22 | | | 153,842 | |
| | | |
| | 125,000 | | | | | Tanger Properties, LP^
3.875%, 07/15/27 | | | 128,289 | |
| | | |
| | 200,000 | | | | | UDR, Inc.
4.625%, 01/10/22 | | | 210,976 | |
| | | | | | | | | | |
| | | | | | | | | 1,486,406 | |
| | | | | | | | | | |
| | | | | | Utilities (3.6%) | | | | |
| | 250,000 | | | | | AES Corp.
4.000%, 03/15/21 | | | 254,799 | |
| | | |
| | 250,000 | | | | | Alabama Power Company^
2.450%, 03/30/22 | | | 253,797 | |
| | | |
| | 150,000 | | | | | Berkshire Hathaway Energy Company
3.800%, 07/15/48 | | | 163,093 | |
| | | |
| | 250,000 | | | | | CenterPoint Energy, Inc.
3.850%, 02/01/24 | | | 265,065 | |
| | | |
| | 150,000 | | | | | DTE Energy Company
2.250%, 11/01/22 | | | 150,338 | |
| | | |
| | 150,000 | | | | | Duke Energy Carolinas, LLC
3.700%, 12/01/47 | | | 164,018 | |
| | | |
| | 250,000 | | | | | Exelon Corp.
2.450%, 04/15/21 | | | 251,615 | |
| | | |
| | 100,000 | | | | | NGPL PipeCo, LLC*
4.875%, 08/15/27 | | | 107,764 | |
| | | |
| | 150,000 | | | | | Northern States Power Co.
3.750%, 12/01/47 | | | 157,970 | |
| | | |
| | 150,000 | | | | | Public Service Electric & Gas Company 3.600%, 12/01/47 | | | 164,659 | |
| | | | | | |
| See accompanying Notes to Schedule of Investments | | www.calamos.com | | | 135 | |
Total Return Bond Fund Schedule of Investments October 31, 2019
| | | | | | | | | | |
PRINCIPAL AMOUNT | | | | | | | VALUE | |
| | | |
| | 250,000 | | | | | Southern California Edison Company
3.400%, 06/01/23 | | $ | 258,275 | |
| | | | | | | | | | |
| | | | | | | | | 2,191,393 | |
| | | | | | | | | | |
| | | |
| | | | | | TOTAL CORPORATE BONDS (Cost $24,337,698) | | | 25,374,426 | |
| | | | | | | | | | |
| | | | | | | | | | |
|
| | BANK LOANS (2.9%)‡ | |
| | | | | | Communication Services (0.4%) | | | | |
| | 124,373 | | | | | Sprint Communications, Inc. 4.813%, 02/02/24 1 mo. LIBOR + 3.00% | | | 123,829 | |
| | | |
| | 124,362 | | | | | Zayo Group, LLC / Zayo Capital, Inc. 3.786%, 01/19/21 1 mo. LIBOR + 2.00% | | | 124,751 | |
| | | | | | | | | | |
| | | | | | | | | 248,580 | |
| | | | | | | | | | |
| | | | | | Financials (0.9%) | | | | |
| | 190,485 | | | | | GLP Financing, LLC 3.300%, 04/28/21 1 mo. LIBOR + 1.50% | | | 190,009 | |
| | | |
| | 250,000 | | | | | Level 3 Financing, Inc. 4.036%, 02/22/24 1 mo. LIBOR + 2.25% | | | 250,625 | |
| | | |
| | 124,356 | | | | | MGM Growth Properties Operating Partnership LP 3.786%, 03/21/25 1 mo. LIBOR + 2.00% | | | 124,891 | |
| | | | | | | | | | |
| | | | | | | | | 565,525 | |
| | | | | | | | | | |
| | | | | | Health Care (1.1%) | | | | |
| | 280,583 | | | | | Mallinckrodt International Finance, SA 4.854%, 09/24/24 3 mo. LIBOR + 2.75% | | | 221,361 | |
| | | |
| | 271,499 | | | | | Amneal Pharmaceuticals, LLC 5.313%, 05/04/25 1 mo. LIBOR + 3.50% | | | 208,240 | |
| | | |
| | 248,111 | | | | | HCA, Inc. 3.536%, 03/13/25 1 mo. LIBOR + 1.75% | | | 249,506 | |
| | | | | | | | | | |
| | | | | | | | | 679,107 | |
| | | | | | | | | | |
| | | | | | Industrials (0.4%) | | | | |
| | 125,000 | | | | | Berry Global, Inc. 4.189%, 10/01/22 1 mo. LIBOR + 2.25% | | | 125,523 | |
| | | |
| | 124,367 | | | | | Navistar International Corp. 5.420%, 11/06/24 1 mo. LIBOR + 3.50% | | | 123,357 | |
| | | | | | | | | | |
| | | | | | | | | 248,880 | |
| | | | | | | | | | |
| | | | | | Information Technology (0.1%) | |
| | 41,783 | | | | | SS&C Technologies, Inc. 4.036%, 07/08/22 1 mo. LIBOR + 2.25% | | | 42,109 | |
| | | | | | | | | | |
| | | |
| | | | | | TOTAL BANK LOANS (Cost $1,903,303) | | | 1,784,201 | |
| | | | | | | | | | |
| | | | | | | | | | |
| | | | | | | | | | |
PRINCIPAL AMOUNT | | | | | | | VALUE | |
|
| | U.S. GOVERNMENT AND AGENCY SECURITIES (44.6%) | |
| | | | | | Federal National Mortgage Association | | | | |
| | 1,050,726 | | | | | 3.500%, 02/01/49 | | $ | 1,080,701 | |
| | 950,371 | | | | | 3.000%, 07/01/46 | | | 974,715 | |
| | 806,469 | | | | | 3.500%, 08/01/47 | | | 835,723 | |
| | 788,144 | | | | | 4.000%, 06/01/48 | | | 818,656 | |
| | 466,535 | | | | | 3.000%, 03/01/47 | | | 478,486 | |
| | 442,963 | | | | | 4.500%, 04/01/48 | | | 465,439 | |
| | 392,031 | | | | | 4.000%, 03/01/47 | | | 410,921 | |
| | 391,325 | | | | | 3.000%, 02/01/33 | | | 402,076 | |
| | 317,970 | | | | | 2.500%, 09/01/31 | | | 322,988 | |
| | | |
| | 678,757 | | | | | Freddie Mac Multifamily Structured Pass Through Certificates Class A1
2.892%, 06/25/27 | | | 704,169 | |
| | | |
| | 460,000 | | | | | Freddie Mac Multifamily Structured Pass Through Certificates Class A2
3.350%, 01/25/28 | | | 500,189 | |
| | | |
| | | | | | Government National Mortgage Association II Pool | | | | |
| | 715,449 | | | | | 3.500%, 10/20/47 | | | 745,335 | |
| | 487,406 | | | | | 3.000%, 10/20/47 | | | 502,616 | |
| | | |
| | 1,500,000 | | | | | United States Treasury Bill^
0.000%, 11/19/19 | | | 1,498,860 | |
| | | |
| | | | | | United States Treasury Bond | | | | |
| | 1,400,000 | | | | | 2.250%, 08/15/49 | | | 1,420,781 | |
| | 1,000,000 | | | | | 3.500%, 02/15/39 | | | 1,240,937 | |
| | 1,000,000 | | | | | 2.750%, 08/15/47^ | | | 1,117,891 | |
| | 750,000 | | | | | 2.875%, 11/15/46^ | | | 857,168 | |
| | 500,000 | | | | | 3.000%, 05/15/47 | | | 584,961 | |
| | 300,000 | | | | | 3.000%, 02/15/49 | | | 353,367 | |
| | | |
| | | | | | United States Treasury Inflation Indexed Note | | | | |
| | 1,040,110 | | | | | 0.500%, 01/15/28 | | | 1,066,145 | |
| | 540,935 | | | | | 0.375%, 07/15/25 | | | 549,263 | |
| | | |
| | | | | | United States Treasury Note | | | | |
| | 3,000,000 | | | | | 1.250%, 08/31/24 | | | 2,963,672 | |
| | 2,000,000 | | | | | 1.625%, 08/15/29^ | | | 1,988,281 | |
| | 2,000,000 | | | | | 1.375%, 08/31/26 | | | 1,970,781 | |
| | 1,350,000 | | | | | 1.750%, 06/30/24 | | | 1,363,711 | |
| | 750,000 | | | | | 2.875%, 11/30/25 | | | 805,869 | |
| | 500,000 | | | | | 2.500%, 02/28/26 | | | 527,285 | |
| | 400,000 | | | | | 1.875%, 06/30/26 | | | 406,969 | |
| | 250,000 | | | | | 1.750%, 07/31/24 | | | 252,598 | |
| | | | | | | | | | |
| | | |
| | | | | | TOTAL U.S. GOVERNMENT AND AGENCY SECURITIES (Cost $26,206,341) | | | 27,210,553 | |
| | | | | | | | | | |
| | | | | | | | | | |
|
| | ASSET BACKED SECURITIES (5.9%) | |
| | 250,000 | | | | | Credit Acceptance Auto Loan TrustSeries 2018-3A, Class A*
3.550%, 08/15/27 | | | 254,827 | |
| | | |
| | 235,000 | | | | | Dell Equipment Finance TrustSeries 2017-2, Class B*
2.470%, 10/24/22 | | | 235,492 | |
| | | |
| | 127,943 | | | | | Enterprise Fleet Financing, LLCSeries 2018-1, Class A2*
2.870%, 10/20/23 | | | 128,652 | |
| | | |
| | 500,000 | | | | | Ford Credit Floorplan Master Owner Trust Series2018-1, Class A1
2.950%, 05/15/23 | | | 507,548 | |
| | | | |
| 136 | | CALAMOS OPEN-END FAMILY OF FUNDS ANNUAL REPORT | | See accompanying Notes to Schedule of Investments |
Total Return Bond Fund Schedule of Investments October 31, 2019
| | | | | | | | | | |
PRINCIPAL AMOUNT | | | | | | | VALUE | |
| | | |
| | 307,659 | | | | | Hertz Fleet Lease Funding, LPSeries 2018-1, Class A2*
3.230%, 05/10/32 | | $ | 310,052 | |
| | | |
| | 459,738 | | | | | MVW Owner Trust Series2019-1A, Class A*
2.890%, 11/20/36 | | | 468,296 | |
| | | |
| | 300,000 | | | | | OSCAR US Funding Trust IX, LLCSeries 2018-2A, Class A3*
3.390%, 09/12/22 | | | 304,260 | |
| | | |
| | 132,074 | | | | | SoFi Consumer Loan Program Trust Series2018-4, Class A*
3.540%, 11/26/27 | | | 133,367 | |
| | | |
| | 272,954 | | | | | SoFi Professional Loan Program LLC Series2016-C, Class A2B*
2.360%, 12/27/32 | | | 273,491 | |
| | | |
| | 500,000 | | | | | SoFi Professional Loan Program LLC Series2017-F, Class A2FX*
2.840%, 01/25/41 | | | 507,402 | |
| | | |
| | 500,000 | | | | | Toyota Auto Loan Extended Note Trust Series2019-1A, Class A*
2.560%, 11/25/31 | | | 510,978 | |
| | | | | | | | | | |
| | | |
| | | | | | TOTAL ASSET BACKED SECURITIES (Cost $3,582,569) | | | 3,634,365 | |
| | | | | | | | | | |
| | | | | | | | | | |
NUMBER OF SHARES | | | | | | | VALUE | |
|
| | SHORT TERM INVESTMENTS (5.7%) | |
| | 1,742,951 | | | | | Fidelity Prime Money Market Fund - Institutional Class, 1.890%*** | | | 1,743,648 | |
| | | |
| | 1,743,216 | | | | | Morgan Stanley Institutional Liquidity Funds - Government Portfolio,
1.720%*** | | | 1,743,216 | |
| | | | | | | | | | |
| | | |
| | | | | | TOTAL SHORT TERM INVESTMENTS (Cost $3,486,786) | | | 3,486,864 | |
| | | | | | | | | | |
| | | | | | | | | | |
NUMBER OF SHARES/ PRINCIPAL
AMOUNT | | | | | | | VALUE | |
|
| INVESTMENT OF CASH COLLATERAL FOR SECURITIES
LOANED (7.7%) |
|
| | 4,728,925 | | | | | State Street Navigator Securities Lending Government Money Market Portfolio† (Cost $4,728,925) | | | 4,728,925 | |
| | | | | | | | | | |
| |
| TOTAL INVESTMENTS (108.4%)
(Cost $64,245,622) | | | 66,219,334 | |
| | | | | | | | | | |
| |
| | PAYABLE UPON RETURN OF SECURITIES ON LOAN(-7.7%) | | | (4,728,925 | ) |
| | | | | | | | | | |
| |
| | LIABILITIES, LESS OTHER ASSETS(-0.7%) | | | (426,868 | ) |
| | | | | | | | | | |
| |
| | NET ASSETS (100.0%) | | $ | 61,063,541 | |
| | | | | | | | | | |
NOTES TO SCHEDULE OF INVESTMENTS
| * | Securities issued and sold pursuant to a Rule 144A transaction are excepted from the registration requirement of the Securities Act of 1933, as amended. These securities may only be sold to qualified institutional buyers (“QIBs”), such as the Fund. Any resale of these securities must generally be effected through a sale that is registered under the Act or otherwise exempted from such registration requirements. |
| ^ | Security, or portion of security, is on loan. |
| ‡ | Variable rate security. The rate shown is the rate in effect at October 31, 2019. |
| *** | The rate disclosed is the 7 day net yield as of October 31, 2019. |
| † | Represents investment of cash collateral received from securities on loan as of October 31, 2019. |
| | | | | | |
| See accompanying Notes to Financial Statements | | www.calamos.com | | | 137 | |
High Income Opportunities Fund Schedule of Investments October 31, 2019
| | | | | | | | | | |
PRINCIPAL AMOUNT | | | | | | | VALUE | |
|
| | CORPORATE BONDS (79.1%) | |
| | | | | | Communication Services (13.4%) | | | | |
| | 300,000 | | | | | Altice France, SA*
7.375%, 05/01/26 | | $ | 321,456 | |
| | | |
| | 125,000 | | | | | Arrow Bidco, LLC*
9.500%, 03/15/24 | | | 121,424 | |
| | | |
| | 44,000 | | | | | Belo Corp.
7.250%, 09/15/27 | | | 50,203 | |
| | | |
| | 196,000 | | | | | Cincinnati Bell, Inc.*
8.000%, 10/15/25 | | | 175,114 | |
| | | |
| | | | | | CommScope, Inc.* | | | | |
| | 115,000 | | | | | 5.500%, 03/01/24 | | | 116,857 | |
| | 25,000 | | | | | 8.250%, 03/01/27 | | | 23,708 | |
| | | |
| | 80,000 | | | | | Consolidated Communications, Inc.^
6.500%, 10/01/22 | | | 72,328 | |
| | | |
| | | | | | CSC Holdings, LLC* | | | | |
| | 315,000 | | | | | 5.750%, 01/15/30 | | | 331,260 | |
| | 200,000 | | | | | 5.500%, 05/15/26 | | | 211,530 | |
| | 200,000 | | | | | 5.500%, 04/15/27 | | | 212,541 | |
| | | |
| | 75,000 | | | | | Cumulus Media New Holdings, Inc.*
6.750%, 07/01/26 | | | 79,601 | |
| | | |
| | | | | | Diamond Sports Group, LLC / Diamond Sports Finance Company* | | | | |
| | 100,000 | | | | | 5.375%, 08/15/26 | | | 104,582 | |
| | 85,000 | | | | | 6.625%, 08/15/27^ | | | 87,751 | |
| | | |
| | 612,000 | | | | | Embarq Corp.
7.995%, 06/01/36 | | | 606,703 | |
| | | |
| | | | | | Entercom Media Corp.* | | | | |
| | 120,000 | | | | | 7.250%, 11/01/24^ | | | 125,401 | |
| | 50,000 | | | | | 6.500%, 05/01/27 | | | 52,565 | |
| | | |
| | | | | | Frontier Communications Corp. | | | | |
| | 265,000 | | | | | 7.625%, 04/15/24 | | | 119,581 | |
| | 220,000 | | | | | 11.000%, 09/15/25 | | | 103,794 | |
| | 125,000 | | | | | 10.500%, 09/15/22 | | | 58,837 | |
| | 80,000 | | | | | 8.500%, 04/01/26* | | | 80,316 | |
| | 50,000 | | | | | 8.000%, 04/01/27* | | | 52,628 | |
| | | |
| | 25,000 | | | | | Go Daddy Operating Company, LLC / GD Finance Company, Inc.*
5.250%, 12/01/27 | | | 26,528 | |
| | | |
| | 175,000 | | | | | Gray Television, Inc.*
7.000%, 05/15/27 | | | 191,585 | |
| | | |
| | | | | | Hughes Satellite Systems Corp. | | | | |
| | 90,000 | | | | | 6.625%, 08/01/26^ | | | 97,871 | |
| | 30,000 | | | | | 5.250%, 08/01/26 | | | 32,178 | |
| | | |
| | 55,000 | | | | | iHeartCommunications, Inc.^
8.375%, 05/01/27 | | | 59,108 | |
| | | |
| | 450,000 | | | | | Inmarsat Finance, PLC*
4.875%, 05/15/22 | | | 456,226 | |
| | | |
| | | | | | Intelsat Jackson Holdings, SA | | | | |
| | 195,000 | | | | | 9.750%, 07/15/25* | | | 203,054 | |
| | 50,000 | | | | | 5.500%, 08/01/23 | | | 46,818 | |
| | | |
| | | | | | Netflix, Inc. | | | | |
| | 80,000 | | | | | 4.875%, 06/15/30* | | | 80,946 | |
| | 45,000 | | | | | 4.875%, 04/15/28 | | | 46,525 | |
| | | | | | | | | | |
PRINCIPAL AMOUNT | | | | | | | VALUE | |
| | | |
| | 125,000 | | | | | Qwest Corp.
6.875%, 09/15/33 | | $ | 125,926 | |
| | | |
| | 125,000 | | | | | Scripps Escrow, Inc.*^
5.875%, 07/15/27 | | | 128,415 | |
| | | |
| | | | | | Sprint Corp. | | | | |
| | 310,000 | | | | | 7.125%, 06/15/24 | | | 336,888 | |
| | 240,000 | | | | | 7.875%, 09/15/23 | | | 265,409 | |
| | 145,000 | | | | | 7.625%, 03/01/26 | | | 160,959 | |
| | | |
| | 140,000 | | | | | T-Mobile USA, Inc.
4.750%, 02/01/28 | | | 147,780 | |
| | | |
| | 80,000 | | | | | Telecom Italia Capital, SA
6.000%, 09/30/34 | | | 85,864 | |
| | | |
| | 196,000 | | | | | United States Cellular Corp.
6.700%, 12/15/33 | | | 212,986 | |
| | | |
| | | | | | Windstream Services, LLC / Windstream Finance Corp.@ | | | | |
| | 42,000 | | | | | 7.750%, 10/01/21 | | | 7,825 | |
| | 24,000 | | | | | 10.500%, 06/30/24* | | | 12,990 | |
| | | |
| | 55,000 | | | | | Zayo Group, LLC / Zayo Capital, Inc.*
5.750%, 01/15/27 | | | 56,056 | |
| | | | | | | | | | |
| | | | | | | | | 5,890,117 | |
| | | | | | | | | | |
| | | | | | Consumer Discretionary (13.5%) | | | | |
| | 115,000 | | | | | Ashton Woods USA, LLC / Ashton Woods Finance Company*
9.875%, 04/01/27 | | | 128,691 | |
| | | |
| | 190,000 | | | | | Beverages & More, Inc.*
11.500%, 06/15/22 | | | 136,482 | |
| | | |
| | 140,000 | | | | | Boyd Gaming Corp.
6.000%, 08/15/26 | | | 148,939 | |
| | | |
| | 155,000 | | | | | Caesars Resort Collection, LLC / CRC Finco, Inc.*
5.250%, 10/15/25 | | | 158,772 | |
| | | |
| | | | | | CCO Holdings, LLC / CCO Holdings Capital Corp.* | | | | |
| | 430,000 | | | | | 5.125%, 05/01/27 | | | 454,994 | |
| | 170,000 | | | | | 5.000%, 02/01/28 | | | 178,039 | |
| | | |
| | 75,000 | | | | | Cedar Fair, LP*
5.250%, 07/15/29 | | | 80,278 | |
| | | |
| | | | | | Century Communities, Inc. | | | | |
| | 125,000 | | | | | 6.750%, 06/01/27* | | | 133,753 | |
| | 85,000 | | | | | 5.875%, 07/15/25 | | | 88,153 | |
| | | |
| | 263,000 | | | | | Dana, Inc.
5.500%, 12/15/24 | | | 270,639 | |
| | | |
| | | | | | DISH DBS Corp. | | | | |
| | 150,000 | | | | | 7.750%, 07/01/26^ | | | 151,725 | |
| | 90,000 | | | | | 5.875%, 11/15/24 | | | 90,305 | |
| | | |
| | 270,000 | | | | | Eldorado Resorts, Inc.
6.000%, 04/01/25 | | | 284,722 | |
| | | |
| | | | | | ESH Hospitality, Inc.* | | | | |
| | 130,000 | | | | | 5.250%, 05/01/25 | | | 134,398 | |
| | 50,000 | | | | | 4.625%, 10/01/27 | | | 50,263 | |
| | | |
| | | | | | Ford Motor Credit Company, LLC | | | | |
| | 200,000 | | | | | 4.134%, 08/04/25 | | | 199,522 | |
| | 200,000 | | | | | 3.664%, 09/08/24 | | | 197,752 | |
| | | | |
| 138 | | CALAMOS OPEN-END FAMILY OF FUNDS ANNUAL REPORT | | See accompanying Notes to Schedule of Investments |
High Income Opportunities Fund Schedule of Investments October 31, 2019
| | | | | | | | | | |
PRINCIPAL AMOUNT | | | | | | | VALUE | |
| | | |
| | 175,000 | | | | | goeasy, Ltd.*
7.875%, 11/01/22 | | $ | 182,177 | |
| | | |
| | 175,000 | | | | | Guitar Center, Inc.*
9.500%, 10/15/21 | | | 162,990 | |
| | | |
| | 25,000 | | | | | Installed Building Products, Inc.*
5.750%, 02/01/28 | | | 26,282 | |
| | | |
| | 200,000 | | | | | International Game Technology, PLC*^
6.250%, 01/15/27 | | | 224,046 | |
| | | |
| | 285,000 | | | | | L Brands, Inc.^
6.875%, 11/01/35 | | | 242,894 | |
| | | |
| | 135,000 | | | | | Lennar Corp.
5.250%, 06/01/26 | | | 149,269 | |
| | | |
| | 170,000 | | | | | M/I Homes, Inc.
5.625%, 08/01/25 | | | 177,097 | |
| | | |
| | | | | | Mattel, Inc. | | | | |
| | 115,000 | | | | | 6.750%, 12/31/25* | | | 120,544 | |
| | 5,000 | | | | | 2.350%, 08/15/21 | | | 4,921 | |
| | | |
| | 200,000 | | | | | Mclaren Finance, PLC*
5.750%, 08/01/22 | | | 191,517 | |
| | | |
| | 155,000 | | | | | Meritage Homes Corp.
6.000%, 06/01/25 | | | 174,553 | |
| | | |
| | 50,000 | | | | | Michaels Stores, Inc.*
8.000%, 07/15/27 | | | 49,485 | |
| | | |
| | 160,000 | | | | | Penske Automotive Group, Inc.
5.375%, 12/01/24 | | | 164,840 | |
| | | |
| | | | | | Rite Aid Corp. | | | | |
| | 275,000 | | | | | 7.700%, 02/15/27 | | | 183,077 | |
| | 85,000 | | | | | 6.125%, 04/01/23*^ | | | 72,706 | |
| | | |
| | 100,000 | | | | | Salem Media Group, Inc.*
6.750%, 06/01/24 | | | 86,373 | |
| | | |
| | 50,000 | | | | | Service Corp. International^
5.125%, 06/01/29 | | | 53,450 | |
| | | |
| | | | | | Sirius XM Radio, Inc.* | | | | |
| | 125,000 | | | | | 5.500%, 07/01/29 | | | 135,497 | |
| | 125,000 | | | | | 4.625%, 07/15/24 | | | 130,838 | |
| | | |
| | 125,000 | | | | | Speedway Motorsports, LLC / Speedway Funding II, Inc.*
4.875%, 11/01/27 | | | 124,972 | |
| | | |
| | 75,000 | | | | | Taylor Morrison Communities, Inc.*
5.750%, 01/15/28 | | | 83,063 | |
| | | |
| | 125,000 | | | | | Twin River Worldwide Holdings, Inc.*^
6.750%, 06/01/27 | | | 131,684 | |
| | | |
| | 47,488 | | | | | US Airways Pass Through TrustSeries 2012-2, Class B
6.750%, 12/03/22 | | | 49,944 | |
| | | |
| | 105,000 | | | | | VOC Escrow, Ltd.*
5.000%, 02/15/28 | | | 109,485 | |
| | | | | | | | | | |
| | | | | | | | | 5,919,131 | |
| | | | | | | | | | |
| | | | | | Consumer Staples (4.1%) | | | | |
| | | | | | Albertsons Companies, LLC / Safeway, Inc. / New Albertsons, LP / Albertson’s, LLC | | | | |
| | 125,000 | | | | | 5.750%, 03/15/25 | | | 129,646 | |
| | 75,000 | | | | | 7.500%, 03/15/26* | | | 83,815 | |
| | | | | | | | | | |
PRINCIPAL AMOUNT | | | | | | | VALUE | |
| | | |
| | 75,000 | | | | | Dean Foods Company*
6.500%, 03/15/23 | | $ | 35,251 | |
| | | |
| | 85,000 | | | | | Energizer Holdings, Inc.*^
6.375%, 07/15/26 | | | 90,757 | |
| | | |
| | 120,000 | | | | | Fresh Market, Inc.*
9.750%, 05/01/23 | | | 70,358 | |
| | | |
| | | | | | JBS USA LUX, SA / JBS USA Finance, Inc.* | | | | |
| | 270,000 | | | | | 5.875%, 07/15/24 | | | 278,590 | |
| | 205,000 | | | | | 6.750%, 02/15/28 | | | 226,381 | |
| | | |
| | | | | | JBS USA LUX, SA / JBS USA Food Company / JBS USA Finance, Inc.* | | | | |
| | 100,000 | | | | | 5.500%, 01/15/30 | | | 107,843 | |
| | 42,000 | | | | | 6.500%, 04/15/29 | | | 46,823 | |
| | | |
| | | | | | New Albertson’s, Inc. | | | | |
| | 76,000 | | | | | 7.750%, 06/15/26 | | | 77,694 | |
| | 27,000 | | | | | 8.000%, 05/01/31 | | | 27,616 | |
| | | |
| | | | | | Pilgrim’s Pride Corp.* | | | | |
| | 145,000 | | | | | 5.875%, 09/30/27 | | | 155,694 | |
| | 60,000 | | | | | 5.750%, 03/15/25 | | | 62,324 | |
| | | |
| | | | | | Post Holdings, Inc.* | | | | |
| | 110,000 | | | | | 5.750%, 03/01/27 | | | 117,178 | |
| | 35,000 | | | | | 5.500%, 12/15/29 | | | 36,964 | |
| | 30,000 | | | | | 5.625%, 01/15/28 | | | 32,169 | |
| | | |
| | | | | | Simmons Foods, Inc.* | | | | |
| | 104,000 | | | | | 7.750%, 01/15/24 | | | 113,104 | |
| | 59,000 | | | | | 5.750%, 11/01/24^ | | | 57,906 | |
| | | |
| | | | | | Vector Group, Ltd.* | | | | |
| | 45,000 | | | | | 6.125%, 02/01/25 | | | 43,379 | |
| | 25,000 | | | | | 10.500%, 11/01/26 | | | 25,551 | |
| | | | | | | | | | |
| | | | | | | | | 1,819,043 | |
| | | | | | | | | | |
| | | | | | Energy (7.1%) | | | | |
| | 85,000 | | | | | Apergy Corp.
6.375%, 05/01/26 | | | 83,597 | |
| | | |
| | 145,000 | | | | | Brazos Valley Longhorn, LLC / Brazos Valley Longhorn Finance Corp.
6.875%, 02/01/25 | | | 114,303 | |
| | | |
| | 82,000 | | | | | Bruin E&P Partners, LLC*
8.875%, 08/01/23 | | | 54,425 | |
| | | |
| | | | | | Buckeye Partners, LP | | | | |
| | 75,000 | | | | | 3.950%, 12/01/26 | | | 69,514 | |
| | 50,000 | | | | | 5.850%, 11/15/43 | | | 43,221 | |
| | | |
| | 101,000 | | | | | Calfrac Holdings, LP*
8.500%, 06/15/26 | | | 43,654 | |
| | | |
| | 215,000 | | | | | California Resources Corp.*
8.000%, 12/15/22 | | | 64,811 | |
| | | |
| | 34,000 | | | | | Carrizo Oil & Gas, Inc.^
6.250%, 04/15/23 | | | 32,003 | |
| | | |
| | 145,000 | | | | | Chaparral Energy, Inc.*
8.750%, 07/15/23 | | | 61,397 | |
| | | |
| | 110,000 | | | | | Cheniere Energy Partners, LP
5.625%, 10/01/26 | | | 116,371 | |
| | | |
| | 120,000 | | | | | Chesapeake Energy Corp.
7.000%, 10/01/24 | | | 81,302 | |
| | | | | | |
| See accompanying Notes to Schedule of Investments | | www.calamos.com | | | 139 | |
High Income Opportunities Fund Schedule of Investments October 31, 2019
| | | | | | | | | | |
PRINCIPAL AMOUNT | | | | | | | VALUE | |
| | | |
| | 125,000 | | | | | DCP Midstream Operating, LP*‡ 5.850%, 05/21/43 3 mo. USD LIBOR + 3.85% | | $ | 112,964 | |
| | | |
| | | | | | Denbury Resources, Inc. | | | | |
| | 129,000 | | | | | 7.750%, 02/15/24* | | | 94,976 | |
| | 45,000 | | | | | 9.250%, 03/31/22* | | | 37,386 | |
| | 33,000 | | | | | 5.500%, 05/01/22 | | | 16,693 | |
| | | |
| | 75,000 | | | | | Diamond Offshore Drilling, Inc.^
7.875%, 08/15/25 | | | 59,972 | |
| | | |
| | 220,000 | | | | | Energy Transfer Operating, LP‡ 4.927%, 11/01/66 3 mo. USD LIBOR + 3.02% | | | 165,510 | |
| | | |
| | | | | | EP Energy, LLC / Everest Acquisition Finance, Inc.*@ | | | | |
| | 100,000 | | | | | 9.375%, 05/01/24 | | | 2,448 | |
| | 60,000 | | | | | 7.750%, 05/15/26 | | | 42,030 | |
| | | |
| | | | | | Genesis Energy, LP / Genesis Energy Finance Corp. | | | | |
| | 150,000 | | | | | 6.500%, 10/01/25 | | | 142,893 | |
| | 150,000 | | | | | 6.250%, 05/15/26 | | | 139,093 | |
| | | |
| | | | | | Gulfport Energy Corp. | | | | |
| | 130,000 | | | | | 6.375%, 05/15/25 | | | 79,104 | |
| | 100,000 | | | | | 6.000%, 10/15/24^ | | | 64,386 | |
| | | |
| | 183,000 | | | | | Lonestar Resources America, Inc.*
11.250%, 01/01/23 | | | 128,310 | |
| | | |
| | 135,000 | | | | | Magnolia Oil & Gas Operating, LLC / Magnolia Oil & Gas Finance Corp.*
6.000%, 08/01/26 | | | 135,206 | |
| | | |
| | 205,000 | | | | | McDermott Technologies Americas, Inc. / McDermott Technology U.S., Inc.*
10.625%, 05/01/24 | | | 39,308 | |
| | | |
| | | | | | Moss Creek Resources Holdings, Inc.* | | | | |
| | 50,000 | | | | | 7.500%, 01/15/26 | | | 34,497 | |
| | 45,000 | | | | | 10.500%, 05/15/27 | | | 35,044 | |
| | | |
| | 45,000 | | | | | Nine Energy Service, Inc.*
8.750%, 11/01/23 | | | 34,265 | |
| | | |
| | 65,000 | | | | | Oasis Petroleum, Inc.*^
6.250%, 05/01/26 | | | 44,377 | |
| | | |
| | 150,000 | | | | | Par Petroleum, LLC / Par Petroleum Finance Corp.*
7.750%, 12/15/25 | | | 149,783 | |
| | | |
| | 75,000 | | | | | Parkland Fuel Corp.*
5.875%, 07/15/27 | | | 79,614 | |
| | | |
| | 100,000 | | | | | Plains All American Pipeline, LP‡ 6.125%, 11/15/22 3 mo. USD LIBOR + 4.11% | | | 93,439 | |
| | | |
| | 126,000 | | | | | SESI, LLC
7.750%, 09/15/24 | | | 71,541 | |
| | | |
| | 60,000 | | | | | SM Energy Company^
6.750%, 09/15/26 | | | 51,617 | |
| | | |
| | 75,000 | | | | | Targa Resources Partners, LP / Targa Resources Partners Finance Corp.*
6.500%, 07/15/27 | | | 80,439 | |
| | | |
| | 70,000 | | | | | Transocean, Inc.*^
7.500%, 01/15/26 | | | 62,443 | |
| | | | | | | | | | |
PRINCIPAL AMOUNT | | | | | | | VALUE | |
| | | |
| | 150,000 | | | | | Vine Oil & Gas, LP / Vine Oil & Gas Finance Corp.*
8.750%, 04/15/23 | | $ | 58,912 | |
| | | |
| | 50,000 | | | | | Viper Energy Partners, LP*
5.375%, 11/01/27 | | | 50,971 | |
| | | |
| | 140,000 | | | | | W&T Offshore, Inc.*
9.750%, 11/01/23 | | | 131,701 | |
| | | |
| | 165,000 | | | | | Weatherford International, Ltd.@
8.250%, 06/15/23 | | | 52,155 | |
| | | |
| | 95,000 | | | | | Whiting Petroleum Corp.
6.625%, 01/15/26 | | | 58,993 | |
| | | | | | | | | | |
| | | | | | | | | 3,114,668 | |
| | | | | | | | | | |
| | | | | | Financials (12.8%) | | | | |
| | 295,000 | | | | | Acrisure, LLC / Acrisure Finance, Inc.*
7.000%, 11/15/25 | | | 271,747 | |
| | | |
| | 125,000 | | | | | Alliant Holdings Intermediate, LLC / Alliant HoldingsCo-Issuer*
6.750%, 10/15/27 | | | 130,133 | |
| | | |
| | 160,000 | | | | | Ally Financial, Inc.
8.000%, 11/01/31 | | | 223,742 | |
| | | |
| | 172,000 | | | | | Amwins Group, Inc.*
7.750%, 07/01/26 | | | 185,450 | |
| | | |
| | 275,000 | | | | | Ardonagh Midco 3, PLC*^
8.625%, 07/15/23 | | | 258,833 | |
| | | |
| | 215,000 | | | | | AssuredPartners, Inc.*
7.000%, 08/15/25 | | | 214,531 | |
| | | |
| | 70,000 | | | | | Bank of America Corp.^‡ 5.875%, 03/15/28 3 mo. USD LIBOR + 2.93% | | | 77,020 | |
| | | |
| | 125,000 | | | | | Brookfield Property REIT, Inc. / BPR Cumulus, LLC / BPR Nimbus, LLC / GGSI Sellco, LLC*
5.750%, 05/15/26 | | | 130,389 | |
| | | |
| | 50,000 | | | | | Connect Finco SARL*
6.750%, 10/01/26 | | | 51,814 | |
| | | |
| | 130,000 | | | | | Credit Acceptance Corp.*
6.625%, 03/15/26 | | | 138,382 | |
| | | |
| | 125,000 | | | | | Donnelley Financial Solutions, Inc.
8.250%, 10/15/24 | | | 130,856 | |
| | | |
| | 125,000 | | | | | Global Aircraft Leasing Company, Ltd.* 6.500%, 09/15/24 7.250% PIK rate | | | 128,231 | |
| | | |
| | 130,000 | | | | | Greystar Real Estate Partners, LLC*
5.750%, 12/01/25 | | | 135,772 | |
| | | |
| | 75,000 | | | | | HAT Holdings I, LLC / HAT Holdings II, LLC*
5.250%, 07/15/24 | | | 79,031 | |
| | | |
| | 320,000 | | | | | HUB International, Ltd.*
7.000%, 05/01/26 | | | 330,024 | |
| | | |
| | 125,000 | | | | | Icahn Enterprises, LP / Icahn Enterprises Finance Corp.
6.250%, 05/15/26 | | | 132,739 | |
| | | |
| | 160,000 | | | | | ILFCE-Capital Trust II*‡ 4.020%, 12/21/65 3 mo. USD LIBOR + 1.80% | | | 122,946 | |
| | | | |
| 140 | | CALAMOS OPEN-END FAMILY OF FUNDS ANNUAL REPORT | | See accompanying Notes to Schedule of Investments |
High Income Opportunities Fund Schedule of Investments October 31, 2019
| | | | | | | | | | |
PRINCIPAL AMOUNT | | | | | | | VALUE | |
| | | |
| | 230,000 | | | | | Iron Mountain, Inc.*
5.250%, 03/15/28 | | $ | 242,143 | |
| | | |
| | | | | | Jefferies Finance, LLC / JFINCo-Issuer Corp.* | | | | |
| | 275,000 | | | | | 7.250%, 08/15/24 | | | 278,946 | |
| | 200,000 | | | | | 6.250%, 06/03/26 | | | 205,491 | |
| | | |
| | 140,000 | | | | | Ladder Capital Finance Holdings LLLP / Ladder Capital Finance Corp.*
5.250%, 10/01/25 | | | 143,176 | |
| | | |
| | 150,000 | | | | | Level 3 Financing, Inc.
5.375%, 05/01/25 | | | 155,802 | |
| | | |
| | 60,000 | | | | | Lions Gate Capital Holdings, LLC*
6.375%, 02/01/24 | | | 57,661 | |
| | | |
| | 230,000 | | | | | LPL Holdings, Inc.*
5.750%, 09/15/25 | | | 240,087 | |
| | | |
| | 260,000 | | | | | MetLife, Inc.
6.400%, 12/15/66 | | | 315,822 | |
| | | |
| | 237,000 | | | | | Nationstar Mortgage, LLC / Nationstar Capital Corp.
6.500%, 07/01/21 | | | 238,051 | |
| | | |
| | 225,000 | | | | | Navient Corp.^
6.750%, 06/25/25 | | | 237,904 | |
| | | |
| | 125,000 | | | | | Radian Group, Inc.
4.875%, 03/15/27 | | | 129,634 | |
| | | |
| | | | | | Springleaf Finance Corp. | | | | |
| | 185,000 | | | | | 6.875%, 03/15/25 | | | 209,810 | |
| | 140,000 | | | | | 7.125%, 03/15/26 | | | 160,044 | |
| | 25,000 | | | | | 6.625%, 01/15/28 | | | 27,729 | |
| | | |
| | 150,000 | | | | | Starwood Property Trust, Inc.
4.750%, 03/15/25 | | | 156,209 | |
| | | |
| | 95,000 | | | | | Tronox Finance, PLC*
5.750%, 10/01/25 | | | 89,762 | |
| | | | | | | | | | |
| | | | | | | | | 5,629,911 | |
| | | | | | | | | | |
| | | | | | Health Care (9.4%) | | | | |
| | 180,000 | | | | | Acadia Healthcare Company, Inc.
6.500%, 03/01/24 | | | 187,245 | |
| | | |
| | | | | | Bausch Health Americas, Inc.* | | | | |
| | 295,000 | | | | | 8.500%, 01/31/27 | | | 332,306 | |
| | 135,000 | | | | | 9.250%, 04/01/26 | | | 153,089 | |
| | | |
| | | | | | Bausch Health Cos., Inc.* | | | | |
| | 300,000 | | | | | 9.000%, 12/15/25 | | | 337,602 | |
| | 25,000 | | | | | 5.750%, 08/15/27^ | | | 27,215 | |
| | | |
| | | | | | CHS/Community Health Systems, Inc. | | | | |
| | 388,000 | | | | | 8.125%, 06/30/24* | | | 297,926 | |
| | 75,000 | | | | | 6.250%, 03/31/23 | | | 73,277 | |
| | 60,000 | | | | | 8.000%, 03/15/26* | | | 58,687 | |
| | 23,000 | | | | | 6.875%, 02/01/22 | | | 17,800 | |
| | | |
| | 265,000 | | | | | DaVita, Inc.
5.125%, 07/15/24 | | | 271,492 | |
| | | |
| | 275,000 | | | | | Endo DAC / Endo Finance, LLC / Endo Finco, Inc.*^
6.000%, 07/15/23 | | | 182,233 | |
| | | |
| | 130,000 | | | | | HCA, Inc.
7.500%, 11/06/33 | | | 158,137 | |
| | | |
| | 78,000 | | | | | Hill-Rom Holdings, Inc.*
4.375%, 09/15/27 | | | 80,478 | |
| | | | | | | | | | |
PRINCIPAL AMOUNT | | | | | | | VALUE | |
| | | |
| | 240,000 | | | | | Magellan Health, Inc.
4.900%, 09/22/24 | | $ | 239,789 | |
| | | |
| | | | | | Mallinckrodt International Finance, SA / Mallinckrodt CB, LLC* | | | | |
| | 80,000 | | | | | 5.625%, 10/15/23 | | | 28,844 | |
| | 25,000 | | | | | 4.875%, 04/15/20 | | | 15,688 | |
| | | |
| | 80,000 | | | | | Par Pharmaceutical, Inc.*
7.500%, 04/01/27 | | | 76,579 | |
| | | |
| | 107,000 | | | | | Team Health Holdings, Inc.*^
6.375%, 02/01/25 | | | 69,462 | |
| | | |
| | | | | | Tenet Healthcare Corp. | | | | |
| | 220,000 | | | | | 6.250%, 02/01/27* | | | 232,619 | |
| | 140,000 | | | | | 4.625%, 07/15/24 | | | 144,552 | |
| | 130,000 | | | | | 6.875%, 11/15/31 | | | 119,081 | |
| | 125,000 | | | | | 4.875%, 01/01/26* | | | 129,616 | |
| | | |
| | | | | | Teva Pharmaceutical Finance Netherlands III, BV | | | | |
| | 325,000 | | | | | 2.800%, 07/21/23 | | | 281,356 | |
| | 320,000 | | | | | 6.000%, 04/15/24^ | | | 300,110 | |
| | 115,000 | | | | | 2.200%, 07/21/21 | | | 109,367 | |
| | | |
| | 240,000 | | | | | West Street Merger Sub, Inc.*
6.375%, 09/01/25 | | | 229,040 | |
| | | | | | | | | | |
| | | | | | | | | 4,153,590 | |
| | | | | | | | | | |
| | | | | | Industrials (12.6%) | | | | |
| | 200,000 | | | | | ACCO Brands Corp.*^
5.250%, 12/15/24 | | | 207,807 | |
| | | |
| | | | | | Allison Transmission, Inc.* | | | | |
| | 175,000 | | | | | 4.750%, 10/01/27 | | | 179,585 | |
| | 25,000 | | | | | 5.875%, 06/01/29 | | | 26,975 | |
| | | |
| | 50,000 | | | | | American Airlines Group, Inc.*
5.000%, 06/01/22 | | | 52,191 | |
| | | |
| | 115,000 | | | | | Arconic, Inc.
5.125%, 10/01/24 | | | 123,653 | |
| | | |
| | 227,837 | | | | | ARD Securities Finance Sarl* 8.750%, 01/31/23 8.750% PIK rate | | | 237,691 | |
| | | |
| | 50,000 | | | | | Avolon Holdings Funding, Ltd.*
5.250%, 05/15/24 | | | 54,561 | |
| | | |
| | 150,000 | | | | | Beacon Roofing Supply, Inc.*^
4.875%, 11/01/25 | | | 147,776 | |
| | | |
| | 220,000 | | | | | Bombardier, Inc.*^
7.500%, 03/15/25 | | | 210,815 | |
| | | |
| | | | | | Covanta Holding Corp. | | | | |
| | 160,000 | | | | | 5.875%, 03/01/24 | | | 164,738 | |
| | 45,000 | | | | | 5.875%, 07/01/25 | | | 46,755 | |
| | | |
| | 155,000 | | | | | Delphi Technologies, PLC*^
5.000%, 10/01/25 | | | 134,784 | |
| | | |
| | 200,000 | | | | | Fly Leasing, Ltd.
5.250%, 10/15/24 | | | 206,712 | |
| | | |
| | 257,000 | | | | | Garda World Security Corp.*
7.250%, 11/15/21 | | | 257,281 | |
| | | |
| | | | | | Golden Nugget, Inc.* | | | | |
| | 135,000 | | | | | 6.750%, 10/15/24 | | | 139,401 | |
| | 130,000 | | | | | 8.750%, 10/01/25 | | | 137,164 | |
| | | | | | |
| See accompanying Notes to Schedule of Investments | | www.calamos.com | | | 141 | |
High Income Opportunities Fund Schedule of Investments October 31, 2019
| | | | | | | | | | |
PRINCIPAL AMOUNT | | | | | | | VALUE | |
| | | |
| | 50,000 | | | | | Granite Holdings US Acquisition Company*
11.000%, 10/01/27 | | $ | 46,445 | |
| | | |
| | 60,000 | | | | | Graphic Packaging International, LLC*
4.750%, 07/15/27 | | | 63,866 | |
| | | |
| | 155,000 | | | | | Great Lakes Dredge & Dock Corp.
8.000%, 05/15/22 | | | 164,563 | |
| | | |
| | 255,000 | | | | | H&E Equipment Services, Inc.
5.625%, 09/01/25 | | | 268,284 | |
| | | |
| | 125,000 | | | | | Herc Holdings, Inc.*
5.500%, 07/15/27 | | | 130,781 | |
| | | |
| | | | | | Hertz Corp.* | | | | |
| | 220,000 | | | | | 7.625%, 06/01/22 | | | 229,185 | |
| | 50,000 | | | | | 7.125%, 08/01/26 | | | 51,818 | |
| | | |
| | 150,000 | | | | | Jeld-Wen, Inc.*
4.625%, 12/15/25 | | | 149,841 | |
| | | |
| | 80,000 | | | | | JPW Industries Holding Corp.*
9.000%, 10/01/24 | | | 75,262 | |
| | | |
| | 75,000 | | | | | KeHE Distributors, LLC / KeHE Finance Corp.*
8.625%, 10/15/26 | | | 77,155 | |
| | | |
| | 205,000 | | | | | Meritor, Inc.
6.250%, 02/15/24 | | | 210,790 | |
| | | |
| | 210,000 | | | | | Navistar International Corp.*
6.625%, 11/01/25 | | | 214,426 | |
| | | |
| | | | | | Park Aerospace Holdings, Ltd.* | | | | |
| | 90,000 | | | | | 4.500%, 03/15/23 | | | 94,363 | |
| | 65,000 | �� | | | | 5.500%, 02/15/24 | | | 71,438 | |
| | | |
| | 175,000 | | | | | Park-Ohio Industries, Inc.
6.625%, 04/15/27 | | | 168,254 | |
| | | |
| | 50,000 | | | | | Patrick Industries, Inc.*
7.500%, 10/15/27 | | | 51,940 | |
| | | |
| | | | | | Scientific Games International, Inc.* | | | | |
| | 110,000 | | | | | 5.000%, 10/15/25 | | | 113,394 | |
| | 105,000 | | | | | 8.250%, 03/15/26 | | | 111,419 | |
| | | |
| | 105,000 | | | | | Tennant Company
5.625%, 05/01/25 | | | 109,577 | |
| | | |
| | | | | | TransDigm, Inc. | | | | |
| | 195,000 | | | | | 7.500%, 03/15/27 | | | 210,880 | |
| | 125,000 | | | | | 6.250%, 03/15/26* | | | 134,061 | |
| | | |
| | | | | | United Rentals North America, Inc. | | | | |
| | 125,000 | | | | | 5.875%, 09/15/26 | | | 132,806 | |
| | 70,000 | | | | | 4.625%, 07/15/23 | | | 71,685 | |
| | 55,000 | | | | | 6.500%, 12/15/26 | | | 59,733 | |
| | | |
| | 75,000 | | | | | Waste Pro USA, Inc.*
5.500%, 02/15/26 | | | 77,628 | |
| | | |
| | 115,000 | | | | | XPO Logistics, Inc.*^
6.750%, 08/15/24 | | | 125,068 | |
| | | | | | | | | | |
| | | | | | | | | 5,542,551 | |
| | | | | | | | | | |
| | | | | | Information Technology (1.0%) | | | | |
| | | |
| | 50,000 | | | | | CDK Global, Inc.*
5.250%, 05/15/29 | | | 53,248 | |
| | | |
| | 75,000 | | | | | Clear Channel Worldwide Holdings, Inc.*
5.125%, 08/15/27 | | | 78,277 | |
| | | | | | | | | | |
PRINCIPAL AMOUNT | | | | | | | VALUE | |
| | | |
| | 130,000 | | | | | CommScope Technologies, LLC*
6.000%, 06/15/25 | | $ | 115,841 | |
| | | |
| | 150,000 | | | | | Harland Clarke Holdings Corp.*
8.375%, 08/15/22 | | | 119,787 | |
| | | |
| | 75,000 | | | | | MTS Systems Corp.*
5.750%, 08/15/27 | | | 78,793 | |
| | | | | | | | | | |
| | | | | | | | | 445,946 | |
| | | | | | | | | | |
| | | | | | Materials (3.1%) | | | | |
| | 53,000 | | | | | AK Steel Corp.^
6.375%, 10/15/25 | | | 44,362 | |
| | | |
| | 75,000 | | | | | ArcelorMittal, SA^
7.000%, 10/15/39 | | | 91,903 | |
| | | |
| | 335,000 | | | | | Ardagh Packaging Finance, PLC / Ardagh Holdings USA, Inc.*
6.000%, 02/15/25 | | | 352,313 | |
| | | |
| | 55,000 | | | | | Baffinland Iron Mines Corp. / Baffinland Iron Mines, LP*
8.750%, 07/15/26 | | | 55,380 | |
| | | |
| | | | | | Freeport-McMoRan, Inc. | | | | |
| | 65,000 | | | | | 5.000%, 09/01/27 | | | 66,484 | |
| | 48,000 | | | | | 5.450%, 03/15/43 | | | 44,707 | |
| | | |
| | 200,000 | | | | | INEOS Group Holdings, SA*
5.625%, 08/01/24 | | | 205,078 | |
| | | |
| | 85,000 | | | | | JW Aluminum Continuous Cast Company*
10.250%, 06/01/26 | | | 89,446 | |
| | | |
| | 25,000 | | | | | Mineral Resources, Ltd.*
8.125%, 05/01/27 | | | 26,269 | |
| | | |
| | 140,000 | | | | | New Gold, Inc.*
6.375%, 05/15/25 | | | 133,395 | |
| | | |
| | 25,000 | | | | | Norbord, Inc.*
5.750%, 07/15/27 | | | 26,028 | |
| | | |
| | 205,000 | | | | | PBF Holding Company, LLC / PBF Finance Corp.
7.250%, 06/15/25 | | | 215,028 | |
| | | | | | | | | | |
| | | | | | | | | 1,350,393 | |
| | | | | | | | | | |
| | | | | | Real Estate (0.8%) | | | | |
| | 130,000 | | | | | CBL & Associates, LP^
5.250%, 12/01/23 | | | 91,196 | |
| | | |
| | 125,000 | | | | | Forestar Group, Inc.*
8.000%, 04/15/24 | | | 135,439 | |
| | | |
| | 125,000 | | | | | Service Properties Trust
4.350%, 10/01/24 | | | 127,911 | |
| | | | | | | | | | |
| | | | | | | | | 354,546 | |
| | | | | | | | | | |
| | | | | | Utilities (1.3%) | | | | |
| | | |
| | 25,000 | | | | | NextEra Energy Operating Partners, LP*
4.250%, 07/15/24 | | | 25,853 | |
| | | |
| | 85,000 | | | | | NGPL PipeCo, LLC*
4.875%, 08/15/27 | | | 91,599 | |
| | | |
| | 262,000 | | | | | PPL Capital Funding, Inc.‡ 4.769%, 03/30/67 3 mo. USD LIBOR + 2.67% | | | 235,118 | |
| | | |
| | | | | | Talen Energy Supply, LLC* | | | | |
| | 55,000 | | | | | 10.500%, 01/15/26 | | | 46,759 | |
| | 25,000 | | | | | 7.250%, 05/15/27 | | | 24,970 | |
| | | | |
| 142 | | CALAMOS OPEN-END FAMILY OF FUNDS ANNUAL REPORT | | See accompanying Notes to Schedule of Investments |
High Income Opportunities Fund Schedule of Investments October 31, 2019
| | | | | | | | | | |
PRINCIPAL AMOUNT | | | | | | | VALUE | |
| | | |
| | 150,000 | | | | | TerraForm Power Operating, LLC*
5.000%, 01/31/28 | | $ | 158,796 | |
| | | | | | | | | | |
| | | | | | | | | 583,095 | |
| | | | | | | | | | |
| | | |
| | | | | | TOTAL CORPORATE BONDS (Cost $36,114,890) | | | 34,802,991 | |
| | | | | | | | | | |
| | | | | | | | | | |
|
| | CONVERTIBLE BONDS (1.0%) | |
| | | | | | Consumer Discretionary (0.7%) | |
| | 150,000 | | | | | DISH Network Corp.
2.375%, 03/15/24 | | | 134,928 | |
| | | |
| | | | | | Liberty Interactive, LLC | | | | |
| | 125,000 | | | | | 3.750%, 02/15/30 | | | 88,118 | |
| | 118,187 | | | | | 4.000%, 11/15/29 | | | 83,866 | |
| | | | | | | | | | |
| | | | | | | | | 306,912 | |
| | | | | | | | | | |
| | | | | | Energy (0.1%) | | | | |
| | 47,000 | | | | | Denbury Resources, Inc.*
6.375%, 12/31/24 | | | 25,534 | |
| | | | | | | | | | |
| | | | | | Financials (0.2%) | | | | |
| | 125,000 | | | | | Prospect Capital Corp.^
4.950%, 07/15/22 | | | 128,691 | |
| | | | | | | | | | |
| | | |
| | | | | | TOTAL CONVERTIBLE BONDS (Cost $493,757) | | | 461,137 | |
| | | | | | | | | | |
| | | | | | | | | | |
|
| | BANK LOANS (11.2%) | |
| | | | | | Communication Services (2.3%) | |
| | 75,000 | | | | | Cumulus Media New Holdings, Inc.‡ 5.536%, 03/31/26 1 mo. LIBOR + 3.75% | | | 75,469 | |
| | | |
| | 124,681 | | | | | Frontier Communications Corp.‡ 5.540%, 06/15/24 1 mo. LIBOR + 3.75% | | | 124,478 | |
| | | |
| | 98,556 | | | | | iHeartCommunications, Inc.‡ 6.032%, 05/01/26 1 mo. LIBOR + 4.00% | | | 99,018 | |
| | | |
| | 233,900 | | | | | Intelsat Jackson Holdings, SA
6.625%, 01/02/24 | | | 240,131 | |
| | | |
| | 125,000 | | | | | Intelsat Jackson Holdings, SA‡ 6.432%, 01/02/24 6 mo. LIBOR + 4.50% | | | 126,797 | |
| | | |
| | 191,216 | | | | | New Media Holdings II, LLC‡ 8.036%, 07/14/22 1 mo. LIBOR + 6.25% | | | 191,535 | |
| | | |
| | 113,802 | | | | | Sprint Communications, Inc.‡ 4.813%, 02/02/24 1 mo. LIBOR + 3.00% | | | 113,304 | |
| | | |
| | 55,000 | | | | | Windstream Services, LLC‡ 9.000%, 02/17/24 3 mo. PRIME + 4.25% | | | 55,153 | |
| | | | | | | | | | |
| | | | | | | | | 1,025,885 | |
| | | | | | | | | | |
| | | | | | Consumer Discretionary (2.0%) | | | | |
| | 99,716 | | | | | Michaels Stores, Inc.‡ 4.306%, 01/30/23 1 mo. LIBOR + 2.50% | | | 97,392 | |
| | | | | | | | | | |
PRINCIPAL AMOUNT | | | | | | | VALUE | |
| | | |
| | 361,995 | | | | | PetSmart, Inc.‡ 5.930%, 03/11/22 3 mo. LIBOR + 4.00% | | $ | 353,774 | |
| | | |
| | 175,000 | | | | | Staples, Inc.‡ 7.123%, 04/16/26 1 mo. LIBOR + 5.00% | | | 172,813 | |
| | | |
| | 254,269 | | | | | Weight Watchers International, Inc.‡ 6.860%, 11/29/24 3 mo. LIBOR + 4.75% | | | 254,341 | |
| | | | | | | | | | |
| | | | | | | | | 878,320 | |
| | | | | | | | | | |
| | | | | | Energy (0.7%) | | | | |
| | 100,000 | | | | | Buckeye Partners, LP!
0.000%, 11/15/26 | | | 100,582 | |
| | | |
| | 100,000 | | | | | Epic Crude Services, LP‡ 7.040%, 03/02/26 6 mo. LIBOR + 5.00% | | | 94,407 | |
| | | |
| | 148,124 | | | | | McDermott Technology Americas, Inc.‡ 7.104%, 05/09/25 3 mo. LIBOR + 5.00% | | | 90,022 | |
| | | |
| | 39,425 | | | | | McDermott Technology Americas, Inc.!
0.000%, 10/21/21 | | | 39,425 | |
| | | | | | | | | | |
| | | | | | | | | 324,436 | |
| | | | | | | | | | |
| | | | | | Financials (1.1%) | | | | |
| | 125,000 | | | | | Connect Finco SARL!
0.000%, 09/23/26 | | | 123,438 | |
| | | |
| | 270,875 | | | | | Genworth Holdings, Inc.‡ 6.323%, 03/07/23 1 mo. LIBOR + 4.50% | | | 270,875 | |
| | | |
| | 76,194 | | | | | GLP Financing, LLC‡ 3.300%, 04/28/21 1 mo. LIBOR + 1.50% | | | 76,003 | |
| | | | | | | | | | |
| | | | | | | | | 470,316 | |
| | | | | | | | | | |
| | | | | | Health Care (2.8%) | | | | |
| | 271,499 | | | | | Amneal Pharmaceuticals, LLC‡ 5.313%, 05/04/25 1 mo. LIBOR + 3.50% | | | 208,240 | |
| | | |
| | 236,860 | | | | | Bausch Health Cos., Inc.‡ 4.921%, 06/02/25 1 mo. LIBOR + 3.00% | | | 237,958 | |
| | | |
| | 112,619 | | | | | Gentiva Health Services, Inc.‡ 5.563%, 07/02/25 1 mo. LIBOR + 3.75% | | | 112,619 | |
| | | |
| | 257,201 | | | | | Mallinckrodt International Finance, SA‡ 4.854%, 09/24/24 3 mo. LIBOR + 2.75% | | | 202,914 | |
| | | |
| | 266,750 | | | | | Ortho Clinical Diagnostics, SA‡ 5.306%, 06/30/25 3 mo. LIBOR + 3.25% | | | 255,525 | |
| | | |
| | 270,151 | | | | | Team Health Holdings, Inc.‡ 4.536%, 02/06/24 1 mo. LIBOR + 2.75% | | | 210,042 | |
| | | | | | | | | | |
| | | | | | | | | 1,227,298 | |
| | | | | | | | | | |
| | | | | | |
| See accompanying Notes to Schedule of Investments | | www.calamos.com | | | 143 | |
High Income Opportunities Fund Schedule of Investments October 31, 2019
| | | | | | | | | | |
PRINCIPAL AMOUNT | | | | | | | VALUE | |
| | | | | | | | | | |
| | | | | | Industrials (1.2%) | | | | |
| | 199,500 | | | | | Berry Global, Inc.‡ 4.439%, 07/01/26 1 mo. LIBOR + 2.50% | | $ | 200,407 | |
| | | |
| | 95,000 | | | | | Dun & Bradstreet Corp.‡ 6.804%, 02/06/26 1 mo. LIBOR + 5.00% | | | 95,386 | |
| | | |
| | 100,000 | | | | | Granite Holdings US Acquisition Co.‡ 7.354%, 09/30/26 3 mo. LIBOR + 5.25% | | | 94,875 | |
| | | |
| | 124,367 | | | | | Navistar International Corp.‡ 5.420%, 11/06/24 1 mo. LIBOR + 3.50% | | | 123,357 | |
| | | | | | | | | | |
| | | | | | | | | 514,025 | |
| | | | | | | | | | |
| | | | | | Information Technology (1.1%) | | | | |
| | 248,125 | | | | | BMC Software Finance, Inc.‡ 6.036%, 10/02/25 1 mo. LIBOR + 4.25% | | | 230,668 | |
| | | |
| | 125,000 | | | | | Camelot U.S. Acquisition 1 Co.!
0.000%, 10/25/26 | | | 125,547 | |
| | | |
| | 125,000 | | | | | VFH Parent LLC‡ 6.044%, 03/01/26 1 mo. LIBOR + 3.50% | | | 125,011 | |
| | | | | | | | | | |
| | | | | | | | | 481,226 | |
| | | | | | | | | | |
| | | |
| | | | | | TOTAL BANK LOANS (Cost $5,167,162) | | | 4,921,506 | |
| | | | | | | | | | |
| | | | | | | | | | |
NUMBER OF SHARES | | | | | | | VALUE | |
|
| | CONVERTIBLE PREFERRED STOCKS (0.8%) | |
| | | | | | Energy (0.8%) | | | | |
| | | | | | NuStar Energy, LP‡ | | | | |
| | 10,765 | | | | | 7.625%, 06/15/22 3 mo. USD LIBOR + 5.64% | | | 243,397 | |
| | 3,692 | | | | | 8.500%, 12/15/21 3 mo. USD LIBOR + 6.77% | | | 89,752 | |
| | | | | | | | | | |
| | | |
| | | | | | TOTAL CONVERTIBLE PREFERRED STOCKS (Cost $368,773) | | | 333,149 | |
| | | | | | | | | | |
| | | | | | | | | | |
|
| | COMMON STOCKS (1.4%) | |
| | | | | | Communication Services (0.0%) | | | | |
| | 1,527 | | | | | Cumulus Media, Inc. - Class A# | | | 20,905 | |
| | | | | | | | | | |
| | | | | | Energy (1.4%) | | | | |
| | 215 | | | | | Chevron Corp. | | | 24,970 | |
| | | |
| | 6,100 | | | | | Energy Transfer, LP | | | 76,799 | |
| | | |
| | 4,645 | | | | | Enterprise Products Partners, LP | | | 120,909 | |
| | | |
| | 1,525 | | | | | GasLog, Ltd. | | | 20,908 | |
| | | |
| | 1,840 | | | | | Magellan Midstream Partners, LP | | | 114,669 | |
| | | |
| | 790 | | | | | Schlumberger, Ltd. | | | 25,825 | |
| | | |
| | 2,675 | | | | | Targa Resources Corp.^ | | | 104,004 | |
| | | |
| | 4,769 | | | | | Tidewater, Inc.# | | | 77,401 | |
| | | | | | | | | | |
NUMBER OF SHARES | | | | | | | VALUE | |
| | | |
| | 5,504 | | | | | Transocean, Ltd.^# | | $ | 26,144 | |
| | | |
| | 965 | | | | | Williams Companies, Inc. | | | 21,529 | |
| | | | | | | | | | |
| | | | | | | | | 613,158 | |
| | | | | | | | | | |
| | | |
| | | | | | TOTAL COMMON STOCKS (Cost $754,266) | | | 634,063 | |
| | | | | | | | | | |
|
| | SHORT TERM INVESTMENTS (6.8%) | |
| | 1,496,140 | | | | | Fidelity Prime Money Market Fund - Institutional Class, 1.890%*** | | | 1,496,739 | |
| | | |
| | 1,495,148 | | | | | Morgan Stanley Institutional Liquidity Funds - Government Portfolio,
1.720%*** | | | 1,495,148 | |
| | | | | | | | | | |
| | | |
| | | | | | TOTAL SHORT TERM INVESTMENTS (Cost $2,991,766) | | | 2,991,887 | |
| | | | | | | | | | |
| | | | | | | | | | |
NUMBER OF SHARES/ PRINCIPAL
AMOUNT | | | | | | | VALUE | |
|
| INVESTMENT OF CASH COLLATERAL FOR SECURITIES
LOANED (9.0%) |
|
| | 3,959,174 | | | | | State Street Navigator Securities Lending Government Money Market Portfolio† (Cost $3,959,174) | | | 3,959,174 | |
| | | | | | | | | | |
| |
| TOTAL INVESTMENTS (109.3%)
(Cost $49,849,788) | | | 48,103,907 | |
| | | | | | | | | | |
| |
| | PAYABLE UPON RETURN OF SECURITIES ON LOAN(-9.0%) | | | (3,959,174 | ) |
| | | | | | | | | | |
| |
| | LIABILITIES, LESS OTHER ASSETS(-0.3%) | | | (130,165 | ) |
| | | | | | | | | | |
| |
| | NET ASSETS (100.0%) | | $ | 44,014,568 | |
| | | | | | | | | | |
NOTES TO SCHEDULE OF INVESTMENTS
| * | Securities issued and sold pursuant to a Rule 144A transaction are excepted from the registration requirement of the Securities Act of 1933, as amended. These securities may only be sold to qualified institutional buyers (“QIBs”), such as the Fund. Any resale of these securities must generally be effected through a sale that is registered under the Act or otherwise exempted from such registration requirements. |
| ^ | Security, or portion of security, is on loan. |
| @ | In default status and considerednon-income producing. |
| ‡ | Variable rate security. The rate shown is the rate in effect at October 31, 2019. |
| ! | This position represents an unsettled loan commitment at period end. Certain details associated with this purchase are not known prior to the settlement date, including coupon rate, which will be adjusted on settlement date. |
| # | Non-income producing security. |
| *** | The rate disclosed is the 7 day net yield as of October 31, 2019. |
| † | Represents investment of cash collateral received from securities on loan as of October 31, 2019. |
| | | | |
| 144 | | CALAMOS OPEN-END FAMILY OF FUNDS ANNUAL REPORT | | See accompanying Notes to Financial Statements |
Short-Term Bond Fund Schedule of Investments October 31, 2019
| | | | | | | | | | |
PRINCIPAL AMOUNT | | | | | | | VALUE | |
|
| | CORPORATE BONDS (71.2%) | |
| | | | | | Airlines (1.0%) | | | | |
| | 248,308 | | | | | Air Canada Pass Through Trust Series2013-1, Class B*
5.375%, 11/15/22 | | $ | 255,413 | |
| | | |
| | 359,999 | | | | | Air Canada Pass Through TrustSeries 2015-2, Class B*
5.000%, 06/15/25 | | | 376,816 | |
| | | |
| | 195,918 | | | | | American Airlines Pass Through Trust Series2013-2, Class B*
5.600%, 01/15/22 | | | 199,295 | |
| | | |
| | 330,396 | | | | | British Airways2013-1 Class A Pass Through Trust*
4.625%, 12/20/25 | | | 350,534 | |
| | | |
| | 379,302 | | | | | Southwest Airlines Company2007-1 Pass Through Trust
6.650%, 08/01/22 | | | 401,182 | |
| | | |
| | 494,578 | | | | | UAL Pass Through Trust Series2007-1
6.636%, 01/02/24 | | | 525,281 | |
| | | | | | | | | | |
| | | | | | | | | 2,108,521 | |
| | | | | | | | | | |
| | | | | | Communication Services (3.3%) | | | | |
| | 500,000 | | | | | Activision Blizzard, Inc.
2.300%, 09/15/21 | | | 503,010 | |
| | | |
| | | | | | AT&T, Inc. | | | | |
| | 250,000 | | | | | 2.800%, 02/17/21 | | | 252,614 | |
| | 225,000 | | | | | 2.450%, 06/30/20 | | | 225,705 | |
| | | |
| | 200,000 | | | | | Charter Communications Operating, LLC / Charter Communications Operating Capital
4.464%, 07/23/22 | | | 210,408 | |
| | | |
| | 500,000 | | | | | Comcast Corp.
3.300%, 10/01/20 | | | 506,880 | |
| | | |
| | | | | | Crown Castle Towers, LLC* | | | | |
| | 690,000 | | | | | 3.222%, 05/15/42 | | | 697,566 | |
| | 300,000 | | | | | 3.720%, 07/15/43 | | | 309,954 | |
| | | |
| | 500,000 | | | | | Electronic Arts, Inc.
3.700%, 03/01/21 | | | 510,377 | |
| | | |
| | 500,000 | | | | | Fox Corp.*
3.666%, 01/25/22 | | | 518,090 | |
| | | |
| | 500,000 | | | | | Hughes Satellite Systems Corp.
7.625%, 06/15/21 | | | 539,555 | |
| | | |
| | 500,000 | | | | | Inmarsat Finance, PLC*
4.875%, 05/15/22 | | | 506,918 | |
| | | |
| | | | | | Netflix, Inc. | | | | |
| | 250,000 | | | | | 5.500%, 02/15/22 | | | 265,383 | |
| | 250,000 | | | | | 5.375%, 02/01/21 | | | 259,491 | |
| | | |
| | 250,000 | | | | | Qwest Corp.
6.750%, 12/01/21 | | | 269,766 | |
| | | |
| | 364,000 | | | | | SBA Communications Corp.
4.000%, 10/01/22 | | | 371,628 | |
| | | |
| | 250,000 | | | | | Sprint Spectrum Company, LLC / Sprint Spectrum Company II, LLC / Sprint Spectrum Company III, LLC*
3.360%, 03/20/23 | | | 251,979 | |
| | | | | | | | | | |
PRINCIPAL AMOUNT | | | | | | | VALUE | |
| | | |
| | 250,000 | | | | | T-Mobile USA, Inc.^
4.000%, 04/15/22 | | $ | 258,471 | |
| | | |
| | 750,000 | | | | | Verizon Communications, Inc.
3.125%, 03/16/22 | | | 772,125 | |
| | | | | | | | | | |
| | | | | | | | | 7,229,920 | |
| | | | | | | | | | |
| | | | | | Consumer Discretionary (9.8%) | |
| | | | | | American Honda Finance Corp. | | | | |
| | 500,000 | | | | | 2.200%, 06/27/22 | | | 505,193 | |
| | 250,000 | | | | | 3.150%, 01/08/21 | | | 253,906 | |
| | 250,000 | | | | | 2.000%, 02/14/20 | | | 250,056 | |
| | | |
| | | | | | BMW US Capital, LLC* | | | | |
| | 250,000 | | | | | 3.100%, 04/12/21 | | | 254,356 | |
| | 250,000 | | | | | 2.950%, 04/14/22^ | | | 255,405 | |
| | 250,000 | | | | | 2.000%, 04/11/21 | | | 250,496 | |
| | | |
| | 500,000 | | | | | Cablevision Systems Corp.
8.000%, 04/15/20 | | | 513,445 | |
| | | |
| | | | | | Cargill, Inc.* | | | | |
| | 500,000 | | | | | 3.250%, 11/15/21 | | | 512,577 | |
| | 250,000 | | | | | 3.050%, 04/19/21 | | | 254,385 | |
| | | |
| | 145,154 | | | | | Continental Airlines Pass Through Trust Series2012-2, Class B
5.500%, 04/29/22 | | | 148,605 | |
| | | |
| | | | | | D.R. Horton, Inc. | | | | |
| | 250,000 | | | | | 4.000%, 02/15/20 | | | 251,473 | |
| | 250,000 | | | | | 2.550%, 12/01/20 | | | 250,961 | |
| | | |
| | | | | | Daimler Finance North America, LLC* | | | | |
| | 500,000 | | | | | 3.000%, 02/22/21 | | | 506,178 | |
| | 250,000 | | | | | 3.400%, 02/22/22 | | | 256,635 | |
| | | |
| | 525,354 | | | | | Delta Air Lines Pass Through TrustSeries 2007-1, Class A
6.821%, 02/10/24 | | | 575,635 | |
| | | |
| | 246,424 | | | | | Delta Air Lines Pass Through TrustSeries 2007-1, Class B
8.021%, 02/10/24 | | | 272,159 | |
| | | |
| | 292,548 | | | | | Delta Air Lines Pass Through TrustSeries 2012-1, Class A
4.750%, 11/07/21 | | | 297,491 | |
| | | |
| | 752,000 | | | | | Expedia Group, Inc.
5.950%, 08/15/20 | | | 774,052 | |
| | | |
| | | | | | Ford Motor Credit Company, LLC | | | | |
| | 750,000 | | | | | 3.339%, 03/28/22 | | | 754,474 | |
| | 250,000 | | | | | 3.350%, 11/01/22 | | | 251,054 | |
| | | |
| | | | | | General Motors Financial Company, Inc. | | | | |
| | 400,000 | | | | | 3.200%, 07/06/21 | | | 405,058 | |
| | 250,000 | | | | | 3.200%, 07/13/20 | | | 251,586 | |
| | 100,000 | | | | | 3.150%, 01/15/20 | | | 100,167 | |
| | | |
| | 500,000 | | | | | GLP Capital, LP / GLP Financing II, Inc.
4.375%, 04/15/21 | | | 512,052 | |
| | | |
| | 505,000 | | | | | goeasy, Ltd.*
7.875%, 11/01/22 | | | 525,710 | |
| | | |
| | 500,000 | | | | | Harley-Davidson Financial Services, Inc.*
3.550%, 05/21/21 | | | 511,783 | |
| | | |
| | 750,000 | | | | | Hasbro, Inc.
3.150%, 05/15/21 | | | 759,412 | |
| | | | | | |
| See accompanying Notes to Schedule of Investments | | www.calamos.com | | | 145 | |
Short-Term Bond Fund Schedule of Investments October 31, 2019
| | | | | | | | | | |
PRINCIPAL AMOUNT | | | | | | | VALUE | |
| | | |
| | 250,000 | | | | | International Game Technology, PLC*
6.250%, 02/15/22 | | $ | 264,738 | |
| | | |
| | | | | | Lennar Corp. | | | | |
| | 500,000 | | | | | 4.750%, 11/15/22 | | | 527,122 | |
| | 250,000 | | | | | 6.250%, 12/15/21 | | | 264,705 | |
| | 250,000 | | | | | 4.500%, 11/15/19 | | | 250,166 | |
| | | |
| | 500,000 | | | | | M/I Homes, Inc.
6.750%, 01/15/21 | | | 505,718 | |
| | | |
| | | | | | Marriott International, Inc.‡ | | | | |
| | 500,000 | | | | | 2.752%, 03/08/21 | | | 502,195 | |
| | 250,000 | | | | | 2.738%, 12/01/20 3 mo. USD LIBOR + .60% | | | 250,781 | |
| | | |
| | 500,000 | | | | | Mattel, Inc.
2.350%, 08/15/21 | | | 492,050 | |
| | | |
| | 353,000 | | | | | McDonald’s Corp.
3.625%, 05/20/21 | | | 362,282 | |
| | | |
| | 500,000 | | | | | Meritage Homes Corp.
7.150%, 04/15/20 | | | 509,500 | |
| | | |
| | 500,000 | | | | | Newell Brands, Inc.
3.850%, 04/01/23 | | | 518,142 | |
| | | |
| | 750,000 | | | | | Nissan Motor Acceptance Corp.*
2.150%, 07/13/20 | | | 750,000 | |
| | | |
| | 500,000 | | | | | Nordstrom, Inc.^
4.750%, 05/01/20 | | | 506,398 | |
| | | |
| | 500,000 | | | | | Panasonic Corp.*
2.536%, 07/19/22 | | | 504,243 | |
| | | |
| | 500,000 | | | | | Penske Automotive Group, Inc.^
3.750%, 08/15/20 | | | 504,853 | |
| | | |
| | 500,000 | | | | | Penske Truck Leasing Company, LP / PTL Finance Corp.*
3.650%, 07/29/21 | | | 512,385 | |
| | | |
| | 525,000 | | | | | PulteGroup, Inc.^
4.250%, 03/01/21 | | | 537,886 | |
| | | |
| | 500,000 | | | | | Service Corp. International
8.000%, 11/15/21 | | | 552,127 | |
| | | |
| | 750,000 | | | | | Sirius XM Radio, Inc.*^
3.875%, 08/01/22 | | | 767,227 | |
| | | |
| | 105,000 | | | | | Taylor Morrison Communities, Inc.*
5.875%, 04/15/23 | | | 113,941 | |
| | | |
| | 355,000 | | | | | Toll Brothers Finance Corp.
5.875%, 02/15/22 | | | 378,906 | |
| | | |
| | 500,000 | | | | | Toyota Motor Corp.
2.157%, 07/02/22 | | | 504,450 | |
| | | |
| | 250,000 | | | | | Toyota Motor Credit Corp.
2.650%, 04/12/22 | | | 255,098 | |
| | | |
| | 553,789 | | | | | US Airways Pass Through TrustSeries 2012-2, Class B
6.750%, 12/03/22 | | | 582,437 | |
| | | | | | | | | | |
| | | | | | | | | 21,371,654 | |
| | | | | | | | | | |
| | | | | | Consumer Staples (2.5%) | |
| | 500,000 | | | | | Altria Group, Inc.
3.490%, 02/14/22 | | | 513,617 | |
| | | |
| | 346,000 | | | | | Anheuser-Busch InBev Worldwide, Inc.^
2.500%, 07/15/22 | | | 351,939 | |
| | | | | | | | | | |
PRINCIPAL AMOUNT | | | | | | | VALUE | |
| | | |
| | 250,000 | | | | | Archer-Daniels-Midland Company
3.375%, 03/15/22 | | $ | 258,212 | |
| | | |
| | 100,000 | | | | | Conagra Brands, Inc.^‡
2.512%, 10/09/20 3 mo. USD LIBOR + .50% | | | 100,109 | |
| | | |
| | | | | | Constellation Brands, Inc. | | | | |
| | 250,000 | | | | | 2.250%, 11/06/20 | | | 250,468 | |
| | 250,000 | | | | | 2.000%, 11/07/19 | | | 249,995 | |
| | | |
| | 516,000 | | | | | General Mills, Inc.
3.200%, 04/16/21 | | | 525,316 | |
| | | |
| | 500,000 | | | | | JBS USA LUX, SA / JBS USA Finance, Inc.*
5.875%, 07/15/24 | | | 515,907 | |
| | | |
| | 653,000 | | | | | Land O’Lakes, Inc.*
6.000%, 11/15/22 | | | 695,194 | |
| | | |
| | | | | | Mondelez International Holdings Netherlands, BV* | | | | |
| | 500,000 | | | | | 2.000%, 10/28/21 | | | 500,062 | |
| | 250,000 | | | | | 2.125%, 09/19/22 | | | 250,423 | |
| | | |
| | | | | | Unilever Capital Corp. | | | | |
| | 350,000 | | | | | 4.250%, 02/10/21 | | | 360,873 | |
| | 150,000 | | | | | 3.000%, 03/07/22 | | | 154,223 | |
| | | |
| | 685,000 | | | | | WM Wrigley Jr. Company*
3.375%, 10/21/20 | | | 694,148 | |
| | | | | | | | | | |
| | | | | | | | | 5,420,486 | |
| | | | | | | | | | |
| | | | | | Energy (3.3%) | |
| | 263,000 | | | | | Baltimore Gas & Electric Company
2.800%, 08/15/22 | | | 268,033 | |
| | | |
| | 558,000 | | | | | Buckeye Partners, LP
4.875%, 02/01/21 | | | 567,313 | |
| | | |
| | 300,000 | | | | | CenterPoint Energy Houston Electric, LLC
1.850%, 06/01/21 | | | 300,189 | |
| | | |
| | 313,000 | | | | | Continental Resources, Inc.
5.000%, 09/15/22 | | | 315,781 | |
| | | |
| | 500,000 | | | | | DCP Midstream Operating, LP*
4.750%, 09/30/21 | | | 512,417 | |
| | | |
| | 500,000 | | | | | Energy Transfer Operating, LP
7.500%, 10/15/20 | | | 524,672 | |
| | | |
| | | | | | Enterprise Products Operating, LLC | | | | |
| | 250,000 | | | | | 3.500%, 02/01/22 | | | 258,298 | |
| | 125,000 | | | | | 2.850%, 04/15/21 | | | 126,567 | |
| | | |
| | 500,000 | | | | | Halliburton Company
3.250%, 11/15/21 | | | 511,227 | |
| | | |
| | 225,000 | | | | | Magellan Midstream Partners, LP
4.250%, 02/01/21 | | | 231,120 | |
| | | |
| | 750,000 | | | | | Midwest Connector Capital Company, LLC*
3.625%, 04/01/22 | | | 770,764 | |
| | | |
| | 1,000,000 | | | | | Occidental Petroleum Corp.
2.700%, 08/15/22 | | | 1,011,420 | |
| | | |
| | 250,000 | | | | | ONEOK, Inc.
2.750%, 09/01/24 | | | 252,694 | |
| | | |
| | 500,000 | | | | | Phillips 66
4.300%, 04/01/22 | | | 527,995 | |
| | | | |
| 146 | | CALAMOS OPEN-END FAMILY OF FUNDS ANNUAL REPORT | | See accompanying Notes to Schedule of Investments |
Short-Term Bond Fund Schedule of Investments October 31, 2019
| | | | | | | | | | |
PRINCIPAL AMOUNT | | | | | | | VALUE | |
| | | |
| | 500,000 | | | | | Saudi Arabian Oil Company*
2.750%, 04/16/22 | | $ | 506,480 | |
| | | |
| | 500,000 | | | | | TransCanada PipeLines, Ltd.
3.800%, 10/01/20 | | | 508,250 | |
| | | | | | | | | | |
| | | | | | | | | 7,193,220 | |
| | | | | | | | | | |
| | | | | | Financials (28.9%) | |
| | | |
| | | | | | AerCap Ireland Capital DAC / AerCap Global Aviation Trust | | | | |
| | 500,000 | | | | | 2.875%, 08/14/24^ | | | 503,430 | |
| | 150,000 | | | | | 4.450%, 12/16/21 | | | 156,439 | |
| | | |
| | 355,000 | | | | | AerCap Ireland Capital, Ltd. / AerCap Global Aviation Trust
4.625%, 10/30/20 | | | 363,605 | |
| | | |
| | 250,000 | | | | | AIG Global Funding*
2.300%, 07/01/22 | | | 251,114 | |
| | | |
| | | | | | Ally Financial, Inc. | | | | |
| | 500,000 | | | | | 4.125%, 02/13/22 | | | 517,242 | |
| | 250,000 | | | | | 4.250%, 04/15/21 | | | 256,596 | |
| | 250,000 | | | | | 4.125%, 03/30/20 | | | 251,949 | |
| | | |
| | | | | | American Express Company | | | | |
| | 250,000 | | | | | 3.700%, 11/05/21 | | | 258,689 | |
| | 250,000 | | | | | 3.000%, 02/22/21 | | | 253,571 | |
| | 250,000 | | | | | 2.750%, 05/20/22 | | | 254,938 | |
| | | |
| | 250,000 | | | | | American Express Credit Corp.
2.375%, 05/26/20 | | | 250,540 | |
| | | |
| | | | | | American International Group, Inc. | | | | |
| | 500,000 | | | | | 3.300%, 03/01/21 | | | 508,247 | |
| | 250,000 | | | | | 4.875%, 06/01/22 | | | 267,984 | |
| | | |
| | 1,051,000 | | | | | Ameriprise Financial, Inc.
3.000%, 03/22/22 | | | 1,075,194 | |
| | | |
| | 350,000 | | | | | AON Corp.
5.000%, 09/30/20 | | | 359,475 | |
| | | |
| | 500,000 | | | | | Ares Capital Corp.
3.875%, 01/15/20 | | | 500,978 | |
| | | |
| | 1,000,000 | | | | | Asian Development Bank
1.625%, 03/16/21 | | | 999,555 | |
| | | |
| | 750,000 | | | | | Aviation Capital Group, LLC*
2.875%, 01/20/22 | | | 754,387 | |
| | | |
| | 608,000 | | | | | AXIS Specialty Finance, LLC
5.875%, 06/01/20 | | | 621,118 | |
| | | |
| | | | | | Bank of America Corp.‡ | | | | |
| | 500,000 | | | | | 2.369%, 07/21/21^ 3 mo. USD LIBOR + .66% | | | 501,293 | |
| | 250,000 | | | | | 2.456%, 10/22/25 3 mo. USD LIBOR + .87 | | | 251,473 | |
| | | |
| | | | | | Bank of Montreal | | | | |
| | 500,000 | | | | | 2.900%, 03/26/22 | | | 510,340 | |
| | 500,000 | | | | | 2.050%, 11/01/22 | | | 500,830 | |
| | 250,000 | | | | | 2.100%, 06/15/20 | | | 250,308 | |
| | | |
| | | | | | Bank of New York Mellon Corp. | | | | |
| | 500,000 | | | | | 1.950%, 08/23/22^ | | | 501,437 | |
| | 250,000 | | | | | 2.450%, 11/27/20 | | | 251,515 | |
| | | |
| | | | | | Bank of Nova Scotia | | | | |
| | 500,000 | | | | | 2.500%, 01/08/21 | | | 503,877 | |
| | 500,000 | | | | | 2.375%, 01/18/23^ | | | 505,490 | |
| | | | | | | | | | |
PRINCIPAL AMOUNT | | | | | | | VALUE | |
| | | |
| | | | | | BB&T Corp. | | | | |
| | 500,000 | | | | | 3.200%, 09/03/21 | | $ | 510,982 | |
| | 250,000 | | | | | 3.050%, 06/20/22 | | | 256,513 | |
| | 250,000 | | | | | 2.200%, 03/16/23 | | | 251,278 | |
| | | |
| | | | | | BP Capital Markets, PLC | | | | |
| | 400,000 | | | | | 3.561%, 11/01/21 | | | 413,156 | |
| | 100,000 | | | | | 2.315%, 02/13/20 | | | 100,121 | |
| | | |
| | 500,000 | | | | | Capital One Financial Corp.
3.450%, 04/30/21 | | | 510,412 | |
| | | |
| | 500,000 | | | | | Capital One NA
2.150%, 09/06/22 | | | 500,425 | |
| | | |
| | | | | | Caterpillar Financial Services Corp. | | | | |
| | 400,000 | | | | | 3.350%, 12/07/20 | | | 406,174 | |
| | 250,000 | | | | | 2.950%, 02/26/22 | | | 256,288 | |
| | 250,000 | | | | | 2.650%, 05/17/21 | | | 253,138 | |
| | 100,000 | | | | | 2.100%, 01/10/20 | | | 100,034 | |
| | | |
| | 250,000 | | | | | Charles Schwab Corp.
3.250%, 05/21/21 | | | 255,398 | |
| | | |
| | 500,000 | | | | | Chubb INA Holdings, Inc.
2.300%, 11/03/20 | | | 501,740 | |
| | | |
| | 500,000 | | | | | CIT Group, Inc.
4.125%, 03/09/21 | | | 511,277 | |
| | | |
| | 500,000 | | | | | Citibank, N.A.‡
3.165%, 02/19/22 | | | 507,410 | |
| | | |
| | | | | | Citigroup, Inc. | | | | |
| | 250,000 | | | | | 2.400%, 02/18/20 | | | 250,199 | |
| | 250,000 | | | | | 2.312%, 11/04/22‡ Update Replacements.xls: SOFRRATE + .87 | | | 250,708 | |
| | | |
| | 250,000 | | | | | Citizens Bank, N.A.
3.250%, 02/14/22 | | | 256,650 | |
| | | |
| | 500,000 | | | | | Comerica Bank
2.500%, 06/02/20 | | | 501,283 | |
| | | |
| | 750,000 | | | | | Danske Bank, A/S*‡ 3.001%, 09/20/22 3 mo. USD LIBOR + 1.25 | | | 756,679 | |
| | | |
| | | | | | Discover Bank | | | | |
| | 500,000 | | | | | 3.100%, 06/04/20 | | | 502,712 | |
| | 250,000 | | | | | 2.450%, 09/12/24 | | | 250,841 | |
| | | |
| | 500,000 | | | | | ERP Operating, LP
4.625%, 12/15/21 | | | 524,687 | |
| | | |
| | 500,000 | | | | | Essex Portfolio, LP^
3.625%, 08/15/22 | | | 518,092 | |
| | | |
| | | | | | European Investment Bank | | | | |
| | 1,500,000 | | | | | 2.000%, 03/15/21^ | | | 1,506,952 | |
| | 1,000,000 | | | | | 1.625%, 12/15/20 | | | 999,310 | |
| | 1,000,000 | | | | | 1.625%, 06/15/21 | | | 999,925 | |
| | | |
| | 500,000 | | | | | Fifth Third Bank
2.875%, 10/01/21 | | | 508,482 | |
| | | |
| | 750,000 | | | | | Franklin Resources, Inc.
2.800%, 09/15/22 | | | 766,410 | |
| | | |
| | | | | | Goldman Sachs Group, Inc. | | | | |
| | 500,000 | | | | | 3.000%, 04/26/22 | | | 506,867 | |
| | 225,000 | | | | | 2.625%, 04/25/21 | | | 227,174 | |
| | | |
| | 500,000 | | | | | Huntington Bancshares, Inc.
2.625%, 08/06/24 | | | 507,390 | |
| | | | | | |
| See accompanying Notes to Schedule of Investments | | www.calamos.com | | | 147 | |
Short-Term Bond Fund Schedule of Investments October 31, 2019
| | | | | | | | | | |
PRINCIPAL AMOUNT | | | | | | | VALUE | |
| | | |
| | | | | | Hyundai Capital America* | | | | |
| | 250,000 | | | | | 3.950%, 02/01/22 | | $ | 257,411 | |
| | 250,000 | | | | | 3.000%, 06/20/22^ | | | 252,783 | |
| | 250,000 | | | | | 2.600%, 03/19/20 | | | 250,151 | |
| | | |
| | | | | | Inter-American Development Bank | | | | |
| | 1,500,000 | | | | | 2.125%, 11/09/20 | | | 1,506,247 | |
| | 1,000,000 | | | | | 2.149%, 03/15/22‡ 3 mo. USD LIBOR + ..03 | | | 999,685 | |
| | 1,000,000 | | | | | 1.750%, 04/14/22 | | | 1,003,920 | |
| | | |
| | | | | | International Bank for Reconstruction & Development | | | | |
| | 1,500,000 | | | | | 1.375%, 05/24/21 | | | 1,494,270 | |
| | 1,000,000 | | | | | 2.125%, 11/01/20 | | | 1,003,945 | |
| | 1,000,000 | | | | | 1.625%, 02/10/22 | | | 1,000,895 | |
| | | |
| | 100,000 | | | | | International Lease Finance Corp.
4.625%, 04/15/21 | | | 103,487 | |
| | | |
| | 500,000 | | | | | Jackson National Life Global Funding*
3.300%, 06/11/21 | | | 510,580 | |
| | | |
| | 500,000 | | | | | JPMorgan Chase Bank, N.A.‡
2.604%, 02/01/21 | | | 500,735 | |
| | | |
| | 500,000 | | | | | KeyCorp
2.900%, 09/15/20 | | | 504,270 | |
| | | |
| | | | | | Kreditanstalt fuer Wiederaufbau | | | | |
| | 2,000,000 | | | | | 2.500%, 02/15/22 | | | 2,040,280 | |
| | 1,500,000 | | | | | 1.500%, 04/20/20 | | | 1,497,945 | |
| | 1,000,000 | | | | | 1.875%, 12/15/20 | | | 1,002,070 | |
| | | |
| | 500,000 | | | | | Lloyds Banking Group, PLC‡ 2.858%, 03/17/23 3 mo. USD LIBOR + 1.25 | | | 505,487 | |
| | | |
| | 250,000 | | | | | Macquarie Bank, Ltd.*
2.100%, 10/17/22 | | | 249,458 | |
| | | |
| | 650,000 | | | | | Macquarie Group, Ltd.*‡
4.150%, 03/27/24 | | | 686,293 | |
| | | |
| | | | | | Marsh & McLennan Companies, Inc. | | | | |
| | 250,000 | | | | | 4.800%, 07/15/21 | | | 260,509 | |
| | 250,000 | | | | | 2.350%, 03/06/20 | | | 250,228 | |
| | | |
| | 750,000 | | | | | MassMutual Global Funding II*
2.250%, 07/01/22 | | | 754,755 | |
| | | |
| | | | | | Metropolitan Life Global Funding I* | | | | |
| | 500,000 | | | | | 3.375%, 01/11/22 | | | 515,707 | |
| | 500,000 | | | | | 2.400%, 06/17/22 | | | 505,282 | |
| | | |
| | 750,000 | | | | | Mitsubishi UFJ Financial Group, Inc.
3.218%, 03/07/22 | | | 768,589 | |
| | | |
| | 750,000 | | | | | Mizuho Financial Group, Inc.‡
2.721%, 07/16/23 3 mo. USD LIBOR + .84 | | | 758,576 | |
| | | |
| | 390,000 | | | | | Morgan Stanley
2.650%, 01/27/20 | | | 390,661 | |
| | | |
| | 500,000 | | | | | National Bank of Canada*^
2.150%, 10/07/22 | | | 500,905 | |
| | | |
| | 500,000 | | | | | NatWest Markets, PLC*
3.625%, 09/29/22 | | | 517,485 | |
| | | |
| | 250,000 | | | | | New York Life Global Funding*
2.250%, 07/12/22 | | | 252,353 | |
| | | | | | | | | | |
PRINCIPAL AMOUNT | | | | | | | VALUE | |
| | | |
| | | | | | PACCAR Financial Corp. | | | | |
| | 500,000 | | | | | 2.850%, 03/01/22 | | $ | 511,135 | |
| | 500,000 | | | | | 2.000%, 09/26/22 | | | 502,152 | |
| | | |
| | 500,000 | | | | | PNC Bank, N.A.
2.500%, 01/22/21 | | | 503,785 | |
| | | |
| | 250,000 | | | | | PNC Bank, N.A.‡ 2.232%, 07/22/22 3 mo. USD LIBOR + .44 | | | 251,003 | |
| | | |
| | 250,000 | | | | | PNC Financial Services Group, Inc.
2.200%, 11/01/24 | | | 251,465 | |
| | | |
| | 250,000 | | | | | Prudential Financial, Inc.
4.500%, 11/16/21 | | | 262,801 | |
| | | |
| | 1,000,000 | | | | | Reliance Standard Life Global Funding II*
3.850%, 09/19/23 | | | 1,055,475 | |
| | | |
| | 500,000 | | | | | Royal Bank of Canada
2.500%, 01/19/21 | | | 503,850 | |
| | | |
| | 250,000 | | | | | Royal Bank Of Canada
2.800%, 04/29/22 | | | 255,251 | |
| | | |
| | 750,000 | | | | | Santander Holdings USA, Inc.
3.700%, 03/28/22 | | | 771,379 | |
| | | |
| | | | | | SBA Tower Trust* | | | | |
| | 500,000 | | | | | 3.168%, 04/09/47 | | | 505,075 | |
| | 260,000 | | | | | 3.156%, 10/10/45 | | | 260,190 | |
| | 165,000 | | | | | 3.722%, 04/09/48 | | | 168,581 | |
| | | |
| | 500,000 | | | | | Shell International Finance, BV
1.875%, 05/10/21 | | | 500,843 | |
| | | |
| | 750,000 | | | | | Silversea Cruise Finance, Ltd.*
7.250%, 02/01/25 | | | 798,611 | |
| | | |
| | 750,000 | | | | | Skandinaviska Enskilda Banken, AB*
3.050%, 03/25/22 | | | 767,209 | |
| | | |
| | 250,000 | | | | | Starwood Property Trust, Inc.
3.625%, 02/01/21 | | | 252,260 | |
| | | |
| | 500,000 | | | | | State Street Corp.‡ 2.354%, 11/01/25 Update Replacements.xls: SOFRRATE + .94 | | | 503,397 | |
| | | |
| | 250,000 | | | | | SunTrust Bank
2.800%, 05/17/22 | | | 254,700 | |
| | | |
| | 500,000 | | | | | SunTrust Banks, Inc.
2.900%, 03/03/21 | | | 505,682 | |
| | | |
| | 500,000 | | | | | TD Ameritrade Holding Corp.
2.950%, 04/01/22 | | | 511,260 | |
| | | |
| | | | | | Toronto-Dominion Bank | | | | |
| | 350,000 | | | | | 2.550%, 01/25/21 | | | 352,952 | |
| | 150,000 | | | | | 3.150%, 09/17/20^ | | | 151,700 | |
| | | |
| | 500,000 | | | | | Travelers Companies, Inc.
3.900%, 11/01/20 | | | 509,917 | |
| | | |
| | 250,000 | | | | | US Bancorp
2.350%, 01/29/21 | | | 251,651 | |
| | | |
| | 250,000 | | | | | US Bank, N.A.
3.450%, 11/16/21 | | | 257,545 | |
| | | |
| | | | | | USAA Capital Corp.* | | | | |
| | 510,000 | | | | | 2.000%, 06/01/21 | | | 511,300 | |
| | 450,000 | | | | | 2.450%, 08/01/20 | | | 452,252 | |
| | | | |
| 148 | | CALAMOS OPEN-END FAMILY OF FUNDS ANNUAL REPORT | | See accompanying Notes to Schedule of Investments |
Short-Term Bond Fund Schedule of Investments October 31, 2019
| | | | | | | | | | |
PRINCIPAL AMOUNT | | | | | | | VALUE | |
| | 250,000 | | | | | 2.625%, 06/01/21 | | $ | 253,038 | |
| | | |
| | 500,000 | | | | | Ventas Realty, LP
3.125%, 06/15/23 | | | 514,617 | |
| | | |
| | 100,000 | | | | | Weingarten Realty Investors
3.375%, 10/15/22 | | | 102,215 | |
| | | |
| | 1,000,000 | | | | | Wells Fargo Bank, N.A.^‡ 2.082%, 09/09/22 3 mo. USD LIBOR + .65 | | | 999,615 | |
| | | |
| | 500,000 | | | | | Zions Bancorporation, N.A.
3.350%, 03/04/22 | | | 512,312 | |
| | | | | | | | | | |
| | | | | | | | | 62,960,501 | |
| | | | | | | | | | |
| | | | | | Health Care (4.2%) | |
| | | | | | AbbVie, Inc. | | | | |
| | 250,000 | | | | | 3.375%, 11/14/21 | | | 256,645 | |
| | 250,000 | | | | | 2.500%, 05/14/20 | | | 250,439 | |
| | | |
| | | | | | Amgen, Inc. | | | | |
| | 250,000 | | | | | 2.125%, 05/01/20 | | | 250,194 | |
| | 250,000 | | | | | 1.850%, 08/19/21 | | | 249,824 | |
| | | |
| | | | | | AstraZeneca, PLC | | | | |
| | 500,000 | | | | | 2.375%, 11/16/20 | | | 502,477 | |
| | 250,000 | | | | | 2.375%, 06/12/22 | | | 252,448 | |
| | | |
| | | | | | Celgene Corp. | | | | |
| | 500,000 | | | | | 2.875%, 08/15/20 | | | 503,222 | |
| | 250,000 | | | | | 3.550%, 08/15/22 | | | 260,117 | |
| | | |
| | 500,000 | | | | | Centene Corp.
4.750%, 05/15/22 | | | 512,350 | |
| | | |
| | 1,000,000 | | | | | CVS Health Corp.
2.625%, 08/15/24 | | | 1,011,600 | |
| | | |
| | 500,000 | | | | | DaVita, Inc.
5.125%, 07/15/24 | | | 512,250 | |
| | | |
| | 435,000 | | | | | Elanco Animal Health, Inc.
3.912%, 08/27/21 | | | 446,573 | |
| | | |
| | | | | | Gilead Sciences, Inc. | | | | |
| | 500,000 | | | | | 3.250%, 09/01/22 | | | 519,242 | |
| | 250,000 | | | | | 2.550%, 09/01/20 | | | 251,385 | |
| | 250,000 | | | | | 2.350%, 02/01/20 | | | 250,229 | |
| | | |
| | | | | | GlaxoSmithKline Capital, PLC | | | | |
| | 500,000 | | | | | 2.850%, 05/08/22 | | | 511,990 | |
| | 100,000 | | | | | 2.525%, 05/14/21‡ 3 mo. USD LIBOR + ..35% | | | 100,245 | |
| | | |
| | 250,000 | | | | | McKesson Corp.
3.650%, 11/30/20 | | | 253,796 | |
| | | |
| | 500,000 | | | | | Tenet Healthcare Corp.*
4.625%, 09/01/24 | | | 514,050 | |
| | | |
| | 1,075,000 | | | | | Teva Pharmaceutical Finance Netherlands III, BV^
2.200%, 07/21/21 | | | 1,022,341 | |
| | | |
| | | | | | UnitedHealth Group, Inc. | | | | |
| | 100,000 | | | | | 2.379%, 06/15/21‡ 3 mo. USD LIBOR + ..26% | | | 99,989 | |
| | 100,000 | | | | | 2.300%, 12/15/19 | | | 100,062 | |
| | | |
| | | | | | Zoetis, Inc. | | | | |
| | 254,000 | | | | | 3.450%, 11/13/20 | | | 257,434 | |
| | 250,000 | | | | | 3.250%, 08/20/21 | | | 255,328 | |
| | | | | | | | | | |
| | | | | | | | | 9,144,230 | |
| | | | | | | | | | |
| | | | | | | | | | |
PRINCIPAL AMOUNT | | | | | | | VALUE | |
| | | | | | | | | | |
| | | | | | Industrials (6.9%) | |
| | 200,000 | | | | | 3M Company
3.000%, 09/14/21 | | $ | 204,270 | |
| | | |
| | | | | | Air Lease Corp. | | | | |
| | 520,000 | | | | | 3.500%, 01/15/22 | | | 534,895 | |
| | 250,000 | | | | | 2.250%, 01/15/23 | | | 249,339 | |
| | 200,000 | | | | | 3.375%, 06/01/21 | | | 203,788 | |
| | 100,000 | | | | | 2.125%, 01/15/20 | | | 100,008 | |
| | | |
| | 500,000 | | | | | Aircastle, Ltd.
5.500%, 02/15/22 | | | 531,707 | |
| | | |
| | 500,000 | | | | | Alimentation Couche-Tard, Inc.*
2.700%, 07/26/22 | | | 505,865 | |
| | | |
| | 500,000 | | | | | Arconic, Inc.
6.150%, 08/15/20 | | | 514,005 | |
| | | |
| | 500,000 | | | | | Avolon Holdings Funding, Ltd.*^
3.625%, 05/01/22 | | | 511,107 | |
| | | |
| | 500,000 | | | | | BMW Finance, NV*
2.250%, 08/12/22 | | | 502,390 | |
| | | |
| | | | | | Boeing Company | | | | |
| | 500,000 | | | | | 2.700%, 05/01/22 | | | 508,288 | |
| | 250,000 | | | | | 2.300%, 08/01/21 | | | 251,669 | |
| | | |
| | 250,000 | | | | | FedEx Corp.
3.400%, 01/14/22 | | | 257,474 | |
| | | |
| | 100,000 | | | | | GATX Corp.‡ 3.007%, 11/05/21 3 mo. USD LIBOR + .72% | | | 100,463 | |
| | | |
| | 100,000 | | | | | General Dynamics Corp.‡ 2.561%, 05/11/21 3 mo. USD LIBOR + .38% | | | 100,409 | |
| | | |
| | 500,000 | | | | | Great Lakes Dredge & Dock Corp.
8.000%, 05/15/22 | | | 530,850 | |
| | | |
| | 140,396 | | | | | Hawaiian Airlines Pass Through Certificates Series2013-1, Class B
4.950%, 07/15/23 | | | 143,370 | |
| | | |
| | 500,000 | | | | | Hertz Corp.*
7.625%, 06/01/22 | | | 520,875 | |
| | | |
| | 500,000 | | | | | Honeywell International, Inc.
2.150%, 08/08/22 | | | 505,395 | |
| | | |
| | | | | | John Deere Capital Corp. | | | | |
| | 500,000 | | | | | 3.200%, 01/10/22^ | | | 514,715 | |
| | 250,000 | | | | | 2.950%, 04/01/22 | | | 256,645 | |
| | 100,000 | | | | | 2.050%, 03/10/20 | | | 100,033 | |
| | | |
| | 500,000 | | | | | Meritor, Inc.
6.250%, 02/15/24 | | | 514,122 | |
| | | |
| | 500,000 | | | | | Norfolk Southern Corp.
3.250%, 12/01/21 | | | 512,112 | |
| | | |
| | | | | | Park Aerospace Holdings, Ltd.* | | | | |
| | 250,000 | | | | | 5.250%, 08/15/22 | | | 266,231 | |
| | 250,000 | | | | | 3.625%, 03/15/21 | | | 253,366 | |
| | | |
| | 250,000 | | | | | QVC, Inc.
5.125%, 07/02/22 | | | 263,570 | |
| | | |
| | 500,000 | | | | | Roper Technologies, Inc.^
2.800%, 12/15/21 | | | 508,170 | |
| | | |
| | 500,000 | | | | | Ryder System, Inc.
2.875%, 06/01/22 | | | 509,050 | |
| | | | | | |
| See accompanying Notes to Schedule of Investments | | www.calamos.com | | | 149 | |
Short-Term Bond Fund Schedule of Investments October 31, 2019
| | | | | | | | | | |
PRINCIPAL AMOUNT | | | | | | | VALUE | |
| | | |
| | | | | | Siemens Financieringsmaatschappij, NV* | | | | |
| | 500,000 | | | | | 1.700%, 09/15/21 | | $ | 499,145 | |
| | 250,000 | | | | | 2.150%, 05/27/20 | | | 250,593 | |
| | | |
| | 1,000,000 | | | | | SMBC Aviation Capital Finance DAC*
4.125%, 07/15/23 | | | 1,056,230 | |
| | | |
| | 500,000 | | | | | Southwest Airlines Company
2.650%, 11/05/20 | | | 503,935 | |
| | | |
| | 500,000 | | | | | Union Pacific Corp.^
2.950%, 03/01/22 | | | 512,310 | |
| | | |
| | 508,000 | | | | | United Rentals North America, Inc.
4.625%, 07/15/23 | | | 520,230 | |
| | | |
| | 500,000 | | | | | United Technologies Corp.
3.350%, 08/16/21 | | | 513,050 | |
| | | |
| | | | | | Volkswagen Group of America Finance, LLC* | | | | |
| | 500,000 | | | | | 3.875%, 11/13/20 | | | 509,053 | |
| | 200,000 | | | | | 2.500%, 09/24/21 | | | 201,428 | |
| | | | | | | | | | |
| | | | | | | | | 15,040,155 | |
| | | | | | | | | | |
| | | | | | Information Technology (2.9%) | |
| | 500,000 | | | | | Anixter, Inc.
5.125%, 10/01/21 | | | 517,472 | |
| | | |
| | 434,000 | | | | | Apple, Inc.
2.700%, 05/13/22 | | | 444,657 | |
| | | |
| | 640,000 | | | | | Autodesk, Inc.
3.125%, 06/15/20 | | | 643,379 | |
| | | |
| | 500,000 | | | | | Broadcom, Inc.*
3.125%, 04/15/21 | | | 506,110 | |
| | | |
| | 500,000 | | | | | Broadridge Financial Solutions, Inc.
3.950%, 09/01/20 | | | 508,292 | |
| | | |
| | 250,000 | | | | | Cisco Systems, Inc.
2.200%, 02/28/21 | | | 251,554 | |
| | | |
| | | | | | Hewlett Packard Enterprise Company | | | | |
| | 500,000 | | | | | 3.600%, 10/15/20 | | | 506,788 | |
| | 300,000 | | | | | 2.250%, 04/01/23 | | | 300,162 | |
| | 225,000 | | | | | 3.500%, 10/05/21 | | | 231,033 | |
| | | |
| | 245,000 | | | | | NetApp, Inc.
3.375%, 06/15/21 | | | 249,748 | |
| | | |
| | 500,000 | | | | | NVIDIA Corp.
2.200%, 09/16/21 | | | 502,458 | |
| | | |
| | 500,000 | | | | | NXP, BV / NXP Funding, LLC*
4.125%, 06/01/21 | | | 514,195 | |
| | | |
| | 310,000 | | | | | Oracle Corp.
3.875%, 07/15/20 | | | 314,332 | |
| | | |
| | 500,000 | | | | | PayPal Holdings, Inc.
2.200%, 09/26/22 | | | 502,998 | |
| | | |
| | 250,000 | | | | | QUALCOMM, Inc.
2.250%, 05/20/20 | | | 250,516 | |
| | | |
| | 120,000 | | | | | Symantec Corp.
4.200%, 09/15/20 | | | 121,520 | |
| | | | | | | | | | |
| | | | | | | | | 6,365,214 | |
| | | | | | | | | | |
| | | | | | Materials (0.9%) | |
| | 485,000 | | | | | Alcoa Nederland Holding, BV*
6.750%, 09/30/24 | | | 511,981 | |
| | | | | | | | | | |
PRINCIPAL AMOUNT | | | | | | | VALUE | |
| | | |
| | 500,000 | | | | | DuPont de Nemours, Inc.
3.766%, 11/15/20 | | $ | 509,395 | |
| | | |
| | 750,000 | | | | | Georgia-Pacific, LLC*
5.400%, 11/01/20 | | | 775,106 | |
| | | |
| | 100,000 | | | | | Vulcan Materials Company‡ 2.782%, 03/01/21 3 mo. USD LIBOR + .65% | | | 100,265 | |
| | | | | | | | | | |
| | | | | | | | | 1,896,747 | |
| | | | | | | | | | |
| | | | | | Real Estate (2.7%) | |
| | | | | | American Tower Corp. | | | | |
| | 500,000 | | | | | 2.800%, 06/01/20 | | | 501,952 | |
| | 159,000 | | | | | 3.450%, 09/15/21 | | | 162,858 | |
| | | |
| | 500,000 | | | | | AvalonBay Communities, Inc.
3.625%, 10/01/20 | | | 505,392 | |
| | | |
| | 897,000 | | | | | Equinix, Inc.
5.375%, 01/01/22 | | | 915,676 | |
| | | |
| | 200,000 | | | | | Federal Realty Investment Trust
2.550%, 01/15/21 | | | 201,467 | |
| | | |
| | | | | | Kimco Realty Corp. | | | | |
| | 500,000 | | | | | 3.125%, 06/01/23 | | | 514,280 | |
| | 250,000 | | | | | 3.200%, 05/01/21 | | | 253,888 | |
| | | |
| | 500,000 | | | | | Public Storage
2.370%, 09/15/22 | | | 506,685 | |
| | | |
| | 100,000 | | | | | Realty Income Corp.
5.750%, 01/15/21 | | | 103,599 | |
| | | |
| | 500,000 | | | | | Service Properties Trust
4.250%, 02/15/21 | | | 507,702 | |
| | | |
| | | | | | Simon Property Group, LP | | | | |
| | 250,000 | | | | | 2.500%, 09/01/20 | | | 250,940 | |
| | 250,000 | | | | | 2.000%, 09/13/24^ | | | 249,649 | |
| | | |
| | 750,000 | | | | | UDR, Inc.
4.625%, 01/10/22 | | | 791,160 | |
| | | |
| | 500,000 | | | | | Welltower, Inc.
3.625%, 03/15/24 | | | 527,825 | |
| | | | | | | | | | |
| | | | | | | | | 5,993,073 | |
| | | | | | | | | | |
| | | | | | Utilities (4.8%) | |
| | 250,000 | | | | | AES Corp.
4.000%, 03/15/21 | | | 254,799 | |
| | | |
| | 510,000 | | | | | American Electric Power Company, Inc.
3.650%, 12/01/21 | | | 527,674 | |
| | | |
| | 225,000 | | | | | CenterPoint Energy, Inc.
3.600%, 11/01/21 | | | 231,708 | |
| | | |
| | 100,000 | | | | | Consolidated Edison Company of New York, Inc.‡ 2.506%, 06/25/21 3 mo. USD LIBOR + .40% | | | 100,375 | |
| | | |
| | | | | | Consolidated Edison, Inc. | | | | |
| | 500,000 | | | | | 2.000%, 05/15/21 | | | 500,308 | |
| | 400,000 | | | | | 2.000%, 03/15/20^ | | | 400,038 | |
| | | |
| | | | | | Dominion Energy, Inc. | | | | |
| | 500,000 | | | | | 2.715%, 08/15/21*** | | | 504,825 | |
| | 250,000 | | | | | 2.579%, 07/01/20 | | | 250,758 | |
| | | | |
| 150 | | CALAMOS OPEN-END FAMILY OF FUNDS ANNUAL REPORT | | See accompanying Notes to Schedule of Investments |
Short-Term Bond Fund Schedule of Investments October 31, 2019
| | | | | | | | | | |
PRINCIPAL AMOUNT | | | | | | | VALUE | |
| | | |
| | | | | | DTE Energy Company | | | | |
| | 500,000 | | | | | 2.600%, 06/15/22 | | $ | 505,532 | |
| | 250,000 | | | | | 2.250%, 11/01/22 | | | 250,564 | |
| | | |
| | 500,000 | | | | | Duke Energy Carolinas, LLC^
3.350%, 05/15/22 | | | 519,625 | |
| | | |
| | 760,000 | | | | | Entergy Arkansas, LLC
3.750%, 02/15/21 | | | 774,448 | |
| | | |
| | 500,000 | | | | | Exelon Corp.
2.850%, 06/15/20 | | | 502,197 | |
| | | |
| | 250,000 | | | | | Exelon Generation Company, LLC
2.950%, 01/15/20 | | | 250,260 | |
| | | |
| | 250,000 | | | | | Georgia Power Company
4.250%, 12/01/19 | | | 250,415 | |
| | | |
| | 100,000 | | | | | Nevada Power Company
2.750%, 04/15/20 | | | 100,402 | |
| | | |
| | | | | | NextEra Energy Capital Holdings, Inc. | | | | |
| | 500,000 | | | | | 2.900%, 04/01/22 | | | 510,557 | |
| | 500,000 | | | | | 2.403%, 09/01/21 | | | 504,152 | |
| | | |
| | 500,000 | | | | | NGPL PipeCo, LLC*
4.375%, 08/15/22 | | | 519,770 | |
| | | |
| | 500,000 | | | | | NRG Energy, Inc.*
3.750%, 06/15/24 | | | 518,562 | |
| | | |
| | 100,000 | | | | | PPL Capital Funding, Inc.‡ 4.769%, 03/30/67 3 mo. USD LIBOR + 2.67% | | | 89,740 | |
| | | |
| | | | | | Sempra Energy | | | | |
| | 400,000 | | | | | 2.400%, 02/01/20 | | | 400,280 | |
| | 100,000 | | | | | 2.569%, 03/15/21‡ 3 mo. USD LIBOR + ..45% | | | 99,860 | |
| | | |
| | 500,000 | | | | | Southern Company
2.350%, 07/01/21 | | | 502,950 | |
| | | |
| | | | | | WEC Energy Group, Inc. | | | | |
| | 250,000 | | | | | 3.375%, 06/15/21 | | | 255,675 | |
| | 250,000 | | | | | 3.100%, 03/08/22 | | | 256,094 | |
| | | |
| | 250,000 | | | | | Wisconsin Public Service Corp.
3.350%, 11/21/21 | | | 257,415 | |
| | | |
| | 733,000 | | | | | Xcel Energy, Inc.
2.600%, 03/15/22 | | | 742,401 | |
| | | | | | | | | | |
| | | | | | | | | 10,581,384 | |
| | | | | | | | | | |
| | | |
| | | | | | TOTAL CORPORATE BONDS
(Cost $153,105,910) | | | 155,305,105 | |
| | | | | | | | | | |
| | | | | | | | | | |
|
| | CONVERTIBLE BOND (0.2%) | |
| | | | | | Financials (0.2%) | |
| | 400,000 | | | | | Prospect Capital Corp. 4.950%, 07/15/22 (Cost $395,777) | | | 411,810 | |
| | | | | | | | | | |
|
| | U.S. GOVERNMENT AND AGENCY SECURITIES (7.0%) | |
| | | | | | United States Treasury Note | | | | |
| | 7,000,000 | | | | | 1.375%, 06/30/23 | | | 6,965,273 | |
| | 2,500,000 | | | | | 1.250%, 08/31/24 | | | 2,469,727 | |
| | 2,000,000 | | | | | 2.000%, 05/31/24 | | | 2,043,125 | |
| | 2,000,000 | | | | | 1.750%, 07/31/24 | | | 2,020,781 | |
| | | | | | | | | | |
PRINCIPAL AMOUNT | | | | | | | VALUE | |
| | 1,750,000 | | | | | 2.000%, 10/31/22 | | $ | 1,774,815 | |
| | | | | | | | | | |
| | | |
| | | | | | TOTAL U.S. GOVERNMENT AND AGENCY SECURITIES (Cost $15,017,477) | | | 15,273,721 | |
| | | | | | | | | | |
| | | | | | | | | | |
|
| | BANK LOANS (4.2%) | |
| | | | | | Communication Services (1.0%) | |
| | 743,693 | | | | | Charter Communications Operating, LLC‡ 3.580%, 04/30/25 1 mo. LIBOR + 1.75% | | | 747,014 | |
| | | |
| | 498,750 | | | | | CSC Holdings, LLC‡ 4.327%, 04/15/27 1 mo. LIBOR + 2.50% | | | 499,194 | |
| | | |
| | 535,428 | | | | | Sprint Communications, Inc.‡ 4.813%, 02/02/24 1 mo. LIBOR + 3.00% | | | 533,085 | |
| | | |
| | 497,449 | | | | | Zayo Group, LLC / Zayo Capital, Inc.‡ 3.786%, 01/19/21 1 mo. LIBOR + 2.00% | | | 499,003 | |
| | | | | | | | | | |
| | | | | | | | | 2,278,296 | |
| | | | | | | | | | |
| | | | | | Consumer Discretionary (0.2%) | |
| | 500,000 | | | | | MGM Resorts International‡ 3.710%, 12/21/23 1 mo. LIBOR + 2.00% | | | 498,750 | |
| | | | | | | | | | |
| | | | | | Energy (0.1%) | |
| | 250,000 | | | | | Buckeye Partners, LP!
0.000%, 11/15/26 | | | 251,456 | |
| | | | | | | | | | |
| | | | | | Financials (0.8%) | |
| | 750,000 | | | | | Level 3 Financing, Inc.‡ 4.036%, 02/22/24 1 mo. LIBOR + 2.25% | | | 751,875 | |
| | | |
| | 994,845 | | | | | MGM Growth Properties Operating Partnership LP‡ 3.786%, 03/21/25 1 mo. LIBOR + 2.00% | | | 999,128 | |
| | | | | | | | | | |
| | | | | | | | | 1,751,003 | |
| | | | | | | | | | |
| | | | | | Health Care (0.6%) | |
| | 446,023 | | | | | Bausch Health Cos., Inc.‡ 4.671%, 11/27/25 1 mo. LIBOR + 2.75% | | | 447,075 | |
| | | |
| | 744,332 | | | | | HCA, Inc.‡ 3.536%, 03/13/25 1 mo. LIBOR + 1.75% | | | 748,520 | |
| | | | | | | | | | |
| | | | | | | | | 1,195,595 | |
| | | | | | | | | | |
| | | | | | Industrials (0.9%) | |
| | 875,000 | | | | | Berry Global, Inc.‡ 4.189%, 10/01/22 2 mo. LIBOR + 2.25% | | | 878,658 | |
| | | |
| | 497,468 | | | | | Navistar International Corp.‡ 5.420%, 11/06/24 1 mo. LIBOR + 3.50% | | | 493,429 | |
| | | | | | |
| See accompanying Notes to Schedule of Investments | | www.calamos.com | | | 151 | |
Short-Term Bond Fund Schedule of Investments October 31, 2019
| | | | | | | | | | |
PRINCIPAL AMOUNT | | | | | | | VALUE | |
| | | |
| | 497,475 | | | | | TransDigm, Inc.‡ 4.286%, 06/09/23 1 mo. LIBOR + 2.50% | | $ | 495,880 | |
| | | | | | | | | | |
| | | | | | | | | 1,867,967 | |
| | | | | | | | | | |
| | | | | | Information Technology (0.6%) | |
| | 250,000 | | | | | Camelot U.S. Acquisition 1 Co.!
0.000%, 10/25/26 | | | 251,094 | |
| | | |
| | 744,231 | | | | | CDW, LLC‡ 3.540%, 10/13/26 1 mo. LIBOR + 1.75% | | | 747,822 | |
| | | |
| | 292,480 | | | | | SS&C Technologies, Inc.‡ 4.036%, 07/08/22 1 mo. LIBOR + 2.25% | | | 294,766 | |
| | | | | | | | | | |
| | | | | | | | | 1,293,682 | |
| | | | | | | | | | |
| | | |
| | | | | | TOTAL BANK LOANS
(Cost $9,104,175) | | | 9,136,749 | |
| | | | | | | | | | |
|
| | ASSET BACKED SECURITIES (14.7%) | |
| | 327,195 | | | | | American Airlines Pass Through TrustSeries 2013-1, Class B*
5.625%, 07/15/22 | | | 333,371 | |
| | | |
| | 500,000 | | | | | American Tower Trust #1Series 2013-2A*
3.070%, 03/15/48 | | | 505,798 | |
| | | |
| | 250,000 | | | | | Avis Budget Rental Car Funding AESOP, LLC Series2015-2A, Class A*
2.630%, 12/20/21 | | | 251,149 | |
| | | |
| | 1,500,000 | | | | | Avis Budget Rental Car Funding AESOP, LLC Series2017-1A, Class A*
3.070%, 09/20/23 | | | 1,533,217 | |
| | | |
| | 150,000 | | | | | BA Credit Card Trust Series2017-A1, Class A1
1.950%, 08/15/22 | | | 150,007 | |
| | | |
| | 910,000 | | | | | BMW Vehicle Lease Trust Series2019-1, Class A4
2.920%, 08/22/22 | | | 923,974 | |
| | | |
| | 150,000 | | | | | Capital One Multi-Asset Execution Trust Series2016-A6, Class A6
1.820%, 09/15/22 | | | 149,996 | |
| | | |
| | 69,301 | | | | | CarMax Auto Owner Trust Series2018-3, Class A2A
2.880%, 10/15/21 | | | 69,462 | |
| | | |
| | 500,000 | | | | | Commonbond Student Loan TrustSeries 2019-AGS, Class A1*
2.540%, 01/25/47 | | | 501,807 | |
| | | |
| | 250,000 | | | | | Credit Acceptance Auto Loan TrustSeries 2017-3A, Class A*
2.650%, 06/15/26 | | | 250,619 | |
| | | |
| | 2,200,000 | | | | | Credit Acceptance Auto Loan TrustSeries 2019-1A, Class A*
3.330%, 02/15/28 | | | 2,247,553 | |
| | | |
| | 110,291 | | | | | Dell Equipment Finance TrustSeries 2017-2, Class A3*
2.190%, 10/24/22 | | | 110,322 | |
| | | |
| | 250,000 | | | | | Dell Equipment Finance TrustSeries 2018-1, Class A3*
3.180%, 06/22/23 | | | 252,515 | |
| | | | | | | | | | |
PRINCIPAL AMOUNT | | | | | | | VALUE | |
| | | |
| | 127,584 | | | | | Dell Equipment Finance TrustSeries 2018-2, Class A2*
3.160%, 02/22/21 | | $ | 128,154 | |
| | | |
| | 1,000,000 | | | | | Dell Equipment Finance TrustSeries 2018-2, Class A3*
3.370%, 10/22/23 | | | 1,016,296 | |
| | | |
| | 794,791 | | | | | DT Auto Owner Trust Series2019-3A, Class A*
2.550%, 08/15/22 | | | 796,881 | |
| | | |
| | 326,255 | | | | | Enterprise Fleet Financing, LLCSeries 2018-1, Class A2*
2.870%, 10/20/23 | | | 328,063 | |
| | | |
| | 1,000,000 | | | | | Enterprise Fleet Financing, LLCSeries 2019-3, Class A2*
2.060%, 05/20/25 | | | 1,001,639 | |
| | | |
| | 1,000,000 | | | | | Ford Credit Floorplan Master Owner Trust Series2019-1, Class A
2.840%, 03/15/24 | | | 1,019,282 | |
| | | |
| | 150,000 | | | | | GM Financial Consumer Automobile Receivables Series2018-3, Class A3
3.020%, 05/16/23 | | | 152,180 | |
| | | |
| | 879,025 | | | | | Hertz Fleet Lease Funding, LPSeries 2018-1, Class A2*
3.230%, 05/10/32 | | | 885,862 | |
| | | |
| | 150,000 | | | | | Hertz Vehicle Financing II, LPSeries 2015-1A, Class A*
2.730%, 03/25/21 | | | 150,254 | |
| | | |
| | 500,000 | | | | | Honda Auto Receivables Owner TrustSeries 2018-4, Class A3
3.160%, 01/17/23 | | | 509,691 | |
| | | |
| | 1,000,000 | | | | | MMAF Equipment Finance LLCSeries 2019-B, Class A2*
2.070%, 10/12/22 | | | 1,000,971 | |
| | | |
| | 919,475 | | | | | MVW Owner Trust Series2019-1A, Class A*
2.890%, 11/20/36 | | | 936,591 | |
| | | |
| | 1,000,000 | | | | | Navistar Financial Dealer Note Master Owner Trust II Series2019-1, Class A*‡
2.463%, 05/25/24 | | | 1,000,130 | |
| | | |
| | 1,200,000 | | | | | NextGear Floorplan Master Owner Trust Series2019-1A, Class A2*
3.210%, 02/15/24 | | | 1,227,768 | |
| | | |
| | 10,800 | | | | | OSCAR US Funding Trust V, LLCSeries 2016-2A, Class A3*
2.730%, 12/15/20 | | | 10,801 | |
| | | |
| | 1,500,000 | | | | | OSCAR US Funding Trust VIII, LLCSeries 2018-1A, Class A3*
3.230%, 05/10/22 | | | 1,514,050 | |
| | | |
| | 1,000,000 | | | | | OSCAR US Funding Trust X, LLCSeries 2019-1A, Class A3*
3.180%, 05/10/23 | | | 1,017,424 | |
| | | |
| | 2,000,000 | | | | | Palmer Square Loan Funding, Ltd.Series 2019-3A, Class A1*‡
3.016%, 08/20/27 | | | 1,998,150 | |
| | | |
| | 132,163 | | | | | SCF Equipment Leasing, LLCSeries 2018-1A, Class A2*
3.630%, 10/20/24 | | | 134,066 | |
| | | | |
| 152 | | CALAMOS OPEN-END FAMILY OF FUNDS ANNUAL REPORT | | See accompanying Notes to Schedule of Investments |
Short-Term Bond Fund Schedule of Investments October 31, 2019
| | | | | | | | | | |
PRINCIPAL AMOUNT | | | | | | | VALUE | |
| | | |
| | 750,000 | | | | | SCF Equipment Leasing, LLCSeries 2019-2A, Class A1*
2.220%, 06/20/24 | | $ | 750,805 | |
| | | |
| | 1,608,664 | | | | | SoFi Consumer Loan Program TrustSeries 2018-4, Class A*
3.540%, 11/26/27 | | | 1,624,407 | |
| | | |
| | 1,488,275 | | | | | SoFi Professional Loan Program LLCSeries 2016-E, Class A2B*
2.490%, 01/25/36 | | | 1,493,749 | |
| | | |
| | 128,588 | | | | | SoFi Professional Loan Program LLCSeries 2017-C, Class A2A*
1.750%, 07/25/40 | | | 128,487 | |
| | | |
| | 1,000,000 | | | | | Toyota Auto Loan Extended Note Trust Series2019-1A, Class A*
2.560%, 11/25/31 | | | 1,021,957 | |
| | | |
| | 360,096 | | | | | Verizon Owner Trust Series2017-1A, Class A*
2.060%, 09/20/21 | | | 360,103 | |
| | | |
| | 1,500,000 | | | | | Verizon Owner Trust Series2019-C, Class A1A
1.940%, 04/22/24 | | | 1,500,770 | |
| | | |
| | 500,000 | | | | | Volvo Financial Equipment, LLCSeries 2018-1A, Class A4*
2.760%, 10/17/22 | | | 506,617 | |
| | | |
| | 1,525,000 | | | | | Volvo Financial Equipment, LLCSeries 2018-1A, Class B*
2.910%, 01/17/23 | | | 1,550,018 | |
| | | |
| | 30,000 | | | | | World Financial Network Credit Card Master Trust Series2015-B, Class A
2.550%, 06/17/24 | | | 30,115 | |
| | | |
| | 140,000 | | | | | World Financial Network Credit Card Master Trust Series2017-A, Class A
2.120%, 03/15/24 | | | 140,002 | |
| | | |
| | 834,481 | | | | | World Omni Auto Receivables Trust Series 2019- A, Class A2
3.020%, 04/15/22 | | | 838,588 | |
| | | | | | | | | | |
| | | |
| | | | | | TOTAL ASSET BACKED SECURITIES
(Cost $31,738,055) | | | 32,053,661 | |
| | | | | | | | | | |
| | | | | | | | | | |
|
| | RESIDENTIAL MORTGAGE BACKED SECURITIES (1.7%) | |
| | 932,420 | | | | | Federal Home Loan Mortgage Corp.
3.000%, 01/25/26 | | | 938,353 | |
| | | |
| | 143,894 | | | | | Federal National Mortgage Association
2.761%, 04/01/21 | | | 144,266 | |
| | | |
| | 13,636 | | | | | Morgan Stanley Bank of America Merrill Lynch Trust, Series2016-C29, Class A1
1.597%, 05/15/49 | | | 13,590 | |
| | | |
| | 6,674 | | | | | Morgan Stanley Capital I Trust, Series 2015-UBS8, Class A1
1.966%, 12/15/48 | | | 6,665 | |
| | | |
| | 122,303 | | | | | Morgan Stanley Capital I Trust,Series 2018-H3, Class A1
3.176%, 07/15/51 | | | 125,150 | |
| | | | | | | | | | |
PRINCIPAL AMOUNT | | | | | | | VALUE | |
| | | |
| | 331,096 | | | | | Wells Fargo Commercial Mortgage Trust Series2015-C26, Class A2
2.663%, 02/15/48 | | $ | 330,933 | |
| | | |
| | 443,973 | | | | | Wells Fargo Commercial Mortgage Trust Series 2015-LC20, Class A2
2.678%, 04/15/50 | | | 444,030 | |
| | | |
| | 675,000 | | | | | Wells Fargo Commercial Mortgage Trust Series2017-RC1, Class A2
3.118%, 01/15/60 | | | 687,683 | |
| | | |
| | 534,000 | | | | | WFRBS Commercial Mortgage TrustSeries 2011-C4, Class A4*‡
4.902%, 06/15/44 | | | 554,223 | |
| | | |
| | 229,915 | | | | | WFRBS Commercial Mortgage TrustSeries 2012-C10, Class ASB
2.453%, 12/15/45 | | | 231,346 | |
| | | |
| | 260,172 | | | | | WFRBS Commercial Mortgage Trust Series 2014-LC14, Class ASB
3.522%, 03/15/47 | | | 267,929 | |
| | | | | | | | | | |
| | | |
| | | | | | TOTAL RESIDENTIAL MORTGAGE BACKED SECURITIES
(Cost $3,712,772) | | | 3,744,168 | |
| | | | | | | | | | |
| | | | | | | | | | |
|
| | MUNICIPAL OBLIGATIONS (0.3%) | |
| | | | | | Financials (0.0%) | |
| | | |
| | 75,000 | | | | | Massachusetts Housing Finance Agency 2.313%, 12/01/19 | | | 75,018 | |
| | | | | | | | | | |
| | | | | | Industrials (0.1%) | |
| | | |
| | 100,000 | | | | | Metropolitan Transportation Authority
5.269%, 11/15/20 | | | 103,239 | |
| | | | | | | | | | |
| | | | | | Other (0.2%) | | | | |
| | | |
| | 260,000 | | | | | City of Miami, Florida*
3.558%, 01/01/21 | | | 263,552 | |
| | | |
| | 200,000 | | | | | City of Ridgecrest, California
5.000%, 06/01/20 | | | 202,999 | |
| | | | | | | | | | |
| | | | | | | | | 466,551 | |
| | | | | | | | | | |
| | | |
| | | | | | TOTAL MUNICIPAL OBLIGATIONS
(Cost $639,117) | | | 644,808 | |
| | | | | | | | | | |
| | | | | | | | | | |
NUMBER OF SHARES | | | | | | | VALUE | |
|
| | SHORT TERM INVESTMENTS (1.3%) | |
| | 1,377,124 | | | | | Fidelity Prime Money Market Fund - Institutional Class, 1.890%*** | | | 1,377,675 | |
| | | |
| | 1,374,412 | | | | | Morgan Stanley Institutional Liquidity Funds - Government Portfolio,
1.720%*** | | | 1,374,412 | |
| | | | | | | | | | |
| | | |
| | | | | | TOTAL SHORT TERM INVESTMENTS
(Cost $2,752,065) | | | 2,752,087 | |
| | | | | | | | | | |
| | | | | | |
| See accompanying Notes to Schedule of Investments | | www.calamos.com | | | 153 | |
Short-Term Bond Fund Schedule of Investments October 31, 2019
| | | | | | | | | | |
NUMBER OF SHARES/ PRINCIPAL
AMOUNT | | | | | | | VALUE | |
|
| INVESTMENT OF CASH COLLATERAL FOR SECURITIES
LOANED (3.0%) |
|
| | 6,579,080 | | | | | State Street Navigator Securities Lending Government Money Market Portfolio† (Cost $6,579,080) | | $ | 6,579,080 | |
| | | | | | | | | | |
| |
| TOTAL INVESTMENTS (103.6%)
(Cost $223,044,428) | | | 225,901,189 | |
| | | | | | | | | | |
| |
| | PAYABLE UPON RETURN OF SECURITIES ONLOAN (-3.0%) | | | (6,579,080 | ) |
| | | | | | | | | | |
| |
| | LIABILITIES, LESS OTHER ASSETS(-0.6%) | | | (1,169,082 | ) |
| | | | | | | | | | |
| |
| | NET ASSETS (100.0%) | | $ | 218,153,027 | |
| | | | | | | | | | |
NOTES TO SCHEDULE OF INVESTMENTS
| * | Securities issued and sold pursuant to a Rule 144A transaction are excepted from the registration requirement of the Securities Act of 1933, as amended. These securities may only be sold to qualified institutional buyers (“QIBs”), such as the Fund. Any resale of these securities must generally be effected through a sale that is registered under the Act or otherwise exempted from such registration requirements. |
| ^ | Security, or portion of security, is on loan. |
| ‡ | Variable rate security. The rate shown is the rate in effect at October 31, 2019. |
| ** | Step coupon security. Coupon changes periodically based upon a predetermined schedule. The rate shown is the rate in effect at October 31, 2019. |
| ! | This position represents an unsettled loan commitment at period end. Certain details associated with this purchase are not known prior to the settlement date, including coupon rate, which will be adjusted on settlement date. |
| *** | The rate disclosed is the 7 day net yield as of October 31, 2019. |
| † | Represents investment of cash collateral received from securities on loan as of October 31, 2019. |
FUTURES CONTRACTS
| | | | | | | | | | | | |
NUMBER OF CONTRACTS | | DESCRIPTION | | EXPIRATION DATE | | NOTIONAL VALUE | | | MARKET VALUE/ UNREALIZED APPRECIATION (DEPRECIATION) | |
| | | | |
| Sales | | | | | | | | | | | | |
| | | | |
| 20 | | U.S. Treasury Note5-Year | | Dec 2019 | | $ | 2,384,062 | | | $ | (5,363 | ) |
| | | | |
| 154 | | CALAMOS OPEN-END FAMILY OF FUNDS ANNUAL REPORT | | See accompanying Notes to Financial Statements |
Statements of Assets and Liabilities October 31, 2019
| | | | | | | | | | | | | | | | | | | | |
| | | MARKET NEUTRAL
INCOME FUND | | | HEDGED EQUITY
FUND | | | PHINEUS LONG/SHORT FUND | | | CONVERTIBLE
FUND | | | GLOBAL
CONVERTIBLE
FUND | |
ASSETS | | | | | | | | | | | | | | | | | | | | |
Investments in securities, at cost | | $ | 8,140,831,345 | | | $ | 234,535,729 | | | $ | 755,719,217 | | | $ | 729,486,748 | | | $ | 133,157,547 | |
Investments in affiliated funds, at cost | | | 150,000,000 | | | | — | | | | 35,250,728 | | | | — | | | | — | |
Investment in securities, at value | | $ | 9,178,109,413 | | | $ | 256,560,289 | | | $ | 779,683,477 | | | $ | 785,586,185 | | | $ | 137,197,631 | |
Investments in affiliated funds, at value | | | 152,367,617 | | | | — | | | | 36,060,658 | | | | — | | | | — | |
Cash with custodian (interest bearing) | | | 13,318,315 | | | | — | | | | 5,853,269 | | | | 8,877 | | | | — | |
Restricted cash | | | 2,190,000 | | | | — | | | | — | | | | — | | | | — | |
Restricted cash for short positions (interest bearing) | | | 2,665,727,021 | | | | — | | | | 708,107,802 | | | | 174 | | | | — | |
Restricted foreign currency for short positions (cost $126,627,332 and $58) | | | 127,318,901 | | | | — | | | | 58 | | | | — | | | | — | |
Unrealized appreciation on total return swaps | | | 104,638 | | | | — | | | | — | | | | — | | | | — | |
Receivables: | | | | | | | | | | | | | | | | | | | | |
Accrued interest and dividends | | | 17,725,059 | | | | 222,795 | | | | 867,298 | | | | 1,606,927 | | | | 398,719 | |
Investments sold | | | 13,892,445 | | | | — | | | | — | | | | 4,119,155 | | | | — | |
Open swap contracts | | | 170,762 | | | | — | | | | — | | | | — | | | | — | |
Fund shares sold | | | 25,784,866 | | | | 497,157 | | | | 881,743 | | | | 1,856,480 | | | | 121,878 | |
Prepaid expenses | | | 206,155 | | | | 17,224 | | | | 34,547 | | | | 35,603 | | | | 11,448 | |
Other assets | | | 1,872,470 | | | | 5,126 | | | | 927,200 | | | | 143,875 | | | | 5,164 | |
Total assets | | | 12,198,787,662 | | | | 257,302,591 | | | | 1,532,416,052 | | | | 793,357,276 | | | | 137,734,840 | |
LIABILITIES | | | | | | | | | | | | | | | | | | | | |
Due to custodian bank | | | 6,940,863 | | | | 136 | | | | — | | | | — | | | | — | |
Due to custodian bank - Foreign currency | | | 2,557,115 | | | | — | | | | — | | | | — | | | | — | |
Collateral for securities loaned | | | 102,369,545 | | | | — | | | | 11,962,705 | | | | 43,780,562 | | | | 3,755,500 | |
Securities sold short, at value (proceeds $2,221,893,032 and $633,022,454) | | | 2,747,003,702 | | | | — | | | | 708,131,417 | | | | — | | | | — | |
Options written, at value (premium $330,554,145, $13,501,497, $4,795,213, and $205,629) | | | 573,181,455 | | | | 19,907,178 | | | | 4,331,844 | | | | 63,000 | | | | — | |
Unrealized depreciation on forward foreign currency contracts | | | 207,724 | | | | — | | | | — | | | | 1,154 | | | | — | |
Payables: | | | | | | | | | | | | | | | | | | | | |
Investments purchased | | | 37,339,605 | | | | 105,984 | | | | 540,020 | | | | 3,164,922 | | | | 668,844 | |
Upfront payments paid on open swap contracts | | | 1,868 | | | | — | | | | — | | | | — | | | | — | |
Fund shares redeemed | | | 6,379,121 | | | | 269,203 | | | | 13,390,606 | | | | 622,932 | | | | 228,373 | |
Affiliates: | | | | | | | | | | | | | | | | | | | | |
Investment advisory fees | | | 4,776,252 | | | | 146,570 | | | | 844,172 | | | | 457,530 | | | | 94,599 | |
Distribution fees | | | 24,500 | | | | 261 | | | | 3,173 | | | | 6,432 | | | | 311 | |
Deferred compensation to trustees | | | 147,978 | | | | 5,126 | | | | 6,821 | | | | 143,875 | | | | 5,164 | |
Trustees’ fees and officer compensation | | | 73,171 | | | | 4,060 | | | | 13,401 | | | | 9,114 | | | | 4,087 | |
Other accounts payable and accrued liabilities | | | 2,630,934 | | | | 67,046 | | | | 274,596 | | | | 183,213 | | | | 44,574 | |
Total liabilities | | | 3,483,633,833 | | | | 20,505,564 | | | | 739,498,755 | | | | 48,432,734 | | | | 4,801,452 | |
NET ASSETS | | $ | 8,715,153,829 | | | $ | 236,797,027 | | | $ | 792,917,297 | | | $ | 744,924,542 | | | $ | 132,933,388 | |
COMPOSITION OF NET ASSETS | | | | | | | | | | | | | | | | | | | | |
Paid in capital | | $ | 8,457,365,989 | | | $ | 226,777,465 | | | $ | 866,644,821 | | | $ | 668,942,332 | | | $ | 124,437,285 | |
Undistributed net investment income (loss) | | | 23,546,658 | | | | 559,122 | | | | 1,859,803 | | | | 1,348,258 | | | | 330,216 | |
Accumulated net realized gain (loss) on investments, foreign currency transactions, written options, short positions and total return swaps | | | (38,267,800 | ) | | | (6,158,439 | ) | | | (25,714,996 | ) | | | 18,393,040 | | | | 4,126,366 | |
Unrealized appreciation (depreciation) of investments, foreign currency translations, written options and short positions | | | 272,508,982 | | | | 15,618,879 | | | | (49,872,331 | ) | | | 56,240,912 | | | | 4,039,521 | |
NET ASSETS | | $ | 8,715,153,829 | | | $ | 236,797,027 | | | $ | 792,917,297 | | | $ | 744,924,542 | | | $ | 132,933,388 | |
CLASS A SHARES† | | | | | | | | | | | | | | | | | | | | |
Net assets applicable to shares outstanding | | $ | 744,356,478 | | | $ | 10,412,349 | | | $ | 76,689,024 | | | $ | 245,948,003 | | | $ | 8,997,986 | |
Shares outstanding | | | 55,245,145 | | | | 876,326 | | | | 6,591,353 | | | | 14,090,476 | | | | 812,394 | |
Net asset value and redemption price per share | | $ | 13.47 | | | $ | 11.88 | | | $ | 11.63 | | | $ | 17.45 | | | $ | 11.08 | |
Maximum offering price per share (Net asset value, plus 4.75% of offering price) | | $ | 13.78 | # | | $ | 12.47 | | | $ | 12.21 | | | $ | 17.85 | # | | $ | 11.34 | # |
CLASS C SHARES†** | | | | | | | | | | | | | | | | | | | | |
Net assets applicable to shares outstanding | | $ | 261,351,926 | | | $ | 2,151,149 | | | $ | 38,071,734 | | | $ | 56,069,513 | | | $ | 3,409,322 | |
Shares outstanding | | | 19,078,662 | | | | 183,516 | | | | 3,363,625 | | | | 3,247,504 | | | | 311,957 | |
Net asset value and redemption price per share | | $ | 13.70 | | | $ | 11.72 | | | $ | 11.32 | | | $ | 17.27 | | | $ | 10.93 | |
CLASS I SHARES† | | | | | | | | | | | | | | | | | | | | |
Net assets applicable to shares outstanding | | $ | 7,709,445,425 | | | $ | 224,233,529 | | | $ | 678,156,539 | | | $ | 442,907,026 | | | $ | 120,526,080 | |
Shares outstanding | | | 579,565,874 | | | | 18,892,502 | | | | 57,730,674 | | | | 28,794,872 | | | | 10,876,631 | |
Net asset value and redemption price per share | | $ | 13.30 | | | $ | 11.87 | | | $ | 11.75 | | | $ | 15.38 | | | $ | 11.08 | |
| † | No par value; unlimited number of shares authorized. |
| # | For Market Neutral Income Fund, Convertible Fund and Global Convertible Fund maximum offering price per share is Net asset value plus 2.25% of offering price. |
| ** | Redemption price may be reduced by contingent deferred sales charge. |
| | | | | | |
| See accompanying Notes to Financial Statements | | www.calamos.com | | | 155 | |
Statements of Assets and Liabilities October 31, 2019
| | | | | | | | | | | | | | | | | | | | |
| | | TIMPANI SMALL
CAP GROWTH
FUND | | | TIMPANI SMID GROWTH FUND | | | GROWTH FUND | | | GROWTH AND INCOME FUND | | | DIVIDEND
GROWTH FUND | |
ASSETS | | | | | | | | | | | | | | | | | | | | |
Investments in securities, at cost | | $ | 62,722,397 | | | $ | 9,219,516 | | | $ | 1,094,817,011 | | | $ | 1,510,471,210 | | | $ | 12,152,749 | |
Investments in affiliated funds, at cost | | | — | | | | — | | | | 5,540,119 | | | | — | | | | — | |
Investment in securities, at value | | $ | 78,962,611 | | | $ | 9,118,063 | | | $ | 1,424,010,491 | | | $ | 2,055,413,778 | | | $ | 17,278,371 | |
Investments in affiliated funds, at value | | | — | | | | — | | | | 5,662,175 | | | | — | | | | — | |
Foreign currency (cost $1,162) | | | — | | | | — | | | | 1,162 | | | | — | | | | — | |
Receivables: | | | | | | | | | | | | | | | | | | | | |
Accrued interest and dividends | | | 166 | | | | 25 | | | | 656,728 | | | | 2,886,175 | | | | 13,848 | |
Investments sold | | | 2,694,306 | | | | 303,642 | | | | 997,172 | | | | 4,899,286 | | | | — | |
Fund shares sold | | | 122,444 | | | | — | | | | 41,066 | | | | 893,436 | | | | — | |
Due from investment advisor | | | — | | | | 19,092 | | | | — | | | | — | | | | 13,107 | |
Prepaid expenses | | | 25,152 | | | | 47 | | | | 44,449 | | | | 62,602 | | | | 20,593 | |
Deferred offering costs | | | — | | | | 86,832 | | | | — | | | | — | | | | — | |
Other assets | | | — | | | | — | | | | 660,571 | | | | 292,533 | | | | 6,829 | |
Total assets | | | 81,804,679 | | | | 9,527,701 | | | | 1,432,073,814 | | | | 2,064,447,810 | | | | 17,332,748 | |
LIABILITIES | | | | | | | | | | | | | | | | | | | | |
Due to custodian bank | | | — | | | | — | | | | 12,522 | | | | — | | | | — | |
Due to Investment advisor | | | 17,856 | | | | — | | | | — | | | | — | | | | — | |
Collateral for securities loaned | | | — | | | | — | | | | 29,711,149 | | | | 47,952,028 | | | | — | |
Options written, at value (premium $645,442 and $149,099) | | | — | | | | — | | | | 751,100 | | | | 102,430 | | | | — | |
Unrealized depreciation on forward foreign currency contracts | | | — | | | | — | | | | — | | | | 2,040 | | | | — | |
Payables: | | | | | | | | | | | | | | | | | | | | |
Investments purchased | | | 1,216,680 | | | | 77,154 | | | | — | | | | 11,424,455 | | | | — | |
Fund shares redeemed | | | 15,015 | | | | — | | | | 1,695,182 | | | | 2,090,103 | | | | — | |
Affiliates: | | | | | | | | | | | | | | | | | | | | |
Investment advisory fees | | | 60,750 | | | | 7,491 | | | | 1,069,888 | | | | 1,152,564 | | | | 14,228 | |
Distribution fees | | | 95 | | | | — | | | | 17,446 | | | | 22,971 | | | | 86 | |
Deferred compensation to trustees | | | — | | | | — | | | | 660,571 | | | | 292,533 | | | | 6,829 | |
Trustees’ fees and officer compensation | | | 912 | | | | 819 | | | | 16,982 | | | | 22,203 | | | | 2,973 | |
Other accounts payable and accrued liabilities | | | 34,547 | | | | 75,974 | | | | 464,103 | | | | 523,514 | | | | 25,911 | |
Total liabilities | | | 1,345,855 | | | | 161,438 | | | | 34,398,943 | | | | 63,584,841 | | | | 50,027 | |
NET ASSETS | | $ | 80,458,824 | | | $ | 9,366,263 | | | $ | 1,397,674,871 | | | $ | 2,000,862,969 | | | $ | 17,282,721 | |
COMPOSITION OF NET ASSETS | | | | | | | | | | | | | | | | | | | | |
Paid in capital | | $ | 60,492,987 | | | $ | 10,359,469 | | | $ | 946,569,577 | | | $ | 1,413,836,437 | | | $ | 10,235,074 | |
Undistributed net investment income (loss) | | | — | | | | — | | | | (256,650 | ) | | | (5,144,433 | ) | | | 22,495 | |
Accumulated net realized gain (loss) on investments, foreign currency transactions, written options and short positions | | | 3,725,623 | | | | (891,753 | ) | | | 122,153,862 | | | | 47,183,768 | | | | 1,899,530 | |
Unrealized appreciation (depreciation) of investments, foreign currency translations and written options | | | 16,240,214 | | | | (101,453 | ) | | | 329,208,082 | | | | 544,987,197 | | | | 5,125,622 | |
NET ASSETS | | $ | 80,458,824 | | | $ | 9,366,263 | | | $ | 1,397,674,871 | | | $ | 2,000,862,969 | | | $ | 17,282,721 | |
CLASS A SHARES† | | | | | | | | | | | | | | | | | | | | |
Net assets applicable to shares outstanding | | $ | 6,856,661 | | | $ | 9,011 | | | $ | 1,066,938,939 | | | $ | 1,129,200,507 | | | $ | 3,637,836 | |
Shares outstanding | | | 307,267 | | | | 1,000 | | | | 33,105,539 | | | | 33,779,156 | | | | 271,997 | |
Net asset value and redemption price per share | | $ | 22.31 | | | $ | 9.01 | | | $ | 32.23 | | | $ | 33.43 | | | $ | 13.37 | |
Maximum offering price per share (Net asset value, plus 4.75% of offering price) | | $ | 23.43 | | | $ | 9.46 | | | $ | 33.84 | | | $ | 35.10 | | | $ | 14.04 | |
CLASS C SHARES†** | | | | | | | | | | | | | | | | | | | | |
Net assets applicable to shares outstanding | | $ | — | | | $ | — | | | $ | 50,441,842 | | | $ | 136,333,091 | | | $ | 658,969 | |
Shares outstanding | | | — | | | | — | | | | 2,762,851 | | | | 4,047,437 | | | | 50,400 | |
Net asset value and redemption price per share | | $ | — | | | $ | — | | | $ | 18.26 | | | $ | 33.68 | | | $ | 13.07 | |
CLASS I SHARES† | | | | | | | | | | | | | | | | | | | | |
Net assets applicable to shares outstanding | | $ | 72,539,367 | | | $ | 9,348,235 | | | $ | 280,294,090 | | | $ | 735,329,371 | | | $ | 12,985,916 | |
Shares outstanding | | | 3,174,964 | | | | 1,036,544 | | | | 6,352,086 | | | | 22,958,018 | | | | 971,997 | |
Net asset value and redemption price per share | | $ | 22.85 | | | $ | 9.02 | | | $ | 44.13 | | | $ | 32.03 | | | $ | 13.36 | |
CLASS R6 SHARES† | | | | | | | | | | | | | | | | | | | | |
Net assets applicable to shares outstanding | | $ | 1,062,796 | | | $ | 9,017 | | | $ | — | | | $ | — | | | $ | — | |
Shares Outstanding | | | 46,499 | | | | 1,000 | | | | — | | | | — | | | | — | |
Net asset value and redemption price per share | | $ | 22.86 | | | $ | 9.02 | | | $ | — | | | $ | — | | | $ | — | |
| † | No par value; unlimited number of shares authorized. |
| ** | Redemption price may be reduced by contingent deferred sales charge. |
| | | | |
| 156 | | CALAMOS OPEN-END FAMILY OF FUNDS ANNUAL REPORT | | See accompanying Notes to Financial Statements |
Statements of Assets and Liabilities October 31, 2019
| | | | | | | | | | | | | | | | | | | | |
| | | OPPORTUNISTIC
VALUE FUND | | | INTERNATIONAL
GROWTH FUND | | | EVOLVING WORLD GROWTH
FUND | | | GLOBAL EQUITY
FUND | | | GLOBAL GROWTH
AND INCOME
FUND | |
ASSETS | | | | | | | | | | | | | | | | | | | | |
Investments in securities, at cost | | $ | 38,472,271 | | | $ | 174,766,227 | | | $ | 132,570,250 | | | $ | 64,490,606 | | | $ | 130,313,323 | |
Investment in securities, at value | | $ | 45,109,915 | | | $ | 208,870,166 | | | $ | 162,012,124 | | | $ | 81,535,837 | | | $ | 148,873,691 | |
Foreign currency (cost $1,552,411, $623,464 and $2,318,606) | | | — | | | | 1,552,423 | | | | — | | | | 623,468 | | | | 2,318,607 | |
Unrealized appreciation on forward foreign currency contracts | | | — | | | | 1,202 | | | | — | | | | — | | | | — | |
Receivables: | | | | | | | | | | | | | | | | | | | | |
Accrued interest and dividends | | | 45,952 | | | | 586,032 | | | | 389,150 | | | | 86,796 | | | | 418,373 | |
Investments sold | | | 949,339 | | | | 4,173,639 | | | | 2,913,766 | | | | 2,690,207 | | | | 5,616,257 | |
Fund shares sold | | | 210 | | | | 128,129 | | | | 198,240 | | | | 3,797 | | | | 2,993 | |
Due from investment advisor | | | 18,937 | | | | 46,323 | | | | — | | | | 1,242 | | | | — | |
Prepaid expenses | | | 10,559 | | | | 200,650 | | | | 17,984 | | | | 15,624 | | | | 20,591 | |
Other assets | | | 73,211 | | | | 53,664 | | | | 22,318 | | | | 30,919 | | | | 111,924 | |
Total assets | | | 46,208,123 | | | | 215,612,228 | | | | 165,553,582 | | | | 84,987,890 | | | | 157,362,436 | |
LIABILITIES | | | | | | | | | | | | | | | | | | | | |
Due to custodian bank | | | — | | | | 1,471,238 | | | | — | | | | 829,022 | | | | — | |
Collateral for securities loaned | | | 293,100 | | | | 3,983,662 | | | | 1,297,500 | | | | 72,557 | | | | — | |
Options written, at value (premium $618,200, $97,441, and $96,781) | | | — | | | | 117,704 | | | | — | | | | 17,291 | | | | 18,645 | |
Payables: | | | | | | | | | | | | | | | | | | | | |
Investments purchased | | | 749,134 | | | | 4,309,220 | | | | 1,556,737 | | | | 2,430,983 | | | | 5,465,569 | |
Fund shares redeemed | | | 2,110 | | | | 110,824 | | | | 313,627 | | | | 596,996 | | | | 103,572 | |
Affiliates: | | | | | | | | | | | | | | | | | | | | |
Investment advisory fees | | | 37,696 | | | | 157,151 | | | | 149,539 | | | | 62,693 | | | | 128,259 | |
Distribution fees | | | 445 | | | | 1,238 | | | | 1,131 | | | | 731 | | | | 1,949 | |
Deferred compensation to trustees | | | 73,211 | | | | 53,664 | | | | 22,318 | | | | 30,919 | | | | 111,924 | |
Trustees’ fees and officer compensation | | | 3,211 | | | | 4,951 | | | | 4,679 | | | | 3,655 | | | | 4,492 | |
Other accounts payable and accrued liabilities | | | 22,738 | | | | 405,304 | | | | 243,824 | | | | 77,560 | | | | 122,230 | |
Total liabilities | | | 1,181,645 | | | | 10,614,956 | | | | 3,589,355 | | | | 4,122,407 | | | | 5,956,640 | |
NET ASSETS | | $ | 45,026,478 | | | $ | 204,997,272 | | | $ | 161,964,227 | | | $ | 80,865,483 | | | $ | 151,405,796 | |
COMPOSITION OF NET ASSETS | | | | | | | | | | | | | | | | | | | | |
Paid in capital | | $ | 38,017,437 | | | $ | 171,786,252 | | | $ | 149,584,526 | | | $ | 57,817,754 | | | $ | 130,166,751 | |
Undistributed net investment income (loss) | | | 265,315 | | | | 44,680 | | | | 1,421,824 | | | | (75,178 | ) | | | (189,445 | ) |
Accumulated net realized gain (loss) on investments, foreign currency transactions and written options | | | 106,082 | | | | (1,325,141 | ) | | | (18,344,099 | ) | | | 6,029,537 | | | | 2,839,537 | |
Unrealized appreciation (depreciation) of investments, foreign currency translations and written options | | | 6,637,644 | | | | 34,491,481 | * | | | 29,301,976 | * | | | 17,093,370 | * | | | 18,588,953 | * |
NET ASSETS | | $ | 45,026,478 | | | $ | 204,997,272 | | | $ | 161,964,227 | | | $ | 80,865,483 | | | $ | 151,405,796 | |
CLASS A SHARES† | | | | | | | | | | | | | | | | | | | | |
Net assets applicable to shares outstanding | | $ | 11,362,807 | | | $ | 53,949,719 | | | $ | 28,168,277 | | | $ | 20,235,736 | | | $ | 83,069,291 | |
Shares outstanding | | | 799,656 | | | | 3,001,406 | | | | 1,995,161 | | | | 1,739,088 | | | | 9,758,845 | |
Net asset value and redemption price per share | | $ | 14.21 | | | $ | 17.97 | | | $ | 14.12 | | | $ | 11.64 | | | $ | 8.51 | |
Maximum offering price per share (Net asset value, plus 4.75% of offering price) | | $ | 14.92 | | | $ | 18.87 | | | $ | 14.82 | | | $ | 12.22 | | | $ | 8.93 | |
CLASS C SHARES†** | | | | | | | | | | | | | | | | | | | | |
Net assets applicable to shares outstanding | | $ | 5,274,396 | | | $ | 9,021,707 | | | $ | 13,478,168 | | | $ | 8,010,684 | | | $ | 14,742,110 | |
Shares outstanding | | | 426,878 | | | | 567,070 | | | | 1,024,196 | | | | 789,066 | | | | 1,977,745 | |
Net asset value and redemption price per share | | $ | 12.36 | | | $ | 15.91 | | | $ | 13.16 | | | $ | 10.15 | | | $ | 7.45 | |
CLASS I SHARES† | | | | | | | | | | | | | | | | | | | | |
Net assets applicable to shares outstanding | | $ | 28,389,275 | | | $ | 134,562,402 | | | $ | 120,317,782 | | | $ | 52,619,063 | | | $ | 53,594,395 | |
Shares outstanding | | | 1,942,213 | | | | 7,262,636 | | | | 8,438,339 | | | | 4,377,284 | | | | 6,096,388 | |
Net asset value and redemption price per share | | $ | 14.62 | | | $ | 18.53 | | | $ | 14.26 | | | $ | 12.02 | | | $ | 8.79 | |
CLASS R6 SHARES† | | | | | | | | | | | | | | | | | | | | |
Net assets applicable to shares outstanding | | $ | — | | | $ | 7,463,444 | | | $ | — | | | $ | — | | | $ | — | |
Shares Outstanding | | | — | | | | 399,725 | | | | — | | | | — | | | | — | |
Net asset value and redemption price per share | | $ | — | | | $ | 18.67 | | | $ | — | | | $ | — | | | $ | — | |
| * | Net of deferred foreign capital gains tax of $(109,190), $(128,363), $(30,824), and $(45,922). |
| † | No par value; unlimited number of shares authorized. |
| ** | Redemption price may be reduced by contingent deferred sales charge. |
| | | | | | |
| See accompanying Notes to Financial Statements | | www.calamos.com | | | 157 | |
Statements of Assets and Liabilities October 31, 2019
| | | | | | | | | | | | |
| | | TOTAL RETURN
BOND FUND | | | HIGH INCOME
OPPORTUNITIES
FUND | | | SHORT-TERM BOND FUND | |
ASSETS | | | | | | | | | | | | |
Investments in securities, at cost | | $ | 64,245,622 | | | $ | 49,849,788 | | | $ | 223,044,428 | |
Investment in securities, at value | | $ | 66,219,334 | | | $ | 48,103,907 | | | $ | 225,901,189 | |
Cash with custodian (interest bearing) | | | 26,670 | | | | 8,899 | | | | 167,243 | |
Restricted cash for futures (interest bearing) | | | — | | | | — | | | | 41,569 | |
Receivables: | | | | | | | | | | | | |
Accrued interest and dividends | | | 332,671 | | | | 664,350 | | | | 1,446,969 | |
Investments sold | | | — | | | | 212,139 | | | | 20,193 | |
Fund shares sold | | | 35,317 | | | | 15,782 | | | | — | |
Due from investment advisor | | | 10,510 | | | | 3,987 | | | | 11,081 | |
Prepaid expenses | | | 15,935 | | | | 22,176 | | | | 29,422 | |
Other assets | | | 33,378 | | | | 80,712 | | | | — | |
Total assets | | | 66,673,815 | | | | 49,111,952 | | | | 227,617,666 | |
LIABILITIES | | | | | | | | | | | | |
Collateral for securities loaned | | | 4,728,925 | | | | 3,959,174 | | | | 6,579,080 | |
Variation margin on open futures contracts | | | — | | | | — | | | | 5,314 | |
Payables: | | | | | | | | | | | | |
Investments purchased | | | 749,655 | | | | 931,304 | | | | 2,289,072 | |
Fund shares redeemed | | | 28,436 | | | | 49,319 | | | | 7,594 | |
Dividends payable | | | 6,779 | | | | 11,704 | | | | 484,974 | |
Affiliates: | | | | | | | | | | | | |
Investment advisory fees | | | 23,246 | | | | 22,531 | | | | 55,546 | |
Distribution fees | | | 465 | | | | 587 | | | | 8 | |
Deferred compensation to trustees | | | 33,378 | | | | 80,712 | | | | — | |
Trustees’ fees and officer compensation | | | 3,277 | | | | 3,222 | | | | 3,671 | |
Other accounts payable and accrued liabilities | | | 36,113 | | | | 38,831 | | | | 39,380 | |
Total liabilities | | | 5,610,274 | | | | 5,097,384 | | | | 9,464,639 | |
NET ASSETS | | $ | 61,063,541 | | | $ | 44,014,568 | | | $ | 218,153,027 | |
COMPOSITION OF NET ASSETS | | | | | | | | | | | | |
Paid in capital | | $ | 60,046,857 | | | $ | 55,680,095 | | | $ | 214,439,052 | |
Undistributed net investment income (loss) | | | (34,074 | ) | | | (299,584 | ) | | | 404,969 | |
Accumulated net realized gain (loss) on investments | | | (922,954 | ) | | | (9,620,062 | ) | | | 457,608 | |
Unrealized appreciation (depreciation) of investments | | | 1,973,712 | | | | (1,745,881 | ) | | | 2,851,398 | |
NET ASSETS | | $ | 61,063,541 | | | $ | 44,014,568 | | | $ | 218,153,027 | |
CLASS A SHARES† | | | | | | | | | | | | |
Net assets applicable to shares outstanding | | $ | 22,564,524 | | | $ | 35,124,261 | | | $ | 601,195 | |
Shares outstanding | | | 2,141,945 | | | | 4,213,871 | | | | 58,962 | |
Net asset value and redemption price per share | | $ | 10.53 | | | $ | 8.34 | | | $ | 10.20 | |
Maximum offering price per share (Net asset value, plus 4.75% of offering price) | | $ | 10.77 | # | | $ | 8.53 | # | | $ | 10.43 | # |
CLASS C SHARES†** | | | | | | | | | | | | |
Net assets applicable to shares outstanding | | $ | 2,929,194 | | | $ | 1,886,909 | | | $ | — | |
Shares outstanding | | | 278,073 | | | | 213,955 | | | | — | |
Net asset value and redemption price per share | | $ | 10.53 | | | $ | 8.82 | | | $ | — | |
CLASS I SHARES† | | | | | | | | | | | | |
Net assets applicable to shares outstanding | | $ | 35,569,823 | | | $ | 7,003,398 | | | $ | 217,551,832 | |
Shares outstanding | | | 3,375,981 | | | | 840,132 | | | | 21,331,333 | |
Net asset value and redemption price per share | | $ | 10.54 | | | $ | 8.34 | | | $ | 10.20 | |
| † | No par value; unlimited number of shares authorized. |
| # | For Total Return Bond Fund, High Income Opportunities Fund, and Short-Term Bond Fund, maximum offering price per share is Net asset value plus 2.25% of offering price. |
| ** | Redemption price may be reduced by contingent deferred sales charge. |
| | | | |
| 158 | | CALAMOS OPEN-END FAMILY OF FUNDS ANNUAL REPORT | | See accompanying Notes to Financial Statements |
Statements of Operations Year Ended October 31, 2019
| | | | | | | | | | | | | | | | | | | | |
| | | MARKET NEUTRAL
INCOME FUND | | | HEDGED EQUITY FUND | | | PHINEUS
LONG/SHORT FUND | | | CONVERTIBLE FUND | | | GLOBAL
CONVERTIBLE FUND | |
INVESTMENT INCOME | | | | | | | | | | | | | | | | | | | | |
Interest | | $ | 104,080,799 | | | $ | — | | | $ | 13,220,603 | | | $ | 21,535,796 | | | $ | 2,083,873 | |
Dividends | | | 104,023,236 | | | | 3,595,740 | | | | 16,787,494 | | | | 5,819,498 | | | | 853,169 | |
Dividends from affiliated funds | | | 2,642,644 | | | | — | | | | 986,590 | | | | — | | | | — | |
Dividend taxes withheld | | | — | | | | — | | | | (282,758 | ) | | | — | | | | (3,950 | ) |
Other income | | | 39,701,260 | | | | — | | | | — | | | | — | | | | — | |
Total investment income | | | 250,447,939 | | | | 3,595,740 | | | | 30,711,929 | | | | 27,355,294 | | | | 2,933,092 | |
| | | | | |
EXPENSES | | | | | | | | | | | | | | | | | | | | |
Investment advisory fees | | | 50,520,367 | | | | 1,295,083 | | | | 11,560,808 | | | | 5,018,471 | | | | 1,116,719 | |
Distribution fees | | | | | | | | | | | | | | | | | | | | |
Class A | | | 1,970,627 | | | | 18,734 | | | | 230,888 | | | | 584,095 | | | | 26,346 | |
Class C | | | 2,823,056 | | | | 16,427 | | | | 459,272 | | | | 857,814 | | | | 36,529 | |
Dividend or interest expense on short positions | | | 13,785,915 | | | | — | | | | 12,211,255 | | | | — | | | | — | |
Transfer agent fees | | | 7,470,879 | | | | 136,343 | | | | 962,553 | | | | 717,746 | | | | 109,438 | |
Printing and mailing fees | | | 723,003 | | | | 10,146 | | | | 126,544 | | | | 64,538 | | | | 14,463 | |
Fund administration fees | | | 654,710 | | | | 14,667 | | | | 83,404 | | | | 58,946 | | | | 11,428 | |
Accounting fees | | | 451,123 | | | | 29,821 | | | | 62,257 | | | | 50,144 | | | | 22,593 | |
Trustees’ fees and officer compensation | | | 415,652 | | | | 24,306 | | | | 69,191 | | | | 49,986 | | | | 21,999 | |
Legal fees | | | 384,710 | | | | 16,717 | | | | 57,421 | | | | 38,712 | | | | 17,623 | |
Audit fees | | | 268,675 | | | | 15,034 | | | | 32,457 | | | | 30,251 | | | | 12,079 | |
Registration fees | | | 245,474 | | | | 47,510 | | | | 119,743 | | | | 72,649 | | | | 45,667 | |
Custodian fees | | | 210,224 | | | | 50,961 | | | | 88,826 | | | | 15,610 | | | | 11,220 | |
Other | | | 719,460 | | | | 22,157 | | | | 28,769 | | | | 66,720 | | | | 26,679 | |
Total expenses | | | 80,643,875 | | | | 1,697,906 | | | | 26,093,388 | | | | 7,625,682 | | | | 1,472,783 | |
Less expense reductions | | | (292,334 | ) | | | — | | | | (105,456 | ) | | | — | | | | — | |
Net expenses | | | 80,351,541 | | | | 1,697,906 | | | | 25,987,932 | | | | 7,625,682 | | | | 1,472,783 | |
NET INVESTMENT INCOME (LOSS) | | | 170,096,398 | | | | 1,897,834 | | | | 4,723,997 | | | | 19,729,612 | | | | 1,460,309 | |
| | | | | |
REALIZED AND UNREALIZED GAIN (LOSS) | | | | | | | | | | | | | | | | | | | | |
Net realized gain (loss) from: | | | | | | | | | | | | | | | | | | | | |
Investments, excluding purchased options | | | 83,973,886 | | | | 1,457,246 | | | | (17,308,892 | ) | | | (5,744,810 | ) | | | (629,611 | ) |
Purchased options | | | (124,912,021 | ) | | | (4,433,714 | ) | | | (43,714,521 | ) | | | 412,402 | | | | 588,881 | |
Foreign currency transactions | | | (205,381 | ) | | | — | | | | (7,766 | ) | | | — | | | | (31,897 | ) |
Forward foreign currency contracts | | | 6,519,700 | | | | — | | | | — | | | | 207,237 | | | | — | |
Written options | | | 90,388,020 | | | | (209,366 | ) | | | 26,494,053 | | | | (215,952 | ) | | | 40,659 | |
Short positions | | | (21,684,326 | ) | | | (14,031 | ) | | | 27,123,035 | | | | — | | | | — | |
Total return swaps | | | 16,742,912 | | | | — | | | | — | | | | — | | | | — | |
Realized capital gain distribution from Affiliated fund | | | — | | | | — | | | | 211 | | | | — | | | | — | |
Change in net unrealized appreciation/(depreciation) on: | | | | | | | | | | | | | | | | | | | | |
Investments, excluding purchased options | | | 645,278,214 | | | | 22,519,560 | | | | 103,283,331 | | | | 48,362,156 | | | | 8,232,409 | |
Affiliated funds | | | 2,367,617 | | | | — | | | | 809,930 | | | | — | | | | — | |
Purchased options | | | (2,480,398 | ) | | | (986,691 | ) | | | (14,624,172 | ) | | | (27,845 | ) | | | (105,440 | ) |
Foreign currency translations | | | 4,823,362 | | | | — | | | | 1,254 | | | | — | | | | 14,674 | |
Forward foreign currency contracts | | | (3,641,646 | ) | | | — | | | | — | | | | (76,457 | ) | | | — | |
Written options | | | (299,085,231 | ) | | | (7,319,309 | ) | | | 3,199,557 | | | | 405,734 | | | | — | |
Short positions | | | (223,322,513 | ) | | | — | | | | (95,723,993 | ) | | | — | | | | — | |
Total return swaps | | | 104,638 | | | | — | | | | — | | | | — | | | | — | |
NET GAIN (LOSS) | | | 174,866,833 | | | | 11,013,695 | | | | (10,467,973 | ) | | | 43,322,465 | | | | 8,109,675 | |
NET INCREASE (DECREASE) IN NET ASSETS RESULTING FROM OPERATIONS | | $ | 344,963,231 | | | $ | 12,911,529 | | | $ | (5,743,976 | ) | | $ | 63,052,077 | | | $ | 9,569,984 | |
| | | | | | |
| See accompanying Notes to Financial Statements | | www.calamos.com | | | 159 | |
Statements of Operations Year Ended October 31, 2019
| | | | | | | | | | | | | | | | | | | | | | | | |
| | | TIMPANI SMALL CAP GROWTH FUND May 31, 2019(a)
through
October 31, 2019 | | | TIMPANI SMALL
CAP GROWTH
FUND
July 1, 2018
through
May 31, 2019 | | | TIMPANI SMID
GROWTH FUND(b) | | | GROWTH FUND | | | GROWTH AND
INCOME FUND | | | DIVIDEND
GROWTH FUND | |
INVESTMENT INCOME | | | | | | | | | | | | | | | | | | | | | | | | |
Interest | | $ | 130 | | | $ | 27,464 | | | $ | — | | | $ | 990 | | | $ | 6,088,103 | | | $ | 804 | |
Dividends | | | 40,839 | | | | 101,672 | | | | 6,148 | | | | 17,261,361 | | | | 35,740,654 | | | | 386,470 | |
Dividends from affiliated funds | | | — | | | | — | | | | — | | | | 155,663 | | | | — | | | | — | |
Dividend taxes withheld | | | — | | | | (1,615 | ) | | | — | | | | (1,279 | ) | | | — | | | | — | |
Other income | | | 7,877 | | | | — | | | | — | | | | 218,071 | | | | — | | | | — | |
Total investment income | | | 48,846 | | | | 127,521 | | | | 6,148 | | | | 17,634,806 | | | | 41,828,757 | | | | 387,274 | |
| | | | | | |
EXPENSES | | | | | | | | | | | | | | | | | | | | | | | | |
Investment advisory fees | | | 304,424 | | | | 689,488 | | | | 23,036 | | | | 12,874,387 | | | | 13,552,355 | | | | 192,802 | |
Distribution fees | | | | | | | | | | | | | | | | | | | | | | | | |
Class A | | | 6,867 | | | | 20,649 | (c) | | | 6 | | | | 2,487,018 | | | | 2,533,796 | | | | 7,298 | |
Class C | | | — | | | | — | | | | — | | | | 1,489,265 | | | | 2,690,798 | | | | 9,235 | |
Transfer agent fees | | | 20,482 | | | | 32,376 | | | | 955 | | | | 1,804,495 | | | | 2,022,434 | | | | 14,414 | |
Fund administration fees | | | 3,036 | | | | 14,106 | | | | 356 | | | | 124,819 | | | | 172,256 | | | | 1,694 | |
Printing and mailing fees | | | 2,302 | | | | 19,527 | | | | 2,189 | | | | 180,023 | | | | 191,066 | | | | 2,973 | |
Accounting fees | | | 7,043 | | | | 24,537 | | | | 3,525 | | | | 88,108 | | | | 117,810 | | | | 15,677 | |
Trustees’ fees and officer compensation | | | 10,706 | | | | 28,903 | | | | 3,609 | | | | 99,993 | | | | 113,235 | | | | 15,895 | |
Legal fees | | | — | | | | 31,599 | | | | 2,668 | | | | 47,922 | | | | 95,426 | | | | 12,519 | |
Audit fees | | | — | | | | 14,456 | | | | 6,349 | | | | 49,882 | | | | 67,546 | | | | 8,617 | |
Custodian fees | | | 2,841 | | | | 17,356 | | | | 1,380 | | | | 37,636 | | | | 31,983 | | | | 3,952 | |
Registration fees | | | 29,635 | | | | 36,880 | | | | — | | | | 70,037 | | | | 95,349 | | | | 45,948 | |
Offering costs | | | — | | | | — | | | | 31,558 | | | | — | | | | — | | | | — | |
Other | | | 3,706 | | | | 8,967 | | | | 1,150 | | | | 159,610 | | | | 186,812 | | | | 8,408 | |
Total expenses | | | 391,042 | | | | 938,844 | | | | 76,781 | | | | 19,513,195 | | | | 21,870,866 | | | | 339,432 | |
Less expense reductions | | | (21,294 | ) | | | (159,552 | ) | | | (50,102 | ) | | | (16,726 | ) | | | — | | | | (110,815 | ) |
Net expenses | | | 369,748 | | | | 779,292 | | | | 26,679 | | | | 19,496,469 | | | | 21,870,866 | | | | 228,617 | |
NET INVESTMENT INCOME (LOSS) | | | (320,902 | ) | | | (651,771 | ) | | | (20,531 | ) | | | (1,861,663 | ) | | | 19,957,891 | | | | 158,657 | |
| | | | | | |
REALIZED AND UNREALIZED GAIN (LOSS) | | | | | | | | | | | | | | | | | | | | | | | | |
Net realized gain (loss) from: | | | | | | | | | | | | | | | | | | | | | | | | |
Investments | | | 2,606,534 | | | | 2,119,354 | | | | (891,753 | ) | | | 157,883,534 | | | | 70,618,767 | | | | 2,559,388 | |
Purchased options | | | — | | | | — | | | | — | | | | (18,489,227 | ) | | | (15,097,313 | ) | | | — | |
Foreign currency transactions | | | — | | | | — | | | | — | | | | 1,073 | | | | (7,693 | ) | | | — | |
Forward foreign currency contracts | | | — | | | | — | | | | — | | | | — | | | | 182,863 | | | | — | |
Written options | | | — | | | | — | | | | — | | | | 4,980,033 | | | | 395,986 | | | | — | |
Short positions | | | — | | | | — | | | | — | | | | 11,949,202 | | | | — | | | | — | |
Realized capital gain distribution from Affiliated fund | | | — | | | | — | | | | — | | | | 33 | | | | — | | | | — | |
Change in net unrealized appreciation/(depreciation) on: | | | | | | | | | | | | | | | | | | | | | | | | |
Investments | | | (3,290,127 | ) | | | (4,315,675 | ) | | | (101,453 | ) | | | 29,869,608 | | | | 138,600,500 | | | | (545,355 | ) |
Affiliated funds | | | — | | | | — | | | | — | | | | 122,056 | | | | — | | | | — | |
Purchased options | | | — | | | | — | | | | — | | | | (482,099 | ) | | | (1,114,368 | ) | | | — | |
Foreign currency translations | | | — | | | | — | | | | — | | | | (417 | ) | | | — | | | | — | |
Forward foreign currency contracts | | | — | | | | — | | | | — | | | | — | | | | (69,180 | ) | | | — | |
Written options | | | — | | | | — | | | | — | | | | (32,034 | ) | | | 46,669 | | | | — | |
NET GAIN (LOSS) | | | (683,593 | ) | | | (2,196,321 | ) | | | (993,206 | ) | | | 185,801,762 | | | | 193,556,231 | | | | 2,014,033 | |
NET INCREASE (DECREASE) IN NET ASSETS RESULTING FROM OPERATIONS | | $ | (1,004,495 | ) | | $ | (2,848,092 | ) | | $ | (1,013,737 | ) | | $ | 183,940,099 | | | $ | 213,514,122 | | | $ | 2,172,690 | |
| (a) | Prior to May 31, 2019, figures are shown for the predecessor fund. |
| (b) | Timpani SMID Growth Fund commenced operations on July 31, 2019. |
| (c) | Prior to May 31, 2019, Class A distribution fees represent predecessor fund Class Y shares. |
| | | | |
| 160 | | CALAMOS OPEN-END FAMILY OF FUNDS ANNUAL REPORT | | See accompanying Notes to Financial Statements |
Statements of Operations Year Ended October 31, 2019
| | | | | | | | | | | | | | | | | | | | |
| | | OPPORTUNISTIC
VALUE FUND | | | INTERNATIONAL
GROWTH FUND | | | EVOLVING WORLD
GROWTH FUND | | | GLOBAL
EQUITY FUND | | | GLOBAL
GROWTH AND
INCOME FUND | |
INVESTMENT INCOME | | | | | | | | | | | | | | | | | | | | |
Interest | | $ | 2,149 | | | $ | 90,346 | | | $ | 534,109 | | | $ | 33,602 | | | $ | 2,260,967 | |
Dividends | | | 941,413 | | | | 3,565,363 | | | | 3,892,571 | | | | 1,182,148 | | | | 2,266,376 | |
Securities lending income | | | — | | | | — | | | | — | | | | — | | | | 7,844 | |
Dividend taxes withheld | | | (644 | ) | | | (287,885 | ) | | | (233,283 | ) | | | (67,020 | ) | | | (91,391 | ) |
Total investment income | | | 942,918 | | | | 3,367,824 | | | | 4,193,397 | | | | 1,148,730 | | | | 4,443,796 | |
| | | | | |
EXPENSES | | | | | | | | | | | | | | | | | | | | |
Investment advisory fees | | | 454,337 | | | | 1,993,457 | | | | 2,010,919 | | | | 850,011 | | | | 1,634,494 | |
Distribution fees | | | | | | | | | | | | | | | | | | | | |
Class A | | | 27,911 | | | | 136,363 | | | | 78,152 | | | | 62,984 | | | | 190,368 | |
Class C | | | 56,751 | | | | 131,925 | | | | 157,969 | | | | 95,945 | | | | 302,668 | |
Transfer agent fees | | | 39,054 | | | | 237,531 | | | | 213,081 | | | | 96,561 | | | | 203,936 | |
Fund administration fees | | | 3,967 | | | | 18,477 | | | | 16,223 | | | | 7,863 | | | | 14,405 | |
Printing and mailing fees | | | 7,002 | | | | 27,647 | | | | 25,261 | | | | 10,737 | | | | 9,235 | |
Accounting fees | | | 18,884 | | | | 27,780 | | | | 23,415 | | | | 17,713 | | | | 22,652 | |
Trustees’ fees and officer compensation | | | 17,223 | | | | 25,666 | | | | 23,226 | | | | 23,711 | | | | 23,288 | |
Legal fees | | | 13,665 | | | | 76,574 | | | | 24,224 | | | | 15,257 | | | | 22,091 | |
Audit fees | | | 9,444 | | | | 15,824 | | | | 13,091 | | | | 10,545 | | | | 12,537 | |
Custodian fees | | | 3,721 | | | | 51,636 | | | | 101,339 | | | | 13,890 | | | | 20,461 | |
Registration fees | | | 42,458 | | | | 77,242 | | | | 54,275 | | | | 48,721 | | | | 53,115 | |
Other | | | 9,136 | | | | 36,135 | | | | 41,737 | | | | 24,157 | | | | 32,467 | |
Total expenses | | | 703,553 | | | | 2,856,257 | | | | 2,782,912 | | | | 1,278,095 | | | | 2,541,717 | |
Less expense reductions | | | (209,608 | ) | | | (804,880 | ) | | | — | | | | (102,614 | ) | | | — | |
Net expenses | | | 493,945 | | | | 2,051,377 | | | | 2,782,912 | | | | 1,175,481 | | | | 2,541,717 | |
NET INVESTMENT INCOME (LOSS) | | | 448,973 | | | | 1,316,447 | | | | 1,410,485 | | | | (26,751 | ) | | | 1,902,079 | |
| | | | | |
REALIZED AND UNREALIZED GAIN (LOSS) | | | | | | | | | | | | | | | | | | | | |
Net realized gain (loss) from: | | | | | | | | | | | | | | | | | | | | |
Investments, excluding purchased options | | | 306,901 | | | | (557,027 | ) | | | 1,840,777 | (a) | | | 8,194,968 | (a) | | | 4,699,751 | |
Purchased options | | | 218,952 | | | | 247,412 | | | | 1,042,019 | | | | (148,130 | ) | | | (2,520,492 | ) |
Foreign currency transactions | | | — | | | | (62,597 | ) | | | (192,070 | ) | | | (15,590 | ) | | | (13,499 | ) |
Forward foreign currency contracts | | | — | | | | (1,159,476 | ) | | | — | | | | (1,390 | ) | | | — | |
Written options | | | (64,679 | ) | | | (129,865 | ) | | | (152,867 | ) | | | (28,286 | ) | | | 103,509 | |
Change in net unrealized appreciation/(depreciation) on: | | | | | | | | | | | | | | | | | | | | |
Investments, excluding purchased options | | | 3,384,826 | | | | 26,176,663 | (b) | | | 20,252,991 | (b) | | | 912,166 | (b) | | | 5,917,531 | (b) |
Purchased options | | | (220,004 | ) | | | (1,443,265 | ) | | | (1,539,908 | ) | | | (226,012 | ) | | | (95,835 | ) |
Foreign currency translations | | | — | | | | 10,946 | | | | 6,463 | | | | (1,317 | ) | | | 4,751 | |
Forward foreign currency contracts | | | — | | | | 393,738 | | | | — | | | | — | | | | — | |
Written options | | | 103,451 | | | | 500,496 | | | | — | | | | 80,150 | | | | 78,136 | |
NET GAIN (LOSS) | | | 3,729,447 | | | | 23,977,025 | | | | 21,257,405 | | | | 8,766,559 | | | | 8,173,852 | |
NET INCREASE (DECREASE) IN NET ASSETS RESULTING FROM OPERATIONS | | $ | 4,178,420 | | | $ | 25,293,472 | | | $ | 22,667,890 | | | $ | 8,739,808 | | | $ | 10,075,931 | |
| (a) | Net of foreign capital gains tax of $(5) and $1,270. |
| (b) | Net of change of $(109,190), $(128,363), $(30,824) and $(45,922), respectively in deferred capital gains tax. |
| | | | | | |
| See accompanying Notes to Financial Statements | | www.calamos.com | | | 161 | |
Statements of Operations Year Ended October 31, 2019
| | | | | | | | | | | | |
| | | TOTAL RETURN
BOND FUND | | | HIGH INCOME
OPPORTUNITIES FUND | | | SHORT-TERM
BOND FUND | |
INVESTMENT INCOME | | | | | | | | | | | | |
Interest | | $ | 1,864,306 | | | $ | 2,947,652 | | | $ | 4,886,056 | |
Dividends | | | 18,868 | | | | 132,955 | | | | 96,709 | |
Total investment income | | | 1,883,174 | | | | 3,080,607 | | | | 4,982,765 | |
| | | |
EXPENSES | | | | | | | | | | | | |
Investment advisory fees | | | 236,799 | | | | 274,635 | | | | 476,920 | |
Distribution fees | | | | | | | | | | | | |
Class A | | | 50,392 | | | | 84,510 | | | | 738 | |
Class C | | | 43,619 | | | | 48,833 | | | | — | |
Transfer agent fees | | | 49,565 | | | | 58,517 | | | | 27,040 | |
Fund administration fees | | | 4,466 | | | | 3,998 | | | | 13,626 | |
Printing and mailing fees | | | 10,534 | | | | — | | | | 12,529 | |
Accounting fees | | | 20,482 | | | | 25,827 | | | | 24,953 | |
Trustees’ fees and officer compensation | | | 21,887 | | | | 17,211 | | | | 25,009 | |
Legal fees | | | 14,969 | | | | 13,618 | | | | 12,906 | |
Audit fees | | | 9,689 | | | | 9,438 | | | | 15,836 | |
Custodian fees | | | 2,688 | | | | 3,871 | | | | 7,961 | |
Registration fees | | | 50,923 | | | | 21,583 | | | | 9,073 | |
Offering costs | | | — | | | | — | | | | 95,176 | |
Other | | | 19,501 | | | | 23,860 | | | | 28,828 | |
Total expenses | | | 535,514 | | | | 585,901 | | | | 750,595 | |
Less expense reductions | | | (99,462 | ) | | | (108,907 | ) | | | (113,630 | ) |
Net expenses | | | 436,052 | | | | 476,994 | | | | 636,965 | |
NET INVESTMENT INCOME (LOSS) | | | 1,447,122 | | | | 2,603,613 | | | | 4,345,800 | |
| | | |
REALIZED AND UNREALIZED GAIN (LOSS) | | | | | | | | | | | | |
Net realized gain (loss) from: | | | | | | | | | | | | |
Investments | | | (52,743 | ) | | | (791,826 | ) | | | 887,418 | |
Change in net unrealized appreciation/(depreciation) on: | | | | | | | | | | | | |
Investments | | | 3,779,147 | | | | 644,222 | | | | 2,893,805 | |
Futures contracts | | | — | | | | — | | | | (5,363 | ) |
NET GAIN (LOSS) | | | 3,726,404 | | | | (147,604 | ) | | | 3,775,860 | |
NET INCREASE (DECREASE) IN NET ASSETS RESULTING FROM OPERATIONS | | $ | 5,173,526 | | | $ | 2,456,009 | | | $ | 8,121,660 | |
| | | | |
| 162 | | CALAMOS OPEN-END FAMILY OF FUNDS ANNUAL REPORT | | See accompanying Notes to Financial Statements |
Statements of Changes in Net Assets
| | | | | | | | | | | | | | | | | | | | | | | | |
| | | MARKET NEUTRAL INCOME FUND | | | HEDGED EQUITY FUND | | | PHINEUS LONG/SHORT FUND | |
| | | YEAR ENDED
OCTOBER 31,
2019 | | | YEAR ENDED
OCTOBER 31,
2018 | | | YEAR ENDED
OCTOBER 31,
2019 | | | YEAR ENDED
OCTOBER 31,
2018 | | | YEAR ENDED
OCTOBER 31,
2019 | | | YEAR ENDED
OCTOBER 31,
2018 | |
OPERATIONS | | | | | | | | | | | | | | | | | | | | | | | | |
Net investment income (loss) | | $ | 170,096,398 | | | $ | 133,560,542 | | | $ | 1,897,834 | | | $ | 395,193 | | | $ | 4,723,997 | | | $ | (368,973 | ) |
Net realized gain (loss) | | | 50,822,790 | | | | (84,087,826 | ) | | | (3,199,865 | ) | | | (348,206 | ) | | | (7,413,880 | ) | | | 33,591,055 | |
Change in unrealized appreciation/(depreciation) | | | 124,044,043 | | | | 150,563,215 | | | | 14,213,560 | | | | (334,618 | ) | | | (3,054,093 | ) | | | (64,915,641 | ) |
Net increase (decrease) in net assets resulting from operations | | | 344,963,231 | | | | 200,035,931 | | | | 12,911,529 | | | | (287,631 | ) | | | (5,743,976 | ) | | | (31,693,559 | ) |
| | | | | | |
DISTRIBUTIONS TO SHAREHOLDERS | | | | | | | | | | | | | | | | | | | | | | | | |
Class A | | | (34,356,827 | ) | | | (19,790,489 | ) | | | (150,877 | ) | | | (98,050 | ) | | | (3,642,160 | ) | | | (963,926 | ) |
Class C | | | (11,097,627 | ) | | | (6,104,800 | ) | | | (18,780 | ) | | | (87 | ) | | | (1,859,837 | ) | | | (403,405 | ) |
Class I | | | (295,713,301 | ) | | | (132,167,069 | ) | | | (3,729,094 | ) | | | (196,116 | ) | | | (32,415,010 | ) | | | (4,970,781 | ) |
Class R | | | — | | | | (126,158 | )(a) | | | — | | | | — | | | | — | | | | — | |
Class R6 | | | — | | | | — | | | | — | | | | — | | | | — | | | | — | |
Total distributions | | | (341,167,755 | ) | | | (158,188,516 | ) | | | (3,898,751 | ) | | | (294,253 | ) | | | (37,917,007 | ) | | | (6,338,112 | ) |
| | | | | | |
Return of capital | | | | | | | | | | | | | | | | | | | | | | | | |
Class A | | | — | | | | — | | | | — | | | | — | | | | — | | | | — | |
Class C | | | — | | | | — | | | | — | | | | — | | | | — | | | | — | |
Class I | | | — | | | | — | | | | — | | | | — | | | | — | | | | — | |
Class R | | | — | | | | — | | | | — | | | | — | | | | — | | | | — | |
Total return of capital | | | — | | | | — | | | | — | | | | — | | | | — | | | | — | |
| | | | | | |
CAPITAL SHARE TRANSACTIONS | | | 2,005,517,149 | | | | 1,958,907,302 | | | | 130,427,738 | | | | 84,875,022 | | | | (327,777,704 | ) | | | 757,759,541 | |
TOTAL INCREASE (DECREASE) IN NET ASSETS | | | 2,009,312,625 | | | | 2,000,754,717 | | | | 139,440,516 | | | | 84,293,138 | | | | (371,438,687 | ) | | | 719,727,870 | |
| | | | | | |
NET ASSETS | | | | | | | | | | | | | | | | | | | | | | | | |
Beginning of year | | $ | 6,705,841,204 | | | $ | 4,705,086,487 | | | $ | 97,356,511 | | | $ | 13,063,373 | | | $ | 1,164,355,984 | | | $ | 444,628,114 | |
End of year | | $ | 8,715,153,829 | | | $ | 6,705,841,204 | | | $ | 236,797,027 | | | $ | 97,356,511 | | | $ | 792,917,297 | | | $ | 1,164,355,984 | |
| (a) | Class R shares were converted into Class A shares at the close of business on February 22, 2018. |
| | | | | | |
| See accompanying Notes to Financial Statements | | www.calamos.com | | | 163 | |
Statements of Changes in Net Assets
| | | | | | | | | | | | | | | | | | | | | | | | | | | | |
| | | CONVERTIBLE FUND | | | GLOBAL CONVERTIBLE FUND | | | TIMPANI SMALL CAP GROWTH FUND(a) | |
| | | YEAR ENDED OCTOBER 31, 2019 | | | YEAR ENDED
OCTOBER 31, 2018 | | | YEAR ENDED
OCTOBER 31, 2019 | | | YEAR ENDED
OCTOBER 31, 2018 | | | PERIOD ENDED
OCTOBER 31, 2019 | | | FOR THE
ELEVEN MONTHS
ENDED
MAY 31,
2019 | | | YEAR ENDED
JUNE 30, 2018 | |
OPERATIONS | | | | | | | | | | | | | | | | | | | | | | | | | | | | |
Net investment income (loss) | | $ | 19,729,612 | | | $ | 15,251,028 | | | $ | 1,460,309 | | | $ | 4,049,578 | | | $ | (320,902 | ) | | $ | (651,771 | ) | | $ | (556,536 | ) |
Net realized gain (loss) | | | (5,341,123 | ) | | | 63,802,671 | | | | (31,968 | ) | | | 4,557,628 | | | | 2,606,534 | | | | 2,119,354 | | | | 6,591,334 | |
Change in unrealized appreciation/(depreciation) | | | 48,663,588 | | | | (61,042,739 | ) | | | 8,141,643 | | | | (9,247,330 | ) | | | (3,290,127 | ) | | | (4,315,675 | ) | | | 11,921,485 | |
Net increase (decrease) in net assets resulting from operations | | | 63,052,077 | | | | 18,010,960 | | | | 9,569,984 | | | | (640,124 | ) | | | (1,004,495 | ) | | | (2,848,092 | ) | | | 17,956,283 | |
| | | | | | | |
DISTRIBUTIONS TO SHAREHOLDERS | | | | | | | | | | | | | | | | | | | | | | | | | | | | |
Class A | | | (24,667,990 | ) | | | (9,096,274 | ) | | | (528,376 | ) | | | (486,775 | ) | | | — | | | | (313,214 | )(b) | | | — | |
Class C | | | (14,196,158 | ) | | | (5,028,361 | ) | | | (168,024 | ) | | | (95,051 | ) | | | — | | | | — | | | | — | |
Class I | | | (38,620,881 | ) | | | (11,800,923 | ) | | | (6,172,780 | ) | | | (3,913,214 | ) | | | — | | | | (3,947,336 | )(b) | | | — | |
Class R | | | — | | | | (52,590 | )(c) | | | — | | | | (245 | )(c) | | | — | | | | — | | | | — | |
Class R6 | | | — | | | | — | | | | — | | | | — | | | | — | | | | — | | | | — | |
Total distributions | | | (77,485,029 | ) | | | (25,978,148 | ) | | | (6,869,180 | ) | | | (4,495,285 | ) | | | — | | | | (4,260,550 | ) | | | — | |
| | | | | | | |
Return of capital | | | | | | | | | | | | | | | | | | | | | | | | | | | | |
Class A | | | — | | | | — | | | | — | | | | — | | | | — | | | | — | | | | — | |
Class C | | | — | | | | — | | | | — | | | | — | | | | — | | | | — | | | | — | |
Class I | | | — | | | | — | | | | — | | | | — | | | | — | | | | — | | | | — | |
Class R | | | — | | | | — | | | | — | | | | — | | | | — | | | | — | | | | — | |
Total return of capital | | | — | | | | — | | | | — | | | | — | | | | — | | | | — | | | | — | |
| | | | | | | |
CAPITAL SHARE TRANSACTIONS | | | 143,816,325 | | | | 19,548,691 | | | | (6,005,413 | ) | | | 34,679,408 | | | | 7,080,673 | | | | 6,226,365 | | | | 9,491,716 | |
TOTAL INCREASE (DECREASE) IN NET ASSETS | | | 129,383,373 | | | | 11,581,503 | | | | (3,304,609 | ) | | | 29,543,999 | | | | 6,076,178 | | | | (1,001,804 | ) | | | 27,447,999 | |
| | | | | | | |
NET ASSETS | | | | | | | | | | | | | | | | | | | | | | | | | | | | |
Beginning of year | | $ | 615,541,169 | | | $ | 603,959,666 | | | $ | 136,237,997 | | | $ | 106,693,998 | | | | 74,382,646 | * | | $ | 75,234,923 | | | $ | 47,786,924 | |
End of year | | $ | 744,924,542 | | | $ | 615,541,169 | | | $ | 132,933,388 | | | $ | 136,237,997 | | | $ | 80,458,824 | | | $ | 74,352,646 | | | $ | 75,234,923 | |
| (a) | Prior to May 31, 2019, the figures shown are for the predecessor fund. |
| (b) | Prior to May 31, 2019, figures shown for Class A represent the precessor fund’s class Y, and figures shown for Class I represent precessor fund’s Service class and Institutional class. The Class I distributions include $15,669 from the Service class. |
| (c) | Class R shares were converted into Class A shares at the close of business on February 22, 2018. |
| * | Beginning net assets for period ended October 31, 2019, include $30,000 in capital share transactions made to the Calamos Timpani Small Cap Growth Fund prior to the completion of the conversion. |
| | | | |
| 164 | | CALAMOS OPEN-END FAMILY OF FUNDS ANNUAL REPORT | | See accompanying Notes to Financial Statements |
Statements of Changes in Net Assets
| | | | | | | | | | | | | | | | | | | | |
| | | TIMPANI SMID
GROWTH FUND | | | GROWTH FUND | | | GROWTH AND INCOME FUND | |
| | | PERIOD ENDED
OCTOBER 31,
2019(b) | | | YEAR ENDED OCTOBER 31, 2019 | | | YEAR ENDED
OCTOBER 31, 2018 | | | YEAR ENDED
OCTOBER 31, 2019 | | | YEAR ENDED
OCTOBER 31, 2018 | |
OPERATIONS | | | | | | | | | | | | | | | | | | | | |
Net investment income (loss) | | $ | (20,531 | ) | | $ | (1,861,663 | ) | | $ | (5,683,541 | ) | | $ | 19,957,891 | | | $ | 13,113,736 | |
Net realized gain (loss) | | | (891,753 | ) | | | 156,324,648 | | | | 246,806,178 | | | | 56,092,610 | | | | 125,919,453 | |
Change in unrealized appreciation/(depreciation) | | | (101,453 | ) | | | 29,477,114 | | | | (134,210,439 | ) | | | 137,463,621 | | | | (35,656,274 | ) |
Net increase (decrease) in net assets resulting from operations | | | (1,013,737 | ) | | | 183,940,099 | | | | 106,912,198 | | | | 213,514,122 | | | | 103,376,915 | |
| | | | | |
DISTRIBUTIONS TO SHAREHOLDERS | | | | | | | | | | | | | | | | | | | | |
Class A | | | — | | | | (110,345,634 | ) | | | (118,711,102 | ) | | | (63,407,471 | ) | | | (61,831,918 | ) |
Class C | | | — | | | | (66,517,149 | ) | | | (70,806,265 | ) | | | (31,205,466 | ) | | | (34,200,058 | ) |
Class I | | | — | | | | (27,706,322 | ) | | | (28,576,842 | ) | | | (52,024,069 | ) | | | (41,414,931 | ) |
Class R | | | — | | | | — | | | | (690,251 | )(a) | | | — | | | | (687,487 | )(a) |
Class R6 | | | — | | | | — | | | | — | | | | — | | | | — | |
Total distributions | | | — | | | | (204,569,105 | ) | | | (218,784,460 | ) | | | (146,637,006 | ) | | | (138,134,394 | ) |
| | | | | |
Return of capital | | | | | | | | | | | | | | | | | | | | |
Class A | | | — | | | | — | | | | — | | | | — | | | | — | |
Class C | | | — | | | | — | | | | — | | | | — | | | | — | |
Class I | | | — | | | | — | | | | — | | | | — | | | | — | |
Class R | | | — | | | | — | | | | — | | | | — | | | | — | |
Total return of capital | | | — | | | | — | | | | — | | | | — | | | | — | |
| | | | | |
CAPITAL SHARE TRANSACTIONS | | | 10,380,000 | | | | (45,231,198 | ) | | | (97,019,944 | ) | | | (44,462,882 | ) | | | (46,306,586 | ) |
TOTAL INCREASE (DECREASE) IN NET ASSETS | | | 9,366,263 | | | | (65,860,204 | ) | | | (208,892,206 | ) | | | 22,414,234 | | | | (81,064,065 | ) |
| | | | | |
NET ASSETS | | | | | | | | | | | | | | | | | | | | |
Beginning of year | | $ | — | | | $ | 1,463,535,075 | | | $ | 1,672,427,281 | | | $ | 1,978,448,735 | | | $ | 2,059,512,800 | |
End of year | | $ | 9,366,263 | | | $ | 1,397,674,871 | | | $ | 1,463,535,075 | | | $ | 2,000,862,969 | | | $ | 1,978,448,735 | |
| (a) | Class R shares were converted into Class A shares at the close of business on February 22, 2018. |
| (b) | Timpani SMID Growth Fund commenced operations on July 31, 2019. |
| | | | | | |
| See accompanying Notes to Financial Statements | | www.calamos.com | | | 165 | |
Statements of Changes in Net Assets
| | | | | | | | | | | | | | | | | | | | | | | | |
| | | DIVIDEND GROWTH FUND | | | OPPORTUNISTIC VALUE FUND | | | INTERNATIONAL GROWTH FUND | |
| | | YEAR ENDED
OCTOBER 31,
2019 | | | YEAR ENDED
OCTOBER 31,
2018 | | | YEAR ENDED
OCTOBER 31,
2019 | | | YEAR ENDED
OCTOBER 31,
2018 | | | YEAR ENDED
OCTOBER 31,
2019 | | | YEAR ENDED
OCTOBER 31,
2018(b) | |
OPERATIONS | | | | | | | | | | | | | | | | | | | | | | | | |
Net investment income (loss) | | $ | 158,657 | | | $ | 192,868 | | | $ | 448,973 | | | $ | 359,439 | | | $ | 1,316,447 | | | $ | 2,204,265 | |
Net realized gain (loss) | | | 2,559,388 | | | | 1,005,910 | | | | 461,174 | | | | 7,267,910 | | | | (1,661,553 | ) | | | 26,684,732 | |
Change in unrealized appreciation/(depreciation) | | | (545,355 | ) | | | 197,081 | | | | 3,268,273 | | | | (5,172,491 | ) | | | 25,638,578 | | | | (63,063,179 | ) |
Net increase (decrease) in net assets resulting from operations | | | 2,172,690 | | | | 1,395,859 | | | | 4,178,420 | | | | 2,454,858 | | | | 25,293,472 | | | | (34,174,182 | ) |
| | | | | | |
DISTRIBUTIONS TO SHAREHOLDERS | | | | | | | | | | | | | | | | | | | | | | | | |
Class A | | | (103,054 | ) | | | (163,449 | ) | | | (1,446,325 | ) | | | (737,994 | ) | | | (6,172,737 | ) | | | (4,300,922 | ) |
Class C | | | (38,283 | ) | | | (79,037 | ) | | | (1,259,904 | ) | | | (155,577 | ) | | | (2,405,608 | ) | | | (1,129,875 | ) |
Class I | | | (892,276 | ) | | | (1,856,416 | ) | | | (4,646,839 | ) | | | (917,598 | ) | | | (15,226,176 | ) | | | (6,458,775 | ) |
Class R | | | — | | | | — | | | | — | | | | (5,402 | )(a) | | | — | | | | (267,543 | )(a) |
Class R6 | | | — | | | | — | | | | — | | | | — | | | | (2,420 | ) | | | — | (b) |
Total distributions | | | (1,033,613 | ) | | | (2,098,902 | ) | | | (7,353,068 | ) | | | (1,816,571 | ) | | | (23,806,941 | ) | | | (12,157,115 | ) |
| | | | | | |
Return of capital | | | | | | | | | | | | | | | | | | | | | | | | |
Class A | | | — | | | | — | | | | — | | | | — | | | | — | | | | — | |
Class C | | | — | | | | — | | | | — | | | | — | | | | — | | | | — | |
Class I | | | — | | | | — | | | | — | | | | — | | | | — | | | | — | |
Class R | | | — | | | | — | | | | — | | | | — | | | | — | | | | — | |
Total return of capital | | | — | | | | — | | | | — | | | | — | | | | — | | | | — | |
| | | | | | |
CAPITAL SHARE TRANSACTIONS | | | (7,816,392 | ) | | | (607,473 | ) | | | 642,283 | | | | (5,531,659 | ) | | | (29,839,329 | ) | | | (2,477,933 | ) |
TOTAL INCREASE (DECREASE) IN NET ASSETS | | | (6,677,315 | ) | | | (1,310,516 | ) | | | (2,532,365 | ) | | | (4,893,372 | ) | | | (28,352,798 | ) | | | (48,809,230 | ) |
| | | | | | |
NET ASSETS | | | | | | | | | | | | | | | | | | | | | | | | |
Beginning of year | | $ | 23,960,036 | | | $ | 25,270,552 | | | $ | 47,558,843 | | | $ | 52,452,215 | | | $ | 233,350,070 | | | $ | 282,159,300 | |
End of year | | $ | 17,282,721 | | | $ | 23,960,036 | | | $ | 45,026,478 | | | $ | 47,558,843 | | | $ | 204,997,272 | | | $ | 233,350,070 | |
| (a) | Class R shares were converted into Class A shares at the close of business on February 22, 2018. |
| (b) | International Growth Fund Class R6 commenced operations on September 17, 2018. |
| | | | |
| 166 | | CALAMOS OPEN-END FAMILY OF FUNDS ANNUAL REPORT | | See accompanying Notes to Financial Statements |
Statements of Changes in Net Assets
| | | | | | | | | | | | | | | | | | | | | | | | |
| | | EVOLVING WORLD GROWTH FUND | | | GLOBAL EQUITY FUND | | | GLOBAL GROWTH AND INCOME FUND | |
| | | YEAR ENDED
OCTOBER 31, 2019 | | | YEAR ENDED
OCTOBER 31, 2018 | | | YEAR ENDED
OCTOBER 31, 2019 | | | YEAR ENDED
OCTOBER 31, 2018 | | | YEAR ENDED
OCTOBER 31, 2019 | | | YEAR ENDED
OCTOBER 31, 2018 | |
OPERATIONS | | | | | | | | | | | | | | | | | | | | | | | | |
Net investment income (loss) | | $ | 1,410,485 | | | $ | 29,128 | | | $ | (26,751 | ) | | $ | 22,110 | | | $ | 1,902,079 | | | $ | 1,739,689 | |
Net realized gain (loss) | | | 2,537,859 | | | | 33,416,762 | | | | 8,001,572 | | | | 22,866,735 | | | | 2,269,269 | | | | 18,995,830 | |
Change in unrealized appreciation/(depreciation) | | | 18,719,546 | | | | (69,667,885 | ) | | | 764,987 | | | | (24,904,595 | ) | | | 5,904,583 | | | | (25,939,489 | ) |
Net increase (decrease) in net assets resulting from operations | | | 22,667,890 | | | | (36,221,995 | ) | | | 8,739,808 | | | | (2,015,750 | ) | | | 10,075,931 | | | | (5,203,970 | ) |
| | | | | | |
DISTRIBUTIONS TO SHAREHOLDERS | | | | | | | | | | | | | | | | | | | | | | | | |
Class A | | | — | | | | (8,575 | ) | | | (5,307,306 | ) | | | (2,369,038 | ) | | | (6,498,883 | ) | | | (4,633,084 | ) |
Class C | | | — | | | | — | | | | (2,645,190 | ) | | | (1,306,602 | ) | | | (5,796,232 | ) | | | (4,392,776 | ) |
Class I | | | — | | | | (954,899 | ) | | | (10,702,340 | ) | | | (7,611,885 | ) | | | (6,363,175 | ) | | | (4,640,349 | ) |
Class R | | | — | | | | — | (a) | | | — | | | | (472,463 | )(a) | | | — | | | | (74,198 | )(a) |
Class R6 | | | — | | | | — | | | | — | | | | — | | | | — | | | | — | |
Total distributions | | | — | | | | (963,474 | ) | | | (18,654,836 | ) | | | (11,759,988 | ) | | | (18,658,290 | ) | | | (13,740,407 | ) |
| | | | | | |
Return of capital | | | | | | | | | | | | | | | | | | | | | | | | |
Class A | | | — | | | | (1 | ) | | | — | | | | — | | | | — | | | | — | |
Class C | | | — | | | | — | | | | — | | | | — | | | | — | | | | — | |
Class I | | | — | | | | (109 | ) | | | — | | | | — | | | | — | | | | — | |
Class R | | | — | | | | — | | | | — | | | | — | | | | — | | | | — | |
Total return of capital | | | — | | | | (110 | ) | | | — | | | | — | | | | — | | | | — | |
| | | | | | |
CAPITAL SHARE TRANSACTIONS | | | (65,234,868 | ) | | | (79,460,414 | ) | | | (5,673,079 | ) | | | (22,045,459 | ) | | | (30,348,373 | ) | | | (13,750,518 | ) |
TOTAL INCREASE (DECREASE) IN NET ASSETS | | | (42,566,978 | ) | | | (116,645,993 | ) | | | (15,588,107 | ) | | | (35,821,197 | ) | | | (38,930,732 | ) | | | (32,694,895 | ) |
| | | | | | |
NET ASSETS | | | | | | | | | | | | | | | | | | | | | | | | |
Beginning of year | | $ | 204,531,205 | | | $ | 321,177,198 | | | $ | 96,453,590 | | | $ | 132,274,787 | | | $ | 190,336,528 | | | $ | 223,031,423 | |
End of year | | $ | 161,964,227 | | | $ | 204,531,205 | | | $ | 80,865,483 | | | $ | 96,453,590 | | | $ | 151,405,796 | | | $ | 190,336,528 | |
| (a) | Class R shares were converted into Class A shares at the close of business on February 22, 2018. |
| | | | | | |
| See accompanying Notes to Financial Statements | | www.calamos.com | | | 167 | |
Statements of Changes in Net Assets
| | | | | | | | | | | | | | | | | | | | | | | | |
| | | TOTAL RETURN BOND FUND | | | HIGH INCOME OPPORTUNITIES FUND | | | SHORT-TERM BOND FUND | |
| | | YEAR ENDED
OCTOBER 31, 2019 | | | YEAR ENDED
OCTOBER 31, 2018 | | | YEAR ENDED
OCTOBER 31, 2019 | | | YEAR ENDED
OCTOBER 31, 2018 | | | YEAR ENDED
OCTOBER 31, 2019 | | | PERIOD ENDED
OCTOBER 31,
2018(b) | |
OPERATIONS | | | | | | | | | | | | | | | | | | | | | | | | |
Net investment income (loss) | | $ | 1,447,122 | | | $ | 1,640,128 | | | $ | 2,603,613 | | | $ | 2,881,984 | | | $ | 4,345,800 | | | $ | 54,729 | |
Net realized gain (loss) | | | (52,743 | ) | | | (587,926 | ) | | | (791,826 | ) | | | (547,859 | ) | | | 887,418 | | | | 356 | |
Change in unrealized appreciation/(depreciation) | | | 3,779,147 | | | | (2,567,811 | ) | | | 644,222 | | | | (2,172,841 | ) | | | 2,888,442 | | | | (37,044 | ) |
Net increase (decrease) in net assets resulting from operations | | | 5,173,526 | | | | (1,515,609 | ) | | | 2,456,009 | | | | 161,284 | | | | 8,121,660 | | | | 18,041 | |
| | | | | | |
DISTRIBUTIONS TO SHAREHOLDERS | | | | | | | | | | | | | | | | | | | | | | | | |
Class A | | | (537,649 | ) | | | (628,147 | ) | | | (2,025,174 | ) | | | (2,078,697 | ) | | | (7,328 | ) | | | (81 | ) |
Class C | | | (85,932 | ) | | | (192,264 | ) | | | (244,119 | ) | | | (565,261 | ) | | | — | | | | — | |
Class I | | | (819,442 | ) | | | (1,298,630 | ) | | | (442,113 | ) | | | (537,734 | ) | | | (4,362,670 | ) | | | (54,089 | ) |
Class R | | | — | | | | (5,977 | )(a) | | | — | | | | (1,704 | )(a) | | | — | | | | — | |
Class R6 | | | — | | | | — | | | | — | | | | — | | | | — | | | | — | |
Total distributions | | | (1,443,023 | ) | | | (2,125,018 | ) | | | (2,711,406 | ) | | | (3,183,396 | ) | | | (4,369,998 | ) | | | (54,170 | ) |
| | | | | | |
Return of capital | | | | | | | | | | | | | | | | | | | | | | | | |
Class A | | | — | | | | (52,753 | ) | | | — | | | | — | | | | — | | | | — | |
Class C | | | — | | | | (15,293 | ) | | | — | | | | — | | | | — | | | | — | |
Class I | | | — | | | | (111,460 | ) | | | — | | | | — | | | | — | | | | — | |
Class R | | | — | | | | (414 | ) | | | — | | | | — | | | | — | | | | — | |
Total return of capital | | | — | | | | (179,920 | ) | | | — | | | | — | | | | — | | | | — | |
| | | | | | |
CAPITAL SHARE TRANSACTIONS | | | 923,652 | | | | (11,492,890 | ) | | | (5,490,171 | ) | | | (7,003,095 | ) | | | 199,258,390 | | | | 15,179,104 | |
TOTAL INCREASE (DECREASE) IN NET ASSETS | | | 4,654,155 | | | | (15,313,437 | ) | | | (5,745,568 | ) | | | (10,025,207 | ) | | | 203,010,052 | | | | 15,142,975 | |
| | | | | | |
NET ASSETS | | | | | | | | | | | | | | | | | | | | | | | | |
Beginning of year | | $ | 56,409,386 | | | $ | 71,722,823 | | | $ | 49,760,136 | | | $ | 59,785,343 | | | $ | 15,142,975 | | | $ | — | |
End of year | | $ | 61,063,541 | | | $ | 56,409,386 | | | $ | 44,014,568 | | | $ | 49,760,136 | | | $ | 218,153,027 | | | $ | 15,142,975 | |
| (a) | Class R shares were converted into Class A shares at the close of business on February 22, 2018. |
| (b) | Short-Term Bond Fund commenced operations on September 19, 2018. |
| | | | |
| 168 | | CALAMOS OPEN-END FAMILY OF FUNDS ANNUAL REPORT | | See accompanying Notes to Financial Statements |
Notes to Financial Statements
Note 1 – Organization and Significant Accounting Policies
Organization. CALAMOS INVESTMENT TRUST, a Massachusetts business trust organized December 21, 1987 (the “Trust”), consists of eighteen series,Market Neutral Income Fund, Hedged Equity Fund, Phineus Long/Short Fund, Convertible Fund, Global Convertible Fund, Timpani Small Cap Growth Fund (formerly “Frontier Timpani Small Cap Growth Fund”), Timpani SMID Growth Fund (commenced operations on July 31, 2019), Growth Fund, Growth and Income Fund, Dividend Growth Fund, Opportunistic Value Fund, International Growth Fund, Evolving World Growth Fund, Global Equity Fund, Global Growth and Income Fund, Total Return Bond Fund, High Income Opportunities Fund, and Short-Term Bond Fund, (commenced operations on September 19, 2018),(each a “Fund” and collectively the “Funds”). The Trust is registered under the Investment Company Act of 1940 as amended (the “1940 Act”) as anopen-end management investment company. The Fund is considered an investment company under U.S. GAAP and follows the accounting and reporting guidance applicable to investment companies. The Trust currently offers Class A, Class C (except Timpani Small Cap Growth Fund and Timpani SMID Growth Fund), and Class I shares of each of the Funds (except Short-Term Bond Fund). Class R6 shares are offered in Timpani Small Cap Growth Fund, Timpani SMID Growth Fund, and International Growth Fund only.
Significant Accounting Policies. The financial statements have been prepared in conformity with accounting principles generally accepted in the United States of America (U.S. GAAP), and the Funds’ are each considered an investment company under U.S. GAAP and follow the accounting and reporting guidance applicable to investment companies. The Funds adhere to the accounting and reporting requirements set forth in ASU2013-08 and ASC 946. Under U.S. GAAP, management is required to make certain estimates and assumptions at the date of the financial statements and actual results may differ from those estimates. Subsequent events, if any, through the date that the financial statements were issued, have been evaluated in the preparation of the financial statements. The following summarizes the significant accounting policies of the Fund:
Fund Valuation. The valuation of theFunds’ investments is in accordance with policies and procedures adopted by and under the ultimate supervision of the board of trustees.
Fund securities that are traded on U.S. securities exchanges, except option securities, are valued at the official closing price, which is the last current reported sales price on its principal exchange at the time each Fund determines its net asset value (“NAV”). Securities traded in theover-the-counter market and quoted on The NASDAQ Stock Market are valued at the NASDAQ Official Closing Price, as determined by NASDAQ, or lacking a NASDAQ Official Closing Price, the last current reported sale price on NASDAQ at the time a Fund determines its NAV. When a last sale or closing price is not available, equity securities, other than option securities, that are traded on a U.S. securities exchange and other equity securities traded in theover-the-counter market are valued at the mean between the most recent bid and asked quotations on its principal exchange in accordance with guidelines adopted by the board of trustees. Each option security traded on a U.S. securities exchange is valued at themid-point of the consolidated bid/ask quote for the option security, also in accordance with guidelines adopted by the board of trustees. Eachover-the-counter option that is not traded through the Options Clearing Corporation is valued either by an independent pricing agent approved by the board of trustees or based on a quotation provided by the counterparty to such option under the ultimate supervision of the board of trustees.
Fixed income securities, bank loans, certain convertible preferred securities, andnon-exchange traded derivatives are normally valued by independent pricing services or by dealers or brokers who make markets in such securities. Valuations of such fixed income securities, bank loans, certain convertible preferred securities andnon-exchange traded derivatives consider yield or price of equivalent securities of comparable quality, coupon rate, maturity, type of issue, trading characteristics and other market data and do not rely exclusively upon exchange orover-the-counter prices.
Trading on European and Far Eastern exchanges andover-the-counter markets is typically completed at various times before the close of business on each day on which the New York Stock Exchange (“NYSE”) is open. Each security trading on these exchanges or inover-the-counter markets may be valued utilizing a systematic fair valuation model provided by an independent pricing service approved by the board of trustees. The valuation of each security that meets certain criteria in relation to the valuation model is systematically adjusted to reflect the impact of movement in the U.S. market after the foreign markets close. Securities that do not meet the criteria, or that are principally traded in other foreign markets, are valued as of the last reported sale price at the time the respective Fund determines its NAV, or when reliable market prices or quotations are not readily available, at the mean between the most recent bid and asked quotations as of the close of the appropriate exchange or other designated time. Trading of foreign securities may not take place on every NYSE business day. In addition, trading may take place in various foreign markets on Saturdays or on other days when the NYSE is not open and on which the respective Fund’s NAV is not calculated.
Notes to Financial Statements
If the pricing committee determines that the valuation of a security in accordance with the methods described above is not reflective of a fair value for such security, the security is valued at a fair value by the pricing committee, under the ultimate supervision of the board of trustees, following the guidelines and/or procedures adopted by the board of trustees.
Each Fund also may use fair value pricing, pursuant to guidelines adopted by the board of trustees and under the ultimate supervision of the board of trustees, if trading in the security is halted or if the value of a security it holds is materially affected by events occurring before the Fund’s pricing time but after the close of the primary market or exchange on which the security is listed. Those procedures may utilize valuations furnished by pricing services approved by the board of trustees, which may be based on market transactions for comparable securities and various relationships between securities that are generally recognized by institutional traders, a computerized matrix system, or appraisals derived from information concerning the securities or similar securities received from recognized dealers in those securities.
When fair value pricing of securities is employed, the prices of securities used by the Fund to calculate its NAV may differ from market quotations or official closing prices. There can be no assurance that the Fund could purchase or sell a portfolio security at the price used to calculate the Fund’s net asset value (“NAV”).
Investment Transactions. Investment transactions are recorded on a trade date basis as of October 31, 2019. Net realized gains and losses from investment transactions are reported on an identified cost basis. Interest income is recognized using the accrual method and includes accretion of original issue and market discount and amortization of premium. Dividend income is recognized on theex-dividend date, except that certain dividends from foreign securities are recorded as soon as the information becomes available after theex-dividend date.
Foreign Currency Translation. Values of investments and other assets and liabilities denominated in foreign currencies are translated into U.S. dollars using a rate quoted by a major bank or dealer in the particular currency market, as reported by a recognized quotation dissemination service.
The Funds do not isolate that portion of the results of operations resulting from changes in foreign exchange rates on investments from the fluctuations arising from changes in market prices of securities held. Such fluctuations are included with the net realized and unrealized gain or loss from investments.
Reported net realized foreign currency gains or losses arise from disposition of foreign currency, the difference in the foreign exchange rates between the trade and settlement dates on securities transactions, and the difference between the amounts of dividends, interest and foreign withholding taxes recorded on theex-date or accrual date and the U.S. dollar equivalent of the amounts actually received or paid. Net unrealized foreign exchange gains and losses arise from changes (due to the changes in the exchange rate) in the value of foreign currency and other assets and liabilities denominated in foreign currencies held at period end.
Allocation of Expenses Among Funds and Classes. Expenses directly attributable to a Fund are charged to that Fund; certain other common expenses of the Trust, Calamos Advisors Trust, Calamos Convertible Opportunities and Income Fund, Calamos Convertible and High Income Fund, Calamos Strategic Total Return Fund, Calamos Global Total Return Fund,Calamos Global Dynamic Income Fund and Calamos Dynamic Convertible and Income Fundare allocated proportionately among each Fund to which the expenses relate in relation to the net assets of each Fund or on another reasonable basis. Expenses directly attributable to a particular class of a fund in the Trust are charged directly to such class. In calculating the net asset value per share of each class, investment income, realized and unrealized gains and losses and expenses other than class specific expenses are allocated daily to each class of shares based upon the proportion of net assets of each class at the beginning of each day plus current day fund share activity.
Income Taxes. No provision has been made for U.S. income taxes because the Trust’s policy is to continue to qualify as a regulated investment company under the Internal Revenue Code of 1986, as amended, and distribute to shareholders substantially all of theFunds’ taxable income and net realized gains.
Dividends and distributions paid to shareholders are recorded on theex-dividend date. The amount of dividends and distributions from net investment income and net realized capital gains is determined in accordance with federal income tax regulations, which may differ from U.S. generally accepted accounting principles. To the extent these “book/tax” differences are permanent in nature, such amounts are reclassified within the capital accounts based on their federaltax-basis treatment. These differences are primarily due to differing treatments for foreign currency transactions, contingent payment debt instruments and methods of amortizing and accreting for fixed income securities. The financial statements are not adjusted for temporary differences.
| | | | |
| 170 | | CALAMOS OPEN-END FAMILY OF FUNDS ANNUAL REPORT | | |
Notes to Financial Statements
The Fund recognized no liability for uncertain tax positions. A reconciliation is not provided as the beginning and ending amounts of unrecognized benefits are zero, with no interim additions, reductions or settlements. Tax years 2015 – 2018 remain subject to examination by the U.S. and the State of Illinois tax jurisdictions for those Funds that have been in existence during that time, and for all years since inception for those Funds created subsequent to October 31, 2013.
Indemnifications. Under the Trust’s organizational documents, the Trust is obligated to indemnify its officers and trustees against certain liabilities incurred by them by reason of having been an officer or trustee of the Trust. In addition, in the normal course of business, the Trust may enter into contracts that provide general indemnifications to other parties. Each Fund’s maximum exposure under these arrangements is unknown as this would involve future claims that may be made against the Fund that have not yet occurred. Currently, the Funds’ management expects the risk of material loss in connection to a potential claim to be remote.
Note 2 – Investment Adviser and Transactions With Affiliates Or Certain Other Parties
Pursuant to an investment advisory agreement with Calamos Advisors LLC (“Calamos Advisors”), each Fund pays a monthly investment advisory fee based on the average daily net assets of the Fund, as shown below:
| | | | | | | | | | | | | | | | |
| AVERAGE DAILY NET ASSETS | | GROWTH FUND
ANNUAL RATE | | | EVOLVING WORLD
GROWTH FUND
ANNUAL RATE | | | TOTAL RETURN
BOND FUND
ANNUAL RATE | | | OPPORTUNISTIC VALUE FUND,
DIVIDEND GROWTH FUND,
INTERNATIONAL GROWTH FUND*,
GLOBAL EQUITY FUND*, GLOBAL GROWTH AND INCOME FUND
ANNUAL RATE | |
| First $500 million | | | 1.00% | | | | 1.10% | | | | 0.45% | | | | 1.00% | |
| | | | |
| | | | |
| Next $500 million | | | 0.90% | | | | 1.05% | | | | 0.43% | | | | 0.95% | |
| | | | |
| | | | |
| Next $5 billion | | | 0.80% | | | | 1.00% | | | | 0.41% | | | | 0.90% | |
| | | | |
| | | | |
| Over $6 billion | | | 0.70% | | | | 0.90% | | | | 0.35% | | | | 0.80% | |
| | | | |
| * | International Growth Fund and Global Equity Fund are subject to a possible adjustment based on performance as described below. |
| | | | | | | | | | | | | | | | | | | | |
| AVERAGE DAILY NET ASSETS | | GLOBAL CONVERTIBLE FUND ANNUAL RATE | | | TIMPANI SMALL
CAP GROWTH
FUND
ANNUAL RATE | | | TIMPANI SMID
GROWTH
FUND
ANNUAL RATE | | | SHORT-TERM
BOND FUND
ANNUAL RATE | | | GROWTH AND INCOME FUND,
CONVERTIBLE FUND,
MARKET NEUTRAL INCOME FUND,
HEDGED EQUITY FUND
ANNUAL RATE | |
| First $500 million | | | 0.85% | | | | 0.90% | | | | 0.95% | | | | 0.30% | | | | 0.75% | |
| | | | |
| | | | | |
| Next $500 million | | | 0.80% | | | | 0.80% | | | | 0.85% | | | | 0.27% | | | | 0.70% | |
| | | | |
| | | | | |
| Over $1 billion | | | 0.75% | | | | 0.75% | | | | 0.80% | | | | 0.25% | | | | 0.65% | |
| | | | |
| | | | | | | | |
| AVERAGE DAILY NET ASSETS | | HIGH INCOME OPPORTUNITIES
FUND
ANNUAL RATE | | | PHINEUS LONG/SHORT FUND
ANNUAL RATE | |
| First $500 million | | | 0.60% | | | | 1.25% | |
| | | | |
| | |
| Next $500 million | | | 0.55% | | | | 1.20% | |
| | | | |
| | |
| Over $1 billion | | | 0.50% | | | | 1.15% | |
| | | | |
The average investment advisory fee as of the period ended October 31, 2019 was as follows:
| | | | |
| FUND | | PERCENTAGE | |
| Market Neutral Income Fund | | | 0.66 | % |
| |
| Hedged Equity Fund | | | 0.75 | |
| |
| Phineus Long/Short Fund | | | 1.23 | |
| |
| Convertible Fund | | | 0.74 | |
| |
| Global Convertible Fund | | | 0.85 | |
| |
| Timpani Small Cap Growth Fund | | | 0.90 | * |
| |
| Timpani SMID Growth Fund | | | 0.95 | * |
Notes to Financial Statements
| | | | |
| FUND | | PERCENTAGE | |
| Growth Fund | | | 0.91 | % |
| |
| Growth and Income Fund | | | 0.69 | |
| |
| Dividend Growth Fund | | | 1.00 | |
| |
| Opportunistic Value Fund | | | 1.00 | |
| |
| International Growth Fund | | | 0.95 | |
| |
| Evolving World Growth Fund | | | 1.10 | |
| |
| Global Equity Fund | | | 0.96 | |
| |
| Global Growth and Income Fund | | | 1.00 | |
| |
| Total Return Bond Fund | | | 0.45 | |
| |
| High Income Opportunities Fund | | | 0.60 | |
| |
| Short-Term Bond Fund | | | 0.30 | |
Each of theInternational Growth andGlobal Equity Funds pays a fee based on average daily net assets of the Fund that is accrued daily and paid on a monthly basis, subject to possible adjustment based on the Fund’s investment performance (since March 2006 forInternational Growth Fund and since February 2008 forGlobal Equity Fund). The performance adjustment increases or decreases the management fee, on a monthly basis, by 1/12 of 0.03% of a Fund’s average daily net assets over the performance period for each full 1% increment amount by which a Fund outperforms or underperforms the benchmark index (“Index”), on an annualized basis, over the performance measurement period. The benchmark indexes are the MSCI EAFE Growth Index and the MSCI World Index for theInternational Growth Fund andGlobal Equity Fund, respectively.
The base fee is shown in the table above. The performance adjustment rate is calculated by comparing over the performance measurement period the Fund’s Class A share performance to that of the respective Index. The performance measurement period commenced at the beginning of each Fund’s first full month of operation (April 2005 and March 2007 for theInternational Growth Fund andGlobal Equity Fund, respectively). The first performance adjustment was applied to the advisory fee at the end of the twelfth month. Each month subsequent to the twelfth month, a new month is added to the performance measurement period until the performance measurement period includes 36 months. Thereafter, the performance measurement period consists of the most recent month plus the previous 35 months.
The performance comparison is made at the end of each month. The maximum annualized performance adjustment rate is +/- 0.30% of the Fund’s average daily net assets over the performance measurement period. The performance adjustment rate is divided by twelve and multiplied by the Fund’s average daily net assets over the performance measurement period, and the resulting dollar amount is then added to or subtracted from the base fee. Calamos Advisors may receive a positive performance adjustment even if the Fund has a negative return over a performance measurement period if it otherwise outperforms the Index during that period.
Each Fund may invest in shares of theTimpani Small Cap Growth Fund (“SCG”),Timpani SMID Growth Fund (“SMID”), andShort Term Bond Fund(“STBF”). Calamos Advisors has contractually agreed to waive a portion of its advisory fee charged to the Fund equal to the advisory fee paid by SCG, SMID, or STBF attributable to the Fund’s investment in SCG, SMID, or STBF as applicable, based on daily net assets. For the period ended October 31, 2019, the total advisory fees waived pursuant to such agreement were $16,726, $292,334, and $105,456 for theGrowth Fund, Market Neutral Income Fund, Phineus Long/Short Fund,respectively, and are included in the Statements of Operations under the caption “Expense reductions”.
As of October 31, 2019, theGrowth Fund, Market Neutral Income Fund,and Phineus Long/Short Fundhad holdings of $5.7 million, $152.4 million, and $36.1 million respectively inSTBF. During the period from November 1, 2018 through October 31, 2019, theGrowth Fund, Market Neutral Income Fund,and Phineus Long/Short Fundhad net subscriptions of $5.5 million, $150.0 million, and $35.3 million and earned $155.7 thousand, $2,642.6 thousand, and $986.6 thousand in dividends respectively. As of November 1, 2018, no affiliate Fund had a balance in SCG or SMID.
The Funds have an agreement with Ernst & Young LLP (“EY”) to provide certain tax services to the Funds. The tax services include the following: calculating, tracking and reporting tax adjustments on all assets of each Fund, including but not limited to contingent debt and preferred trust obligations; preparing excise tax and fiscal year distribution schedules; preparing tax information required for financial statement footnotes; preparing state and federal income tax returns; preparing specialized calculations of amortization on convertible securities; preparing year-end dividend disclosure information; providing treaty-based foreign withholding tax reclaim services; providing certain global compliance and reporting services; providing a match service and analysis of the “passive foreign
| | | | |
| 172 | | CALAMOS OPEN-END FAMILY OF FUNDS ANNUAL REPORT | | |
Notes to Financial Statements
investment company status of foreign corporate entities; and providing services related to corporate actions that may or may not have a tax impact on the Funds’ holdings. The Funds have an agreement with State Street pursuant to which State Street provides certain administration treasury services to the Funds. These services include: monitoring the calculation of expense accrual amounts for each Fund and making any necessary modifications; managing the Fund’s expenses and expense payment processing; coordinating any expense reimbursement calculations and payment; calculating net investment income dividends and capital gain distributions; coordinating the audits for each Fund; preparing financial reporting statements for each Fund; preparing certain regulatory filings; and calculating asset coverage tests for certain Calamos Funds.
The Funds reimburses Calamos Advisors for a portion of compensation paid to the Trust’s Chief Compliance Officer. This compensation is reported as part of the “Trustees’ fees and officer compensation” expense on the Statements of Operations.
Calamos Advisors has contractually agreed to limit the annual ordinary operating expenses of each Fund as a percentage of the average daily net assets as follows:
| | | | | | | | | | | | | | | | |
| Fund | | CLASS A
SHARES | | | CLASS C
SHARES | | | CLASS I
SHARES | | | CLASS R6
SHARES | |
| Market Neutral Income Fund | | | 1.75% | | | | 2.50% | | | | 1.50% | | | | — | |
| | | | |
| Hedged Equity Fund | | | 1.25% | | | | 2.00% | | | | 1.00% | | | | — | |
| | | | |
| Phineus Long/Short Fund | | | 2.00% | | | | 2.75% | | | | 1.75% | | | | — | |
| | | | |
| Convertible Fund | | | 1.75% | | | | 2.50% | | | | 1.50% | | | | — | |
| | | | |
| Global Convertible Fund | | | 1.35% | | | | 2.10% | | | | 1.10% | | | | — | |
| | | | |
| Timpani Small Cap Growth Fund | | | 1.30% | | | | — | | | | 1.05% | | |
| 1.05% less
the annual
sub-transfer
agency
ratio |
* |
| | | | |
| Timpani SMID Growth Fund | | | 1.35% | | | | — | | | | 1.10% | | |
| 1.09% less
the annual
sub-transfer
agency
ratio |
* |
| | | | |
| Growth Fund | | | 1.75% | | | | 2.50% | | | | 1.50% | | | | — | |
| | | | |
| Growth and Income Fund | | | 1.75% | | | | 2.50% | | | | 1.50% | | | | — | |
| | | | |
| Dividend Growth Fund | | | 1.35% | | | | 2.10% | | | | 1.10% | | | | — | |
| | | | |
| Opportunistic Value Fund | | | 1.15% | | | | 1.90% | | | | 0.90% | | | | — | |
| | | | |
| International Growth Fund | | | 1.10% | | | | 1.85% | | | | 0.85% | | |
| 0.85% less
the annual
sub-transfer
agency
ratio |
* |
| | | | |
| Evolving World Growth Fund | | | 1.75% | | | | 2.50% | | | | 1.50% | | | | — | |
| | | | |
| Global Equity Fund | | | 1.40% | | | | 2.15% | | | | 1.15% | | | | — | |
| | | | |
| Global Growth and Income Fund | | | 1.75% | | | | 2.50% | | | | 1.50% | | | | — | |
| | | | |
| Total Return Bond Fund | | | 0.90% | | | | 1.65% | | | | 0.65% | | | | — | |
| | | | |
| High Income Opportunities Fund | | | 1.00% | | | | 1.75% | | | | 0.75% | | | | — | |
| | | | |
| Short-Term Bond Fund | | | 0.65% | | | | — | | | | 0.40% | | | | — | |
| * | The annualsub-transfer agency ratio is equal to the aggregatesub-transfer agency expenses common to the other share classes of the Fund divided by the aggregated average annual net assets of the Fund’s other share classes. |
These agreements are binding on Calamos Advisors through March 1, 2022.
For the year ended October 31, 2019, Calamos Advisors waived or absorbed the following expenses:
| | | | |
| FUND | | AMOUNT | |
| Market Neutral Income Fund | | $ | 292,334 | |
| |
| Phineus Long/Short Fund | | | 105,456 | |
| |
| Timpani Small Cap Growth Fund | | | 21,294 | |
| |
| Timpani SMID Growth Fund | | | 50,102 | |
| |
| Growth Fund | | | 16,726 | |
| |
| Dividend Growth Fund | | | 110,815 | |
Notes to Financial Statements
| | | | |
| FUND | | AMOUNT | |
| Opportunistic Value Fund | | $ | 209,608 | |
| |
| International Growth Fund | | | 804,880 | |
| |
| Global Equity Fund | | | 102,614 | |
| |
| Total Return Bond Fund | | | 99,462 | |
| |
| High Income Opportunities Fund | | | 108,907 | |
| |
| Short-Term Bond Fund | | | 113,630 | |
These amounts are included in the Statements of Operations under the caption “Expense reductions”.
As Distributor, Calamos Financial Services LLC (“CFS”) assumed all expenses of personnel, office space, office facilities and equipment incidental to such service. Each Fund has adopted a Distribution Plan pursuant to Rule12b-1 under the 1940 Act whereby the Fund pays to CFS a distribution and/or service fee at the annual rate of 0.25% of the average daily net assets of the Fund’s Class A shares; a service fee at the annual rate of 0.25% and a distribution fee at the rate of 0.75% of the average daily net assets of the Fund’s Class B and Class C shares; a service fee at the annual rate of 0.25% and a distribution fee of 0.25% of the average daily net assets of the Fund’s Class R shares. No such fees are paid on each Fund’s Class I or Class R6 shares.
CFS also receives a sales commission and/or an underwriting fee on certain sales of each Fund’s Class A shares. During the period ended October 31, 2019, CFS received commissions and underwriting fees as follows:
| | | | |
| FUND | | AMOUNT | |
| Market Neutral Income Fund | | $ | 41,975 | |
| |
| Hedged Equity Fund | | | 7,822 | |
| |
| Phineus Long/Short Fund | | | 28,880 | |
| |
| Convertible Fund | | | 14,540 | |
| |
| Global Convertible Fund | | | 311 | |
| |
| Timpani Small Cap Growth Fund | | | 3,886 | |
| |
| Growth Fund | | | 35,395 | |
| |
| Growth and Income Fund | | | 89,746 | |
| |
| Dividend Growth Fund | | | 1,221 | |
| |
| Opportunistic Value Fund | | | 1,206 | |
| |
| International Growth Fund | | | 1,375 | |
| |
| Evolving World Growth Fund | | | 1,345 | |
| |
| Global Equity Fund | | | 879 | |
| |
| Global Growth and Income Fund | | | 4,614 | |
| |
| Total Return Bond Fund | | | 350 | |
| |
| High Income Opportunities Fund | | | 365 | |
| |
| Short-Term Bond Fund | | | 38 | |
A trustee and certain officers of the Trust are also officers and directors of CFS and Calamos Advisors. Such trustee and officers serve without direct compensation from the Trust. The Trust’s Statement of Additional Information contains additional information about the Trust’s Trustees and Officers and is available without charge, upon request, at www.calamos.com or by calling 800.582.6959.
As of October 31, 2019, certain affiliates of Calamos Advisors hold material investments in the Funds as follows:
| | | | |
| FUND | | PERCENTAGE | |
| Timpani SMID Growth Fund | | | 97 | % |
| |
| Opportunistic Value Fund | | | 46 | |
| |
| High Income Opportunities Fund | | | 28 | |
As of October 31, 2019, theGrowth Fund, Market Neutral Income Fund,and Phineus Long/Short Fundheld 2.6%, 69.8%, and 16.5% of the outstanding shares respectively of Short Term Bond Fund.
The Trust has adopted a deferred compensation plan (the “Plan”). Under the Plan, a trustee who is not an “interested person” (as defined in the 1940 Act) and has elected to participate in the Plan (a “participating trustee”) may defer receipt of all or a portion of his compensation from the Trust. The deferred compensation payable to the participating trustee is credited to the trustee’s deferral account as of the business day such compensation would have been paid to the participating trustee. The value of amounts deferred for a
| | | | |
| 174 | | CALAMOS OPEN-END FAMILY OF FUNDS ANNUAL REPORT | | |
Notes to Financial Statements
participating trustee is determined by reference to the change in value of Class I shares of one or more funds of the Trust designated by the participant. The value of the account increases with contributions to the account or with increases in the value of the measuring shares, and the value of the account decreases with withdrawals from the account or with declines in the value of the measuring shares.
At October 31, 2019, the Funds had deferred compensation balances, which are included in “Other assets” on the Statements of Assets and Liabilities, as follows:
| | | | |
| FUND | | AMOUNT | |
| Market Neutral Income Fund | | $ | 147,978 | |
| |
| Hedged Equity Fund | | | 5,126 | |
| |
| Phineus Long/Short Fund | | | 6,821 | |
| |
| Convertible Fund | | | 143,875 | |
| |
| Global Convertible Fund | | | 5,164 | |
| |
| Growth Fund | | | 660,571 | |
| |
| Growth and Income Fund | | | 292,533 | |
| |
| Dividend Growth Fund | | | 6,829 | |
| |
| Opportunistic Value Fund | | | 73,211 | |
| |
| International Growth Fund | | | 53,664 | |
| |
| Evolving World Growth Fund | | | 22,318 | |
| |
| Global Equity Fund | | | 30,919 | |
| |
| Global Growth and Income Fund | | | 111,924 | |
| |
| Total Return Bond Fund | | | 33,378 | |
| |
| High Income Opportunities Fund | | | 80,712 | |
Each Fund’s obligation to make payments under the Plan is a general obligation of the Fund and is included in “Payable for deferred compensation to trustees” on the Statements of Assets and Liabilities at October 31, 2019.
Note 3 – Investments
The cost of purchases and proceeds from sales of long-term investments for the year ended October 31, 2019 were as follows:
| | | | | | | | | | | | | | | | |
| | | COST OF PURCHASES | | | PROCEEDS FROM SALES | |
| FUND | | U.S. GOV’T
SECURITIES | | | OTHER | | | U.S. GOV’T
SECURITIES | | | OTHER | |
| Market Neutral Income Fund | | $ | 49,831,055 | | | $ | 8,184,880,897 | | | $ | — | | | $ | 7,392,862,564 | |
| | | | |
| Hedged Equity Fund | | | — | | | | 285,778,966 | | | | — | | | | 145,666,767 | |
| | | | |
| Phineus Long/Short Fund | | | — | | | | 2,101,823,709 | | | | — | | | | 2,668,089,803 | |
| | | | |
| Convertible Fund | | | — | | | | 342,713,274 | | | | 5,846,250 | | | | 230,069,047 | |
| | | | |
| Global Convertible Fund | | | 4,070,828 | | | | 52,807,517 | | | | 5,435,446 | | | | 50,105,998 | |
| | | | |
| Timpani Small Cap Growth Fund | | | — | | | | 110,645,450 | | | | — | | | | 105,543,219 | |
| | | | |
| Timpani SMID Growth Fund | | | — | | | | 15,120,467 | | | | — | | | | 5,029,133 | |
| | | | |
| Growth Fund | | | — | | | | 940,238,507 | | | | — | | | | 1,250,286,098 | |
| | | | |
| Growth and Income Fund | | | — | | | | 349,317,285 | | | | — | | | | 506,678,427 | |
| | | | |
| Dividend Growth Fund | | | — | | | | 2,951,633 | | | | — | | | | 11,996,097 | |
| | | | |
| Opportunistic Value Fund | | | — | | | | 35,034,054 | | | | — | | | | 41,060,304 | |
| | | | |
| International Growth Fund | | | — | | | | 165,550,420 | | | | — | | | | 207,943,262 | |
| | | | |
| Evolving World Growth Fund | | | — | | | | 138,714,428 | | | | — | | | | 181,901,270 | |
| | | | |
| Global Equity Fund | | | — | | | | 62,306,165 | | | | — | | | | 82,495,632 | |
| | | | |
| Global Growth and Income Fund | | | — | | | | 108,374,644 | | | | 6,251,184 | | | | 126,119,194 | |
| | | | |
| Total Return Bond Fund | | | 21,674,499 | | | | 11,456,643 | | | | 8,025,405 | | | | 26,178,178 | |
| | | | |
| High Income Opportunities Fund | | | — | | | | 19,740,390 | | | | — | | | | 27,068,570 | |
| | | | |
| Short-Term Bond Fund | | | 180,345,104 | | | | 221,712,152 | | | | 165,978,619 | | | | 30,781,400 | |
Notes to Financial Statements
The following information is presented on a federal income tax basis as of October 31, 2019. Differences between the cost basis under U.S. generally accepted accounting principles and federal income tax purposes are primarily due to temporary differences.
The cost basis of investments for federal income tax purposes at October 31, 2019 was as follows:
| | | | | | | | | | | | | | | | |
| FUND | | COST BASIS OF
INVESTMENTS | | | GROSS UNREALIZED
APPRECIATION | | | GROSS UNREALIZED
DEPRECIATION | | | NET UNREALIZED
APPRECIATION
(DEPRECIATION) | |
| Market Neutral Income Fund | | $ | 5,437,481,507 | | | $ | 1,630,802,804 | | | $ | (1,057,889,668 | ) | | $ | 572,913,136 | |
| | | | |
| Hedged Equity Fund | | | 215,827,564 | | | | 32,258,517 | | | | (11,432,970 | ) | | | 20,825,547 | |
| | | | |
| Phineus Long/Short Fund | | | 177,292,597 | | | | 64,823,289 | | | | (138,835,012 | ) | | | (74,011,723 | ) |
| | | | |
| Convertible Fund | | | 711,897,065 | | | | 83,850,234 | | | | (10,224,114 | ) | | | 73,626,120 | |
| | | | |
| Global Convertible Fund | | | 130,822,741 | | | | 10,436,790 | | | | (4,061,900 | ) | | | 6,374,890 | |
| | | | |
| Timpani Small Cap Growth Fund | | | 62,962,626 | | | | 16,550,891 | | | | (550,906 | ) | | | 15,999,985 | |
| | | | |
| Timpani SMID Growth Fund | | | 9,262,240 | | | | 392,670 | | | | (536,847 | ) | | | (144,177 | ) |
| | | | |
| Growth Fund | | | 1,101,908,953 | | | | 345,983,716 | | | | (18,971,103 | ) | | | 327,012,613 | |
| | | | |
| Growth and Income Fund | | | 1,521,436,472 | | | | 583,119,329 | | | | (49,244,453 | ) | | | 533,874,876 | |
| | | | |
| Dividend Growth Fund | | | 12,151,140 | | | | 5,401,792 | | | | (274,561 | ) | | | 5,127,231 | |
| | | | |
| Opportunistic Value Fund | | | 38,333,444 | | | | 6,983,675 | | | | (207,204 | ) | | | 6,776,471 | |
| | | | |
| International Growth Fund | | | 173,785,910 | | | | 39,769,509 | | | | (4,802,957 | ) | | | 34,966,552 | |
| | | | |
| Evolving World Growth Fund | | | 132,570,298 | | | | 33,820,116 | | | | (4,378,290 | ) | | | 29,441,826 | |
| | | | |
| Global Equity Fund | | | 64,417,807 | | | | 18,270,482 | | | | (1,169,743 | ) | | | 17,100,739 | |
| | | | |
| Global Growth and Income Fund | | | 128,858,807 | | | | 22,374,130 | | | | (2,377,891 | ) | | | 19,996,239 | |
| | | | |
| Total Return Bond Fund | | | 64,325,109 | | | | 2,117,535 | | | | (223,310 | ) | | | 1,894,225 | |
| | | | |
| High Income Opportunities Fund | | | 50,133,591 | | | | 1,136,634 | | | | (3,166,318 | ) | | | (2,029,684 | ) |
| | | | |
| Short-Term Bond Fund | | | 223,585,336 | | | | 2,357,932 | | | | (47,442 | ) | | | 2,310,490 | |
Note 4 – Income Taxes
For the fiscal year ended October 31, 2019, the Fund recorded the following permanent reclassifications to reflect tax character. The results of operations and net assets were not affected by these reclassifications.
| | | | | | | | | | | | |
| FUND | | PAID-IN
CAPITAL | | | ACCUMULATED
UNDISTRIBUTED/
(OVERDISTRIBUTED)
NET INVESTMENT
INCOME | | | ACCUMULATED
NET REALIZED
GAIN/(LOSS) ON
INVESTMENTS | |
| Market Neutral Income Fund | | $ | (5,654,278 | ) | | $ | (43,796,680 | ) | | $ | 49,450,958 | |
| | | |
| Hedged Equity Fund | | | — | | | | (55,988 | ) | | | 55,988 | |
| | | |
| Phineus Long/Short Fund | | | 10,837,708 | | | | (2,641,212 | ) | | | (8,196,496 | ) |
| | | |
| Convertible Fund | | | 103,491 | | | | (10,850,135 | ) | | | 10,746,644 | |
| | | |
| Global Convertible Fund | | | (217,025 | ) | | | (250,886 | ) | | | 467,911 | |
| | | |
| Timpani Small Cap Growth Fund* | | | (681,641 | ) | | | 1,267,742 | | | | (586,101 | ) |
| | | |
| Timpani SMID Growth Fund | | | (20,531 | ) | | | 20,531 | | | | — | |
| | | |
| Growth Fund | | | 31,759,087 | | | | 2,219,611 | | | | (33,978,698 | ) |
| | | |
| Growth and Income Fund | | | 4,208,230 | | | | 2,137,234 | | | | (6,345,464 | ) |
| | | |
| Dividend Growth Fund | | | 669,072 | | | | (8,145 | ) | | | (660,927 | ) |
| | | |
| Opportunistic Value Fund | | | 294,570 | | | | (5,162 | ) | | | (289,408 | ) |
| | | |
| International Growth Fund | | | 536,502 | | | | (1,349,767 | ) | | | 813,265 | |
| | | |
| Evolving World Growth Fund | | | (272,243 | ) | | | 88,128 | | | | 184,115 | |
| | | |
| Global Equity Fund | | | 1,864,034 | | | | 76,942 | | | | (1,940,976 | ) |
| | | |
| Global Growth and Income Fund | | | 1,529,517 | | | | (1,320,181 | ) | | | (209,336 | ) |
| | | |
| Total Return Bond Fund | | | — | | | | 33,305 | | | | (33,305 | ) |
| | | |
| High Income Opportunities Fund | | | (1 | ) | | | 6,170 | | | | (6,169 | ) |
| | | |
| Short-Term Bond Fund | | | 1,558 | | | | 422,579 | | | | (424,137 | ) |
| * | Timpani Small Cap Growth Fund also recorded a permanent reclassification to reflect tax character for the 12 month period ended June 30, 2019 (prior tax year-end). Paid-In Capital and Accumulated Net Realized Gain/(Loss) On Investments were reduced by $447,181 and $560,563, respectively. Accumulated Undistributed/(Overdistributed) Net Investment Income was increased by $1,007,744. |
| | | | |
| 176 | | CALAMOS OPEN-END FAMILY OF FUNDS ANNUAL REPORT | | |
Notes to Financial Statements
Distributions were characterized for federal income tax purposes as follows:
| | | | | | | | | | | | | | | | | | | | | | | | |
| | | YEAR OR PERIOD ENDED
OCTOBER 31, 2019 | | | YEAR OR PERIOD ENDED
OCTOBER 31, 2018 | |
| FUND | | ORDINARY
INCOME | | | LONG-TERM
CAPITAL GAIN | | | RETURN OF
CAPITAL | | | ORDINARY
INCOME | | | LONG-TERM
CAPITAL GAIN | | | RETURN OF
CAPITAL | |
| Market Neutral Income Fund | | $ | 217,846,961 | | | $ | 123,320,794 | | | | — | | | $ | 77,379,152 | | | $ | 80,809,364 | | | | — | |
| | | | | | |
| Hedged Equity Income Fund | | | 1,391,398 | | | | 2,507,353 | | | | — | | | | 294,253 | | | | 223 | | | | — | |
| | | | | | |
| Phineus Long/Short Fund | | | 39,979,878 | | | | 8,774,837 | | | | — | | | | 4,847,673 | | | | 3,469,521 | | | | — | |
| | | | | | |
| Convertible Fund | | | 25,865,067 | | | | 52,484,924 | | | | — | | | | 10,520,105 | | | | 18,076,624 | | | | — | |
| | | | | | |
| Global Convertible Fund | | | 4,182,325 | | | | 2,821,821 | | | | — | | | | 1,935,321 | | | | 2,717,363 | | | | — | |
| | | | | | |
| Timpani SMID Growth Fund | | | — | | | | — | | | | — | | | | — | | | | — | | | | — | |
| | | | | | |
| Growth Fund | | | 55,623,655 | | | | 183,241,565 | | | | — | | | | 34,957,588 | | | | 218,784,460 | | | | — | |
| | | | | | |
| Growth and Income Fund | | | 40,039,934 | | | | 111,810,729 | | | | — | | | | 30,462,496 | | | | 116,932,931 | | | | — | |
| | | | | | |
| Dividend Growth Fund | | | 159,783 | | | | 1,542,903 | | | | — | | | | 157,148 | | | | 2,083,020 | | | | — | |
| | | | | | |
| Opportunistic Value Fund | | | 1,915,605 | | | | 5,732,033 | | | | — | | | | 679,851 | | | | 1,596,824 | | | | — | |
| | | | | | |
| International Growth Fund | | | 824,415 | | | | 23,806,913 | | | | — | | | | 2,007,704 | | | | 16,295,738 | | | | — | |
| | | | | | |
| Evolving World Growth Fund | | | 233,278 | | | | — | | | | — | | | | 2,351,175 | | | | — | | | | 110 | |
| | | | | | |
| Global Equity Fund | | | 856,978 | | | | 19,728,912 | | | | — | | | | 2,634,875 | | | | 13,457,533 | | | | — | |
| | | | | | |
| Global Growth and Income Fund | | | 3,954,070 | | | | 16,447,349 | | | | — | | | | 2,786,565 | | | | 13,090,122 | | | | — | |
| | | | | | |
| Total Return Bond Fund | | | 1,448,909 | | | | — | | | | — | | | | 1,692,483 | | | | 352,324 | | | | 179,920 | |
| | | | | | |
| High Income Opportunities Fund | | | 2,714,610 | | | | — | | | | — | | | | 3,181,977 | | | | — | | | | — | |
| | | | | | |
| Short-Term Bond Fund | | | 4,371,556 | | | | — | | | | — | | | | 54,170 | | | | — | | | | — | |
| | | | | | |
| FUND | | YEAR OR
PERIOD ENDED | | | ORDINARY
INCOME | | | LONG-TERM
CAPITAL GAIN | | | RETURN OF
CAPITAL | | | | | | | |
| Timpani Small Cap Growth Fund | | | June 30, 2018 | | | $ | — | | | $ | — | | | | — | | | | | | | | | |
| | | | | | |
| | | June 30, 2019 | | | | — | | | | 4,768,338 | | | | — | | | | | | | | | |
| | | | | | |
| | | October 31, 2019 | | | | — | | | | 90,869 | | | | — | | | | | | | | | |
As of October 31, 2019, the components of accumulated earnings/(loss) on a tax basis were as follows:
| | | | | | | | | | | | | | | | | | | | |
| | | MARKET NEUTRAL
INCOME FUND | | | HEDGED EQUITY
FUND | | | PHINEUS
LONG/SHORT
FUND | | | CONVERTIBLE
FUND | | | GLOBAL
CONVERTIBLE
FUND | |
| Undistributed ordinary income | | $ | 26,284,243 | | | $ | 545,135 | | | $ | 1,884,471 | | | $ | 2,468,298 | | | $ | 1,451,990 | |
| | | | | |
| Undistributed capital gains | | | — | | | | — | | | | — | | | | — | | | | 685,870 | |
| | | | |
| Total undistributed earnings | | | 26,284,243 | | | | 545,135 | | | | 1,884,471 | | | | 2,468,298 | | | | 2,137,860 | |
| | | | | |
| Accumulated capital and other losses | | | (294,470,932 | ) | | | (11,335,520 | ) | | | — | | | | — | | | | — | |
| | | | | |
| Net unrealized gains/(losses) | | | 573,409,775 | | | | 20,825,547 | | | | (74,012,650 | ) | | | 73,624,966 | | | | 6,374,327 | |
| | | | |
| Total accumulated earnings/(losses) | | | 305,223,086 | | | | 10,035,162 | | | | (72,128,179 | ) | | | 76,093,264 | | | | 8,512,187 | |
| | | | | |
| Other | | | (47,435,246 | ) | | | (15,600 | ) | | | (1,599,345 | ) | | | (111,054 | ) | | | (16,084 | ) |
| | | | | |
| Paid-in-capital | | | 8,457,365,989 | | | | 226,777,465 | | | | 866,644,821 | | | | 668,942,332 | | | | 124,437,285 | |
| | | | |
| Net assets applicable to common shareholders | | $ | 8,715,153,829 | | | $ | 236,797,027 | | | $ | 792,917,297 | | | $ | 744,924,542 | | | $ | 132,933,388 | |
| | | | |
| | | | | |
| | | TIMPANI SMALL
CAP GROWTH
FUND | | | TIMPANI SMID
GROWTH FUND | | | GROWTH FUND | | | GROWTH AND
INCOME FUND | | | | |
| Undistributed ordinary income | | $ | — | | | $ | — | | | $ | — | | | $ | 4,972,055 | | | | | |
| | | | | |
| Undistributed capital gains | | | 3,965,852 | | | | — | | | | 124,358,575 | | | | 48,354,057 | | | | | |
| | | | | | | | |
| Total undistributed earnings | | | 3,965,852 | | | | — | | | | 124,358,575 | | | | 53,326,112 | | | | | |
| | | | | |
| Accumulated capital and other losses | | | — | | | | (849,029 | ) | | | — | | | | — | | | | | |
| | | | | |
| Net unrealized gains/(losses) | | | 15,999,985 | | | | (144,177 | ) | | | 327,010,817 | | | | 533,872,836 | | | | | |
| | | | | | | | |
| Total accumulated earnings/(losses) | | | 19,965,837 | | | | (993,206 | ) | | | 451,369,392 | | | | 587,198,948 | | | | | |
| | | | | |
| Other | | | — | | | | — | | | | (264,098 | ) | | | (172,416 | ) | | | | |
| | | | | |
| Paid-in-capital | | | 60,492,987 | | | | 10,359,469 | | | | 946,569,577 | | | | 1,413,836,437 | | | | | |
| | | | | | | | |
| Net assets applicable to common shareholders | | $ | 80,458,824 | | | $ | 9,366,263 | | | $ | 1,397,674,871 | | | $ | 2,000,862,969 | | | | | |
| | | | | | | | |
Notes to Financial Statements
| | | | | | | | | | | | | | | | | | | | |
| | | DIVIDEND
GROWTH FUND | | | OPPORTUNISTIC
VALUE FUND | | | INTERNATIONAL
GROWTH FUND | | | EVOLVING WORLD
GROWTH FUND | | | GLOBAL EQUITY
FUND | |
| Undistributed ordinary income | | $ | 29,164 | | | $ | 313,127 | | | $ | — | | | $ | 1,493,605 | | | $ | — | |
| | | | | |
| Undistributed capital gains | | | 1,897,921 | | | | — | | | | — | | | | — | | | | 6,071,360 | |
| | | | |
| Total undistributed earnings | | | 1,927,085 | | | | 313,127 | | | | — | | | | 1,493,605 | | | | 6,071,360 | |
| | | | | |
| Accumulated capital and other losses | | | — | | | | — | | | | (1,687,258 | ) | | | (18,344,051 | ) | | | — | |
| | | | | |
| Net unrealized gains/(losses) | | | 5,127,231 | | | | 6,776,471 | | | | 34,853,598 | | | | 29,301,928 | | | | 17,068,728 | |
| | | | |
| Total accumulated earnings/(losses) | | | 7,054,316 | | | | 7,089,598 | | | | 33,166,340 | | | | 12,451,482 | | | | 23,140,088 | |
| | | | | |
| Other | | | (6,669 | ) | | | (80,557 | ) | | | 44,680 | | | | (71,781 | ) | | | (92,359 | ) |
| | | | | |
| Paid-in-capital | | | 10,235,074 | | | | 38,017,437 | | | | 171,786,252 | | | | 149,584,526 | | | | 57,817,754 | |
| | | | |
| Net assets applicable to common shareholders | | $ | 17,282,721 | | | $ | 45,026,478 | | | $ | 204,997,272 | | | $ | 161,964,227 | | | $ | 80,865,483 | |
| | | | |
| | | | | |
| | | GLOBAL GROWTH
AND INCOME
FUND | | | TOTAL RETURN
BOND FUND | | | HIGH INCOME
OPPORTUNITIES
FUND | | | SHORT-TERM
BOND FUND | | | | |
| Undistributed ordinary income | | $ | — | | | $ | 18,056 | | | $ | 24,873 | | | $ | 1,392,893 | | | | | |
| | | | | |
| Undistributed capital gains | | | 1,481,802 | | | | — | | | | — | | | | 12,636 | | | | | |
| | | | | | | | |
| Total undistributed earnings | | | 1,481,802 | | | | 18,056 | | | | 24,873 | | | | 1,405,529 | | | | | |
| | | | | |
| Accumulated capital and other losses | | | — | | | | (843,473 | ) | | | (9,544,054 | ) | | | — | | | | | |
| | | | | |
| Net unrealized gains/(losses) | | | 19,946,688 | | | | 1,894,225 | | | | (2,029,684 | ) | | | 2,310,490 | | | | | |
| | | | | | | | |
| Total accumulated earnings/(losses) | | | 21,428,490 | | | | 1,068,808 | | | | (11,548,865 | ) | | | 3,716,019 | | | | | |
| | | | | |
| Other | | | (189,445 | ) | | | (52,124 | ) | | | (116,662 | ) | | | (2,044 | ) | | | | |
| | | | | |
| Paid-in-capital | | | 130,166,751 | | | | 60,046,857 | | | | 55,680,095 | | | | 214,439,052 | | | | | |
| | | | | | | | |
| Net assets applicable to common shareholders | | $ | 151,405,796 | | | $ | 61,063,541 | | | $ | 44,014,568 | | | $ | 218,153,027 | | | | | |
| | | | | | | | |
The following Funds had capital loss carryforwards for the year ended October 31, 2019, with no expiration date, available to offset future realized capital gains:
| | | | | | | | |
| FUND | | SHORT-TERM | | | LONG-TERM | |
| Market Neutral Income Fund | | $ | (177,336,915 | ) | | $ | (117,134,017 | ) |
| | |
| Hedged Equity Fund | | | (4,293,571 | ) | | | (7,041,949 | ) |
| | |
| Timpani SMID Growth Fund | | | (849,029 | ) | | | — | |
| | |
| International Growth Fund | | | (1,687,258 | ) | | | — | |
| | |
| Evolving World Growth Fund | | | (18,344,051 | ) | | | — | |
| | |
| Total Return Bond Fund | | | (335,762 | ) | | | (507,711 | ) |
| | |
| High Income Opportunities Fund | | | (1,082,399 | ) | | | (8,461,655 | ) |
Note 5 – Short Sales
Securities sold short represent obligations to deliver the securities at a future date. A Fund may sell a security it does not own in anticipation of a decline in the value of that security before the delivery date. When the Fund sells a security short, it must borrow the security sold short and deliver it to the broker-dealer through which it made the short sale. Dividends paid on securities sold short are disclosed as an expense on the Statements of Operations. A gain, limited to the price at which the Fund sold the security short, or a loss, unlimited in size, will be realized upon the termination of a short sale.
To secure its obligation to deliver to the broker-dealer the securities sold short, the Fund must segregate an amount of cash or liquid securities with its custodian equal to any excess of the current market value of the securities sold short over any cash or liquid securities deposited as collateral with the broker in connection with the short sale (not including the proceeds of the short sale). As a result of that requirement, the Fund will not gain any leverage merely by selling short, except to the extent that it earns interest or other income or gains on the segregated cash or liquid securities while also being subject to the possibility of gain or loss from the securities sold short.
| | | | |
| 178 | | CALAMOS OPEN-END FAMILY OF FUNDS ANNUAL REPORT | | |
Notes to Financial Statements
Note 6 – Derivative Investments
Foreign Currency Risk. Each Fund may engage in portfolio hedging with respect to changes in currency exchange rates by entering into forward foreign currency contracts to purchase or sell currencies. A forward foreign currency contract is a commitment to purchase or sell a foreign currency at a future date at a negotiated forward rate. Risks associated with such contracts include, among other things, movement in the value of the foreign currency relative to the U.S. dollar and the ability of the counterparty to perform.
To mitigate the counterparty risk, the Fund may enter into an International Swaps and Derivatives Association, Inc. Master Agreement (“ISDA Master Agreement”) or similar agreement with its derivative contract counterparties. An ISDA Master Agreement is a bilateral agreement between the Fund and a counterparty that governsover-the-counter derivatives and foreign exchange contracts and typically contains, among other things, collateral posting terms and netting provisions in the event of a default and/or termination event. Under an ISDA Master Agreement, the Fund may, under certain circumstances, offset with the counterparty certain derivative financial instrument’s payables and/or receivables with collateral held and/or posted and create one single net payment. The provisions of the ISDA Master Agreement typically permit a single net payment in the event of default(close-out netting) including the bankruptcy or insolvency of the counterparty. Generally, collateral is exchanged between the Fund and the counterparty and the amount of collateral due from the Fund or to a counterparty has to exceed a minimum transfer amount threshold before a transfer has to be made. To the extent amounts due to the Fund from its counterparties are not fully collateralized, contractually or otherwise, the Fund bears the risk of loss from counterparty nonperformance. When a Fund is required to post collateral under the terms of a derivatives transaction and master netting agreement, the Fund’s custodian holds the collateral in a segregated account, subject to the terms of atri-party agreement among the Fund, the custodian and the counterparty. The master netting agreement andtri-party agreement provide, in relevant part, that the counterparty may have rights to the amounts in the segregated account in the event that the Fund defaults in its obligation with respect to the derivative instrument that is subject to the collateral requirement. When a counterparty is required to post collateral under the terms of a derivatives transaction and master netting agreement, the counterparty delivers such amount to the Fund’s custodian. The master netting agreement provides, in relevant part, that the Fund may have rights to such collateral in the event that the counterparty defaults in its obligation with respect to the derivative instrument that is subject to the collateral requirement. Generally before a default, neither a Fund nor the counterparty may resell, rehypothecate, or repledge any collateral that it receives.
For financial reporting purposes, the Funds do not offset derivative assets and derivative liabilities that are subject to netting arrangements in the Statements of Assets and Liabilities. The Fund’s net counterparty exposure is reflected in the counterparty table below. The net unrealized gain, if any, represents the credit risk to the respective Fund on a forward foreign currency contract. The contracts are valued daily at forward foreign exchange rates. The Funds realize a gain or loss when a position is closed or upon settlement of the contracts. Please see the disclosure regarding ISDA Master Agreements under Foreign Currency Risk within this note.
As of October 31, 2019, the Funds had outstanding forward foreign currency contracts listed on the Schedules of Investments.
Equity Risk. Each Fund may engage in option transactions and in doing so achieves similar objectives to what it would achieve through the sale or purchase of individual securities. A call option, upon payment of a premium, gives the purchaser of the option the right to buy, and the seller of the option the obligation to sell, the underlying security, index or other instrument at the exercise price. A put option gives the purchaser of the option, upon payment of a premium, the right to sell, and the seller the obligation to buy, the underlying security, index, or other instrument at the exercise price.
To seek to offset some of the risk of a potential decline in value of certain long positions, each Fund may also purchase put options on individual securities, broad-based securities indexes or certain exchange-traded funds (“ETFs”). Each Fund may also seek to generate income from option premiums by writing (selling) options on a portion of the equity securities (including securities that are convertible into equity securities) in the Fund’s portfolio, on broad-based securities indexes, or certain ETFs.
When the Fund purchases an option, it pays a premium and an amount equal to that premium is recorded as an asset. When the Fund writes an option, it receives a premium and an amount equal to that premium is recorded as a liability. The asset or liability is adjusted daily to reflect the current market value of the option. If an option expires unexercised, the Fund realizes a gain or loss to the extent of the premium received or paid. If an option is exercised, the premium received or paid is recorded as an adjustment to the proceeds from the sale or the cost basis of the purchase. The difference between the premium and the amount received or paid on a closing purchase or sale transaction is also treated as a realized gain or loss. The cost of securities acquired through the exercise of call options is increased by premiums paid. The proceeds from securities sold through the exercise of put options are decreased by the premiums paid. Gain or loss on written options and purchased options is presented separately as net realized gain or loss on written options and net realized gain or loss on purchased options, respectively.
Notes to Financial Statements
Options written by each Fund do not typically give rise to counterparty credit risk since options written obligate each Fund and not the counterparty to perform. Exchange traded purchased options have minimal counterparty credit risk to each Fund since the exchange’s clearinghouse, as counterparty to such instruments, guarantees against a possible default.
As of October 31, 2019, the Fund had outstanding purchased options and/or written options as listed on the Schedules of Investments.
As ofOctober 31, 2019, the Funds had outstanding derivative contracts which are reflected on the Statements of Assets and Liabilities as follows:
| | | | | | | | |
| | | ASSET
DERIVATIVES | | | LIABILITY
DERIVATIVES | |
| |
| | | MARKET NEUTRAL INCOME FUND | |
| Gross amounts at fair value: | | | | |
| | |
| Forward foreign currency contracts(1) | | $ | — | | | $ | 207,724 | |
| | |
| Purchased options(2) | | | 52,237,565 | | | | — | |
| | |
| Written options(3) | | | — | | | | 573,181,455 | |
| | |
| Total Return Swaps(4) | | | 104,638 | | | | — | |
| | | | |
| | $ | 52,342,203 | | | $ | 573,389,179 | |
| | | | |
| |
| | | HEDGED EQUITY FUND | |
| Gross amounts at fair value: | | | | |
| | |
| Purchased options(2) | | $ | 1,349,799 | | | $ | — | |
| | |
| Written options(3) | | | — | | | | 19,907,178 | |
| | | | |
| | $ | 1,349,799 | | | $ | 19,907,178 | |
| | | | |
| |
| | | PHINEUS LONG/SHORT FUND | |
| Gross amounts at fair value: | | | | |
| | |
| Purchased options(2) | | $ | 1,829,708 | | | $ | — | |
| | |
| Written options(3) | | | — | | | | 4,331,844 | |
| | | | |
| | $ | 1,829,708 | | | $ | 4,331,844 | |
| | | | |
| |
| | | CONVERTIBLE FUND | |
| Gross amounts at fair value: | | | | |
| | |
| Forward foreign currency contracts(1) | | $ | — | | | $ | 1,154 | |
| | |
| Purchased options(2) | | | 3,545,635 | | | | — | |
| | |
| Written options(3) | | | — | | | | 63,000 | |
| | | | |
| | $ | 3,545,635 | | | $ | 64,154 | |
| | | | |
| |
| | | GLOBAL CONVERTIBLE FUND | |
| Gross amounts at fair value: | | | | |
| | |
| Purchased options(2) | | $ | 926,353 | | | $ | — | |
| | | | |
| | $ | 926,353 | | | $ | — | |
| | | | |
| |
| | | GROWTH FUND | |
| Gross amounts at fair value: | | | | |
| | |
| Purchased options(2) | | $ | 186,625 | | | $ | — | |
| | |
| Written options(3) | | | — | | | | 751,100 | |
| | | | |
| | $ | 186,625 | | | $ | 751,100 | |
| | | | |
| | | | |
| 180 | | CALAMOS OPEN-END FAMILY OF FUNDS ANNUAL REPORT | | |
Notes to Financial Statements
| | | | | | | | |
| | | ASSET
DERIVATIVES | | | LIABILITY
DERIVATIVES | |
| |
| | | GROWTH AND INCOME FUND | |
| Gross amounts at fair value: | | | | |
| | |
| Forward foreign currency contracts(1) | | $ | — | | | $ | 2,040 | |
| | |
| Purchased options(2) | | | 11,798,458 | | | | — | |
| | |
| Written options(3) | | | — | | | | 102,430 | |
| | | | |
| | $ | 11,798,458 | | | $ | 104,470 | |
| | | | |
| |
| | | INTERNATIONAL GROWTH FUND | |
| Gross amounts at fair value: | | | | |
| | |
| Forward foreign currency contracts(1) | | $ | 1,202 | | | $ | — | |
| | |
| Purchased options(2) | | | 1,243,327 | | | | — | |
| | |
| Written options(3) | | | — | | | | 117,704 | |
| | | | |
| | $ | 1,244,529 | | | $ | 117,704 | |
| | | | |
| |
| | | EVOLVING WORLD GROWTH FUND | |
| Gross amounts at fair value: | | | | |
| | |
| Purchased options(2) | | $ | 2,647,932 | | | $ | — | |
| | | | |
| | $ | 2,647,932 | | | $ | — | |
| | | | |
| |
| | | GLOBAL EQUITY FUND | |
| Gross amounts at fair value: | | | | |
| | |
| Purchased options(1) | | $ | 108,789 | | | $ | — | |
| | |
| Written options(2) | | | — | | | | 17,291 | |
| | | | |
| | $ | 108,789 | | | $ | 17,291 | |
| | | | |
| |
| | | GLOBAL GROWTH AND INCOME FUND | |
| Gross amounts at fair value: | | | | |
| | |
| Purchased options(1) | | $ | 1,603,048 | | | $ | — | |
| | |
| Written options(2) | | | — | | | | 18,645 | |
| | | | |
| | $ | 1,603,048 | | | $ | 18,645 | |
| | | | |
| |
| | | SHORT-TERM BOND FUND | |
| Gross amounts at fair value: | | | | |
| | |
| Futures contracts(5) | | $ | — | | | $ | 5,363 | |
| | | | |
| | $ | — | | | $ | 5,363 | |
| | | | |
The following table presents the outstanding derivative contracts, organized by counterparty, that are subject to enforceable master netting agreements as of October 31, 2019:
| | | | | | | | | | | | | | | | | | | | | | | | |
| | | GROSS AMOUNTS NOT OFFSET
IN THE STATEMENT OF ASSETS AND LIABILITIES | |
| MARKET NEUTRAL INCOME FUND | | GROSS AMOUNTS PRESENTED IN THE
STATEMENT OF ASSETS AND LIABILITIES | | | COLLATERAL PLEDGED | | | NET AMOUNT
RECEIVABLE IN
THE EVENT OF DEFAULT | | | NET AMOUNT
PAYABLE IN
THE EVENT OF DEFAULT | |
| Counterparty | | | | | ASSETS | | | LIABILITIES | |
| Northern Trust Company | | | ISDA | | | $ | — | | | $ | 113,917 | | | $ | — | | | $ | — | | | $ | 113,917 | |
| | | | | | |
| State Street Bank and Trust | | | ISDA | | | | — | | | | 89,662 | | | | — | | | | — | | | | 89,662 | |
| | | | | | |
| Goldman Sachs & Co. | | | ISDA | | | | 4,359 | | | | 4,145 | | | | — | | | | 214 | | | | — | |
| | | | | | |
| Morgan Stanley & Co. | | | ISDA | | | | 100,279 | | | | — | | | | — | | | | 100,279 | | | | — | |
| | | | |
| | | $ | 104,638 | | | $ | 207,724 | | | $ | — | | | $ | 100,493 | | | $ | 203,579 | |
| | | | |
Notes to Financial Statements
| | | | | | | | | | | | | | | | | | | | | | | | |
| | | GROSS AMOUNTS NOT OFFSET
IN THE STATEMENT OF ASSETS AND LIABILITIES | |
| CONVERTIBLE FUND | | GROSS AMOUNTS PRESENTED IN THE
STATEMENT OF ASSETS AND LIABILITIES | | | COLLATERAL PLEDGED | | | NET AMOUNT
RECEIVABLE IN
THE EVENT OF DEFAULT | | | NET AMOUNT
PAYABLE IN
THE EVENT OF DEFAULT | |
| Counterparty | | | | | ASSETS | | | LIABILITIES | |
| State Street Bank and Trust | | | ISDA | | | $ | — | | | $ | 1,154 | | | $ | — | | | $ | — | | | $ | 1,154 | |
| | | | |
| | | | | | $ | — | | | $ | 1,154 | | | $ | — | | | $ | — | | | $ | 1,154 | |
| | | | |
| | | | |
| GROWTH AND INCOME FUND | | GROSS AMOUNTS PRESENTED IN THE
STATEMENT OF ASSETS AND LIABILITIES | | | COLLATERAL PLEDGED | | | NET AMOUNT
RECEIVABLE IN
THE EVENT OF DEFAULT | | | NET AMOUNT
PAYABLE IN
THE EVENT OF DEFAULT | |
| Counterparty | | | | | ASSETS | | | LIABILITIES | |
| Goldman Sachs & Co. | | | ISDA | | | $ | — | | | $ | 73 | | | $ | — | | | $ | — | | | $ | 73 | |
| | | | | | |
| State Street Bank and Trust | | | ISDA | | | | — | | | | 1,967 | | | | — | | | | — | | | | 1,967 | |
| | | | |
| | | | | | $ | — | | | $ | 2,040 | | | $ | — | | | $ | — | | | $ | 2,040 | |
| | | | |
| | | | |
| INTERNATIONAL GROWTH FUND | | GROSS AMOUNTS PRESENTED IN THE
STATEMENT OF ASSETS AND LIABILITIES | | | COLLATERAL PLEDGED | | | NET AMOUNT
RECEIVABLE IN
THE EVENT OF DEFAULT | | | NET AMOUNT
PAYABLE IN
THE EVENT OF DEFAULT | |
| Counterparty | | | | | ASSETS | | | LIABILITIES | |
| Goldman Sachs & Co. | | | | | | $ | 1,202 | | | $ | — | | | $ | — | | | $ | 1,202 | | | $ | — | |
| | | | |
| | | | | | $ | 1,202 | | | $ | — | | | $ | — | | | $ | 1,202 | | | $ | — | |
| | | | |
For the year endedOctober 31, 2019, the volume of derivative activity for the Fund is reflected below:*
| | | | | | | | | | | | | | | | | | | | |
| FUND | | FORWARD
CONTRACTS(1) | | | FUTURES
CONTRACTS(5) | | | PURCHASED
OPTIONS(2) | | | WRITTEN
OPTIONS(3) | | | SWAPS(4) | |
| Market Neutral Income Fund | | | 686,826,521 | | | | — | | | | 283,312 | | | | 190,134 | | | | 17,799,401 | |
| | | | | |
| Hedged Equity Fund | | | — | | | | — | | | | 11,328 | | | | 6,869 | | | | — | |
| | | | | |
| Phineus Long/Short Fund | | | — | | | | — | | | | 662,982 | | | | 627,382 | | | | — | |
| | | | | |
| Convertible Fund | | | 33,644,369 | | | | — | | | | 20,588 | | | | 951 | | | | — | |
| | | | | |
| Global Convertible Fund | | | 357 | | | | — | | | | 3,911 | | | | 130 | | | | — | |
| | | | | |
| Growth Fund | | | — | | | | — | | | | 137,644 | | | | 128,965 | | | | — | |
| | | | | |
| Growth and Income Fund | | | 37,452,532 | | | | — | | | | 176,373 | | | | 21,406 | | | | — | |
| | | | | |
| Opportunistic Value Fund | | | — | | | | — | | | | 30 | | | | 30 | | | | — | |
| | | | | |
| International Growth Fund | | | 209,917,854 | | | | — | | | | 35,510 | | | | 3,453 | | | | — | |
| | | | | |
| Evolving World Growth Fund | | | 518 | | | | — | | | | 66,173 | | | | 780 | | | | — | |
| | | | | |
| Global Equity Fund | | | 98 | | | | — | | | | 4,808 | | | | 657 | | | | — | |
| | | | | |
| Global Growth and Income Fund | | | — | | | | — | | | | 15,736 | | | | 3,527 | | | | — | |
| | | | | |
| Short-Term Bond Fund | | | — | | | | 20 | | | | — | | | | — | | | | — | |
| * | Activity during the period is measured by opened number of contracts for options purchased or written, opened foreign currency contracts (measured in notional), opened number of contracts for futures contracts, and opened total return swaps (measured in notional). |
| (1) | Generally, the Statement of Assets and Liabilities location for Forward contracts is Unrealized appreciation on forward foreign currency contracts for asset derivatives and Unrealized depreciation on forward foreign currency contracts for liability derivatives. |
| (2) | Generally, the Statement of Assets and Liabilities location for Purchased Options is Investments in securities, at value. |
| (3) | Generally, the Statement of Assets and Liabilities location for Written Options is Options written, at value. |
| (4) | Generally, the Statement of Assets and Liabilities location for Swap contracts is Unrealized appreciation on total return swaps for asset derivatives and Unrealized depreciation on total return swaps for liability derivatives. |
| (5) | Generally, the Statement of Assets and Liabilities location for Futures contracts is Variation margin on open futures contracts for asset derivatives and Variation margin on open futures contracts for liability derivatives. |
Note 7 – Securities Lending
The Funds may loan one or more of their securities to broker-dealers and banks. Any such loan must be secured by collateral in cash or cash equivalents maintained on a current basis in an amount at least equal to the value of the securities loaned by the Funds. The Funds continue to receive the equivalent of the interest or dividends paid by the issuer on the securities loaned and also receive an additional return that may be in the form of a fixed fee or a percentage of the collateral. The additional return is disclosed on a net basis as
| | | | |
| 182 | | CALAMOS OPEN-END FAMILY OF FUNDS ANNUAL REPORT | | |
Notes to Financial Statements
Securities lending income in the Statement of Operations. Upon receipt of cash or cash equivalent collateral, the Funds’ securities lending agent invests the collateral into short term investments following investment guidelines approved by Calamos Advisors. The Funds record the investment of collateral as an asset and the value of the collateral as a liability on the Statements of Assets and Liabilities. If the value of the invested collateral declines below the value of the collateral deposited by the borrower, the Funds will record unrealized depreciation equal to the decline in value of the invested collateral. The Funds will pay reasonable fees to persons unaffiliated with the Funds for services in arranging these loans. The Funds have the right to call a loan and obtain the securities loaned at any time. The Funds do not have the right to vote the securities during the existence of the loan but could call the loan in an attempt to permit voting of the securities in certain circumstances. Upon return of the securities loaned, the cash or cash equivalent collateral will be returned to the borrower. In the event of bankruptcy or other default of the borrower, the Funds could experience both delays in liquidating the loan collateral or recovering the loaned securities and losses, including (a) possible decline in the value of the collateral or in the value of the securities loaned during the period while the Funds seek to enforce its rights thereto, (b) possible subnormal levels of income and lack of access to income during this period, and (c) the expenses of enforcing their rights. In an effort to reduce these risks, the Funds’ security lending agent monitors and reports to Calamos Advisors on the creditworthiness of the firms to which a Fund lends securities.
The following table indicates the total amount of securities loaned by asset class, reconciled to the gross liability payable upon return of the securities loaned by the Funds as of October 31, 2019.
| | | | | | | | | | | | | | | | | | | | |
| FUND | | VALUE OF SECURITIES
ON LOAN TO
BROKER-
DEALERS AND
BANKS | | | AMOUNT OF COLLATERAL HELD IN SHORT TERM INVESTMENTS
AND RESTRICTED CASH BY ASSET CLASS ON LOAN | | | EXCESS AMOUNT
DUE TO/FROM
COUNTERPARTY | |
| | EQUITY | | | FIXED INCOME | | | TOTAL | |
| Market Neutral Income Fund | | $ | 102,369,545 | | | $ | 56,606,652 | | | $ | 95,093,763 | | | $ | 151,700,415 | | | $ | 49,330,870 | |
| | | | | |
| Hedged Equity Fund | | | — | | | | 1,208,863 | | | | — | | | | 1,208,863 | | | | 1,208,863 | |
| | | | | |
| Phineus Long/Short Fund | | | 11,962,705 | | | | 19,327,669 | | | | — | | | | 19,327,669 | | | | 7,364,964 | |
| | | | | |
| Convertible Fund | | | 43,780,562 | | | | 2,793,406 | | | | 42,968,465 | | | | 45,761,871 | | | | 1,981,309 | |
| | | | | |
| Global Convertible Fund | | | 3,755,500 | | | | — | | | | 6,466,618 | | | | 6,466,618 | | | | 2,711,118 | |
| | | | | |
| Growth Fund | | | 29,711,149 | | | | 43,164,771 | | | | — | | | | 43,164,771 | | | | 13,453,622 | |
| | | | | |
| Growth and Income Fund | | | 47,952,028 | | | | 21,577,410 | | | | 42,228,841 | | | | 63,806,251 | | | | 15,854,223 | |
| | | | | |
| Dividend Growth Fund | | | — | | | | 79,006 | | | | — | | | | 79,006 | | | | 79,006 | |
| | | | | |
| Opportunistic Value Fund | | | 293,100 | | | | 623,892 | | | | — | | | | 623,892 | | | | 330,792 | |
| | | | | |
| International Growth Fund | | | 3,983,662 | | | | 7,955,941 | | | | — | | | | 7,955,941 | | | | 3,972,279 | |
| | | | | |
| Evolving World Growth Fund | | | 1,297,500 | | | | 3,479,479 | | | | — | | | | 3,479,479 | | | | 2,181,979 | |
| | | | | |
| Global Equity Fund | | | 72,557 | | | | 2,412,272 | | | | — | | | | 2,412,272 | | | | 2,339,715 | |
| | | | | |
| Global Growth and Income Fund | | | — | | | | 3,123,022 | | | | — | | | | 3,123,022 | | | | 3,123,022 | |
| | | | | |
| Total Return Bond Fund | | | 4,728,925 | | | | — | | | | 8,151,274 | | | | 8,151,274 | | | | 3,422,349 | |
| | | | | |
| High Income Opportunities Fund | | | 3,959,174 | | | | 130,148 | | | | 4,302,116 | | | | 4,432,264 | | | | 473,090 | |
| | | | | |
| Short-Term Bond Fund | | | 6,579,080 | | | | — | | | | 7,431,693 | | | | 7,431,693 | | | | 852,613 | |
Note 8 – Fair Value Measurements
Various inputs are used to determine the value of the Funds’ investments. These inputs are categorized into three broad levels as follows:
| | • | | Level 1 – Prices are determined using inputs from unadjusted quoted prices from active markets (including securities actively traded on a securities exchange) for identical assets. |
| | • | | Level 2 – Prices are determined using significant observable market inputs other than unadjusted quoted prices, including quoted prices of similar securities, fair value adjustments to quoted foreign securities, interest rates, credit risk, prepayment speeds, and other relevant data. |
| | • | | Level 3 – Prices reflect unobservable market inputs (including the Funds’ own judgments about assumptions market participants would use in determining fair value) when observable inputs are unavailable. |
Debt securities are valued based upon evaluated prices received from an independent pricing service or from a dealer or broker who makes markets in such securities. Pricing services utilize various observable market data and as such, debt securities are generally categorized as Level 2. The levels are not necessarily an indication of the risk or liquidity of the Fund’s investments.
Notes to Financial Statements
The following is a summary of the inputs used in valuing the Funds’ holdings at fair value:
| | | | | | | | | | | | | | | | |
| | | MARKET NEUTRAL INCOME FUND | |
| | | LEVEL 1 | | | LEVEL 2 | | | LEVEL 3 | | | TOTAL | |
| Assets: | |
| | | | |
Convertible Bonds | | $ | — | | | $ | 3,526,205,223 | | | $ | — | | | $ | 3,526,205,223 | |
| | | | |
Synthetic Convertible Securities (Purchased Options) | | | 10,501,140 | | | | 20,594,550 | | | | — | | | | 31,095,690 | |
| | | | |
Synthetic Convertible Securities (U.S. Government and Agency Security) | | | — | | | | 50,411,133 | | | | — | | | | 50,411,133 | |
| | | | |
Convertible Preferred Stocks | | | 384,106,619 | | | | 57,017,900 | | | | — | | | | 441,124,519 | |
| | | | |
Common Stocks U.S. | | | 4,677,524,859 | | | | — | | | | — | | | | 4,677,524,859 | |
| | | | |
Exchange-Traded Funds | | | 26,086,380 | | | | — | | | | — | | | | 26,086,380 | |
| | | | |
Investments in Affiliated Funds | | | 152,367,617 | | | | — | | | | — | | | | 152,367,617 | |
| | | | |
Purchased options | | | 21,141,875 | | | | — | | | | — | | | | 21,141,875 | |
| | | | |
Short Term Investments | | | 302,150,189 | | | | — | | | | — | | | | 302,150,189 | |
| | | | |
Investment of Cash Collateral For Securities Loaned | | | 36,524,248 | | | | 65,845,297 | | | | — | | | | 102,369,545 | |
| | | | |
Total Return Swaps | | | — | | | | 104,638 | | | | — | | | | 104,638 | |
| | | | |
Total | | $ | 5,610,402,927 | | | $ | 3,720,178,741 | | | $ | — | | | $ | 9,330,581,668 | |
| | | | |
|
| Liabilities: | |
| | | | |
Common Stocks Sold Short U.S. | | $ | 2,623,461,468 | | | $ | — | | | $ | — | | | $ | 2,623,461,468 | |
| | | | |
Common Stocks Sold Short Foreign | | | 123,542,234 | | | | — | | | | — | | | | 123,542,234 | |
| | | | |
Written options | | | 573,181,455 | | | | — | | | | — | | | | 573,181,455 | |
| | | | |
Forward Foreign Currency Contracts | | | — | | | | 207,724 | | | | — | | | | 207,724 | |
| | | | |
Total | | $ | 3,320,185,157 | | | $ | 207,724 | | | $ | — | | | $ | 3,320,392,881 | |
| | | | |
| |
| | | HEDGED EQUITY FUND | |
| | | LEVEL 1 | | | LEVEL 2 | | | LEVEL 3 | | | TOTAL | |
| Assets: | |
| | | | |
Common Stocks U.S. | | $ | 240,502,513 | | | $ | — | | | $ | — | | | $ | 240,502,513 | |
| | | | |
Exchange-Traded Funds | | | 11,247,476 | | | | — | | | | — | | | | 11,247,476 | |
| | | | |
Purchased options | | | 1,349,799 | | | | — | | | | — | | | | 1,349,799 | |
| | | | |
Short Term Investments | | | 3,460,501 | | | | — | | | | — | | | | 3,460,501 | |
| | | | |
Total | | $ | 256,560,289 | | | $ | — | | | $ | — | | | $ | 256,560,289 | |
| | | | |
|
| Liabilities: | |
| | | | |
Written options | | $ | 19,907,178 | | | $ | — | | | $ | — | | | $ | 19,907,178 | |
| | | | |
Total | | $ | 19,907,178 | | | $ | — | | | $ | — | | | $ | 19,907,178 | |
| | | | |
| |
| | | PHINEUS LONG/SHORT FUND | |
| | | LEVEL 1 | | | LEVEL 2 | | | LEVEL 3 | | | TOTAL | |
| Assets: | |
| | | | |
Common Stocks U.S. | | $ | 693,066,814 | | | $ | — | | | $ | — | | | $ | 693,066,814 | |
| | | | |
Common Stocks Foreign | | | — | | | | 16,702,142 | | | | — | | | | 16,702,142 | |
| | | | |
Investments in Affiliated Funds | | | 36,060,658 | | | | — | | | | — | | | | 36,060,658 | |
| | | | |
Purchased options | | | 1,829,708 | | | | — | | | | — | | | | 1,829,708 | |
| | | | |
Short Term Investments | | | 56,122,108 | | | | — | | | | — | | | | 56,122,108 | |
| | | | |
Investment of Cash Collateral For Securities Loaned | | | — | | | | 11,962,705 | | | | — | | | | 11,962,705 | |
| | | | |
Total | | $ | 787,079,288 | | | $ | 28,664,847 | | | $ | — | | | $ | 815,744,135 | |
| | | | |
|
| Liabilities: | |
| | | | |
Common Stocks Sold Short U.S. | | $ | 58,580,555 | | | $ | — | | | $ | — | | | $ | 58,580,555 | |
| | | | |
Exchange-Traded Funds Sold Short | | | 649,550,862 | | | | — | | | | — | | | | 649,550,862 | |
| | | | |
Written options | | | 4,331,844 | | | | — | | | | — | | | | 4,331,844 | |
| | | | |
Total | | $ | 712,463,261 | | | $ | — | | | $ | — | | | $ | 712,463,261 | |
| | | | |
| | | | |
| 184 | | CALAMOS OPEN-END FAMILY OF FUNDS ANNUAL REPORT | | |
Notes to Financial Statements
| | | | | | | | | | | | | | | | |
| | | CONVERTIBLE FUND | |
| | | LEVEL 1 | | | LEVEL 2 | | | LEVEL 3 | | | TOTAL | |
| Assets: | |
| | | | |
Convertible Bonds | | $ | — | | | $ | 573,594,638 | | | $ | — | | | $ | 573,594,638 | |
| | | | |
Synthetic Convertible Securities (U.S. Government and Agency Security) | | | — | | | | 12,300,543 | | | | — | | | | 12,300,543 | |
| | | | |
Synthetic Convertible Securities (Purchased Options) | | | 2,550,885 | | | | — | | | | — | | | | 2,550,885 | |
| | | | |
Convertible Preferred Stocks | | | 117,979,348 | | | | — | | | | — | | | | 117,979,348 | |
| | | | |
Common Stocks U.S. | | | 17,133,749 | | | | — | | | | — | | | | 17,133,749 | |
| | | | |
Purchased options | | | 994,750 | | | | — | | | | — | | | | 994,750 | |
| | | | |
Short Term Investments | | | 17,251,710 | | | | — | | | | — | | | | 17,251,710 | |
| | | | |
Investment of Cash Collateral For Securities Loaned | | | 20,867,259 | | | | 22,913,303 | | | | — | | | | 43,780,562 | |
| | | | |
Total | | $ | 176,777,701 | | | $ | 608,808,484 | | | $ | — | | | $ | 785,586,185 | |
| | | | |
|
| Liabilities: | |
| | | | |
Written options | | $ | 63,000 | | | $ | — | | | $ | — | | | $ | 63,000 | |
| | | | |
Forward Foreign Currency Contracts | | | — | | | | 1,154 | | | | — | | | | 1,154 | |
| | | | |
Total | | $ | 63,000 | | | $ | 1,154 | | | $ | — | | | $ | 64,154 | |
| | | | |
| |
| | | GLOBAL CONVERTIBLE FUND | |
| | | LEVEL 1 | | | LEVEL 2 | | | LEVEL 3 | | | TOTAL | |
| Assets: | | | | | | | | | | | | | | | | |
| | | | |
Convertible Bonds | | $ | — | | | $ | 100,140,902 | | | $ | — | | | $ | 100,140,902 | |
| | | | |
Synthetic Convertible Securities (U.S. Government and Agency Securities) | | | — | | | | 10,743,533 | | | | — | | | | 10,743,533 | |
| | | | |
Synthetic Convertible Securities (Purchased Options) | | | 926,353 | | | | — | | | | — | | | | 926,353 | |
| | | | |
Convertible Preferred Stocks | | | 16,782,701 | | | | 673,431 | | | | — | | | | 17,456,132 | |
| | | | |
Bank Loans | | | — | | | | 408,906 | | | | — | | | | 408,906 | |
| | | | |
Short Term Investments | | | 3,766,305 | | | | — | | | | — | | | | 3,766,305 | |
| | | | |
Investment of Cash Collateral For Securities Loaned | | | — | | | | 3,755,500 | | | | — | | | | 3,755,500 | |
| | | | |
Total | | $ | 21,475,359 | | | $ | 115,722,272 | | | $ | — | | | $ | 137,197,631 | |
| | | | |
| |
| | | TIMPANI SMALL CAP GROWTH FUND | |
| | | LEVEL 1 | | | LEVEL 2 | | | LEVEL 3 | | | TOTAL | |
| Assets: | | | | | | | | | | | | | | | | |
| | | | |
Common Stocks U.S. | | $ | 76,958,412 | | | $ | — | | | $ | — | | | $ | 76,958,412 | |
| | | | |
Short Term Investments | | | 2,004,199 | | | | — | | | | — | | | | 2,004,199 | |
| | | | |
Total | | $ | 78,962,611 | | | $ | — | | | $ | — | | | $ | 78,962,611 | |
| | | | |
| |
| | | TIMPANI SMID GROWTH FUND | |
| | | LEVEL 1 | | | LEVEL 2 | | | LEVEL 3 | | | TOTAL | |
| Assets: | | | | | | | | | | | | | | | | |
| | | | |
Common Stocks U.S. | | $ | 9,098,121 | | | $ | — | | | $ | — | | | $ | 9,098,121 | |
| | | | |
Short Term Investments | | | 19,942 | | | | — | | | | — | | | | 19,942 | |
| | | | |
Total | | $ | 9,118,063 | | | $ | — | | | $ | — | | | $ | 9,118,063 | |
| | | | |
Notes to Financial Statements
| | | | | | | | | | | | | | | | |
| | | GROWTH FUND | |
| | | LEVEL 1 | | | LEVEL 2 | | | LEVEL 3 | | | TOTAL | |
| Assets: | | | | | | | | | | | | | | | | |
| | | | |
Common Stocks U.S. | | $ | 1,307,904,533 | | | $ | — | | | $ | — | | | $ | 1,307,904,533 | |
| | | | |
Common Stocks Foreign | | | 2,138,873 | | | | 5,499,845 | | | | — | | | | 7,638,718 | |
| | | | |
Exchange-Traded Funds | | | 2,092,904 | | | | — | | | | — | | | | 2,092,904 | |
| | | | |
Investments in Affiliated Funds | | | 5,662,175 | | | | — | | | | — | | | | 5,662,175 | |
| | | | |
Purchased options | | | 186,625 | | | | — | | | | — | | | | 186,625 | |
| | | | |
Short Term Investments | | | 76,476,562 | | | | — | | | | — | | | | 76,476,562 | |
| | | | |
Investment of Cash Collateral For Securities Loaned | | | 8,401,922 | | | | 21,309,227 | | | | — | | | | 29,711,149 | |
| | | | |
Total | | $ | 1,402,863,594 | | | $ | 26,809,072 | | | $ | — | | | $ | 1,429,672,666 | |
| | | | |
| | | | |
| Liabilities: | | | | | | | | | | | | | | | | |
| | | | |
Written options | | $ | 751,100 | | | $ | — | | | $ | — | | | $ | 751,100 | |
| | | | |
Total | | $ | 751,100 | | | $ | — | | | $ | — | | | $ | 751,100 | |
| | | | |
| |
| | | GROWTH AND INCOME FUND | |
| | | LEVEL 1 | | | LEVEL 2 | | | LEVEL 3 | | | TOTAL | |
| Assets: | | | | | | | | | | | | | | | | |
| | | | |
Corporate Bonds | | $ | — | | | $ | 59,550,818 | | | $ | — | | | $ | 59,550,818 | |
| | | | |
Convertible Bonds | | | — | | | | 262,112,544 | | | | — | | | | 262,112,544 | |
| | | | |
U.S. Government and Agency Securities | | | — | | | | 33,785,133 | | | | — | | | | 33,785,133 | |
| | | | |
Convertible Preferred Stocks | | | 126,580,763 | | | | 16,559,274 | | | | — | | | | 143,140,037 | |
| | | | |
Common Stocks U.S. | | | 1,430,172,581 | | | | — | | | | — | | | | 1,430,172,581 | |
| | | | |
Exchange-Traded Funds | | | 23,563,407 | | | | — | | | | — | | | | 23,563,407 | |
| | | | |
Purchased options | | | 11,798,458 | | | | — | | | | — | | | | 11,798,458 | |
| | | | |
Short Term Investments | | | 43,338,772 | | | | — | | | | — | | | | 43,338,772 | |
| | | | |
Investment of Cash Collateral For Securities Loaned | | | 21,197,013 | | | | 26,755,015 | | | | — | | | | 47,952,028 | |
| | | | |
Total | | $ | 1,656,650,994 | | | $ | 398,762,784 | | | $ | — | | | $ | 2,055,413,778 | |
| | | | |
| | | | |
| Liabilities: | | | | | | | | | | | | | | | | |
| | | | |
Written options | | $ | 102,430 | | | $ | — | | | $ | — | | | $ | 102,430 | |
| | | | |
Forward Foreign Currency Contracts | | | — | | | | 2,040 | | | | — | | | | 2,040 | |
| | | | |
Total | | $ | 102,430 | | | $ | 2,040 | | | $ | — | | | $ | 104,470 | |
| | | | |
| |
| | | DIVIDEND GROWTH FUND | |
| | | LEVEL 1 | | | LEVEL 2 | | | LEVEL 3 | | | TOTAL | |
| Assets: | | | | | | | | | | | | | | | | |
| | | | |
Common Stocks U.S. | | $ | 16,787,547 | | | $ | — | | | $ | — | | | $ | 16,787,547 | |
| | | | |
Short Term Investments | | | 490,824 | | | | — | | | | — | | | | 490,824 | |
| | | | |
Total | | $ | 17,278,371 | | | $ | — | | | $ | — | | | $ | 17,278,371 | |
| | | | |
| |
| | | OPPORTUNISTIC VALUE FUND | |
| | | LEVEL 1 | | | LEVEL 2 | | | LEVEL 3 | | | TOTAL | |
| Assets: | | | | | | | | | | | | | | | | |
| | | | |
Common Stocks U.S. | | $ | 44,330,967 | | | $ | — | | | $ | — | | | $ | 44,330,967 | |
| | | | |
Exchange-Traded Funds | | | 334,140 | | | | — | | | | — | | | | 334,140 | |
| | | | |
Short Term Investments | | | 151,708 | | | | — | | | | — | | | | 151,708 | |
| | | | |
Investment of Cash Collateral For Securities Loaned | | | — | | | | 293,100 | | | | — | | | | 293,100 | |
| | | | |
Total | | $ | 44,816,815 | | | $ | 293,100 | | | $ | — | | | $ | 45,109,915 | |
| | | | |
| | | | |
| 186 | | CALAMOS OPEN-END FAMILY OF FUNDS ANNUAL REPORT | | |
Notes to Financial Statements
| | | | | | | | | | | | | | | | |
| | | INTERNATIONAL GROWTH FUND | |
| | | LEVEL 1 | | | LEVEL 2 | | | LEVEL 3 | | | TOTAL | |
| Assets: | | | | | | | | | | | | | | | | |
| | | | |
Common Stocks U.S. | | $ | 50,355,502 | | | $ | — | | | $ | — | | | $ | 50,355,502 | |
| | | | |
Common Stocks Foreign | | | 13,486,837 | | | | 139,799,383 | | | | — | | | | 153,286,220 | |
| | | | |
Purchased options | | | 1,243,327 | | | | — | | | | — | | | | 1,243,327 | |
| | | | |
Short Term Investments | | | 1,455 | | | | — | | | | — | | | | 1,455 | |
| | | | |
Investment of Cash Collateral For Securities Loaned | | | — | | | | 3,983,662 | | | | — | | | | 3,983,662 | |
| | | | |
Forward Foreign Currency Contracts | | | — | | | | 1,202 | | | | — | | | | 1,202 | |
| | | | |
Total | | $ | 65,087,121 | | | $ | 143,784,247 | | | $ | — | | | $ | 208,871,368 | |
| | | | |
| | | | |
| Liabilities: | | | | | | | | | | | | | | | | |
| | | | |
Written options | | $ | 117,704 | | | $ | — | | | $ | — | | | $ | 117,704 | |
| | | | |
Total | | $ | 117,704 | | | $ | — | | | $ | — | | | $ | 117,704 | |
| | | | |
| |
| | | EVOLVING WORLD GROWTH FUND | |
| | | LEVEL 1 | | | LEVEL 2 | | | LEVEL 3 | | | TOTAL | |
| Assets: | | | | | | | | | | | | | | | | |
| | | | |
Convertible Bonds | | $ | — | | | $ | 33,952,607 | | | $ | — | | | $ | 33,952,607 | |
| | | | |
Convertible Preferred Stocks | | | 1,786,983 | | | | — | | | | — | | | | 1,786,983 | |
| | | | |
Common Stocks Foreign | | | 13,759,816 | | | | 76,737,626 | | | | — | | | | 90,497,442 | |
| | | | |
Common Stocks U.S. | | | 31,552,379 | | | | — | | | | — | | | | 31,552,379 | |
| | | | |
Purchased Options | | | 2,647,932 | | | | — | | | | — | | | | 2,647,932 | |
| | | | |
Short Term Investments | | | 277,281 | | | | — | | | | — | | | | 277,281 | |
| | | | |
Investment of Cash Collateral For Securities Loaned | | | — | | | | 1,297,500 | | | | — | | | | 1,297,500 | |
| | | | |
Total | | $ | 50,024,391 | | | $ | 111,987,733 | | | $ | — | | | $ | 162,012,124 | |
| | | | |
| |
| | | GLOBAL EQUITY FUND | |
| | | LEVEL 1 | | | LEVEL 2 | | | LEVEL 3 | | | TOTAL | |
| Assets: | | | | | | | | | | | | | | | | |
| | | | |
Common Stocks U.S. | | $ | 43,106,589 | | | $ | — | | | $ | — | | | $ | 43,106,589 | |
| | | | |
Common Stocks Foreign | | | 1,906,447 | | | | 36,340,637 | | | | — | | | | 38,247,084 | |
| | | | |
Purchased options | | | 108,789 | | | | — | | | | — | | | | 108,789 | |
| | | | |
Short Term Investments | | | 818 | | | | — | | | | — | | | | 818 | |
| | | | |
Investment of Cash Collateral For Securities Loaned | | | — | | | | 72,557 | | | | — | | | | 72,557 | |
| | | | |
Total | | $ | 45,122,643 | | | $ | 36,413,194 | | | $ | — | | | $ | 81,535,837 | |
| | | | |
| | | | |
| Liabilities: | | | | | | | | | | | | | | | | |
| | | | |
Written options | | $ | 17,291 | | | $ | — | | | $ | — | | | $ | 17,291 | |
| | | | |
Total | | $ | 17,291 | | | $ | — | | | $ | — | | | $ | 17,291 | |
| | | | |
Notes to Financial Statements
| | | | | | | | | | | | | | | | |
| | | GLOBAL GROWTH AND INCOME FUND | |
| | | LEVEL 1 | | | LEVEL 2 | | | LEVEL 3 | | | TOTAL | |
| Assets: | | | | | | | | | | | | | | | | |
| | | | |
Convertible Bonds | | $ | — | | | $ | 35,262,492 | | | $ | — | | | $ | 35,262,492 | |
| | | | |
U.S. Government and Agency Securities | | | — | | | | 4,527,883 | | | | — | | | | 4,527,883 | |
| | | | |
Convertible Preferred Stocks | | | 8,409,997 | | | | — | | | | — | | | | 8,409,997 | |
| | | | |
Common Stocks U.S. | | | 49,569,366 | | | | — | | | | — | | | | 49,569,366 | |
| | | | |
Common Stocks Foreign | | | 3,498,528 | | | | 45,253,042 | | | | — | | | | 48,751,570 | |
| | | | |
Purchased options | | | 1,603,048 | | | | — | | | | — | | | | 1,603,048 | |
| | | | |
Short Term Investments | | | 749,335 | | | | — | | | | — | | | | 749,335 | |
| | | | |
Total | | $ | 63,830,274 | | | $ | 85,043,417 | | | $ | — | | | $ | 148,873,691 | |
| | | | |
| | | | |
| Liabilities: | | | | | | | | | | | | | | | | |
| | | | |
Written options | | $ | 18,645 | | | $ | — | | | $ | — | | | $ | 18,645 | |
| | | | |
Total | | $ | 18,645 | | | $ | — | | | $ | — | | | $ | 18,645 | |
| | | | |
| |
| | | TOTAL RETURN BOND FUND | |
| | | LEVEL 1 | | | LEVEL 2 | | | LEVEL 3 | | | TOTAL | |
| Assets: | | | | | | | | | | | | | | | | |
| | | | |
Corporate Bonds | | $ | — | | | $ | 25,374,426 | | | $ | — | | | $ | 25,374,426 | |
| | | | |
Bank Loans | | | — | | | | 1,784,201 | | | | — | | | | 1,784,201 | |
| | | | |
U.S. Government and Agency Securities | | | — | | | | 27,210,553 | | | | — | | | | 27,210,553 | |
| | | | |
Asset Backed Securities | | | — | | | | 3,634,365 | | | | — | | | | 3,634,365 | |
| | | | |
Short Term Investments | | | 3,486,864 | | | | — | | | | — | | | | 3,486,864 | |
| | | | |
Investment of Cash Collateral For Securities Loaned | | | — | | | | 4,728,925 | | | | — | | | | 4,728,925 | |
| | | | |
Total | | $ | 3,486,864 | | | $ | 62,732,470 | | | $ | — | | | $ | 66,219,334 | |
| | | | |
| |
| | | HIGH INCOME OPPORTUNITIES FUND | |
| | | LEVEL 1 | | | LEVEL 2 | | | LEVEL 3 | | | TOTAL | |
| Assets: | | | | | | | | | | | | | | | | |
| | | | |
Corporate Bonds | | $ | — | | | $ | 34,802,991 | | | $ | — | | | $ | 34,802,991 | |
| | | | |
Convertible Bonds | | | — | | | | 461,137 | | | | — | | | | 461,137 | |
| | | | |
Bank Loans | | | — | | | | 4,921,506 | | | | — | | | | 4,921,506 | |
| | | | |
Convertible Preferred Stocks | | | 333,149 | | | | — | | | | — | | | | 333,149 | |
| | | | |
Common Stocks U.S. | | | 634,063 | | | | — | | | | — | | | | 634,063 | |
| | | | |
Short Term Investments | | | 2,991,887 | | | | — | | | | — | | | | 2,991,887 | |
| | | | |
Investment of Cash Collateral For Securities Loaned | | | — | | | | 3,959,174 | | | | — | | | | 3,959,174 | |
| | | | |
Total | | $ | 3,959,099 | | | $ | 44,144,808 | | | $ | — | | | $ | 48,103,907 | |
| | | | |
| | | | |
| 188 | | CALAMOS OPEN-END FAMILY OF FUNDS ANNUAL REPORT | | |
Notes to Financial Statements
| | | | | | | | | | | | | | | | |
| | | SHORT-TERM BOND FUND | |
| | | LEVEL 1 | | | LEVEL 2 | | | LEVEL 3 | | | TOTAL | |
| Assets: | | | | | | | | | | | | | | | | |
| | | | |
Corporate Bonds | | $ | — | | | $ | 155,305,105 | | | $ | — | | | $ | 155,305,105 | |
| | | | |
Convertible Bonds | | | — | | | | 411,810 | | | | — | | | | 411,810 | |
| | | | |
U.S. Government and Agency Securities | | | — | | | | 15,273,721 | | | | — | | | | 15,273,721 | |
| | | | |
Bank Loans | | | — | | | | 9,136,749 | | | | — | | | | 9,136,749 | |
| | | | |
Asset Backed Securities | | | — | | | | 32,053,661 | | | | — | | | | 32,053,661 | |
| | | | |
Residential Mortgage Backed Securities | | | — | | | | 3,744,168 | | | | — | | | | 3,744,168 | |
| | | | |
Municipal Obligations | | | — | | | | 644,808 | | | | — | | | | 644,808 | |
| | | | |
Short Term Investments | | | 2,752,087 | | | | — | | | | — | | | | 2,752,087 | |
| | | | |
Investment of Cash Collateral For Securities Loaned | | | — | | | | 6,579,080 | | | | — | | | | 6,579,080 | |
| | | | |
Total | | $ | 2,752,087 | | | $ | 223,149,102 | | | $ | — | | | $ | 225,901,189 | |
| | | | |
| | | | |
| Liabilities: | | | | | | | | | | | | | | | | |
| | | | |
Futures Contracts | | $ | 5,363 | | | $ | — | | | $ | — | | | $ | 5,363 | |
| | | | |
Total | | $ | 5,363 | | | $ | — | | | $ | — | | | $ | 5,363 | |
| | | | |
Note 9 – Capital Share Transactions
The following table summarizes the activity in capital shares of the Funds for the Year ended October 31, 2019:
| | | | | | | | | | | | | | | | | | | | | | | | |
| | | MARKET NEUTRAL INCOME FUND | | | HEDGED EQUITY FUND | | | PHINEUS LONG/SHORT FUND | |
| Class A | | Shares | | | Dollars | | | Shares | | | Dollars | | | Shares | | | Dollars | |
| Shares sold | | | 29,680,352 | | | $ | 393,434,323 | | | | 925,177 | | | $ | 10,546,955 | | | | 2,254,270 | | | $ | 26,483,229 | |
| | | | | | |
| Shares issued as reinvestment of distributions | | | 2,440,956 | | | | 31,487,658 | | | | 13,843 | | | | 150,877 | | | | 325,291 | | | | 3,636,756 | |
| | | | | | |
| Less shares redeemed | | | (31,909,968 | ) | | | (423,741,284 | ) | | | (512,821 | ) | | | (5,874,811 | ) | | | (4,940,696 | ) | | | (57,831,780 | ) |
| | | | |
| Net increase (decrease) | | | 211,340 | | | $ | 1,180,697 | | | | 426,199 | | | $ | 4,823,021 | | | | (2,361,135 | ) | | $ | (27,711,795 | ) |
| | | | |
| | | | | | |
| Class C | | Shares | | | Dollars | | | Shares | | | Dollars | | | Shares | | | Dollars | |
| Shares sold | | | 5,630,014 | | | $ | 75,990,349 | | | | 210,465 | | | $ | 2,373,495 | | | | 566,072 | | | $ | 6,503,222 | |
| | | | | | |
| Shares issued as reinvestment of distributions | | | 747,645 | | | | 9,756,404 | | | | 1,761 | | | | 18,780 | | | | 170,003 | | | | 1,859,837 | |
| | | | | | |
| Less shares redeemed | | | (9,405,506 | ) | | | (126,560,124 | ) | | | (83,016 | ) | | | (944,143 | ) | | | (1,750,780 | ) | | | (20,083,924 | ) |
| | | | |
| Net increase (decrease) | | | (3,027,847 | ) | | $ | (40,813,371 | ) | | | 129,210 | | | $ | 1,448,132 | | | | (1,014,705 | ) | | $ | (11,720,865 | ) |
| | | | |
| | | | | | |
| Class I | | Shares | | | Dollars | | | Shares | | | Dollars | | | Shares | | | Dollars | |
| Shares sold | | | 271,275,266 | | | $ | 3,554,451,162 | | | | 14,314,809 | | | $ | 163,261,984 | | | | 26,643,604 | | | $ | 315,706,970 | |
| | | | | | |
| Shares issued as reinvestment of distributions | | | 19,385,503 | | | | 247,263,382 | | | | 341,162 | | | | 3,725,247 | | | | 2,860,728 | | | | 32,211,796 | |
| | | | | | |
| Less shares redeemed | | | (134,555,579 | ) | | | (1,756,564,721 | ) | | | (3,761,065 | ) | | | (42,830,646 | ) | | | (53,808,028 | ) | | | (636,263,810 | ) |
| | | | |
| Net increase (decrease) | | | 156,105,190 | | | $ | 2,045,149,823 | | | | 10,894,906 | | | $ | 124,156,585 | | | | (24,303,696 | ) | | $ | (288,345,044 | ) |
| | | | |
| | | | | | |
| Class R6 | | Shares | | | Dollars | | | Shares | | | Dollars | | | Shares | | | Dollars | |
| Shares sold | | | — | | | $ | — | | | | — | | | $ | — | | | | — | | | $ | — | |
| | | | | | |
| Shares issued as reinvestment of distributions | | | — | | | | — | | | | — | | | | — | | | | — | | | | — | |
| | | | | | |
| Less shares redeemed | | | — | | | | — | | | | — | | | | — | | | | — | | | | — | |
| | | | |
| Net increase (decrease) | | | — | | | $ | — | | | | — | | | $ | — | | | | — | | | $ | — | |
| | | | |
Notes to Financial Statements
| | | | | | | | | | | | | | | | |
| | | CONVERTIBLE FUND | | | GLOBAL CONVERTIBLE FUND | |
| Class A | | Shares | | | Dollars | | | Shares | | | Dollars | |
| Shares sold | | | 6,464,165 | | | $ | 109,061,464 | | | | 224,720 | | | $ | 2,390,163 | |
| | | | |
| Shares issued as reinvestment of distributions | | | 1,415,747 | | | | 21,910,099 | | | | 52,472 | | | | 528,310 | |
| | | | |
| Less shares redeemed | | | (5,432,904 | ) | | | (92,274,164 | ) | | | (499,335 | ) | | | (5,383,927 | ) |
| | | | |
| Net increase (decrease) | | | 2,447,008 | | | $ | 38,697,399 | | | | (222,143 | ) | | $ | (2,465,454 | ) |
| | | | |
| | | | |
| Class C | | Shares | | | Dollars | | | Shares | | | Dollars | |
| Shares sold | | | 744,331 | | | $ | 12,386,248 | | | | 39,365 | | | $ | 411,226 | |
| | | | |
| Shares issued as reinvestment of distributions | | | 866,407 | | | | 13,169,660 | | | | 16,672 | | | | 165,169 | |
| | | | |
| Less shares redeemed | | | (5,557,821 | ) | | | (92,761,975 | ) | | | (107,257 | ) | | | (1,138,486 | ) |
| | | | |
| Net increase (decrease) | | | (3,947,083 | ) | | $ | (67,206,067 | ) | | | (51,220 | ) | | $ | (562,091 | ) |
| | | | |
| | | | |
| Class I | | Shares | | | Dollars | | | Shares | | | Dollars | |
| Shares sold | | | 19,705,724 | | | $ | 294,220,340 | | | | 4,110,369 | | | $ | 43,882,156 | |
| | | | |
| Shares issued as reinvestment of distributions | | | 2,759,584 | | | | 37,785,812 | | | | 610,630 | | | | 6,166,716 | |
| | | | |
| Less shares redeemed | | | (10,664,606 | ) | | | (159,681,159 | ) | | | (5,045,984 | ) | | | (53,026,740 | ) |
| | | | |
| Net increase (decrease) | | | 11,800,702 | | | $ | 172,324,993 | | | | (324,985 | ) | | $ | (2,977,868 | ) |
| | | | |
| | | | |
| Class R6(a) | | Shares | | | Dollars | | | Shares | | | Dollars | |
| Shares sold | | | — | | | $ | — | | | | — | | | $ | — | |
| | | | |
| Shares issued as reinvestment of distributions | | | — | | | | — | | | | — | | | | — | |
| | | | |
| Less shares redeemed | | | — | | | | — | | | | — | | | | — | |
| | | | |
| Net increase (decrease) | | | — | | | $ | — | | | | — | | | $ | — | |
| | | | |
| | | | |
| 190 | | CALAMOS OPEN-END FAMILY OF FUNDS ANNUAL REPORT | | |
Notes to Financial Statements
| | | | | | | | | | | | | | | | | | | | | | | | | | | | | | | | |
| | | CALAMOS TIMPANI
SMALL CAP
GROWTH FUND
MAY 31, 2019
THROUGH
OCTOBER 31, 2019 | | | CALAMOS TIMPANI
SMALL CAP
GROWTH FUND
JULY 1, 2018
THROUGH
MAY 31, 2019* | | | TIMPANI SMID
GROWTH FUND(b) | | | GROWTH FUND | |
| Class A | | Shares | | | Dollars | | | Shares | | | Dollars | | | Shares | | | Dollars | | | Shares | | | Dollars | |
| Shares sold | | | 69,544 | | | $ | 1,650,315 | | | | 44,877 | | | $ | 1,083,466 | | | | 1,000 | | | $ | 10,000 | | | | 9,587,177 | | | $ | 284,967,966 | |
| | | | | | | | |
| Shares issued as reinvestment of distributions | | | — | | | | — | | | | 14,580 | | | | 286,931 | | | | — | | | | — | | | | 3,896,550 | | | | 99,712,712 | |
| | | | | | | | |
| Less shares redeemed | | | (9,348 | ) | | | (215,625 | ) | | | (48,199 | ) | | | (1,178,916 | ) | | | — | | | | — | | | | (6,077,197 | ) | | | (187,586,969 | ) |
| | | | |
| Net increase (decrease) | | | 60,196 | | | $ | 1,434,690 | | | | 11,258 | | | $ | 191,481 | | | | 1,000 | | | $ | 10,000 | | | | 7,406,530 | | | $ | 197,093,709 | |
| | | | |
| | | | | | | | |
| Class C | | Shares | | | Dollars | | | Shares | | | Dollars | | | Shares | | | Dollars | | | Shares | | | Dollars | |
| Shares sold | | | — | | | $ | — | | | | — | | | $ | — | | | | — | | | $ | — | | | | 323,807 | | | $ | 5,218,792 | |
| | | | | | | | |
| Shares issued as reinvestment of distributions | | | — | | | | — | | | | — | | | | — | | | | — | | | | — | | | | 4,480,634 | | | | 65,327,650 | |
| | | | | | | | |
| Less shares redeemed | | | — | | | | — | | | | — | | | | — | | | | — | | | | — | | | | (17,750,289 | ) | | | (302,227,922 | ) |
| | | | |
| Net increase (decrease) | | | — | | | $ | — | | | | — | | | $ | — | | | | — | | | $ | — | | | | (12,945,848 | ) | | $ | (231,681,480 | ) |
| | | | |
| | | | | | | | |
| Class I | | Shares | | | Dollars | | | Shares | | | Dollars | | | Shares | | | Dollars | | | Shares | | | Dollars | |
| Shares sold | | | 447,393 | | | $ | 10,684,843 | | | | 612,221 | | | $ | 14,843,109 | | | | 1,036,544 | | | $ | 10,360,000 | | | | 838,179 | | | $ | 35,111,918 | |
| | | | | | | | |
| Shares issued as reinvestment of distributions | | | — | | | | — | | | | 179,215 | | | | 3,600,415 | | | | — | | | | — | | | | 776,327 | | | | 27,140,373 | |
| | | | | | | | |
| Less shares redeemed | | | (261,577 | ) | | | (6,205,215 | ) | | | (525,834 | ) | | | (12,408,640 | ) | | | — | | | | — | | | | (1,749,854 | ) | | | (72,895,718 | ) |
| | | | |
| Net increase (decrease) | | | 185,816 | | | $ | 4,479,628 | | | | 265,602 | | | $ | 6,034,884 | | | | 1,036,544 | | | $ | 10,360,000 | | | | (135,348 | ) | | $ | (10,643,427 | ) |
| | | | |
| | | | | | | | |
| Class R6(a) | | Shares | | | Dollars | | | Shares | | | Dollars | | | Shares | | | Dollars | | | Shares | | | Dollars | |
| Shares sold | | | 46,065 | | | $ | 1,166,355 | | | | — | | | $ | — | | | | 1,000 | | | $ | 10,000 | | | | — | | | $ | — | |
| | | | | | | | |
| Shares issued as reinvestment of distributions | | | — | | | | — | | | | — | | | | — | | | | — | | | | — | | | | — | | | | — | |
| | | | | | | | |
| Less shares redeemed | | | — | | | | — | | | | — | | | | — | | | | — | | | | — | | | | — | | | | — | |
| | | | |
| Net increase (decrease) | | | 46,065 | | | $ | 1,166,355 | | | | — | | | $ | — | | | | 1,000 | | | $ | 10,000 | | | | — | | | $ | — | |
| | | | |
| * | Activity shown includes activity of the Predecessor Fund prior to May 31, 2019. The Class I activity prior to May 31, 2019 includes the Predecessor Fund’s Service and Institutional share classes that were reorganized into Class I. |
| (a) | Timpani Small Cap Growth Fund Class R6 shares commenced operations on June 1, 2019. |
| (b) | Timpani SMID Growth Fund commenced operations on July 31, 2019. |
Notes to Financial Statements
| | | | | | | | | | | | | | | | | | | | | | | | | | | | | | | | |
| | | GROWTH AND INCOME FUND | | | DIVIDEND GROWTH FUND | | | OPPORTUNISTIC VALUE FUND | | | INTERNATIONAL GROWTH FUND | |
| Class A | | Shares | | | Dollars | | | Shares | | | Dollars | | | Shares | | | Dollars | | | Shares | | | Dollars | |
| Shares sold | | | 12,497,710 | | | $ | 391,728,042 | | | | 101,755 | | | $ | 1,250,779 | | | | 231,417 | | | $ | 3,076,083 | | | | 929,035 | | | $ | 15,634,398 | |
| | | | | | | | |
| Shares issued as reinvestment of distributions | | | 1,925,650 | | | | 55,053,122 | | | | 9,354 | | | | 102,817 | | | | 111,969 | | | | 1,322,359 | | | | 362,648 | | | | 5,305,535 | |
| | | | | | | | |
| Less shares redeemed | | | (6,230,340 | ) | | | (197,413,390 | ) | | | (29,247 | ) | | | (358,368 | ) | | | (932,810 | ) | | | (14,108,734 | ) | | | (1,581,022 | ) | | | (26,727,598 | ) |
| | | | |
| Net increase (decrease) | | | 8,193,020 | | | $ | 249,367,774 | | | | 81,862 | | | $ | 995,228 | | | | (589,424 | ) | | $ | (9,710,292 | ) | | | (289,339 | ) | | $ | (5,787,665 | ) |
| | | | |
| | | | | | | | |
| Class C | | Shares | | | Dollars | | | Shares | | | Dollars | | | Shares | | | Dollars | | | Shares | | | Dollars | |
| Shares sold | | | 636,780 | | | $ | 19,754,168 | | | | 32,760 | | | $ | 358,846 | | | | 270,582 | | | $ | 3,672,986 | | | | 45,648 | | | $ | 628,378 | |
| | | | | | | | |
| Shares issued as reinvestment of distributions | | | 1,054,355 | | | | 29,744,060 | | | | 3,605 | | | | 38,283 | | | | 119,355 | | | | 1,232,939 | | | | 171,935 | | | | 2,240,319 | |
| | | | | | | | |
| Less shares redeemed | | | (13,016,220 | ) | | | (409,666,760 | ) | | | (71,003 | ) | | | (857,004 | ) | | | (276,544 | ) | | | (3,194,104 | ) | | | (898,962 | ) | | | (13,296,115 | ) |
| | | | |
| Net increase (decrease) | | | (11,325,085 | ) | | $ | (360,168,532 | ) | | | (34,638 | ) | | $ | (459,875 | ) | | | 113,393 | | | $ | 1,711,821 | | | | (681,379 | ) | | $ | (10,427,418 | ) |
| | | | |
| | | | | | | | |
| Class I | | Shares | | | Dollars | | | Shares | | | Dollars | | | Shares | | | Dollars | | | Shares | | | Dollars | |
| Shares sold | | | 6,855,294 | | | $ | 204,430,740 | | | | 232,224 | | | $ | 2,874,396 | | | | 737,982 | | | $ | 11,740,442 | | | | 1,334,479 | | | $ | 22,380,624 | |
| | | | | | | | |
| Shares issued as reinvestment of distributions | | | 1,861,051 | | | | 50,896,933 | | | | 81,633 | | | | 892,276 | | | | 383,272 | | | | 4,645,250 | | | | 1,006,590 | | | | 15,149,175 | |
| | | | | | | | |
| Less shares redeemed | | | (6,328,452 | ) | | | (188,989,797 | ) | | | (1,011,497 | ) | | | (12,118,417 | ) | | | (564,747 | ) | | | (7,744,938 | ) | | | (3,344,240 | ) | | | (57,605,298 | ) |
| | | | |
| Net increase (decrease) | | | 2,387,893 | | | $ | 66,337,876 | | | | (697,640 | ) | | $ | (8,351,745 | ) | | | 556,507 | | | $ | 8,640,754 | | | | (1,003,171 | ) | | $ | (20,075,499 | ) |
| | | | |
| | | | | | | | |
| Class R6 | | Shares | | | Dollars | | | Shares | | | Dollars | | | Shares | | | Dollars | | | Shares | | | Dollars | |
| Shares sold | | | — | | | $ | — | | | | — | | | $ | — | | | | — | | | $ | — | | | | 455,301 | | | $ | 7,480,147 | |
| | | | | | | | |
| Shares issued as reinvestment of distributions | | | — | | | | — | | | | — | | | | — | | | | — | | | | — | | | | 160 | | | | 2,420 | |
| | | | | | | | |
| Less shares redeemed | | | — | | | | — | | | | — | | | | — | | | | — | | | | — | | | | (56,933 | ) | | | (1,031,314 | ) |
| | | | |
| Net increase (decrease) | | | — | | | $ | — | | | | — | | | $ | — | | | | — | | | $ | — | | | | 398,528 | | | $ | 6,451,253 | |
| | | | |
| | | | |
| 192 | | CALAMOS OPEN-END FAMILY OF FUNDS ANNUAL REPORT | | |
Notes to Financial Statements
| | | | | | | | | | | | | | | | | | | | | | | | |
| | | EVOLVING WORLD
GROWTH FUND | | | GLOBAL EQUITY FUND | | | GLOBAL GROWTH AND INCOME FUND | |
| Class A | | Shares | | | Dollars | | | Shares | | | Dollars | | | Shares | | | Dollars | |
| Shares sold | | | 384,571 | | | $ | 5,201,193 | | | | 577,546 | | | $ | 6,138,141 | | | | 4,520,918 | | | $ | 37,428,463 | |
| | | | | | |
| Shares issued as reinvestment of distributions | | | — | | | | — | | | | 421,580 | | | | 4,009,226 | | | | 741,067 | | | | 5,601,253 | |
| | | | | | |
| Less shares redeemed | | | (1,154,814 | ) | | | (15,562,395 | ) | | | (1,280,011 | ) | | | (14,645,366 | ) | | | (2,518,918 | ) | | | (21,112,416 | ) |
| | | | |
| Net increase (decrease) | | | (770,243 | ) | | $ | (10,361,202 | ) | | | (280,885 | ) | | $ | (4,497,999 | ) | | | 2,743,067 | | | $ | 21,917,300 | |
| | | | |
| | | | | | |
| Class C | | Shares | | | Dollars | | | Shares | | | Dollars | | | Shares | | | Dollars | |
| Shares sold | | | 53,119 | | | $ | 652,490 | | | | 203,747 | | | $ | 2,231,301 | | | | 392,744 | | | $ | 2,622,942 | |
| | | | | | |
| Shares issued as reinvestment of distributions | | | — | | | | — | | | | 289,494 | | | | 2,417,271 | | | | 832,154 | | | | 5,492,212 | |
| | | | | | |
| Less shares redeemed | | | (535,243 | ) | | | (6,774,470 | ) | | | (586,685 | ) | | | (5,706,218 | ) | | | (6,069,077 | ) | | | (44,055,702 | ) |
| | | | |
| Net increase (decrease) | | | (482,124 | ) | | $ | (6,121,980 | ) | | | (93,444 | ) | | $ | (1,057,646 | ) | | | (4,844,179 | ) | | $ | (35,940,548 | ) |
| | | | |
| | | | | | |
| Class I | | Shares | | | Dollars | | | Shares | | | Dollars | | | Shares | | | Dollars | |
| Shares sold | | | 1,175,634 | | | $ | 15,961,982 | | | | 402,501 | | | $ | 4,628,884 | | | | 1,273,631 | | | $ | 10,798,427 | |
| | | | | | |
| Shares issued as reinvestment of distributions | | | — | | | | — | | | | 1,073,542 | | | | 10,520,717 | | | | 782,448 | | | | 6,100,697 | |
| | | | | | |
| Less shares redeemed | | | (4,778,472 | ) | | | (64,713,668 | ) | | | (1,267,362 | ) | | | (15,267,035 | ) | | | (3,833,527 | ) | | | (33,224,249 | ) |
| | | | |
| Net increase (decrease) | | | (3,602,838 | ) | | $ | (48,751,686 | ) | | | 208,681 | �� | | $ | (117,434 | ) | | | (1,777,448 | ) | | $ | (16,325,125 | ) |
| | | | |
| | | | | | |
| Class R6 | | Shares | | | Dollars | | | Shares | | | Dollars | | | Shares | | | Dollars | |
| Shares sold | | | — | | | $ | — | | | | — | | | $ | — | | | | — | | | $ | — | |
| | | | | | |
| Shares issued as reinvestment of distributions | | | — | | | | — | | | | — | | | | — | | | | — | | | | — | |
| | | | | | |
| Less shares redeemed | | | — | | | | — | | | | — | | | | — | | | | — | | | | — | |
| | | | |
| Net increase (decrease) | | | — | | | $ | — | | | | — | | | $ | — | | | | — | | | $ | — | |
| | | | |
Notes to Financial Statements
| | | | | | | | | | | | | | | | | | | | | | | | |
| | | TOTAL RETURN BOND FUND | | | HIGH INCOME
OPPORTUNITIES FUND | | | SHORT-TERM BOND FUND | |
| Class A | | Shares | | | Dollars | | | Shares | | | Dollars | | | Shares | | | Dollars | |
| Shares sold | | | 997,327 | | | $ | 10,048,728 | | | | 921,595 | | | $ | 7,738,365 | | | | 62,838 | | | $ | 634,792 | |
| | | | | | |
| Shares issued as reinvestment of distributions | | | 43,240 | | | | 442,703 | | | | 228,497 | | | | 1,902,920 | | | | 721 | | | | 7,319 | |
| | | | | | |
| Less shares redeemed | | | (643,180 | ) | | | (6,480,705 | ) | | | (791,789 | ) | | | (6,569,707 | ) | | | (7,105 | ) | | | (72,160 | ) |
| | | | |
| Net increase (decrease) | | | 397,387 | | | $ | 4,010,726 | | | | 358,303 | | | $ | 3,071,578 | | | | 56,454 | | | $ | 569,951 | |
| | | | |
| | | | | | |
| Class C | | Shares | | | Dollars | | | Shares | | | Dollars | | | Shares | | | Dollars | |
| Shares sold | | | 166,274 | | | $ | 1,656,441 | | | | 47,632 | | | $ | 420,946 | | | | — | | | $ | — | |
| | | | | | |
| Shares issued as reinvestment of distributions | | | 7,828 | | | | 79,230 | | | | 27,606 | | | | 240,276 | | | | — | | | | — | |
| | | | | | |
| Less shares redeemed | | | (549,775 | ) | | | (5,533,304 | ) | | | (968,833 | ) | | | (8,562,524 | ) | | | — | | | | — | |
| | | | |
| Net increase (decrease) | | | (375,673 | ) | | $ | (3,797,633 | ) | | | (893,595 | ) | | $ | (7,901,302 | ) | | | — | | | $ | — | |
| | | | |
| | | | | | |
| Class I | | Shares | | | Dollars | | | Shares | | | Dollars | | | Shares | | | Dollars | |
| Shares sold | | | 1,774,798 | | | $ | 18,474,632 | | | | 206,491 | | | $ | 1,734,024 | | | | 19,799,992 | | | $ | 198,535,221 | |
| | | | | | |
| Shares issued as reinvestment of distributions | | | 79,328 | | | | 810,296 | | | | 50,266 | | | | 418,310 | | | | 86,089 | | | | 866,912 | |
| | | | | | |
| Less shares redeemed | | | (1,831,206 | ) | | | (18,574,369 | ) | | | (336,941 | ) | | | (2,812,781 | ) | | | (70,159 | ) | | | (713,694 | ) |
| | | | |
| Net increase (decrease) | | | 22,920 | | | $ | 710,559 | | | | (80,184 | ) | | $ | (660,447 | ) | | | 19,815,922 | | | $ | 198,688,439 | |
| | | | |
| | | | | | |
| Class R6 | | Shares | | | Dollars | | | Shares | | | Dollars | | | Shares | | | Dollars | |
| Shares sold | | | — | | | $ | — | | | | — | | | $ | — | | | | — | | | $ | — | |
| | | | | | |
| Shares issued as reinvestment of distributions | | | — | | | | — | | | | — | | | | — | | | | — | | | | — | |
| | | | | | |
| Less shares redeemed | | | — | | | | — | | | | — | | | | — | | | | — | | | | — | |
| | | | |
| Net increase (decrease) | | | — | | | $ | — | | | | — | | | $ | — | | | | — | | | $ | — | |
| | | | |
| | | | |
| 194 | | CALAMOS OPEN-END FAMILY OF FUNDS ANNUAL REPORT | | |
Notes to Financial Statements
The following table summarizes the activity in capital shares of the Funds for the year or period ended October 31, 2018:
| | | | | | | | | | | | | | | | | | | | | | | | |
| | | MARKET NEUTRAL INCOME FUND | | | HEDGED EQUITY INCOME FUND | | | PHINEUS LONG/SHORT FUND | |
| Class A | | Shares | | | Dollars | | | Shares | | | Dollars | | | Shares | | | Dollars | |
| Shares sold | | | 23,304,729 | | | $ | 313,766,420 | | | | 3,026,723 | | | $ | 34,707,585 | | | | 6,488,594 | | | $ | 81,785,520 | |
| | | | | | |
| Shares issued as reinvestment of distributions | | | 1,389,035 | | | | 18,438,255 | | | | 8,436 | | | | 98,050 | | | | 77,219 | | | | 962,149 | |
| | | | | | |
| Shares converted from class R | | | 456,993 | | | | 6,105,427 | | | | — | | | | — | | | | — | | | | — | |
| | | | | | |
| Less shares redeemed | | | (20,993,918 | ) | | | (282,581,777 | ) | | | (2,677,841 | ) | | | (30,489,455 | ) | | | (3,035,625 | ) | | | (38,072,768 | ) |
| | | | |
| Net increase (decrease) | | | 4,156,839 | | | $ | 55,728,325 | | | | 357,318 | | | $ | 4,316,180 | | | | 3,530,188 | | | $ | 44,674,901 | |
| | | | |
| | | | | | |
| Class C | | Shares | | | Dollars | | | Shares | | | Dollars | | | Shares | | | Dollars | |
| Shares sold | | | 5,044,232 | | | $ | 69,003,246 | | | | 41,040 | | | $ | 471,929 | | | | 2,677,188 | | | $ | 33,309,114 | |
| | | | | | |
| Shares issued as reinvestment of distributions | | | 410,720 | | | | 5,529,317 | | | | 8 | | | | 87 | | | | 32,298 | | | | 397,268 | |
| | | | | | |
| Less shares redeemed | | | (4,056,839 | ) | | | (55,404,303 | ) | | | (2,778 | ) | | | (30,004 | ) | | | (704,983 | ) | | | (8,639,555 | ) |
| | | | |
| Net increase (decrease) | | | 1,398,113 | | | $ | 19,128,260 | | | | 38,270 | | | $ | 442,012 | | | | 2,004,503 | | | $ | 25,066,827 | |
| | | | |
| | | | | | |
| Class I | | Shares | | | Dollars | | | Shares | | | Dollars | | | Shares | | | Dollars | |
| Shares sold | | | 201,073,177 | | | $ | 2,677,721,119 | | | | 7,299,401 | | | $ | 84,667,799 | | | | 72,928,696 | | | $ | 926,283,927 | |
| | | | | | |
| Shares issued as reinvestment of distributions | | | 8,642,306 | | | | 113,598,391 | | | | 16,925 | | | | 196,116 | | | | 392,138 | | | | 4,909,564 | |
| | | | | | |
| Less shares redeemed | | | (67,773,139 | ) | | | (900,807,963 | ) | | | (414,839 | ) | | | (4,747,085 | ) | | | (19,452,058 | ) | | | (243,175,678 | ) |
| | | | |
| Net increase (decrease) | | | 141,942,344 | | | $ | 1,890,511,547 | | | | 6,901,487 | | | $ | 80,116,830 | | | | 53,868,776 | | | $ | 688,017,813 | |
| | | | |
| | | | | | |
| Class R(a) | | Shares | | | Dollars | | | Shares | | | Dollars | | | Shares | | | Dollars | |
| Shares sold | | | 25,000 | | | $ | 332,597 | | | | — | | | $ | — | | | | — | | | $ | — | |
| | | | | | |
| Shares issued as reinvestment of distributions | | | 7,310 | | | | 96,131 | | | | — | | | | — | | | | — | | | | — | |
| | | | | | |
| Less shares redeemed | | | (58,819 | ) | | | (784,131 | ) | | | — | | | | — | | | | — | | | | — | |
| | | | | | |
| Shares converted to class A | | | (458,875 | ) | | | (6,105,427 | ) | | | — | | | | — | | | | — | | | | — | |
| | | | |
| Net increase (decrease) | | | (485,384 | ) | | $ | (6,460,830 | ) | | | — | | | $ | — | | | | — | | | $ | — | |
| | | | |
| | | | | | |
| Class R6 | | Shares | | | Dollars | | | Shares | | | Dollars | | | Shares | | | Dollars | |
| Shares sold | | | — | | | $ | — | | | | — | | | $ | — | | | | — | | | $ | — | |
| | | | | | |
| Shares issued as reinvestment of distributions | | | — | | | | — | | | | — | | | | — | | | | — | | | | — | |
| | | | | | |
| Less shares redeemed | | | — | | | | — | | | | — | | | | — | | | | — | | | | — | |
| | | | |
| Net increase (decrease) | | | — | | | $ | — | | | | — | | | $ | — | | | | — | | | $ | — | |
| | | | |
| (a) | Class R shares were converted into Class A shares at the close of business on February 22, 2018. |
Notes to Financial Statements
| | | | | | | | | | | | | | | | | | | | | | | | | | | | | | | | |
| | | CONVERTIBLE FUND | | | GLOBAL CONVERTIBLE FUND | | | CALAMOS TIMPANI
SMALL CAP
GROWTH FUND* | | | GROWTH FUND | |
| Class A | | Shares | | | Dollars | | | Shares | | | Dollars | | | Shares | | | Dollars | | | Shares | | | Dollars | |
| Shares sold | | | 2,490,392 | | | $ | 46,027,206 | | | | 769,987 | | | $ | 8,556,786 | | | | 65,597 | | | $ | 1,462,983 | | | | 1,045,901 | | | $ | 35,392,030 | |
| | | | | | | | |
| Shares issued as reinvestment of distributions | | | 445,294 | | | | 7,973,633 | | | | 44,303 | | | | 483,005 | | | | — | | | | — | | | | 3,302,766 | | | | 106,811,442 | |
| | | | | | | | |
| Shares converted from class R | | | 94,626 | | | | 1,692,856 | | | | 743 | | | | 8,253 | | | | — | | | | — | | | | 160,063 | | | | 5,406,928 | |
| | | | | | | | |
| Less shares redeemed | | | (3,539,359 | ) | | | (65,339,068 | ) | | | (911,638 | ) | | | (10,154,591 | ) | | | (43,464 | ) | | | (897,610 | ) | | | (6,039,038 | ) | | | (208,488,738 | ) |
| | | | |
| Net increase (decrease) | | | (509,047 | ) | | $ | (9,645,373 | ) | | | (96,605 | ) | | $ | (1,106,547 | ) | | | 22,133 | | | $ | 565,373 | | | | (1,530,308 | ) | | $ | (60,878,338 | ) |
| | | | |
| | | | | | | | |
| Class C | | Shares | | | Dollars | | | Shares | | | Dollars | | | Shares | | | Dollars | | | Shares | | | Dollars | |
| Shares sold | | | 451,525 | | | $ | 8,239,481 | | | | 147,136 | | | $ | 1,617,477 | | | | — | | | $ | — | | | | 239,855 | | | $ | 5,182,517 | |
| | | | | | | | |
| Shares issued as reinvestment of distributions | | | 263,210 | | | | 4,631,349 | | | | 8,538 | | | | 91,739 | | | | — | | | | — | | | | 3,338,958 | | | | 68,882,701 | |
| | | | | | | | |
| Less shares redeemed | | | (1,653,755 | ) | | | (30,141,422 | ) | | | (51,663 | ) | | | (566,118 | ) | | | — | | | | — | | | | (4,283,795 | ) | | | (95,076,494 | ) |
| | | | |
| Net increase (decrease) | | | (939,020 | ) | | $ | (17,270,592 | ) | | | 104,011 | | | $ | 1,143,098 | | | | — | | | $ | — | | | | (704,982 | ) | | $ | (21,011,276 | ) |
| | | | |
| | | | | | | | |
| Class I | | Shares | | | Dollars | | | Shares | | | Dollars | | | Shares(a) | | | Dollars(a) | | | Shares | | | Dollars | |
| Shares sold | | | 7,786,551 | | | $ | 129,978,184 | | | | 5,534,311 | | | $ | 61,616,069 | | | | 890,483 | | | $ | 19,756,104 | | | | 759,645 | | | $ | 34,701,111 | |
| | | | | | | | |
| Shares issued as reinvestment of distributions | | | 716,667 | | | | 11,544,487 | | | | 357,579 | | | | 3,907,030 | | | | — | | | | — | | | | 658,057 | | | | 27,862,157 | |
| | | | | | | | |
| Less shares redeemed | | | (5,674,347 | ) | | | (93,339,101 | ) | | | (2,791,104 | ) | | | (30,872,234 | ) | | | (499,438 | ) | | | (10,829,761 | ) | | | (1,597,541 | ) | | | (72,616,037 | ) |
| | | | |
| Net increase (decrease) | | | 2,828,871 | | | $ | 48,183,570 | | | | 3,100,786 | | | $ | 34,650,865 | | | | 391,045 | | | $ | 8,926,343 | | | | (179,839 | ) | | $ | (10,052,769 | ) |
| | | | |
| | | | | | | | |
| Class R(b) | | Shares | | | Dollars | | | Shares | | | Dollars | | | Shares | | | Dollars | | | Shares | | | Dollars | |
| Shares sold | | | 2,804 | | | $ | 50,132 | | | | — | | | $ | — | | | | — | | | $ | — | | | | 14,470 | | | $ | 457,344 | |
| | | | | | | | |
| Shares issued as reinvestment of distributions | | | 2,260 | | | | 39,597 | | | | 23 | | | | 245 | | | | — | | | | — | | | | 19,006 | | | | 574,749 | |
| | | | | | | | |
| Less shares redeemed | | | (6,421 | ) | | | (115,787 | ) | | | — | | | | — | | | | — | | | | — | | | | (21,840 | ) | | | (702,726 | ) |
| | | | | | | | |
| Shares converted to class A | | | (95,040 | ) | | | (1,692,856 | ) | | | (747 | ) | | | (8,253 | ) | | | — | | | | — | | | | (171,252 | ) | | | (5,406,928 | ) |
| | | | |
| Net increase (decrease) | | | (96,397 | ) | | $ | (1,718,914 | ) | | | (724 | ) | | $ | (8,008 | ) | | | — | | | $ | — | | | | (159,616 | ) | | $ | (5,077,561 | ) |
| | | | |
| | | | | | | | |
| Class R6 | | Shares | | | Dollars | | | Shares | | | Dollars | | | Shares | | | Dollars | | | Shares | | | Dollars | |
| Shares sold | | | — | | | $ | — | | | | — | | | $ | — | | | | | | | $ | | | | | — | | | $ | — | |
| | | | | | | | |
| Shares issued as reinvestment of distributions | | | — | | | | — | | | | — | | | | — | | | | | | | | | | | | — | | | | — | |
| | | | | | | | |
| Less shares redeemed | | | — | | | | — | | | | — | | | | — | | | | | | | | | | | | — | | | | — | |
| | | | |
| Net increase (decrease) | | | — | | | $ | — | | | | — | | | $ | — | | | | | | | $ | | | | | — | | | $ | — | |
| | | | |
| * | Activity for the period shown is for the Predecessor Fund for the year ended June 30, 2018. |
| (a) | Activity shown is the combination of the Predecessor Service Class and Institutional Class reorganized into Class I of the Fund. |
| (b) | Class R shares were converted into Class A shares at the close of business on February 22, 2018. |
| | | | |
| 196 | | CALAMOS OPEN-END FAMILY OF FUNDS ANNUAL REPORT | | |
Notes to Financial Statements
| | | | | | | | | | | | | | | | | | | | | | | | |
| | | GROWTH AND INCOME FUND | | | DIVIDEND GROWTH FUND | | | OPPORTUNISTIC VALUE FUND | |
| Class A | | Shares | | | Dollars | | | Shares | | | Dollars | | | Shares | | | Dollars | |
| Shares sold | | | 1,828,279 | | | $ | 60,648,514 | | | | 36,621 | | | $ | 457,419 | | | | 68,060 | | | $ | 1,062,665 | |
| | | | | | |
| Shares issued as reinvestment of distributions | | | 1,668,011 | | | | 53,417,704 | | | | 13,502 | | | | 163,449 | | | | 47,295 | | | | 712,264 | |
| | | | | | |
| Shares converted from class R | | | 348,363 | | | | 11,447,223 | | | | — | | | | — | | | | 9,856 | | | | 151,294 | |
| | | | | | |
| Less shares redeemed | | | (5,973,982 | ) | | | (199,006,475 | ) | | | (19,572 | ) | | | (247,248 | ) | | | (175,440 | ) | | | (2,724,491 | ) |
| | | | |
| Net increase (decrease) | | | (2,129,329 | ) | | $ | (73,493,034 | ) | | | 30,551 | | | $ | 373,620 | | | | (50,229 | ) | | $ | (798,268 | ) |
| | | | |
| | | | | | |
| Class C | | Shares | | | Dollars | | | Shares | | | Dollars | | | Shares | | | Dollars | |
| Shares sold | | | 620,929 | | | $ | 20,716,983 | | | | 9,121 | | | $ | 111,383 | | | | 3,505 | | | $ | 49,331 | |
| | | | | | |
| Shares issued as reinvestment of distributions | | | 1,010,250 | | | | 32,400,402 | | | | 6,653 | | | | 79,037 | | | | 10,988 | | | | 149,333 | |
| | | | | | |
| Less shares redeemed | | | (3,510,401 | ) | | | (117,073,601 | ) | | | (13,712 | ) | | | (170,222 | ) | | | (45,143 | ) | | | (637,684 | ) |
| | | | |
| Net increase (decrease) | | | (1,879,222 | ) | | $ | (63,956,216 | ) | | | 2,062 | | | $ | 20,198 | | | | (30,650 | ) | | $ | (439,020 | ) |
| | | | |
| | | | | | |
| Class I | | Shares | | | Dollars | | | Shares | | | Dollars | | | Shares | | | Dollars | |
| Shares sold | | | 5,419,973 | | | $ | 174,411,586 | | | | 131,156 | | | $ | 1,670,092 | | | | 29,642 | | | $ | 473,387 | |
| | | | | | |
| Shares issued as reinvestment of distributions | | | 1,302,327 | | | | 40,205,524 | | | | 153,479 | | | | 1,856,415 | | | | 57,863 | | | | 893,972 | |
| | | | | | |
| Less shares redeemed | | | (3,503,146 | ) | | | (111,683,122 | ) | | | (361,307 | ) | | | (4,527,798 | ) | | | (344,243 | ) | | | (5,499,472 | ) |
| | | | |
| Net increase (decrease) | | | 3,219,154 | | | $ | 102,933,988 | | | | (76,672 | ) | | $ | (1,001,291 | ) | | | (256,738 | ) | | $ | (4,132,113 | ) |
| | | | |
| | | | | | |
| Class R(a) | | Shares | | | Dollars | | | Shares | | | Dollars | | | Shares | | | Dollars | |
| Shares sold | | | 15,639 | | | $ | 506,978 | | | | — | | | $ | — | | | | 291 | | | $ | 4,471 | |
| | | | | | |
| Shares issued as reinvestment of distributions | | | 19,246 | | | | 606,450 | | | | — | | | | — | | | | 80 | | | | 1,186 | |
| | | | | | |
| Less shares redeemed | | | (44,626 | ) | | | (1,457,529 | ) | | | — | | | | — | | | | (1,114 | ) | | | (16,621 | ) |
| | | | | | |
| Shares converted to class A | | | (351,366 | ) | | | (11,447,223 | ) | | | — | | | | — | | | | (9,994 | ) | | | (151,294 | ) |
| | | | |
| Net increase (decrease) | | | (361,107 | ) | | $ | (11,791,324 | ) | | | — | | | $ | — | | | | (10,737 | ) | | $ | (162,258 | ) |
| | | | |
| | | | | | |
| Class R6 | | Shares | | | Dollars | | | Shares | | | Dollars | | | Shares | | | Dollars | |
| Shares sold | | | — | | | $ | — | | | | — | | | $ | — | | | | — | | | $ | — | |
| | | | | | |
| Shares issued as reinvestment of distributions | | | — | | | | — | | | | — | | | | — | | | | — | | | | — | |
| | | | | | |
| Less shares redeemed | | | — | | | | — | | | | — | | | | — | | | | — | | | | — | |
| | | | |
| Net increase (decrease) | | | — | | | $ | — | | | | — | | | $ | — | | | | — | | | $ | — | |
| | | | |
| (a) | Class R shares were converted into Class A shares at the close of business on February 22, 2018. |
Notes to Financial Statements
| | | | | | | | | | | | | | | | | | | | | | | | |
| | | INTERNATIONAL GROWTH FUND | | | EVOLVING WORLD
GROWTH FUND | | | EMERGING MARKET
EQUITY FUND | |
| Class A | | Shares | | | Dollars | | | Shares | | | Dollars | | | Shares | | | Dollars | |
| Shares sold | | | 3,560,783 | | | $ | 77,582,022 | | | | 793,820 | | | $ | 12,006,694 | | | | 16,938 | | | $ | 182,579 | |
| | | | | | |
| Shares issued as reinvestment of distributions | | | 188,722 | | | | 3,940,528 | | | | 550 | | | | 8,122 | | | | 887 | | | | 9,320 | |
| | | | | | |
| Shares converted from class R | | | 312,475 | | | | 6,808,822 | | | | 145,134 | | | | 2,303,279 | | | | — | | | | — | |
| | | | | | |
| Less shares redeemed | | | (4,134,915 | ) | | | (87,647,764 | ) | | | (2,769,557 | ) | | | (41,240,663 | ) | | | (12,255 | ) | | | (126,537 | ) |
| | | | |
| Net increase (decrease) | | | (72,935 | ) | | $ | 683,608 | | | | (1,830,053 | ) | | $ | (26,922,568 | ) | | | 5,570 | | | $ | 65,362 | |
| | | | |
| | | | | | |
| Class C | | Shares | | | Dollars | | | Shares | | | Dollars | | | Shares | | | Dollars | |
| Shares sold | | | 77,422 | | | $ | 1,510,861 | | | | 175,178 | | | $ | 2,500,143 | | | | 4,210 | | | $ | 41,438 | |
| | | | | | |
| Shares issued as reinvestment of distributions | | | 54,710 | | | | 1,040,583 | | | | — | | | | — | | | | — | | | | — | |
| | | | | | |
| Less shares redeemed | | | (295,417 | ) | | | (5,656,723 | ) | | | (440,136 | ) | | | (6,102,909 | ) | | | (7,248 | ) | | | (71,644 | ) |
| | | | |
| Net increase (decrease) | | | (163,285 | ) | | $ | (3,105,279 | ) | | | (264,958 | ) | | $ | (3,602,766 | ) | | | (3,038 | ) | | $ | (30,206 | ) |
| | | | |
| | | | | | |
| Class I | | Shares | | | Dollars | | | Shares | | | Dollars | | | Shares | | | Dollars | |
| Shares sold | | | 1,908,475 | | | $ | 41,551,059 | | | | 3,062,969 | | | $ | 46,063,386 | | | | 109,133 | | | $ | 1,222,231 | |
| | | | | | |
| Shares issued as reinvestment of distributions | | | 295,866 | | | | 6,316,729 | | | | 59,671 | | | | 885,521 | | | | 4,307 | | | | 45,350 | |
| | | | | | |
| Less shares redeemed | | | (1,893,024 | ) | | | (41,115,312 | ) | | | (6,143,599 | ) | | | (92,860,230 | ) | | | (91,379 | ) | | | (903,361 | ) |
| | | | |
| Net increase (decrease) | | | 311,317 | | | $ | 6,752,476 | | | | (3,020,959 | ) | | $ | (45,911,323 | ) | | | 22,061 | | | $ | 364,220 | |
| | | | |
| | | | | | |
| Class R(a) | | Shares | | | Dollars | | | Shares | | | Dollars | | | Shares | | | Dollars | |
| Shares sold | | | 26,978 | | | $ | 574,860 | | | | 11,039 | | | $ | 168,394 | | | | — | | | $ | — | |
| | | | | | |
| Shares issued as reinvestment of distributions | | | 9,239 | | | | 188,200 | | | | — | | | | — | | | | — | | | | — | |
| | | | | | |
| Less shares redeemed | | | (36,825 | ) | | | (787,976 | ) | | | (58,709 | ) | | | (888,872 | ) | | | — | | | | — | |
| | | | | | |
| Shares converted to class A | | | (320,427 | ) | | | (6,808,822 | ) | | | (147,156 | ) | | | (2,303,279 | ) | | | — | | | | — | |
| | | | |
| Net increase (decrease) | | | (321,035 | ) | | $ | (6,833,738 | ) | | | (194,826 | ) | | $ | (3,023,757 | ) | | | — | | | $ | — | |
| | | | |
| | | | | | |
| Class R6(b) | | Shares | | | Dollars | | | Shares | | | Dollars | | | Shares | | | Dollars | |
| Shares sold | | | 1,197 | | | $ | 25,000 | | | | — | | | $ | — | | | | — | | | $ | — | |
| | | | | | |
| Shares issued as reinvestment of distributions | | | — | | | | — | | | | — | | | | — | | | | — | | | | — | |
| | | | | | |
| Less shares redeemed | | | — | | | | — | | | | — | | | | — | | | | — | | | | — | |
| | | | |
| Net increase (decrease) | | | 1,197 | | | $ | 25,000 | | | | — | | | $ | — | | | | — | | | $ | — | |
| | | | |
| (a) | Class R shares were converted into Class A shares at the close of business on February 22, 2018. |
| (b) | International Growth Fund Class R6 commenced operations on September 17, 2018. |
| | | | |
| 198 | | CALAMOS OPEN-END FAMILY OF FUNDS ANNUAL REPORT | | |
Notes to Financial Statements
| | | | | | | | | | | | | | | | | | | | | | | | |
| | | GLOBAL EQUITY FUND | | | GLOBAL GROWTH AND INCOME FUND | | | TOTAL RETURN BOND FUND | |
| Class A | | Shares | | | Dollars | | | Shares | | | Dollars | | | Shares | | | Dollars | |
| Shares sold | | | 346,836 | | | $ | 5,221,585 | | | | 544,702 | | | $ | 5,257,205 | | | | 168,855 | | | $ | 1,706,191 | |
| | | | | | |
| Shares issued as reinvestment of distributions | | | 126,959 | | | | 1,837,097 | | | | 420,944 | | | | 3,955,552 | | | | 51,227 | | | | 517,633 | |
| | | | | | |
| Shares converted from class R | | | 357,072 | | | | 5,398,935 | | | | 104,769 | | | | 1,016,255 | | | | 61,291 | | | | 614,140 | |
| | | | | | |
| Less shares redeemed | | | (535,449 | ) | | | (8,085,122 | ) | | | (1,993,126 | ) | | | (19,270,396 | ) | | | (626,257 | ) | | | (6,288,448 | ) |
| | | | |
| Net increase (decrease) | | | 295,418 | | | $ | 4,372,495 | | | | (922,711 | ) | | $ | (9,041,384 | ) | | | (344,884 | ) | | $ | (3,450,484 | ) |
| | | | |
| | | | | | |
| Class C | | Shares | | | Dollars | | | Shares | | | Dollars | | | Shares | | | Dollars | |
| Shares sold | | | 83,432 | | | $ | 1,145,132 | | | | 291,472 | | | $ | 2,491,887 | | | | 67,659 | | | $ | 686,541 | |
| | | | | | |
| Shares issued as reinvestment of distributions | | | 86,016 | | | | 1,135,416 | | | | 489,662 | | | | 4,088,680 | | | | 18,552 | | | | 187,881 | |
| | | | | | |
| Less shares redeemed | | | (243,411 | ) | | | (3,334,186 | ) | | | (1,901,384 | ) | | | (16,249,536 | ) | | | (330,688 | ) | | | (3,351,059 | ) |
| | | | |
| Net increase (decrease) | | | (73,963 | ) | | $ | (1,053,638 | ) | | | (1,120,250 | ) | | $ | (9,668,969 | ) | | | (244,477 | ) | | $ | (2,476,637 | ) |
| | | | |
| | | | | | |
| Class I | | Shares | | | Dollars | | | Shares | | | Dollars | | | Shares | | | Dollars | |
| Shares sold | | | 1,007,980 | | | $ | 15,534,006 | | | | 2,678,700 | | | $ | 26,661,221 | | | | 1,193,049 | | | $ | 12,036,831 | |
| | | | | | |
| Shares issued as reinvestment of distributions | | | 506,670 | | | | 7,488,587 | | | | 429,390 | | | | 4,152,611 | | | | 137,422 | | | | 1,386,984 | |
| | | | | | |
| Less shares redeemed | | | (2,764,474 | ) | | | (43,444,918 | ) | | | (2,487,651 | ) | | | (24,606,215 | ) | | | (1,854,902 | ) | | | (18,617,344 | ) |
| | | | |
| Net increase (decrease) | | | (1,249,824 | ) | | $ | (20,422,325 | ) | | | 620,439 | | | $ | 6,207,617 | | | | (524,431 | ) | | $ | (5,193,529 | ) |
| | | | |
| | | | | | |
| Class R(a) | | Shares | | | Dollars | | | Shares | | | Dollars | | | Shares | | | Dollars | |
| Shares sold | | | 61,091 | | | $ | 901,022 | | | | 5,432 | | | $ | 51,418 | | | | 25,219 | | | $ | 257,282 | |
| | | | | | |
| Shares issued as reinvestment of distributions | | | 28,155 | | | | 394,456 | | | | 5,692 | | | | 52,426 | | | | 162 | | | | 1,666 | |
| | | | | | |
| Less shares redeemed | | | (57,612 | ) | | | (838,534 | ) | | | (34,928 | ) | | | (335,371 | ) | | | (1,672 | ) | | | (17,048 | ) |
| | | | | | |
| Shares converted to class A | | | (368,961 | ) | | | (5,398,935 | ) | | | (106,802 | ) | | | (1,016,255 | ) | | | (61,421 | ) | | | (614,140 | ) |
| | | | |
| Net increase (decrease) | | | (337,327 | ) | | $ | (4,941,991 | ) | | | (130,606 | ) | | $ | (1,247,782 | ) | | | (37,712 | ) | | $ | (372,240 | ) |
| | | | |
| | | | | | |
| Class R6 | | Shares | | | Dollars | | | Shares | | | Dollars | | | Shares | | | Dollars | |
| Shares sold | | | — | | | $ | — | | | | — | | | $ | — | | | | — | | | $ | — | |
| | | | | | |
| Shares issued as reinvestment of distributions | | | — | | | | — | | | | — | | | | — | | | | — | | | | — | |
| | | | | | |
| Less shares redeemed | | | — | | | | — | | | | — | | | | — | | | | — | | | | — | |
| | | | |
| Net increase (decrease) | | | — | | | $ | — | | | �� | — | | | $ | — | | | | — | | | $ | — | |
| | | | |
| (a) | Class R shares were converted into Class A shares at the close of business on February 22, 2018. |
Notes to Financial Statements
| | | | | | | | | | | | | | | | |
| | | HIGH INCOME OPPORTUNITIES FUND | | | SHORT-TERM BOND FUND(b) | |
| Class A | | Shares | | | Dollars | | | Shares | | | Dollars | |
| Shares sold | | | 995,944 | | | $ | 8,579,913 | | | | 2,500 | | | $ | 25,000 | |
| | | | |
| Shares issued as reinvestment of distributions | | | 221,549 | | | | 1,906,178 | | | | 8 | | | | 81 | |
| | | | |
| Shares converted from class R | | | 13,166 | | | | 114,548 | | | | — | | | | — | |
| | | | |
| Less shares redeemed | | | (1,475,277 | ) | | | (12,733,842 | ) | | | — | | | | — | |
| | | | |
| Net increase (decrease) | | | (244,618 | ) | | $ | (2,133,203 | ) | | | 2,508 | | | $ | 25,081 | |
| | | | |
| | | | |
| Class C | | Shares | | | Dollars | | | Shares | | | Dollars | |
| Shares sold | | | 21,467 | | | $ | 198,026 | | | | — | | | $ | — | |
| | | | |
| Shares issued as reinvestment of distributions | | | 61,066 | | | | 553,202 | | | | — | | | | — | |
| | | | |
| Less shares redeemed | | | (401,593 | ) | | | (3,653,160 | ) | | | — | | | | — | |
| | | | |
| Net increase (decrease) | | | (319,060 | ) | | $ | (2,901,932 | ) | | | — | | | $ | — | |
| | | | |
| | | | |
| Class I | | Shares | | | Dollars | | | Shares | | | Dollars | |
| Shares sold | | | 348,933 | | | $ | 3,017,151 | | | | 3,015 | | | $ | 30,140 | |
| | | | |
| Shares acquired throughIn-Kind purchases | | | — | | | | — | | | | 1,507,400 | | | | 15,074,001 | |
| | | | |
| Shares issued as reinvestment of distributions | | | 55,269 | | | | 475,680 | | | | 5,418 | | | | 54,087 | |
| | | | |
| Less shares redeemed | | | (614,914 | ) | | | (5,339,800 | ) | | | (422 | ) | | | (4,205 | ) |
| | | | |
| Net increase (decrease) | | | (210,712 | ) | | $ | (1,846,969 | ) | | | 1,515,411 | | | $ | 15,154,023 | |
| | | | |
| | | | |
| Class R(a) | | Shares | | | Dollars | | | Shares | | | Dollars | |
| Shares sold | | | 646 | | | $ | 5,668 | | | | — | | | $ | — | |
| | | | |
| Shares issued as reinvestment of distributions | | | 174 | | | | 1,527 | | | | — | | | | — | |
| | | | |
| Less shares redeemed | | | (1,543 | ) | | | (13,638 | ) | | | — | | | | — | |
| | | | |
| Shares converted to class A | | | (13,211 | ) | | | (114,548 | ) | | | — | | | | — | |
| | | | |
| Net increase (decrease) | | | (13,934 | ) | | $ | (120,991 | ) | | | — | | | $ | — | |
| | | | |
| | | | |
| Class R6 | | Shares | | | Dollars | | | Shares | | | Dollars | |
| Shares sold | | | — | | | $ | — | | | | — | | | $ | — | |
| | | | |
| Shares issued as reinvestment of distributions | | | — | | | | — | | | | — | | | | — | |
| | | | |
| Less shares redeemed | | | — | | | | — | | | | — | | | | — | |
| | | | |
| Net increase (decrease) | | | — | | | $ | — | | | | — | | | $ | — | |
| | | | |
| (a) | Class R shares were converted into Class A shares at the close of business on February 22, 2018. |
| (b) | Short-Term Bond Fund commenced operations on September 19, 2018. |
| | | | |
| 200 | | CALAMOS OPEN-END FAMILY OF FUNDS ANNUAL REPORT | | |
Calamos Market Neutral Income Fund Financial Highlights
Selected data for a share outstanding throughout each year were as follows:
| | | | | | | | | | | | | | | | | | | | |
| | | CLASS A | |
| | | Year Ended October 31, | |
| | | 2019 | | | 2018 | | | 2017 | | | 2016 | | | 2015 | |
| | | | | |
Net asset value, beginning of year | | | $13.52 | | | | $13.41 | | | | $13.13 | | | | $13.08 | | | | $13.13 | |
|
Income from investment operations: | |
| | | | | |
Net investment income (loss)(a) | | | 0.27 | | | | 0.30 | | | | 0.26 | | | | 0.25 | | | | 0.21 | |
| | | | | |
Net realized and unrealized gain (loss) | | | 0.28 | | | | 0.19 | | | | 0.35 | | | | 0.16 | | | | — | |
| | | | | |
Total from investment operations | | | 0.55 | | | | 0.49 | | | | 0.61 | | | | 0.41 | | | | 0.21 | |
|
Distributions: | |
| | | | | |
Dividends from net investment income | | | (0.19 | ) | | | (0.16 | ) | | | (0.13 | ) | | | (0.16 | ) | | | (0.12 | ) |
| | | | | |
Dividends from net realized gains | | | (0.41 | ) | | | (0.22 | ) | | | (0.20 | ) | | | (0.20 | ) | | | (0.14 | ) |
| | | | | |
Total distributions* | | | (0.60 | ) | | | (0.38 | ) | | | (0.33 | ) | | | (0.36 | ) | | | (0.26 | ) |
| | | | | |
Net asset value, end of year | | | $13.47 | | | | $13.52 | | | | $13.41 | | | | $13.13 | | | | $13.08 | |
|
Ratios and supplemental data: | |
| | | | | |
Total return(b) | | | 4.32% | | | | 3.79% | | | | 4.74% | | | | 3.16% | | | | 1.60% | |
| | | | | |
Net assets, end of year (000) | | | $744,356 | | | | $743,925 | | | | $682,451 | | | | $970,737 | | | | $1,051,576 | |
| | | | | |
Ratio of net expenses to average net assets | | | 1.24% | (c) | | | 1.25% | (d) | | | 1.28% | (e) | | | 1.22% | (f) | | | 1.23% | |
| | | | | |
Ratio of gross expenses to average net assets prior to expense reductions | | | 1.24% | | | | 1.25% | | | | 1.28% | | | | 1.22% | | | | 1.23% | |
| | | | | |
Ratio of net investment income (loss) to average net assets | | | 2.04% | | | | 2.26% | | | | 1.96% | | | | 1.91% | | | | 1.58% | |
| |
| | | Year Ended October 31, | |
| | | 2019 | | | 2018 | | | 2017 | | | 2016 | | | 2015 | |
| | | | | |
Portfolio turnover rate | | | 73.8% | | | | 66.8% | | | | 81.1% | | | | 37.5% | | | | 37.6% | |
| * | Distribution for annual periods determined in accordance with federal income tax regulations. |
| (a) | Net investment income (loss) allocated based on average shares method. |
| (b) | Total return measures net investment income (loss) and capital gain or loss from portfolio investments assuming reinvestment of dividends and capital gains distributions. Total return is not annualized for periods that are less than a full year, does not reflect the effect of sales charge for Class A shares nor the contingent deferred sales charge for Class B and C shares and does not reflect the deduction of taxes that a shareholder would pay on fund distributions or the redemption of fund shares. |
| (c) | Ratio of net expenses, excluding dividend expense on short positions, to average net assets was 1.06% for the year ended October 31, 2019. |
| (d) | Ratio of net expenses, excluding dividend expense on short positions, to average net assets was 1.07% for the year ended October 31, 2018. |
| (e) | Ratio of net expenses, excluding dividend expense on short positions, to average net assets was 1.08% for the year ended October 31, 2017. |
| (f) | Ratio of net expenses, excluding dividend expense on short positions, to average net assets was 1.08% for the year ended October 31, 2016. |
Calamos Market Neutral Income Fund Financial Highlights
| | | | | | | | | | | | | | | | | | | | |
| | | CLASS C | |
| | | Year Ended October 31, | |
| | | 2019 | | | 2018 | | | 2017 | | | 2016 | | | 2015 | |
| | | | | |
Net asset value, beginning of year | | | $13.73 | | | | $13.62 | | | | $13.33 | | | | $13.27 | | | | $13.32 | |
|
Income from investment operations: | |
| | | | | |
Net investment income (loss)(a) | | | 0.18 | | | | 0.21 | | | | 0.16 | | | | 0.15 | | | | 0.11 | |
| | | | | |
Net realized and unrealized gain (loss) | | | 0.28 | | | | 0.19 | | | | 0.36 | | | | 0.17 | | | | 0.01 | |
| | | | | |
Total from investment operations | | | 0.46 | | | | 0.40 | | | | 0.52 | | | | 0.32 | | | | 0.12 | |
|
Distributions: | |
| | | | | |
Dividends from net investment income | | | (0.08 | ) | | | (0.07 | ) | | | (0.03 | ) | | | (0.06 | ) | | | (0.03 | ) |
| | | | | |
Dividends from net realized gains | | | (0.41 | ) | | | (0.22 | ) | | | (0.20 | ) | | | (0.20 | ) | | | (0.14 | ) |
| | | | | |
Total distributions* | | | (0.49 | ) | | | (0.29 | ) | | | (0.23 | ) | | | (0.26 | ) | | | (0.17 | ) |
| | | | | |
Net asset value, end of year | | | $13.70 | | | | $13.73 | | | | $13.62 | | | | $13.33 | | | | $13.27 | |
|
Ratios and supplemental data: | |
| | | | | |
Total return(b) | | | 3.56% | | | | 3.03% | | | | 3.98% | | | | 2.41% | | | | 0.86% | |
| | | | | |
Net assets, end of year (000) | | | $261,352 | | | | $303,417 | | | | $282,115 | | | | $318,853 | | | | $339,054 | |
| | | | | |
Ratio of net expenses to average net assets | | | 1.98% | (c) | | | 2.00% | (d) | | | 2.03% | (e) | | | 1.97% | (f) | | | 1.98% | |
| | | | | |
Ratio of gross expenses to average net assets prior to expense reductions | | | 1.99% | | | | 2.00% | | | | 2.03% | | | | 1.97% | | | | 1.98% | |
| | | | | |
Ratio of net investment income (loss) to average net assets | | | 1.31% | | | | 1.51% | | | | 1.22% | | | | 1.16% | | | | 0.83% | |
| * | Distribution for annual periods determined in accordance with federal income tax regulations. |
| (a) | Net investment income (loss) allocated based on average shares method. |
| (b) | Total return measures net investment income (loss) and capital gain or loss from portfolio investments assuming reinvestment of dividends and capital gains distributions. Total return is not annualized for periods that are less than a full year, does not reflect the effect of sales charge for Class A shares nor the contingent deferred sales charge for Class C shares and does not reflect the deduction of taxes that a shareholder would pay on fund distributions or the redemption of fund shares. |
| (c) | Ratio of net expenses, excluding dividend expense on short positions, to average net assets was 1.80% for the year ended October 31, 2019. |
| (d) | Ratio of net expenses, excluding dividend expense on short positions, to average net assets was 1.81% for the year ended October 31, 2018. |
| (e) | Ratio of net expenses, excluding dividend expense on short positions, to average net assets was 1.83% for the year ended October 31, 2017. |
| (f) | Ratio of net expenses, excluding dividend expense on short positions, to average net assets was 1.84% for the year ended October 31, 2016. |
| | | | |
| 202 | | CALAMOS OPEN-END FAMILY OF FUNDS ANNUAL REPORT | | |
Calamos Market Neutral Income Fund Financial Highlights
| | | | | | | | | | | | | | | | | | | | |
| | | CLASS I | |
| | | Year Ended October 31, | |
| | | 2019 | | | 2018 | | | 2017 | | | 2016 | | | 2015 | |
| | | | | |
Net asset value, beginning of year | | | $13.36 | | | | $13.26 | | | | $12.98 | | | | $12.94 | | | | $12.99 | |
|
Income from investment operations: | |
| | | | | |
Net investment income (loss)(a) | | | 0.30 | | | | 0.33 | | | | 0.29 | | | | 0.27 | | | | 0.24 | |
| | | | | |
Net realized and unrealized gain (loss) | | | 0.28 | | | | 0.19 | | | | 0.36 | | | | 0.16 | | | | — | |
| | | | | |
Total from investment operations | | | 0.58 | | | | 0.52 | | | | 0.65 | | | | 0.43 | | | | 0.24 | |
|
Distributions: | |
| | | | | |
Dividends from net investment income | | | (0.23 | ) | | | (0.20 | ) | | | (0.17 | ) | | | (0.19 | ) | | | (0.15 | ) |
| | | | | |
Dividends from net realized gains | | | (0.41 | ) | | | (0.22 | ) | | | (0.20 | ) | | | (0.20 | ) | | | (0.14 | ) |
| | | | | |
Total distributions* | | | (0.64 | ) | | | (0.42 | ) | | | (0.37 | ) | | | (0.39 | ) | | | (0.29 | ) |
| | | | | |
Net asset value, end of year | | | $13.30 | | | | $13.36 | | | | $13.26 | | | | $12.98 | | | | $12.94 | |
|
Ratios and supplemental data: | |
| | | | | |
Total return(b) | | | 4.62% | | | | 4.02% | | | | 5.07% | | | | 3.38% | | | | 1.89% | |
| | | | | |
Net assets, end of year (000) | | | $7,709,445 | | | | $5,658,499 | | | | $3,734,035 | | | | $2,587,922 | | | | $2,377,641 | |
| | | | | |
Ratio of net expenses to average net assets | | | 0.99% | (c) | | | 0.99% | (d) | | | 1.02% | (e) | | | 0.97% | (f) | | | 0.98% | |
| | | | | |
Ratio of gross expenses to average net assets prior to expense reductions | | | 0.99% | | | | 0.99% | | | | 1.02% | | | | 0.97% | | | | 0.98% | |
| | | | | |
Ratio of net investment income (loss) to average net assets | | | 2.28% | | | | 2.49% | | | | 2.22% | | | | 2.15% | | | | 1.83% | |
| * | Distribution for annual periods determined in accordance with federal income tax regulations. |
| (a) | Net investment income (loss) allocated based on average shares method. |
| (b) | Total return measures net investment income (loss) and capital gain or loss from portfolio investments assuming reinvestment of dividends and capital gains distributions. Total return is not annualized for periods that are less than a full year, does not reflect the effect of sales charge for Class A shares nor the contingent deferred sales charge for Class C shares and does not reflect the deduction of taxes that a shareholder would pay on fund distributions or the redemption of fund shares. |
| (c) | Ratio of net expenses, excluding dividend expense on short positions, to average net assets was 0.81% for the year ended October 31, 2019. |
| (d) | Ratio of net expenses, excluding dividend expense on short positions, to average net assets was 0.81% for the year ended October 31, 2018. |
| (e) | Ratio of net expenses, excluding dividend expense on short positions, to average net assets was 0.83% for the year ended October 31, 2017. |
| (f) | Ratio of net expenses, excluding dividend expense on short positions, to average net assets was 0.84% for the year ended October 31, 2016. |
Calamos Hedged Equity Fund Financial Highlights
Selected data for a share outstanding throughout each year were as follows:
| | | | | | | | | | | | | | | | | | | | |
| | | CLASS A | |
| | | Year Ended October 31, | | | December 31, 2014• through October 31, | |
| | | 2019 | | | 2018 | | | 2017 | | | 2016 | | | 2015 | |
| | | | | |
Net asset value, beginning of year | | | $11.44 | | | | $10.85 | | | | $10.03 | | | | $10.00 | | | | $10.00 | |
|
Income from investment operations: | |
| | | | | |
Net investment income (loss)(a) | | | 0.10 | | | | 0.08 | | | | 0.12 | | | | 0.10 | | | | 0.06 | |
| | | | | |
Net realized and unrealized gain (loss) | | | 0.64 | | | | 0.57 | | | | 0.76 | | | | 0.17 | | | | 0.01 | |
| | | | | |
Total from investment operations | | | 0.74 | | | | 0.65 | | | | 0.88 | | | | 0.27 | | | | 0.07 | |
|
Distributions: | |
| | | | | |
Dividends from net investment income | | | (0.05 | ) | | | (0.06 | ) | | | (0.06 | ) | | | (0.15 | ) | | | (0.07 | ) |
| | | | | |
Dividends from net realized gains | | | (0.25 | ) | | | — | | | | — | | | | (0.09 | ) | | | — | |
| | | | | |
Total distributions* | | | (0.30 | ) | | | (0.06 | ) | | | (0.06 | ) | | | (0.24 | ) | | | (0.07 | ) |
| | | | | |
Net asset value, end of year | | | $11.88 | | | | $11.44 | | | | $10.85 | | | | $10.03 | | | | $10.00 | |
|
Ratios and supplemental data: | |
| | | | | |
Total return(b) | | | 6.65% | | | | 6.08% | | | | 8.77% | | | | 2.79% | | | | 0.67% | |
| | | | | |
Net assets, end of year (000) | | | $10,412 | | | | $5,151 | | | | $1,007 | | | | $10,275 | | | | $5,661 | |
| | | | | |
Ratio of net expenses to average net assets | | | 1.21% | | | | 1.25% | | | | 1.25% | | | | 1.22% | | | | 1.25% | (c) |
| | | | | |
Ratio of gross expenses to average net assets prior to expense reductions | | | 1.21% | | | | 1.47% | | | | 2.14% | | | | 2.03% | | | | 3.05% | (c) |
| | | | | |
Ratio of net investment income (loss) to average net assets | | | 0.86% | | | | 0.65% | | | | 1.12% | | | | 1.01% | | | | 0.78% | (c) |
| | |
| | | Year Ended October 31, | | | December 31, 2014• through October 31, | |
| | | 2019 | | | 2018 | | | 2017 | | | 2016 | | | 2015 | |
| | | | | |
Portfolio turnover rate | | | 81.7% | | | | 140.8% | | | | 49.2% | | | | 19.6% | | | | 29.4% | |
| • | Commencement of operations. |
| * | Distribution for annual periods determined in accordance with federal income tax regulations. |
| (a) | Net investment income (loss) allocated based on average shares method. |
| (b) | Total return measures net investment income (loss) and capital gain or loss from portfolio investments assuming reinvestment of dividends and capital gains distributions. Total return is not annualized for periods that are less than a full year, does not reflect the effect of sales charge for Class A shares nor the contingent deferred sales charge for Class B and C shares and does not reflect the deduction of taxes that a shareholder would pay on fund distributions or the redemption of fund shares. |
| | | | |
| 204 | | CALAMOS OPEN-END FAMILY OF FUNDS ANNUAL REPORT | | |
Calamos Hedged Equity Fund Financial Highlights
| | | | | | | | | | | | | | | | | | | | |
| | | CLASS C | |
| | | Year Ended October 31, | | | December 31, 2014• through October 31, | |
| | | 2019 | | | 2018 | | | 2017 | | | 2016 | | | 2015 | |
| | | | | |
Net asset value, beginning of year | | | $11.35 | | | | $10.78 | | | | $10.00 | | | | $9.98 | | | | $10.00 | |
|
Income from investment operations: | |
| | | | | |
Net investment income (loss)(a) | | | 0.01 | | | | (0.01 | ) | | | 0.02 | | | | 0.03 | | | | 0.00 | * |
| | | | | |
Net realized and unrealized gain (loss) | | | 0.63 | | | | 0.58 | | | | 0.79 | | | | 0.16 | | | | 0.01 | |
| | | | | |
Total from investment operations | | | 0.64 | | | | 0.57 | | | | 0.81 | | | | 0.19 | | | | 0.01 | |
|
Distributions: | |
| | | | | |
Dividends from net investment income | | | (0.02 | ) | | | (0.00 | )* | | | (0.03 | ) | | | (0.08 | ) | | | (0.03 | ) |
| | | | | |
Dividends from net realized gains | | | (0.25 | ) | | | — | | | | — | | | | (0.09 | ) | | | — | |
| | | | | |
Total distributions** | | | (0.27 | ) | | | (0.00 | )* | | | (0.03 | ) | | | (0.17 | ) | | | (0.03 | ) |
| | | | | |
Net asset value, end of year | | | $11.72 | | | | $11.35 | | | | $10.78 | | | | $10.00 | | | | $9.98 | |
|
Ratios and supplemental data: | |
| | | | | |
Total return(b) | | | 5.88% | | | | 5.31% | | | | 8.09% | | | | 1.92% | | | | 0.09% | |
| | | | | |
Net assets, end of year (000) | | | $2,151 | | | | $616 | | | | $173 | | | | $156 | | | | $100 | |
| | | | | |
Ratio of net expenses to average net assets | | | 1.96% | | | | 2.00% | | | | 2.00% | | | | 1.97% | | | | 2.00% | (c) |
| | | | | |
Ratio of gross expenses to average net assets prior to expense reductions | | | 1.96% | | | | 2.30% | | | | 3.03% | | | | 2.79% | | | | 3.79% | (c) |
| | | | | |
Ratio of net investment income (loss) to average net assets | | | 0.11% | | | | (0.07% | ) | | | 0.24% | | | | 0.26% | | | | 0.03% | (c) |
| • | Commencement of operations. |
| * | Amounts are less than $0.005. |
| ** | Distribution for annual periods determined in accordance with federal income tax regulations. |
| (a) | Net investment income (loss) allocated based on average shares method. |
| (b) | Total return measures net investment income (loss) and capital gain or loss from portfolio investments assuming reinvestment of dividends and capital gains distributions. Total return is not annualized for periods that are less than a full year, does not reflect the effect of sales charge for Class A shares nor the contingent deferred sales charge for Class C shares and does not reflect the deduction of taxes that a shareholder would pay on fund distributions or the redemption of fund shares. |
Calamos Hedged Equity Fund Financial Highlights
| | | | | | | | | | | | | | | | | | | | |
| | | CLASS I | |
| | | Year Ended October 31, | | | December 31, 2014• through October 31, | |
| | | 2019 | | | 2018 | | | 2017 | | | 2016 | | | 2015 | |
| | | | | |
Net asset value, beginning of year | | | $11.45 | | | | $10.84 | | | | $10.04 | | | | $10.01 | | | | $10.00 | |
|
Income from investment operations: | |
| | | | | |
Net investment income (loss)(a) | | | 0.13 | | | | 0.10 | | | | 0.13 | | | | 0.13 | | | | 0.09 | |
| | | | | |
Net realized and unrealized gain (loss) | | | 0.64 | | | | 0.59 | | | | 0.78 | | | | 0.17 | | | | — | |
| | | | | |
Total from investment operations | | | 0.77 | | | | 0.69 | | | | 0.91 | | | | 0.30 | | | | 0.09 | |
|
Distributions: | |
| | | | | |
Dividends from net investment income | | | (0.10 | ) | | | (0.08 | ) | | | (0.11 | ) | | | (0.18 | ) | | | (0.08 | ) |
| | | | | |
Dividends from net realized gains | | | (0.25 | ) | | | — | | | | — | | | | (0.09 | ) | | | — | |
| | | | | |
Total distributions* | | | (0.35 | ) | | | (0.08 | ) | | | (0.11 | ) | | | (0.27 | ) | | | (0.08 | ) |
| | | | | |
Net asset value, end of year | | | $11.87 | | | | $11.45 | | | | $10.84 | | | | $10.04 | | | | $10.01 | |
|
Ratios and supplemental data: | |
| | | | | |
Total return(b) | | | 7.01% | | | | 6.38% | | | | 9.12% | | | | 3.02% | | | | 0.89% | |
| | | | | |
Net assets, end of year (000) | | | $224,234 | | | | $91,589 | | | | $11,883 | | | | $8,035 | | | | $5,527 | |
| | | | | |
Ratio of net expenses to average net assets | | | 0.96% | | | | 1.00% | | | | 1.00% | | | | 0.97% | | | | 1.00% | (c) |
| | | | | |
Ratio of gross expenses to average net assets prior to expense reductions | | | 0.96% | | | | 1.26% | | | | 2.06% | | | | 1.81% | | | | 2.80% | (c) |
| | | | | |
Ratio of net investment income (loss) to average net assets | | | 1.12% | | | | 0.91% | | | | 1.22% | | | | 1.27% | | | | 1.03% | (c) |
| • | Commencement of operations. |
| * | Distribution for annual periods determined in accordance with federal income tax regulations. |
| (a) | Net investment income (loss) allocated based on average shares method. |
| (b) | Total return measures net investment income (loss) and capital gain or loss from portfolio investments assuming reinvestment of dividends and capital gains distributions. Total return is not annualized for periods that are less than a full year, does not reflect the effect of sales charge for Class A shares nor the contingent deferred sales charge for Class C shares and does not reflect the deduction of taxes that a shareholder would pay on fund distributions or the redemption of fund shares. |
| | | | |
| 206 | | CALAMOS OPEN-END FAMILY OF FUNDS ANNUAL REPORT | | |
Calamos Phineus Long/Short Fund Financial Highlights
Selected data for a share outstanding throughout each year were as follows:
| | | | | | | | | | | | | | | | |
| | | CLASS A | |
| | | Year Ended October 31, | | | April 5, 2016•
through
October 31, | |
| | | 2019 | | | 2018 | | | 2017 | | | 2016 | |
| | | | |
Net asset value, beginning of year | | | $12.15 | | | | $12.33 | | | | $10.77 | | | | $10.00 | |
|
Income from investment operations: | |
| | | | |
Net investment income (loss)(a) | | | 0.04 | | | | (0.03 | ) | | | (0.16 | ) | | | (0.10 | ) |
| | | | |
Net realized and unrealized gain (loss) | | | (0.12 | ) | | | — | | | | 1.82 | | | | 0.87 | |
| | | | |
Total from investment operations | | | (0.08 | ) | | | (0.03 | ) | | | 1.66 | | | | 0.77 | |
|
Distributions: | |
| | | | |
Dividends from net investment income | | | — | | | | — | | | | — | | | | — | |
| | | | |
Dividends from net realized gains | | | (0.44 | ) | | | (0.15 | ) | | | (0.10 | ) | | | — | |
| | | | |
Total distributions* | | | (0.44 | ) | | | (0.15 | ) | | | (0.10 | ) | | | — | |
| | | | |
Net asset value, end of year | | | $11.63 | | | | $12.15 | | | | $12.33 | | | | $10.77 | |
|
Ratios and supplemental data: | |
| | | | |
Total return(b) | | | (0.45% | ) | | | (0.34% | ) | | | 15.46% | | | | 7.70% | |
| | | | |
Net assets, end of year (000) | | | $76,689 | | | | $108,730 | | | | $66,854 | | | | $14,708 | |
| | | | |
Ratio of net expenses to average net assets | | | 2.95% | (d) | | | 2.28% | (e) | | | 2.71% | (f) | | | 2.99% | (c)(g) |
| | | | |
Ratio of gross expenses to average net assets prior to expense reductions | | | 2.96% | | | | 2.28% | | | | 2.71% | | | | 4.04% | (c) |
| | | | |
Ratio of net investment income (loss) to average net assets | | | 0.33% | | | | (0.27% | ) | | | (1.34% | ) | | | (1.77% | )(c) |
| | |
| | | Year Ended October 31, | | | April 5, 2016•
through
October 31, | |
| | | 2019 | | | 2018 | | | 2017 | | | 2016 | |
| | | | |
Portfolio turnover rate | | | 135.4% | | | | 228.6% | | | | 167.8% | | | | 177.6% | |
| • | Commencement of operations. |
| * | Distribution for annual periods determined in accordance with federal income tax regulations. |
| (a) | Net investment income (loss) allocated based on average shares method. |
| (b) | Total return measures net investment income (loss) and capital gain or loss from portfolio investments assuming reinvestment of dividends and capital gains distributions. Total return is not annualized for periods that are less than a full year, does not reflect the effect of sales charge for Class A shares nor the contingent deferred sales charge for Class B and C shares and does not reflect the deduction of taxes that a shareholder would pay on fund distributions or the redemption of fund shares. |
| (d) | Ratio of net expenses, excluding dividend expense on short positions, to average net assets was 1.64% for the year ended October 31, 2019. |
| (e) | Ratio of net expenses, excluding dividend expense on short positions, to average net assets was 1.64% for the year ended October 31, 2018. |
| (f) | Ratio of net expenses, excluding dividend expense on short positions, to average net assets was 1.73% for the year ended October 31, 2017. |
| (g) | Ratio of net expenses, excluding dividend expense on short positions, to average net assets was 2.01% for the period ended October 31, 2016. |
Calamos Phineus Long/Short Fund Financial Highlights
| | | | | | | | | | | | | | | | |
| | | CLASS C | |
| | | Year Ended October 31, | | | April 5, 2016• through
October 31, | |
| | | 2019 | | | 2018 | | | 2017 | | | 2016 | |
| | | | |
Net asset value, beginning of year | | | $11.92 | | | | $12.19 | | | | $10.73 | | | | $10.00 | |
|
Income from investment operations: | |
| | | | |
Net investment income (loss)(a) | | | (0.05 | ) | | | (0.13 | ) | | | (0.25 | ) | | | (0.15 | ) |
| | | | |
Net realized and unrealized gain (loss) | | | (0.11 | ) | | | 0.01 | | | | 1.81 | | | | 0.88 | |
| | | | |
Total from investment operations | | | (0.16 | ) | | | (0.12 | ) | | | 1.56 | | | | 0.73 | |
|
Distributions: | |
| | | | |
Dividends from net investment income | | | — | | | | — | | | | — | | | | — | |
| | | | |
Dividends from net realized gains | | | (0.44 | ) | | | (0.15 | ) | | | (0.10 | ) | | | — | |
| | | | |
Total distributions* | | | (0.44 | ) | | | (0.15 | ) | | | (0.10 | ) | | | — | |
| | | | |
Net asset value, end of year | | | $11.32 | | | | $11.92 | | | | $12.19 | | | | $10.73 | |
|
Ratios and supplemental data: | |
| | | | |
Total return(b) | | | (1.15% | ) | | | (1.09% | ) | | | 14.58% | | | | 7.30% | |
| | | | |
Net assets, end of year (000) | | | $38,072 | | | | $52,169 | | | | $28,933 | | | | $4,936 | |
| | | | |
Ratio of net expenses to average net assets | | | 3.69% | (d) | | | 3.03% | (e) | | | 3.46% | (f) | | | 3.69% | (c)(g) |
| | | | |
Ratio of gross expenses to average net assets prior to expense reductions | | | 3.70% | | | | 3.03% | | | | 3.46% | | | | 4.82% | (c) |
| | | | |
Ratio of net investment income (loss) to average net assets | | | (0.42% | ) | | | (1.02% | ) | | | (2.11% | ) | | | (2.54% | )(c) |
| • | Commencement of operations. |
| * | Distribution for annual periods determined in accordance with federal income tax regulations. |
| (a) | Net investment income (loss) allocated based on average shares method. |
| (b) | Total return measures net investment income (loss) and capital gain or loss from portfolio investments assuming reinvestment of dividends and capital gains distributions. Total return is not annualized for periods that are less than a full year, does not reflect the effect of sales charge for Class A shares nor the contingent deferred sales charge for Class C shares and does not reflect the deduction of taxes that a shareholder would pay on fund distributions or the redemption of fund shares. |
| (d) | Ratio of net expenses, excluding dividend expense on short positions, to average net assets was 2.39% for the year ended October 31, 2019. |
| (e) | Ratio of net expenses, excluding dividend expense on short positions, to average net assets was 2.39% for the year ended October 31, 2018. |
| (f) | Ratio of net expenses, excluding dividend expense on short positions, to average net assets was 2.47% for the year ended October 31, 2017. |
| (g) | Ratio of net expenses, excluding dividend expense on short positions, to average net assets was 2.67% for the period ended October 31, 2016. |
| | | | |
| 208 | | CALAMOS OPEN-END FAMILY OF FUNDS ANNUAL REPORT | | |
Calamos Phineus Long/Short Fund Financial Highlights
| | | | | | | | | | | | | | | | |
| | | CLASS I | |
| | | Year Ended October 31, | | | April 5, 2016• through
October 31, | |
| | | 2019 | | | 2018 | | | 2017 | | | 2016 | |
| | | | |
Net asset value, beginning of year | | | $12.23 | | | | $12.39 | | | | $10.80 | | | | $10.00 | |
|
Income from investment operations: | |
| | | | |
Net investment income (loss)(a) | | | 0.07 | | | | 0.01 | | | | (0.13 | ) | | | (0.08 | ) |
| | | | |
Net realized and unrealized gain (loss) | | | (0.11 | ) | | | (0.02 | ) | | | 1.82 | | | | 0.88 | |
| | | | |
Total from investment operations | | | (0.04 | ) | | | (0.01 | ) | | | 1.69 | | | | 0.80 | |
|
Distributions: | |
| | | | |
Dividends from net investment income | | | — | | | | — | | | | — | | | | — | |
| | | | |
Dividends from net realized gains | | | (0.44 | ) | | | (0.15 | ) | | | (0.10 | ) | | | — | |
| | | | |
Total distributions* | | | (0.44 | ) | | | (0.15 | ) | | | (0.10 | ) | | | — | |
| | | | |
Net asset value, end of year | | | $11.75 | | | | $12.23 | | | | $12.39 | | | | $10.80 | |
|
Ratios and supplemental data: | |
| | | | |
Total return(b) | | | (0.16% | ) | | | (0.10% | ) | | | 15.70% | | | | 8.00% | |
| | | | |
Net assets, end of year (000) | | | $678,157 | | | | $1,003,457 | | | | $348,840 | | | | $56,319 | |
| | | | |
Ratio of net expenses to average net assets | | | 2.68% | (d) | | | 2.00% | (e) | | | 2.45% | (f) | | | 2.77% | (c)(g) |
| | | | |
Ratio of gross expenses to average net assets prior to expense reductions | | | 2.69% | | | | 2.00% | | | | 2.45% | | | | 4.04% | (c) |
| | | | |
Ratio of net investment income (loss) to average net assets | | | 0.57% | | | | 0.05% | | | | (1.09% | ) | | | (1.33% | )(c) |
| • | Commencement of operations. |
| * | Distribution for annual periods determined in accordance with federal income tax regulations. |
| (a) | Net investment income (loss) allocated based on average shares method. |
| (b) | Total return measures net investment income (loss) and capital gain or loss from portfolio investments assuming reinvestment of dividends and capital gains distributions. Total return is not annualized for periods that are less than a full year, does not reflect the effect of sales charge for Class A shares nor the contingent deferred sales charge for Class C shares and does not reflect the deduction of taxes that a shareholder would pay on fund distributions or the redemption of fund shares. |
| (d) | Ratio of net expenses, excluding dividend expense on short positions, to average net assets was 1.39% for the year ended October 31, 2019. |
| (e) | Ratio of net expenses, excluding dividend expense on short positions, to average net assets was 1.39% for the year ended October 31, 2018. |
| (f) | Ratio of net expenses, excluding dividend expense on short positions, to average net assets was 1.47% for the year ended October 31, 2017. |
| (g) | Ratio of net expenses, excluding dividend expense on short positions, to average net assets was 1.76% for the period ended October 31, 2016. |
Calamos Convertible Fund Financial Highlights
Selected data for a share outstanding throughout each year were as follows:
| | | | | | | | | | | | | | | | | | | | |
| | | CLASS A | |
| | | Year Ended October 31, | |
| | | 2019 | | | 2018 | | | 2017 | | | 2016 | | | 2015 | |
| | | | | |
Net asset value, beginning of year | | | $18.11 | | | | $18.27 | | | | $15.93 | | | | $16.56 | | | | $18.59 | |
|
Income from investment operations: | |
| | | | | |
Net investment income (loss)(a) | | | 0.51 | | | | 0.48 | | | | 0.49 | | | | 0.50 | | | | 0.44 | |
| | | | | |
Net realized and unrealized gain (loss) | | | 1.00 | | | | 0.13 | | | | 2.16 | | | | (0.30 | ) | | | (1.01 | ) |
| | | | | |
Total from investment operations | | | 1.51 | | | | 0.61 | | | | 2.65 | | | | 0.20 | | | | (0.57 | ) |
|
Distributions: | |
| | | | | |
Dividends from net investment income | | | (0.35 | ) | | | (0.24 | ) | | | (0.31 | ) | | | (0.56 | ) | | | (0.58 | ) |
| | | | | |
Dividends from net realized gains | | | (1.82 | ) | | | (0.53 | ) | | | — | | | | (0.27 | ) | | | (0.88 | ) |
| | | | | |
Total distributions* | | | (2.17 | ) | | | (0.77 | ) | | | (0.31 | ) | | | (0.83 | ) | | | (1.46 | ) |
| | | | | |
Net asset value, end of year | | | $17.45 | | | | $18.11 | | | | $18.27 | | | | $15.93 | | | | $16.56 | |
|
Ratios and supplemental data: | |
| | | | | |
Total return(b) | | | 10.02% | | | | 3.43% | | | | 16.88% | | | | 1.33% | | | | (3.31% | ) |
| | | | | |
Net assets, end of year (000) | | | $245,948 | | | | $210,845 | | | | $222,017 | | | | $228,334 | | | | $385,844 | |
| | | | | |
Ratio of net expenses to average net assets | | | 1.16% | | | | 1.16% | | | | 1.18% | | | | 1.15% | | | | 1.13% | |
| | | | | |
Ratio of gross expenses to average net assets prior to expense reductions | | | 1.16% | | | | 1.16% | | | | 1.18% | | | | 1.15% | | | | 1.13% | |
| | | | | |
Ratio of net investment income (loss) to average net assets | | | 2.98% | | | | 2.58% | | | | 2.87% | | | | 3.17% | | | | 2.53% | |
| |
| | | Year Ended October 31, | |
| | | 2019 | | | 2018 | | | 2017 | | | 2016 | | | 2015 | |
| | | | | |
Portfolio turnover rate | | | 36.7% | | | | 73.2% | | | | 55.7% | | | | 43.8% | | | | 63.0% | |
| * | Distribution for annual periods determined in accordance with federal income tax regulations. |
| (a) | Net investment income (loss) allocated based on average shares method. |
| (b) | Total return measures net investment income (loss) and capital gain or loss from portfolio investments assuming reinvestment of dividends and capital gains distributions. Total return is not annualized for periods that are less than a full year, does not reflect the effect of sales charge for Class A shares nor the contingent deferred sales charge for Class C shares and does not reflect the deduction of taxes that a shareholder would pay on fund distributions or the redemption of fund shares. |
| | | | |
| 210 | | CALAMOS OPEN-END FAMILY OF FUNDS ANNUAL REPORT | | |
Calamos Convertible Fund Financial Highlights
| | | | | | | | | | | | | | | | | | | | |
| | | CLASS C | |
| | | Year Ended October 31, | |
| | | 2019 | | | 2018 | | | 2017 | | | 2016 | | | 2015 | |
| | | | | |
Net asset value, beginning of year | | | $17.92 | | | | $18.09 | | | | $15.79 | | | | $16.41 | | | | $18.43 | |
|
Income from investment operations: | |
| | | | | |
Net investment income (loss)(a) | | | 0.39 | | | | 0.34 | | | | 0.36 | | | | 0.37 | | | | 0.31 | |
| | | | | |
Net realized and unrealized gain (loss) | | | 0.99 | | | | 0.12 | | | | 2.14 | | | | (0.28 | ) | | | (1.00 | ) |
| | | | | |
Total from investment operations | | | 1.38 | | | | 0.46 | | | | 2.50 | | | | 0.09 | | | | (0.69 | ) |
|
Distributions: | |
| | | | | |
Dividends from net investment income | | | (0.21 | ) | | | (0.10 | ) | | | (0.20 | ) | | | (0.44 | ) | | | (0.45 | ) |
| | | | | |
Dividends from net realized gains | | | (1.82 | ) | | | (0.53 | ) | | | — | | | | (0.27 | ) | | | (0.88 | ) |
| | | | | |
Total distributions* | | | (2.03 | ) | | | (0.63 | ) | | | (0.20 | ) | | | (0.71 | ) | | | (1.33 | ) |
| | | | | |
Net asset value, end of year | | | $17.27 | | | | $17.92 | | | | $18.09 | | | | $15.79 | | | | $16.41 | |
|
Ratios and supplemental data: | |
| | | | | |
Total return(b) | | | 9.21% | | | | 2.65% | | | | 15.99% | | | | 0.62% | | | | (4.01% | ) |
| | | | | |
Net assets, end of year (000) | | | $56,070 | | | | $128,920 | | | | $147,112 | | | | $193,339 | | | | $265,686 | |
| | | | | |
Ratio of net expenses to average net assets | | | 1.91% | | | | 1.91% | | | | 1.93% | | | | 1.90% | | | | 1.88% | |
| | | | | |
Ratio of gross expenses to average net assets prior to expense reductions | | | 1.91% | | | | 1.91% | | | | 1.93% | | | | 1.90% | | | | 1.88% | |
| | | | | |
Ratio of net investment income (loss) to average net assets | | | 2.34% | | | | 1.85% | | | | 2.14% | | | | 2.40% | | | | 1.78% | |
| |
| | | CLASS I | |
| | | Year Ended October 31, | |
| | | 2019 | | | 2018 | | | 2017 | | | 2016 | | | 2015 | |
| | | | | |
Net asset value, beginning of year | | | $16.23 | | | | $16.45 | | | | $14.38 | | | | $15.03 | | | | $17.02 | |
|
Income from investment operations: | |
| | | | | |
Net investment income (loss)(a) | | | 0.49 | | | | 0.47 | | | | 0.48 | | | | 0.49 | | | | 0.44 | |
| | | | | |
Net realized and unrealized gain (loss) | | | 0.88 | | | | 0.13 | | | | 1.95 | | | | (0.27 | ) | | | (0.93 | ) |
| | | | | |
Total from investment operations | | | 1.37 | | | | 0.60 | | | | 2.43 | | | | 0.22 | | | | (0.49 | ) |
|
Distributions: | |
| | | | | |
Dividends from net investment income | | | (0.40 | ) | | | (0.29 | ) | | | (0.36 | ) | | | (0.60 | ) | | | (0.62 | ) |
| | | | | |
Dividends from net realized gains | | | (1.82 | ) | | | (0.53 | ) | | | — | | | | (0.27 | ) | | | (0.88 | ) |
| | | | | |
Total distributions* | | | (2.22 | ) | | | (0.82 | ) | | | (0.36 | ) | | | (0.87 | ) | | | (1.50 | ) |
| | | | | |
Net asset value, end of year | | | $15.38 | | | | $16.23 | | | | $16.45 | | | | $14.38 | | | | $15.03 | |
|
Ratios and supplemental data: | |
| | | | | |
Total return(b) | | | 10.31% | | | | 3.73% | | | | 17.14% | | | | 1.64% | | | | (3.11% | ) |
| | | | | |
Net assets, end of year (000) | | | $442,907 | | | | $275,776 | | | | $233,077 | | | | $238,309 | | | | $455,702 | |
| | | | | |
Ratio of net expenses to average net assets | | | 0.91% | | | | 0.91% | | | | 0.93% | | | | 0.90% | | | | 0.88% | |
| | | | | |
Ratio of gross expenses to average net assets prior to expense reductions | | | 0.91% | | | | 0.91% | | | | 0.93% | | | | 0.90% | | | | 0.88% | |
| | | | | |
Ratio of net investment income (loss) to average net assets | | | 3.21% | | | | 2.83% | | | | 3.12% | | | | 3.48% | | | | 2.77% | |
| * | Distribution for annual periods determined in accordance with federal income tax regulations. |
| (a) | Net investment income (loss) allocated based on average shares method. |
| (b) | Total return measures net investment income (loss) and capital gain or loss from portfolio investments assuming reinvestment of dividends and capital gains distributions. Total return is not annualized for periods that are less than a full year, does not reflect the effect of sales charge for Class A shares nor the contingent deferred sales charge for Class C shares and does not reflect the deduction of taxes that a shareholder would pay on fund distributions or the redemption of fund shares. |
Calamos Global Convertible Fund Financial Highlights
Selected data for a share outstanding throughout each year were as follows:
| | | | | | | | | | | | | | | | | | | | |
| | | CLASS A | |
| | | Year Ended October 31, | | | December 31, 2014• through October 31, | |
| | | 2019 | | | 2018 | | | 2017 | | | 2016 | | | 2015 | |
| | | | | |
Net asset value, beginning of year | | | $10.81 | | | | $11.24 | | | | $9.89 | | | | $9.93 | | | | $10.00 | |
|
Income from investment operations: | |
| | | | | |
Net investment income (loss)(a) | | | 0.10 | | | | 0.33 | | | | 0.25 | | | | 0.26 | | | | 0.13 | |
| | | | | |
Net realized and unrealized gain (loss) | | | 0.70 | | | | (0.34 | ) | | | 1.21 | | | | (0.14 | ) | | | (0.13 | ) |
| | | | | |
Total from investment operations | | | 0.80 | | | | (0.01 | ) | | | 1.46 | | | | 0.12 | | | | — | |
|
Distributions: | |
| | | | | |
Dividends from net investment income | | | (0.22 | ) | | | (0.08 | ) | | | (0.11 | ) | | | (0.16 | ) | | | (0.07 | ) |
| | | | | |
Dividends from net realized gains | | | (0.31 | ) | | | (0.34 | ) | | | — | | | | — | | | | — | |
| | | | | |
Total distributions* | | | (0.53 | ) | | | (0.42 | ) | | | (0.11 | ) | | | (0.16 | ) | | | (0.07 | ) |
| | | | | |
Net asset value, end of year | | | $11.08 | | | | $10.81 | | | | $11.24 | | | | $9.89 | | | | $9.93 | |
|
Ratios and supplemental data: | |
| | | | | |
Total return(b) | | | 7.90% | | | | (0.09% | ) | | | 14.86% | | | | 1.27% | | | | —% | |
| | | | | |
Net assets, end of year (000) | | | $8,998 | | | | $11,184 | | | | $12,713 | | | | $29,037 | | | | $20,550 | |
| | | | | |
Ratio of net expenses to average net assets | | | 1.32% | | | | 1.34% | | | | 1.35% | | | | 1.35% | | | | 1.35% | (c) |
| | | | | |
Ratio of gross expenses to average net assets prior to expense reductions | | | 1.32% | | | | 1.35% | | | | 1.45% | | | | 1.46% | | | | 2.30% | (c) |
| | | | | |
Ratio of net investment income (loss) to average net assets | | | 0.91% | | | | 2.98% | | | | 2.46% | | | | 2.64% | | | | 1.56% | (c) |
| | |
| | | Year Ended October 31, | | | December 31, 2014• through October 31, | |
| | | 2019 | | | 2018 | | | 2017 | | | 2016 | | | 2015 | |
| | | | | |
Portfolio turnover rate | | | 45.4% | | | | 32.0% | | | | 52.2% | | | | 38.4% | | | | 28.2% | |
| • | Commencement of operations. |
| * | Distribution for annual periods determined in accordance with federal income tax regulations. |
| (a) | Net investment income (loss) allocated based on average shares method. |
| (b) | Total return measures net investment income (loss) and capital gain or loss from portfolio investments assuming reinvestment of dividends and capital gains distributions. Total return is not annualized for periods that are less than a full year, does not reflect the effect of sales charge for Class A shares nor the contingent deferred sales charge for Class C shares and does not reflect the deduction of taxes that a shareholder would pay on fund distributions or the redemption of fund shares. |
| | | | |
| 212 | | CALAMOS OPEN-END FAMILY OF FUNDS ANNUAL REPORT | | |
Calamos Global Convertible Fund Financial Highlights
| | | | | | | | | | | | | | | | | | | | |
| | | CLASS C | |
| | | Year Ended October 31, | | | December 31, 2014• through October 31, | |
| | | 2019 | | | 2018 | | | 2017 | | | 2016 | | | 2015 | |
| | | | | |
Net asset value, beginning of year | | | $10.69 | | | | $11.14 | | | | $9.85 | | | | $9.90 | | | | $10.00 | |
|
Income from investment operations: | |
| | | | | |
Net investment income (loss)(a) | | | 0.02 | | | | 0.24 | | | | 0.16 | | | | 0.18 | | | | 0.07 | |
| | | | | |
Net realized and unrealized gain (loss) | | | 0.69 | | | | (0.33 | ) | | | 1.21 | | | | (0.13 | ) | | | (0.12 | ) |
| | | | | |
Total from investment operations | | | 0.71 | | | | (0.09 | ) | | | 1.37 | | | | 0.05 | | | | (0.05 | ) |
|
Distributions: | |
| | | | | |
Dividends from net investment income | | | (0.16 | ) | | | (0.02 | ) | | | (0.08 | ) | | | (0.10 | ) | | | (0.05 | ) |
| | | | | |
Dividends from net realized gains | | | (0.31 | ) | | | (0.34 | ) | | | — | | | | — | | | | — | |
| | | | | |
Total distributions* | | | (0.47 | ) | | | (0.36 | ) | | | (0.08 | ) | | | (0.10 | ) | | | (0.05 | ) |
| | | | | |
Net asset value, end of year | | | $10.93 | | | | $10.69 | | | | $11.14 | | | | $9.85 | | | | $9.90 | |
|
Ratios and supplemental data: | |
| | | | | |
Total return(b) | | | 7.01% | | | | (0.77% | ) | | | 13.95% | | | | 0.50% | | | | (0.52% | ) |
| | | | | |
Net assets, end of year (000) | | | $3,409 | | | | $3,884 | | | | $2,887 | | | | $2,440 | | | | $1,259 | |
| | | | | |
Ratio of net expenses to average net assets | | | 2.07% | | | | 2.09% | | | | 2.10% | | | | 2.10% | | | | 2.10% | (c) |
| | | | | |
Ratio of gross expenses to average net assets prior to expense reductions | | | 2.07% | | | | 2.10% | | | | 2.19% | | | | 2.21% | | | | 2.88% | (c) |
| | | | | |
Ratio of net investment income (loss) to average net assets | | | 0.16% | | | | 2.21% | | | | 1.54% | | | | 1.89% | | | | 0.84% | (c) |
| |
| | | CLASS I | |
| | | Year Ended October 31, | | | December 31, 2014• through October 31, | |
| | | 2019 | | | 2018 | | | 2017 | | | 2016 | | | 2015 | |
| | | | | |
Net asset value, beginning of year | | | $10.82 | | | | $11.24 | | | | $9.92 | | | | $9.95 | | | | $10.00 | |
|
Income from investment operations: | |
| | | | | |
Net investment income (loss)(a) | | | 0.12 | | | | 0.36 | | | | 0.26 | | | | 0.28 | | | | 0.15 | |
| | | | | |
Net realized and unrealized gain (loss) | | | 0.70 | | | | (0.33 | ) | | | 1.21 | | | | (0.13 | ) | | | (0.12 | ) |
| | | | | |
Total from investment operations | | | 0.82 | | | | 0.03 | | | | 1.47 | | | | 0.15 | | | | 0.03 | |
|
Distributions: | |
| | | | | |
Dividends from net investment income | | | (0.25 | ) | | | (0.11 | ) | | | (0.15 | ) | | | (0.18 | ) | | | (0.08 | ) |
| | | | | |
Dividends from net realized gains | | | (0.31 | ) | | | (0.34 | ) | | | — | | | | — | | | | — | |
| | | | | |
Total distributions* | | | (0.56 | ) | | | (0.45 | ) | | | (0.15 | ) | | | (0.18 | ) | | | (0.08 | ) |
| | | | | |
Net asset value, end of year | | | $11.08 | | | | $10.82 | | | | $11.24 | | | | $9.92 | | | | $9.95 | |
|
Ratios and supplemental data: | |
| | | | | |
Total return(b) | | | 8.09% | | | | 0.24% | | | | 14.98% | | | | 1.60% | | | | 0.29% | |
| | | | | |
Net assets, end of year (000) | | | $120,526 | | | | $121,170 | | | | $91,086 | | | | $47,637 | | | | $23,054 | |
| | | | | |
Ratio of net expenses to average net assets | | | 1.07% | | | | 1.09% | | | | 1.10% | | | | 1.10% | | | | 1.10% | (c) |
| | | | | |
Ratio of gross expenses to average net assets prior to expense reductions | | | 1.07% | | | | 1.10% | | | | 1.18% | | | | 1.21% | | | | 1.80% | (c) |
| | | | | |
Ratio of net investment income (loss) to average net assets | | | 1.16% | | | | 3.22% | | | | 2.47% | | | | 2.88% | | | | 1.81% | (c) |
| • | Commencement of operations. |
| * | Distribution for annual periods determined in accordance with federal income tax regulations. |
| (a) | Net investment income (loss) allocated based on average shares method. |
| (b) | Total return measures net investment income (loss) and capital gain or loss from portfolio investments assuming reinvestment of dividends and capital gains distributions. Total return is not annualized for periods that are less than a full year, does not reflect the effect of sales charge for Class A shares nor the contingent deferred sales charge for Class C shares and does not reflect the deduction of taxes that a shareholder would pay on fund distributions or the redemption of fund shares. |
Calamos Timpani Small Cap Growth Fund Financial Highlights
Selected data for a share outstanding throughout each year were as follows:
| | | | | | | | | | | | | | | | | | | | | | | | |
| | | CLASS A* | |
| | | May 31, 2019
through October 31, | | | July 1, 2018 through May 31, | | | Year Ended June 30, | |
| | | 2019 | | | 2019† | | | 2018 | | | 2017 | | | 2016 | | | 2015 | |
| | | | | | |
Net asset value, beginning of year | | | $22.51 | | | | $25.02 | | | | $18.54 | | | | $14.62 | | | | $18.48 | | | | $16.04 | |
|
Income from investment operations: | |
| | | | | | |
Net investment income (loss)(a) | | | (0.11 | ) | | | (0.29 | ) | | | (0.28 | ) | | | (0.18 | ) | | | (0.18 | ) | | | (0.23 | ) |
| | | | | | |
Net realized and unrealized gain (loss) | | | (0.09 | ) | | | (0.80 | ) | | | 6.76 | | | | 4.10 | | | | (3.68 | ) | | | 2.67 | |
| | | | | | |
Total from investment operations | | | (0.20 | ) | | | (1.09 | ) | | | 6.48 | | | | 3.92 | | | | (3.86 | ) | | | 2.44 | |
|
Distributions: | |
| | | | | | |
Dividends from net investment income | | | — | | | | — | | | | — | | | | — | | | | — | | | | — | |
| | | | | | |
Dividends from net realized gains | | | — | | | | (1.42 | ) | | | — | | | | — | | | | — | | | | — | |
| | | | | | |
Total distributions** | | | — | | | | (1.42 | ) | | | — | | | | — | | | | — | | | | — | |
| | | | | | |
Net asset value, end of year | | | $22.31 | | | | $22.51 | | | | $25.02 | | | | $18.54 | | | | $14.62 | | | | $18.48 | |
|
Ratios and supplemental data: | |
| | | | | | |
Total return(b) | | | (0.89% | ) | | | (3.52% | ) | | | 34.95% | | | | 26.81% | | | | (20.84% | ) | | | 15.15% | |
| | | | | | |
Net assets, end of year (000) | | | $6,857 | | | | $5,551 | | | | $5,890 | | | | $3,954 | | | | $3,369 | | | | $2,262 | |
| | | | | | |
Ratio of net expenses to average net assets | | | 1.30% | (c) | | | 1.50% | (c) | | | 1.50% | | | | 1.50% | | | | 1.50% | | | | 1.50% | |
| | | | | | |
Ratio of gross expenses to average net assets prior to expense reductions | | | 1.35% | (c) | | | 1.71% | (c) | | | 1.74% | | | | 1.75% | | | | 1.70% | | | | 1.95% | |
| | | | | | |
Ratio of net investment income (loss) to average net assets | | | (1.18% | )(c) | | | (1.31% | )(c) | | | (1.33% | ) | | | (1.10% | ) | | | (1.16% | ) | | | (1.37% | ) |
| | | |
| | | May 31, 2019
through
October 31, | | | July 1, 2018
through
May 31, | | | Year Ended June 30, | |
| | | 2019 | | | 2019† | | | 2018 | | | 2017 | | | 2016 | | | 2015 | |
| | | | | | |
Portfolio turnover rate | | | 141.7% | | | | 112.3% | | | | 126.0% | | | | 179.0% | | | | 156.0% | | | | 124.0% | |
| * | Prior to May 31, 2019, Class A shares were Class Y shares of the predecessor fund. |
| ** | Distribution for annual periods determined in accordance with federal income tax regulations. |
| (a) | Net investment income (loss) allocated based on average shares method. |
| (b) | Total return measures net investment income (loss) and capital gain or loss from portfolio investments assuming reinvestment of dividends and capital gains distributions. Total return is not annualized for periods that are less than a full year, does not reflect the effect of sales charge for Class A shares and does not reflect the deduction of taxes that a shareholder would pay on fund distributions or the redemption of fund shares. |
| † | Pursuant to the Reorganization of the Predecessor Fund into the Fund, Class Y shareholders of the Predecessor Fund received Class A shares of the Fund, and Service Class and Institutional Class shareholders of the Predecessor Fund each received Class I shares of the Fund. As a result of the Reorganization, the Fund adopted the performance and financial history of the Predecessor Fund. Accordingly, the data shown for periods prior to May 31, 2019 is the data of the Predecessor Fund. |
| | | | |
| 214 | | CALAMOS OPEN-END FAMILY OF FUNDS ANNUAL REPORT | | |
Calamos Timpani Small Cap Growth Fund Financial Highlights
Selected data for a share outstanding throughout each year were as follows:
| | | | | | | | | | | | | | | | | | | | | | | | |
| | | CLASS I* | |
| | | May 31, 2019 through October 31, | | | July 1, 2018 through May 31, | | | Year Ended June 30, | |
| | | 2019 | | | 2019† | | | 2018 | | | 2017 | | | 2016 | | | 2015 | |
| | | | | | |
Net asset value, beginning of year | | | $23.02 | | | | $25.47 | | | | $18.80 | | | | $14.77 | | | | $18.58 | | | | $16.06 | |
|
Income from investment operations: | |
| | | | | | |
Net investment income (loss)(a) | | | (0.09 | ) | | | (0.20 | ) | | | (0.20 | ) | | | (0.10 | ) | | | (0.12 | ) | | | (0.16 | ) |
| | | | | | |
Net realized and unrealized gain (loss) | | | (0.08 | ) | | | (0.83 | ) | | | 6.87 | | | | 4.13 | | | | (3.69 | ) | | | 2.68 | |
| | | | | | |
Total from investment operations | | | (0.17 | ) | | | (1.03 | ) | | | 6.67 | | | | 4.03 | | | | (3.81 | ) | | | 2.52 | |
|
Distributions: | |
| | | | | | |
Dividends from net investment income | | | — | | | | — | | | | — | | | | — | | | | — | | | | — | |
| | | | | | |
Dividends from net realized gains | | | — | | | | (1.42 | ) | | | — | | | | — | | | | — | | | | — | |
| | | | | | |
Total distributions** | | | — | | | | (1.42 | ) | | | — | | | | — | | | | — | | | | — | |
| | | | | | |
Net asset value, end of year | | | $22.85 | | | | $23.02 | | | | $25.47 | | | | $18.80 | | | | $14.77 | | | | $18.58 | |
|
Ratios and supplemental data: | |
| | | | | | |
Total return(b) | | | (0.74% | ) | | | (3.21% | ) | | | 35.48% | | | | 27.29% | | | | (20.51% | ) | | | 15.62% | |
| | | | | | |
Net assets, end of year (000) | | | $72,539 | | | | $68,510 | | | | $69,095 | | | | $43,833 | | | | $52,595 | | | | $47,455 | |
| | | | | | |
Ratio of net expenses to average net assets | | | 1.05% | (c) | | | 1.10% | (c) | | | 1.10% | | | | 1.10% | | | | 1.10% | | | | 1.10% | |
| | | | | | |
Ratio of gross expenses to average net assets prior to expense reductions | | | 1.11% | (c) | | | 1.34% | (c) | | | 1.36% | | | | 1.36% | | | | 1.32% | | | | 1.52% | |
| | | | | | |
Ratio of net investment income (loss) to average net assets | | | (0.93% | )(c) | | | (0.92% | )(c) | | | (0.92% | ) | | | (0.64% | ) | | | (0.77% | ) | | | (0.95% | ) |
| * | Prior to May 31, 2019, Class I shares were Institutional Class shares or Service Class shares of the predecessor fund. Results shown are exclusive of the Service Class shares. |
| ** | Distribution for annual periods determined in accordance with federal income tax regulations. |
| (a) | Net investment income (loss) allocated based on average shares method. |
| (b) | Total return measures net investment income (loss) and capital gain or loss from portfolio investments assuming reinvestment of dividends and capital gains distributions. Total return is not annualized for periods that are less than a full year, does not reflect the effect of sales charge for Class A shares and does not reflect the deduction of taxes that a shareholder would pay on fund distributions or the redemption of fund shares. |
| † | Pursuant to the Reorganization of the Predecessor Fund into the Fund, Class Y shareholders of the Predecessor Fund received Class A shares of the Fund, and Service Class and Institutional Class shareholders of the Predecessor Fund each received Class I shares of the Fund. As a result of the Reorganization, the Fund adopted the performance and financial history of the Predecessor Fund. Accordingly, the data shown for periods prior to May 31, 2019 is the data of the Predecessor Fund. |
Calamos Timpani Small Cap Growth Fund Financial Highlights
Selected data for a share outstanding throughout each year were as follows:
| | | | |
| | | CLASS R6 | |
| | | May 31, 2019•
through
October 31, | |
| | | 2019 | |
| |
Net asset value, beginning of year | | | $23.02 | |
| |
Income from investment operations: | | | | |
| |
Net investment income (loss)(a) | | | (0.08 | ) |
| |
Net realized and unrealized gain (loss) | | | (0.08 | ) |
| |
Total from investment operations | | | (0.16 | ) |
| |
Distributions: | | | | |
| |
Dividends from net investment income | | | — | |
| |
Net asset value, end of year | | | $22.86 | |
| |
Ratios and supplemental data: | | | | |
| |
Total return(b) | | | (0.70% | ) |
| |
Net assets, end of year (000) | | | $1,063 | |
| |
Ratio of net expenses to average net assets | | | 1.00% | (c) |
| |
Ratio of gross expenses to average net assets prior to expense reductions | | | 0.96% | (c) |
| |
Ratio of net investment income (loss) to average net assets | | | (0.84% | )(c) |
| • | Commencement of operations. |
| (a) | Net investment income (loss) allocated based on average shares method. |
| (b) | Total return measures net investment income (loss) and capital gain or loss from portfolio investments assuming reinvestment of dividends and capital gains distributions. Total return is not annualized for periods that are less than a full year. |
| | | | |
| 216 | | CALAMOS OPEN-END FAMILY OF FUNDS ANNUAL REPORT | | |
Calamos Timpani SMID Growth Fund Financial Highlights
Selected data for a share outstanding throughout each period were as follows:
| | | | |
| | | CLASS A | |
| | | July 31, 2019•
through
October 31, | |
| | | 2019 | |
| |
Net asset value, beginning of period | | | $10.00 | |
| |
Income from investment operations: | | | | |
| |
Net investment income (loss)(a) | | | (0.03 | ) |
| |
Net realized and unrealized gain (loss) | | | (0.96 | ) |
| |
Total from investment operations | | | (0.99 | ) |
| |
Distributions: | | | | |
| |
Dividends from net investment income | | | — | |
| |
Dividends from net realized gains | | | — | |
| |
Total distributions* | | | — | |
| |
Net asset value, end of year | | | $9.01 | |
| |
Ratios and supplemental data: | | | | |
| |
Total return(b) | | | (9.90% | ) |
| |
Net assets, end of year (000) | | | $9 | |
| |
Ratio of net expenses to average net assets | | | 1.37% | (c) |
| |
Ratio of gross expenses to average net assets prior to expense reductions | | | 3.42% | (c) |
| |
Ratio of net investment income (loss) to average net assets | | | (1.11% | )(c) |
| |
| | | July 31, 2019•
through
October 31,
2019 | |
| |
Portfolio turnover rate | | | 55.0% | |
| • | Commencement of operations. |
| * | Distribution for annual periods determined in accordance with federal income tax regulations. |
| (a) | Net investment income (loss) allocated based on average shares method. |
| (b) | Total return measures net investment income (loss) and capital gain or loss from portfolio investments assuming reinvestment of dividends and capital gains distributions. Total return is not annualized for periods that are less than a full year, does not reflect the effect of sales charge for Class A shares. |
Calamos Timpani SMID Growth Fund Financial Highlights
Selected data for a share outstanding throughout each period were as follows:
| | | | |
| | | CLASS I | |
| | | July 31, 2019• through
October 31, | |
| | | 2019 | |
| |
Net asset value, beginning of period | | | $10.00 | |
| |
Income from investment operations: | | | | |
| |
Net investment income (loss)(a) | | | (0.02 | ) |
| |
Net realized and unrealized gain (loss) | | | (0.96 | ) |
| |
Total from investment operations | | | (0.98 | ) |
| |
Distributions: | | | | |
| |
Dividends from net investment income | | | — | |
| |
Dividends from net realized gains | | | — | |
| |
Total distributions* | | | — | |
| |
Net asset value, end of year | | | $9.02 | |
| |
Ratios and supplemental data: | | | | |
| |
Total return(b) | | | (9.80% | ) |
| |
Net assets, end of year (000) | | | $9,348 | |
| |
Ratio of net expenses to average net assets | | | 1.10% | (c) |
| |
Ratio of gross expenses to average net assets prior to expense reductions | | | 3.17% | (c) |
| |
Ratio of net investment income (loss) to average net assets | | | (0.85% | )(c) |
| • | Commencement of operations. |
| * | Distribution for annual periods determined in accordance with federal income tax regulations. |
| (a) | Net investment income (loss) allocated based on average shares method. |
| (b) | Total return measures net investment income (loss) and capital gain or loss from portfolio investments assuming reinvestment of dividends and capital gains distributions. Total return is not annualized for periods that are less than a full year. |
| | | | |
| 218 | | CALAMOS OPEN-END FAMILY OF FUNDS ANNUAL REPORT | | |
Calamos Timpani SMID Growth Fund Financial Highlights
Selected data for a share outstanding throughout each period were as follows:
| | | | |
| | | CLASS R6 | |
| | | July 31, 2019• through
October 31, | |
| | | 2019 | |
| |
Net asset value, beginning of period | | | $10.00 | |
| |
Income from investment operations: | | | | |
| |
Net investment income (loss)(a) | | | (0.02 | ) |
| |
Net realized and unrealized gain (loss) | | | (0.96 | ) |
| |
Total from investment operations | | | (0.98 | ) |
| |
Distributions: | | | | |
| |
Dividends from net investment income | | | — | |
| |
Net asset value, end of year | | | $9.02 | |
| |
Ratios and supplemental data: | | | | |
| |
Total return(b) | | | (9.80% | ) |
| |
Net assets, end of year (000) | | | $9 | |
| |
Ratio of net expenses to average net assets | | | 1.07% | (c) |
| |
Ratio of gross expenses to average net assets prior to expense reductions | | | 3.16% | (c) |
| |
Ratio of net investment income (loss) to average net assets | | | (0.81% | )(c) |
| • | Commencement of operations. |
| (a) | Net investment income (loss) allocated based on average shares method. |
| (b) | Total return measures net investment income (loss) and capital gain or loss from portfolio investments assuming reinvestment of dividends and capital gains distributions. Total return is not annualized for periods that are less than a full year. |
Calamos Growth Fund Financial Highlights
Selected data for a share outstanding throughout each year were as follows:
| | | | | | | | | | | | | | | | | | | | |
| | | CLASS A | |
| | | Year Ended October 31, | |
| | | 2019 | | | 2018 | | | 2017 | | | 2016 | | | 2015 | |
| | | | | |
Net asset value, beginning of year | | | $33.14 | | | | $35.54 | | | | $30.12 | | | | $42.80 | | | | $50.16 | |
|
Income from investment operations: | |
| | | | | |
Net investment income (loss)(a) | | | (0.04 | ) | | | (0.08 | ) | | | (0.17 | ) | | | (0.07 | ) | | | (0.07 | ) |
| | | | | |
Net realized and unrealized gain (loss) | | | 3.53 | | | | 2.15 | | | | 6.79 | | | | (1.67 | ) | | | 2.84 | |
| | | | | |
Total from investment operations | | | 3.49 | | | | 2.07 | | | | 6.62 | | | | (1.74 | ) | | | 2.77 | |
|
Distributions: | |
| | | | | |
Dividends from net investment income | | | — | | | | — | | | | — | | | | — | | | | — | |
| | | | | |
Dividends from net realized gains | | | (4.40 | ) | | | (4.47 | ) | | | (1.20 | ) | | | (10.94 | ) | | | (10.13 | ) |
| | | | | |
Total distributions* | | | (4.40 | ) | | | (4.47 | ) | | | (1.20 | ) | | | (10.94 | ) | | | (10.13 | ) |
| | | | | |
Net asset value, end of year | | | $32.23 | | | | $33.14 | | | | $35.54 | | | | $30.12 | | | | $42.80 | |
|
Ratios and supplemental data: | |
| | | | | |
Total return(b) | | | 13.97% | | | | 6.12% | | | | 22.79% | | | | (4.76% | ) | | | 6.55% | |
| | | | | |
Net assets, end of year (000) | | | $1,066,939 | | | | $851,590 | | | | $967,725 | | | | $1,017,541 | | | | $1,424,967 | |
| | | | | |
Ratio of net expenses to average net assets | | | 1.34% | | | | 1.29% | | | | 1.39% | | | | 1.34% | | | | 1.31% | |
| | | | | |
Ratio of gross expenses to average net assets prior to expense reductions | | | 1.34% | | | | 1.29% | | | | 1.39% | | | | 1.34% | | | | 1.31% | |
| | | | | |
Ratio of net investment income (loss) to average net assets | | | (0.12% | ) | | | (0.22% | ) | | | (0.52% | ) | | | (0.21% | ) | | | (0.17% | ) |
| |
| | | Year Ended October 31, | |
| | | 2019 | | | 2018 | | | 2017 | | | 2016 | | | 2015 | |
| | | | | |
Portfolio turnover rate | | | 68.9% | | | | 71.7% | | | | 104.4% | | | | 90.0% | | | | 60.0% | |
| * | Distribution for annual periods determined in accordance with federal income tax regulations. |
| (a) | Net investment income (loss) allocated based on average shares method. |
| (b) | Total return measures net investment income (loss) and capital gain or loss from portfolio investments assuming reinvestment of dividends and capital gains distributions. Total return is not annualized for periods that are less than a full year, does not reflect the effect of sales charge for Class A shares nor the contingent deferred sales charge for Class B and C shares and does not reflect the deduction of taxes that a shareholder would pay on fund distributions or the redemption of fund shares. |
| | | | |
| 220 | | CALAMOS OPEN-END FAMILY OF FUNDS ANNUAL REPORT | | |
Calamos Growth Fund Financial Highlights
| | | | | | | | | | | | | | | | | | | | |
| | | CLASS C | |
| | | Year Ended October 31, | |
| | | 2019 | | | 2018 | | | 2017 | | | 2016 | | | 2015 | |
| | | | | |
Net asset value, beginning of year | | | $21.00 | | | | $24.26 | | | | $21.08 | | | | $33.48 | | | | $41.66 | |
|
Income from investment operations: | |
| | | | | |
Net investment income (loss)(a) | | | (0.13 | ) | | | (0.22 | ) | | | (0.28 | ) | | | (0.21 | ) | | | (0.32 | ) |
| | | | | |
Net realized and unrealized gain (loss) | | | 1.79 | | | | 1.43 | | | | 4.66 | | | | (1.25 | ) | | | 2.27 | |
| | | | | |
Total from investment operations | | | 1.66 | | | | 1.21 | | | | 4.38 | | | | (1.46 | ) | | | 1.95 | |
|
Distributions: | |
| | | | | |
Dividends from net investment income | | | — | | | | — | | | | — | | | | — | | | | — | |
| | | | | |
Dividends from net realized gains | | | (4.40 | ) | | | (4.47 | ) | | | (1.20 | ) | | | (10.94 | ) | | | (10.13 | ) |
| | | | | |
Total distributions* | | | (4.40 | ) | | | (4.47 | ) | | | (1.20 | ) | | | (10.94 | ) | | | (10.13 | ) |
| | | | | |
Net asset value, end of year | | | $18.26 | | | | $21.00 | | | | $24.26 | | | | $21.08 | | | | $33.48 | |
|
Ratios and supplemental data: | |
| | | | | |
Total return(b) | | | 13.18% | | | | 5.34% | | | | 21.85% | | | | (5.45% | ) | | | 5.75% | |
| | | | | |
Net assets, end of year (000) | | | $50,442 | | | | $329,883 | | | | $398,115 | | | | $540,422 | | | | $792,046 | |
| | | | | |
Ratio of net expenses to average net assets | | | 2.11% | | | | 2.04% | | | | 2.14% | | | | 2.09% | | | | 2.06% | |
| | | | | |
Ratio of gross expenses to average net assets prior to expense reductions | | | 2.12% | | | | 2.04% | | | | 2.14% | | | | 2.09% | | | | 2.06% | |
| | | | | |
Ratio of net investment income (loss) to average net assets | | | (0.73% | ) | | | (0.97% | ) | | | (1.26% | ) | | | (0.96% | ) | | | (0.92% | ) |
| |
| | | CLASS I | |
| | | Year Ended October 31, | |
| | | 2019 | | | 2018 | | | 2017 | | | 2016 | | | 2015 | |
| | | | | |
Net asset value, beginning of year | | | $43.48 | | | | $45.18 | | | | $37.88 | | | | $50.84 | | | | $57.59 | |
|
Income from investment operations: | |
| | | | | |
Net investment income (loss)(a) | | | 0.06 | | | | 0.02 | | | | (0.11 | ) | | | 0.02 | | | | 0.05 | |
| | | | | |
Net realized and unrealized gain (loss) | | | 4.99 | | | | 2.75 | | | | 8.61 | | | | (2.04 | ) | | | 3.33 | |
| | | | | |
Total from investment operations | | | 5.05 | | | | 2.77 | | | | 8.50 | | | | (2.02 | ) | | | 3.38 | |
|
Distributions: | |
| | | | | |
Dividends from net investment income | | | — | | | | — | | | | — | | | | — | | | | — | |
| | | | | |
Dividends from net realized gains | | | (4.40 | ) | | | (4.47 | ) | | | (1.20 | ) | | | (10.94 | ) | | | (10.13 | ) |
| | | | | |
Total distributions* | | | (4.40 | ) | | | (4.47 | ) | | | (1.20 | ) | | | (10.94 | ) | | | (10.13 | ) |
| | | | | |
Net asset value, end of year | | | $44.13 | | | | $43.48 | | | | $45.18 | | | | $37.88 | | | | $50.84 | |
|
Ratios and supplemental data: | |
| | | | | |
Total return(b) | | | 14.24% | | | | 6.41% | | | | 23.09% | | | | (4.51% | ) | | | 6.80% | |
| | | | | |
Net assets, end of year (000) | | | $280,294 | | | | $282,061 | | | | $301,237 | | | | $327,872 | | | | $480,028 | |
| | | | | |
Ratio of net expenses to average net assets | | | 1.09% | | | | 1.04% | | | | 1.14% | | | | 1.09% | | | | 1.06% | |
| | | | | |
Ratio of gross expenses to average net assets prior to expense reductions | | | 1.09% | | | | 1.04% | | | | 1.14% | | | | 1.09% | | | | 1.06% | |
| | | | | |
Ratio of net investment income (loss) to average net assets | | | 0.15% | | | | 0.03% | | | | (0.27% | ) | | | 0.04% | | | | 0.09% | |
| * | Distribution for annual periods determined in accordance with federal income tax regulations. |
| (a) | Net investment income (loss) allocated based on average shares method. |
| (b) | Total return measures net investment income (loss) and capital gain or loss from portfolio investments assuming reinvestment of dividends and capital gains distributions. Total return is not annualized for periods that are less than a full year, does not reflect the effect of sales charge for Class A shares nor the contingent deferred sales charge for Class C shares and does not reflect the deduction of taxes that a shareholder would pay on fund distributions or the redemption of fund shares. |
Calamos Growth and Income Fund Financial Highlights
Selected data for a share outstanding throughout each year were as follows:
| | | | | | | | | | | | | | | | | | | | |
| | | CLASS A | |
| | | Year Ended October 31, | |
| | | 2019 | | | 2018 | | | 2017 | | | 2016 | | | 2015 | |
| | | | | |
Net asset value, beginning of year | | | $32.53 | | | | $33.15 | | | | $30.17 | | | | $31.68 | | | | $35.22 | |
|
Income from investment operations: | |
| | | | | |
Net investment income (loss)(a) | | | 0.32 | | | | 0.25 | | | | 0.49 | | | | 0.48 | | | | 0.60 | |
| | | | | |
Net realized and unrealized gain (loss) | | | 2.99 | | | | 1.41 | | | | 4.53 | | | | 0.16 | | | | 0.51 | |
| | | | | |
Total from investment operations | | | 3.31 | | | | 1.66 | | | | 5.02 | | | | 0.64 | | | | 1.11 | |
|
Distributions: | |
| | | | | |
Dividends from net investment income | | | (0.50 | ) | | | (0.38 | ) | | | (0.84 | ) | | | (0.84 | ) | | | (0.89 | ) |
| | | | | |
Dividends from net realized gains | | | (1.91 | ) | | | (1.90 | ) | | | (1.20 | ) | | | (1.31 | ) | | | (3.76 | ) |
| | | | | |
Total distributions* | | | (2.41 | ) | | | (2.28 | ) | | | (2.04 | ) | | | (2.15 | ) | | | (4.65 | ) |
| | | | | |
Net asset value, end of year | | | $33.43 | | | | $32.53 | | | | $33.15 | | | | $30.17 | | | | $31.68 | |
|
Ratios and supplemental data: | |
| | | | | |
Total return(b) | | | 11.51% | | | | 5.20% | | | | 17.39% | | | | 2.26% | | | | 3.50% | |
| | | | | |
Net assets, end of year (000) | | | $1,129,201 | | | | $832,433 | | | | $918,695 | | | | $930,625 | | | | $1,105,102 | |
| | | | | |
Ratio of net expenses to average net assets | | | 1.09% | | | | 1.09% | | | | 1.11% | | | | 1.11% | | | | 1.10% | |
| | | | | |
Ratio of gross expenses to average net assets prior to expense reductions | | | 1.09% | | | | 1.09% | | | | 1.11% | | | | 1.11% | | | | 1.10% | |
| | | | | |
Ratio of net investment income (loss) to average net assets | | | 1.01% | | | | 0.77% | | | | 1.58% | | | | 1.59% | | | | 1.86% | |
| |
| | | Year Ended October 31, | |
| | | 2019 | | | 2018 | | | 2017 | | | 2016 | | | 2015 | |
| | | | | |
Portfolio turnover rate | | | 18.5% | | | | 25.3% | | | | 31.6% | | | | 23.5% | | | | 23.8% | |
| * | Distribution for annual periods determined in accordance with federal income tax regulations. |
| (a) | Net investment income (loss) allocated based on average shares method. |
| (b) | Total return measures net investment income (loss) and capital gain or loss from portfolio investments assuming reinvestment of dividends and capital gains distributions. Total return is not annualized for periods that are less than a full year, does not reflect the effect of sales charge for Class A shares nor the contingent deferred sales charge for Class B and C shares and does not reflect the deduction of taxes that a shareholder would pay on fund distributions or the redemption of fund shares. |
| | | | |
| 222 | | CALAMOS OPEN-END FAMILY OF FUNDS ANNUAL REPORT | | |
Calamos Growth and Income Fund Financial Highlights
| | | | | | | | | | | | | | | | | | | | |
| | | CLASS C | |
| | | Year Ended October 31, | |
| | | 2019 | | | 2018 | | | 2017 | | | 2016 | | | 2015 | |
| | | | | |
Net asset value, beginning of year | | | $32.69 | | | | $33.30 | | | | $30.28 | | | | $31.81 | | | | $35.34 | |
|
Income from investment operations: | |
| | | | | |
Net investment income (loss)(a) | | | 0.12 | | | | 0.01 | | | | 0.27 | | | | 0.25 | | | | 0.36 | |
| | | | | |
Net realized and unrealized gain (loss) | | | 2.98 | | | | 1.41 | | | | 4.54 | | | | 0.14 | | | | 0.51 | |
| | | | | |
Total from investment operations | | | 3.10 | | | | 1.42 | | | | 4.81 | | | | 0.39 | | | | 0.87 | |
|
Distributions: | |
| | | | | |
Dividends from net investment income | | | (0.20 | ) | | | (0.13 | ) | | | (0.59 | ) | | | (0.61 | ) | | | (0.64 | ) |
| | | | | |
Dividends from net realized gains | | | (1.91 | ) | | | (1.90 | ) | | | (1.20 | ) | | | (1.31 | ) | | | (3.76 | ) |
| | | | | |
Total distributions* | | | (2.11 | ) | | | (2.03 | ) | | | (1.79 | ) | | | (1.92 | ) | | | (4.40 | ) |
| | | | | |
Net asset value, end of year | | | $33.68 | | | | $32.69 | | | | $33.30 | | | | $30.28 | | | | $31.81 | |
|
Ratios and supplemental data: | |
| | | | | |
Total return(b) | | | 10.68% | | | | 4.42% | | | | 16.54% | | | | 1.39% | | | | 2.73% | |
| | | | | |
Net assets, end of year (000) | | | $136,333 | | | | $502,593 | | | | $574,455 | | | | $739,780 | | | | $889,516 | |
| | | | | |
Ratio of net expenses to average net assets | | | 1.85% | | | | 1.84% | | | | 1.86% | | | | 1.86% | | | | 1.85% | |
| | | | | |
Ratio of gross expenses to average net assets prior to expense reductions | | | 1.85% | | | | 1.84% | | | | 1.86% | | | | 1.86% | | | | 1.85% | |
| | | | | |
Ratio of net investment income (loss) to average net assets | | | 0.37% | | | | 0.02% | | | | 0.85% | | | | 0.84% | | | | 1.11% | |
| |
| | | CLASS I | |
| | | Year Ended October 31, | |
| | | 2019 | | | 2018 | | | 2017 | | | 2016 | | | 2015 | |
| | | | | |
Net asset value, beginning of year | | | $31.28 | | | | $31.96 | | | | $29.15 | | | | $30.71 | | | | $34.28 | |
|
Income from investment operations: | |
| | | | | |
Net investment income (loss)(a) | | | 0.39 | | | | 0.32 | | | | 0.55 | | | | 0.53 | | | | 0.66 | |
| | | | | |
Net realized and unrealized gain (loss) | | | 2.85 | | | | 1.37 | | | | 4.38 | | | | 0.14 | | | | 0.50 | |
| | | | | |
Total from investment operations | | | 3.24 | | | | 1.69 | | | | 4.93 | | | | 0.67 | | | | 1.16 | |
|
Distributions: | |
| | | | | |
Dividends from net investment income | | | (0.58 | ) | | | (0.47 | ) | | | (0.92 | ) | | | (0.92 | ) | | | (0.97 | ) |
| | | | | |
Dividends from net realized gains | | | (1.91 | ) | | | (1.90 | ) | | | (1.20 | ) | | | (1.31 | ) | | | (3.76 | ) |
| | | | | |
Total distributions* | | | (2.49 | ) | | | (2.37 | ) | | | (2.12 | ) | | | (2.23 | ) | | | (4.73 | ) |
| | | | | |
Net asset value, end of year | | | $32.03 | | | | $31.28 | | | | $31.96 | | | | $29.15 | | | | $30.71 | |
|
Ratios and supplemental data: | |
| | | | | |
Total return(b) | | | 11.81% | | | | 5.45% | | | | 17.71% | | | | 2.43% | | | | 3.79% | |
| | | | | |
Net assets, end of year (000) | | | $735,329 | | | | $643,422 | | | | $554,490 | | | | $513,604 | | | | $577,449 | |
| | | | | |
Ratio of net expenses to average net assets | | | 0.85% | | | | 0.84% | | | | 0.86% | | | | 0.86% | | | | 0.85% | |
| | | | | |
Ratio of gross expenses to average net assets prior to expense reductions | | | 0.85% | | | | 0.84% | | | | 0.86% | | | | 0.86% | | | | 0.85% | |
| | | | | |
Ratio of net investment income (loss) to average net assets | | | 1.27% | | | | 1.01% | | | | 1.83% | | | | 1.84% | | | | 2.11% | |
| * | Distribution for annual periods determined in accordance with federal income tax regulations. |
| (a) | Net investment income (loss) allocated based on average shares method. |
| (b) | Total return measures net investment income (loss) and capital gain or loss from portfolio investments assuming reinvestment of dividends and capital gains distributions. Total return is not annualized for periods that are less than a full year, does not reflect the effect of sales charge for Class A shares nor the contingent deferred sales charge for Class C shares and does not reflect the deduction of taxes that a shareholder would pay on fund distributions or the redemption of fund shares. |
Calamos Dividend Growth Fund Financial Highlights
Selected data for a share outstanding throughout each year were as follows:
| | | | | | | | | | | | | | | | | | | | |
| | | CLASS A | |
| | | Year Ended October 31, | |
| | | 2019 | | | 2018 | | | 2017 | | | 2016 | | | 2015 | |
| | | | | |
Net asset value, beginning of period | | | $12.34 | | | | $12.73 | | | | $10.38 | | | | $10.52 | | | | $10.78 | |
|
Income from investment operations: | |
| | | | | |
Net investment income (loss)(a) | | | 0.07 | | | | 0.07 | | | | 0.10 | | | | 0.10 | | | | 0.17 | |
| | | | | |
Net realized and unrealized gain (loss) | | | 1.50 | | | | 0.57 | | | | 2.30 | | | | 0.11 | | | | (0.15 | ) |
| | | | | |
Total from investment operations | | | 1.57 | | | | 0.64 | | | | 2.40 | | | | 0.21 | | | | 0.02 | |
|
Distributions: | |
| | | | | |
Dividends from net investment income | | | (0.08 | ) | | | (0.05 | ) | | | (0.05 | ) | | | (0.08 | ) | | | (0.15 | ) |
| | | | | |
Dividends from net realized gains | | | (0.46 | ) | | | (0.98 | ) | | | — | | | | (0.27 | ) | | | (0.13 | ) |
| | | | | |
Total distributions* | | | (0.54 | ) | | | (1.03 | ) | | | (0.05 | ) | | | (0.35 | ) | | | (0.28 | ) |
| | | | | |
Net asset value, end of period | | | $13.37 | | | | $12.34 | | | | $12.73 | | | | $10.38 | | | | $10.52 | |
|
Ratios and supplemental data: | |
| | | | | |
Total return(b) | | | 13.63% | | | | 5.26% | | | | 23.17% | | | | 2.17% | | | | 0.21% | |
| | | | | |
Net assets, end of year (000) | | | $3,638 | | | | $2,347 | | | | $2,031 | | | | $23,157 | | | | $28,030 | |
| | | | | |
Ratio of net expenses to average net assets | | | 1.35% | | | | 1.35% | | | | 1.35% | | | | 1.33% | | | | 1.35% | |
| | | | | |
Ratio of gross expenses to average net assets prior to expense reductions | | | 1.94% | | | | 1.83% | | | | 1.87% | | | | 1.73% | | | | 1.74% | |
| | | | | |
Ratio of net investment income (loss) to average net assets | | | 0.60% | | | | 0.55% | | | | 0.93% | | | | 0.95% | | | | 1.66% | |
| |
| | | Year Ended October 31, | |
| | | 2019 | | | 2018 | | | 2017 | | | 2016 | | | 2015 | |
| | | | | |
Portfolio turnover rate | | | 15.4% | | | | 10.7% | | | | 15.3% | | | | 11.5% | | | | 107.6% | |
| * | Distribution for annual periods determined in accordance with federal income tax regulations. |
| (a) | Net investment income (loss) allocated based on average shares method. |
| (b) | Total return measures net investment income (loss) and capital gain or loss from portfolio investments assuming reinvestment of dividends and capital gains distributions. Total return is not annualized for periods that are less than a full year, does not reflect the effect of sales charge for Class A shares nor the contingent deferred sales charge for Class B and C shares and does not reflect the deduction of taxes that a shareholder would pay on fund distributions or the redemption of fund shares. |
| | | | |
| 224 | | CALAMOS OPEN-END FAMILY OF FUNDS ANNUAL REPORT | | |
Calamos Dividend Growth Fund Financial Highlights
| | | | | | | | | | | | | | | | | | | | |
| | | CLASS C | |
| | | Year Ended October 31, | |
| | | 2019 | | | 2018 | | | 2017 | | | 2016 | | | 2015 | |
| | | | | |
Net asset value, beginning of period | | | $12.09 | | | | $12.52 | | | | $10.26 | | | | $10.41 | | | | $10.74 | |
|
Income from investment operations: | |
| | | | | |
Net investment income (loss)(a) | | | (0.01 | ) | | | (0.02 | ) | | | 0.00 | * | | | 0.02 | | | | 0.08 | |
| | | | | |
Net realized and unrealized gain (loss) | | | 1.45 | | | | 0.57 | | | | 2.28 | | | | 0.12 | | | | (0.15 | ) |
| | | | | |
Total from investment operations | | | 1.44 | | | | 0.55 | | | | 2.28 | | | | 0.14 | | | | (0.07 | ) |
|
Distributions: | |
| | | | | |
Dividends from net investment income | | | — | | | | — | | | | (0.02 | ) | | | (0.02 | ) | | | (0.13 | ) |
| | | | | |
Dividends from net realized gains | | | (0.46 | ) | | | (0.98 | ) | | | — | | | | (0.27 | ) | | | (0.13 | ) |
| | | | | |
Total distributions*** | | | (0.46 | ) | | | (0.98 | ) | | | (0.02 | ) | | | (0.29 | ) | | | (0.26 | ) |
| | | | | |
Net asset value, end of period | | | $13.07 | | | | $12.09 | | | | $12.52 | | | | $10.26 | | | | $10.41 | |
|
Ratios and supplemental data: | |
| | | | | |
Total return(b) | | | 12.74% | | | | 4.56% | | | | 22.26% | | | | 1.42% | | | | (0.63% | ) |
| | | | | |
Net assets, end of year (000) | | | $659 | | | | $1,028 | | | | $1,039 | | | | $969 | | | | $702 | |
| | | | | |
Ratio of net expenses to average net assets | | | 2.10% | | | | 2.10% | | | | 2.10% | | | | 2.08% | | | | 2.10% | |
| | | | | |
Ratio of gross expenses to average net assets prior to expense reductions | | | 2.65% | | | | 2.59% | | | | 2.73% | | | | 2.48% | | | | 2.51% | |
| | | | | |
Ratio of net investment income (loss) to average net assets | | | (0.06% | ) | | | (0.19% | ) | | | 0.00% | ** | | | 0.17% | | | | 0.77% | |
| |
| | | CLASS I | |
| | | Year Ended October 31, | |
| | | 2019 | | | 2018 | | | 2017 | | | 2016 | | | 2015 | |
| | | | | |
Net asset value, beginning of period | | | $12.33 | | | | $12.71 | | | | $10.39 | | | | $10.55 | | | | $10.79 | |
|
Income from investment operations: | |
| | | | | |
Net investment income (loss)(a) | | | 0.11 | | | | 0.10 | | | | 0.11 | | | | 0.12 | | | | 0.20 | |
| | | | | |
Net realized and unrealized gain (loss) | | | 1.49 | | | | 0.58 | | | | 2.32 | | | | 0.12 | | | | (0.16 | ) |
| | | | | |
Total from investment operations | | | 1.60 | | | | 0.68 | | | | 2.43 | | | | 0.24 | | | | 0.04 | |
|
Distributions: | |
| | | | | |
Dividends from net investment income | | | (0.11 | ) | | | (0.08 | ) | | | (0.11 | ) | | | (0.13 | ) | | | (0.15 | ) |
| | | | | |
Dividends from net realized gains | | | (0.46 | ) | | | (0.98 | ) | | | — | | | | (0.27 | ) | | | (0.13 | ) |
| | | | | |
Total distributions*** | | | (0.57 | ) | | | (1.06 | ) | | | (0.11 | ) | | | (0.40 | ) | | | (0.28 | ) |
| | | | | |
Net asset value, end of period | | | $13.36 | | | | $12.33 | | | | $12.71 | | | | $10.39 | | | | $10.55 | |
|
Ratios and supplemental data: | |
| | | | | |
Total return(b) | | | 13.93% | | | | 5.61% | | | | 23.46% | | | | 2.39% | | | | 0.47% | |
| | | | | |
Net assets, end of year (000) | | | $12,986 | | | | $20,585 | | | | $22,201 | | | | $7,989 | | | | $7,375 | |
| | | | | |
Ratio of net expenses to average net assets | | | 1.10% | | | | 1.10% | | | | 1.10% | | | | 1.08% | | | | 1.10% | |
| | | | | |
Ratio of gross expenses to average net assets prior to expense reductions | | | 1.67% | | | | 1.60% | | | | 1.80% | | | | 1.48% | | | | 1.49% | |
| | | | | |
Ratio of net investment income (loss) to average net assets | | | 0.92% | | | | 0.82% | | | | 0.89% | | | | 1.17% | | | | 1.91% | |
| * | Amounts are less than $0.005. |
| ** | Amounts are less than 0.005%. |
| *** | Distribution for annual periods determined in accordance with federal income tax regulations. |
| (a) | Net investment income (loss) allocated based on average shares method. |
| (b) | Total return measures net investment income (loss) and capital gain or loss from portfolio investments assuming reinvestment of dividends and capital gains distributions. Total return is not annualized for periods that are less than a full year, does not reflect the effect of sales charge for Class A shares nor the contingent deferred sales charge for Class C shares and does not reflect the deduction of taxes that a shareholder would pay on fund distributions or the redemption of fund shares. |
Calamos Opportunistic Value Fund Financial Highlights
Selected data for a share outstanding throughout each year were as follows:
| | | | | | | | | | | | | | | | | | | | |
| | | CLASS A | |
| | | Year Ended October 31, | |
| | | 2019 | | | 2018 | | | 2017 | | | 2016 | | | 2015 | |
| | | | | |
Net asset value, beginning of year | | | $15.37 | | | | $15.21 | | | | $12.60 | | | | $13.61 | | | | $15.07 | |
|
Income from investment operations: | |
| | | | | |
Net investment income (loss)(a) | | | 0.15 | | | | 0.10 | | | | 0.15 | | | | 0.21 | | | | 0.19 | |
| | | | | |
Net realized and unrealized gain (loss) | | | 0.95 | | | | 0.58 | | | | 2.56 | | | | (0.15 | ) | | | (0.52 | ) |
| | | | | |
Total from investment operations | | | 1.10 | | | | 0.68 | | | | 2.71 | | | | 0.06 | | | | (0.33 | ) |
|
Distributions: | |
| | | | | |
Dividends from net investment income | | | (0.06 | ) | | | (0.05 | ) | | | (0.10 | ) | | | (0.16 | ) | | | (0.14 | ) |
| | | | | |
Dividends from net realized gains | | | (2.20 | ) | | | (0.47 | ) | | | — | | | | (0.91 | ) | | | (0.99 | ) |
| | | | | |
Total distributions* | | | (2.26 | ) | | | (0.52 | ) | | | (0.10 | ) | | | (1.07 | ) | | | (1.13 | ) |
| | | | | |
Net asset value, end of year | | | $14.21 | | | | $15.37 | | | | $15.21 | | | | $12.60 | | | | $13.61 | |
|
Ratios and supplemental data: | |
| | | | | |
Total return(b) | | | 10.14% | | | | 4.53% | | | | 21.56% | | | | 0.76% | | | | (2.32% | ) |
| | | | | |
Net assets, end of year (000) | | | $11,363 | | | | $21,349 | | | | $21,894 | | | | $32,350 | | | | $44,792 | |
| | | | | |
Ratio of net expenses to average net assets | | | 1.15% | | | | 1.15% | | | | 1.15% | | | | 1.12% | | | | 1.15% | |
| | | | | |
Ratio of gross expenses to average net assets prior to expense reductions | | | 1.62% | | | | 1.60% | | | | 1.67% | | | | 1.57% | | | | 1.61% | |
| | | | | |
Ratio of net investment income (loss) to average net assets | | | 1.06% | | | | 0.64% | | | | 1.10% | | | | 1.67% | | | | 1.38% | |
| |
| | | Year Ended October 31, | |
| | | 2019 | | | 2018 | | | 2017 | | | 2016 | | | 2015 | |
| | | | | |
Portfolio turnover rate | | | 77.7% | | | | 119.3% | | | | 104.7% | | | | 40.7% | | | | 139.8% | |
| * | Distribution for annual periods determined in accordance with federal income tax regulations. |
| (a) | Net investment income (loss) allocated based on average shares method. |
| (b) | Total return measures net investment income (loss) and capital gain or loss from portfolio investments assuming reinvestment of dividends and capital gains distributions. Total return is not annualized for periods that are less than a full year, does not reflect the effect of sales charge for Class A shares nor the contingent deferred sales charge for Class C shares and does not reflect the deduction of taxes that a shareholder would pay on fund distributions or the redemption of fund shares. |
| | | | |
| 226 | | CALAMOS OPEN-END FAMILY OF FUNDS ANNUAL REPORT | | |
Calamos Opportunistic Value Fund Financial Highlights
| | | | | | | | | | | | | | | | | | | | |
| | | CLASS C | |
| | | Year Ended October 31, | |
| | | 2019 | | | 2018 | | | 2017 | | | 2016 | | | 2015 | |
| | | | | |
Net asset value, beginning of year | | | $13.77 | | | | $13.74 | | | | $11.39 | | | | $12.38 | | | | $13.79 | |
|
Income from investment operations: | |
| | | | | |
Net investment income (loss)(a) | | | 0.02 | | | | (0.01 | ) | | | 0.04 | | | | 0.10 | | | | 0.08 | |
| | | | | |
Net realized and unrealized gain (loss) | | | 0.83 | | | | 0.51 | | | | 2.32 | | | | (0.13 | ) | | | (0.47 | ) |
| | | | | |
Total from investment operations | | | 0.85 | | | | 0.50 | | | | 2.36 | | | | (0.03 | ) | | | (0.39 | ) |
|
Distributions: | |
| | | | | |
Dividends from net investment income | | | (0.06 | ) | | | — | | | | (0.01 | ) | | | (0.05 | ) | | | (0.03 | ) |
| | | | | |
Dividends from net realized gains | | | (2.20 | ) | | | (0.47 | ) | | | — | | | | (0.91 | ) | | | (0.99 | ) |
| | | | | |
Total distributions* | | | (2.26 | ) | | | (0.47 | ) | | | (0.01 | ) | | | (0.96 | ) | | | (1.02 | ) |
| | | | | |
Net asset value, end of year | | | $12.36 | | | | $13.77 | | | | $13.74 | | | | $11.39 | | | | $12.38 | |
|
Ratios and supplemental data: | |
| | | | | |
Total return(b) | | | 9.33% | | | | 3.77% | | | | 20.70% | | | | (0.04% | ) | | | (3.01% | ) |
| | | | | |
Net assets, end of year (000) | | | $5,274 | | | | $4,318 | | | | $4,728 | | | | $4,915 | | | | $5,738 | |
| | | | | |
Ratio of net expenses to average net assets | | | 1.90% | | | | 1.90% | | | | 1.90% | | | | 1.87% | | | | 1.90% | |
| | | | | |
Ratio of gross expenses to average net assets prior to expense reductions | | | 2.35% | | | | 2.35% | | | | 2.42% | | | | 2.32% | | | | 2.35% | |
| | | | | |
Ratio of net investment income (loss) to average net assets | | | 0.15% | | | | (0.10% | ) | | | 0.31% | | | | 0.91% | | | | 0.64% | |
| |
| | | CLASS I | |
| | | Year Ended October 31, | |
| | | 2019 | | | 2018 | | | 2017 | | | 2016 | | | 2015 | |
| | | | | |
Net asset value, beginning of year | | | $15.80 | | | | $15.63 | | | | $12.94 | | | | $13.96 | | | | $15.44 | |
|
Income from investment operations: | |
| | | | | |
Net investment income (loss)(a) | | | 0.16 | | | | 0.14 | | | | 0.18 | | | | 0.24 | | | | 0.23 | |
| | | | | |
Net realized and unrealized gain (loss) | | | 1.01 | | | | 0.59 | | | | 2.64 | | | | (0.14 | ) | | | (0.53 | ) |
| | | | | |
Total from investment operations | | | 1.17 | | | | 0.73 | | | | 2.82 | | | | 0.10 | | | | (0.30 | ) |
|
Distributions: | |
| | | | | |
Dividends from net investment income | | | (0.15 | ) | | | (0.09 | ) | | | (0.13 | ) | | | (0.21 | ) | | | (0.19 | ) |
| | | | | |
Dividends from net realized gains | | | (2.20 | ) | | | (0.47 | ) | | | — | | | | (0.91 | ) | | | (0.99 | ) |
| | | | | |
Total distributions* | | | (2.35 | ) | | | (0.56 | ) | | | (0.13 | ) | | | (1.12 | ) | | | (1.18 | ) |
| | | | | |
Net asset value, end of year | | | $14.62 | | | | $15.80 | | | | $15.63 | | | | $12.94 | | | | $13.96 | |
|
Ratios and supplemental data: | |
| | | | | |
Total return(b) | | | 10.43% | | | | 4.78% | | | | 21.92% | | | | 0.98% | | | | (2.08% | ) |
| | | | | |
Net assets, end of year (000) | | | $28,389 | | | | $21,892 | | | | $25,669 | | | | $16,672 | | | | $19,583 | |
| | | | | |
Ratio of net expenses to average net assets | | | 0.90% | | | | 0.90% | | | | 0.90% | | | | 0.87% | | | | 0.90% | |
| | | | | |
Ratio of gross expenses to average net assets prior to expense reductions | | | 1.36% | | | | 1.36% | | | | 1.42% | | | | 1.32% | | | | 1.36% | |
| | | | | |
Ratio of net investment income (loss) to average net assets | | | 1.13% | | | | 0.90% | | | | 1.28% | | | | 1.91% | | | | 1.63% | |
| * | Distribution for annual periods determined in accordance with federal income tax regulations. |
| (a) | Net investment income (loss) allocated based on average shares method. |
| (b) | Total return measures net investment income (loss) and capital gain or loss from portfolio investments assuming reinvestment of dividends and capital gains distributions. Total return is not annualized for periods that are less than a full year, does not reflect the effect of sales charge for Class A shares nor the contingent deferred sales charge for Class C shares and does not reflect the deduction of taxes that a shareholder would pay on fund distributions or the redemption of fund shares. |
Calamos International Growth Fund Financial Highlights
Selected data for a share outstanding throughout each year were as follows:
| | | | | | | | | | | | | | | | | | | | |
| | | CLASS A | |
| | | Year Ended October 31, | |
| | | 2019 | | | 2018 | | | 2017 | | | 2016 | | | 2015 | |
| | | | | |
Net asset value, beginning of year | | | $18.10 | | | | $21.55 | | | | $16.65 | | | | $17.27 | | | | $19.27 | |
|
Income from investment operations: | |
| | | | | |
Net investment income (loss)(a) | | | 0.09 | | | | 0.15 | | | | 0.07 | | | | 0.05 | | | | 0.09 | |
| | | | | |
Net realized and unrealized gain (loss) | | | 1.80 | | | | (2.78 | ) | | | 4.83 | | | | (0.65 | ) | | | 0.02 | |
| | | | | |
Total from investment operations | | | 1.89 | | | | (2.63 | ) | | | 4.90 | | | | (0.60 | ) | | | 0.11 | |
|
Distributions: | |
| | | | | |
Dividends from net investment income | | | — | | | | — | | | | — | | | | — | | | | — | |
| | | | | |
Dividends from net realized gains | | | (2.02 | ) | | | (0.82 | ) | | | — | | | | (0.02 | ) | | | (2.11 | ) |
| | | | | |
Return of capital | | | — | | | | — | | | | — | | | | (0.00 | )* | | | — | |
| | | | | |
Total distributions** | | | (2.02 | ) | | | (0.82 | ) | | | — | | | | (0.02 | ) | | | (2.11 | ) |
| | | | | |
Net asset value, end of year | | | $17.97 | | | | $18.10 | | | | $21.55 | | | | $16.65 | | | | $17.27 | |
| | | | | |
Ratios and supplemental data: | | | | | | | | | | | | | | | | | | | | |
| | | | | |
Total return(b) | | | 13.07% | | | | (12.70% | ) | | | 29.43% | | | | (3.46% | ) | | | 0.94% | |
| | | | | |
Net assets, end of year (000) | | | $53,950 | | | | $59,566 | | | | $72,491 | | | | $111,036 | | | | $209,548 | |
| | | | | |
Ratio of net expenses to average net assets | | | 1.10% | | | | 1.33% | | | | 1.40% | | | | 1.38% | | | | 1.31% | |
| | | | | |
Ratio of gross expenses to average net assets prior to expense reductions | | | 1.48% | | | | 1.51% | | | | 1.46% | | | | 1.39% | | | | 1.31% | |
| | | | | |
Ratio of net investment income (loss) to average net assets | | | 0.51% | | | | 0.71% | | | | 0.41% | | | | 0.32% | | | | 0.52% | |
| |
| | | Year Ended October 31, | |
| | | 2019 | | | 2018 | | | 2017 | | | 2016 | | | 2015 | |
| | | | | |
Portfolio turnover rate | | | 80.7% | | | | 111.8% | | | | 100.4% | | | | 69.0% | | | | 65.0% | |
| * | Amounts are less than $0.005. |
| ** | Distribution for annual periods determined in accordance with federal income tax regulations. |
| (a) | Net investment income (loss) allocated based on average shares method. |
| (b) | Total return measures net investment income (loss) and capital gain or loss from portfolio investments assuming reinvestment of dividends and capital gains distributions. Total return is not annualized for periods that are less than a full year, does not reflect the effect of sales charge for Class A shares nor the contingent deferred sales charge for Class C shares and does not reflect the deduction of taxes that a shareholder would pay on fund distributions or the redemption of fund shares. |
| | | | |
| 228 | | CALAMOS OPEN-END FAMILY OF FUNDS ANNUAL REPORT | | |
Calamos International Growth Fund Financial Highlights
| | | | | | | | | | | | | | | | | | | | |
| | | CLASS C | |
| | | Year Ended October 31, | |
| | | 2019 | | | 2018 | | | 2017 | | | 2016 | | | 2015 | |
| | | | | |
Net asset value, beginning of year | | | $16.38 | | | | $19.72 | | | | $15.35 | | | | $16.04 | | | | $18.18 | |
|
Income from investment operations: | |
| | | | | |
Net investment income (loss)(a) | | | (0.05 | ) | | | (0.03 | ) | | | (0.05 | ) | | | (0.07 | ) | | | (0.04 | ) |
| | | | | |
Net realized and unrealized gain (loss) | | | 1.60 | | | | (2.49 | ) | | | 4.42 | | | | (0.60 | ) | | | 0.01 | |
| | | | | |
Total from investment operations | | | 1.55 | | | | (2.52 | ) | | | 4.37 | | | | (0.67 | ) | | | (0.03 | ) |
|
Distributions: | |
| | | | | |
Dividends from net investment income | | | — | | | | — | | | | — | | | | — | | | | — | |
| | | | | |
Dividends from net realized gains | | | (2.02 | ) | | | (0.82 | ) | | | — | | | | (0.02 | ) | | | (2.11 | ) |
| | | | | |
Return of capital | | | — | | | | — | | | | — | | | | (0.00 | )* | | | — | |
| | | | | |
Total distributions** | | | (2.02 | ) | | | (0.82 | ) | | | — | | | | (0.02 | ) | | | (2.11 | ) |
| | | | | |
Net asset value, end of year | | | $15.91 | | | | $16.38 | | | | $19.72 | | | | $15.35 | | | | $16.04 | |
| | | | | |
Ratios and supplemental data: | | | | | | | | | | | | | | | | | | | | |
| | | | | |
Total return(b) | | | 12.21% | | | | (13.35% | ) | | | 28.47% | | | | (4.16% | ) | | | 0.15% | |
| | | | | |
Net assets, end of year (000) | | | $9,022 | | | | $20,449 | | | | $27,840 | | | | $35,537 | | | | $47,996 | |
| | | | | |
Ratio of net expenses to average net assets | | | 1.85% | | | | 2.06% | | | | 2.15% | | | | 2.13% | | | | 2.06% | |
| | | | | |
Ratio of gross expenses to average net assets prior to expense reductions | | | 2.26% | | | | 2.26% | | | | 2.21% | | | | 2.14% | | | | 2.06% | |
| | | | | |
Ratio of net investment income (loss) to average net assets | | | (0.35% | ) | | | (0.17% | ) | | | (0.33% | ) | | | (0.46% | ) | | | (0.23% | ) |
| |
| | | CLASS I | |
| | | Year Ended October 31, | |
| | | 2019 | | | 2018 | | | 2017 | | | 2016 | | | 2015 | |
| | | | | |
Net asset value, beginning of year | | | $18.55 | | | | $22.01 | | | | $16.96 | | | | $17.54 | | | | $19.50 | |
|
Income from investment operations: | |
| | | | | |
Net investment income (loss)(a) | | | 0.13 | | | | 0.18 | | | | 0.12 | | | | 0.09 | | | | 0.14 | |
| | | | | |
Net realized and unrealized gain (loss) | | | 1.87 | | | | (2.82 | ) | | | 4.93 | | | | (0.65 | ) | | | 0.01 | |
| | | | | |
Total from investment operations | | | 2.00 | | | | (2.64 | ) | | | 5.05 | | | | (0.56 | ) | | | 0.15 | |
|
Distributions: | |
| | | | | |
Dividends from net investment income | | | — | | | | — | | | | — | | | | — | | | | — | |
| | | | | |
Dividends from net realized gains | | | (2.02 | ) | | | (0.82 | ) | | | — | | | | (0.02 | ) | | | (2.11 | ) |
| | | | | |
Return of capital | | | — | | | | — | | | | — | | | | (0.00 | )* | | | — | |
| | | | | |
Total distributions** | | | (2.02 | ) | | | (0.82 | ) | | | — | | | | (0.02 | ) | | | (2.11 | ) |
| | | | | |
Net asset value, end of year | | | $18.53 | | | | $18.55 | | | | $22.01 | | | | $16.96 | | | | $17.54 | |
| | | | | |
Ratios and supplemental data: | | | | | | | | | | | | | | | | | | | | |
| | | | | |
Total return(b) | | | 13.32% | | | | (12.48% | ) | | | 29.78% | | | | (3.18% | ) | | | 1.16% | |
| | | | | |
Net assets, end of year (000) | | | $134,562 | | | | $153,312 | | | | $175,070 | | | | $213,166 | | | | $339,909 | |
| | | | | |
Ratio of net expenses to average net assets | | | 0.85% | | | | 1.06% | | | | 1.15% | | | | 1.13% | | | | 1.06% | |
| | | | | |
Ratio of gross expenses to average net assets prior to expense reductions | | | 1.23% | | | | 1.26% | | | | 1.21% | | | | 1.14% | | | | 1.06% | |
| | | | | |
Ratio of net investment income (loss) to average net assets | | | 0.75% | | | | 0.85% | | | | 0.66% | | | | 0.53% | | | | 0.78% | |
| * | Amounts are less than $0.005. |
| ** | Distribution for annual periods determined in accordance with federal income tax regulations. |
| (a) | Net investment income (loss) allocated based on average shares method. |
| (b) | Total return measures net investment income (loss) and capital gain or loss from portfolio investments assuming reinvestment of dividends and capital gains distributions. Total return is not annualized for periods that are less than a full year, does not reflect the effect of sales charge for Class A shares nor the contingent deferred sales charge for Class C shares and does not reflect the deduction of taxes that a shareholder would pay on fund distributions or the redemption of fund shares. |
Calamos International Growth Fund Financial Highlights
| | | | | | | | |
| | | CLASS R6 | |
| | | Year Ended
October 31, | | | September 17, 2018• through October 31, | |
| | | 2019 | | | 2018 | |
| | |
Net asset value, beginning of year | | | $18.66 | | | | $20.89 | |
|
| Income from investment operations: | |
| | |
Net investment income (loss)(a) | | | 0.20 | | | | 0.01 | |
| | |
Net realized and unrealized gain (loss) | | | 1.83 | | | | (2.24 | ) |
| | |
Total from investment operations | | | 2.03 | | | | (2.23 | ) |
|
Distributions: | |
| | |
Dividends from net investment income | | | — | | | | — | |
| | |
Dividends from net realized gains | | | (2.02 | ) | | | — | |
| | |
Total distributions* | | | (2.02 | ) | | | — | |
| | |
Net asset value, end of year | | | $18.67 | | | | $18.66 | |
|
Ratios and supplemental data: | |
| | |
Total return(b) | | | 13.41% | | | | (10.67% | ) |
| | |
Net assets, end of year (000) | | | $7,463 | | | | $22 | |
| | |
Ratio of net expenses to average net assets | | | 0.77% | | | | 0.76% | (c) |
| | |
Ratio of gross expenses to average net assets prior to expense reductions | | | 1.15% | | | | 1.21% | (c) |
| | |
Ratio of net investment income (loss) to average net assets | | | 1.13% | | | | 0.34% | (c) |
| • | Commencement of operations. |
| * | Distribution for annual periods determined in accordance with federal income tax regulations. |
| (a) | Net investment income (loss) allocated based on average shares method. |
| (b) | Total return measures net investment income (loss) and capital gain or loss from portfolio investments assuming reinvestment of dividends and capital gains distributions. Total return is not annualized for periods that are less than a full year, does not reflect the effect of sales charge for Class A shares nor the contingent deferred sales charge for Class C shares and does not reflect the deduction of taxes that a shareholder would pay on fund distributions or the redemption of fund shares. |
| | | | |
| 230 | | CALAMOS OPEN-END FAMILY OF FUNDS ANNUAL REPORT | | |
Calamos Evolving World Growth Fund Financial Highlights
Selected data for a share outstanding throughout each year were as follows:
| | | | | | | | | | | | | | | | | | | | |
| | | CLASS A | |
| | | Year Ended October 31, | |
| | | 2019 | | | 2018 | | | 2017 | | | 2016 | | | 2015 | |
| | | | | |
Net asset value, beginning of year | | | $12.54 | | | | $14.83 | | | | $12.11 | | | | $12.11 | | | | $13.73 | |
|
Income from investment operations: | |
| | | | | |
Net investment income (loss)(a) | | | 0.09 | | | | (0.01 | ) | | | 0.05 | | | | 0.03 | | | | 0.02 | |
| | | | | |
Net realized and unrealized gain (loss) | | | 1.49 | | | | (2.28 | ) | | | 2.67 | | | | (0.02 | ) | | | (1.31 | ) |
| | | | | |
Total from investment operations | | | 1.58 | | | | (2.29 | ) | | | 2.72 | | | | 0.01 | | | | (1.29 | ) |
|
Distributions: | |
| | | | | |
Dividends from net investment income | | | ��� | | | | (0.00 | )* | | | — | | | | (0.01 | ) | | | (0.03 | ) |
| | | | | |
Dividends from net realized gains | | | — | | | | — | | | | — | | | | — | | | | (0.30 | ) |
| | | | | |
Return of capital | | | — | | | | (0.00 | )* | | | — | | | | (0.00 | )* | | | (0.00 | )* |
| | | | | |
Total distributions** | | | — | | | | (0.00 | )* | | | — | | | | (0.01 | ) | | | (0.33 | ) |
| | | | | |
Net asset value, end of year | | | $14.12 | | | | $12.54 | | | | $14.83 | | | | $12.11 | | | | $12.11 | |
| | | | | |
Ratios and supplemental data: | | | | | | | | | | | | | | | | | | | | |
| | | | | |
Total return(b) | | | 12.60% | | | | (15.43% | ) | | | 22.46% | | | | 0.08% | | | | (9.56% | ) |
| | | | | |
Net assets, end of year (000) | | | $28,168 | | | | $34,678 | | | | $68,142 | | | | $102,545 | | | | $121,946 | |
| | | | | |
Ratio of net expenses to average net assets | | | 1.64% | | | | 1.63% | | | | 1.67% | | | | 1.64% | | | | 1.65% | |
| | | | | |
Ratio of gross expenses to average net assets prior to expense reductions | | | 1.64% | | | | 1.63% | | | | 1.67% | | | | 1.64% | | | | 1.65% | |
| | | | | |
Ratio of net investment income (loss) to average net assets | | | 0.63% | | | | (0.08% | ) | | | 0.40% | | | | 0.23% | | | | 0.14% | |
| |
| | | Year Ended October 31, | |
| | | 2019 | | | 2018 | | | 2017 | | | 2016 | | | 2015 | |
| | | | | |
Portfolio turnover rate | | | 77.9% | | | | 97.3% | | | | 104.8% | | | | 87.4% | | | | 58.8% | |
| * | Amounts are less than $0.005. |
| ** | Distribution for annual periods determined in accordance with federal income tax regulations. |
| (a) | Net investment income (loss) allocated based on average shares method. |
| (b) | Total return measures net investment income (loss) and capital gain or loss from portfolio investments assuming reinvestment of dividends and capital gains distributions. Total return is not annualized for periods that are less than a full year, does not reflect the effect of sales charge for Class A shares nor the contingent deferred sales charge for Class C shares and does not reflect the deduction of taxes that a shareholder would pay on fund distributions or the redemption of fund shares. |
Calamos Evolving World Growth Fund Financial Highlights
| | | | | | | | | | | | | | | | | | | | |
| | | CLASS C | |
| | | Year Ended October 31, | |
| | | 2019 | | | 2018 | | | 2017 | | | 2016 | | | 2015 | |
| | | | | |
Net asset value, beginning of year | | | $11.78 | | | | $14.03 | | | | $11.55 | | | | $11.62 | | | | $13.26 | |
|
Income from investment operations: | |
| | | | | |
Net investment income (loss)(a) | | | (0.01 | ) | | | (0.12 | ) | | | (0.03 | ) | | | (0.06 | ) | | | (0.07 | ) |
| | | | | |
Net realized and unrealized gain (loss) | | | 1.39 | | | | (2.13 | ) | | | 2.51 | | | | (0.01 | ) | | | (1.27 | ) |
| | | | | |
Total from investment operations | | | 1.38 | | | | (2.25 | ) | | | 2.48 | | | | (0.07 | ) | | | (1.34 | ) |
|
Distributions: | |
| | | | | |
Dividends from net investment income | | | — | | | | — | | | | — | | | | — | | | | — | |
| | | | | |
Dividends from net realized gains | | | — | | | | — | | | | — | | | | — | | | | (0.30 | ) |
| | | | | |
Return of capital | | | — | | | | — | | | | — | | | | (0.00 | )* | | | (0.00 | )* |
| | | | | |
Total distributions** | | | — | | | | — | | | | — | | | | — | | | | (0.30 | ) |
| | | | | |
Net asset value, end of year | | | $13.16 | | | | $11.78 | | | | $14.03 | | | | $11.55 | | | | $11.62 | |
| | | | | |
Ratios and supplemental data: | | | | | | | | | | | | | | | | | | | | |
| | | | | |
Total return(b) | | | 11.71% | | | | (16.04% | ) | | | 21.47% | | | | (0.60% | ) | | | (10.25% | ) |
| | | | | |
Net assets, end of year (000) | | | $13,478 | | | | $17,739 | | | | $24,846 | | | | $31,231 | | | | $36,532 | |
| | | | | |
Ratio of net expenses to average net assets | | | 2.39% | | | | 2.38% | | | | 2.41% | | | | 2.39% | | | | 2.40% | |
| | | | | |
Ratio of gross expenses to average net assets prior to expense reductions | | | 2.39% | | | | 2.38% | | | | 2.41% | | | | 2.39% | | | | 2.40% | |
| | | | | |
Ratio of net investment income (loss) to average net assets | | | (0.11% | ) | | | (0.85% | ) | | | (0.29% | ) | | | (0.54% | ) | | | (0.59% | ) |
| |
| | | CLASS I | |
| | | Year Ended October 31, | |
| | | 2019 | | | 2018 | | | 2017 | | | 2016 | | | 2015 | |
| | | | | |
Net asset value, beginning of year | | | $12.63 | | | | $14.96 | | | | $12.19 | | | | $12.19 | | | | $13.83 | |
|
Income from investment operations: | |
| | | | | |
Net investment income (loss)(a) | | | 0.12 | | | | 0.02 | | | | 0.09 | | | | 0.06 | | | | 0.05 | |
| | | | | |
Net realized and unrealized gain (loss) | | | 1.51 | | | | (2.29 | ) | | | 2.68 | | | | (0.01 | ) | | | (1.32 | ) |
| | | | | |
Total from investment operations | | | 1.63 | | | | (2.27 | ) | | | 2.77 | | | | 0.05 | | | | (1.27 | ) |
|
Distributions: | |
| | | | | |
Dividends from net investment income | | | — | | | | (0.06 | ) | | | — | | | | (0.05 | ) | | | (0.07 | ) |
| | | | | |
Dividends from net realized gains | | | — | | | | — | | | | — | | | | — | | | | (0.30 | ) |
| | | | | |
Return of capital | | | — | | | | (0.00 | )* | | | — | | | | (0.00 | )* | | | (0.00 | )* |
| | | | | |
Total distributions** | | | — | | | | (0.06 | ) | | | — | | | | (0.05 | ) | | | (0.37 | ) |
| | | | | |
Net asset value, end of year | | | $14.26 | | | | $12.63 | | | | $14.96 | | | | $12.19 | | | | $12.19 | |
| | | | | |
Ratios and supplemental data: | | | | | | | | | | | | | | | | | | | | |
| | | | | |
Total return(b) | | | 12.91% | | | | (15.21% | ) | | | 22.72% | | | | 0.38% | | | | (9.35% | ) |
| | | | | |
Net assets, end of year (000) | | | $120,318 | | | | $152,114 | | | | $225,339 | | | | $255,965 | | | | $351,571 | |
| | | | | |
Ratio of net expenses to average net assets | | | 1.39% | | | | 1.38% | | | | 1.41% | | | | 1.39% | | | | 1.40% | |
| | | | | |
Ratio of gross expenses to average net assets prior to expense reductions | | | 1.39% | | | | 1.38% | | | | 1.41% | | | | 1.39% | | | | 1.40% | |
| | | | | |
Ratio of net investment income (loss) to average net assets | | | 0.91% | | | | 0.14% | | | | 0.72% | | | | 0.50% | | | | 0.42% | |
| * | Amounts are less than $0.005. |
| ** | Distribution for annual periods determined in accordance with federal income tax regulations. |
| (a) | Net investment income (loss) allocated based on average shares method. |
| (b) | Total return measures net investment income (loss) and capital gain or loss from portfolio investments assuming reinvestment of dividends and capital gains distributions. Total return is not annualized for periods that are less than a full year, does not reflect the effect of sales charge for Class A shares nor the contingent deferred sales charge for Class C shares and does not reflect the deduction of taxes that a shareholder would pay on fund distributions or the redemption of fund shares. |
| | | | |
| 232 | | CALAMOS OPEN-END FAMILY OF FUNDS ANNUAL REPORT | | |
Calamos Global Equity Fund Financial Highlights
Selected data for a share outstanding throughout each year were as follows:
| | | | | | | | | | | | | | | | | | | | |
| | | CLASS A | |
| | | Year Ended October 31, | |
| | | 2019 | | | 2018 | | | 2017 | | | 2016 | | | 2015 | |
| | | | | |
Net asset value, beginning of year | | | $13.61 | | | | $15.63 | | | | $12.74 | | | | $13.19 | | | | $15.67 | |
|
Income from investment operations: | |
| | | | | |
Net investment income (loss)(a) | | | (0.01 | ) | | | 0.00 | * | | | (0.00 | )* | | | 0.01 | | | | 0.00 | * |
| | | | | |
Net realized and unrealized gain (loss) | | | 0.79 | | | | (0.63 | ) | | | 3.45 | | | | (0.21 | ) | | | 0.62 | |
| | | | | |
Total from investment operations | | | 0.78 | | | | (0.63 | ) | | | 3.45 | | | | (0.20 | ) | | | 0.62 | |
|
Distributions: | |
| | | | | |
Dividends from net investment income | | | — | | | | — | | | | — | | | | — | | | | — | |
| | | | | |
Dividends from net realized gains | | | (2.75 | ) | | | (1.39 | ) | | | (0.56 | ) | | | (0.25 | ) | | | (3.10 | ) |
| | | | | |
Total distributions*** | | | (2.75 | ) | | | (1.39 | ) | | | (0.56 | ) | | | (0.25 | ) | | | (3.10 | ) |
| | | | | |
Net asset value, end of year | | | $11.64 | | | | $13.61 | | | | $15.63 | | | | $12.74 | | | | $13.19 | |
|
Ratios and supplemental data: | |
| | | | | |
Total return(b) | | | 10.28% | | | | (4.59% | ) | | | 28.42% | | | | (1.47% | ) | | | 5.33% | |
| | | | | |
Net assets, end of year (000) | | | $20,236 | | | | $27,489 | | | | $26,957 | | | | $29,314 | | | | $67,141 | |
| | | | | |
Ratio of net expenses to average net assets | | | 1.40% | | | | 1.40% | | | | 1.40% | | | | 1.38% | | | | 1.34% | |
| | | | | |
Ratio of gross expenses to average net assets prior to expense reductions | | | 1.51% | | | | 1.56% | | | | 1.53% | | | | 1.50% | | | | 1.34% | |
| | | | | |
Ratio of net investment income (loss) to average net assets | | | (0.08% | ) | | | 0.03% | | | | (0.02% | ) | | | 0.06% | | | | 0.00% | ** |
| |
| | | Year Ended October 31, | |
| | | 2019 | | | 2018 | | | 2017 | | | 2016 | | | 2015 | |
| | | | | |
Portfolio turnover rate | | | 72.4% | | | | 81.3% | | | | 102.0% | | | | 64.6% | | | | 43.0% | |
| * | Amounts are less than $0.005. |
| ** | Amounts are less than 0.005%. |
| *** | Distribution for annual periods determined in accordance with federal income tax regulations. |
| (a) | Net investment income (loss) allocated based on average shares method. |
| (b) | Total return measures net investment income (loss) and capital gain or loss from portfolio investments assuming reinvestment of dividends and capital gains distributions. Total return is not annualized for periods that are less than a full year, does not reflect the effect of sales charge for Class A shares nor the contingent deferred sales charge for Class C shares and does not reflect the deduction of taxes that a shareholder would pay on fund distributions or the redemption of fund shares. |
Calamos Global Equity Fund Financial Highlights
| | | | | | | | | | | | | | | | | | | | |
| | | CLASS C | |
| | | Year Ended October 31, | |
| | | 2019 | | | 2018 | | | 2017 | | | 2016 | | | 2015 | |
| | | | | |
Net asset value, beginning of year | | | $12.34 | | | | $14.40 | | | | $11.86 | | | | $12.39 | | | | $15.00 | |
|
Income from investment operations: | |
| | | | | |
Net investment income (loss)(a) | | | (0.09 | ) | | | (0.10 | ) | | | (0.09 | ) | | | (0.08 | ) | | | (0.09 | ) |
| | | | | |
Net realized and unrealized gain (loss) | | | 0.65 | | | | (0.57 | ) | | | 3.19 | | | | (0.20 | ) | | | 0.58 | |
| | | | | |
Total from investment operations | | | 0.56 | | | | (0.67 | ) | | | 3.10 | | | | (0.28 | ) | | | 0.49 | |
|
Distributions: | |
| | | | | |
Dividends from net investment income | | | — | | | | — | | | | — | | | | — | | | | — | |
| | | | | |
Dividends from net realized gains | | | (2.75 | ) | | | (1.39 | ) | | | (0.56 | ) | | | (0.25 | ) | | | (3.10 | ) |
| | | | | |
Total distributions* | | | (2.75 | ) | | | (1.39 | ) | | | (0.56 | ) | | | (0.25 | ) | | | (3.10 | ) |
| | | | | |
Net asset value, end of year | | | $10.15 | | | | $12.34 | | | | $14.40 | | | | $11.86 | | | | $12.39 | |
|
Ratios and supplemental data: | |
| | | | | |
Total return(b) | | | 9.36% | | | | (5.31% | ) | | | 27.53% | | | | (2.23% | ) | | | 4.55% | |
| | | | | |
Net assets, end of year (000) | | | $8,011 | | | | $10,887 | | | | $13,769 | | | | $16,375 | | | | $21,227 | |
| | | | | |
Ratio of net expenses to average net assets | | | 2.15% | | | | 2.15% | | | | 2.15% | | | | 2.13% | | | | 2.09% | |
| | | | | |
Ratio of gross expenses to average net assets prior to expense reductions | | | 2.26% | | | | 2.32% | | | | 2.27% | | | | 2.25% | | | | 2.09% | |
| | | | | |
Ratio of net investment income (loss) to average net assets | | | (0.86% | ) | | | (0.76% | ) | | | (0.76% | ) | | | (0.68% | ) | | | (0.76% | ) |
| |
| | | CLASS I | |
| | | Year Ended October 31, | |
| | | 2019 | | | 2018 | | | 2017 | | | 2016 | | | 2015 | |
| | | | | |
Net asset value, beginning of year | | | $13.93 | | | | $15.95 | | | | $12.95 | | | | $13.38 | | | | $15.81 | |
|
Income from investment operations: | |
| | | | | |
Net investment income (loss)(a) | | | 0.02 | | | | 0.03 | | | | 0.03 | | | | 0.04 | | | | 0.04 | |
| | | | | |
Net realized and unrealized gain (loss) | | | 0.82 | | | | (0.64 | ) | | | 3.53 | | | | (0.22 | ) | | | 0.63 | |
| | | | | |
Total from investment operations | | | 0.84 | | | | (0.61 | ) | | | 3.56 | | | | (0.18 | ) | | | 0.67 | |
|
Distributions: | |
| | | | | |
Dividends from net investment income | | | — | | | | (0.02 | ) | | | — | | | | — | | | | — | |
| | | | | |
Dividends from net realized gains | | | (2.75 | ) | | | (1.39 | ) | | | (0.56 | ) | | | (0.25 | ) | | | (3.10 | ) |
| | | | | |
Total distributions* | | | (2.75 | ) | | | (1.41 | ) | | | (0.56 | ) | | | (0.25 | ) | | | (3.10 | ) |
| | | | | |
Net asset value, end of year | | | $12.02 | | | | $13.93 | | | | $15.95 | | | | $12.95 | | | | $13.38 | |
|
Ratios and supplemental data: | |
| | | | | |
Total return(b) | | | 10.52% | | | | (4.38% | ) | | | 28.82% | | | | (1.30% | ) | | | 5.64% | |
| | | | | |
Net assets, end of year (000) | | | $52,619 | | | | $58,078 | | | | $86,429 | | | | $87,605 | | | | $96,390 | |
| | | | | |
Ratio of net expenses to average net assets | | | 1.15% | | | | 1.15% | | | | 1.15% | | | | 1.13% | | | | 1.09% | |
| | | | | |
Ratio of gross expenses to average net assets prior to expense reductions | | | 1.26% | | | | 1.31% | | | | 1.28% | | | | 1.25% | | | | 1.09% | |
| | | | | |
Ratio of net investment income (loss) to average net assets | | | 0.14% | | | | 0.18% | | | | 0.23% | | | | 0.33% | | | | 0.26% | |
| * | Distribution for annual periods determined in accordance with federal income tax regulations. |
| (a) | Net investment income (loss) allocated based on average shares method. |
| (b) | Total return measures net investment income (loss) and capital gain or loss from portfolio investments assuming reinvestment of dividends and capital gains distributions. Total return is not annualized for periods that are less than a full year, does not reflect the effect of sales charge for Class A shares nor the contingent deferred sales charge for Class C shares and does not reflect the deduction of taxes that a shareholder would pay on fund distributions or the redemption of fund shares. |
| | | | |
| 234 | | CALAMOS OPEN-END FAMILY OF FUNDS ANNUAL REPORT | | |
Calamos Global Growth and Income Fund Financial Highlights
Selected data for a share outstanding throughout each year were as follows:
| | | | | | | | | | | | | | | | | | | | |
| | | CLASS A | |
| | | Year Ended October 31, | |
| | | 2019 | | | 2018 | | | 2017 | | | 2016 | | | 2015 | |
| | | | | |
Net asset value, beginning of year | | | $8.99 | | | | $9.85 | | | | $8.47 | | | | $8.63 | | | | $10.22 | |
|
Income from investment operations: | |
| | | | | |
Net investment income (loss)(a) | | | 0.10 | | | | 0.09 | | | | 0.10 | | | | 0.09 | | | | 0.10 | |
| | | | | |
Net realized and unrealized gain (loss) | | | 0.37 | | | | (0.35 | ) | | | 1.35 | | | | (0.14 | ) | | | 0.06 | |
| | | | | |
Total from investment operations | | | 0.47 | | | | (0.26 | ) | | | 1.45 | | | | (0.05 | ) | | | 0.16 | |
|
Distributions: | |
| | | | | |
Dividends from net investment income | | | (0.07 | ) | | | (0.03 | ) | | | (0.01 | ) | | | — | | | | (0.04 | ) |
| | | | | |
Dividends from net realized gains | | | (0.88 | ) | | | (0.57 | ) | | | (0.06 | ) | | | (0.11 | ) | | | (1.71 | ) |
| | | | | |
Total distributions* | | | (0.95 | ) | | | (0.60 | ) | | | (0.07 | ) | | | (0.11 | ) | | | (1.75 | ) |
| | | | | |
Net asset value, end of year | | | $8.51 | | | | $8.99 | | | | $9.85 | | | | $8.47 | | | | $8.63 | |
|
Ratios and supplemental data: | |
| | | | | |
Total return(b) | | | 6.67% | | | | (2.91% | ) | | | 17.16% | | | | (0.59% | ) | | | 2.02% | |
| | | | | |
Net assets, end of year (000) | | | $83,069 | | | | $63,069 | | | | $78,196 | | | | $84,648 | | | | $111,615 | |
| | | | | |
Ratio of net expenses to average net assets | | | 1.49% | | | | 1.50% | | | | 1.54% | | | | 1.46% | | | | 1.49% | |
| | | | | |
Ratio of gross expenses to average net assets prior to expense reductions | | | 1.49% | | | | 1.50% | | | | 1.54% | | | | 1.46% | | | | 1.49% | |
| | | | | |
Ratio of net investment income (loss) to average net assets | | | 1.20% | | | | 0.93% | | | | 1.16% | | | | 1.09% | | | | 1.18% | |
| |
| | | Year Ended October 31, | |
| | | 2019 | | | 2018 | | | 2017 | | | 2016 | | | 2015 | |
| | | | | |
Portfolio turnover rate | | | 68.8% | | | | 75.0% | | | | 100.2% | | | | 58.0% | | | | 54.7% | |
| * | Distribution for annual periods determined in accordance with federal income tax regulations. |
| (a) | Net investment income (loss) allocated based on average shares method. |
| (b) | Total return measures net investment income (loss) and capital gain or loss from portfolio investments assuming reinvestment of dividends and capital gains distributions. Total return is not annualized for periods that are less than a full year, does not reflect the effect of sales charge for Class A shares nor the contingent deferred sales charge for Class C shares and does not reflect the deduction of taxes that a shareholder would pay on fund distributions or the redemption of fund shares. |
Calamos Global Growth and Income Fund Financial Highlights
| | | | | | | | | | | | | | | | | | | | |
| | | CLASS C | |
| | | Year Ended October 31, | |
| | | 2019 | | | 2018 | | | 2017 | | | 2016 | | | 2015 | |
| | | | | |
Net asset value, beginning of year | | | $7.98 | | | | $8.84 | | | | $7.65 | | | | $7.87 | | | | $9.50 | |
|
Income from investment operations: | |
| | | | | |
Net investment income (loss)(a) | | | 0.04 | | | | 0.02 | | | | 0.04 | | | | 0.03 | | | | 0.03 | |
| | | | | |
Net realized and unrealized gain (loss) | | | 0.31 | | | | (0.31 | ) | | | 1.21 | | | | (0.14 | ) | | | 0.05 | |
| | | | | |
Total from investment operations | | | 0.35 | | | | (0.29 | ) | | | 1.25 | | | | (0.11 | ) | | | 0.08 | |
|
Distributions: | |
| | | | | |
Dividends from net investment income | | | — | | | | — | | | | — | | | | — | | | | — | |
| | | | | |
Dividends from net realized gains | | | (0.88 | ) | | | (0.57 | ) | | | (0.06 | ) | | | (0.11 | ) | | | (1.71 | ) |
| | | | | |
Total distributions* | | | (0.88 | ) | | | (0.57 | ) | | | (0.06 | ) | | | (0.11 | ) | | | (1.71 | ) |
| | | | | |
Net asset value, end of year | | | $7.45 | | | | $7.98 | | | | $8.84 | | | | $7.65 | | | | $7.87 | |
|
Ratios and supplemental data: | |
| | | | | |
Total return(b) | | | 5.87% | | | | (3.61% | ) | | | 16.41% | | | | (1.42% | ) | | | 1.19% | |
| | | | | |
Net assets, end of year (000) | | | $14,742 | | | | $54,425 | | | | $70,210 | | | | $90,640 | | | | $119,620 | |
| | | | | |
Ratio of net expenses to average net assets | | | 2.28% | | | | 2.25% | | | | 2.29% | | | | 2.21% | | | | 2.24% | |
| | | | | |
Ratio of gross expenses to average net assets prior to expense reductions | | | 2.28% | | | | 2.25% | | | | 2.29% | | | | 2.21% | | | | 2.24% | |
| | | | | |
Ratio of net investment income (loss) to average net assets | | | 0.50% | | | | 0.18% | | | | 0.44% | | | | 0.34% | | | | 0.43% | |
| |
| | | CLASS I | |
| | | Year Ended October 31, | |
| | | 2019 | | | 2018 | | | 2017 | | | 2016 | | | 2015 | |
| | | | | |
Net asset value, beginning of year | | | $9.25 | | | | $10.11 | | | | $8.70 | | | | $8.84 | | | | $10.43 | |
|
Income from investment operations: | |
| | | | | |
Net investment income (loss)(a) | | | 0.13 | | | | 0.12 | | | | 0.13 | | | | 0.11 | | | | 0.13 | |
| | | | | |
Net realized and unrealized gain (loss) | | | 0.38 | | | | (0.36 | ) | | | 1.38 | | | | (0.14 | ) | | | 0.05 | |
| | | | | |
Total from investment operations | | | 0.51 | | | | (0.24 | ) | | | 1.51 | | | | (0.03 | ) | | | 0.18 | |
|
Distributions: | |
| | | | | |
Dividends from net investment income | | | (0.09 | ) | | | (0.05 | ) | | | (0.04 | ) | | | — | | | | (0.06 | ) |
| | | | | |
Dividends from net realized gains | | | (0.88 | ) | | | (0.57 | ) | | | (0.06 | ) | | | (0.11 | ) | | | (1.71 | ) |
| | | | | |
Total distributions* | | | (0.97 | ) | | | (0.62 | ) | | | (0.10 | ) | | | (0.11 | ) | | | (1.77 | ) |
| | | | | |
Net asset value, end of year | | | $8.79 | | | | $9.25 | | | | $10.11 | | | | $8.70 | | | | $8.84 | |
|
Ratios and supplemental data: | |
| | | | | |
Total return(b) | | | 6.95% | | | | (2.65% | ) | | | 17.51% | | | | (0.35% | ) | | | 2.23% | |
| | | | | |
Net assets, end of year (000) | | | $53,594 | | | | $72,843 | | | | $73,361 | | | | $124,175 | | | | $146,241 | |
| | | | | |
Ratio of net expenses to average net assets | | | 1.25% | | | | 1.25% | | | | 1.29% | | | | 1.21% | | | | 1.24% | |
| | | | | |
Ratio of gross expenses to average net assets prior to expense reductions | | | 1.25% | | | | 1.25% | | | | 1.29% | | | | 1.21% | | | | 1.24% | |
| | | | | |
Ratio of net investment income (loss) to average net assets | | | 1.47% | | | | 1.18% | | | | 1.43% | | | | 1.34% | | | | 1.43% | |
| * | Distribution for annual periods determined in accordance with federal income tax regulations. |
| (a) | Net investment income (loss) allocated based on average shares method. |
| (b) | Total return measures net investment income (loss) and capital gain or loss from portfolio investments assuming reinvestment of dividends and capital gains distributions. Total return is not annualized for periods that are less than a full year, does not reflect the effect of sales charge for Class A shares nor the contingent deferred sales charge for Class C shares and does not reflect the deduction of taxes that a shareholder would pay on fund distributions or the redemption of fund shares. |
| | | | |
| 236 | | CALAMOS OPEN-END FAMILY OF FUNDS ANNUAL REPORT | | |
Calamos Total Return Bond Fund Financial Highlights
Selected data for a share outstanding throughout each year were as follows:
| | | | | | | | | | | | | | | | | | | | |
| | | CLASS A | |
| | | Year Ended October 31, | |
| | | 2019 | | | 2018 | | | 2017 | | | 2016 | | | 2015 | |
| | | | | |
Net asset value, beginning of year | | | $9.81 | | | | $10.39 | | | | $10.54 | | | | $10.51 | | | | $10.70 | |
|
Income from investment operations: | |
| | | | | |
Net investment income (loss)(a) | | | 0.27 | | | | 0.25 | | | | 0.22 | | | | 0.24 | | | | 0.26 | |
| | | | | |
Net realized and unrealized gain (loss) | | | 0.72 | | | | (0.49 | ) | | | (0.13 | ) | | | 0.20 | | | | (0.05 | ) |
| | | | | |
Total from investment operations | | | 0.99 | | | | (0.24 | ) | | | 0.09 | | | | 0.44 | | | | 0.21 | |
|
Distributions: | |
| | | | | |
Dividends from net investment income | | | (0.27 | ) | | | (0.26 | ) | | | (0.23 | ) | | | (0.28 | ) | | | (0.28 | ) |
| | | | | |
Dividends from net realized gains | | | — | | | | (0.05 | ) | | | (0.01 | ) | | | (0.13 | ) | | | (0.12 | ) |
| | | | | |
Return of capital | | | — | | | | (0.03 | ) | | | — | | | | — | | | | — | |
| | | | | |
Total distributions* | | | (0.27 | ) | | | (0.34 | ) | | | (0.24 | ) | | | (0.41 | ) | | | (0.40 | ) |
| | | | | |
Net asset value, end of year | | | $10.53 | | | | $9.81 | | | | $10.39 | | | | $10.54 | | | | $10.51 | |
| | | | | |
Ratios and supplemental data: | | | | | | | | | | | | | | | | | | | | |
| | | | | |
Total return(b) | | | 10.24% | | | | (2.30% | ) | | | 0.92% | | | | 4.35% | | | | 2.04% | |
| | | | | |
Net assets, end of year (000) | | | $22,565 | | | | $17,109 | | | | $21,707 | | | | $57,339 | | | | $51,462 | |
| | | | | |
Ratio of net expenses to average net assets | | | 0.90% | | | | 0.90% | | | | 0.90% | | | | 0.88% | | | | 0.90% | |
| | | | | |
Ratio of gross expenses to average net assets prior to expense reductions | | | 1.09% | | | | 1.05% | | | | 1.14% | | | | 1.07% | | | | 1.13% | |
| | | | | |
Ratio of net investment income (loss) to average net assets | | | 2.67% | | | | 2.44% | | | | 2.14% | | | | 2.25% | | | | 2.49% | |
| |
| | | Year Ended October 31, | |
| | | 2019 | | | 2018 | | | 2017 | | | 2016 | | | 2015 | |
| | | | | |
Portfolio turnover rate | | | 63.8% | | | | 64.3% | | | | 79.1% | | | | 54.0% | | | | 80.0% | |
| * | Distribution for annual periods determined in accordance with federal income tax regulations. |
| (a) | Net investment income (loss) allocated based on average shares method. |
| (b) | Total return measures net investment income (loss) and capital gain or loss from portfolio investments assuming reinvestment of dividends and capital gains distributions. Total return is not annualized for periods that are less than a full year, does not reflect the effect of sales charge for Class A shares nor the contingent deferred sales charge for Class C shares and does not reflect the deduction of taxes that a shareholder would pay on fund distributions or the redemption of fund shares. |
Calamos Total Return Bond Fund Financial Highlights
| | | | | | | | | | | | | | | | | | | | |
| | | CLASS C | |
| | | Year Ended October 31, | |
| | | 2019 | | | 2018 | | | 2017 | | | 2016 | | | 2015 | |
| | | | | |
Net asset value, beginning of year | | | $9.81 | | | | $10.39 | | | | $10.54 | | | | $10.51 | | | | $10.70 | |
|
Income from investment operations: | |
| | | | | |
Net investment income (loss)(a) | | | 0.20 | | | | 0.17 | | | | 0.14 | | | | 0.16 | | | | 0.18 | |
| | | | | |
Net realized and unrealized gain (loss) | | | 0.72 | | | | (0.48 | ) | | | (0.12 | ) | | | 0.20 | | | | (0.05 | ) |
| | | | | |
Total from investment operations | | | 0.92 | | | | (0.31 | ) | | | 0.02 | | | | 0.36 | | | | 0.13 | |
|
Distributions: | |
| | | | | |
Dividends from net investment income | | | (0.20 | ) | | | (0.20 | ) | | | (0.16 | ) | | | (0.20 | ) | | | (0.20 | ) |
| | | | | |
Dividends from net realized gains | | | — | | | | (0.05 | ) | | | (0.01 | ) | | | (0.13 | ) | | | (0.12 | ) |
| | | | | |
Return of capital | | | — | | | | (0.02 | ) | | | — | | | | — | | | | — | |
| | | | | |
Total distributions* | | | (0.20 | ) | | | (0.27 | ) | | | (0.17 | ) | | | (0.33 | ) | | | (0.32 | ) |
| | | | | |
Net asset value, end of year | | | $10.53 | | | | $9.81 | | | | $10.39 | | | | $10.54 | | | | $10.51 | |
| | | | | |
Ratios and supplemental data: | | | | | | | | | | | | | | | | | | | | |
| | | | | |
Total return(b) | | | 9.42% | | | | (3.03% | ) | | | 0.17% | | | | 3.57% | | | | 1.28% | |
| | | | | |
Net assets, end of year (000) | | | $2,929 | | | | $6,413 | | | | $9,334 | | | | $16,340 | | | | $15,898 | |
| | | | | |
Ratio of net expenses to average net assets | | | 1.65% | | | | 1.65% | | | | 1.65% | | | | 1.63% | | | | 1.65% | |
| | | | | |
Ratio of gross expenses to average net assets prior to expense reductions | | | 1.84% | | | | 1.80% | | | | 1.89% | | | | 1.82% | | | | 1.88% | |
| | | | | |
Ratio of net investment income (loss) to average net assets | | | 1.98% | | | | 1.69% | | | | 1.38% | | | | 1.51% | | | | 1.74% | |
| |
| | | CLASS I | |
| | | Year Ended October 31, | |
| | | 2019 | | | 2018 | | | 2017 | | | 2016 | | | 2015 | |
| | | | | |
Net asset value, beginning of year | | | $9.81 | | | | $10.39 | | | | $10.54 | | | | $10.51 | | | | $10.70 | |
|
Income from investment operations: | |
| | | | | |
Net investment income (loss)(a) | | | 0.30 | | | | 0.27 | | | | 0.24 | | | | 0.26 | | | | 0.29 | |
| | | | | |
Net realized and unrealized gain (loss) | | | 0.73 | | | | (0.48 | ) | | | (0.12 | ) | | | 0.21 | | | | (0.05 | ) |
| | | | | |
Total from investment operations | | | 1.03 | | | | (0.21 | ) | | | 0.12 | | | | 0.47 | | | | 0.24 | |
|
Distributions: | |
| | | | | |
Dividends from net investment income | | | (0.30 | ) | | | (0.29 | ) | | | (0.26 | ) | | | (0.31 | ) | | | (0.31 | ) |
| | | | | |
Dividends from net realized gains | | | — | | | | (0.05 | ) | | | (0.01 | ) | | | (0.13 | ) | | | (0.12 | ) |
| | | | | |
Return of capital | | | — | | | | (0.03 | ) | | | — | | | | — | | | | — | |
| | | | | |
Total distributions* | | | (0.30 | ) | | | (0.37 | ) | | | (0.27 | ) | | | (0.44 | ) | | | (0.43 | ) |
| | | | | |
Net asset value, end of year | | | $10.54 | | | | $9.81 | | | | $10.39 | | | | $10.54 | | | | $10.51 | |
| | | | | |
Ratios and supplemental data: | | | | | | | | | | | | | | | | | | | | |
| | | | | |
Total return(b) | | | 10.62% | | | | (2.06% | ) | | | 1.18% | | | | 4.60% | | | | 2.30% | |
| | | | | |
Net assets, end of year (000) | | | $35,570 | | | | $32,888 | | | | $40,290 | | | | $22,067 | | | | $16,561 | |
| | | | | |
Ratio of net expenses to average net assets | | | 0.65% | | | | 0.65% | | | | 0.65% | | | | 0.63% | | | | 0.65% | |
| | | | | |
Ratio of gross expenses to average net assets prior to expense reductions | | | 0.84% | | | | 0.80% | | | | 0.90% | | | | 0.82% | | | | 0.88% | |
| | | | | |
Ratio of net investment income (loss) to average net assets | | | 2.92% | | | | 2.69% | | | | 2.32% | | | | 2.49% | | | | 2.73% | |
| * | Distribution for annual periods determined in accordance with federal income tax regulations. |
| (a) | Net investment income (loss) allocated based on average shares method. |
| (b) | Total return measures net investment income (loss) and capital gain or loss from portfolio investments assuming reinvestment of dividends and capital gains distributions. Total return is not annualized for periods that are less than a full year, does not reflect the effect of sales charge for Class A shares nor the contingent deferred sales charge for Class C shares and does not reflect the deduction of taxes that a shareholder would pay on fund distributions or the redemption of fund shares. |
| | | | |
| 238 | | CALAMOS OPEN-END FAMILY OF FUNDS ANNUAL REPORT | | |
Calamos High Income Opportunities Fund Financial Highlights
Selected data for a share outstanding throughout each year were as follows:
| | | | | | | | | | | | | | | | | | | | |
| | | CLASS A | |
| | | Year Ended October 31, | |
| | | 2019 | | | 2018 | | | 2017 | | | 2016 | | | 2015 | |
| | | | | |
Net asset value, beginning of year | | | $8.37 | | | | $8.87 | | | | $8.62 | | | | $8.63 | | | | $9.65 | |
|
Income from investment operations: | |
| | | | | |
Net investment income (loss)(a) | | | 0.48 | | | | 0.47 | | | | 0.40 | | | | 0.40 | | | | 0.43 | |
| | | | | |
Net realized and unrealized gain (loss) | | | (0.01 | ) | | | (0.45 | ) | | | 0.26 | | | | 0.03 | | | | (0.74 | ) |
| | | | | |
Total from investment operations | | | 0.47 | | | | 0.02 | | | | 0.66 | | | | 0.43 | | | | (0.31 | ) |
|
Distributions: | |
| | | | | |
Dividends from net investment income | | | (0.50 | ) | | | (0.52 | ) | | | (0.41 | ) | | | (0.44 | ) | | | (0.47 | ) |
| | | | | |
Dividends from net realized gains | | | — | | | | — | | | | — | | | | — | | | | (0.24 | ) |
| | | | | |
Return of capital | | | — | | | | — | | | | — | | | | — | | | | (0.00 | )* |
| | | | | |
Total distributions** | | | (0.50 | ) | | | (0.52 | ) | | | (0.41 | ) | | | (0.44 | ) | | | (0.71 | ) |
| | | | | |
Net asset value, end of year | | | $8.34 | | | | $8.37 | | | | $8.87 | | | | $8.62 | | | | $8.63 | |
| | | | | |
Ratios and supplemental data: | | | | | | | | | | | | | | | | | | | | |
| | | | | |
Total return(b) | | | 5.85% | | | | 0.25% | | | | 7.82% | | | | 5.26% | | | | (3.25% | ) |
| | | | | |
Net assets, end of year (000) | | | $35,124 | | | | $32,282 | | | | $36,351 | | | | $41,046 | | | | $71,513 | |
| | | | | |
Ratio of net expenses to average net assets | | | 1.00% | | | | 1.00% | | | | 1.29% | | | | 1.33% | | | | 1.28% | |
| | | | | |
Ratio of gross expenses to average net assets prior to expense reductions | | | 1.23% | | | | 1.46% | | | | 1.43% | | | | 1.33% | | | | 1.28% | |
| | | | | |
Ratio of net investment income (loss) to average net assets | | | 5.71% | | | | 5.41% | | | | 4.57% | | | | 4.81% | | | | 4.73% | |
| |
| | | Year Ended October 31, | |
| | | 2019 | | | 2018 | | | 2017 | | | 2016 | | | 2015 | |
| | | | | |
Portfolio turnover rate | | | 45.6% | | | | 55.5% | | | | 93.1% | | | | 44.4% | | | | 65.3% | |
| * | Amounts are less than $0.005. |
| ** | Distribution for annual periods determined in accordance with federal income tax regulations. |
| (a) | Net investment income (loss) allocated based on average shares method. |
| (b) | Total return measures net investment income (loss) and capital gain or loss from portfolio investments assuming reinvestment of dividends and capital gains distributions. Total return is not annualized for periods that are less than a full year, does not reflect the effect of sales charge for Class A shares nor the contingent deferred sales charge for Class B and C shares and does not reflect the deduction of taxes that a shareholder would pay on fund distributions or the redemption of fund shares. |
Calamos High Income Opportunities Fund Financial Highlights
| | | | | | | | | | | | | | | | | | | | |
| | | CLASS C | |
| | | Year Ended October 31, | |
| | | 2019 | | | 2018 | | | 2017 | | | 2016 | | | 2015 | |
| | | | | |
Net asset value, beginning of year | | | $8.82 | | | | $9.31 | | | | $9.03 | | | | $9.03 | | | | $10.06 | |
|
Income from investment operations: | |
| | | | | |
Net investment income (loss)(a) | | | 0.45 | | | | 0.42 | | | | 0.35 | | | | 0.36 | | | | 0.38 | |
| | | | | |
Net realized and unrealized gain (loss) | | | (0.02 | ) | | | (0.46 | ) | | | 0.27 | | | | 0.01 | | | | (0.78 | ) |
| | | | | |
Total from investment operations | | | 0.43 | | | | (0.04 | ) | | | 0.62 | | | | 0.37 | | | | (0.40 | ) |
|
Distributions: | |
| | | | | |
Dividends from net investment income | | | (0.43 | ) | | | (0.45 | ) | | | (0.34 | ) | | | (0.37 | ) | | | (0.39 | ) |
| | | | | |
Dividends from net realized gains | | | — | | | | — | | | | — | | | | — | | | | (0.24 | ) |
| | | | | |
Return of capital | | | — | | | | — | | | | — | | | | — | | | | (0.00 | )* |
| | | | | |
Total distributions** | | | (0.43 | ) | | | (0.45 | ) | | | (0.34 | ) | | | (0.37 | ) | | | (0.63 | ) |
| | | | | |
Net asset value, end of year | | | $8.82 | | | | $8.82 | | | | $9.31 | | | | $9.03 | | | | $9.03 | |
| | | | | |
Ratios and supplemental data: | | | | | | | | | | | | | | | | | | | | |
| | | | | |
Total return(b) | | | 5.04% | | | | (0.42% | ) | | | 6.97% | | | | 4.35% | | | | (3.94% | ) |
| | | | | |
Net assets, end of year (000) | | | $1,887 | | | | $9,772 | | | | $13,286 | | | | $17,479 | | | | $21,149 | |
| | | | | |
Ratio of net expenses to average net assets | | | 1.75% | | | | 1.75% | | | | 2.05% | | | | 2.08% | | | | 2.04% | |
| | | | | |
Ratio of gross expenses to average net assets prior to expense reductions | | | 2.08% | | | | 2.22% | | | | 2.18% | | | | 2.08% | | | | 2.04% | |
| | | | | |
Ratio of net investment income (loss) to average net assets | | | 5.16% | | | | 4.66% | | | | 3.80% | | | | 4.07% | | | | 3.98% | |
| |
| | | CLASS I | |
| | | Year Ended October 31, | |
| | | 2019 | | | 2018 | | | 2017 | | | 2016 | | | 2015 | |
| | | | | |
Net asset value, beginning of year | | | $8.37 | | | | $8.86 | | | | $8.61 | | | | $8.63 | | | | $9.65 | |
|
Income from investment operations: | |
| | | | | |
Net investment income (loss)(a) | | | 0.50 | | | | 0.49 | | | | 0.43 | | | | 0.42 | | | | 0.45 | |
| | | | | |
Net realized and unrealized gain (loss) | | | (0.01 | ) | | | (0.44 | ) | | | 0.25 | | | | 0.02 | | | | (0.74 | ) |
| | | | | |
Total from investment operations | | | 0.49 | | | | 0.05 | | | | 0.68 | | | | 0.44 | | | | (0.29 | ) |
|
Distributions: | |
| | | | | |
Dividends from net investment income | | | (0.52 | ) | | | (0.54 | ) | | | (0.43 | ) | | | (0.46 | ) | | | (0.49 | ) |
| | | | | |
Dividends from net realized gains | | | — | | | | — | | | | — | | | | — | | | | (0.24 | ) |
| | | | | |
Return of capital | | | — | | | | — | | | | — | | | | — | | | | (0.00 | )* |
| | | | | |
Total distributions** | | | (0.52 | ) | | | (0.54 | ) | | | (0.43 | ) | | | (0.46 | ) | | | (0.73 | ) |
| | | | | |
Net asset value, end of year | | | $8.34 | | | | $8.37 | | | | $8.86 | | | | $8.61 | | | | $8.63 | |
| | | | | |
Ratios and supplemental data: | | | | | | | | | | | | | | | | | | | | |
| | | | | |
Total return(b) | | | 6.11% | | | | 0.62% | | | | 8.09% | | | | 5.41% | | | | (3.00% | ) |
| | | | | |
Net assets, end of year (000) | | | $7,003 | | | | $7,706 | | | | $10,026 | | | | $15,183 | | | | $17,452 | |
| | | | | |
Ratio of net expenses to average net assets | | | 0.75% | | | | 0.75% | | | | 1.02% | | | | 1.08% | | | | 1.04% | |
| | | | | |
Ratio of gross expenses to average net assets prior to expense reductions | | | 0.99% | | | | 1.21% | | | | 1.18% | | | | 1.08% | | | | 1.04% | |
| | | | | |
Ratio of net investment income (loss) to average net assets | | | 5.97% | | | | 5.65% | | | | 4.84% | | | | 5.07% | | | | 4.98% | |
| * | Amounts are less than $0.005. |
| ** | Distribution for annual periods determined in accordance with federal income tax regulations. |
| (a) | Net investment income (loss) allocated based on average shares method. |
| (b) | Total return measures net investment income (loss) and capital gain or loss from portfolio investments assuming reinvestment of dividends and capital gains distributions. Total return is not annualized for periods that are less than a full year, does not reflect the effect of sales charge for Class A shares nor the contingent deferred sales charge for Class C shares and does not reflect the deduction of taxes that a shareholder would pay on fund distributions or the redemption of fund shares. |
| | | | |
| 240 | | CALAMOS OPEN-END FAMILY OF FUNDS ANNUAL REPORT | | |
Calamos Short-Term Bond Fund Financial Highlights
Selected data for a share outstanding throughout each year were as follows:
| | | | | | | | |
| | | CLASS A | |
| | | Year Ended
October 31, | | | September 19, 2018• through October 31, | |
| | | 2019 | | | 2018 | |
| | |
Net asset value, beginning of year | | | $9.98 | | | | $10.00 | |
|
| Income from investment operations: | |
| | |
Net investment income (loss)(a) | | | 0.25 | | | | 0.03 | |
| | |
Net realized and unrealized gain (loss) | | | 0.23 | | | | (0.02 | ) |
| | |
Total from investment operations | | | 0.48 | | | | 0.01 | |
|
Distributions: | |
| | |
Dividends from net investment income | | | (0.26 | ) | | | (0.03 | ) |
| | |
Dividends from net realized gains | | | — | * | | | — | |
| | |
Total distributions** | | | (0.26 | ) | | | (0.03 | ) |
| | |
Net asset value, end of year | | | $10.20 | | | | $9.98 | |
|
Ratios and supplemental data: | |
| | |
Total return(b) | | | 4.84% | | | | 0.12% | |
| | |
Net assets, end of year (000) | | | $601 | | | | $25 | |
| | |
Ratio of net expenses to average net assets | | | 0.65% | | | | 0.66% | (c) |
| | |
Ratio of gross expenses to average net assets prior to expense reductions | | | 0.74% | | | | 48.01% | (c) |
| | |
Ratio of net investment income (loss) to average net assets | | | 2.47% | | | | 2.55% | (c) |
| | |
| | | Year Ended
October 31, | | | September 19, 2018• through October 31, | |
| | | 2019 | | | 2018 | |
| | |
Portfolio turnover rate | | | 132.0% | | | | 3.3% | |
| • | Commencement of operations. |
| * | Amounts are less than $0.005. |
| ** | Distribution for annual periods determined in accordance with federal income tax regulations. |
| (a) | Net investment income (loss) allocated based on average shares method. |
| (b) | Total return measures net investment income (loss) and capital gain or loss from portfolio investments assuming reinvestment of dividends and capital gains distributions. Total return is not annualized for periods that are less than a full year, does not reflect the effect of sales charge for Class A shares nor the contingent deferred sales charge for Class B and C shares and does not reflect the deduction of taxes that a shareholder would pay on fund distributions or the redemption of fund shares. |
Calamos Short-Term Bond Fund Financial Highlights
| | | | | | | | |
| | | CLASS I | |
| | | Year Ended
October 31, | | | September 19, 2018• through October 31, | |
| | | 2019 | | | 2018 | |
| | |
Net asset value, beginning of year | | | $9.98 | | | | $10.00 | |
|
| Income from investment operations: | |
| | |
Net investment income (loss)(a) | | | 0.28 | | | | 0.04 | |
| | |
Net realized and unrealized gain (loss) | | | 0.22 | | | | (0.02 | ) |
| | |
Total from investment operations | | | 0.50 | | | | 0.02 | |
|
Distributions: | |
| | |
Dividends from net investment income | | | (0.28 | ) | | | (0.04 | ) |
| | |
Dividends from net realized gains | | | — | * | | | — | |
| | |
Total distributions** | | | (0.28 | ) | | | (0.04 | ) |
| | |
Net asset value, end of year | | | $10.20 | | | | $9.98 | |
|
Ratios and supplemental data: | |
| | |
Total return(b) | | | 5.09% | | | | 0.16% | |
| | |
Net assets, end of year (000) | | | $217,552 | | | | $15,118 | |
| | |
Ratio of net expenses to average net assets | | | 0.40% | | | | 0.42% | (c) |
| | |
Ratio of gross expenses to average net assets prior to expense reductions | | | 0.47% | | | | 2.13% | (c) |
| | |
Ratio of net investment income (loss) to average net assets | | | 2.73% | | | | 3.22% | (c) |
| • | Commencement of operations. |
| * | Amounts are less than $0.005. |
| ** | Distribution for annual periods determined in accordance with federal income tax regulations. |
| (a) | Net investment income (loss) allocated based on average shares method. |
| (b) | Total return measures net investment income (loss) and capital gain or loss from portfolio investments assuming reinvestment of dividends and capital gains distributions. Total return is not annualized for periods that are less than a full year, does not reflect the effect of sales charge for Class A shares nor the contingent deferred sales charge for Class C shares and does not reflect the deduction of taxes that a shareholder would pay on fund distributions or the redemption of fund shares. |
| | | | |
| 242 | | CALAMOS OPEN-END FAMILY OF FUNDS ANNUAL REPORT | | |
Report of Independent Registered Public Accounting Firm
To the shareholders and the Board of Trustees of Calamos Investment Trust
Opinion on the Financial Statements and Financial Highlights
We have audited the accompanying statements of assets and liabilities of Calamos Investment Trust comprising the Calamos Growth Fund, Calamos Opportunistic Value Fund, Calamos Dividend Growth Fund, Calamos International Growth Fund, Calamos Evolving World Growth Fund, Calamos Global Equity Fund, Calamos Growth and Income Fund, Calamos Global Growth and Income Fund, Calamos Convertible Fund, Calamos Global Convertible Fund, Calamos Total Return Bond Fund, Calamos High Income Opportunities Fund, Calamos Market Neutral Income Fund, Calamos Hedged Equity Fund, Calamos Phineus Long/Short Fund, Calamos Short-Term Bond Fund, Calamos Timpani Small Cap Growth Fund (formerly known as “Frontier Timpani Small Cap Growth Fund”), and Calamos Timpani SMID Growth Fund (the “Funds”), including the schedules of investments, as of October 31, 2019; the related statements of operations, the statements of changes in net assets, and the financial highlights for each of the periods listed in the table below, and the related notes. In our opinion, the financial statements and financial highlights present fairly, in all material respects, the financial position of each of the funds listed above constituting Calamos Investment Trust as of October 31, 2019, and the results of their operations, the changes in their net assets, and the financial highlights for each of the periods listed in the table below in conformity with accounting principles generally accepted in the United States of America.
| | | | | | |
Individual Fund Comprising the
Calamos Investment Trust | | Statement of
Operations | | Statements of
Changes in
Net Assets | | Financial Highlights |
| | | |
| Calamos Growth Fund, Calamos Opportunistic Value Fund, Calamos Dividend Growth Fund, Calamos International Growth Fund, Calamos Evolving World Growth Fund, Calamos Global Equity Fund, Calamos Growth and Income Fund, Calamos Global Growth and Income Fund, Calamos Convertible Fund, Calamos Total Return Bond Fund, Calamos High Income Opportunities Fund, Calamos Market Neutral Income Fund | | For the year ended October 31, 2019 | | For the years ended October 31, 2019 and 2018. | | For the years ended October 31, 2019, October 31, 2018, October 31, 2017, October 31, 2016 and, October 31, 2015 |
| | | |
Calamos Hedged Equity Fund
Calamos Global Convertible Fund
| | For the year ended October 31, 2019 | | For the years ended October 31, 2019 and 2018 | | For the years ended October 31, 2019, 2018, 2017, and 2016 and the period from December 31, 2014 (commencement of operations) through October 31, 2015 |
| | | |
| Calamos Phineus Long/Short Fund | | For the year ended October 31, 2019 | | For the years ended October 31, 2019 and 2018 | | For the years ended October 31, 2019, 2018, and 2017, and the period from April 5, 2016 (commencement of operations) through October 31, 2016 |
| | | |
| Calamos Short-Term Bond Fund | | For the year ended October 31, 2019 | | For the years ended October 31, 2019 and 2018 | | For the year ended October 31, 2019 and for the period from September 19, 2018 (commencement of operations) through October 31, 2018 |
| |
| Calamos Timpani Small Cap Growth Fund | | For the period from May 31, 2019 (commencement of operations) through October 31, 2019 |
| |
| Calamos Timpani SMID Growth Fund | | For the period from July 31, 2019 (commencement of operations) through October 31, 2019 |
| |
| Frontier Timpani Small Cap Growth Fund | | For the period from July 1, 2018 through May 31, 2019 |
The statement of changes in net assets for the year ended June 30, 2018 and the financial highlights for the year ended June 30, 2018, 2017, 2016, and 2015 of Frontier Timpani Small Cap Growth Fund were audited by other auditors whose report dated August 27, 2018, expressed an unqualified opinion on those financial statements and financial highlights.
Basis for Opinion
These financial statements and financial highlights are the responsibility of the Funds’ management. Our responsibility is to express an opinion on the Funds’ financial statements and financial highlights based on our audits. We are a public accounting firm registered with the Public Company Accounting Oversight Board (United States) (PCAOB) and are required to be independent with respect to the Funds in accordance with the U.S. federal securities laws and the applicable rules and regulations of the Securities and Exchange Commission and the PCAOB.
We conducted our audits in accordance with the standards of the PCAOB. Those standards require that we plan and perform the audit to obtain reasonable assurance about whether the financial statements and financial highlights are free of material
Report of Independent Registered Public Accounting Firm
misstatement, whether due to error or fraud. The Funds are not required to have, nor were we engaged to perform, an audit of their internal control over financial reporting. As part of our audits we are required to obtain an understanding of internal control over financial reporting but not for the purpose of expressing an opinion on the effectiveness of the Funds’ internal control over financial reporting. Accordingly, we express no such opinion.
Our audits included performing procedures to assess the risks of material misstatement of the financial statements and financial highlights, whether due to error or fraud, and performing procedures that respond to those risks. Such procedures included examining, on a test basis, evidence regarding the amounts and disclosures in the financial statements and financial highlights. Our audits also included evaluating the accounting principles used and significant estimates made by management, as well as evaluating the overall presentation of the financial statements and financial highlights. Our procedures included confirmation of securities owned as of October 31, 2019, by correspondence with the custodian and brokers; when replies were not received from brokers, we performed other auditing procedures. We believe that our audits provide a reasonable basis for our opinion.

Chicago, Illinois
December 18, 2019
We have served as the auditor of one or more Calamos Advisors LLC investment companies since 2003.
| | | | |
| 244 | | CALAMOS OPEN-END FAMILY OF FUNDS ANNUAL REPORT | | |
Trustee Approval of Management Agreement (Unaudited)
The Board of Trustees (“Board” or the “Trustees”) of the Trust oversees the management of each of the Funds, and, as required by law, determines annually whether to continue the Trust’s management agreement with Calamos Advisors LLC (“Adviser”) pursuant to which the Adviser serves as the investment manager and administrator for each of the Funds. The “Independent Trustees,” who comprise more than 80% of the Board, have never been affiliated with the Adviser.
In connection with their most recent consideration regarding the continuation of the management agreement, the Trustees received and reviewed a substantial amount of information provided by the Adviser in response to detailed requests of the Independent Trustees and their independent legal counsel. In the course of their consideration of the agreement, the Independent Trustees were advised by their counsel, and in addition to meeting with management of the Adviser, they met separately in executive session with their counsel.
At a meeting held on July 9, 2019, based on their evaluation of the information referred to above and other information provided in this and previous meetings, the Trustees determined that the overall arrangements between the Trust and the Adviser on behalf of the Funds were fair in light of the nature, quality and extent of the services provided by the Adviser and its affiliates, the fees charged for those services and other matters that the Trustees considered relevant in the exercise of their business judgment. At that meeting, the Trustees, including all of the Independent Trustees, approved the continuation of the management agreement with respect to all of the Funds through July 31, 2020, subject to possible earlier termination as provided in the agreement.
In connection with its consideration of the management agreement, the Board considered, among other things: (i) the nature, quality and extent of the Adviser’s services, (ii) the investment performance of each Fund as well as performance information for comparable funds and other, comparable clients of the Adviser, (iii) the fees and other expenses paid by each Fund as well as expense information for comparable funds and for other, comparable clients of the Adviser, (iv) the profitability of the Adviser and its affiliates from their relationship with each Fund, (v) whether economies of scale may be realized as each Fund grows and whether potential economies may be shared, in some measure, with Fund investors and (vi) other benefits to the Adviser from its relationship with the Funds. In the Board’s deliberations, no single factor was responsible for the Board’s decision to approve continuation of the management agreement, and each Trustee may have afforded different weight to the various factors.
Nature, Quality and Extent of Services. The Board’s consideration of the nature, quality and extent of the Adviser’s services to the Funds took into account the knowledge gained from the Board’s meetings with the Adviser throughout the years. In addition, the Board considered: the Adviser’s long-term history of managing the Funds; the consistency of investment approach; the background and experience of the Adviser’s investment personnel responsible for managing the Funds; and the Adviser’s performance as administrator of the Funds, including, among other things, in the areas of brokerage selection, trade execution, compliance and shareholder communications. The Board also reviewed the Adviser’s resources and key personnel involved in providing investment management services to the Funds. The Board noted the personal investments that the Adviser’s key investment personnel have made in the Funds, which further aligns the interests of the Adviser and its personnel with those of the Funds’ shareholders. In addition, the Board considered compliance reports about the Adviser from the Funds’ Chief Compliance Officer.
The Board also considered the information provided by the Adviser regarding the Funds’ performance and the steps the Adviser is taking to improve performance. In particular, the Board noted the additional personnel added to the investment teams, which includes portfolio managers, research analysts, research associates and risk management personnel. The Board also noted the Adviser’s significant investment into its infrastructure and investment processes.
Investment Performance of the Funds. The Board considered each Fund’s investment performance over various time periods, including how the Fund performed compared to the median performance of a group of comparable funds (the Fund’s “Category”) selected by an independent third-party service provider. In certain instances noted below, the Category represents a custom group of comparable funds, also selected by an independent third-party service provider. The performance periods considered by the Board ended on March 31, 2019, except where otherwise noted. Where available, the Board consideredone-, three-, five- andten-year performance. To the extent the Board considered data for periods other than those ending on March 31, 2019 or considered comparative data in addition to that of the Category, the data was still produced by the independent third-party service provider.
Further detail considered by the Board regarding the investment performance of each Fund is set forth below:
Calamos Growth Fund. The Board considered that the Fund underperformed its custom Category median for all periods. The Board noted, however, the recent changes to the Fund’s management team and portfolio positioning, including its appointment of a new lead portfolio manager in February 2017 and the adoption of a new primary benchmark index in October 2018. To this end, the
Trustee Approval of Management Agreement (Unaudited)
Board noted that the recent changes have yielded improving performance with the Fund ranked in the 41st percentile for theyear-to-date period ended June 30, 2019. The Board further noted that the Fund also has outperformed its benchmark by approximately 200 basis points for theyear-to-date period ended June 30, 2019. In light of the foregoing, the Board concluded that it would be prudent to allow the investment team time to further develop its performance record and noted that it would continue to closely monitor performance.
Calamos Opportunistic Value Fund. The Board considered that the Fund outperformed its custom Category median for theone- and three-year periods, though it underperformed for the other periods.
Calamos Dividend Growth Fund. The Board considered that the Fund outperformed its custom Category median for theone- and three-year periods, though it underperformed for the five-year period.
Calamos International Growth Fund. The Board considered that the Fund outperformed its Category median for theten-year period, though it underperformed for the other periods. The Board also noted, however, that the Fund ranked in the 21st percentile of its Category for theyear-to-date period ended June 30, 2019. The Board further noted that, as of June 30, 2019, the Fund ranked in the 8th percentile since inception.
Calamos Evolving World Growth Fund. The Board considered that, while the Fund underperformed its Category median for all periods, the Fund ranked in 21st percentile since inception and in the 26th percentile for theyear-to-date period ended June 30, 2019.
Calamos Emerging Market Equity Fund. The Board considered that, while the Fund underperformed its Category median for all periods, at the Board’s request, the Adviser has considered strategic alternatives for the Fund. In this regard, the Board noted the Adviser’s proposal to liquidate the Fund.
Calamos Global Equity Fund. The Board considered that the Fund outperformed its Category median for the three-, five- andten-year periods, though it underperformed for theone-year period. The Board also noted, however, that the Fund ranked in the 14th percentile of its Category for theyear-to-date period ended June 30, 2019.
Calamos Growth and Income Fund. The Board considered that the Fund outperformed its custom Category median for all periods.
Calamos Global Growth and Income Fund. The Board considered that the Fund outperformed its custom Category median for the three- and five-year periods, though it underperformed for the other periods.
Calamos Convertible Fund. The Board considered that the Fund outperformed its Category median for theone- and three-year periods, though it underperformed for the other periods.
Calamos Global Convertible Fund. The Board considered that, while the Fund underperformed its Category median for theone- and three-year periods, it outperformed its benchmark index for the three-year period and was within six basis points of its benchmark for theone-year period. The Board also noted the Adviser’s representation that the Fund is the only U.S.-based convertible fund with a global mandate in its Category. As a result, the Adviser has indicated that the benchmark is a better comparative source than the Category. As a result, the Board considered the Fund’s similarity to the UCITS fund managed by the Adviser noting that the UCITs fund, when compared to its peers, ranked in the 13th and 6th percentile for theone- and three-year periods ended April 30, 2019, respectively.
Calamos Total Return Bond Fund. The Board considered that the Fund outperformed its Category median for theone- and five-year periods, though it underperformed for the other periods.
Calamos High Income Opportunities Fund. The Board considered that the Fund outperformed its Category median for theone-year period, though it underperformed for the other periods. The Board noted that the Fund ranked in the 14thpercentile for theyear-to-date period ended June 30, 2019. The Board also considered that the Adviser had recently made significant changes to the Fund’s portfolio management team, including the hiring of a lead portfolio manager in November 2016 and four additional investment professionals in 2017. To this end, the Board noted that the changes to the investment team had yielded favorable performance evidenced by the outperformance in theone-year period ended March 31, 2019 andyear-to-date period ended June 30, 2019. The Board considered that it would be prudent to allow the Fund’s investment team time to further develop its long-term performance record.
Calamos Market Neutral Income Fund. The Board considered that the Fund outperformed its Category median for all periods.
Calamos Hedged Equity Income Fund. The Board considered that the Fund outperformed its Category median for all periods.
| | | | |
| 246 | | CALAMOS OPEN-END FAMILY OF FUNDS ANNUAL REPORT | | |
Trustee Approval of Management Agreement (Unaudited)
Calamos Phineus Long/Short Fund. The Board considered that the Fund outperformed its Category median for the three-, five- andten-year periods, though it underperformed for theone-year period.
Costs of Services Provided and Profits Realized by the Adviser. Using information provided by an independent third-party service provider, the Board evaluated each Fund’s actual management fee rate compared to the median management fee rate for other mutual funds similar in size, character and investment strategy (the Fund’s “Expense Group”), and the Fund’s total expense ratio compared to the median total expense ratio of the Fund’s Expense Group.
The Board also reviewed the Adviser’s management fee rates for its institutional separate accounts and noted the Adviser’s assertion that the Adviser no longer managessub-advisory accounts. The Board took into account that although, generally, the rates of fees paid by institutional clients were lower than the rates of fees paid by the Funds, the differences reflected the Adviser’s greater level of responsibilities and significantly broader scope of services regarding the Funds, the more extensive regulatory obligations and risks associated with managing the Funds, and other financial considerations with respect to creation and sponsorship of the Funds. The Board considered factors that lead to more expenses for registered funds including but not limited to: (i) capital expenditures to establish a fund, (ii) length of time to reach critical mass, and the related expenses, (iii) higher servicing costs of intermediaries and shareholders, (iv) higher redemption rates of assets under management, (v) entrepreneurial risk assumed by the Adviser and (vi) greater exposure to “make whole” errors.
The Board also considered the Adviser’s costs in serving as the Funds’ investment adviser and manager, including but not limited to costs associated with technology, infrastructure and compliance necessary to manage the Funds. The Board reviewed the Adviser’s methodology for allocating costs among the Adviser’s lines of business. The Board also considered information regarding the structure of the Adviser’s compensation program for portfolio managers, analysts and certain other employees, and the relationship of such compensation to the attraction and retention of quality personnel. Finally, the Board reviewed information on the profitability of the Adviser in serving as each Fund’s investment manager and of the Adviser and its affiliates in all of their relationships with each Fund, as well as an explanation of the methodology utilized in allocating various expenses among the Funds and the Adviser’s other business units. Data was provided to the Board with respect to profitability, both on apre- and post-marketing cost basis. The Board reviewed the financial statements of the Adviser’s parent company and discussed its corporate structure.
Further detail considered by the Board regarding the management fee rate and total expense ratio of each Fund is set forth below:
Calamos Growth Fund. The Board considered that, while the Fund’s management fee rate and total expense ratio are higher than the respective medians of the Fund’s Expense Group, the Adviser continues to invest resources in the Fund to address performance and that those investments appear to be yielding positive outcomes.
Calamos Opportunistic Value Fund. The Board considered that the Fund’s management fee rate and total expense ratio are higher than the respective medians of the Fund’s Expense Group. The Board noted, however, that the Fund’s total expense ratio is within one basis point of the Expense Group median.
Calamos Dividend Growth Fund. The Board considered that the Fund’s management fee rate is lower than the median of the Fund’s Expense Group, though the Fund’s total expense ratio is higher than its Expense Group median.
Calamos International Growth Fund. The Board considered that, while the Fund’s management fee rate and total expense ratio are higher than the respective medians of the Fund’s Expense Group, the Fund’s management fee is subject to a performance adjustment, which serves to lower the management fee during periods of underperformance.
Calamos Evolving World Growth Fund. The Board considered that, while the Fund’s management fee rate and total expense ratio are higher than the respective medians of the Fund’s Expense Group, the Adviser continues to invest resources in the Fund to address performance.
Calamos Emerging Market Equity Fund. The Board considered that the Fund’s management fee rate and total expense ratio are higher than the respective medians of the Fund’s Expense Group. The Board took into account, however, the Adviser’s proposal to liquidate the Fund.
Calamos Global Equity Fund. The Board considered that, while the Fund’s management fee rate and total expense ratio are higher than the respective medians of the Fund’s Expense Group, the Fund’s management fee is subject to a performance adjustment, which serves to lower the management fee during periods of underperformance. The Board also reviewed the Fund’s expenses in light of its long-term performance record.
Trustee Approval of Management Agreement (Unaudited)
Calamos Growth and Income Fund. The Board considered that the Fund’s management fee rate and total expense ratio are higher than the respective medians of the Fund’s Expense Group. The Board reviewed the Fund’s expenses in light of its performance record.
Calamos Global Growth and Income Fund. The Board considered that the Fund’s management fee rate and total expense ratio are higher than the respective medians of the Fund’s Expense Group. The Board reviewed the Fund’s expenses in light of its outperformance during the three- and five-year periods.
Calamos Convertible Fund. The Board considered that the Fund’s management fee rate and total expense ratio are higher than the respective medians of the Fund’s Expense Group. The Board reviewed the Fund’s expenses in light of its more recent performance record.
Calamos Global Convertible Fund. The Board considered that the Fund’s management fee rate and total expense ratio are higher than the respective medians of the Fund’s Expense Group. The Board also considered, however, that the Fund offers a unique mandate and the Adviser’s assertion that, as a result, there are no appropriate peer funds against which to meaningfully compare the Fund’s fees. The Board reviewed the Fund’s expenses in light of its performance record against its benchmark.
Calamos Total Return Bond Fund. The Board considered that the Fund’s management fee rate and total expense ratio are higher than the respective medians of the Fund’s Expense Group.
Calamos High Income Opportunities Fund. The Board considered that the Fund’s management fee rate is lower than the median of the Fund’s Expense Group and the Fund’s total expense ratio is equal to the Expense Group median.
Calamos Market Neutral Income Fund. The Board considered that the Fund’s management fee rate and total expense ratio are lower than the respective medians of the Fund’s Expense Group.
Calamos Hedged Equity Income Fund. The Board considered that the Fund’s total expense ratio is lower than its Expense Group median and the Fund’s management fee rate is within two basis points of its Expense Group median.
Calamos Phineus Long/Short Fund. The Board considered that the Fund’s management fee rate and total expense ratio are lower than the respective medians of the Fund’s Expense Group.
Economies of Scale. The Board considered whether each Fund’s management fee shares with shareholders potential economies of scale that may be achieved by the Adviser. The Board recognized that breakpoints in the fee schedule for each Fund could result in the sharing of economies of scale as Fund assets increase. The Board also considered the Adviser’s agreement to reimburse each Fund for a portion of its expenses if the Fund’s expense ratio otherwise would exceed a certain level. The Board also considered the benefits accruing to shareholders from the Adviser’s investments into its infrastructure and investment processes. The Board concluded that the breakpoints in the fee schedule for each Fund allow shareholders to benefit from potential economies of scale that may be achieved by the Adviser.
Other Benefits Derived from the Relationship with the Funds. The Board also considered other benefits that accrue to the Adviser and its affiliates from their relationship with the Funds. The Board concluded that while the Adviser may potentially benefit from its relationship with the Funds in ways other than the fees payable by the Funds, the Funds also may benefit from their relationship with the Adviser in ways other than the services to be provided by the Adviser and its affiliates pursuant to their agreement with the Funds and the fees payable by the Funds.
The Board also considered the Adviser’s use of a portion of the commissions paid by the Funds on their portfolio brokerage transactions to obtain research products and services benefiting the Funds and/or other clients of the Adviser and concluded, based on reports from the Funds’ Chief Compliance Officer, that the Adviser’s use of “soft” commission dollars to obtain research products and services was consistent with regulatory requirements.
After full consideration of the above factors as well as other factors that were instructive in their consideration, the Trustees, including all of the Independent Trustees, concluded that the continuation of the management agreement for each Fund with the Adviser was in the best interest of each respective Fund and its shareholders.
Calamos Timpani Small Cap Growth Fund. The Board of Trustees (“Board” or the “Trustees”) of Calamos Investment Trust (“Trust”), on behalf of its new series, Calamos Timpani Small Cap Growth Fund (the “New Fund”), oversees the management of the New Fund, and, as required by law, determines whether to approve or (annually thereafter) continue the New Fund’s management agreement with Calamos Advisors LLC (“Adviser”) pursuant to which the Adviser serves as the investment manager and provides
| | | | |
| 248 | | CALAMOS OPEN-END FAMILY OF FUNDS ANNUAL REPORT | | |
Trustee Approval of Management Agreement (Unaudited)
certain administrative services for the New Fund. The “Independent Trustees,” who comprise more than 80% of the Board, have never been affiliated with the Adviser.
In connection with their consideration regarding the initial approval of the management agreement for the New Fund, the Trustees received and reviewed a substantial amount of information provided by the Adviser in response to detailed requests of the Independent Trustees and their independent legal counsel. In the course of their consideration of the agreement, the Independent Trustees were advised by their counsel and, in addition to meeting with management of the Adviser, they met separately in executive session with their counsel.
At a meeting held on March 12, 2019, the Trustees determined, based on their evaluation of the information referred to above, and other information, that the overall arrangements between the New Fund and the Adviser were fair in light of the nature, quality and extent of the services to be provided by the Adviser and its affiliates, the proposed fees charged for those services, and other matters that the Trustees considered relevant in the exercise of their business judgment. At that meeting, the Trustees, including all of the Independent Trustees, approved the management agreement with respect to the New Fund through March 12, 2021, subject to possible earlier termination as provided in the management agreement.
In connection with its consideration of the management agreement with respect to the New Fund, the Board considered, among other things: (i) the nature, quality and extent of the Adviser’s services to be provided, (ii) the investment performance of the New Fund’s predecessor fund, Frontier Timpani Small Cap Growth Fund (the “Predecessor Fund”), as well as performance information for comparable funds, (iii) the fees and other expenses to be paid by the New Fund as well as expense information for comparable funds, (iv) the expected profitability of the Adviser and its affiliates from their relationship with the New Fund, (v) whether economies of scale may be realized as the New Fund grows and whether potential economies may be shared, in some measure, with the New Fund’s investors; and (vi) other benefits to the Adviser from its relationship with the New Fund. The Board also considered the Adviser’s planned acquisition of Timpani Capital Management LLC (“Timpani”) and the corresponding proposed reorganization of the Predecessor Fund into the New Fund. In the Board’s deliberations, no single factor was responsible for the Board’s decision to approve the management agreement, and each Trustee may have afforded different weight to the various factors.
Nature, Quality and Extent of Services. The Board’s consideration of the nature, quality and extent of the Adviser’s services to be provided to the New Fund took into account the knowledge that may be gained from the Board’s meetings with the Adviser throughout the year. In addition, the Board considered: the Adviser’s long-term history of managing the other Funds in the Calamos fund complex; the consistency of the Adviser’s investment approach; the Adviser’s planned acquisition of Timpani; and the background and experience of Timpani’s investment personnel that have been responsible for managing the Predecessor Fund and that will be responsible for managing the New Fund upon closing of the Reorganization; and the Adviser’s provision of administrative services for the other Funds in the Calamos fund complex, including, among other things, in the areas of brokerage selection, trade execution, compliance and shareholder communications. The Board also reviewed Timpani’s and the Adviser’s resources and key personnel expected to be involved in providing investment management services to the New Fund, including the expertise of the New Fund’s portfolio manager and his experience in managing the Predecessor Fund. The Board also considered compliance reports about the Adviser from the Trust’s Chief Compliance Officer. The Board concluded that the nature, quality and extent of the services to be provided by the Adviser to the New Fund were appropriate and consistent with the management agreement and that the New Fund was likely to benefit from services to be provided under the management agreement with the Adviser.
Investment Performance of the New Fund. Because the New Fund has not yet commenced operations, the Board did not consider the investment performance of the New Fund, though it did consider the portfolio manager’s historical performance record for the Predecessor Fund.
Costs of Services Provided and Profits Realized by the Adviser. Using information provided by an independent third-party service provider, the Board evaluated the New Fund’s proposed management fee rate compared to the median management fee rate for other mutual funds similar in size, character and investment strategy (the New Fund’s “Expense Group”) and estimated total expense ratio compared to the median total expense ratio of the Fund’s Expense Group. The Board considered that the New Fund’s estimated total net expense ratio is lower than the median of the New Fund’s Expense Group. The Board also considered that the proposed net management fee rate (taking into account the expense reimbursement the Adviser would implement for the New Fund) is lower than the median of the New Fund’s Expense Group, though the proposed gross contractual management fee rate is approximately one basis point higher than the median of the New Fund’s Expense Group. In light of all the information presented, the Board concluded that it would be in the best interest of the New Fund and its shareholders to approve the management agreement.
Trustee Approval of Management Agreement (Unaudited)
Economies of Scale. The Board considered whether the New Fund’s proposed management fee shares with shareholders potential economies of scale that may be achieved by the Adviser. The Board recognized that breakpoints in the proposed fee schedule for the New Fund could result in the sharing of economies of scale as the New Fund’s assets increase. The Board also considered the Adviser’s agreement to reimburse the New Fund for a portion of its expenses if the New Fund’s expense ratio otherwise would exceed a certain level. The Board concluded that the breakpoints in the proposed fee schedule for the New Fund allow shareholders to benefit from potential economies of scale that may be achieved by the Adviser.
Profitability. The Board considered information on the anticipated profitability of the Adviser in serving as the New Fund’s investment manager and of the Adviser and its affiliates in their relationships with the New Fund, as well as an explanation of the methodology utilized in allocating various expenses among the Funds in the Calamos fund complex and the Adviser’s other business units.
Other Benefits Derived from the Relationship with the New Fund. The Board considered other benefits that could accrue to the Adviser and its affiliates from their relationship with the New Fund. The Board concluded that while the Adviser may potentially benefit from its relationship with the New Fund in ways other than the proposed fees payable by the New Fund, the New Fund also may benefit from its relationship with the Adviser in ways other than the services to be provided by the Adviser and its affiliates pursuant to its agreement with the New Fund and the proposed fees payable by the New Fund.
The Board also considered the Adviser’s proposed use of a portion of the commissions to be paid by the New Fund on its portfolio brokerage transactions to obtain research products and services benefiting the New Fund and/or other clients of the Adviser and concluded, based on reports from the New Fund’s Chief Compliance Officer, that the Adviser’s use of “soft” commission dollars to obtain research products and services is consistent with regulatory requirements.
After full consideration of the above factors as well as other factors that were instructive in their consideration, the Trustees, including all of the Independent Trustees, concluded that the proposed amendment to the Trust’s management agreement with the Adviser to add the New Fund was in the best interest of the New Fund and its shareholders.
Calamos Timpani SMID Growth Fund. The Board of Trustees (“Board” or the “Trustees”) of Calamos Investment Trust (“Trust”), on behalf of its new series, Calamos Timpani SMID Growth Fund (the “New Fund”), oversees the management of the New Fund, and, as required by law, determines whether to approve or (annually thereafter) continue the New Fund’s management agreement with Calamos Advisors LLC (“Adviser”) pursuant to which the Adviser serves as the investment manager and provides certain administrative services for the New Fund. The “Independent Trustees,” who comprise more than 80% of the Board, have never been affiliated with the Adviser.
In connection with their consideration regarding the initial approval of the management agreement for the New Fund, the Trustees received and reviewed a substantial amount of information provided by the Adviser in response to detailed requests of the Independent Trustees and their independent legal counsel. In the course of their consideration of the agreement, the Independent Trustees were advised by their counsel and, in addition to meeting with management of the Adviser, they met separately in executive session with their counsel.
At a meeting held on July 9, 2019, the Trustees determined, based on their evaluation of the information referred to above, and other information, that the overall arrangements between the New Fund and the Adviser were fair in light of the nature, quality and extent of the services to be provided by the Adviser and its affiliates, the proposed fees charged for those services, and other matters that the Trustees considered relevant in the exercise of their business judgment. At that meeting, the Trustees, including all of the Independent Trustees, approved the management agreement with respect to the New Fund through July 9, 2021, subject to possible earlier termination as provided in the management agreement.
In connection with its consideration of the management agreement with respect to the New Fund, the Board considered, among other things: (i) the nature, quality and extent of the Adviser’s services to be provided, (ii) the fees and other expenses to be paid by the New Fund as well as expense information for comparable funds, (iii) the expected profitability of the Adviser and its affiliates from their relationship with the New Fund, (iv) whether economies of scale may be realized as the New Fund grows and whether potential economies may be shared, in some measure, with the New Fund’s investors; and (v) other benefits to the Adviser from its relationship with the New Fund. In the Board’s deliberations, no single factor was responsible for the Board’s decision to approve the management agreement, and each Trustee may have afforded different weight to the various factors.
| | | | |
| 250 | | CALAMOS OPEN-END FAMILY OF FUNDS ANNUAL REPORT | | |
Trustee Approval of Management Agreement (Unaudited)
Nature, Quality and Extent of Services. The Board’s consideration of the nature, quality and extent of the Adviser’s services to be provided to the New Fund took into account the knowledge that may be gained from the Board’s meetings with the Adviser throughout the year. In addition, the Board considered: the Adviser’s long-term history of managing the other Funds in the Calamos fund complex; the consistency of the Adviser’s investment approach; the Adviser’s recent acquisition of Timpani Capital Management LLC (“Timpani”); and the background and experience of Timpani’s investment personnel (who are now employees of the Adviser) that will be responsible for managing the New Fund; and the Adviser’s provision of administrative services for the other Funds in the Calamos fund complex, including, among other things, in the areas of brokerage selection, trade execution, compliance and shareholder communications. The Board also reviewed the Adviser’s resources and key personnel expected to be involved in providing investment management services to the New Fund. The Board also considered compliance reports about the Adviser from the Trust’s Chief Compliance Officer. The Board concluded that the nature, quality and extent of the services to be provided by the Adviser to the New Fund were appropriate and consistent with the management agreement and that the New Fund was likely to benefit from services to be provided under the management agreement with the Adviser.
Investment Performance of the New Fund. Because the New Fund has not yet commenced operations, the Board did not consider the investment performance of the New Fund.
Costs of Services Provided and Profits Realized by the Adviser. Using information provided by an independent third-party service provider, the Board evaluated the New Fund’s proposed management fee rate compared to the median management fee rate for other mutual funds similar in size, character and investment strategy (the “Expense Group”) and estimated total expense ratio compared to the median total expense ratio of the Expense Group. The Board considered that the Fund’s estimated total net expense ratio and proposed management fee rate are both higher than the respective medians of the Expense Group. The Board also took into account, however, the Adviser’s agreement to cap expenses of the Fund. The Board noted that under the contractual expense cap, the Fund’s Class I total annual expenses are capped at 1.10% through March 1, 2022. The Board also noted the Adviser’s assertion that due to the lack of research coverage in the small- andmid-capitalization space, the Fund’s investment mandate is less efficient and more complicated than a pure small-,mid- orlarge-cap fund, which, in turn, makes it more expensive to run. Lastly, the Board considered the Adviser’s confidence in the Fund’s investment team to deliver favorable performance and scale given its track record with other funds that it manages. In light of all the information presented, the Board concluded that it would be in the best interest of the Fund and its shareholders to approve the management agreement.
Economies of Scale. The Board considered whether the New Fund’s proposed management fee shares with shareholders potential economies of scale that may be achieved by the Adviser. The Board recognized that breakpoints in the proposed fee schedule for the New Fund could result in the sharing of economies of scale as the New Fund’s assets increase. The Board also considered the Adviser’s agreement to reimburse the New Fund for a portion of its expenses if the New Fund’s expense ratio otherwise would exceed a certain level. The Board concluded that the breakpoints in the proposed fee schedule for the New Fund allow shareholders to benefit from potential economies of scale that may be achieved by the Adviser.
Profitability. The Board considered information on the anticipated profitability of the Adviser in serving as the New Fund’s investment manager and of the Adviser and its affiliates in their relationships with the New Fund, as well as an explanation of the methodology utilized in allocating various expenses among the Funds in the Calamos fund complex and the Adviser’s other business units.
Other Benefits Derived from the Relationship with the New Fund. The Board considered other benefits that could accrue to the Adviser and its affiliates from their relationship with the New Fund. The Board concluded that while the Adviser may potentially benefit from its relationship with the New Fund in ways other than the proposed fees payable by the New Fund, the New Fund also may benefit from its relationship with the Adviser in ways other than the services to be provided by the Adviser and its affiliates pursuant to its agreement with the New Fund and the proposed fees payable by the New Fund.
The Board also considered the Adviser’s proposed use of a portion of the commissions to be paid by the New Fund on its portfolio brokerage transactions to obtain research products and services benefiting the New Fund and/or other clients of the Adviser and concluded, based on reports from the New Fund’s Chief Compliance Officer, that the Adviser’s use of “soft” commission dollars to obtain research products and services is consistent with regulatory requirements.
After full consideration of the above factors as well as other factors that were instructive in their consideration, the Trustees, including all of the Independent Trustees, concluded that the proposed amendment to the Trust’s management agreement with the Adviser to add the New Fund was in the best interest of the New Fund and its shareholders.
Trustees and Officers (Unaudited)
The management of the Trust, including general supervision of the duties performed for the Trust under the investment management agreement between the Trust and Calamos Advisors, is the responsibility of its board of trustees. Each trustee elected will hold office for the lifetime of the Trust or until such trustee’s earlier resignation, death or removal; however, each trustee who is not an interested person of the Trust shall retire as a trustee at the end of the calendar year in which the trustee attains the age of 75 years.
The following table sets forth each trustee’s name, year of birth, position(s) with the Trust, number of portfolios in the Calamos Fund Complex overseen, principal occupation(s) during the past five years and other directorships held, and date first elected or appointed. Each Trustee oversees each Fund of the Trust.
| | | | | | |
| NAME AND YEAR OF BIRTH | | POSITION(S) AND
LENGTH OF TIME
WITH THE TRUST | | PORTFOLIOS IN
FUND COMPLEX^
OVERSEEN | | PRINCIPAL OCCUPATION(S) DURING THE PAST 5 YEARS AND OTHER DIRECTORSHIPS |
| Trustees who are interested persons of the Trust: |
| | | |
| John P. Calamos, Sr., (1940)* | | Chairman, Trustee and President (since 1988) | | 25 | | Founder, Chairman and Global Chief Investment Officer, Calamos Asset Management, Inc. (“CAM”), Calamos Investments LLC (“CILLC”), Calamos Advisors LLC and its predecessor (“Calamos Advisors”) and Calamos Wealth Management LLC (“CWM”); Director, CAM; and previously Chief Executive Officer, Calamos Financial Services LLC and its predecessor (“CFS”), CAM, CILLC, Calamos Advisors, and CWM |
|
| Trustees who are not interested persons of the Trust: |
| | | |
| John E. Neal, (1950) | | Trustee (since 2001) Lead Independent Trustee (since July 2019) | | 25 | | Retired; Private investor; formerly, Director, Equity Residential Trust (publicly-owned REIT); Director, Creation Investments (private international microfinance company); Director, Centrust Bank (Northbrook Illinois community bank); Director,Neuro-ID (private company providing prescriptive analytics for the risk industry); Partner, Linden LLC (health care private equity) (until 2018) |
| | | |
| William R. Rybak, (1951) | | Trustee (since 2002) | | 25 | | Private investor; Chairman (since 2016) and Director (since 2010), Christian Brothers Investment Services Inc.; Trustee, JNL Series Trust, JNL Investors Series Trust and JNL Variable Fund LLC (since 2007) and Jackson Variable Series Trust (since January 2018); JNL Strategic Income Fund LLC(2007-2018)(open-end mutual funds)**; Trustee, Lewis University (since 2012); formerly Director, Private Bancorp (2003-2017); Executive Vice President and Chief Financial Officer, Van Kampen Investments, Inc. and subsidiaries (investment manager) |
| | | |
| Stephen B. Timbers, (1944) | | Trustee (since 2004); Lead Independent Trustee(2005-July 2019) | | 25 | | Private investor |
| | | |
| David D. Tripple, (1944) | | Trustee (since 2006) | | 25 | | Private investor; Trustee, Century Capital Management Trust (open-end mutual funds)(2004-2018)*** |
| | | |
| Virginia G. Breen, (1964) | | Trustee (since 2015) | | 25 | | Private Investor; Director, Paylocity Holding Corporation (since 2018); Trustee, Neuberger Berman Private Equity Registered Funds (registered private equity funds) (since 2015)****; Trustee, Jones Lang LaSalle Income Property Trust, Inc. (REIT) (since 2004); Director, UBS A&Q Fund Complex(closed-end funds) (since 2008)*****; Director, Bank of America/US Trust Company (until 2015); Director of Modus Link Global Solutions, Inc. (until 2013) |
| | | | |
| 252 | | CALAMOS OPEN-END FAMILY OF FUNDS ANNUAL REPORT | | |
Trustees and Officers (Unaudited)
| | | | | | |
| NAME AND YEAR OF BIRTH | | POSITION(S) AND
LENGTH OF TIME
WITH THE TRUST | | PORTFOLIOS IN
FUND COMPLEX^
OVERSEEN | | PRINCIPAL OCCUPATION(S) DURING THE PAST 5 YEARS AND OTHER DIRECTORSHIPS |
| Lloyd A. Wennlund, (1957) | | Trustee (since 2018) | | 25 | | Expert Affiliate, Bates Group, LLC (financial services consulting and expert testimony firm) (since 2018); Executive Vice President, The Northern Trust Company (1989-2017); President and Business Unit Head of Northern Funds and Northern Institutional Funds (1994-2017); Director, Northern Trust Investments (1998-2017); Governor (2004-2017) and Executive Committee member (2011-2017), Investment Company Institute Board of Governors; Member, Securities Industry Financial Markets Association (SIFMA) Advisory Council, Private Client Services Committee and Private Client Steering Group (2006-2017); Board Member, Chicago Advisory Board of the Salvation Army (since 2011) |
| * | Mr. Calamos, Sr. is an “interested person” of the Trust as defined in the 1940 Act because he is an officer of the Trust and an affiliate of Calamos Advisors and CFS. |
| ** | Overseeing 163 portfolios in fund complex. |
| *** | Overseeing two portfolios in fund complex. |
| **** | Overseeing five portfolios in fund complex. |
| ***** | Overseeing five portfolios in fund complex. |
| ^ | The Fund Complex consists of Calamos Investment Trust, Calamos Advisors Trust, Calamos Convertible Opportunities and Income Fund, Calamos Convertible and High Income Fund, Calamos Strategic Total Return Fund, Calamos Global Total Return Fund, Calamos Global Dynamic Income Fund and Calamos Dynamic Convertible and Income Fund. |
The address of each trustee is 2020 Calamos Court, Naperville, Illinois 60563.
Trustees and Officers (Unaudited)
Officers. The preceding table gives information about John P. Calamos, Sr., who is Chairman, Trustee and President of the Trust. The following table sets forth each other officer’s name, year of birth, position with the Trust and date first appointed to that position, and principal occupation(s) during the past five years. Each officer serves until his or her successor is chosen and qualified or until his or her resignation or removal by the board of trustees.
| | | | |
| NAME AND YEAR OF BIRTH | | POSITION(S) AND
LENGTH OF TIME
WITH THE TRUST | | PRINCIPAL OCCUPATION(S)
DURING THE PAST 5 YEARS |
| John S. Koudounis, (1966) | | Vice President (since 2016) | | Chief Executive Officer, CAM, CILLC, Calamos Advisors, CWM and CFS (since 2016); Director CAM (since 2016); President and Chief Executive Officer (2010-2016), Mizuho Securities USA Inc. |
| | |
| Thomas E. Herman, (1961) | | Vice President (since 2016) and Chief Financial Officer (2016-2017) and since August 2019) | | Chief Financial Officer, CAM, CILLC, Calamos Advisors, and CWM (since 2016); Chief Financial Officer and Treasurer, Harris Associates(2010-2016) |
| | |
Dave Vanisko, (1968) | | Treasurer (since August 2019) | | Head of Fund Administration (since August 2019), Calamos Advisors; prior thereto Assistant Controller (2003-August 2019) |
| | |
| Robert F. Behan, (1964) | | Vice President (since 2013) | | President (since 2015), Head of Global Distribution (since 2013), CAM, CILLC, Calamos Advisors, and CFS; prior thereto Executive Vice President (2013-2015); Senior Vice President (2009-2013), Head of U.S. Intermediary Distribution (2010-2013) |
| | |
| J. Christopher Jackson, (1951) | | Vice President and Secretary (since 2010) | | Senior Vice President, General Counsel and Secretary, CAM, CILLC, Calamos Advisors, CWM and CFS (since 2010); Director, Calamos Global Funds plc (since 2011) |
| | |
| Mark J. Mickey, (1951) | | Chief Compliance Officer (since 2005) | | Chief Compliance Officer, Calamos Funds (since 2005) |
The address of each officer is 2020 Calamos Court, Naperville, Illinois 60563.
| | | | |
| 254 | | CALAMOS OPEN-END FAMILY OF FUNDS ANNUAL REPORT | | |
Tax Information (Unaudited)
We are providing this information as required by the Internal Revenue Code (Code). The amounts shown may differ from those elsewhere in this report due to differences between tax and financial reporting requirements. In January 2020, shareholders will receive Form 1099-DIV which will include their share of qualified dividends and capital gains distributed during the calendar year 2019. Shareholders are advised to check with their tax advisors for information on the treatment of these amounts on their individual income tax returns.
Under Section 852(b)(3)(C) of the Code, the Funds hereby designate the following amounts as capital gain dividends for the fiscal period ended October 31, 2019:
| | | | | | |
MARKET NEUTRAL
INCOME FUND | | HEDGED EQUITY
INCOME FUND | | PHINEUS LONG/SHORT
FUND | | CONVERTIBLE
FUND |
| $123,320,794 | | $2,507,353 | | $8,774,837 | | $52,484,924 |
| | | |
GLOBAL
CONVERTIBLE FUND | | TIMPANI
SMALL CAP GROWTH FUND | | GROWTH
FUND | | GROWTH AND
INCOME FUND |
| $2,821,821 | | $90,869 | | $183,241,565 | | $111,810,729 |
| | | |
DIVIDEND GROWTH
FUND | | OPPORTUNISTIC VALUE
FUND | | INTERNATIONAL
GROWTH FUND | | GLOBAL EQUITY
FUND |
$1,542,903 | | $5,732,033 | | $23,806,913 | | $19,728,912 |
| | | |
GLOBAL GROWTH
AND INCOME FUND | | | | | | |
$16,447,349 | | | | | | |
Under Section 854(b)(2) of the Code, the Funds hereby designate the following amounts, or the maximum amount allowable under the Code, as qualified dividends for the fiscal period ended October 31, 2019:
| | | | | | |
MARKET NEUTRAL
INCOME FUND | | HEDGED EQUITY
INCOME FUND | | PHINEUS LONG/SHORT
FUND | | CONVERTIBLE
FUND |
| $85,813,264 | | $3,141,749 | | $16,359,295 | | $4,617,132 |
| | | |
GLOBAL
CONVERTIBLE FUND | | TIMPANI
SMALL CAP GROWTH FUND | | TIMPANI
SMID GROWTH FUND | | GROWTH
FUND |
| $729,365 | | $19,784 | | $2,769 | | $15,991,348 |
| | | |
GROWTH AND
INCOME FUND | | DIVIDEND GROWTH
FUND | | OPPORTUNISTIC VALUE
FUND | | INTERNATIONAL
GROWTH FUND |
$30,947,637 | | $355,966 | | $860,329 | | $2,998,251 |
| | | |
EVOLVING WORLD
GROWTH FUND | | GLOBAL EQUITY
FUND | | GLOBAL GROWTH
AND INCOME FUND | | HIGH INCOME
OPPORTUNITIES FUND |
$2,707,079 | | $946,958 | | $1,873,515 | | $91,582 |
| | | |
SHORT-TERM BOND FUND | | | | | | |
$652 | | | | | | |
Tax Information (Unaudited)
Under Section 854(b)(2) of the Code, the Funds hereby designate the following percentage amounts of the ordinary income dividends as income qualifying for the dividends received deduction for the period ended October 31, 2019:
| | | | | | |
MARKET NEUTRAL
INCOME FUND | | HEDGED EQUITY
INCOME FUND | | PHINEUS LONG/SHORT
FUND | | CONVERTIBLE
FUND |
30% | | 100% | | 45% | | 24% |
| | | |
GLOBAL
CONVERTIBLE FUND | | TIMPANI
SMID GROWTH FUND | | GROWTH
FUND | | GROWTH AND
INCOME FUND |
16% | | 0% | | 17% | | 81% |
| | | |
DIVIDEND GROWTH
FUND | | OPPORTUNISTIC VALUE
FUND | | INTERNATIONAL
GROWTH FUND | | EVOLVING WORLD
GROWTH FUND |
100% | | 37% | | 0% | | 21% |
| | | |
GLOBAL EQUITY
FUND | | GLOBAL GROWTH
AND INCOME FUND | | HIGH INCOME
OPPORTUNITIES FUND | | SHORT-TERM BOND FUND |
41% | | 30% | | 3% | | 0% |
At October 31, 2019, more than 50% of each ofInternational Growth Fund andEvolving World Growth Fundtotal assets were invested in securities of foreign issuers. In most instances, foreign taxes were withheld from income paid to each fund on these investments.International Growth Fundand Evolving World Growth Fund elect to treat foreign taxes paid as allowed under Section 853 of the Code. This election will allow shareholders of record as of the 2019 distribution date to treat the proportionate share of foreign taxes paid byInternational Growth Fund andEvolving World Growth Fund as having been paid directly by them. The shareholder shall consider these amounts as foreign taxes paid in the tax year in which they receive the distribution.
| | | | |
| 256 | | CALAMOS OPEN-END FAMILY OF FUNDS ANNUAL REPORT | | |
MANAGING YOUR CALAMOS FUNDS INVESTMENTS
Calamos Investments offers several convenient means to monitor, manage and feel confident about your Calamos investment choice.
24-HOUR AUTOMATED SHAREHOLDER ASSISTANCE: 800.823.7386
Through a single toll-free number, Calamos24-Hour Shareholder Assistance is fast and easy. Get fund prices and account balances, review recent transactions, order statements, literature and more.
PERSONAL ASSISTANCE: 800.582.6959
Dial this toll-free number to speak with a knowledgeable Client Services Representative who can help answer questions or address issues concerning your Calamos Fund.
ONLINE ACCOUNT MANAGEMENT: www.calamos.com
Manage your personal account of Calamos Funds online at www.calamos.com. On your account access page, you can view account history and download data.
YOUR FINANCIAL ADVISOR
We encourage you to talk to your financial advisor to determine how the Calamos Funds can benefit your investment portfolio based on your financial goals, risk tolerance, time horizon and income needs.
This report, including the audited financial statements contained herein, is submitted for general information for the shareholders of the Funds. The report is not authorized for distribution to prospective investors in the Funds unless accompanied by a currently effective prospectus of the Funds. The views expressed in this report reflect those of Calamos Advisors LLC only through October 31, 2019.
A description of the Calamos Proxy Voting Policies and Procedures and the Funds’ proxy voting record for the 12-month period ended June 30 are available free of charge upon request by calling 800.582.6959, by visiting the Calamos Web site at www.calamos.com, or by writing Calamos at: Calamos Investments, Attn: Client Services, 2020 Calamos Court, Naperville, IL 60563. The Funds’ proxy voting record is also available free of charge by visiting the SEC Web site at www.sec.gov.
The Funds file a complete list of their portfolio holdings with the SEC for the first and third quarters each fiscal year as an exhibit to its reports on Form N-PORT. TheForms N-PORT are available free of charge, upon request, by calling or writing Calamos Investments at the phone number or address provided above or by visiting the SEC Web site at www.sec.gov. You may also review or, for a fee, copy the forms at the SEC’s Public Reference Room in Washington, D.C. Information on the operation of the Public Reference Room may be obtained by calling 800.732.0330.
FOR 24-HOUR AUTOMATED SHAREHOLDER ASSISTANCE: 800.823.7386
TO OBTAIN INFORMATION ABOUT YOUR INVESTMENTS: 800.582.6959
VISIT OUR WEB SITE:www.calamos.com
INVESTMENT ADVISER:
Calamos Advisors LLC
2020 Calamos Court
Naperville, IL 60563-2787
CUSTODIAN AND FUND ACCOUNTING AGENT:
State Street Bank and Trust Company
Boston, MA
TRANSFER AGENT:
U.S. Bank Global Fund Services
615 E. Michigan St., 3rd Floor
Milwaukee, WI 53202
INDEPENDENT REGISTERED PUBLIC ACCOUNTING FIRM:
Deloitte & Touche LLP
Chicago, IL
LEGAL COUNSEL:
Ropes & Gray LLP
Chicago, IL
| | |

| | STAY CONNECTED www.calamos.com/connect |
|
Visit our Web site for timely fund performance, detailed fund profiles, fund news and insightful market commentary. |

2020 Calamos Court
Naperville, IL 60563-2787
800.582.6959
www.calamos.com
© 2019 Calamos Investments LLC. All Rights Reserved.
Calamos® and Calamos Investments® are registered
trademarks of Calamos Investments LLC.
MFANR 1631 2019
ITEM 2. CODE OF ETHICS.
(a) As of the end of the period covered by this report, the registrant has adopted a code of ethics (the “Code of Ethics”) that applies to its principal executive officer, principal financial officer, principal accounting officer or controller, or person performing similar functions.
(b) No response required.
(c) The registrant has not amended its Code of Ethics as it relates to any element of the code of ethics definition enumerated in paragraph (b) of this Item 2 during the period covered by this report.
(d) The registrant has not granted a waiver or an implicit waiver from its Code of Ethics during the period covered by this report.
(e) Not applicable.
(f) (1) The registrant’s Code of Ethics is attached as an Exhibit hereto.
ITEM 3. AUDIT COMMITTEE FINANCIAL EXPERT.
The registrant’s Board of Trustees has determined that, for the period covered by the shareholder report presented in Item 1 hereto, it has five audit committee financial experts serving on its audit committee, each of whom is an independent Trustee for purpose of thisN-CSR item: John E. Neal, William R. Rybak, Virginia G. Breen, Stephen B. Timbers and David D. Tripple. Under applicable securities laws, a person who is determined to be an audit committee financial expert will not be deemed an “expert” for any purpose, including without limitation for the purposes of Section 11 of the Securities Act of 1933, as a result of being designated or identified as an audit committee financial expert pursuant to this Item. The designation or identification of a person as an audit committee financial expert does not impose on such person any duties, obligations, or liabilities that are greater than the duties, obligations and liabilities imposed on such person as a member of audit committee and board of directors in the absence of such designation or identification. The designation or identification of a person as an audit committee financial expert pursuant to this Item does not affect the duties, obligations, or liabilities of any other member of the audit committee or board of trustees.
ITEM 4. PRINCIPAL ACCOUNTANT FEES AND SERVICES.
| | | | | | | | |
Fiscal Years Ended | | 10/31/2018 | | | 10/31/2019 | |
Audit Fees(a) | | $ | 384,000 | | | $ | 441,000 | |
Audit-Related Fees(b) | | $ | 127,800 | | | $ | 160,500 | |
Tax Fees(c) | | $ | — | | | $ | 615,586 | |
All Other Fees(d) | | $ | — | | | $ | — | |
| | | | | | | | |
Total | | $ | 511,800 | | | $ | 1,217,086 | |
| | | | | | | | |
(a) Audit fees are the aggregate fees billed in each of the last two fiscal years for professional services rendered by the principal accountant to the registrant for the audit of the registrant’s annual financial statements or services that are normally provided by the accountant in connection with statutory and regulatory filings or engagements for those fiscal years.
(b) Audit-related fees are the aggregate fees billed in each of the last two fiscal years for assurance and related services rendered by the principal accountant to the registrant that are reasonably related to the performance of the audit of the registrant’s financial statements and are not reported under paragraph (a) of this Item 4.
(c) Tax fees are the aggregate fees billed in each of the last two fiscal years for professional services rendered by the principal accountant to the registrant for tax compliance, tax advice and tax planning.
(d) All other fees are the aggregate fees billed in each of the last two fiscal years for products and services provided by the principal accountant to the registrant, other than the services reported in paragraph (a)-(c) of this Item 4.
(e) (1) Registrant’s audit committee meets with the principal accountants and management to review andpre-approve all audit services to be provided by the principal accountants.
The audit committee shallpre-approve allnon-audit services to be provided by the principal accountants to the registrant, including the fees and other compensation to be paid to the principal accountants; provided that thepre-approval ofnon-audit services is waived if (i) the services were not recognized by management at the time of the engagement asnon-audit services,(ii) the aggregate fees for allnon-audit services provided to the registrant are less than 5% of the total fees paid by the registrant to its principal accountants during the fiscal year in which thenon-audit services are provided, and (iii) such services are promptly brought to the attention of the audit committee by management and the audit committee approves them prior to the completion of the audit.
The audit committee shallpre-approve allnon-audit services to be provided by the principal accountants to the investment adviser or any entity controlling, controlled by or under common control with the adviser that provides ongoing services to the registrant if the engagement relates directly to the operations or financial reporting of the registrant, including the fees and other compensation to be paid to the principal accountants; provided thatpre-approval ofnon-audit services to the adviser or an affiliate of the adviser is not required if (i) the services were not recognized by management at the time of the engagement asnon-audit services, (ii) the aggregate fees for allnon-audit services provided to the adviser and all entities controlling, controlled by or under common control with the adviser are less than 5% of the total fees fornon-audit services requiringpre-approval under paragraph (e)(1)of this Item 4 paid by the registrant, the adviser or its affiliates to the registrant’s principal accountants during the fiscal year in which thenon-audit services are provided, and (iii) such services are promptly brought to the attention of the audit committee by management and the audit committee approves them prior to the completion of the audit.
(e)(2) No percentage of the principal accountant’s fees or services described in each of paragraphs (b)—(d) of this Item were approved pursuant to the waiver provision paragraph (c)(7)(i)(C) of Rule2-01 of RegulationS-X.
(f) No disclosures are required by this Item 4(f).
(g) The following table presents the aggregate non-audit fees billed in each of the last two fiscal years for services rendered by the principal accountant to the registrant and the aggregate non-audit fees billed in each of the last two fiscal years for services rendered by the principal accountant to the investment adviser or any entity controlling, controlled by or under common control of the adviser.
| | | | | | | | |
Fiscal Years Ended | | 10/31/2018 | | | 10/31/2019 | |
Registrant | | $ | — | | | $ | 615,586 | |
Investment Adviser | | $ | — | | | $ | — | |
| (h) | No disclosures are required by this Item 4(h). |
ITEM 5. AUDIT COMMITTEE OF LISTED REGISTRANTS.
Not applicable.
ITEM 6. SCHEDULE OF INVESTMENTS
(a) Included in the Report to Shareholders in Item 1.
(b) Not applicable.
ITEM 7. DISCLOSURE OF PROXY VOTING POLICIES AND PROCEDURES FORCLOSED-END MANAGEMENT INVESTMENT COMPANIES.
Not applicable.
ITEM 8. PORTFOLIO MANAGERS OFCLOSED-END MANAGEMENT INVESTMENT COMPANIES.
Not applicable.
ITEM 9. PURCHASES OF EQUITY SECURITIES BYCLOSED-END MANAGEMENT INVESTMENT COMPANY AND AFFILIATED PURCHASERS.
Not applicable.
ITEM 10. SUBMISSION OF MATTERS TO A VOTE OF SECURITY HOLDERS.
No material changes.
ITEM 11. CONTROLS AND PROCEDURES.
a) The registrant’s principal executive officer and principal financial officer have evaluated the registrant’s disclosure controls and procedures within 90 days of this filing and have concluded that the registrant’s disclosure controls and procedures were effective, as of that date, in ensuring that information required to be disclosed by the registrant in this FormN-CSR was recorded, processed, summarized, and timely reported.
b) There were no changes in the registrant’s internal controls over financial reporting (as defined in Rule30a-3(d) under the Investment Company Act of 1940) that occurred during the period covered by this report that has materially affected, or is reasonably likely to materially affect, the registrant’s internal control over financial reporting.
ITEM 12. DISCLOSURE OF SECURITIES LENDING ACTIVITIES FOR CLOSED-END MANAGEMENT INVESTMENT COMPANIES.
Not applicable.
ITEM 13. EXHIBITS.
(a)(1) Code of Ethics
(a)(2)(i) Certification of Principal Executive Officer.
(a)(2)(ii) Certification of Principal Financial Officer.
(a)(3) Not applicable.
(a)(4) Change in the registrant’s independent registered public accounting firm is attached hereto.
SIGNATURES
Pursuant to the requirements of the Securities Exchange Act of 1934 and the Investment Company Act of 1940, the registrant has duly caused this report to be signed on its behalf by the undersigned, thereunto duly authorized.
Calamos Investment Trust
| | |
| |
| By: | | /s/ John P. Calamos, Sr. |
| Name: | | John P. Calamos, Sr. |
| Title: | | Principal Executive Officer |
| Date: | | December 27, 2019 |
| | |
| |
| By: | | /s/ Thomas E. Herman |
| Name: | | Thomas E. Herman |
| Title: | | Principal Financial Officer |
| Date: | | December 27, 2019 |
Pursuant to the requirements of the Securities Exchange Act of 1934 and the Investment Company Act of 1940, this report has been signed by the following persons on behalf of the registrant and in the capacities and on the dates indicated.
| | |
| |
| By: | | /s/ John P. Calamos, Sr. |
| Name: | | John P. Calamos, Sr. |
| Title: | | Principal Executive Officer |
| Date: | | December 27, 2019 |
| | |
| |
| By: | | /s/ Thomas E. Herman |
| Name: | | Thomas E. Herman |
| Title: | | Principal Financial Officer |
| Date: | | December 27, 2019 |