UNITED STATES
SECURITIES AND EXCHANGE COMMISSION
Washington, D.C. 20549
FORM N-CSR
CERTIFIED SHAREHOLDER REPORT OF
REGISTERED MANAGEMENT INVESTMENT COMPANIES
Investment Company Act file number 811-05440
MFS INTERMEDIATE INCOME TRUST
(Exact name of registrant as specified in charter)
111 Huntington Avenue, Boston, Massachusetts 02199
(Address of principal executive offices) (Zip code)
Christopher R. Bohane
Massachusetts Financial Services Company
111 Huntington Avenue
Boston, Massachusetts 02199
(Name and address of agents for service)
Registrant’s telephone number, including area code: (617) 954-5000
Date of fiscal year end: October 31
Date of reporting period: April 30, 2017
| ITEM 1. | REPORTS TO STOCKHOLDERS. |
SEMIANNUAL REPORT
April 30, 2017

MFS® INTERMEDIATE INCOME TRUST

MIN-SEM
MANAGED DISTRIBUTION POLICY DISCLOSURE
The MFS Intermediate Income Trust’s (the fund) Board of Trustees adopted a managed distribution policy. The fund seeks to pay monthly distributions based on an annual rate of 8.5% of the fund’s average monthly net asset value. The primary purpose of the managed distribution policy is to provide shareholders with a constant, but not guaranteed, fixed minimum rate of distribution each month. You should not draw any conclusions about the fund’s investment performance from the amount of the current distribution or from the terms of the fund’s managed distribution policy. The Board may amend or terminate the managed distribution policy at any time without prior notice to fund shareholders. The amendment or termination of the managed distribution policy could have an adverse effect on the market price of the fund’s shares.
With each distribution, the fund will issue a notice to shareholders and an accompanying press release which will provide detailed information regarding the amount and composition of the distribution and other related information. The amounts and sources of distributions reported in the notice to shareholders are only estimates and are not being provided for tax reporting purposes. The actual amounts and sources of the amounts for tax reporting purposes will depend upon the fund’s investment experience during the remainder of its fiscal year and may be subject to changes based on tax regulations. The fund will send you a Form 1099-DIV for the calendar year that will tell you how to report these distributions for federal income tax purposes. Please refer to “Tax Matters and Distributions” under Note 2 of the Notes to Financial Statements for information regarding the tax character of the fund’s distributions.
Under a managed distribution policy the fund may at times distribute more than its net investment income and net realized capital gains; therefore, a portion of your distribution may result in a return of capital. A return of capital may occur, for example, when some or all of the money that you invested in the fund is paid back to you. Any such returns of capital will decrease the fund’s total assets and, therefore, could have the effect of increasing the fund’s expense ratio. In addition, in order to make the level of distributions called for under its managed distribution policy, the fund may have to sell portfolio securities at a less than opportune time. A return of capital does not necessarily reflect the fund’s investment performance and should not be confused with ‘yield’ or ‘income’. The fund’s total return in relation to changes in net asset value is presented in the Financial Highlights.
MFS® INTERMEDIATE INCOME TRUST
New York Stock Exchange Symbol: MIN
NOT FDIC INSURED • MAY LOSE VALUE • NO BANK GUARANTEE

LETTER FROM THE EXECUTIVE CHAIRMAN
Dear Shareholders:
Despite the United Kingdom’s decision to leave the European Union and policy uncertainty accompanying a new presidential administration in the United States, most
markets have proved resilient. U.S. share prices have reached new highs, and U.S. bond yields rose on hopes surrounding President Trump’s proposed fiscal policies and indications that the U.S. Federal Reserve will continue to gradually hike interest rates. However, interest rates in most developed markets remain very low, with central banks maintaining accommodative monetary policies in hopes of reinvigorating slow-growing economies and lifting inflation.
Globally, economic growth has shown signs of recovery, led by China, the U.S. and the eurozone. Despite better growth, there are few immediate signs of worrisome inflation. Emerging market
economies are recovering at a somewhat slower pace amid fears that restrictive U.S. trade policies could further hamper the restrained pace of global trade growth. Looking ahead, markets will have to contend with a series of European elections during 2017, as well as geopolitical hot spots on the Korean peninsula and in the Middle East.
At MFS®, we believe time is an asset. A patient, long-term approach to investing can have a powerful impact on decision making and outcomes. Time arbitrage, as we call it, simply comes down to having the conviction and discipline to allow enough time for good investment ideas to play out. In our view, such an approach, along with the professional guidance of a financial advisor, will help you reach your investment objectives.
Respectfully,

Robert J. Manning
Executive Chairman
MFS Investment Management
June 16, 2017
The opinions expressed in this letter are subject to change and may not be relied upon for investment advice. No forecasts can be guaranteed.
1
PORTFOLIO COMPOSITION
Portfolio structure at value
| | | | |
| Fixed income sectors (i) | | | | |
| Investment Grade Corporates | | | 45.8% | |
| U.S. Treasury Securities | | | 32.5% | |
| Non-U.S. Government Bonds | | | 14.5% | |
| Asset-Backed Securities | | | 5.0% | |
| Emerging Markets Bonds | | | 3.7% | |
| Mortgage-Backed Securities | | | 1.5% | |
| High Yield Corporates | | | 1.5% | |
| U.S. Government Agencies | | | 0.8% | |
| Collateralized Debt Obligations | | | 0.8% | |
| Residential Mortgage-Backed Securities | | | 0.7% | |
| Commercial Mortgage-Backed Securities | | | 0.3% | |
Portfolio structure reflecting equivalent exposure of derivative positions (i)
| | | | |
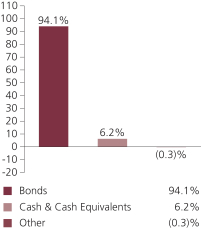
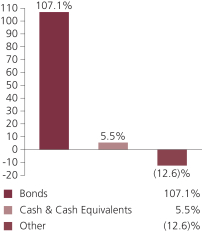
| Composition including fixed income credit quality (a)(i) | |
| AAA | | | 10.1% | |
| AA | | | 8.0% | |
| A | | | 16.0% | |
| BBB | | | 36.4% | |
| BB | | | 1.5% | |
| CC (o) | | | 0.0% | |
| U.S. Government | | | 20.2% | |
| Federal Agencies | | | 2.3% | |
| Not Rated | | | 12.6% | |
| Cash & Cash Equivalents | | | 5.5% | |
| Other | | | (12.6)% | |
| |
| Portfolio facts (i) | | | | |
| Average Duration (d) | | | 4.0 | |
| Average Effective Maturity (m) | | | 4.3 yrs. | |
2
Portfolio Composition – continued
| | | | |
| Issuer country weightings (i)(x) | |
| United States | | | 68.1% | |
| United Kingdom | | | 5.9% | |
| Italy | | | 4.1% | |
Switzerland | | | 3.0% | |
| Canada | | | 2.5% | |
| Belgium | | | 1.8% | |
| Germany | | | 1.8% | |
| Spain | | | 1.7% | |
| Australia | | | 1.6% | |
| Other Countries | | | 9.5% | |
| (a) | For all securities other than those specifically described below, ratings are assigned to underlying securities utilizing ratings from Moody’s, Fitch, and Standard & Poor’s rating agencies and applying the following hierarchy: If all three agencies provide a rating, the middle rating (after dropping the highest and lowest ratings) is assigned; if two of the three agencies rate a security, the lower of the two is assigned. Ratings are shown in the S&P and Fitch scale (e.g., AAA). Securities rated BBB or higher are considered investment grade. All ratings are subject to change. U.S. Government includes securities issued by the U.S. Department of the Treasury. Federal Agencies includes rated and unrated U.S. Agency fixed-income securities, U.S. Agency mortgage-backed securities, and collateralized mortgage obligations of U.S. Agency mortgage-backed securities. Not Rated includes fixed income securities, including fixed income futures contracts, which have not been rated by any rating agency. The fund may or may not have held all of these instruments on this date. The fund is not rated by these agencies. |
| (d) | Duration is a measure of how much a bond’s price is likely to fluctuate with general changes in interest rates, e.g., if rates rise 1.00%, a bond with a 5-year duration is likely to lose about 5.00% of its value due to the interest rate move. |
| (i) | For purposes of this presentation, the components include the value of securities, and reflect the impact of the equivalent exposure of derivative positions, if any. These amounts may be negative from time to time. Equivalent exposure is a calculated amount that translates the derivative position into a reasonable approximation of the amount of the underlying asset that the portfolio would have to hold at a given point in time to have the same price sensitivity that results from the portfolio’s ownership of the derivative contract. When dealing with derivatives, equivalent exposure is a more representative measure of the potential impact of a position on portfolio performance than value. The bond component will include any accrued interest amounts. |
| (m) | In determining an instrument’s effective maturity for purposes of calculating the fund’s dollar-weighted average effective maturity, MFS uses the instrument’s stated maturity or, if applicable, an earlier date on which MFS believes it is probable that a maturity-shortening device (such as a put, pre-refunding or prepayment) will cause the instrument to be repaid. Such an earlier date can be substantially shorter than the instrument’s stated maturity. |
| (x) | Represents the portfolio’s exposure to issuer countries as a percentage of a portfolio’s net assets. For purposes of this presentation, United States includes Cash & Cash Equivalents and Other. |
3
Portfolio Composition – continued
Where the fund holds convertible bonds, these are treated as part of the equity portion of the portfolio.
Cash & Cash Equivalents includes any cash, investments in money market funds, short-term securities, and other assets less liabilities. Please see the Statement of Assets and Liabilities for additional information related to the fund’s cash position and other assets and liabilities.
Other includes equivalent exposure from currency derivatives and/or any offsets to derivative positions and may be negative.
Percentages are based on net assets as of 4/30/17.
The portfolio is actively managed and current holdings may be different.
4
PORTFOLIO MANAGERS’ PROFILES
| | | | | | |
| Portfolio Manager | | Primary Role | | Since | | Title and Five Year History |
| Geoffrey Schechter | | Lead Portfolio
Manager | | 2017 | | Investment Officer of MFS; employed in the investment management area of MFS since 1993. |
| | | |
| Alexander Mackey | | Investment Grade
Debt Instruments
Portfolio Manager | | 2017 | | Investment Officer of MFS: employed in the investment management area of MFS since 2001. |
| | | |
| Erik Weisman | | Sovereign Debt
Instruments
Portfolio Manager | | 2004 | | Investment Officer of MFS; employed in the investment management area of MFS since 2002. |
Note to Shareholders: Effective February 1, 2017, James Calmas is no longer a Portfolio Manager of the Fund. Effective February 1, 2017, Alexander Mackey and Geoffrey Schechter became Portfolio Managers of the Fund.
OTHER NOTES
The fund’s shares may trade at a discount or premium to net asset value. When fund shares trade at a premium, buyers pay more than the net asset value underlying fund shares, and shares purchased at a premium would receive less than the amount paid for them in the event of the fund’s concurrent liquidation.
The fund’s monthly distributions may include a return of capital to shareholders to the extent that the fund’s net investment income and net capital gains, determined in accordance with federal income tax regulations, are insufficient to meet the fund’s target annual distribution rate. Distributions that are treated for federal income tax purposes as a return of capital will reduce each shareholder’s basis in his or her shares and, to the extent the return of capital exceeds such basis, will be treated as gain to the shareholder from a sale of shares. It may also result in a recharacterization of what economically represents a return of capital to ordinary income in those situations where a fund has long term capital gains and a capital loss carryforward. Returns of shareholder capital may have the effect of reducing the fund’s assets and increasing the fund’s expense ratio.
The fund’s target annual distribution rate is calculated based on an annual rate of 8.5% of the fund’s average monthly net asset value, not a fixed share price, and the fund’s dividend amount will fluctuate with changes in the fund’s average monthly net assets.
In accordance with Section 23(c) of the Investment Company Act of 1940, the fund hereby gives notice that it may from time to time repurchase shares of the fund in the open market at the option of the Board of Trustees and on such terms as the Trustees shall determine.
5
PORTFOLIO OF INVESTMENTS
4/30/17 (unaudited)
The Portfolio of Investments is a complete list of all securities owned by your fund. It is categorized by broad-based asset classes.
| | | | | | | | |
| Bonds - 94.1% | | | | | | | | |
| Issuer | | Shares/Par | | | Value ($) | |
| Asset-Backed & Securitized - 6.7% | | | | | | | | |
| AmeriCredit Automobile Receivables Trust, 2015-3, “A2A”, 1.07%, 1/08/2019 | | $ | 62,913 | | | $ | 62,915 | |
| ARI Fleet Lease Trust, 2016-A, “A2”, 1.82%, 7/15/2024 (n) | | | 313,274 | | | | 313,015 | |
| Babson CLO Ltd., 2013-IIA, “BR”, FRN, 3.408%, 1/18/2025 (n) | | | 2,166,331 | | | | 2,171,465 | |
| Capital One Multi-Asset Execution Trust, 2016-A4, “A4”, 1.33%, 6/15/2022 | | | 2,880,000 | | | | 2,854,788 | |
| Chesapeake Funding II LLC, 2016-1A, “A2”, FRN, 2.062%, 3/15/2028 (n) | | | 1,386,547 | | | | 1,393,188 | |
| Colony Starwood Homes, 2016-2A, “A”, FRN, 2.243%, 12/17/2033 (n) | | | 1,895,654 | | | | 1,908,371 | |
| Credit Acceptance Auto Loan Trust, 2015-2A, “A”, 2.4%, 2/15/2023 (n) | | | 2,126,000 | | | | 2,136,743 | |
| Credit Suisse Commercial Mortgage Trust, “A4”, FRN, 6.138%, 9/15/2039 | | | 530,858 | | | | 532,340 | |
| Credit Suisse Mortgage Capital Certificate, 5.695%, 9/15/2040 | | | 817,501 | | | | 819,879 | |
| CWCapital Cobalt Ltd., “A4”, FRN, 5.99%, 5/15/2046 | | | 70,217 | | | | 70,163 | |
| Drive Auto Receivables Trust, 2016-CA, “A3”, 1.67%, 11/15/2019 (n) | | | 2,030,000 | | | | 2,030,780 | |
| Drive Auto Receivables Trust, 2017-AA, “A3”, 1.77%, 1/15/2020 (n) | | | 1,040,000 | | | | 1,041,128 | |
| Dryden Senior Loan Fund, 2014-34A, “CR”, FRN, 3.171%, 10/15/2026 (n) | | | 824,972 | | | | 824,368 | |
| Enterprise Fleet Financing LLC, 2017-1, “A2”, 2.13%, 7/20/2022 (n) | | | 850,000 | | | | 849,571 | |
| Exeter Automobile Receivables Trust, 2015-2A, “A”, 1.54%, 11/15/2019 (n) | | | 346,530 | | | | 346,351 | |
| Exeter Automobile Receivables Trust, 2017-1A, “A”, 1.96%, 3/15/2021 (n) | | | 795,226 | | | | 794,090 | |
| Falcon Franchise Loan LLC, FRN, 7.583%, 1/05/2023 (i)(z) | | | 204,143 | | | | 8,281 | |
| Flagship Credit Auto Trust, 2016-1, “A”, 2.77%, 12/15/2020 (n) | | | 270,086 | | | | 272,055 | |
| Ford Credit Auto Owner Trust, 2014-1, “A”, 2.26%, 11/15/2025 (n) | | | 339,000 | | | | 342,254 | |
| Ford Credit Auto Owner Trust, 2014-2, “A”, 2.31%, 4/15/2026 (n) | | | 1,247,000 | | | | 1,259,243 | |
| Ford Credit Floorplan Master Owner Trust, 2015-1, “A2”, FRN, 1.393%, 1/15/2020 | | | 2,470,000 | | | | 2,473,390 | |
| GE Dealer Floorplan Master Note Trust, 2014-1, “A”, FRN, 1.372%, 7/20/2019 | | | 2,270,000 | | | | 2,270,866 | |
| GMF Floorplan Owner Revolving Trust, 2017-A1, “A”, 2.22%, 1/18/2022 (n) | | | 1,290,000 | | | | 1,295,212 | |
6
Portfolio of Investments (unaudited) – continued
| | | | | | | | |
| Issuer | | Shares/Par | | | Value ($) | |
| Bonds - continued | | | | | | | | |
| Asset-Backed & Securitized - continued | | | | | | | | |
| GO Financial Auto Securitization Trust, 2015-2, “A”, 3.27%, 11/15/2018 (n) | | $ | 134,880 | | | $ | 134,949 | |
| Hertz Fleet Lease Funding LP, 2016-1, “A2”, 1.96%, 4/10/2030 (n) | | | 1,030,000 | | | | 1,033,629 | |
| Loomis, Sayles & Co., CLO, “A1”, FRN, 2.688%, 10/15/2027 (z) | | | 1,117,883 | | | | 1,123,303 | |
| Mercedes-Benz Master Owner Trust, 2016-AA, “A”, FRN, 1.573%, 5/15/2020 (n) | | | 1,800,000 | | | | 1,806,984 | |
| Nextgear Floorplan Master Owner Trust, 2015-1A, “A”, 1.8%, 7/15/2019 (n) | | | 1,301,000 | | | | 1,301,757 | |
| Sierra Receivables Funding Co. LLC, 2015-1A, “A”, 2.4%, 3/22/2032 (n) | | | 655,307 | | | | 657,113 | |
| SPS Servicer Advance Receivables Trust, 2016-T1, “AT1”, 2.53%, 11/16/2048 (n) | | | 2,360,000 | | | | 2,354,551 | |
| Sway Residential Trust, 2014-1, “A”, FRN, 2.293%, 1/17/2032 (n) | | | 776,625 | | | | 780,067 | |
| Tricon American Homes 2015-SFR1, Trust “1A”, FRN, 2.589%, 11/17/2033 (n) | | | 1,300,000 | | | | 1,279,857 | |
| | | | | | | | |
| | | | $ | 36,542,666 | |
| Automotive - 0.7% | | | | | | | | |
| General Motors Financial Co., 3.95%, 4/13/2024 | | $ | 4,000,000 | | | $ | 4,025,600 | |
| | |
| Broadcasting - 0.3% | | | | | | | | |
| Time Warner, Inc., 3.8%, 2/15/2027 | | $ | 1,406,000 | | | $ | 1,399,822 | |
| | |
| Brokerage & Asset Managers - 0.4% | | | | | | | | |
| Intercontinental Exchange, Inc., 2.75%, 12/01/2020 | | $ | 2,388,000 | | | $ | 2,428,326 | |
| | |
| Business Services - 0.7% | | | | | | | | |
| Fidelity National Information Services, Inc., 2.85%, 10/15/2018 | | $ | 665,000 | | | $ | 673,630 | |
| Fidelity National Information Services, Inc., 5%, 10/15/2025 | | | 2,700,000 | | | | 2,978,786 | |
| | | | | | | | |
| | | | $ | 3,652,416 | |
| Cable TV - 1.3% | | | | | | | | |
| Charter Communications Operating LLC/Charter Communications Operating Capital Corp., 4.908%, 7/23/2025 | | $ | 1,350,000 | | | $ | 1,446,857 | |
| Cox Communications, Inc., 3.25%, 12/15/2022 (n) | | | 2,925,000 | | | | 2,888,946 | |
| Time Warner Cable, Inc., 4%, 9/01/2021 | | | 2,770,000 | | | | 2,892,273 | |
| | | | | | | | |
| | | | $ | 7,228,076 | |
| Chemicals - 0.6% | | | | | | | | |
| Dow Chemical Co., 8.55%, 5/15/2019 | | $ | 2,490,000 | | | $ | 2,808,907 | |
| LyondellBasell Industries N.V., 5%, 4/15/2019 | | | 336,000 | | | | 352,938 | |
| | | | | | | | |
| | | | $ | 3,161,845 | |
7
Portfolio of Investments (unaudited) – continued
| | | | | | | | |
| Issuer | | Shares/Par | | | Value ($) | |
| Bonds - continued | | | | | | | | |
| Computer Software - 0.8% | | | | | | | | |
| Diamond 1 Finance Corp./Diamond 2 Finance Corp., 3.48%, 6/01/2019 (n) | | $ | 1,140,000 | | | $ | 1,165,990 | |
| Microsoft Corp., 3.125%, 11/03/2025 | | | 3,110,000 | | | | 3,180,382 | |
| | | | | | | | |
| | | | $ | 4,346,372 | |
| Computer Software - Systems - 0.5% | | | | | | | | |
| Apple, Inc., 3.35%, 2/09/2027 | | $ | 2,700,000 | | | $ | 2,761,547 | |
| | |
| Conglomerates - 0.2% | | | | | | | | |
| General Electric Capital Corp., 6%, 8/07/2019 | | $ | 338,000 | | | $ | 370,111 | |
| Roper Technologies, Inc., 2.8%, 12/15/2021 | | | 651,000 | | | | 654,546 | |
| | | | | | | | |
| | | | $ | 1,024,657 | |
| Consumer Products - 0.7% | | | | | | | | |
| Newell Rubbermaid, Inc., 2.875%, 12/01/2019 | | $ | 1,530,000 | | | $ | 1,558,860 | |
| Reckitt Benckiser Treasury Services PLC, 3.625%, 9/21/2023 (n) | | | 2,274,000 | | | | 2,349,892 | |
| | | | | | | | |
| | | | $ | 3,908,752 | |
| Defense Electronics - 0.3% | | | | | | | | |
| BAE Systems Holdings, Inc., 6.375%, 6/01/2019 (n) | | $ | 1,400,000 | | | $ | 1,518,556 | |
| | |
| Electrical Equipment - 0.3% | | | | | | | | |
| Molex Electronic Technologies LLC, 2.878%, 4/15/2020 (n) | | $ | 1,703,000 | | | $ | 1,717,355 | |
| | |
| Emerging Market Quasi-Sovereign - 1.6% | | | | | | | | |
| Corporacion Financiera de Desarrollo S.A., 3.25%, 7/15/2019 (n) | | $ | 1,337,000 | | | $ | 1,360,398 | |
| Corporacion Financiera de Desarrollo S.A., 4.75%, 2/08/2022 (n) | | | 228,000 | | | | 243,162 | |
| Korea Gas Corp., 2.25%, 7/25/2017 (n) | | | 1,630,000 | | | | 1,632,086 | |
| Petroleos Mexicanos, 6%, 3/05/2020 | | | 2,970,000 | | | | 3,197,205 | |
| Sinopec Capital (2013) Ltd., 3.125%, 4/24/2023 (n) | | | 733,000 | | | | 727,339 | |
| State Grid International Development Co. Ltd., 1.75%, 5/22/2018 (n) | | | 1,330,000 | | | | 1,326,002 | |
| | | | | | | | |
| | | | $ | 8,486,192 | |
| Emerging Market Sovereign - 0.4% | | | | | | | | |
| Republic of Poland, 5%, 3/23/2022 | | $ | 772,000 | | | $ | 848,930 | |
| State of Qatar, 2.375%, 6/02/2021 (n) | | | 1,105,000 | | | | 1,098,923 | |
| | | | | | | | |
| | | | $ | 1,947,853 | |
| Energy - Integrated - 0.7% | | | | | | | | |
| BP Capital Markets PLC, 4.5%, 10/01/2020 | | $ | 853,000 | | | $ | 917,520 | |
| BP Capital Markets PLC, 4.742%, 3/11/2021 | | | 1,810,000 | | | | 1,974,062 | |
| Petro-Canada, 6.05%, 5/15/2018 | | | 904,000 | | | | 942,783 | |
| | | | | | | | |
| | | | $ | 3,834,365 | |
8
Portfolio of Investments (unaudited) – continued
| | | | | | | | |
| Issuer | | Shares/Par | | | Value ($) | |
| Bonds - continued | | | | | | | | |
| Financial Institutions - 0.2% | | | | | | | | |
| GE Capital International Funding Co., 2.342%, 11/15/2020 | | $ | 984,000 | | | $ | 990,447 | |
| | |
| Food & Beverages - 4.2% | | | | | | | | |
| Anheuser-Busch InBev Finance, Inc., 2.65%, 2/01/2021 | | $ | 6,000,000 | | | $ | 6,073,656 | |
| Anheuser-Busch InBev Worldwide, Inc., 3.3%, 2/01/2023 | | | 2,308,000 | | | | 2,371,119 | |
| Coca-Cola Bottling Co. Consolidated, 3.8%, 11/25/2025 | | | 3,120,000 | | | | 3,209,023 | |
| Kerry Group Financial Services, 3.2%, 4/09/2023 (n) | | | 2,850,000 | | | | 2,837,845 | |
| Kraft Heinz Foods Co., 6.125%, 8/23/2018 | | | 2,380,000 | | | | 2,508,977 | |
| Tyson Foods, Inc., 4.5%, 6/15/2022 | | | 1,447,000 | | | | 1,547,490 | |
| Want Want China Finance Co., 1.875%, 5/14/2018 (n) | | | 1,430,000 | | | | 1,422,724 | |
| Wm. Wrigley Jr. Co., 2.4%, 10/21/2018 (n) | | | 613,000 | | | | 617,954 | |
| Wm. Wrigley Jr. Co., 3.375%, 10/21/2020 (n) | | | 1,876,000 | | | | 1,936,199 | |
| | | | | | | | |
| | | | $ | 22,524,987 | |
| Food & Drug Stores - 0.8% | | | | | | | | |
| CVS Health Corp., 3.875%, 7/20/2025 | | $ | 2,479,000 | | | $ | 2,578,782 | |
| Walgreens Boots Alliance, Inc., 3.3%, 11/18/2021 | | | 1,522,000 | | | | 1,567,069 | |
| | | | | | | | |
| | | | $ | 4,145,851 | |
| Insurance - 1.6% | | | | | | | | |
| American International Group, Inc., 3.75%, 7/10/2025 | | $ | 2,808,000 | | | $ | 2,837,681 | |
| American International Group, Inc., 3.9%, 4/01/2026 | | | 1,350,000 | | | | 1,376,699 | |
| Metropolitan Life Global Funding I, 2%, 4/14/2020 (n) | | | 1,600,000 | | | | 1,593,995 | |
| Unum Group, 4%, 3/15/2024 | | | 2,863,000 | | | | 2,949,981 | |
| | | | | | | | |
| | | | $ | 8,758,356 | |
| Insurance - Health - 0.5% | | | | | | | | |
| UnitedHealth Group, Inc., 3.75%, 7/15/2025 | | $ | 2,800,000 | | | $ | 2,944,869 | |
| | |
| Insurance - Property & Casualty - 2.5% | | | | | | | | |
| Allied World Assurance Co. Holdings Ltd., 4.35%, 10/29/2025 | | $ | 3,110,000 | | | $ | 3,139,626 | |
| AXIS Capital Holdings Ltd., 5.875%, 6/01/2020 | | | 1,610,000 | | | | 1,770,610 | |
| Liberty Mutual Group, Inc., 4.25%, 6/15/2023 (n) | | | 4,000,000 | | | | 4,257,692 | |
| Marsh & McLennan Cos., Inc., 2.35%, 9/10/2019 | | | 1,260,000 | | | | 1,268,704 | |
| ZFS Finance USA Trust V, 6.5% to 5/09/2017, FRN to 5/09/2067 (n) | | | 3,000,000 | | | | 3,003,300 | |
| | | | | | | | |
| | | | $ | 13,439,932 | |
| International Market Quasi-Sovereign - 1.7% | | | | | | | | |
| Bank Nederlandse Gemeenten N.V., 1.375%, 3/19/2018 (n) | | $ | 1,746,000 | | | $ | 1,746,190 | |
| Dexia Credit Local S.A., 1.875%, 9/15/2021 (n) | | | 2,510,000 | | | | 2,433,314 | |
| Dexia Credit Local S.A., 2.25%, 1/30/2019 (n) | | | 3,280,000 | | | | 3,291,513 | |
| Electricite de France, 2.15%, 1/22/2019 (n) | | | 1,784,000 | | | | 1,787,666 | |
| | | | | | | | |
| | | | $ | 9,258,683 | |
9
Portfolio of Investments (unaudited) – continued
| | | | | | | | |
| Issuer | | Shares/Par | | | Value ($) | |
| Bonds - continued | | | | | | | | |
| International Market Sovereign - 12.6% | | | | | | | | |
| Commonwealth of Australia, 5.75%, 5/15/2021 | | AUD | 3,836,000 | | | $ | 3,292,209 | |
| Federal Republic of Germany, 3.25%, 7/04/2021 | | EUR | 1,200,000 | | | | 1,516,070 | |
| Federal Republic of Germany, 1.75%, 2/15/2024 | | EUR | 4,050,000 | | | | 4,983,195 | |
| Government of Canada, 4.25%, 6/01/2018 | | CAD | 505,000 | | | | 384,256 | |
| Government of Canada, 3.25%, 6/01/2021 | | CAD | 1,579,000 | | | | 1,264,160 | |
| Government of Canada, 2.5%, 6/01/2024 | | CAD | 3,043,000 | | | | 2,418,283 | |
| Government of Japan, 2.1%, 9/20/2024 | | JPY | 320,000,000 | | | | 3,335,722 | |
| Government of Norway, 3.75%, 5/25/2021 | | NOK | 6,400,000 | | | | 827,617 | |
| Kingdom of Belgium, 4.25%, 9/28/2021 | | EUR | 404,000 | | | | 530,064 | |
| Kingdom of Belgium, 2.6%, 6/22/2024 | | EUR | 2,845,000 | | | | 3,618,695 | |
| Kingdom of Denmark, 3%, 11/15/2021 | | DKK | 4,447,000 | | | | 748,582 | |
| Kingdom of Denmark, 1.5%, 11/15/2023 | | DKK | 4,198,000 | | | | 674,992 | |
| Kingdom of Spain, 5.5%, 7/30/2017 | | EUR | 711,000 | | | | 785,388 | |
| Kingdom of Spain, 4.6%, 7/30/2019 | | EUR | 4,110,000 | | | | 4,960,854 | |
| Kingdom of Spain, 5.4%, 1/31/2023 | | EUR | 2,425,000 | | | | 3,351,691 | |
| Kingdom of Sweden, 5%, 12/01/2020 | | SEK | 6,500,000 | | | | 875,586 | |
| Kingdom of Sweden, 3.5%, 6/01/2022 | | SEK | 4,235,000 | | | | 565,073 | |
| Kingdom of the Netherlands, 2%, 7/15/2024 | | EUR | 1,251,000 | | | | 1,553,711 | |
| Republic of Austria, 1.75%, 10/20/2023 | | EUR | 210,000 | | | | 254,770 | |
| Republic of France, 2.5%, 10/25/2020 | | EUR | 1,500,000 | | | | 1,800,384 | |
| Republic of Italy, 5.25%, 8/01/2017 | | EUR | 11,388,000 | | | | 12,578,490 | |
| Republic of Italy, 3.75%, 3/01/2021 | | EUR | 2,600,000 | | | | 3,177,665 | |
| Republic of Italy, 5.5%, 9/01/2022 | | EUR | 2,969,000 | | | | 3,965,491 | |
| United Kingdom Treasury, 8%, 6/07/2021 | | GBP | 2,500,000 | | | | 4,265,836 | |
| United Kingdom Treasury, 2.25%, 9/07/2023 | | GBP | 4,750,000 | | | | 6,779,474 | |
| | | | | | | | |
| | | | $ | 68,508,258 | |
| Internet - 0.3% | | | | | | | | |
| Baidu, Inc., 2.75%, 6/09/2019 | | $ | 1,510,000 | | | $ | 1,523,179 | |
| | |
| Major Banks - 11.4% | | | | | | | | |
| Bank of America Corp., 6.875%, 4/25/2018 | | $ | 1,000,000 | | | $ | 1,049,260 | |
| Bank of America Corp., 2.151%, 11/09/2020 | | | 750,000 | | | | 744,848 | |
Bank of America Corp., 3.124% to 1/20/2022,
FRN to 1/20/2023 | | | 5,400,000 | | | | 5,456,376 | |
| Bank of America Corp., 4.125%, 1/22/2024 | | | 2,876,000 | | | | 3,022,547 | |
| Bank of America Corp., 4.183%, 11/25/2027 | | | 2,285,000 | | | | 2,308,232 | |
| Barclays PLC, 3.25%, 1/12/2021 | | | 3,848,000 | | | | 3,905,874 | |
| Commonwealth Bank of Australia, 5%, 10/15/2019 (n) | | | 2,560,000 | | | | 2,733,197 | |
| Credit Suisse Group AG, 6.5%, 8/08/2023 (n) | | | 915,000 | | | | 1,018,887 | |
| Credit Suisse Group AG, “A”, 3.574%, 1/09/2023 (n) | | | 1,500,000 | | | | 1,518,033 | |
| Goldman Sachs Group, Inc., 2%, 4/25/2019 | | | 260,000 | | | | 259,809 | |
| Goldman Sachs Group, Inc., 5.75%, 1/24/2022 | | | 1,924,000 | | | | 2,170,690 | |
10
Portfolio of Investments (unaudited) – continued
| | | | | | | | |
| Issuer | | Shares/Par | | | Value ($) | |
| Bonds - continued | | | | | | | | |
| Major Banks - continued | | | | | | | | |
| Goldman Sachs Group, Inc., 3%, 4/26/2022 | | $ | 1,720,000 | | | $ | 1,733,677 | |
| HSBC Holdings PLC, 3.262% to 3/13/2022, FRN to 3/13/2023 | | | 4,000,000 | | | | 4,047,592 | |
| ING Bank N.V., 5.8%, 9/25/2023 (n) | | | 2,912,000 | | | | 3,259,291 | |
| JPMorgan Chase & Co., 2.2%, 10/22/2019 | | | 2,090,000 | | | | 2,099,050 | |
| JPMorgan Chase & Co., 4.625%, 5/10/2021 | | | 2,890,000 | | | | 3,128,376 | |
| Lloyds Bank PLC, 3.75%, 1/11/2027 | | | 1,400,000 | | | | 1,396,592 | |
| Mitsubishi UFJ Financial Group, Inc., 2.95%, 3/01/2021 | | | 1,140,000 | | | | 1,156,563 | |
| Morgan Stanley, 6.625%, 4/01/2018 | | | 1,532,000 | | | | 1,599,344 | |
| Morgan Stanley, 5.625%, 9/23/2019 | | | 640,000 | | | | 691,105 | |
| Morgan Stanley, 3.7%, 10/23/2024 | | | 1,816,000 | | | | 1,860,129 | |
| Morgan Stanley, 3.875%, 1/27/2026 | | | 5,400,000 | | | | 5,520,814 | |
| Morgan Stanley, FRN, 1.893%, 7/23/2019 | | | 1,070,000 | | | | 1,075,208 | |
| Skandinaviska Enskilda Banken AB, 2.45%, 5/27/2020 (n) | | | 1,810,000 | | | | 1,819,687 | |
| Sumitomo Mitsui Financial Group, Inc., 3.01%, 10/19/2026 | | | 1,505,000 | | | | 1,466,860 | |
| UBS Group Funding (Jersey) Ltd., 3%, 4/15/2021 (n) | | | 2,505,000 | | | | 2,522,127 | |
| UBS Group Funding (Jersey) Ltd., FRN, 2.596%, 9/24/2020 (n) | | | 1,680,000 | | | | 1,713,786 | |
| UBS Group Funding (Switzerland) AG, 4.253%, 3/23/2028 (n) | | | 2,449,000 | | | | 2,523,068 | |
| | | | | | | | |
| | | | $ | 61,801,022 | |
| Medical & Health Technology & Services - 0.4% | | | | | | | | |
| Laboratory Corp. of America Holdings, 2.625%, 2/01/2020 | | $ | 2,120,000 | | | $ | 2,135,086 | |
| | |
| Medical Equipment - 0.4% | | | | | | | | |
| Abbott Laboratories, 3.4%, 11/30/2023 | | $ | 2,285,000 | | | $ | 2,318,350 | |
| | |
| Metals & Mining - 1.7% | | | | | | | | |
| Barrick Gold Corp., 4.1%, 5/01/2023 | | $ | 857,000 | | | $ | 931,866 | |
| Freeport-McMoRan, Inc., 2.375%, 3/15/2018 | | | 1,090,000 | | | | 1,084,550 | |
| Freeport-McMoRan, Inc., 3.1%, 3/15/2020 | | | 1,740,000 | | | | 1,716,075 | |
| Glencore Funding LLC, 2.125%, 4/16/2018 (n) | | | 1,270,000 | | | | 1,269,632 | |
| Glencore Funding LLC, 4.125%, 5/30/2023 (n) | | | 1,518,000 | | | | 1,559,608 | |
| Glencore Funding LLC, 4%, 4/16/2025 (n) | | | 880,000 | | | | 881,742 | |
| Kinross Gold Corp., 5.95%, 3/15/2024 | | | 1,897,000 | | | | 2,033,963 | |
| | | | | | | | |
| | | | $ | 9,477,436 | |
| Midstream - 1.6% | | | | | | | | |
| APT Pipelines Ltd., 4.2%, 3/23/2025 (n) | | $ | 2,246,000 | | | $ | 2,310,249 | |
| APT Pipelines Ltd., 4.25%, 7/15/2027 (n) | | | 364,000 | | | | 372,302 | |
| Enbridge, Inc., 4.25%, 12/01/2026 | | | 2,700,000 | | | | 2,815,536 | |
| Kinder Morgan Energy Partners LP, 3.5%, 3/01/2021 | | | 1,854,000 | | | | 1,895,543 | |
| Spectra Energy Capital LLC, 8%, 10/01/2019 | | | 1,299,000 | | | | 1,457,362 | |
| | | | | | | | |
| | | | $ | 8,850,992 | |
11
Portfolio of Investments (unaudited) – continued
| | | | | | | | |
| Issuer | | Shares/Par | | | Value ($) | |
| Bonds - continued | | | | | | | | |
| Mortgage-Backed - 1.6% | | | | | | | | |
| Fannie Mae, 5.5%, 9/01/2017 - 4/01/2025 | | $ | 318,761 | | | $ | 351,017 | |
| Fannie Mae, 4.5%, 3/01/2019 | | | 297,439 | | | | 305,277 | |
| Fannie Mae, 5%, 5/01/2019 - 12/01/2020 | | | 70,562 | | | | 72,586 | |
| Fannie Mae, 6.5%, 11/01/2031 | | | 976,735 | | | | 1,126,570 | |
| Fannie Mae, FRN, 1.07%, 12/25/2017 | | | 179,351 | | | | 179,330 | |
| Fannie Mae, FRN, 1.34%, 5/25/2018 | | | 1,162,773 | | | | 1,163,031 | |
| Freddie Mac, 6%, 8/01/2017 - 8/01/2034 | | | 49,238 | | | | 52,820 | |
| Freddie Mac, 5.5%, 9/01/2017 - 6/01/2020 | | | 353,587 | | | | 366,593 | |
| Freddie Mac, 3.882%, 11/25/2017 | | | 1,423,992 | | | | 1,433,491 | |
| Freddie Mac, 5%, 6/01/2019 | | | 172,523 | | | | 177,130 | |
| Freddie Mac, 4.224%, 3/25/2020 | | | 2,249,154 | | | | 2,388,788 | |
| Ginnie Mae, 6%, 6/15/2033 - 10/15/2036 | | | 653,946 | | | | 753,870 | |
| Ginnie Mae, 6.157%, 4/20/2058 | | | 47,678 | | | | 52,714 | |
| | | | | | | | |
| | | | $ | 8,423,217 | |
| Network & Telecom - 1.8% | | | | | | | | |
| AT&T, Inc., 3.4%, 5/15/2025 | | $ | 5,400,000 | | | $ | 5,258,660 | |
| AT&T, Inc., FRN, 1.962%, 11/27/2018 | | | 2,940,000 | | | | 2,965,369 | |
| British Telecommunications PLC, 2.35%, 2/14/2019 | | | 1,330,000 | | | | 1,339,815 | |
| | | | | | | | |
| | | | $ | 9,563,844 | |
| Oils - 0.6% | | | | | | | | |
| Marathon Petroleum Corp., 3.625%, 9/15/2024 | | $ | 1,003,000 | | | $ | 999,346 | |
| Valero Energy Corp., 3.4%, 9/15/2026 | | | 2,353,000 | | | | 2,278,864 | |
| | | | | | | | |
| | | | $ | 3,278,210 | |
| Other Banks & Diversified Financials - 2.4% | | | | | | | | |
| Citizens Bank N.A., 2.5%, 3/14/2019 | | $ | 1,000,000 | | | $ | 1,008,452 | |
| Citizens Bank N.A., 2.55%, 5/13/2021 | | | 910,000 | | | | 910,222 | |
| Discover Bank, 3.1%, 6/04/2020 | | | 1,152,000 | | | | 1,176,939 | |
| First Republic Bank, 2.375%, 6/17/2019 | | | 578,000 | | | | 579,318 | |
| Groupe BPCE S.A., 12.5% to 9/30/2019, FRN to 8/29/2049 (n) | | | 2,556,000 | | | | 3,079,980 | |
| Lloyds Bank PLC, 2.3%, 11/27/2018 | | | 780,000 | | | | 785,002 | |
| Lloyds Bank PLC, 5.8%, 1/13/2020 (n) | | | 2,080,000 | | | | 2,273,101 | |
| SunTrust Banks, Inc., 2.7%, 1/27/2022 | | | 1,803,000 | | | | 1,806,370 | |
| SunTrust Banks, Inc., 3.3%, 5/15/2026 | | | 1,473,000 | | | | 1,442,876 | |
| | | | | | | | |
| | | | $ | 13,062,260 | |
| Personal Computers & Peripherals - 0.1% | | | | | | | | |
| Equifax, Inc., 2.3%, 6/01/2021 | | $ | 759,000 | | | $ | 752,989 | |
| | |
| Pharmaceuticals - 3.3% | | | | | | | | |
| Actavis Funding SCS, 3%, 3/12/2020 | | $ | 3,625,000 | | | $ | 3,696,086 | |
| Actavis Funding SCS, 3.45%, 3/15/2022 | | | 3,000,000 | | | | 3,083,967 | |
12
Portfolio of Investments (unaudited) – continued
| | | | | | | | |
| Issuer | | Shares/Par | | | Value ($) | |
| Bonds - continued | | | | | | | | |
| Pharmaceuticals - continued | | | | | | | | |
| Biogen, Inc., 2.9%, 9/15/2020 | | $ | 1,420,000 | | | $ | 1,449,036 | |
| Celgene Corp., 2.125%, 8/15/2018 | | | 2,220,000 | | | | 2,228,862 | |
| Gilead Sciences, Inc., 3.65%, 3/01/2026 | | | 3,740,000 | | | | 3,804,661 | |
| Mylan N.V., 2.5%, 6/07/2019 | | | 940,000 | | | | 944,526 | |
| Shire Acquisitions Investments Ireland Designated Activity Co., 2.875%, 9/23/2023 | | | 3,000,000 | | | | 2,941,422 | |
| | | | | | | | |
| | | | $ | 18,148,560 | |
| Real Estate - Retail - 0.1% | | | | | | | | |
| Kimco Realty Corp., REIT, 6.875%, 10/01/2019 | | $ | 690,000 | | | $ | 766,353 | |
| | |
| Specialty Chemicals - 0.2% | | | | | | | | |
| Airgas, Inc., 3.05%, 8/01/2020 | | $ | 870,000 | | | $ | 893,570 | |
| | |
| Supranational - 0.9% | | | | | | | | |
Banco Latinoamericano de Comercio Exterior S.A.,
3.25%, 5/07/2020 (n) | | $ | 1,900,000 | | | $ | 1,933,250 | |
| Corporacion Andina de Fomento, 4.375%, 6/15/2022 | | | 2,950,000 | | | | 3,174,584 | |
| | | | | | | | |
| | | | $ | 5,107,834 | |
| Telecommunications - Wireless - 1.0% | | | | | | | | |
| American Tower Trust I, REIT, 1.551%, 3/15/2018 (n) | | $ | 1,540,000 | | | $ | 1,536,786 | |
| Rogers Communications, Inc., 6.8%, 8/15/2018 | | | 1,490,000 | | | | 1,583,676 | |
| SBA Tower Trust, 2.877%, 7/15/2021 (n) | | | 586,000 | | | | 585,502 | |
| SBA Tower Trust, 2.898%, 10/15/2044 (n) | | | 1,920,000 | | | | 1,931,133 | |
| | | | | | | | |
| | | | $ | 5,637,097 | |
| Telephone Services - 0.2% | | | | | | | | |
| Qwest Corp., 6.5%, 6/01/2017 | | $ | 1,200,000 | | | $ | 1,204,788 | |
| | |
| Tobacco - 0.7% | | | | | | | | |
| Reynolds American, Inc., 8.125%, 6/23/2019 | | $ | 1,316,000 | | | $ | 1,477,086 | |
| Reynolds American, Inc., 6.875%, 5/01/2020 | | | 1,340,000 | | | | 1,514,276 | |
| Reynolds American, Inc., 3.25%, 6/12/2020 | | | 614,000 | | | | 632,724 | |
| | | | | | | | |
| | | | $ | 3,624,086 | |
| Transportation - Services - 0.5% | | | | | | | | |
| TTX Co., 2.6%, 6/15/2020 (n) | | $ | 2,450,000 | | | $ | 2,459,447 | |
| | |
| U.S. Government Agencies and Equivalents - 0.8% | | | | | | | | |
| AID-Ukraine, 1.847%, 5/29/2020 | | $ | 2,500,000 | | | $ | 2,504,448 | |
| Small Business Administration, 6.35%, 4/01/2021 | | | 107,311 | | | | 113,311 | |
| Small Business Administration, 6.34%, 5/01/2021 | | | 108,890 | | | | 115,054 | |
| Small Business Administration, 6.44%, 6/01/2021 | | | 114,766 | | | | 121,717 | |
13
Portfolio of Investments (unaudited) – continued
| | | | | | | | |
| Issuer | | Shares/Par | | | Value ($) | |
| Bonds - continued | | | | | | | | |
| U.S. Government Agencies and Equivalents - continued | | | | | |
| Small Business Administration, 6.625%, 7/01/2021 | | $ | 137,972 | | | $ | 147,018 | |
| Small Business Administration, 5.34%, 11/01/2021 | | | 383,358 | | | | 400,315 | |
| Small Business Administration, 4.93%, 1/01/2024 | | | 207,597 | | | | 219,680 | |
| Small Business Administration, 5.36%, 11/01/2025 | | | 321,352 | | | | 343,771 | |
| Small Business Administration, 5.39%, 12/01/2025 | | | 245,200 | | | | 262,356 | |
| | | | | | | | |
| | | | $ | 4,227,670 | |
| U.S. Treasury Obligations - 20.2% | | | | | | | | |
| U.S. Treasury Notes, 0.75%, 4/30/2018 | | $ | 90,000,000 | | | $ | 89,648,460 | |
| U.S. Treasury Notes, 1.75%, 2/28/2022 | | | 3,210,000 | | | | 3,199,969 | |
| U.S. Treasury Notes, 1.625%, 5/15/2026 (f) | | | 17,420,000 | | | | 16,505,450 | |
| | | | | | | | |
| | | | $ | 109,353,879 | |
| Utilities - Electric Power - 3.6% | | | | | | | | |
| Dominion Resources, Inc., 3.9%, 10/01/2025 | | $ | 2,641,000 | | | $ | 2,719,108 | |
| E.ON International Finance B.V., 5.8%, 4/30/2018 (n) | | | 3,000,000 | | | | 3,109,260 | |
| Emera U.S. Finance LP, 2.15%, 6/15/2019 | | | 670,000 | | | | 670,131 | |
| Enel Americas S.A., 4%, 10/25/2026 | | | 252,000 | | | | 250,425 | |
| Enel Finance International S.A., 6.25%, 9/15/2017 (n) | | | 2,240,000 | | | | 2,278,015 | |
| Eversource Energy, 2.5%, 3/15/2021 | | | 1,000,000 | | | | 997,520 | |
| Exelon Corp., 3.497%, 6/01/2022 | | | 2,365,000 | | | | 2,411,813 | |
| Great Plains Energy, Inc., 3.15%, 4/01/2022 | | | 927,000 | | | | 938,246 | |
| NextEra Energy Capital Holdings, Inc., 2.3%, 4/01/2019 | | | 1,714,000 | | | | 1,725,755 | |
| Oncor Electric Delivery Co., 4.1%, 6/01/2022 | | | 2,206,000 | | | | 2,351,517 | |
| PPL WEM Holdings PLC, 5.375%, 5/01/2021 (n) | | | 546,000 | | | | 592,292 | |
| Transelec S.A., 4.625%, 7/26/2023 (n) | | | 927,000 | | | | 980,656 | |
| Transelec S.A., 4.25%, 1/14/2025 (n) | | | 228,000 | | | | 235,209 | |
| | | | | | | | |
| | | | $ | 19,259,947 | |
| Total Bonds (Identified Cost, $510,856,028) | | | $ | 510,425,599 | |
| | |
| Short-Term Obligations (y) - 0.9% | | | | | | | | |
Bank of Nova Scotia, 1.44%, due 9/01/17
(Identified Cost, $5,001,000) | | $ | 5,000,000 | | | $ | 5,005,568 | |
| | |
| Money Market Funds - 4.0% | | | | | | | | |
MFS Institutional Money Market Portfolio, 0.78% (v)
(Identified Cost, $21,437,486) | | | 21,439,629 | | | $ | 21,439,629 | |
| Total Investments (Identified Cost, $537,294,514) | | | | | | $ | 536,870,796 | |
| | |
| Other Assets, Less Liabilities - 1.0% | | | | | | | 5,532,674 | |
| Net Assets - 100.0% | | | | | | $ | 542,403,470 | |
14
Portfolio of Investments (unaudited) – continued
| (f) | All or a portion of the security has been segregated as collateral for open futures contracts. |
| (i) | Interest only security for which the fund receives interest on notional principal (Par amount). Par amount shown is the notional principal and does not reflect the cost of the security. |
| (n) | Securities exempt from registration under Rule 144A of the Securities Act of 1933. These securities may be sold in the ordinary course of business in transactions exempt from registration, normally to qualified institutional buyers. At period end, the aggregate value of these securities was $111,780,022 representing 20.6% of net assets. |
| (v) | Underlying affiliated fund that is available only to investment companies managed by MFS. The rate quoted for the MFS Institutional Money Market Portfolio is the annualized seven-day yield of the fund at period end. |
| (y) | The rate shown represents an annualized yield at time of purchase. |
| (z) | Restricted securities are not registered under the Securities Act of 1933 and are subject to legal restrictions on resale. These securities generally may be resold in transactions exempt from registration or to the public if the securities are subsequently registered. Disposal of these securities may involve time-consuming negotiations and prompt sale at an acceptable price may be difficult. The fund holds the following restricted securities: |
| | | | | | | | | | |
| Restricted Securities | | Acquisition
Date | | Cost | | | Value | |
| Falcon Franchise Loan LLC, FRN, 7.583%, 1/05/2023 | | 1/18/02 | | | $29,880 | | | | $8,281 | |
| Loomis, Sayles & Co., CLO, “A1”, FRN, 2.688%, 10/15/2027 | | 6/27/16 | | | 1,112,647 | | | | 1,123,303 | |
| Total Restricted Securities | | | | | | | | | $1,131,584 | |
| % of Net assets | | | | | | | | | 0.2% | |
The following abbreviations are used in this report and are defined:
| CLO | | Collateralized Loan Obligation |
| FRN | | Floating Rate Note. Interest rate resets periodically and the current rate may not be the rate reported at period end. |
| PLC | | Public Limited Company |
| REIT | | Real Estate Investment Trust |
Abbreviations indicate amounts shown in currencies other than the U.S. dollar. All amounts are stated in U.S. dollars unless otherwise indicated. A list of abbreviations is shown below:
15
Portfolio of Investments (unaudited) – continued
Derivative Contracts at 4/30/17
Forward Foreign Currency Exchange Contracts at 4/30/17
| | | | | | | | | | | | | | | | | | | | | | | | |
| Type | | Currency | | Counter- party | | Contracts to
Deliver/
Receive | | | Settlement
Date Range | | | In
Exchange
For | | | Contracts
at Value | | | Net
Unrealized
Appreciation
(Depreciation) | |
| Asset Derivatives | | | | | | | | | | | | | |
| SELL | | AUD | | Westpac Banking Corp. | | | 4,469,012 | | | | 6/09/17 | | | | $3,380,473 | | | | $3,344,126 | | | | $36,347 | |
| SELL | | CAD | | Citibank N.A. | | | 5,639,614 | | | | 6/09/17 | | | | 4,208,934 | | | | 4,133,696 | | | | 75,238 | |
| SELL | | NOK | | Deutsche Bank AG | | | 7,569,996 | | | | 6/09/17 | | | | 894,303 | | | | 882,053 | | | | 12,250 | |
| SELL | | NZD | | JPMorgan Chase Bank N.A. | | | 56,234 | | | | 6/09/17 | | | | 39,056 | | | | 38,573 | | | | 483 | |
| | | | | | | | | | | | | | | | | | | | | | | | |
| | | | | | | | | | | | | | | | | | | | | | | $124,318 | |
| | | | | | | | | | | | | | | | | | | | | | | | |
| | | | |
| Liability Derivatives | | | | | | | | | | | | | |
| SELL | | DKK | | Goldman Sachs International | | | 9,466,576 | | | | 6/09/17 | | | | $1,352,008 | | | | $1,389,049 | | | | $(37,041 | ) |
| SELL | | EUR | | JPMorgan Chase Bank N.A. | | | 17,267,682 | | | | 6/09/17 | | | | 18,340,350 | | | | 18,843,544 | | | | (503,194 | ) |
| SELL | | EUR | | Morgan Stanley Capital Services, Inc. | | | 24,603,977 | | | | 5/19/17 | | | | 26,162,639 | | | | 26,821,697 | | | | (659,058 | ) |
| SELL | | GBP | | Barclays Bank PLC | | | 9,405,477 | | | | 6/09/17 | | | | 11,507,667 | | | | 12,194,327 | | | | (686,660 | ) |
| SELL | | JPY | | Goldman Sachs International | | | 305,140,293 | | | | 6/09/17 | | | | 2,687,727 | | | | 2,741,257 | | | | (53,530 | ) |
| SELL | | SEK | | Goldman Sachs International | | | 11,649,976 | | | | 6/09/17 | | | | 1,299,512 | | | | 1,317,760 | | | | (18,248 | ) |
| | | | | | | | | | | | | | | | | | | | | | | | |
| | | | | | | | | | | | | | | | | | | | | | | $(1,957,731 | ) |
| | | | | | | | | | | | | | | | | | | | | | | | |
16
Portfolio of Investments (unaudited) – continued
Futures Contracts at 4/30/17
| | | | | | | | | | | | | | | | | | |
| Description | | Currency | | | Contracts | | | Value | | Expiration
Date | | | Unrealized
Appreciation
(Depreciation) | |
| Asset Derivatives | | | | | | | | | | | | | | | | | | |
| Interest Rate Futures | | | | | | | | | | | | | | | | | | |
| U.S. Treasury Note 5 yr (Long) | | | USD | | | | 155 | | | $18,352,969 | | | June - 2017 | | | | $91,606 | |
| U.S. Treasury Note 10 yr (Long) | | | USD | | | | 383 | | | 48,150,281 | | | June - 2017 | | | | 477,360 | |
| | | | | | | | | | | | | | | | | | |
| | | | | | | | | | | | | | | | | $568,966 | |
| | | | | | | | | | | | | | | | | | |
At April 30, 2017, the fund had cash collateral of $1,767,000 and other liquid securities with an aggregate value of $784,000 to cover any commitments for certain derivative contracts. Cash collateral is comprised of “Restricted Cash” on the Statement of Assets and Liabilities.
See Notes to Financial Statements
17
Financial Statements
STATEMENT OF ASSETS AND LIABILITIES
At 4/30/17 (unaudited)
This statement represents your fund’s balance sheet, which details the assets and liabilities comprising the total value of the fund.
| | | | |
| Assets | | | | |
Investments | | | | |
Non-affiliated issuers, at value (identified cost, $515,857,028) | | | $515,431,167 | |
Underlying affiliated funds, at value (identified cost, $21,437,486) | | | 21,439,629 | |
Total investments, at value (identified cost, $537,294,514) | | | $536,870,796 | |
Cash | | | 44,883 | |
Restricted cash | | | 1,767,000 | |
Receivables for | | | | |
Forward foreign currency exchange contracts | | | 124,318 | |
Daily variation margin on open futures contracts | | | 32,346 | |
Investments sold | | | 1,570,159 | |
Interest | | | 4,235,101 | |
Other assets | | | 79,110 | |
Total assets | | | $544,723,713 | |
| Liabilities | | | | |
Payables for | | | | |
Distributions | | | $142,865 | |
Forward foreign currency exchange contracts | | | 1,957,731 | |
Payable to affiliates | | | | |
Investment adviser | | | 30,223 | |
Transfer agent and dividend disbursing costs | | | 2,878 | |
Payable for independent Trustees’ compensation | | | 40,913 | |
Accrued expenses and other liabilities | | | 145,633 | |
Total liabilities | | | $2,320,243 | |
Net assets | | | $542,403,470 | |
| Net assets consist of | | | | |
Paid-in capital | | | $565,093,437 | |
Unrealized appreciation (depreciation) on investments and translation of assets and liabilities in foreign currencies | | | (1,678,116 | ) |
Accumulated net realized gain (loss) on investments and foreign currency | | | (514,474 | ) |
Accumulated distributions in excess of net investment income | | | (20,497,377 | ) |
Net assets | | | $542,403,470 | |
Shares of beneficial interest outstanding | | | 117,732,674 | |
Net asset value per share (net assets of $542,403,470 / 117,732,674 shares of beneficial interest outstanding) | | | $4.61 | |
See Notes to Financial Statements
18
Financial Statements
STATEMENT OF OPERATIONS
Six months ended 4/30/17 (unaudited)
This statement describes how much your fund earned in investment income and accrued in expenses. It also describes any gains and/or losses generated by fund operations.
| | | | |
| Net investment income | |
Income | | | | |
Interest | | | $7,341,839 | |
Dividends from underlying affiliated funds | | | 62,958 | |
Other | | | 7,656 | |
Foreign taxes withheld | | | (24 | ) |
Total investment income | | | $7,412,429 | |
Expenses | | | | |
Management fee | | | $1,333,677 | |
Transfer agent and dividend disbursing costs | | | 52,714 | |
Administrative services fee | | | 47,427 | |
Independent Trustees’ compensation | | | 57,374 | |
Stock exchange fee | | | 56,657 | |
Custodian fee | | | 22,125 | |
Reimbursement of custodian expenses | | | (99,859 | ) |
Shareholder communications | | | 100,702 | |
Audit and tax fees | | | 39,262 | |
Legal fees | | | 6,788 | |
Miscellaneous | | | 20,513 | |
Total expenses | | | $1,637,380 | |
Net investment income | | | $5,775,049 | |
| Realized and unrealized gain (loss) on investments and foreign currency | |
Realized gain (loss) (identified cost basis) | | | | |
Investments: | | | | |
Non-affiliated issuers | | | $1,738,941 | |
Underlying affiliated funds | | | (2,115 | ) |
Futures contracts | | | (2,798,298 | ) |
Foreign currency | | | 4,694,059 | |
Net realized gain (loss) on investments and foreign currency | | | $3,632,587 | |
Change in unrealized appreciation (depreciation) | | | | |
Investments | | | $(5,921,515 | ) |
Futures contracts | | | 1,351,743 | |
Translation of assets and liabilities in foreign currencies | | | (4,252,306 | ) |
Net unrealized gain (loss) on investments and foreign currency translation | | | $(8,822,078 | ) |
Net realized and unrealized gain (loss) on investments and foreign currency | | | $(5,189,491 | ) |
Change in net assets from operations | | | $585,558 | |
See Notes to Financial Statements
19
Financial Statements
STATEMENTS OF CHANGES IN NET ASSETS
These statements describe the increases and/or decreases in net assets resulting from operations, any distributions, and any shareholder transactions.
| | | | | | | | |
| Change in net assets | | Six months ended
4/30/17 (unaudited) | | | Year ended
10/31/16 | |
| From operations | | | | | | | | |
Net investment income | | | $5,775,049 | | | | $12,561,201 | |
Net realized gain (loss) on investments and foreign currency | | | 3,632,587 | | | | (1,119,108 | ) |
Net unrealized gain (loss) on investments and foreign currency translation | | | (8,822,078 | ) | | | 8,944,282 | |
Change in net assets from operations | | | $585,558 | | | | $20,386,375 | |
| Distributions declared to shareholders | | | | | | | | |
From net investment income | | | $(7,093,377 | ) | | | $(9,585,719 | ) |
From tax return of capital | | | — | | | | (39,950,442 | ) |
From other sources | | | (16,404,893 | ) | | | — | |
Total distributions declared to shareholders | | | $(23,498,270 | ) | | | $(49,536,161 | ) |
Change in net assets from fund share transactions | | | $— | | | | $(26,196 | ) |
Total change in net assets | | | $(22,912,712 | ) | | | $(29,175,982 | ) |
| Net assets | | | | | | | | |
At beginning of period | | | 565,316,182 | | | | 594,492,164 | |
At end of period (including accumulated distributions in excess of net investment income of $20,497,377 and $2,774,156, respectively) | | | $542,403,470 | | | | $565,316,182 | |
See Notes to Financial Statements
20
Financial Statements
FINANCIAL HIGHLIGHTS
The financial highlights table is intended to help you understand the fund’s financial performance for the semiannual period and the past 5 fiscal years. Certain information reflects financial results for a single fund share. The total returns in the table represent the rate that an investor would have earned (or lost) on an investment in the fund share class (assuming reinvestment of all distributions) held for the entire period.
| | | | | | | | | | | | | | | | | | | | | | | | |
| | | Six months
ended
4/30/17 (unaudited) | | | Years ended 10/31 | |
| | | | 2016 | | | 2015 | | | 2014 | | | 2013 | | | 2012 | |
| | | | | | | | | | | | | | | | | |
Net asset value, beginning of period | | | $4.80 | | | | $5.05 | | | | $5.44 | | | | $5.76 | | | | $6.25 | | | | $6.37 | |
| Income (loss) from investment operations | | | | | | | | | | | | | | | | | | | | | |
Net investment income (d) | | | $0.05 | (c) | | | $0.11 | | | | $0.12 | | | | $0.15 | | | | $0.18 | | | | $0.21 | |
Net realized and unrealized gain
(loss) on investments and
foreign currency | | | (0.04 | ) | | | 0.06 | | | | (0.06 | ) | | | 0.01 | | | | (0.16 | ) | | | 0.20 | |
Total from investment operations | | | $0.01 | | | | $0.17 | | | | $0.06 | | | | $0.16 | | | | $0.02 | | | | $0.41 | |
| Less distributions declared to shareholders | | | | | | | | | | | | | | | | | |
From net investment income | | | $(0.06 | ) | | | $(0.08 | ) | | | $(0.25 | ) | | | $(0.21 | ) | | | $(0.18 | ) | | | $(0.30 | ) |
From tax return of capital | | | — | | | | (0.34 | ) | | | (0.20 | ) | | | (0.27 | ) | | | (0.33 | ) | | | (0.23 | ) |
From other sources | | | (0.14 | ) | | | — | | | | — | | | | — | | | | — | | | | — | |
Total distributions declared to
shareholders | | | $(0.20 | ) | | | $(0.42 | ) | | | $(0.45 | ) | | | $(0.48 | ) | | | $(0.51 | ) | | | $(0.53 | ) |
Net increase from repurchase of capital
shares | | | $— | | | | $0.00 | (w) | | | $0.00 | (w) | | | $— | | | | $— | | | | $— | |
Net asset value, end of period (x) | | | $4.61 | | | | $4.80 | | | | $5.05 | | | | $5.44 | | | | $5.76 | | | | $6.25 | |
Market value, end of period | | | $4.37 | | | | $4.45 | | | | $4.56 | | | | $5.05 | | | | $5.28 | | | | $6.53 | |
Total return at market value (%) | | | 2.78 | (n) | | | 6.93 | | | | (0.82 | ) | | | 4.78 | | | | (11.67 | ) | | | 13.01 | |
Total return at net asset value (%) (j)(r)(s)(x) | | | 0.51 | (c)(n) | | | 4.15 | | | | 1.96 | | | | 3.47 | | | | 0.67 | | | | 6.80 | |
Ratios (%) (to average net assets)
and Supplemental data: | | | | | | | | | | | | | | | | | | | | | |
Expenses before expense reductions (f) | | | 0.60 | (a)(c) | | | 0.64 | | | | 0.64 | | | | 0.65 | | | | 0.68 | | | | 0.71 | |
Expenses after expense reductions (f) | | | N/A | | | | N/A | | | | N/A | | | | 0.65 | | | | 0.68 | | | | 0.71 | |
Net investment income | | | 2.12 | (a)(c) | | | 2.16 | | | | 2.22 | | | | 2.66 | | | | 2.99 | | | | 3.30 | |
Portfolio turnover | | | 36 | (n) | | | 19 | | | | 31 | | | | 25 | | | | 30 | | | | 29 | |
Net assets at end of period
(000 omitted) | | | $542,403 | | | | $565,316 | | | | $594,492 | | | | $641,942 | | | | $679,162 | | | | $735,110 | |
21
Financial Highlights – continued
| (c) | Amount reflects a one-time reimbursement of expenses by the custodian (or former custodian) without which net investment income and performance would be lower and expenses would be higher. See Note 2 in the Notes to Financial Statements for additional information. |
| (d) | Per share data is based on average shares outstanding. |
| (f) | Ratios do not reflect reductions from fees paid indirectly, if applicable. |
| (j) | Total return at net asset value is calculated using the net asset value of the fund, not the publicly traded price and therefore may be different than the total return at market value. |
| (r) | Certain expenses have been reduced without which performance would have been lower. |
| (s) | From time to time the fund may receive proceeds from litigation settlements, without which performance would be lower. |
| (w) | Per share amount was less than $0.01. |
| (x) | The net asset values and total returns at net asset value have been calculated on net assets which include adjustments made in accordance with U.S. generally accepted accounting principles required at period end for financial reporting purposes. |
See Notes to Financial Statements
22
NOTES TO FINANCIAL STATEMENTS
(unaudited)
(1) Business and Organization
MFS Intermediate Income Trust (the fund) is organized as a Massachusetts business trust and is registered under the Investment Company Act of 1940, as amended, as a diversified closed-end management investment company.
The fund is an investment company and accordingly follows the investment company accounting and reporting guidance of the Financial Accounting Standards Board (FASB) Accounting Standards Codification Topic 946 Financial Services – Investment Companies.
(2) Significant Accounting Policies
General – The preparation of financial statements in conformity with U.S. generally accepted accounting principles requires management to make estimates and assumptions that affect the reported amounts of assets and liabilities, and disclosure of contingent assets and liabilities at the date of the financial statements and the reported amounts of increases and decreases in net assets from operations during the reporting period. Actual results could differ from those estimates. In the preparation of these financial statements, management has evaluated subsequent events occurring after the date of the fund’s Statement of Assets and Liabilities through the date that the financial statements were issued. The fund invests in foreign securities. Investments in foreign securities are vulnerable to the effects of changes in the relative values of the local currency and the U.S. dollar and to the effects of changes in each country’s legal, political, and economic environment.
In October 2016, the Securities and Exchange Commission (SEC) released its Final Rule on Investment Company Reporting Modernization (the “Rule”). The Rule, which introduces two new regulatory reporting forms for investment companies – Form N-PORT and Form N-CEN – also contains amendments to Regulation S-X which impact financial statement presentation, particularly the presentation of derivative investments. Although still evaluating the impacts of the Rule, management believes that many of the Regulation S-X amendments are consistent with the fund’s current financial statement presentation and expects that the fund will be able to comply with the Rule’s Regulation S-X amendments by the August 1, 2017 compliance date.
In March 2017, FASB issued Accounting Standards Update 2017-08, Receivables – Nonrefundable Fees and Other Costs (Subtopic 310-20) – Premium Amortization on Purchased Callable Debt Securities (“ASU 2017-08”). For entities that hold callable debt securities at a premium, ASU 2017-08 requires that the premium be amortized to the earliest call date. ASU 2017-08 will be effective for fiscal years beginning after December 15, 2018, and interim periods within those fiscal years. Management is still evaluating the potential impacts of ASU 2017-08 but believes that adoption of ASU 2017-08 will not have a material effect on the fund’s overall financial position or its overall results of operations.
Balance Sheet Offsetting – The fund’s accounting policy with respect to balance sheet offsetting is that, absent an event of default by the counterparty or a termination of the agreement, the International Swaps and Derivatives Association (ISDA) Master Agreement does not result in an offset of reported amounts of financial assets and
23
Notes to Financial Statements (unaudited) – continued
financial liabilities in the Statement of Assets and Liabilities across transactions between the fund and the applicable counterparty. The fund’s right to setoff may be restricted or prohibited by the bankruptcy or insolvency laws of the particular jurisdiction to which a specific master netting agreement counterparty is subject. Balance sheet offsetting disclosures, to the extent applicable to the fund, have been included in the fund’s Significant Accounting Policies note under the captions for each of the fund’s in-scope financial instruments and transactions.
Investment Valuations – Debt instruments and floating rate loans, including restricted debt instruments, are generally valued at an evaluated or composite bid as provided by a third-party pricing service. Short-term instruments with a maturity at issuance of 60 days or less may be valued at amortized cost, which approximates market value. Futures contracts are generally valued at last posted settlement price on their primary exchange as provided by a third-party pricing service. Futures contracts for which there were no trades that day for a particular position are generally valued at the closing bid quotation on their primary exchange as provided by a third-party pricing service. Forward foreign currency exchange contracts are generally valued at the mean of bid and asked prices for the time period interpolated from rates provided by a third-party pricing service for proximate time periods. Open-end investment companies are generally valued at net asset value per share. Securities and other assets generally valued on the basis of information from a third-party pricing service may also be valued at a broker/dealer bid quotation. Values obtained from third-party pricing services can utilize both transaction data and market information such as yield, quality, coupon rate, maturity, type of issue, trading characteristics, and other market data. The values of foreign securities and other assets and liabilities expressed in foreign currencies are converted to U.S. dollars using the mean of bid and asked prices for rates provided by a third-party pricing service.
The Board of Trustees has delegated primary responsibility for determining or causing to be determined the value of the fund’s investments (including any fair valuation) to the adviser pursuant to valuation policies and procedures approved by the Board. If the adviser determines that reliable market quotations are not readily available, investments are valued at fair value as determined in good faith by the adviser in accordance with such procedures under the oversight of the Board of Trustees. Under the fund’s valuation policies and procedures, market quotations are not considered to be readily available for most types of debt instruments and floating rate loans and many types of derivatives. These investments are generally valued at fair value based on information from third-party pricing services. In addition, investments may be valued at fair value if the adviser determines that an investment’s value has been materially affected by events occurring after the close of the exchange or market on which the investment is principally traded (such as foreign exchange or market) and prior to the determination of the fund’s net asset value, or after the halting of trading of a specific security where trading does not resume prior to the close of the exchange or market on which the security is principally traded. The adviser generally relies on third-party pricing services or other information (such as the correlation with price movements of similar securities in the same or other markets; the type, cost and investment characteristics of the security; the business and financial condition of the issuer; and trading and other market data) to assist in determining whether to fair value and at what value to fair
24
Notes to Financial Statements (unaudited) – continued
value an investment. The value of an investment for purposes of calculating the fund’s net asset value can differ depending on the source and method used to determine value. When fair valuation is used, the value of an investment used to determine the fund’s net asset value may differ from quoted or published prices for the same investment. There can be no assurance that the fund could obtain the fair value assigned to an investment if it were to sell the investment at the same time at which the fund determines its net asset value per share.
Various inputs are used in determining the value of the fund’s assets or liabilities. These inputs are categorized into three broad levels. In certain cases, the inputs used to measure fair value may fall into different levels of the fair value hierarchy. In such cases, an investment’s level within the fair value hierarchy is based on the lowest level of input that is significant to the fair value measurement. The fund’s assessment of the significance of a particular input to the fair value measurement in its entirety requires judgment, and considers factors specific to the investment. Level 1 includes unadjusted quoted prices in active markets for identical assets or liabilities. Level 2 includes other significant observable market-based inputs (including quoted prices for similar securities, interest rates, prepayment speed, and credit risk). Level 3 includes unobservable inputs, which may include the adviser’s own assumptions in determining the fair value of investments. Other financial instruments are derivative instruments not reflected in total investments, such as futures contracts and forward foreign currency exchange contracts. The following is a summary of the levels used as of April 30, 2017 in valuing the fund’s assets or liabilities:
| | | | | | | | | | | | | | | | |
| Investments at Value | | Level 1 | | | Level 2 | | | Level 3 | | | Total | |
| U.S. Treasury Bonds & U.S. Government Agency & Equivalents | | | $— | | | | $113,581,549 | | | | $— | | | | $113,581,549 | |
| Non-U.S. Sovereign Debt | | | — | | | | 93,308,820 | | | | — | | | | 93,308,820 | |
| U.S. Corporate Bonds | | | — | | | | 181,098,135 | | | | — | | | | 181,098,135 | |
| Residential Mortgage-Backed Securities | | | — | | | | 12,391,512 | | | | — | | | | 12,391,512 | |
| Commercial Mortgage-Backed Securities | | | — | | | | 1,430,663 | | | | — | | | | 1,430,663 | |
| Asset-Backed Securities (including CDOs) | | | — | | | | 31,143,708 | | | | — | | | | 31,143,708 | |
| Foreign Bonds | | | — | | | | 77,471,212 | | | | — | | | | 77,471,212 | |
| Mutual Funds | | | 21,439,629 | | | | — | | | | — | | | | 21,439,629 | |
| Short-Term Securities | | | — | | | | 5,005,568 | | | | — | | | | 5,005,568 | |
| Total Investments | | | $21,439,629 | | | | $515,431,167 | | | | $— | | | | $536,870,796 | |
| | | | |
| Other Financial Instruments | | | | | | | | | | | | |
| Futures Contracts – Assets | | | $568,966 | | | | $— | | | | $— | | | | $568,966 | |
| Forward Foreign Currency Exchange Contracts – Assets | | | — | | | | 124,318 | | | | — | | | | $124,318 | |
| Forward Foreign Currency Exchange Contracts – Liabilities | | | — | | | | (1,957,731 | ) | | | — | | | | (1,957,731 | ) |
For further information regarding security characteristics, see the Portfolio of Investments.
Foreign Currency Translation – Purchases and sales of foreign investments, income, and expenses are converted into U.S. dollars based upon currency exchange rates prevailing on the respective dates of such transactions or on the reporting date for
25
Notes to Financial Statements (unaudited) – continued
foreign denominated receivables and payables. Gains and losses attributable to foreign currency exchange rates on sales of securities are recorded for financial statement purposes as net realized gains and losses on investments. Gains and losses attributable to foreign exchange rate movements on receivables, payables, income and expenses are recorded for financial statement purposes as foreign currency transaction gains and losses. That portion of both realized and unrealized gains and losses on investments that results from fluctuations in foreign currency exchange rates is not separately disclosed.
Derivatives – The fund uses derivatives for different purposes, primarily to increase or decrease exposure to a particular market or segment of the market, or security, to increase or decrease interest rate or currency exposure, or as alternatives to direct investments. Derivatives are used for hedging or non-hedging purposes. While hedging can reduce or eliminate losses, it can also reduce or eliminate gains. When the fund uses derivatives as an investment to increase market exposure, or for hedging purposes, gains and losses from derivative instruments may be substantially greater than the derivative’s original cost.
The derivative instruments used by the fund were futures contracts and forward foreign currency exchange contracts. The fund’s period end derivatives, as presented in the Portfolio of Investments and the associated Derivative Contract tables, generally are indicative of the volume of its derivative activity during the period.
The following table presents, by major type of derivative contract, the fair value, on a gross basis, of the asset and liability components of derivatives held by the fund at April 30, 2017 as reported in the Statement of Assets and Liabilities:
| | | | | | | | | | |
| | | | | Fair Value (a) | |
| Risk | | Derivative Contracts | | Asset Derivatives | | | Liability Derivatives | |
| Interest Rate | | Interest Rate Futures | | | $568,966 | | | | $— | |
| Foreign Exchange | | Forward Foreign Currency Exchange | | | 124,318 | | | | (1,957,731 | ) |
| Total | | | | | $693,284 | | | | $(1,957,731 | ) |
| (a) | The value of futures contracts includes cumulative appreciation (depreciation) as reported in the fund’s Portfolio of Investments. Only the current day net variation margin for futures contracts is separately reported within the fund’s Statement of Assets and Liabilities. |
The following table presents, by major type of derivative contract, the realized gain (loss) on derivatives held by the fund for the six months ended April 30, 2017 as reported in the Statement of Operations:
| | | | | | | | |
| Risk | | Futures
Contracts | | | Foreign
Currency | |
| Interest Rate | | | $(2,798,298 | ) | | | $— | |
| Foreign Exchange | | | — | | | | 4,644,242 | |
| Total | | | $(2,798,298 | ) | | | $4,644,242 | |
26
Notes to Financial Statements (unaudited) – continued
The following table presents, by major type of derivative contract, the change in unrealized appreciation (depreciation) on derivatives held by the fund for the six months ended April 30, 2017 as reported in the Statement of Operations:
| | | | | | | | |
| Risk | | Futures
Contracts | | | Translation of Assets
and Liabilities in Foreign
Currencies | |
| Interest Rate | | | $1,351,743 | | | | $— | |
| Foreign Exchange | | | — | | | | (4,206,128 | ) |
| Total | | | $1,351,743 | | | | $(4,206,128 | ) |
Derivative counterparty credit risk is managed through formal evaluation of the creditworthiness of all potential counterparties. On certain, but not all, uncleared derivatives, the fund attempts to reduce its exposure to counterparty credit risk whenever possible by entering into an ISDA Master Agreement on a bilateral basis. The ISDA Master Agreement gives each party to the agreement the right to terminate all transactions traded under such agreement if there is a certain deterioration in the credit quality of the other party. Upon an event of default or a termination of the ISDA Master Agreement, the non-defaulting party has the right to close out all transactions traded under such agreement and to net amounts owed under each agreement to one net amount payable by one party to the other. This right to close out and net payments across all transactions traded under the ISDA Master Agreement could result in a reduction of the fund’s credit risk to such counterparty equal to any amounts payable by the fund under the applicable transactions, if any.
Collateral and margin requirements differ by type of derivative. Margin requirements are set by the clearing broker and the clearing house for cleared derivatives (e.g., futures contracts, cleared swaps, and exchange-traded options) while collateral terms are contract specific for uncleared derivatives (e.g., forward foreign currency exchange contracts, uncleared swap agreements, and uncleared options). For derivatives traded under an ISDA Master Agreement, which contains a collateral support annex, the collateral requirements are netted across all transactions traded under such agreement and one amount is posted from one party to the other to collateralize such obligations. Cash that has been segregated to cover the fund’s collateral or margin obligations under derivative contracts, if any, will be reported separately in the Statement of Assets and Liabilities as “Restricted cash” or “Deposits with brokers.” Securities pledged as collateral or margin for the same purpose, if any, are noted in the Portfolio of Investments. The fund may be required to make payments of interest on uncovered collateral or margin obligations with the broker. Any such payments are included in “Miscellaneous” expense in the Statement of Operations.
Futures Contracts – The fund entered into futures contracts which may be used to hedge against or obtain broad market exposure, interest rate exposure, currency exposure, or to manage duration. A futures contract represents a commitment for the future purchase or sale of an asset at a specified price on a specified date.
27
Notes to Financial Statements (unaudited) – continued
Upon entering into a futures contract, the fund is required to deposit with the broker, either in cash or securities, an initial margin in an amount equal to a certain percentage of the notional amount of the contract. Subsequent payments (variation margin) are made or received by the fund each day, depending on the daily fluctuations in the value of the contract, and are recorded for financial statement purposes as unrealized gain or loss by the fund until the contract is closed or expires at which point the gain or loss on futures contracts is realized.
The fund bears the risk of interest rates, exchange rates or securities prices moving unexpectedly, in which case, the fund may not achieve the anticipated benefits of the futures contracts and may realize a loss. While futures contracts may present less counterparty risk to the fund since the contracts are exchange traded and the exchange’s clearinghouse guarantees payments to the broker, there is still counterparty credit risk due to the insolvency of the broker. The fund’s maximum risk of loss due to counterparty credit risk is equal to the margin posted by the fund to the broker plus any gains or minus any losses on the outstanding futures contracts.
Forward Foreign Currency Exchange Contracts – The fund entered into forward foreign currency exchange contracts for the purchase or sale of a specific foreign currency at a fixed price on a future date. These contracts may be used to hedge the fund’s currency risk or for non-hedging purposes. For hedging purposes, the fund may enter into contracts to deliver or receive foreign currency that the fund will receive from or use in its normal investment activities. The fund may also use contracts to hedge against declines in the value of foreign currency denominated securities due to unfavorable exchange rate movements. For non-hedging purposes, the fund may enter into contracts with the intent of changing the relative exposure of the fund’s portfolio of securities to different currencies to take advantage of anticipated exchange rate changes.
Forward foreign currency exchange contracts are adjusted by the daily exchange rate of the underlying currency and any unrealized gains or losses are recorded as a receivable or payable for forward foreign currency exchange contracts until the contract settlement date. On contract settlement date, any gain or loss on the contract is recorded as realized gains or losses on foreign currency.
Risks may arise upon entering into these contracts from unanticipated movements in the value of the contract and from the potential inability of counterparties to meet the terms of their contracts. Generally, the fund’s maximum risk due to counterparty credit risk is the unrealized gain on the contract due to the use of Continuous Linked Settlement, a multicurrency cash settlement system for the centralized settlement of foreign transactions. This risk is mitigated in cases where there is an ISDA Master Agreement between the fund and the counterparty providing for netting as described above and, where applicable, by the posting of collateral by the counterparty to the fund to cover the fund’s exposure to the counterparty under such ISDA Master Agreement.
Indemnifications – Under the fund’s organizational documents, its officers and Trustees may be indemnified against certain liabilities and expenses arising out of the performance of their duties to the fund. Additionally, in the normal course of business, the fund enters into agreements with service providers that may contain
28
Notes to Financial Statements (unaudited) – continued
indemnification clauses. The fund’s maximum exposure under these agreements is unknown as this would involve future claims that may be made against the fund that have not yet occurred.
Investment Transactions and Income – Investment transactions are recorded on the trade date. Interest income is recorded on the accrual basis. All premium and discount is amortized or accreted for financial statement purposes in accordance with U.S. generally accepted accounting principles. Interest payments received in additional securities are recorded on the ex-interest date in an amount equal to the value of the security on such date.
The fund may receive proceeds from litigation settlements. Any proceeds received from litigation involving portfolio holdings are reflected in the Statement of Operations in realized gain/loss if the security has been disposed of by the fund or in unrealized gain/loss if the security is still held by the fund. Any other proceeds from litigation not related to portfolio holdings are reflected as other income in the Statement of Operations.
The fund invests a significant portion of its assets in asset-backed and/or mortgage-backed securities. The value of these securities may depend, in part, on the issuer’s or borrower’s credit quality or ability to pay principal and interest when due and that value may fall if an issuer or borrower defaults on its obligation to pay principal or interest or if the instrument’s credit rating is downgraded by a credit rating agency. U.S. Government securities not supported as to the payment of principal or interest by the U.S. Treasury, such as those issued by Fannie Mae, Freddie Mac, and the Federal Home Loan Banks, are subject to greater credit risk than are U.S. Government securities supported by the U.S. Treasury, such as those issued by Ginnie Mae.
The fund purchased or sold debt securities on a when-issued or delayed delivery basis, or in a “To Be Announced” (TBA) or “forward commitment” transaction with delivery or payment to occur at a later date beyond the normal settlement period. At the time a fund enters into a commitment to purchase or sell a security, the transaction is recorded and the value of the security acquired is reflected in the fund’s net asset value. The price of such security and the date that the security will be delivered and paid for are fixed at the time the transaction is negotiated. The value of the security may vary with market fluctuations. No interest accrues to the fund until payment takes place. At the time that a fund enters into this type of transaction, the fund is required to have sufficient cash and/or liquid securities to cover its commitments. Losses may arise due to changes in the value of the underlying securities or if the counterparty does not perform under the contract’s terms, or if the issuer does not issue the securities due to political, economic or other factors. Additionally, losses may arise due to declines in the value of the securities prior to settlement date.
To mitigate this risk of loss on TBA securities and other types of forward settling mortgage-backed securities, the fund whenever possible enters into a Master Securities Forward Transaction Agreement (“MSFTA”) on a bilateral basis with each of the counterparties with whom it undertakes a significant volume of transactions. The MSFTA gives each party to the agreement the right to terminate all transactions traded under such agreement if there is a certain deterioration in the credit quality of the other party. Upon an event of default or a termination of the MSFTA, the non-defaulting party has the right
29
Notes to Financial Statements (unaudited) – continued
to close out all transactions traded under such agreement and to net amounts owed under each transaction to one net amount payable by one party to the other. This right to close out and net payments across all transactions traded under the MSFTA could result in a reduction of the fund’s credit risk to such counterparty equal to any amounts payable by the fund under the applicable transactions, if any.
For mortgage-backed securities traded under a MSFTA, the collateral and margining requirements are contract specific. Collateral amounts across all transactions traded under such agreement are netted and one amount is posted from one party to the other to collateralize such obligations. Cash that has been pledged to cover the fund’s collateral or margin obligations under a MSFTA, if any, will be reported separately on the Statement of Assets and Liabilities as restricted cash. Securities pledged as collateral or margin for the same purpose, if any, are noted in the Portfolio of Investments.
Reimbursement of Expenses by Custodian – In December 2015, the fund’s custodian (or former custodian), State Street Bank and Trust Company, announced that it intended to reimburse its asset servicing clients for expense amounts that it billed in error during the period 1998 through 2015. The amount of this one-time reimbursement attributable to the fund is reflected as “Reimbursement of custodian expenses” in the Statement of Operations.
Tax Matters and Distributions – The fund intends to qualify as a regulated investment company, as defined under Subchapter M of the Internal Revenue Code, and to distribute all of its taxable income, including realized capital gains. As a result, no provision for federal income tax is required. The fund’s federal tax returns, when filed, will remain subject to examination by the Internal Revenue Service for a three year period. Management has analyzed the fund’s tax positions taken on federal and state tax returns for all open tax years and does not believe that there are any uncertain tax positions that require recognition of a tax liability. Foreign taxes, if any, have been accrued by the fund in the accompanying financial statements in accordance with the applicable foreign tax law. Foreign income taxes may be withheld by certain countries in which the fund invests. Additionally, capital gains realized by the fund on securities issued in or by certain foreign countries may be subject to capital gains tax imposed by those countries.
Distributions to shareholders are recorded on the ex-dividend date. The fund seeks to pay monthly distributions based on an annual rate of 8.5% of the fund’s average monthly net asset value. As a result, distributions may exceed actual earnings which may result in a tax return of capital or, to the extent the fund has long-term gains, distributions of current year long-term gains may be recharacterized as ordinary income. Income and capital gain distributions are determined in accordance with income tax regulations, which may differ from U.S. generally accepted accounting principles. Certain capital accounts in the financial statements are periodically adjusted for permanent differences in order to reflect their tax character. These adjustments have no impact on net assets or net asset value per share. Temporary differences which arise from recognizing certain items of income, expense, gain or loss in different periods for financial statement and tax purposes will reverse at some time in the future.
30
Notes to Financial Statements (unaudited) – continued
Book/tax differences primarily relate to expiration of capital loss carryforwards, amortization and accretion of debt securities, straddle loss deferrals, and derivative transactions.
For the six months ended April 30, 2017, the amount of distributions estimated to be a tax return of capital was approximately $16,404,893 which are reported as distributions from other sources in the Statements of Changes in Net Assets. The tax character of distributions made during the current period will be determined at fiscal year end. The tax character of distributions declared to shareholders for the last fiscal year is as follows:
| | | | |
| | | 10/31/16 | |
Ordinary income (including any
short-term capital gains) (a) | | | $9,585,719 | |
| Tax return of capital (b) | | | 39,950,442 | |
| Total distributions | | | $49,536,161 | |
| (a) | Included in the fund’s distributions from ordinary income for the year ended October 31, 2016 is $373,256 in excess of investment company taxable income which, in accordance with applicable U.S. tax law, is taxable to shareholders as ordinary income distributions. |
| (b) | Distributions in excess of tax basis earnings and profits are reported in the financial statements as a tax return of capital. |
The federal tax cost and the tax basis components of distributable earnings were as follows:
| | | | |
| As of 4/30/17 | | | |
| Cost of investments | | | $542,256,348 | |
| Gross appreciation | | | 8,194,081 | |
| Gross depreciation | | | (13,579,633 | ) |
| Net unrealized appreciation (depreciation) | | | $(5,385,552 | ) |
| |
| As of 10/31/16 | | | |
| Other temporary differences | | | (735,105 | ) |
| Net unrealized appreciation (depreciation) | | | 957,850 | |
The aggregate cost above includes prior fiscal year end tax adjustments, if applicable.
(3) Transactions with Affiliates
Investment Adviser – The fund has an investment advisory agreement with MFS to provide overall investment management and related administrative services and facilities to the fund. The management fee is computed daily and paid monthly at an annual rate of 0.32% of the fund’s average daily net assets and 5.65% of gross income. Gross income is calculated based on tax elections that generally include the accretion of discount and exclude the amortization of premium, which may differ from investment income reported in the Statement of Operations. MFS has agreed to reduce its management fee to the lesser of the contractual management fee as set forth above or 0.85% of the fund’s average daily net assets. This written agreement will continue until modified by the fund’s Board of Trustees, but such agreement will continue at least until October 31, 2017. For the six months ended April 30, 2017, the fund’s average daily net assets and gross income fees did not meet the thresholds required to
31
Notes to Financial Statements (unaudited) – continued
waive the management fee under this agreement. The management fee, from net assets and gross income, incurred for the six months ended April 30, 2017 was equivalent to an annual effective rate of 0.49% of the fund’s average daily net assets.
Transfer Agent – The fund engages Computershare Trust Company, N.A. (“Computershare”) as the sole transfer agent for the fund. MFS Service Center, Inc. (MFSC) monitors and supervises the activities of Computershare for an agreed upon fee approved by the Board of Trustees. For the six months ended April 30, 2017, these fees paid to MFSC amounted to $15,530.
Administrator – MFS provides certain financial, legal, shareholder communications, compliance, and other administrative services to the fund. Under an administrative services agreement, the fund reimburses MFS the costs incurred to provide these services. The fund is charged an annual fixed amount of $17,500 plus a fee based on average daily net assets. The administrative services fee incurred for the six months ended April 30, 2017 was equivalent to an annual effective rate of 0.0174% of the fund’s average daily net assets.
Trustees’ and Officers’ Compensation – The fund pays compensation to independent Trustees in the form of a retainer, attendance fees, and additional compensation to Board and Committee chairpersons. The fund does not pay compensation directly to Trustees or officers of the fund who are also officers of the investment adviser, all of whom receive remuneration for their services to the fund from MFS. Certain officers and Trustees of the fund are officers or directors of MFS and MFSC.
Prior to December 31, 2001, the fund had an unfunded defined benefit plan (“DB plan”) for independent Trustees. As of December 31, 2001, the Board took action to terminate the DB plan with respect to then-current and any future independent Trustees, such that the DB plan covers only certain of those former independent Trustees who retired on or before December 31, 2001. The DB plan resulted in a pension expense of $1,824 and is included in “Independent Trustees’ compensation” in the Statement of Operations for the six months ended April 30, 2017. The liability for deferred retirement benefits payable to certain independent Trustees under the DB plan amounted to $23,820 at April 30, 2017, and is included in “Payable for independent Trustees’ compensation” in the Statement of Assets and Liabilities.
Other – This fund and certain other funds managed by MFS (the funds) have entered into a service agreement (the ISO Agreement) which provides for payment of fees solely by the funds to Tarantino LLC in return for the provision of services of an Independent Senior Officer (ISO) for the funds. Frank L. Tarantino serves as the ISO and is an officer of the funds and the sole member of Tarantino LLC. The funds can terminate the ISO Agreement with Tarantino LLC at any time under the terms of the ISO Agreement. For the six months ended April 30, 2017, the fee paid by the fund under this agreement was $524 and is included in “Miscellaneous” expense in the Statement of Operations. MFS has agreed to bear all expenses associated with office space, other administrative support, and supplies provided to the ISO.
The fund invests in the MFS Institutional Money Market Portfolio which is managed by MFS and seeks current income consistent with preservation of capital and liquidity. This money market fund does not pay a management fee to MFS.
32
Notes to Financial Statements (unaudited) – continued
(4) Portfolio Securities
For the six months ended April 30, 2017, purchases and sales of investments, other than short-term obligations, were as follows:
| | | | | | | | |
| | | Purchases | | | Sales | |
| U.S. Government securities | | | $103,499,707 | | | | $1,673,192 | |
| Investments (non-U.S. Government securities) | | | $84,923,576 | | | | $207,638,539 | |
(5) Shares of Beneficial Interest
The fund’s Declaration of Trust permits the Trustees to issue an unlimited number of full and fractional shares of beneficial interest. The Trustees have authorized the repurchase by the fund of up to 10% annually of its own shares of beneficial interest. During the six months ended April 30, 2017, there were no transactions in fund shares. The fund repurchased and retired 5,900 shares of beneficial interest during the year ended October 31, 2016 at an average price per share of $4.44 and a weighted average discount of 7.50% per share. Transactions in fund shares were as follows:
| | | | | | | | | | | | | | | | |
| | | Six months ended
April 30, 2017 | | | Year ended
October 31, 2016 | |
| | | Shares | | | Amount | | | Shares | | | Amount | |
| Capital shares reacquired | | | — | | | | $— | | | | (5,900 | ) | | | $(26,196 | ) |
(6) Line of Credit
The fund and certain other funds managed by MFS participate in a $1.25 billion unsecured committed line of credit, subject to a $1 billion sublimit, provided by a syndication of banks under a credit agreement. Borrowings may be made for temporary financing needs. Interest is charged to each fund, based on its borrowings, generally at a rate equal to the higher of the Overnight Federal Reserve funds rate or daily one month LIBOR plus an agreed upon spread. A commitment fee, based on the average daily, unused portion of the committed line of credit, is allocated among the participating funds at the end of each calendar quarter. In addition, the fund and other funds managed by MFS have established unsecured uncommitted borrowing arrangements with certain banks for temporary financing needs. Interest is charged to each fund, based on its borrowings, at a rate equal to the Overnight Federal Reserve funds rate plus an agreed upon spread. For the six months ended April 30, 2017, the fund’s commitment fee and interest expense were $2,024 and $0, respectively, and are included in “Miscellaneous” expense in the Statement of Operations.
33
Notes to Financial Statements (unaudited) – continued
(7) Transactions in Underlying Affiliated Funds-Affiliated Issuers
An affiliated issuer may be considered one in which the fund owns 5% or more of the outstanding voting securities, or a company which is under common control. For the purposes of this report, the fund assumes the following to be an affiliated issuer:
| | | | | | | | | | | | | | | | |
| Underlying Affiliated Fund | | Beginning
Shares/Par
Amount | | | Acquisitions
Shares/Par
Amount | | | Dispositions
Shares/Par
Amount | | | Ending
Shares/Par
Amount | |
MFS Institutional Money
Market Portfolio | | | 9,232,328 | | | | 168,047,275 | | | | (155,839,974 | ) | | | 21,439,629 | |
| | | | |
| Underlying Affiliated Fund | | Realized
Gain (Loss) | | | Capital Gain
Distributions | | | Dividend
Income | | | Ending
Value | |
MFS Institutional Money
Market Portfolio | | | $(2,115 | ) | | | $— | | | | $62,958 | | | | $21,439,629 | |
34
REPORT OF INDEPENDENT REGISTERED PUBLIC ACCOUNTING FIRM
To the Trustees and Shareholders of MFS Intermediate Income Trust:
We have reviewed the accompanying statement of assets and liabilities of MFS Intermediate Income Trust (the “Fund”), including the portfolio of investments, as of April 30, 2017, and the related statements of operations and changes in net assets, and financial highlights for the six-month period ended April 30, 2017. These interim financial statements and financial highlights are the responsibility of the Fund’s management.
We conducted our review in accordance with the standards of the Public Company Accounting Oversight Board (United States). A review of interim financial information consists principally of applying analytical procedures and making inquiries of persons responsible for financial and accounting matters. It is substantially less in scope than an audit conducted in accordance with the standards of the Public Company Accounting Oversight Board (United States), the objective of which is the expression of an opinion regarding the financial statements taken as a whole. Accordingly, we do not express such an opinion.
Based on our review, we are not aware of any material modifications that should be made to the accompanying interim financial statements and financial highlights referred to above for them to be in conformity with accounting principles generally accepted in the United States of America.
We have previously audited, in accordance with the standards of the Public Company Accounting Oversight Board (United States), the statement of changes in net assets for the year ended October 31, 2016, and the financial highlights for each of the five years in the period ended October 31, 2016, and in our report dated December 15, 2016, we expressed an unqualified opinion on such statement of changes in net assets and financial highlights.
DELOITTE & TOUCHE LLP
Boston, Massachusetts
June 16, 2017
35
PROXY VOTING POLICIES AND INFORMATION
MFS votes proxies on behalf of the fund pursuant to proxy voting policies and procedures that are available without charge, upon request, by calling 1-800-225-2606, by visiting mfs.com (once you have selected “Individual Investor” as your role, click on “Individual Investor Home” in the top navigation and then select “Learn More About Proxy Voting” under the “I want to…” header on the left hand column of the page), or by visiting the SEC’s Web site at http://www.sec.gov.
Information regarding how the fund voted proxies relating to portfolio securities during the most recent twelve-month period ended June 30 is available by August 31 of each year without charge by visiting mfs.com (once you have selected “Individual Investor” as your role, click on “Individual Investor Home” in the top navigation and then select “Learn More About Proxy Voting” under the “I want to…” header on the left hand column of the page), or by visiting the SEC’s Web site at http://www.sec.gov.
QUARTERLY PORTFOLIO DISCLOSURE
The fund will file a complete schedule of portfolio holdings with the Securities and Exchange Commission (the Commission) for the first and third quarters of each fiscal year on Form N-Q. A shareholder can obtain the quarterly portfolio holdings report at mfs.com. The fund’s Form N-Q is also available on the EDGAR database on the Commission’s Internet Web site at http://www.sec.gov, and may be reviewed and copied at the:
Public Reference Room
Securities and Exchange Commission
100 F Street, NE, Room 1580
Washington, D.C. 20549
Information on the operation of the Public Reference Room may be obtained by calling the Commission at 1-800-SEC-0330. Copies of the fund’s Form N-Q also may be obtained, upon payment of a duplicating fee, by electronic request at the following e-mail address: publicinfo@sec.gov or by writing the Public Reference Section at the above address.
FURTHER INFORMATION
From time to time, MFS may post important information about the fund or the MFS funds on the MFS web site (mfs.com). This information is available by visiting the “Market Commentary” and “Announcements” sub sections in the “Market Outlooks” section of mfs.com or by clicking on the fund’s name under “Closed-End Funds” in the “Products” section of mfs.com.
Additional information about the fund (e.g. performance, dividends and the fund’s price history) is also available by clicking on the fund’s name under “Closed-End Funds” in the “Products” section of mfs.com.
36
INFORMATION ABOUT FUND CONTRACTS AND LEGAL CLAIMS
The fund has entered into contractual arrangements with an investment adviser, administrator, transfer agent, and custodian who each provide services to the fund. Unless expressly stated otherwise, shareholders are not parties to, or intended beneficiaries of these contractual arrangements, and these contractual arrangements are not intended to create any shareholder right to enforce them against the service providers or to seek any remedy under them against the service providers, either directly or on behalf of the fund.
Under the Trust’s By-Laws and Declaration of Trust, any claims asserted against or on behalf of the MFS Funds, including claims against Trustees and Officers, must be brought in state and federal courts located within the Commonwealth of Massachusetts.
37
CONTACT US
TRANSFER AGENT, REGISTRAR, AND
DIVIDEND DISBURSING AGENT
CALL
1-800-637-2304
9 a.m. to 5 p.m. Eastern time
WRITE
Computershare Trust Company, N.A.
P.O. Box 43078
Providence, RI 02940-3078
New York Stock Exchange Symbol: MIN
Effective January 1, 2017, the Code of Ethics (the “Code”) was amended to (i) clarify that the term “for profit” company as used in Section II.B of the Code excludes the investment adviser and its subsidiaries and pooled investment vehicles sponsored by the investment adviser or its subsidiaries, (ii) align the Code’s provisions regarding receipt of gifts and entertainment in Section II.B of the Code with the gifts and entertainment policy of the Funds’ investment adviser, and (iii) make other administrative changes. During the period covered by this report, the Registrant did not grant a waiver, including an implicit waiver, from any provision of the Code.
A copy of the amended Code effective as of January 1, 2017 is filed as an exhibit to this Form N-CSR.
| ITEM 3. | AUDIT COMMITTEE FINANCIAL EXPERT. |
Not applicable for semi-annual reports.
| ITEM 4. | PRINCIPAL ACCOUNTANT FEES AND SERVICES. |
Not applicable for semi-annual reports.
| ITEM 5. | AUDIT COMMITTEE OF LISTED REGISTRANTS. |
Not applicable for semi-annual reports.
| ITEM 6. | SCHEDULE OF INVESTMENTS |
A schedule of investments for MFS Intermediate Income Trust is included as part of the report to shareholders under Item 1 of this Form N-CSR.
| ITEM 7. | DISCLOSURE OF PROXY VOTING POLICIES AND PROCEDURES FOR CLOSED-END MANAGEMENT INVESTMENT COMPANIES. |
Not applicable for semi-annual reports.
| ITEM 8. | PORTFOLIO MANAGERS OF CLOSED-END MANAGEMENT INVESTMENT COMPANIES. |
Portfolio Manager(s)
Information regarding the portfolio manager(s) of the MFS Intermediate Income Trust (the “Fund”) is set forth below. Each portfolio manager is primarily responsible for the day-to-day management of the Fund.
As of February 1, 2017, James Calmas was no longer a portfolio manager of the Fund. Geoffrey Schechter and Alexander Mackey became portfolio managers of the Fund on February 1, 2017.
| | | | | | |
Portfolio Manager | | Primary Role | | Since | | Title and Five Year History |
| Geoffrey Schechter | | Lead Portfolio Manager | | February 2017 | | Investment Officer of MFS; employed in the investment area of MFS since 1993 |
| Alexander Mackey | | Investment Grade Debt Instruments Portfolio Manager | | February 2017 | | Investment Officer of MFS; employed in the investment area of MFS since 2001 |
| Erik Weisman | | Sovereign Debt Instruments Portfolio Manager | | 2004 | | Investment Officer of MFS; employed in the investment area of MFS since 2002. |
Compensation
Portfolio manager compensation is reviewed annually. As of December 31, 2016, portfolio manager total cash compensation is a combination of base salary and performance bonus:
Base Salary – Base salary represents a smaller percentage of portfolio manager total cash compensation than performance bonus.
Performance Bonus – Generally, the performance bonus represents more than a majority of portfolio manager total cash compensation.
The performance bonus is based on a combination of quantitative and qualitative factors, generally with more weight given to the former and less weight given to the latter.
The quantitative portion is primarily based on the pre-tax performance of assets managed by the portfolio manager over three- and five-year periods relative to peer group universes and/or indices (“benchmarks”). As of December 31, 2016, the following benchmarks were used to measure the following portfolio manager’s performance for the Fund:
| | | | |
Fund | | Portfolio Manager | | Benchmark(s) |
| MFS Intermediate Income Trust | | Geoffrey Schechter1 | | Bloomberg Barclays Intermediate U.S. Government/Credit Bond Index JPMorgan Global Government Bond Index ex U.S. Hedged |
| | Alexander Mackey1 | | Bloomberg Barclays Intermediate U.S. Government/Credit Bond Index |
| | Erik Weisman | | JPMorgan Global Government Bond Index ex U.S. Hedged |
| 1 | Information is as of February 1, 2017. |
Additional or different benchmarks, including versions and components of indices, custom indices, and linked indices that combine performance of different indices for different portions of the time period, may also be used. Consideration is primarily given to portfolio
performance over three and five years with consideration given to other periods if available. For portfolio managers who have served for more than five years, additional, longer-term performance periods, including the ten-year and since inception periods, are also considered. For portfolio managers who have served for less than three years, additional, shorter-term performance periods, including the one-year period, may also be considered. Emphasis is generally placed on longer performance periods when multiple performance periods are available.
The qualitative portion is based on the results of an annual internal peer review process (conducted by other portfolio managers, analysts, and traders) and management’s assessment of overall portfolio manager contributions to investor relations and the investment process (distinct from fund and other account performance). This performance bonus may be in the form of cash and/or a deferred cash award, at the discretion of management. A deferred cash award is issued for a cash value and becomes payable over a three-year vesting period if the portfolio manager remains in the continuous employ of MFS or its affiliates. During the vesting period, the value of the unfunded deferred cash award will fluctuate as though the portfolio manager had invested the cash value of the award in an MFS Fund(s) selected by the portfolio manager. A selected fund may be, but is not required to be, a fund that is managed by the portfolio manager.
Portfolio managers also typically benefit from the opportunity to participate in the MFS Equity Plan. Equity interests are awarded by management, on a discretionary basis, taking into account tenure at MFS, contribution to the investment process, and other factors.
Finally, portfolio managers also participate in benefit plans (including a defined contribution plan and health and other insurance plans) and programs available generally to other employees of MFS. The percentage such benefits represent of any portfolio manager’s compensation depends upon the length of the individual’s tenure at MFS and salary level, as well as other factors.
Ownership of Fund Shares
The following table shows the dollar range of equity securities of the Fund beneficially owned by the Fund’s portfolio manager(s) as of the Fund’s fiscal year ended October 31, 2016. The following dollar ranges apply:
N. None
A. $1 – $10,000
B. $10,001 – $50,000
C. $50,001 – $100,000
D. $100,001 – $500,000
E. $500,001 – $1,000,000
F. Over $1,000,000
| | |
Name of Portfolio Manager | | Dollar Range of Equity Securities in Fund |
| Geoffrey Schechter1 | | N |
| Alexander Mackey1 | | N |
| Erik Weisman | | N |
| 1 | Messrs. Schechter and Mackey became portfolio managers of the Fund on February 1, 2017. Information is as of April 30, 2017. |
Other Accounts
In addition to the Fund, each portfolio manager of the Fund is named as a portfolio manager of certain other accounts managed or subadvised by MFS or an affiliate. The number and assets of these accounts were as follows as of the Fund’s fiscal year ended October 31, 2016:
| | | | | | | | | | | | | | | | | | | | | | | | |
| | | Registered Investment
Companies* | | | Other Pooled Investment Vehicles | | | Other Accounts | |
Name | | Number of
Accounts | | | Total Assets | | | Number of
Accounts | | | Total Assets | | | Number of
Accounts | | | Total Assets | |
Geoffrey Schechter1 | | | 14 | | | $ | 18.1 billion | | | | 3 | | | $ | 691.7 million | | | | 0 | | | | N/A | |
Alexander Mackey1 | | | 9 | | | $ | 8.3 billion | | | | 3 | | | $ | 1.0 billion | | | | 0 | | | | N/A | |
Erik S. Weisman | | | 8 | | | $ | 6.2 billion | | | | 4 | | | $ | 3.0 billion | | | | 1 | | | $ | 324.0 million | |
| 1 | Messrs. Schechter and Mackey became portfolio managers of the Fund on February 1, 2017. Account information is as of April 30, 2017. |
Advisory fees are not based upon performance of any of the accounts identified in the table above.
Potential Conflicts of Interest
MFS seeks to identify potential conflicts of interest resulting from a portfolio manager’s management of both the Fund and other accounts, and has adopted policies and procedures designed to address such potential conflicts.
The management of multiple funds and accounts (including proprietary accounts) gives rise to conflicts of interest if the funds and accounts have different objectives and strategies, benchmarks, time horizons and fees as a portfolio manager must allocate his or her time and investment ideas across multiple funds and accounts. In certain instances there are securities which are suitable for the Fund’s portfolio as well as for accounts of MFS or its subsidiaries with similar investment objectives. The Fund’s trade allocation policies may give rise to conflicts of interest if the Fund’s orders do not get fully executed or are delayed in getting executed due to being aggregated with those of other accounts of MFS or its subsidiaries. A portfolio manager may execute transactions for another fund or account that may adversely affect the value of the Fund’s investments. Investments selected for funds or accounts other than the Fund may outperform investments selected for the Fund.
When two or more clients are simultaneously engaged in the purchase or sale of the same security, the securities are allocated among clients in a manner believed by MFS to be fair and equitable to each. Allocations may be based on many factors and may not always be pro rata based on assets managed. The allocation methodology could have a detrimental effect on the price or volume of the security as far as the Fund is concerned.
MFS and/or a portfolio manager may have a financial incentive to allocate favorable or limited opportunity investments or structure the timing of investments to favor accounts other than the Fund, for instance, those that pay a higher advisory fee and/or have a performance adjustment and/or include an investment by the portfolio manager.
| ITEM 9. | PURCHASES OF EQUITY SECURITIES BY CLOSED-END MANAGEMENT INVESTMENT COMPANY AND AFFILIATED PURCHASERS. |
MFS Intermediate Income Trust
| | | | | | | | | | | | | | | | |
Period | | (a) Total number
of Shares
Purchased | | | (b)
Average
Price Paid
per Share | | | (c) Total
Number of
Shares
Purchased as
Part of Publicly
Announced
Plans or
Programs | | | (d) Maximum
Number (or
Approximate
Dollar Value) of
Shares that May
Yet Be Purchased
under the Plans
or Programs | |
11/01/16-11/30/16 | | | 0 | | | | N/A | | | | 0 | | | | 11,767,957 | |
12/01/16-12/31/16 | | | 0 | | | | N/A | | | | 0 | | | | 11,767,957 | |
1/01/17-1/31/17 | | | 0 | | | | N/A | | | | 0 | | | | 11,767,957 | |
2/01/17-2/28/17 | | | 0 | | | | N/A | | | | 0 | | | | 11,767,957 | |
3/01/17-3/31/17 | | | 0 | | | | N/A | | | | 0 | | | | 11,767,957 | |
4/01/17-4/30/17 | | | 0 | | | | N/A | | | | 0 | | | | 11,767,957 | |
| | | | | | | | | | | | | | | | |
Total | | | 0 | | | | | | | | 0 | | | | | |
| | | | | | | | | | | | | | | | |
Note: The Board approved procedures to repurchase shares and reviews the results periodically. The notification to shareholders of the program is part of the semi-annual and annual reports sent to shareholders. These annual programs begin on October 1st of each year. The programs conform to the conditions of Rule 10b-18 of the Securities Exchange Act of 1934 and limit the aggregate number of shares that may be purchased in each annual period (October 1 through the following September 30) to 10% of the Registrant’s outstanding shares as of the first day of the plan year (October 1). The aggregate number of shares available for purchase for the October 1, 2016 plan year is 11,773,857.
| ITEM 10. | SUBMISSION OF MATTERS TO A VOTE OF SECURITY HOLDERS. |
There were no material changes to the procedures by which shareholders may send recommendations to the Board for nominees to the Registrant’s Board since the Registrant last provided disclosure as to such procedures in response to the requirements of Item 407 (c)(2)(iv) of Regulation S-K or this Item.
| ITEM 11. | CONTROLS AND PROCEDURES. |
| (a) | Based upon their evaluation of the registrant’s disclosure controls and procedures (as defined in Rule 30a-3(c) under the Investment Company Act of 1940 (the “Act”)) as conducted within 90 days of the filing date of this Form N-CSR, the registrant’s principal financial officer and principal executive officer have concluded that those disclosure controls and procedures provide reasonable assurance that the material information required to be disclosed by the registrant on this report is recorded, processed, summarized and reported within the time periods specified in the Securities and Exchange Commission’s rules and forms. |
| (b) | There were no changes in the registrant’s internal controls over financial reporting (as defined in Rule 30a-3(d) under the Act) that occurred during the second fiscal quarter covered by the report that has materially affected, or is reasonably likely to materially affect, the registrant’s internal control over financial reporting. |
| (a) | File the exhibits listed below as part of this form. Letter or number the exhibits in the sequence indicated. |
| | (1) | Any code of ethics, or amendment thereto, that is the subject of the disclosure required by Item 2, to the extent that the registrant intends to satisfy the Item 2 requirements through filing of an exhibit. Attached hereto. |
| | (2) | A separate certification for each principal executive officer and principal financial officer of the registrant as required by Rule 30a-2(a) under the Act (17 CFR 270.30a-2): Attached hereto. |
| | (3) | Notices to Trust’s common shareholders in accordance with Investment Company Act Section 19(a) and Rule 19a-1. Attached hereto. |
| (b) | If the report is filed under Section 13(a) or 15(d) of the Exchange Act, provide the certifications required by Rule 30a-2(b) under the Act (17 CFR 270.30a-2(b)), Rule 13a-14(b) or Rule 15d-14(b) under the Exchange Act (17 CFR 240.13a-14(b) or 240.15d-14(b)) and Section 1350 of Chapter 63 of Title 18 of the United States Code (18 U.S.C. 1350) as an exhibit. A certification furnished pursuant to this paragraph will not be deemed “filed” for the purposes of Section 18 of the Exchange Act (15 U.S.C. 78r), or otherwise subject to the liability of that section. Such certification will not be deemed to be incorporated by reference into any filing under the Securities Act of 1933 or the Exchange Act, except to the extent that the registrant specifically incorporates it by reference: Attached hereto. |
Notice
A copy of the Amended and Restated Declaration of Trust of the Registrant is on file with the Secretary of State of the Commonwealth of Massachusetts and notice is hereby given that this instrument is executed on behalf of the Registrant by an officer of the Registrant as an officer and not individually and the obligations of or arising out of this instrument are not binding upon any of the Trustees or shareholders individually, but are binding only upon the assets and property of the respective constituent series of the Registrant.
SIGNATURES
Pursuant to the requirements of the Securities Exchange Act of 1934 and the Investment Company Act of 1940, the registrant has duly caused this report to be signed on its behalf by the undersigned, thereunto duly authorized.
Registrant: MFS INTERMEDIATE INCOME TRUST
| | |
| By (Signature and Title)* | | DAVID L. DILORENZO |
| | David L. DiLorenzo, President |
Date: June 16, 2017
Pursuant to the requirements of the Securities Exchange Act of 1934 and the Investment Company Act of 1940, this report has been signed below by the following persons on behalf of the registrant and in the capacities and on the dates indicated.
| | |
| By (Signature and Title)* | | DAVID L. DILORENZO |
| | David L. DiLorenzo, President (Principal Executive Officer) |
Date: June 16, 2017
| | |
| By (Signature and Title)* | | JAMES O. YOST |
| | James O. Yost, Treasurer (Principal Financial Officer and Accounting Officer) |
Date: June 16, 2017
| * | Print name and title of each signing officer under his or her signature. |