UNITED STATES
SECURITIES AND EXCHANGE COMMISSION
Washington, D.C. 20549
FORMN-CSR
CERTIFIED SHAREHOLDER REPORT OF
REGISTERED MANAGEMENT INVESTMENT COMPANIES
Investment Company Act file number811-05440
MFS INTERMEDIATE INCOME TRUST
(Exact name of registrant as specified in charter)
111 Huntington Avenue, Boston, Massachusetts 02199
(Address of principal executive offices) (Zip code)
Christopher R. Bohane
Massachusetts Financial Services Company
111 Huntington Avenue
Boston, Massachusetts 02199
(Name and address of agents for service)
Registrant’s telephone number, including area code: (617)954-5000
Date of fiscal year end: October 31
Date of reporting period: April 30, 2020
| ITEM 1. | REPORTS TO STOCKHOLDERS. |
Semiannual Report
April 30, 2020

MFS® Intermediate Income Trust

Beginning on January 1, 2021, as permitted by regulations adopted by the U.S. Securities and Exchange Commission, paper copies of the fund’s annual and semiannual shareholder reports will no longer be sent by mail, unless you specifically request paper copies of the reports. Instead, the complete reports will be made available on the fund’s Web site, and you will be notified by mail each time a report is posted and provided with a Web site link to access the report.
If you are already signed up to receive shareholder reports by email, you will not be affected by this change and you need not take any action. You may sign up to receive shareholder reports and other communications from the fund by email by contacting your financial intermediary (such as a broker-dealer or bank) or, if you hold your shares directly with the fund, by calling 1-800-637-2304 or by logging into your Investor Center account at www.computershare.com/investor.
Beginning on January 1, 2019, you may elect to receive all future reports in paper free of charge. Contact your financial intermediary to request that you continue to receive paper copies of your shareholder reports. If you invest directly with the fund, you can call 1-800-637-2304 to let the fund know that you wish to continue receiving paper copies of your shareholder reports. Your election to receive reports in paper will apply to all funds held in your account if you invest through your financial intermediary or all funds held with the MFS fund complex if you invest directly.
MIN-SEM
MANAGED DISTRIBUTION POLICY DISCLOSURE
The MFS Intermediate Income Trust’s (the fund) Board of Trustees adopted a managed distribution policy. The fund seeks to pay monthly distributions based on an annual rate of 8.50% of the fund’s average monthly net asset value. The primary purpose of the managed distribution policy is to provide shareholders with a constant, but not guaranteed, fixed minimum rate of distribution each month. You should not draw any conclusions about the fund’s investment performance from the amount of the current distribution or from the terms of the fund’s managed distribution policy. The Board may amend or terminate the managed distribution policy at any time without prior notice to fund shareholders. The amendment or termination of the managed distribution policy could have an adverse effect on the market price of the fund’s shares.
With each distribution, the fund will issue a notice to shareholders and an accompanying press release which will provide detailed information regarding the amount and composition of the distribution and other related information. The amounts and sources of distributions reported in the notice to shareholders are only estimates and are not being provided for tax reporting purposes. The actual amounts and sources of the amounts for tax reporting purposes will depend upon the fund’s investment experience during the remainder of its fiscal year and may be subject to changes based on tax regulations. The fund will send you a Form 1099-DIV for the calendar year that will tell you how to report these distributions for federal income tax purposes. Please refer to “Tax Matters and Distributions” under Note 2 of the Notes to Financial Statements for information regarding the tax character of the fund’s distributions.
Under a managed distribution policy the fund may at times distribute more than its net investment income and net realized capital gains; therefore, a portion of your distribution may result in a return of capital. A return of capital may occur, for example, when some or all of the money that you invested in the fund is paid back to you. Any such returns of capital will decrease the fund’s total assets and, therefore, could have the effect of increasing the fund’s expense ratio. In addition, in order to make the level of distributions called for under its managed distribution policy, the fund may have to sell portfolio securities at a less than opportune time. A return of capital does not necessarily reflect the fund’s investment performance and should not be confused with ‘yield’ or ‘income’. The fund’s total return in relation to changes in net asset value is presented in the Financial Highlights.
MFS® Intermediate Income Trust
New York Stock Exchange Symbol:MIN
NOT FDIC INSURED• MAY LOSE VALUE• NO BANK GUARANTEE

LETTER FROM THE EXECUTIVE CHAIR
Dear Shareholders:
Markets experienced dramatic swings in early 2020 as the coronavirus pandemic crippled the global economy for a time. Optimism over the development of vaccines
and therapeutics, along with a decline in cases in countries hit early in the outbreak, has brightened the economic and market outlook during the second quarter, though a great deal of uncertainty remains on how long the aftereffects of the lockdowns will linger.
Global central banks have taken aggressive, coordinated steps to cushion the economic and market fallout related to the virus, and governments are undertaking unprecedented levels of fiscal stimulus. As uncertainty recedes, these measures can help build a supportive environment and encourage economic recovery. In the aftermath of the crisis, there are likely to be societal changes as
households, businesses, and governments adjust to a new reality, and these alterations could change the investment landscape. For investors, occurrences such as theCOVID-19 outbreak demonstrate the importance of having a deep understanding of company fundamentals, and our global research platform has been built to do just that.
Here at MFS®, we aim to help our clients navigate the growing complexity of the markets and world economies. Our long-term investment philosophy and commitment to the responsible allocation of capital allow us to tune out the noise and uncover what we believe are the best, most durable investment opportunities in the market. Through our powerful global investment platform, we combine collective expertise, thoughtful risk management, and long-term discipline to create sustainable value for investors.
Respectfully,

Robert J. Manning
Executive Chair
MFS Investment Management
June 16, 2020
The opinions expressed in this letter are subject to change and may not be relied upon for investment advice. No forecasts can be guaranteed.
1
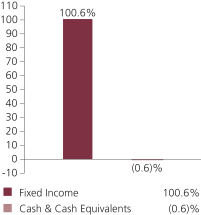
PORTFOLIO COMPOSITION
Portfolio structure (i)
| | | | |
| Fixed income sectors (i) | | | | |
| Investment Grade Corporates | | | 59.5% | |
| U.S. Treasury Securities | | | 30.0% | |
| Municipal Bonds | | | 3.9% | |
| Emerging Markets Bonds | | | 2.1% | |
| Commercial Mortgage-Backed Securities | | | 1.2% | |
| Mortgage-Backed Securities | | | 0.9% | |
| U.S. Government Agencies | | | 0.7% | |
| Collateralized Debt Obligations | | | 0.6% | |
| Non-U.S. Government Bonds | | | 0.6% | |
| High Yield Corporates | | | 0.5% | |
| Asset-Backed Securities | | | 0.3% | |
| Residential Mortgage-Backed Securities | | | 0.3% | |
| | | | |
| Composition including fixed income credit quality (a)(i) | |
| AAA | | | 3.2% | |
| AA | | | 2.9% | |
| A | | | 25.8% | |
| BBB | | | 34.0% | |
| BB | | | 2.7% | |
| D | | | 0.4% | |
| U.S. Government | | | 30.0% | |
| Federal Agencies | | | 1.6% | |
| Cash & Cash Equivalents | | | (0.6)% | |
| |
| Portfolio facts (i) | | | | |
| Average Duration (d) | | | 4.1 | |
| Average Effective Maturity (m) | | | 4.6 yrs. | |
2
Portfolio Composition – continued
| (a) | For all securities other than those specifically described below, ratings are assigned to underlying securities utilizing ratings from Moody’s, Fitch, and Standard & Poor’s rating agencies and applying the following hierarchy: If all three agencies provide a rating, the middle rating (after dropping the highest and lowest ratings) is assigned; if two of the three agencies rate a security, the lower of the two is assigned. Ratings are shown in the S&P and Fitch scale (e.g., AAA). Securities rated BBB or higher are considered investment grade. All ratings are subject to change. U.S. Government includes securities issued by the U.S. Department of the Treasury. Federal Agencies includes rated and unrated U.S. Agencyfixed-income securities, U.S. Agency mortgage-backed securities, and collateralized mortgage obligations of U.S. Agency mortgage-backed securities. Not Rated includes fixed income securities and fixed income derivatives, which have not been rated by any rating agency. The fund may or may not have held all of these instruments on this date. The fund is not rated by these agencies. |
| (d) | Duration is a measure of how much a bond’s price is likely to fluctuate with general changes in interest rates, e.g., if rates rise 1.00%, a bond with a5-year duration is likely to lose about 5.00% of its value due to the interest rate move. |
| (i) | For purposes of this presentation, the components include the value of securities, and reflect the impact of the equivalent exposure of derivative positions, if any. These amounts may be negative from time to time. Equivalent exposure is a calculated amount that translates the derivative position into a reasonable approximation of the amount of the underlying asset that the portfolio would have to hold at a given point in time to have the same price sensitivity that results from the portfolio’s ownership of the derivative contract. When dealing with derivatives, equivalent exposure is a more representative measure of the potential impact of a position on portfolio performance than value. The bond component will include any accrued interest amounts. |
| (m) | In determining each instrument’s effective maturity for purposes of calculating the fund’s dollar-weighted average effective maturity, MFS uses the instrument’s stated maturity or, if applicable, an earlier date on which MFS believes it is probable that a maturity-shortening device (such as a put,pre-refunding or prepayment) will cause the instrument to be repaid. Such an earlier date can be substantially shorter than the instrument’s stated maturity. |
Where the fund holds convertible bonds, they are treated as part of the equity portion of the portfolio.
Cash & Cash Equivalents includes any cash, investments in money market funds, short-term securities, and other assets less liabilities. Please see the Statement of Assets and Liabilities for additional information related to the fund’s cash position and other assets and liabilities.
From time to time Cash & Cash Equivalents may be negative due to timing of cash receipts and disbursements.
Percentages are based on net assets as of April 30, 2020.
The portfolio is actively managed and current holdings may be different.
3
PORTFOLIO MANAGERS’ PROFILES
| | | | | | |
| Portfolio Manager | | Primary Role | | Since | | Title and Five Year History |
| Geoffrey Schechter | | Lead Portfolio
Manager | | 2017 | | Investment Officer of MFS; employed in the investment management area of MFS since 1993. |
| | | |
| Alexander Mackey | | Investment Grade
Debt Instruments
Portfolio Manager | | 2017 | | Investment Officer of MFS; employed in the investment management area of MFS since 2001. |
OTHER NOTES
The fund’s shares may trade at a discount or premium to net asset value. When fund shares trade at a premium, buyers pay more than the net asset value underlying fund shares, and shares purchased at a premium would receive less than the amount paid for them in the event of the fund’s concurrent liquidation.
The fund’s target annual distribution rate is calculated based on an annual rate of 8.50% of the fund’s average monthly net asset value, not a fixed share price, and the fund’s dividend amount will fluctuate with changes in the fund’s average monthly net assets.
In accordance with Section 23(c) of the Investment Company Act of 1940, the fund hereby gives notice that it may from time to time repurchase shares of the fund in the open market at the option of the Board of Trustees and on such terms as the Trustees shall determine.
4
PORTFOLIO OF INVESTMENTS
4/30/20 (unaudited)
The Portfolio of Investments is a complete list of all securities owned by your fund. It is categorized by broad-based asset classes.
| | | | | | | | |
| | |
| Issuer | | Shares/Par | | | Value ($) | |
| Bonds - 99.9% | | | | | | |
| Aerospace - 2.0% | | | | | | |
| Boeing Co., 5.04%, 5/01/2027 | | $ | 2,500,000 | | | $ | 2,500,000 | |
| Huntington Ingalls Industries, Inc., 3.844%, 5/01/2025 (n) | | | 2,486,000 | | | | 2,613,710 | |
| Raytheon Technologies Corp., 3.125%, 5/04/2027 | | | 2,000,000 | | | | 2,159,641 | |
| Raytheon Technologies Corp., 4.125%, 11/16/2028 | | | 1,753,000 | | | | 2,034,604 | |
| | | | | | | | |
| | | | | | | $ | 9,307,955 | |
| Apparel Manufacturers - 0.6% | | | | | | |
| NIKE, Inc., 2.75%, 3/27/2027 | | $ | 2,600,000 | | | $ | 2,801,036 | |
| | |
| Asset-Backed & Securitized - 2.4% | | | | | | |
| Chesapeake Funding II LLC,2017-3A, “A2”, FLR, 1.154% (LIBOR -1mo. + 0.34%), 8/15/2029 (n) | | $ | 1,371,899 | | | $ | 1,364,730 | |
| Commercial Mortgage Trust, 2017-COR2, “A3”, 3.51%, 9/10/2050 | | | 1,676,352 | | | | 1,795,120 | |
| Falcon Franchise Loan LLC, 11.145%, 1/05/2023 (i)(n) | | | 47,348 | | | | 2,767 | |
| GS Mortgage Securities Trust,2010-C1, “A2”, 4.592%, 8/10/2043 (n) | | | 756,880 | | | | 757,779 | |
| JPMorgan Chase & Co., 4.717%, 2/15/2046 (n) | | | 2,122,262 | | | | 2,150,189 | |
| Loomis, Sayles & Co., CLO,2015-2A, “A1R”, FLR, 2.118% (LIBOR -3mo. + 0.9%), 4/15/2028 (n) | | | 1,109,976 | | | | 1,060,027 | |
| Shackleton CLO Ltd.,2015-8A, “A1R”, FLR, 2.055% (LIBOR - 3mo. + 1.51%), 10/20/2027 (n) | | | 1,957,763 | | | | 1,912,241 | |
| Tricon American Homes Trust, 2015-SFR1, “1A”, 2.589%, 11/17/2033 (n) | | | 1,247,563 | | | | 1,250,217 | |
| UBS Commercial Mortgage Trust,2017-C1, “A4”, 3.544%, 11/15/2050 | | | 875,000 | | | | 943,088 | |
| | | | | | | | |
| | | | | | | $ | 11,236,158 | |
| Automotive - 3.5% | | | | | | |
| BMW U.S. Capital LLC, 3.1%, 4/12/2021 (n) | | $ | 1,770,000 | | | $ | 1,778,243 | |
| Ford Motor Credit Co. LLC, 5.085%, 1/07/2021 | | | 1,074,000 | | | | 1,049,835 | |
| Ford Motor Credit Co. LLC, 5.75%, 2/01/2021 | | | 1,250,000 | | | | 1,218,750 | |
| Hyundai Capital America, 3.75%, 7/08/2021 (n) | | | 1,769,000 | | | | 1,775,262 | |
| Hyundai Capital America, 2.375%, 2/10/2023 (n) | | | 577,000 | | | | 555,205 | |
| Lear Corp., 3.5%, 5/30/2030 | | | 3,000,000 | | | | 2,588,547 | |
| Toyota Motor Credit Corp., 2.9%, 3/30/2023 | | | 2,250,000 | | | | 2,358,430 | |
| Toyota Motor Credit Corp., 3%, 4/01/2025 | | | 3,000,000 | | | | 3,198,240 | |
| Volkswagen Group of America Co., 2.85%, 9/26/2024 (n) | | | 1,765,000 | | | | 1,732,884 | |
| | | | | | | | |
| | | | | | | $ | 16,255,396 | |
5
Portfolio of Investments (unaudited) – continued
| | | | | | | | |
| | |
| Issuer | | Shares/Par | | | Value ($) | |
| Bonds - continued | | | | | | |
| Brokerage & Asset Managers - 2.7% | | | | | | |
| E*TRADE Financial Corp., 2.95%, 8/24/2022 | | $ | 3,500,000 | | | $ | 3,573,441 | |
| Low Income Investment Fund, 3.386%, 7/01/2026 | | | 705,000 | | | | 698,355 | |
| Low Income Investment Fund, 3.711%, 7/01/2029 | | | 1,905,000 | | | | 1,914,541 | |
| National Securities Clearing Corp., 1.5%, 4/23/2025 (n) | | | 1,117,000 | | | | 1,122,742 | |
| Raymond James Financial, 4.65%, 4/01/2030 | | | 1,471,000 | | | | 1,655,971 | |
| TD Ameritrade Holding Corp., 3.3%, 4/01/2027 | | | 3,150,000 | | | | 3,365,975 | |
| | | | | | | | |
| | | | | | | $ | 12,331,025 | |
| Building - 0.7% | | | | | | |
| Martin Marietta Materials, Inc., 3.5%, 12/15/2027 | | $ | 2,946,000 | | | $ | 3,060,099 | |
| | |
| Business Services - 0.7% | | | | | | |
| Equinix, Inc., 2.9%, 11/18/2026 | | $ | 3,000,000 | | | $ | 3,068,820 | |
| | |
| Cable TV - 0.9% | | | | | | |
| Charter Communications Operating LLC/Charter Communications Operating Capital Corp., 4.908%, 7/23/2025 | | $ | 1,350,000 | | | $ | 1,523,681 | |
| Time Warner Cable, Inc., 4%, 9/01/2021 | | | 2,770,000 | | | | 2,822,249 | |
| | | | | | | | |
| | | | | | | $ | 4,345,930 | |
| Chemicals - 0.9% | | | | | | |
| Sherwin-Williams Co., 3.125%, 6/01/2024 | | $ | 4,000,000 | | | $ | 4,195,962 | |
| | |
| Computer Software - 1.3% | | | | | | |
| Dell International LLC/EMC Corp., 5.85%, 7/15/2025 (n) | | $ | 399,000 | | | $ | 434,005 | |
| Dell International LLC/EMC Corp., 4.9%, 10/01/2026 (n) | | | 2,054,000 | | | | 2,123,588 | |
| Microsoft Corp., 3.125%, 11/03/2025 | | | 3,110,000 | | | | 3,466,306 | |
| | | | | | | | |
| | | | | | | $ | 6,023,899 | |
| Computer Software - Systems - 0.7% | | | | | | |
| Apple, Inc., 3.35%, 2/09/2027 | | $ | 2,700,000 | | | $ | 3,026,317 | |
| | |
| Conglomerates - 1.6% | | | | | | |
| General Electric Co., 3.45%, 5/01/2027 | | $ | 3,000,000 | | | $ | 3,053,675 | |
| Roper Technologies, Inc., 2.8%, 12/15/2021 | | | 651,000 | | | | 664,085 | |
| Westinghouse Air Brake Technologies Corp., 4.95%, 9/15/2028 | | | 3,760,000 | | | | 3,719,588 | |
| | | | | | | | |
| | | | | | | $ | 7,437,348 | |
| Consumer Products - 1.5% | | | | | | |
| Kimberly-Clark Corp., 3.1%, 3/26/2030 | | $ | 316,000 | | | $ | 352,809 | |
| Reckitt Benckiser Treasury Services PLC, 3.625%, 9/21/2023 (n) | | | 2,274,000 | | | | 2,406,838 | |
| Reckitt Benckiser Treasury Services PLC, 2.75%, 6/26/2024 (n) | | | 4,000,000 | | | | 4,127,127 | |
| | | | | | | | |
| | | | | | | $ | 6,886,774 | |
6
Portfolio of Investments (unaudited) – continued
| | | | | | | | |
| | |
| Issuer | | Shares/Par | | | Value ($) | |
| Bonds - continued | | | | | | |
| Consumer Services - 2.9% | | | | | | |
| Alibaba Group Holding Ltd., 2.8%, 6/06/2023 | | $ | 1,605,000 | | | $ | 1,658,972 | |
| Booking Holdings, Inc., 3.55%, 3/15/2028 | | | 2,737,000 | | | | 2,765,649 | |
| Conservation Fund, 3.474%, 12/15/2029 | | | 563,000 | | | | 598,091 | |
| Experian Finance PLC, 2.75%, 3/08/2030 (n) | | | 2,636,000 | | | | 2,631,584 | |
| Mastercard, Inc., 3.3%, 3/26/2027 | | | 2,750,000 | | | | 3,066,081 | |
| Toll Road Investors Partnership II LP, Capital Appreciation, NATL, 0%, 2/15/2026 (n) | | | 480,000 | | | | 391,198 | |
| Toll Road Investors Partnership II LP, Capital Appreciation, NATL, 0%, 2/15/2027 (n) | | | 1,525,000 | | | | 1,120,305 | |
| Toll Road Investors Partnership II LP, Capital Appreciation, NATL, 0%, 2/15/2029 (n) | | | 1,392,000 | | | | 928,704 | |
| Toll Road Investors Partnership II LP, Capital Appreciation, NATL, 0%, 2/15/2031 (n) | | | 480,000 | | | | 290,059 | |
| | | | | | | | |
| | | | | | | $ | 13,450,643 | |
| Electronics - 1.1% | | | | | | |
| Broadcom Corp./Broadcom Cayman Finance Ltd., 3.875%, 1/15/2027 | | $ | 3,900,000 | | | $ | 4,065,666 | |
| Microchip Technology, Inc., 3.922%, 6/01/2021 | | | 1,213,000 | | | | 1,232,643 | |
| | | | | | | | |
| | | | | | | $ | 5,298,309 | |
| Emerging Market Quasi-Sovereign - 0.2% | | | | | | |
| Corporacion Financiera de Desarrollo S.A. (Republic of Peru), 4.75%, 2/08/2022 (n) | | $ | 228,000 | | | $ | 233,132 | |
| Sinopec Capital (2013) Ltd. (People’s Republic of China), 3.125%, 4/24/2023 (n) | | | 733,000 | | | | 768,309 | |
| | | | | | | | |
| | | | | | | $ | 1,001,441 | |
| Emerging Market Sovereign - 0.2% | | | | | | |
| Republic of Poland, 5%, 3/23/2022 | | $ | 772,000 | | | $ | 824,950 | |
| | |
| Energy - Integrated - 1.4% | | | | | | |
| BP Capital Markets PLC, 4.742%, 3/11/2021 | | $ | 1,810,000 | | | $ | 1,851,318 | |
| Eni S.p.A., 4%, 9/12/2023 (n) | | | 1,327,000 | | | | 1,352,350 | |
| Exxon Mobil Corp., 3.294%, 3/19/2027 | | | 3,000,000 | | | | 3,270,897 | |
| | | | | | | | |
| | | | | | | $ | 6,474,565 | |
| Financial Institutions - 1.0% | | | | | | |
| AerCap Ireland Capital DAC, 4.875%, 1/16/2024 | | $ | 1,719,000 | | | $ | 1,595,560 | |
| Avolon Holdings Funding Ltd., 3.95%, 7/01/2024 (n) | | | 3,123,000 | | | | 2,687,088 | |
| Avolon Holdings Funding Ltd., 3.25%, 2/15/2027 (n) | | | 583,000 | | | | 451,198 | |
| | | | | | | | |
| | | | | | | $ | 4,733,846 | |
7
Portfolio of Investments (unaudited) – continued
| | | | | | | | |
| | |
| Issuer | | Shares/Par | | | Value ($) | |
| Bonds - continued | | | | | | |
| Food & Beverages - 2.6% | | | | | | |
| Anheuser-Busch InBev Worldwide, Inc., 3.3%, 2/01/2023 | | $ | 3,198,000 | | | $ | 3,375,883 | |
| Conagra Brands, Inc., 4.6%, 11/01/2025 | | | 2,987,000 | | | | 3,335,619 | |
| Constellation Brands, Inc., 4.4%, 11/15/2025 | | | 3,306,000 | | | | 3,646,334 | |
| Wm. Wrigley Jr. Co., 3.375%, 10/21/2020 (n) | | | 1,876,000 | | | | 1,893,458 | |
| | | | | | | | |
| | | | | | | $ | 12,251,294 | |
| Gaming & Lodging - 0.4% | | | | | | |
| Marriott International, Inc., 2.3%, 1/15/2022 | | $ | 1,686,000 | | | $ | 1,633,057 | |
| Marriott International, Inc., 5.75%, 5/01/2025 | | | 271,000 | | | | 283,213 | |
| | | | | | | | |
| | | | | | | $ | 1,916,270 | |
| Industrial - 0.3% | | | | | | |
| Howard University, 2.757%, 10/01/2027 | | $ | 1,250,000 | | | $ | 1,241,481 | |
| | |
| Insurance - 0.5% | | | | | | |
| AIA Group Ltd., 3.375%, 4/07/2030 (n) | | $ | 563,000 | | | $ | 606,499 | |
| American International Group, Inc., 3.9%, 4/01/2026 | | | 1,450,000 | | | | 1,569,811 | |
| | | | | | | | |
| | | | | | | $ | 2,176,310 | |
| Insurance - Property & Casualty - 1.3% | | | | | | |
| Allied World Assurance Co. Holdings Ltd., 4.35%, 10/29/2025 | | $ | 3,110,000 | | | $ | 3,178,304 | |
| Fairfax Financial Holdings Ltd., 4.85%, 4/17/2028 | | | 2,971,000 | | | | 3,016,866 | |
| | | | | | | | |
| | | | | | | $ | 6,195,170 | |
| International Market Quasi-Sovereign - 0.5% | | | | | | |
| Dexia Credit Local S.A. (Kingdom of Belgium), 1.875%, 9/15/2021 (n) | | $ | 2,510,000 | | | $ | 2,552,886 | |
| | |
| Internet - 0.3% | | | | | | |
| Baidu, Inc., 3.875%, 9/29/2023 | | $ | 1,361,000 | | | $ | 1,418,570 | |
| | |
| Machinery & Tools - 1.0% | | | | | | |
| CNH Industrial Capital LLC, 4.2%, 1/15/2024 | | $ | 472,000 | | | $ | 492,567 | |
| CNH Industrial Capital LLC, 3.85%, 11/15/2027 | | | 3,066,000 | | | | 3,055,198 | |
| Deere & Co., 2.75%, 4/15/2025 | | | 813,000 | | | | 865,557 | |
| | | | | | | | |
| | | | | | | $ | 4,413,322 | |
| Major Banks - 14.2% | | | | | | |
| Bank of America Corp., 3.124% to 1/20/2022, FLR (LIBOR - 3mo. + 1.16%) to 1/20/2023 | | $ | 5,400,000 | | | $ | 5,542,830 | |
| Bank of America Corp., 4.125%, 1/22/2024 | | | 2,876,000 | | | | 3,121,156 | |
| Bank of New York Mellon Corp., 3.5%, 4/28/2023 | | | 3,446,000 | | | | 3,681,902 | |
| Barclays PLC, 4.61%, 2/15/2023 | | | 3,857,000 | | | | 4,007,554 | |
| Credit Suisse Group AG, 3.574%, 1/09/2023 (n) | | | 1,500,000 | | | | 1,535,213 | |
| Credit Suisse Group AG, 6.5%, 8/08/2023 (n) | | | 915,000 | | | | 964,717 | |
8
Portfolio of Investments (unaudited) – continued
| | | | | | | | |
| | |
| Issuer | | Shares/Par | | | Value ($) | |
| Bonds - continued | | | | | | |
| Major Banks - continued | | | | | | |
| Goldman Sachs Group, Inc., 5.75%, 1/24/2022 | | $ | 1,924,000 | | | $ | 2,059,527 | |
| Goldman Sachs Group, Inc., 3%, 4/26/2022 | | | 1,720,000 | | | | 1,742,447 | |
| Goldman Sachs Group, Inc., 2.908% to 6/05/2022, FLR (LIBOR -3mo. + 1.053%) to 6/05/2023 | | | 1,750,000 | | | | 1,788,727 | |
| Goldman Sachs Group, Inc., 3.5%, 4/01/2025 | | | 1,500,000 | | | | 1,596,100 | |
| HSBC Holdings PLC, 3.262% to 3/13/2022, FLR (LIBOR - 3mo. + 1.055%) to 3/13/2023 | | | 4,000,000 | | | | 4,101,625 | |
| HSBC Holdings PLC, 3.033% to 11/22/2022, FLR (LIBOR - 3mo. + 0.923%) to 11/22/2023 | | | 1,500,000 | | | | 1,543,855 | |
| JPMorgan Chase & Co., 4.625%, 5/10/2021 | | | 2,890,000 | | | | 2,994,463 | |
| JPMorgan Chase & Co., 3.125%, 1/23/2025 | | | 3,500,000 | | | | 3,703,884 | |
| JPMorgan Chase & Co., 2.005% to 3/13/2025, FLR (SOFR + 1.585%) to 3/13/2026 | | | 2,500,000 | | | | 2,524,265 | |
| Lloyds Bank PLC, 3.75%, 1/11/2027 | | | 1,400,000 | | | | 1,488,034 | |
| Mitsubishi UFJ Financial Group, Inc., 2.95%, 3/01/2021 | | | 382,000 | | | | 387,925 | |
| Morgan Stanley, 3.875%, 1/27/2026 | | | 5,400,000 | | | | 5,937,921 | |
| NatWest Markets PLC, 3.625%, 9/29/2022 (n) | | | 800,000 | | | | 825,639 | |
| Royal Bank of Scotland Group, PLC, FLR, 4.892% (LIBOR - 3mo. + 1.754%), 5/18/2029 | | | 2,442,000 | | | | 2,744,697 | |
| State Street Corp., 2.901% to 3/30/2025, FLR (SOFR + 2.7%) to 3/30/2026 (n) | | | 407,000 | | | | 432,272 | |
| Sumitomo Mitsui Financial Group, Inc., 3.102%, 1/17/2023 | | | 1,145,000 | | | | 1,186,767 | |
| UBS Group Funding (Switzerland) AG, 4.253%, 3/23/2028 (n) | | | 2,449,000 | | | | 2,709,053 | |
| UBS Group Funding Ltd., 3%, 4/15/2021 (n) | | | 2,505,000 | | | | 2,531,791 | |
| UBS Group Funding Ltd., FLR, 2.644% (LIBOR - 3mo. + 1.44%), 9/24/2020 (n) | | | 1,680,000 | | | | 1,687,344 | |
| UniCredito Italiano S.p.A., 6.572%, 1/14/2022 (n) | | | 1,500,000 | | | | 1,547,130 | |
| Wells Fargo & Co., 2.572% to 2/11/2030, FLR (LIBOR - 3mo. + 1%) to 2/11/2031 | | | 3,500,000 | | | | 3,474,926 | |
| | | | | | | | |
| | | | | | | $ | 65,861,764 | |
| Medical & Health Technology & Services - 1.2% | | | | | | |
| Cigna Corp., FLR, 1.493% (LIBOR - 3mo. + 0.65%), 9/17/2021 | | $ | 2,000,000 | | | $ | 1,966,261 | |
| HCA, Inc., 4.125%, 6/15/2029 | | | 3,215,000 | | | | 3,477,979 | |
| | | | | | | | |
| | | | | | | $ | 5,444,240 | |
| Medical Equipment - 0.4% | | | | | | |
| Abbott Laboratories, 3.4%, 11/30/2023 | | $ | 1,600,000 | | | $ | 1,735,606 | |
| | |
| Metals & Mining - 1.7% | | | | | | |
| Anglo American Capital PLC, 5.375%, 4/01/2025 (n) | | $ | 1,250,000 | | | $ | 1,344,837 | |
| Glencore Funding LLC, 4.125%, 5/30/2023 (n) | | | 1,518,000 | | | | 1,535,711 | |
| Glencore Funding LLC, 3.875%, 10/27/2027 (n) | | | 1,887,000 | | | | 1,878,516 | |
| Newmont Corp., 2.25%, 10/01/2030 | | | 3,000,000 | | | | 2,970,567 | |
| | | | | | | | |
| | | | | | | $ | 7,729,631 | |
9
Portfolio of Investments (unaudited) – continued
| | | | | | | | |
| | |
| Issuer | | Shares/Par | | | Value ($) | |
| Bonds - continued | | | | | | |
| Midstream - 1.0% | | | | | | |
| MPLX LP, 3.5%, 12/01/2022 (n) | | $ | 1,584,000 | | | $ | 1,564,442 | |
| MPLX LP, 4%, 3/15/2028 | | | 3,395,000 | | | | 3,219,148 | |
| | | | | | | | |
| | | | | | | $ | 4,783,590 | |
| Mortgage-Backed - 0.9% | | | | | | |
| Fannie Mae, 5%, 12/01/2020 | | $ | 166 | | | $ | 174 | |
| Fannie Mae, 6.5%, 11/01/2031 | | | 616,598 | | | | 726,251 | |
| Freddie Mac, 5.5%, 6/01/2020 | | | 2,139 | | | | 2,137 | |
| Freddie Mac, 6%, 5/01/2021 - 8/01/2034 | | | 11,306 | | | | 12,461 | |
| Freddie Mac, 3.064%, 8/25/2024 | | | 1,457,127 | | | | 1,567,266 | |
| Freddie Mac, 3.187%, 9/25/2027 | | | 550,000 | | | | 616,695 | |
| Freddie Mac, 4.06%, 10/25/2028 | | | 780,000 | | | | 939,847 | |
| Ginnie Mae, 6%, 6/15/2033 - 10/15/2036 | | | 396,832 | | | | 452,498 | |
| Ginnie Mae, 5.87%, 4/20/2058 | | | 24,820 | | | | 28,460 | |
| | | | | | | | |
| | | | | | | $ | 4,345,789 | |
| Municipals - 3.9% | | | | | | |
| Bridgeview, IL, Stadium and Redevelopment Projects, AAC, 5.06%, 12/01/2025 | | $ | 4,000,000 | | | $ | 3,912,360 | |
| Gainesville, TX, Hospital District, “A”, 5.711%, 8/15/2033 | | | 2,330,000 | | | | 2,521,642 | |
| Michigan Finance Authority Hospital Refunding Rev. (Trinity Health | | | | | | | | |
| Credit Group), “T”, 3.084%, 12/01/2034 | | | 2,500,000 | | | | 2,564,950 | |
| New Jersey Economic Development Authority State Pension Funding | | | | | | | | |
| Rev., Capital Appreciation, “B”, AGM, 0%, 2/15/2023 | | | 3,704,000 | | | | 3,545,839 | |
| Puerto Rico Electric Power Authority Rev., “RR”, NATL, 5%, 7/01/2022 | | | 1,675,000 | | | | 1,677,496 | |
| Syracuse, NY, Industrial Development Agency PILOT Rev. (Carousel | | | | | | | | |
| Center Project), “B”, 5%, 1/01/2036 | | | 3,635,000 | | | | 3,730,855 | |
| | | | | | | | |
| | | | | | | $ | 17,953,142 | |
| Oils - 0.9% | | | | | | |
| Marathon Petroleum Corp., 3.625%, 9/15/2024 | | $ | 1,003,000 | | | $ | 964,593 | |
| Valero Energy Corp., 2.85%, 4/15/2025 | | | 1,052,000 | | | | 1,043,482 | |
| Valero Energy Corp., 3.4%, 9/15/2026 | | | 2,353,000 | | | | 2,342,975 | |
| | | | | | | | |
| | | | | | | $ | 4,351,050 | |
| Other Banks & Diversified Financials - 0.8% | | | | | | |
| BBVA USA, 2.875%, 6/29/2022 | | $ | 1,826,000 | | | $ | 1,835,253 | |
| SunTrust Banks, Inc., 2.7%, 1/27/2022 | | | 1,803,000 | | | | 1,842,651 | |
| | | | | | | | |
| | | | | | | $ | 3,677,904 | |
| Personal Computers & Peripherals - 0.2% | | | | | | |
| Equifax, Inc., 2.6%, 12/15/2025 | | $ | 832,000 | | | $ | 842,648 | |
10
Portfolio of Investments (unaudited) – continued
| | | | | | | | |
| | |
| Issuer | | Shares/Par | | | Value ($) | |
| Bonds - continued | | | | | | |
| Pharmaceuticals - 1.3% | | | | | | |
| Allergan Funding SCS, 3.45%, 3/15/2022 | | $ | 3,000,000 | | | $ | 3,074,720 | |
| Bristol-Myers Squibb Co., 2.75%, 2/15/2023 (n) | | | 2,628,000 | | | | 2,762,325 | |
| | | | | | | | |
| | | | | | | $ | 5,837,045 | |
| Restaurants - 0.2% | | | | | | |
| McDonald’s Corp., 3.3%, 7/01/2025 | | $ | 665,000 | | | $ | 724,525 | |
| | |
| Retailers - 1.2% | | | | | | |
| Alimentation Couche-Tard, Inc., 2.7%, 7/26/2022 (n) | | $ | 2,700,000 | | | $ | 2,715,057 | |
| Home Depot, Inc., 2.5%, 4/15/2027 | | | 2,750,000 | | | | 2,908,339 | |
| | | | | | | | |
| | | | | | | $ | 5,623,396 | |
| Specialty Stores - 0.2% | | | | | | |
| TJX Cos., Inc., 3.5%, 4/15/2025 | | $ | 1,000,000 | | | $ | 1,078,456 | |
| | |
| Supranational - 0.7% | | | | | | |
| Corporacion Andina de Fomento, 4.375%, 6/15/2022 | | $ | 2,950,000 | | | $ | 3,097,529 | |
| | |
| Telecommunications - Wireless - 2.6% | | | | | | |
| American Tower Corp., REIT, 3.55%, 7/15/2027 | | $ | 4,000,000 | | | $ | 4,369,933 | |
| Crown Castle International Corp., 3.65%, 9/01/2027 | | | 947,000 | | | | 1,031,641 | |
| Crown Castle International Corp., 3.3%, 7/01/2030 | | | 2,500,000 | | | | 2,680,746 | |
| SBA Tower Trust, 2.877%, 7/09/2021 (n) | | | 586,000 | | | | 588,636 | |
| T-Mobile USA, Inc., 3.75%, 4/15/2027 (n) | | | 3,000,000 | | | | 3,222,090 | |
| | | | | | | | |
| | | | | | | $ | 11,893,046 | |
| Tobacco - 0.9% | | | | | | |
| B.A.T Capital Corp., 4.7%, 4/02/2027 | | $ | 2,000,000 | | | $ | 2,205,964 | |
| Reynolds American, Inc., 6.875%, 5/01/2020 | | | 1,340,000 | | | | 1,340,000 | |
| Reynolds American, Inc., 3.25%, 6/12/2020 | | | 614,000 | | | | 614,652 | |
| | | | | | | | |
| | | | | | | $ | 4,160,616 | |
| U.S. Government Agencies and Equivalents - 0.7% | | | | | | |
| AID Ukraine, 1.847%, 5/29/2020 | | $ | 2,500,000 | | | $ | 2,502,685 | |
| Small Business Administration, 6.35%, 4/01/2021 | | | 14,966 | | | | 15,217 | |
| Small Business Administration, 6.34%, 5/01/2021 | | | 29,040 | | | | 29,450 | |
| Small Business Administration, 6.44%, 6/01/2021 | | | 25,233 | | | | 25,707 | |
| Small Business Administration, 6.625%, 7/01/2021 | | | 27,791 | | | | 28,281 | |
| Small Business Administration, 5.34%, 11/01/2021 | | | 97,818 | | | | 99,724 | |
| Small Business Administration, 4.93%, 1/01/2024 | | | 67,118 | | | | 70,353 | |
| Small Business Administration, 5.36%, 11/01/2025 | | | 152,267 | | | | 163,639 | |
| Small Business Administration, 5.39%, 12/01/2025 | | | 96,898 | | | | 104,109 | |
| | | | | | | | |
| | | | | | | $ | 3,039,165 | |
11
Portfolio of Investments (unaudited) – continued
| | | | | | | | |
| | |
| Issuer | | Shares/Par | | | Value ($) | |
| Bonds - continued | | | | | | |
| U.S. Treasury Obligations - 29.8% | | | | | | |
| U.S. Treasury Notes, 2.375%, 3/15/2021 | | $ | 3,900,000 | | | $ | 3,975,867 | |
| U.S. Treasury Notes, 1.75%, 11/30/2021 | | | 10,000,000 | | | | 10,242,969 | |
| U.S. Treasury Notes, 2.625%, 12/15/2021 | | | 12,500,000 | | | | 12,992,187 | |
| U.S. Treasury Notes, 1.75%, 2/28/2022 | | | 10,420,000 | | | | 10,714,691 | |
| U.S. Treasury Notes, 1.75%, 5/15/2022 | | | 8,500,000 | | | | 8,767,285 | |
| U.S. Treasury Notes, 2.125%, 12/31/2022 | | | 14,635,000 | | | | 15,370,180 | |
| U.S. Treasury Notes, 2.5%, 8/15/2023 | | | 12,710,000 | | | | 13,639,419 | |
| U.S. Treasury Notes, 2.75%, 2/15/2024 | | | 8,385,000 | | | | 9,157,665 | |
| U.S. Treasury Notes, 2.375%, 8/15/2024 | | | 9,230,000 | | | | 10,034,020 | |
| U.S. Treasury Notes, 2%, 2/15/2025 | | | 9,900,000 | | | | 10,673,051 | |
| U.S. Treasury Notes, 2%, 8/15/2025 | | | 5,225,000 | | | | 5,662,798 | |
| U.S. Treasury Notes, 2.25%, 11/15/2025 | | | 5,086,000 | | | | 5,594,799 | |
| U.S. Treasury Notes, 2%, 11/15/2026 | | | 6,254,000 | | | | 6,860,100 | |
| U.S. Treasury Notes, 1.625%, 11/30/2026 | | | 4,250,000 | | | | 4,560,947 | |
| U.S. Treasury Notes, 2.375%, 5/15/2027 | | | 4,075,000 | | | | 4,601,407 | |
| U.S. Treasury Notes, 1.75%, 11/15/2029 | | | 4,500,000 | | | | 4,975,840 | |
| | | | | | | | |
| | | | | | | $ | 137,823,225 | |
| Utilities - Electric Power - 3.9% | | | | | | |
| Berkshire Hathaway Energy, 3.7%, 7/15/2030 (n) | | $ | 2,450,000 | | | $ | 2,813,283 | |
| Emera U.S. Finance LP, 2.7%, 6/15/2021 | | | 492,000 | | | | 494,797 | |
| Enel Americas S.A., 4%, 10/25/2026 | | | 252,000 | | | | 257,673 | |
| Enel Finance International N.V., 2.75%, 4/06/2023 (n) | | | 3,500,000 | | | | 3,533,286 | |
| Enel Finance International N.V., 4.875%, 6/14/2029 (n) | | | 1,615,000 | | | | 1,863,789 | |
| FirstEnergy Corp., 3.9%, 7/15/2027 | | | 2,827,000 | | | | 3,111,927 | |
| Florida Power & Light Co., 2.85%, 4/01/2025 | | | 758,000 | | | | 821,347 | |
| Oncor Electric Delivery Co., 4.1%, 6/01/2022 | | | 2,206,000 | | | | 2,319,444 | |
| PPL WEM Holdings PLC, 5.375%, 5/01/2021 (n) | | | 546,000 | | | | 560,017 | |
| Transelec S.A., 4.625%, 7/26/2023 (n) | | | 927,000 | | | | 964,089 | |
| Transelec S.A., 4.25%, 1/14/2025 (n) | | | 228,000 | | | | 233,130 | |
| Xcel Energy, Inc., 3.4%, 6/01/2030 | | | 966,000 | | | | 1,067,131 | |
| | | | | | | | |
| | | | | | | $ | 18,039,913 | |
| Total Bonds (Identified Cost, $440,977,506) | | | $ | 461,968,056 | |
| | |
| Investment Companies (h) - 0.0% | | | | | | |
| Money Market Funds - 0.0% | | | | | | |
MFS Institutional Money Market Portfolio, 0.41% (v) (Identified Cost, $102,340) | | | 102,330 | | | $ | 102,340 | |
| | |
| Other Assets, Less Liabilities - 0.1% | | | | | 668,893 | |
| Net Assets - 100.0% | | | | | | $ | 462,739,289 | |
12
Portfolio of Investments (unaudited) – continued
| (h) | An affiliated issuer, which may be considered one in which the fund owns 5% or more of the outstanding voting securities, or a company which is under common control. At period end, the aggregate values of the fund’s investments in affiliated issuers and in unaffiliated issuers were $102,340 and $461,968,056, respectively. |
| (i) | Interest only security for which the fund receives interest on notional principal (Par amount). Par amount shown is the notional principal and does not reflect the cost of the security. |
| (n) | Securities exempt from registration under Rule 144A of the Securities Act of 1933. These securities may be sold in the ordinary course of business in transactions exempt from registration, normally to qualified institutional buyers. At period end, the aggregate value of these securities was $80,886,691, representing 17.5% of net assets. |
| (v) | Affiliated issuer that is available only to investment companies managed by MFS. The rate quoted for the MFS Institutional Money Market Portfolio is the annualizedseven-day yield of the fund at period end. |
The following abbreviations are used in this report and are defined:
| AAC | | Ambac Assurance Corp. |
| AGM | | Assured Guaranty Municipal |
| AID | | U.S. Agency for International Development |
| CLO | | Collateralized Loan Obligation |
| FLR | | Floating Rate. Interest rate resets periodically based on the parenthetically disclosed reference rate plus a spread (if any). Theperiod-end rate reported may not be the current rate. All reference rates are USD unless otherwise noted. |
| LIBOR | | London Interbank Offered Rate |
| NATL | | National Public Finance Guarantee Corp. |
| REIT | | Real Estate Investment Trust |
| SOFR | | Secured Overnight Financing Rate |
See Notes to Financial Statements
13
Financial Statements
STATEMENT OF ASSETS AND LIABILITIES
At 4/30/20 (unaudited)
This statement represents your fund’s balance sheet, which details the assets and liabilities comprising the total value of the fund.
| | | | |
| Assets | | | | |
Investments in unaffiliated issuers, at value (identified cost, $440,977,506) | | | $461,968,056 | |
Investments in affiliated issuers, at value (identified cost, $102,340) | | | 102,340 | |
Receivables for | | | | |
Interest | | | 3,361,013 | |
Other assets | | | 77,395 | |
Total assets | | | $465,508,804 | |
| |
| Liabilities | | | | |
Payables for | | | | |
Distributions | | | $116,374 | |
Investments purchased | | | 2,500,000 | |
Payable to affiliates | | | | |
Investment adviser | | | 12,677 | |
Administrative services fee | | | 420 | |
Transfer agent and dividend disbursing costs | | | 9,563 | |
Payable for independent Trustees’ compensation | | | 7,664 | |
Accrued expenses and other liabilities | | | 122,817 | |
Total liabilities | | | $2,769,515 | |
Net assets | | | $462,739,289 | |
| |
| Net assets consist of | | | | |
Paid-in capital | | | $456,278,459 | |
Total distributable earnings (loss) | | | 6,460,830 | |
Net assets | | | $462,739,289 | |
Shares of beneficial interest outstanding | | | 115,930,528 | |
Net asset value per share (net assets of $462,739,289 / 115,930,528 shares of beneficial interest outstanding) | | | $3.99 | |
See Notes to Financial Statements
14
Financial Statements
STATEMENT OF OPERATIONS
Six months ended 4/30/20 (unaudited)
This statement describes how much your fund earned in investment income and accrued in expenses. It also describes any gains and/or losses generated by fund operations.
| | | | |
| Net investment income (loss) | |
Income | | | | |
Interest | | | $7,025,084 | |
Dividends from affiliated issuers | | | 25,900 | |
Other | | | 3,156 | |
Total investment income | | | $7,054,140 | |
Expenses | | | | |
Management fee | | | $1,148,070 | |
Transfer agent and dividend disbursing costs | | | 44,804 | |
Administrative services fee | | | 35,789 | |
Independent Trustees’ compensation | | | 52,399 | |
Stock exchange fee | | | 56,734 | |
Custodian fee | | | 14,420 | |
Shareholder communications | | | 77,049 | |
Audit and tax fees | | | 41,779 | |
Legal fees | | | 5,650 | |
Miscellaneous | | | 22,852 | |
Total expenses | | | $1,499,546 | |
Net investment income (loss) | | | $5,554,594 | |
|
| Realized and unrealized gain (loss) | |
Realized gain (loss) (identified cost basis) | | | | |
Unaffiliated issuers | | | $5,476,727 | |
Affiliated issuers | | | 2,109 | |
Net realized gain (loss) | | | $5,478,836 | |
Change in unrealized appreciation or depreciation | | | | |
Unaffiliated issuers | | | $2,530,571 | |
Affiliated issuers | | | (336 | ) |
Net unrealized gain (loss) | | | $2,530,235 | |
Net realized and unrealized gain (loss) | | | $8,009,071 | |
Change in net assets from operations | | | $13,563,665 | |
See Notes to Financial Statements
15
Financial Statements
STATEMENTS OF CHANGES IN NET ASSETS
These statements describe the increases and/or decreases in net assets resulting from operations, any distributions, and any shareholder transactions.
| | | | | | | | |
| | | Six months ended
4/30/20 | | | Year ended
10/31/19 | |
| Change in net assets | | (unaudited) | | | | |
| | |
| From operations | | | | | | | | |
Net investment income (loss) | | | $5,554,594 | | | | $12,212,459 | |
Net realized gain (loss) | | | 5,478,836 | | | | 104,762 | |
Net unrealized gain (loss) | | | 2,530,235 | | | | 28,519,123 | |
Change in net assets from operations | | | $13,563,665 | | | | $40,836,344 | |
Distributions to shareholders | | | $(6,012,884 | ) | | | $(12,403,691 | ) |
Tax return of capital distributions to shareholders | | | $— | | | | $(27,810,480 | ) |
Distributions from other sources | | | $(13,823,106 | ) | | | $— | |
Change in net assets from fund share transactions | | | $(3,410,552 | ) | | | $(1,777,421 | ) |
Total change in net assets | | | $(9,682,877 | ) | | | $(1,155,248 | ) |
| | |
| Net assets | | | | | | | | |
At beginning of period | | | 472,422,166 | | | | 473,577,414 | |
At end of period | | | $462,739,289 | | | | $472,422,166 | |
See Notes to Financial Statements
16
Financial Statements
FINANCIAL HIGHLIGHTS
The financial highlights table is intended to help you understand the fund’s financial performance for the semiannual period and the past 5 fiscal years. Certain information reflects financial results for a single fund share. The total returns in the table represent the rate that an investor would have earned (or lost) on an investment in the fund share class (assuming reinvestment of all distributions) held for the entire period.
| | | | | | | | | | | | | | | | | | | | | | | | |
| | | Six months
ended
4/30/20
(unaudited) | | | Year ended | |
| | | 10/31/19 | | | 10/31/18 | | | 10/31/17 | | | 10/31/16 | | | 10/31/15 | |
| | | | | | | | | | | | | | | | |
Net asset value, beginning of
period | | | $4.04 | | | | $4.03 | | | | $4.46 | | | | $4.80 | | | | $5.05 | | | | $5.44 | |
| | | | |
| Income (loss) from investment operations | | | | | | | | | | | | | | | | | |
Net investment income
(loss) (d) | | | $0.05 | | | | $0.10 | | | | $0.10 | | | | $0.10 | (c) | | | $0.11 | | | | $0.12 | |
Net realized and unrealized
gain (loss) | | | 0.07 | | | | 0.25 | | | | (0.17 | ) | | | (0.05 | ) | | | 0.06 | | | | (0.06 | ) |
Total from investment
operations | | | $0.12 | | | | $0.35 | | | | $(0.07 | ) | | | $0.05 | | | | $0.17 | | | | $0.06 | |
| | | | |
| Less distributions declared to shareholders | | | | | | | | | | | | | | | | | |
From net investment income | | | $(0.05 | ) | | | $(0.10 | ) | | | $(0.10 | ) | | | $(0.02 | ) | | | $(0.08 | ) | | | $(0.25 | ) |
From tax return of capital | | | — | | | �� | (0.24 | ) | | | (0.26 | ) | | | (0.37 | ) | | | (0.34 | ) | | | (0.20 | ) |
From other sources | | | (0.12 | ) | | | — | | | | — | | | | — | | | | — | | | | — | |
Total distributions declared to
shareholders | | | $(0.17 | ) | | | $(0.34 | ) | | | $(0.36 | ) | | | $(0.39 | ) | | | $(0.42 | ) | | | $(0.45 | ) |
Net increase from repurchase of
capital shares | | | $0.00 | (w) | | | $0.00 | (w) | | | $0.00 | (w) | | | $— | | | | $0.00 | (w) | | | $0.00 | (w) |
Net asset value, end of period (x) | | | $3.99 | | | | $4.04 | | | | $4.03 | | | | $4.46 | | | | $4.80 | | | | $5.05 | |
Market value, end of period | | | $3.74 | | | | $3.77 | | | | $3.69 | | | | $4.24 | | | | $4.45 | | | | $4.56 | |
Total return at market value (%) | | | 3.78 | (n) | | | 11.87 | | | | (4.56 | ) | | | 4.30 | | | | 6.93 | | | | (0.82 | ) |
Total return at net asset
value (%) (j)(r)(s)(x) | | | 3.31 | (n) | | | 9.77 | | | | (0.90 | ) | | | 1.72 | (c) | | | 4.15 | | | | 1.96 | |
| | | | | |
Ratios (%) (to average net assets)
and Supplemental data: | | | | | | | | | | | | | | | | | | | | | |
Expenses (f) | | | 0.65 | (a) | | | 0.65 | | | | 0.64 | | | | 0.61 | (c) | | | 0.64 | | | | 0.64 | |
Net investment income (loss) | | | 2.40 | (a) | | | 2.58 | | | | 2.33 | | | | 2.07 | (c) | | | 2.16 | | | | 2.22 | |
Portfolio turnover | | | 26 | (n) | | | 18 | | | | 50 | | | | 65 | | | | 19 | | | | 31 | |
Net assets at end of period
(000 omitted) | | | $462,739 | | | | $472,422 | | | | $473,577 | | | | $524,864 | | | | $565,316 | | | | $594,492 | |
17
Financial Highlights – continued
| (c) | Amount reflects aone-time reimbursement of expenses by the custodian (or former custodian) without which net investment income and performance would be lower and expenses would be higher. |
| (d) | Per share data is based on average shares outstanding. |
| (f) | Ratios do not reflect reductions from fees paid indirectly, if applicable. |
| (j) | Total return at net asset value is calculated using the net asset value of the fund, not the publicly traded price and therefore may be different than the total return at market value. |
| (r) | Certain expenses have been reduced without which performance would have been lower. |
| (s) | From time to time the fund may receive proceeds from litigation settlements, without which performance would be lower. |
| (w) | Per share amount was less than $0.01. |
| (x) | The net asset values and total returns at net asset value have been calculated on net assets which include adjustments made in accordance with U.S. generally accepted accounting principles required at period end for financial reporting purposes. |
See Notes to Financial Statements
18
NOTES TO FINANCIAL STATEMENTS
(unaudited)
(1) Business and Organization
MFS Intermediate Income Trust (the fund) is organized as a Massachusetts business trust and is registered under the Investment Company Act of 1940, as amended, as a diversifiedclosed-end management investment company.
The fund is an investment company and accordingly follows the investment company accounting and reporting guidance of the Financial Accounting Standards Board (FASB) Accounting Standards Codification Topic 946 Financial Services – Investment Companies.
(2) Significant Accounting Policies
General– The preparation of financial statements in conformity with U.S. generally accepted accounting principles requires management to make estimates and assumptions that affect the reported amounts of assets and liabilities, and disclosure of contingent assets and liabilities at the date of the financial statements and the reported amounts of increases and decreases in net assets from operations during the reporting period. Actual results could differ from those estimates. In the preparation of these financial statements, management has evaluated subsequent events occurring after the date of the fund’s Statement of Assets and Liabilities through the date that the financial statements were issued. The fund invests in foreign securities. Investments in foreign securities are vulnerable to the effects of changes in the relative values of the local currency and the U.S. dollar and to the effects of changes in each country’s market, economic, industrial, political, regulatory, geopolitical, and other conditions.
In March 2020, the FASB issued Accounting Standards Update2020-04, Reference Rate Reform (Topic 848) – Facilitation of the Effects of Reference Rate Reform on Financial Reporting (“ASU2020-04”), which provides optional, temporary relief with respect to the financial reporting of contracts subject to certain types of modifications due to the planned discontinuation of the London Interbank Offered Rate (LIBOR) and other IBOR-based reference rates as of the end of 2021. The temporary relief provided by ASU2020-04 is effective for certain reference rate-related contract modifications that occur during the period from March 12, 2020 through December 31, 2022. Management is evaluating the impact of ASU2020-04 on the fund’s investments, derivatives, debt and other contracts that will undergo reference rate-related modifications as a result of the reference rate reform.
In March 2017, the FASB issued Accounting Standards Update2017-08, Receivables –Nonrefundable Fees and Other Costs (Subtopic310-20) – Premium Amortization on Purchased Callable Debt Securities (“ASU2017-08”). For callable debt securities purchased at a premium that have explicit,non-contingent call features and that are callable at fixed prices on preset dates, ASU2017-08 requires the premium to be amortized to the earliest call date. The fund adopted ASU2017-08 as of the beginning of the reporting period on a modified retrospective basis. The adoption resulted in a change in accounting principle, since the fund had historically amortized such premiums to maturity for U.S. GAAP. As a result of the adoption, the fund recognized a cumulative effect adjustment that decreased the beginning of period cost of investments and increased the unrealized appreciation on investments by offsetting
19
Notes to Financial Statements (unaudited) – continued
amounts. Adoption had no impact on the fund’s net assets or any prior period information presented in the financial statements. With respect to the fund’s results of operations, amortization of premium to first call date under ASU2017-08 accelerates amortization with the intent of more closely aligning the recognition of income on such bonds with the economics of the instrument.
Balance Sheet Offsetting– The fund’s accounting policy with respect to balance sheet offsetting is that, absent an event of default by the counterparty or a termination of the agreement, the International Swaps and Derivatives Association (ISDA) Master Agreement, or similar agreement, does not result in an offset of reported amounts of financial assets and financial liabilities in the Statement of Assets and Liabilities across transactions between the fund and the applicable counterparty. The fund’s right to setoff may be restricted or prohibited by the bankruptcy or insolvency laws of the particular jurisdiction to which a specific master netting agreement counterparty is subject. Balance sheet offsetting disclosures, to the extent applicable to the fund, have been included in the fund’s Significant Accounting Policies note under the captions for each of the fund’sin-scope financial instruments and transactions.
Investment Valuations– Debt instruments and floating rate loans, including restricted debt instruments, are generally valued at an evaluated or composite bid as provided by a third-party pricing service. Short-term instruments with a maturity at issuance of 60 days or less may be valued at amortized cost, which approximates market value.Open-end investment companies are generally valued at net asset value per share. Securities and other assets generally valued on the basis of information from a third-party pricing service may also be valued at a broker/dealer bid quotation. In determining values, third-party pricing services can utilize both transaction data and market information such as yield, quality, coupon rate, maturity, type of issue, trading characteristics, and other market data. The values of foreign securities and other assets and liabilities expressed in foreign currencies are converted to U.S. dollars using the mean of bid and asked prices for rates provided by a third-party pricing service.
The Board of Trustees has delegated primary responsibility for determining or causing to be determined the value of the fund’s investments (including any fair valuation) to the adviser pursuant to valuation policies and procedures approved by the Board. If the adviser determines that reliable market quotations are not readily available, investments are valued at fair value as determined in good faith by the adviser in accordance with such procedures under the oversight of the Board of Trustees. Under the fund’s valuation policies and procedures, market quotations are not considered to be readily available for most types of debt instruments and floating rate loans and many types of derivatives. These investments are generally valued at fair value based on information from third-party pricing services. In addition, investments may be valued at fair value if the adviser determines that an investment’s value has been materially affected by events occurring after the close of the exchange or market on which the investment is principally traded (such as foreign exchange or market) and prior to the determination of the fund’s net asset value, or after the halt of trading of a specific security where trading does not resume prior to the close of the exchange or market on which the security is principally traded. The adviser generally relies on third-party pricing services or other information (such as the correlation with price movements of similar securities in the same or other markets; the type, cost and investment characteristics of the
20
Notes to Financial Statements (unaudited) – continued
security; the business and financial condition of the issuer; and trading and other market data) to assist in determining whether to fair value and at what value to fair value an investment. The value of an investment for purposes of calculating the fund’s net asset value can differ depending on the source and method used to determine value. When fair valuation is used, the value of an investment used to determine the fund’s net asset value may differ from quoted or published prices for the same investment. There can be no assurance that the fund could obtain the fair value assigned to an investment if it were to sell the investment at the same time at which the fund determines its net asset value per share.
Various inputs are used in determining the value of the fund’s assets or liabilities. These inputs are categorized into three broad levels. In certain cases, the inputs used to measure fair value may fall into different levels of the fair value hierarchy. In such cases, an investment’s level within the fair value hierarchy is based on the lowest level of input that is significant to the fair value measurement. The fund’s assessment of the significance of a particular input to the fair value measurement in its entirety requires judgment, and considers factors specific to the investment. Level 1 includes unadjusted quoted prices in active markets for identical assets or liabilities. Level 2 includes other significant observable market-based inputs (including quoted prices for similar securities, interest rates, prepayment speed, and credit risk). Level 3 includes unobservable inputs, which may include the adviser’s own assumptions in determining the fair value of investments. The following is a summary of the levels used as of April 30, 2020 in valuing the fund’s assets or liabilities:
| | | | | | | | | | | | | | | | |
| | | | |
| Financial Instruments | | Level 1 | | | Level 2 | | | Level 3 | | | Total | |
| U.S. Treasury Bonds & U.S. Government Agencies & Equivalents | | | $— | | | | $140,862,390 | | | | $— | | | | $140,862,390 | |
| Non-U.S. Sovereign Debt | | | — | | | | 7,476,806 | | | | — | | | | 7,476,806 | |
| Municipal Bonds | | | — | | | | 17,953,142 | | | | — | | | | 17,953,142 | |
| U.S. Corporate Bonds | | | — | | | | 199,544,731 | | | | — | | | | 199,544,731 | |
| Residential Mortgage-Backed Securities | | | — | | | | 5,596,006 | | | | — | | | | 5,596,006 | |
| Commercial Mortgage-Backed Securities | | | — | | | | 5,648,943 | | | | — | | | | 5,648,943 | |
| Asset-Backed Securities (including CDOs) | | | — | | | | 4,336,998 | | | | — | | | | 4,336,998 | |
| Foreign Bonds | | | — | | | | 80,549,040 | | | | — | | | | 80,549,040 | |
| Mutual Funds | | | 102,340 | | | | — | | | | — | | | | 102,340 | |
| Total | | | $102,340 | | | | $461,968,056 | | | | $— | | | | $462,070,396 | |
For further information regarding security characteristics, see the Portfolio of Investments.
Indemnifications– Under the fund’s organizational documents, its officers and Trustees may be indemnified against certain liabilities and expenses arising out of the performance of their duties to the fund. Additionally, in the normal course of business, the fund enters into agreements with service providers that may contain indemnification clauses. The fund’s maximum exposure under these agreements is unknown as this would involve future claims that may be made against the fund that have not yet occurred.
Investment Transactions and Income– Investment transactions are recorded on the trade date. Interest income is recorded on the accrual basis. All premium and discount
21
Notes to Financial Statements (unaudited) – continued
is amortized or accreted for financial statement purposes in accordance with U.S. generally accepted accounting principles. Interest payments received in additional securities are recorded on theex-interest date in an amount equal to the value of the security on such date.
The fund may receive proceeds from litigation settlements. Any proceeds received from litigation involving portfolio holdings are reflected in the Statement of Operations in realized gain/loss if the security has been disposed of by the fund or in unrealized gain/loss if the security is still held by the fund. Any other proceeds from litigation not related to portfolio holdings are reflected as other income in the Statement of Operations.
Tax Matters and Distributions– The fund intends to qualify as a regulated investment company, as defined under Subchapter M of the Internal Revenue Code, and to distribute all of its taxable income, including realized capital gains. As a result, no provision for federal income tax is required. The fund’s federal tax returns, when filed, will remain subject to examination by the Internal Revenue Service for a three year period. Management has analyzed the fund’s tax positions taken on federal and state tax returns for all open tax years and does not believe that there are any uncertain tax positions that require recognition of a tax liability. Foreign taxes, if any, have been accrued by the fund in the accompanying financial statements in accordance with the applicable foreign tax law. Foreign income taxes may be withheld by certain countries in which the fund invests. Additionally, capital gains realized by the fund on securities issued in or by certain foreign countries may be subject to capital gains tax imposed by those countries.
Distributions to shareholders are recorded on theex-dividend date. The fund seeks to pay monthly distributions based on an annual rate of 8.50% of the fund’s average monthly net asset value. As a result, distributions may exceed actual earnings which may result in a tax return of capital. Income and capital gain distributions are determined in accordance with income tax regulations, which may differ from U.S. generally accepted accounting principles. Certain capital accounts in the financial statements are periodically adjusted for permanent differences in order to reflect their tax character. These adjustments have no impact on net assets or net asset value per share. Temporary differences which arise from recognizing certain items of income, expense, gain or loss in different periods for financial statement and tax purposes will reverse at some time in the future.
During the year ended October 31, 2019, there were no significant adjustments due to differences between book and tax accounting.
For the six months ended April 30, 2020, the amount of distributions estimated to be a tax return of capital was approximately $13,823,106 which is reported as distributions from other sources in the Statements of Changes in Net Assets.
22
Notes to Financial Statements (unaudited) – continued
The tax character of distributions made during the current period will be determined at fiscal year end. The tax character of distributions declared to shareholders for the last fiscal year is as follows:
| | | | |
| |
| | | Year ended
10/31/19 | |
Ordinary income (including any
short-term capital gains) | | | $12,403,691 | |
| Tax return of capital (b) | | | 27,810,480 | |
| |
| Total distributions | | | $40,214,171 | |
| (b) | Distributions in excess of tax basis earnings and profits are reported in the financial statements as a tax return of capital. |
The federal tax cost and the tax basis components of distributable earnings were as follows:
| | | | |
| |
| As of 4/30/20 | | | |
| |
| Cost of investments | | | $441,670,086 | |
| Gross appreciation | | | 22,845,208 | |
| |
| Gross depreciation | | | (2,444,898 | ) |
| Net unrealized appreciation (depreciation) | | | $20,400,310 | |
| |
| As of 10/31/19 | | | |
| |
| Capital loss carryforwards | | | (5,097,904 | ) |
| Other temporary differences | | | (111,129 | ) |
| Net unrealized appreciation (depreciation) | | | 17,942,188 | |
The aggregate cost above includes prior fiscal year end tax adjustments, if applicable.
As of October 31, 2019, the fund had capital loss carryforwards available to offset future realized gains. These net capital losses may be carried forward indefinitely and their character is retained as short-term and/or long-term losses. Such losses are characterized as follows:
| | | | |
| Short-Term | | | $(2,620,236 | ) |
| Long-Term | | | (2,477,668 | ) |
| Total | | | $(5,097,904 | ) |
(3) Transactions with Affiliates
Investment Adviser– The fund has an investment advisory agreement with MFS to provide overall investment management and related administrative services and facilities to the fund. The management fee is computed daily and paid monthly at an annual rate of 0.32% of the fund’s average daily net assets and 5.65% of gross income. Gross income is calculated based on tax elections that generally include the accretion of discount and exclude the amortization of premium, which may differ from investment income reported in the Statement of Operations. MFS has agreed to reduce its management fee to the lesser of the contractual management fee as set forth above or 0.85% of the fund’s average daily net assets. This written agreement will continue until modified by the fund’s Board of Trustees, but such agreement will continue at least until October 31, 2020. For the six months ended April 30, 2020, the fund’s
23
Notes to Financial Statements (unaudited) – continued
average daily net assets and gross income fees did not meet the thresholds required to waive the management fee under this agreement. The management fee, from net assets and gross income, incurred for the six months ended April 30, 2020 was equivalent to an annual effective rate of 0.50% of the fund’s average daily net assets.
Transfer Agent– The fund engages Computershare Trust Company, N.A. (“Computershare”) as the sole transfer agent for the fund. MFS Service Center, Inc. (MFSC) monitors and supervises the activities of Computershare for an agreed upon fee approved by the Board of Trustees. For the six months ended April 30, 2020, these fees paid to MFSC amounted to $14,446.
Administrator– MFS provides certain financial, legal, shareholder communications, compliance, and other administrative services to the fund. Under an administrative services agreement, the fund reimburses MFS the costs incurred to provide these services. The fund is charged an annual fixed amount of $17,500 plus a fee based on average daily net assets. The administrative services fee incurred for the six months ended April 30, 2020 was equivalent to an annual effective rate of 0.0155% of the fund’s average daily net assets.
Trustees’ and Officers’ Compensation– The fund pays compensation to independent Trustees in the form of a retainer, attendance fees, and additional compensation to Board and Committee chairpersons. The fund does not pay compensation directly to Trustees or officers of the fund who are also officers of the investment adviser, all of whom receive remuneration from MFS for their services to the fund. Certain officers and Trustees of the fund are officers or directors of MFS and MFSC.
Other –The fund invests in the MFS Institutional Money Market Portfolio which is managed by MFS and seeks current income consistent with preservation of capital and liquidity. This money market fund does not pay a management fee to MFS but does incur investment and operating costs.
(4) Portfolio Securities
For the six months ended April 30, 2020, purchases and sales of investments, other than short-term obligations, were as follows:
| | | | | | | | |
| | |
| | | Purchases | | | Sales | |
| U.S. Government securities | | | $36,237,923 | | | | $83,258,024 | |
| Non-U.S. Government securities | | | 84,506,555 | | | | 47,017,175 | |
(5) Shares of Beneficial Interest
The fund’s Declaration of Trust permits the Trustees to issue an unlimited number of full and fractional shares of beneficial interest. The Trustees have authorized the repurchase by the fund of up to 10% annually of its own shares of beneficial interest. The fund repurchased 973,652 shares of beneficial interest during the six months ended April 30, 2020 at an average price per share of $3.50 and a weighted average discount of 8.62% per share. The fund repurchased 482,936 shares of beneficial
24
Notes to Financial Statements (unaudited) – continued
interest during the year ended October 31, 2019 at an average price per share of $3.68 and a weighted average discount of 8.44% per share. Transactions in fund shares were as follows:
| | | | | | | | | | | | | | | | |
| | | Six months ended
4/30/20 | | | Year ended
10/31/19 | |
| | | | |
| | | Shares | | | Amount | | | Shares | | | Amount | |
| Capital shares repurchased | | | (973,652 | ) | | | $(3,410,552 | ) | | | (482,936 | ) | | | $(1,777,421 | ) |
(6) Line of Credit
The fund and certain other funds managed by MFS participate in a $1.25 billion unsecured committed line of credit, subject to a $1 billion sublimit, provided by a syndicate of banks under a credit agreement. Borrowings may be made for temporary financing needs. Interest is charged to each fund, based on its borrowings, generally at a rate equal to the highest of one month LIBOR, the Federal Funds Effective Rate and the Overnight Bank Funding Rate, plus an agreed upon spread. A commitment fee, based on the average daily, unused portion of the committed line of credit, is allocated among the participating funds. In addition, the fund and other funds managed by MFS have established unsecured uncommitted borrowing arrangements with certain banks for temporary financing needs. Interest is charged to each fund, based on its borrowings, at rates equal to customary reference rates plus an agreed upon spread. For the six months ended April 30, 2020, the fund’s commitment fee and interest expense were $1,152 and $0, respectively, and are included in “Miscellaneous” expense in the Statement of Operations.
(7) Investments in Affiliated Issuers
An affiliated issuer may be considered one in which the fund owns 5% or more of the outstanding voting securities, or a company which is under common control. For the purposes of this report, the following were affiliated issuers:
| | | | | | | | | | | | | | | | | | | | | | | | |
| | | | | | |
| Affiliated Issuers | | Beginning
Value | | | Purchases | | | Sales
Proceeds | | | Realized
Gain
(Loss) | | | Change in
Unrealized
Appreciation or
Depreciation | | | Ending
Value | |
| MFS Institutional Money Market Portfolio | | | $3,881,383 | | | | $62,080,556 | | | | $65,861,372 | | | | $2,109 | | | | $(336 | ) | | | $102,340 | |
| | | | | | |
| Affiliated Issuers | | | | | | | | | | | | | | Dividend
Income | | | Capital Gain
Distributions | |
| MFS Institutional Money Market Portfolio | | | | | | | | | | | | $25,900 | | | | $— | |
(8) Impacts of COVID-19
The pandemic related to the global spread of novel coronavirus disease (COVID-19), which was first detected in December 2019, has resulted in significant disruptions to global business activity and the global economy, as well as the economies of individual countries, the financial performance of individual companies and sectors, and the securities and commodities markets in general. This pandemic, the full effects of which are still unknown, has resulted in substantial market volatility and may have adversely impacted the prices and liquidity of the fund’s investments and the fund’s performance.
25
REPORT OF INDEPENDENT REGISTERED PUBLIC ACCOUNTING FIRM
To the Trustees and Shareholders of MFS Intermediate Income Trust:
Results of Review of Interim Financial Statements
We have reviewed the accompanying statement of assets and liabilities of MFS Intermediate Income Trust (the “Trust”), including the portfolio of investments, as of April 30, 2020, and the related statements of operations and changes in net assets and the financial highlights for the six-month period ended April 30, 2020, and the related notes. Based on our review, we are not aware of any material modifications that should be made to the accompanying interim financial statements and financial highlights for them to be in conformity with accounting principles generally accepted in the United States of America.
We have previously audited, in accordance with the standards of the Public Company Accounting Oversight Board (United States) (PCAOB), the statement of assets and liabilities, including the portfolio of investments, as of October 31, 2019 (not presented herein), the related statement of operations for the year ended October 31, 2019 (not presented herein), the statements of changes in net assets for the years ended October 31, 2019, and October 31, 2018 (2018 not presented herein) and the financial highlights for each of the five years in the period ended October 31, 2019; and in our report dated December 16, 2019, we expressed an unqualified opinion on those financial statements.
Basis for Review Results
These interim financial statements and financial highlights are the responsibility of the Trust’s management. We are a public accounting firm registered with the PCAOB and are required to be independent with respect to the Fund in accordance with the U.S. federal securities laws and the applicable rules and regulations of the Securities and Exchange Commission and the PCAOB.
We conducted our review in accordance with the standards of the PCAOB. A review of interim financial information consists principally of applying analytical procedures and making inquiries of persons responsible for financial and accounting matters. It is substantially less in scope than an audit conducted in accordance with the standards of the PCAOB, the objective of which is the expression of an opinion regarding the financial statements taken as a whole. Accordingly, we do not express such an opinion.
DELOITTE & TOUCHE LLP
Boston, Massachusetts
June 16, 2020
26
PROXY VOTING POLICIES AND INFORMATION
MFS votes proxies on behalf of the fund pursuant to proxy voting policies and procedures that are available without charge, upon request, by calling1-800-225-2606, by visitingmfs.com/proxyvoting, or by visiting the SEC’s Web site athttp://www.sec.gov.
Information regarding how the fund voted proxies relating to portfolio securities during the most recent twelve-month period ended June 30 is available by August 31 of each year without charge by visitingmfs.com/proxyvoting, or by visiting the SEC’s Web site athttp://www.sec.gov.
QUARTERLY PORTFOLIO DISCLOSURE
The fund files a complete schedule of portfolio holdings with the SEC for the first and third quarters of each fiscal year as an exhibit to its reports onForm N-PORT. The fund’s Form N-PORT reports are available on the SEC’s website athttp://www.sec.gov.A shareholder can obtain the portfolio holdings report for the first and third quarters of the fund’s fiscal year atmfs.com/closedendfunds by choosing the fund’s name and then selecting the “Resources” tab and clicking on “Prospectus and Reports”.
FURTHER INFORMATION
From time to time, MFS may post important information about the fund or the MFS funds on the MFS web site (mfs.com). This information is available athttps://www.mfs.com/en-us/what-we-do/announcements.html or atmfs.com/closedendfunds by choosing the fund’s name.
Additional information about the fund (e.g., performance, dividends and the fund’s price history) is also available by clicking on the fund’s name under “Closed-End Funds” in the “Products” section of mfs.com.
INFORMATION ABOUT FUND CONTRACTS AND LEGAL CLAIMS
The fund has entered into contractual arrangements with an investment adviser, administrator, transfer agent, and custodian who each provide services to the fund. Unless expressly stated otherwise, shareholders are not parties to, or intended beneficiaries of these contractual arrangements, and these contractual arrangements are not intended to create any shareholder right to enforce them against the service providers or to seek any remedy under them against the service providers, either directly or on behalf of the fund.
Under the Trust’sBy-Laws and Declaration of Trust, any claims asserted against or on behalf of the MFS Funds, including claims against Trustees and Officers, must be brought in state and federal courts located within the Commonwealth of Massachusetts.
27
CONTACT US
TRANSFER AGENT, REGISTRAR, AND
DIVIDEND DISBURSING AGENT
CALL
1-800-637-2304
9 a.m. to 5 p.m. Eastern time
WRITE
Computershare Trust Company, N.A.
P.O. Box 505005
Louisville, KY 40233-5005
New York Stock Exchange Symbol:MIN
During the period covered by this report, the Registrant has not amended any provision in its Code of Ethics (the “Code”) that relates to an element of the Code’s definitions enumerated in paragraph (b) of Item 2 of this FormN-CSR. During the period covered by this report, the Registrant did not grant a waiver, including an implicit waiver, from any provision of the Code.
| ITEM 3. | AUDIT COMMITTEE FINANCIAL EXPERT. |
Not applicable for semi-annual reports.
| ITEM 4. | PRINCIPAL ACCOUNTANT FEES AND SERVICES. |
Not applicable for semi-annual reports.
| ITEM 5. | AUDIT COMMITTEE OF LISTED REGISTRANTS. |
Not applicable for semi-annual reports.
| ITEM 6. | SCHEDULE OF INVESTMENTS |
A schedule of investments for MFS Intermediate Income Trust is included as part of the report to shareholders under Item 1 of this FormN-CSR.
| ITEM 7. | DISCLOSURE OF PROXY VOTING POLICIES AND PROCEDURES FORCLOSED-END MANAGEMENT INVESTMENT COMPANIES. |
Not applicable for semi-annual reports.
| ITEM 8. | PORTFOLIO MANAGERS OFCLOSED-END MANAGEMENT INVESTMENT COMPANIES. |
There were no changes during the period.
| ITEM 9. | PURCHASES OF EQUITY SECURITIES BYCLOSED-END MANAGEMENT INVESTMENT COMPANY AND AFFILIATED PURCHASERS. |
MFS Intermediate Income Trust
| | | | | | | | | | | | | | | | |
Period | | (a) Total number
of Shares
Purchased | | | (b)
Average
Price Paid
per Share | | | (c) Total
Number of
Shares
Purchased as
Part of Publicly
Announced
Plans or
Programs | | | (d) Maximum
Number (or
Approximate
Dollar Value) of
Shares that May
Yet Be Purchased
under the Plans
or Programs | |
11/01/19-11/30/19 | | | 0 | | | | N/A | | | | 0 | | | | 11,690,418 | |
12/01/19-12/31/19 | | | 0 | | | | N/A | | | | 0 | | | | 11,690,418 | |
1/01/20-1/31/20 | | | 0 | | | | N/A | | | | 0 | | | | 11,690,418 | |
2/01/20-2/28/20 | | | 0 | | | | N/A | | | | 0 | | | | 11,690,418 | |
3/01/20-3/31/20 | | | 821,294 | | | | 3.48 | | | | 821,294 | | | | 10,869,124 | |
4/01/20-4/30/20 | | | 152,358 | | | | 3.62 | | | | 152,358 | | | | 10,716,766 | |
| | | | | | | | | | | | | | | | |
Total | | | 973,652 | | | | 3.50 | | | | 973,652 | | | | | |
| | | | | | | | | | | | | | | | |
Note: The Board approved procedures to repurchase shares and reviews the results periodically. The notification to shareholders of the program is part of the semi-annual and annual reports sent to shareholders. These annual programs begin on October 1st of each year. The programs conform to the conditions of Rule10b-18 of the Securities Exchange Act of 1934 and limit the aggregate number of shares that may be purchased in each annual period (October 1 through the following September 30) to 10% of the Registrant’s outstanding shares as of the first day of the plan year (October 1). The aggregate number of shares available for purchase for the October 1, 2019 plan year is 11,690,418.
| ITEM 10. | SUBMISSION OF MATTERS TO A VOTE OF SECURITY HOLDERS. |
There were no material changes to the procedures by which shareholders may send recommendations to the Board for nominees to the Registrant’s Board since the Registrant last provided disclosure as to such procedures in response to the requirements of Item 407 (c)(2)(iv) of RegulationS-K or this Item.
| ITEM 11. | CONTROLS AND PROCEDURES. |
| (a) | Based upon their evaluation of the registrant’s disclosure controls and procedures (as defined in Rule30a-3(c) under the Investment Company Act of 1940 (the “Act”)) as conducted within 90 days of the filing date of this FormN-CSR, the registrant’s principal financial officer and principal executive officer have concluded that those disclosure controls and procedures provide reasonable assurance that the material information required to be disclosed by the registrant on this report is recorded, processed, summarized and reported within the time periods specified in the Securities and Exchange Commission’s rules and forms. |
| (b) | There were no changes in the registrant’s internal controls over financial reporting (as defined in Rule30a-3(d) under the Act) that occurred during the period covered by the report that has materially affected, or is reasonably likely to materially affect, the registrant’s internal control over financial reporting. |
| ITEM 12. | DISCLOSURE OF SECURITIES LENDING ACTIVITIES FORCLOSED-END MANAGEMENT INVESTMENT COMPANIES. |
Not applicable for semi-annual reports.
| (a) | File the exhibits listed below as part of this form. Letter or number the exhibits in the sequence indicated. |
| | (1) | Any code of ethics, or amendment thereto, that is the subject of the disclosure required by Item 2, to the extent that the registrant intends to satisfy the Item 2 requirements through filing of an exhibit. Not applicable. |
| | (2) | A separate certification for each principal executive officer and principal financial officer of the registrant as required by Rule30a-2(a) under the Act (17 CFR270.30a-2): Attached hereto asEX-99.302CERT. |
| | (3) | Any written solicitation to purchase securities under Rule23c-1 under the Act (17 CFR270.23c-1) sent or given during the period covered by the report by or on behalf of the registrant to 10 or more persons. Not applicable. |
| | (4) | Change in the registrant’s independent public accountant. Not applicable. |
| (b) | If the report is filed under Section 13(a) or 15(d) of the Exchange Act, provide the certifications required by Rule30a-2(b) under the Act (17 CFR270.30a-2(b)), Rule13a-14(b) or Rule15d-14(b) under the Exchange Act (17 CFR240.13a-14(b) or240.15d-14(b)) and Section 1350 of Chapter 63 of Title 18 of the United States Code (18 U.S.C. 1350) as an exhibit. A certification furnished pursuant to this paragraph will not be deemed “filed” for the purposes of Section 18 of the Exchange Act (15 U.S.C. 78r), or otherwise subject to the liability of that section. Such certification will not be deemed to be incorporated by reference into any filing under the Securities Act of 1933 or the Exchange Act, except to the extent that the registrant specifically incorporates it by reference: Attached hereto asEX-99.906CERT. |
| (c) | Notices to Trust’s common shareholders in accordance with Investment Company Act Section 19(a) and Rule19a-1. Attached hereto asEX-99.19a-1. |
Notice
A copy of the Amended and Restated Declaration of Trust of the Registrant is on file with the Secretary of State of the Commonwealth of Massachusetts and notice is hereby given that this instrument is executed on behalf of the Registrant by an officer of the Registrant as an officer and not individually and the obligations of or arising out of this instrument are not binding upon any of the Trustees or shareholders individually, but are binding only upon the assets and property of the respective constituent series of the Registrant.
SIGNATURES
Pursuant to the requirements of the Securities Exchange Act of 1934 and the Investment Company Act of 1940, the registrant has duly caused this report to be signed on its behalf by the undersigned, thereunto duly authorized.
Registrant: MFS INTERMEDIATE INCOME TRUST
| | |
| By (Signature and Title)* | | DAVID L. DILORENZO |
| | David L. DiLorenzo, President |
Date: June 16, 2020
Pursuant to the requirements of the Securities Exchange Act of 1934 and the Investment Company Act of 1940, this report has been signed below by the following persons on behalf of the registrant and in the capacities and on the dates indicated.
| | |
| By (Signature and Title)* | | DAVID L. DILORENZO |
| | David L. DiLorenzo, President (Principal Executive Officer) |
Date: June 16, 2020
| | |
| By (Signature and Title)* | | JAMES O. YOST |
| | James O. Yost, Treasurer (Principal Financial Officer and Accounting Officer) |
Date: June 16, 2020
| * | Print name and title of each signing officer under his or her signature. |