UNITED STATES
SECURITIES AND EXCHANGE COMMISSION Washington, D.C. 20549
FORM N-CSR
CERTIFIED SHAREHOLDER REPORT OF REGISTERED MANAGEMENT INVESTMENT COMPANIES
Investment Company Act file number 811-05440
MFS INTERMEDIATE INCOME TRUST
(Exact name of registrant as specified in charter)
111 Huntington Avenue, Boston, Massachusetts 02199 (Address of principal executive offices) (Zip code)
Christopher R. Bohane
Massachusetts Financial Services Company
111Huntington Avenue Boston, Massachusetts 02199
(Name and address of agents for service)
Registrant's telephone number, including area code: (617) 954-5000
Date of fiscal year end: October 31
Date of reporting period: April 30, 2023
ITEM 1. REPORTS TO STOCKHOLDERS.
Item 1(a):
Semiannual Report
April 30, 2023
MFS® Intermediate
Income Trust
MANAGED DISTRIBUTION POLICY DISCLOSURE
The MFS Intermediate Income Trust’s (the fund) Board of Trustees adopted a managed distribution policy. The fund seeks to pay monthly distributions based on an annual rate of 8.50% of the fund’s average monthly net asset value. The primary purpose of the managed distribution policy is to provide shareholders with a constant, but not guaranteed, fixed rate of distribution each month. You should not draw any conclusions about the fund’s investment performance from the amount of the current distribution or from the terms of the fund’s managed distribution policy. The Board may amend or terminate the managed distribution policy at any time without prior notice to fund shareholders. The amendment or termination of the managed distribution policy could have an adverse effect on the market price of the fund’s shares.
With each distribution, the fund will issue a notice to shareholders and an accompanying press release which will provide detailed information regarding the amount and composition of the distribution and other related information. The amounts and sources of distributions reported in the notice to shareholders are only estimates and are not being provided for tax reporting purposes. The actual amounts and sources of the amounts for tax reporting purposes will depend upon the fund’s investment experience during the remainder of its fiscal year and may be subject to changes based on tax regulations. The fund will send you a Form 1099-DIV for the calendar year that will tell you how to report these distributions for federal income tax purposes. Please refer to “Tax Matters and Distributions” under Note 2 of the Notes to Financial Statements for information regarding the tax character of the fund’s distributions.
Under a managed distribution policy the fund may at times distribute more than its net investment income and net realized capital gains; therefore, a portion of your distribution may result in a return of capital. A return of capital may occur, for example, when some or all of the money that you invested in the fund is paid back to you. Any such returns of capital will decrease the fund’s total assets and, therefore, could have the effect of increasing the fund’s expense ratio. In addition, in order to make the level of distributions called for under its managed distribution policy, the fund may have to sell portfolio securities at a less than opportune time. A return of capital does not necessarily reflect the fund’s investment performance and should not be confused with ‘yield’ or ‘income’. The fund’s total return in relation to changes in net asset value is presented in the Financial Highlights.
MFS® Intermediate
Income Trust
New York Stock Exchange Symbol: MIN
NOT FDIC INSURED • MAY LOSE VALUE • NO BANK GUARANTEE
Portfolio structure (i)
Fixed income sectors (i)
| Investment Grade Corporates | 54.6% |
| U.S. Treasury Securities | 38.4% |
| Municipal Bonds | 4.5% |
| Emerging Markets Bonds | 2.4% |
| Commercial Mortgage-Backed Securities | 2.3% |
| High Yield Corporates | 2.3% |
| Collateralized Loan Obligations | 1.3% |
| Mortgage-Backed Securities | 0.7% |
| Asset-Backed Securities | 0.5% |
| U.S. Government Agencies (o) | 0.0% |
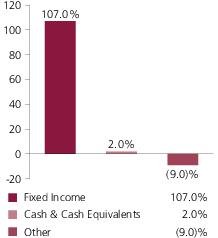
Composition including fixed income credit quality (a)(i)
| AAA | 4.1% |
| AA | 2.7% |
| A | 17.3% |
| BBB | 39.9% |
| BB | 3.1% |
| C | 0.8% |
| U.S. Government | 29.4% |
| Federal Agencies | 0.7% |
| Not Rated | 9.0% |
| Cash & Cash Equivalents | 2.0% |
| Other | (9.0)% |
Portfolio facts
| Average Duration (d) | 3.9 |
| Average Effective Maturity (m) | 4.2 yrs. |
| (a) | For all securities other than those specifically described below, ratings are assigned to underlying securities utilizing ratings from Moody’s, Fitch, and Standard & Poor’s rating agencies and applying the following hierarchy: If all three agencies provide a rating, the middle rating (after dropping the highest and lowest ratings) is assigned; if two of the three agencies rate a security, the lower of the two is assigned. If none of the 3 rating agencies above assign a rating, but the security is rated by DBRS Morningstar, then the DBRS Morningstar rating is assigned. If none of the 4 rating agencies listed above rate the security, but the security is rated by the Kroll Bond Rating Agency (KBRA), then the KBRA rating is assigned. Ratings are shown in the S&P and Fitch scale (e.g., AAA). Securities rated BBB or higher are considered investment grade. All ratings are subject to change. U.S. Government includes securities issued by the U.S. Department of the Treasury. Federal Agencies includes rated and unrated U.S. Agency fixed-income securities, U.S. Agency mortgage-backed securities, and collateralized mortgage obligations of U.S. Agency mortgage-backed securities. |
Not Rated includes fixed income securities and fixed income derivatives that have not been
Portfolio Composition - continued
rated by any rating agency. The fund may or may not have held all of these instruments on this date. The fund is not rated by these agencies.
| (d) | Duration is a measure of how much a bond’s price is likely to fluctuate with general changes in interest rates, e.g., if rates rise 1.00%, a bond with a 5-year duration is likely to lose about 5.00% of its value due to the interest rate move. The Average Duration calculation reflects the impact of the equivalent exposure of derivative positions, if any. |
| (i) | For purposes of this presentation, the components include the value of securities, and reflect the impact of the equivalent exposure of derivative positions, if any. These amounts may be negative from time to time. Equivalent exposure is a calculated amount that translates the derivative position into a reasonable approximation of the amount of the underlying asset that the portfolio would have to hold at a given point in time to have the same price sensitivity that results from the portfolio’s ownership of the derivative contract. When dealing with derivatives, equivalent exposure is a more representative measure of the potential impact of a position on portfolio performance than value. The bond component will include any accrued interest amounts. |
| (m) | In determining each instrument’s effective maturity for purposes of calculating the fund’s dollar-weighted average effective maturity, MFS uses the instrument’s stated maturity or, if applicable, an earlier date on which MFS believes it is probable that a maturity-shortening device (such as a put, pre-refunding or prepayment) will cause the instrument to be repaid. Such an earlier date can be substantially shorter than the instrument’s stated maturity. |
Where the fund holds convertible bonds, they are treated as part of the equity portion of the portfolio.
Cash & Cash Equivalents includes any cash, investments in money market funds, short-term securities, and other assets less liabilities. Please see the Statement of Assets and Liabilities for additional information related to the fund’s cash position and other assets and liabilities.
Other includes equivalent exposure from currency derivatives and/or any offsets to derivative positions and may be negative.
Percentages are based on net assets as of April 30, 2023.
The portfolio is actively managed and current holdings may be different.
Portfolio Managers' Profiles
| Portfolio Manager | Primary Role | Since | Title and Five Year History |
| Geoffrey Schechter | Lead Portfolio Manager | 2017 | Investment Officer of MFS; employed in the investment management area of MFS since 1993. |
| Alexander Mackey | Investment Grade Debt Instruments Portfolio Manager | 2017 | Investment Officer of MFS; employed in the investment management area of MFS since 2001. |
Effective May 31, 2023, Jake Stone was added as a Portfolio Manager of the fund.
Other Notes
The fund’s shares may trade at a discount or premium to net asset value. When fund shares trade at a premium, buyers pay more than the net asset value of the underlying fund shares, and shares purchased at a premium would receive less than the amount paid for them in the event of the fund’s concurrent liquidation.
The fund's target annual distribution rate is calculated based on an annual rate of 8.50% of the fund's average monthly net asset value, not a fixed share price, and the fund's dividend amount will fluctuate with changes in the fund's average monthly net assets.
In accordance with Section 23(c) of the Investment Company Act of 1940, the fund hereby gives notice that it may from time to time repurchase shares of the fund in the open market at the option of the Board of Trustees and on such terms as the Trustees shall determine.
Portfolio of Investments
4/30/23 (unaudited)
The Portfolio of Investments is a complete list of all securities owned by your fund. It is categorized by broad-based asset classes.
| Issuer | | | Shares/Par | Value ($) |
| Bonds – 97.3% |
| Aerospace & Defense – 1.3% |
| Boeing Co., 1.433%, 2/04/2024 | | $ | 2,269,000 | $2,203,101 |
| Huntington Ingalls Industries, Inc., 3.844%, 5/01/2025 | | | 2,486,000 | 2,426,684 |
| | | | | $4,629,785 |
| Asset-Backed & Securitized – 4.1% |
| 3650R Commercial Mortgage Trust, 2021-PF1, “XA”, 1.137%, 11/15/2054 (i) | | $ | 10,443,630 | $567,131 |
| ACREC 2021-FL1 Ltd., “AS”, FLR, 6.459% (LIBOR - 1mo. + 1.5%), 10/16/2036 (n) | | | 1,087,000 | 1,029,592 |
| Arbor Realty Trust, Inc., CLO, 2021-FL3, “AS”, FLR, 6.347% (LIBOR - 1mo. + 1.4%), 8/15/2034 (n) | | | 1,112,500 | 1,061,787 |
| AREIT 2022-CRE6 Trust, “AS”, FLR, 6.408% (SOFR - 30 day + 1.65%), 1/16/2037 (n) | | | 1,522,500 | 1,460,170 |
| BDS 2021-FL9 Ltd., “A”, FLR, 6.029% (LIBOR - 1mo. + 1.07%), 11/16/2038 (n) | | | 958,000 | 925,054 |
| Brazos Securitization LLC, 5.014%, 3/01/2034 (n) | | | 800,000 | 801,923 |
| BSPDF 2021-FL1 Issuer Ltd., “A”, FLR, 6.147% (LIBOR - 1mo. + 1.2%), 10/15/2036 (n) | | | 599,000 | 579,145 |
| BSPDF 2021-FL1 Issuer Ltd., “AS”, FLR, 6.427% (LIBOR - 1mo. + 1.48%), 10/15/2036 (n) | | | 774,500 | 718,850 |
| BXMT 2021-FL4 Ltd., “AS”, FLR, 6.247% (LIBOR - 1mo. + 1.3%), 5/15/2038 (n) | | | 2,000,000 | 1,883,059 |
| Commercial Mortgage Trust, 2017-COR2, “A3”, 3.51%, 9/10/2050 | | | 1,676,352 | 1,567,372 |
| Dell Equipment Finance Trust 2023-1, “A2”, 5.65%, 9/22/2028 (n) | | | 765,000 | 765,732 |
| LoanCore 2021-CRE6 Ltd., “AS”, FLR, 6.597% (LIBOR - 1mo. + 1.65%), 11/15/2038 (n) | | | 1,500,000 | 1,412,451 |
| ReadyCap Commercial Mortgage Trust, 2021-FL7, “A”, FLR, 6.22% (LIBOR - 1mo. + 1.2%), 11/25/2036 (n) | | | 638,622 | 621,430 |
| ReadyCap Commercial Mortgage Trust, 2021-FL7, “AS”, FLR, 6.52% (LIBOR - 1mo. + 1.5%), 11/25/2036 (n) | | | 199,500 | 194,443 |
| Shackleton 2015-8A CLO Ltd., “A1R”, FLR, 6.17% (LIBOR - 3mo. + 0.92%), 10/20/2027 (n) | | | 557,516 | 553,400 |
| | | | | $14,141,539 |
| Automotive – 2.4% |
| Hyundai Capital America, 5.875%, 4/07/2025 (n) | | $ | 2,094,000 | $2,116,029 |
| Hyundai Capital America, 1.65%, 9/17/2026 (n) | | | 1,000,000 | 887,891 |
| Stellantis Finance US, Inc., 1.711%, 1/29/2027 (n) | | | 1,150,000 | 1,028,609 |
| Stellantis N.V., 2.691%, 9/15/2031 (n) | | | 532,000 | 433,312 |
| Volkswagen Group of America Finance LLC, 2.85%, 9/26/2024 (n) | | | 1,765,000 | 1,711,297 |
Portfolio of Investments (unaudited) – continued
| Issuer | | | Shares/Par | Value ($) |
| Bonds – continued |
| Automotive – continued |
| Volkswagen Group of America Finance LLC, 1.625%, 11/24/2027 (n) | | $ | 1,500,000 | $1,314,948 |
| Volkswagen Group of America Finance LLC, 3.75%, 5/13/2030 (n) | | | 1,000,000 | 922,042 |
| | | | | $8,414,128 |
| Broadcasting – 0.8% |
| Warnermedia Holdings, Inc., 6.412%, 3/15/2026 | | $ | 683,000 | $688,890 |
| Warnermedia Holdings, Inc., 4.279%, 3/15/2032 | | | 2,524,000 | 2,241,716 |
| | | | | $2,930,606 |
| Brokerage & Asset Managers – 1.7% |
| Brookfield Finance, Inc., 2.724%, 4/15/2031 | | $ | 2,844,000 | $2,387,843 |
| Low Income Investment Fund, 3.386%, 7/01/2026 | | | 705,000 | 671,851 |
| Low Income Investment Fund, 3.711%, 7/01/2029 | | | 1,905,000 | 1,691,138 |
| National Securities Clearing Corp., 1.5%, 4/23/2025 (n) | | | 1,117,000 | 1,044,945 |
| | | | | $5,795,777 |
| Business Services – 1.4% |
| Tencent Holdings Ltd., 2.88%, 4/22/2031 (n) | | $ | 1,499,000 | $1,300,007 |
| Verisk Analytics, Inc., 4.125%, 3/15/2029 | | | 716,000 | 692,446 |
| Verisk Analytics, Inc., 5.75%, 4/01/2033 | | | 850,000 | 896,062 |
| Western Union Co., 1.35%, 3/15/2026 | | | 1,968,000 | 1,772,203 |
| | | | | $4,660,718 |
| Cable TV – 0.4% |
| Charter Communications Operating LLC/Charter Communications Operating Capital Corp., 4.908%, 7/23/2025 | | $ | 1,350,000 | $1,337,363 |
| Chemicals – 0.2% |
| Nutrien Ltd., 4.9%, 3/27/2028 | | $ | 558,000 | $560,289 |
| Computer Software – 0.8% |
| Dell International LLC/EMC Corp., 5.85%, 7/15/2025 | | $ | 399,000 | $407,490 |
| Dell International LLC/EMC Corp., 4.9%, 10/01/2026 | | | 2,054,000 | 2,055,022 |
| Oracle Corp., 4.5%, 5/06/2028 | | | 369,000 | 365,203 |
| | | | | $2,827,715 |
| Computer Software - Systems – 0.6% |
| VMware, Inc., 1.4%, 8/15/2026 | | $ | 2,333,000 | $2,083,243 |
| Conglomerates – 1.3% |
| nVent Finance S.à r.l., 5.65%, 5/15/2033 (w) | | $ | 1,216,000 | $1,227,943 |
| Regal Rexnord Corp., 6.05%, 4/15/2028 (n) | | | 1,533,000 | 1,547,557 |
| Westinghouse Air Brake Technologies Corp., 4.95%, 9/15/2028 | | | 1,760,000 | 1,747,107 |
| | | | | $4,522,607 |
Portfolio of Investments (unaudited) – continued
| Issuer | | | Shares/Par | Value ($) |
| Bonds – continued |
| Consumer Products – 0.2% |
| GSK Consumer Healthcare Capital US LLC, 3.375%, 3/24/2029 | | $ | 860,000 | $800,612 |
| Consumer Services – 1.7% |
| Booking Holdings, Inc., 3.55%, 3/15/2028 | | $ | 2,737,000 | $2,640,824 |
| Conservation Fund, 3.474%, 12/15/2029 | | | 563,000 | 487,960 |
| Toll Road Investors Partnership II LP, Capital Appreciation, NPFG, 0%, 2/15/2026 (n) | | | 480,000 | 401,728 |
| Toll Road Investors Partnership II LP, Capital Appreciation, NPFG, 0%, 2/15/2027 (n) | | | 1,525,000 | 1,196,903 |
| Toll Road Investors Partnership II LP, Capital Appreciation, NPFG, 0%, 2/15/2029 (n) | | | 1,392,000 | 958,783 |
| Toll Road Investors Partnership II LP, Capital Appreciation, NPFG, 0%, 2/15/2031 (n) | | | 480,000 | 290,363 |
| | | | | $5,976,561 |
| Containers – 0.5% |
| Berry Global, Inc., 1.65%, 1/15/2027 | | $ | 1,542,000 | $1,353,677 |
| Berry Global, Inc., 5.5%, 4/15/2028 (n) | | | 325,000 | 325,189 |
| | | | | $1,678,866 |
| Electrical Equipment – 0.5% |
| Arrow Electronics, Inc., 6.125%, 3/01/2026 | | $ | 717,000 | $717,522 |
| Arrow Electronics, Inc., 3.875%, 1/12/2028 | | | 1,049,000 | 987,809 |
| | | | | $1,705,331 |
| Electronics – 1.1% |
| Broadcom, Inc., 3.469%, 4/15/2034 (n) | | $ | 2,055,000 | $1,697,773 |
| Broadcom, Inc., 3.137%, 11/15/2035 (n) | | | 1,845,000 | 1,428,325 |
| Qorvo, Inc., 1.75%, 12/15/2024 (n) | | | 634,000 | 593,697 |
| | | | | $3,719,795 |
| Emerging Market Quasi-Sovereign – 0.9% |
| DAE Funding LLC (United Arab Emirates), 1.55%, 8/01/2024 (n) | | $ | 613,000 | $579,992 |
| DAE Funding LLC (United Arab Emirates), 2.625%, 3/20/2025 (n) | | | 1,000,000 | 946,232 |
| Qatar Petroleum, 2.25%, 7/12/2031 (n) | | | 1,635,000 | 1,407,918 |
| | | | | $2,934,142 |
| Energy - Integrated – 0.7% |
| Eni S.p.A., 4%, 9/12/2023 (n) | | $ | 1,327,000 | $1,325,274 |
| Eni S.p.A., 4.25%, 5/09/2029 (n) | | | 1,252,000 | 1,206,015 |
| | | | | $2,531,289 |
Portfolio of Investments (unaudited) – continued
| Issuer | | | Shares/Par | Value ($) |
| Bonds – continued |
| Financial Institutions – 2.5% |
| AerCap Ireland Capital DAC/AerCap Global Aviation Trust, 4.875%, 1/16/2024 | | $ | 1,719,000 | $1,704,918 |
| AerCap Ireland Capital DAC/AerCap Global Aviation Trust, 3.3%, 1/30/2032 | | | 332,000 | 271,932 |
| Avolon Holdings Funding Ltd., 3.95%, 7/01/2024 (n) | | | 3,123,000 | 3,032,598 |
| Avolon Holdings Funding Ltd., 3.25%, 2/15/2027 (n) | | | 583,000 | 520,617 |
| Avolon Holdings Funding Ltd., 2.528%, 11/18/2027 (n) | | | 869,000 | 730,480 |
| Avolon Holdings Funding Ltd., 2.75%, 2/21/2028 (n) | | | 2,336,000 | 1,965,959 |
| SMBC Aviation Capital Finance DAC, 5.449%, 5/03/2028 (n)(w) | | | 394,000 | 394,548 |
| | | | | $8,621,052 |
| Food & Beverages – 2.1% |
| Constellation Brands, Inc., 4.4%, 11/15/2025 | | $ | 3,306,000 | $3,277,745 |
| JBS USA Lux S.A./JBS USA Food Co./JBS USA Finance, Inc., 5.125%, 2/01/2028 (n) | | | 937,000 | 915,134 |
| JBS USA Lux S.A./JBS USA Food Co./JBS USA Finance, Inc., 3%, 2/02/2029 (n) | | | 1,451,000 | 1,240,488 |
| JDE Peet's N.V., 1.375%, 1/15/2027 (n) | | | 1,931,000 | 1,688,985 |
| | | | | $7,122,352 |
| Gaming & Lodging – 1.7% |
| GLP Capital LP/GLP Financing II, Inc., 4%, 1/15/2031 | | $ | 3,055,000 | $2,673,084 |
| Hyatt Hotels Corp., 1.8%, 10/01/2024 | | | 1,286,000 | 1,222,417 |
| Marriott International, Inc., 5.75%, 5/01/2025 | | | 29,000 | 29,371 |
| Marriott International, Inc., 2.85%, 4/15/2031 | | | 802,000 | 683,821 |
| Marriott International, Inc., 2.75%, 10/15/2033 | | | 1,750,000 | 1,420,133 |
| | | | | $6,028,826 |
| Industrial – 0.3% |
| Howard University, Washington D.C., AGM, 2.757%, 10/01/2027 | | $ | 1,250,000 | $1,135,987 |
| Insurance – 1.3% |
| AIA Group Ltd., 3.375%, 4/07/2030 (n) | | $ | 563,000 | $522,313 |
| Corebridge Financial, Inc., 3.85%, 4/05/2029 (n) | | | 2,500,000 | 2,279,411 |
| Sammons Financial Group, Inc., 4.75%, 4/08/2032 (n) | | | 2,000,000 | 1,721,364 |
| | | | | $4,523,088 |
| Insurance - Health – 0.2% |
| Humana, Inc., 3.7%, 3/23/2029 | | $ | 867,000 | $820,641 |
| Insurance - Property & Casualty – 1.7% |
| Allied World Assurance Co. Holdings Ltd., 4.35%, 10/29/2025 | | $ | 3,110,000 | $3,009,302 |
| Fairfax Financial Holdings Ltd., 4.85%, 4/17/2028 | | | 2,971,000 | 2,922,546 |
| | | | | $5,931,848 |
Portfolio of Investments (unaudited) – continued
| Issuer | | | Shares/Par | Value ($) |
| Bonds – continued |
| Internet – 0.4% |
| Baidu, Inc., 3.875%, 9/29/2023 | | $ | 1,361,000 | $1,353,351 |
| Machinery & Tools – 0.9% |
| CNH Industrial N.V., 3.85%, 11/15/2027 | | $ | 3,066,000 | $2,945,838 |
| Major Banks – 12.2% |
| Bank of America Corp., 4.125%, 1/22/2024 | | $ | 2,876,000 | $2,851,578 |
| Bank of America Corp., 1.734% to 7/22/2026, FLR (SOFR - 1 day + 0.96%) to 7/22/2027 | | | 2,224,000 | 1,992,480 |
| Bank of America Corp., 2.572% to 10/20/2031, FLR (SOFR + 1.21%) to 10/20/2032 | | | 1,823,000 | 1,496,971 |
| Barclays PLC, 2.279% to 11/24/2026, FLR (CMT - 1yr. + 1.05%) to 11/24/2027 | | | 1,435,000 | 1,282,451 |
| BNP Paribas S.A., 2.591% to 1/20/2027, FLR (SOFR - 1 day + 1.228%) to 1/20/2028 (n) | | | 1,723,000 | 1,564,670 |
| Deutsche Bank AG, 1.447% to 4/01/2024, FLR (SOFR - 1 day + 1.131%) to 4/01/2025 | | | 2,012,000 | 1,896,664 |
| Deutsche Bank AG, 2.311% to 11/16/2026, FLR (SOFR - 1 day + 1.219%) to 11/16/2027 | | | 457,000 | 395,552 |
| Deutsche Bank AG, 6.72% to 1/18/2028, FLR (SOFR - 1 day + 3.18%) to 1/18/2029 | | | 150,000 | 152,514 |
| Goldman Sachs Group, Inc., 3.5%, 4/01/2025 | | | 1,500,000 | 1,457,254 |
| Goldman Sachs Group, Inc., 1.093% to 12/09/2025, FLR (SOFR - 1 day + 0.789%) to 12/09/2026 | | | 894,000 | 799,749 |
| HSBC Holdings PLC, 2.251% to 11/22/2026, FLR (SOFR - 1 day + 1.1%) to 11/22/2027 | | | 1,446,000 | 1,293,012 |
| JPMorgan Chase & Co., 2.005% to 3/13/2025, FLR (SOFR - 1 day + 1.585%) to 3/13/2026 | | | 2,500,000 | 2,357,566 |
| JPMorgan Chase & Co., 2.58% to 4/22/2031, FLR (SOFR - 1 day + 1.25%) to 4/22/2032 | | | 2,250,000 | 1,889,948 |
| Lloyds Banking Group PLC, 3.511% to 3/18/2025, FLR (CMT - 1yr. + 1.6%) to 3/18/2026 | | | 2,546,000 | 2,449,216 |
| Mizuho Financial Group, 5.754%, 5/27/2034 | | | 2,000,000 | 2,060,738 |
| Morgan Stanley, 3.875%, 1/27/2026 | | | 5,400,000 | 5,271,088 |
| Morgan Stanley, 3.625%, 1/20/2027 | | | 824,000 | 793,246 |
| Morgan Stanley, 3.95%, 4/23/2027 | | | 290,000 | 278,670 |
| Morgan Stanley, 1.512% to 7/20/2026, FLR (SOFR - 1 day + 0.858%) to 7/20/2027 | | | 977,000 | 868,095 |
| NatWest Group PLC, 4.269% to 3/22/2024, FLR (LIBOR - 3mo. + 1.762%) to 3/22/2025 | | | 2,621,000 | 2,581,634 |
| NatWest Markets PLC, 3.479%, 3/22/2025 (n) | | | 585,000 | 564,057 |
| Standard Chartered PLC, 6.17%, 1/09/2027 (n) | | | 1,750,000 | 1,775,007 |
| Sumitomo Mitsui Trust Bank Ltd., 0.85%, 3/25/2024 (n) | | | 946,000 | 908,335 |
Portfolio of Investments (unaudited) – continued
| Issuer | | | Shares/Par | Value ($) |
| Bonds – continued |
| Major Banks – continued |
| UBS Group AG, 1.008% to 7/30/2023, FLR (CMT - 1yr. + 0.83%) to 7/30/2024 (n) | | $ | 770,000 | $759,250 |
| UBS Group Funding (Switzerland) AG, 4.253%, 3/23/2028 (n) | | | 2,449,000 | 2,316,092 |
| UniCredit S.p.A., 2.569% to 9/22/2025, FLR (CMT - 1yr. + 2.3%) to 9/22/2026 (n) | | | 2,088,000 | 1,899,930 |
| | | | | $41,955,767 |
| Medical & Health Technology & Services – 0.4% |
| ProMedica Toledo Hospital, “B”, AGM, 5.75%, 11/15/2038 | | $ | 1,250,000 | $1,220,230 |
| Metals & Mining – 2.1% |
| Anglo American Capital PLC, 4.75%, 4/10/2027 (n) | | $ | 1,547,000 | $1,523,054 |
| Anglo American Capital PLC, 2.25%, 3/17/2028 (n) | | | 744,000 | 647,756 |
| Anglo American Capital PLC, 2.875%, 3/17/2031 (n) | | | 870,000 | 736,805 |
| Glencore Funding LLC, 4.125%, 5/30/2023 (n) | | | 1,518,000 | 1,516,161 |
| Glencore Funding LLC, 1.625%, 4/27/2026 (n) | | | 1,191,000 | 1,080,406 |
| Glencore Funding LLC, 3.875%, 10/27/2027 (n) | | | 1,887,000 | 1,791,518 |
| | | | | $7,295,700 |
| Midstream – 2.4% |
| Enbridge, Inc., 2.5%, 2/14/2025 | | $ | 483,000 | $462,183 |
| Enbridge, Inc., 3.125%, 11/15/2029 | | | 1,506,000 | 1,368,627 |
| MPLX LP, 4%, 3/15/2028 | | | 1,395,000 | 1,347,779 |
| Plains All American Pipeline LP, 3.8%, 9/15/2030 | | | 1,510,000 | 1,366,343 |
| Targa Resources Corp., 4.2%, 2/01/2033 | | | 357,000 | 324,341 |
| Targa Resources Corp., 6.125%, 3/15/2033 | | | 577,000 | 602,398 |
| Targa Resources Partners LP/Targa Resources Finance Corp., 6.875%, 1/15/2029 | | | 499,000 | 509,628 |
| TC Energy Corp., 6.203%, 3/09/2026 | | | 2,392,000 | 2,405,691 |
| | | | | $8,386,990 |
| Mortgage-Backed – 0.7% | |
| Fannie Mae, 6.5%, 11/01/2031 | | $ | 301,183 | $315,820 |
| Freddie Mac, 3.064%, 8/25/2024 | | | 1,411,819 | 1,378,691 |
| Freddie Mac, 3.187%, 9/25/2027 | | | 550,000 | 529,209 |
| Freddie Mac, 6%, 8/01/2034 | | | 4,556 | 4,677 |
| Ginnie Mae, 6%, 6/15/2033 - 10/15/2036 | | | 224,157 | 233,462 |
| | | | | $2,461,859 |
Portfolio of Investments (unaudited) – continued
| Issuer | | | Shares/Par | Value ($) |
| Bonds – continued |
| Municipals – 4.4% |
| Bridgeview, IL, Stadium and Redevelopment Projects, Taxable, AAC, 5.06%, 12/01/2025 | | $ | 2,685,000 | $2,649,795 |
| California Earthquake Authority Rev., Taxable, “B”, 1.477%, 7/01/2023 | | | 405,000 | 402,324 |
| Gainesville, TX, Hospital District, Taxable, “A”, 5.711%, 8/15/2033 | | | 2,330,000 | 2,395,043 |
| Golden State, CA, Tobacco Securitization Corp., Tobacco Settlement Rev., Taxable, “B”, 3%, 6/01/2046 | | | 675,000 | 625,734 |
| Guam International Airport Authority Rev., Taxable (A.B. Won Pat Airport), “A”, 3.839%, 10/01/2036 | | | 110,000 | 88,738 |
| Massachusetts Educational Financing Authority, Education Loan Rev., Taxable, “M-A”, 2.641%, 7/01/2037 | | | 2,070,000 | 1,906,588 |
| Michigan Finance Authority Hospital Refunding Rev., Taxable (Trinity Health Credit Group), “T”, 3.084%, 12/01/2034 | | | 2,500,000 | 2,203,912 |
| Michigan Finance Authority Tobacco Settlement Asset-Backed Rev., Taxable (2006 Sold Tobacco Receipts), “A-1”, 2.326%, 6/01/2030 | | | 211,559 | 202,539 |
| Rhode Island Student Loan Authority, Education Loan Rev., Taxable, “2”, 2.348%, 12/01/2040 | | | 385,000 | 359,914 |
| Syracuse, NY, Industrial Development Agency PILOT Rev., Taxable (Carousel Center Project), “B”, 5%, 1/01/2036 (n) | | | 3,635,000 | 2,683,899 |
| University of California, General Taxable Rev., Taxable, “BG”, 1.614%, 5/15/2030 | | | 2,010,000 | 1,706,943 |
| | | | | $15,225,429 |
| Network & Telecom – 0.4% |
| Verizon Communications, Inc., 2.355%, 3/15/2032 | | $ | 1,726,000 | $1,416,940 |
| Other Banks & Diversified Financials – 0.5% |
| Macquarie Group Ltd., 1.34% to 1/12/2026, FLR (SOFR - 1 day + 1.069%) to 1/12/2027 (n) | | $ | 1,784,000 | $1,599,046 |
| Real Estate - Retail – 2.2% |
| Brixmor Operating Partnership LP, REIT, 4.05%, 7/01/2030 | | $ | 2,349,000 | $2,123,093 |
| Realty Income Corp., REIT, 3.4%, 1/15/2028 | | | 2,875,000 | 2,697,966 |
| Regency Centers Corp., 3.7%, 6/15/2030 | | | 3,000,000 | 2,748,420 |
| | | | | $7,569,479 |
| Retailers – 1.1% |
| Alibaba Group Holding Ltd., 2.8%, 6/06/2023 | | $ | 1,605,000 | $1,601,145 |
| Kohl's Corp., 9.75%, 5/15/2025 | | | 1,634,000 | 1,664,213 |
| Nordstrom, Inc., 2.3%, 4/08/2024 | | | 518,000 | 493,441 |
| | | | | $3,758,799 |
| Specialty Stores – 0.6% |
| DICK'S Sporting Goods, 3.15%, 1/15/2032 | | $ | 2,631,000 | $2,181,450 |
Portfolio of Investments (unaudited) – continued
| Issuer | | | Shares/Par | Value ($) |
| Bonds – continued |
| Telecommunications - Wireless – 2.8% |
| American Tower Corp., REIT, 3.55%, 7/15/2027 | | $ | 4,000,000 | $3,794,983 |
| Crown Castle International Corp., REIT, 2.25%, 1/15/2031 | | | 1,000,000 | 830,926 |
| Crown Castle, Inc., REIT, 3.65%, 9/01/2027 | | | 947,000 | 904,808 |
| Rogers Communications, Inc., 3.2%, 3/15/2027 (n) | | | 1,739,000 | 1,630,724 |
| T-Mobile USA, Inc., 3.875%, 4/15/2030 | | | 2,500,000 | 2,353,880 |
| | | | | $9,515,321 |
| Tobacco – 1.3% |
| B.A.T. Capital Corp., 4.7%, 4/02/2027 | | $ | 2,000,000 | $1,975,277 |
| Imperial Brands Finance PLC, 6.125%, 7/27/2027 (n) | | | 523,000 | 540,176 |
| Philip Morris International, Inc., 5.75%, 11/17/2032 | | | 1,773,000 | 1,862,104 |
| | | | | $4,377,557 |
| Transportation - Services – 0.8% |
| Element Fleet Management Corp., 1.6%, 4/06/2024 (n) | | $ | 2,990,000 | $2,868,205 |
| U.S. Government Agencies and Equivalents – 0.0% |
| Small Business Administration, 4.93%, 1/01/2024 | | $ | 9,003 | $8,922 |
| Small Business Administration, 5.36%, 11/01/2025 | | | 50,458 | 49,803 |
| Small Business Administration, 5.39%, 12/01/2025 | | | 28,315 | 28,136 |
| | | | | $86,861 |
| U.S. Treasury Obligations – 29.3% |
| U.S. Treasury Notes, 2.5%, 8/15/2023 | | $ | 12,710,000 | $12,610,207 |
| U.S. Treasury Notes, 2.75%, 2/15/2024 | | | 8,385,000 | 8,242,520 |
| U.S. Treasury Notes, 2.375%, 8/15/2024 | | | 9,230,000 | 8,980,501 |
| U.S. Treasury Notes, 2%, 2/15/2025 (f) | | | 9,900,000 | 9,528,750 |
| U.S. Treasury Notes, 2%, 8/15/2025 | | | 5,225,000 | 5,005,183 |
| U.S. Treasury Notes, 2.25%, 11/15/2025 | | | 5,086,000 | 4,889,513 |
| U.S. Treasury Notes, 2%, 11/15/2026 | | | 6,254,000 | 5,912,229 |
| U.S. Treasury Notes, 1.625%, 11/30/2026 | | | 7,750,000 | 7,230,205 |
| U.S. Treasury Notes, 1.875%, 2/28/2027 | | | 10,066,500 | 9,442,062 |
| U.S. Treasury Notes, 2.375%, 5/15/2027 | | | 4,075,000 | 3,889,715 |
| U.S. Treasury Notes, 0.5%, 6/30/2027 | | | 6,500,000 | 5,731,934 |
| U.S. Treasury Notes, 0.375%, 9/30/2027 | | | 5,672,000 | 4,938,850 |
| U.S. Treasury Notes, 1.75%, 11/15/2029 | | | 4,500,000 | 4,064,941 |
| U.S. Treasury Notes, 1.5%, 2/15/2030 | | | 5,043,500 | 4,450,495 |
| U.S. Treasury Notes, 1.875%, 2/15/2032 | | | 2,705,500 | 2,391,091 |
| U.S. Treasury Notes, 4.125%, 11/15/2032 | | | 3,400,000 | 3,588,594 |
| | | | | $100,896,790 |
Portfolio of Investments (unaudited) – continued
| Issuer | | | Shares/Par | Value ($) |
| Bonds – continued |
| Utilities - Electric Power – 4.4% |
| Enel Americas S.A., 4%, 10/25/2026 | | $ | 252,000 | $245,818 |
| Enel Finance International N.V., 6.8%, 10/14/2025 (n) | | | 895,000 | 927,208 |
| FirstEnergy Corp., 4.15%, 7/15/2027 | | | 2,827,000 | 2,749,258 |
| ITC Holdings Corp., 2.95%, 5/14/2030 (n) | | | 3,000,000 | 2,658,204 |
| Liberty Utilities Finance Co., 2.05%, 9/15/2030 (n) | | | 3,000,000 | 2,397,779 |
| Pacific Gas & Electric Co., 1.7%, 11/15/2023 | | | 435,000 | 424,824 |
| Pacific Gas & Electric Co., 3.25%, 2/16/2024 | | | 926,000 | 906,439 |
| Pacific Gas & Electric Co., 5.45%, 6/15/2027 | | | 401,000 | 398,257 |
| Pacific Gas & Electric Co., 2.1%, 8/01/2027 | | | 952,000 | 832,953 |
| Southern California Edison Co., 6.65%, 4/01/2029 | | | 816,000 | 878,410 |
| Transelec S.A., 4.25%, 1/14/2025 (n) | | | 228,000 | 222,951 |
| Vistra Operations Co. LLC, 4.875%, 5/13/2024 (n) | | | 2,446,000 | 2,416,689 |
| | | | | $15,058,790 |
| Total Bonds (Identified Cost, $358,101,088) | | $335,608,562 |
| Investment Companies (h) – 2.4% |
| Money Market Funds – 2.4% | |
| MFS Institutional Money Market Portfolio, 4.59% (v) (Identified Cost, $8,376,519) | | | 8,375,950 | $8,377,625 |
|
|
| Other Assets, Less Liabilities – 0.3% | | 940,706 |
| Net Assets – 100.0% | $344,926,893 |
| (f) | All or a portion of the security has been segregated as collateral for open futures contracts. | | | |
| (h) | An affiliated issuer, which may be considered one in which the fund owns 5% or more of the outstanding voting securities, or a company which is under common control. At period end, the aggregate values of the fund's investments in affiliated issuers and in unaffiliated issuers were $8,377,625 and $335,608,562, respectively. | | | |
| (i) | Interest only security for which the fund receives interest on notional principal (Par amount). Par amount shown is the notional principal and does not reflect the cost of the security. | | | |
| (n) | Securities exempt from registration under Rule 144A of the Securities Act of 1933. These securities may be sold in the ordinary course of business in transactions exempt from registration, normally to qualified institutional buyers. At period end, the aggregate value of these securities was $86,711,684, representing 25.1% of net assets. | | | |
| (v) | Affiliated issuer that is available only to investment companies managed by MFS. The rate quoted for the MFS Institutional Money Market Portfolio is the annualized seven-day yield of the fund at period end. | | | |
| (w) | When-issued security. | | | |
| The following abbreviations are used in this report and are defined: |
| AAC | Ambac Assurance Corp. |
| AGM | Assured Guaranty Municipal |
| CLO | Collateralized Loan Obligation |
| CMT | Constant Maturity Treasury |
Portfolio of Investments (unaudited) – continued
| FLR | Floating Rate. Interest rate resets periodically based on the parenthetically disclosed reference rate plus a spread (if any). The period-end rate reported may not be the current rate. All reference rates are USD unless otherwise noted. |
| LIBOR | London Interbank Offered Rate |
| NPFG | National Public Finance Guarantee Corp. |
| REIT | Real Estate Investment Trust |
| SOFR | Secured Overnight Financing Rate |
Derivative Contracts at 4/30/23
| Futures Contracts |
| Description | Long/
Short | Currency | Contracts | Notional
Amount | Expiration
Date | Value/Unrealized
Appreciation
(Depreciation) |
| Asset Derivatives |
| Interest Rate Futures | | |
| U.S. Treasury Note 10 yr | Long | USD | 101 | $11,635,516 | June – 2023 | $344,437 |
| U.S. Treasury Note 5 yr | Long | USD | 177 | 19,424,367 | June – 2023 | 30,290 |
| | | | | | | $374,727 |
At April 30, 2023, the fund had liquid securities with an aggregate value of $550,550 to cover any collateral or margin obligations for certain derivative contracts.
Financial Statements
Statement of Assets and Liabilities
At 4/30/23 (unaudited)
This statement represents your fund’s balance sheet, which details the assets and liabilities comprising the total value of the fund.
| Assets | |
| Investments in unaffiliated issuers, at value (identified cost, $358,101,088) | $335,608,562 |
| Investments in affiliated issuers, at value (identified cost, $8,376,519) | 8,377,625 |
| Receivables for | |
| Net daily variation margin on open futures contracts | 94,372 |
| Interest | 2,624,986 |
| Other assets | 75,891 |
| Total assets | $346,781,436 |
| Liabilities | |
| Payables for | |
| Distributions | $95,692 |
| When-issued investments purchased | 1,605,893 |
| Payable to affiliates | |
| Investment adviser | 19,740 |
| Administrative services fee | 653 |
| Transfer agent and dividend disbursing costs | 4,717 |
| Payable for independent Trustees' compensation | 1,066 |
| Accrued expenses and other liabilities | 126,782 |
| Total liabilities | $1,854,543 |
| Net assets | $344,926,893 |
| Net assets consist of | |
| Paid-in capital | $382,568,434 |
| Total distributable earnings (loss) | (37,641,541) |
| Net assets | $344,926,893 |
| Shares of beneficial interest outstanding (114,365,208 shares authorized less 52,696 capital shares to be retired) | 114,312,512 |
| Net asset value per share (net assets of $344,926,893 / 114,312,512 shares of beneficial interest outstanding) | $3.02 |
See Notes to Financial Statements
Financial Statements
Statement of Operations
Six months ended 4/30/23 (unaudited)
This statement describes how much your fund earned in investment income and accrued in expenses. It also describes any gains and/or losses generated by fund operations.
| Net investment income (loss) | |
| Income | |
| Interest | $5,488,564 |
| Dividends from affiliated issuers | 108,753 |
| Other | 26,085 |
| Total investment income | $5,623,402 |
| Expenses | |
| Management fee | $886,423 |
| Transfer agent and dividend disbursing costs | 39,071 |
| Administrative services fee | 30,333 |
| Independent Trustees' compensation | 4,839 |
| Stock exchange fee | 55,953 |
| Custodian fee | 12,289 |
| Shareholder communications | 76,522 |
| Audit and tax fees | 47,113 |
| Legal fees | 3,035 |
| Miscellaneous | 20,908 |
| Total expenses | $1,176,486 |
| Net investment income (loss) | $4,446,916 |
| Realized and unrealized gain (loss) |
| Realized gain (loss) (identified cost basis) | |
| Unaffiliated issuers | $(1,316,949) |
| Affiliated issuers | 1,044 |
| Futures contracts | (590,255) |
| Net realized gain (loss) | $(1,906,160) |
| Change in unrealized appreciation or depreciation | |
| Unaffiliated issuers | $15,266,052 |
| Affiliated issuers | 843 |
| Futures contracts | 1,183,355 |
| Net unrealized gain (loss) | $16,450,250 |
| Net realized and unrealized gain (loss) | $14,544,090 |
| Change in net assets from operations | $18,991,006 |
See Notes to Financial Statements
Financial Statements
Statements of Changes in Net Assets
These statements describe the increases and/or decreases in net assets resulting from operations, any distributions, and any shareholder transactions.
| | Six months ended | Year ended |
| | 4/30/23
(unaudited) | 10/31/22 |
| Change in net assets | | |
| From operations | | |
| Net investment income (loss) | $4,446,916 | $8,289,151 |
| Net realized gain (loss) | (1,906,160) | (891,991) |
| Net unrealized gain (loss) | 16,450,250 | (51,269,575) |
| Change in net assets from operations | $18,991,006 | $(43,872,415) |
| Distributions to shareholders | $(4,788,045) | $(9,183,435) |
| Tax return of capital distributions to shareholders | $— | $(23,988,404) |
| Distributions from other sources | $(9,915,533) | $— |
| Change in net assets from fund share transactions | $(1,640,483) | $(3,057,527) |
| Total change in net assets | $2,646,945 | $(80,101,781) |
| Net assets | | |
| At beginning of period | 342,279,948 | 422,381,729 |
| At end of period | $344,926,893 | $342,279,948 |
See Notes to Financial Statements
Financial Statements
Financial Highlights
The financial highlights table is intended to help you understand the fund's financial performance for the semiannual period and the past 5 fiscal years. Certain information reflects financial results for a single fund share. The total returns in the table represent the rate that an investor would have earned (or lost) on an investment in the fund share class (assuming reinvestment of all distributions) held for the entire period.
| | Six months
ended | Year ended |
| | 4/30/23
(unaudited) | 10/31/22 | 10/31/21 | 10/31/20 | 10/31/19 | 10/31/18 |
| Net asset value, beginning of period | $2.98 | $3.64 | $3.95 | $4.04 | $4.03 | $4.46 |
| Income (loss) from investment operations |
| Net investment income (loss) (d) | $0.04 | $0.07 | $0.08 | $0.09 | $0.10 | $0.10 |
| Net realized and unrealized gain (loss) | 0.13 | (0.44) | (0.06) | 0.16 | 0.25 | (0.17) |
| Total from investment operations | $0.17 | $(0.37) | $0.02 | $0.25 | $0.35 | $(0.07) |
| Less distributions declared to shareholders |
| From net investment income | $(0.04) | $(0.08) | $(0.10) | $(0.11) | $(0.10) | $(0.10) |
| From net realized gain | — | — | (0.03) | (0.04) | — | — |
| From tax return of capital | — | (0.21) | (0.20) | (0.19) | (0.24) | (0.26) |
| From other sources | (0.09) | — | — | — | — | — |
| Total distributions declared to shareholders | $(0.13) | $(0.29) | $(0.33) | $(0.34) | $(0.34) | $(0.36) |
| Net increase from repurchase of capital shares | $0.00(w) | $0.00(w) | $— | $0.00(w) | $0.00(w) | $0.00(w) |
| Net asset value, end of period (x) | $3.02 | $2.98 | $3.64 | $3.95 | $4.04 | $4.03 |
| Market value, end of period | $2.79 | $2.75 | $3.63 | $3.73 | $3.77 | $3.69 |
| Total return at market value (%) | 6.14(n) | (16.98) | 6.18 | 8.24 | 11.87 | (4.56) |
| Total return at net asset value (%) (j)(r)(s)(x) | 6.02(n) | (10.29) | 0.54 | 6.96 | 9.77 | (0.90) |
Ratios (%) (to average net assets)
and Supplemental data: |
| Expenses | 0.68(a) | 0.65 | 0.62 | 0.64 | 0.65 | 0.64 |
| Net investment income (loss) | 2.59(a) | 2.16 | 2.08 | 2.33 | 2.58 | 2.33 |
| Portfolio turnover | 8(n) | 16 | 20 | 43 | 18 | 50 |
| Net assets at end of period (000 omitted) | $344,927 | $342,280 | $422,382 | $457,844 | $472,422 | $473,577 |
See Notes to Financial Statements
Financial Highlights – continued
| (a) | Annualized. |
| (d) | Per share data is based on average shares outstanding. |
| (j) | Total return at net asset value is calculated using the net asset value of the fund, not the publicly traded price and therefore may be different than the total return at market value. |
| (n) | Not annualized. |
| (r) | Certain expenses have been reduced without which performance would have been lower. |
| (s) | From time to time the fund may receive proceeds from litigation settlements, without which performance would be lower. |
| (w) | Per share amount was less than $0.01. |
| (x) | The net asset values and total returns at net asset value have been calculated on net assets which include adjustments made in accordance with U.S. generally accepted accounting principles required at period end for financial reporting purposes. |
See Notes to Financial Statements
Notes to Financial Statements
(unaudited)
(1) Business and Organization
MFS Intermediate Income Trust (the fund) is organized as a Massachusetts business trust and is registered under the Investment Company Act of 1940, as amended, as a diversified closed-end management investment company.
The fund is an investment company and accordingly follows the investment company accounting and reporting guidance of the Financial Accounting Standards Board (FASB) Accounting Standards Codification Topic 946 Financial Services - Investment Companies.
(2) Significant Accounting Policies
General — The preparation of financial statements in conformity with U.S. generally accepted accounting principles requires management to make estimates and assumptions that affect the reported amounts of assets and liabilities, and disclosure of contingent assets and liabilities at the date of the financial statements and the reported amounts of increases and decreases in net assets from operations during the reporting period. Actual results could differ from those estimates. In the preparation of these financial statements, management has evaluated subsequent events occurring after the date of the fund’s Statement of Assets and Liabilities through the date that the financial statements were issued. The fund invests in foreign securities. Investments in foreign securities are vulnerable to the effects of changes in the relative values of the local currency and the U.S. dollar and to the effects of changes in each country’s market, economic, industrial, political, regulatory, geopolitical, environmental, public health, and other conditions.
Balance Sheet Offsetting — The fund's accounting policy with respect to balance sheet offsetting is that, absent an event of default by the counterparty or a termination of the agreement, the International Swaps and Derivatives Association (ISDA) Master Agreement, or similar agreement, does not result in an offset of reported amounts of financial assets and financial liabilities in the Statement of Assets and Liabilities across transactions between the fund and the applicable counterparty. The fund's right to setoff may be restricted or prohibited by the bankruptcy or insolvency laws of the particular jurisdiction to which a specific master netting agreement counterparty is subject. Balance sheet offsetting disclosures, to the extent applicable to the fund, have been included in the fund’s Significant Accounting Policies note under the captions for each of the fund’s in-scope financial instruments and transactions.
Investment Valuations — Subject to its oversight, the fund's Board of Trustees has delegated primary responsibility for determining or causing to be determined the value of the fund’s investments to MFS as the fund's adviser, pursuant to the fund’s valuation policy and procedures which have been adopted by the adviser and approved by the Board. In accordance with Rule 2a-5 under the Investment Company Act of 1940, the Board of Trustees designated the adviser as the “valuation designee” of the fund. If the adviser, as valuation designee, determines that reliable market quotations are not readily available for an investment, the investment is valued at fair value as determined in good faith by the adviser in accordance with the adviser’s fair valuation policy and procedures.
Notes to Financial Statements (unaudited) - continued
Under the fund's valuation policy and procedures, debt instruments and floating rate loans, including restricted debt instruments, are generally valued at an evaluated or composite bid as provided by a third-party pricing service. Short-term instruments with a maturity at issuance of 60 days or less may be valued at amortized cost, which approximates market value. Futures contracts are generally valued at last posted settlement price on their primary exchange as provided by a third-party pricing service. Futures contracts for which there were no trades that day for a particular position are generally valued at the closing bid quotation on their primary exchange as provided by a third-party pricing service. Open-end investment companies are generally valued at net asset value per share. The values of foreign securities and other assets and liabilities expressed in foreign currencies are converted to U.S. dollars using the mean of bid and asked prices for rates provided by a third-party pricing service.
Under the fund’s valuation policy and procedures, market quotations are not considered to be readily available for debt instruments, floating rate loans, and many types of derivatives. These investments are generally valued at fair value based on information from third-party pricing services or otherwise determined by the adviser in accordance with the adviser’s fair valuation policy and procedures. Securities and other assets generally valued on the basis of information from a third-party pricing service may also be valued at a broker/dealer bid quotation. In determining values, third-party pricing services can utilize both transaction data and market information such as yield, quality, coupon rate, maturity, type of issue, trading characteristics, spreads and other market data. An investment may also be valued at fair value if the adviser determines that the investment’s value has been materially affected by events occurring after the close of the exchange or market on which the investment is principally traded (such as foreign exchange or market) and prior to the determination of the fund’s net asset value, or after the halt of trading of a specific security where trading does not resume prior to the close of the exchange or market on which the security is principally traded. The adviser generally relies on third-party pricing services or other information (such as the correlation with price movements of similar securities in the same or other markets; the type, cost and investment characteristics of the security; the business and financial condition of the issuer; and trading and other market data) to assist in determining whether to fair value and at what value to fair value an investment. The value of an investment for purposes of calculating the fund’s net asset value can differ depending on the source and method used to determine value. When fair valuation is used, the value of an investment used to determine the fund’s net asset value may differ from quoted or published prices for the same investment. There can be no assurance that the fund could obtain the fair value assigned to an investment if it were to sell the investment at the same time at which the fund determines its net asset value per share.
Various inputs are used in determining the value of the fund's assets or liabilities. These inputs are categorized into three broad levels. In certain cases, the inputs used to measure fair value may fall into different levels of the fair value hierarchy. In such cases, an investment's level within the fair value hierarchy is based on the lowest level of input that is significant to the fair value measurement. The fund's assessment of the significance of a particular input to the fair value measurement in its entirety requires judgment, and considers factors specific to the investment. Level 1 includes unadjusted quoted prices in active markets for identical assets or liabilities. Level 2 includes other significant observable market-based inputs (including quoted prices for similar securities, interest rates, prepayment speed, and credit risk). Level 3 includes significant unobservable inputs, which may include the adviser's own assumptions in determining
Notes to Financial Statements (unaudited) - continued
the fair value of investments. Other financial instruments are derivative instruments, such as futures contracts. The following is a summary of the levels used as of April 30, 2023 in valuing the fund's assets and liabilities:
| Financial Instruments | Level 1 | Level 2 | Level 3 | Total |
| U.S. Treasury Bonds & U.S. Government Agencies & Equivalents | $— | $100,983,651 | $— | $100,983,651 |
| Non - U.S. Sovereign Debt | — | 2,934,142 | — | 2,934,142 |
| Municipal Bonds | — | 15,225,429 | — | 15,225,429 |
| U.S. Corporate Bonds | — | 124,810,326 | — | 124,810,326 |
| Residential Mortgage-Backed Securities | — | 2,461,859 | — | 2,461,859 |
| Commercial Mortgage-Backed Securities | — | 7,919,775 | — | 7,919,775 |
| Asset-Backed Securities (including CDOs) | — | 6,221,764 | — | 6,221,764 |
| Foreign Bonds | — | 75,051,616 | — | 75,051,616 |
| Mutual Funds | 8,377,625 | — | — | 8,377,625 |
| Total | $8,377,625 | $335,608,562 | $— | $343,986,187 |
| Other Financial Instruments | | | | |
| Futures Contracts – Assets | $374,727 | $— | $— | $374,727 |
For further information regarding security characteristics, see the Portfolio of Investments.
Derivatives — The fund uses derivatives primarily to increase or decrease exposure to a particular market or segment of the market, or security, to increase or decrease interest rate or currency exposure, or as alternatives to direct investments. Derivatives are used for hedging or non-hedging purposes. While hedging can reduce or eliminate losses, it can also reduce or eliminate gains. When the fund uses derivatives as an investment to increase market exposure, or for hedging purposes, gains and losses from derivative instruments may be substantially greater than the derivative’s original cost.
The derivative instruments used by the fund during the period were futures contracts. Depending on the type of derivative, a fund may exit a derivative position by entering into an offsetting transaction with a counterparty or exchange, negotiating an agreement with the derivative counterparty, or novating the position to a third party. The fund may be unable to promptly close out a futures position in instances where the daily fluctuation in the price for that type of future exceeds the daily limit set by the exchange. The fund's period end derivatives, as presented in the Portfolio of Investments and the associated Derivative Contract tables, generally are indicative of the volume of its derivative activity during the period.
Notes to Financial Statements (unaudited) - continued
The following table presents, by major type of derivative contract, the fair value, on a gross basis, of the asset and liability components of derivatives held by the fund at April 30, 2023 as reported in the Statement of Assets and Liabilities:
| | | Fair Value (a) |
| Risk | Derivative Contracts | Asset Derivatives |
| Interest Rate | Futures Contracts | $374,727 |
| (a) | Values presented in this table for futures contracts correspond to the values reported in the Portfolio of Investments. Only the current day net variation margin for futures contracts is reported separately within the Statement of Assets and Liabilities. |
The following table presents, by major type of derivative contract, the realized gain (loss) on derivatives held by the fund for the six months ended April 30, 2023 as reported in the Statement of Operations:
| Risk | Futures
Contracts |
| Interest Rate | $(590,255) |
The following table presents, by major type of derivative contract, the change in unrealized appreciation or depreciation on derivatives held by the fund for the six months ended April 30, 2023 as reported in the Statement of Operations:
| Risk | Futures
Contracts |
| Interest Rate | $1,183,355 |
Derivative counterparty credit risk is managed through formal evaluation of the creditworthiness of all potential counterparties. On certain, but not all, uncleared derivatives, the fund attempts to reduce its exposure to counterparty credit risk whenever possible by entering into an ISDA Master Agreement on a bilateral basis. The ISDA Master Agreement gives each party to the agreement the right to terminate all transactions traded under such agreement if there is a specified deterioration in the credit quality of the other party. Upon an event of default or a termination of the ISDA Master Agreement, the non-defaulting party has the right to close out all transactions traded under such agreement and to net amounts owed under each agreement to one net amount payable by one party to the other. This right to close out and net payments across all transactions traded under the ISDA Master Agreement could result in a reduction of the fund's credit risk to such counterparty equal to any amounts payable by the fund under the applicable transactions, if any.
Collateral and margin requirements differ by type of derivative. For cleared derivatives (e.g., futures contracts, cleared swaps, and exchange-traded options), margin requirements are set by the clearing broker and the clearing house and collateral, in the form of cash or securities, is posted by the fund directly with the clearing broker. Collateral terms are counterparty agreement specific for uncleared derivatives (e.g., forward foreign currency exchange contracts, uncleared swap agreements, and uncleared options) and collateral, in the form of cash and securities, is held in segregated accounts with the fund's custodian in connection with these agreements. For derivatives traded under an ISDA Master Agreement, which contains a credit support annex, the collateral requirements are netted across all transactions traded under such counterparty-specific agreement and an amount is posted from one party
Notes to Financial Statements (unaudited) - continued
to the other to collateralize such obligations. Cash that has been segregated or delivered to cover the fund's collateral or margin obligations under derivative contracts, if any, will be reported separately in the Statement of Assets and Liabilities as restricted cash for uncleared derivatives and/or deposits with brokers for cleared derivatives. Securities pledged as collateral or margin for the same purpose, if any, are noted in the Portfolio of Investments. The fund may be required to make payments of interest on uncovered collateral or margin obligations with the broker. Any such payments are included in “Miscellaneous” expense in the Statement of Operations.
Futures Contracts — The fund entered into futures contracts which may be used to hedge against or obtain broad market exposure, interest rate exposure, currency exposure, or to manage duration. A futures contract represents a commitment for the future purchase or sale of an asset at a specified price on a specified date.
Upon entering into a futures contract, the fund is required to deposit with the broker, either in cash or securities, an initial margin in an amount equal to a specified percentage of the notional amount of the contract. Subsequent payments (variation margin) are made or received by the fund each day, depending on the daily fluctuations in the value of the contract, and are recorded for financial statement purposes as unrealized gain or loss by the fund until the contract is closed or expires at which point the gain or loss on futures contracts is realized.
The fund bears the risk of interest rates, exchange rates or securities prices moving unexpectedly, in which case, the fund may not achieve the anticipated benefits of the futures contracts and may realize a loss. While futures contracts may present less counterparty risk to the fund since the contracts are exchange traded and the exchange’s clearinghouse guarantees payments to the broker, there is still counterparty credit risk due to the insolvency of the broker. The fund’s maximum risk of loss due to counterparty credit risk is equal to the margin posted by the fund to the broker plus any gains or minus any losses on the outstanding futures contracts.
Indemnifications — Under the fund's organizational documents, its officers and Trustees may be indemnified against certain liabilities and expenses arising out of the performance of their duties to the fund. Additionally, in the normal course of business, the fund enters into agreements with service providers that may contain indemnification clauses. The fund's maximum exposure under these agreements is unknown as this would involve future claims that may be made against the fund that have not yet occurred.
Investment Transactions and Income — Investment transactions are recorded on the trade date. Some securities may be purchased or sold on an extended settlement basis, which means that the receipt or delivery of the securities by the fund and related payments occur at a future date, usually beyond the customary settlement period.
Interest income is recorded on the accrual basis. All premium and discount is amortized or accreted for financial statement purposes in accordance with U.S. generally accepted accounting principles. Interest payments received in additional securities are recorded on the ex-interest date in an amount equal to the value of the security on such date. In determining the net gain or loss on securities sold, the cost of securities is determined on the identified cost basis.
Notes to Financial Statements (unaudited) - continued
The fund may receive proceeds from litigation settlements. Any proceeds received from litigation involving portfolio holdings are reflected in the Statement of Operations in realized gain/loss if the security has been disposed of by the fund or in unrealized gain/loss if the security is still held by the fund. Any other proceeds from litigation not related to portfolio holdings are reflected as other income in the Statement of Operations.
The fund may purchase or sell securities on a when-issued or delayed delivery basis. In these extended settlement transactions, the receipt or delivery of the securities by the fund and related payments occur at a future date, usually beyond the normal settlement period. The price of such security and the date that the security will be settled are generally fixed at the time the transaction is negotiated. The value of the security varies with market fluctuations and for debt securities no interest accrues to the fund until settlement takes place. When the fund sells securities on a when-issued or delayed delivery basis, the fund typically owns or has the right to acquire securities equivalent in kind and amount to the securities sold. Purchase and sale commitments for when-issued or delayed delivery securities are held at carrying amount, which approximates fair value and are categorized as level 2 within the fair value hierarchy, and included in When-issued investments purchased in the Statement of Assets and Liabilities. Losses may arise due to changes in the value of the underlying securities prior to settlement date or if the counterparty does not perform under the contract’s terms, or if the issuer does not issue the securities due to political, economic or other factors.
To mitigate the counterparty credit risk on TBA transactions, mortgage dollar rolls, and other types of forward settling mortgage-backed and asset-backed security transactions, the fund whenever possible enters into a Master Securities Forward Transaction Agreement (“MSFTA”) on a bilateral basis with each of the counterparties with whom it undertakes a significant volume of transactions. The MSFTA gives each party to the agreement the right to terminate all transactions traded under such agreement if there is a specified deterioration in the credit quality of the other party. Upon an event of default or a termination of the MSFTA, the non-defaulting party has the right to close out all transactions traded under such agreement and to net amounts owed under each transaction to one net amount payable by one party to the other. This right to close out and net payments across all transactions traded under the MSFTA could result in a reduction of the fund's credit risk to such counterparty equal to any amounts payable by the fund under the applicable transactions, if any.
For mortgage-backed and asset-backed securities traded under a MSFTA, the collateral and margining requirements are contract specific. Collateral amounts across all transactions traded under such agreement are netted and an amount is posted from one party to the other to collateralize such obligations. Cash that has been pledged to cover the fund's collateral or margin obligations under a MSFTA, if any, will be reported separately on the Statement of Assets and Liabilities as restricted cash. Securities pledged as collateral or margin for the same purpose, if any, are noted in the Portfolio of Investments.
Tax Matters and Distributions — The fund intends to qualify as a regulated investment company, as defined under Subchapter M of the Internal Revenue Code, and to distribute all of its taxable income, including realized capital gains. As a result, no provision for federal income tax is required. The fund’s federal tax returns, when filed, will remain subject to examination by the Internal Revenue Service for a three
Notes to Financial Statements (unaudited) - continued
year period. Management has analyzed the fund’s tax positions taken on federal and state tax returns for all open tax years and does not believe that there are any uncertain tax positions that require recognition of a tax liability. Foreign taxes, if any, have been accrued by the fund in the accompanying financial statements in accordance with the applicable foreign tax law. Foreign income taxes may be withheld by certain countries in which the fund invests. Additionally, capital gains realized by the fund on securities issued in or by certain foreign countries may be subject to capital gains tax imposed by those countries.
Distributions to shareholders are recorded on the ex-dividend date. The fund employs a managed distribution policy whereby the fund seeks to pay monthly distributions based on an annual rate of 8.50% of the fund’s average monthly net asset value. As a result, distributions may exceed actual earnings which may result in a tax return of capital. Distributions in any year may include a substantial return of capital component. Please refer to the Financial Highlights for distributions of tax returns of capital made during the prior five years. Income and capital gain distributions are determined in accordance with income tax regulations, which may differ from U.S. generally accepted accounting principles. Certain capital accounts in the financial statements are periodically adjusted for permanent differences in order to reflect their tax character. These adjustments have no impact on net assets or net asset value per share. Temporary differences which arise from recognizing certain items of income, expense, gain or loss in different periods for financial statement and tax purposes will reverse at some time in the future.
Book/tax differences primarily relate to amortization and accretion of debt securities and derivative transactions.
For the six months ended April 30, 2023, the amount of distributions estimated to be a tax return of capital was approximately $9,915,533 which is reported as distributions from other sources in the Statements of Changes in Net Assets. All or a portion of this amount may be redesignated as capital gains at fiscal year end.
The tax character of distributions made during the current period will be determined at fiscal year end. The tax character of distributions declared to shareholders for the last fiscal year is as follows:
| | Year ended
10/31/22 |
| Ordinary income (including any short-term capital gains) | $9,183,435 |
| Tax return of capital (b) | 23,988,404 |
| Total distributions | $33,171,839 |
| (b) | Distributions in excess of tax basis earnings and profits are reported in the financial statements as a tax return of capital. |
Notes to Financial Statements (unaudited) - continued
The federal tax cost and the tax basis components of distributable earnings were as follows:
| As of 4/30/23 | |
| Cost of investments | $368,043,303 |
| Gross appreciation | 645,719 |
| Gross depreciation | (24,702,835) |
| Net unrealized appreciation (depreciation) | $(24,057,116) |
| As of 10/31/22 | |
| Capital loss carryforwards | (2,711,665) |
| Other temporary differences | (92,476) |
| Net unrealized appreciation (depreciation) | (39,124,828) |
The aggregate cost above includes prior fiscal year end tax adjustments, if applicable.
As of October 31, 2022, the fund had capital loss carryforwards available to offset future realized gains. These net capital losses may be carried forward indefinitely and their character is retained as short-term and/or long-term losses. Such losses are characterized as follows:
| Short-Term | $(453,635) |
| Long-Term | (2,258,030) |
| Total | $(2,711,665) |
(3) Transactions with Affiliates
Investment Adviser — The fund has an investment advisory agreement with MFS to provide overall investment management and related administrative services and facilities to the fund. The management fee is computed daily and paid monthly at an annual rate of 0.32% of the fund’s average daily net assets and 5.65% of gross income. Gross income is calculated based on tax elections that generally include the accretion of discount and exclude the amortization of premium, which may differ from investment income reported in the Statement of Operations. MFS has agreed to reduce its management fee to the lesser of the contractual management fee as set forth above or 0.85% of the fund's average daily net assets. This written agreement will continue until modified by the fund's Board of Trustees, but such agreement will continue at least until October 31, 2023. For the six months ended April 30, 2023, the fund’s average daily net assets and gross income fees did not meet the thresholds required to waive the management fee under this agreement. The management fee, from net assets and gross income, incurred for the six months ended April 30, 2023 was equivalent to an annual effective rate of 0.52% of the fund’s average daily net assets.
Transfer Agent — The fund engages Computershare Trust Company, N.A. (“Computershare”) as the sole transfer agent for the fund. MFS Service Center, Inc. (MFSC) monitors and supervises the activities of Computershare for an agreed upon fee approved by the Board of Trustees. For the six months ended April 30, 2023, these fees paid to MFSC amounted to $14,645.
Administrator — MFS provides certain financial, legal, shareholder communications, compliance, and other administrative services to the fund. Under an administrative services agreement, the fund reimburses MFS the costs incurred to provide these
Notes to Financial Statements (unaudited) - continued
services. The fund is charged an annual fixed amount of $17,500 plus a fee based on average daily net assets. The administrative services fee incurred for the six months ended April 30, 2023 was equivalent to an annual effective rate of 0.0177% of the fund's average daily net assets.
Trustees’ and Officers’ Compensation — The fund pays compensation to independent Trustees in the form of a retainer, attendance fees, and additional compensation to Board and Committee chairpersons. The fund does not pay compensation directly to Trustees or officers of the fund who are also officers of the investment adviser, all of whom receive remuneration from MFS for their services to the fund. Certain officers and Trustees of the fund are officers or directors of MFS and MFSC.
Other — The fund invests in the MFS Institutional Money Market Portfolio which is managed by MFS and seeks current income consistent with preservation of capital and liquidity. This money market fund does not pay a management fee to MFS but does incur investment and operating costs.
(4) Portfolio Securities
For the six months ended April 30, 2023, purchases and sales of investments, other than short-term obligations, were as follows:
| | Purchases | Sales |
| U.S. Government securities | $3,468,014 | $18,098,204 |
| Non-U.S. Government securities | 24,825,048 | 25,829,628 |
(5) Shares of Beneficial Interest
The fund's Declaration of Trust permits the Trustees to issue an unlimited number of full and fractional shares of beneficial interest. The Trustees have authorized the repurchase by the fund of up to 10% annually of its own shares of beneficial interest.
The fund repurchased 585,259 shares of beneficial interest during the six months ended April 30, 2023 at an average price per share of $2.80 and a weighted average discount of 7.30% per share. The fund repurchased 1,156,709 shares of beneficial interest during the year ended October 31, 2022 at an average price per share of $2.84 and a weighted average discount of 7.72% per share. Transactions in fund shares were as follows:
| | Six months ended
4/30/23 | | Year ended
10/31/22 |
| | Shares | Amount | | Shares | Amount |
| Shares issued to shareholders in reinvestment of distributions | — | $— | | 61,956 | $222,731 |
| Capital shares repurchased | (585,259) | (1,640,483) | | (1,156,709) | (3,280,258) |
| Net change | (585,259) | $(1,640,483) | | (1,094,753) | $(3,057,527) |
(6) Line of Credit
The fund and certain other funds managed by MFS participate in a $1.45 billion unsecured committed line of credit of which $1.2 billion is reserved for use by the fund and certain other MFS U.S. funds. The line of credit is provided by a syndicate of banks under a credit agreement. Borrowings may be made for temporary financing needs. Interest is charged to each fund, based on its borrowings, generally at a rate equal to
Notes to Financial Statements (unaudited) - continued
the highest of 1) Daily Simple SOFR (Secured Overnight Financing Rate) plus 0.10%, 2) the Federal Funds Effective Rate, or 3) the Overnight Bank Funding Rate, each plus an agreed upon spread. A commitment fee, based on the average daily unused portion of the committed line of credit, is allocated among the participating funds. The line of credit expires on March 14, 2024 unless extended or renewed. In addition, the fund and other funds managed by MFS have established unsecured uncommitted borrowing arrangements with certain banks for temporary financing needs. Interest is charged to each fund, based on its borrowings, at rates equal to customary reference rates plus an agreed upon spread. For the six months ended April 30, 2023, the fund’s commitment fee and interest expense were $909 and $0, respectively, and are included in “Miscellaneous” expense in the Statement of Operations.
(7) Investments in Affiliated Issuers
An affiliated issuer may be considered one in which the fund owns 5% or more of the outstanding voting securities, or a company which is under common control. For the purposes of this report, the following were affiliated issuers:
| Affiliated Issuers | Beginning
Value | Purchases | Sales
Proceeds | Realized
Gain
(Loss) | Change in
Unrealized
Appreciation or
Depreciation | Ending
Value |
| MFS Institutional Money Market Portfolio | $2,639,402 | $40,457,949 | $34,721,613 | $1,044 | $843 | $8,377,625 |
| Affiliated Issuers | Dividend
Income | Capital Gain
Distributions |
| MFS Institutional Money Market Portfolio | $108,753 | $— |
(8) LIBOR Transition
Certain of the fund's investments, including investments in certain debt instruments and derivatives (if any), as well as borrowings by the fund and certain other contractual arrangements of the fund, may be based on the London Interbank Offered Rate (“LIBOR”). In 2017, the regulatory authority that oversees financial services firms in the United Kingdom announced plans to transition away from LIBOR by the end of 2021. In March 2021, the administrator of LIBOR announced the extension of the publication of the more commonly used U.S. dollar LIBOR settings to the end of June 2023. Although the full impacts of the transition away from LIBOR are not fully known, the transition may result in, among other things, an increase in volatility or illiquidity of the markets for instruments that currently rely on LIBOR to determine interest rates and this could have an adverse impact on the fund's performance. With respect to the fund's accounting for investments, including investments in certain debt instruments and derivatives, as well as borrowings by the fund and any other contractual arrangements of the fund that undergo reference rate-related modifications as a result of the transition, management will rely upon the relief provided by FASB Codification Topic 848 – Reference Rate Reform (Topic 848). The guidance in Topic 848 permits the fund to account for those modified contracts as a continuation of the existing contracts. The situation remains fluid, and management believes, based on best available information, that the impact of the transition will not be material to the fund.
Report of Independent Registered Public Accounting Firm
To the Trustees and Shareholders of MFS Intermediate Income Trust:
Results of Review of Interim Financial Statements
We have reviewed the accompanying statement of assets and liabilities of MFS Intermediate Income Trust (the “Trust”), including the portfolio of investments, as of April 30, 2023, and the related statements of operations and changes in net assets and the financial highlights for the six-month period ended April 30, 2023, and the related notes. Based on our review, we are not aware of any material modifications that should be made to the accompanying interim financial statements and financial highlights for them to be in conformity with accounting principles generally accepted in the United States of America.
We have previously audited, in accordance with the standards of the Public Company Accounting Oversight Board (United States) (PCAOB), the statement of assets and liabilities, including the portfolio of investments, as of October 31, 2022 (not presented herein), the related statement of operations for the year ended October 31, 2022 (not presented herein), the statements of changes in net assets for the years ended October 31, 2022, and October 31, 2021 (2021 not presented herein) and the financial highlights for each of the five years in the period ended October 31, 2022; and in our report dated December 15, 2022, we expressed an unqualified opinion on those financial statements.
Basis for Review Results
These interim financial statements and financial highlights are the responsibility of the Trust's management. We are a public accounting firm registered with the PCAOB and are required to be independent with respect to the Fund in accordance with the U.S. federal securities laws and the applicable rules and regulations of the Securitiesand Exchange Commission and the PCAOB.
We conducted our review in accordance with the standards of the PCAOB. A review of interim financial information consists principally of applying analytical procedures and making inquiries of persons responsible for financial and accounting matters. It is substantially less in scope than an audit conducted in accordance with the standards of the PCAOB, the objective of which is the expression of an opinion regarding the financial statements taken as a whole. Accordingly, we do not express such an opinion.
DELOITTE & TOUCHE LLP
Boston, Massachusetts
June 15, 2023
We have served as the auditor of one or more of the MFS investment companies since 1924.
Proxy Voting Policies and Information
MFS votes proxies on behalf of the fund pursuant to proxy voting policies and procedures that are available without charge, upon request, by calling 1-800-225-2606, by visiting mfs.com/proxyvoting, or by visiting the SEC’s Web site at http://www.sec.gov.
Information regarding how the fund voted proxies relating to portfolio securities during the most recent twelve-month period ended June 30 is available by August 31 of each year without charge by visiting mfs.com/proxyvoting, or by visiting the SEC’s Web site at http://www.sec.gov.
Quarterly Portfolio Disclosure
The fund files a complete schedule of portfolio holdings with the SEC for the first and third quarters of each fiscal year as an exhibit to its reports on Form N-PORT. The fund’s Form N-PORT reports are available on the SEC’s Web site at http://www.sec.gov. A shareholder can obtain the portfolio holdings report for the first and third quarters of the fund's fiscal year at mfs.com/closedendfunds by choosing the fund's name and then scrolling to the “Resources” section and clicking on the “Prospectus and Reports” tab.
Further Information
From time to time, MFS may post important information about the fund or the MFS Funds on the MFS Web site (mfs.com). This information is available at https://www.mfs.com/announcements or at mfs.com/closedendfunds by choosing the fund's name and then scrolling to the “Resources” section and clicking on the “Announcements” tab, if any.
Additional information about the fund (e.g., performance, dividends and the fund’s price history) is also available at mfs.com/closedendfunds by choosing the fund's name, if any.
INFORMATION ABOUT FUND CONTRACTS AND LEGAL CLAIMS
The fund has entered into contractual arrangements with an investment adviser, administrator, transfer agent, and custodian who each provide services to the fund. Unless expressly stated otherwise, shareholders are not parties to, or intended beneficiaries of these contractual arrangements, and these contractual arrangements are not intended to create any shareholder right to enforce them against the service providers or to seek any remedy under them against the service providers, either directly or on behalf of the fund.
Under the Trust’s By-Laws and Declaration of Trust, any claims asserted against or on behalf of the MFS Funds, including claims against Trustees and Officers, must be brought in state and federal courts located within the Commonwealth of Massachusetts.
CONTACT US
TRANSFER AGENT, REGISTRAR, AND
DIVIDEND DISBURSING AGENT
CALL
1-800-637-2304
9 a.m. to 5 p.m. Eastern time
WRITE
Computershare Trust Company, N.A.
P.O. Box 43078
Providence, RI 02940-3078
New York Stock Exchange Symbol: MIN
Item 1(b):
A copy of the notice transmitted to the Registrant's shareholders in reliance on Rule 30e-3 of the Investment Company Act of 1940, as amended that contains disclosure specified by paragraph (c)(3) of Rule 30e-3 is attached hereto as EX-99.30e-3Notice.
ITEM 2. CODE OF ETHICS.
During the period covered by this report, the Registrant has not amended any provision in its Code of Ethics (the "Code") that relates to an element of the Code's definition enumerated in paragraph (b) of Item 2 of this Form N-CSR. During the period covered by this report, the Registrant did not grant a waiver, including an implicit waiver, from any provision of the Code.
ITEM 3. AUDIT COMMITTEE FINANCIAL EXPERT.
Not applicable for semi-annual reports.
ITEM 4. PRINCIPAL ACCOUNTANT FEES AND SERVICES.
Not applicable for semi-annual reports.
ITEM 5. AUDIT COMMITTEE OF LISTED REGISTRANTS.
Not applicable for semi-annual reports.
ITEM 6. INVESTMENTS
A schedule of investments of the Registrant is included as part of the report to shareholders of the Registrant under Item 1(a) of this Form N-CSR.
ITEM 7. DISCLOSURE OF PROXY VOTING POLICIES AND PROCEDURES FOR CLOSED-END MANAGEMENT INVESTMENT COMPANIES.
Not applicable for semi-annual reports.
ITEM 8. PORTFOLIO MANAGERS OF CLOSED-END MANAGEMENT INVESTMENT COMPANIES.
Portfolio Manager(s)
Information regarding the portfolio manager(s) of the MFS Intermediate Income Trust (the "Fund") is set forth below. Each portfolio manager is primarily responsible for the day-to-day management of the Fund.
Effective May 31, 2023, Jake Stone became a portfolio manager of the Fund.
Portfolio Manager | Primary Role | Since | Title and Five Year History |
Geoffrey Schechter | Lead Portfolio Manager | 2017 | Investment Officer of MFS; employed in the investment |
| | | area of MFS since 1993 |
Alexander Mackey | Investment Grade Debt Instruments Portfolio | 2017 | Investment Officer of MFS; employed in the investment |
| Manager | | area of MFS since 2001 |
| | | Investment Officer of MFS; employed in the investment |
| | | area of MFS since July 2018; Vice President, Wellington |
Jake Stone | U.S. Government Securities Portfolio Manager | May 2023 | Management Company, LLP prior to July 2018 |
Compensation
MFS' philosophy is to align portfolio manager compensation with the goal to provide shareholders with long-term value through a collaborative investment process. Therefore, MFS uses long-term investment performance as well as contribution to the overall investment process and collaborative culture as key factors in determining portfolio manager compensation. In addition, MFS seeks to maintain total compensation programs that are competitive in the asset management industry in each geographic market where it has employees. MFS uses competitive compensation data to ensure that compensation practices are aligned with its goals of attracting, retaining, and motivating the highest-quality professionals.
MFS reviews portfolio manager compensation annually. In determining portfolio manager compensation, MFS uses quantitative means and qualitative means to help ensure a durable investment process. As of December 31, 2022 portfolio manager total cash compensation is a combination of base salary and performance bonus:
Base Salary – Base salary generally represents a smaller percentage of portfolio manager total cash compensation than performance bonus. Performance Bonus – Generally, the performance bonus represents more than a majority of portfolio manager total cash compensation.
The performance bonus is based on a combination of quantitative and qualitative factors, generally with more weight given to the former and less weight given to the latter.
The quantitative portion is primarily based on the pre-tax performance of accounts managed by the portfolio manager over a range of fixed- length time periods, intended to provide the ability to assess performance over time periods consistent with a full market cycle and a strategy's investment horizon. The fixed-length time periods include the portfolio manager's full tenure on each fund and, when available,
10-, 5-, and 3-year periods. For portfolio managers who have served for less than three years, shorter-term periods, including the one-year period, will also be considered, as will performance in previous roles, if any, held at the firm. Emphasis is generally placed on longer performance periods when multiple performance periods are available. Performance is evaluated across the full set of strategies and portfolios managed by a given portfolio manager, relative to appropriate peer group universes and/or representative indices ("benchmarks"). As of December 31, 2022, the following benchmarks were used to measure the following portfolio manager's performance for the Fund, unless otherwise indicated:
Fund | Portfolio Manager | Benchmark(s) |
MFS Intermediate Income Trust | Geoffrey Schechter | Bloomberg U.S. Intermediate Government/Credit Bond Index |
| Alexander Mackey | Bloomberg U.S. Intermediate Government/Credit Bond Index |
| Jake Stone1 | Bloomberg U.S. Intermediate Government/Credit Bond Index |
1Became a portfolio manager of the Fund after the date referenced above; therefore, information is as of May 31, 2023.
Benchmarks may include versions and components of indices, custom indices, and linked indices that combine performance of different indices for different portions of the time period, where appropriate.
The qualitative portion is based on the results of an annual internal peer review process (where portfolio managers are evaluated by other portfolio managers, analysts, and traders) and management's assessment of overall portfolio manager contribution to the MFS investment process and the client experience (distinct from fund and other account performance).
The performance bonus is generally a combination of cash and a deferred cash award. A deferred cash award is issued for a cash value and becomes payable over a three-year vesting period if the portfolio manager remains in the continuous employ of MFS or its affiliates. During the vesting period, the value of the unfunded deferred cash award will fluctuate as though the portfolio manager had invested the cash value of the award in an MFS Fund(s) selected by the portfolio manager.
MFS Equity Plan – Portfolio managers also typically benefit from the opportunity to participate in the MFS Equity Plan. Equity interests are awarded by management, on a discretionary basis, taking into account tenure at MFS, contribution to the investment process, and other factors.
Finally, portfolio managers also participate in benefit plans (including a defined contribution plan and health and other insurance plans) and programs available generally to other employees of MFS. The percentage such benefits represent of any portfolio manager's compensation depends upon the length of the individual's tenure at MFS and salary level, as well as other factors.
Ownership of Fund Shares
The following table shows the dollar range of equity securities of the Fund beneficially owned by the Fund's portfolio manager(s) as of the Fund's fiscal year ended October 31, 2022, unless otherwise indicated. The following dollar ranges apply:
N. None
A. $1 – $10,000
B. $10,001 – $50,000
C. $50,001 – $100,000
D. $100,001 – $500,000
E. $500,001 – $1,000,000
F. Over $1,000,000
1Became a portfolio manager of the Fund after the date referenced above; therefore, information is as of May 31, 2023.
Name of Portfolio Manager | Dollar Range of Equity Securities in Fund |
Geoffrey Schechter | N |
Alexander Mackey | N |
Jake Stone1 | N |
Other Accounts
In addition to the Fund, each portfolio manager of the Fund is named as a portfolio manager of certain other accounts managed or sub- advised by MFS or an affiliate. The number and assets of these accounts were as follows as of the Fund's fiscal year ended October 31, 2022, unless otherwise indicated:
| Registered Investment Companies* | Other Pooled Investment Vehicles | Other Accounts |
Name | Number of Accounts | Total | Number of | Total Assets | Number of | Total Assets |
| | Assets | Accounts | | Accounts | |
Geoffrey Schechter | 15 | $20.4 billion | 4 | $738.9 million | 1 | $236.0 million |
| | | | | | |
Alexander Mackey | 19 | $32.7 billion | 5 | $1.9 billion | 5 | $336.1 million |
| | | | | | |
Jake Stone1 | 5 | $5.5 billion | 2 | $455.3 million | 0 | N/A |
*Includes the Fund
1Became a portfolio manager of the Fund after the date referenced above; therefore, information is as of May 31, 2023.
Advisory fees are not based upon performance of any of the accounts identified in the table above.
Potential Conflicts of Interest
MFS seeks to identify potential conflicts of interest resulting from a portfolio manager's management of both the Fund and other accounts, and has adopted policies and procedures designed to address such potential conflicts. There is no guarantee that MFS will be successful in identifying or mitigating conflicts of interest.
The management of multiple funds and accounts (including accounts in which MFS or an affiliate has an interest) gives rise to conflicts of interest if the funds and accounts have different objectives and strategies, benchmarks, time horizons, and fees, as a portfolio manager must allocate his or her time and investment ideas across multiple funds and accounts. In certain instances, there are securities which are suitable for the Fund's portfolio as well as for one or more other accounts advised by MFS or its subsidiaries (including accounts in which MFS or an affiliate has an interest) with similar investment objectives. MFS' trade allocation policies could have a detrimental effect on the Fund if the Fund's orders do not get fully executed or are delayed in getting executed due to being aggregated with those of other accounts advised by MFS or its subsidiaries. A portfolio manager may execute transactions for another fund or account that may adversely affect the value of the Fund's investments. Investments selected for funds or accounts other than the Fund may outperform investments selected for the Fund.
When two or more accounts are simultaneously engaged in the purchase or sale of the same security, the securities are allocated among clients in a manner believed by MFS to be fair and equitable to each over time. Allocations may be based on many factors and may not always be pro rata based on assets managed. The allocation methodology could have a detrimental effect on the price or availability of a security with respect to the Fund.
MFS and/or a portfolio manager may have a financial incentive to allocate favorable or limited opportunity investments or structure the timing of investments to favor accounts other than the Fund; for instance, those that pay a higher advisory fee and/or have a performance adjustment, those that include an investment by the portfolio manager, and/or those in which MFS, its officers and/or employees, and/or its affiliates own or have an interest.
To the extent permitted by applicable law, certain accounts may invest their assets in other accounts advised by MFS or its affiliates, including accounts that are advised by one or more of the same portfolio manager(s), which could result in conflicts of interest relating to asset allocation, timing of purchases and redemptions, and increased profitability for MFS, its affiliates, and/or its personnel, including portfolio managers.

ITEM 9. PURCHASES OF EQUITY SECURITIES BY CLOSED-END MANAGEMENT INVESTMENT COMPANY AND AFFILIATED PURCHASERS.
MFS Intermediate Income Trust
| | | | (c) Total Number of | (d) Maximum Number |
| | | | Shares Purchased as | (or Approximate |
| | (a) Total number of | (b) Average | Part of Publicly | Dollar Value) of |
| Period | Shares Purchased | Price Paid | Announced Plans or | Shares that May Yet |
| | | per Share | Programs | Be Purchased under |
| | | | | the Plans or Programs |
| | | | | |
| 11/01/22-11/30/22 | 0 | N/A | 0 | 11,363,813 |
| 12/01/22-12/31/22 | 108,092 | 2.79 | 108,092 | 11,255,721 |
| 1/01/23-1/31/23 | 0 | N/A | 0 | 11,255,721 |
| 2/01/23-2/28/23 | 0 | N/A | 0 | 11,255,721 |
| 3/01/23-3/31/23 | 341,471 | 2.81 | 341,471 | 10,914,250 |
| 4/01/23-4/30/23 | 135,969 | 2.80 | 135,969 | 10,778,554 |
| Total | 585,259 | 2.80 | 585,259 | |
Note: The Board approved procedures to repurchase shares and reviews the results periodically. The notification to shareholders of the program is part of the semi-annual and annual reports sent to shareholders. These annual programs begin on October 1st of each year. The programs conform to the conditions of Rule 10b-18 of the Securities Exchange Act of 1934 and limit the aggregate number of shares that may be purchased in each annual period (October 1 through the following September 30) to 10% of the Registrant's outstanding shares as of the first day of the plan year (October 1). The aggregate number of shares available for purchase for the October 1, 2022 plan year is 11,503,806.
ITEM 10. SUBMISSION OF MATTERS TO A VOTE OF SECURITY HOLDERS.
There were no material changes to the procedures by which shareholders may send recommendations to the Board for nominees to the Registrant's Board since the Registrant last provided disclosure as to such procedures in response to the requirements of Item 407 (c)(2)(iv) of Regulation S-K or this Item.
ITEM 11. CONTROLS AND PROCEDURES.
(a)Based upon their evaluation of the effectiveness of the registrant's disclosure controls and procedures (as defined in Rule 30a-3(c) under the Investment Company Act of 1940 (the "Act")) as conducted within 90 days of the filing date of this report on Form N-CSR, the Registrant's principal financial officer and principal executive officer have concluded that those disclosure controls and procedures provide reasonable assurance that the material information required to be disclosed by the Registrant on this report is recorded, processed, summarized and reported within the time periods specified in the Securities and Exchange Commission's rules and forms.
(b)There were no changes in the Registrant's internal controls over financial reporting (as defined in Rule 30a-3(d) under the Act) that occurred during the period covered by the report that have materially affected, or are reasonably likely to materially affect, the Registrant's internal control over financial reporting.
ITEM 12. DISCLOSURE OF SECURITIES LENDING ACTIVITIES FOR CLOSED-END MANAGEMENT INVESTMENT COMPANIES.
Not applicable for semi-annual reports.
ITEM 13. EXHIBITS.
(a)(1) Any code of ethics, or amendment thereto, that is the subject of the disclosure required by Item 2, to the extent that the registrant intends to satisfy the Item 2 requirements through filing of an exhibit: Not applicable.
(2)A separate certification for each principal executive officer and principal financial officer of the registrant as required by Rule 30a-2(a) under the Act (17 CFR 270.30a-2): Attached hereto as EX-99.302CERT.
(3)Any written solicitation to purchase securities under Rule 23c-1 under the Act (17 CFR 270.23c-1) sent or given during the period covered by the report by or on behalf of the registrant to 10 or more persons. Not applicable.
(4)Change in the registrant's independent public accountant. Not applicable.
(b)If the report is filed under Section 13(a) or 15(d) of the Exchange Act, provide the certifications required by Rule 30a-2(b) under the Act (17 CFR 270.30a-2(b)), Rule 13a-14(b) or Rule 15d-14(b) under the Exchange Act (17 CFR 240.13a-14(b) or 240.15d-14(b)) and Section 1350 of Chapter 63 of Title 18 of the United States Code (18 U.S.C. 1350) as an exhibit. A certification furnished pursuant to this paragraph will not be deemed "filed" for the purposes of Section 18 of the Exchange Act (15 U.S.C. 78r), or otherwise subject to the liability of that section. Such certification will not be deemed to be incorporated by reference into any filing under the Securities Act of 1933 or the Exchange Act, except to the extent that the registrant specifically incorporates it by reference. Attached hereto as EX-99.906CERT.
(c)Registrant's Rule 30e-3 Notice pursuant to Item 1(b) of Form N-CSR. Attached hereto as EX-99.30e-3Notice.
(d)Notices to Trust's common shareholders in accordance with Investment Company Act Section 19(a) and Rule 19a-1. Attached hereto as Ex-99.19a-1.
Notice
A copy of the Amended and Restated Declaration of Trust, as amended, of the Registrant is on file with the Secretary of State of The Commonwealth of Massachusetts and notice is hereby given that this instrument is executed on behalf of the Registrant by an officer of the Registrant as an officer and not individually and the obligations of or arising out of this instrument are not binding upon any of the Trustees or shareholders individually, but are binding only upon the assets and property of the respective constituent series of the Registrant.
SIGNATURES
Pursuant to the requirements of the Securities Exchange Act of 1934 and the Investment Company Act of 1940, the registrant has duly caused this report to be signed on its behalf by the undersigned, thereunto duly authorized.
(Registrant) MFS INTERMEDIATE INCOME TRUST
By (Signature and Title)*
/S/ DAVID L. DILORENZO
David L. DiLorenzo, President
Date: June 15, 2023
Pursuant to the requirements of the Securities Exchange Act of 1934 and the Investment Company Act of 1940, this report has been signed below by the following persons on behalf of the registrant and in the capacities and on the dates indicated.
By (Signature and Title)*
/S/ DAVID L. DILORENZO
David L. DiLorenzo, President (Principal Executive Officer)
Date: June 15, 2023
By (Signature and Title)*
/S/ JAMES O. YOST
James O. Yost, Treasurer (Principal Financial Officer and Accounting Officer) Date: June 15, 2023
* Print name and title of each signing officer under his or her signature.