EDISON INTERNATIONAL® Leading the Way in Electricity SM 2007 Financial Teleconference February 27, 2008 Exhibit 99.2 |
EDISON INTERNATIONAL® 1 Leading the Way in Electricity SM Forward-Looking Statements Statements contained in this presentation about future performance, including, without limitation, earnings, asset and rate base growth, load growth, capital investments, and other statements that are not purely historical, are forward-looking statements. These forward- looking statements reflect our current expectations; however, such statements involve risks and uncertainties. Actual results could differ materially from current expectations. Important factors that could cause different results are discussed under the headings “Risk Factors” and “Management’s Discussion and Analysis” in Edison International’s most recent Form 10-K and other reports filed with the Securities and Exchange Commission and available on our website: www.edisoninvestor.com. These forward-looking statements represent our expectations only as of the date of this presentation, and Edison International assumes no duty to update them to reflect new information, events or circumstances. |
EDISON INTERNATIONAL® 2 Leading the Way in Electricity SM 1 Reported earnings per share refers to basic earnings per share. See slide 3 for reconciliation of core earnings to reported earnings. Core earnings is defined as reported earnings less income from discontinued operations and other non-core items. GAAP Net Income ($ millions) Reported EPS Core 1 Net Income ($ millions) EPS Fourth Quarter Earnings Summary $211 $288 4Q 07 4Q 06 $214 $215 4Q 07 4Q 06 $0.64 $0.87 4Q 07 4Q 06 $0.65 $0.65 4Q 07 4Q 06 |
EDISON INTERNATIONAL® 3 Leading the Way in Electricity SM Fourth Quarter Financial Results Reconciliation of Core Earnings to Reported Earnings 1 See use of Non-GAAP Financial Measures in appendix. The impact of participating securities is included in EIX parent company and other, and was $(0.01) per share for each of the quarters ended December 31, 2007 and 2006. 2 EMMT overhead is included in Corporate Expense and Other Items. Core Earnings Variances SCE Settlement of a tariff dispute 0.05 EMG Midwest Generation Lower interest expense from debt repayment in 2Q 07 and higher 0.06 realized energy margin, partially offset by higher maintenance costs and SFAS #133 impact Homer City Higher energy margin, mostly offset by SFAS #133 impact 0.01 EMMT 2 Higher trading margin 0.05 Corporate Expense and Other Items (0.07) Edison Capital 2006 infrastructure fund gains and other (0.11) Non-Core Variances SCE 4Q 06 resolution of a state tax apportionment issue $0.15 (0.16) and generator refund incentive $0.01 EMG 4Q 07 includes ($0.01) from discontinued operations; 4Q 06 (0.07) includes $0.07 from discontinued operations and ($0.01) from early debt extinguishment charges Core Earnings 4Q 07 4Q 06 Var. SCE $ 0.37 $ 0.32 $ 0.05 EMG 0.30 0.36 (0.06) EIX parent company (0.02) (0.03) 0.01 and other Core EPS 1 $ 0.65 $ 0.65 $ – Non-core Items SCE $ – $ 0.16 $ (0.16) EMG (0.01) 0.06 (0.07) Total Non-Core $ (0.01) $ 0.22 $ (0.23) Basic EPS $ 0.64 $ 0.87 $ (0.23) Diluted EPS $ 0.64 $ 0.87 $ (0.23) |
EDISON INTERNATIONAL® 4 Leading the Way in Electricity SM GAAP Net Income ($ millions) Reported EPS Core 1 Net Income ($ millions) EPS Full-Year Earnings Summary $1,098 $1,181 2007 2006 $1,217 $1,015 2007 2006 $3.33 $3.58 2007 2006 $3.69 $3.07 2007 2006 1 Reported earnings per share refers to basic earnings per share. See slide 5 for reconciliation of core earnings to reported earnings. Core earnings is defined as reported earnings less income from discontinued operations and other non-core items. |
EDISON INTERNATIONAL® 5 Leading the Way in Electricity SM Full-Year Financial Results Reconciliation of Core Earnings to Reported Earnings 1 See use of Non-GAAP Financial Measures in appendix. The impact of participating securities is included in EIX parent company and other, and was $(0.04) and $(0.05) per share for year-to-date December 31, 2007 and 2006, respectively. 2 EMMT overhead is included in Corporate Expense and Other Items. Core Earnings Variances SCE Higher operating margin and lower income taxes, partially offset by 0.18 higher net interest expense EMG Midwest Generation Higher energy margin (generation and realized energy prices) and 0.39 lower interest expense, partially offset by SFAS #133 impact and higher maintenance costs Homer City Higher energy margin (generation and realized energy prices), partially 0.14 offset by SFAS #133 impact Income from Other Projects 0.07 EMMT 2 Higher trading margin 0.03 Corporate Expense and Other Items Higher development costs, corporate expenses and other (0.15) Edison Capital 2006 infrastructure fund gains and other (0.06) Non-Core Variances SCE 2007: $0.10 income tax treatment of certain environmental (0.39) remediation costs; 2006: $0.40 resolution of regulatory and tax issues, generator settlement $0.07, and generator refund incentive $0.02 EMG 2007 and 2006 include ($0.45) and ($0.28) for early debt (0.48) extinguishment charges, and ($0.01) and $0.30 for discontinued operations, respectively Core Earnings 2007 2006 Var. SCE $ 2.07 $ 1.89 $ 0.18 EMG 1.72 1.30 0.42 EIX parent company (0.10) (0.12) 0.02 and other Core EPS¹ $ 3.69 $ 3.07 $ 0.62 Non-core Items SCE $ 0.10 $ 0.49 $ (0.39) EMG (0.46) 0.02 (0.48) Total Non-Core $ (0.36) $ 0.51 $ (0.87) Basic EPS $ 3.33 $ 3.58 $ (0.25) Diluted EPS $ 3.31 $ 3.57 $ (0.26) |
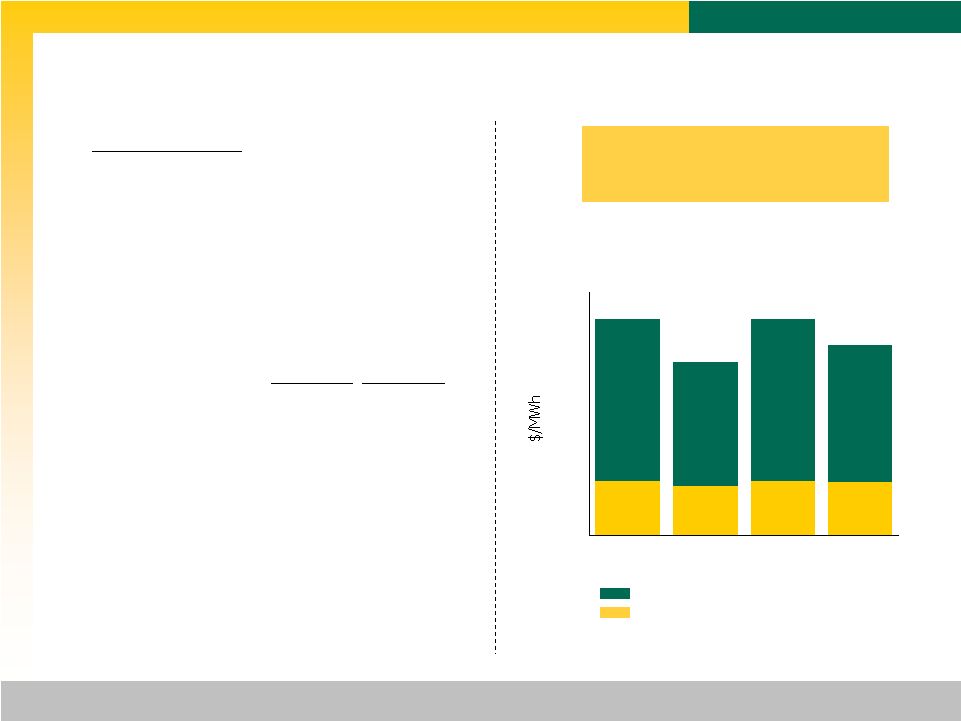
EDISON INTERNATIONAL® 6 Leading the Way in Electricity SM Midwest Generation – Operating Performance Average fuel and emission costs ($/MWh) Average realized gross margin ($/MWh)² 2007 vs. 2006 • Generation up 3.7% • Forced Outage Rate impacted by unplanned maintenance outages at Powerton Station (1,538 MW) during 4Q 07. Both units currently back on line. All-in average realized price increased 13% in 2007 compared to last year 1 Includes the price of energy, capacity, ancillary services, etc. 2 Average realized gross margin is equal to all-in average realized prices less average fuel and emission costs. $53.53 $42.95 $53.36 $47.03 Operating Statistics Total Generation (GWh) 29,961 28,898 Equivalent Availability 75.8 % 79.3 % Capacity Factor 60.9 % 58.8 % Load Factor 80.4 % 74.1 % Forced Outage Rate 9.7 % 7.9 % 2007 2006 All-in Average Realized Prices 1 $13.36 $13.19 $40.28 $30.69 $40.00 $33.84 $13.25 $12.26 $0 $20 $40 $60 4Q 07 4Q 06 2007 2006 |
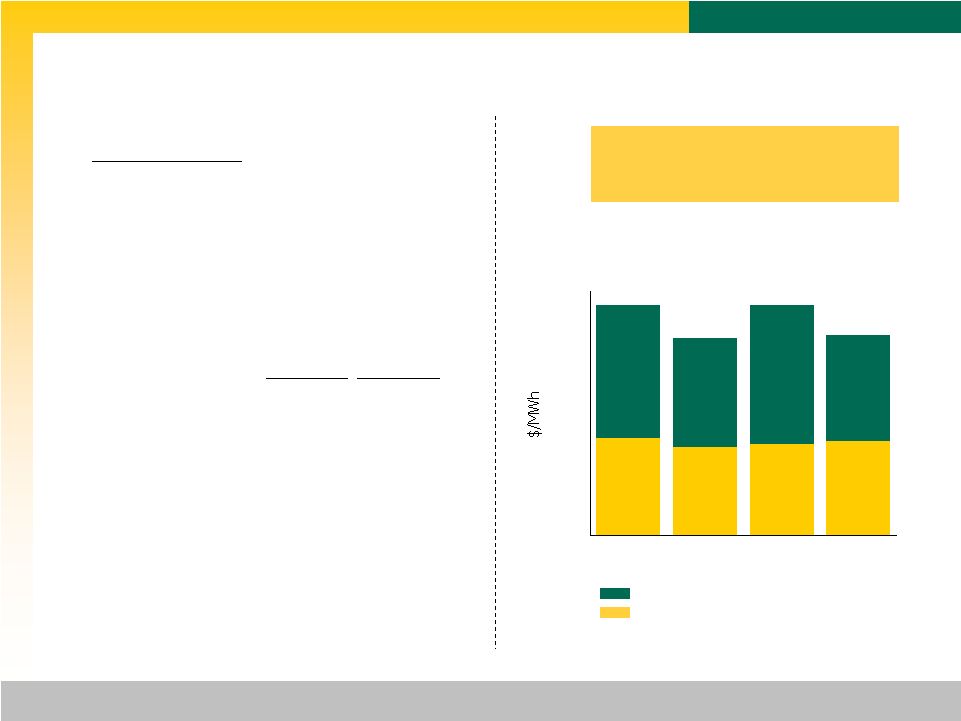
EDISON INTERNATIONAL® 7 Leading the Way in Electricity SM Homer City – Operating Performance Operating Statistics Total Generation (GWh) 13,649 12,286 Equivalent Availability 89.4 % 81.9 % Capacity Factor 82.5 % 74.3 % Load Factor 92.4 % 90.7 % Forced Outage Rate 4.1 % 13.5 % 2007 2006 1 Includes the price of energy, capacity, ancillary services, etc. 2 Average realized gross margin is equal to all-in average realized prices less average fuel and emission costs. Average fuel and emission costs ($/MWh) Average realized gross margin ($/MWh) 2 All-in average realized price increased 15% in 2007 compared to last year 2007 vs. 2006 • Generation up 11.1% • Strong operating performance across the board in 2007 $56.68 $48.61 $56.52 $49.20 All-in Average Realized Prices 1 $22.45 $23.06 $32.85 $27.05 $34.07 $26.14 $21.56 $23.83 $0 $20 $40 $60 4Q 07 4Q 06 2007 2006 |
EDISON INTERNATIONAL® 8 Leading the Way in Electricity SM EMG Hedge Program Status 1 The amount of power sold is a portion of the retail load of the purchasing utility and can vary significantly with variations in that retail load. Retail load depends upon a number of factors, including the time of day and year, and the utility’s number of new and continuing customers. Estimated MWh have been forecast based on historical patterns and on assumptions regarding the factors that may affect retail loads in the future. The actual load will vary from that used for the above estimate, and the amount of variation may be material. 2 The average price per MWh, which is subject to a seasonal price adjustment, represents the sale of a bundled product that includes, but is not limited to, energy, capacity and ancillary services. Also, Midwest Generation will incur charges from PJM as a load-serving entity. Thus, the average price per MWh is not comparable to the sale of power under an energy only contract. The average price per MWh represents the sale of the bundled product based on an estimated customer load profile. 3 Homer City hedge position for 2009 was incorrectly reported as 3,890/GWh at September 30, 2007. The correct hedge position for 2009 was 2,867/GWh. There was no change in the hedge position during the fourth quarter. 4 The average price/MWh for Homer City’s hedge position is based on PJM West Hub prices. As a result of transmission congestion in the PJM, actual energy prices at the Homer City busbar have been lower than those at the PJM West Hub. 3 Status at December 31, 2007 2008 2009 2010 Midwest Generation Energy Only Contracts Megawatt hours (in GWh) 10,838 7,692 3,472 Average Price ($/MWh) $61.27 $62.38 $62.62 Load Requirement Services Contracts Estimated GWh 1 5,613 1,632 — Average Price ($/MWh) 2 $64.01 $63.65 — Total estimated GWh hedged 16,451 9,324 3,472 Coal under contract (in millions of tons) 17.5 11.7 11.7 Homer City Total estimated GWh hedged 7,232 2,867 1,022 Average Price ($/MWh) 4 $60.85 $73.84 $77.80 Coal under contract (in millions of tons) 5.7 4.4 0.3 |

Leading the Way in Electricity SM
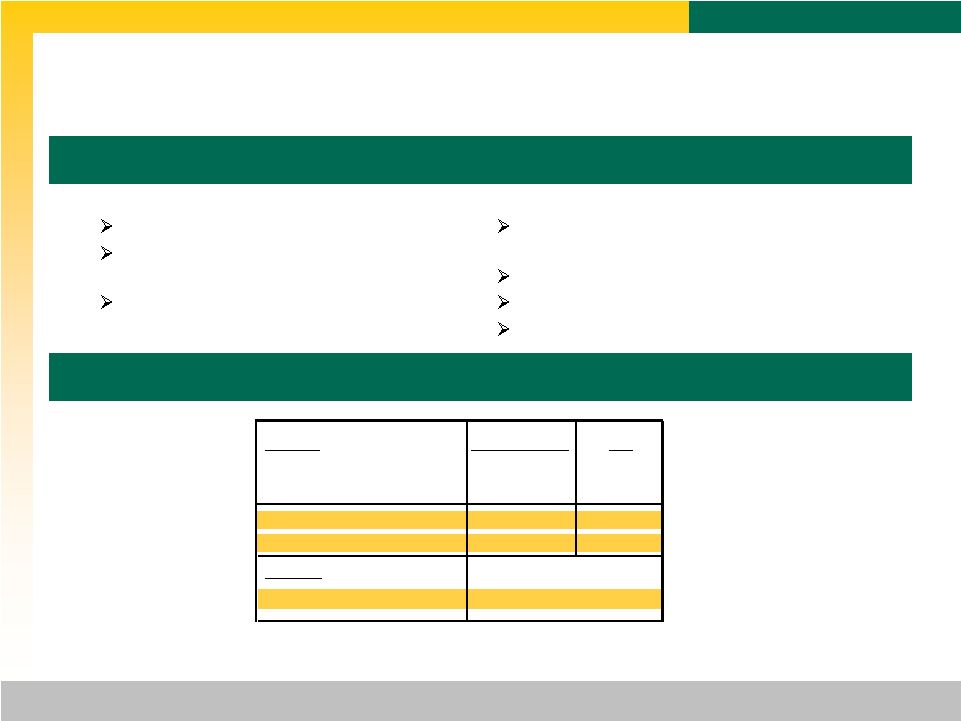
EMG Capacity Sales
Status at December 31, 2007
Jan. 1, 2007 — May 31, 2008 June 1, 2008 — May 31, 2009 June 1, 2009 — May 31, 2010 June 1, 2010 — May 31, 2011
Midwest Homer Midwest Homer Midwest Homer Midwest Homer
Megawatts except price per MW-day Generation City Generation City Generation City Generation City
INSTALLED CAPACITY 5,776 1,884 5,776 1,884 5,776 1,884 5,477 1,884
Less: Net capacity held due to load
requirement services contracts,1
and retained for outages(2,673)(207)(1,613)(173)(447)(214)(548)(71)
NET CAPACITY AVAILABLE FOR SALE 3,103 1,677 4,163 1,711 5,329 1,670 4,929 1,813
Fixed Price Capacity Sales
RPM Auction Process
• Net Capacity Sold 2,603 786 3,283 820 4,614 1,670 4,929 1,813
• Price per MW-day $ 40.80 $ 40.80 $ 111.92 $ 111.92 $ 102.04 $ 191.32 $ 174.29 $ 174.29
Non-unit Specific Capacity Sales
• Net Capacity Sold 500 — 880 — 715 — — —
• Price per MW-day (Net) $ 21.31 $ — $ 64.35 $ — $ 71.46 $ — $ — $ —
Variable Capacity Sales
Third Party Transaction
• Capacity — 891 — 891 — — — —
• Expected price per MW-day2 $ — $ 66.71 $ — $ 69.50 $ — $ — $ — $ —
TOTAL CAPACITY SOLD 3,103 1,677 4,163 1,711 5,329 1,670 4,929 1,813
AVERAGE PRICE PER MW-DAY $ 37.66 $ 54.57 $ 101.86 $ 89.83 $ 97.94 $ 191.32 $ 174.29 $ 174.29
| | 1 | | Load requirements services contracts include energy, capacity and ancillary services. |
| | 2 | | Actual contract price for Homer City sale is a function of NYISO capacity auction clearing prices. Expected price per MW-day is based on forward over-the-counter NYISO prices on December 31, 2007. |
9
EDISON INTERNATIONAL®
Leading the Way in Electricity SM
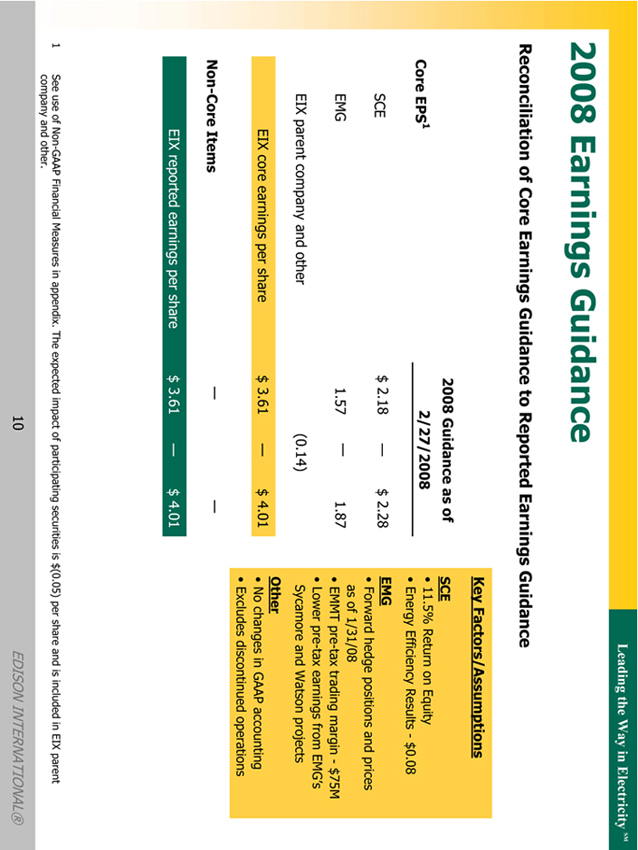
2008 Earnings Guidance
Reconciliation of Core Earnings Guidance to Reported Earnings Guidance
2008 Guidance as of
Core EPS1 2/27/2008
SCE $ 2.18 — $ 2.28
EMG 1.57 — 1.87
EIX parent company and other (0.14)
EIX core earnings per share $ 3.61 — $ 4.01
Non-Core Items — —
EIX reported earnings per share $ 3.61 — $ 4.01
— $ 4.01
Key Factors/Assumptions
SCE
• 11.5% Return on Equity
• Energy Efficiency Results - $0.08
EMG
• Forward hedge positions and prices
as of 1/31/08
• EMMT pre-tax trading margin - $75M
• Lower pre-tax earnings from EMG’s
Sycamore and Watson projects
Other
• No changes in GAAP accounting
• Excludes discontinued operations
1 See use of Non-GAAP Financial Measures in appendix. The expected impact of participating securities is $(0.05) per share and is included in EIX parent company and other.
10
EDISON INTERNATIONAL®
EDISON INTERNATIONAL® 11 Leading the Way in Electricity SM Appendix |

Leading the Way in Electricity SM
SCE Capital Investment
Proposed $19 Billion Five-Year Capital Spending Plan
$Billions
$5 $4 $3 $2 $0 2008 2009 2010 2011 2012 $2.8 $3.9 $4.3 $4.4 $3.6
Forecast by Classification $ %
Edison SmartConnectTM 1.2 6
Generation 2.5 13
Transmission 5.5 29
Distribution 9.8 52
Total1 19.0 100
Current Forecast by Proceeding $ %
CPUC Rate Cases 11.8 62
CPUC Project Specific 1.8 10
FERC Rate Cases 5.4 28
Total1 19.0 100
$19 billion capital spending plan over next 5 years
In 2007, SCE substantially advanced major multi-year projects comprising
more than 75% of this plan
| | 1 | | Subject to timely receipt of permitting, licensing and regulatory approvals. Forecast is as of February 2008 and includes $640 million of capital spending for |
DPV2, the majority of which is expected to occur in 2009 and 2010. The Arizona Corporation Commission (ACC) denied approval of the DPV2 project. The denial has resulted in a minimum two-year delay of the project. SCE is evaluating its options for the project.
EDISON INTERNATIONAL®
Leading the Way in Electricity SM
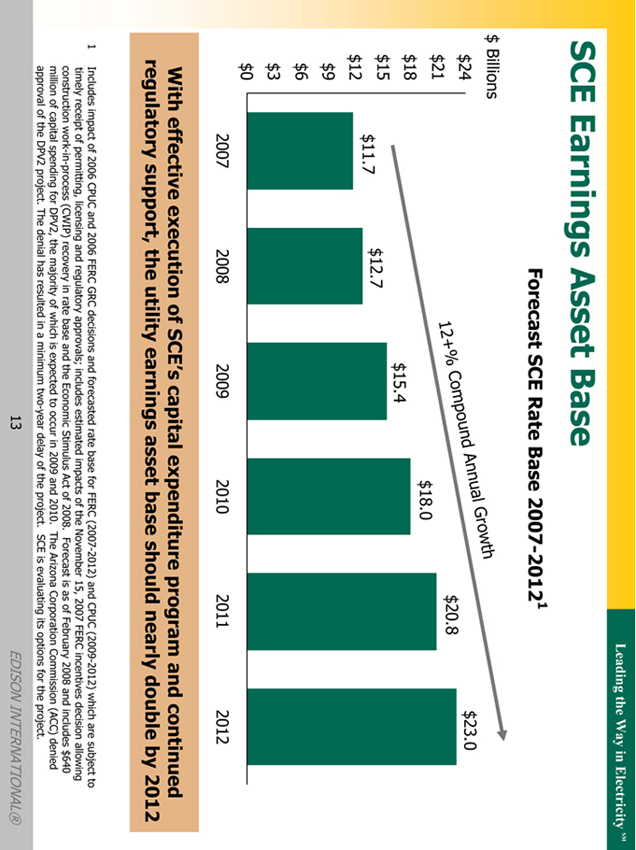
SCE Earnings Asset Base
Forecast SCE Rate Base 2007-20121
$ Billions
$24 $21 $18 $15 $9 $6 $3 $0
12+% Compound Annual Growth
$11.7 $12.7 $15.4 $18.0 $20.8 $23.0
2007 2008 2009 2010 2011 2012
With effective execution of SCE’s capital expenditure program and continued regulatory support, the utility earnings asset base should nearly double by 2012
1 Includes impact of 2006 CPUC and 2006 FERC GRC decisions and forecasted rate base for FERC (2007-2012) and CPUC (2009-2012) which are subject to
timely receipt of permitting, licensing and regulatory approvals; includes estimated impacts of the November 15, 2007 FERC incentives decision allowing construction work-in-process (CWIP) recovery in rate base and the Economic Stimulus Act of 2008. Forecast is as of February 2008 and includes $640 million of capital spending for DPV2, the majority of which is expected to occur in 2009 and 2010. The Arizona Corporation Commission (ACC) denied approval of the DPV2 project. The denial has resulted in a minimum two-year delay of the project. SCE is evaluating its options for the project.
13
EDISON INTERNATIONAL®
EDISON INTERNATIONAL® 14 Leading the Way in Electricity SM EMG Comparative Operating Statistics 4Q 07 4Q 06 Variance % 2007 2006 Variance % Midwest Generation Generation (in GWh) Energy Only contracts 5,062 7,731 22,503 28,898 Load Requirement Services Contracts 1,730 — 7,458 — Total 6,792 7,731 (939) -12% 29,961 28,898 1,063 4% Performance Equivalent Availability Rate (EAF) 67.2% 74.6% -7.4% 75.8% 79.3% -3.5% Forced Outage Rate (EFOR) 18.1% 14.5% 3.6% 9.7% 7.9% 1.8% Pricing Information Average Realized Energy Price ($/MWh) Energy Only Contracts $48.06 $42.51 $5.55 13% $48.79 $46.19 $2.60 6% Load Requirement Services Contracts $63.73 — $63.43 — Average Cost of Fuel ($/MWh) $13.24 $12.26 $0.98 8% $13.36 $13.19 $0.17 — Flat Energy Price - Nihub ($/MWh) $45.92 $37.76 $8.16 22% $45.53 $41.42 $4.11 10% Homer City Generation (in Gwh) 3,437 3,235 202 6% 13,649 12,286 1,363 11% Performance Equivalent Availability Rate (EAF) 90.4% 89.2% 1.2% 89.4% 81.9% 7.5% Forced Outage Rate (EFOR) 5.2% 3.3% 1.9% 4.1% 13.5% -9.4% Pricing Information Average Realized Energy Price ($/MWh) $54.35 $47.34 $7.01 15% $54.40 $48.02 $6.38 13% Average Cost of Fuel ($/MWh) $23.81 $21.56 $2.25 10% $22.45 $23.05 ($0.60) -3% Flat Energy Price - PJM West Hub ($/MWh) $58.68 $41.67 $17.01 41% $59.87 $51.08 $8.79 17% Flat Energy Price - HC Busbar ($/MWh) $51.25 $37.61 $13.64 36% $51.03 $45.15 $5.88 13% Flat Energy Price - Basis (PJM West Hub - HC Busbar) $7.43 $4.06 $3.37 $8.84 $5.93 $2.91 |
EDISON INTERNATIONAL® 15 Leading the Way in Electricity SM EMG - Wind Projects and Pipeline Over 5,000 MW development pipeline in 14 states 1 Data as of December 31, 2007; turbines purchased or committed to support development pipeline. MW In-Service 566 Under Construction 447 Development Pipeline 5,091 Turbines (not shown) 1,166 EMG Wind Portfolio 1 Iowa In-Service 145 MW Pipeline 200 MW Illinois Pipeline 520 MW New York Pipeline 140 MW Maryland Pipeline 95 MW West Virginia Pipeline 232 MW Minnesota In-Service 75 MW Construction 70 MW Pipeline 149 MW Pennsylvania Construction 67 MW Oklahoma In-Service 95 MW Pipeline 300 MW Texas In-Service 161 MW Construction 150 MW Pipeline 480 MW New Mexico In-Service 90 MW Pipeline 1,070 MW Nebraska Pipeline 80 MW Wyoming Construction 141 MW Nevada Pipeline 515 MW Utah Construction 19 MW Pipeline 70MW Wisconsin Pipeline 100 MW Arizona Pipeline 1,140 MW |
EDISON INTERNATIONAL® 16 Leading the Way in Electricity SM No. of Projects MW Projects¹ In-Service 13 566 Under Construction 8 447 Total Projects 21 1,013 Development Pipeline² 39 5,091 Turbines Purchased and under option 1,166 EMG Growth Driver – Wind Energy Development Strategy & Portfolio Wind Project Portfolio & Development Pipeline Wind Energy Development Strategy • Strategic importance to growth plan Contributes to portfolio diversification Objective is to attain national scope and leadership scale Leverages successful wind energy experience to date • Wind energy provides attractive opportunities Growing RPS requirements and national desire for renewables Production tax credits Accelerated depreciation (MACRS) over 5 yrs. Mainly long-term contracts for output 1 Data as of December 31, 2007; turbines purchased or committed to support development pipeline 2 Owned or under exclusive agreements. |
EDISON INTERNATIONAL® 17 Leading the Way in Electricity SM EMG – Liquidity Profile Available Liquidity $2,234 1,230 497 $ 507 2007 $3,149 2,181 495 $ 473 2006 Cash & Short term investments 1 MWG Revolver EME Revolver Sources ($ Millions) $1.1 billion of credit facilities between MWG and EME 1 Excludes $121 million and $73 million of cash collateral held by counterparties at 12/31/07 and 12/31/06, respectively. Total |
Leading the Way in Electricity SM
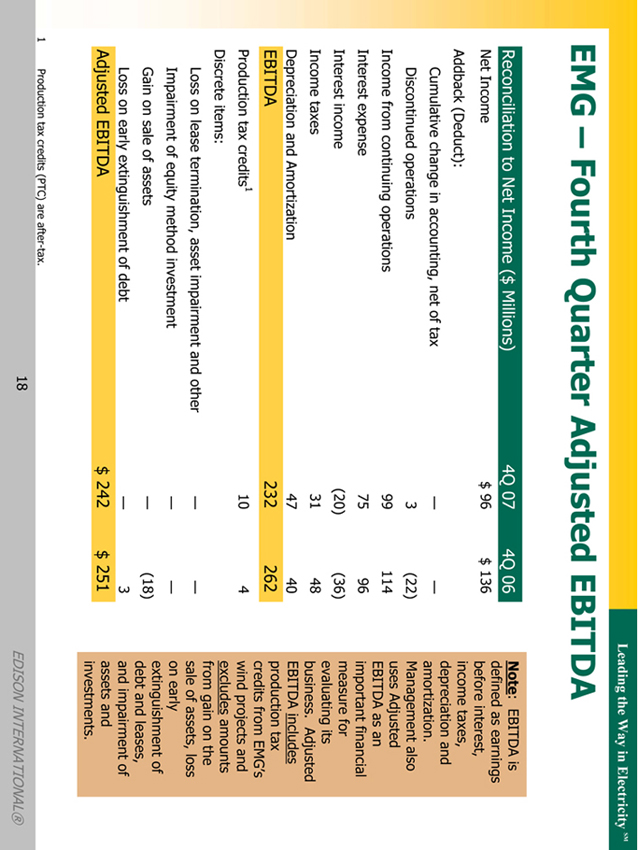
EMG – Fourth Quarter Adjusted EBITDA
Reconciliation to Net Income ($ Millions) 4Q 07 4Q 06
Net Income $ 96 $ 136
Addback (Deduct):
Cumulative change in accounting, net of tax — —
Discontinued operations 3 (22)
Income from continuing operations 99 114
Interest expense 75 96
Interest income (20) (36)
Income taxes 31 48
Depreciation and Amortization 47 40
EBITDA 232 262
Production tax credits1 10 4
Discrete items:
Loss on lease termination, asset impairment and other — —
Impairment of equity method investment — —
Gain on sale of assets — (18)
Loss on early extinguishment of debt — 3
Adjusted EBITDA $ 242 $ 251
Note: EBITDA is defined as earnings before interest, income taxes, depreciation and amortization. Management also uses Adjusted EBITDA as an important financial measure for evaluating its business. Adjusted EBITDA includes production tax credits from EMG’s wind projects and excludes amounts from gain on the sale of assets, loss on early extinguishment of debt and leases, and impairment of assets and investments.
| | 1 | | Production tax credits (PTC) are after-tax. |
18
EDISON INTERNATIONAL®
Leading the Way in Electricity SM
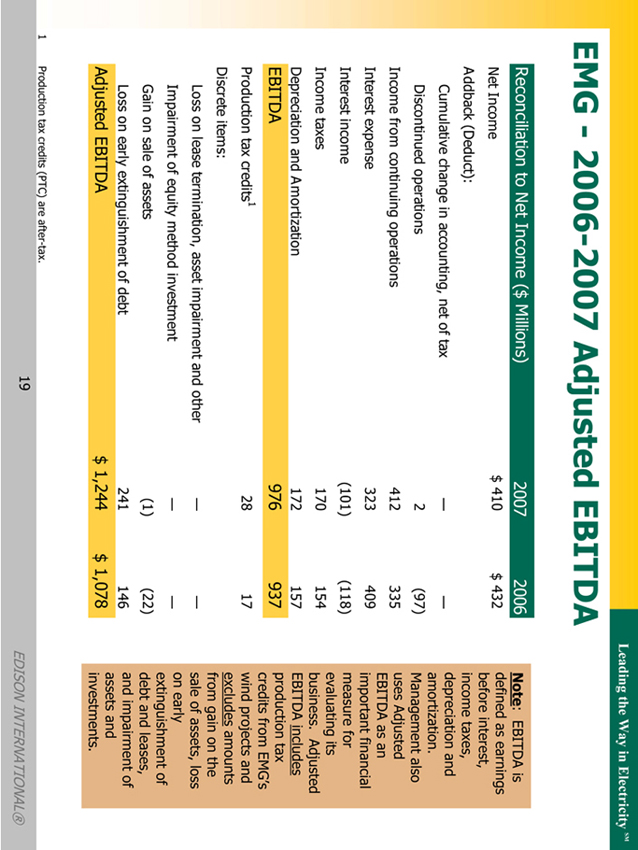
EMG—2006-2007 Adjusted EBITDA
Reconciliation to Net Income ($ Millions) 2007 2006
Net Income $ 410 $ 432
Addback (Deduct):
Cumulative change in accounting, net of tax — —
Discontinued operations 2 (97)
Income from continuing operations 412 335
Interest expense 323 409
Interest income (101) (118)
Income taxes 170 154
Depreciation and Amortization 172 157
EBITDA 976 937
Production tax credits1 28 17
Discrete items:
Loss on lease termination, asset impairment and other — —
Impairment of equity method investment — —
Gain on sale of assets (1) (22)
Loss on early extinguishment of debt 241 146
Adjusted EBITDA $ 1,244 $ 1,078
Note: EBITDA is defined as earnings before interest, income taxes, depreciation and amortization. Management also uses Adjusted EBITDA as an important financial measure for evaluating its business. Adjusted EBITDA includes production tax credits from EMG’s wind projects and excludes amounts from gain on the sale of assets, loss on early extinguishment of debt and leases, and impairment of assets and investments.
| | 1 | | Production tax credits (PTC) are after-tax. |
19
EDISON INTERNATIONAL®
EDISON INTERNATIONAL® 20 Leading the Way in Electricity SM Use of Non-GAAP Financial Measures Edison International’s earnings are prepared in accordance with generally accepted accounting principles used in the United States and represent the company’s earnings as reported to the Securities and Exchange Commission. Our management uses core earnings and EPS by principal operating subsidiary internally for financial planning and for analysis of performance. We also use core earnings and EPS by principal operating subsidiary as primary performance measurements when communicating with analysts and investors regarding our earnings results and outlook, as it allows us to more accurately compare the company’s ongoing performance across periods. Core earnings exclude discontinued operations and other non-core items and are reconciled to basic earnings per common share. EPS by principal operating subsidiary is based on the principal operating subsidiary net income and Edison International’s weighted average outstanding common shares. The impact of participating securities (vested stock options that earn dividend equivalents that may participate in undistributed earnings with common stock) for each principal operating subsidiary is not material to each principal operating subsidiary’s EPS and is therefore reflected in the results of the Edison International holding company, which we refer to as EIX parent company. EPS and core EPS by principal operating subsidiary are reconciled to basic earnings per common share. A reconciliation of Non-GAAP information to GAAP information, including the impact of participating securities, is included either on the slide where the information appears or on another slide referenced in the presentation. |