Exhibit 99.2
Leading the Way in Electricity SM
EDISON
INTERNATIONAL
First Quarter 2009
Financial Teleconference
May 8, 2009 EDISON INTERNATIONAL®
Leading the Way in Electricity SM
Forward-Looking Statements
Statements contained in this presentation about future performance, including, without limitation, earnings, asset and rate base growth, load growth, capital investments, and other statements that are not purely historical, are forward-looking statements. These forward-looking statements reflect our current expectations; however, such statements involve risks and uncertainties. Actual results could differ materially from current expectations. Important factors that could cause different results are discussed under the headings “Risk Factors” and “Management’s Discussion and Analysis” in Edison International’s 2008 Form 10-K and other reports filed with the Securities and Exchange Commission, which are available on our website: www.edisoninvestor.com. These forward-looking statements represent our expectations only as of the date of this presentation, and Edison International assumes no duty to update them to reflect new information, events or circumstances.
May 8, 2009 1 EDISON INTERNATIONAL®
Leading the Way in Electricity SM
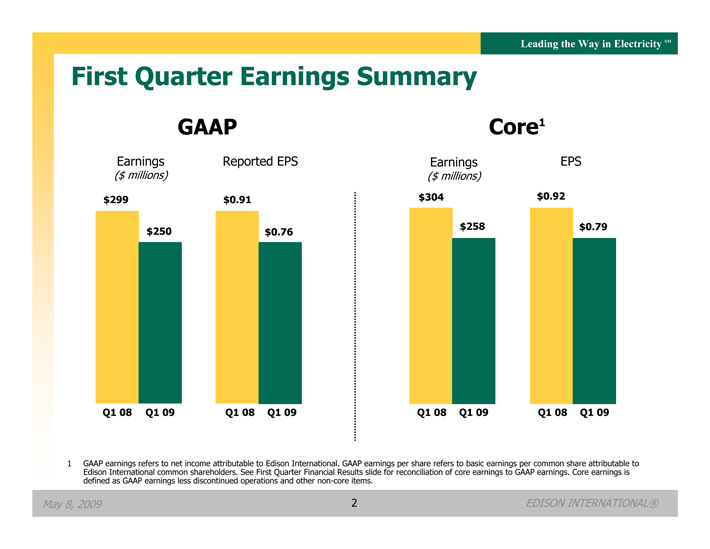
First Quarter Earnings Summary
GAAP Core1
Earnings Reported EPS Earnings EPS
($ millions) ($ millions)
$299 $0.91 $304 $0.92
$258 $0.79 $250 $0.76
Q1 08 Q1 09 Q1 08 Q1 09 Q1 08 Q1 09 Q1 08 Q1 09
1 GAAP earnings refers to net income attributable to Edison International. GAAP earnings per share refers to basic earnings per common share attributable to Edison International common shareholders. See First Quarter Financial Results slide for reconciliation of core earnings to GAAP earnings. Core earnings is defined as GAAP earnings less discontinued operations and other non-core items.
May 8, 2009 2 EDISON INTERNATIONAL®
Leading the Way in Electricity SM
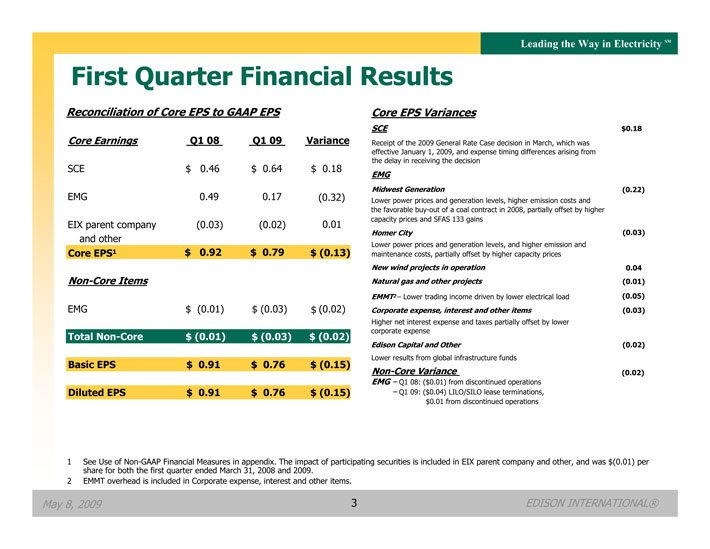
First Quarter Financial Results
Reconciliation of Core EPS to GAAP EPS Core EPS Variances
SCE $0.18
Core Earnings Q1 08 Q1 09 Variance Receipt of the 2009 General Rate Case decision in March, which was effective January 1, 2009, and expense timing differences arising from the delay in receiving the decision
SCE $ 0.46 $ 0.64 $ 0.18
EMG
Midwest Generation (0.22)
EMG 0.49 0.17 (0.32) Lower power prices and generation levels, higher emission costs and the favorable buy-out of a coal contract in 2008, partially offset by higher 0.01 capacity prices and SFAS 133 gains
EIX parent company (0.03) (0.02) Homer City (0.03) and other
Lower power prices and generation levels, and higher emission and Core EPS1 $ 0.92 $ 0.79 $ (0.13) maintenance costs, partially offset by higher capacity prices
New wind projects in operation 0.04 Non-Core Items Natural gas and other projects (0.01)
EMMT2 – Lower trading income driven by lower electrical load (0.05)
EMG $ (0.01) $ (0.03) (0.02) Corporate expense, interest and other items (0.03)
Higher net interest expense and taxes partially offset by lower corporate expense
Total Non-Core $ (0.01) $ (0.03) $ (0.02) Edison Capital and Other (0.02)
Lower results from global infrastructure funds
Basic EPS $ 0.91 $ 0.76 $ (0.15)
Non-Core Variance (0.02)
EMG – Q1 08: ($0.01) from discontinued operations Diluted EPS $ 0.91 $ 0.76 $ (0.15) – Q1 09: ($0.04) LILO/SILO lease terminations, $0.01 from discontinued operations
1 See Use of Non-GAAP Financial Measures in appendix. The impact of participating securities is included in EIX parent company and other, and was $(0.01) per share for both the first quarter ended March 31, 2008 and 2009.
2 EMMT overhead is included in Corporate expense, interest and other items.
May 8, 2009 3 EDISON INTERNATIONAL®
Leading the Way in Electricity SM
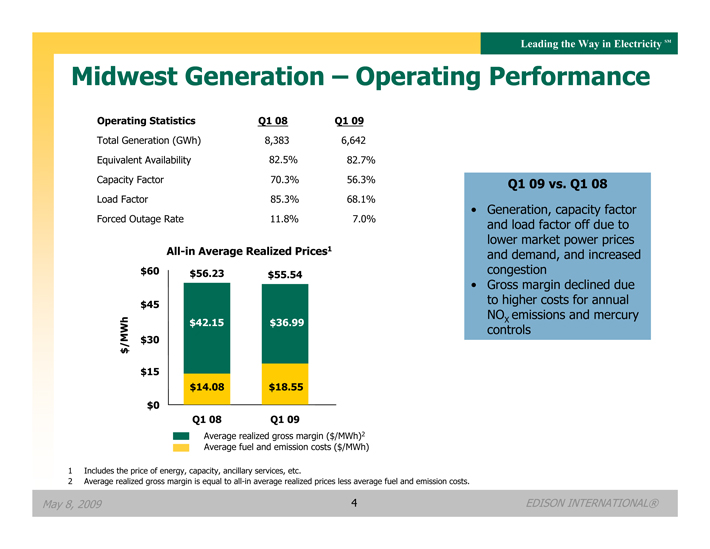
Midwest Generation – Operating Performance
Operating Statistics Q1 08 Q1 09
Total Generation (GWh) 8,383 6,642 Equivalent Availability 82.5% 82.7%
Capacity Factor 70.3% 56.3% Q1 09 vs. Q1 08 Load Factor 85.3% 68.1%
Generation, capacity factor Forced Outage Rate 11.8% 7.0% and load factor off due to lower market power prices and demand, and increased congestion
All-in Average Realized Prices1
$60 $56.23 $55.54
Gross margin declined due $45 to higher costs for annual NOX emissions and mercury controls
$42.15 $36.99
$/MWh
$30 $15 $14.08 $18.55 $0 Q1 08 Q1 09
Average realized gross margin ($/MWh)2 Average fuel and emission costs ($/MWh)
1 Includes the price of energy, capacity, ancillary services, etc.
2 Average realized gross margin is equal to all-in average realized prices less average fuel and emission costs.
May 8, 2009 4 EDISON INTERNATIONAL®
Leading the Way in Electricity SM
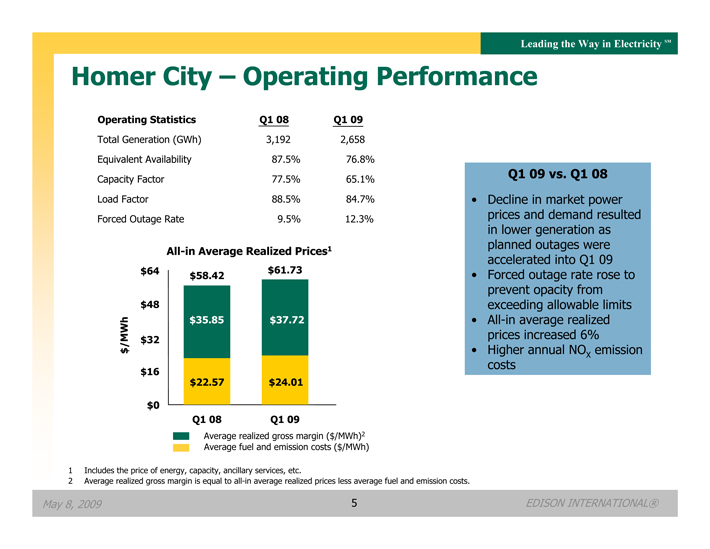
Homer City – Operating Performance
Operating Statistics Q1 08 Q1 09
Total Generation (GWh) 3,192 2,658 Equivalent Availability 87.5% 76.8% Capacity Factor 77.5% 65.1% Load Factor 88.5% 84.7% Forced Outage Rate 9.5% 12.3%
All-in Average Realized Prices1
$64 $61.73 $58.42
$48 $35.85 $37.72 /MWh $32 $
$16 $22.57 $24.01
$0
Q1 08 Q1 09
Average realized gross margin ($/MWh)2 Average fuel and emission costs ($/MWh)
Q1 09 vs. Q1 08
Decline in market power prices and demand resulted in lower generation as planned outages were accelerated into Q1 09
Forced outage rate rose to prevent opacity from exceeding allowable limits
All-in average realized prices increased 6%
Higher annual NOX emission costs
1 Includes the price of energy, capacity, ancillary services, etc.
2 Average realized gross margin is equal to all-in average realized prices less average fuel and emission costs.
May 8, 2009 5 EDISON INTERNATIONAL®
Leading the Way in Electricity SM
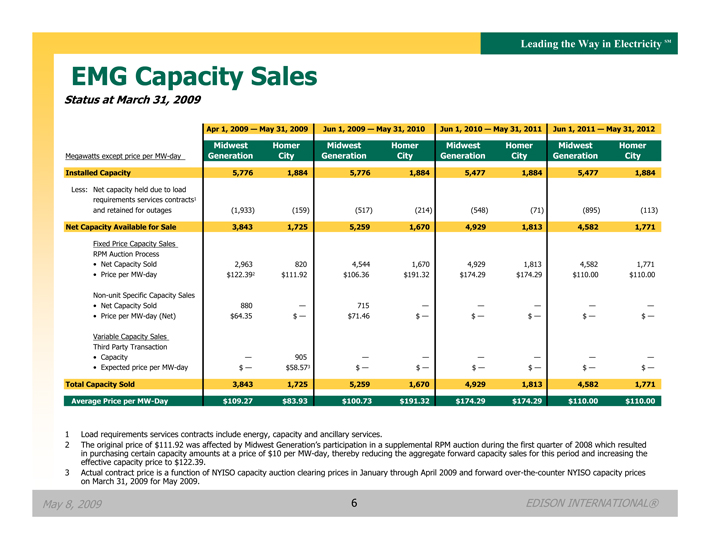
EMG Capacity Sales
Status at March 31, 2009
Apr 1, 2009 — May 31, 2009 Jun 1, 2009 — May 31, 2010 Jun 1, 2010 — May 31, 2011 Jun 1, 2011 — May 31, 2012 Midwest Homer Midwest Homer Midwest Homer Midwest Homer Megawatts except price per MW-day Generation City Generation City Generation City Generation City Installed Capacity 5,776 1,884 5,776 1,884 5,477 1,884 5,477 1,884
Less: Net capacity held due to load requirements services contracts1 and retained for outages (1,933) (159) (517) (214) (548) (71) (895) (113)
Net Capacity Available for Sale 3,843 1,725 5,259 1,670 4,929 1,813 4,582 1,771
Fixed Price Capacity Sales RPM Auction Process
• Net Capacity Sold 2,963 820 4,544 1,670 4,929 1,813 4,582 1,771
• Price per MW-day $122.392 $111.92 $106.36 $191.32 $174.29 $174.29 $110.00 $110.00
Non-unit Specific Capacity Sales
• Net Capacity Sold 880 — 715 — — — — —
• Price per MW-day (Net) $64.35 $ — $71.46 $ — $ — $ — $ — $ —
Variable Capacity Sales Third Party Transaction
• Capacity — 905 — — — — — —
• Expected price per MW-day $ — $58.573 $ — $ — $ — $ — $ — $ —
Total Capacity Sold 3,843 1,725 5,259 1,670 4,929 1,813 4,582 1,771
Average Price per MW-Day $109.27 $83.93 $100.73 $191.32 $174.29 $174.29 $110.00 $110.00
1 Load requirements services contracts include energy, capacity and ancillary services.
2 The original price of $111.92 was affected by Midwest Generation’s participation in a supplemental RPM auction during the first quarter of 2008 which resulted in purchasing certain capacity amounts at a price of $10 per MW-day, thereby reducing the aggregate forward capacity sales for this period and increasing the effective capacity price to $122.39.
3 Actual contract price is a function of NYISO capacity auction clearing prices in January through April 2009 and forward over-the-counter NYISO capacity prices on March 31, 2009 for May 2009.
May 8, 2009 6 EDISON INTERNATIONAL®
Leading the Way in Electricity SM
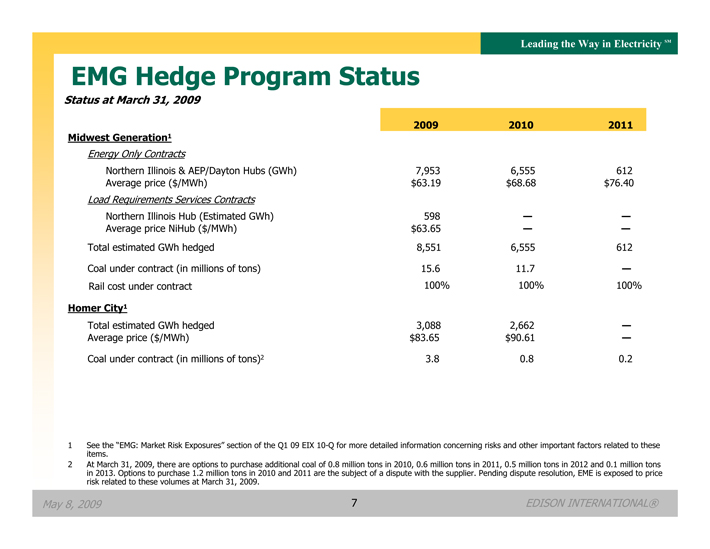
EMG Hedge Program Status
Status at March 31, 2009
2009 2010 2011 Midwest Generation1
Energy Only Contracts
Northern Illinois & AEP/Dayton Hubs (GWh) 7,953 6,555 612 Average price ($/MWh) $63.19 $68.68 $76.40
Load Requirements Services Contracts
Northern Illinois Hub (Estimated GWh) 598 — —Average price NiHub ($/MWh) $63.65 — —Total estimated GWh hedged 8,551 6,555 612 Coal under contract (in millions of tons) 15.6 11.7 —Rail cost under contract 100% 100% 100%
Homer City1
Total estimated GWh hedged 3,088 2,662 —Average price ($/MWh) $83.65 $90.61 —Coal under contract (in millions of tons)2 3.8 0.8 0.2
1 See the “EMG: Market Risk Exposures” section of the Q1 09 EIX 10-Q for more detailed information concerning risks and other important factors related to these items.
2 At March 31, 2009, there are options to purchase additional coal of 0.8 million tons in 2010, 0.6 million tons in 2011, 0.5 million tons in 2012 and 0.1 million tons in 2013. Options to purchase 1.2 million tons in 2010 and 2011 are the subject of a dispute with the supplier. Pending dispute resolution, EME is exposed to price risk related to these volumes at March 31, 2009.
May 8, 2009 7 EDISON INTERNATIONAL®
Leading the Way in Electricity SM
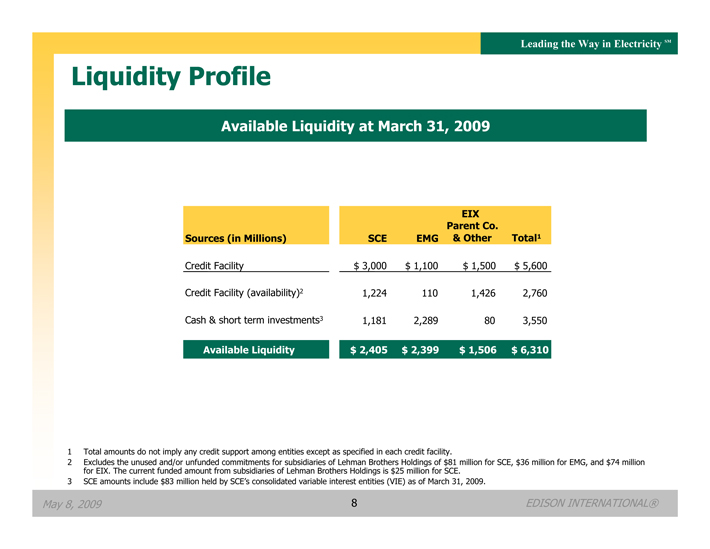
Liquidity Profile
Available Liquidity at March 31, 2009
EIX Parent Co.
Sources (in Millions) SCE EMG & Other Total1
Credit Facility $ 3,000 $ 1,100 $ 1,500 $ 5,600 Credit Facility (availability)2 1,224 110 1,426 2,760 Cash & short term investments3 1,181 2,289 80 3,550
Available Liquidity $ 2,405 $ 2,399 $ 1,506 $ 6,310
1 Total amounts do not imply any credit support among entities except as specified in each credit facility.
2 Excludes the unused and/or unfunded commitments for subsidiaries of Lehman Brothers Holdings of $81 million for SCE, $36 million for EMG, and $74 million for EIX. The current funded amount from subsidiaries of Lehman Brothers Holdings is $25 million for SCE.
3 SCE amounts include $83 million held by SCE’s consolidated variable interest entities (VIE) as of March 31, 2009.
May 8, 2009 8 EDISON INTERNATIONAL®
Leading the Way in Electricity SM
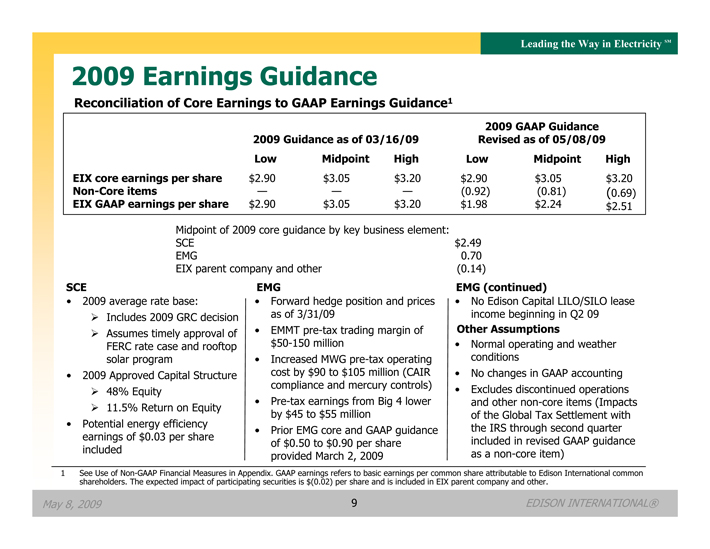
2009 Earnings Guidance
Reconciliation of Core Earnings to GAAP Earnings Guidance1
2009 GAAP Guidance 2009 Guidance as of 03/16/09 Revised as of 05/08/09 Low Midpoint High Low Midpoint High EIX core earnings per share $2.90 $3.05 $3.20 $2.90 $3.05 $3.20 Non-Core items — — — (0.92) (0.81) (0.69) EIX GAAP earnings per share $2.90 $3.05 $3.20 $1.98 $2.24 $2.51 Midpoint of 2009 core guidance by key business element: SCE $2.49 EMG 0.70 EIX parent company and other (0.14)
SCE EMG EMG (continued)
• 2009 average rate base: • Forward hedge position and prices • No Edison Capital LILO/SILO lease
Includes 2009 GRC decision as of 3/31/09 income beginning in Q2 09
Assumes timely approval of • EMMT pre-tax trading margin of Other Assumptions
FERC rate case and rooftop $50-150 million • Normal operating and weather solar program • Increased MWG pre-tax operating conditions
• 2009 Approved Capital Structure cost by $90 to $105 million (CAIR • No changes in GAAP accounting compliance and mercury controls) • Excludes discontinued operations
48% Equity
• Pre-tax earnings from Big 4 lower and other non-core items (Impacts
11.5% Return on Equity by $45 to $55 million of the Global Tax Settlement with
• Potential energy efficiency
• Prior EMG core and GAAP guidance the IRS through second quarter earnings of $0.03 per share included in revised GAAP guidance of $0.50 to $0.90 per share included as a non-core item) provided March 2, 2009
1 See Use of Non-GAAP Financial Measures in Appendix. GAAP earnings refers to basic earnings per common share attributable to Edison International common shareholders. The expected impact of participating securities is $(0.02) per share and is included in EIX parent company and other.
May 8, 2009 9 EDISON INTERNATIONAL®
Leading the Way in Electricity SM
Appendix
May 8, 2009 10 EDISON INTERNATIONAL®
Leading the Way in Electricity SM
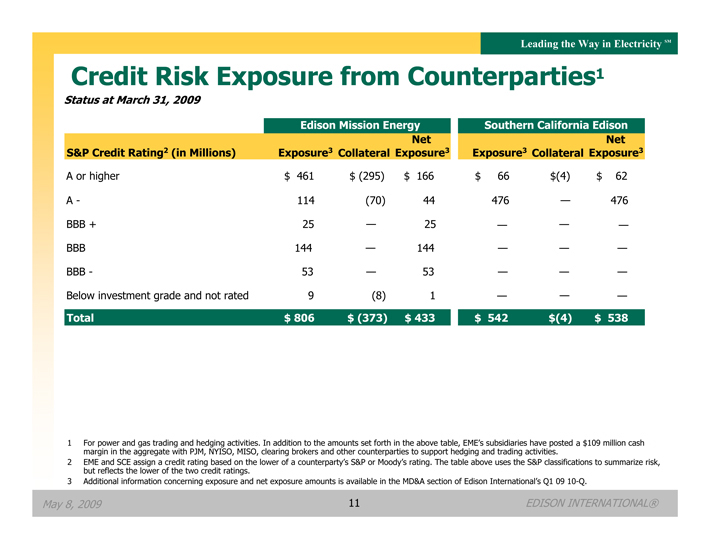
Credit Risk Exposure from Counterparties1
Status at March 31, 2009
Edison Mission Energy Southern California Edison Net Net S&P Credit Rating2 (in Millions) Exposure3 Collateral Exposure3 Exposure3 Collateral Exposure3
A or higher $ 461 $ (295) $ 166 $ 66 $(4) $ 62
A—114 (70) 44 476 — 476 BBB + 25 — 25 — — —BBB 144 — 144 — — —BBB—53 — 53 — — —Below investment grade and not rated 9 (8) 1 — — —
Total $ 806 $ (373) $ 433 $ 542 $(4) $ 538
1 For power and gas trading and hedging activities. In addition to the amounts set forth in the above table, EME’s subsidiaries have posted a $109 million cash margin in the aggregate with PJM, NYISO, MISO, clearing brokers and other counterparties to support hedging and trading activities.
2 EME and SCE assign a credit rating based on the lower of a counterparty’s S&P or Moody’s rating. The table above uses the S&P classifications to summarize risk, but reflects the lower of the two credit ratings.
3 Additional information concerning exposure and net exposure amounts is available in the MD&A section of Edison International’s Q1 09 10-Q.
May 8, 2009 11 EDISON INTERNATIONAL®
Leading the Way in Electricity SM
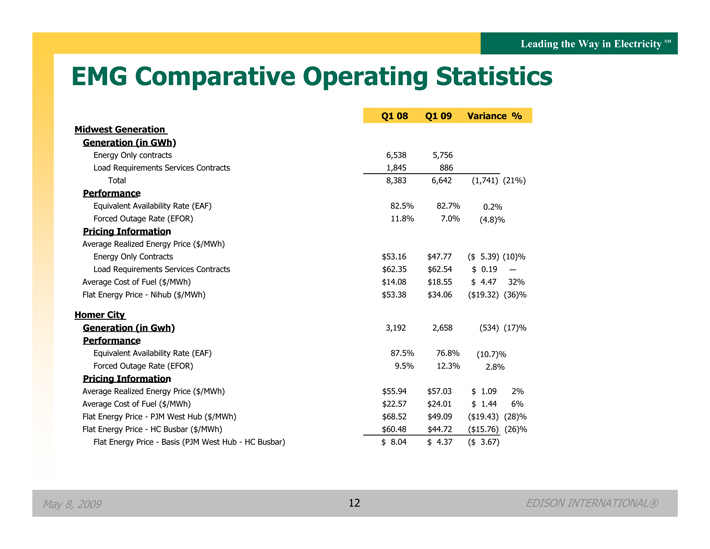
EMG Comparative Operating Statistics
Q1 08 Q1 09 Variance % Midwest Generation Generation (in GWh)
Energy Only contracts 6,538 5,756 Load Requirements Services Contracts 1,845 886
Total 8,383 6,642 (1,741) (21%)
Performance
Equivalent Availability Rate (EAF) 82.5% 82.7% 0.2% Forced Outage Rate (EFOR) 11.8% 7.0% (4.8)%
Pricing Information
Average Realized Energy Price ($/MWh)
Energy Only Contracts $53.16 $47.77 ($ 5.39) (10)% Load Requirements Services Contracts $62.35 $62.54 $ 0.19 — Average Cost of Fuel ($/MWh) $14.08 $18.55 $ 4.47 32% Flat Energy Price—Nihub ($/MWh) $53.38 $34.06 ($19.32) (36)%
Homer City
Generation (in Gwh) 3,192 2,658 (534) (17)%
Performance
Equivalent Availability Rate (EAF) 87.5% 76.8% (10.7)% Forced Outage Rate (EFOR) 9.5% 12.3% 2.8%
Pricing Information
Average Realized Energy Price ($/MWh) $55.94 $57.03 $ 1.09 2% Average Cost of Fuel ($/MWh) $22.57 $24.01 $ 1.44 6% Flat Energy Price—PJM West Hub ($/MWh) $68.52 $49.09 ($19.43) (28)% Flat Energy Price—HC Busbar ($/MWh) $60.48 $44.72 ($15.76) (26)% Flat Energy Price—Basis (PJM West Hub—HC Busbar) $ 8.04 $ 4.37 ($ 3.67)
May 8, 2009 12 EDISON INTERNATIONAL®
Leading the Way in Electricity SM
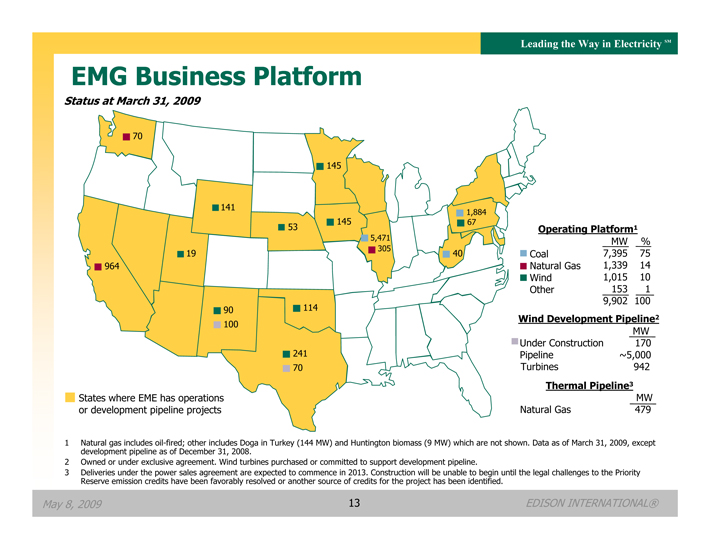
EMG Business Platform
Status at March 31, 2009
70
145
141
1,884 145 67
53 Operating Platform1
5,471 MW % 305
19 40 Coal 7,395 75 964 Natural Gas 1,339 14 Wind 1,015 10 Other 153 1 9,902 100
90 114
Wind Development Pipeline2
100
MW Under Construction 170 241 Pipeline ~5,000
70 Turbines 942
Thermal Pipeline3
States where EME has operations MW or development pipeline projects Natural Gas 479
1 Natural gas includes oil-fired; other includes Doga in Turkey (144 MW) and Huntington biomass (9 MW) which are not shown. Data as of March 31, 2009, except development pipeline as of December 31, 2008.
2 Owned or under exclusive agreement. Wind turbines purchased or committed to support development pipeline.
3 Deliveries under the power sales agreement are expected to commence in 2013. Construction will be unable to begin until the legal challenges to the Priority Reserve emission credits have been favorably resolved or another source of credits for the project has been identified.
May 8, 2009 13 EDISON INTERNATIONAL®
Leading the Way in Electricity SM
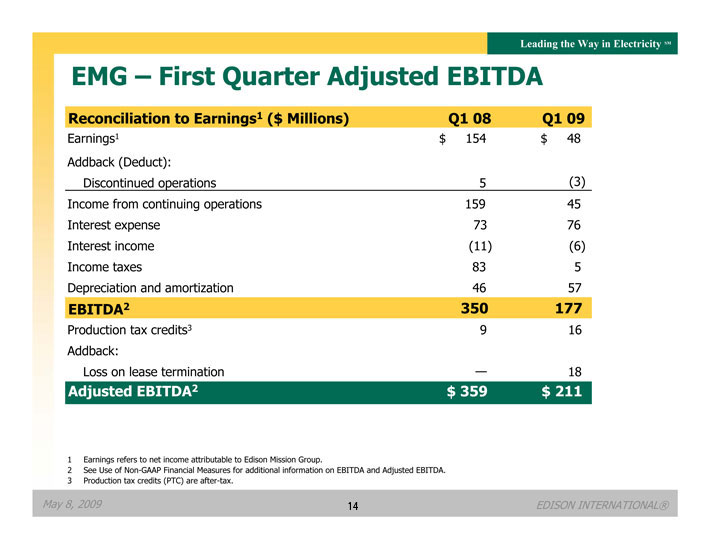
EMG – First Quarter Adjusted EBITDA
Reconciliation to Earnings1 ($ Millions) Q1 08 Q1 09
Earnings1 $ 154 $ 48 Addback (Deduct): Discontinued operations 5 (3) Income from continuing operations 159 45 Interest expense 73 76 Interest income (11) (6) Income taxes 83 5 Depreciation and amortization 46 57
EBITDA2 350 177
Production tax credits3 9 16 Addback: Loss on lease termination — 18
Adjusted EBITDA2 $ 359 $ 211
1 Earnings refers to net income attributable Edison Mission Group.
2 See Use of Non-GAAP Financial Measures for additional information on EBITDA and Adjusted EBITDA.
3 Production tax credits (PTC) are after-tax.
May 8, 2009 14 EDISON INTERNATIONAL®
Leading the Way in Electricity SM
Use of Non-GAAP Financial Measures
Edison International’s earnings are prepared in accordance with generally accepted accounting principles used in the United States and represent the company’s earnings as reported to the Securities and Exchange Commission. Our management uses core earnings and EPS by principal operating subsidiary internally for financial planning and for analysis of performance. We also use core earnings and EPS by principal operating subsidiary as primary performance measurements when communicating with analysts and investors regarding our earnings results and outlook, as it allows us to more accurately compare the company’s ongoing performance across periods. Core earnings exclude discontinued operations and other non-core items and are reconciled to basic earnings per common share.
EPS by principal operating subsidiary is based on the principal operating subsidiaries’ net income attributable to the common shareholders of each subsidiary, respectively, and Edison International’s weighted average outstanding common shares. The impact of participating securities (vested stock options that earn dividend equivalents that may participate in undistributed earnings with common stock) for each principal operating subsidiary is not material to each principal operating subsidiary’s EPS and is therefore reflected in the results of the Edison International holding company, which we refer to as EIX parent company and other. EPS and core EPS by principal operating subsidiary are reconciled to basic earnings per common share.
EBITDA is defined as earnings before interest, income taxes, depreciation and amortization. Adjusted EBITDA includes production tax credits from EMG’s wind projects and excludes amounts from gain on the sale of assets, loss on early extinguishment of debt and leases, and impairment of assets and investments. Our management uses Adjusted EBITDA as an important financial measure for evaluating EMG.
A reconciliation of Non-GAAP information to GAAP information, including the impact of participating securities, is included either on the slide where the information appears or on another slide referenced in this presentation.
May 8, 2009 15 EDISON INTERNATIONAL®