Exhibit 99.2

Leading the Way in Electricity SM
Second Quarter 2010
Financial Teleconference
August 5, 2010 EDISON INTERNATIONAL®
Leading the Way in Electricity SM
Forward-Looking Statements
Statements contained in this presentation about future performance, including, without limitation, earnings, asset and rate base growth, load growth, capital investments, and other statements that are not purely historical, are forward-looking statements. These forward-looking statements reflect our current expectations; however, such statements involve risks and uncertainties. Actual results could differ materially from current expectations. These forward-looking statements represent our expectations only as of the date of this presentation, and Edison International assumes no duty to update them to reflect new information, events or circumstances. Important factors that could cause different results are discussed under the headings “Risk Factors,” and “Management’s Discussion and Analysis” in Edison International’s 2009 Form 10-K, most recent Form 10-Q and other reports filed with the Securities and Exchange Commission, which are available on our website: www.edisoninvestor.com. These filings also provide additional information on historical and other factual data contained in this presentation.
August 5, 2010 1 EDISON INTERNATIONAL®
Leading the Way in Electricity SM
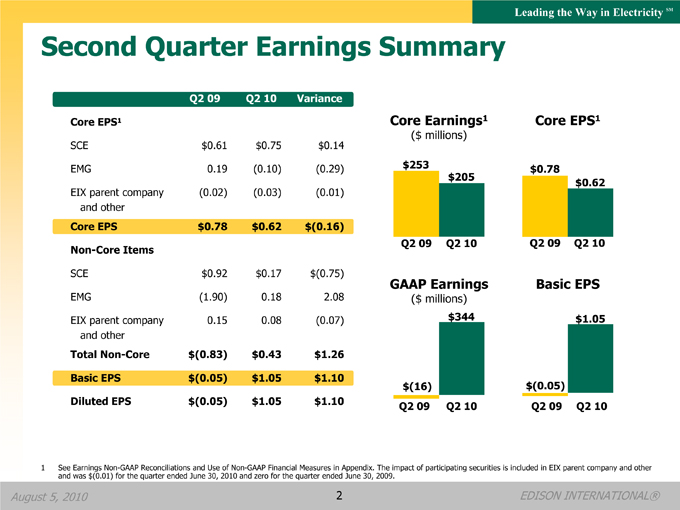
Second Quarter Earnings Summary
Earnings EPS
($ millions)
Core1
$253 $0.78 $205
$0.62
Q2 09 Q2 10 Q2 09 Q2 10
Basic
$344 $1.05
$(16) $(0.05) Q2 09 Q2 10 Q2 09 Q2 10
Q2 09 Q2 10 Variance
Core EPS1
SCE
$0.61
$0.75
$0.14
EMG
0.19
(0.10)
(0.29)
EIX parent company
(0.02)
(0.03)
(0.01)
and other
Core EPS
$0.78
$0.62
$(0.16)
Non-Core Items
SCE
$0.92
$0.17
$(0.75)
EMG
(1.90)
0.18
2.08
EIX parent company
0.15
0.08
(0.07)
and other
Total Non-Core
$(0.83)
$0.43
$1.26
Basic EPS
$(0.05)
$1.05
$1.10
Diluted EPS
$(0.05)
$1.05
$1.10
1 See Earnings Non-GAAP Reconciliations and Use of Non-GAAP Financial Measures in Appendix. The impact of participating securities is included in EIX parent company and other and was $(0.01) for the quarter ended June 30, 2010 and zero for the quarter ended June 30, 2009.
August 5, 2010 2 EDISON INTERNATIONAL®
Leading the Way in Electricity SM
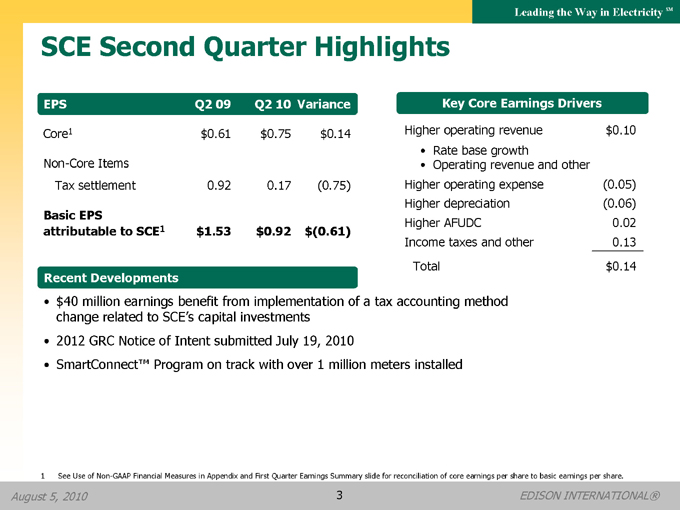
SCE Second Quarter Highlights
EPS
Q2 09
Q2 10
Variance
Core1
$0.61
$0.75
$0.14
Non-Core Items
Tax settlement
0.92
0.17
(0.75)
Basic EPS
attributable to SCE1
$1.53
$0.92
$(0.61)
Key Core Earnings Drivers
Higher operating revenue $0.10
• Rate base growth
• Operating revenue and other
Higher operating expense (0.05) Higher depreciation (0.06)
Higher AFUDC 0.02 Income taxes and other 0.13
Total $0.14
Recent Developments
• $40 million earnings benefit from implementation of a tax accounting method change related to SCE’s capital investments
• 2012 GRC Notice of Intent submitted July 19, 2010
• SmartConnect™ Program on track with over 1 million meters installed
1 See Use of Non-GAAP Financial Measures in Appendix and First Quarter Earnings Summary slide for reconciliation of core earnings per share to basic earnings per share.
August 5, 2010 3 EDISON INTERNATIONAL®

Leading the Way in Electricity SM
EMG Second Quarter Highlights
EPS
Q2 09
Q2 10
Variance
Core1
$0.19
$(0.10)
$(0.29)
Non-Core Items
Tax settlement
(1.88)
0.18
2.06
Discontinued operations
(0.02)
-
0.02
Basic EPS
attributable to EMG1
$(1.71)
$0.08
$1.79
Key Core Earnings Drivers
Merchant coal2
$(0.29)
Renewable projects
0.02
EMMT—trading
0.03
Natural gas projects
(0.01)
Edison Capital3
(0.05)
Corporate expense & other
0.01
Total
$(0.29)
Recent Developments
• The estimated costs to retrofit all of the units to comply with the SO2 portion of CPS is approximately $1.2 billion (in 2010 dollars) no final - decisions have been made on individual units
• Received approval on all SNCR permit applications from Illinois EPA
• Closed Laredo Ridge $140 million financing and began construction
• Additional energy hedges of 4,648 MWh and 408 MWh for 2011 and 2012, respectively
1 See Use of Non-GAAP Financial Measures in Appendix and Second Quarter Earnings Summary slide for reconciliation of core earnings per share to basic earnings per share.
2 | | Includes impact of unrealized gains of $0.04 in 2009 and unrealized losses of $0.03 in 2010. |
3 | | Includes $0.06 per share gain on sale of Midland Cogeneration Ventures in Q2 2009. |
August 5, 2010 4 EDISON INTERNATIONAL®
Leading the Way in Electricity SM
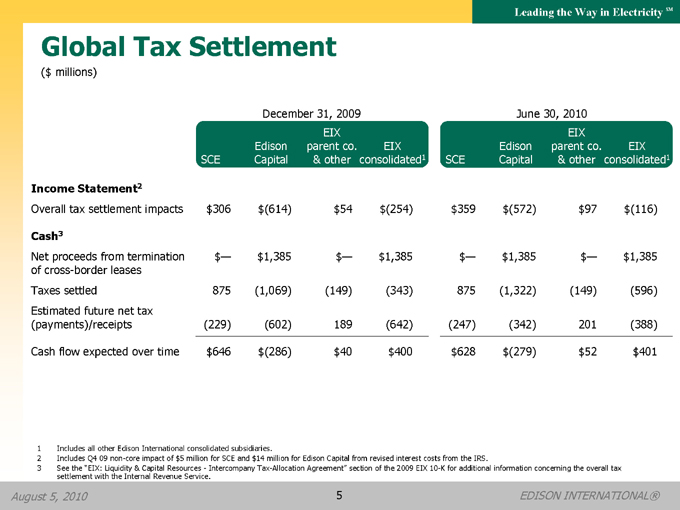
Global Tax Settlement
($ millions)
December 31, 2009
SCE
Edison Capital
EIX parent co.
& other
SEC
EIX consolidated1
June 30, 2010
EIX consolidated1
Edison Capital
EIX parent co.
& other
EIX consolidated1
Income Statement2
Overall tax settlement impacts
$306
$(614)
$54
$(254)
$359
$(572)
$97
$(116)
Cash3
Net proceeds from termination
$-
$1,385
$-
$1,385
$-
$1,385
$-
$1,385
of cross-border leases
Taxes settled
875
(1,069)
(149)
(343)
875
(1,322)
(149)
(596)
Estimated future net tax
(payments)/receipts
(229)
(602)
189
(642)
(247)
(342)
201
Cash flow expected over time
$646
$(286)
$40
$400
$628
$(279)
$52
$401
1 | | Includes all other Edison International consolidated subsidiaries. |
2 Includes Q4 09 non-core impact of $5 million for SCE and $14 million for Edison Capital from revised interest costs from the IRS.
3 See the “EIX: Liquidity & Capital Resources-Intercompany Tax-Allocation Agreement” section of the 2009 EIX 10-K for additional information concerning the overall tax settlement with the Internal Revenue Service.
August 5, 2010 5 EDISON INTERNATIONAL®
Leading the Way in Electricity SM
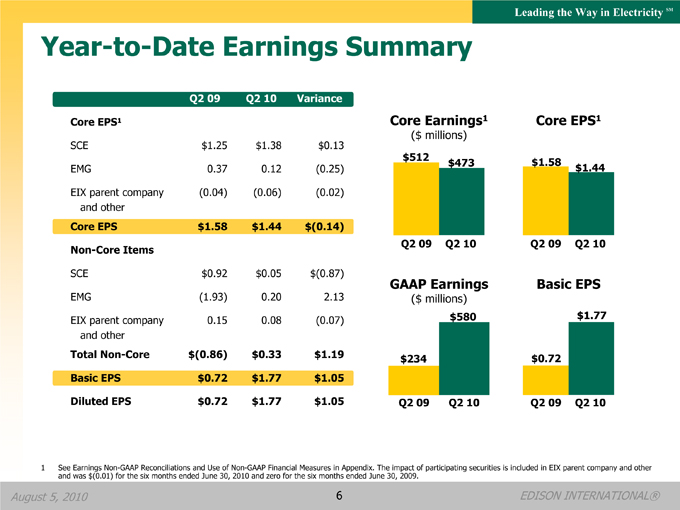
Year-to-Date Earnings Summary
Earnings
($ millions)
EPS
Core1
$512 $1.58 $473 $1.44
Q2 09 Q2 10 Q2 09 Q2 10
Basic
$580 $1.77 $234 $0.72 Q2 09 Q2 10 Q2 09 Q2 10
Q2 09
Q2 10
Variance
Core EPS1
SCE
$1.25
$1.38
$0.13
EMG
0.37
0.12
(0.25)
EIX parent company
(0.04)
(0.06)
(0.02)
and other Core EPS
$1.58
$1.44
$(0.14)
Non-Core Items
SCE
$0.92
$0.05
$(0.87)
EMG
(1.93)
0.20
2.13
EIX parent company
0.15
0.08
(0.07)
and other
Total Non-Core
$(0.86)
$0.33
$1.19
Basic EPS
$0.72
$1.77
$1.05
Diluted EPS
$0.72
$1.77
$1.05
1 See Earnings Non-GAAP Reconciliations and Use of Non-GAAP Financial Measures in Appendix. The impact of participating securities is included in EIX parent company and other and was $(0.01) for the six months ended June 30, 2010 and zero for the six months ended June 30, 2009.
August 5, 2010 6 EDISON INTERNATIONAL®
Leading the Way in Electricity SM
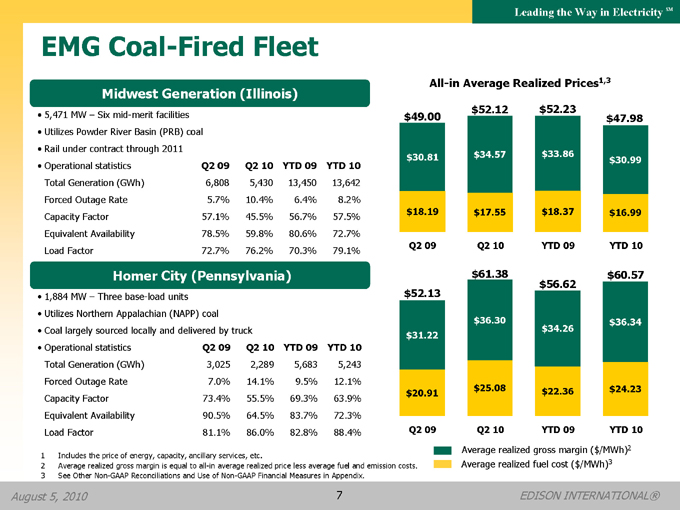
EMG Coal-Fired Fleet
Midwest Generation (Illinois)
• 5,471 MW – Six mid-merit facilities
• Utilizes Powder River Basin (PRB) coal
• Rail under contract through 2011
• Operational statistics Q2 09 Q2 10 YTD 09 YTD 10
• Total Generation (GWh) 6,808 5,430 13,450 13,642
• Forced Outage Rate 5.7% 10.4% 6.4% 8.2%
• Capacity Factor 57.1% 45.5% 56.7% 57.5%
• Equivalent Availability 78.5% 59.8% 80.6% 72.7%
• Load Factor 72.7% 76.2% 70.3% 79.1%
Homer City (Pennsylvania)
• 1,884 MW – Three base-load units
• Utilizes Northern Appalachian (NAPP) coal
• Coal largely sourced locally and delivered by truck
• Operational statistics Q2 09 Q2 10 YTD 09 YTD 10
• Total Generation (GWh) 3,025 2,289 5,683 5,243
• Forced Outage Rate 7.0% 14.1% 9.5% 12.1%
• Capacity Factor 73.4% 55.5% 69.3% 63.9%
• Equivalent Availability 90.5% 64.5% 83.7% 72.3%
• Load Factor 81.1% 86.0% 82.8% 88.4%
All-in Average Realized Prices1,3
$52.12
$52.23
$49.00
$47.98
$30.81
$34.57
$33.86
$30.99
$18.19
$17.55
$18.37
$16.99
Q2 09
Q2 10
YTD 09
YTD 10
$61.38
$60.57
$56.62
$52.13
$36.30
$36.34
$31.22
$34.26
$20.91
$25.08
$22.36
$24.23
Q2 09
Q2 10
YTD 09
YTD 10
1 | | Includes the price of energy, capacity, ancillary services, etc. |
2 | | Average realized gross margin is equal to all-in average realized price less average fuel and emission costs. |
3 | | See Other Non-GAAP Reconciliations and Use of Non-GAAP Financial Measures in Appendix. |
Average realized gross margin ($/MWh)2 Average realized fuel cost ($/MWh)3
August 5, 2010 7 EDISON INTERNATIONAL®
Leading the Way in Electricity SM
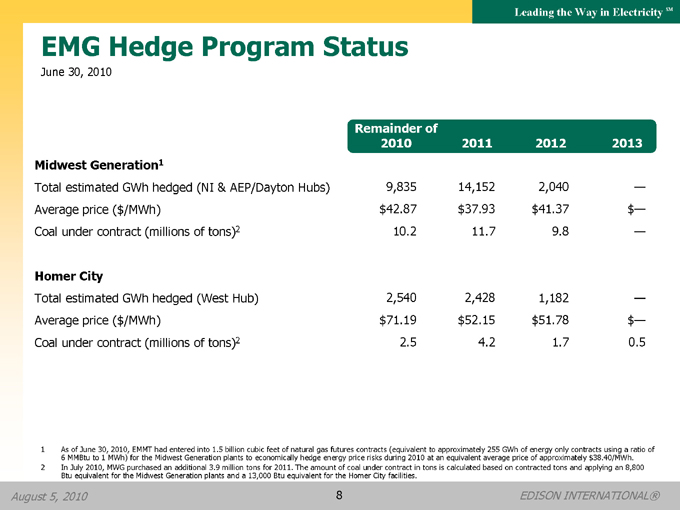
EMG Hedge Program Status
June 30, 2010
Remainder of
2010
2011
2012
2013
Midwest Generation1
Total estimated GWh hedged (NI & AEP/Dayton Hubs)
9,835
14,152
2,040
—
Average price ($/MWh)
$42.87
$37.93
$41.37
$—
Coal under contract (millions of tons)2
10.2
11.7
9.8
—
Homer City
Total estimated GWh hedged (West Hub)
2,540
2,428
1,182
—
Average price ($/MWh)
$71.19
$52.15
$51.78
$—
Coal under contract (millions of tons)2
2.5
4.2
1.7
0.5
1 As of June 30, 2010, EMMT had entered into 1.5 billion cubic feet of natural gas futures contracts (equivalent to approximately 255 GWh of energy only contracts using a ratio of
6 MMBtu to 1 MWh) for the Midwest Generation plants to economically hedge energy price risks during 2010 at an equivalent average price of approximately $38.40/MWh.
2 In July 2010, MWG purchased an additional 3.9 million tons for 2011. The amount of coal under contract in tons is calculated based on contracted tons and applying an 8,800 Btu equivalent for the Midwest Generation plants and a 13,000 Btu equivalent for the Homer City facilities.
August 5, 2010 8 EDISON INTERNATIONAL®

Leading the Way in Electricity SM
EMG Capacity Sales
June 30, 2010
Installed
Unsold
Capacity
RPM Capacity Sold in
Other Capacity Sales,
Capacity
Capacity1
Sold
Base Residual Auction
Net of Purchases2
Aggregate
Price per
Average Price
Average Price
MW
MW
MW
MW
MW-day1
MW
per MW-day
per MW-day
July 1, 2010 to May 31, 2011
Midwest Generation
5,477
(548)
4,929
4,929
$174.29
—
—
$174.29
Homer City
1,884
(211)
1,673
1,813
$174.29
(140)
$55.36
$184.24
June 1, 2011 to May 31, 2012
Midwest Generation
5,477
(495)
4,982
4,582
$110.00
400
$85.00
$107.99
Homer City
1,884
(113)
1,771
1,771
$110.00
—
—
$110.00
June 1, 2012 to May 31, 2013
Midwest Generation
5,477
(773)
4,704
4,704
$16.46
—
—
$16.46
Homer City
1,884
(148)
1,736
1,736
$133.37
—
—
$133.37
June 1, 2013 to May 31, 2014
Midwest Generation
5,477
(827)
4,650
4,650
$27.73
—
—
$27.73
Homer City3
1,884
(104)
1,780
1,780
$226.15
—
—
$226.15
1 Capacity not sold arises from: (1) capacity retained to meet forced outages under the RPM auction guidelines, and (2) capacity that PJM does not purchase at the clearing price resulting from the auction.
2 Other capacity sales and purchases, net includes contracts executed in advance of the RPM base residual auction to hedge the price risk related to such auction, participation in RPM incremental auctions, and other capacity transactions entered into to manage capacity risks.
3 Excludes 100 MW capacity swap transaction executed prior to the base residual auction at $135 MW-day.
August 5, 2010 9 EDISON INTERNATIONAL®
Leading the Way in Electricity SM
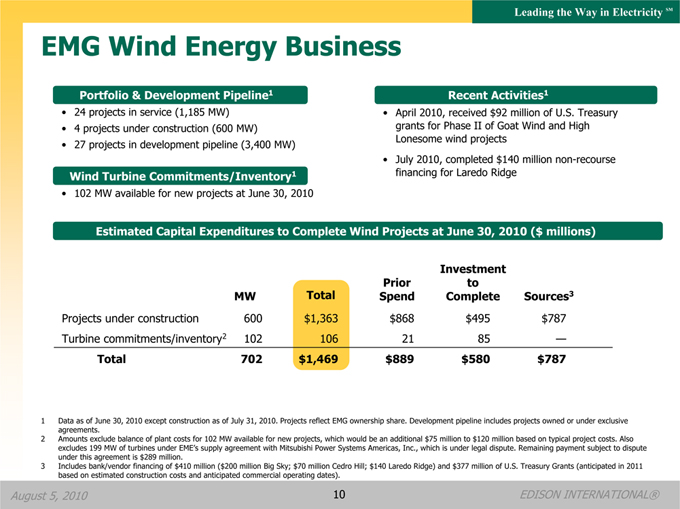
EMG Wind Energy Business
Portfolio & Development Pipeline1
• 24 projects in service (1,185 MW)
• | | 4 projects under construction (600 MW) |
• 27 projects in development pipeline (3,400 MW)
Recent Activities1
• April 2010, received $92 million of U.S. Treasury grants for Phase II of Goat Wind and High Lonesome wind projects
• July 2010, completed $140 million non-recourse financing for Laredo Ridge
Wind Turbine Commitments/Inventory1
• 102 MW available for new projects at June 30, 2010
Estimated Capital Expenditures to Complete Wind Projects at June 30, 2010 ($ millions)
Investment
Prior
to
MW
Total
Spend
Complete
Sources3
Projects under construction
600
$1,363
$868
$495
$787
Turbine commitments/inventory2
102
106
21
85
—
Total
702
$1,469
$889
$580
$787
1 Data as of June 30, 2010 except construction as of July 31, 2010. Projects reflect EMG ownership share. Development pipeline includes projects owned or under exclusive agreements.
2 Amounts exclude balance of plant costs for 102 MW available for new projects, which would be an additional $75 million to $120 million based on typical project costs. Also excludes 199 MW of turbines under EME’s supply agreement with Mitsubishi Power Systems Americas, Inc., which is under legal dispute. Remaining payment subject to dispute under this agreement is $289 million.
3 Includes bank/vendor financing of $410 million ($200 million Big Sky; $70 million Cedro Hill; $140 Laredo Ridge) and $377 million of U.S. Treasury Grants (anticipated in 2011 based on estimated construction costs and anticipated commercial operating dates).
August 5, 2010 10 EDISON INTERNATIONAL®

Leading the Way in Electricity SM
EMG Capital Expenditures
June 30, 2010 ($ millions)
2009
2010
2011
2012
Midwest Generation
Plant capital expenditures
$54
$78
$79
$10
Environmental expenditures1
24
107
145
78
Homer City
Plant capital expenditures
19
21
52
24
Environmental expenditures
7
1
3
22
Renewable Projects
Capital & construction3
171
727
—
—
Turbine commitments2,3
265
3
85
—
Other capital expenditures
21
17
9
Total
$548
$958
$381
$143
1 Environmental expenditures include $158 million expenditures related to SNCR equipment in 2010 and 2012 and $156 million during the remainder of 2010 to 2012 to retrofit initial units using dry scrubbing with sodium-based sorbents to comply with CPS requirements for SO2 emissions. The estimated costs to retrofit all of the units to comply with the SO2 portion of CPS is approximately $1.2 billion (in 2010 dollars) - no final decisions have been made on individual units:
2 Turbine commitment figures exclude $289 million, which is subject to dispute under provisions in one of the turbine supply agreements. In March 2010, EME filed a breach of contract complaint against turbine supplier.
3 Amounts exclude balance of project costs for 102 MW available for new projects, which would be an additional $75 million to $120 million based on typical project costs.
August 5, 2010 11 EDISON INTERNATIONAL®

Leading the Way in Electricity SM
2010 Earnings Guidance
Prior 2010
Updated 2010
Earnings Guidance
Earnings Guidance
as of 5/7/10
as of 8/5/10
Low
Mid
High
Low
Mid
High
EIX core earnings per share1
$3.15
$3.30
$3.45
$3.15
$3.30
$3.45
Non-core items
SCE – tax impact of health carelegislation
(0.12)
(0.12)
Tax settlement
-
0.43
EMG – discontinued operations
0.02
0.02
Total non-core items
(0.10)
0.33
EIX basic earnings per share
$3.05
$3.20
$3.35
$3.48
$3.63
$3.78
Midpoint of core guidance by key business element
SCE
$2.80
$2.80
EMG
0.62
0.62
EIX parent company and other1
(0.12)
(0.12)
Total
$3.30
$3.30
Assumptions
Southern California Edison
• Average rate base $16.2 billion
• Approved capital structure
48% equity, 11.5% ROE
• Potential energy efficiency earnings of $0.05 per share included
Edison Mission Group
• Forward hedge position and prices as of June 30, 2010
• EMMT pre-tax trading margin of $60-$110 million
Other
• Normal operating and weather conditions
• No changes in GAAP accounting
• Excludes future discontinued operations and other non-core items
1 See Use of Non-GAAP Financial Measures in Appendix. Expected 2010 impact of participating securities is $(0.01) per share and is included in EIX parent company and other.
August 5, 2010 12 EDISON INTERNATIONAL®

Leading the Way in Electricity SM
Appendix
August 5, 2010 13 EDISON INTERNATIONAL®

Leading the Way in Electricity SM
Updates Since Our Last Presentation
• Q2 10 results and standard information
• Global Tax Settlement (p. 5)
• EMG estimated capital costs for MWG SO2 compliance program (pp. 4 & 11)
• 2010 Earnings Guidance (p. 12)
• SCE 2012 General Rate Case (submittal of Notice of Intent) (pp. 35-36)
• SCE Regulatory Key Events (p. 37)
August 5, 2010 14 EDISON INTERNATIONAL®
Leading the Way in Electricity SM
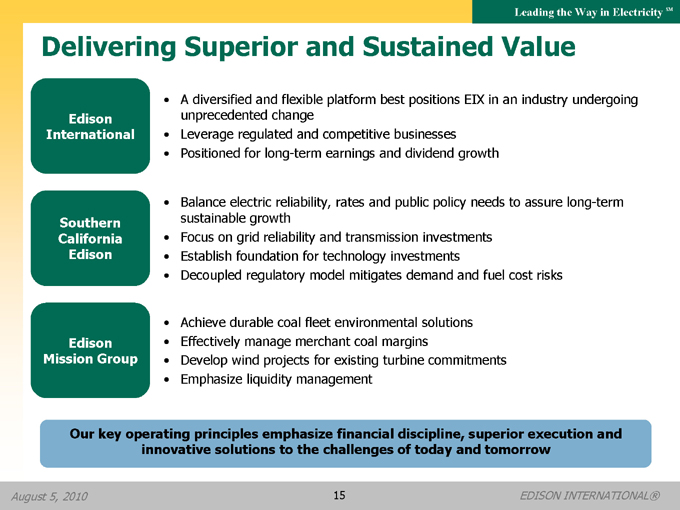
Delivering Superior and Sustained Value
Edison International
• A diversified and flexible platform best positions EIX in an industry undergoing unprecedented change
• Leverage regulated and competitive businesses
• Positioned for long-term earnings and dividend growth
Southern California Edison
• Balance electric reliability, rates and public policy needs to assure long-term sustainable growth
• Focus on grid reliability and transmission investments
• Establish foundation for technology investments
• Decoupled regulatory model mitigates demand and fuel cost risks
Edison Mission Group
• Achieve durable coal fleet environmental solutions
• Effectively manage merchant coal margins
• Develop wind projects for existing turbine commitments
• Emphasize liquidity management
Our key operating principles emphasize financial discipline, superior execution and innovative solutions to the challenges of today and tomorrow
August 5, 2010 15 EDISON INTERNATIONAL®
Leading the Way in Electricity SM
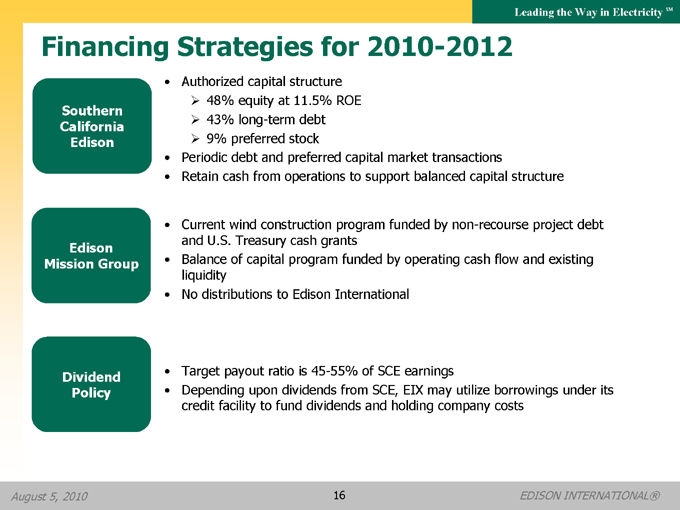
Financing Strategies for 2010-2012
Southern California Edison
• Authorized capital structure
48% equity at 11.5% ROE
43% long-term debt
9% preferred stock
• Periodic debt and preferred capital market transactions
• Retain cash from operations to support balanced capital structure
Edison Mission Group
• Current wind construction program funded by non-recourse project debt and U.S. Treasury cash grants
• Balance of capital program funded by operating cash flow and existing liquidity
• No distributions to Edison International
Dividend Policy
• Target payout ratio is 45-55% of SCE earnings
• Depending upon dividends from SCE, EIX may utilize borrowings under its credit facility to fund dividends and holding company costs
August 5, 2010 16 EDISON INTERNATIONAL®
Leading the Way in Electricity SM
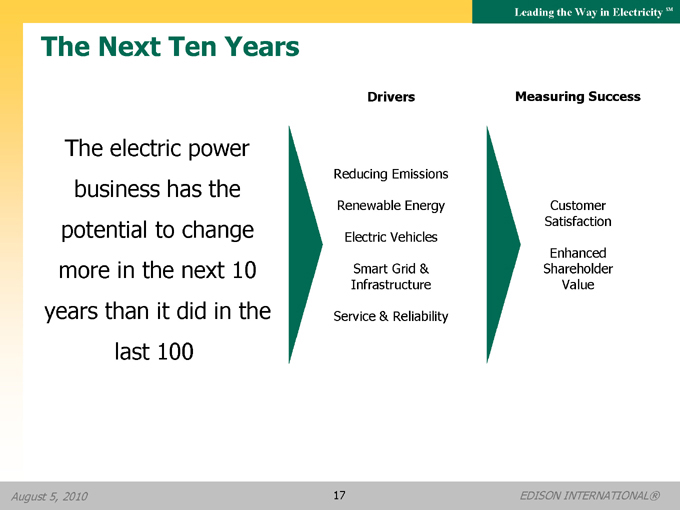
The Next Ten Years
The electric power business has the potential to change more in the next 10 years than it did in the last 100.
Drivers
Reducing Emissions
Renewable Energy
Electric Vehicles
Smart Grid & Infrastructure
Service & Reliability
Measuring Success
Customer Satisfaction
Enhanced Shareholder Value
August 5, 2010 17 EDISON INTERNATIONAL®

Leading the Way in Electricity SM
Liquidity Profile
June 30, 2010 ($ millions)
EMG
EME
Edison
EIX
&
Capital
parent co.
Sources
SCE
Subs
& other1
& other
Credit Facility
$2,894
$1,100
$-
$1,426
Credit Facility (availability)2
$2,668
$961
$-
$1,211
Cash & short-term investments
91
707
41
36
Available Liquidity
$2,759
$1,668
$41
$1,247
1 | | Edison Capital & other includes Mission Energy Holding Company and other EMG subsidiaries. |
2 Excludes the unused and/or unfunded commitments of subsidiaries of Lehman Brothers Holdings of $36 million for EMG. In June 2009, SCE and EIX amended their credit facilities to remove a subsidiary of Lehman Brothers Holding as a lender.
August 5, 2010 18 EDISON INTERNATIONAL®

Leading the Way in Electricity SM
Debt Maturity Profiles
June 30, 2010 ($ millions)
Debt Profile
2010
2011
2012
2013
Short- and Long-Term Debt Maturities
SCE
$215
$—
$—
$—
EMG1
23
109
49
555
EIX
215
—
—
—
Expiration of Credit Facilities
SCE2
$—
$—
$—
$2,894
EME
—
—
600
—
MWG
—
—
500
—
EIX2
—
—
—
1,426
1 Cedro Hill construction loan ($65 million, included in 2011) converts to long-term financing subject to meeting specific provisions.
2 $98 million of SCE commitments and $47 million of the EIX commitments mature in 2012.
August 5, 2010 19 EDISON INTERNATIONAL®
Leading the Way in Electricity SM
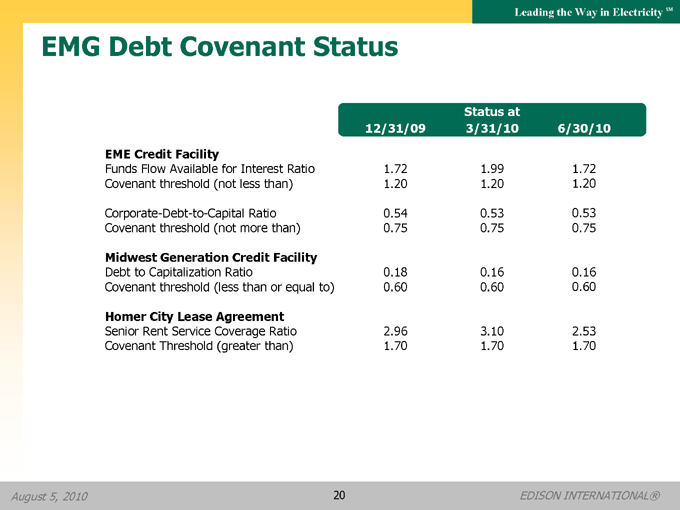
EMG Debt Covenant Status
Statusat
12/31/09
3/31/10
6/30/10
EME Credit Facility
Funds Flow Available for Interest Ratio
1.72
1.99
1.72
Covenant threshold (not less than)
1.20
1.20
1.20
Corporate-Debt-to-Capital Ratio
0.54
0.53
0.53
Covenant threshold (not more than)
0.75
0.75
0.75
Midwest Generation Credit Facility
Debt to Capitalization Ratio
0.18
0.16
0.16
Covenant threshold (less than or equal to)
0.60
0.60
0.60
Homer City Lease Agreement
Senior Rent Service Coverage Ratio
2.96
3.10
2.53
Covenant Threshold (greater than)
1.70
1.70
1.70
August 5, 2010 20 EDISON INTERNATIONAL®

Leading the Way in Electricity SM
SCE Appendix
August 5, 2010 21 EDISON INTERNATIONAL®

Leading the Way in Electricity SM
SCE Highlights
• One of the nation’s largest electric utilities
Over 13 million residents in service territory
4.9 million customer accounts
50,000 square-mile service area
Over 110,000 miles of distribution and transmission lines
• 8-11% five-year average annual rate base growth driven by $18 billion—$21.5 billion capital program
System reliability investments
Smart grid technology
California Renewable Portfolio Standard
August 5, 2010 22 EDISON INTERNATIONAL®

Leading the Way in Electricity SM
SCE Constructive Environment
Element
• Forward-looking rate-making
• Multi-year cost-of-capital mechanism
• Decoupling of regulated revenues from sales
• Reliable electric system
• Advance approval of annual procurement plans
• Procurement trigger mechanism
• FERC transmission incentives
Benefits to Customers and Investors
Three-year process allows planning of capex and operating costs
Through 2012, return-on-common equity tied to trigger mechanism based on Moody’s Baa Utility Bond Index; current rate is 11.5% Allows utility to promote energy conservation; stabilizes revenues during economic cycles
State regulatory actions supportive of reliable electric system; significant infrastructure replacement program
Upfront prudency review of utility procurement plan
Pre-established mechanism to adjust procurement rates should costs rise or fall significantly
Return on common equity adders, construction work in progress in rate base and abandoned plant treatment (if needed)
Regulatory framework supports growth and reliability needs
August 5, 2010 23 EDISON INTERNATIONAL®
Leading the Way in Electricity SM
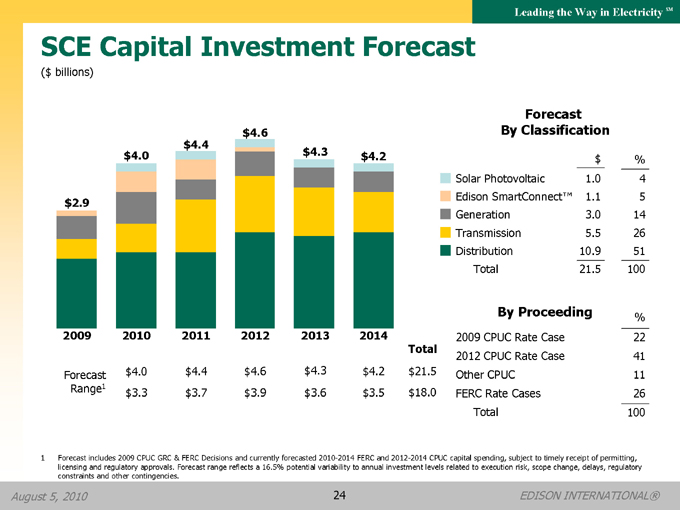
SCE Capital Investment Forecast
($ billions)
$4.6
$4.4
$4.3
$4.0
$4.2
$2.9
2009
2010
2011
2012
2013
2014
Total
Forecast
$4.0
$4.4
$4.6
$4.3
$4.2
$21.5
Range1
$3.3
$3.7
$3.9
$3.6
$3.5
$18.0
Forecast By Classification
$
%
1.0
4
1.1
5
3.0
14
5.5
26
10.9
51
21.5
100
2009
CPUC Rate Case
22
2012
CPUC Rate Case
41
Other CPUC
11
26
Total
100
By Proceeding %
1 Forecast includes 2009 CPUC GRC & FERC Decisions and currently forecasted 2010-2014 FERC and 2012-2014 CPUC capital spending, subject to timely receipt of permitting, licensing and regulatory approvals. Forecast range reflects a 16.5% potential variability to annual investment levels related to execution risk, scope change, delays, regulatory constraints and other contingencies.
August 5, 2010 24 EDISON INTERNATIONAL®

Leading the Way in Electricity SM
SCE Rate Base Forecast
($ billions)
$25.2
$23.0
$20.8
$18.1
$16.2
$14.8
2009 2010 2011 2012 2013 2014
| | | | | | | | | | | | | | | | | | | | | |
| | | | | | | | | | | | | | | | | | | | | 5-Yr | |
| | | | | | | | | | | | | | | | | | | | | CAGR2 | |
Forecast | | $ | 14.8 | | $ | 16.2 | | $ | 18.1 | | $ | 20.8 | | $ | 23.0 | | $ | 25.2 | | 11 | % |
Range1
| | | | | $ | 15.8 | | $ | 17.2 | | $ | 19.0 | | $ | 20.5 | | $ | 22.2 | | 8 | % |
1 Forecast includes: (1) 2009 CPUC GRC & FERC Decisions; (2) currently forecasted 2010-2014 FERC and 2012-2014 CPUC rate base, subject to timely receipt of permitting, licensing and regulatory approvals; (3) FERC construction work in progress forecast; (4) estimated impact of accelerated depreciation of the Economic Stimulus Act of 2009; and (5) CPUC approved solar rooftop program. Rate Base forecast range reflects capital spending forecast range from SCE Capital Investment Forecast.
2 Earnings per share growth rate may vary depending on the level of financing and other activities.
August 5, 2010 25 EDISON INTERNATIONAL®

Leading the Way in Electricity SM
SCE Transmission Investment Program
2010-2014
Project Name
Phase
In-Service ($ millions)1
Tehachapi Segment 3-112
Complete/Construction
2009-2015
$1,742
Devers-Colorado River Project
Licensing
2013
658
Eldorado-Ivanpah
Licensing
2013
469
San Joaquin Cross Valley Loop
Licensing
2012
128
Alberhill
Licensing
2014
171
Other Projects3
Various
Various
2,375
Grand Total
$5,543
San Joaquin Cross Valley Loop
Rector SCE Highwind Service Whirlwind WindhubTerritory
Antelope Eldorado
Santa Clarita Palmdale Ivanpah
Vincent
Pardee Devers Mira Loma
Los Angeles Santa
Ana Valley PalmSprings Colorado River Alberhill
San Diego
San Diego
DCR 500kV Tehachapi Segments 1-3 500kV Alberhill Tehachapi Segments 4-11 500kV Eldorado Ivanpah San Joaquin Cross Valley Loop Existing Substation
Transmission investment needed to strengthen system reliability and increase access to renewable energy
1 | | FERC jurisdictional assets only. Subject to timely receipt of permitting, licensing and regulatory approvals. |
2 A portion of Segment 3 was ready for service in 2009. The remainder is under construction and will be placed in service under a phased approach from 2011 through 2013.
3 Includes new transmission projects to connect renewable generation and projects related to reliability, load growth, infrastructure replacement and grid monitoring and control.
August 5, 2010 26 EDISON INTERNATIONAL®
Leading the Way in Electricity SM
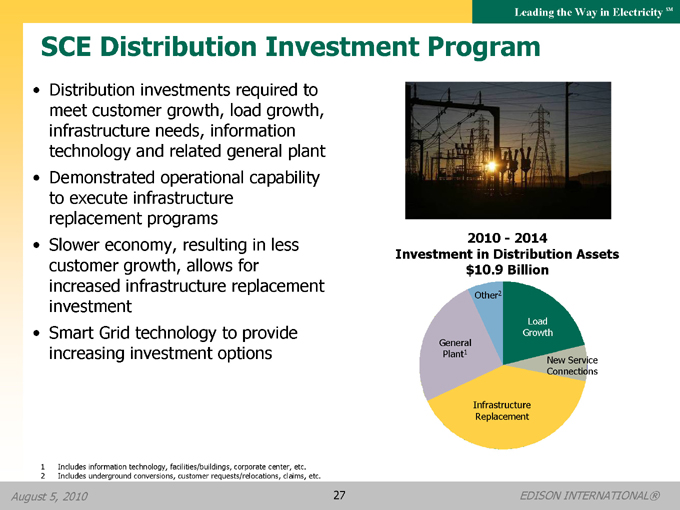
SCE Distribution Investment Program
• Distribution investments required to meet customer growth, load growth, infrastructure needs, information technology and related general plant
• Demonstrated operational capability to execute infrastructure replacement programs
• Slower economy, resulting in less customer growth, allows for increased infrastructure replacement investment
• Smart Grid technology to provide increasing investment options
2010 - 2014
Investment in Distribution Assets $10.9 Billion
Other2
Load Growth General Plant1
New Service Connections
Infrastructure Replacement
1 Includes information technology, facilities/buildings, corporate center, etc.
2 Includes underground conversions, customer requests/relocations, claims, etc.
August 5, 2010 27 EDISON INTERNATIONAL®
Leading the Way in Electricity SM
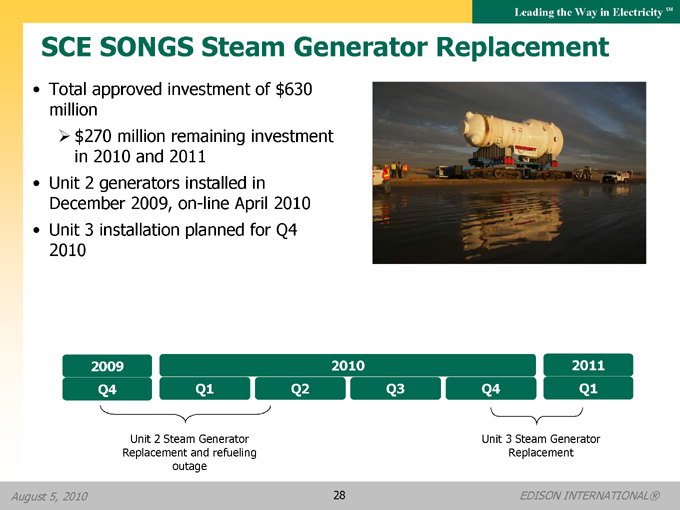
SCE SONGS Steam Generator Replacement
• Total approved investment of $630 million
$270 million remaining investment in 2010 and 2011
• Unit 2 generators installed in December 2009, on-line April 2010
• Unit 3 installation planned for Q4 2010
2009
2010
2011
Q4
Q1
Q2
Q3
Q4
Q1
Unit 2 Steam Generator
Unit
3 Steam Generator
Replacement and refueling
Replacement
outage
August 5, 2010 28 EDISON INTERNATIONAL®

Leading the Way in Electricity SM
SCE Solar Photovoltaic Program
• SCE authorized to build 250 MW and contract for 250 MW1
1-2 MW average project - primarily on commercial rooftops
• Master Supply Agreements in place for all major components
• Projected 42 MW of SCE-owned solar installed and 8 MW in construction by year-end 2010
• Annual Requests for Offers (RFOs) to procure 250 MW, under 20-year PPAs
RFO issued in March 2010
Executed 36 solar PV contracts for 60 MW (DC) in July 2010
Online dates for majority of PPA’s anticipated in 2011 and 2012
2009
2010
2011
2012
2013
2014
CPUC approval
60 MW awarded
Various sites in construction (future)
June 2009
July 2010
1 CPUC decision received June 2009 authorized SCE to construct up to 250 MW for a cost of $1 billion, and ordered SCE to procure up to 250 MW from independent solar producers.
August 5, 2010 29 EDISON INTERNATIONAL®
Leading the Way in Electricity SM
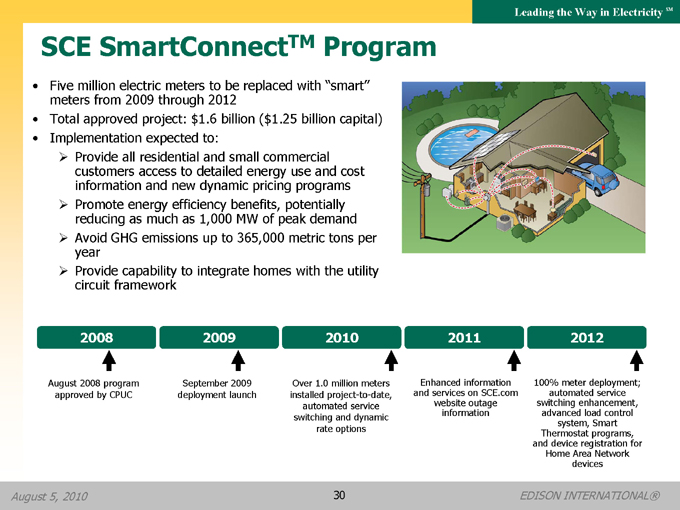
SCE SmartConnectTM Program
• Five million electric meters to be replaced with “smart” meters from 2009 through 2012
• Total approved project: $1.6 billion ($1.25 billion capital)
• Implementation expected to:
Provide all residential and small commercial customers access to detailed energy use and cost information and new dynamic pricing programs
Promote energy efficiency benefits, potentially reducing as much as 1,000 MW of peak demand
Avoid GHG emissions up to 365,000 metric tons per year
Provide capability to integrate homes with the utility circuit framework
2008
2009
2010
2011
2012
August 2008 program
September 2009
Over 1.0 million meters
Enhanced information
100% meter deployment;
approved by CPUC
deployment launch
installed project-to-date,
and services on SCE.com
automated service
automated service
website outage
switching enhancement,
switching and dynamic rate options
information
advanced load control
system, Smart
Thermostat programs,
and device registration for
Home Area Network
devices
August 5, 2010 30 EDISON INTERNATIONAL®

Leading the Way in Electricity SM
California Renewable Policy
• Governor Schwarzenegger’s executive order advances renewable energy goals from 20% to 33%
• California Air Resources Board (CARB) actions
Final regulation postponed until September 2010
Likely targets: 20% in 2013; 24% in 2016; 28% in 2018; 33% in 2020
• Policy debates in both forums center around
Use of out-of-state resources
Compliance flexibility around targets
Cost impacts for customers
Applicability to Municipal utilities and other retail electricity providers
SCE is taking a proactive approach towards environmental stewardship policy formulation
August 5, 2010 31 EDISON INTERNATIONAL®

Leading the Way in Electricity SM
SCE Renewable Portfolio
SCE 2010 20% Renewable Energy Goal
Contracts are in place to meet 20% of customers’ energy requirement with renewable resources, but a portion of energy delivery may be delayed in 2010 due to transmission constraints. SCE expects to meet the 2010 goal with flexible compliance that allows banking and earmarking of past and future renewable energy surplus.
Renewable Resources
(billion kWh)
Small Hydro 4% Solar 6% Biomass 7%
Geothermal 57% Wind 26%
89% Increa se
28.2
13.6
14.9
10%
2009
2010
2020
20% RPS
Potential
(forecast)
33% RPS
(forecast)
SCE Renewable Resource % of Total Delivered Portfolio 17% 19+%
August 5, 2010 32 EDISON INTERNATIONAL®

Leading the Way in Electricity SM
SCE Cost of Capital Mechanism
Moody’s Baa Utility Index—12-month moving average and spot rate through 7/30/101
10
Spot rate1
9
Average from beginning
of measurement period
8
(%)
7
Rate
6
5
4
Sep-07
Dec-07
Mar-08
Jun-08
Sep-08 Dec-08
Mar-09
Jun-09 Sep-09 Dec-09
Mar-10
Jun-10
• In 2008, CPUC approved multi -year cost of capital mechanism through 2010 with authorized return on equity (ROE) at 11.5%
2012
• Cost of Capital mechanism allows for indexed changes in SCE’s authorized ROE:
Triggers based on 12-month average of Moody’s Baa utility bond index, measured in September of each year
If index exceeds a 1% deadband from starting index value of 6.26%, ROE changes by half the difference
• As of July 2010, index is averaging 6.15%
At September 2010, index must exceed 7.26% or be below 5.26% to trigger ROE change
If not triggered, SCE’s authorized ROE for 2011 will continue at 11.5%
1 Spot rate is daily yield on Moody’s Baa Utility Bond Index and the Measurement Period Average is the average of the monthly yields on the index beginning with the first month of the measurement period.
August 5, 2010 33 EDISON INTERNATIONAL®

Leading the Way in Electricity SM
SCE Rates and Bills Comparison
2008 Average Residential Rates1 (¢/kWh)
15.0
11.6
30% Higher
U.S. Average SCE
2008 Average Residential Bills1 ($ per Month)
100
90
9% Lower
U.S. Average SCE
Key Factors
• SCE’s residential rates are above national average due, in part, to cleaner fuel mix
Costs for renewables are higher than high carbon sources
• However, average monthly residential bills are lower than national average, with high rate levels offset by significantly lower average customer usage
Residential usage is 30% lower than national average, due to a combination of factors including relatively mild climate and higher efficiency building standards
1 | | EIA’s 2008 Electric Sales, Revenue, and Average Price Data. |
August 5, 2010 34 EDISON INTERNATIONAL®
Leading the Way in Electricity SM
SCE 2012 CPUC General Rate Case
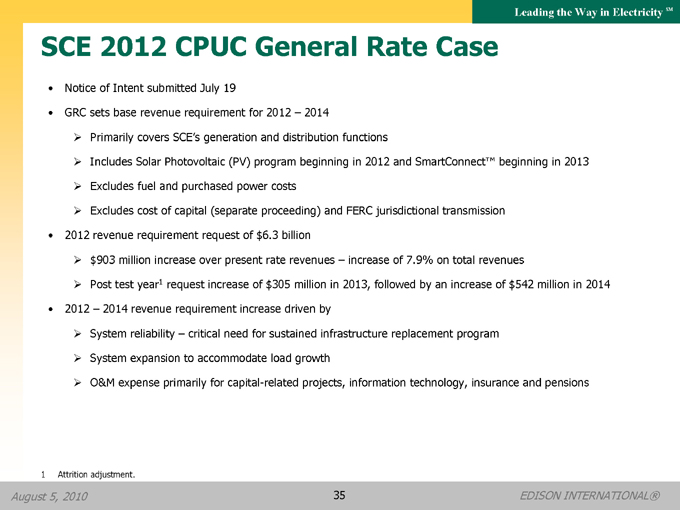
• Notice of Intent submitted July 19
• GRC sets base revenue requirement for 2012 – 2014
Primarily covers SCE’s generation and distribution functions
Includes Solar Photovoltaic (PV) program beginning in 2012 and SmartConnect™ beginning in 2013
Excludes fuel and purchased power costs
Excludes cost of capital (separate proceeding) and FERC jurisdictional transmission
• 2012 revenue requirement request of $6.3 billion
$903 million increase over present rate revenues – increase of 7.9% on total revenues
Post test year1 request increase of $305 million in 2013, followed by an increase of $542 million in 2014
• 2012 – 2014 revenue requirement increase driven by
System reliability – critical need for sustained infrastructure replacement program
System expansion to accommodate load growth
O&M expense primarily for capital-related projects, information technology, insurance and pensions
August 5, 2010 35 EDISON INTERNATIONAL®

Leading the Way in Electricity SM
SCE 2012 CPUC GRC Projected Schedule
• 2012 GRC application forecast to be filed in late November 2010
• Final Decision expected in December 2011
2010
2011
Q1
Q2
Q3
Q4
Q1
Q2
Q3
Q4
July 19
GRC
July 16-August 2
Final
Notice of
Application
Opening and
Decision
Intent
Filed
Reply Briefs
June 1-16
ALJ Proposed
Evidentiary
Decision
Hearings
August 5, 2010 36 EDISON INTERNATIONAL®

Leading the Way in Electricity SM
SCE Regulatory Key Events
Case
Date of
Next
Number
Filing
Status
Milestone
September 2009, FERC accepted SCE’s proposed
Hearings begin
2010 FERC
December 1, 2010
ER09-1534
07/31/09
2010 base transmission rates and made them
Rate Case
effective March 1, 2010, subject to refund.
ALJ order is expected in April
2011.
Tehachapi
December 2009, Certificate of Public Convenience
Record of Decision from U.S.
A.07- A.07-06- 031
06/28/07
and Necessity (CPCN) granted by CPUC (D. 09-12-
Forest Service expected by Q4
Transmission
044).
2010.
CAISO approval is expected in
DCR
November 2009, the CPUC approved construction,
Q4 2010. Record of Decision
A.05- A.05-04- 015
04/11/05
Transmission
subject to CAISO approval.
expected from Bureau of Land
Management in Q4 2010.
April 2010, the CPUC issued a Draft EIR. With
Eldorado-Ivanpah
regard to rate incentives, FERC approval is still
Final EIR expected from CPUC
A.09- A.09-05- 027
05/28/09
conditioned upon CAISO approval and a finding
Transmission
that the project ensures reliability or reduces the
by Q4 2010.
cost of delivered power.
Alberhill
A.09- A.09-09- 022
09/30/09
Permit to Construct (PTC) filed September 2009
Draft EIR expected from CPUC
and converted to CPCN filing March 2010.
in Q4 2010.
May 2010, the CPUC released a Proposed Decision
Final Decision is expected by
San Joaquin Cross
A.08- A.08-05- 039
05/30/08
as well as an Alternate Proposed Decision.
Q4 2010.
VALLEY LOOP
August 5, 2010 37 EDISON INTERNATIONAL®

Leading the Way in Electricity SM
EMG Appendix
August 5, 2010 38 EDISON INTERNATIONAL®

Leading the Way in Electricity SM
EMG Business Platform
June 30, 2010
Operating Platform1
MW
%
Coal
7,395
74
Natural Gas
1,269
13
Wind
1,185
12
Other
153
1
Total
10,002
100
Wind Development Pipeline
MW
Pipeline2
~3,400
Under Construction
600
Thermal Pipeline
Natural Gas3
479
145
141
1,884
53
145
67
5,471
19
305
40
964
190
114
311
1 Natural gas includes oil-fired; other includes Doga in Turkey (144 MW) and Huntington biomass (9 MW) which are not shown.
2 | | Owned or under exclusive agreement. |
3 Deliveries under the power sales agreement are expected to commence in 2013. Construction will be unable to begin until the legal challenges to the Priority Reserve emission credits are resolved or another source of credits for the project is identified.
August 5, 2010 39 EDISON INTERNATIONAL®

Leading the Way in Electricity SM
EMG – Illinois Compliance Agreement Timeline
Compliance Deadlines and Estimated Construction Timelines1
2010
2011
2012
2013
2014
2015
2016
2017
2018 2019
Mercury
Waukegan 7
Will County 3
0.008 or 90% reduction
Compliance deadlines and rates (lb/GWh)
Construction timelines
NOx
0.11
Compliance deadlines and rates (lb/mmbtu)
Construction timelines
SO2
Waukegan 7
Crawford 7,
Compliance deadlines and rates (lb/mmbtu)
0.44
Waukegan 8
Joliet,
0.41
Fisk
Powerton,
0.28
0.195
Crawford 8
Will
0.15
County
0.13
0.11
Construction timelines
Compliance scenario and capital requirements to be determined
NOx
SO2
Mercury
Unit-specific technology requirements
Fleet-wide average emission rate requirements
Capital spending period
1 Simplified summary of key compliance deadlines and estimated construction timelines. No decision has been made on SO2 or further mercury compliance approach and estimated capital costs. Unit-specific deadlines as of December 31 of the calendar year shown. SO2 unit-specific deadlines apply to Unit 19 at Fisk, Units 7 and 8 at Waukegan, Units 7 and 8 at Crawford, Units 6, 7 and 8 at Joliet, Units 5 and 6 at Powerton and Units 3 and 4 at Will County.
August 5, 2010 40 EDISON INTERNATIONAL®
Leading the Way in Electricity SM
Edison Mission Marketing & Trading (EMMT)
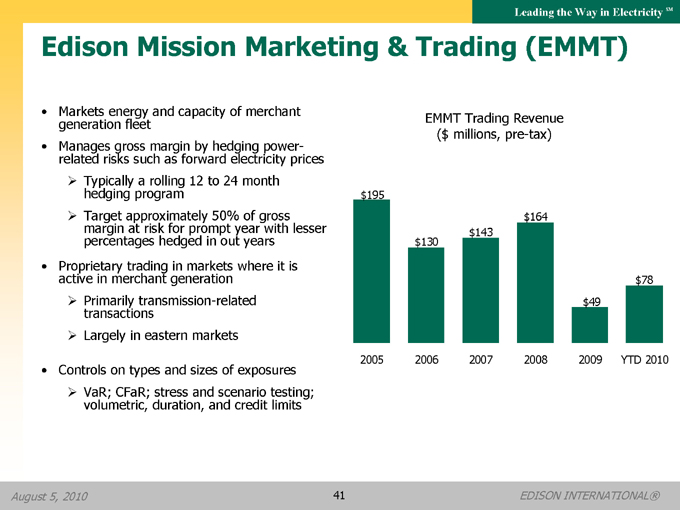
• Markets energy and capacity of merchant generation fleet
• Manages gross margin by hedging power- related risks such as forward electricity prices
Typically a rolling 12 to 24 month hedging program
Target approximately 50% of gross margin at risk for prompt year with lesser percentages hedged in out years
• Proprietary trading in markets where it is active in merchant generation
Primarily transmission-related transactions
Largely in eastern markets
• Controls on types and sizes of exposures
VaR; CFaR; stress and scenario testing; volumetric, duration, and credit limits
EMMT Trading Revenue ($ millions, pre-tax)
$195
$164
$143
$130
$78
$49
2005
2006
2007
2008
2009
$195
$164
$143
$130
$78
$49
2005
2006
2007
2008
2009
YTD 2010
YTD 2010
August 5, 2010 41 EDISON INTERNATIONAL®
Leading the Way in Electricity SM
EMG Comparative Operating Statistics
Fav./(Unfav.)
Fav./(Unfav.)
Q2 09
Q2 10
Variance
%
YTD 09
YTD 10
Variance
%
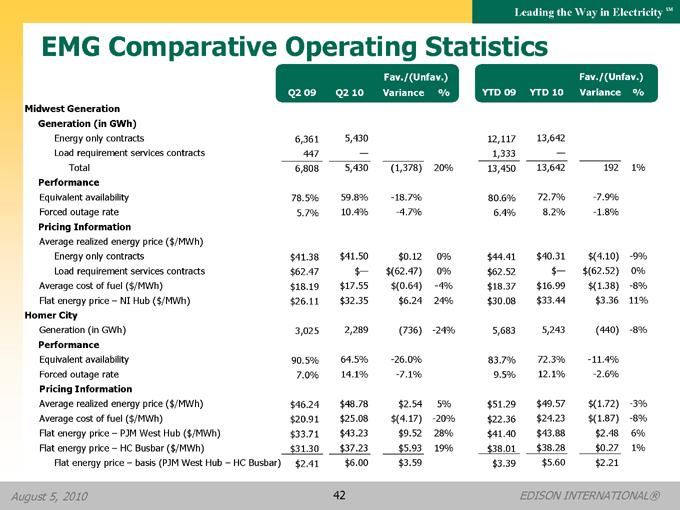
Midwest Generation
Generation (in GWh)
Energy only contracts
6,361
5,430
12,117
13,642
Load requirement services contracts
447
—
1,333
—
Total
6,808
5,430
(1,378)
20%
13,450
13,642
192
1%
Performance
Equivalent availability
78.5%
59.8%
-18.7%
80.6%
72.7%
-7.9%
Forced outage rate
5.7%
10.4%
-4.7%
6.4%
8.2%
-1.8%
Pricing Information
Average realized energy price ($/MWh)
Energy only contracts
$41.38
$41.50
$0.12
0%
$44.41
$40.31
$(4.10)
-9%
Load requirement services contracts
$62.47
$—
$(62.47)
0%
$62.52
$—
$(62.52)
0%
Average cost of fuel ($/MWh)
$18.19
$17.55
$(0.64)
-4%
$18.37
$16.99
$(1.38)
-8%
Flat energy price – NI Hub ($/MWh)
$26.11
$32.35
$6.24
24%
$30.08
$33.44
$3.36
11%
Homer City
Generation (in GWh)
3,025
2,289
(736)
-24%
5,683
5,243
(440)
-8%
Performance
Equivalent availability
90.5%
64.5%
-26.0%
83.7%
72.3%
-11.4%
Forced outage rate
7.0%
14.1%
-7.1%
9.5%
12.1%
-2.6%
Pricing Information
Average realized energy price ($/MWh)
$46.24
$48.78
$2.54
5%
$51.29
$49.57
$(1.72)
-3%
Average cost of fuel ($/MWh)
$20.91
$25.08
$(4.17)
-20%
$22.36
$24.23
$(1.87)
-8%
Flat energy price – PJM West Hub ($/MWh)
$33.71
$43.23
$9.52
28%
$41.40
$43.88
$2.48
6%
Flat energy price – HC Busbar ($/MWh)
$31.30
$37.23
$5.93
19%
$38.01
$38.28
$0.27
1%
Flat energy price – basis (PJM West Hub – HC Busbar)
$2.41
$6.00
$3.59
$3.39
$5.60
$2.21
August 5, 2010 42 EDISON INTERNATIONAL®

Leading the Way in Electricity SM
Our Shareholder Value Proposition
• Dual platform operating across the full spectrum of the electricity industry
• Southern California Edison
Among the best domestic electric utility growth platforms
Supportive regulatory framework
Leadership in renewable energy, energy efficiency, electric vehicles and smart grid development
• Edison Mission Group
See real equity value in the portfolio
Working coal fleet environmental compliance issues
Current wind construction program is self-funding
• Commitment to long-term shareholder value creation
• Incentive compensation and stock ownership guidelines consistent with shareholder interests
• Edison people committed to excellence in safety and customer service
August 5, 2010 43 EDISON INTERNATIONAL®
Leading the Way in Electricity SM
EMG – Adjusted EBITDA
June 30, 2010 ($ millions)
Reconciliation to Earnings1
Q2 09
Q2 10
YTD 09
YTD 10
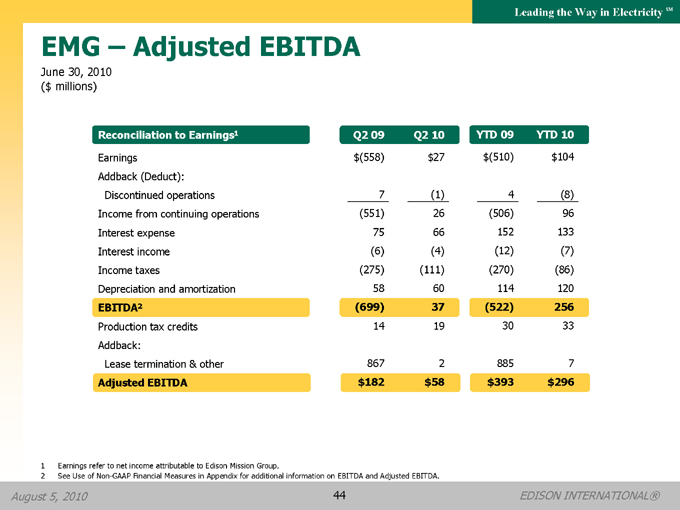
Earnings
$(558)
$27
$(510)
$104
Addback (Deduct):
Discontinued operations
7
(1)
4
(8)
Income from continuing operations
(551)
26
(506)
96
Interest expense
75
66
152
133
Interest income
(6)
(4)
(12)
(7)
Income taxes
(275)
(111)
(270)
(86)
Depreciation and amortization
58
60
114
120
EBITDA2
(699)
37
(522)
256
Production tax credits
14
19
30
33
Addback:
Lease termination & other
867
2
885
7
Adjusted EBITDA
$182
$58
$393
$296
1 | | Earnings refer to net income attributable to Edison Mission Group. |
2 | | See Use of Non-GAAP Financial Measures in Appendix for additional information on EBITDA and Adjusted EBITDA. |
August 5, 2010 44 EDISON INTERNATIONAL®

Leading the Way in Electricity SM
Earnings Non-GAAP Reconciliations
($ millions)
Reconciliation of EIX Core Earnings to EIX Basic Earnings
Earnings
Attributable to Edison International
Q2 09
Q2 10
YTD 09
YTD 10
Core Earnings1
SCE
$199
$248
$407
$451
EMG
61
(32)
118
38
EIX parent company and other
(7)
(11)
(13)
(16)
EIX core earnings
253
205
512
473
Non-core items
SCE – tax settlement and health care legislation
300
53
300
14
EMG – tax settlement2
(612)
58
(624)
58
EIX – tax settlement
50
27
50
27
EMG – discontinued operations
(7)
1
(4)
8
Total non-core items
(269)
139
(278)
107
EIX Basic Earnings
$(16)
$344
$234
$580
1 | | See Use of Non-GAAP Financial Measures in Appendix. |
2 | | 2010 amounts do not include estimated interest netting detriment to be recorded in Q3 2010. |
August 5, 2010 45 EDISON INTERNATIONAL®
Leading the Way in Electricity SM
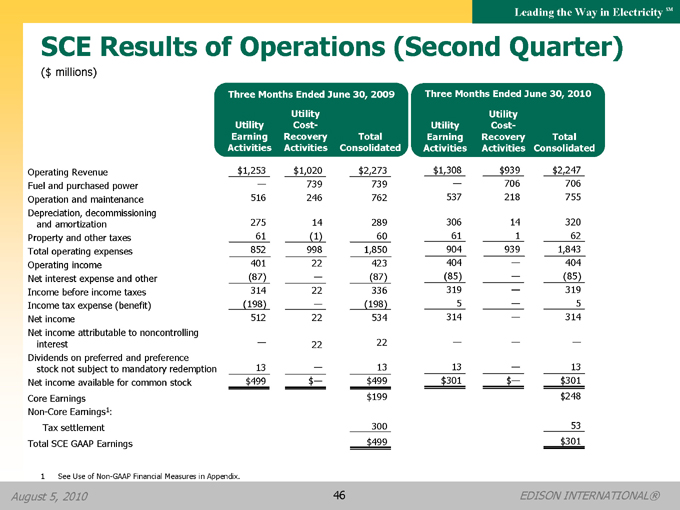
SCE Results of Operations (Second Quarter)
($ millions)
| | | | | | | | | | | | | | | | | | | | | | | |
| | |
| Three Months Ended June 30,
2009 |
| |
| Three Months Ended June 30,
2010 |
|
| | | | | | | | Utility | | | | | | | | | | | | Utility | | | | |
| | | | Utility | | | | Cost- | | | | | | | | Utility | | | | Cost- | | | | |
| | | | Earning | | | | Recovery | | | | Total | | | | Earning | | | | Recovery | | | Total | |
| | |
| Activities Activities
Consolidated |
| | | Activities | | |
| Activities
Consolidated |
|
Operating Revenue | | $ | 1,253 | | | $ | 1,020 | | | $ | 2,273 | | | $ | 1,308 | | | $ | 939 | | $ | 2,247 | |
Fuel and purchased power | | | — | | | | 739 | | | | 739 | | | | — | | | | 706 | | | 706 | |
Operation and maintenance | | | 516 | | | | 246 | | | | 762 | | | | 537 | | | | 218 | | | 755 | |
Depreciation, decommissioningand amortization | | | 275 | | | | 14 | | | | 289 | | | | 306 | | | | 14 | | | 320 | |
Property and other taxes | | | 61 | | | | (1 | ) | | | 60 | | | | 61 | | | | 1 | | | 62 | |
Total operating expenses | | | 852 | | | | 998 | | | | 1,850 | | | | 904 | | | | 939 | | | 1,843 | |
Operating income | | | 401 | | | | 22 | | | | 423 | | | | 404 | | | | — | | | 404 | |
Net interest expense and other | | | (87 | ) | | | — | | | | (87 | ) | | | (85 | ) | | | — | | | (85 | ) |
Income before income taxes | | | 314 | | | | 22 | | | | 336 | | | | 319 | | | | — | | | 319 | |
Income tax expense (benefit) | | | (198 | ) | | | — | | | | (198 | ) | | | 5 | | | | — | | | 5 | |
Net income | | | 512 | | | | 22 | | | | 534 | | | | 314 | | | | — | | | 314 | |
Net income attributable to noncontrollinginterest | | | — | | | | 22 | | | | 22 | | | | — | | | | — | | | — | |
Dividends on preferred and preferencestock not subject to mandatory redemption | | | 13 | | | | — | | | | 13 | | | | 13 | | | | — | | | 13 | |
Net income available for common stock | | $ | 499 | | | $ | — | | | $ | 499 | | | $ | 301 | | | $ | — | | $ | 301 | |
Core Earnings | | | | | | | | | | $ | 199 | | | | | | | | | | $ | 248 | |
Non-Core Earnings1: | | | | | | | | | | | | | | | | | | | | | | | |
Tax settlement | | | | | | | | | | | 300 | | | | | | | | | | | 53 | |
Total SCE GAAP Earnings | | | | | | | | | | $ | 499 | | | | | | | | | | $ | 301 | |
1 | | See Use of Non-GAAP Financial Measures in Appendix. |
August 5, 2010 46 EDISON INTERNATIONAL®

Leading the Way in Electricity SM
SCE Results of Operations (Year-To-Date)
($ millions)
Six Months Ended June 30, 2009
Six Months Ended June 30, 2010
Utility
Utility
Utility
Cost-
Utility
Cost-
Earning
Recovery
Total
Earning
Recovery
Total
Activities Activities Consolidated
Activities
Activities Consolidated
Operating Revenue
$2,457
$2,005
$4,462
$2,573
$1,833
$4,406
Fuel and purchased power
—
1,480
1,480
—
1,395
1,395
Operation and maintenance
958
462
1,420
1,057
411
1,468
Depreciation, decommissioningand amortization
548
26
574
605
24
629
Property and other taxes
127
(1)
126
129
1
130
Total operating expenses
1,633
1,967
3,600
1,791
1,831
3,622
Operating income
824
38
862
782
2
784
Net interest expense and other
(169)
(4)
(173)
(157)
(2)
(159)
Income before income taxes
655
34
689
625
—
625
Income tax expense (benefit)
(77)
—
(77)
134
—
134
Net income
732
34
766
491
—
491
Net income attributable to noncontrollinginterest
—
34
34
—
—
—
Dividends on preferred and preferencestock not subject to mandatory redemption
25
—
25
26
—
26
Net income available for common stock
$707
$—
$707
$465
$—
$465
Core Earnings
$407
$451
Non-Core Earnings1:
Tax settlement and tax impact of health care legislation
300
14
Total SCE GAAP Earnings
$707
$465
1 | | See Use of Non-GAAP Financial Measures in Appendix. |
August 5, 2010 47 EDISON INTERNATIONAL®
Leading the Way in Electricity SM
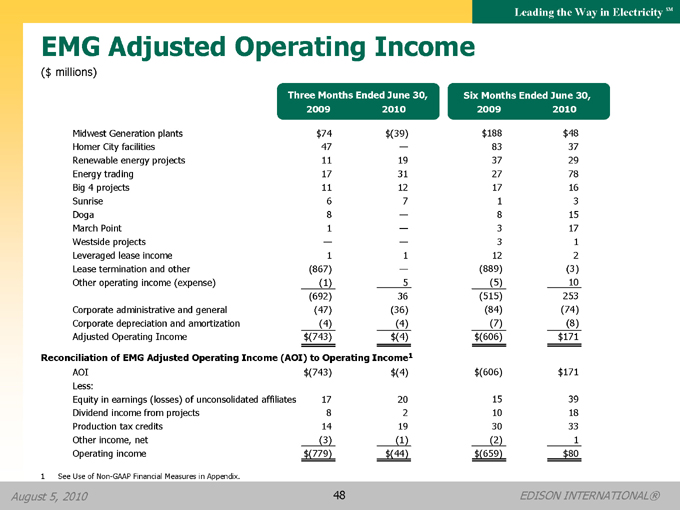
EMG Adjusted Operating Income
($ millions)
Three Months Ended June 30,
Six Months Ended June 30,
2009
2010
2009
2010
Midwest Generation plants
$74
$(39)
$188
$48
Homer City facilities
47
—
83
37
Renewable energy projects
11
19
37
29
Energy trading
17
31
27
78
Big 4 projects
11
12
17
16
Sunrise
6
7
1
3
Doga
8
—
8
15
March Point
1
—
3
17
Westside projects
—
—
3
1
Leveraged lease income
1
1
12
2
Lease termination and other
(867)
—
(889)
(3)
Other operating income (expense)
(1)
5
(5)
10
(692)
36
(515)
253
Corporate administrative and general
(47)
(36)
(84)
(74)
Corporate depreciation and amortization
(4)
(4)
(7)
(8)
Adjusted Operating Income
$(743)
$(4)
$(606)
$171
Reconciliation of EMG Adjusted Operating Income (AOI) to Operating Income1
AOI
$(743)
$(4)
$(606)
$171
Less:
Equity in earnings (losses) of unconsolidated affiliates
17
20
15
39
Dividend income from projects
8
2
10
18
Production tax credits
14
19
30
33
Other income, net
(3)
(1)
(2)
1
Operating income
$(779)
$(44)
$(659)
$80
1 | | See Use of Non-GAAP Financial Measures in Appendix. |
August 5, 2010 48 EDISON INTERNATIONAL®

Leading the Way in Electricity SM
EMG Other Non-GAAP Reconciliations
($ millions)
Reconciliation of Midwest Generation and Homer City Operating Revenues and Fuel Costs
to All-in Average Realized Price/MWh and Average Realized Fuel Cost/MWh
Midwest Generation
Homer City
Q2 09
Q2 10
YTD 09
YTD 10
Q2 09
Q2 10
YTD 09
YTD 10
Generation (GWh)
6,808
5,430
13,450
13,642
3,025
2,289
5,683
5,243
Operating revenues
$340
$281
$724
$660
$161
$129
$326
$304
Less: Unrealized (gains) losses
(5)
3
(20)
(4)
(5)
12
(5)
14
Other revenues
(1)
(1)
(1)
(1)
2
—
1
—
Realized revenues
$334
$283
$703
$655
$158
$141
$322
$318
All-in average realized price/MWh
$49.00
$52.12
$52.23
$47.98
$52.13
$61.38
$56.62
$60.57
Fuel expenses
$110
$98
$233
$239
$63
$57
$127
$127
Less: Unrealized gains (losses)
14
(2)
14
(7)
—
—
—
—
Realized fuel expenses
$124
$96
$247
$232
$63
$57
$127
$127
Average realized fuel cost/MWh
$18.19
$17.55
$18.37
$16.99
$20.91
$25.08
$22.36
$24.23
August 5, 2010 49 EDISON INTERNATIONAL®
Leading the Way in Electricity SM
Use of Non-GAAP Financial Measures
Edison International’s earnings are prepared in accordance with generally accepted accounting principles used in the management United States uses and represent core earnings the company’s and EPS by earnings principal as operating reported subsidiary to the Securities internally and for Exchange financial Commission. planning and Our for analysis of performance. We also use core earnings and EPS by principal operating subsidiary when communicating with analysts and investors regarding our earnings results and outlook, to facilitate the company’s performance from period to period.
Core and core earnings earnings is a per Non share -GAAP are financial defined measure as GAAP and earnings may not and be GAAP comparable earnings to per those share of other excluding companies. income Core or loss earnings from discontinued operations and income or loss from significant discrete items that management does not consider representative to the common of shareholders ongoing earnings. of each GAAP subsidiary earnings and refer Edison to International net income attributable GAAP earnings to Edison per share International refers to or basic attributable earnings per common share attributable to Edison International common shareholders. EPS by principal operating subsidiary is respectively, based on the and principal Edison operating International’s subsidiaries’ weighted net income average attributable outstanding to common the common shares. shareholders The impact of of each participating subsidiary, securities (vested stock options that earn dividend equivalents that may participate in undistributed earnings with common reflected stock) for in each the principal results of operating the Edison subsidiary International is not holding material company, to each principal which we operating refer to as subsidiary’s EIX parent EPS company and is and therefore other. production EBITDA is defined tax credits as earnings from EMG’s before wind interest, projects income and excludes taxes, depreciation amounts from and gain amortization. on the sale Adjusted of assets, EBITDA loss on includes early extinguishment of debt and leases, and impairment of assets and investments. Our management uses Adjusted EBITDA as an important financial measure for evaluating EMG.
The statistical average measures realized exclude energy unrealized price and average gains or realized losses recorded fuel cost as is operating a non-GAAP revenues performance and unrealized measure gains since or such losses recorded as fuel expenses. Management believes that the average realized energy price and average realized fuel cost is period more meaningful comparisons for or investors as compared as it reflects to real- time the impact market of prices. hedge contracts at the time of actual generation in period-over- A either reconciliation on the slide of Non where -GAAP the information information to appears GAAP or information, on another including slide referenced the impact in this of participating presentation. securities, is included
August 5, 2010 50 EDISON INTERNATIONAL®