UNITED STATES
SECURITIES AND EXCHANGE COMMISSION
Washington, D.C. 20549
FORM N-CSR
CERTIFIED SHAREHOLDER REPORT OF REGISTERED
MANAGEMENT INVESTMENT COMPANIES
|
| | | | | | |
| Investment Company Act file number | 811-05447 |
| | |
| AMERICAN CENTURY QUANTITATIVE EQUITY FUNDS, INC. |
| (Exact name of registrant as specified in charter) |
| | |
| 4500 MAIN STREET, KANSAS CITY, MISSOURI | 64111 |
| (Address of principal executive offices) | (Zip Code) |
| | |
CHARLES A. ETHERINGTON 4500 MAIN STREET, KANSAS CITY, MISSOURI 64111 |
| (Name and address of agent for service) |
| | |
| Registrant’s telephone number, including area code: | 816-531-5575 |
| | |
| Date of fiscal year end: | 06-30 |
| | |
| Date of reporting period: | 06-30-2018 |
ITEM 1. REPORTS TO STOCKHOLDERS.
|
| |
| ANNUAL REPORT | |
| JUNE 30, 2018 |
| |
|
|
AC Alternatives® Disciplined Long Short Fund |
| Investor Class (ACDJX) |
| I Class (ACDKX) |
| A Class (ACDQX) |
| C Class (ACDHX) |
| R Class (ACDWX) |
|
| | |
| President's Letter | 2 |
|
| Performance | 3 |
|
| Portfolio Commentary | |
|
| Fund Characteristics | |
|
| Shareholder Fee Example | |
|
| Schedule of Investments | |
|
| Statement of Assets and Liabilities | |
|
| Statement of Operations | |
|
| Statement of Changes in Net Assets | |
|
| Notes to Financial Statements | |
|
| Financial Highlights | |
|
| Report of Independent Registered Public Accounting Firm | |
|
| Management | |
|
| Approval of Management Agreement | |
|
| Additional Information | |
|
Any opinions expressed in this report reflect those of the author as of the date of the report, and do not necessarily represent the opinions of American Century Investments® or any other person in the American Century Investments organization. Any such opinions are subject to change at any time based upon market or other conditions and American Century Investments disclaims any responsibility to update such opinions. These opinions may not be relied upon as investment advice and, because investment decisions made by American Century Investments funds are based on numerous factors, may not be relied upon as an indication of trading intent on behalf of any American Century Investments fund. Security examples are used for representational purposes only and are not intended as recommendations to purchase or sell securities. Performance information for comparative indices and securities is provided to American Century Investments by third party vendors. To the best of American Century Investments’ knowledge, such information is accurate at the time of printing.
 Jonathan Thomas
Dear Investor:
Thank you for reviewing this annual report for the period ended June 30, 2018. Annual reports help convey important information about fund returns, including market factors that affected performance during the reporting period. For additional, updated investment and market insights, we encourage you to visit our website, americancentury.com.
Volatility’s Return Challenged Financial Markets
Broad U.S. and global stock market indices generally rallied for the first half of the 12-month period. A favorable backdrop of robust corporate earnings results, improving global economic growth, and relatively low interest rates, combined with the effects of U.S. tax reform, drove stock prices higher. For the six months ended December 31, 2017, U.S. stocks (S&P 500 Index) returned 11.42%. U.S. bond returns were also positive, but much more subdued, as the Federal Reserve (the Fed) continued its rate-normalization efforts and interest rates edged higher. The Bloomberg Barclays U.S. Aggregate Bond Index returned 1.24% for the six-month period.
In early February, a force that was largely dormant during 2017—volatility—re-emerged, as better-than-expected economic data triggered expectations for rising inflation, higher interest rates, and a more-hawkish Fed. In response, U.S. Treasury yields climbed to their highest levels in several years, and stock prices plunged. Economic data released in subsequent months were more in line with market expectations, while corporate earnings results remained healthy. These factors helped calm the market unrest, and stocks generally recovered their earlier losses. Nevertheless, rising interest rates, geopolitical tensions, and the mounting threat of a global trade war continued to provide periodic headwinds for investors.
Despite the return of volatility, U.S. stocks (S&P 500 Index) gained14.37% for the 12-month period. Meanwhile, rising U.S. Treasury yields, particularly in the second half of the period, took a toll on bonds and other interest-rate-sensitive investments, including gold, utilities stocks, and real estate investment trusts (REITs). Investment-grade bonds (Bloomberg Barclays U.S. Aggregate Bond Index) returned -0.40% for the 12 months.
With volatility resurfacing, inflationary pressures building, Treasury yields rising, and the implications of U.S. tariff and trade policy still unfolding, investors likely will face new opportunities and challenges in the months ahead. We believe this scenario warrants a disciplined, diversified, and risk-aware approach, using professionally managed portfolios in pursuit of investment goals. We appreciate your continued trust and confidence in us.
Sincerely,
Jonathan Thomas
President and Chief Executive Officer
American Century Investments
|
| | | | | |
| Total Returns as of June 30, 2018 |
| | Average Annual Returns | |
| | Ticker Symbol | 1 year | 5 years | Since Inception | Inception Date |
| Investor Class | ACDJX | 5.06% | 11.26% | 12.34% | 10/31/11 |
| HFRX Equity Hedge Index | — | 6.28% | 3.04% | 3.35% | — |
| Russell 1000 Growth Index | — | 22.51% | 16.35% | 16.31% | — |
| I Class | ACDKX | 5.22% | 11.48% | 12.55% | 10/31/11 |
| A Class | ACDQX | | | | 10/31/11 |
| No sales charge | | 4.77% | 10.98% | 12.05% | |
| With sales charge | | -1.26% | 9.67% | 11.06% | |
| C Class | ACDHX | 3.97% | 10.15% | 11.22% | 10/31/11 |
| R Class | ACDWX | 4.54% | 10.70% | 11.78% | 10/31/11 |
Sales charges include initial sales charges and contingent deferred sales charges (CDSCs), as applicable. A Class shares have a 5.75% maximum initial sales charge and may be subject to a maximum CDSC of 1.00%. C Class shares redeemed within 12 months of purchase are subject to a maximum CDSC of 1.00%. The SEC requires that mutual funds provide performance information net of maximum sales charges in all cases where charges could be applied.
Data presented reflect past performance. Past performance is no guarantee of future results. Current performance may be higher or lower than the performance shown. Total returns for periods less than one year are not annualized. Investment return and principal value will fluctuate, and redemption value may be more or less than original cost. Data assumes reinvestment of dividends and capital gains, and none of the charts reflect the deduction of taxes that a shareholder would pay on fund distributions or the redemption of fund shares. To obtain performance data current to the most recent month end, please call 1-800-345-2021 or visit americancentury.com. For additional information about the fund, please consult the prospectus.
|
|
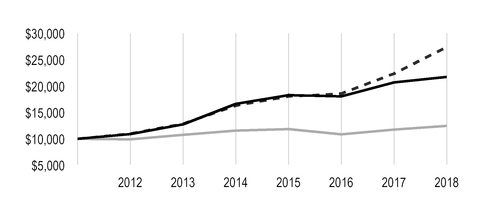
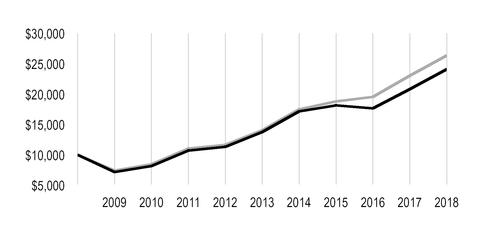
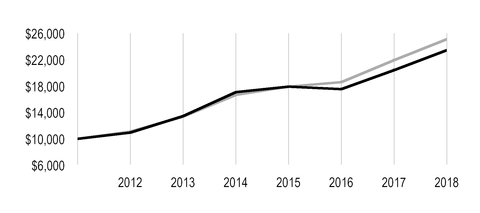
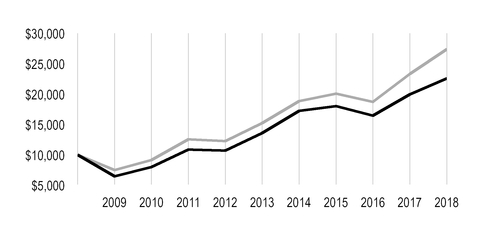
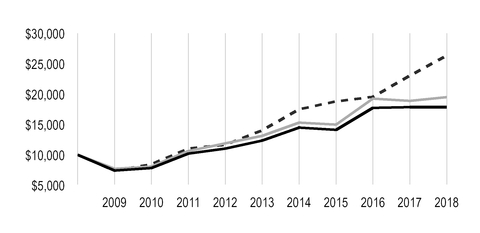
| Growth of $10,000 Over Life of Class |
| $10,000 investment made October 31, 2011 |
| Performance for other share classes will vary due to differences in fee structure. |
|
| |
| Value on June 30, 2018 |
| | Investor Class — $21,725 |
| |
| | HFRX Equity Hedge Index — $12,455 |
| |
| | Russell 1000 Growth Index — $27,392 |
| |
|
| | | | |
| Total Annual Fund Operating Expenses |
| Investor Class | I Class | A Class | C Class | R Class |
| 2.05% | 1.85% | 2.30% | 3.05% | 2.55% |
The total annual fund operating expenses shown is as stated in the fund’s prospectus current as of the date of this report. The prospectus may vary from the expense ratio shown elsewhere in this report because it is based on a different time period, includes acquired fund fees and expenses, and, if applicable, does not include fee waivers or expense reimbursements.
Data presented reflect past performance. Past performance is no guarantee of future results. Current performance may be higher or lower than the performance shown. Total returns for periods less than one year are not annualized. Investment return and principal value will fluctuate, and redemption value may be more or less than original cost. Data assumes reinvestment of dividends and capital gains, and none of the charts reflect the deduction of taxes that a shareholder would pay on fund distributions or the redemption of fund shares. To obtain performance data current to the most recent month end, please call 1-800-345-2021 or visit americancentury.com. For additional information about the fund, please consult the prospectus.
Portfolio Managers: Yulin Long and Tsuyoshi Ozaki
During the period, Tsuyoshi Ozaki joined the fund's management team.
Performance Summary
The AC Alternatives Disciplined Long Short Fund returned 5.06%* for the fiscal year ended June 30, 2018, while the HFRX Equity Hedge Index, the fund's benchmark, returned 6.28%. By comparison, the Russell 1000 Growth Index, a measure of U.S. large-cap growth equity market performance, returned 22.51%.
The portfolio’s stock selection process incorporates factors of valuation, quality, growth, and sentiment. Within the fund, growth, sentiment, and quality insights were supportive, while valuation signals detracted from results.
The fund seeks to participate in strong markets, with the expectation that it will deliver somewhat lower-than-market returns during a sustained rally. It also seeks to protect in down markets, with the goal of outperforming during market declines. During the reporting period, stocks rose sharply, and the fund participated in the rally, but trailed large-cap growth stocks, which made up the best-performing segment of the market. The fund’s performance reflects gains by long positions, while short positions underperformed in a strong, rising market.
The fund’s largest exposure was to the information technology sector, which was the leading contributor by far to absolute performance. Notable contributions to performance also came from positions in the industrials and financials sectors, among others. Positions in the health care sector were the largest detractors from absolute return.
Information Technology Contributed the Most
Reflecting the enduring strength of large-cap technology stocks in recent years, once again during the period the information technology sector made the leading contribution to performance. Four of the five largest individual contributing long positions on average during the period were technology stocks—Alphabet (the parent of Google), Microsoft, Apple, and Facebook. Adobe Systems, Texas Instruments, Intel, and VMware were other sources of strength. As a group, these stocks scored highly on multiple metrics and were among the largest individual contributors to performance during the period.
Other Key Contributors
Stock selection within the industrials sector also contributed meaningfully to results. Aerospace and defense giant Boeing’s stock rose on the back of strong new orders, which drove earnings and cash flow growth. The stock was attractive along every dimension we track. Holdings within the professional services industry were another source of strength, as human resource management companies Robert Half International and Insperity benefited from a tight job market.
* All fund returns referenced in this commentary are for Investor Class shares. Performance for other share classes will vary due to differences in fee structure; when Investor Class performance exceeds that of the fund's benchmark, other share classes may not. See page 3 for returns for all share classes.
Financial stocks also made significant contributions to total return, led by savings and loan Charter Financial and insurer Infinity Property & Casualty. Both benefited from solid economic growth and rising rates. Stronger economic activity translates into greater lending and underwriting volumes, while higher interest rates benefit banks’ spread lending business and insurers invest capital at new, higher rates. Charter Financial was eliminated during the period after sizable gains.
Online retail giant Amazon.com was another leading contributor to performance, benefiting from rapid growth in its public cloud business and increasing volume of transactions across its retail platform. Other notable contributors were managed health care company UnitedHealth Group and medical device maker Globus Medical, which both posted significant gains during the period.
Notable Detractors
On a sector basis, health care stocks detracted the most, led by a short position in biotechnology company AveXis. The gene therapy company was acquired by Novartis during the period at a premium, which meant our short position detracted. A short position in medical instrument and device company ICU Medical was another source of weakness. Other short positions in the sector that detracted from performance included medical device company Insulet and biotechnology firms AxoGen and Neurocrine Biosciences, among others. We closed out our short positions in ICU Medical and Neurocrine Biosciences. Elsewhere in the sector, biotechnology company Celgene was a long position, which underperformed as investors worried about generic competition for some of the firm’s leading drugs.
Information technology services firm WEX was a key detractor from performance. The stock scored particularly poorly for quality and sentiment, but our short position in this corporate payment processor and service provider hurt as the company reported strong revenue growth. Internet retailer Overstock.com was another source of weakness, as our short position detracted. We closed out the position.
Portfolio Positioning
Our disciplined, objective, and systematic investment strategy is designed to take advantage of opportunities at the individual company level in both the long and short portions of the portfolio. We believe this approach is the most powerful way to capitalize on market inefficiencies that lead to the mispricing of individual stocks. Our broad sector exposures reflect the net effect of the underlying individual long and short positions.
At period-end, we held significant exposure to information technology, health care, consumer discretionary, and industrials. In information technology, stocks in the software and services and semiconductors and semiconductor equipment industry groups are attractive along multiple dimensions of our stock selection process. Our health care long positions are led by holdings in the pharmaceuticals and biotechnology and health care equipment and services industry groups. The consumer discretionary and industrials sectors long positions reflect allocations to the capital goods and retailing industry groups, respectively. Conversely, we found materials and real estate among less attractive sectors, with sizable net short positions. These stocks generally scored poorly on our measures of growth and quality.
|
| |
| JUNE 30, 2018 |
| Top Ten Long Holdings | % of net assets |
| Alphabet, Inc.* | 3.58% |
| Microsoft Corp. | 1.95% |
| Amazon.com, Inc. | 1.90% |
| Apple, Inc. | 1.89% |
| Facebook, Inc., Class A | 1.85% |
| Ingersoll-Rand plc | 1.79% |
| UnitedHealth Group, Inc. | 1.74% |
| PS Business Parks, Inc. | 1.61% |
| Adobe Systems, Inc. | 1.46% |
| Las Vegas Sands Corp. | 1.39% |
*Includes all classes of the issuer held by the fund.
| |
| | |
| Top Five Short Holdings | % of net assets |
| Gartner, Inc. | (1.51)% |
| Pinnacle Financial Partners, Inc. | (1.39)% |
| Crown Castle International Corp. | (1.26)% |
| John Bean Technologies Corp. | (1.06)% |
| Healthcare Services Group, Inc. | (1.06)% |
| | |
| Types of Investments in Portfolio | % of net assets |
| Common Stocks | 103.6% |
| Common Stocks Sold Short | (54.6)% |
| Temporary Cash Investments | 49.8% |
| Other Assets and Liabilities | 1.2% |
Fund shareholders may incur two types of costs: (1) transaction costs, including sales charges (loads) on purchase payments and redemption/exchange fees; and (2) ongoing costs, including management fees; distribution and service (12b-1) fees; and other fund expenses. This example is intended to help you understand your ongoing costs (in dollars) of investing in your fund and to compare these costs with the ongoing cost of investing in other mutual funds.
The example is based on an investment of $1,000 made at the beginning of the period and held for the entire period from January 1, 2018 to June 30, 2018.
Actual Expenses
The table provides information about actual account values and actual expenses for each class. You may use the information, together with the amount you invested, to estimate the expenses that you paid over the period. First, identify the share class you own. Then simply divide your account value by $1,000 (for example, an $8,600 account value divided by $1,000 = 8.6), then multiply the result by the number under the heading “Expenses Paid During Period” to estimate the expenses you paid on your account during this period.
If you hold Investor Class shares of any American Century Investments fund, or I Class shares of the American Century Diversified Bond Fund, in an American Century Investments account (i.e., not a financial intermediary or retirement plan account), American Century Investments may charge you a $12.50 semiannual account maintenance fee if the value of those shares is less than $10,000. We will redeem shares automatically in one of your accounts to pay the $12.50 fee. In determining your total eligible investment amount, we will include your investments in all personal accounts (including American Century Investments Brokerage accounts) registered under your Social Security number. Personal accounts include individual accounts, joint accounts, UGMA/UTMA accounts, personal trusts, Coverdell Education Savings Accounts and IRAs (including traditional, Roth, Rollover, SEP-, SARSEP- and SIMPLE-IRAs), and certain other retirement accounts. If you have only business, business retirement, employer-sponsored or American Century Investments Brokerage accounts, you are currently not subject to this fee. If you are subject to the Account Maintenance Fee, your account value could be reduced by the fee amount.
Hypothetical Example for Comparison Purposes
The table also provides information about hypothetical account values and hypothetical expenses based on the actual expense ratio of each class of your fund and an assumed rate of return of 5% per year before expenses, which is not the actual return of a fund’s share class. The hypothetical account values and expenses may not be used to estimate the actual ending account balance or expenses you paid for the period. You may use this information to compare the ongoing costs of investing in your fund and other funds. To do so, compare this 5% hypothetical example with the 5% hypothetical examples that appear in the shareholder reports of the other funds.
Please note that the expenses shown in the table are meant to highlight your ongoing costs only and do not reflect any transactional costs, such as sales charges (loads) or redemption/exchange fees. Therefore, the table is useful in comparing ongoing costs only, and will not help you determine the relative total costs of owning different funds. In addition, if these transactional costs were included, your costs would have been higher.
|
| | | | |
| | Beginning
Account Value
1/1/18 | Ending
Account Value
6/30/18 | Expenses Paid
During Period(1)
1/1/18 - 6/30/18 | Annualized
Expense Ratio(1) |
| Actual |
| Investor Class | $1,000 | $1,016.80 | $11.95 | 2.39% |
| I Class | $1,000 | $1,017.30 | $10.95 | 2.19% |
| A Class | $1,000 | $1,014.70 | $13.19 | 2.64% |
| C Class | $1,000 | $1,011.30 | $16.91 | 3.39% |
| R Class | $1,000 | $1,014.40 | $14.43 | 2.89% |
| Hypothetical |
| Investor Class | $1,000 | $1,012.94 | $11.93 | 2.39% |
| I Class | $1,000 | $1,013.94 | $10.94 | 2.19% |
| A Class | $1,000 | $1,011.70 | $13.17 | 2.64% |
| C Class | $1,000 | $1,007.98 | $16.88 | 3.39% |
| R Class | $1,000 | $1,010.46 | $14.41 | 2.89% |
| |
| (1) | Expenses are equal to the class's annualized expense ratio listed in the table above, multiplied by the average account value over the period, multiplied by 181, the number of days in the most recent fiscal half-year, divided by 365, to reflect the one-half year period. Annualized expense ratio reflects actual expenses, including any applicable fee waivers or expense reimbursements and excluding any acquired fund fees and expenses. |
JUNE 30, 2018
|
| | | | | |
| | Shares | Value |
| COMMON STOCKS — 103.6% | | |
| Aerospace and Defense — 4.3% | | |
Boeing Co. (The)(1) | 614 |
| $ | 206,003 |
|
Curtiss-Wright Corp.(1) | 2,604 |
| 309,928 |
|
General Dynamics Corp.(1) | 2,286 |
| 426,133 |
|
| Hexcel Corp. | 1,215 |
| 80,652 |
|
Lockheed Martin Corp.(1) | 1,483 |
| 438,123 |
|
Raytheon Co.(1) | 2,198 |
| 424,610 |
|
| Textron, Inc. | 3,696 |
| 243,603 |
|
| | | 2,129,052 |
|
| Auto Components — 0.9% | | |
| Tenneco, Inc. | 744 |
| 32,706 |
|
Visteon Corp.(2) | 3,214 |
| 415,378 |
|
| | | 448,084 |
|
| Banks — 4.9% | | |
| Cambridge Bancorp | 1,403 |
| 121,416 |
|
Central Pacific Financial Corp.(1) | 20,546 |
| 588,643 |
|
First Financial Northwest, Inc.(1) | 20,640 |
| 402,893 |
|
Franklin Financial Network, Inc.(1)(2) | 11,369 |
| 427,474 |
|
| Hanmi Financial Corp. | 7,745 |
| 219,571 |
|
| Independent Bank Corp. | 3,370 |
| 85,935 |
|
RBB Bancorp(1) | 4,645 |
| 149,197 |
|
West Bancorporation, Inc.(1) | 15,247 |
| 383,462 |
|
| | | 2,378,591 |
|
| Beverages — 0.4% | | |
| Constellation Brands, Inc., Class A | 855 |
| 187,134 |
|
| Biotechnology — 4.5% | | |
AbbVie, Inc.(1) | 3,113 |
| 288,419 |
|
Acorda Therapeutics, Inc.(2) | 1,531 |
| 43,940 |
|
Akebia Therapeutics, Inc.(2) | 3,216 |
| 32,096 |
|
Alexion Pharmaceuticals, Inc.(2) | 2,059 |
| 255,625 |
|
Amgen, Inc.(1) | 2,193 |
| 404,806 |
|
Arbutus Biopharma Corp.(2) | 11,121 |
| 81,183 |
|
Biogen, Inc.(2) | 1,157 |
| 335,808 |
|
Celgene Corp.(1)(2) | 2,816 |
| 223,647 |
|
CytomX Therapeutics, Inc.(2) | 1,954 |
| 44,668 |
|
Emergent BioSolutions, Inc.(2) | 1,368 |
| 69,070 |
|
Genomic Health, Inc.(2) | 1,984 |
| 99,994 |
|
Ionis Pharmaceuticals, Inc.(2) | 1,366 |
| 56,921 |
|
Pieris Pharmaceuticals, Inc.(2) | 4,727 |
| 23,966 |
|
Protagonist Therapeutics, Inc.(2) | 6,405 |
| 43,042 |
|
Regeneron Pharmaceuticals, Inc.(2) | 311 |
| 107,292 |
|
Surface Oncology, Inc.(2) | 2,865 |
| 46,728 |
|
|
| | | | | |
| | Shares | Value |
Vertex Pharmaceuticals, Inc.(2) | 161 |
| $ | 27,363 |
|
| | | 2,184,568 |
|
| Building Products — 0.1% | | |
Trex Co., Inc.(2) | 614 |
| 38,430 |
|
| Capital Markets — 1.4% | | |
| Cboe Global Markets, Inc. | 1,136 |
| 118,224 |
|
| Evercore, Inc., Class A | 528 |
| 55,678 |
|
| Federated Investors, Inc., Class B | 1,420 |
| 33,114 |
|
| Piper Jaffray Cos. | 511 |
| 39,270 |
|
SEI Investments Co.(1) | 4,996 |
| 312,350 |
|
| Silvercrest Asset Management Group, Inc., Class A | 7,043 |
| 114,801 |
|
| | | 673,437 |
|
| Chemicals — 1.6% | | |
| Huntsman Corp. | 4,889 |
| 142,759 |
|
Kraton Corp.(2) | 1,138 |
| 52,507 |
|
LyondellBasell Industries NV, Class A(1) | 2,252 |
| 247,382 |
|
| Praxair, Inc. | 646 |
| 102,165 |
|
WR Grace & Co.(1) | 3,066 |
| 224,769 |
|
| | | 769,582 |
|
| Commercial Services and Supplies — 1.4% | | |
| Brady Corp., Class A | 2,321 |
| 89,474 |
|
| Herman Miller, Inc. | 2,423 |
| 82,140 |
|
McGrath RentCorp(1) | 2,582 |
| 163,363 |
|
MSA Safety, Inc.(1) | 2,879 |
| 277,363 |
|
| Quad/Graphics, Inc. | 4,288 |
| 89,319 |
|
| | | 701,659 |
|
| Communications Equipment — 1.2% | | |
Arista Networks, Inc.(2) | 146 |
| 37,594 |
|
ARRIS International plc(2) | 7,640 |
| 186,760 |
|
F5 Networks, Inc.(1)(2) | 1,563 |
| 269,539 |
|
Palo Alto Networks, Inc.(2) | 236 |
| 48,491 |
|
| Plantronics, Inc. | 317 |
| 24,171 |
|
| | | 566,555 |
|
| Construction and Engineering — 1.1% | | |
EMCOR Group, Inc.(1) | 7,247 |
| 552,076 |
|
| Consumer Finance — 1.3% | | |
American Express Co.(1) | 2,483 |
| 243,334 |
|
Elevate Credit, Inc.(2) | 10,110 |
| 85,530 |
|
Enova International, Inc.(2) | 3,267 |
| 119,409 |
|
| Synchrony Financial | 5,121 |
| 170,939 |
|
| | | 619,212 |
|
| Diversified Consumer Services — 1.2% | | |
Cambium Learning Group, Inc.(2) | 8,207 |
| 91,508 |
|
Grand Canyon Education, Inc.(1)(2) | 2,295 |
| 256,145 |
|
| H&R Block, Inc. | 8,264 |
| 188,254 |
|
| Liberty Tax, Inc. | 3,707 |
| 29,934 |
|
| | | 565,841 |
|
|
| | | | | |
| | Shares | Value |
| Diversified Financial Services — 0.1% | | |
| Marlin Business Services Corp. | 1,756 |
| $ | 52,417 |
|
| Diversified Telecommunication Services — 0.4% | | |
Ooma, Inc.(2) | 7,535 |
| 106,620 |
|
Vonage Holdings Corp.(2) | 8,954 |
| 115,417 |
|
| | | 222,037 |
|
| Electrical Equipment — 1.0% | | |
AMETEK, Inc.(1) | 3,430 |
| 247,509 |
|
Generac Holdings, Inc.(1)(2) | 4,454 |
| 230,405 |
|
| | | 477,914 |
|
| Electronic Equipment, Instruments and Components — 1.1% | | |
Coherent, Inc.(2) | 645 |
| 100,891 |
|
| National Instruments Corp. | 694 |
| 29,134 |
|
Trimble, Inc.(2) | 2,013 |
| 66,107 |
|
Zebra Technologies Corp., Class A(1)(2) | 2,376 |
| 340,362 |
|
| | | 536,494 |
|
| Energy Equipment and Services — 1.3% | | |
Halliburton Co.(1) | 14,396 |
| 648,684 |
|
| Equity Real Estate Investment Trusts (REITs) — 5.2% | | |
Gaming and Leisure Properties, Inc.(1) | 13,299 |
| 476,104 |
|
| GEO Group, Inc. (The) | 3,533 |
| 97,299 |
|
MedEquities Realty Trust, Inc.(1) | 27,754 |
| 305,849 |
|
PotlatchDeltic Corp.(1) | 12,159 |
| 618,285 |
|
PS Business Parks, Inc.(1) | 6,125 |
| 787,063 |
|
Tanger Factory Outlet Centers, Inc.(1) | 11,540 |
| 271,075 |
|
| | | 2,555,675 |
|
| Food Products — 0.1% | | |
Hostess Brands, Inc.(2) | 2,415 |
| 32,844 |
|
| Health Care Equipment and Supplies — 4.1% | | |
| Atrion Corp. | 107 |
| 64,136 |
|
Boston Scientific Corp.(2) | 2,581 |
| 84,399 |
|
| CONMED Corp. | 2,291 |
| 167,701 |
|
Edwards Lifesciences Corp.(2) | 1,043 |
| 151,829 |
|
Globus Medical, Inc., Class A(1)(2) | 6,863 |
| 346,307 |
|
Haemonetics Corp.(2) | 2,095 |
| 187,880 |
|
Hill-Rom Holdings, Inc.(1) | 2,381 |
| 207,956 |
|
IDEXX Laboratories, Inc.(2) | 627 |
| 136,648 |
|
Integer Holdings Corp.(2) | 2,158 |
| 139,515 |
|
Intuitive Surgical, Inc.(1)(2) | 477 |
| 228,235 |
|
NuVasive, Inc.(2) | 1,821 |
| 94,910 |
|
Orthofix International NV(2) | 1,891 |
| 107,447 |
|
STAAR Surgical Co.(2) | 2,793 |
| 86,583 |
|
| | | 2,003,546 |
|
| Health Care Providers and Services — 4.2% | | |
Cigna Corp.(1) | 2,709 |
| 460,394 |
|
Express Scripts Holding Co.(2) | 395 |
| 30,498 |
|
| Humana, Inc. | 447 |
| 133,041 |
|
|
| | | | | |
| | Shares | Value |
Tivity Health, Inc.(2) | 2,774 |
| $ | 97,645 |
|
UnitedHealth Group, Inc.(1) | 3,476 |
| 852,802 |
|
WellCare Health Plans, Inc.(1)(2) | 1,885 |
| 464,162 |
|
| | | 2,038,542 |
|
| Health Care Technology — 0.6% | | |
athenahealth, Inc.(2) | 205 |
| 32,624 |
|
Cerner Corp.(2) | 2,440 |
| 145,887 |
|
| HealthStream, Inc. | 4,175 |
| 114,019 |
|
| | | 292,530 |
|
| Hotels, Restaurants and Leisure — 2.7% | | |
| Choice Hotels International, Inc. | 361 |
| 27,292 |
|
| Extended Stay America, Inc. | 9,114 |
| 196,953 |
|
Las Vegas Sands Corp.(1) | 8,908 |
| 680,215 |
|
Marriott International, Inc., Class A(1) | 1,930 |
| 244,338 |
|
| Wynn Resorts Ltd. | 1,081 |
| 180,895 |
|
| | | 1,329,693 |
|
| Household Durables — 1.6% | | |
KB Home(1) | 9,479 |
| 258,208 |
|
NVR, Inc.(2) | 9 |
| 26,733 |
|
PulteGroup, Inc.(1) | 11,196 |
| 321,885 |
|
Toll Brothers, Inc.(1) | 4,674 |
| 172,891 |
|
| | | 779,717 |
|
| Household Products — 1.2% | | |
Kimberly-Clark Corp.(1) | 5,522 |
| 581,687 |
|
| Independent Power and Renewable Electricity Producers — 0.8% | |
NRG Energy, Inc.(1) | 12,365 |
| 379,605 |
|
| Insurance — 1.8% | | |
Infinity Property & Casualty Corp.(1) | 4,718 |
| 671,607 |
|
| Progressive Corp. (The) | 3,304 |
| 195,432 |
|
| | | 867,039 |
|
| Internet and Direct Marketing Retail — 2.3% | | |
Amazon.com, Inc.(1)(2) | 548 |
| 931,490 |
|
| Nutrisystem, Inc. | 2,662 |
| 102,487 |
|
Shutterfly, Inc.(2) | 850 |
| 76,526 |
|
| | | 1,110,503 |
|
| Internet Software and Services — 6.3% | | |
Alphabet, Inc., Class A(1)(2) | 803 |
| 906,740 |
|
Alphabet, Inc., Class C(1)(2) | 757 |
| 844,547 |
|
Care.com, Inc.(2) | 6,975 |
| 145,638 |
|
Endurance International Group Holdings, Inc.(2) | 5,925 |
| 58,954 |
|
Facebook, Inc., Class A(1)(2) | 4,657 |
| 904,948 |
|
| LogMeIn, Inc. | 857 |
| 88,485 |
|
SPS Commerce, Inc.(2) | 495 |
| 36,373 |
|
Stamps.com, Inc.(2) | 205 |
| 51,875 |
|
TrueCar, Inc.(2) | 3,139 |
| 31,672 |
|
| | | 3,069,232 |
|
| | | |
|
| | | | | |
| | Shares | Value |
| IT Services — 2.8% | | |
Acxiom Corp.(2) | 5,564 |
| $ | 166,642 |
|
CSG Systems International, Inc.(1) | 945 |
| 38,622 |
|
International Business Machines Corp.(1) | 2,175 |
| 303,848 |
|
MasterCard, Inc., Class A(1) | 1,597 |
| 313,842 |
|
| Paychex, Inc. | 1,423 |
| 97,262 |
|
Syntel, Inc.(2) | 3,079 |
| 98,805 |
|
| Total System Services, Inc. | 2,072 |
| 175,125 |
|
Unisys Corp.(2) | 3,960 |
| 51,084 |
|
| Visa, Inc., Class A | 1,081 |
| 143,179 |
|
| | | 1,388,409 |
|
| Leisure Products — 0.3% | | |
MCBC Holdings, Inc.(2) | 1,753 |
| 50,749 |
|
Nautilus, Inc.(2) | 3,474 |
| 54,542 |
|
| Polaris Industries, Inc. | 400 |
| 48,872 |
|
| | | 154,163 |
|
| Machinery — 3.5% | | |
Caterpillar, Inc.(1) | 2,139 |
| 290,198 |
|
Columbus McKinnon Corp.(1) | 5,479 |
| 237,570 |
|
Harsco Corp.(2) | 8,332 |
| 184,137 |
|
Ingersoll-Rand plc(1) | 9,782 |
| 877,739 |
|
Toro Co. (The)(1) | 2,489 |
| 149,962 |
|
| | | 1,739,606 |
|
| Media — 1.0% | | |
DISH Network Corp., Class A(2) | 5,928 |
| 199,240 |
|
| Emerald Expositions Events, Inc. | 4,304 |
| 88,663 |
|
| Entravision Communications Corp., Class A | 26,776 |
| 133,880 |
|
tronc, Inc.(2) | 3,140 |
| 54,259 |
|
| | | 476,042 |
|
| Multiline Retail — 0.5% | | |
Dollar Tree, Inc.(1)(2) | 2,783 |
| 236,555 |
|
| Oil, Gas and Consumable Fuels — 1.7% | | |
Continental Resources, Inc.(1)(2) | 3,914 |
| 253,471 |
|
Evolution Petroleum Corp.(1) | 42,175 |
| 415,424 |
|
Isramco, Inc.(2) | 249 |
| 30,602 |
|
Newfield Exploration Co.(2) | 4,046 |
| 122,391 |
|
Westmoreland Coal Co.(2) | 201,127 |
| 28,158 |
|
| | | 850,046 |
|
| Paper and Forest Products — 0.6% | | |
Louisiana-Pacific Corp.(1) | 10,758 |
| 292,833 |
|
| Personal Products — 0.1% | | |
| Nu Skin Enterprises, Inc., Class A | 551 |
| 43,083 |
|
| Pharmaceuticals — 4.5% | | |
Allergan plc(1) | 1,927 |
| 321,269 |
|
| Bristol-Myers Squibb Co. | 6,241 |
| 345,377 |
|
Eli Lilly & Co.(1) | 5,443 |
| 464,451 |
|
Endo International plc(2) | 4,215 |
| 39,748 |
|
|
| | | | | |
| | Shares | Value |
Horizon Pharma plc(2) | 4,743 |
| $ | 78,544 |
|
Innoviva, Inc.(2) | 2,422 |
| 33,424 |
|
Johnson & Johnson(1) | 5,554 |
| 673,922 |
|
Zoetis, Inc.(1) | 2,928 |
| 249,436 |
|
| | | 2,206,171 |
|
| Professional Services — 3.3% | | |
ASGN, Inc.(1)(2) | 3,291 |
| 257,323 |
|
Dun & Bradstreet Corp. (The)(1) | 2,784 |
| 341,458 |
|
Insperity, Inc.(1) | 2,969 |
| 282,797 |
|
| Kforce, Inc. | 1,952 |
| 66,954 |
|
Robert Half International, Inc.(1) | 8,397 |
| 546,645 |
|
TrueBlue, Inc.(2) | 2,833 |
| 76,349 |
|
WageWorks, Inc.(2) | 732 |
| 36,600 |
|
| | | 1,608,126 |
|
| Real Estate Management and Development — 0.5% | | |
Newmark Group, Inc., Class A(1) | 18,271 |
| 259,996 |
|
| Road and Rail — 0.3% | | |
| ArcBest Corp. | 1,755 |
| 80,204 |
|
Avis Budget Group, Inc.(2) | 2,675 |
| 86,937 |
|
| | | 167,141 |
|
| Semiconductors and Semiconductor Equipment — 4.3% | | |
Advanced Energy Industries, Inc.(2) | 925 |
| 53,733 |
|
Amkor Technology, Inc.(2) | 3,827 |
| 32,874 |
|
Applied Materials, Inc.(1) | 7,704 |
| 355,848 |
|
| Broadcom, Inc. | 382 |
| 92,688 |
|
| Cabot Microelectronics Corp. | 988 |
| 106,269 |
|
| Cypress Semiconductor Corp. | 4,558 |
| 71,014 |
|
| Intel Corp. | 627 |
| 31,168 |
|
| KLA-Tencor Corp. | 791 |
| 81,101 |
|
| Lam Research Corp. | 925 |
| 159,886 |
|
Lattice Semiconductor Corp.(2) | 9,585 |
| 62,878 |
|
Micron Technology, Inc.(2) | 624 |
| 32,723 |
|
| MKS Instruments, Inc. | 1,805 |
| 172,738 |
|
Nanometrics, Inc.(2) | 1,160 |
| 41,076 |
|
| NVIDIA Corp. | 1,341 |
| 317,683 |
|
ON Semiconductor Corp.(1)(2) | 11,591 |
| 257,726 |
|
Qorvo, Inc.(2) | 1,102 |
| 88,347 |
|
Rudolph Technologies, Inc.(2) | 1,465 |
| 43,364 |
|
| Texas Instruments, Inc. | 988 |
| 108,927 |
|
| | | 2,110,043 |
|
| Software — 10.5% | | |
A10 Networks, Inc.(2) | 3,848 |
| 23,973 |
|
Activision Blizzard, Inc.(1) | 6,126 |
| 467,536 |
|
Adobe Systems, Inc.(1)(2) | 2,923 |
| 712,657 |
|
Aspen Technology, Inc.(1)(2) | 2,947 |
| 273,305 |
|
Cadence Design Systems, Inc.(1)(2) | 6,118 |
| 264,971 |
|
| CDK Global, Inc. | 1,708 |
| 111,105 |
|
|
| | | | | |
| | Shares | Value |
Citrix Systems, Inc.(2) | 558 |
| $ | 58,501 |
|
Electronic Arts, Inc.(1)(2) | 1,986 |
| 280,066 |
|
Fair Isaac Corp.(1)(2) | 1,097 |
| 212,072 |
|
| Intuit, Inc. | 523 |
| 106,851 |
|
Microsoft Corp.(1) | 9,673 |
| 953,854 |
|
Oracle Corp.(New York)(1) | 5,436 |
| 239,510 |
|
Paylocity Holding Corp.(2) | 419 |
| 24,662 |
|
| Pegasystems, Inc. | 1,321 |
| 72,391 |
|
Progress Software Corp.(1) | 4,920 |
| 190,994 |
|
Rosetta Stone, Inc.(2) | 1,970 |
| 31,579 |
|
salesforce.com, Inc.(1)(2) | 2,613 |
| 356,413 |
|
| Symantec Corp. | 2,441 |
| 50,407 |
|
Synopsys, Inc.(1)(2) | 4,931 |
| 421,946 |
|
Ultimate Software Group, Inc. (The)(2) | 174 |
| 44,772 |
|
Verint Systems, Inc.(2) | 1,794 |
| 79,564 |
|
VMware, Inc., Class A(2) | 343 |
| 50,411 |
|
Zendesk, Inc.(2) | 1,192 |
| 64,952 |
|
Zix Corp.(2) | 7,216 |
| 38,894 |
|
| | | 5,131,386 |
|
| Specialty Retail — 1.9% | | |
Asbury Automotive Group, Inc.(2) | 1,308 |
| 89,664 |
|
AutoZone, Inc.(1)(2) | 391 |
| 262,334 |
|
Burlington Stores, Inc.(2) | 278 |
| 41,847 |
|
Conn's, Inc.(2) | 797 |
| 26,301 |
|
Five Below, Inc.(2) | 448 |
| 43,774 |
|
J. Jill, Inc.(2) | 2,888 |
| 26,974 |
|
Ross Stores, Inc.(1) | 3,615 |
| 306,371 |
|
| Tailored Brands, Inc. | 5,106 |
| 130,305 |
|
| | | 927,570 |
|
| Technology Hardware, Storage and Peripherals — 2.5% | | |
Apple, Inc.(1) | 5,006 |
| 926,661 |
|
| NetApp, Inc. | 1,773 |
| 139,234 |
|
| Western Digital Corp. | 2,196 |
| 169,992 |
|
| | | 1,235,887 |
|
| Textiles, Apparel and Luxury Goods — 2.3% | | |
| Columbia Sportswear Co. | 1,641 |
| 150,102 |
|
Deckers Outdoor Corp.(1)(2) | 4,488 |
| 506,650 |
|
Michael Kors Holdings Ltd.(2) | 3,739 |
| 249,018 |
|
| Oxford Industries, Inc. | 1,231 |
| 102,148 |
|
| Tapestry, Inc. | 2,666 |
| 124,529 |
|
| | | 1,132,447 |
|
| Thrifts and Mortgage Finance — 1.9% | | |
Essent Group Ltd.(2) | 1,228 |
| 43,987 |
|
FS Bancorp, Inc.(1) | 3,312 |
| 209,484 |
|
Luther Burbank Corp.(1) | 17,607 |
| 202,568 |
|
| Merchants Bancorp | 4,171 |
| 118,999 |
|
|
| | | | | |
| | Shares | Value |
Sterling Bancorp, Inc.(1) | 26,371 |
| $ | 352,317 |
|
| | | 927,355 |
|
| Tobacco — 0.1% | | |
| Turning Point Brands, Inc. | 2,070 |
| 66,033 |
|
| Trading Companies and Distributors — 1.1% | | |
HD Supply Holdings, Inc.(2) | 3,719 |
| 159,508 |
|
| Kaman Corp. | 1,354 |
| 94,360 |
|
| MSC Industrial Direct Co., Inc., Class A | 1,400 |
| 118,790 |
|
| W.W. Grainger, Inc. | 576 |
| 177,639 |
|
| | | 550,297 |
|
| Wireless Telecommunication Services — 0.8% | | |
T-Mobile US, Inc.(1)(2) | 6,421 |
| 383,655 |
|
TOTAL COMMON STOCKS
(Cost $43,450,442) | | 50,679,224 |
|
| TEMPORARY CASH INVESTMENTS — 49.8% | | |
| Repurchase Agreement, BMO Capital Markets Corp., (collateralized by various U.S. Treasury obligations, 1.375% - 3.75%, 2/15/19 - 11/15/47, valued at $13,542,654), in a joint trading account at 1.75%, dated 6/29/18, due 7/2/18 (Delivery value $13,271,194) | | 13,269,259 |
|
| Repurchase Agreement, Fixed Income Clearing Corp., (collateralized by various U.S. Treasury obligations, 2.75%, 2/15/28, valued at $11,281,334), at 0.90%, dated 6/29/18, due 7/2/18 (Delivery value $11,059,829) | | 11,059,000 |
|
| State Street Institutional U.S. Government Money Market Fund, Premier Class | 17,900 |
| 17,900 |
|
TOTAL TEMPORARY CASH INVESTMENTS
(Cost $24,346,159) | | 24,346,159 |
|
TOTAL INVESTMENT SECURITIES BEFORE SECURITIES SOLD SHORT — 153.4%
(Cost $67,796,601) | 75,025,383 |
|
| COMMON STOCKS SOLD SHORT — (54.6)% | | |
| Aerospace and Defense — (1.4)% | | |
| BWX Technologies, Inc. | (7,943 | ) | (495,008 | ) |
| Kratos Defense & Security Solutions, Inc. | (9,901 | ) | (113,961 | ) |
| Mercury Systems, Inc. | (1,488 | ) | (56,633 | ) |
| | | (665,602 | ) |
| Air Freight and Logistics — (0.2)% | | |
| Air Transport Services Group, Inc. | (5,378 | ) | (121,489 | ) |
| Airlines — (0.1)% | | |
| Allegiant Travel Co. | (227 | ) | (31,542 | ) |
| Auto Components — (1.1)% | | |
| Fox Factory Holding Corp. | (1,092 | ) | (50,833 | ) |
| Lear Corp. | (171 | ) | (31,773 | ) |
| Standard Motor Products, Inc. | (9,220 | ) | (445,695 | ) |
| | | (528,301 | ) |
| Banks — (5.6)% | | |
| Allegiance Bancshares, Inc. | (1,153 | ) | (49,983 | ) |
| Blue Hills Bancorp, Inc. | (13,459 | ) | (298,790 | ) |
| Equity Bancshares, Inc., Class A | (4,264 | ) | (176,871 | ) |
| First Foundation, Inc. | (3,180 | ) | (58,957 | ) |
| Green Bancorp, Inc. | (5,099 | ) | (110,138 | ) |
| HarborOne Bancorp, Inc. | (14,623 | ) | (276,960 | ) |
|
| | | | | |
| | Shares | Value |
| Home BancShares, Inc. | (11,893 | ) | $ | (268,306 | ) |
| Howard Bancorp, Inc. | (7,143 | ) | (128,574 | ) |
| LegacyTexas Financial Group, Inc. | (1,906 | ) | (74,372 | ) |
| Pinnacle Financial Partners, Inc. | (11,068 | ) | (679,022 | ) |
| Texas Capital Bancshares, Inc. | (4,126 | ) | (377,529 | ) |
| Triumph Bancorp, Inc. | (5,870 | ) | (239,202 | ) |
| | | (2,738,704 | ) |
| Biotechnology — (3.2)% | | |
| Acceleron Pharma, Inc. | (905 | ) | (43,911 | ) |
| Aimmune Therapeutics, Inc. | (4,030 | ) | (108,367 | ) |
| Alnylam Pharmaceuticals, Inc. | (517 | ) | (50,919 | ) |
| AnaptysBio, Inc. | (715 | ) | (50,794 | ) |
| Audentes Therapeutics, Inc. | (2,724 | ) | (104,084 | ) |
| Biohaven Pharmaceutical Holding Co. Ltd. | (695 | ) | (27,466 | ) |
| Bluebird Bio, Inc. | (151 | ) | (23,699 | ) |
| Blueprint Medicines Corp. | (2,336 | ) | (148,289 | ) |
| Celcuity, Inc. | (4,316 | ) | (107,123 | ) |
| Deciphera Pharmaceuticals, Inc. | (2,109 | ) | (82,989 | ) |
| Fate Therapeutics, Inc. | (3,566 | ) | (40,438 | ) |
| Fennec Pharmaceuticals, Inc. | (2,323 | ) | (24,252 | ) |
| FibroGen, Inc. | (1,037 | ) | (64,916 | ) |
| G1 Therapeutics, Inc. | (1,395 | ) | (60,627 | ) |
| Global Blood Therapeutics, Inc. | (977 | ) | (44,160 | ) |
| Immunomedics, Inc. | (1,768 | ) | (41,849 | ) |
| Insmed, Inc. | (1,806 | ) | (42,712 | ) |
| Iovance Biotherapeutics, Inc. | (4,052 | ) | (51,866 | ) |
| Madrigal Pharmaceuticals, Inc. | (335 | ) | (93,696 | ) |
| Natera, Inc. | (1,221 | ) | (22,979 | ) |
| Sage Therapeutics, Inc. | (877 | ) | (137,277 | ) |
| Sarepta Therapeutics, Inc. | (1,403 | ) | (185,449 | ) |
| | | (1,557,862 | ) |
| Building Products — (1.2)% | | |
| AAON, Inc. | (12,084 | ) | (401,793 | ) |
| Insteel Industries, Inc. | (5,058 | ) | (168,937 | ) |
| | | (570,730 | ) |
| Capital Markets — (1.8)% | | |
| Eaton Vance Corp. | (1,764 | ) | (92,063 | ) |
| Hamilton Lane, Inc., Class A | (5,138 | ) | (246,470 | ) |
| Moelis & Co., Class A | (1,144 | ) | (67,095 | ) |
| T Rowe Price Group, Inc. | (2,068 | ) | (240,074 | ) |
| Virtu Financial, Inc., Class A | (1,920 | ) | (50,976 | ) |
| Virtus Investment Partners, Inc. | (1,406 | ) | (179,898 | ) |
| | | (876,576 | ) |
| Chemicals — (1.8)% | | |
| Albemarle Corp. | (456 | ) | (43,014 | ) |
| Chase Corp. | (1,895 | ) | (222,189 | ) |
| Ecolab, Inc. | (518 | ) | (72,691 | ) |
|
| | | | | |
| | Shares | Value |
| HB Fuller Co. | (6,905 | ) | $ | (370,660 | ) |
| NewMarket Corp. | (227 | ) | (91,822 | ) |
| Quaker Chemical Corp. | (517 | ) | (80,068 | ) |
| | | (880,444 | ) |
| Commercial Services and Supplies — (2.1)% | | |
| Brink's Co. (The) | (4,380 | ) | (349,305 | ) |
| Healthcare Services Group, Inc. | (12,024 | ) | (519,316 | ) |
| Multi-Color Corp. | (2,335 | ) | (150,958 | ) |
| | | (1,019,579 | ) |
| Construction and Engineering — (1.1)% | | |
| MasTec, Inc. | (5,716 | ) | (290,087 | ) |
| MYR Group, Inc. | (7,039 | ) | (249,603 | ) |
| | | (539,690 | ) |
| Construction Materials — (0.7)% | | |
| Vulcan Materials Co. | (2,543 | ) | (328,200 | ) |
| Containers and Packaging — (0.1)% | | |
| Crown Holdings, Inc. | (644 | ) | (28,826 | ) |
| Graphic Packaging Holding Co. | (2,281 | ) | (33,097 | ) |
| | | (61,923 | ) |
| Distributors — (0.2)% | | |
| Core-Mark Holding Co., Inc. | (5,434 | ) | (123,352 | ) |
| Diversified Consumer Services — (0.3)% | | |
| Bright Horizons Family Solutions, Inc. | (1,298 | ) | (133,071 | ) |
| Diversified Telecommunication Services — (0.4)% | | |
| Zayo Group Holdings, Inc. | (5,339 | ) | (194,767 | ) |
| Electrical Equipment — (0.3)% | | |
| AZZ, Inc. | (3,250 | ) | (141,213 | ) |
| Electronic Equipment, Instruments and Components — (2.2)% | | |
| Badger Meter, Inc. | (6,592 | ) | (294,662 | ) |
| FARO Technologies, Inc. | (1,347 | ) | (73,210 | ) |
| II-VI, Inc. | (7,842 | ) | (340,735 | ) |
| Mesa Laboratories, Inc. | (438 | ) | (92,453 | ) |
| Napco Security Technologies, Inc. | (8,289 | ) | (121,434 | ) |
| PAR Technology Corp. | (3,747 | ) | (66,247 | ) |
| Park Electrochemical Corp. | (4,863 | ) | (112,773 | ) |
| | | (1,101,514 | ) |
| Equity Real Estate Investment Trusts (REITs) — (3.0)% | | |
| Crown Castle International Corp. | (5,727 | ) | (617,485 | ) |
| Digital Realty Trust, Inc. | (3,323 | ) | (370,780 | ) |
| Equinix, Inc. | (466 | ) | (200,329 | ) |
| Iron Mountain, Inc. | (7,348 | ) | (257,254 | ) |
| | | (1,445,848 | ) |
| Food and Staples Retailing — (0.2)% | | |
| PriceSmart, Inc. | (1,337 | ) | (120,999 | ) |
| Health Care Equipment and Supplies — (2.4)% | | |
| AxoGen, Inc. | (2,703 | ) | (135,826 | ) |
| CryoLife, Inc. | (9,274 | ) | (258,281 | ) |
|
| | | | | |
| | Shares | Value |
| Insulet Corp. | (3,123 | ) | $ | (267,641 | ) |
| Integra LifeSciences Holdings Corp. | (1,396 | ) | (89,916 | ) |
| iRhythm Technologies, Inc. | (3,932 | ) | (319,003 | ) |
| Tactile Systems Technology, Inc. | (1,665 | ) | (86,580 | ) |
| | | (1,157,247 | ) |
| Health Care Providers and Services — (1.3)% | | |
| Henry Schein, Inc. | (6,367 | ) | (462,499 | ) |
| LHC Group, Inc. | (2,126 | ) | (181,964 | ) |
| | | (644,463 | ) |
| Hotels, Restaurants and Leisure — (2.3)% | | |
| Aramark | (1,054 | ) | (39,103 | ) |
| Belmond Ltd., Class A | (20,216 | ) | (225,408 | ) |
| Caesars Entertainment Corp. | (5,068 | ) | (54,228 | ) |
| Churchill Downs, Inc. | (839 | ) | (248,764 | ) |
| Chuy's Holdings, Inc. | (3,947 | ) | (121,173 | ) |
| Drive Shack, Inc. | (20,499 | ) | (158,252 | ) |
| Golden Entertainment, Inc. | (2,984 | ) | (80,538 | ) |
| Lindblad Expeditions Holdings, Inc. | (5,979 | ) | (79,222 | ) |
| Potbelly Corp. | (7,775 | ) | (100,686 | ) |
| | | (1,107,374 | ) |
| Household Durables — (0.7)% | | |
| Leggett & Platt, Inc. | (1,680 | ) | (74,995 | ) |
| Mohawk Industries, Inc. | (979 | ) | (209,770 | ) |
| Universal Electronics, Inc. | (1,049 | ) | (34,670 | ) |
| | | (319,435 | ) |
| Household Products — (0.5)% | | |
| WD-40 Co. | (1,665 | ) | (243,506 | ) |
| Insurance — (2.1)% | | |
| Arch Capital Group Ltd. | (14,421 | ) | (381,580 | ) |
| Arthur J Gallagher & Co. | (370 | ) | (24,154 | ) |
| Aspen Insurance Holdings Ltd. | (1,423 | ) | (57,916 | ) |
| Marsh & McLennan Cos., Inc. | (1,548 | ) | (126,889 | ) |
| RLI Corp. | (6,785 | ) | (449,099 | ) |
| | | (1,039,638 | ) |
| Internet and Direct Marketing Retail — (0.8)% | | |
| Gaia, Inc. | (9,739 | ) | (197,215 | ) |
| TripAdvisor, Inc. | (779 | ) | (43,398 | ) |
| Wayfair, Inc., Class A | (1,232 | ) | (146,312 | ) |
| | | (386,925 | ) |
| Internet Software and Services — (1.1)% | | |
| 2U, Inc. | (6,112 | ) | (510,719 | ) |
| GTT Communications, Inc. | (1,028 | ) | (46,260 | ) |
| | | (556,979 | ) |
| IT Services — (4.1)% | | |
| Gartner, Inc. | (5,544 | ) | (736,798 | ) |
| Genpact Ltd. | (13,794 | ) | (399,060 | ) |
| Global Payments, Inc. | (2,366 | ) | (263,785 | ) |
|
| | | | | |
| | Shares | Value |
| StarTek, Inc. | (3,803 | ) | $ | (23,921 | ) |
| WEX, Inc. | (752 | ) | (143,241 | ) |
| Worldpay, Inc., Class A | (5,296 | ) | (433,107 | ) |
| | | (1,999,912 | ) |
| Machinery — (2.6)% | | |
| Albany International Corp., Class A | (995 | ) | (59,849 | ) |
| CIRCOR International, Inc. | (4,478 | ) | (165,507 | ) |
| Evoqua Water Technologies Corp. | (5,105 | ) | (104,652 | ) |
| John Bean Technologies Corp. | (5,843 | ) | (519,443 | ) |
| Middleby Corp. (The) | (1,995 | ) | (208,318 | ) |
| NN, Inc. | (3,259 | ) | (61,595 | ) |
| Sun Hydraulics Corp. | (2,594 | ) | (125,005 | ) |
| Welbilt, Inc. | (1,268 | ) | (28,289 | ) |
| | | (1,272,658 | ) |
| Media — (2.4)% | | |
| GCI Liberty, Inc., Class A | (3,093 | ) | (139,433 | ) |
| Hemisphere Media Group, Inc. | (7,918 | ) | (103,726 | ) |
| Live Nation Entertainment, Inc. | (7,079 | ) | (343,827 | ) |
| Loral Space & Communications, Inc. | (3,589 | ) | (134,946 | ) |
| New York Times Co. (The), Class A | (9,010 | ) | (233,359 | ) |
| Reading International, Inc., Class A | (15,334 | ) | (244,577 | ) |
| | | (1,199,868 | ) |
| Oil, Gas and Consumable Fuels — (0.4)% | | |
| Cheniere Energy, Inc. | (859 | ) | (55,998 | ) |
| Diamondback Energy, Inc. | (967 | ) | (127,228 | ) |
| | | (183,226 | ) |
| Personal Products — (0.2)% | | |
| Coty, Inc., Class A | (6,892 | ) | (97,177 | ) |
| Pharmaceuticals — (0.6)% | | |
| Aerie Pharmaceuticals, Inc. | (1,421 | ) | (95,989 | ) |
| Catalent, Inc. | (2,313 | ) | (96,892 | ) |
| MyoKardia, Inc. | (1,339 | ) | (66,481 | ) |
| Zogenix, Inc. | (800 | ) | (35,360 | ) |
| | | (294,722 | ) |
| Professional Services — (1.3)% | | |
| Forrester Research, Inc. | (6,736 | ) | (282,575 | ) |
| Franklin Covey Co. | (4,702 | ) | (115,434 | ) |
| InnerWorkings, Inc. | (6,351 | ) | (55,190 | ) |
| TriNet Group, Inc. | (3,392 | ) | (189,749 | ) |
| | | (642,948 | ) |
| Real Estate Management and Development — (0.2)% | | |
| Consolidated-Tomoka Land Co. | (528 | ) | (32,477 | ) |
| Kennedy-Wilson Holdings, Inc. | (2,282 | ) | (48,265 | ) |
| | | (80,742 | ) |
| Semiconductors and Semiconductor Equipment — (0.8)% | | |
| Alpha & Omega Semiconductor Ltd. | (7,923 | ) | (112,824 | ) |
| Monolithic Power Systems, Inc. | (508 | ) | (67,904 | ) |
|
| | | | | |
| | Shares | Value |
| NVE Corp. | (1,281 | ) | $ | (156,000 | ) |
| PDF Solutions, Inc. | (6,230 | ) | (74,635 | ) |
| | | (411,363 | ) |
| Software — (0.5)% | | |
| 8x8, Inc. | (5,109 | ) | (102,435 | ) |
| Guidewire Software, Inc. | (1,732 | ) | (153,767 | ) |
| | | (256,202 | ) |
| Specialty Retail — (0.2)% | | |
| At Home Group, Inc. | (2,215 | ) | (86,717 | ) |
| National Vision Holdings, Inc. | (795 | ) | (29,073 | ) |
| | | (115,790 | ) |
| Technology Hardware, Storage and Peripherals — (0.9)% | | |
| Cray, Inc. | (3,357 | ) | (82,582 | ) |
| Super Micro Computer, Inc. | (1,352 | ) | (31,975 | ) |
| USA Technologies, Inc. | (24,502 | ) | (343,028 | ) |
| | | (457,585 | ) |
| Textiles, Apparel and Luxury Goods — (0.6)% | | |
| NIKE, Inc., Class B | (3,487 | ) | (277,844 | ) |
| Thrifts and Mortgage Finance — (0.4)% | | |
| Kearny Financial Corp. | (5,672 | ) | (76,288 | ) |
| Western New England Bancorp, Inc. | (9,368 | ) | (103,048 | ) |
| | | (179,336 | ) |
| Trading Companies and Distributors — (1.1)% | | |
| Beacon Roofing Supply, Inc. | (562 | ) | (23,953 | ) |
| SiteOne Landscape Supply, Inc. | (5,391 | ) | (452,682 | ) |
| Veritiv Corp. | (1,447 | ) | (57,663 | ) |
| | | (534,298 | ) |
| Water Utilities — (0.1)% | | |
| California Water Service Group | (1,275 | ) | (49,661 | ) |
TOTAL COMMON STOCKS SOLD SHORT — (54.6)%
(Proceeds $25,119,817) | | (26,690,305 | ) |
| OTHER ASSETS AND LIABILITIES — 1.2% | | 589,715 |
|
| TOTAL NET ASSETS — 100.0% | | $ | 48,924,793 |
|
|
| | |
| NOTES TO SCHEDULE OF INVESTMENTS |
| |
| (1) | Security, or a portion thereof, has been pledged at the custodian bank or with a broker for collateral requirements on securities sold short. At the period end, the aggregate value of securities pledged was $33,296,694. |
See Notes to Financial Statements.
|
|
| Statement of Assets and Liabilities |
|
| | | |
| JUNE 30, 2018 |
| Assets |
| Investment securities, at value (cost of $43,468,342) | $ | 50,697,124 |
|
| Repurchase agreements, at value (cost of $24,328,259) | 24,328,259 |
|
| Total investment securities, at value (cost of $67,796,601) | 75,025,383 |
|
| Receivable for investments sold | 603,543 |
|
| Receivable for capital shares sold | 368,525 |
|
| Dividends and interest receivable | 16,921 |
|
| | 76,014,372 |
|
| | |
| Liabilities | |
| Securities sold short, at value (proceeds of $25,119,817) | 26,690,305 |
|
| Payable for investments purchased | 178,633 |
|
| Payable for capital shares redeemed | 129,943 |
|
| Accrued management fees | 56,882 |
|
| Distribution and service fees payable | 2,196 |
|
| Dividend expense payable on securities sold short | 9,663 |
|
| Fees and charges payable on borrowings for securities sold short | 21,957 |
|
| | 27,089,579 |
|
| | |
| Net Assets | $ | 48,924,793 |
|
| | |
| Net Assets Consist of: | |
| Capital (par value and paid-in surplus) | $ | 42,282,555 |
|
| Accumulated net investment loss | (114,435 | ) |
| Undistributed net realized gain | 1,098,379 |
|
| Net unrealized appreciation | 5,658,294 |
|
| | $ | 48,924,793 |
|
|
| | | | | | |
| | Net Assets | Shares Outstanding | Net Asset Value Per Share |
| Investor Class, $0.01 Par Value |
| $39,702,001 |
| 2,190,168 |
| $18.13 |
| I Class, $0.01 Par Value |
| $5,055,103 |
| 278,066 |
| $18.18 |
| A Class, $0.01 Par Value |
| $1,583,350 |
| 88,487 |
| $17.89* |
| C Class, $0.01 Par Value |
| $1,817,395 |
| 106,892 |
| $17.00 |
| R Class, $0.01 Par Value |
| $766,944 |
| 43,508 |
| $17.63 |
*Maximum offering price $18.98 (net asset value divided by 0.9425).
See Notes to Financial Statements.
|
| | | |
| YEAR ENDED JUNE 30, 2018 |
| Investment Income (Loss) |
| Income: | |
| Dividends | $ | 631,734 |
|
| Interest | 202,747 |
|
| | 834,481 |
|
| | |
| Expenses: | |
| Dividend expense on securities sold short | 212,109 |
|
| Fees and charges on borrowings for securities sold short | 225,716 |
|
| Management fees | 658,321 |
|
| Distribution and service fees: | |
| A Class | 4,668 |
|
| C Class | 20,823 |
|
| R Class | 3,150 |
|
| Directors' fees and expenses | 2,805 |
|
| | 1,127,592 |
|
| | |
| Net investment income (loss) | (293,111 | ) |
| | |
| Realized and Unrealized Gain (Loss) | |
| Net realized gain (loss) on: | |
| Investment transactions | 7,445,928 |
|
| Securities sold short transactions | (5,073,727 | ) |
| | 2,372,201 |
|
| | |
| Change in net unrealized appreciation (depreciation) on: | |
| Investments | 440,282 |
|
| Securities sold short | (414,069 | ) |
| | 26,213 |
|
| | |
| Net realized and unrealized gain (loss) | 2,398,414 |
|
| | |
| Net Increase (Decrease) in Net Assets Resulting from Operations | $ | 2,105,303 |
|
See Notes to Financial Statements.
|
|
| Statement of Changes in Net Assets |
|
| | | | | | |
| YEARS ENDED JUNE 30, 2018 AND JUNE 30, 2017 |
| Increase (Decrease) in Net Assets | June 30, 2018 | June 30, 2017 |
| Operations | | |
| Net investment income (loss) | $ | (293,111 | ) | $ | (33,936 | ) |
| Net realized gain (loss) | 2,372,201 |
| 4,701,387 |
|
| Change in net unrealized appreciation (depreciation) | 26,213 |
| 799,589 |
|
| Net increase (decrease) in net assets resulting from operations | 2,105,303 |
| 5,467,040 |
|
| | | |
| Distributions to Shareholders | | |
| From net investment income: | | |
| Investor Class | — |
| (14,589 | ) |
| I Class | — |
| (906 | ) |
| From net realized gains: | | |
| Investor Class | (2,804,255 | ) | — |
|
| I Class | (130,005 | ) | — |
|
| A Class | (135,710 | ) | — |
|
| C Class | (152,548 | ) | — |
|
| R Class | (49,146 | ) | — |
|
| Decrease in net assets from distributions | (3,271,664 | ) | (15,495 | ) |
| | | |
| Capital Share Transactions | | |
| Net increase (decrease) in net assets from capital share transactions (Note 5) | 9,245,912 |
| (7,641,652 | ) |
| | | |
| Net increase (decrease) in net assets | 8,079,551 |
| (2,190,107 | ) |
| | | |
| Net Assets | | |
| Beginning of period | 40,845,242 |
| 43,035,349 |
|
| End of period | $ | 48,924,793 |
| $ | 40,845,242 |
|
| | | |
| Accumulated net investment loss | $ | (114,435 | ) | — |
|
See Notes to Financial Statements.
|
|
| Notes to Financial Statements |
JUNE 30, 2018
1. Organization
American Century Quantitative Equity Funds, Inc. (the corporation) is registered under the Investment Company Act of 1940, as amended (the 1940 Act), as an open-end management investment company and is organized as a Maryland corporation. AC Alternatives Disciplined Long Short Fund (the fund) is one fund in a series issued by the corporation. The fund’s investment objective is to seek long-term capital growth.
The fund offers the Investor Class, I Class, A Class, C Class and R Class. The A Class may incur an initial sales charge. The A Class and C Class may be subject to a contingent deferred sales charge.
2. Significant Accounting Policies
The following is a summary of significant accounting policies consistently followed by the fund in preparation of its financial statements. The fund is an investment company and follows accounting and reporting guidance in accordance with accounting principles generally accepted in the United States of America. This may require management to make certain estimates and assumptions at the date of the financial statements. Actual results could differ from these estimates. Management evaluated the impact of events or transactions occurring through the date the financial statements were issued that would merit recognition or disclosure.
Investment Valuations — The fund determines the fair value of its investments and computes its net asset value per share at the close of regular trading (usually 4 p.m. Eastern time) on the New York Stock Exchange (NYSE) on each day the NYSE is open. The Board of Directors has adopted valuation policies and procedures to guide the investment advisor in the fund’s investment valuation process and to provide methodologies for the oversight of the fund’s pricing function.
Equity securities that are listed or traded on a domestic securities exchange are valued at the last reported sales price or at the official closing price as provided by the exchange. Equity securities traded on foreign securities exchanges are generally valued at the closing price of such securities on the exchange where primarily traded or at the close of the NYSE, if that is earlier. If no last sales price is reported, or if local convention or regulation so provides, the mean of the latest bid and asked prices may be used. Securities traded over-the-counter are valued at the mean of the latest bid and asked prices, the last sales price, or the official closing price.
Open-end management investment companies are valued at the reported net asset value per share. Repurchase agreements are valued at cost, which approximates fair value.
If the fund determines that the market price for an investment is not readily available or the valuation methods mentioned above do not reflect an investment’s fair value, such investment is valued as determined in good faith by the Board of Directors or its delegate, in accordance with policies and procedures adopted by the Board of Directors. In its determination of fair value, the fund may review several factors including, but not limited to, market information regarding the specific investment or comparable investments and correlation with other investment types, futures indices or general market indicators. Circumstances that may cause the fund to use these procedures to value an investment include, but are not limited to: an investment has been declared in default or is distressed; trading in a security has been suspended during the trading day or a security is not actively trading on its principal exchange; prices received from a regular pricing source are deemed unreliable; or there is a foreign market holiday and no trading occurred.
The fund monitors for significant events occurring after the close of an investment’s primary exchange but before the fund’s net asset value per share is determined. Significant events may include, but are not limited to: corporate announcements and transactions; governmental action and political unrest that could impact a specific investment or an investment sector; or armed conflicts, natural disasters and similar events that could affect investments in a specific country or region. The fund also monitors for significant fluctuations between domestic and foreign markets, as evidenced by the U.S. market or such other indicators that the Board of Directors, or its delegate, deems appropriate. If significant fluctuations in foreign markets are identified, the fund may apply a model-derived factor to the closing price of equity securities traded on foreign securities exchanges. The factor is based on observable market data as provided by an independent pricing service.
Security Transactions — Security transactions are accounted for as of the trade date. Net realized gains and losses are determined on the identified cost basis, which is also used for federal income tax purposes.
Investment Income — Dividend income less foreign taxes withheld, if any, is recorded as of the ex-dividend date. Distributions received on securities that represent a return of capital or long-term capital gain are recorded as a reduction of cost of investments and/or as a realized gain. The fund may estimate the components of distributions received that may be considered nontaxable distributions or long-term capital gain distributions for income tax purposes. Interest income is recorded on the accrual basis and includes accretion of discounts and amortization of premiums.
Securities Sold Short — The fund enters into short sales, which is selling securities it does not own, as part of its normal investment activities. Upon selling a security short, the fund will segregate cash, cash equivalents or other appropriate liquid securities in at least an amount equal to the current market value of the securities sold short until the fund replaces the borrowed security. Interest earned on segregated cash for securities sold short, if any, is reflected as interest income. The fund is required to pay any dividends or interest due on securities sold short. Such dividends and interest are recorded as an expense. The fund may pay fees or charges on the assets borrowed for securities sold short. These fees are calculated daily based upon the value of each security sold short and a rate that is dependent on the availability of such security. Liabilities for securities sold short are valued daily and changes in value are recorded as change in net unrealized appreciation (depreciation) on securities sold short. The fund records realized gain (loss) on a security sold short when it is terminated by the fund and includes as a component of net realized gain (loss) on securities sold short transactions.
Repurchase Agreements — The fund may enter into repurchase agreements with institutions that American Century Investment Management, Inc. (ACIM) (the investment advisor) has determined are creditworthy pursuant to criteria adopted by the Board of Directors. The fund requires that the collateral, represented by securities, received in a repurchase transaction be transferred to the custodian in a manner sufficient to enable the fund to obtain those securities in the event of a default under the repurchase agreement. ACIM monitors, on a daily basis, the securities transferred to ensure the value, including accrued interest, of the securities under each repurchase agreement is equal to or greater than amounts owed to the fund under each repurchase agreement.
Joint Trading Account — Pursuant to an Exemptive Order issued by the Securities and Exchange Commission, the fund, along with certain other funds in the American Century Investments family of funds, may transfer uninvested cash balances into a joint trading account. These balances are invested in one or more repurchase agreements that are collateralized by U.S. Treasury or Agency obligations.
Segregated Assets — In accordance with the 1940 Act, the fund segregates assets on its books and records to cover certain types of investment securities and other financial instruments. ACIM monitors, on a daily basis, the securities segregated to ensure the fund designates a sufficient amount of liquid assets, marked-to-market daily. The fund may also receive assets or be required to pledge assets at the custodian bank or with a broker for collateral requirements.
Income Tax Status — It is the fund’s policy to distribute substantially all net investment income and net realized gains to shareholders and to otherwise qualify as a regulated investment company under provisions of the Internal Revenue Code. Accordingly, no provision has been made for income taxes. The fund files U.S. federal, state, local and non-U.S. tax returns as applicable. The fund's tax returns are subject to examination by the relevant taxing authority until expiration of the applicable statute of limitations, which is generally three years from the date of filing but can be longer in certain jurisdictions. At this time, management believes there are no uncertain tax positions which, based on their technical merit, would not be sustained upon examination and for which it is reasonably possible that the total amounts of unrecognized tax benefits will significantly change in the next twelve months.
Multiple Class — All shares of the fund represent an equal pro rata interest in the net assets of the class to which such shares belong, and have identical voting, dividend, liquidation and other rights and the same terms and conditions, except for class specific expenses and exclusive rights to vote on matters affecting only individual classes. Income, non-class specific expenses, and realized and unrealized capital gains and losses of the fund are allocated to each class of shares based on their relative net assets.
Distributions to Shareholders — Distributions from net investment income, if any, are generally declared and paid semiannually. Distributions from net realized gains, if any, are generally declared and paid annually. The fund may elect to treat a portion of its payment to a redeeming shareholder, which represents the pro rata share of undistributed net investment income and net realized gains, as a distribution for federal income tax purposes (tax equalization).
Indemnifications — Under the corporation’s organizational documents, its officers and directors are indemnified against certain liabilities arising out of the performance of their duties to the fund. In addition, in the normal course of business, the fund enters into contracts that provide general indemnifications. The maximum exposure under these arrangements is unknown as this would involve future claims that may be made against a fund. The risk of material loss from such claims is considered by management to be remote.
3. Fees and Transactions with Related Parties
Certain officers and directors of the corporation are also officers and/or directors of American Century Companies, Inc. (ACC). The corporation’s investment advisor, ACIM, the corporation's distributor, American Century Investment Services, Inc. (ACIS), and the corporation’s transfer agent, American Century Services, LLC, are wholly owned, directly or indirectly, by ACC.
Management Fees — The corporation has entered into a management agreement with ACIM, under which ACIM provides the fund with investment advisory and management services in exchange for a single, unified management fee (the fee) per class. The agreement provides that all expenses of managing and operating the fund, except distribution and service fees, expenses on securities sold short, brokerage expenses, taxes, interest, fees and expenses of the independent directors (including legal counsel fees), and extraordinary expenses, will be paid by ACIM. The fee is computed and accrued daily based on each class's daily net assets and paid monthly in arrears. The difference in the fee among the classes is a result of their separate arrangements for non-Rule 12b-1 shareholder services. It is not the result of any difference in advisory or custodial fees or other expenses related to the management of the fund’s assets, which do not vary by class. The fee consists of (1) an Investment Category Fee based on the daily net assets of the fund and certain other accounts managed by the investment advisor that are in the same broad investment category as the fund and (2) a Complex Fee based on the assets of all the funds in the American Century Investments family of funds.
The Investment Category Fee range, the Complex Fee range and the effective annual management fee for each class for the period ended June 30, 2018 are as follows:
|
| | | |
| | Investment Category Fee Range | Complex Fee Range | Effective Annual
Management Fee |
| Investor Class | 1.1180% to 1.3000% | 0.2500% to 0.3100% | 1.44% |
| I Class | 0.0500% to 0.1100% | 1.24% |
| A Class | 0.2500% to 0.3100% | 1.44% |
| C Class | 0.2500% to 0.3100% | 1.44% |
| R Class | 0.2500% to 0.3100% | 1.44% |
Distribution and Service Fees — The Board of Directors has adopted a separate Master Distribution and Individual Shareholder Services Plan for each of the A Class, C Class and R Class (collectively the plans), pursuant to Rule 12b-1 of the 1940 Act. The plans provide that the A Class will pay ACIS an annual distribution and service fee of 0.25%. The plans provide that the C Class will pay ACIS an annual distribution and service fee of 1.00%, of which 0.25% is paid for individual shareholder services and 0.75% is paid for distribution services. The plans provide that the R Class will pay ACIS an annual distribution and service fee of 0.50%. The fees are computed and accrued daily based on each class’s daily net assets and paid monthly in arrears. The fees are used to pay financial intermediaries for distribution and individual shareholder services. Fees incurred under the plans during the period ended June 30, 2018 are detailed in the Statement of Operations.
Directors' Fees and Expenses — The Board of Directors is responsible for overseeing the investment advisor’s management and operations of the fund. The directors receive detailed information about the fund and its investment advisor regularly throughout the year, and meet at least quarterly with management of the investment advisor to review reports about fund operations. The fund’s officers do not receive compensation from the fund.
Interfund Transactions — The fund may enter into security transactions with other American Century Investments funds and other client accounts of the investment advisor, in accordance with the 1940 Act rules and procedures adopted by the Board of Directors. The rules and procedures require, among other things, that these transactions be effected at the independent current market price of the security. During the period, the interfund purchases and sales were $1,044,684 and $921,145, respectively. The effect of interfund transactions on the Statement of Operations was $93,476 in net realized gain (loss) on investment transactions.
4. Investment Transactions
Purchases and sales of investment securities and securities sold short, excluding short-term investments, for the period ended June 30, 2018 were $117,802,701 and $116,003,151, respectively.
5. Capital Share Transactions
Transactions in shares of the fund were as follows:
|
| | | | | | | | | | |
| | Year ended
June 30, 2018 | Year ended
June 30, 2017 |
| | Shares | Amount | Shares | Amount |
| Investor Class/Shares Authorized | 50,000,000 |
| | 50,000,000 |
| |
| Sold | 1,274,754 |
| $ | 23,619,522 |
| 709,766 |
| $ | 12,888,344 |
|
| Issued in reinvestment of distributions | 148,786 |
| 2,664,762 |
| 817 |
| 14,306 |
|
| Redeemed | (1,165,589 | ) | (21,437,057 | ) | (936,332 | ) | (16,384,723 | ) |
| | 257,951 |
| 4,847,227 |
| (225,749 | ) | (3,482,073 | ) |
| I Class/Shares Authorized | 25,000,000 |
| | 25,000,000 |
| |
| Sold | 275,796 |
| 5,086,168 |
| 2,782 |
| 48,694 |
|
| Issued in reinvestment of distributions | 7,247 |
| 130,005 |
| 52 |
| 906 |
|
| Redeemed | (26,606 | ) | (487,271 | ) | (1,098 | ) | (20,133 | ) |
| | 256,437 |
| 4,728,902 |
| 1,736 |
| 29,467 |
|
| A Class/Shares Authorized | 20,000,000 |
| | 20,000,000 |
| |
| Sold | 26,419 |
| 483,482 |
| 35,143 |
| 620,552 |
|
| Issued in reinvestment of distributions | 7,335 |
| 129,830 |
| – |
| – |
|
| Redeemed | (51,825 | ) | (945,562 | ) | (261,037 | ) | (4,661,858 | ) |
| | (18,071 | ) | (332,250 | ) | (225,894 | ) | (4,041,306 | ) |
| C Class/Shares Authorized | 15,000,000 |
| | 15,000,000 |
| |
| Sold | 13,593 |
| 239,127 |
| 11,084 |
| 190,434 |
|
| Issued in reinvestment of distributions | 9,032 |
| 152,548 |
| – |
| – |
|
| Redeemed | (40,415 | ) | (706,839 | ) | (36,154 | ) | (606,319 | ) |
| | (17,790 | ) | (315,164 | ) | (25,070 | ) | (415,885 | ) |
| R Class/Shares Authorized | 15,000,000 |
| | 15,000,000 |
| |
| Sold | 27,688 |
| 502,597 |
| 16,339 |
| 285,343 |
|
| Issued in reinvestment of distributions | 2,815 |
| 49,146 |
| – |
| – |
|
| Redeemed | (13,075 | ) | (234,546 | ) | (985 | ) | (17,198 | ) |
| | 17,428 |
| 317,197 |
| 15,354 |
| 268,145 |
|
| Net increase (decrease) | 495,955 |
| $ | 9,245,912 |
| (459,623 | ) | $ | (7,641,652 | ) |
6. Fair Value Measurements
The fund’s investments valuation process is based on several considerations and may use multiple inputs to determine the fair value of the investments held by the fund. In conformity with accounting principles generally accepted in the United States of America, the inputs used to determine a valuation are classified into three broad levels.
• Level 1 valuation inputs consist of unadjusted quoted prices in an active market for identical investments.
• Level 2 valuation inputs consist of direct or indirect observable market data (including quoted prices for comparable investments, evaluations of subsequent market events, interest rates, prepayment speeds, credit risk, etc.). These inputs also consist of quoted prices for identical investments initially expressed in local currencies that are adjusted through translation into U.S. dollars.
• Level 3 valuation inputs consist of unobservable data (including a fund’s own assumptions).
The level classification is based on the lowest level input that is significant to the fair valuation measurement. The valuation inputs are not necessarily an indication of the risks associated with investing in these securities or other financial instruments. There were no significant transfers between levels during the period.
The following is a summary of the level classifications as of period end. The Schedule of Investments provides additional information on the fund’s portfolio holdings.
|
| | | | | | | | |
| | Level 1 | Level 2 | Level 3 |
| Assets |
| Investment Securities |
| Common Stocks | $ | 50,679,224 |
| — |
| — |
|
| Temporary Cash Investments | 17,900 |
| $ | 24,328,259 |
| — |
|
| | $ | 50,697,124 |
| $ | 24,328,259 |
| — |
|
| | | | |
| Liabilities |
| Securities Sold Short |
| Common Stocks | $ | 26,690,305 |
| — |
| — |
|
7. Risk Factors
The fund is subject to short sales risk. If the market price of a security increases after the fund borrows the security, the fund may suffer a loss when it replaces the borrowed security at the higher price. Any loss will be increased by the amount of compensation, interest or dividends, and transaction costs the fund must pay to the lender of the borrowed security.
The fund's investment strategy utilizes leverage, which can increase market exposure and subject the fund to greater risk and higher volatility.
If the fund is overweighted in a stock or sector, any negative development related to that stock or sector will have a greater impact on the fund than other funds that are not overweighted in that stock or sector.
The fund’s investment process may result in high portfolio turnover, which could mean high transaction costs, affecting both performance and capital gains tax liabilities to investors.
8. Federal Tax Information
The tax character of distributions paid during the years ended June 30, 2018 and June 30, 2017 were as follows:
|
| | | | | | |
| | 2018 | 2017 |
| Distributions Paid From | | |
| Ordinary income | — |
| $ | 15,486 |
|
| Long-term capital gains | $ | 3,271,664 |
| $ | 9 |
|
The book-basis character of distributions made during the year from net investment income or net realized gains may differ from their ultimate characterization for federal income tax purposes. These differences reflect the differing character of certain income items and net realized gains and losses for financial statement and tax purposes, and may result in reclassification among certain capital accounts on the financial statements.
As of period end, the federal tax cost of investments and the components of distributable earnings on a tax-basis were as follows:
|
| | | |
| Federal tax cost of investments | $ | 67,836,500 |
|
| Gross tax appreciation of investments | $ | 8,322,452 |
|
| Gross tax depreciation of investments | (1,133,569 | ) |
| Net tax appreciation (depreciation) of investments | 7,188,883 |
|
| Gross tax appreciation on securities sold short | 714,574 |
|
| Gross tax depreciation on securities sold short | (2,366,766 | ) |
| Net tax appreciation (depreciation) | $ | 5,536,691 |
|
| Undistributed ordinary income | — |
|
| Accumulated long-term gains | $ | 1,219,982 |
|
| Late-year ordinary loss deferral | $ | (114,435 | ) |
The difference between book-basis and tax-basis unrealized appreciation (depreciation) is attributable primarily to the tax deferral of losses on wash sales.
Loss deferrals represent certain qualified losses that the fund has elected to treat as having been incurred in the following fiscal year for federal income tax purposes.
|
| | | | | | | | | | | | | | | | |
| For a Share Outstanding Throughout the Years Ended June 30 (except as noted) |
| Per-Share Data | Ratios and Supplemental Data |
| | | Income From Investment Operations: | Distributions From: | | | Ratio to Average Net Assets of: | | |
| | Net Asset Value, Beginning of Period | Net Investment Income (Loss)(1) | Net Realized and Unrealized Gain (Loss) | Total From Investment Operations | Net Investment Income | Net Realized Gains | Total Distributions | Net Asset Value, End of Period | Total Return(2) | Operating Expenses | Operating Expenses (excluding expenses on securities sold short) | Net Investment Income (Loss) | Portfolio Turnover Rate | Net Assets, End of Period (in thousands) |
| Investor Class |
| 2018 | $18.54 | (0.11) | 1.02 | 0.91 | — | (1.32) | (1.32) | $18.13 | 5.06% | 2.39% | 1.44% | (0.58)% | 243% |
| $39,702 |
|
| 2017 | $16.17 | —(3) | 2.38 | 2.38 | (0.01) | — | (0.01) | $18.54 | 14.65% | 2.05% | 1.45% | 0.00%(4) | 127% |
| $35,816 |
|
| 2016 | $16.67 | 0.02 | (0.25) | (0.23) | —(3) | (0.27) | (0.27) | $16.17 | (1.40)% | 1.91% | 1.47% | 0.14% | 121% |
| $34,885 |
|
| 2015 | $16.02 | 0.04 | 1.54 | 1.58 | (0.01) | (0.92) | (0.93) | $16.67 | 10.22% | 1.80% | 1.45% | 0.22% | 115% |
| $47,976 |
|
| 2014 | $12.65 | 0.03 | 3.76 | 3.79 | (0.01) | (0.41) | (0.42) | $16.02 | 30.29% | 1.81% | 1.46% | 0.17% | 96% |
| $15,188 |
|
| I Class |
| 2018 | $18.55 | (0.06) | 1.01 | 0.95 | — | (1.32) | (1.32) | $18.18 | 5.22% | 2.19% | 1.24% | (0.38)% | 243% |
| $5,055 |
|
| 2017 | $16.18 | 0.04 | 2.37 | 2.41 | (0.04) | — | (0.04) | $18.55 | 14.93% | 1.85% | 1.25% | 0.20% | 127% |
| $401 |
|
| 2016 | $16.69 | 0.04 | (0.24) | (0.20) | (0.04) | (0.27) | (0.31) | $16.18 | (1.26)% | 1.71% | 1.27% | 0.34% | 121% |
| $322 |
|
| 2015 | $16.03 | 0.06 | 1.57 | 1.63 | (0.05) | (0.92) | (0.97) | $16.69 | 10.49% | 1.60% | 1.25% | 0.42% | 115% |
| $1,027 |
|
| 2014 | $12.66 | 0.05 | 3.77 | 3.82 | (0.04) | (0.41) | (0.45) | $16.03 | 30.52% | 1.61% | 1.26% | 0.37% | 96% |
| $503 |
|
| A Class |
| 2018 | $18.36 | (0.15) | 1.00 | 0.85 | — | (1.32) | (1.32) | $17.89 | 4.77% | 2.64% | 1.69% | (0.83)% | 243% |
| $1,583 |
|
| 2017 | $16.04 | (0.05) | 2.37 | 2.32 | — | — | — | $18.36 | 14.40% | 2.30% | 1.70% | (0.25)% | 127% |
| $1,956 |
|
| 2016 | $16.59 | (0.02) | (0.26) | (0.28) | — | (0.27) | (0.27) | $16.04 | (1.72)% | 2.16% | 1.72% | (0.11)% | 121% |
| $5,333 |
|
| 2015 | $15.97 | (0.01) | 1.55 | 1.54 | — | (0.92) | (0.92) | $16.59 | 9.97% | 2.05% | 1.70% | (0.03)% | 115% |
| $6,083 |
|
| 2014 | $12.63 | (0.01) | 3.76 | 3.75 | — | (0.41) | (0.41) | $15.97 | 29.99% | 2.06% | 1.71% | (0.08)% | 96% |
| $1,252 |
|
|
| | | | | | | | | | | | | | | | |
| For a Share Outstanding Throughout the Years Ended June 30 (except as noted) |
| Per-Share Data | Ratios and Supplemental Data |
| | | Income From Investment Operations: | Distributions From: | | | Ratio to Average Net Assets of: | | |
| | Net Asset Value, Beginning of Period | Net Investment Income (Loss)(1) | Net Realized and Unrealized Gain (Loss) | Total From Investment Operations | Net Investment Income | Net Realized Gains | Total Distributions | Net Asset Value, End of Period | Total Return(2) | Operating Expenses | Operating Expenses (excluding expenses on securities sold short) | Net Investment Income (Loss) | Portfolio Turnover Rate | Net Assets, End of Period (in thousands) |
| C Class |
| 2018 | $17.63 | (0.28) | 0.97 | 0.69 | — | (1.32) | (1.32) | $17.00 | 3.97% | 3.39% | 2.44% | (1.58)% | 243% |
| $1,817 |
|
| 2017 | $15.53 | (0.17) | 2.27 | 2.10 | — | — | — | $17.63 | 13.52% | 3.05% | 2.45% | (1.00)% | 127% |
| $2,199 |
|
| 2016 | $16.18 | (0.14) | (0.24) | (0.38) | — | (0.27) | (0.27) | $15.53 | (2.38)% | 2.91% | 2.47% | (0.86)% | 121% |
| $2,325 |
|
| 2015 | $15.71 | (0.13) | 1.52 | 1.39 | — | (0.92) | (0.92) | $16.18 | 9.16% | 2.80% | 2.45% | (0.78)% | 115% |
| $1,306 |
|
| 2014 | $12.53 | (0.12) | 3.71 | 3.59 | — | (0.41) | (0.41) | $15.71 | 28.94% | 2.81% | 2.46% | (0.83)% | 96% |
| $699 |
|
| R Class |
| 2018 | $18.15 | (0.19) | 0.99 | 0.80 | — | (1.32) | (1.32) | $17.63 | 4.54% | 2.89% | 1.94% | (1.08)% | 243% |
| $767 |
|
| 2017 | $15.90 | (0.08) | 2.33 | 2.25 | — | — | — | $18.15 | 14.09% | 2.55% | 1.95% | (0.50)% | 127% |
| $473 |
|
| 2016 | $16.48 | (0.06) | (0.25) | (0.31) | — | (0.27) | (0.27) | $15.90 | (1.91)% | 2.41% | 1.97% | (0.36)% | 121% |
| $171 |
|
| 2015 | $15.91 | (0.04) | 1.53 | 1.49 | — | (0.92) | (0.92) | $16.48 | 9.69% | 2.30% | 1.95% | (0.28)% | 115% |
| $44 |
|
| 2014 | $12.62 | (0.05) | 3.75 | 3.70 | — | (0.41) | (0.41) | $15.91 | 29.61% | 2.31% | 1.96% | (0.33)% | 96% |
| $521 |
|
|
|
| Notes to Financial Highlights |
| |
| (1) | Computed using average shares outstanding throughout the period. |
| |
| (2) | Total returns are calculated based on the net asset value of the last business day and do not reflect applicable sales charges, if any. Total returns for periods less than one year are not annualized. |
| |
| (3) | Per share amount was less than $0.005. |
| |
| (4) | Ratio was less than 0.005%. |
See Notes to Financial Statements.
|
|
| Report of Independent Registered Public Accounting Firm |
To the Board of Directors of American Century Quantitative Equity Funds, Inc. and Shareholders of AC Alternatives® Disciplined Long Short Fund
Opinion on the Financial Statements
We have audited the accompanying statement of assets and liabilities, including the schedule of investments, of AC Alternatives® Disciplined Long Short Fund (one of the funds constituting American Century Quantitative Equity Funds, Inc., referred to hereafter as the "Fund") as of June 30, 2018, the related statements of operations for the year ended June 30, 2018, the statement of changes in net assets for each of the two years in the period ended June 30, 2018, including the related notes, and the financial highlights for each of the five years in the period ended June 30, 2018 (collectively referred to as the “financial statements”). In our opinion, the financial statements present fairly, in all material respects, the financial position of the Fund as of June 30, 2018, the results of its operations for the year then ended, the changes in its net assets for each of the two years in the period ended June 30, 2018 and the financial highlights for each of the five years in the period ended June 30, 2018 in conformity with accounting principles generally accepted in the United States of America.
Basis for Opinion
These financial statements are the responsibility of the Fund’s management. Our responsibility is to express an opinion on the Fund’s financial statements based on our audits. We are a public accounting firm registered with the Public Company Accounting Oversight Board (United States) (“PCAOB”) and are required to be independent with respect to the Fund in accordance with the U.S. federal securities laws and the applicable rules and regulations of the Securities and Exchange Commission and the PCAOB.
We conducted our audits of these financial statements in accordance with the standards of the PCAOB. Those standards require that we plan and perform the audit to obtain reasonable assurance about whether the financial statements are free of material misstatement, whether due to error or fraud.
Our audits included performing procedures to assess the risks of material misstatement of the financial statements, whether due to error or fraud, and performing procedures that respond to those risks. Such procedures included examining, on a test basis, evidence regarding the amounts and disclosures in the financial statements. Our audits also included evaluating the accounting principles used and significant estimates made by management, as well as evaluating the overall presentation of the financial statements. Our procedures included confirmation of securities owned as of June 30, 2018 by correspondence with the custodian and brokers; when replies were not received from brokers, we performed other auditing procedures. We believe that our audits provide a reasonable basis for our opinion.
/s/ PricewaterhouseCoopers LLP
Kansas City, Missouri
August 16, 2018
We have served as the auditor of one or more investment companies in American Century Investments since 1997.
The Board of Directors
The individuals listed below serve as directors of the funds. Each director will continue to serve in this capacity until death, retirement, resignation or removal from office. The board has adopted a mandatory retirement age for directors who are not “interested persons,” as that term is defined in the Investment Company Act (independent directors). Independent directors shall retire by December 31 of the year in which they reach their 75th birthday; provided, however, that on or after January 1, 2022, independent trustees shall retire on December 31 of the year in which they reach their 76th birthday.
Mr. Thomas is an “interested person” because he currently serves as President and Chief Executive Officer of American Century Companies, Inc. (ACC), the parent company of American Century Investment Management, Inc. (ACIM or the advisor). The other directors (more than three-fourths of the total number) are independent. They are not employees, directors or officers of, and have no financial interest in, ACC or any of its wholly owned, direct or indirect, subsidiaries, including ACIM, American Century Investment Services, Inc. (ACIS) and American Century Services, LLC (ACS), and they do not have any other affiliations, positions or relationships that would cause them to be considered “interested persons” under the Investment Company Act. The directors serve in this capacity for eight (in the case of Jonathan S. Thomas, 16; and Ronald J. Gilson, 9) registered investment companies in the American Century Investments family of funds.
The following table presents additional information about the directors. The mailing address for each director other than Mr. Thomas is 1665 Charleston Road, Mountain View, California 94043. The mailing address for Mr. Thomas is 4500 Main Street, Kansas City, Missouri 64111.
|
| | | | | |
Name
(Year of Birth) | Position(s) Held with Funds | Length of Time Served | Principal Occupation(s) During Past 5 Years | Number of American Century Portfolios Overseen by Director | Other Directorships Held During Past 5 Years |
| Independent Directors |
|
|
Tanya S. Beder
(1955) | Director | Since 2011 | Chairman and CEO, SBCC Group Inc. (independent advisory services) (2006 to present) | 45 | CYS Investments, Inc.; Nabors Industries Ltd. |
Jeremy I. Bulow
(1954) | Director | Since 2011 | Professor of Economics, Stanford University, Graduate School of Business (1979 to present) | 45 | None |
Anne Casscells
(1958) | Director | Since 2016 | Co-Chief Executive Officer and Chief Investment Officer, Aetos Alternatives Management (investment advisory firm) (2001 to present); Lecturer in Accounting, Stanford University, Graduate School of Business (2009 to present) | 45 | None |
|
| | | | | |
Name
(Year of Birth) | Position(s) Held with Funds | Length of Time Served | Principal Occupation(s) During Past 5 Years | Number of American Century Portfolios Overseen by Director | Other Directorships Held During Past 5 Years |
| Independent Directors |
|
|
Ronald J. Gilson
(1946) | Director and Chairman of the Board | Since 1995
(Chairman since 2005) | Charles J. Meyers Professor of Law and Business, Emeritus, Stanford Law School (1979 to 2016); Marc and Eva Stern Professor of Law and Business, Columbia University School of Law (1992 to present) | 47 | None |
Frederick L. A. Grauer
(1946) | Director | Since 2008 | Senior Advisor, iShares by BlackRock, Inc. (investment management firm) (2010 to 2011, 2013 to 2015); Senior Advisor, Course Hero (an educational technology company) (2015 to present) | 45 | None |
Jonathan D. Levin
(1972) | Director | Since 2016 | Philip H. Knight Professor and Dean, Graduate School of Business, Stanford University (2016 to present); Professor, Stanford University, (2000 to present); Chair, Department of Economics, Stanford University (2011 to 2014) | 45 | None |
Peter F. Pervere
(1947) | Director | Since 2007 | Retired | 45 | None |
John B. Shoven
(1947) | Director | Since 2002 | Charles R. Schwab Professor of Economics, Stanford University (1973 to present) | 45 | Cadence Design Systems; Exponent; Financial Engines |
| Interested Director |
|
|
Jonathan S. Thomas
(1963) | Director and President | Since 2007 | President and Chief Executive Officer, ACC (2007 to present). Also serves as Chief Executive Officer, ACS; Executive Vice President, ACIM; Director, ACC, ACIM and other ACC subsidiaries | 115 | BioMed Valley Discoveries, Inc. |
The Statement of Additional Information has additional information about the fund's directors and is available without charge, upon request, by calling 1-800-345-2021.
Officers
The following table presents certain information about the executive officers of the funds. Each officer serves as an officer for each of the 16 (in the case of Robert J. Leach, 15) investment companies in the American Century family of funds, unless otherwise noted. No officer is compensated for his or her service as an officer of the funds. The listed officers are interested persons of the funds and are appointed or re-appointed on an annual basis. The mailing address for each officer listed below is 4500 Main Street, Kansas City, Missouri 64111.
|
| | |
Name
(Year of Birth) | Offices with the Funds | Principal Occupation(s) During the Past Five Years |
Jonathan S. Thomas
(1963) | Director and President since 2007 | President and Chief Executive Officer, ACC (2007 to present). Also serves as Chief Executive Officer, ACS; Executive Vice President, ACIM; Director, ACC, ACIM and other ACC subsidiaries |
Amy D. Shelton
(1964) | Chief Compliance Officer and Vice President since 2014 | Chief Compliance Officer, American Century funds, (2014 to present); Chief Compliance Officer, ACIM (2014 to present); Chief Compliance Officer, ACIS (2009 to present); Vice President, Client Interactions and Marketing, ACIS (2013 to 2014). Also serves as Vice President, ACIS |
Charles A. Etherington
(1957) | General Counsel since 2007 and Senior Vice President since 2006 | Attorney, ACC (1994 to present); Vice President, ACC (2005 to present); General Counsel, ACC (2007 to present). Also serves as General Counsel, ACIM, ACS, ACIS and other ACC subsidiaries; and Senior Vice President, ACIM and ACS |
C. Jean Wade
(1964) | Vice President,Treasurer and Chief Financial Officer since 2012 | Senior Vice President, ACS (2017 to present); Vice President, ACS (2000 to 2017) |
Robert J. Leach
(1966) | Vice President since 2006 and Assistant Treasurer since 2012 | Vice President, ACS (2000 to present) |
David H. Reinmiller
(1963) | Vice President since 2000 | Attorney, ACC (1994 to present). Also serves as Vice President, ACIM and ACS |
Ward D. Stauffer
(1960) | Secretary since 2005 | Attorney, ACC (2003 to present) |
|
|
| Approval of Management Agreement |
At a meeting held on June 19, 2018, the Fund’s Board of Directors (the "Board") unanimously approved the renewal of the management agreement pursuant to which American Century Investment Management, Inc. (the “Advisor”) acts as the investment advisor for the Fund. Under Section 15(c) of the Investment Company Act, contracts for investment advisory services are required to be reviewed, evaluated, and approved by a majority of a fund’s directors/trustees, including a majority of the independent Directors, each year. The Board regards this annual evaluation and renewal as one of its most important responsibilities.
The independent Directors have memorialized a statement regarding the relationship between their ongoing obligations to oversee and evaluate the performance of the Advisor and their annual consideration of renewal of the management agreement. In that statement, the independent Directors noted that their assessment of the Advisor’s performance is an ongoing process that takes place over the entire year and is informed by all of the extensive information that the Board and its committees receive and consider over time. This information, together with the additional materials provided specifically in connection with the review, are central to the Board’s assessment of the Advisor’s performance and its determination whether to renew the Fund’s management agreement.
Prior to its consideration of the renewal of the management agreement, the Board requested and reviewed extensive data and analysis relating to the proposed renewal. This information and analysis was compiled by the Advisor and certain independent providers of evaluation data concerning the Fund and the services provided to the Fund by the Advisor.
In connection with its consideration of the renewal of the management agreement, the Board’s review and evaluation of the services provided by the Advisor included, but was not limited to, the following:
| |
| • | the nature, extent, and quality of investment management, shareholder services, and other services provided to the Fund; |
| |
| • | the wide range of other programs and services the Advisor provides to the Fund and its shareholders on a routine and non-routine basis; |
| |
| • | the investment performance of the Fund, including data comparing the Fund’s performance to appropriate benchmarks and/or a peer group of other mutual funds with similar investment objectives and strategies; |
| |
| • | the cost of owning the Fund compared to the cost of owning similar funds; |
| |
| • | the Advisor’s compliance policies, procedures, and regulatory experience; |
| |
| • | financial data showing the cost of services provided to the Fund, the profitability of the Fund to the Advisor, and the overall profitability of the Advisor; |
| |
| • | strategic plans of the Advisor; |
| |
| • | any economies of scale associated with the Advisor’s management of the Fund and other accounts; |
| |
| • | services provided and charges to other investment management clients of the Advisor; |
| |
| • | acquired fund fees and expenses; |
| |
| • | payments and practices in connection with financial intermediaries holding shares of the Fund and the services provided by intermediaries in connection therewith; and |
| |
| • | any collateral benefits derived by the Advisor from the management of the Fund. |
In keeping with its practice, the Board held two in-person meetings to review and discuss the information provided in response to their request and held active discussions with the Advisor regarding the renewal of the management agreement. The independent Directors had the benefit of the advice of their independent counsel throughout the process.
Factors Considered
The Directors considered all of the information provided by the Advisor, the independent data providers, and the independent Directors’ independent counsel in connection with the approval. They determined that the information was sufficient for them to evaluate the management agreement for the Fund. In connection with their review, the Directors did not identify any single factor as being all-important or controlling and each Director may have attributed different levels of importance to different factors. In deciding to renew the management agreement, the Board based its decision on a number of factors, including the following:
Nature, Extent and Quality of Services - Generally. Under the management agreement, the Advisor is responsible for providing or arranging for all services necessary for the operation of the Fund. The Board noted that the Advisor provides or arranges at its own expense a wide variety of services including:
| |
| • | constructing and designing the Fund |
| |
| • | portfolio research and security selection |
| |
| • | initial capitalization/funding |
| |
| • | daily valuation of the Fund’s portfolio |
| |
| • | shareholder servicing and transfer agency, including shareholder confirmations, recordkeeping, and communications |
| |
| • | legal services (except the independent Directors’ counsel) |
| |
| • | regulatory and portfolio compliance |
| |
| • | marketing and distribution (except amounts paid by the Fund under Rule 12b-1 plans) |
The Board noted that many of these services have expanded over time in terms of both quantity and complexity in response to shareholder demands, competition in the industry, changing distribution channels, and the changing regulatory environment.
Investment Management, Shareholder, and Other Services. The nature of the investment management services provided to the Fund is quite complex and allows Fund shareholders access to professional money management, instant diversification of their investments within an asset class, the opportunity to easily diversify among asset classes by investing in or exchanging among various American Century Investments funds, and liquidity. In evaluating investment performance, the Board expects the Advisor to manage the Fund in accordance with its investment objectives and approved strategies. Further, the Directors recognize that the Advisor has an obligation to seek the best execution of fund trades. In providing these services, the Advisor utilizes teams of investment professionals (portfolio managers, analysts, research assistants, and securities traders) who require extensive information technology, research, training, compliance, and other systems to conduct their business. The Board, directly and through its Portfolio Committee, regularly reviews investment performance information for the Fund, together with comparative information for appropriate benchmarks and/or peer groups of similarly-managed funds, over different time horizons. The Directors also review detailed performance information during the management agreement approval process. If performance concerns are identified, the Fund receives special reviews until performance improves, during which the Board discusses with the Advisor the reasons for such results (e.g., market conditions, security selection) and any efforts being undertaken to improve performance. The Fund’s performance was below its benchmark for the one-, three-, and five-year periods reviewed by the Board. The Board found the investment management services provided by the Advisor to the Fund to be satisfactory and consistent with the management agreement.
Under the management agreement, the Advisor provides the Fund with a comprehensive package of transfer agency, shareholder, and other services. The Board, directly and through various committees of the Board, regularly reviews reports and evaluations of such services at its regular meetings. These reports include, but are not limited to, information regarding the operational efficiency and accuracy of the shareholder and transfer agency services provided, staffing levels, shareholder satisfaction (as measured by external as well as internal sources), technology support, new products and services offered to Fund shareholders, securities trading activities, portfolio valuation services, auditing services, and legal and operational compliance activities. The Board found the services provided by the Advisor to the Fund under the management agreement to be competitive and of high quality.
Costs of Services and Profitability. The Advisor provides detailed information concerning its cost of providing various services to the Fund, its profitability in managing the Fund, its overall profitability, and its financial condition. The Directors have reviewed with the Advisor the methodology used to prepare this financial information. This information is considered in evaluating the Advisor’s financial condition, its ability to continue to provide services under the management agreement, and the reasonableness of the current management fee. The Board concluded that the Advisor’s profits were reasonable in light of the services provided to the Fund.
Economies of Scale. The Board also reviewed information provided by the Advisor regarding the possible existence of economies of scale in connection with the management of the Fund. The Board concluded that economies of scale are difficult to measure and predict with precision, especially on a fund-by-fund basis. The Board concluded that the Advisor is appropriately sharing economies of scale through its competitive fee structure, offering competitive fees from fund inception, and through reinvestment in its business to provide shareholders enhanced and expanded services.
Comparison to Other Funds’ Fees. The management agreement provides that the Fund pays the Advisor a single, all-inclusive (or unified) management fee for providing all services necessary for the management and operation of the Fund, other than brokerage expenses, expenses attributable to short sales, taxes, interest, extraordinary expenses, the fees and expenses of the Fund’s independent Directors (including their independent legal counsel), and expenses incurred in connection with the provision of shareholder services and distribution services under a plan adopted pursuant to Rule 12b-1 under the 1940 Act. Under the unified fee structure, the Advisor is responsible for providing all investment advisory, custody, audit, administrative, compliance, recordkeeping, marketing, and shareholder services, or arranging and supervising third parties to provide such services. By contrast, most other funds are charged a variety of fees, including an investment advisory fee, a transfer agency fee, an administrative fee, distribution charges, and other expenses. Other than their investment advisory fees and any applicable Rule 12b-1 distribution fees, all other components of the total fees charged by these other funds may be increased without shareholder approval. The Board believes the unified fee structure is a benefit to Fund shareholders because it clearly discloses to shareholders the cost of owning Fund shares, and, since the unified fee cannot be increased without a vote of Fund shareholders, it shifts to the Advisor the risk of increased costs of operating the Fund and provides a direct incentive to minimize administrative inefficiencies. Part of the Board’s analysis of fee levels involves reviewing certain evaluative data compiled by an independent provider and comparing the Fund’s unified fee to the total expense ratio of peer funds. The unified fee charged to shareholders of the Fund was below the median of the total expense ratios of the Fund’s peer universe. The Board concluded that the management fee paid by the Fund to the Advisor under the management agreement is reasonable in light of the services provided to the Fund.
Comparison to Fees and Services Provided to Other Clients of the Advisor. The Board also requested and received information from the Advisor concerning the nature of the services, fees, costs, and profitability of its advisory services to advisory clients other than the Fund. They observed that these varying types of client accounts require different services and involve different regulatory and entrepreneurial risks than the management of the Fund. The Board analyzed this
information and concluded that the fees charged and services provided to the Fund were reasonable by comparison.
Payments to Intermediaries. The Directors also requested and received a description of payments made to intermediaries by the Fund and the Advisor and services provided by intermediaries. These payments include various payments made by the Fund or the Advisor to different types of intermediaries and recordkeepers for distribution and service activities provided for the Fund. The Directors reviewed such information and received representations from the Advisor that all such payments by the Fund were made pursuant to the Fund’s Rule 12b-1 Plan and that all such payments by the Advisor were made from the Advisor’s resources and reasonable profits. The Board found such payments to be reasonable in scope and purpose.
Collateral or “Fall-Out” Benefits Derived by the Advisor. The Board considered the existence of collateral benefits the Advisor may receive as a result of its relationship with the Fund. The Board noted that the Advisor’s primary business is managing mutual funds and it generally does not use fund or shareholder information to generate profits in other lines of business, and therefore does not derive any significant collateral benefits from them. The Board noted that the Advisor may receive proprietary research from broker-dealers that execute fund portfolio transactions. The Board also determined that the Advisor is able to provide investment management services to certain clients other than the Fund, at least in part, due to its existing infrastructure built to serve the fund complex. The Board noted that the assets of those other accounts are, where applicable, included with the assets of the Fund to determine breakpoints in the management fee schedule.
Existing Relationship. The Board also considered whether there was any reason for not continuing the existing arrangement with the Advisor. In this regard, the Board was mindful of the potential disruptions of the Fund’s operations and various risks, uncertainties, and other effects that could occur as a result of a decision not to continue such relationship. In particular, the Board recognized that most shareholders have invested in the Fund on the strength of the Advisor’s industry standing and reputation and in the expectation that the Advisor will have a continuing role in providing advisory services to the Fund.
Conclusion of the Directors. As a result of this process, the Board, including all of the independent Directors and assisted by the advice of independent legal counsel, taking into account all of the factors discussed above and the information provided by the Advisor and others in connection with its review and throughout the year, concluded that the management agreement between the Fund and the Advisor is fair and reasonable in light of the services provided and should be renewed.
Retirement Account Information
As required by law, distributions you receive from certain retirement accounts are subject to federal income tax withholding, unless you elect not to have withholding apply*. Tax will be withheld on the total amount withdrawn even though you may be receiving amounts that are not subject to withholding, such as nondeductible contributions. In such case, excess amounts of withholding could occur. You may adjust your withholding election so that a greater or lesser amount will be withheld.
If you don’t want us to withhold on this amount, you must notify us to not withhold the federal income tax. You may notify us in writing or in certain situations by telephone or through other electronic means. For systematic withdrawals, your withholding election will remain in effect until revoked or changed by filing a new election. You have the right to revoke your election at any time and change your withholding percentage for future distributions.
Remember, even if you elect not to have income tax withheld, you are liable for paying income tax on the taxable portion of your withdrawal. If you elect not to have income tax withheld or you don’t have enough income tax withheld, you may be responsible for payment of estimated tax. You may incur penalties under the estimated tax rules if your withholding and estimated tax payments are not sufficient. You can reduce or defer the income tax on a distribution by directly or indirectly rolling such distribution over to another IRA or eligible plan. You should consult your tax advisor for additional information.
State tax will be withheld if, at the time of your distribution, your address is within one of the mandatory withholding states and you have federal income tax withheld (or as otherwise required by state law). State taxes will be withheld from your distribution in accordance with the respective state rules.
*Some 403(b), 457 and qualified retirement plan distributions may be subject to 20% mandatory withholding, as they are subject to special tax and withholding rules. Your plan administrator or plan sponsor is required to provide you with a special tax notice explaining those rules at the time you request a distribution. If applicable, federal and/or state taxes may be withheld from your distribution amount.
Proxy Voting Policies
Descriptions of the principles and policies that the fund's investment advisor uses in exercising the voting rights associated with the securities purchased and/or held by the fund are available without charge, upon request, by calling 1-800-345-2021 or visiting the "About Us" page of American Century Investments’ website at americancentury.com. A description of the policies is also available on the Securities and Exchange Commission’s website at sec.gov. Information regarding how the investment advisor voted proxies relating to portfolio securities during the most recent 12-month period ended June 30 is available on the "About Us" page at americancentury.com. It is also available at sec.gov.
Quarterly Portfolio Disclosure
The fund files its complete schedule of portfolio holdings with the Securities and Exchange Commission (SEC) for the first and third quarters of each fiscal year on Form N-Q. The fund’s Forms N-Q are available on the SEC’s website at sec.gov, and may be reviewed and copied at the SEC’s Public Reference Room in Washington, DC. Information on the operation of the Public Reference Room may be obtained by calling 1-800-SEC-0330. The fund also makes its complete schedule of portfolio holdings for the most recent quarter of its fiscal year available on its website at americancentury.com and, upon request, by calling 1-800-345-2021.
Other Tax Information
The following information is provided pursuant to provisions of the Internal Revenue Code.
The fund hereby designates $3,337,401, or up to the maximum amount allowable, as long-term
capital gain distributions (20% rate gain distributions) for the fiscal year ended June 30, 2018.
The fund utilized earnings and profits of $65,737 distributed to shareholders on redemption of shares as part of the dividends paid deduction (tax equalization).
|
| | |
| |
| | | |
| Contact Us | americancentury.com | |
| Automated Information Line | 1-800-345-8765 | |
| Investor Services Representative | 1-800-345-2021
or 816-531-5575 | |
| Investors Using Advisors | 1-800-378-9878 | |
Business, Not-For-Profit, Employer-Sponsored
Retirement Plans | 1-800-345-3533 | |
Banks and Trust Companies, Broker-Dealers,
Financial Professionals, Insurance Companies | 1-800-345-6488 | |
| Telecommunications Relay Service for the Deaf | 711 | |
| | | |
| American Century Quantitative Equity Funds, Inc. | |
| | | |
Investment Advisor: American Century Investment Management, Inc. Kansas City, Missouri | |
| | | |
| This report and the statements it contains are submitted for the general information of our shareholders. The report is not authorized for distribution to prospective investors unless preceded or accompanied by an effective prospectus. | |
| | | |
©2018 American Century Proprietary Holdings, Inc. All rights reserved.
CL-ANN-92995 1808 | |
|
| |
| ANNUAL REPORT | |
| JUNE 30, 2018 |
| |
|
|
AC Alternatives® Equity Market Neutral Fund |
| Investor Class (ALHIX) |
| I Class (ALISX) |
| Y Class (ALYIX) |
| A Class (ALIAX) |
| C Class (ALICX) |
| R Class (ALIRX) |
| R5 Class (ALIGX) |
|
| | |
| President's Letter | 2 |
|
| Performance | 3 |
|
| Portfolio Commentary | |
|
| Fund Characteristics | |
|
| Shareholder Fee Example | |
|
| Schedule of Investments | |
|
| Statement of Assets and Liabilities | |
|
| Statement of Operations | |
|
| Statement of Changes in Net Assets | |
|
| Notes to Financial Statements | |
|
| Financial Highlights | |
|
| Report of Independent Registered Public Accounting Firm | |
|
| Management | |
|
| Approval of Management Agreement | |
|
| Additional Information | |
|
Any opinions expressed in this report reflect those of the author as of the date of the report, and do not necessarily represent the opinions of American Century Investments® or any other person in the American Century Investments organization. Any such opinions are subject to change at any time based upon market or other conditions and American Century Investments disclaims any responsibility to update such opinions. These opinions may not be relied upon as investment advice and, because investment decisions made by American Century Investments funds are based on numerous factors, may not be relied upon as an indication of trading intent on behalf of any American Century Investments fund. Security examples are used for representational purposes only and are not intended as recommendations to purchase or sell securities. Performance information for comparative indices and securities is provided to American Century Investments by third party vendors. To the best of American Century Investments’ knowledge, such information is accurate at the time of printing.
Jonathan Thomas
Dear Investor:
Thank you for reviewing this annual report for the period ended June 30, 2018. Annual reports help convey important information about fund returns, including market factors that affected performance during the reporting period. For additional, updated investment and market insights, we encourage you to visit our website, americancentury.com.
Volatility’s Return Challenged Financial Markets
Broad U.S. and global stock market indices generally rallied for the first half of the 12-month period. A favorable backdrop of robust corporate earnings results, improving global economic growth, and relatively low interest rates, combined with the effects of U.S. tax reform, drove stock prices higher. For the six months ended December 31, 2017, U.S. stocks (S&P 500 Index) returned 11.42%. U.S. bond returns were also positive, but much more subdued, as the Federal Reserve (the Fed) continued its rate-normalization efforts and interest rates edged higher. The Bloomberg Barclays U.S. Aggregate Bond Index returned 1.24% for the six-month period.
In early February, a force that was largely dormant during 2017—volatility—re-emerged, as better-than-expected economic data triggered expectations for rising inflation, higher interest rates, and a more-hawkish Fed. In response, U.S. Treasury yields climbed to their highest levels in several years, and stock prices plunged. Economic data released in subsequent months were more in line with market expectations, while corporate earnings results remained healthy. These factors helped calm the market unrest, and stocks generally recovered their earlier losses. Nevertheless, rising interest rates, geopolitical tensions, and the mounting threat of a global trade war continued to provide periodic headwinds for investors.
Despite the return of volatility, U.S. stocks (S&P 500 Index) gained14.37% for the 12-month period. Meanwhile, rising U.S. Treasury yields, particularly in the second half of the period, took a toll on bonds and other interest-rate-sensitive investments, including gold, utilities stocks, and real estate investment trusts (REITs). Investment-grade bonds (Bloomberg Barclays U.S. Aggregate Bond Index) returned -0.40% for the 12 months.
With volatility resurfacing, inflationary pressures building, Treasury yields rising, and the implications of U.S. tariff and trade policy still unfolding, investors likely will face new opportunities and challenges in the months ahead. We believe this scenario warrants a disciplined, diversified, and risk-aware approach, using professionally managed portfolios in pursuit of investment goals. We appreciate your continued trust and confidence in us.
Sincerely,
Jonathan Thomas
President and Chief Executive Officer
American Century Investments
|
| | | | | | |
| Total Returns as of June 30, 2018 |
| | Average Annual Returns | | |
| | Ticker Symbol | 1 year | 5 years | 10 years | Since Inception | Inception Date |
| Investor Class | ALHIX | 1.71% | 0.95% | 0.34% | — | 9/30/05 |
| Bloomberg Barclays U.S. 1-3 Month Treasury Bill Index | — | 1.29% | 0.38% | 0.31% | — | — |
| I Class | ALISX | 2.03% | 1.16% | 0.55% | — | 9/30/05 |
| Y Class | ALYIX | 2.03% | — | — | 0.71% | 4/10/17 |
| A Class | ALIAX | | | | | 9/30/05 |
| No sales charge | | 1.48% | 0.69% | 0.09% | — | |
| With sales charge | | -4.35% | -0.50% | -0.50% | — | |
| C Class | ALICX | 0.70% | -0.06% | -0.65% | — | 9/30/05 |
| R Class | ALIRX | 1.23% | 0.44% | -0.16% | — | 9/30/05 |
| R5 Class | ALIGX | 1.94% | — | — | 0.64% | 4/10/17 |
Average annual returns since inception are presented when ten years of performance history is not available.
Sales charges include initial sales charges and contingent deferred sales charges (CDSCs), as applicable. A Class shares have a 5.75% maximum initial sales charge and may be subject to a maximum CDSC of 1.00%. C Class shares redeemed within 12 months of purchase are subject to a maximum CDSC of 1.00%. The SEC requires that mutual funds provide performance information net of maximum sales charges in all cases where charges could be applied.
Data presented reflect past performance. Past performance is no guarantee of future results. Current performance may be higher or lower than the performance shown. Total returns for periods less than one year are not annualized. Investment return and principal value will fluctuate, and redemption value may be more or less than original cost. Data assumes reinvestment of dividends and capital gains, and none of the charts reflect the deduction of taxes that a shareholder would pay on fund distributions or the redemption of fund shares. To obtain performance data current to the most recent month end, please call 1-800-345-2021 or visit americancentury.com. For additional information about the fund, please consult the prospectus.
|
|
| Growth of $10,000 Over 10 Years |
| $10,000 investment made June 30, 2008 |
| Performance for other share classes will vary due to differences in fee structure. |
|
| |
| Value on June 30, 2018 |
| | Investor Class — $10,348 |
| |
| | Bloomberg Barclays U.S. 1-3 Month Treasury Bill Index — $10,310 |
| |
|
| | | | | | |
| Total Annual Fund Operating Expenses |
| Investor Class | I Class | Y Class | A Class | C Class | R Class | R5 Class |
| 2.92% | 2.72% | 2.67% | 3.17% | 3.92% | 3.42% | 2.72% |
The total annual fund operating expenses shown is as stated in the fund’s prospectus current as of the date of this report. The prospectus may vary from the expense ratio shown elsewhere in this report because it is based on a different time period, includes acquired fund fees and expenses, and, if applicable, does not include fee waivers or expense reimbursements.
Data presented reflect past performance. Past performance is no guarantee of future results. Current performance may be higher or lower than the performance shown. Total returns for periods less than one year are not annualized. Investment return and principal value will fluctuate, and redemption value may be more or less than original cost. Data assumes reinvestment of dividends and capital gains, and none of the charts reflect the deduction of taxes that a shareholder would pay on fund distributions or the redemption of fund shares. To obtain performance data current to the most recent month end, please call 1-800-345-2021 or visit americancentury.com. For additional information about the fund, please consult the prospectus.
Portfolio Managers: Brian Garbe and Claudia Musat
Performance Summary
The AC Alternatives Equity Market Neutral Fund returned 1.71%* for the fiscal year ended June 30, 2018, compared with the 1.29% return of its benchmark, the Bloomberg Barclays U.S. 1-3 Month Treasury Bill Index.
AC Alternatives Equity Market Neutral is managed to produce capital appreciation independent of equity market conditions, so its benchmark is a cash-equivalent asset: the three-month U.S. Treasury bill.
The portfolio’s stock selection process incorporates factors of valuation, quality, growth, and sentiment, while striving to minimize unintended risks along industries and other risk characteristics. Within the fund, quality, sentiment, and growth insights were supportive, while valuation signals detracted from results.
Industrials Holdings Were Largest Contributor
Within industrials, long positions within the professional services industry were one of the largest collective contributors to performance. A position in TriNet Group, a human resources outsourcing company, was among one of the largest individual contributors. We have since exited the position. The company’s stock rose during the period on the back of strong earnings supported by a tightening labor market. ASGN, another human resources company, also saw its stock price increase during the year and was another top contributor. Elsewhere in the sector, positioning in machinery and building products was also additive. In aerospace and defense, long positions in Boeing and Curtiss-Wright were among the top sector contributors.
Positioning within the financials sector was also additive. Long and short positions made the banking industry a top contributor within the sector. In capital markets, several long positions contributed to performance. Evercore, an investment banking company, saw its stock rise throughout the period and was one of the top contributors to portfolio performance. According to our factor model, it maintains high scores for quality, valuation, and sentiment. Elsewhere in the sector, positioning in thrifts and mortgage finance and consumer finance also contributed.
Holdings in the consumer discretionary sector were another source of strength. Auto components was the largest contributing industry for the sector. Long and short positions benefited returns. In textiles, apparel, and luxury goods, a long position in Deckers Outdoor was one of the highest-contributing individual positions for the year. The stock of the company rose during the period on the back of strong earnings, which were supported by solid consumer spending. The company retains high scores across all four factors of our stock selection model. A long position in Ralph Lauren was a strong contributor to performance. We have since exited the position. Long positions in the diversified consumer services industry were also additive.
*All fund returns referenced in this commentary are for Investor Class shares. Performance for other share classes will vary due to differences in fee structure; when Investor Class performance exceeds that of the fund's benchmark, other share classes may not. See page 3 for returns for all share classes.
Health Care Sector Led Detractors
Short positions within health care were the largest cumulative detractors. Short positions in biotechnology holdings such as Sage Therapeutics and AveXis were the largest detractors within the industry. Sage’s stock surged after reporting positive results from two drug trials, while gene therapy company AveXis was acquired by Novartis during the period at a premium, which meant our short positions detracted. Within health care equipment and supplies, short positions in Insulet and ICU Medical were among the portfolio’s largest overall detractors. We have since exited the position. Although Insulet’s stock rose during the period, the company has poor factor model scores for quality, valuation, and sentiment, leading us to a short position. ICU Medical scores poorly for valuation.
Positioning within real estate also negatively affected the portfolio. Long and short positions within the real estate management and development and equity real estate investment trusts (REITs) industries detracted. The largest detractor within the sector was a short position within Rayonier, an equity REIT manager, whose stock rose throughout the period on strength in timber and construction materials.
Portfolio Positioning
Our disciplined, objective, and systematic investment strategy is designed to take advantage of opportunities at the individual company level, in both the long and short portions of the portfolio. We believe this approach is the most powerful way to capitalize on market inefficiencies that lead to the mispricing of individual stocks. These bottom-up stock decisions collectively point toward long and short allocations to broader industries and sectors. At period-end, we have long positions in consumer discretionary, information technology, and materials holdings as we continue to see investment opportunities that offer the potential for gains across multiple measures of our stock-selection model in these sectors. In consumer discretionary, we believe consumer services is a key area of opportunity. In information technology, technology hardware and semiconductors are areas of particular interest. Large-cap technology stocks have been rewarded with price appreciation for their innovation, ingenuity, and growth. With high growth stocks occupying much of center stage the last few years, we believe it is important not to lose sight of valuations. As reflected in our model, on the long side, we want to look for growing, quality companies with lower valuations. It is our impression that these stocks have the best chance of outperforming over the long term. Conversely, our largest net short positions at period-end were in utilities and financials. Utilities stocks score poorly across multiple dimensions of our model. Specifically, we see opportunity for profit in water and electric utilities. In financials, we see diversified financials and insurance as areas of opportunity for short positions.
|
| |
| JUNE 30, 2018 |
| Top Ten Long Holdings | % of net assets |
| PotlatchDeltic Corp. | 0.96% |
| Southwestern Energy Co. | 0.95% |
| WR Grace & Co. | 0.94% |
| Evercore, Inc., Class A | 0.93% |
| Assurant, Inc. | 0.91% |
| Forest City Realty Trust, Inc., Class A | 0.91% |
| Edgewell Personal Care Co. | 0.90% |
| Whitehaven Coal Ltd. | 0.90% |
| Grand Canyon Education, Inc. | 0.90% |
| Robert Half International, Inc. | 0.90% |
| | |
| Top Ten Short Holdings | % of net assets |
| NIKE, Inc., Class B | (1.01)% |
| Core-Mark Holding Co., Inc. | (0.96)% |
| United Bankshares, Inc. | (0.96)% |
| Gartner, Inc. | (0.95)% |
| Sterling Bancorp | (0.95)% |
| WR Berkley Corp. | (0.94)% |
| Ecolab, Inc. | (0.93)% |
| Leggett & Platt, Inc. | (0.93)% |
| Zayo Group Holdings, Inc. | (0.92)% |
| Healthcare Services Group, Inc. | (0.91)% |
| | |
| Types of Investments in Portfolio | % of net assets |
| Domestic Common Stocks | 76.2% |
| Foreign Common Stocks* | 17.8% |
| Domestic Common Stocks Sold Short | (76.9)% |
| Foreign Common Stocks Sold Short* | (16.8)% |
| Temporary Cash Investments | 4.5% |
| Other Assets and Liabilities | 95.2%** |
*Includes depositary shares, dual listed securities and foreign ordinary shares.
**Amount relates primarily to deposits for securities sold short at period end.
Fund shareholders may incur two types of costs: (1) transaction costs, including sales charges (loads) on purchase payments and redemption/exchange fees; and (2) ongoing costs, including management fees; distribution and service (12b-1) fees; and other fund expenses. This example is intended to help you understand your ongoing costs (in dollars) of investing in your fund and to compare these costs with the ongoing cost of investing in other mutual funds.
The example is based on an investment of $1,000 made at the beginning of the period and held for the entire period from January 1, 2018 to June 30, 2018.
Actual Expenses
The table provides information about actual account values and actual expenses for each class. You may use the information, together with the amount you invested, to estimate the expenses that you paid over the period. First, identify the share class you own. Then simply divide your account value by $1,000 (for example, an $8,600 account value divided by $1,000 = 8.6), then multiply the result by the number under the heading “Expenses Paid During Period” to estimate the expenses you paid on your account during this period.
If you hold Investor Class shares of any American Century Investments fund, or I Class shares of the American Century Diversified Bond Fund, in an American Century Investments account (i.e., not a financial intermediary or retirement plan account), American Century Investments may charge you a $12.50 semiannual account maintenance fee if the value of those shares is less than $10,000. We will redeem shares automatically in one of your accounts to pay the $12.50 fee. In determining your total eligible investment amount, we will include your investments in all personal accounts (including American Century Investments Brokerage accounts) registered under your Social Security number. Personal accounts include individual accounts, joint accounts, UGMA/UTMA accounts, personal trusts, Coverdell Education Savings Accounts and IRAs (including traditional, Roth, Rollover, SEP-, SARSEP- and SIMPLE-IRAs), and certain other retirement accounts. If you have only business, business retirement, employer-sponsored or American Century Investments Brokerage accounts, you are currently not subject to this fee. If you are subject to the Account Maintenance Fee, your account value could be reduced by the fee amount.
Hypothetical Example for Comparison Purposes
The table also provides information about hypothetical account values and hypothetical expenses based on the actual expense ratio of each class of your fund and an assumed rate of return of 5% per year before expenses, which is not the actual return of a fund’s share class. The hypothetical account values and expenses may not be used to estimate the actual ending account balance or expenses you paid for the period. You may use this information to compare the ongoing costs of investing in your fund and other funds. To do so, compare this 5% hypothetical example with the 5% hypothetical examples that appear in the shareholder reports of the other funds.
Please note that the expenses shown in the table are meant to highlight your ongoing costs only and do not reflect any transactional costs, such as sales charges (loads) or redemption/exchange fees. Therefore, the table is useful in comparing ongoing costs only, and will not help you determine the relative total costs of owning different funds. In addition, if these transactional costs were included, your costs would have been higher.
|
| | | | |
| | Beginning
Account Value
1/1/18 | Ending
Account Value
6/30/18 | Expenses Paid
During Period(1)
1/1/18 - 6/30/18 | Annualized
Expense Ratio(1) |
| Actual | | | | |
| Investor Class | $1,000 | $1,007.10 | $15.38 | 3.09% |
| I Class | $1,000 | $1,008.70 | $14.39 | 2.89% |
| Y Class | $1,000 | $1,008.70 | $14.14 | 2.84% |
| A Class | $1,000 | $1,005.50 | $16.61 | 3.34% |
| C Class | $1,000 | $1,002.00 | $20.30 | 4.09% |
| R Class | $1,000 | $1,004.70 | $17.84 | 3.59% |
| R5 Class | $1,000 | $1,007.80 | $14.39 | 2.89% |
| Hypothetical | | | | |
| Investor Class | $1,000 | $1,009.47 | $15.40 | 3.09% |
| I Class | $1,000 | $1,010.46 | $14.41 | 2.89% |
| Y Class | $1,000 | $1,010.71 | $14.16 | 2.84% |
| A Class | $1,000 | $1,008.23 | $16.63 | 3.34% |
| C Class | $1,000 | $1,004.51 | $20.33 | 4.09% |
| R Class | $1,000 | $1,006.99 | $17.86 | 3.59% |
| R5 Class | $1,000 | $1,010.46 | $14.41 | 2.89% |
| |
| (1) | Expenses are equal to the class's annualized expense ratio listed in the table above, multiplied by the average account value over the period, multiplied by 181, the number of days in the most recent fiscal half-year, divided by 365, to reflect the one-half year period. Annualized expense ratio reflects actual expenses, including any applicable fee waivers or expense reimbursements and excluding any acquired fund fees and expenses. |
JUNE 30, 2018
|
| | | | | |
| | Shares | Value |
| COMMON STOCKS — 94.0% | | |
| Aerospace and Defense — 2.7% | | |
| Boeing Co. (The) | 1,002 |
| $ | 336,181 |
|
| Curtiss-Wright Corp. | 4,230 |
| 503,455 |
|
| General Dynamics Corp. | 3,004 |
| 559,976 |
|
| Lockheed Martin Corp. | 842 |
| 248,752 |
|
| Textron, Inc. | 6,275 |
| 413,585 |
|
| | | 2,061,949 |
|
| Air Freight and Logistics — 0.7% | | |
| Royal Mail plc | 82,750 |
| 551,944 |
|
| Airlines — 1.2% | | |
| Deutsche Lufthansa AG | 16,370 |
| 393,808 |
|
| International Consolidated Airlines Group SA | 64,249 |
| 564,375 |
|
| | | 958,183 |
|
| Auto Components — 1.1% | | |
| TS Tech Co. Ltd. | 3,700 |
| 154,564 |
|
Visteon Corp.(1)(2) | 5,135 |
| 663,647 |
|
| | | 818,211 |
|
| Automobiles — 0.6% | | |
| Peugeot SA | 19,188 |
| 438,296 |
|
| Banks — 7.0% | | |
Bank of America Corp.(1) | 24,564 |
| 692,459 |
|
| BB&T Corp. | 3,269 |
| 164,888 |
|
Fifth Third Bancorp(1) | 22,677 |
| 650,830 |
|
First Citizens BancShares, Inc., Class A(1) | 1,404 |
| 566,233 |
|
First Hawaiian, Inc.(1) | 21,858 |
| 634,319 |
|
| Huntington Bancshares, Inc. | 13,873 |
| 204,766 |
|
JPMorgan Chase & Co.(1) | 6,532 |
| 680,635 |
|
| Regions Financial Corp. | 12,030 |
| 213,893 |
|
SunTrust Banks, Inc.(1) | 9,210 |
| 608,044 |
|
U.S. Bancorp(1) | 12,629 |
| 631,703 |
|
| United Overseas Bank Ltd. | 19,247 |
| 378,018 |
|
| | | 5,425,788 |
|
| Beverages — 0.7% | | |
| Molson Coors Brewing Co., Class B | 8,316 |
| 565,821 |
|
| Biotechnology — 1.2% | | |
Alexion Pharmaceuticals, Inc.(2) | 1,567 |
| 194,543 |
|
| Amgen, Inc. | 977 |
| 180,344 |
|
Biogen, Inc.(2) | 615 |
| 178,498 |
|
Celgene Corp.(2) | 2,384 |
| 189,337 |
|
Regeneron Pharmaceuticals, Inc.(2) | 533 |
| 183,880 |
|
| | | 926,602 |
|
|
| | | | | |
| | Shares | Value |
| Building Products — 0.1% | | |
Trex Co., Inc.(2) | 1,550 |
| $ | 97,015 |
|
| Capital Markets — 2.9% | | |
| Affiliated Managers Group, Inc. | 3,809 |
| 566,284 |
|
Evercore, Inc., Class A(1) | 6,858 |
| 723,176 |
|
| Federated Investors, Inc., Class B | 10,431 |
| 243,251 |
|
| Investec plc | 68,160 |
| 483,954 |
|
MSCI, Inc.(1) | 580 |
| 95,949 |
|
| SEI Investments Co. | 1,889 |
| 118,100 |
|
| | | 2,230,714 |
|
| Chemicals — 3.3% | | |
| Chemours Co. (The) | 4,752 |
| 210,799 |
|
| Covestro AG | 2,300 |
| 205,259 |
|
| Eastman Chemical Co. | 5,584 |
| 558,177 |
|
| Scotts Miracle-Gro Co. (The) | 3,205 |
| 266,528 |
|
| Tokuyama Corp. | 18,300 |
| 587,603 |
|
WR Grace & Co.(1) | 9,952 |
| 729,581 |
|
| | | 2,557,947 |
|
| Commercial Services and Supplies — 2.3% | | |
| Herman Miller, Inc. | 18,296 |
| 620,235 |
|
MSA Safety, Inc.(1) | 6,053 |
| 583,146 |
|
| Pitney Bowes, Inc. | 66,560 |
| 570,419 |
|
| | | 1,773,800 |
|
| Communications Equipment — 1.5% | | |
ARRIS International plc(2) | 11,262 |
| 275,300 |
|
Ciena Corp.(2) | 10,814 |
| 286,679 |
|
F5 Networks, Inc.(1)(2) | 3,587 |
| 618,578 |
|
| | | 1,180,557 |
|
| Construction and Engineering — 0.8% | | |
| EMCOR Group, Inc. | 6,619 |
| 504,235 |
|
Fomento de Construcciones y Contratas SA(2) | 10,536 |
| 132,883 |
|
| | | 637,118 |
|
| Consumer Finance — 2.2% | | |
| American Express Co. | 4,138 |
| 405,524 |
|
| Discover Financial Services | 1,459 |
| 102,728 |
|
OneMain Holdings, Inc.(1)(2) | 18,049 |
| 600,851 |
|
| Synchrony Financial | 17,629 |
| 588,456 |
|
| | | 1,697,559 |
|
| Containers and Packaging — 0.4% | | |
Berry Global Group, Inc.(2) | 6,185 |
| 284,139 |
|
| Diversified Consumer Services — 2.4% | | |
Adtalem Global Education, Inc.(1)(2) | 12,950 |
| 622,895 |
|
| Graham Holdings Co., Class B | 989 |
| 579,653 |
|
Grand Canyon Education, Inc.(1)(2) | 6,251 |
| 697,674 |
|
| | | 1,900,222 |
|
| Diversified Telecommunication Services — 0.6% | | |
| Telenor ASA | 23,504 |
| 482,383 |
|
|
| | | | | |
| | Shares | Value |
| Electric Utilities — 0.6% | | |
| Portland General Electric Co. | 10,892 |
| $ | 465,742 |
|
| Electronic Equipment, Instruments and Components — 1.0% | | |
Coherent, Inc.(2) | 478 |
| 74,769 |
|
| Jabil, Inc. | 17,243 |
| 476,941 |
|
Zebra Technologies Corp., Class A(2) | 1,473 |
| 211,007 |
|
| | | 762,717 |
|
| Energy Equipment and Services — 1.3% | | |
Diamond Offshore Drilling, Inc.(2) | 21,126 |
| 440,688 |
|
Halliburton Co.(1) | 13,063 |
| 588,619 |
|
| | | 1,029,307 |
|
| Equity Real Estate Investment Trusts (REITs) — 5.1% | | |
| CoreCivic, Inc. | 3,414 |
| 81,561 |
|
Forest City Realty Trust, Inc., Class A(1) | 31,007 |
| 707,270 |
|
| Park Hotels & Resorts, Inc. | 19,662 |
| 602,247 |
|
PotlatchDeltic Corp.(1) | 14,721 |
| 748,563 |
|
| PS Business Parks, Inc. | 2,924 |
| 375,734 |
|
| Segro plc | 52,115 |
| 460,405 |
|
| Select Income REIT | 19,375 |
| 435,356 |
|
| Weingarten Realty Investors | 19,046 |
| 586,807 |
|
| | | 3,997,943 |
|
| Food and Staples Retailing — 0.7% | | |
| cocokara fine, Inc. | 9,200 |
| 565,885 |
|
| Food Products — 0.7% | | |
a2 Milk Co. Ltd.(2) | 11,907 |
| 92,420 |
|
Health and Happiness H&H International Holdings Ltd.(2) | 65,500 |
| 451,661 |
|
| | | 544,081 |
|
| Health Care Equipment and Supplies — 2.8% | | |
Edwards Lifesciences Corp.(2) | 1,794 |
| 261,153 |
|
Globus Medical, Inc., Class A(1)(2) | 11,884 |
| 599,667 |
|
| Hill-Rom Holdings, Inc. | 6,858 |
| 598,978 |
|
| STERIS plc | 2,814 |
| 295,498 |
|
Varian Medical Systems, Inc.(2) | 3,845 |
| 437,253 |
|
| | | 2,192,549 |
|
| Health Care Providers and Services — 1.7% | | |
| Cigna Corp. | 1,810 |
| 307,609 |
|
Express Scripts Holding Co.(2) | 6,928 |
| 534,911 |
|
| UnitedHealth Group, Inc. | 1,855 |
| 455,106 |
|
| | | 1,297,626 |
|
| Health Care Technology — 0.8% | | |
Cerner Corp.(1)(2) | 10,551 |
| 630,844 |
|
| Hotels, Restaurants and Leisure — 2.6% | | |
| Choice Hotels International, Inc. | 7,609 |
| 575,240 |
|
Las Vegas Sands Corp.(1) | 7,864 |
| 600,495 |
|
| Sands China Ltd. | 89,200 |
| 476,948 |
|
| Wyndham Destinations, Inc. | 2,088 |
| 92,436 |
|
|
| | | | | |
| | Shares | Value |
| Wynn Resorts Ltd. | 1,734 |
| $ | 290,167 |
|
| | | 2,035,286 |
|
| Household Durables — 1.3% | | |
| KB Home | 16,003 |
| 435,922 |
|
| PulteGroup, Inc. | 1,703 |
| 48,961 |
|
| Toll Brothers, Inc. | 14,095 |
| 521,374 |
|
| | | 1,006,257 |
|
| Household Products — 0.8% | | |
| Kimberly-Clark Corp. | 5,902 |
| 621,717 |
|
| Independent Power and Renewable Electricity Producers — 0.9% | |
| AES Corp. | 48,301 |
| 647,717 |
|
| NRG Energy, Inc. | 2,483 |
| 76,228 |
|
| | | 723,945 |
|
| Industrial Conglomerates — 0.8% | | |
| Honeywell International, Inc. | 4,101 |
| 590,749 |
|
| Insurance — 3.2% | | |
Assurant, Inc.(1) | 6,870 |
| 710,976 |
|
| First American Financial Corp. | 11,281 |
| 583,453 |
|
| Hartford Financial Services Group, Inc. (The) | 11,483 |
| 587,126 |
|
Torchmark Corp.(1) | 7,128 |
| 580,291 |
|
| | | 2,461,846 |
|
| Internet and Direct Marketing Retail — 0.2% | | |
Amazon.com, Inc.(2) | 50 |
| 84,990 |
|
Groupon, Inc.(2) | 18,607 |
| 80,010 |
|
| | | 165,000 |
|
| Internet Software and Services — 1.7% | | |
Alphabet, Inc., Class A(2) | 569 |
| 642,509 |
|
Facebook, Inc., Class A(2) | 2,421 |
| 470,449 |
|
| LogMeIn, Inc. | 1,716 |
| 177,177 |
|
| | | 1,290,135 |
|
| IT Services — 1.4% | | |
Acxiom Corp.(2) | 20,712 |
| 620,325 |
|
| Total System Services, Inc. | 5,127 |
| 433,334 |
|
| | | 1,053,659 |
|
| Leisure Products — 0.8% | | |
| Sega Sammy Holdings, Inc. | 37,700 |
| 646,295 |
|
| Machinery — 3.7% | | |
Allison Transmission Holdings, Inc.(1) | 14,089 |
| 570,464 |
|
| Ingersoll-Rand plc | 7,155 |
| 642,018 |
|
| Oshkosh Corp. | 7,880 |
| 554,122 |
|
| Pentair plc | 6,487 |
| 272,973 |
|
Terex Corp.(1) | 16,437 |
| 693,477 |
|
| Wacker Neuson SE | 5,218 |
| 132,596 |
|
| | | 2,865,650 |
|
| Media — 0.6% | | |
| ProSiebenSat.1 Media SE | 13,776 |
| 349,584 |
|
|
| | | | | |
| | Shares | Value |
| Walt Disney Co. (The) | 742 |
| $ | 77,769 |
|
| | | 427,353 |
|
| Metals and Mining — 1.8% | | |
| Anglo American plc | 2,073 |
| 46,367 |
|
| Antofagasta plc | 43,317 |
| 565,960 |
|
| Iluka Resources Ltd. | 27,537 |
| 227,834 |
|
| St. Barbara Ltd. | 164,039 |
| 586,348 |
|
| | | 1,426,509 |
|
| Multiline Retail — 0.4% | | |
| Next plc | 3,457 |
| 276,024 |
|
| Oil, Gas and Consumable Fuels — 6.6% | | |
| Aker BP ASA | 16,510 |
| 609,773 |
|
Chesapeake Energy Corp.(2) | 24,444 |
| 128,087 |
|
| Chevron Corp. | 2,263 |
| 286,111 |
|
| ConocoPhillips | 3,618 |
| 251,885 |
|
Continental Resources, Inc.(2) | 6,201 |
| 401,577 |
|
| Gaztransport Et Technigaz SA | 6,030 |
| 369,696 |
|
| HollyFrontier Corp. | 6,382 |
| 436,720 |
|
PBF Energy, Inc., Class A(1) | 15,565 |
| 652,640 |
|
| Plains GP Holdings LP, Class A | 24,383 |
| 582,998 |
|
Southwestern Energy Co.(1)(2) | 139,544 |
| 739,583 |
|
| Whitehaven Coal Ltd. | 163,291 |
| 698,476 |
|
| | | 5,157,546 |
|
| Paper and Forest Products — 1.5% | | |
| Louisiana-Pacific Corp. | 21,383 |
| 582,045 |
|
| UPM-Kymmene Oyj | 15,978 |
| 571,342 |
|
| | | 1,153,387 |
|
| Personal Products — 1.8% | | |
Edgewell Personal Care Co.(1)(2) | 13,858 |
| 699,275 |
|
Nu Skin Enterprises, Inc., Class A(1) | 8,503 |
| 664,849 |
|
| | | 1,364,124 |
|
| Pharmaceuticals — 1.6% | | |
| Allergan plc | 1,137 |
| 189,561 |
|
| Astellas Pharma, Inc. | 12,400 |
| 189,167 |
|
| GlaxoSmithKline plc | 9,317 |
| 188,106 |
|
| H Lundbeck A/S | 2,717 |
| 190,958 |
|
Horizon Pharma plc(2) | 11,358 |
| 188,088 |
|
Indivior plc(2) | 27,951 |
| 141,356 |
|
| Roche Holding AG | 831 |
| 185,072 |
|
| | | 1,272,308 |
|
| Professional Services — 2.5% | | |
ASGN, Inc.(1)(2) | 8,079 |
| 631,697 |
|
Dun & Bradstreet Corp. (The)(1) | 5,183 |
| 635,695 |
|
Robert Half International, Inc.(1) | 10,712 |
| 697,351 |
|
| | | 1,964,743 |
|
| Real Estate Management and Development — 0.3% | | |
| Jones Lang LaSalle, Inc. | 1,530 |
| 253,965 |
|
|
| | | | | |
| | Shares | Value |
| Road and Rail — 0.7% | | |
| National Express Group plc | 109,294 |
| $ | 579,271 |
|
| Semiconductors and Semiconductor Equipment — 1.4% | | |
Advanced Energy Industries, Inc.(2) | 1,059 |
| 61,517 |
|
| Applied Materials, Inc. | 9,109 |
| 420,745 |
|
Cirrus Logic, Inc.(2) | 2,278 |
| 87,316 |
|
| MKS Instruments, Inc. | 5,288 |
| 506,062 |
|
| Skyworks Solutions, Inc. | 494 |
| 47,745 |
|
| | | 1,123,385 |
|
| Software — 2.8% | | |
Aspen Technology, Inc.(2) | 5,855 |
| 542,993 |
|
Cadence Design Systems, Inc.(2) | 14,554 |
| 630,334 |
|
Electronic Arts, Inc.(2) | 2,073 |
| 292,334 |
|
Synopsys, Inc.(2) | 6,816 |
| 583,245 |
|
Verint Systems, Inc.(2) | 3,458 |
| 153,362 |
|
| | | 2,202,268 |
|
| Specialty Retail — 2.2% | | |
AutoZone, Inc.(2) | 869 |
| 583,038 |
|
Sally Beauty Holdings, Inc.(2) | 40,530 |
| 649,696 |
|
| Signet Jewelers Ltd. | 8,391 |
| 467,798 |
|
| | | 1,700,532 |
|
| Technology Hardware, Storage and Peripherals — 0.7% | | |
| Toshiba TEC Corp. | 69,000 |
| 420,675 |
|
| Western Digital Corp. | 1,857 |
| 143,750 |
|
| | | 564,425 |
|
| Textiles, Apparel and Luxury Goods — 2.2% | | |
Deckers Outdoor Corp.(1)(2) | 5,071 |
| 572,465 |
|
| HUGO BOSS AG | 4,688 |
| 425,708 |
|
Michael Kors Holdings Ltd.(2) | 10,421 |
| 694,039 |
|
| | | 1,692,212 |
|
| Thrifts and Mortgage Finance — 0.5% | | |
Essent Group Ltd.(2) | 10,748 |
| 384,993 |
|
| Trading Companies and Distributors — 1.8% | | |
HD Supply Holdings, Inc.(2) | 12,521 |
| 537,026 |
|
| MSC Industrial Direct Co., Inc., Class A | 2,658 |
| 225,531 |
|
United Rentals, Inc.(1)(2) | 4,057 |
| 598,894 |
|
| | | 1,361,451 |
|
| Wireless Telecommunication Services — 0.8% | | |
T-Mobile US, Inc.(2) | 10,355 |
| 618,711 |
|
TOTAL COMMON STOCKS
(Cost $67,336,479) | | 73,058,688 |
|
| TEMPORARY CASH INVESTMENTS — 4.5% | | |
| Repurchase Agreement, BMO Capital Markets Corp., (collateralized by various U.S. Treasury obligations, 1.375% - 3.75%, 2/15/19 - 11/15/47, valued at $1,951,242), in a joint trading account at 1.75%, dated 6/29/18, due 7/2/18 (Delivery value $1,912,130) | | 1,911,851 |
|
| Repurchase Agreement, Fixed Income Clearing Corp., (collateralized by various U.S. Treasury obligations, 2.75%, 2/15/28, valued at $1,627,356), at 0.90%, dated 6/29/18, due 7/2/18 (Delivery value $1,593,119) | | 1,593,000 |
|
|
| | | | | |
| | Shares | Value |
| State Street Institutional U.S. Government Money Market Fund, Premier Class | 5,398 |
| $ | 5,398 |
|
TOTAL TEMPORARY CASH INVESTMENTS
(Cost $3,510,249) | | 3,510,249 |
|
TOTAL INVESTMENT SECURITIES BEFORE SECURITIES SOLD SHORT — 98.5%
(Cost $70,846,728) | 76,568,937 |
|
| COMMON STOCKS SOLD SHORT — (93.7)% | | |
| Aerospace and Defense — (0.7)% | | |
| BWX Technologies, Inc. | (8,717 | ) | (543,243 | ) |
| Airlines — (1.3)% | | |
| Allegiant Travel Co. | (4,242 | ) | (589,426 | ) |
| Spirit Airlines, Inc. | (11,308 | ) | (411,046 | ) |
| | | (1,000,472 | ) |
| Auto Components — (0.8)% | | |
| Adient plc | (11,764 | ) | (578,671 | ) |
| Goodyear Tire & Rubber Co. (The) | (1,561 | ) | (36,356 | ) |
| | | (615,027 | ) |
| Banks — (5.9)% | | |
| Bankia SA | (143,018 | ) | (535,622 | ) |
| Columbia Banking System, Inc. | (3,236 | ) | (132,352 | ) |
| First Financial Bancorp | (6,510 | ) | (199,532 | ) |
| Hancock Whitney Corp. | (919 | ) | (42,871 | ) |
| Home BancShares, Inc. | (29,727 | ) | (670,641 | ) |
| Pinnacle Financial Partners, Inc. | (11,101 | ) | (681,046 | ) |
| Simmons First National Corp., Class A | (6,811 | ) | (203,649 | ) |
| Sterling Bancorp | (31,357 | ) | (736,890 | ) |
| Texas Capital Bancshares, Inc. | (5,904 | ) | (540,216 | ) |
| Union Bankshares Corp. | (3,072 | ) | (119,439 | ) |
| United Bankshares, Inc. | (20,460 | ) | (744,744 | ) |
| | | (4,607,002 | ) |
| Biotechnology — (1.9)% | | |
| Alnylam Pharmaceuticals, Inc. | (1,818 | ) | (179,055 | ) |
| Bluebird Bio, Inc. | (1,084 | ) | (170,134 | ) |
| Blueprint Medicines Corp. | (3,160 | ) | (200,597 | ) |
| Global Blood Therapeutics, Inc. | (4,066 | ) | (183,783 | ) |
| Immunomedics, Inc. | (8,030 | ) | (190,070 | ) |
| Neurocrine Biosciences, Inc. | (733 | ) | (72,010 | ) |
| Sage Therapeutics, Inc. | (1,047 | ) | (163,887 | ) |
| Sarepta Therapeutics, Inc. | (1,269 | ) | (167,736 | ) |
| Spark Therapeutics, Inc. | (1,757 | ) | (145,409 | ) |
| | | (1,472,681 | ) |
| Building Products — (0.7)% | | |
| Tarkett SA | (19,731 | ) | (568,673 | ) |
| Capital Markets — (3.6)% | | |
| Bank of New York Mellon Corp. (The) | (6,546 | ) | (353,026 | ) |
| Brookfield Asset Management, Inc., Class A | (15,445 | ) | (626,140 | ) |
| Charles Schwab Corp. (The) | (11,528 | ) | (589,081 | ) |
| Eaton Vance Corp. | (13,292 | ) | (693,710 | ) |
|
| | | | | |
| | Shares | Value |
| T Rowe Price Group, Inc. | (4,703 | ) | $ | (545,971 | ) |
| | | (2,807,928 | ) |
| Chemicals — (3.8)% | | |
| Albemarle Corp. | (892 | ) | (84,142 | ) |
| Ecolab, Inc. | (5,150 | ) | (722,700 | ) |
| HB Fuller Co. | (10,545 | ) | (566,056 | ) |
| Mosaic Co. (The) | (20,725 | ) | (581,336 | ) |
| Valvoline, Inc. | (28,481 | ) | (614,335 | ) |
| Yara International ASA | (9,383 | ) | (385,488 | ) |
| | | (2,954,057 | ) |
| Commercial Services and Supplies — (2.7)% | | |
| Cimpress NV | (1,867 | ) | (270,641 | ) |
| Covanta Holding Corp. | (39,500 | ) | (651,750 | ) |
| Elis SA | (21,703 | ) | (497,771 | ) |
| Healthcare Services Group, Inc. | (16,406 | ) | (708,575 | ) |
| | | (2,128,737 | ) |
| Communications Equipment — (0.1)% | | |
| EchoStar Corp., Class A | (1,832 | ) | (81,341 | ) |
| Construction and Engineering — (2.8)% | | |
| Fluor Corp. | (12,251 | ) | (597,604 | ) |
| JGC Corp. | (22,800 | ) | (459,851 | ) |
| MasTec, Inc. | (5,002 | ) | (253,852 | ) |
| Skanska AB, B Shares | (12,809 | ) | (226,169 | ) |
| Valmont Industries, Inc. | (4,247 | ) | (640,235 | ) |
| | | (2,177,711 | ) |
| Consumer Finance — (1.6)% | | |
| Capital One Financial Corp. | (7,090 | ) | (651,571 | ) |
| SLM Corp. | (52,946 | ) | (606,232 | ) |
| | | (1,257,803 | ) |
| Distributors — (1.0)% | | |
| Core-Mark Holding Co., Inc. | (32,902 | ) | (746,875 | ) |
| Diversified Consumer Services — (0.4)% | | |
| Bright Horizons Family Solutions, Inc. | (523 | ) | (53,618 | ) |
| Service Corp., International | (8,162 | ) | (292,118 | ) |
| | | (345,736 | ) |
| Diversified Financial Services — (0.7)% | | |
| Berkshire Hathaway, Inc., Class B | (3,103 | ) | (579,175 | ) |
| Diversified Telecommunication Services — (1.2)% | | |
| Cellnex Telecom SA | (7,598 | ) | (191,656 | ) |
| Zayo Group Holdings, Inc. | (19,679 | ) | (717,890 | ) |
| | | (909,546 | ) |
| Electric Utilities — (2.1)% | | |
| Alliant Energy Corp. | (16,256 | ) | (687,954 | ) |
| Duke Energy Corp. | (4,874 | ) | (385,436 | ) |
| Eversource Energy | (10,183 | ) | (596,825 | ) |
| | | (1,670,215 | ) |
|
| | | | | |
| | Shares | Value |
| Electronic Equipment, Instruments and Components — (1.0)% | | |
| II-VI, Inc. | (15,016 | ) | $ | (652,445 | ) |
| IPG Photonics Corp. | (557 | ) | (122,891 | ) |
| | | (775,336 | ) |
| Energy Equipment and Services — (0.7)% | | |
| Tenaris SA | (27,868 | ) | (511,433 | ) |
| Equity Real Estate Investment Trusts (REITs) — (3.1)% | | |
| Crown Castle International Corp. | (5,951 | ) | (641,637 | ) |
| Duke Realty Corp. | (22,203 | ) | (644,553 | ) |
| Equinix, Inc. | (1,577 | ) | (677,937 | ) |
| Iron Mountain, Inc. | (9,021 | ) | (315,825 | ) |
| Rayonier, Inc. | (3,309 | ) | (128,025 | ) |
| Regency Centers Corp. | (624 | ) | (38,738 | ) |
| | | (2,446,715 | ) |
| Food and Staples Retailing — (1.7)% | | |
| Casey's General Stores, Inc. | (6,048 | ) | (635,524 | ) |
| PriceSmart, Inc. | (7,338 | ) | (664,089 | ) |
| | | (1,299,613 | ) |
| Food Products — (2.7)% | | |
| Archer-Daniels-Midland Co. | (9,143 | ) | (419,024 | ) |
| Darling Ingredients, Inc. | (22,638 | ) | (450,043 | ) |
| Kraft Heinz Co. (The) | (10,712 | ) | (672,928 | ) |
| Schouw & Co. A/S | (6,541 | ) | (577,724 | ) |
| | | (2,119,719 | ) |
| Health Care Equipment and Supplies — (2.6)% | | |
| Avanos Medical, Inc. | (9,674 | ) | (553,836 | ) |
| Becton Dickinson and Co. | (1,601 | ) | (383,536 | ) |
| Insulet Corp. | (5,830 | ) | (499,631 | ) |
| Integra LifeSciences Holdings Corp. | (9,419 | ) | (606,678 | ) |
| | | (2,043,681 | ) |
| Health Care Providers and Services — (2.8)% | | |
| Henry Schein, Inc. | (7,883 | ) | (572,621 | ) |
| LifePoint Health, Inc. | (13,459 | ) | (656,799 | ) |
| NMC Health plc | (5,498 | ) | (259,910 | ) |
| Orpea | (2,892 | ) | (386,023 | ) |
| RHOEN-KLINIKUM AG | (6,151 | ) | (179,435 | ) |
| Ryman Healthcare Ltd. | (11,692 | ) | (94,790 | ) |
| | | (2,149,578 | ) |
| Hotels, Restaurants and Leisure — (1.7)% | | |
| ILG, Inc. | (6,067 | ) | (200,393 | ) |
| Planet Fitness, Inc., Class A | (15,719 | ) | (690,693 | ) |
| Restaurant Brands International, Inc. | (3,337 | ) | (201,221 | ) |
| Starbucks Corp. | (4,365 | ) | (213,230 | ) |
| | | (1,305,537 | ) |
| Household Durables — (2.3)% | | |
| Iida Group Holdings Co. Ltd. | (24,400 | ) | (470,964 | ) |
| Leggett & Platt, Inc. | (16,176 | ) | (722,097 | ) |
|
| | | | | |
| | Shares | Value |
| Mohawk Industries, Inc. | (2,814 | ) | $ | (602,956 | ) |
| | | (1,796,017 | ) |
| Independent Power and Renewable Electricity Producers — (0.1)% | |
| Ormat Technologies, Inc. | (1,313 | ) | (69,838 | ) |
| Insurance — (4.3)% | | |
| Alleghany Corp. | (109 | ) | (62,672 | ) |
| American International Group, Inc. | (8,288 | ) | (439,430 | ) |
| Arch Capital Group Ltd. | (5,400 | ) | (142,884 | ) |
| Aspen Insurance Holdings Ltd. | (4,928 | ) | (200,570 | ) |
| Enstar Group Ltd. | (2,058 | ) | (426,623 | ) |
| Markel Corp. | (118 | ) | (127,953 | ) |
| Marsh & McLennan Cos., Inc. | (6,914 | ) | (566,741 | ) |
| RLI Corp. | (9,708 | ) | (642,572 | ) |
| WR Berkley Corp. | (10,062 | ) | (728,589 | ) |
| | | (3,338,034 | ) |
| Internet and Direct Marketing Retail — (0.1)% | | |
| ASOS plc | (934 | ) | (75,216 | ) |
| Internet Software and Services — (0.8)% | | |
| 2U, Inc. | (7,424 | ) | (620,349 | ) |
| IT Services — (3.3)% | | |
| Gartner, Inc. | (5,581 | ) | (741,715 | ) |
| Genpact Ltd. | (15,601 | ) | (451,337 | ) |
| Global Payments, Inc. | (5,348 | ) | (596,249 | ) |
| WEX, Inc. | (869 | ) | (165,527 | ) |
| Worldpay, Inc., Class A | (7,448 | ) | (609,097 | ) |
| | | (2,563,925 | ) |
| Machinery — (3.7)% | | |
| CNH Industrial NV | (48,129 | ) | (506,798 | ) |
| Colfax Corp. | (18,564 | ) | (568,987 | ) |
| Flowserve Corp. | (3,532 | ) | (142,693 | ) |
| John Bean Technologies Corp. | (7,106 | ) | (631,723 | ) |
| Middleby Corp. (The) | (3,036 | ) | (317,019 | ) |
| Trinity Industries, Inc. | (19,660 | ) | (673,552 | ) |
| | | (2,840,772 | ) |
| Marine — (1.2)% | | |
| Mitsui OSK Lines Ltd. | (20,200 | ) | (486,778 | ) |
| Nippon Yusen KK | (22,200 | ) | (440,932 | ) |
| | | (927,710 | ) |
| Media — (2.6)% | | |
| Cinemark Holdings, Inc. | (17,253 | ) | (605,235 | ) |
| Entertainment One Ltd. | (50,388 | ) | (244,585 | ) |
| Live Nation Entertainment, Inc. | (2,301 | ) | (111,760 | ) |
| Loral Space & Communications, Inc. | (15,440 | ) | (580,544 | ) |
| New York Times Co. (The), Class A | (18,233 | ) | (472,235 | ) |
| | | (2,014,359 | ) |
| Metals and Mining — (2.3)% | | |
| Agnico Eagle Mines Ltd. | (6,480 | ) | (296,978 | ) |
|
| | | | | |
| | Shares | Value |
| AMG Advanced Metallurgical Group NV | (9,255 | ) | $ | (520,945 | ) |
| Dowa Holdings Co. Ltd. | (17,700 | ) | (545,956 | ) |
| New Gold, Inc. | (212,784 | ) | (442,591 | ) |
| | | (1,806,470 | ) |
| Mortgage Real Estate Investment Trusts (REITs) — (1.6)% | | |
| AGNC Investment Corp. | (32,205 | ) | (598,691 | ) |
| Starwood Property Trust, Inc. | (28,486 | ) | (618,431 | ) |
| | | (1,217,122 | ) |
| Multi-Utilities — (1.2)% | | |
| NiSource, Inc. | (11,449 | ) | (300,880 | ) |
| Sempra Energy | (5,601 | ) | (650,332 | ) |
| | | (951,212 | ) |
| Oil, Gas and Consumable Fuels — (6.6)% | | |
| Callon Petroleum Co. | (31,928 | ) | (342,907 | ) |
| Cheniere Energy, Inc. | (9,693 | ) | (631,887 | ) |
| Diamondback Energy, Inc. | (4,548 | ) | (598,380 | ) |
| Parsley Energy, Inc., Class A | (7,597 | ) | (230,037 | ) |
| PDC Energy, Inc. | (9,477 | ) | (572,884 | ) |
| RSP Permian, Inc. | (14,870 | ) | (654,577 | ) |
| SM Energy Co. | (25,604 | ) | (657,767 | ) |
| Targa Resources Corp. | (13,379 | ) | (662,127 | ) |
| Williams Cos., Inc. (The) | (6,793 | ) | (184,158 | ) |
| WPX Energy, Inc. | (31,859 | ) | (574,418 | ) |
| | | (5,109,142 | ) |
| Personal Products — (0.7)% | | |
| Coty, Inc., Class A | (38,820 | ) | (547,362 | ) |
| Pharmaceuticals — (0.2)% | | |
| Catalent, Inc. | (4,648 | ) | (194,705 | ) |
| Professional Services — (1.0)% | | |
| DKSH Holding AG | (2,460 | ) | (173,514 | ) |
| Verisk Analytics, Inc. | (5,722 | ) | (615,916 | ) |
| | | (789,430 | ) |
| Real Estate Management and Development — (1.5)% | | |
| Howard Hughes Corp. (The) | (4,711 | ) | (624,207 | ) |
| Kennedy-Wilson Holdings, Inc. | (27,312 | ) | (577,649 | ) |
| | | (1,201,856 | ) |
| Road and Rail — (0.9)% | | |
| Keikyu Corp. | (27,500 | ) | (451,068 | ) |
| Knight-Swift Transportation Holdings, Inc. | (6,219 | ) | (237,628 | ) |
| | | (688,696 | ) |
| Semiconductors and Semiconductor Equipment — (0.9)% | | |
| Cree, Inc. | (15,241 | ) | (633,569 | ) |
| Monolithic Power Systems, Inc. | (366 | ) | (48,923 | ) |
| | | (682,492 | ) |
| Software — (1.3)% | | |
| Autodesk, Inc. | (615 | ) | (80,620 | ) |
| Guidewire Software, Inc. | (1,058 | ) | (93,929 | ) |
|
| | | | | |
| | Shares | Value |
| HubSpot, Inc. | (2,083 | ) | $ | (261,208 | ) |
| Koei Tecmo Holdings Co. Ltd. | (30,200 | ) | (594,099 | ) |
| | | (1,029,856 | ) |
| Specialty Retail — (1.5)% | | |
| Monro, Inc. | (10,844 | ) | (630,036 | ) |
| Sports Direct International plc | (107,198 | ) | (565,050 | ) |
| | | (1,195,086 | ) |
| Textiles, Apparel and Luxury Goods — (1.0)% | | |
| NIKE, Inc., Class B | (9,897 | ) | (788,593 | ) |
| Thrifts and Mortgage Finance — (0.9)% | | |
| TFS Financial Corp. | (42,232 | ) | (665,999 | ) |
| Tobacco — (1.5)% | | |
| British American Tobacco plc | (11,569 | ) | (584,772 | ) |
| Philip Morris International, Inc. | (7,150 | ) | (577,291 | ) |
| | | (1,162,063 | ) |
| Trading Companies and Distributors — (2.1)% | | |
| Hanwa Co. Ltd. | (13,300 | ) | (507,542 | ) |
| NOW, Inc. | (42,603 | ) | (567,898 | ) |
| SiteOne Landscape Supply, Inc. | (6,192 | ) | (519,942 | ) |
| | | (1,595,382 | ) |
| Transportation Infrastructure — (1.4)% | | |
| Auckland International Airport Ltd. | (82,041 | ) | (376,740 | ) |
| Macquarie Infrastructure Corp. | (16,433 | ) | (693,472 | ) |
| | | (1,070,212 | ) |
| Water Utilities — (1.1)% | | |
| American Water Works Co., Inc. | (5,781 | ) | (493,582 | ) |
| Aqua America, Inc. | (9,433 | ) | (331,853 | ) |
| | | (825,435 | ) |
TOTAL COMMON STOCKS SOLD SHORT
(Proceeds $71,887,804) | | (72,885,167 | ) |
OTHER ASSETS AND LIABILITIES(3) — 95.2% | | 74,064,065 |
|
| TOTAL NET ASSETS — 100.0% | | $ | 77,747,835 |
|
|
| | |
| NOTES TO SCHEDULE OF INVESTMENTS |
| |
| (1) | Security, or a portion thereof, has been pledged at the custodian bank or with a broker for collateral requirements on securities sold short. At the period end, the aggregate value of securities pledged was $15,195,482. |
| |
| (3) | Amount relates primarily to deposits for securities sold short at period end. |
See Notes to Financial Statements.
|
|
| Statement of Assets and Liabilities |
|
| | | |
| JUNE 30, 2018 |
| Assets |
| Investment securities, at value (cost of $70,846,728) | $ | 76,568,937 |
|
| Foreign currency holdings, at value (cost of $26,771) | 26,684 |
|
| Deposits for securities sold short | 74,385,581 |
|
| Receivable for investments sold | 3,252,079 |
|
| Receivable for capital shares sold | 77,232 |
|
| Dividends and interest receivable | 165,829 |
|
| | 154,476,342 |
|
| | |
| Liabilities | |
| Securities sold short, at value (proceeds of $71,887,804) | 72,885,167 |
|
| Payable for investments purchased | 3,539,118 |
|
| Payable for capital shares redeemed | 131,307 |
|
| Accrued management fees | 84,204 |
|
| Distribution and service fees payable | 6,092 |
|
| Dividend expense payable on securities sold short | 82,619 |
|
| | 76,728,507 |
|
| | |
| Net Assets | $ | 77,747,835 |
|
| | |
| Net Assets Consist of: | |
| Capital (par value and paid-in surplus) | $ | 74,653,052 |
|
| Accumulated net investment loss | (141,802 | ) |
| Accumulated net realized loss | (1,487,562 | ) |
| Net unrealized appreciation | 4,724,147 |
|
| | $ | 77,747,835 |
|
|
| | | | | | |
| | Net Assets | Shares Outstanding | Net Asset Value Per Share |
| Investor Class, $0.01 Par Value |
| $36,777,571 |
| 3,253,522 |
| $11.30 |
| I Class, $0.01 Par Value |
| $28,914,266 |
| 2,499,662 |
| $11.57 |
| Y Class, $0.01 Par Value |
| $762,399 |
| 65,887 |
| $11.57 |
| A Class, $0.01 Par Value |
| $3,757,138 |
| 341,685 |
| $11.00* |
| C Class, $0.01 Par Value |
| $4,960,143 |
| 492,483 |
| $10.07 |
| R Class, $0.01 Par Value |
| $2,565,320 |
| 240,135 |
| $10.68 |
| R5 Class, $0.01 Par Value |
| $10,998 |
| 951 |
| $11.56 |
See Notes to Financial Statements.
|
| | | |
| YEAR ENDED JUNE 30, 2018 | |
| Investment Income (Loss) | |
| Income: | |
| Dividends (net of foreign taxes withheld of $26,193) | $ | 1,478,283 |
|
| Interest | 972,181 |
|
| | 2,450,464 |
|
| | |
| Expenses: | |
| Dividend expense on securities sold short | 1,741,807 |
|
| Management fees | 1,345,275 |
|
| Distribution and service fees: | |
| A Class | 10,348 |
|
| C Class | 46,017 |
|
| R Class | 14,859 |
|
| Directors' fees and expenses | 6,357 |
|
| Other expenses | 1,126 |
|
| | 3,165,789 |
|
| | |
| Net investment income (loss) | (715,325 | ) |
| | |
| Realized and Unrealized Gain (Loss) | |
| Net realized gain (loss) on: | |
| Investment transactions | 16,897,439 |
|
| Securities sold short transactions | (10,765,391 | ) |
| Foreign currency translation transactions | (7,586 | ) |
| | 6,124,462 |
|
| | |
| Change in net unrealized appreciation (depreciation) on: | |
| Investments | (3,367,052 | ) |
| Securities sold short | 272,963 |
|
| Translation of assets and liabilities in foreign currencies | (631 | ) |
| | (3,094,720 | ) |
| | |
| Net realized and unrealized gain (loss) | 3,029,742 |
|
| | |
| Net Increase (Decrease) in Net Assets Resulting from Operations | $ | 2,314,417 |
|
See Notes to Financial Statements.
|
|
| Statement of Changes in Net Assets |
|
| | | | | | |
| YEARS ENDED JUNE 30, 2018 AND JUNE 30, 2017 |
| Increase (Decrease) in Net Assets | June 30, 2018 | June 30, 2017 |
| Operations | | |
| Net investment income (loss) | $ | (715,325 | ) | $ | (1,552,826 | ) |
| Net realized gain (loss) | 6,124,462 |
| (1,334,874 | ) |
| Change in net unrealized appreciation (depreciation) | (3,094,720 | ) | 4,150,433 |
|
| Net increase (decrease) in net assets resulting from operations | 2,314,417 |
| 1,262,733 |
|
| | | |
| Capital Share Transactions | | |
| Net increase (decrease) in net assets from capital share transactions (Note 5) | (39,883,856 | ) | (7,010,183 | ) |
| | | |
| Net increase (decrease) in net assets | (37,569,439 | ) | (5,747,450 | ) |
| | | |
| Net Assets | | |
| Beginning of period | 115,317,274 |
| 121,064,724 |
|
| End of period | $ | 77,747,835 |
| $ | 115,317,274 |
|
| | | |
| Accumulated net investment loss | $ | (141,802 | ) | $ | (752,581 | ) |
See Notes to Financial Statements.
|
|
| Notes to Financial Statements |
JUNE 30, 2018
1. Organization
American Century Quantitative Equity Funds, Inc. (the corporation) is registered under the Investment Company Act of 1940, as amended (the 1940 Act), as an open-end management investment company and is organized as a Maryland corporation. AC Alternatives Equity Market Neutral Fund (the fund) is one fund in a series issued by the corporation. The fund’s investment objective is to seek capital appreciation independent of equity market conditions.
The fund offers the Investor Class, I Class, Y Class, A Class, C Class, R Class and R5 Class. The A Class may incur an initial sales charge. The A Class and C Class may be subject to a contingent deferred sales charge. Sale of the Y Class and R5 Class commenced on April 10, 2017.
2. Significant Accounting Policies
The following is a summary of significant accounting policies consistently followed by the fund in preparation of its financial statements. The fund is an investment company and follows accounting and reporting guidance in accordance with accounting principles generally accepted in the United States of America. This may require management to make certain estimates and assumptions at the date of the financial statements. Actual results could differ from these estimates. Management evaluated the impact of events or transactions occurring through the date the financial statements were issued that would merit recognition or disclosure.
Investment Valuations — The fund determines the fair value of its investments and computes its net asset value per share at the close of regular trading (usually 4 p.m. Eastern time) on the New York Stock Exchange (NYSE) on each day the NYSE is open. The Board of Directors has adopted valuation policies and procedures to guide the investment advisor in the fund’s investment valuation process and to provide methodologies for the oversight of the fund’s pricing function.
Equity securities that are listed or traded on a domestic securities exchange are valued at the last reported sales price or at the official closing price as provided by the exchange. Equity securities traded on foreign securities exchanges are generally valued at the closing price of such securities on the exchange where primarily traded or at the close of the NYSE, if that is earlier. If no last sales price is reported, or if local convention or regulation so provides, the mean of the latest bid and asked prices may be used. Securities traded over-the-counter are valued at the mean of the latest bid and asked prices, the last sales price, or the official closing price. Equity securities initially expressed in local currencies are translated into U.S. dollars at the mean of the appropriate currency exchange rate at the close of the NYSE as provided by an independent pricing service.
Open-end management investment companies are valued at the reported net asset value per share. Repurchase agreements are valued at cost, which approximates fair value.
If the fund determines that the market price for an investment is not readily available or the valuation methods mentioned above do not reflect an investment’s fair value, such investment is valued as determined in good faith by the Board of Directors or its delegate, in accordance with policies and procedures adopted by the Board of Directors. In its determination of fair value, the fund may review several factors including, but not limited to, market information regarding the specific investment or comparable investments and correlation with other investment types, futures indices or general market indicators. Circumstances that may cause the fund to use these procedures to value an investment include, but are not limited to: an investment has been declared in default or is distressed; trading in a security has been suspended during the trading day or a security is not actively trading on its principal exchange; prices received from a regular pricing source are deemed unreliable; or there is a foreign market holiday and no trading occurred.
The fund monitors for significant events occurring after the close of an investment’s primary exchange but before the fund’s net asset value per share is determined. Significant events may include, but are not limited to: corporate announcements and transactions; governmental action and political unrest that could impact a specific investment or an investment sector; or armed conflicts, natural disasters and similar events that could affect investments in a specific country or region. The fund also monitors for significant fluctuations between domestic and foreign markets, as evidenced by the U.S. market or such other indicators that the Board of Directors, or its delegate, deems appropriate. If significant fluctuations in foreign markets are identified, the
fund may apply a model-derived factor to the closing price of equity securities traded on foreign securities exchanges. The factor is based on observable market data as provided by an independent pricing service.
Security Transactions — Security transactions are accounted for as of the trade date. Net realized gains and losses are determined on the identified cost basis, which is also used for federal income tax purposes.
Investment Income — Dividend income less foreign taxes withheld, if any, is recorded as of the ex-dividend date. Distributions received on securities that represent a return of capital or long-term capital gain are recorded as a reduction of cost of investments and/or as a realized gain. The fund may estimate the components of distributions received that may be considered nontaxable distributions or long-term capital gain distributions for income tax purposes. Interest income is recorded on the accrual basis and includes accretion of discounts and amortization of premiums.
Securities Sold Short — The fund enters into short sales, which is selling securities it does not own, as part of its normal investment activities. Upon selling a security short, the fund will segregate cash, cash equivalents or other appropriate liquid securities in at least an amount equal to the current market value of the securities sold short until the fund replaces the borrowed security. Interest earned on segregated cash for securities sold short, if any, is reflected as interest income. The fund is required to pay any dividends or interest due on securities sold short. Such dividends and interest are recorded as an expense. The fund may pay fees or charges on the assets borrowed for securities sold short. These fees are calculated daily based upon the value of each security sold short and a rate that is dependent on the availability of such security. Liabilities for securities sold short are valued daily and changes in value are recorded as change in net unrealized appreciation (depreciation) on securities sold short. The fund records realized gain (loss) on a security sold short when it is terminated by the fund and includes as a component of net realized gain (loss) on securities sold short transactions.
Foreign Currency Translations — All assets and liabilities initially expressed in foreign currencies are translated into U.S. dollars at prevailing exchange rates at period end. The fund may enter into spot foreign currency exchange contracts to facilitate transactions denominated in a foreign currency. Purchases and sales of investment securities, dividend and interest income, spot foreign currency exchange contracts, and expenses are translated at the rates of exchange prevailing on the respective dates of such transactions. Net realized and unrealized foreign currency exchange gains or losses related to investment securities are a component of net realized gain (loss) on investment transactions and change in net unrealized appreciation (depreciation) on investments, respectively. Net realized and unrealized foreign currency exchange gains or losses related to securities sold short are a component of net realized gain (loss) on securities sold short transactions and change in net unrealized appreciation (depreciation) on securities sold short, respectively.
Repurchase Agreements — The fund may enter into repurchase agreements with institutions that American Century Investment Management, Inc. (ACIM) (the investment advisor) has determined are creditworthy pursuant to criteria adopted by the Board of Directors. The fund requires that the collateral, represented by securities, received in a repurchase transaction be transferred to the custodian in a manner sufficient to enable the fund to obtain those securities in the event of a default under the repurchase agreement. ACIM monitors, on a daily basis, the securities transferred to ensure the value, including accrued interest, of the securities under each repurchase agreement is equal to or greater than amounts owed to the fund under each repurchase agreement.
Joint Trading Account — Pursuant to an Exemptive Order issued by the Securities and Exchange Commission, the fund, along with certain other funds in the American Century Investments family of funds, may transfer uninvested cash balances into a joint trading account. These balances are invested in one or more repurchase agreements that are collateralized by U.S. Treasury or Agency obligations.
Segregated Assets — In accordance with the 1940 Act, the fund segregates assets on its books and records to cover certain types of investment securities and other financial instruments. ACIM monitors, on a daily basis, the securities segregated to ensure the fund designates a sufficient amount of liquid assets, marked-to-market daily. The fund may also receive assets or be required to pledge assets at the custodian bank or with a broker for collateral requirements.
Income Tax Status — It is the fund’s policy to distribute substantially all net investment income and net realized gains to shareholders and to otherwise qualify as a regulated investment company under provisions of the Internal Revenue Code. Accordingly, no provision has been made for income taxes. The fund files U.S. federal, state, local and non-U.S. tax returns as applicable. The fund's tax returns are subject to examination by the relevant taxing authority until expiration of the applicable statute of limitations, which is generally three years from the date of filing but can be longer in certain jurisdictions. At this time, management believes there
are no uncertain tax positions which, based on their technical merit, would not be sustained upon examination and for which it is reasonably possible that the total amounts of unrecognized tax benefits will significantly change in the next twelve months.
Multiple Class — All shares of the fund represent an equal pro rata interest in the net assets of the class to which such shares belong, and have identical voting, dividend, liquidation and other rights and the same terms and conditions, except for class specific expenses and exclusive rights to vote on matters affecting only individual classes. Income, non-class specific expenses, and realized and unrealized capital gains and losses of the fund are allocated to each class of shares based on their relative net assets.
Distributions to Shareholders — Distributions from net investment income, if any, are generally declared and paid semiannually. Distributions from net realized gains, if any, are generally declared and paid annually.
Indemnifications — Under the corporation’s organizational documents, its officers and directors are indemnified against certain liabilities arising out of the performance of their duties to the fund. In addition, in the normal course of business, the fund enters into contracts that provide general indemnifications. The maximum exposure under these arrangements is unknown as this would involve future claims that may be made against a fund. The risk of material loss from such claims is considered by management to be remote.
3. Fees and Transactions with Related Parties
Certain officers and directors of the corporation are also officers and/or directors of American Century Companies, Inc. (ACC). The corporation’s investment advisor, ACIM, the corporation's distributor, American Century Investment Services, Inc. (ACIS), and the corporation’s transfer agent, American Century Services, LLC, are wholly owned, directly or indirectly, by ACC.
Management Fees — The corporation has entered into a management agreement with ACIM, under which ACIM provides the fund with investment advisory and management services in exchange for a single, unified management fee (the fee) per class. The agreement provides that all expenses of managing and operating the fund, except distribution and service fees, expenses on securities sold short, brokerage expenses, taxes, interest, fees and expenses of the independent directors (including legal counsel fees), and extraordinary expenses, will be paid by ACIM. The fee is computed and accrued daily based on each class's daily net assets and paid monthly in arrears. The difference in the fee among the classes is a result of their separate arrangements for non-Rule 12b-1 shareholder services. It is not the result of any difference in advisory or custodial fees or other expenses related to the management of the fund's assets, which do not vary by class. The fee consists of (1) an Investment Category Fee based on the daily net assets of the fund and certain other accounts managed by the investment advisor that are in the same broad investment category as the fund and (2) a Complex Fee based on the assets of all the funds in the American Century Investments family of funds.
The Investment Category Fee range, the Complex Fee range and the effective annual management fee for each class for the period ended June 30, 2018 are as follows:
|
| | | |
| | Investment Category Fee Range | Complex Fee Range | Effective Annual Management Fee |
| Investor Class | 1.0480%
to 1.2300% | 0.2500% to 0.3100% | 1.37% |
| I Class | 0.0500% to 0.1100% | 1.17% |
| Y Class | 0.0000% to 0.0600% | 1.12% |
| A Class | 0.2500% to 0.3100% | 1.37% |
| C Class | 0.2500% to 0.3100% | 1.37% |
| R Class | 0.2500% to 0.3100% | 1.37% |
| R5 Class | 0.0500% to 0.1100% | 1.17% |
Distribution and Service Fees — The Board of Directors has adopted a separate Master Distribution and Individual Shareholder Services Plan for each of the A Class, C Class and R Class (collectively the plans), pursuant to Rule 12b-1 of the 1940 Act. The plans provide that the A Class will pay ACIS an annual distribution and service fee of 0.25%. The plans provide that the C Class will pay ACIS an annual distribution and service fee of 1.00%, of which 0.25% is paid for individual shareholder services and 0.75% is paid for distribution services. The plans provide that the R Class will pay ACIS an annual distribution and service fee of 0.50%. The fees are computed and accrued daily based on each class’s daily net assets and paid monthly in arrears. The fees are used to pay financial intermediaries for distribution and individual shareholder services. Fees incurred under the plans during the period ended June 30, 2018 are detailed in the Statement of Operations.
Directors' Fees and Expenses — The Board of Directors is responsible for overseeing the investment advisor’s management and operations of the fund. The directors receive detailed information about the fund and its investment advisor regularly throughout the year, and meet at least quarterly with management of the investment advisor to review reports about fund operations. The fund’s officers do not receive compensation from the fund.
4. Investment Transactions
Purchases and sales of investment securities and securities sold short, excluding short-term investments, for the period ended June 30, 2018 were $281,358,566 and $283,830,193, respectively.
5. Capital Share Transactions
Transactions in shares of the fund were as follows:
|
| | | | | | | | | | |
| | Year ended
June 30, 2018 | Year ended
June 30, 2017(1) |
| | Shares | Amount | Shares | Amount |
| Investor Class/Shares Authorized | 70,000,000 |
| | 70,000,000 |
| |
| Sold | 906,191 |
| $ | 10,253,405 |
| 4,826,916 |
| $ | 53,567,457 |
|
| Redeemed | (4,913,854 | ) | (55,483,172 | ) | (5,277,842 | ) | (58,739,581 | ) |
| | (4,007,663 | ) | (45,229,767 | ) | (450,926 | ) | (5,172,124 | ) |
| I Class/Shares Authorized | 30,000,000 |
| | 30,000,000 |
| |
| Sold | 4,254,423 |
| 49,144,474 |
| 1,014,699 |
| 11,491,703 |
|
| Redeemed | (3,617,623 | ) | (42,188,226 | ) | (411,289 | ) | (4,662,428 | ) |
| | 636,800 |
| 6,956,248 |
| 603,410 |
| 6,829,275 |
|
| Y Class/Shares Authorized | 50,000,000 |
| | 50,000,000 |
| |
| Sold | 65,935 |
| 770,788 |
| 436 |
| 5,000 |
|
| Redeemed | (484 | ) | (5,632 | ) | — |
| — |
|
| | 65,451 |
| 765,156 |
| 436 |
| 5,000 |
|
| A Class/Shares Authorized | 20,000,000 |
| | 20,000,000 |
| |
| Sold | 94,048 |
| 1,043,367 |
| 177,059 |
| 1,922,141 |
|
| Redeemed | (203,489 | ) | (2,256,379 | ) | (758,245 | ) | (8,267,727 | ) |
| | (109,441 | ) | (1,213,012 | ) | (581,186 | ) | (6,345,586 | ) |
| C Class/Shares Authorized | 20,000,000 |
| | 20,000,000 |
| |
| Sold | 278,923 |
| 2,846,030 |
| 95,380 |
| 960,865 |
|
| Redeemed | (307,223 | ) | (3,114,851 | ) | (292,311 | ) | (2,943,009 | ) |
| | (28,300 | ) | (268,821 | ) | (196,931 | ) | (1,982,144 | ) |
| R Class/Shares Authorized | 20,000,000 |
| | 20,000,000 |
| |
| Sold | 34,986 |
| 375,985 |
| 119,879 |
| 1,264,682 |
|
| Redeemed | (118,537 | ) | (1,275,653 | ) | (152,289 | ) | (1,614,286 | ) |
| | (83,551 | ) | (899,668 | ) | (32,410 | ) | (349,604 | ) |
| R5 Class/Shares Authorized | 50,000,000 |
| | 50,000,000 |
| |
| Sold | 517 |
| 6,031 |
| 436 |
| 5,000 |
|
| Redeemed | (2 | ) | (23 | ) | — |
| — |
|
| | 515 |
| 6,008 |
| 436 |
| 5,000 |
|
| Net increase (decrease) | (3,526,189 | ) | $ | (39,883,856 | ) | (657,171 | ) | $ | (7,010,183 | ) |
| |
| (1) | April 10, 2017 (commencement of sale) through June 30, 2017 for the Y Class and R5 Class. |
6. Fair Value Measurements
The fund’s investments valuation process is based on several considerations and may use multiple inputs to determine the fair value of the investments held by the fund. In conformity with accounting principles generally accepted in the United States of America, the inputs used to determine a valuation are classified into three broad levels.
| |
| • | Level 1 valuation inputs consist of unadjusted quoted prices in an active market for identical investments. |
| |
| • | Level 2 valuation inputs consist of direct or indirect observable market data (including quoted prices for comparable investments, evaluations of subsequent market events, interest rates, prepayment speeds, credit risk, etc.). These inputs also consist of quoted prices for identical investments initially expressed in local currencies that are adjusted through translation into U.S. dollars. |
| |
| • | Level 3 valuation inputs consist of unobservable data (including a fund’s own assumptions). |
The level classification is based on the lowest level input that is significant to the fair valuation measurement. The valuation inputs are not necessarily an indication of the risks associated with investing in these securities or other financial instruments. There were no significant transfers between levels during the period.
The following is a summary of the level classifications as of period end. The Schedule of Investments provides additional information on the fund’s portfolio holdings.
|
| | | | | | | | |
| | Level 1 | Level 2 | Level 3 |
| Assets | | | |
| Investment Securities | | | |
| Common Stocks | | | |
| Air Freight and Logistics | — |
| $ | 551,944 |
| — |
|
| Airlines | — |
| 958,183 |
| — |
|
| Auto Components | $ | 663,647 |
| 154,564 |
| — |
|
| Automobiles | — |
| 438,296 |
| — |
|
| Banks | 5,047,770 |
| 378,018 |
| — |
|
| Capital Markets | 1,746,760 |
| 483,954 |
| — |
|
| Chemicals | 1,765,085 |
| 792,862 |
| — |
|
| Construction and Engineering | 504,235 |
| 132,883 |
| — |
|
| Diversified Telecommunication Services | — |
| 482,383 |
| — |
|
| Equity Real Estate Investment Trusts (REITs) | 3,537,538 |
| 460,405 |
| — |
|
| Food and Staples Retailing | — |
| 565,885 |
| — |
|
| Food Products | — |
| 544,081 |
| — |
|
| Hotels, Restaurants and Leisure | 1,558,338 |
| 476,948 |
| — |
|
| Leisure Products | — |
| 646,295 |
| — |
|
| Machinery | 2,733,054 |
| 132,596 |
| — |
|
| Media | 77,769 |
| 349,584 |
| — |
|
| Metals and Mining | — |
| 1,426,509 |
| — |
|
| Multiline Retail | — |
| 276,024 |
| — |
|
| Oil, Gas and Consumable Fuels | 3,479,601 |
| 1,677,945 |
| — |
|
| Paper and Forest Products | 582,045 |
| 571,342 |
| — |
|
| Pharmaceuticals | 377,649 |
| 894,659 |
| — |
|
| Road and Rail | — |
| 579,271 |
| — |
|
| Technology Hardware, Storage and Peripherals | 143,750 |
| 420,675 |
| — |
|
| Textiles, Apparel and Luxury Goods | 1,266,504 |
| 425,708 |
| — |
|
| Other Industries | 35,753,929 |
| — |
| — |
|
| Temporary Cash Investments | 5,398 |
| 3,504,851 |
| — |
|
| | $ | 59,243,072 |
| $ | 17,325,865 |
| — |
|
| | | | |
|
| | | | | | | | |
| | Level 1 | Level 2 | Level 3 |
| Liabilities | | | |
| Securities Sold Short | | | |
| Common Stocks | | | |
| Banks | $ | 4,071,380 |
| $ | 535,622 |
| — |
|
| Building Products | — |
| 568,673 |
| — |
|
| Chemicals | 2,568,569 |
| 385,488 |
| — |
|
| Commercial Services and Supplies | 1,630,966 |
| 497,771 |
| — |
|
| Construction and Engineering | 1,491,691 |
| 686,020 |
| — |
|
| Diversified Telecommunication Services | 717,890 |
| 191,656 |
| — |
|
| Energy Equipment and Services | — |
| 511,433 |
| — |
|
| Food Products | 1,541,995 |
| 577,724 |
| — |
|
| Health Care Providers and Services | 1,229,420 |
| 920,158 |
| — |
|
| Household Durables | 1,325,053 |
| 470,964 |
| — |
|
| Internet and Direct Marketing Retail | — |
| 75,216 |
| — |
|
| Marine | — |
| 927,710 |
| — |
|
| Media | 1,769,774 |
| 244,585 |
| — |
|
| Metals and Mining | 739,569 |
| 1,066,901 |
| — |
|
| Professional Services | 615,916 |
| 173,514 |
| — |
|
| Road and Rail | 237,628 |
| 451,068 |
| — |
|
| Software | 435,757 |
| 594,099 |
| — |
|
| Specialty Retail | 630,036 |
| 565,050 |
| — |
|
| Tobacco | 577,291 |
| 584,772 |
| — |
|
| Trading Companies and Distributors | 1,087,840 |
| 507,542 |
| — |
|
| Transportation Infrastructure | 693,472 |
| 376,740 |
| — |
|
| Other Industries | 40,608,214 |
| — |
| — |
|
| | $ | 61,972,461 |
| $ | 10,912,706 |
| — |
|
7. Risk Factors
The fund is subject to short sales risk. If the market price of a security increases after the fund borrows the security, the fund may suffer a loss when it replaces the borrowed security at the higher price. Any loss will be increased by the amount of compensation, interest or dividends, and transaction costs the fund must pay to the lender of the borrowed security.
The fund's investment strategy utilizes leverage, which can increase market exposure and subject the fund to greater risk and higher volatility.
If the fund is overweighted in a stock or sector, any negative development related to that stock or sector will have a greater impact on the fund than other funds that are not overweighted in that stock or sector.
The fund’s investment process may result in high portfolio turnover, which could mean high transaction costs, affecting both performance and capital gains tax liabilities to investors.
There are certain risks involved in investing in foreign securities. These risks include those resulting from future adverse political, social and economic developments, fluctuations in currency exchange rates, the possible imposition of exchange controls, and other foreign laws or restrictions. Investing in emerging markets may accentuate these risks.
8. Federal Tax Information
The book-basis character of distributions made during the year from net investment income or net realized gains may differ from their ultimate characterization for federal income tax purposes. These differences reflect the differing character of certain income items and net realized gains and losses for financial statement and tax purposes, and may result in reclassification among certain capital accounts on the financial statements.
There were no distributions paid by the fund during the years ended June 30, 2018 and June 30, 2017.
The reclassifications, which are primarily due to net operating losses, were made to capital $(1,330,509), accumulated net investment loss $1,326,104, and accumulated net realized loss $4,405.
As of period end, the federal tax cost of investments and the components of distributable earnings on a tax-basis were as follows:
|
| | | |
| Federal tax cost of investments | $ | 70,875,662 |
|
| Gross tax appreciation of investments | $ | 8,221,060 |
|
| Gross tax depreciation of investments | (2,527,785 | ) |
| Net tax appreciation (depreciation) of investments | $ | 5,693,275 |
|
| Gross tax appreciation on securities sold short | 4,097,284 |
|
| Gross tax depreciation on securities sold short | (5,449,388 | ) |
| Net tax appreciation (depreciation) on translation of assets and liabilities in foreign currencies | (699 | ) |
| Net tax appreciation (depreciation) | $ | 4,340,472 |
|
| Undistributed ordinary income | — |
|
| Accumulated short-term capital losses | $ | (1,103,887 | ) |
| Late-year ordinary loss deferral | $ | (141,802 | ) |
The difference between book-basis and tax-basis unrealized appreciation (depreciation) is attributable primarily to the tax deferral of losses on unsettled short positions.
Accumulated capital losses represent net capital loss carryovers that may be used to offset future realized capital gains for federal income tax purposes. The capital loss carryovers may be carried forward for an unlimited period. Future capital loss carryover utilization in any given year may be subject to Internal Revenue Code limitations.
Loss deferrals represent certain qualified losses that the fund has elected to treat as having been incurred in the following fiscal year for federal income tax purposes.
|
| | | | | | | | | | | | | |
| For a Share Outstanding Throughout the Years Ended June 30 (except as noted) |
| Per-Share Data | | | Ratios and Supplemental Data | | |
| | | Income From Investment Operations: | | | Ratio to Average Net Assets of: | | |
| | Net Asset Value, Beginning of Period | Net Investment Income (Loss)(1) | Net Realized and Unrealized Gain (Loss) | Total From Investment Operations | Net Asset Value, End of Period | Total Return(2) | Operating Expenses | Operating Expenses (excluding expenses on securities sold short) | Net Investment Income (Loss) | Portfolio Turnover Rate | Net Assets, End of Period (in thousands) |
| Investor Class | | | | | | | | | |
| 2018 | $11.11 | (0.08) | 0.27 | 0.19 | $11.30 | 1.71% | 3.07% | 1.38% | (0.69)% | 289% |
| $36,778 |
|
| 2017 | $11.01 | (0.13) | 0.23 | 0.10 | $11.11 | 0.91% | 2.92% | 1.38% | (1.17)% | 344% |
| $80,666 |
|
| 2016 | $11.12 | (0.14) | 0.03 | (0.11) | $11.01 | (0.99)% | 2.93% | 1.40% | (1.25)% | 235% |
| $84,899 |
|
| 2015 | $11.24 | (0.16) | 0.04 | (0.12) | $11.12 | (1.07)% | 2.91% | 1.38% | (1.42)% | 243% |
| $57,263 |
|
| 2014 | $10.78 | (0.17) | 0.63 | 0.46 | $11.24 | 4.27% | 2.92% | 1.38% | (1.56)% | 226% |
| $50,641 |
|
| I Class | | | | | | | | | |
| 2018 | $11.34 | (0.05) | 0.28 | 0.23 | $11.57 | 2.03% | 2.87% | 1.18% | (0.49)% | 289% |
| $28,914 |
|
| 2017 | $11.22 | (0.11) | 0.23 | 0.12 | $11.34 | 1.07% | 2.72% | 1.18% | (0.97)% | 344% |
| $21,132 |
|
| 2016 | $11.30 | (0.12) | 0.04 | (0.08) | $11.22 | (0.71)% | 2.73% | 1.20% | (1.05)% | 235% |
| $14,129 |
|
| 2015 | $11.41 | (0.14) | 0.03 | (0.11) | $11.30 | (0.96)% | 2.71% | 1.18% | (1.22)% | 243% |
| $9,509 |
|
| 2014 | $10.92 | (0.15) | 0.64 | 0.49 | $11.41 | 4.49% | 2.72% | 1.18% | (1.36)% | 226% |
| $16,810 |
|
| Y Class | | | | | | | | | |
| 2018 | $11.34 | (0.01) | 0.24 | 0.23 | $11.57 | 2.03% | 2.82% | 1.13% | (0.44)% | 289% |
| $762 |
|
2017(3) | $11.47 | (0.02) | (0.11) | (0.13) | $11.34 | (1.13)% | 2.67%(4) | 1.13%(4) | (0.64)%(4) | 344%(5) |
| $5 |
|
|
| | | | | | | | | | | | | |
| For a Share Outstanding Throughout the Years Ended June 30 (except as noted) |
| Per-Share Data | | | Ratios and Supplemental Data | | |
| | | Income From Investment Operations: | | | Ratio to Average Net Assets of: | | |
| | Net Asset Value, Beginning of Period | Net Investment Income (Loss)(1) | Net Realized and Unrealized Gain (Loss) | Total From Investment Operations | Net Asset Value, End of Period | Total Return(2) | Operating Expenses | Operating Expenses (excluding expenses on securities sold short) | Net Investment Income (Loss) | Portfolio Turnover Rate | Net Assets, End of Period (in thousands) |
| A Class | | | | | | | | |
| 2018 | $10.83 | (0.10) | 0.27 | 0.17 | $11.00 | 1.48% | 3.32% | 1.63% | (0.94)% | 289% |
| $3,757 |
|
| 2017 | $10.76 | (0.16) | 0.23 | 0.07 | $10.83 | 0.65% | 3.17% | 1.63% | (1.42)% | 344% |
| $4,888 |
|
| 2016 | $10.90 | (0.17) | 0.03 | (0.14) | $10.76 | (1.28)% | 3.18% | 1.65% | (1.50)% | 235% |
| $11,113 |
|
| 2015 | $11.04 | (0.19) | 0.05 | (0.14) | $10.90 | (1.27)% | 3.16% | 1.63% | (1.67)% | 243% |
| $18,129 |
|
| 2014 | $10.62 | (0.20) | 0.62 | 0.42 | $11.04 | 3.95% | 3.17% | 1.63% | (1.81)% | 226% |
| $31,354 |
|
| C Class | | | | | | | | |
| 2018 | $10.00 | (0.17) | 0.24 | 0.07 | $10.07 | 0.70% | 4.07% | 2.38% | (1.69)% | 289% |
| $4,960 |
|
| 2017 | $10.01 | (0.22) | 0.21 | (0.01) | $10.00 | (0.10)% | 3.92% | 2.38% | (2.17)% | 344% |
| $5,207 |
|
| 2016 | $10.20 | (0.23) | 0.04 | (0.19) | $10.01 | (1.86)% | 3.93% | 2.40% | (2.25)% | 235% |
| $7,182 |
|
| 2015 | $10.42 | (0.25) | 0.03 | (0.22) | $10.20 | (2.11)% | 3.91% | 2.38% | (2.42)% | 243% |
| $6,413 |
|
| 2014 | $10.10 | (0.26) | 0.58 | 0.32 | $10.42 | 3.17% | 3.92% | 2.38% | (2.56)% | 226% |
| $5,729 |
|
| R Class | | | | | | | | |
| 2018 | $10.55 | (0.13) | 0.26 | 0.13 | $10.68 | 1.23% | 3.57% | 1.88% | (1.19)% | 289% |
| $2,565 |
|
| 2017 | $10.51 | (0.18) | 0.22 | 0.04 | $10.55 | 0.38% | 3.42% | 1.88% | (1.67)% | 344% |
| $3,416 |
|
| 2016 | $10.66 | (0.19) | 0.04 | (0.15) | $10.51 | (1.41)% | 3.43% | 1.90% | (1.75)% | 235% |
| $3,742 |
|
| 2015 | $10.83 | (0.21) | 0.04 | (0.17) | $10.66 | (1.57)% | 3.41% | 1.88% | (1.92)% | 243% |
| $2,187 |
|
| 2014 | $10.45 | (0.22) | 0.60 | 0.38 | $10.83 | 3.64% | 3.42% | 1.88% | (2.06)% | 226% |
| $1,718 |
|
| R5 Class | | | | | | | | |
| 2018 | $11.34 | (0.04) | 0.26 | 0.22 | $11.56 | 1.94% | 2.87% | 1.18% | (0.49)% | 289% |
| $11 |
|
2017(3) | $11.47 | (0.02) | (0.11) | (0.13) | $11.34 | (1.13)% | 2.72%(4) | 1.18%(4) | (0.69)%(4) | 344%(5) |
| $5 |
|
|
|
| Notes to Financial Highlights |
| |
| (1) | Computed using average shares outstanding throughout the period. |
| |
| (2) | Total returns are calculated based on the net asset value of the last business day and do not reflect applicable sales charges, if any. Total returns for periods less than one year are not annualized. |
| |
| (3) | April 10, 2017 (commencement of sale) through June 30, 2017. |
| |
| (5) | Portfolio turnover is calculated at the fund level. Percentage indicated was calculated for the year ended June 30, 2017. |
See Notes to Financial Statements.
|
|
| Report of Independent Registered Public Accounting Firm |
To the Board of Directors of American Century Quantitative Equity Funds, Inc. and Shareholders of AC Alternatives® Equity Market Neutral Fund
Opinion on the Financial Statements
We have audited the accompanying statement of assets and liabilities, including the schedule of investments, of AC Alternatives® Equity Market Neutral Fund (one of the funds constituting American Century Quantitative Equity Funds, Inc., referred to hereafter as the "Fund") as of June 30, 2018, the related statement of operations for the year ended June 30, 2018, the statement of changes in net assets for each of the two years in the period ended June 30, 2018, including the related notes, and the financial highlights for each of the periods indicated therein (collectively referred to as the “financial statements”). In our opinion, the financial statements present fairly, in all material respects, the financial position of the Fund as of June 30, 2018, the results of its operations for the year then ended, the changes in its net assets for each of the two years in the period ended June 30, 2018 and the financial highlights for each of the periods indicated therein in conformity with accounting principles generally accepted in the United States of America.
Basis for Opinion
These financial statements are the responsibility of the Fund’s management. Our responsibility is to express an opinion on the Fund’s financial statements based on our audits. We are a public accounting firm registered with the Public Company Accounting Oversight Board (United States) (“PCAOB”) and are required to be independent with respect to the Fund in accordance with the U.S. federal securities laws and the applicable rules and regulations of the Securities and Exchange Commission and the PCAOB.
We conducted our audits of these financial statements in accordance with the standards of the PCAOB. Those standards require that we plan and perform the audit to obtain reasonable assurance about whether the financial statements are free of material misstatement, whether due to error or fraud.
Our audits included performing procedures to assess the risks of material misstatement of the financial statements, whether due to error or fraud, and performing procedures that respond to those risks. Such procedures included examining, on a test basis, evidence regarding the amounts and disclosures in the financial statements. Our audits also included evaluating the accounting principles used and significant estimates made by management, as well as evaluating the overall presentation of the financial statements. Our procedures included confirmation of securities owned as of June 30, 2018 by correspondence with the custodian and brokers; when replies were not received from brokers, we performed other auditing procedures. We believe that our audits provide a reasonable basis for our opinion.
/s/ PricewaterhouseCoopers LLP
Kansas City, Missouri
August 16, 2018
We have served as the auditor of one or more investment companies in American Century Investments since 1997.
The Board of Directors
The individuals listed below serve as directors of the funds. Each director will continue to serve in this capacity until death, retirement, resignation or removal from office. The board has adopted a mandatory retirement age for directors who are not “interested persons,” as that term is defined in the Investment Company Act (independent directors). Independent directors shall retire by December 31 of the year in which they reach their 75th birthday; provided, however, that on or after January 1, 2022, independent trustees shall retire on December 31 of the year in which they reach their 76th birthday.
Mr. Thomas is an “interested person” because he currently serves as President and Chief Executive Officer of American Century Companies, Inc. (ACC), the parent company of American Century Investment Management, Inc. (ACIM or the advisor). The other directors (more than three-fourths of the total number) are independent. They are not employees, directors or officers of, and have no financial interest in, ACC or any of its wholly owned, direct or indirect, subsidiaries, including ACIM, American Century Investment Services, Inc. (ACIS) and American Century Services, LLC (ACS), and they do not have any other affiliations, positions or relationships that would cause them to be considered “interested persons” under the Investment Company Act. The directors serve in this capacity for eight (in the case of Jonathan S. Thomas, 16; and Ronald J. Gilson, 9) registered investment companies in the American Century Investments family of funds.
The following table presents additional information about the directors. The mailing address for each director other than Mr. Thomas is 1665 Charleston Road, Mountain View, California 94043. The mailing address for Mr. Thomas is 4500 Main Street, Kansas City, Missouri 64111.
|
| | | | | |
Name
(Year of Birth) | Position(s) Held with Funds | Length of Time Served | Principal Occupation(s) During Past 5 Years | Number of American Century Portfolios Overseen by Director | Other Directorships Held During Past 5 Years |
| Independent Directors |
|
|
Tanya S. Beder
(1955) | Director | Since 2011 | Chairman and CEO, SBCC Group Inc. (independent advisory services) (2006 to present) | 45 | CYS Investments, Inc.; Nabors Industries Ltd. |
Jeremy I. Bulow
(1954) | Director | Since 2011 | Professor of Economics, Stanford University, Graduate School of Business (1979 to present) | 45 | None |
Anne Casscells
(1958) | Director | Since 2016 | Co-Chief Executive Officer and Chief Investment Officer, Aetos Alternatives Management (investment advisory firm) (2001 to present); Lecturer in Accounting, Stanford University, Graduate School of Business (2009 to present) | 45 | None |
|
| | | | | |
Name
(Year of Birth) | Position(s) Held with Funds | Length of Time Served | Principal Occupation(s) During Past 5 Years | Number of American Century Portfolios Overseen by Director | Other Directorships Held During Past 5 Years |
| Independent Directors |
|
|
Ronald J. Gilson
(1946) | Director and Chairman of the Board | Since 1995
(Chairman since 2005) | Charles J. Meyers Professor of Law and Business, Emeritus, Stanford Law School (1979 to 2016); Marc and Eva Stern Professor of Law and Business, Columbia University School of Law (1992 to present) | 47 | None |
Frederick L. A. Grauer
(1946) | Director | Since 2008 | Senior Advisor, iShares by BlackRock, Inc. (investment management firm) (2010 to 2011, 2013 to 2015); Senior Advisor, Course Hero (an educational technology company) (2015 to present) | 45 | None |
Jonathan D. Levin
(1972) | Director | Since 2016 | Philip H. Knight Professor and Dean, Graduate School of Business, Stanford University (2016 to present); Professor, Stanford University, (2000 to present); Chair, Department of Economics, Stanford University (2011 to 2014) | 45 | None |
Peter F. Pervere
(1947) | Director | Since 2007 | Retired | 45 | None |
John B. Shoven
(1947) | Director | Since 2002 | Charles R. Schwab Professor of Economics, Stanford University (1973 to present) | 45 | Cadence Design Systems; Exponent; Financial Engines |
| Interested Director |
|
|
Jonathan S. Thomas
(1963) | Director and President | Since 2007 | President and Chief Executive Officer, ACC (2007 to present). Also serves as Chief Executive Officer, ACS; Executive Vice President, ACIM; Director, ACC, ACIM and other ACC subsidiaries | 115 | BioMed Valley Discoveries, Inc. |
The Statement of Additional Information has additional information about the fund's directors and is available without charge, upon request, by calling 1-800-345-2021.
Officers
The following table presents certain information about the executive officers of the funds. Each officer serves as an officer for each of the 16 (in the case of Robert J. Leach, 15) investment companies in the American Century family of funds, unless otherwise noted. No officer is compensated for his or her service as an officer of the funds. The listed officers are interested persons of the funds and are appointed or re-appointed on an annual basis. The mailing address for each officer listed below is 4500 Main Street, Kansas City, Missouri 64111.
|
| | |
Name
(Year of Birth) | Offices with the Funds | Principal Occupation(s) During the Past Five Years |
Jonathan S. Thomas
(1963) | Director and President since 2007 | President and Chief Executive Officer, ACC (2007 to present). Also serves as Chief Executive Officer, ACS; Executive Vice President, ACIM; Director, ACC, ACIM and other ACC subsidiaries |
Amy D. Shelton
(1964) | Chief Compliance Officer and Vice President since 2014 | Chief Compliance Officer, American Century funds, (2014 to present); Chief Compliance Officer, ACIM (2014 to present); Chief Compliance Officer, ACIS (2009 to present); Vice President, Client Interactions and Marketing, ACIS (2013 to 2014). Also serves as Vice President, ACIS |
Charles A. Etherington
(1957) | General Counsel since 2007 and Senior Vice President since 2006 | Attorney, ACC (1994 to present); Vice President, ACC (2005 to present); General Counsel, ACC (2007 to present). Also serves as General Counsel, ACIM, ACS, ACIS and other ACC subsidiaries; and Senior Vice President, ACIM and ACS |
C. Jean Wade
(1964) | Vice President,Treasurer and Chief Financial Officer since 2012 | Senior Vice President, ACS (2017 to present); Vice President, ACS (2000 to 2017) |
Robert J. Leach
(1966) | Vice President since 2006 and Assistant Treasurer since 2012 | Vice President, ACS (2000 to present) |
David H. Reinmiller
(1963) | Vice President since 2000 | Attorney, ACC (1994 to present). Also serves as Vice President, ACIM and ACS |
Ward D. Stauffer
(1960) | Secretary since 2005 | Attorney, ACC (2003 to present) |
|
|
| Approval of Management Agreement |
At a meeting held on June 19, 2018, the Fund’s Board of Directors (the "Board") unanimously approved the renewal of the management agreement pursuant to which American Century Investment Management, Inc. (the “Advisor”) acts as the investment advisor for the Fund. Under Section 15(c) of the Investment Company Act, contracts for investment advisory services are required to be reviewed, evaluated, and approved by a majority of a fund’s directors/trustees, including a majority of the independent Directors, each year. The Board regards this annual evaluation and renewal as one of its most important responsibilities.
The independent Directors have memorialized a statement regarding the relationship between their ongoing obligations to oversee and evaluate the performance of the Advisor and their annual consideration of renewal of the management agreement. In that statement, the independent Directors noted that their assessment of the Advisor’s performance is an ongoing process that takes place over the entire year and is informed by all of the extensive information that the Board and its committees receive and consider over time. This information, together with the additional materials provided specifically in connection with the review, are central to the Board’s assessment of the Advisor’s performance and its determination whether to renew the Fund’s management agreement.
Prior to its consideration of the renewal of the management agreement, the Board requested and reviewed extensive data and analysis relating to the proposed renewal. This information and analysis was compiled by the Advisor and certain independent providers of evaluation data concerning the Fund and the services provided to the Fund by the Advisor.
In connection with its consideration of the renewal of the management agreement, the Board’s review and evaluation of the services provided by the Advisor included, but was not limited to, the following:
| |
| • | the nature, extent, and quality of investment management, shareholder services, and other services provided to the Fund; |
| |
| • | the wide range of other programs and services the Advisor provides to the Fund and its shareholders on a routine and non-routine basis; |
| |
| • | the investment performance of the Fund, including data comparing the Fund’s performance to appropriate benchmarks and/or a peer group of other mutual funds with similar investment objectives and strategies; |
| |
| • | the cost of owning the Fund compared to the cost of owning similar funds; |
| |
| • | the Advisor’s compliance policies, procedures, and regulatory experience; |
| |
| • | financial data showing the cost of services provided to the Fund, the profitability of the Fund to the Advisor, and the overall profitability of the Advisor; |
| |
| • | strategic plans of the Advisor; |
| |
| • | any economies of scale associated with the Advisor’s management of the Fund and other accounts; |
| |
| • | services provided and charges to other investment management clients of the Advisor; |
| |
| • | acquired fund fees and expenses; |
| |
| • | payments and practices in connection with financial intermediaries holding shares of the Fund and the services provided by intermediaries in connection therewith; and |
| |
| • | any collateral benefits derived by the Advisor from the management of the Fund. |
In keeping with its practice, the Board held two in-person meetings to review and discuss the information provided in response to their request and held active discussions with the Advisor regarding the renewal of the management agreement. The independent Directors had the benefit of the advice of their independent counsel throughout the process.
Factors Considered
The Directors considered all of the information provided by the Advisor, the independent data providers, and the independent Directors’ independent counsel in connection with the approval. They determined that the information was sufficient for them to evaluate the management agreement for the Fund. In connection with their review, the Directors did not identify any single factor as being all-important or controlling and each Director may have attributed different levels of importance to different factors. In deciding to renew the management agreement, the Board based its decision on a number of factors, including the following:
Nature, Extent and Quality of Services - Generally. Under the management agreement, the Advisor is responsible for providing or arranging for all services necessary for the operation of the Fund. The Board noted that the Advisor provides or arranges at its own expense a wide variety of services including:
| |
| • | constructing and designing the Fund |
| |
| • | portfolio research and security selection |
| |
| • | initial capitalization/funding |
| |
| • | daily valuation of the Fund’s portfolio |
| |
| • | shareholder servicing and transfer agency, including shareholder confirmations, recordkeeping, and communications |
| |
| • | legal services (except the independent Directors’ counsel) |
| |
| • | regulatory and portfolio compliance |
| |
| • | marketing and distribution (except amounts paid by the Fund under Rule 12b-1 plans) |
The Board noted that many of these services have expanded over time in terms of both quantity and complexity in response to shareholder demands, competition in the industry, changing distribution channels, and the changing regulatory environment.
Investment Management, Shareholder, and Other Services. The nature of the investment management services provided to the Fund is quite complex and allows Fund shareholders access to professional money management, instant diversification of their investments within an asset class, the opportunity to easily diversify among asset classes by investing in or exchanging among various American Century Investments funds, and liquidity. In evaluating investment performance, the Board expects the Advisor to manage the Fund in accordance with its investment objectives and approved strategies. Further, the Directors recognize that the Advisor has an obligation to seek the best execution of fund trades. In providing these services, the Advisor utilizes teams of investment professionals (portfolio managers, analysts, research assistants, and securities traders) who require extensive information technology, research, training, compliance, and other systems to conduct their business. The Board, directly and through its Portfolio Committee, regularly reviews investment performance information for the Fund, together with comparative information for appropriate benchmarks and/or peer groups of similarly-managed funds, over different time horizons. The Directors also review detailed performance information during the management agreement approval process. If performance concerns are identified, the Fund receives special reviews until performance improves, during which the Board discusses with the Advisor the reasons for such results (e.g., market conditions, security selection) and any efforts being undertaken to improve performance. The Fund’s performance was above its benchmark for the one-, three-, five-, and ten-year periods reviewed by the Board. The Board found the investment management services provided by the Advisor to the Fund to be satisfactory and consistent with the management agreement.
Under the management agreement, the Advisor provides the Fund with a comprehensive package of transfer agency, shareholder, and other services. The Board, directly and through various committees of the Board, regularly reviews reports and evaluations of such services at its regular meetings. These reports include, but are not limited to, information regarding the operational efficiency and accuracy of the shareholder and transfer agency services provided, staffing levels, shareholder satisfaction (as measured by external as well as internal sources), technology support, new products and services offered to Fund shareholders, securities trading activities, portfolio valuation services, auditing services, and legal and operational compliance activities. The Board found the services provided by the Advisor to the Fund under the management agreement to be competitive and of high quality.
Costs of Services and Profitability. The Advisor provides detailed information concerning its cost of providing various services to the Fund, its profitability in managing the Fund, its overall profitability, and its financial condition. The Directors have reviewed with the Advisor the methodology used to prepare this financial information. This information is considered in evaluating the Advisor’s financial condition, its ability to continue to provide services under the management agreement, and the reasonableness of the current management fee. The Board concluded that the Advisor’s profits were reasonable in light of the services provided to the Fund.
Economies of Scale. The Board also reviewed information provided by the Advisor regarding the possible existence of economies of scale in connection with the management of the Fund. The Board concluded that economies of scale are difficult to measure and predict with precision, especially on a fund-by-fund basis. The Board concluded that the Advisor is appropriately sharing economies of scale through its competitive fee structure, offering competitive fees from fund inception, and through reinvestment in its business to provide shareholders enhanced and expanded services.
Comparison to Other Funds’ Fees. The management agreement provides that the Fund pays the Advisor a single, all-inclusive (or unified) management fee for providing all services necessary for the management and operation of the Fund, other than brokerage expenses, expenses attributable to short sales, taxes, interest, extraordinary expenses, the fees and expenses of the Fund’s independent Directors (including their independent legal counsel), and expenses incurred in connection with the provision of shareholder services and distribution services under a plan adopted pursuant to Rule 12b-1 under the 1940 Act. Under the unified fee structure, the Advisor is responsible for providing all investment advisory, custody, audit, administrative, compliance, recordkeeping, marketing, and shareholder services, or arranging and supervising third parties to provide such services. By contrast, most other funds are charged a variety of fees, including an investment advisory fee, a transfer agency fee, an administrative fee, distribution charges, and other expenses. Other than their investment advisory fees and any applicable Rule 12b-1 distribution fees, all other components of the total fees charged by these other funds may be increased without shareholder approval. The Board believes the unified fee structure is a benefit to Fund shareholders because it clearly discloses to shareholders the cost of owning Fund shares, and, since the unified fee cannot be increased without a vote of Fund shareholders, it shifts to the Advisor the risk of increased costs of operating the Fund and provides a direct incentive to minimize administrative inefficiencies. Part of the Board’s analysis of fee levels involves reviewing certain evaluative data compiled by an independent provider and comparing the Fund’s unified fee to the total expense ratio of peer funds. The unified fee charged to shareholders of the Fund was below the median of the total expense ratios of the Fund’s peer universe. The Board concluded that the management fee paid by the Fund to the Advisor under the management agreement is reasonable in light of the services provided to the Fund.
Comparison to Fees and Services Provided to Other Clients of the Advisor. The Board also requested and received information from the Advisor concerning the nature of the services, fees, costs, and profitability of its advisory services to advisory clients other than the Fund. They observed that these varying types of client accounts require different services and involve different regulatory and entrepreneurial risks than the management of the Fund. The Board analyzed this
information and concluded that the fees charged and services provided to the Fund were reasonable by comparison.
Payments to Intermediaries. The Directors also requested and received a description of payments made to intermediaries by the Fund and the Advisor and services provided by intermediaries. These payments include various payments made by the Fund or the Advisor to different types of intermediaries and recordkeepers for distribution and service activities provided for the Fund. The Directors reviewed such information and received representations from the Advisor that all such payments by the Fund were made pursuant to the Fund’s Rule 12b-1 Plan and that all such payments by the Advisor were made from the Advisor’s resources and reasonable profits. The Board found such payments to be reasonable in scope and purpose.
Collateral or “Fall-Out” Benefits Derived by the Advisor. The Board considered the existence of collateral benefits the Advisor may receive as a result of its relationship with the Fund. The Board noted that the Advisor’s primary business is managing mutual funds and it generally does not use fund or shareholder information to generate profits in other lines of business, and therefore does not derive any significant collateral benefits from them. The Board noted that the Advisor may receive proprietary research from broker-dealers that execute fund portfolio transactions. The Board also determined that the Advisor is able to provide investment management services to certain clients other than the Fund, at least in part, due to its existing infrastructure built to serve the fund complex. The Board noted that the assets of those other accounts are, where applicable, included with the assets of the Fund to determine breakpoints in the management fee schedule.
Existing Relationship. The Board also considered whether there was any reason for not continuing the existing arrangement with the Advisor. In this regard, the Board was mindful of the potential disruptions of the Fund’s operations and various risks, uncertainties, and other effects that could occur as a result of a decision not to continue such relationship. In particular, the Board recognized that most shareholders have invested in the Fund on the strength of the Advisor’s industry standing and reputation and in the expectation that the Advisor will have a continuing role in providing advisory services to the Fund.
Conclusion of the Directors. As a result of this process, the Board, including all of the independent Directors and assisted by the advice of independent legal counsel, taking into account all of the factors discussed above and the information provided by the Advisor and others in connection with its review and throughout the year, concluded that the management agreement between the Fund and the Advisor is fair and reasonable in light of the services provided and should be renewed.
Retirement Account Information
As required by law, distributions you receive from certain retirement accounts are subject to federal income tax withholding, unless you elect not to have withholding apply*. Tax will be withheld on the total amount withdrawn even though you may be receiving amounts that are not subject to withholding, such as nondeductible contributions. In such case, excess amounts of withholding could occur. You may adjust your withholding election so that a greater or lesser amount will be withheld.
If you don’t want us to withhold on this amount, you must notify us to not withhold the federal income tax. You may notify us in writing or in certain situations by telephone or through other electronic means. For systematic withdrawals, your withholding election will remain in effect until revoked or changed by filing a new election. You have the right to revoke your election at any time and change your withholding percentage for future distributions.
Remember, even if you elect not to have income tax withheld, you are liable for paying income tax on the taxable portion of your withdrawal. If you elect not to have income tax withheld or you don’t have enough income tax withheld, you may be responsible for payment of estimated tax. You may incur penalties under the estimated tax rules if your withholding and estimated tax payments are not sufficient. You can reduce or defer the income tax on a distribution by directly or indirectly rolling such distribution over to another IRA or eligible plan. You should consult your tax advisor for additional information.
State tax will be withheld if, at the time of your distribution, your address is within one of the mandatory withholding states and you have federal income tax withheld (or as otherwise required by state law). State taxes will be withheld from your distribution in accordance with the respective state rules.
*Some 403(b), 457 and qualified retirement plan distributions may be subject to 20% mandatory withholding, as they are subject to special tax and withholding rules. Your plan administrator or plan sponsor is required to provide you with a special tax notice explaining those rules at the time you request a distribution. If applicable, federal and/or state taxes may be withheld from your distribution amount.
Proxy Voting Policies
Descriptions of the principles and policies that the fund's investment advisor uses in exercising the voting rights associated with the securities purchased and/or held by the fund are available without charge, upon request, by calling 1-800-345-2021 or visiting the "About Us" page of American Century Investments’ website at americancentury.com. A description of the policies is also available on the Securities and Exchange Commission’s website at sec.gov. Information regarding how the investment advisor voted proxies relating to portfolio securities during the most recent 12-month period ended June 30 is available on the "About Us" page at americancentury.com. It is also available at sec.gov.
Quarterly Portfolio Disclosure
The fund files its complete schedule of portfolio holdings with the Securities and Exchange Commission (SEC) for the first and third quarters of each fiscal year on Form N-Q. The fund’s Forms N-Q are available on the SEC’s website at sec.gov, and may be reviewed and copied at the SEC’s Public Reference Room in Washington, DC. Information on the operation of the Public Reference Room may be obtained by calling 1-800-SEC-0330. The fund also makes its complete schedule of portfolio holdings for the most recent quarter of its fiscal year available on its website at americancentury.com and, upon request, by calling 1-800-345-2021.
|
| | |
| |
| | | |
| Contact Us | americancentury.com | |
| Automated Information Line | 1-800-345-8765 | |
| Investor Services Representative | 1-800-345-2021
or 816-531-5575 | |
| Investors Using Advisors | 1-800-378-9878 | |
Business, Not-For-Profit, Employer-Sponsored
Retirement Plans | 1-800-345-3533 | |
Banks and Trust Companies, Broker-Dealers,
Financial Professionals, Insurance Companies | 1-800-345-6488 | |
| Telecommunications Relay Service for the Deaf | 711 | |
| | | |
| American Century Quantitative Equity Funds, Inc. | |
| | | |
Investment Advisor: American Century Investment Management, Inc. Kansas City, Missouri | |
| | | |
| This report and the statements it contains are submitted for the general information of our shareholders. The report is not authorized for distribution to prospective investors unless preceded or accompanied by an effective prospectus. | |
| | | |
©2018 American Century Proprietary Holdings, Inc. All rights reserved.
CL-ANN-92987 1808 | |
|
| |
| | |
| | Annual Report |
| | |
| | June 30, 2018 |
| | |
| | Core Equity Plus Fund |
| | Investor Class (ACPVX) |
| | I Class (ACPKX) |
| | A Class (ACPQX) |
| | C Class (ACPHX) |
| | R Class (ACPWX) |
|
| | |
| President's Letter | 2 |
|
| Performance | 3 |
|
| Portfolio Commentary | |
|
| Fund Characteristics | |
|
| Shareholder Fee Example | |
|
| Schedule of Investments | |
|
| Statement of Assets and Liabilities | |
|
| Statement of Operations | |
|
| Statement of Changes in Net Assets | |
|
| Statement of Cash Flows | |
|
| Notes to Financial Statements | |
|
| Financial Highlights | |
|
| Report of Independent Registered Public Accounting Firm | |
|
| Management | |
|
| Approval of Management Agreement | |
|
| Additional Information | |
|
Any opinions expressed in this report reflect those of the author as of the date of the report, and do not necessarily represent the opinions of American Century Investments® or any other person in the American Century Investments organization. Any such opinions are subject to change at any time based upon market or other conditions and American Century Investments disclaims any responsibility to update such opinions. These opinions may not be relied upon as investment advice and, because investment decisions made by American Century Investments funds are based on numerous factors, may not be relied upon as an indication of trading intent on behalf of any American Century Investments fund. Security examples are used for representational purposes only and are not intended as recommendations to purchase or sell securities. Performance information for comparative indices and securities is provided to American Century Investments by third party vendors. To the best of American Century Investments’ knowledge, such information is accurate at the time of printing.
Jonathan Thomas
Dear Investor:
Thank you for reviewing this annual report for the period ended June 30, 2018. Annual reports help convey important information about fund returns, including market factors that affected performance during the reporting period. For additional, updated investment and market insights, we encourage you to visit our website, americancentury.com.
Volatility’s Return Challenged Financial Markets
Broad U.S. and global stock market indices generally rallied for the first half of the 12-month period. A favorable backdrop of robust corporate earnings results, improving global economic growth, and relatively low interest rates, combined with the effects of U.S. tax reform, drove stock prices higher. For the six months ended December 31, 2017, U.S. stocks (S&P 500 Index) returned 11.42%. U.S. bond returns were also positive, but much more subdued, as the Federal Reserve (the Fed) continued its rate-normalization efforts and interest rates edged higher. The Bloomberg Barclays U.S. Aggregate Bond Index returned 1.24% for the six-month period.
In early February, a force that was largely dormant during 2017—volatility—re-emerged, as better-than-expected economic data triggered expectations for rising inflation, higher interest rates, and a more-hawkish Fed. In response, U.S. Treasury yields climbed to their highest levels in several years, and stock prices plunged. Economic data released in subsequent months were more in line with market expectations, while corporate earnings results remained healthy. These factors helped calm the market unrest, and stocks generally recovered their earlier losses. Nevertheless, rising interest rates, geopolitical tensions, and the mounting threat of a global trade war continued to provide periodic headwinds for investors.
Despite the return of volatility, U.S. stocks (S&P 500 Index) gained14.37% for the 12-month period. Meanwhile, rising U.S. Treasury yields, particularly in the second half of the period, took a toll on bonds and other interest-rate-sensitive investments, including gold, utilities stocks, and real estate investment trusts (REITs). Investment-grade bonds (Bloomberg Barclays U.S. Aggregate Bond Index) returned -0.40% for the 12 months.
With volatility resurfacing, inflationary pressures building, Treasury yields rising, and the implications of U.S. tariff and trade policy still unfolding, investors likely will face new opportunities and challenges in the months ahead. We believe this scenario warrants a disciplined, diversified, and risk-aware approach, using professionally managed portfolios in pursuit of investment goals. We appreciate your continued trust and confidence in us.
Sincerely,
Jonathan Thomas
President and Chief Executive Officer
American Century Investments
|
| | | | | |
| Total Returns as of June 30, 2018 | | | |
| | Average
Annual Returns | |
| | Ticker Symbol | 1 year | 5 years | Since Inception | Inception Date |
| Investor Class | ACPVX | 13.50% | 11.46% | 13.10% | 10/31/11 |
| S&P 500 Index | — | 14.37% | 13.41% | 14.72% | — |
| I Class | ACPKX | 13.73% | 11.68% | 13.32% | 10/31/11 |
| A Class | ACPQX | | | | 10/31/11 |
| No sales charge | | 13.24% | 11.18% | 12.82% | |
| With sales charge | | 6.72% | 9.88% | 11.82% | |
| C Class | ACPHX | 12.40% | 10.35% | 11.96% | 10/31/11 |
| R Class | ACPWX | 12.94% | 10.89% | 12.53% | 10/31/11 |
Sales charges include initial sales charges and contingent deferred sales charges (CDSCs), as applicable. A Class shares have a 5.75% maximum initial sales charge and may be subject to a maximum CDSC of 1.00%. C Class shares redeemed within 12 months of purchase are subject to a maximum CDSC of 1.00%. The SEC requires that mutual funds provide performance information net of maximum sales charges in all cases where charges could be applied.
Data presented reflect past performance. Past performance is no guarantee of future results. Current performance may be higher or lower than the performance shown. Total returns for periods less than one year are not annualized. Investment return and principal value will fluctuate, and redemption value may be more or less than original cost. Data assumes reinvestment of dividends and capital gains, and none of the charts reflect the deduction of taxes that a shareholder would pay on fund distributions or the redemption of fund shares. To obtain performance data current to the most recent month end, please call 1-800-345-2021 or visit americancentury.com. For additional information about the fund, please consult the prospectus.
|
|
| Growth of $10,000 Over Life of Class |
| $10,000 investment made October 31, 2011 |
| Performance for other share classes will vary due to differences in fee structure. |
|
| |
| Value on June 30, 2018 |
| | Investor Class — $22,719 |
| |
| | S&P 500 Index — $24,983 |
| |
|
| | | | |
| Total Annual Fund Operating Expenses |
| Investor Class | I Class | A Class | C Class | R Class |
| 1.97% | 1.77% | 2.22% | 2.97% | 2.47% |
The total annual fund operating expenses shown is as stated in the fund’s prospectus current as of the date of this report. The prospectus may vary from the expense ratio shown elsewhere in this report because it is based on a different time period, includes acquired fund fees and expenses, and, if applicable, does not include fee waivers or expense reimbursements.
Data presented reflect past performance. Past performance is no guarantee of future results. Current performance may be higher or lower than the performance shown. Total returns for periods less than one year are not annualized. Investment return and principal value will fluctuate, and redemption value may be more or less than original cost. Data assumes reinvestment of dividends and capital gains, and none of the charts reflect the deduction of taxes that a shareholder would pay on fund distributions or the redemption of fund shares. To obtain performance data current to the most recent month end, please call 1-800-345-2021 or visit americancentury.com. For additional information about the fund, please consult the prospectus.
Portfolio Managers: Claudia Musat and Steven Rossi
Performance Summary
Core Equity Plus returned 13.50%* for the fiscal year ended June 30, 2018, compared with the 14.37% return of its benchmark, the S&P 500 Index.
Core Equity Plus advanced during the fiscal year, but underperformed its benchmark, the S&P 500 Index. The fund is managed to have a 100% net exposure to the equity market by investing approximately 130% of its net assets in long positions, while 30% of its net assets are sold short. The proceeds from the securities sold short are used to fund the purchase of the additional 30% of long positions.
Core Equity Plus’ stock selection process incorporates factors of valuation, quality, growth, and sentiment, while striving to minimize unintended risks along industries and other risk characteristics. Within the fund, overall performance was aided by growth, sentiment, and quality factors, while the valuation factor detracted. Stock selection in the health care, energy, and materials sectors detracted, while choices in consumer staples, consumer discretionary, and financials benefited relative performance.
Stock Choices Across Several Sectors Detracted From Relative Returns
Stock choices in the health care sector were the largest drivers of underperformance for the fiscal year. Several short positions in the biotechnology industry detracted from relative performance. In health care equipment and supplies, short positions in Insulet and ICU Medical were among the portfolio’s largest detractors. While Insulet’s stock rose during the period, the company has poor factor model scores for quality, valuation, and sentiment. ICU Medical scores poorly for valuation. We have since exited the position. Elsewhere in the sector, positions in pharmaceuticals companies also hurt relative returns.
Stock selection within energy also negatively affected the portfolio. Within the oil, gas, and consumable fuels industry, a short position in SM Energy dampened results. The company scores poorly across all four stock selection model factors. In addition, long positions in Newfield Exploration and Apache hurt results. We have since exited the positions.
Within the materials sector, stock selection among chemicals companies was the largest headwind. A short position in CF Industries Holdings detracted, as did a long position in Platform Specialty Products. We have since exited the positions.
Consumer Sectors and Financials Were Additive
Within consumer staples, avoidance of tobacco companies helped relative returns. The stock of companies such as Philip Morris International and Altria Group have been depressed due to falling sales and shifting consumer tastes. Philip Morris International’s stock fell due to poor sales of its new smokeless tobacco product. Elsewhere in the sector, positioning within beverage companies helped performance. A long position in The Boston Beer Company contributed to relative returns. We have since exited the position. Underweights to PepsiCo and The Coca-Cola Company were also additive, as the companies’ stock has been under pressure due to changing consumer preferences. We have since closed both of the positions.
*All fund returns referenced in this commentary are for Investor Class shares. Performance for other share classes will vary due to differences in fee structure; when Investor Class performance exceeds that of the fund's benchmark, other share classes may not. See page 3 for returns for all share classes.
Stock selection within the consumer discretionary sector also helped relative results. Long positions in textiles, apparel, and luxury goods companies Deckers Outdoor and Ralph Lauren contributed to relative performance. Underweights, shorts, or avoidance of various media companies was also additive. Stock choices in the distributors industry also boosted relative returns. A short position in Core-Mark Holding Company was among one of the portfolio’s top contributors for the period.
A Look Ahead
Our disciplined, objective, and systematic investment strategy is designed to take advantage of opportunities at the individual company level. We believe this approach is the most powerful way to capitalize on market inefficiencies that lead to the mispricing of individual stocks. Our strategy is designed to provide investors with well-diversified and risk-controlled exposure to broad U.S. equities. As such, we do not seek significant deviations in sector weightings versus the S&P 500 Index. Nevertheless, we can point to select sectors and industries where we are finding more or less investment opportunity.
At period-end, consumer discretionary was the most overweight sector. According to our factor model, retailing and consumer durables and apparel offer some of the best opportunities in the current environment. We increased our exposure to the sector during the period, increasing our relative overweight position in order to take advantage of these opportunities. Information technology ended the period as the second largest relative overweight. Based on our factor model, we believe there are significant opportunities for growth in the software and services and semiconductors and semiconductor equipment industries. These companies are attractive along multiple dimensions of our stock selection model. Conversely, our largest underweight at period-end was in the consumer staples sector, where our underweight is driven by a lack of exposure to the food, beverage, and tobacco industry group, which scores poorly on growth and quality. In addition, we are underweight utilities. Our model also shows a lack of opportunity in the space, particularly based upon poor quality and growth factors.
|
| |
| JUNE 30, 2018 |
| Top Ten Long Holdings | % of net assets |
| Amazon.com, Inc. | 3.67% |
| Alphabet, Inc., Class A | 3.67% |
| Microsoft Corp. | 3.24% |
| Apple, Inc. | 3.16% |
| Facebook, Inc., Class A | 2.74% |
| JPMorgan Chase & Co. | 2.33% |
| Bank of America Corp. | 1.93% |
| Intel Corp. | 1.87% |
| UnitedHealth Group, Inc. | 1.83% |
| Cisco Systems, Inc. | 1.80% |
| | |
| Top Five Short Holdings | % of net assets |
| 2U, Inc. | (0.89)% |
| NOW, Inc. | (0.88)% |
| SM Energy Co. | (0.86)% |
| SiteOne Landscape Supply, Inc. | (0.85)% |
| Avanos Medical, Inc. | (0.80)% |
| | |
| Types of Investments in Portfolio | % of net assets |
| Common Stocks | 128.8% |
| Common Stocks Sold Short | (29.6)% |
| Temporary Cash Investments | 1.5% |
| Other Assets and Liabilities | (0.7)% |
Fund shareholders may incur two types of costs: (1) transaction costs, including sales charges (loads) on purchase payments and redemption/exchange fees; and (2) ongoing costs, including management fees; distribution and service (12b-1) fees; and other fund expenses. This example is intended to help you understand your ongoing costs (in dollars) of investing in your fund and to compare these costs with the ongoing cost of investing in other mutual funds.
The example is based on an investment of $1,000 made at the beginning of the period and held for the entire period from January 1, 2018 to June 30, 2018.
Actual Expenses
The table provides information about actual account values and actual expenses for each class. You may use the information, together with the amount you invested, to estimate the expenses that you paid over the period. First, identify the share class you own. Then simply divide your account value by $1,000 (for example, an $8,600 account value divided by $1,000 = 8.6), then multiply the result by the number under the heading “Expenses Paid During Period” to estimate the expenses you paid on your account during this period.
If you hold Investor Class shares of any American Century Investments fund, or I Class shares of the American Century Diversified Bond Fund, in an American Century Investments account (i.e., not a financial intermediary or retirement plan account), American Century Investments may charge you a $12.50 semiannual account maintenance fee if the value of those shares is less than $10,000. We will redeem shares automatically in one of your accounts to pay the $12.50 fee. In determining your total eligible investment amount, we will include your investments in all personal accounts (including American Century Investments Brokerage accounts) registered under your Social Security number. Personal accounts include individual accounts, joint accounts, UGMA/UTMA accounts, personal trusts, Coverdell Education Savings Accounts and IRAs (including traditional, Roth, Rollover, SEP-, SARSEP- and SIMPLE-IRAs), and certain other retirement accounts. If you have only business, business retirement, employer-sponsored or American Century Investments Brokerage accounts, you are currently not subject to this fee. If you are subject to the Account Maintenance Fee, your account value could be reduced by the fee amount.
Hypothetical Example for Comparison Purposes
The table also provides information about hypothetical account values and hypothetical expenses based on the actual expense ratio of each class of your fund and an assumed rate of return of 5% per year before expenses, which is not the actual return of a fund’s share class. The hypothetical account values and expenses may not be used to estimate the actual ending account balance or expenses you paid for the period. You may use this information to compare the ongoing costs of investing in your fund and other funds. To do so, compare this 5% hypothetical example with the 5% hypothetical examples that appear in the shareholder reports of the other funds.
Please note that the expenses shown in the table are meant to highlight your ongoing costs only and do not reflect any transactional costs, such as sales charges (loads) or redemption/exchange fees. Therefore, the table is useful in comparing ongoing costs only, and will not help you determine the relative total costs of owning different funds. In addition, if these transactional costs were included, your costs would have been higher.
|
| | | | |
| | Beginning
Account Value
1/1/18 | Ending
Account Value
6/30/18 | Expenses Paid
During Period(1)
1/1/18 - 6/30/18 | Annualized
Expense Ratio(1) |
| Actual |
| Investor Class | $1,000 | $1,019.90 | $9.27 | 1.85% |
| I Class | $1,000 | $1,020.90 | $8.27 | 1.65% |
| A Class | $1,000 | $1,018.10 | $10.51 | 2.10% |
| C Class | $1,000 | $1,014.70 | $14.24 | 2.85% |
| R Class | $1,000 | $1,017.00 | $11.75 | 2.35% |
| Hypothetical |
| Investor Class | $1,000 | $1,015.62 | $9.25 | 1.85% |
| I Class | $1,000 | $1,016.61 | $8.25 | 1.65% |
| A Class | $1,000 | $1,014.38 | $10.49 | 2.10% |
| C Class | $1,000 | $1,010.66 | $14.21 | 2.85% |
| R Class | $1,000 | $1,013.14 | $11.73 | 2.35% |
| |
| (1) | Expenses are equal to the class's annualized expense ratio listed in the table above, multiplied by the average account value over the period, multiplied by 181, the number of days in the most recent fiscal half-year, divided by 365, to reflect the one-half year period. Annualized expense ratio reflects actual expenses, including any applicable fee waivers or expense reimbursements and excluding any acquired fund fees and expenses. |
JUNE 30, 2018
|
| | | | | |
| | Shares | Value |
| COMMON STOCKS — 128.8% | | |
| Aerospace and Defense — 5.2% | | |
Boeing Co. (The)(1) | 8,248 |
| $ | 2,767,286 |
|
| Curtiss-Wright Corp. | 7,028 |
| 836,473 |
|
| General Dynamics Corp. | 9,081 |
| 1,692,789 |
|
| Lockheed Martin Corp. | 6,788 |
| 2,005,379 |
|
| Raytheon Co. | 6,039 |
| 1,166,614 |
|
Teledyne Technologies, Inc.(2) | 1,535 |
| 305,557 |
|
| Textron, Inc. | 24,832 |
| 1,636,677 |
|
| | | 10,410,775 |
|
| Auto Components — 0.7% | | |
Visteon Corp.(2) | 11,420 |
| 1,475,921 |
|
| Banks — 10.0% | | |
Bank of America Corp.(1) | 136,648 |
| 3,852,107 |
|
| BB&T Corp. | 35,736 |
| 1,802,524 |
|
| Citigroup, Inc. | 16,028 |
| 1,072,594 |
|
| Fifth Third Bancorp | 53,647 |
| 1,539,669 |
|
| First Citizens BancShares, Inc., Class A | 1,977 |
| 797,324 |
|
| First Hawaiian, Inc. | 9,068 |
| 263,153 |
|
JPMorgan Chase & Co.(1) | 44,488 |
| 4,635,650 |
|
| SunTrust Banks, Inc. | 27,047 |
| 1,785,643 |
|
U.S. Bancorp(1) | 41,695 |
| 2,085,584 |
|
Wells Fargo & Co.(1) | 36,707 |
| 2,035,036 |
|
| | | 19,869,284 |
|
| Beverages — 1.2% | | |
| Constellation Brands, Inc., Class A | 4,199 |
| 919,035 |
|
| Molson Coors Brewing Co., Class B | 20,826 |
| 1,417,001 |
|
| | | 2,336,036 |
|
| Biotechnology — 3.7% | | |
| AbbVie, Inc. | 18,448 |
| 1,709,207 |
|
Alexion Pharmaceuticals, Inc.(2) | 6,093 |
| 756,446 |
|
| Amgen, Inc. | 8,509 |
| 1,570,676 |
|
Biogen, Inc.(2) | 3,564 |
| 1,034,416 |
|
Celgene Corp.(2) | 12,978 |
| 1,030,713 |
|
| Gilead Sciences, Inc. | 12,179 |
| 862,760 |
|
Regeneron Pharmaceuticals, Inc.(2) | 1,130 |
| 389,839 |
|
| | | 7,354,057 |
|
| Building Products — 0.6% | | |
| Owens Corning | 17,503 |
| 1,109,165 |
|
| Capital Markets — 1.9% | | |
| Affiliated Managers Group, Inc. | 9,083 |
| 1,350,370 |
|
| BGC Partners, Inc., Class A | 43,843 |
| 496,303 |
|
| Evercore, Inc., Class A | 17,261 |
| 1,820,172 |
|
| FactSet Research Systems, Inc. | 647 |
| 128,171 |
|
| | | 3,795,016 |
|
| Chemicals — 3.3% | | |
| Air Products & Chemicals, Inc. | 10,865 |
| 1,692,006 |
|
|
| | | | | |
| | Shares | Value |
| Chemours Co. (The) | 7,570 |
| $ | 335,805 |
|
| Eastman Chemical Co. | 14,362 |
| 1,435,626 |
|
| Huntsman Corp. | 51,942 |
| 1,516,706 |
|
| WR Grace & Co. | 20,515 |
| 1,503,955 |
|
| | | 6,484,098 |
|
| Commercial Services and Supplies — 1.5% | | |
| Herman Miller, Inc. | 29,113 |
| 986,931 |
|
| MSA Safety, Inc. | 17,865 |
| 1,721,114 |
|
| Pitney Bowes, Inc. | 30,513 |
| 261,496 |
|
| | | 2,969,541 |
|
| Communications Equipment — 2.5% | | |
Ciena Corp.(2) | 27,715 |
| 734,725 |
|
Cisco Systems, Inc.(1) | 83,417 |
| 3,589,433 |
|
F5 Networks, Inc.(2) | 4,116 |
| 709,804 |
|
| | | 5,033,962 |
|
| Construction and Engineering — 0.5% | | |
| EMCOR Group, Inc. | 12,840 |
| 978,151 |
|
| Consumer Finance — 2.4% | | |
| American Express Co. | 17,939 |
| 1,758,022 |
|
| Discover Financial Services | 14,029 |
| 987,782 |
|
OneMain Holdings, Inc.(2) | 12,525 |
| 416,957 |
|
| Synchrony Financial | 50,520 |
| 1,686,358 |
|
| | | 4,849,119 |
|
| Containers and Packaging — 0.1% | | |
Berry Global Group, Inc.(2) | 4,530 |
| 208,108 |
|
| Diversified Consumer Services — 2.0% | | |
Adtalem Global Education, Inc.(2) | 31,672 |
| 1,523,423 |
|
| Graham Holdings Co., Class B | 2,032 |
| 1,190,955 |
|
Grand Canyon Education, Inc.(2) | 11,545 |
| 1,288,538 |
|
| | | 4,002,916 |
|
| Diversified Financial Services — 0.8% | | |
Berkshire Hathaway, Inc., Class B(2) | 8,408 |
| 1,569,353 |
|
| Diversified Telecommunication Services — 0.7% | | |
| AT&T, Inc. | 37,406 |
| 1,201,099 |
|
| Verizon Communications, Inc. | 4,715 |
| 237,211 |
|
| | | 1,438,310 |
|
| Electrical Equipment — 0.2% | | |
Generac Holdings, Inc.(2) | 3,198 |
| 165,433 |
|
nVent Electric plc(2) | 7,834 |
| 196,633 |
|
| | | 362,066 |
|
| Electronic Equipment, Instruments and Components — 0.6% | | |
| Jabil, Inc. | 1,199 |
| 33,164 |
|
Zebra Technologies Corp., Class A(2) | 8,692 |
| 1,245,129 |
|
| | | 1,278,293 |
|
| Energy Equipment and Services — 2.1% | | |
Diamond Offshore Drilling, Inc.(2) | 55,160 |
| 1,150,638 |
|
Halliburton Co.(1) | 41,092 |
| 1,851,605 |
|
| Schlumberger Ltd. | 17,911 |
| 1,200,574 |
|
| | | 4,202,817 |
|
| Equity Real Estate Investment Trusts (REITs) — 4.7% | | |
| Forest City Realty Trust, Inc., Class A | 46,871 |
| 1,069,128 |
|
|
| | | | | |
| | Shares | Value |
| Gaming and Leisure Properties, Inc. | 33,271 |
| $ | 1,191,102 |
|
| Host Hotels & Resorts, Inc. | 24,064 |
| 507,028 |
|
| Park Hotels & Resorts, Inc. | 49,468 |
| 1,515,205 |
|
| PotlatchDeltic Corp. | 29,644 |
| 1,507,397 |
|
| PS Business Parks, Inc. | 12,380 |
| 1,590,830 |
|
| Ryman Hospitality Properties, Inc. | 6,759 |
| 562,011 |
|
| Select Income REIT | 32,923 |
| 739,780 |
|
| Weingarten Realty Investors | 21,424 |
| 660,073 |
|
| | | 9,342,554 |
|
| Food and Staples Retailing — 0.6% | | |
Performance Food Group Co.(2) | 28,990 |
| 1,063,933 |
|
United Natural Foods, Inc.(2) | 2,559 |
| 109,167 |
|
| | | 1,173,100 |
|
| Food Products — 0.6% | | |
Nomad Foods Ltd.(2) | 40,536 |
| 777,886 |
|
| Pinnacle Foods, Inc. | 6,609 |
| 429,981 |
|
| | | 1,207,867 |
|
| Health Care Equipment and Supplies — 6.2% | | |
Abbott Laboratories(1) | 39,448 |
| 2,405,934 |
|
| Cooper Cos., Inc. (The) | 636 |
| 149,746 |
|
Edwards Lifesciences Corp.(2) | 6,393 |
| 930,629 |
|
Globus Medical, Inc., Class A(2) | 33,867 |
| 1,708,929 |
|
Haemonetics Corp.(2) | 9,284 |
| 832,589 |
|
| Hill-Rom Holdings, Inc. | 16,859 |
| 1,472,465 |
|
Intuitive Surgical, Inc.(2) | 2,471 |
| 1,182,324 |
|
Masimo Corp.(2) | 2,069 |
| 202,038 |
|
| Medtronic plc | 14,336 |
| 1,227,305 |
|
| STERIS plc | 7,661 |
| 804,482 |
|
Varian Medical Systems, Inc.(2) | 4,124 |
| 468,981 |
|
| Zimmer Biomet Holdings, Inc. | 8,919 |
| 993,933 |
|
| | | 12,379,355 |
|
| Health Care Providers and Services — 3.2% | | |
| Cigna Corp. | 9,602 |
| 1,631,860 |
|
Express Scripts Holding Co.(2) | 4,867 |
| 375,781 |
|
| Humana, Inc. | 2,691 |
| 800,923 |
|
UnitedHealth Group, Inc.(1) | 14,883 |
| 3,651,395 |
|
| | | 6,459,959 |
|
| Health Care Technology — 1.0% | | |
athenahealth, Inc.(2) | 2,243 |
| 356,951 |
|
Cerner Corp.(2) | 27,763 |
| 1,659,950 |
|
| | | 2,016,901 |
|
| Hotels, Restaurants and Leisure — 2.0% | | |
Hilton Grand Vacations, Inc.(2) | 10,459 |
| 362,927 |
|
| International Speedway Corp., Class A | 5,512 |
| 246,386 |
|
| Las Vegas Sands Corp. | 21,007 |
| 1,604,095 |
|
| Marriott International, Inc., Class A | 11,678 |
| 1,478,435 |
|
| Vail Resorts, Inc. | 962 |
| 263,771 |
|
| | | 3,955,614 |
|
| Household Durables — 1.4% | | |
| Garmin Ltd. | 12,180 |
| 742,980 |
|
|
| | | | | |
| | Shares | Value |
| KB Home | 21,567 |
| $ | 587,485 |
|
| PulteGroup, Inc. | 27,049 |
| 777,659 |
|
| Toll Brothers, Inc. | 19,333 |
| 715,127 |
|
| | | 2,823,251 |
|
| Household Products — 0.9% | | |
| Kimberly-Clark Corp. | 16,320 |
| 1,719,149 |
|
| Procter & Gamble Co. (The) | 1,786 |
| 139,415 |
|
| | | 1,858,564 |
|
| Independent Power and Renewable Electricity Producers — 0.8% | |
| AES Corp. | 113,880 |
| 1,527,131 |
|
| Industrial Conglomerates — 1.2% | | |
Honeywell International, Inc.(1) | 16,216 |
| 2,335,915 |
|
| Insurance — 1.0% | | |
| Assurant, Inc. | 2,309 |
| 238,959 |
|
| Hanover Insurance Group, Inc. (The) | 1,406 |
| 168,101 |
|
| Hartford Financial Services Group, Inc. (The) | 29,522 |
| 1,509,460 |
|
| | | 1,916,520 |
|
| Internet and Direct Marketing Retail — 4.1% | | |
Amazon.com, Inc.(1)(2) | 4,302 |
| 7,312,540 |
|
Shutterfly, Inc.(2) | 10,616 |
| 955,758 |
|
| | | 8,268,298 |
|
| Internet Software and Services — 7.9% | | |
Alphabet, Inc., Class A(1)(2) | 6,473 |
| 7,309,247 |
|
eBay, Inc.(2) | 35,242 |
| 1,277,875 |
|
Facebook, Inc., Class A(1)(2) | 28,138 |
| 5,467,776 |
|
| LogMeIn, Inc. | 1,264 |
| 130,508 |
|
Stamps.com, Inc.(2) | 6,039 |
| 1,528,169 |
|
| | | 15,713,575 |
|
| IT Services — 3.7% | | |
| Accenture plc, Class A | 7,118 |
| 1,164,434 |
|
Acxiom Corp.(2) | 28,674 |
| 858,786 |
|
| Convergys Corp. | 3,918 |
| 95,756 |
|
International Business Machines Corp.(1) | 17,727 |
| 2,476,462 |
|
| Total System Services, Inc. | 15,807 |
| 1,336,008 |
|
| Visa, Inc., Class A | 10,476 |
| 1,387,546 |
|
| | | 7,318,992 |
|
| Leisure Products — 0.7% | | |
| Brunswick Corp. | 22,047 |
| 1,421,591 |
|
| Machinery — 4.3% | | |
| Allison Transmission Holdings, Inc. | 32,514 |
| 1,316,492 |
|
| Caterpillar, Inc. | 12,172 |
| 1,651,375 |
|
| Hillenbrand, Inc. | 6,285 |
| 296,338 |
|
| Ingersoll-Rand plc | 19,472 |
| 1,747,222 |
|
| Oshkosh Corp. | 17,922 |
| 1,260,275 |
|
| Pentair plc | 14,201 |
| 597,578 |
|
| Terex Corp. | 30,404 |
| 1,282,745 |
|
| Toro Co. (The) | 7,131 |
| 429,643 |
|
| | | 8,581,668 |
|
| Media — 0.5% | | |
AMC Networks, Inc., Class A(2) | 11,742 |
| 730,352 |
|
|
| | | | | |
| | Shares | Value |
| Walt Disney Co. (The) | 3,227 |
| $ | 338,222 |
|
| | | 1,068,574 |
|
| Metals and Mining — 0.3% | | |
| Reliance Steel & Aluminum Co. | 6,065 |
| 530,930 |
|
| Multiline Retail — 1.2% | | |
| Kohl's Corp. | 18,141 |
| 1,322,479 |
|
| Macy's, Inc. | 26,250 |
| 982,537 |
|
| | | 2,305,016 |
|
| Oil, Gas and Consumable Fuels — 8.1% | | |
Chevron Corp.(1) | 20,296 |
| 2,566,023 |
|
| ConocoPhillips | 8,952 |
| 623,238 |
|
Continental Resources, Inc.(2) | 13,699 |
| 887,147 |
|
Exxon Mobil Corp.(1) | 25,062 |
| 2,073,379 |
|
| HollyFrontier Corp. | 25,128 |
| 1,719,509 |
|
| Marathon Petroleum Corp. | 18,385 |
| 1,289,892 |
|
| PBF Energy, Inc., Class A | 33,366 |
| 1,399,036 |
|
| Phillips 66 | 16,764 |
| 1,882,765 |
|
| Plains GP Holdings LP, Class A | 61,726 |
| 1,475,869 |
|
Southwestern Energy Co.(2) | 301,393 |
| 1,597,383 |
|
| Valero Energy Corp. | 5,182 |
| 574,321 |
|
| | | 16,088,562 |
|
| Paper and Forest Products — 0.7% | | |
| Louisiana-Pacific Corp. | 55,069 |
| 1,498,978 |
|
| Personal Products — 1.6% | | |
Edgewell Personal Care Co.(2) | 33,327 |
| 1,681,681 |
|
| Nu Skin Enterprises, Inc., Class A | 18,243 |
| 1,426,420 |
|
| | | 3,108,101 |
|
| Pharmaceuticals — 4.6% | | |
| Allergan plc | 5,861 |
| 977,146 |
|
| Bristol-Myers Squibb Co. | 22,826 |
| 1,263,191 |
|
| Eli Lilly & Co. | 2,406 |
| 205,304 |
|
Horizon Pharma plc(2) | 29,909 |
| 495,293 |
|
Johnson & Johnson(1) | 19,502 |
| 2,366,373 |
|
| Merck & Co., Inc. | 15,143 |
| 919,180 |
|
Pfizer, Inc.(1) | 63,358 |
| 2,298,628 |
|
| Zoetis, Inc. | 8,491 |
| 723,348 |
|
| | | 9,248,463 |
|
| Professional Services — 2.3% | | |
ASGN, Inc.(2) | 991 |
| 77,486 |
|
| Dun & Bradstreet Corp. (The) | 12,376 |
| 1,517,917 |
|
| Insperity, Inc. | 8,456 |
| 805,434 |
|
| ManpowerGroup, Inc. | 10,806 |
| 929,964 |
|
| Robert Half International, Inc. | 20,069 |
| 1,306,492 |
|
| | | 4,637,293 |
|
| Real Estate Management and Development — 0.6% | | |
| Jones Lang LaSalle, Inc. | 7,628 |
| 1,266,172 |
|
| Road and Rail — 0.7% | | |
| Ryder System, Inc. | 4,578 |
| 328,975 |
|
| Werner Enterprises, Inc. | 26,926 |
| 1,011,071 |
|
| | | 1,340,046 |
|
|
| | | | | |
| | Shares | Value |
| Semiconductors and Semiconductor Equipment — 5.7% | | |
Advanced Energy Industries, Inc.(2) | 3,854 |
| $ | 223,879 |
|
| Applied Materials, Inc. | 38,221 |
| 1,765,428 |
|
| Broadcom, Inc. | 6,927 |
| 1,680,767 |
|
Intel Corp.(1) | 74,960 |
| 3,726,262 |
|
| KLA-Tencor Corp. | 3,985 |
| 408,582 |
|
| Lam Research Corp. | 9,978 |
| 1,724,697 |
|
| MKS Instruments, Inc. | 3,170 |
| 303,369 |
|
| Skyworks Solutions, Inc. | 1,250 |
| 120,813 |
|
Texas Instruments, Inc.(1) | 13,418 |
| 1,479,334 |
|
| | | 11,433,131 |
|
| Software — 8.5% | | |
Activision Blizzard, Inc.(1) | 26,032 |
| 1,986,762 |
|
Adobe Systems, Inc.(1)(2) | 8,267 |
| 2,015,577 |
|
Cadence Design Systems, Inc.(2) | 35,615 |
| 1,542,486 |
|
Citrix Systems, Inc.(2) | 6,527 |
| 684,291 |
|
Electronic Arts, Inc.(2) | 3,147 |
| 443,790 |
|
| Intuit, Inc. | 4,702 |
| 960,642 |
|
Microsoft Corp.(1) | 65,456 |
| 6,454,616 |
|
| Oracle Corp. (New York) | 24,688 |
| 1,087,753 |
|
Synopsys, Inc.(2) | 19,575 |
| 1,675,033 |
|
VMware, Inc., Class A(2) | 376 |
| 55,261 |
|
| | | 16,906,211 |
|
| Specialty Retail — 1.4% | | |
AutoZone, Inc.(2) | 2,279 |
| 1,529,049 |
|
| Best Buy Co., Inc. | 12,072 |
| 900,330 |
|
| Ross Stores, Inc. | 5,465 |
| 463,159 |
|
| | | 2,892,538 |
|
| Technology Hardware, Storage and Peripherals — 3.9% | | |
Apple, Inc.(1) | 33,997 |
| 6,293,185 |
|
| Western Digital Corp. | 19,144 |
| 1,481,937 |
|
| | | 7,775,122 |
|
| Textiles, Apparel and Luxury Goods — 2.7% | | |
Deckers Outdoor Corp.(1)(2) | 16,449 |
| 1,856,928 |
|
Michael Kors Holdings Ltd.(2) | 26,262 |
| 1,749,049 |
|
| Ralph Lauren Corp. | 10,895 |
| 1,369,719 |
|
| Tapestry, Inc. | 8,362 |
| 390,589 |
|
| | | 5,366,285 |
|
| Thrifts and Mortgage Finance — 0.2% | | |
Essent Group Ltd.(2) | 10,523 |
| 376,934 |
|
| Trading Companies and Distributors — 0.7% | | |
United Rentals, Inc.(2) | 9,613 |
| 1,419,071 |
|
| Wireless Telecommunication Services — 0.8% | | |
T-Mobile US, Inc.(2) | 25,321 |
| 1,512,930 |
|
TOTAL COMMON STOCKS
(Cost $205,480,846) | | 256,802,200 |
|
| TEMPORARY CASH INVESTMENTS — 1.5% | | |
| Repurchase Agreement, BMO Capital Markets Corp., (collateralized by various U.S. Treasury obligations, 1.375% - 3.75%, 2/15/19 - 11/15/47, valued at $1,627,375), in a joint trading account at 1.75%, dated 6/29/18, due 7/2/18 (Delivery value $1,594,756) | | 1,594,523 |
|
|
| | | | | |
| | Shares | Value |
| Repurchase Agreement, Fixed Income Clearing Corp., (collateralized by various U.S. Treasury obligations, 2.75%, 2/15/28, valued at $1,356,965), at 0.90%, dated 6/29/18, due 7/2/18 (Delivery value $1,329,100) | | $ | 1,329,000 |
|
| State Street Institutional U.S. Government Money Market Fund, Premier Class | 10,307 |
| 10,307 |
|
TOTAL TEMPORARY CASH INVESTMENTS
(Cost $2,933,830) | | 2,933,830 |
|
TOTAL INVESTMENT SECURITIES BEFORE SECURITIES SOLD SHORT — 130.3%
(Cost $208,414,676) | 259,736,030 |
|
| COMMON STOCKS SOLD SHORT — (29.6)% | | |
| Aerospace and Defense — (0.6)% | | |
| BWX Technologies, Inc. | (19,836 | ) | (1,236,180 | ) |
| Airlines — (0.5)% | | |
| Allegiant Travel Co. | (1,465 | ) | (203,562 | ) |
| Spirit Airlines, Inc. | (22,341 | ) | (812,095 | ) |
| | | (1,015,657 | ) |
| Banks — (3.0)% | | |
| Home BancShares, Inc. | (64,100 | ) | (1,446,096 | ) |
| Pinnacle Financial Partners, Inc. | (24,203 | ) | (1,484,854 | ) |
| Sterling Bancorp | (66,093 | ) | (1,553,186 | ) |
| Texas Capital Bancshares, Inc. | (3,512 | ) | (321,348 | ) |
| United Bankshares, Inc. | (33,308 | ) | (1,212,411 | ) |
| | | (6,017,895 | ) |
| Biotechnology — (1.4)% | | |
| Alnylam Pharmaceuticals, Inc. | (3,197 | ) | (314,873 | ) |
| Blueprint Medicines Corp. | (5,950 | ) | (377,706 | ) |
| FibroGen, Inc. | (8,009 | ) | (501,363 | ) |
| Global Blood Therapeutics, Inc. | (10,405 | ) | (470,306 | ) |
| Sage Therapeutics, Inc. | (3,234 | ) | (506,218 | ) |
| Sarepta Therapeutics, Inc. | (4,069 | ) | (537,840 | ) |
| | | (2,708,306 | ) |
| Capital Markets — (0.5)% | | |
| Brookfield Asset Management, Inc., Class A | (19,921 | ) | (807,597 | ) |
| Eaton Vance Corp. | (4,805 | ) | (250,773 | ) |
| | | (1,058,370 | ) |
| Chemicals — (1.0)% | | |
| Ecolab, Inc. | (1,630 | ) | (228,738 | ) |
| HB Fuller Co. | (6,979 | ) | (374,633 | ) |
| Mosaic Co. (The) | (18,667 | ) | (523,609 | ) |
| Valvoline, Inc. | (42,967 | ) | (926,798 | ) |
| | | (2,053,778 | ) |
| Commercial Services and Supplies — (1.2)% | | |
| Covanta Holding Corp. | (88,003 | ) | (1,452,050 | ) |
| Healthcare Services Group, Inc. | (22,774 | ) | (983,609 | ) |
| | | (2,435,659 | ) |
| Communications Equipment — (0.4)% | | |
| EchoStar Corp., Class A | (16,111 | ) | (715,328 | ) |
| Construction and Engineering — (0.4)% | | |
| MasTec, Inc. | (16,146 | ) | (819,409 | ) |
Construction Materials† | | |
| Vulcan Materials Co. | (577 | ) | (74,468 | ) |
|
| | | | | |
| | Shares | Value |
| Consumer Finance — (0.7)% | | |
| SLM Corp. | (125,446 | ) | $ | (1,436,357 | ) |
| Distributors — (0.5)% | | |
| Core-Mark Holding Co., Inc. | (45,248 | ) | (1,027,130 | ) |
| Diversified Telecommunication Services — (0.7)% | | |
| Zayo Group Holdings, Inc. | (35,611 | ) | (1,299,089 | ) |
| Electronic Equipment, Instruments and Components — (0.8)% | | |
| II-VI, Inc. | (34,895 | ) | (1,516,188 | ) |
| Energy Equipment and Services — (0.4)% | | |
| Patterson-UTI Energy, Inc. | (43,777 | ) | (787,986 | ) |
| Food and Staples Retailing — (0.5)% | | |
| Casey's General Stores, Inc. | (3,243 | ) | (340,774 | ) |
| PriceSmart, Inc. | (7,402 | ) | (669,881 | ) |
| | | (1,010,655 | ) |
| Health Care Equipment and Supplies — (1.7)% | | |
| Avanos Medical, Inc. | (27,986 | ) | (1,602,199 | ) |
| Insulet Corp. | (16,801 | ) | (1,439,846 | ) |
| Integra LifeSciences Holdings Corp. | (4,696 | ) | (302,469 | ) |
| | | (3,344,514 | ) |
| Health Care Providers and Services — (0.6)% | | |
| Henry Schein, Inc. | (13,349 | ) | (969,671 | ) |
| LifePoint Health, Inc. | (5,702 | ) | (278,258 | ) |
| | | (1,247,929 | ) |
| Independent Power and Renewable Electricity Producers — (0.2)% | |
| Ormat Technologies, Inc. | (6,711 | ) | (356,958 | ) |
| Insurance — (0.1)% | | |
| RLI Corp. | (4,036 | ) | (267,143 | ) |
| Internet Software and Services — (0.9)% | | |
| 2U, Inc. | (21,226 | ) | (1,773,645 | ) |
| IT Services — (0.9)% | | |
| Gartner, Inc. | (11,293 | ) | (1,500,840 | ) |
| WEX, Inc. | (1,906 | ) | (363,055 | ) |
| | | (1,863,895 | ) |
| Leisure Products — (0.1)% | | |
| Mattel, Inc. | (12,899 | ) | (211,802 | ) |
| Life Sciences Tools and Services — (0.1)% | | |
| Syneos Health, Inc. | (5,657 | ) | (265,313 | ) |
| Machinery — (2.3)% | | |
| Colfax Corp. | (46,817 | ) | (1,434,941 | ) |
| Flowserve Corp. | (15,939 | ) | (643,936 | ) |
| John Bean Technologies Corp. | (12,547 | ) | (1,115,428 | ) |
| Middleby Corp. (The) | (3,267 | ) | (341,140 | ) |
| Trinity Industries, Inc. | (29,449 | ) | (1,008,923 | ) |
| | | (4,544,368 | ) |
| Marine — (0.2)% | | |
| Kirby Corp. | (5,346 | ) | (446,926 | ) |
| Media — (0.3)% | | |
| Loral Space & Communications, Inc. | (15,274 | ) | (574,302 | ) |
| Metals and Mining — (0.4)% | | |
| New Gold, Inc. | (380,219 | ) | (790,856 | ) |
|
| | | | | |
| | Shares | Value |
| Multi-Utilities — (0.2)% | | |
| NiSource, Inc. | (13,523 | ) | $ | (355,384 | ) |
| Oil, Gas and Consumable Fuels — (3.4)% | | |
| Cheniere Energy, Inc. | (18,281 | ) | (1,191,738 | ) |
| Parsley Energy, Inc., Class A | (8,459 | ) | (256,138 | ) |
| PDC Energy, Inc. | (2,515 | ) | (152,032 | ) |
| QEP Resources, Inc. | (25,542 | ) | (313,145 | ) |
| RSP Permian, Inc. | (3,385 | ) | (149,008 | ) |
| SM Energy Co. | (66,491 | ) | (1,708,154 | ) |
| Targa Resources Corp. | (31,673 | ) | (1,567,497 | ) |
| WPX Energy, Inc. | (80,183 | ) | (1,445,699 | ) |
| | | (6,783,411 | ) |
| Personal Products — (0.4)% | | |
| Coty, Inc., Class A | (63,264 | ) | (892,022 | ) |
| Pharmaceuticals — (0.1)% | | |
| Medicines Co. (The) | (5,534 | ) | (203,098 | ) |
| Professional Services — (0.1)% | | |
| TriNet Group, Inc. | (2,533 | ) | (141,696 | ) |
| Real Estate Management and Development — (1.3)% | | |
| Howard Hughes Corp. (The) | (10,069 | ) | (1,334,142 | ) |
| Kennedy-Wilson Holdings, Inc. | (56,965 | ) | (1,204,810 | ) |
| | | (2,538,952 | ) |
| Semiconductors and Semiconductor Equipment — (0.7)% | | |
| Cree, Inc. | (33,686 | ) | (1,400,327 | ) |
| Software — (0.5)% | | |
| Ellie Mae, Inc. | (1,479 | ) | (153,579 | ) |
| Guidewire Software, Inc. | (3,120 | ) | (276,994 | ) |
| HubSpot, Inc. | (4,069 | ) | (510,253 | ) |
| | | (940,826 | ) |
| Specialty Retail — (0.6)% | | |
| Monro, Inc. | (20,053 | ) | (1,165,079 | ) |
| Thrifts and Mortgage Finance — (0.1)% | | |
| TFS Financial Corp. | (10,613 | ) | (167,367 | ) |
| Trading Companies and Distributors — (1.7)% | | |
| NOW, Inc. | (131,218 | ) | (1,749,136 | ) |
| SiteOne Landscape Supply, Inc. | (20,258 | ) | (1,701,064 | ) |
| | | (3,450,200 | ) |
| Transportation Infrastructure — (0.1)% | | |
| Macquarie Infrastructure Corp. | (3,637 | ) | (153,481 | ) |
TOTAL COMMON STOCKS SOLD SHORT
(Proceeds $57,436,211) | | (59,091,949 | ) |
| OTHER ASSETS AND LIABILITIES — (0.7)% | | (1,349,300 | ) |
| TOTAL NET ASSETS — 100.0% | | $ | 199,294,781 |
|
|
| | |
| NOTES TO SCHEDULE OF INVESTMENTS |
| |
| † | Category is less than 0.05% of total net assets. |
| |
| (1) | Security, or a portion thereof, has been pledged at the custodian bank or with a broker for collateral requirements on securities sold short. At the period end, the aggregate value of securities pledged was $75,487,332. |
See Notes to Financial Statements.
|
|
| Statement of Assets and Liabilities |
|
| | | |
| JUNE 30, 2018 |
| Assets |
| Investment securities, at value (cost of $208,414,676) | $ | 259,736,030 |
|
| Receivable for investments sold | 9,658,053 |
|
| Receivable for capital shares sold | 22,432 |
|
| Dividends and interest receivable | 188,349 |
|
| | 269,604,864 |
|
| | |
| Liabilities | |
| Securities sold short, at value (proceeds of $57,436,211) | 59,091,949 |
|
| Payable for investments purchased | 10,904,885 |
|
| Payable for capital shares redeemed | 182 |
|
| Accrued management fees | 215,571 |
|
| Distribution and service fees payable | 447 |
|
| Dividend expense payable on securities sold short | 47,846 |
|
| Fees and charges payable on borrowings for securities sold short | 49,203 |
|
| | 70,310,083 |
|
| | |
| Net Assets | $ | 199,294,781 |
|
| | |
| Net Assets Consist of: |
| Capital (par value and paid-in surplus) | $ | 140,558,172 |
|
| Undistributed net realized gain | 9,070,993 |
|
| Net unrealized appreciation | 49,665,616 |
|
| | $ | 199,294,781 |
|
|
| | | | | | |
| | Net Assets | Shares Outstanding | Net Asset Value Per Share |
| Investor Class, $0.01 Par Value |
| $198,237,659 |
| 12,693,930 |
| $15.62 |
| I Class, $0.01 Par Value |
| $5,277 |
| 338 |
| $15.61 |
| A Class, $0.01 Par Value |
| $661,778 |
| 42,428 |
| $15.60* |
| C Class, $0.01 Par Value |
| $153,387 |
| 10,134 |
| $15.14 |
| R Class, $0.01 Par Value |
| $236,680 |
| 15,263 |
| $15.51 |
*Maximum offering price $16.55 (net asset value divided by 0.9425).
See Notes to Financial Statements.
|
| | | |
| YEAR ENDED JUNE 30, 2018 |
| Investment Income (Loss) |
| Income: | |
| Dividends (net of foreign taxes withheld of $1,457) | $ | 4,499,591 |
|
| Interest | 19,770 |
|
| | 4,519,361 |
|
| | |
| Expenses: | |
| Dividend expense on securities sold short | 583,773 |
|
| Fees and charges on borrowings for securities sold short | 501,164 |
|
| Management fees | 2,500,650 |
|
| Distribution and service fees: | |
| A Class | 1,463 |
|
| C Class | 2,779 |
|
| R Class | 1,045 |
|
| Directors' fees and expenses | 11,811 |
|
| | 3,602,685 |
|
| | |
| Net investment income (loss) | 916,676 |
|
| | |
| Realized and Unrealized Gain (Loss) | |
| Net realized gain (loss) on: | |
| Investment transactions | 17,809,376 |
|
| Securities sold short transactions | (8,325,783 | ) |
| | 9,483,593 |
|
| | |
| Change in net unrealized appreciation (depreciation) on: | |
| Investments | 14,975,861 |
|
| Securities sold short | (1,480,660 | ) |
| | 13,495,201 |
|
| | |
| Net realized and unrealized gain (loss) | 22,978,794 |
|
| | |
| Net Increase (Decrease) in Net Assets Resulting from Operations | $ | 23,895,470 |
|
See Notes to Financial Statements.
|
|
| Statement of Changes in Net Assets |
|
| | | | | | |
| YEARS ENDED JUNE 30, 2018 AND JUNE 30, 2017 |
| Increase (Decrease) in Net Assets | June 30, 2018 | June 30, 2017 |
| Operations | | |
| Net investment income (loss) | $ | 916,676 |
| $ | 776,359 |
|
| Net realized gain (loss) | 9,483,593 |
| 12,738,228 |
|
| Change in net unrealized appreciation (depreciation) | 13,495,201 |
| 12,616,076 |
|
| Net increase (decrease) in net assets resulting from operations | 23,895,470 |
| 26,130,663 |
|
| | | |
| Distributions to Shareholders | | |
| From net investment income: | | |
| Investor Class | (859,233 | ) | (690,746 | ) |
| I Class | (129 | ) | (6,114 | ) |
| A Class | (1,208 | ) | (844 | ) |
| R Class | (136 | ) | — |
|
| From net realized gains: | | |
| Investor Class | (6,245,295 | ) | — |
|
| I Class | (1,410 | ) | — |
|
| A Class | (16,693 | ) | — |
|
| C Class | (8,914 | ) | — |
|
| R Class | (7,307 | ) | — |
|
| Decrease in net assets from distributions | (7,140,325 | ) | (697,704 | ) |
| | | |
| Capital Share Transactions | | |
| Net increase (decrease) in net assets from capital share transactions (Note 5) | 3,279,313 |
| (7,976,731 | ) |
| | | |
| Net increase (decrease) in net assets | 20,034,458 |
| 17,456,228 |
|
| | | |
| Net Assets | | |
| Beginning of period | 179,260,323 |
| 161,804,095 |
|
| End of period | $ | 199,294,781 |
| $ | 179,260,323 |
|
| | | |
See Notes to Financial Statements.
|
| | | |
| YEAR ENDED JUNE 30, 2018 |
| Cash Flows From (Used In) Operating Activities | |
| Net increase (decrease) in net assets resulting from operations | $ | 23,895,470 |
|
| Adjustments to reconcile net increase (decrease) in net assets resulting from operations to net cash from (used in) operating activities: | |
| Purchases of investment securities | (196,506,584 | ) |
| Proceeds from investments sold | 200,525,532 |
|
| Purchases to cover securities sold short | (54,689,562 | ) |
| Proceeds from securities sold short | 52,888,880 |
|
| (Increase) decrease in short-term investments | (548,863 | ) |
| (Increase) decrease in receivable for investments sold | (9,658,053 | ) |
| (Increase) decrease in dividends and interest receivable | 20,649 |
|
| Increase (decrease) in payable for investments purchased | 10,904,885 |
|
| Increase (decrease) in accrued management fees | 25,759 |
|
| Increase (decrease) in distribution and service fees payable | (49 | ) |
| Increase (decrease) in dividend expense payable on securities sold short | (11,283 | ) |
| Increase (decrease) in fees and charges payable on borrowings for securities sold short | 13,097 |
|
| Change in net unrealized (appreciation) depreciation on investments | (14,975,861 | ) |
| Net realized (gain) loss on investment transactions | (17,809,376 | ) |
| Change in net unrealized (appreciation) depreciation on securities sold short | 1,480,660 |
|
| Net realized (gain) loss on securities sold short transactions | 8,325,783 |
|
| Net cash from (used in) operating activities | 3,881,084 |
|
| | |
| Cash Flows From (Used In) Financing Activities | |
| Proceeds from shares sold | 7,129,421 |
|
| Payments for shares redeemed | (10,996,527 | ) |
| Distributions paid, net of reinvestments | (13,978 | ) |
| Net cash from (used in) financing activities | (3,881,084 | ) |
| | |
| Net Increase (Decrease) In Cash | — |
|
| Cash at beginning of period | — |
|
| Cash at end of period | — |
|
| | |
| Supplemental disclosure of cash flow information: | |
| Non cash financing activities not included herein consist of all reinvestment of distributions of $7,126,347. |
See Notes to Financial Statements.
|
|
| Notes to Financial Statements |
JUNE 30, 2018
1. Organization
American Century Quantitative Equity Funds, Inc. (the corporation) is registered under the Investment Company Act of 1940, as amended (the 1940 Act), as an open-end management investment company and is organized as a Maryland corporation. Core Equity Plus Fund (the fund) is one fund in a series issued by the corporation. The fund’s investment objective is to seek long-term capital growth.
The fund offers the Investor Class, I Class, A Class, C Class and R Class. The A Class may incur an initial sales charge. The A Class and C Class may be subject to a contingent deferred sales charge.
2. Significant Accounting Policies
The following is a summary of significant accounting policies consistently followed by the fund in preparation of its financial statements. The fund is an investment company and follows accounting and reporting guidance in accordance with accounting principles generally accepted in the United States of America. This may require management to make certain estimates and assumptions at the date of the financial statements. Actual results could differ from these estimates. Management evaluated the impact of events or transactions occurring through the date the financial statements were issued that would merit recognition or disclosure.
Investment Valuations — The fund determines the fair value of its investments and computes its net asset value per share at the close of regular trading (usually 4 p.m. Eastern time) on the New York Stock Exchange (NYSE) on each day the NYSE is open. The Board of Directors has adopted valuation policies and procedures to guide the investment advisor in the fund’s investment valuation process and to provide methodologies for the oversight of the fund’s pricing function.
Equity securities that are listed or traded on a domestic securities exchange are valued at the last reported sales price or at the official closing price as provided by the exchange. Equity securities traded on foreign securities exchanges are generally valued at the closing price of such securities on the exchange where primarily traded or at the close of the NYSE, if that is earlier. If no last sales price is reported, or if local convention or regulation so provides, the mean of the latest bid and asked prices may be used. Securities traded over-the-counter are valued at the mean of the latest bid and asked prices, the last sales price, or the official closing price.
Open-end management investment companies are valued at the reported net asset value per share. Repurchase agreements are valued at cost, which approximates fair value.
If the fund determines that the market price for an investment is not readily available or the valuation methods mentioned above do not reflect an investment’s fair value, such investment is valued as determined in good faith by the Board of Directors or its delegate, in accordance with policies and procedures adopted by the Board of Directors. In its determination of fair value, the fund may review several factors including, but not limited to, market information regarding the specific investment or comparable investments and correlation with other investment types, futures indices or general market indicators. Circumstances that may cause the fund to use these procedures to value an investment include, but are not limited to: an investment has been declared in default or is distressed; trading in a security has been suspended during the trading day or a security is not actively trading on its principal exchange; prices received from a regular pricing source are deemed unreliable; or there is a foreign market holiday and no trading occurred.
The fund monitors for significant events occurring after the close of an investment’s primary exchange but before the fund’s net asset value per share is determined. Significant events may include, but are not limited to: corporate announcements and transactions; governmental action and political unrest that could impact a specific investment or an investment sector; or armed conflicts, natural disasters and similar events that could affect investments in a specific country or region. The fund also monitors for significant fluctuations between domestic and foreign markets, as evidenced by the U.S. market or such other indicators that the Board of Directors, or its delegate, deems appropriate. If significant fluctuations in foreign markets are identified, the fund may apply a model-derived factor to the closing price of equity securities traded on foreign securities exchanges. The factor is based on observable market data as provided by an independent pricing service.
Security Transactions — Security transactions are accounted for as of the trade date. Net realized gains and losses are determined on the identified cost basis, which is also used for federal income tax purposes.
Investment Income — Dividend income less foreign taxes withheld, if any, is recorded as of the ex-dividend date. Distributions received on securities that represent a return of capital or long-term capital gain are recorded as a reduction of cost of investments and/or as a realized gain. The fund may estimate the components of distributions received that may be considered nontaxable distributions or long-term capital gain distributions for income tax purposes. Interest income is recorded on the accrual basis and includes accretion of discounts and amortization of premiums.
Securities Sold Short — The fund enters into short sales, which is selling securities it does not own, as part of its normal investment activities. Upon selling a security short, the fund will segregate cash, cash equivalents or other appropriate liquid securities in at least an amount equal to the current market value of the securities sold short until the fund replaces the borrowed security. Interest earned on segregated cash for securities sold short, if any, is reflected as interest income. The fund is required to pay any dividends or interest due on securities sold short. Such dividends and interest are recorded as an expense. The fund may pay fees or charges on the assets borrowed for securities sold short. These fees are calculated daily based upon the value of each security sold short and a rate that is dependent on the availability of such security. Liabilities for securities sold short are valued daily and changes in value are recorded as change in net unrealized appreciation (depreciation) on securities sold short. The fund records realized gain (loss) on a security sold short when it is terminated by the fund and includes as a component of net realized gain (loss) on securities sold short transactions.
Repurchase Agreements — The fund may enter into repurchase agreements with institutions that American Century Investment Management, Inc. (ACIM) (the investment advisor) has determined are creditworthy pursuant to criteria adopted by the Board of Directors. The fund requires that the collateral, represented by securities, received in a repurchase transaction be transferred to the custodian in a manner sufficient to enable the fund to obtain those securities in the event of a default under the repurchase agreement. ACIM monitors, on a daily basis, the securities transferred to ensure the value, including accrued interest, of the securities under each repurchase agreement is equal to or greater than amounts owed to the fund under each repurchase agreement.
Joint Trading Account — Pursuant to an Exemptive Order issued by the Securities and Exchange Commission, the fund, along with certain other funds in the American Century Investments family of funds, may transfer uninvested cash balances into a joint trading account. These balances are invested in one or more repurchase agreements that are collateralized by U.S. Treasury or Agency obligations.
Segregated Assets — In accordance with the 1940 Act, the fund segregates assets on its books and records to cover certain types of investment securities and other financial instruments. ACIM monitors, on a daily basis, the securities segregated to ensure the fund designates a sufficient amount of liquid assets, marked-to-market daily. The fund may also receive assets or be required to pledge assets at the custodian bank or with a broker for collateral requirements.
Income Tax Status — It is the fund’s policy to distribute substantially all net investment income and net realized gains to shareholders and to otherwise qualify as a regulated investment company under provisions of the Internal Revenue Code. Accordingly, no provision has been made for income taxes. The fund files U.S. federal, state, local and non-U.S. tax returns as applicable. The fund's tax returns are subject to examination by the relevant taxing authority until expiration of the applicable statute of limitations, which is generally three years from the date of filing but can be longer in certain jurisdictions. At this time, management believes there are no uncertain tax positions which, based on their technical merit, would not be sustained upon examination and for which it is reasonably possible that the total amounts of unrecognized tax benefits will significantly change in the next twelve months.
Multiple Class — All shares of the fund represent an equal pro rata interest in the net assets of the class to which such shares belong, and have identical voting, dividend, liquidation and other rights and the same terms and conditions, except for class specific expenses and exclusive rights to vote on matters affecting only individual classes. Income, non-class specific expenses, and realized and unrealized capital gains and losses of the fund are allocated to each class of shares based on their relative net assets.
Distributions to Shareholders — Distributions from net investment income, if any, are generally declared and paid semiannually. Distributions from net realized gains, if any, are generally declared and paid annually.
Indemnifications — Under the corporation’s organizational documents, its officers and directors are indemnified against certain liabilities arising out of the performance of their duties to the fund. In addition, in the normal course of business, the fund enters into contracts that provide general indemnifications. The maximum exposure under these arrangements is unknown as this would involve future claims that may be made against a fund. The risk of material loss from such claims is considered by management to be remote.
Statement of Cash Flows — The Statement of Cash Flows has been prepared using the indirect method which requires net increase (decrease) in net assets resulting from operations to be adjusted to reconcile to net cash from (used in) operating activities. The beginning of period and end of period cash is the amount of domestic and foreign currency included in the fund's Statement of Assets and Liabilities and represents the cash on hand at the custodian bank and does not include any short-term investments or deposits for securities sold short.
3. Fees and Transactions with Related Parties
Certain officers and directors of the corporation are also officers and/or directors of American Century Companies, Inc. (ACC). The corporation’s investment advisor, ACIM, the corporation's distributor, American Century Investment Services, Inc. (ACIS), and the corporation’s transfer agent, American Century Services, LLC, are wholly owned, directly or indirectly, by ACC. Various funds issued by American Century Asset Allocation Portfolios, Inc. own, in aggregate, 93% of the shares of the fund. Related parties do not invest in the fund for the purpose of exercising management or control.
Management Fees — The corporation has entered into a management agreement with ACIM, under which ACIM provides the fund with investment advisory and management services in exchange for a single, unified management fee (the fee) per class. The agreement provides that all expenses of managing and operating the fund, except distribution and service fees, expenses on securities sold short, brokerage expenses, taxes, interest, fees and expenses of the independent directors (including legal counsel fees), and extraordinary expenses, will be paid by ACIM. The fee is computed and accrued daily based on each class's daily net assets and paid monthly in arrears. The difference in the fee among the classes is a result of their separate arrangements for non-Rule 12b-1 shareholder services. It is not the result of any difference in advisory or custodial fees or other expenses related to the management of the fund’s assets, which do not vary by class. The fee consists of (1) an Investment Category Fee based on the daily net assets of the fund and certain other accounts managed by the investment advisor that are in the same broad investment category as the fund and (2) a Complex Fee based on the assets of all the funds in the American Century Investments family of funds.
The Investment Category Fee range, the Complex Fee range and the effective annual management fee for each class for the period ended June 30, 2018 are as follows:
|
| | | |
| | Investment Category Fee Range | Complex Fee Range | Effective Annual Management Fee |
| Investor Class | 0.9680% to 1.1500% | 0.2500% to 0.3100% | 1.29% |
| I Class | 0.0500% to 0.1100% | 1.09% |
| A Class | 0.2500% to 0.3100% | 1.29% |
| C Class | 0.2500% to 0.3100% | 1.29% |
| R Class | 0.2500% to 0.3100% | 1.29% |
Distribution and Service Fees — The Board of Directors has adopted a separate Master Distribution and Individual Shareholder Services Plan for each of the A Class, C Class and R Class (collectively the plans), pursuant to Rule 12b-1 of the 1940 Act. The plans provide that the A Class will pay ACIS an annual distribution and service fee of 0.25%. The plans provide that the C Class will pay ACIS an annual distribution and service fee of 1.00%, of which 0.25% is paid for individual shareholder services and 0.75% is paid for distribution services. The plans provide that the R Class will pay ACIS an annual distribution and service fee of 0.50%. The fees are computed and accrued daily based on each class’s daily net assets and paid monthly in arrears. The fees are used to pay financial intermediaries for distribution and individual shareholder services. Fees incurred under the plans during the period ended June 30, 2018 are detailed in the Statement of Operations.
Directors' Fees and Expenses — The Board of Directors is responsible for overseeing the investment advisor’s management and operations of the fund. The directors receive detailed information about the fund and its investment advisor regularly throughout the year, and meet at least quarterly with management of the investment advisor to review reports about fund operations. The fund’s officers do not receive compensation from the fund.
Interfund Transactions — The fund may enter into security transactions with other American Century Investments funds and other client accounts of the investment advisor, in accordance with the 1940 Act rules and procedures adopted by the Board of Directors. The rules and procedures require, among other things, that these transactions be effected at the independent current market price of the security. During the period, the interfund purchases and sales were $2,571,965 and $2,269,498, respectively. The effect of interfund transactions on the Statement of Operations was $438,233 in net realized gain (loss) on investment transactions.
4. Investment Transactions
Purchases and sales of investment securities and securities sold short, excluding short-term investments, for the period ended June 30, 2018 were $250,892,019 and $252,572,486, respectively.
5. Capital Share Transactions
Transactions in shares of the fund were as follows:
|
| | | | | | | | | | |
| | Year ended June 30, 2018 | Year ended
June 30, 2017 |
| | Shares | Amount | Shares | Amount |
| Investor Class/Shares Authorized | 110,000,000 |
| | 110,000,000 |
| |
| Sold | 433,552 |
| $ | 6,761,560 |
| 323,498 |
| $ | 4,471,042 |
|
| Issued in reinvestment of distributions | 459,516 |
| 7,090,550 |
| 48,175 |
| 689,388 |
|
| Redeemed | (603,054 | ) | (9,339,634 | ) | (895,004 | ) | (12,281,314 | ) |
| | 290,014 |
| 4,512,476 |
| (523,331 | ) | (7,120,884 | ) |
| I Class/Shares Authorized | 25,000,000 |
| | 25,000,000 |
| |
| Sold | 778 |
| 11,358 |
| 42,677 |
| 545,597 |
|
| Issued in reinvestment of distributions | 100 |
| 1,539 |
| 427 |
| 6,114 |
|
| Redeemed | (71,046 | ) | (1,062,889 | ) | (84,833 | ) | (1,102,075 | ) |
| | (70,168 | ) | (1,049,992 | ) | (41,729 | ) | (550,364 | ) |
| A Class/Shares Authorized | 15,000,000 |
| | 15,000,000 |
| |
| Sold | 15,734 |
| 244,083 |
| 10,839 |
| 145,098 |
|
| Issued in reinvestment of distributions | 1,164 |
| 17,901 |
| 59 |
| 844 |
|
| Redeemed | (16,964 | ) | (256,974 | ) | (40,166 | ) | (560,991 | ) |
| | (66 | ) | 5,010 |
| (29,268 | ) | (415,049 | ) |
| C Class/Shares Authorized | 15,000,000 |
| | 15,000,000 |
| |
| Sold | 2,139 |
| 31,875 |
| 5,121 |
| 69,023 |
|
| Issued in reinvestment of distributions | 597 |
| 8,914 |
| — |
| — |
|
| Redeemed | (19,259 | ) | (284,363 | ) | (4,085 | ) | (54,338 | ) |
| | (16,523 | ) | (243,574 | ) | 1,036 |
| 14,685 |
|
| R Class/Shares Authorized | 15,000,000 |
| | 15,000,000 |
| |
| Sold | 6,532 |
| 100,315 |
| 7,505 |
| 101,733 |
|
| Issued in reinvestment of distributions | 487 |
| 7,443 |
| — |
| — |
|
| Redeemed | (3,343 | ) | (52,365 | ) | (528 | ) | (6,852 | ) |
| | 3,676 |
| 55,393 |
| 6,977 |
| 94,881 |
|
| Net increase (decrease) | 206,933 |
| $ | 3,279,313 |
| (586,315 | ) | $ | (7,976,731 | ) |
6. Fair Value Measurements
The fund’s investments valuation process is based on several considerations and may use multiple inputs to determine the fair value of the investments held by the fund. In conformity with accounting principles generally accepted in the United States of America, the inputs used to determine a valuation are classified into three broad levels.
| |
| • | Level 1 valuation inputs consist of unadjusted quoted prices in an active market for identical investments. |
| |
| • | Level 2 valuation inputs consist of direct or indirect observable market data (including quoted prices for comparable investments, evaluations of subsequent market events, interest rates, prepayment speeds, credit risk, etc.). These inputs also consist of quoted prices for identical investments initially expressed in local currencies that are adjusted through translation into U.S. dollars. |
| |
| • | Level 3 valuation inputs consist of unobservable data (including a fund’s own assumptions). |
The level classification is based on the lowest level input that is significant to the fair valuation measurement. The valuation inputs are not necessarily an indication of the risks associated with investing in these securities or other financial instruments. There were no significant transfers between levels during the period.
The following is a summary of the level classifications as of period end. The Schedule of Investments provides additional information on the fund’s portfolio holdings.
|
| | | | | | | | |
| | Level 1 | Level 2 | Level 3 |
| Assets |
| Investment Securities |
| Common Stocks | $ | 256,802,200 |
| — |
| — |
|
| Temporary Cash Investments | 10,307 |
| $ | 2,923,523 |
| — |
|
| | $ | 256,812,507 |
| $ | 2,923,523 |
| — |
|
| | | | |
| Liabilities |
| Securities Sold Short |
| Common Stocks | $ | 59,091,949 |
| — |
| — |
|
7. Risk Factors
The fund is subject to short sales risk. If the market price of a security increases after the fund borrows the security, the fund may suffer a loss when it replaces the borrowed security at the higher price. Any loss will be increased by the amount of compensation, interest or dividends, and transaction costs the fund must pay to the lender of the borrowed security.
The fund's investment strategy utilizes leverage, which can increase market exposure and subject the fund to greater risk and higher volatility.
If the fund is overweighted in a stock or sector, any negative development related to that stock or sector will have a greater impact on the fund than other funds that are not overweighted in that stock or sector.
The fund’s investment process may result in high portfolio turnover, which could mean high transaction costs, affecting both performance and capital gains tax liabilities to investors.
8. Federal Tax Information
The tax character of distributions paid during the years ended June 30, 2018 and June 30, 2017 were as follows:
|
| | | | | | |
| | 2018 | 2017 |
| Distributions Paid From | | |
| Ordinary income | $ | 859,900 |
| $ | 681,393 |
|
| Long-term capital gains | $ | 6,280,425 |
| $ | 16,311 |
|
The book-basis character of distributions made during the year from net investment income or net realized gains may differ from their ultimate characterization for federal income tax purposes. These differences reflect the differing character of certain income items and net realized gains and losses for financial statement and tax purposes, and may result in reclassification among certain capital accounts on the financial statements.
As of period end, the federal tax cost of investments and the components of distributable earnings on a tax-basis were as follows:
|
| | | |
| Federal tax cost of investments | $ | 208,452,319 |
|
| Gross tax appreciation of investments | $ | 56,291,109 |
|
| Gross tax depreciation of investments | (5,007,398 | ) |
| Net tax appreciation (depreciation) of investments | 51,283,711 |
|
| Gross tax appreciation on securities sold short | 3,027,606 |
|
| Gross tax depreciation on securities sold short | (5,364,335 | ) |
| Net tax appreciation (depreciation) | $ | 48,946,982 |
|
| Undistributed ordinary income | — |
|
| Accumulated long-term gains | $ | 9,789,627 |
|
The difference between book-basis and tax-basis unrealized appreciation (depreciation) is attributable primarily to the tax deferral of losses on unsettled short positions.
|
| | | | | | | | | | | | | | | | |
| For a Share Outstanding Throughout the Years Ended June 30 (except as noted) |
| Per-Share Data | Ratios and Supplemental Data |
| | | Income From Investment Operations: | Distributions From: | | | Ratio to Average Net Assets of: | | |
| | Net Asset Value, Beginning of Period | Net Investment Income (Loss)(1) | Net Realized and Unrealized Gain (Loss) | Total From Investment Operations | Net Investment Income | Net Realized Gains | Total Distributions | Net Asset Value, End of Period | Total Return(2) | Operating Expenses | Operating Expenses (excluding expenses on securities sold short) | Net Investment Income (Loss) | Portfolio Turnover Rate | Net Assets, End of Period (in thousands) |
| Investor Class |
| 2018 | $14.28 | 0.07 | 1.85 | 1.92 | (0.07) | (0.51) | (0.58) | $15.62 | 13.50% | 1.85% | 1.29% | 0.48% | 101% |
| $198,238 |
|
| 2017 | $12.31 | 0.06 | 1.97 | 2.03 | (0.06) | — | (0.06) | $14.28 | 16.46% | 1.97% | 1.30% | 0.45% | 111% |
| $177,112 |
|
| 2016 | $13.85 | 0.10 | (0.40) | (0.30) | (0.10) | (1.14) | (1.24) | $12.31 | (2.13)% | 1.89% | 1.30% | 0.82% | 107% |
| $159,174 |
|
| 2015 | $15.12 | 0.12 | 0.59 | 0.71 | (0.11) | (1.87) | (1.98) | $13.85 | 4.84% | 1.73% | 1.30% | 0.82% | 106% |
| $163,487 |
|
| 2014 | $12.84 | 0.10 | 3.25 | 3.35 | (0.11) | (0.96) | (1.07) | $15.12 | 26.86% | 1.77% | 1.30% | 0.69% | 104% |
| $148,620 |
|
| I Class |
| 2018 | $14.27 | 0.20 | 1.75 | 1.95 | (0.10) | (0.51) | (0.61) | $15.61 | 13.73% | 1.65% | 1.09% | 0.68% | 101% |
| $5 |
|
| 2017 | $12.31 | 0.09 | 1.95 | 2.04 | (0.08) | — | (0.08) | $14.27 | 16.61% | 1.77% | 1.10% | 0.65% | 111% |
| $1,006 |
|
| 2016 | $13.85 | 0.13 | (0.39) | (0.26) | (0.14) | (1.14) | (1.28) | $12.31 | (1.91)% | 1.69% | 1.10% | 1.02% | 107% |
| $1,381 |
|
| 2015 | $15.13 | 0.15 | 0.57 | 0.72 | (0.13) | (1.87) | (2.00) | $13.85 | 5.04% | 1.53% | 1.10% | 1.02% | 106% |
| $1,854 |
|
| 2014 | $12.84 | 0.13 | 3.26 | 3.39 | (0.14) | (0.96) | (1.10) | $15.13 | 27.19% | 1.57% | 1.10% | 0.89% | 104% |
| $5,993 |
|
| A Class |
| 2018 | $14.26 | 0.04 | 1.84 | 1.88 | (0.03) | (0.51) | (0.54) | $15.60 | 13.24% | 2.10% | 1.54% | 0.23% | 101% |
| $662 |
|
| 2017 | $12.30 | 0.03 | 1.95 | 1.98 | (0.02) | — | (0.02) | $14.26 | 16.10% | 2.22% | 1.55% | 0.20% | 111% |
| $606 |
|
| 2016 | $13.84 | 0.07 | (0.39) | (0.32) | (0.08) | (1.14) | (1.22) | $12.30 | (2.35)% | 2.14% | 1.55% | 0.57% | 107% |
| $882 |
|
| 2015 | $15.12 | 0.08 | 0.58 | 0.66 | (0.07) | (1.87) | (1.94) | $13.84 | 4.59% | 1.98% | 1.55% | 0.57% | 106% |
| $801 |
|
| 2014 | $12.84 | 0.06 | 3.25 | 3.31 | (0.07) | (0.96) | (1.03) | $15.12 | 26.55% | 2.02% | 1.55% | 0.44% | 104% |
| $753 |
|
|
| | | | | | | | | | | | | | | | |
| For a Share Outstanding Throughout the Years Ended June 30 (except as noted) |
| Per-Share Data | Ratios and Supplemental Data |
| | | Income From Investment Operations: | Distributions From: | | | Ratio to Average Net Assets of: | | |
| | Net Asset Value, Beginning of Period | Net Investment Income (Loss)(1) | Net Realized and Unrealized Gain (Loss) | Total From Investment Operations | Net Investment Income | Net Realized Gains | Total Distributions | Net Asset Value, End of Period | Total Return(2) | Operating Expenses | Operating Expenses (excluding expenses on securities sold short) | Net Investment Income (Loss) | Portfolio Turnover Rate | Net Assets, End of Period (in thousands) |
| C Class |
| 2018 | $13.93 | (0.06) | 1.78 | 1.72 | — | (0.51) | (0.51) | $15.14 | 12.40% | 2.85% | 2.29% | (0.52)% | 101% |
| $153 |
|
| 2017 | $12.09 | (0.07) | 1.91 | 1.84 | — | — | — | $13.93 | 15.22% | 2.97% | 2.30% | (0.55)% | 111% |
| $371 |
|
| 2016 | $13.69 | (0.02) | (0.40) | (0.42) | (0.04) | (1.14) | (1.18) | $12.09 | (3.09)% | 2.89% | 2.30% | (0.18)% | 107% |
| $310 |
|
| 2015 | $15.01 | (0.03) | 0.58 | 0.55 | — | (1.87) | (1.87) | $13.69 | 3.77% | 2.73% | 2.30% | (0.18)% | 106% |
| $736 |
|
| 2014 | $12.78 | (0.05) | 3.24 | 3.19 | — | (0.96) | (0.96) | $15.01 | 25.66% | 2.77% | 2.30% | (0.31)% | 104% |
| $768 |
|
| R Class |
| 2018 | $14.20 | (0.01) | 1.84 | 1.83 | (0.01) | (0.51) | (0.52) | $15.51 | 12.94% | 2.35% | 1.79% | (0.02)% | 101% |
| $237 |
|
| 2017 | $12.26 | —(3) | 1.94 | 1.94 | — | — | — | $14.20 | 15.82% | 2.47% | 1.80% | (0.05)% | 111% |
| $165 |
|
| 2016 | $13.83 | 0.03 | (0.39) | (0.36) | (0.07) | (1.14) | (1.21) | $12.26 | (2.62)% | 2.39% | 1.80% | 0.32% | 107% |
| $57 |
|
| 2015 | $15.11 | 0.04 | 0.59 | 0.63 | (0.04) | (1.87) | (1.91) | $13.83 | 4.28% | 2.23% | 1.80% | 0.32% | 106% |
| $9 |
|
| 2014 | $12.83 | 0.03 | 3.25 | 3.28 | (0.04) | (0.96) | (1.00) | $15.11 | 26.27% | 2.27% | 1.80% | 0.19% | 104% |
| $176 |
|
|
|
| Notes to Financial Highlights |
| |
| (1) | Computed using average shares outstanding throughout the period. |
| |
| (2) | Total returns are calculated based on the net asset value of the last business day and do not reflect applicable sales charges, if any. Total returns for periods less than one year are not annualized. |
| |
| (3) | Per-share amount was less than $0.005. |
See Notes to Financial Statements.
|
|
| Report of Independent Registered Public Accounting Firm |
To the Board of Directors of American Century Quantitative Equity Funds, Inc. and Shareholders of Core Equity Plus Fund
Opinion on the Financial Statements
We have audited the accompanying statement of assets and liabilities, including the schedule of investments, of Core Equity Plus Fund (one of the funds constituting American Century Quantitative Equity Funds, Inc., referred to hereafter as the "Fund") as of June 30, 2018, the related statements of operations and cash flows for the year ended June 30, 2018, the statement of changes in net assets for each of the two years in the period ended June 30, 2018, including the related notes, and the financial highlights for each of the five years in the period ended June 30, 2018 (collectively referred to as the “financial statements”). In our opinion, the financial statements present fairly, in all material respects, the financial position of the Fund as of June 30, 2018, the results of its operations and its cash flows for the year then ended, the changes in its net assets for each of the two years in the period ended June 30, 2018 and the financial highlights for each of the five years in the period ended June 30, 2018 in conformity with accounting principles generally accepted in the United States of America.
Basis for Opinion
These financial statements are the responsibility of the Fund’s management. Our responsibility is to express an opinion on the Fund’s financial statements based on our audits. We are a public accounting firm registered with the Public Company Accounting Oversight Board (United States) (“PCAOB”) and are required to be independent with respect to the Fund in accordance with the U.S. federal securities laws and the applicable rules and regulations of the Securities and Exchange Commission and the PCAOB.
We conducted our audits of these financial statements in accordance with the standards of the PCAOB. Those standards require that we plan and perform the audit to obtain reasonable assurance about whether the financial statements are free of material misstatement, whether due to error or fraud.
Our audits included performing procedures to assess the risks of material misstatement of the financial statements, whether due to error or fraud, and performing procedures that respond to those risks. Such procedures included examining, on a test basis, evidence regarding the amounts and disclosures in the financial statements. Our audits also included evaluating the accounting principles used and significant estimates made by management, as well as evaluating the overall presentation of the financial statements. Our procedures included confirmation of securities owned as of June 30, 2018 by correspondence with the custodian and brokers; when replies were not received from brokers, we performed other auditing procedures. We believe that our audits provide a reasonable basis for our opinion.
/s/ PricewaterhouseCoopers LLP
Kansas City, Missouri
August 16, 2018
We have served as the auditor of one or more investment companies in American Century Investments since 1997.
The Board of Directors
The individuals listed below serve as directors of the funds. Each director will continue to serve in this capacity until death, retirement, resignation or removal from office. The board has adopted a mandatory retirement age for directors who are not “interested persons,” as that term is defined in the Investment Company Act (independent directors). Independent directors shall retire by December 31 of the year in which they reach their 75th birthday; provided, however, that on or after January 1, 2022, independent trustees shall retire on December 31 of the year in which they reach their 76th birthday.
Mr. Thomas is an “interested person” because he currently serves as President and Chief Executive Officer of American Century Companies, Inc. (ACC), the parent company of American Century Investment Management, Inc. (ACIM or the advisor). The other directors (more than three-fourths of the total number) are independent. They are not employees, directors or officers of, and have no financial interest in, ACC or any of its wholly owned, direct or indirect, subsidiaries, including ACIM, American Century Investment Services, Inc. (ACIS) and American Century Services, LLC (ACS), and they do not have any other affiliations, positions or relationships that would cause them to be considered “interested persons” under the Investment Company Act. The directors serve in this capacity for eight (in the case of Jonathan S. Thomas, 16; and Ronald J. Gilson, 9) registered investment companies in the American Century Investments family of funds.
The following table presents additional information about the directors. The mailing address for each director other than Mr. Thomas is 1665 Charleston Road, Mountain View, California 94043. The mailing address for Mr. Thomas is 4500 Main Street, Kansas City, Missouri 64111.
|
| | | | | |
Name
(Year of Birth) | Position(s) Held with Funds | Length of Time Served | Principal Occupation(s) During Past 5 Years | Number of American Century Portfolios Overseen by Director | Other Directorships Held During Past 5 Years |
| Independent Directors |
|
|
Tanya S. Beder
(1955) | Director | Since 2011 | Chairman and CEO, SBCC Group Inc. (independent advisory services) (2006 to present) | 45 | CYS Investments, Inc.; Nabors Industries Ltd. |
Jeremy I. Bulow
(1954) | Director | Since 2011 | Professor of Economics, Stanford University, Graduate School of Business (1979 to present) | 45 | None |
Anne Casscells
(1958) | Director | Since 2016 | Co-Chief Executive Officer and Chief Investment Officer, Aetos Alternatives Management (investment advisory firm) (2001 to present); Lecturer in Accounting, Stanford University, Graduate School of Business (2009 to present) | 45 | None |
|
| | | | | |
Name
(Year of Birth) | Position(s) Held with Funds | Length of Time Served | Principal Occupation(s) During Past 5 Years | Number of American Century Portfolios Overseen by Director | Other Directorships Held During Past 5 Years |
| Independent Directors |
|
|
Ronald J. Gilson
(1946) | Director and Chairman of the Board | Since 1995
(Chairman since 2005) | Charles J. Meyers Professor of Law and Business, Emeritus, Stanford Law School (1979 to 2016); Marc and Eva Stern Professor of Law and Business, Columbia University School of Law (1992 to present) | 47 | None |
Frederick L. A. Grauer
(1946) | Director | Since 2008 | Senior Advisor, iShares by BlackRock, Inc. (investment management firm) (2010 to 2011, 2013 to 2015); Senior Advisor, Course Hero (an educational technology company) (2015 to present) | 45 | None |
Jonathan D. Levin
(1972) | Director | Since 2016 | Philip H. Knight Professor and Dean, Graduate School of Business, Stanford University (2016 to present); Professor, Stanford University, (2000 to present); Chair, Department of Economics, Stanford University (2011 to 2014) | 45 | None |
Peter F. Pervere
(1947) | Director | Since 2007 | Retired | 45 | None |
John B. Shoven
(1947) | Director | Since 2002 | Charles R. Schwab Professor of Economics, Stanford University (1973 to present) | 45 | Cadence Design Systems; Exponent; Financial Engines |
| Interested Director |
|
|
Jonathan S. Thomas
(1963) | Director and President | Since 2007 | President and Chief Executive Officer, ACC (2007 to present). Also serves as Chief Executive Officer, ACS; Executive Vice President, ACIM; Director, ACC, ACIM and other ACC subsidiaries | 115 | BioMed Valley Discoveries, Inc. |
The Statement of Additional Information has additional information about the fund's directors and is available without charge, upon request, by calling 1-800-345-2021.
Officers
The following table presents certain information about the executive officers of the funds. Each officer serves as an officer for each of the 16 (in the case of Robert J. Leach, 15) investment companies in the American Century family of funds, unless otherwise noted. No officer is compensated for his or her service as an officer of the funds. The listed officers are interested persons of the funds and are appointed or re-appointed on an annual basis. The mailing address for each officer listed below is 4500 Main Street, Kansas City, Missouri 64111.
|
| | |
Name
(Year of Birth) | Offices with the Funds | Principal Occupation(s) During the Past Five Years |
Jonathan S. Thomas
(1963) | Director and President since 2007 | President and Chief Executive Officer, ACC (2007 to present). Also serves as Chief Executive Officer, ACS; Executive Vice President, ACIM; Director, ACC, ACIM and other ACC subsidiaries |
Amy D. Shelton
(1964) | Chief Compliance Officer and Vice President since 2014 | Chief Compliance Officer, American Century funds, (2014 to present); Chief Compliance Officer, ACIM (2014 to present); Chief Compliance Officer, ACIS (2009 to present); Vice President, Client Interactions and Marketing, ACIS (2013 to 2014). Also serves as Vice President, ACIS |
Charles A. Etherington
(1957) | General Counsel since 2007 and Senior Vice President since 2006 | Attorney, ACC (1994 to present); Vice President, ACC (2005 to present); General Counsel, ACC (2007 to present). Also serves as General Counsel, ACIM, ACS, ACIS and other ACC subsidiaries; and Senior Vice President, ACIM and ACS |
C. Jean Wade
(1964) | Vice President,Treasurer and Chief Financial Officer since 2012 | Senior Vice President, ACS (2017 to present); Vice President, ACS (2000 to 2017) |
Robert J. Leach
(1966) | Vice President since 2006 and Assistant Treasurer since 2012 | Vice President, ACS (2000 to present) |
David H. Reinmiller
(1963) | Vice President since 2000 | Attorney, ACC (1994 to present). Also serves as Vice President, ACIM and ACS |
Ward D. Stauffer
(1960) | Secretary since 2005 | Attorney, ACC (2003 to present) |
|
|
| Approval of Management Agreement |
At a meeting held on June 19, 2018, the Fund’s Board of Directors (the "Board") unanimously approved the renewal of the management agreement pursuant to which American Century Investment Management, Inc. (the “Advisor”) acts as the investment advisor for the Fund. Under Section 15(c) of the Investment Company Act, contracts for investment advisory services are required to be reviewed, evaluated, and approved by a majority of a fund’s directors/trustees, including a majority of the independent Directors, each year. The Board regards this annual evaluation and renewal as one of its most important responsibilities.
The independent Directors have memorialized a statement regarding the relationship between their ongoing obligations to oversee and evaluate the performance of the Advisor and their annual consideration of renewal of the management agreement. In that statement, the independent Directors noted that their assessment of the Advisor’s performance is an ongoing process that takes place over the entire year and is informed by all of the extensive information that the Board and its committees receive and consider over time. This information, together with the additional materials provided specifically in connection with the review, are central to the Board’s assessment of the Advisor’s performance and its determination whether to renew the Fund’s management agreement.
Prior to its consideration of the renewal of the management agreement, the Board requested and reviewed extensive data and analysis relating to the proposed renewal. This information and analysis was compiled by the Advisor and certain independent providers of evaluation data concerning the Fund and the services provided to the Fund by the Advisor.
In connection with its consideration of the renewal of the management agreement, the Board’s review and evaluation of the services provided by the Advisor included, but was not limited to, the following:
| |
| • | the nature, extent, and quality of investment management, shareholder services, and other services provided to the Fund; |
| |
| • | the wide range of other programs and services the Advisor provides to the Fund and its shareholders on a routine and non-routine basis; |
| |
| • | the investment performance of the Fund, including data comparing the Fund’s performance to appropriate benchmarks and/or a peer group of other mutual funds with similar investment objectives and strategies; |
| |
| • | the cost of owning the Fund compared to the cost of owning similar funds; |
| |
| • | the Advisor’s compliance policies, procedures, and regulatory experience; |
| |
| • | financial data showing the cost of services provided to the Fund, the profitability of the Fund to the Advisor, and the overall profitability of the Advisor; |
| |
| • | strategic plans of the Advisor; |
| |
| • | any economies of scale associated with the Advisor’s management of the Fund and other accounts; |
| |
| • | services provided and charges to other investment management clients of the Advisor; |
| |
| • | acquired fund fees and expenses; |
| |
| • | payments and practices in connection with financial intermediaries holding shares of the Fund and the services provided by intermediaries in connection therewith; and |
| |
| • | any collateral benefits derived by the Advisor from the management of the Fund. |
In keeping with its practice, the Board held two in-person meetings to review and discuss the information provided in response to their request and held active discussions with the Advisor regarding the renewal of the management agreement. The independent Directors had the benefit of the advice of their independent counsel throughout the process.
Factors Considered
The Directors considered all of the information provided by the Advisor, the independent data providers, and the independent Directors’ independent counsel in connection with the approval. They determined that the information was sufficient for them to evaluate the management agreement for the Fund. In connection with their review, the Directors did not identify any single factor as being all-important or controlling and each Director may have attributed different levels of importance to different factors. In deciding to renew the management agreement, the Board based its decision on a number of factors, including the following:
Nature, Extent and Quality of Services - Generally. Under the management agreement, the Advisor is responsible for providing or arranging for all services necessary for the operation of the Fund. The Board noted that the Advisor provides or arranges at its own expense a wide variety of services including:
| |
| • | constructing and designing the Fund |
| |
| • | portfolio research and security selection |
| |
| • | initial capitalization/funding |
| |
| • | daily valuation of the Fund’s portfolio |
| |
| • | shareholder servicing and transfer agency, including shareholder confirmations, recordkeeping, and communications |
| |
| • | legal services (except the independent Directors’ counsel) |
| |
| • | regulatory and portfolio compliance |
| |
| • | marketing and distribution (except amounts paid by the Fund under Rule 12b-1 plans) |
The Board noted that many of these services have expanded over time in terms of both quantity and complexity in response to shareholder demands, competition in the industry, changing distribution channels, and the changing regulatory environment.
Investment Management, Shareholder, and Other Services. The nature of the investment management services provided to the Fund is quite complex and allows Fund shareholders access to professional money management, instant diversification of their investments within an asset class, the opportunity to easily diversify among asset classes by investing in or exchanging among various American Century Investments funds, and liquidity. In evaluating investment performance, the Board expects the Advisor to manage the Fund in accordance with its investment objectives and approved strategies. Further, the Directors recognize that the Advisor has an obligation to seek the best execution of fund trades. In providing these services, the Advisor utilizes teams of investment professionals (portfolio managers, analysts, research assistants, and securities traders) who require extensive information technology, research, training, compliance, and other systems to conduct their business. The Board, directly and through its Portfolio Committee, regularly reviews investment performance information for the Fund, together with comparative information for appropriate benchmarks and/or peer groups of similarly-managed funds, over different time horizons. The Directors also review detailed performance information during the management agreement approval process. If performance concerns are identified, the Fund receives special reviews until performance improves, during which the Board discusses with the Advisor the reasons for such results (e.g., market conditions, security selection) and any efforts being undertaken to improve performance. The Fund’s performance was below its benchmark for the one-, three-, and five-year periods reviewed by the Board. The Board found the investment management services provided by the Advisor to the Fund to be satisfactory and consistent with the management agreement.
Under the management agreement, the Advisor provides the Fund with a comprehensive package of transfer agency, shareholder, and other services. The Board, directly and through various committees of the Board, regularly reviews reports and evaluations of such services at its regular meetings. These reports include, but are not limited to, information regarding the operational efficiency and accuracy of the shareholder and transfer agency services provided, staffing levels, shareholder satisfaction (as measured by external as well as internal sources), technology support, new products and services offered to Fund shareholders, securities trading activities, portfolio valuation services, auditing services, and legal and operational compliance activities. The Board found the services provided by the Advisor to the Fund under the management agreement to be competitive and of high quality.
Costs of Services and Profitability. The Advisor provides detailed information concerning its cost of providing various services to the Fund, its profitability in managing the Fund, its overall profitability, and its financial condition. The Directors have reviewed with the Advisor the methodology used to prepare this financial information. This information is considered in evaluating the Advisor’s financial condition, its ability to continue to provide services under the management agreement, and the reasonableness of the current management fee. The Board concluded that the Advisor’s profits were reasonable in light of the services provided to the Fund.
Economies of Scale. The Board also reviewed information provided by the Advisor regarding the possible existence of economies of scale in connection with the management of the Fund. The Board concluded that economies of scale are difficult to measure and predict with precision, especially on a fund-by-fund basis. The Board concluded that the Advisor is appropriately sharing economies of scale through its competitive fee structure, offering competitive fees from fund inception, and through reinvestment in its business to provide shareholders enhanced and expanded services.
Comparison to Other Funds’ Fees. The management agreement provides that the Fund pays the Advisor a single, all-inclusive (or unified) management fee for providing all services necessary for the management and operation of the Fund, other than brokerage expenses, expenses attributable to short sales, taxes, interest, extraordinary expenses, the fees and expenses of the Fund’s independent Directors (including their independent legal counsel), and expenses incurred in connection with the provision of shareholder services and distribution services under a plan adopted pursuant to Rule 12b-1 under the 1940 Act. Under the unified fee structure, the Advisor is responsible for providing all investment advisory, custody, audit, administrative, compliance, recordkeeping, marketing, and shareholder services, or arranging and supervising third parties to provide such services. By contrast, most other funds are charged a variety of fees, including an investment advisory fee, a transfer agency fee, an administrative fee, distribution charges, and other expenses. Other than their investment advisory fees and any applicable Rule 12b-1 distribution fees, all other components of the total fees charged by these other funds may be increased without shareholder approval. The Board believes the unified fee structure is a benefit to Fund shareholders because it clearly discloses to shareholders the cost of owning Fund shares, and, since the unified fee cannot be increased without a vote of Fund shareholders, it shifts to the Advisor the risk of increased costs of operating the Fund and provides a direct incentive to minimize administrative inefficiencies. Part of the Board’s analysis of fee levels involves reviewing certain evaluative data compiled by an independent provider and comparing the Fund’s unified fee to the total expense ratio of peer funds. The unified fee charged to shareholders of the Fund was in the lowest quartile of the total expense ratios of the Fund’s peer group. The Board concluded that the management fee paid by the Fund to the Advisor under the management agreement is reasonable in light of the services provided to the Fund.
Comparison to Fees and Services Provided to Other Clients of the Advisor. The Board also requested and received information from the Advisor concerning the nature of the services, fees, costs, and profitability of its advisory services to advisory clients other than the Fund. They observed that these varying types of client accounts require different services and involve different regulatory and entrepreneurial risks than the management of the Fund. The Board analyzed this
information and concluded that the fees charged and services provided to the Fund were reasonable by comparison.
Payments to Intermediaries. The Directors also requested and received a description of payments made to intermediaries by the Fund and the Advisor and services provided by intermediaries. These payments include various payments made by the Fund or the Advisor to different types of intermediaries and recordkeepers for distribution and service activities provided for the Fund. The Directors reviewed such information and received representations from the Advisor that all such payments by the Fund were made pursuant to the Fund’s Rule 12b-1 Plan and that all such payments by the Advisor were made from the Advisor’s resources and reasonable profits. The Board found such payments to be reasonable in scope and purpose.
Collateral or “Fall-Out” Benefits Derived by the Advisor. The Board considered the existence of collateral benefits the Advisor may receive as a result of its relationship with the Fund. The Board noted that the Advisor’s primary business is managing mutual funds and it generally does not use fund or shareholder information to generate profits in other lines of business, and therefore does not derive any significant collateral benefits from them. The Board noted that the Advisor may receive proprietary research from broker-dealers that execute fund portfolio transactions. The Board also determined that the Advisor is able to provide investment management services to certain clients other than the Fund, at least in part, due to its existing infrastructure built to serve the fund complex. The Board noted that the assets of those other accounts are, where applicable, included with the assets of the Fund to determine breakpoints in the management fee schedule.
Existing Relationship. The Board also considered whether there was any reason for not continuing the existing arrangement with the Advisor. In this regard, the Board was mindful of the potential disruptions of the Fund’s operations and various risks, uncertainties, and other effects that could occur as a result of a decision not to continue such relationship. In particular, the Board recognized that most shareholders have invested in the Fund on the strength of the Advisor’s industry standing and reputation and in the expectation that the Advisor will have a continuing role in providing advisory services to the Fund.
Conclusion of the Directors. As a result of this process, the Board, including all of the independent Directors and assisted by the advice of independent legal counsel, taking into account all of the factors discussed above and the information provided by the Advisor and others in connection with its review and throughout the year, concluded that the management agreement between the Fund and the Advisor is fair and reasonable in light of the services provided and should be renewed.
Retirement Account Information
As required by law, distributions you receive from certain retirement accounts are subject to federal income tax withholding, unless you elect not to have withholding apply*. Tax will be withheld on the total amount withdrawn even though you may be receiving amounts that are not subject to withholding, such as nondeductible contributions. In such case, excess amounts of withholding could occur. You may adjust your withholding election so that a greater or lesser amount will be withheld.
If you don’t want us to withhold on this amount, you must notify us to not withhold the federal income tax. You may notify us in writing or in certain situations by telephone or through other electronic means. For systematic withdrawals, your withholding election will remain in effect until revoked or changed by filing a new election. You have the right to revoke your election at any time and change your withholding percentage for future distributions.
Remember, even if you elect not to have income tax withheld, you are liable for paying income tax on the taxable portion of your withdrawal. If you elect not to have income tax withheld or you don’t have enough income tax withheld, you may be responsible for payment of estimated tax. You may incur penalties under the estimated tax rules if your withholding and estimated tax payments are not sufficient. You can reduce or defer the income tax on a distribution by directly or indirectly rolling such distribution over to another IRA or eligible plan. You should consult your tax advisor for additional information.
State tax will be withheld if, at the time of your distribution, your address is within one of the mandatory withholding states and you have federal income tax withheld (or as otherwise required by state law). State taxes will be withheld from your distribution in accordance with the respective state rules.
*Some 403(b), 457 and qualified retirement plan distributions may be subject to 20% mandatory withholding, as they are subject to special tax and withholding rules. Your plan administrator or plan sponsor is required to provide you with a special tax notice explaining those rules at the time you request a distribution. If applicable, federal and/or state taxes may be withheld from your distribution amount.
Proxy Voting Policies
Descriptions of the principles and policies that the fund's investment advisor uses in exercising the voting rights associated with the securities purchased and/or held by the fund are available without charge, upon request, by calling 1-800-345-2021 or visiting the "About Us" page of American Century Investments’ website at americancentury.com. A description of the policies is also available on the Securities and Exchange Commission’s website at sec.gov. Information regarding how the investment advisor voted proxies relating to portfolio securities during the most recent 12-month period ended June 30 is available on the "About Us" page at americancentury.com. It is also available at sec.gov.
Quarterly Portfolio Disclosure
The fund files its complete schedule of portfolio holdings with the Securities and Exchange Commission (SEC) for the first and third quarters of each fiscal year on Form N-Q. The fund’s Forms N-Q are available on the SEC’s website at sec.gov, and may be reviewed and copied at the SEC’s Public Reference Room in Washington, DC. Information on the operation of the Public Reference Room may be obtained by calling 1-800-SEC-0330. The fund also makes its complete schedule of portfolio holdings for the most recent quarter of its fiscal year available on its website at americancentury.com and, upon request, by calling 1-800-345-2021.
Other Tax Information
The following information is provided pursuant to provisions of the Internal Revenue Code.
The fund hereby designates up to the maximum amount allowable as qualified dividend income for the fiscal year ended June 30, 2018.
For corporate taxpayers, the fund hereby designates $859,900, or up to the maximum amount allowable, of ordinary income distributions paid during the fiscal year ended June 30, 2018 as qualified for the corporate dividends received deduction.
The fund hereby designates $6,280,425, or up to the maximum amount allowable, as long-term capital gain distributions (20% rate gain distributions) for the fiscal year ended June 30, 2018.
|
| | |
| |
| | | |
| Contact Us | americancentury.com | |
| Automated Information Line | 1-800-345-8765 | |
| Investor Services Representative | 1-800-345-2021
or 816-531-5575 | |
| Investors Using Advisors | 1-800-378-9878 | |
Business, Not-For-Profit, Employer-Sponsored
Retirement Plans | 1-800-345-3533 | |
Banks and Trust Companies, Broker-Dealers,
Financial Professionals, Insurance Companies | 1-800-345-6488 | |
| Telecommunications Relay Service for the Deaf | 711 | |
| | | |
| American Century Quantitative Equity Funds, Inc. | |
| | | |
Investment Advisor: American Century Investment Management, Inc. Kansas City, Missouri | |
| | | |
| This report and the statements it contains are submitted for the general information of our shareholders. The report is not authorized for distribution to prospective investors unless preceded or accompanied by an effective prospectus. | |
| | | |
©2018 American Century Proprietary Holdings, Inc. All rights reserved.
CL-ANN-92994 1808 | |

|
| |
| | |
| | Annual Report |
| | |
| | June 30, 2018 |
| | |
| | Disciplined Growth Fund |
| | Investor Class (ADSIX) |
| | I Class (ADCIX) |
| | Y Class (ADCYX) |
| | A Class (ADCVX) |
| | C Class (ADCCX) |
| | R Class (ADRRX) |
| | R5 Class (ADGGX) |
|
| | |
| President's Letter | 2 |
|
| Performance | 3 |
|
| Portfolio Commentary | |
|
| Fund Characteristics | |
|
| Shareholder Fee Example | |
|
| Schedule of Investments | |
|
| Statement of Assets and Liabilities | |
|
| Statement of Operations | |
|
| Statement of Changes in Net Assets | |
|
| Notes to Financial Statements | |
|
| Financial Highlights | |
|
| Report of Independent Registered Public Accounting Firm | |
|
| Management | |
|
| Approval of Management Agreement | |
|
| Additional Information | |
|
Any opinions expressed in this report reflect those of the author as of the date of the report, and do not necessarily represent the opinions of American Century Investments® or any other person in the American Century Investments organization. Any such opinions are subject to change at any time based upon market or other conditions and American Century Investments disclaims any responsibility to update such opinions. These opinions may not be relied upon as investment advice and, because investment decisions made by American Century Investments funds are based on numerous factors, may not be relied upon as an indication of trading intent on behalf of any American Century Investments fund. Security examples are used for representational purposes only and are not intended as recommendations to purchase or sell securities. Performance information for comparative indices and securities is provided to American Century Investments by third party vendors. To the best of American Century Investments’ knowledge, such information is accurate at the time of printing.
Jonathan Thomas
Dear Investor:
Thank you for reviewing this annual report for the period ended June 30, 2018. Annual reports help convey important information about fund returns, including market factors that affected performance during the reporting period. For additional, updated investment and market insights, we encourage you to visit our website, americancentury.com.
Volatility’s Return Challenged Financial Markets
Broad U.S. and global stock market indices generally rallied for the first half of the 12-month period. A favorable backdrop of robust corporate earnings results, improving global economic growth, and relatively low interest rates, combined with the effects of U.S. tax reform, drove stock prices higher. For the six months ended December 31, 2017, U.S. stocks (S&P 500 Index) returned 11.42%. U.S. bond returns were also positive, but much more subdued, as the Federal Reserve (the Fed) continued its rate-normalization efforts and interest rates edged higher. The Bloomberg Barclays U.S. Aggregate Bond Index returned 1.24% for the six-month period.
In early February, a force that was largely dormant during 2017—volatility—re-emerged, as better-than-expected economic data triggered expectations for rising inflation, higher interest rates, and a more-hawkish Fed. In response, U.S. Treasury yields climbed to their highest levels in several years, and stock prices plunged. Economic data released in subsequent months were more in line with market expectations, while corporate earnings results remained healthy. These factors helped calm the market unrest, and stocks generally recovered their earlier losses. Nevertheless, rising interest rates, geopolitical tensions, and the mounting threat of a global trade war continued to provide periodic headwinds for investors.
Despite the return of volatility, U.S. stocks (S&P 500 Index) gained14.37% for the 12-month period. Meanwhile, rising U.S. Treasury yields, particularly in the second half of the period, took a toll on bonds and other interest-rate-sensitive investments, including gold, utilities stocks, and real estate investment trusts (REITs). Investment-grade bonds (Bloomberg Barclays U.S. Aggregate Bond Index) returned -0.40% for the 12 months.
With volatility resurfacing, inflationary pressures building, Treasury yields rising, and the implications of U.S. tariff and trade policy still unfolding, investors likely will face new opportunities and challenges in the months ahead. We believe this scenario warrants a disciplined, diversified, and risk-aware approach, using professionally managed portfolios in pursuit of investment goals. We appreciate your continued trust and confidence in us.
Sincerely,
Jonathan Thomas
President and Chief Executive Officer
American Century Investments
|
| | | | | | |
| Total Returns as of June 30, 2018 |
| | | | Average Annual Returns | |
| | Ticker Symbol | 1 year | 5 years | 10 years | Since Inception | Inception Date |
| Investor Class | ADSIX | 18.80% | 13.92% | 10.71% | — | 9/30/05 |
| Russell 1000 Growth Index | — | 22.51% | 16.35% | 11.82% | — | — |
| I Class | ADCIX | 19.01% | 14.15% | 10.94% | — | 9/30/05 |
| Y Class | ADCYX | 19.06% | — | — | 18.24% | 4/10/17 |
| A Class | ADCVX | | | |
| 9/30/05 |
| No sales charge | | 18.48% | 13.64% | 10.45% | — | |
| With sales charge | | 11.67% | 12.30% | 9.79% | — | |
| C Class | ADCCX | 17.57% | 12.78% | 9.60% | — | 9/28/07 |
| R Class | ADRRX | 18.20% | 13.35% | 10.16% | — | 9/30/05 |
| R5 Class | ADGGX | 19.00% | — | — | 18.18% | 4/10/17 |
Average annual returns since inception are presented when ten years of performance history is not available.
Sales charges include initial sales charges and contingent deferred sales charges (CDSCs), as applicable. A Class shares have a 5.75% maximum initial sales charge and may be subject to a maximum CDSC of 1.00%. C Class shares redeemed within 12 months of purchase are subject to a maximum CDSC of 1.00%. The SEC requires that mutual funds provide performance information net of maximum sales charges in all cases where charges could be applied.
Data presented reflect past performance. Past performance is no guarantee of future results. Current performance may be higher or lower than the performance shown. Total returns for periods less than one year are not annualized. Investment return and principal value will fluctuate, and redemption value may be more or less than original cost. Data assumes reinvestment of dividends and capital gains, and none of the charts reflect the deduction of taxes that a shareholder would pay on fund distributions or the redemption of fund shares. To obtain performance data current to the most recent month end, please call 1-800-345-2021 or visit americancentury.com. For additional information about the fund, please consult the prospectus.
|
|
| Growth of $10,000 Over 10 Years |
| $10,000 investment made June 30, 2008 |
| Performance for other share classes will vary due to differences in fee structure. |
|
| |
| Value on June 30, 2018 |
| | Investor Class — $27,680 |
| |
| | Russell 1000 Growth Index — $30,580 |
| |
|
| | | | | | |
| Total Annual Fund Operating Expenses | |
| Investor Class | I Class | Y Class | A Class | C Class | R Class | R5 Class |
| 1.02% | 0.82% | 0.77% | 1.27% | 2.02% | 1.52% | 0.82% |
The total annual fund operating expenses shown is as stated in the fund’s prospectus current as of the date of this report. The prospectus may vary from the expense ratio shown elsewhere in this report because it is based on a different time period, includes acquired fund fees and expenses, and, if applicable, does not include fee waivers or expense reimbursements.
Data presented reflect past performance. Past performance is no guarantee of future results. Current performance may be higher or lower than the performance shown. Total returns for periods less than one year are not annualized. Investment return and principal value will fluctuate, and redemption value may be more or less than original cost. Data assumes reinvestment of dividends and capital gains, and none of the charts reflect the deduction of taxes that a shareholder would pay on fund distributions or the redemption of fund shares. To obtain performance data current to the most recent month end, please call 1-800-345-2021 or visit americancentury.com. For additional information about the fund, please consult the prospectus.
Portfolio Managers: Yulin Long and Tsuyoshi Ozaki
Tsuyoshi Ozaki joined the portfolio management team in 2017.
Performance Summary
The Disciplined Growth Fund returned 18.80%* for the fiscal year ended June 30, 2018, compared with the 22.51% return of its benchmark, the Russell 1000 Growth Index.
The Disciplined Growth Fund advanced during the fiscal year, but underperformed its benchmark, the Russell 1000 Growth Index. Stock selection in the health care and information technology sectors detracted, while positioning in consumer staples and industrials benefited relative performance.
Disciplined Growth’s stock selection process incorporates factors of valuation, quality, growth, and sentiment, while striving to minimize unintended risks along industries and other risk characteristics. Within the fund, overall performance was aided by growth, sentiment, and quality factors, while the value factor detracted.
Stock Choices Across Several Sectors Detracted From Relative Returns
Picks in the health care sector were the largest drivers of relative underperformance. Selections in the biotechnology industry, such as AbbVie, Celgene, and Regeneron Pharmaceuticals, were among the leading detractors for the period. In health care equipment and supplies, a portfolio-only position in Zimmer Biomet Holdings was also among the largest detractors. Elsewhere in the sector, holdings among pharmaceuticals companies also hurt relative returns. We eliminated our stakes in Regeneron and Zimmer Biomet during the period.
Stock selection within information technology also negatively affected the portfolio. Stock choices in the IT services industry, such as payment processing companies like MasterCard and PayPal Holdings, detracted from relative returns. We eliminated our position in PayPal. In semiconductors and semiconductor equipment, an underweight to NVIDIA was among one of the largest detractors from relative performance for the period. Stock choices in technology hardware, storage, and peripherals were also negative, as were decisions in the communications equipment industry.
Within the consumer discretionary sector, an underweight to streaming services company Netflix was a large detractor. Netflix reported strong subscriber growth, and the stock rose. The portfolio has some exposure to the stock but less than the index, maintaining an underweight to the stock due to its poor quality, valuation, and sentiment scores. In addition to Netflix, positioning in the leisure products, multiline retail, and household durables industries hurt relative performance.
Consumer Staples and Industrials Were Additive
Within consumer staples, an underweight position in tobacco companies helped relative returns. The stock of companies such as Altria Group and Philip Morris International have been depressed due to falling sales and shifting consumer tastes. Philip Morris’ stock fell due to poor sales of its new smokeless tobacco product. A relative underweight to Altria Group and a lack of exposure to Philip Morris International benefited relative returns. Elsewhere in the sector, a portfolio-only
*All fund returns referenced in this commentary are for Investor Class shares. Performance for other share classes will vary due to differences in fee structure; when Investor Class performance exceeds that of the fund's benchmark, other share classes may not. See page 3 for returns for all share classes.
position in diet and nutrition product company Medifast benefited returns and was among the top
contributors for the period. Underweights to beverages companies such as Coca-Cola Co. and PepsiCo also helped performance, as the companies’ stock has been under pressure due to changing consumer preferences.
Stock selection within the industrials sector also helped relative results. Overweights to several aerospace and defense companies helped relative returns. In particular, an overweight to Boeing was among the top contributors for the period. Positioning within the professional services industry also boosted relative returns. Human resources company Insperity was a strong contributor, as its stock rose during the period on the back of a tight job market. Elsewhere in the sector, avoidance of selected poor-performing air freight and logistics and airlines companies was also additive.
A Look Ahead
Our disciplined, objective, and systematic investment strategy is designed to take advantage of opportunities at the individual company level. We believe this approach is the most powerful way to capitalize on market inefficiencies that lead to the mispricing of individual stocks. As a result of this approach, our sector and industry allocations reflect where we are finding the greatest opportunities among individual companies at a given time.
At period-end, consumer discretionary was the most overweight sector. According to our factor model, consumer durables and apparel offer some of the best opportunities in the current environment. We increased our relative overweight position in order to take advantage of these opportunities. Health care was among our largest active weights during the period. Based on our factor model, we believe there are significant opportunities in the pharmaceuticals and biotechnology industries. Conversely, we are underweight the financials and consumer staples sectors. Diversified financials companies show a lack of opportunity and are comparatively unattractive in terms of growth metrics. Our model also identifies a lack of opportunity in the insurance space. In the consumer staples sector, our underweight is driven by a lack of exposure to the food, beverage, and tobacco industry group, which scores poorly on growth, quality, and sentiment.
|
| |
| JUNE 30, 2018 |
| Top Ten Holdings | % of net assets |
| Apple, Inc. | 7.7% |
| Alphabet, Inc., Class A | 6.0% |
| Microsoft Corp. | 5.3% |
| Amazon.com, Inc. | 5.2% |
| Facebook, Inc., Class A | 4.3% |
| UnitedHealth Group, Inc. | 2.7% |
| Visa, Inc., Class A | 2.5% |
| Boeing Co. (The) | 2.1% |
| Adobe Systems, Inc. | 1.9% |
| AbbVie, Inc. | 1.8% |
| | |
| Top Five Industries | % of net assets |
| Software | 12.3% |
| Internet Software and Services | 10.8% |
| Technology Hardware, Storage and Peripherals | 8.8% |
| Internet and Direct Marketing Retail | 6.5% |
| Biotechnology | 5.9% |
| | |
| Types of Investments in Portfolio | % of net assets |
| Common Stocks | 99.9% |
| Other Assets and Liabilities | 0.1% |
Fund shareholders may incur two types of costs: (1) transaction costs, including sales charges (loads) on purchase payments and redemption/exchange fees; and (2) ongoing costs, including management fees; distribution and service (12b-1) fees; and other fund expenses. This example is intended to help you understand your ongoing costs (in dollars) of investing in your fund and to compare these costs with the ongoing cost of investing in other mutual funds.
The example is based on an investment of $1,000 made at the beginning of the period and held for the entire period from January 1, 2018 to June 30, 2018.
Actual Expenses
The table provides information about actual account values and actual expenses for each class. You may use the information, together with the amount you invested, to estimate the expenses that you paid over the period. First, identify the share class you own. Then simply divide your account value by $1,000 (for example, an $8,600 account value divided by $1,000 = 8.6), then multiply the result by the number under the heading “Expenses Paid During Period” to estimate the expenses you paid on your account during this period.
If you hold Investor Class shares of any American Century Investments fund, or I Class shares of the American Century Diversified Bond Fund, in an American Century Investments account (i.e., not a financial intermediary or retirement plan account), American Century Investments may charge you a $12.50 semiannual account maintenance fee if the value of those shares is less than $10,000. We will redeem shares automatically in one of your accounts to pay the $12.50 fee. In determining your total eligible investment amount, we will include your investments in all personal accounts (including American Century Investments Brokerage accounts) registered under your Social Security number. Personal accounts include individual accounts, joint accounts, UGMA/UTMA accounts, personal trusts, Coverdell Education Savings Accounts and IRAs (including traditional, Roth, Rollover, SEP-, SARSEP- and SIMPLE-IRAs), and certain other retirement accounts. If you have only business, business retirement, employer-sponsored or American Century Investments Brokerage accounts, you are currently not subject to this fee. If you are subject to the Account Maintenance Fee, your account value could be reduced by the fee amount.
Hypothetical Example for Comparison Purposes
The table also provides information about hypothetical account values and hypothetical expenses based on the actual expense ratio of each class of your fund and an assumed rate of return of 5% per year before expenses, which is not the actual return of a fund’s share class. The hypothetical account values and expenses may not be used to estimate the actual ending account balance or expenses you paid for the period. You may use this information to compare the ongoing costs of investing in your fund and other funds. To do so, compare this 5% hypothetical example with the 5% hypothetical examples that appear in the shareholder reports of the other funds.
Please note that the expenses shown in the table are meant to highlight your ongoing costs only and do not reflect any transactional costs, such as sales charges (loads) or redemption/exchange fees. Therefore, the table is useful in comparing ongoing costs only, and will not help you determine the relative total costs of owning different funds. In addition, if these transactional costs were included, your costs would have been higher.
|
| | | | |
| | Beginning
Account Value
1/1/18 | Ending
Account Value
6/30/18 | Expenses Paid
During Period(1)
1/1/18 - 6/30/18 |
Annualized
Expense Ratio(1) |
| Actual | | | | |
| Investor Class | $1,000 | $1,055.20 | $5.15 | 1.01% |
| I Class | $1,000 | $1,056.20 | $4.13 | 0.81% |
| Y Class | $1,000 | $1,056.70 | $3.88 | 0.76% |
| A Class | $1,000 | $1,053.90 | $6.42 | 1.26% |
| C Class | $1,000 | $1,049.80 | $10.22 | 2.01% |
| R Class | $1,000 | $1,052.90 | $7.69 | 1.51% |
| R5 Class | $1,000 | $1,056.20 | $4.13 | 0.81% |
| Hypothetical | | | | |
| Investor Class | $1,000 | $1,019.79 | $5.06 | 1.01% |
| I Class | $1,000 | $1,020.78 | $4.06 | 0.81% |
| Y Class | $1,000 | $1,021.03 | $3.81 | 0.76% |
| A Class | $1,000 | $1,018.55 | $6.31 | 1.26% |
| C Class | $1,000 | $1,014.83 | $10.04 | 2.01% |
| R Class | $1,000 | $1,017.31 | $7.55 | 1.51% |
| R5 Class | $1,000 | $1,020.78 | $4.06 | 0.81% |
| |
| (1) | Expenses are equal to the class's annualized expense ratio listed in the table above, multiplied by the average account value over the period, multiplied by 181, the number of days in the most recent fiscal half-year, divided by 365, to reflect the one-half year period. Annualized expense ratio reflects actual expenses, including any applicable fee waivers or expense reimbursements and excluding any acquired fund fees and expenses. |
JUNE 30, 2018
|
| | | | | |
| | Shares | Value |
| COMMON STOCKS — 99.9% | | |
| Aerospace and Defense — 4.4% | | |
Astronics Corp.(1) | 4,027 |
| $ | 144,851 |
|
| Boeing Co. (The) | 43,369 |
| 14,550,733 |
|
| Curtiss-Wright Corp. | 15,323 |
| 1,823,744 |
|
| Lockheed Martin Corp. | 27,353 |
| 8,080,897 |
|
| Raytheon Co. | 29,851 |
| 5,766,616 |
|
| | | 30,366,841 |
|
| Auto Components — 0.4% | | |
Stoneridge, Inc.(1) | 1,968 |
| 69,155 |
|
Visteon Corp.(1) | 22,458 |
| 2,902,472 |
|
| | | 2,971,627 |
|
| Banks — 0.2% | | |
| Central Pacific Financial Corp. | 54,127 |
| 1,550,738 |
|
| Beverages — 1.3% | | |
| Coca-Cola Co. (The) | 24,265 |
| 1,064,263 |
|
| Constellation Brands, Inc., Class A | 30,723 |
| 6,724,343 |
|
| PepsiCo, Inc. | 10,698 |
| 1,164,691 |
|
| | | 8,953,297 |
|
| Biotechnology — 5.9% | | |
| AbbVie, Inc. | 136,013 |
| 12,601,605 |
|
Alexion Pharmaceuticals, Inc.(1) | 54,127 |
| 6,719,867 |
|
| Amgen, Inc. | 38,827 |
| 7,167,076 |
|
Biogen, Inc.(1) | 28,635 |
| 8,311,022 |
|
Celgene Corp.(1) | 73,603 |
| 5,845,550 |
|
| | | 40,645,120 |
|
| Capital Markets — 0.4% | | |
| BGC Partners, Inc., Class A | 11,855 |
| 134,199 |
|
| Cboe Global Markets, Inc. | 23,603 |
| 2,456,364 |
|
| | | 2,590,563 |
|
| Chemicals — 0.6% | | |
Kraton Corp.(1) | 25,738 |
| 1,187,551 |
|
| LyondellBasell Industries NV, Class A | 1,567 |
| 172,135 |
|
| Praxair, Inc. | 14,106 |
| 2,230,864 |
|
| Scotts Miracle-Gro Co. (The) | 2,450 |
| 203,742 |
|
| | | 3,794,292 |
|
| Commercial Services and Supplies — 0.8% | | |
| McGrath RentCorp | 22,358 |
| 1,414,591 |
|
| MSA Safety, Inc. | 39,847 |
| 3,838,860 |
|
| | | 5,253,451 |
|
| Communications Equipment — 0.6% | | |
F5 Networks, Inc.(1) | 14,093 |
| 2,430,338 |
|
|
| | | | | |
| | Shares | Value |
Palo Alto Networks, Inc.(1) | 8,003 |
| $ | 1,644,376 |
|
| | | 4,074,714 |
|
| Diversified Consumer Services — 0.8% | | |
Cambium Learning Group, Inc.(1) | 17,598 |
| 196,218 |
|
Grand Canyon Education, Inc.(1) | 44,189 |
| 4,931,934 |
|
| | | 5,128,152 |
|
| Diversified Telecommunication Services — 0.1% | | |
Vonage Holdings Corp.(1) | 48,001 |
| 618,733 |
|
| Electrical Equipment — 0.2% | | |
| AMETEK, Inc. | 14,473 |
| 1,044,372 |
|
| Energy Equipment and Services — 0.8% | | |
| Halliburton Co. | 123,439 |
| 5,562,161 |
|
| Equity Real Estate Investment Trusts (REITs) — 0.6% | | |
| PotlatchDeltic Corp. | 30,405 |
| 1,546,094 |
|
| PS Business Parks, Inc. | 18,799 |
| 2,415,672 |
|
| | | 3,961,766 |
|
Food and Staples Retailing† | | |
| Walgreens Boots Alliance, Inc. | 2,537 |
| 152,258 |
|
| Health Care Equipment and Supplies — 1.3% | | |
Edwards Lifesciences Corp.(1) | 11,830 |
| 1,722,093 |
|
Haemonetics Corp.(1) | 22,387 |
| 2,007,666 |
|
Intuitive Surgical, Inc.(1) | 10,297 |
| 4,926,909 |
|
Orthofix International NV(1) | 6,944 |
| 394,558 |
|
| | | 9,051,226 |
|
| Health Care Providers and Services — 4.6% | | |
| Cigna Corp. | 30,848 |
| 5,242,618 |
|
Express Scripts Holding Co.(1) | 44,894 |
| 3,466,266 |
|
Tivity Health, Inc.(1) | 39,342 |
| 1,384,838 |
|
| UnitedHealth Group, Inc. | 74,229 |
| 18,211,343 |
|
WellCare Health Plans, Inc.(1) | 13,422 |
| 3,305,033 |
|
| | | 31,610,098 |
|
| Health Care Technology — 0.1% | | |
athenahealth, Inc.(1) | 1,272 |
| 202,426 |
|
| HealthStream, Inc. | 6,111 |
| 166,891 |
|
| | | 369,317 |
|
| Hotels, Restaurants and Leisure — 3.3% | | |
| Las Vegas Sands Corp. | 97,226 |
| 7,424,177 |
|
| Marriott International, Inc., Class A | 52,575 |
| 6,655,995 |
|
| McDonald's Corp. | 7,600 |
| 1,190,844 |
|
| Ruth's Hospitality Group, Inc. | 8,338 |
| 233,881 |
|
| Vail Resorts, Inc. | 13,588 |
| 3,725,694 |
|
| Wynn Resorts Ltd. | 19,243 |
| 3,220,124 |
|
| | | 22,450,715 |
|
| Household Durables — 0.9% | | |
| PulteGroup, Inc. | 172,419 |
| 4,957,046 |
|
| Toll Brothers, Inc. | 30,765 |
| 1,137,997 |
|
|
| | | | | |
| | Shares | Value |
William Lyon Homes, Class A(1) | 11,512 |
| $ | 267,079 |
|
| | | 6,362,122 |
|
| Household Products — 1.0% | | |
| Kimberly-Clark Corp. | 62,514 |
| 6,585,225 |
|
| Independent Power and Renewable Electricity Producers — 0.8% | |
| NRG Energy, Inc. | 168,578 |
| 5,175,345 |
|
| Industrial Conglomerates — 1.8% | | |
| 3M Co. | 20,936 |
| 4,118,530 |
|
| Honeywell International, Inc. | 59,078 |
| 8,510,186 |
|
| | | 12,628,716 |
|
| Insurance — 0.9% | | |
| Infinity Property & Casualty Corp. | 44,481 |
| 6,331,870 |
|
| Internet and Direct Marketing Retail — 6.5% | | |
Amazon.com, Inc.(1) | 21,004 |
| 35,702,599 |
|
Booking Holdings, Inc.(1) | 65 |
| 131,761 |
|
Netflix, Inc.(1) | 5,772 |
| 2,259,334 |
|
| Nutrisystem, Inc. | 57,829 |
| 2,226,416 |
|
| PetMed Express, Inc. | 10,860 |
| 478,383 |
|
Shutterfly, Inc.(1) | 44,353 |
| 3,993,101 |
|
| | | 44,791,594 |
|
| Internet Software and Services — 10.8% | | |
Alphabet, Inc., Class A(1) | 36,213 |
| 40,891,358 |
|
Facebook, Inc., Class A(1) | 151,219 |
| 29,384,876 |
|
| LogMeIn, Inc. | 20,048 |
| 2,069,956 |
|
Stamps.com, Inc.(1) | 4,942 |
| 1,250,573 |
|
| | | 73,596,763 |
|
| IT Services — 5.9% | | |
| Accenture plc, Class A | 16,716 |
| 2,734,570 |
|
| CSG Systems International, Inc. | 106,128 |
| 4,337,451 |
|
| DXC Technology Co. | 21,182 |
| 1,707,481 |
|
| International Business Machines Corp. | 62,385 |
| 8,715,185 |
|
| MasterCard, Inc., Class A | 13,355 |
| 2,624,525 |
|
Syntel, Inc.(1) | 57,565 |
| 1,847,261 |
|
Unisys Corp.(1) | 89,498 |
| 1,154,524 |
|
| Visa, Inc., Class A | 129,504 |
| 17,152,805 |
|
| | | 40,273,802 |
|
| Machinery — 2.1% | | |
| Caterpillar, Inc. | 60,557 |
| 8,215,768 |
|
| Hyster-Yale Materials Handling, Inc. | 1,315 |
| 84,489 |
|
| Ingersoll-Rand plc | 66,621 |
| 5,977,902 |
|
Lydall, Inc.(1) | 2,290 |
| 99,959 |
|
| | | 14,378,118 |
|
| Media — 1.0% | | |
| Comcast Corp., Class A | 53,175 |
| 1,744,672 |
|
| Entravision Communications Corp., Class A | 231,259 |
| 1,156,295 |
|
tronc, Inc.(1) | 39,450 |
| 681,696 |
|
|
| | | | | |
| | Shares | Value |
| Walt Disney Co. (The) | 30,984 |
| $ | 3,247,433 |
|
| | | 6,830,096 |
|
| Multiline Retail — 0.8% | | |
Dollar Tree, Inc.(1) | 65,424 |
| 5,561,040 |
|
| Oil, Gas and Consumable Fuels — 0.8% | | |
Continental Resources, Inc.(1) | 87,425 |
| 5,661,643 |
|
| Personal Products — 0.5% | | |
| Medifast, Inc. | 20,166 |
| 3,229,786 |
|
| Pharmaceuticals — 3.7% | | |
| Allergan plc | 28,576 |
| 4,764,191 |
|
| Bristol-Myers Squibb Co. | 117,769 |
| 6,517,336 |
|
| Eli Lilly & Co. | 61,667 |
| 5,262,045 |
|
| Johnson & Johnson | 21,920 |
| 2,659,773 |
|
| Zoetis, Inc. | 68,771 |
| 5,858,601 |
|
| | | 25,061,946 |
|
| Professional Services — 2.1% | | |
ASGN, Inc.(1) | 25,872 |
| 2,022,932 |
|
| Insperity, Inc. | 59,046 |
| 5,624,132 |
|
| Kforce, Inc. | 11,531 |
| 395,513 |
|
| Robert Half International, Inc. | 94,083 |
| 6,124,803 |
|
TrueBlue, Inc.(1) | 6,234 |
| 168,006 |
|
| | | 14,335,386 |
|
Real Estate Management and Development† | | |
| Newmark Group, Inc., Class A | 9,254 |
| 131,684 |
|
| Semiconductors and Semiconductor Equipment — 4.6% | | |
| Applied Materials, Inc. | 153,619 |
| 7,095,662 |
|
| Broadcom, Inc. | 40,293 |
| 9,776,694 |
|
| Lam Research Corp. | 17,510 |
| 3,026,603 |
|
| MKS Instruments, Inc. | 36,977 |
| 3,538,699 |
|
| NVIDIA Corp. | 9,771 |
| 2,314,750 |
|
NXP Semiconductors NV(1) | 13,560 |
| 1,481,701 |
|
| Skyworks Solutions, Inc. | 21,435 |
| 2,071,693 |
|
| Texas Instruments, Inc. | 18,781 |
| 2,070,605 |
|
| | | 31,376,407 |
|
| Software — 12.3% | | |
| Activision Blizzard, Inc. | 113,311 |
| 8,647,895 |
|
Adobe Systems, Inc.(1) | 52,567 |
| 12,816,360 |
|
Cadence Design Systems, Inc.(1) | 132,796 |
| 5,751,395 |
|
Electronic Arts, Inc.(1) | 63,135 |
| 8,903,298 |
|
| Microsoft Corp. | 369,904 |
| 36,476,233 |
|
Red Hat, Inc.(1) | 22,818 |
| 3,066,055 |
|
salesforce.com, Inc.(1) | 21,982 |
| 2,998,345 |
|
Synopsys, Inc.(1) | 61,386 |
| 5,252,800 |
|
| | | 83,912,381 |
|
| Specialty Retail — 4.3% | | |
Asbury Automotive Group, Inc.(1) | 61,471 |
| 4,213,837 |
|
AutoZone, Inc.(1) | 8,699 |
| 5,836,420 |
|
|
| | | | | |
| | Shares | Value |
Burlington Stores, Inc.(1) | 38,369 |
| $ | 5,775,686 |
|
| Home Depot, Inc. (The) | 32,656 |
| 6,371,186 |
|
| Ross Stores, Inc. | 84,130 |
| 7,130,017 |
|
| | | 29,327,146 |
|
| Technology Hardware, Storage and Peripherals — 8.8% | | |
| Apple, Inc. | 283,880 |
| 52,549,027 |
|
| NetApp, Inc. | 38,064 |
| 2,989,166 |
|
| Western Digital Corp. | 64,456 |
| 4,989,539 |
|
| | | 60,527,732 |
|
| Textiles, Apparel and Luxury Goods — 2.8% | | |
| Columbia Sportswear Co. | 31,054 |
| 2,840,509 |
|
Deckers Outdoor Corp.(1) | 44,571 |
| 5,031,620 |
|
Michael Kors Holdings Ltd.(1) | 84,003 |
| 5,594,600 |
|
| Oxford Industries, Inc. | 5,306 |
| 440,292 |
|
| Tapestry, Inc. | 113,982 |
| 5,324,099 |
|
| | | 19,231,120 |
|
| Thrifts and Mortgage Finance — 0.1% | | |
| Merchants Bancorp | 7,239 |
| 206,529 |
|
Nationstar Mortgage Holdings, Inc.(1) | 35,325 |
| 619,247 |
|
| | | 825,776 |
|
| Tobacco — 0.2% | | |
| Altria Group, Inc. | 18,544 |
| 1,053,114 |
|
| Wireless Telecommunication Services — 0.8% | | |
T-Mobile US, Inc.(1) | 95,468 |
| 5,704,213 |
|
TOTAL INVESTMENT SECURITIES — 99.9%
(Cost $497,338,240) | | 683,042,466 |
|
| OTHER ASSETS AND LIABILITIES — 0.1% | | 941,885 |
|
| TOTAL NET ASSETS — 100.0% | | $ | 683,984,351 |
|
|
| | |
| NOTES TO SCHEDULE OF INVESTMENTS |
| |
| † | Category is less than 0.05% of total net assets. |
See Notes to Financial Statements.
|
|
| Statement of Assets and Liabilities |
|
| | | |
| JUNE 30, 2018 | |
| Assets | |
| Investment securities, at value (cost of $497,338,240) | $ | 683,042,466 |
|
| Receivable for investments sold | 13,815,149 |
|
| Receivable for capital shares sold | 192,529 |
|
| Dividends and interest receivable | 228,730 |
|
| | 697,278,874 |
|
| | |
| Liabilities | |
| Disbursements in excess of demand deposit cash | 7,563,733 |
|
| Payable for capital shares redeemed | 5,129,540 |
|
| Accrued management fees | 553,919 |
|
| Distribution and service fees payable | 47,331 |
|
| | 13,294,523 |
|
| | |
| Net Assets | $ | 683,984,351 |
|
| | |
| Net Assets Consist of: | |
| Capital (par value and paid-in surplus) | $ | 446,663,256 |
|
| Undistributed net realized gain | 51,616,869 |
|
| Net unrealized appreciation | 185,704,226 |
|
| | $ | 683,984,351 |
|
|
| | | | | | |
| | Net Assets | Shares Outstanding | Net Asset Value Per Share |
| Investor Class, $0.01 Par Value |
| $362,864,708 |
| 15,087,639 |
| $24.05 |
| I Class, $0.01 Par Value |
| $231,260,667 |
| 9,585,113 |
| $24.13 |
| Y Class, $0.01 Par Value |
| $6,132 |
| 254 |
| $24.14 |
| A Class, $0.01 Par Value |
| $37,832,068 |
| 1,584,971 |
| $23.87* |
| C Class, $0.01 Par Value |
| $40,252,571 |
| 1,785,403 |
| $22.55 |
| R Class, $0.01 Par Value |
| $10,626,112 |
| 452,803 |
| $23.47 |
| R5 Class, $0.01 Par Value |
| $1,142,093 |
| 47,310 |
| $24.14 |
*Maximum offering price $25.33 (net asset value divided by 0.9425).
See Notes to Financial Statements.
|
| | | |
| YEAR ENDED JUNE 30, 2018 | |
| Investment Income (Loss) | |
| Income: | |
| Dividends | $ | 9,196,931 |
|
| Interest | 32,488 |
|
| | 9,229,419 |
|
| | |
| Expenses: | |
| Management fees | 7,061,822 |
|
| Distribution and service fees: | |
| A Class | 127,519 |
|
| C Class | 419,662 |
|
| R Class | 51,779 |
|
| Directors' fees and expenses | 45,976 |
|
| Other expenses | 18,201 |
|
| | 7,724,959 |
|
| | |
| Net investment income (loss) | 1,504,460 |
|
| | |
| Realized and Unrealized Gain (Loss) | |
| Net realized gain (loss) on: | |
| Investment transactions | 102,381,469 |
|
| Futures contract transactions | 86,201 |
|
| | 102,467,670 |
|
| | |
| Change in net unrealized appreciation (depreciation) on investments | 26,906,887 |
|
| | |
| Net realized and unrealized gain (loss) | 129,374,557 |
|
| Net Increase (Decrease) in Net Assets Resulting from Operations | $ | 130,879,017 |
|
See Notes to Financial Statements.
|
|
| Statement of Changes in Net Assets |
|
| | | | | | |
| YEARS ENDED JUNE 30, 2018 AND JUNE 30, 2017 |
| Increase (Decrease) in Net Assets | June 30, 2018 | June 30, 2017 |
| Operations | | |
| Net investment income (loss) | $ | 1,504,460 |
| $ | 3,799,512 |
|
| Net realized gain (loss) | 102,467,670 |
| 75,445,536 |
|
| Change in net unrealized appreciation (depreciation) | 26,906,887 |
| 75,474,464 |
|
| Net increase (decrease) in net assets resulting from operations | 130,879,017 |
| 154,719,512 |
|
| | | |
| Distributions to Shareholders | | |
| From net investment income: | | |
| Investor Class | (472,347 | ) | (2,059,819 | ) |
| I Class | (777,511 | ) | (1,611,245 | ) |
| Y Class | (23 | ) | (27 | ) |
| A Class | — |
| (206,217 | ) |
| R Class | — |
| (26,167 | ) |
| R5 Class | (3,760 | ) | (26 | ) |
| From net realized gains: | | |
| Investor Class | (33,210,964 | ) | — |
|
| I Class | (20,566,325 | ) | — |
|
| Y Class | (474 | ) | — |
|
| A Class | (4,537,047 | ) | — |
|
| C Class | (3,660,556 | ) | — |
|
| R Class | (837,751 | ) | — |
|
| R5 Class | (38,546 | ) | — |
|
| Decrease in net assets from distributions | (64,105,304 | ) | (3,903,501 | ) |
| | | |
| Capital Share Transactions | | |
| Net increase (decrease) in net assets from capital share transactions (Note 5) | (169,631,530 | ) | (244,320,800 | ) |
| | | |
| Net increase (decrease) in net assets | (102,857,817 | ) | (93,504,789 | ) |
| | | |
| Net Assets | | |
| Beginning of period | 786,842,168 |
| 880,346,957 |
|
| End of period | $ | 683,984,351 |
| $ | 786,842,168 |
|
| | | |
See Notes to Financial Statements.
|
|
| Notes to Financial Statements |
JUNE 30, 2018
1. Organization
American Century Quantitative Equity Funds, Inc. (the corporation) is registered under the Investment Company Act of 1940, as amended (the 1940 Act), as an open-end management investment company and is organized as a Maryland corporation. Disciplined Growth Fund (the fund) is one fund in a series issued by the corporation. The fund’s investment objective is to seek long-term capital growth.
The fund offers the Investor Class, I Class, Y Class, A Class, C Class, R Class and R5 Class. The A Class may incur an initial sales charge. The A Class and C Class may be subject to a contingent deferred sales charge. Sale of the Y Class and R5 Class commenced on April 10, 2017.
2. Significant Accounting Policies
The following is a summary of significant accounting policies consistently followed by the fund in preparation of its financial statements. The fund is an investment company and follows accounting and reporting guidance in accordance with accounting principles generally accepted in the United States of America. This may require management to make certain estimates and assumptions at the date of the financial statements. Actual results could differ from these estimates. Management evaluated the impact of events or transactions occurring through the date the financial statements were issued that would merit recognition or disclosure.
Investment Valuations — The fund determines the fair value of its investments and computes its net asset value per share at the close of regular trading (usually 4 p.m. Eastern time) on the New York Stock Exchange (NYSE) on each day the NYSE is open. The Board of Directors has adopted valuation policies and procedures to guide the investment advisor in the fund’s investment valuation process and to provide methodologies for the oversight of the fund’s pricing function.
Equity securities that are listed or traded on a domestic securities exchange are valued at the last reported sales price or at the official closing price as provided by the exchange. Equity securities traded on foreign securities exchanges are generally valued at the closing price of such securities on the exchange where primarily traded or at the close of the NYSE, if that is earlier. If no last sales price is reported, or if local convention or regulation so provides, the mean of the latest bid and asked prices may be used. Securities traded over-the-counter are valued at the mean of the latest bid and asked prices, the last sales price, or the official closing price.
Open-end management investment companies are valued at the reported net asset value per share. Repurchase agreements are valued at cost, which approximates fair value. Exchange-traded futures contracts are valued at the settlement price as provided by the appropriate exchange.
If the fund determines that the market price for an investment is not readily available or the valuation methods mentioned above do not reflect an investment’s fair value, such investment is valued as determined in good faith by the Board of Directors or its delegate, in accordance with policies and procedures adopted by the Board of Directors. In its determination of fair value, the fund may review several factors including, but not limited to, market information regarding the specific investment or comparable investments and correlation with other investment types, futures indices or general market indicators. Circumstances that may cause the fund to use these procedures to value an investment include, but are not limited to: an investment has been declared in default or is distressed; trading in a security has been suspended during the trading day or a security is not actively trading on its principal exchange; prices received from a regular pricing source are deemed unreliable; or there is a foreign market holiday and no trading occurred.
The fund monitors for significant events occurring after the close of an investment’s primary exchange but before the fund’s net asset value per share is determined. Significant events may include, but are not limited to: corporate announcements and transactions; governmental action and political unrest that could impact a specific investment or an investment sector; or armed conflicts, natural disasters and similar events that could affect investments in a specific country or region. The fund also monitors for significant fluctuations between domestic and foreign markets, as evidenced by the U.S. market or such other indicators that the Board of Directors, or its delegate, deems appropriate. If significant fluctuations in foreign markets are identified, the fund may apply a model-derived factor to the closing price of equity securities traded on foreign securities exchanges. The factor is based on observable market data as provided by an independent pricing service.
Security Transactions — Security transactions are accounted for as of the trade date. Net realized gains and losses are determined on the identified cost basis, which is also used for federal income tax purposes.
Investment Income — Dividend income less foreign taxes withheld, if any, is recorded as of the ex-dividend date. Distributions received on securities that represent a return of capital or long-term capital gain are recorded as a reduction of cost of investments and/or as a realized gain. The fund may estimate the components of distributions received that may be considered nontaxable distributions or long-term capital gain distributions for income tax purposes. Interest income is recorded on the accrual basis and includes accretion of discounts and amortization of premiums.
Repurchase Agreements — The fund may enter into repurchase agreements with institutions that American Century Investment Management, Inc. (ACIM) (the investment advisor) has determined are creditworthy pursuant to criteria adopted by the Board of Directors. The fund requires that the collateral, represented by securities, received in a repurchase transaction be transferred to the custodian in a manner sufficient to enable the fund to obtain those securities in the event of a default under the repurchase agreement. ACIM monitors, on a daily basis, the securities transferred to ensure the value, including accrued interest, of the securities under each repurchase agreement is equal to or greater than amounts owed to the fund under each repurchase agreement.
Joint Trading Account — Pursuant to an Exemptive Order issued by the Securities and Exchange Commission, the fund, along with certain other funds in the American Century Investments family of funds, may transfer uninvested cash balances into a joint trading account. These balances are invested in one or more repurchase agreements that are collateralized by U.S. Treasury or Agency obligations.
Segregated Assets — In accordance with the 1940 Act, the fund segregates assets on its books and records to cover certain types of investment securities and other financial instruments. ACIM monitors, on a daily basis, the securities segregated to ensure the fund designates a sufficient amount of liquid assets, marked-to-market daily. The fund may also receive assets or be required to pledge assets at the custodian bank or with a broker for collateral requirements.
Income Tax Status — It is the fund’s policy to distribute substantially all net investment income and net realized gains to shareholders and to otherwise qualify as a regulated investment company under provisions of the Internal Revenue Code. Accordingly, no provision has been made for income taxes. The fund files U.S. federal, state, local and non-U.S. tax returns as applicable. The fund's tax returns are subject to examination by the relevant taxing authority until expiration of the applicable statute of limitations, which is generally three years from the date of filing but can be longer in certain jurisdictions. At this time, management believes there are no uncertain tax positions which, based on their technical merit, would not be sustained upon examination and for which it is reasonably possible that the total amounts of unrecognized tax benefits will significantly change in the next twelve months.
Multiple Class — All shares of the fund represent an equal pro rata interest in the net assets of the class to which such shares belong, and have identical voting, dividend, liquidation and other rights and the same terms and conditions, except for class specific expenses and exclusive rights to vote on matters affecting only individual classes. Income, non-class specific expenses, and realized and unrealized capital gains and losses of the fund are allocated to each class of shares based on their relative net assets.
Distributions to Shareholders — Distributions from net investment income, if any, are generally declared and paid semiannually. Distributions from net realized gains, if any, are generally declared and paid annually. The fund may elect to treat a portion of its payment to a redeeming shareholder, which represents the pro rata share of undistributed net investment income and net realized gains, as a distribution for federal income tax purposes (tax equalization).
Indemnifications — Under the corporation’s organizational documents, its officers and directors are indemnified against certain liabilities arising out of the performance of their duties to the fund. In addition, in the normal course of business, the fund enters into contracts that provide general indemnifications. The maximum exposure under these arrangements is unknown as this would involve future claims that may be made against a fund. The risk of material loss from such claims is considered by management to be remote.
3. Fees and Transactions with Related Parties
Certain officers and directors of the corporation are also officers and/or directors of American Century Companies, Inc. (ACC). The corporation’s investment advisor, ACIM, the corporation's distributor, American Century Investment Services, Inc. (ACIS), and the corporation’s transfer agent, American Century Services, LLC, are wholly owned, directly or indirectly, by ACC.
Management Fees — The corporation has entered into a management agreement with ACIM, under which ACIM provides the fund with investment advisory and management services in exchange for a single, unified management fee (the fee) per class. The agreement provides that all expenses of managing and operating the fund, except distribution and service fees, brokerage expenses, taxes, interest, fees and expenses of the independent directors (including legal counsel fees), and extraordinary expenses, will be paid by ACIM. The fee is computed and accrued daily based on each class's daily net assets and paid monthly in arrears. The difference in the fee among the classes is a result of their separate arrangements for non-Rule 12b-1 shareholder services. It is not the result of any difference in advisory or custodial fees or other expenses related to the management of the fund’s assets, which do not vary by class. The fee consists of (1) an Investment Category Fee based on the daily net assets of the fund and certain other accounts managed by the investment advisor that are in the same broad investment category as the fund and (2) a Complex Fee based on the assets of all the funds in the American Century Investments family of funds.
The Investment Category Fee range, the Complex Fee range and the effective annual management fee for each class for the period ended June 30, 2018 are as follows:
|
| | | |
| | Investment Category Fee Range | Complex Fee Range | Effective Annual Management Fee |
| Investor Class | 0.6880%
to 0.8700% | 0.2500% to 0.3100% | 1.01% |
| I Class | 0.0500% to 0.1100% | 0.81% |
| Y Class | 0.0000% to 0.0600% | 0.76% |
| A Class | 0.2500% to 0.3100% | 1.01% |
| C Class | 0.2500% to 0.3100% | 1.01% |
| R Class | 0.2500% to 0.3100% | 1.01% |
| R5 Class | 0.0500% to 0.1100% | 0.81% |
Distribution and Service Fees — The Board of Directors has adopted a separate Master Distribution and Individual Shareholder Services Plan for each of the A Class, C Class and R Class (collectively the plans), pursuant to Rule 12b-1 of the 1940 Act. The plans provide that the A Class will pay ACIS an annual distribution and service fee of 0.25%. The plans provide that the C Class will pay ACIS an annual distribution and service fee of 1.00%, of which 0.25% is paid for individual shareholder services and 0.75% is paid for distribution services. The plans provide that the R Class will pay ACIS an annual distribution and service fee of 0.50%. The fees are computed and accrued daily based on each class’s daily net assets and paid monthly in arrears. The fees are used to pay financial intermediaries for distribution and individual shareholder services. Fees incurred under the plans during the period ended June 30, 2018 are detailed in the Statement of Operations.
Directors' Fees and Expenses — The Board of Directors is responsible for overseeing the investment advisor’s management and operations of the fund. The directors receive detailed information about the fund and its investment advisor regularly throughout the year, and meet at least quarterly with management of the investment advisor to review reports about fund operations. The fund’s officers do not receive compensation from the fund.
Interfund Transactions — The fund may enter into security transactions with other American Century Investments funds and other client accounts of the investment advisor, in accordance with the 1940 Act rules and procedures adopted by the Board of Directors. The rules and procedures require, among other things, that these transactions be effected at the independent current market price of the security. During the period,
the interfund purchases and sales were $13,811,364 and $13,091,723, respectively. The effect of interfund transactions on the Statement of Operations was $1,365,680 in net realized gain (loss) on investment transactions.
4. Investment Transactions
Purchases and sales of investment securities, excluding short-term investments, for the period ended June 30, 2018 were $721,276,681 and $950,968,562, respectively.
5. Capital Share Transactions
Transactions in shares of the fund were as follows:
|
| | | | | | | | | | |
| | Year ended June 30, 2018 | Year ended June 30, 2017(1) |
| | Shares | Amount | Shares | Amount |
| Investor Class/Shares Authorized | 170,000,000 |
| | 170,000,000 |
| |
| Sold | 2,472,572 |
| $ | 58,172,305 |
| 6,575,712 |
| $ | 138,691,625 |
|
| Issued in reinvestment of distributions | 1,466,544 |
| 33,371,100 |
| 89,981 |
| 2,002,832 |
|
| Redeemed | (8,504,895 | ) | (200,151,785 | ) | (7,214,211 | ) | (148,807,325 | ) |
| | (4,565,779 | ) | (108,608,380 | ) | (548,518 | ) | (8,112,868 | ) |
| I Class/Shares Authorized | 100,000,000 |
| | 100,000,000 |
| |
| Sold | 3,053,444 |
| 71,671,023 |
| 3,304,496 |
| 69,910,623 |
|
| Issued in reinvestment of distributions | 913,990 |
| 20,917,098 |
| 73,292 |
| 1,610,610 |
|
| Redeemed | (5,144,961 | ) | (120,641,069 | ) | (9,916,966 | ) | (197,984,376 | ) |
| | (1,177,527 | ) | (28,052,948 | ) | (6,539,178 | ) | (126,463,143 | ) |
| Y Class/Shares Authorized | 50,000,000 |
| | 50,000,000 |
| |
| Sold | — |
| — |
| 231 |
| 5,000 |
|
| Issued in reinvestment of distributions | 22 |
| 497 |
| 1 |
| 27 |
|
| | 22 |
| 497 |
| 232 |
| 5,027 |
|
| A Class/Shares Authorized | 50,000,000 |
| | 50,000,000 |
| |
| Sold | 376,774 |
| 8,788,129 |
| 812,165 |
| 16,098,997 |
|
| Issued in reinvestment of distributions | 167,654 |
| 3,782,262 |
| 7,384 |
| 163,546 |
|
| Redeemed | (1,620,851 | ) | (37,798,729 | ) | (5,437,249 | ) | (113,675,537 | ) |
| | (1,076,423 | ) | (25,228,338 | ) | (4,617,700 | ) | (97,412,994 | ) |
| C Class/Shares Authorized | 20,000,000 |
| | 20,000,000 |
| |
| Sold | 93,700 |
| 2,087,597 |
| 242,138 |
| 4,677,733 |
|
| Issued in reinvestment of distributions | 164,651 |
| 3,523,536 |
| — |
| — |
|
| Redeemed | (589,772 | ) | (13,023,595 | ) | (693,234 | ) | (13,311,594 | ) |
| | (331,421 | ) | (7,412,462 | ) | (451,096 | ) | (8,633,861 | ) |
| R Class/Shares Authorized | 20,000,000 |
| | 20,000,000 |
| |
| Sold | 71,330 |
| 1,648,416 |
| 103,716 |
| 2,111,613 |
|
| Issued in reinvestment of distributions | 37,720 |
| 837,751 |
| 1,197 |
| 26,167 |
|
| Redeemed | (172,037 | ) | (3,935,711 | ) | (296,491 | ) | (5,845,767 | ) |
| | (62,987 | ) | (1,449,544 | ) | (191,578 | ) | (3,707,987 | ) |
| R5 Class/Shares Authorized | 50,000,000 |
| | 50,000,000 |
| |
| Sold | 48,935 |
| 1,165,506 |
| 231 |
| 5,000 |
|
| Issued in reinvestment of distributions | 1,840 |
| 42,306 |
| 1 |
| 26 |
|
| Redeemed | (3,697 | ) | (88,167 | ) | — |
| — |
|
| | 47,078 |
| 1,119,645 |
| 232 |
| 5,026 |
|
| Net increase (decrease) | (7,167,037 | ) | $ | (169,631,530 | ) | (12,347,606 | ) | $ | (244,320,800 | ) |
| |
| (1) | April 10, 2017 (commencement of sale) through June 30, 2017 for the Y Class and R5 Class. |
6. Fair Value Measurements
The fund’s investments valuation process is based on several considerations and may use multiple inputs to determine the fair value of the investments held by the fund. In conformity with accounting principles generally accepted in the United States of America, the inputs used to determine a valuation are classified into three broad levels.
• Level 1 valuation inputs consist of unadjusted quoted prices in an active market for identical investments.
• Level 2 valuation inputs consist of direct or indirect observable market data (including quoted prices for comparable investments, evaluations of subsequent market events, interest rates, prepayment speeds, credit risk, etc.). These inputs also consist of quoted prices for identical investments initially expressed in local currencies that are adjusted through translation into U.S. dollars.
• Level 3 valuation inputs consist of unobservable data (including a fund’s own assumptions).
The level classification is based on the lowest level input that is significant to the fair valuation measurement. The valuation inputs are not necessarily an indication of the risks associated with investing in these securities or other financial instruments. There were no significant transfers between levels during the period.
As of period end, the fund's investment securities were classified as Level 1. The Schedule of Investments provides additional information on the fund's portfolio holdings.
7. Derivative Instruments
Equity Price Risk — The fund is subject to equity price risk in the normal course of pursuing its investment objectives. A fund may enter into futures contracts based on an equity index in order to manage its exposure to changes in market conditions. A fund may purchase futures contracts to gain exposure to increases in market value or sell futures contracts to protect against a decline in market value. Upon entering into a futures contract, a fund is required to deposit either cash or securities in an amount equal to a certain percentage of the contract value (initial margin). Subsequent payments (variation margin) are made or received daily, in cash, by a fund. The variation margin is equal to the daily change in the contract value and is recorded as unrealized gains and losses. A fund recognizes a realized gain or loss when the contract is closed or expires. Net realized and unrealized gains or losses occurring during the holding period of futures contracts are a component of net realized gain (loss) on futures contract transactions and change in net unrealized appreciation (depreciation) on futures contracts, respectively. One of the risks of entering into futures contracts is the possibility that the change in value of the contract may not correlate with the changes in value of the underlying securities. During the period, the fund participated in equity price risk derivative instruments for temporary investment purposes.
At period end, the fund did not have any derivative instruments disclosed on the Statement of Assets and Liabilities. For the year ended June 30, 2018, the effect of equity price risk derivative instruments on the Statement of Operations was $86,201 in net realized gain (loss) on futures contract transactions.
8. Federal Tax Information
The tax character of distributions paid during the years ended June 30, 2018 and June 30, 2017 were as follows:
|
| | | | | | |
| | 2018 | 2017 |
| Distributions Paid From | | |
| Ordinary income | $ | 17,580,908 |
| $ | 3,903,501 |
|
| Long-term capital gains | $ | 46,524,396 |
| — |
|
The book-basis character of distributions made during the year from net investment income or net realized gains may differ from their ultimate characterization for federal income tax purposes. These differences reflect the differing character of certain income items and net realized gains and losses for financial statement and tax purposes, and may result in reclassification among certain capital accounts on the financial statements.
The reclassifications, which are primarily due to tax equalization, were made to capital $10,568,975, undistributed net investment income $(250,819) and undistributed net realized gain $(10,318,156).
As of period end, the federal tax cost of investments and the components of distributable earnings on a tax-basis were as follows:
|
| | | |
| Federal tax cost of investments | $ | 498,390,770 |
|
| Gross tax appreciation of investments | $ | 196,128,810 |
|
| Gross tax depreciation of investments | (11,477,114 | ) |
| Net tax appreciation (depreciation) of investments | $ | 184,651,696 |
|
| Undistributed ordinary income | $ | 16,753,212 |
|
| Accumulated long-term gains | $ | 35,916,187 |
|
The difference between book-basis and tax-basis unrealized appreciation (depreciation) is attributable primarily to the tax deferral of losses on wash sales.
|
| | | | | | | | | | | | | | | |
| For a Share Outstanding Throughout the Years Ended June 30 (except as noted) | | |
| Per-Share Data | | | | | Ratios and Supplemental Data |
| | | Income From Investment Operations: | Distributions From: | | | Ratio to Average Net Assets of: | |
| | Net Asset
Value,
Beginning
of Period | Net
Investment
Income
(Loss)(1) | Net
Realized
and
Unrealized
Gain (Loss) | Total From
Investment
Operations | Net
Investment
Income | Net
Realized
Gains | Total
Distributions | Net Asset
Value,
End
of Period | Total
Return(2) | Operating
Expenses | Net
Investment
Income
(Loss) | Portfolio
Turnover
Rate | Net
Assets,
End of
Period
(in thousands) |
| Investor Class | | | | | | | | | | | |
| 2018 | $22.10 | 0.05 | 3.97 | 4.02 | (0.03) | (2.04) | (2.07) | $24.05 | 18.80% | 1.02% | 0.21% | 97% |
| $362,865 |
|
| 2017 | $18.36 | 0.11 | 3.74 | 3.85 | (0.11) | — | (0.11) | $22.10 | 20.88% | 1.02% | 0.51% | 124% |
| $434,242 |
|
| 2016 | $19.15 | 0.12 | (0.53) | (0.41) | (0.12) | (0.26) | (0.38) | $18.36 | (2.08)% | 1.03% | 0.64% | 113% |
| $370,901 |
|
| 2015 | $18.82 | 0.14 | 1.09 | 1.23 | (0.11) | (0.79) | (0.90) | $19.15 | 6.59% | 1.02% | 0.75% | 108% |
| $502,389 |
|
| 2014 | $15.56 | 0.12 | 4.15 | 4.27 | (0.11) | (0.90) | (1.01) | $18.82 | 28.05% | 1.02% | 0.70% | 102% |
| $226,370 |
|
| I Class | | | | | | | | | | | |
| 2018 | $22.16 | 0.10 | 3.99 | 4.09 | (0.08) | (2.04) | (2.12) | $24.13 | 19.01% | 0.82% | 0.41% | 97% |
| $231,261 |
|
| 2017 | $18.41 | 0.15 | 3.75 | 3.90 | (0.15) | — | (0.15) | $22.16 | 21.18% | 0.82% | 0.71% | 124% |
| $238,480 |
|
| 2016 | $19.20 | 0.16 | (0.53) | (0.37) | (0.16) | (0.26) | (0.42) | $18.41 | (1.95)% | 0.83% | 0.84% | 113% |
| $318,576 |
|
| 2015 | $18.87 | 0.20 | 1.06 | 1.26 | (0.14) | (0.79) | (0.93) | $19.20 | 6.84% | 0.82% | 0.95% | 108% |
| $372,011 |
|
| 2014 | $15.60 | 0.16 | 4.15 | 4.31 | (0.14) | (0.90) | (1.04) | $18.87 | 28.30% | 0.82% | 0.90% | 102% |
| $26,334 |
|
| Y Class | | | | | | | | | | | | |
| 2018 | $22.17 | 0.11 | 3.99 | 4.10 | (0.09) | (2.04) | (2.13) | $24.14 | 19.06% | 0.77% | 0.46% | 97% |
| $6 |
|
2017(3) | $21.62 | 0.04 | 0.63 | 0.67 | (0.12) | — | (0.12) | $22.17 | 3.07% | 0.77%(4) | 0.74%(4) | 124%(5) |
| $5 |
|
| A Class | | | | | | | | | | |
| 2018 | $21.97 | (0.01) | 3.95 | 3.94 | — | (2.04) | (2.04) | $23.87 | 18.48% | 1.27% | (0.04)% | 97% |
| $37,832 |
|
| 2017 | $18.28 | 0.05 | 3.72 | 3.77 | (0.08) | — | (0.08) | $21.97 | 20.61% | 1.27% | 0.26% | 124% |
| $58,469 |
|
| 2016 | $19.09 | 0.07 | (0.52) | (0.45) | (0.10) | (0.26) | (0.36) | $18.28 | (2.35)% | 1.28% | 0.39% | 113% |
| $133,042 |
|
| 2015 | $18.77 | 0.09 | 1.08 | 1.17 | (0.06) | (0.79) | (0.85) | $19.09 | 6.35% | 1.27% | 0.50% | 108% |
| $173,300 |
|
| 2014 | $15.52 | 0.08 | 4.13 | 4.21 | (0.06) | (0.90) | (0.96) | $18.77 | 27.75% | 1.27% | 0.45% | 102% |
| $95,509 |
|
|
| | | | | | | | | | | | | | | |
| For a Share Outstanding Throughout the Years Ended June 30 (except as noted) | | |
| Per-Share Data | | | | | Ratios and Supplemental Data |
| | | Income From Investment Operations: | Distributions From: | | | Ratio to Average Net Assets of: | |
| | Net Asset
Value,
Beginning
of Period | Net
Investment
Income
(Loss)(1) | Net
Realized
and
Unrealized
Gain (Loss) | Total From
Investment
Operations | Net
Investment
Income | Net
Realized
Gains | Total
Distributions | Net Asset
Value,
End
of Period | Total
Return(2) | Operating
Expenses | Net
Investment
Income
(Loss) | Portfolio
Turnover
Rate | Net
Assets,
End of
Period
(in thousands) |
| C Class | | | | | | | | | | | |
| 2018 | $21.00 | (0.17) | 3.76 | 3.59 | — | (2.04) | (2.04) | $22.55 | 17.57% | 2.02% | (0.79)% | 97% |
| $40,253 |
|
| 2017 | $17.54 | (0.09) | 3.55 | 3.46 | — | — | — | $21.00 | 19.73% | 2.02% | (0.49)% | 124% |
| $44,456 |
|
| 2016 | $18.41 | (0.06) | (0.51) | (0.57) | (0.04) | (0.26) | (0.30) | $17.54 | (3.11)% | 2.03% | (0.36)% | 113% |
| $45,050 |
|
| 2015 | $18.21 | (0.05) | 1.04 | 0.99 | — | (0.79) | (0.79) | $18.41 | 5.56% | 2.02% | (0.25)% | 108% |
| $50,355 |
|
| 2014 | $15.14 | (0.05) | 4.02 | 3.97 | — | (0.90) | (0.90) | $18.21 | 26.80% | 2.02% | (0.30)% | 102% |
| $24,646 |
|
| R Class | | | | | | | | | | |
| 2018 | $21.68 | (0.06) | 3.89 | 3.83 | — | (2.04) | (2.04) | $23.47 | 18.20% | 1.52% | (0.29)% | 97% |
| $10,626 |
|
| 2017 | $18.06 | —(6) | 3.67 | 3.67 | (0.05) | — | (0.05) | $21.68 | 20.33% | 1.52% | 0.01% | 124% |
| $11,184 |
|
| 2016 | $18.89 | 0.03 | (0.52) | (0.49) | (0.08) | (0.26) | (0.34) | $18.06 | (2.60)% | 1.53% | 0.14% | 113% |
| $12,778 |
|
| 2015 | $18.60 | 0.04 | 1.06 | 1.10 | (0.02) | (0.79) | (0.81) | $18.89 | 6.06% | 1.52% | 0.25% | 108% |
| $14,449 |
|
| 2014 | $15.39 | 0.03 | 4.10 | 4.13 | (0.02) | (0.90) | (0.92) | $18.60 | 27.41% | 1.52% | 0.20% | 102% |
| $6,611 |
|
| R5 Class | | | | | | | | | | | | |
| 2018 | $22.17 | 0.10 | 3.99 | 4.09 | (0.08) | (2.04) | (2.12) | $24.14 | 19.00% | 0.82% | 0.41% | 97% |
| $1,142 |
|
2017(3) | $21.62 | 0.03 | 0.63 | 0.66 | (0.11) | — | (0.11) | $22.17 | 3.06% | 0.82%(4) | 0.69%(4) | 124%(5) |
| $5 |
|
|
|
| Notes to Financial Highlights |
| |
| (1) | Computed using average shares outstanding throughout the period. |
| |
| (2) | Total returns are calculated based on the net asset value of the last business day and do not reflect applicable sales charges, if any. Total returns for periods less than one year are not annualized. |
| |
| (3) | April 10, 2017 (commencement of sale) through June 30, 2017. |
| |
| (5) | Portfolio turnover is calculated at the fund level. Percentage indicated was calculated for the year ended June 30, 2017. |
| |
| (6) | Amount is less than $0.005. |
See Notes to Financial Statements.
|
|
| Report of Independent Registered Public Accounting Firm |
To the Board of Directors of American Century Quantitative Equity Funds, Inc. and Shareholders of Disciplined Growth Fund
Opinion on the Financial Statements
We have audited the accompanying statement of assets and liabilities, including the schedule of investments, of Disciplined Growth Fund (one of the funds constituting American Century Quantitative Equity Funds, Inc., referred to hereafter as the "Fund") as of June 30, 2018, the related statement of operations for the year ended June 30, 2018, the statement of changes in net assets for each of the two years in the period ended June 30, 2018, including the related notes, and the financial highlights for each of the periods indicated therein (collectively referred to as the “financial statements”). In our opinion, the financial statements present fairly, in all material respects, the financial position of the Fund as of June 30, 2018, the results of its operations for the year then ended, the changes in its net assets for each of the two years in the period ended June 30, 2018 and the financial highlights for each of the periods indicated therein in conformity with accounting principles generally accepted in the United States of America.
Basis for Opinion
These financial statements are the responsibility of the Fund’s management. Our responsibility is to express an opinion on the Fund’s financial statements based on our audits. We are a public accounting firm registered with the Public Company Accounting Oversight Board (United States) (“PCAOB”) and are required to be independent with respect to the Fund in accordance with the U.S. federal securities laws and the applicable rules and regulations of the Securities and Exchange Commission and the PCAOB.
We conducted our audits of these financial statements in accordance with the standards of the PCAOB. Those standards require that we plan and perform the audit to obtain reasonable assurance about whether the financial statements are free of material misstatement, whether due to error or fraud.
Our audits included performing procedures to assess the risks of material misstatement of the financial statements, whether due to error or fraud, and performing procedures that respond to those risks. Such procedures included examining, on a test basis, evidence regarding the amounts and disclosures in the financial statements. Our audits also included evaluating the accounting principles used and significant estimates made by management, as well as evaluating the overall presentation of the financial statements. Our procedures included confirmation of securities owned as of June 30, 2018 by correspondence with the custodian and brokers. We believe that our audits provide a reasonable basis for our opinion.
/s/ PricewaterhouseCoopers LLP
Kansas City, Missouri
August 16, 2018
We have served as the auditor of one or more investment companies in American Century Investments since 1997.
The Board of Directors
The individuals listed below serve as directors of the funds. Each director will continue to serve in this capacity until death, retirement, resignation or removal from office. The board has adopted a mandatory retirement age for directors who are not “interested persons,” as that term is defined in the Investment Company Act (independent directors). Independent directors shall retire by December 31 of the year in which they reach their 75th birthday; provided, however, that on or after January 1, 2022, independent trustees shall retire on December 31 of the year in which they reach their 76th birthday.
Mr. Thomas is an “interested person” because he currently serves as President and Chief Executive Officer of American Century Companies, Inc. (ACC), the parent company of American Century Investment Management, Inc. (ACIM or the advisor). The other directors (more than three-fourths of the total number) are independent. They are not employees, directors or officers of, and have no financial interest in, ACC or any of its wholly owned, direct or indirect, subsidiaries, including ACIM, American Century Investment Services, Inc. (ACIS) and American Century Services, LLC (ACS), and they do not have any other affiliations, positions or relationships that would cause them to be considered “interested persons” under the Investment Company Act. The directors serve in this capacity for eight (in the case of Jonathan S. Thomas, 16; and Ronald J. Gilson, 9) registered investment companies in the American Century Investments family of funds.
The following table presents additional information about the directors. The mailing address for each director other than Mr. Thomas is 1665 Charleston Road, Mountain View, California 94043. The mailing address for Mr. Thomas is 4500 Main Street, Kansas City, Missouri 64111.
|
| | | | | |
Name
(Year of Birth) | Position(s) Held with Funds | Length of Time Served | Principal Occupation(s) During Past 5 Years | Number of American Century Portfolios Overseen by Director | Other Directorships Held During Past 5 Years |
| Independent Directors |
|
|
Tanya S. Beder
(1955) | Director | Since 2011 | Chairman and CEO, SBCC Group Inc. (independent advisory services) (2006 to present) | 45 | CYS Investments, Inc.; Nabors Industries Ltd. |
Jeremy I. Bulow
(1954) | Director | Since 2011 | Professor of Economics, Stanford University, Graduate School of Business (1979 to present) | 45 | None |
Anne Casscells
(1958) | Director | Since 2016 | Co-Chief Executive Officer and Chief Investment Officer, Aetos Alternatives Management (investment advisory firm) (2001 to present); Lecturer in Accounting, Stanford University, Graduate School of Business (2009 to present) | 45 | None |
|
| | | | | |
Name
(Year of Birth) | Position(s) Held with Funds | Length of Time Served | Principal Occupation(s) During Past 5 Years | Number of American Century Portfolios Overseen by Director | Other Directorships Held During Past 5 Years |
| Independent Directors |
|
|
Ronald J. Gilson
(1946) | Director and Chairman of the Board | Since 1995
(Chairman since 2005) | Charles J. Meyers Professor of Law and Business, Emeritus, Stanford Law School (1979 to 2016); Marc and Eva Stern Professor of Law and Business, Columbia University School of Law (1992 to present) | 47 | None |
Frederick L. A. Grauer
(1946) | Director | Since 2008 | Senior Advisor, iShares by BlackRock, Inc. (investment management firm) (2010 to 2011, 2013 to 2015); Senior Advisor, Course Hero (an educational technology company) (2015 to present) | 45 | None |
Jonathan D. Levin
(1972) | Director | Since 2016 | Philip H. Knight Professor and Dean, Graduate School of Business, Stanford University (2016 to present); Professor, Stanford University, (2000 to present); Chair, Department of Economics, Stanford University (2011 to 2014) | 45 | None |
Peter F. Pervere
(1947) | Director | Since 2007 | Retired | 45 | None |
John B. Shoven
(1947) | Director | Since 2002 | Charles R. Schwab Professor of Economics, Stanford University (1973 to present) | 45 | Cadence Design Systems; Exponent; Financial Engines |
| Interested Director |
|
|
Jonathan S. Thomas
(1963) | Director and President | Since 2007 | President and Chief Executive Officer, ACC (2007 to present). Also serves as Chief Executive Officer, ACS; Executive Vice President, ACIM; Director, ACC, ACIM and other ACC subsidiaries | 115 | BioMed Valley Discoveries, Inc. |
The Statement of Additional Information has additional information about the fund's directors and is available without charge, upon request, by calling 1-800-345-2021.
Officers
The following table presents certain information about the executive officers of the funds. Each officer serves as an officer for each of the 16 (in the case of Robert J. Leach, 15) investment companies in the American Century family of funds, unless otherwise noted. No officer is compensated for his or her service as an officer of the funds. The listed officers are interested persons of the funds and are appointed or re-appointed on an annual basis. The mailing address for each officer listed below is 4500 Main Street, Kansas City, Missouri 64111.
|
| | |
Name
(Year of Birth) | Offices with the Funds | Principal Occupation(s) During the Past Five Years |
Jonathan S. Thomas
(1963) | Director and President since 2007 | President and Chief Executive Officer, ACC (2007 to present). Also serves as Chief Executive Officer, ACS; Executive Vice President, ACIM; Director, ACC, ACIM and other ACC subsidiaries |
Amy D. Shelton
(1964) | Chief Compliance Officer and Vice President since 2014 | Chief Compliance Officer, American Century funds, (2014 to present); Chief Compliance Officer, ACIM (2014 to present); Chief Compliance Officer, ACIS (2009 to present); Vice President, Client Interactions and Marketing, ACIS (2013 to 2014). Also serves as Vice President, ACIS |
Charles A. Etherington
(1957) | General Counsel since 2007 and Senior Vice President since 2006 | Attorney, ACC (1994 to present); Vice President, ACC (2005 to present); General Counsel, ACC (2007 to present). Also serves as General Counsel, ACIM, ACS, ACIS and other ACC subsidiaries; and Senior Vice President, ACIM and ACS |
C. Jean Wade
(1964) | Vice President,Treasurer and Chief Financial Officer since 2012 | Senior Vice President, ACS (2017 to present); Vice President, ACS (2000 to 2017) |
Robert J. Leach
(1966) | Vice President since 2006 and Assistant Treasurer since 2012 | Vice President, ACS (2000 to present) |
David H. Reinmiller
(1963) | Vice President since 2000 | Attorney, ACC (1994 to present). Also serves as Vice President, ACIM and ACS |
Ward D. Stauffer
(1960) | Secretary since 2005 | Attorney, ACC (2003 to present) |
|
|
| Approval of Management Agreement |
At a meeting held on June 19, 2018, the Fund’s Board of Directors (the "Board") unanimously approved the renewal of the management agreement pursuant to which American Century Investment Management, Inc. (the “Advisor”) acts as the investment advisor for the Fund. Under Section 15(c) of the Investment Company Act, contracts for investment advisory services are required to be reviewed, evaluated, and approved by a majority of a fund’s directors/trustees, including a majority of the independent Directors, each year. The Board regards this annual evaluation and renewal as one of its most important responsibilities.
The independent Directors have memorialized a statement regarding the relationship between their ongoing obligations to oversee and evaluate the performance of the Advisor and their annual consideration of renewal of the management agreement. In that statement, the independent Directors noted that their assessment of the Advisor’s performance is an ongoing process that takes place over the entire year and is informed by all of the extensive information that the Board and its committees receive and consider over time. This information, together with the additional materials provided specifically in connection with the review, are central to the Board’s assessment of the Advisor’s performance and its determination whether to renew the Fund’s management agreement.
Prior to its consideration of the renewal of the management agreement, the Board requested and reviewed extensive data and analysis relating to the proposed renewal. This information and analysis was compiled by the Advisor and certain independent providers of evaluation data concerning the Fund and the services provided to the Fund by the Advisor.
In connection with its consideration of the renewal of the management agreement, the Board’s review and evaluation of the services provided by the Advisor included, but was not limited to, the following:
| |
| • | the nature, extent, and quality of investment management, shareholder services, and other services provided to the Fund; |
| |
| • | the wide range of other programs and services the Advisor provides to the Fund and its shareholders on a routine and non-routine basis; |
| |
| • | the investment performance of the Fund, including data comparing the Fund’s performance to appropriate benchmarks and/or a peer group of other mutual funds with similar investment objectives and strategies; |
| |
| • | the cost of owning the Fund compared to the cost of owning similar funds; |
| |
| • | the Advisor’s compliance policies, procedures, and regulatory experience; |
| |
| • | financial data showing the cost of services provided to the Fund, the profitability of the Fund to the Advisor, and the overall profitability of the Advisor; |
| |
| • | strategic plans of the Advisor; |
| |
| • | any economies of scale associated with the Advisor’s management of the Fund and other accounts; |
| |
| • | services provided and charges to other investment management clients of the Advisor; |
| |
| • | acquired fund fees and expenses; |
| |
| • | payments and practices in connection with financial intermediaries holding shares of the Fund and the services provided by intermediaries in connection therewith; and |
| |
| • | any collateral benefits derived by the Advisor from the management of the Fund. |
In keeping with its practice, the Board held two in-person meetings to review and discuss the information provided in response to their request and held active discussions with the Advisor regarding the renewal of the management agreement. The independent Directors had the benefit of the advice of their independent counsel throughout the process.
Factors Considered
The Directors considered all of the information provided by the Advisor, the independent data providers, and the independent Directors’ independent counsel in connection with the approval. They determined that the information was sufficient for them to evaluate the management agreement for the Fund. In connection with their review, the Directors did not identify any single factor as being all-important or controlling and each Director may have attributed different levels of importance to different factors. In deciding to renew the management agreement, the Board based its decision on a number of factors, including the following:
Nature, Extent and Quality of Services - Generally. Under the management agreement, the Advisor is responsible for providing or arranging for all services necessary for the operation of the Fund. The Board noted that the Advisor provides or arranges at its own expense a wide variety of services including:
| |
| • | constructing and designing the Fund |
| |
| • | portfolio research and security selection |
| |
| • | initial capitalization/funding |
| |
| • | daily valuation of the Fund’s portfolio |
| |
| • | shareholder servicing and transfer agency, including shareholder confirmations, recordkeeping, and communications |
| |
| • | legal services (except the independent Directors’ counsel) |
| |
| • | regulatory and portfolio compliance |
| |
| • | marketing and distribution (except amounts paid by the Fund under Rule 12b-1 plans) |
The Board noted that many of these services have expanded over time in terms of both quantity and complexity in response to shareholder demands, competition in the industry, changing distribution channels, and the changing regulatory environment.
Investment Management, Shareholder, and Other Services. The nature of the investment management services provided to the Fund is quite complex and allows Fund shareholders access to professional money management, instant diversification of their investments within an asset class, the opportunity to easily diversify among asset classes by investing in or exchanging among various American Century Investments funds, and liquidity. In evaluating investment performance, the Board expects the Advisor to manage the Fund in accordance with its investment objectives and approved strategies. Further, the Directors recognize that the Advisor has an obligation to seek the best execution of fund trades. In providing these services, the Advisor utilizes teams of investment professionals (portfolio managers, analysts, research assistants, and securities traders) who require extensive information technology, research, training, compliance, and other systems to conduct their business. The Board, directly and through its Portfolio Committee, regularly reviews investment performance information for the Fund, together with comparative information for appropriate benchmarks and/or peer groups of similarly-managed funds, over different time horizons. The Directors also review detailed performance information during the management agreement approval process. If performance concerns are identified, the Fund receives special reviews until performance improves, during which the Board discusses with the Advisor the reasons for such results (e.g., market conditions, security selection) and any efforts being undertaken to improve performance. The Fund’s performance was above its benchmark for the ten-year period and below its benchmark for the one-, three-, and five-year periods reviewed by the Board. The Board found the investment management services provided by the Advisor to the Fund to be satisfactory and consistent with the management agreement.
Under the management agreement, the Advisor provides the Fund with a comprehensive package of transfer agency, shareholder, and other services. The Board, directly and through various committees of the Board, regularly reviews reports and evaluations of such services at its regular meetings. These reports include, but are not limited to, information regarding the operational efficiency and accuracy of the shareholder and transfer agency services provided, staffing levels, shareholder satisfaction (as measured by external as well as internal sources), technology support, new products and services offered to Fund shareholders, securities trading activities, portfolio valuation services, auditing services, and legal and operational compliance activities. The Board found the services provided by the Advisor to the Fund under the management agreement to be competitive and of high quality.
Costs of Services and Profitability. The Advisor provides detailed information concerning its cost of providing various services to the Fund, its profitability in managing the Fund, its overall profitability, and its financial condition. The Directors have reviewed with the Advisor the methodology used to prepare this financial information. This information is considered in evaluating the Advisor’s financial condition, its ability to continue to provide services under the management agreement, and the reasonableness of the current management fee. The Board concluded that the Advisor’s profits were reasonable in light of the services provided to the Fund.
Economies of Scale. The Board also reviewed information provided by the Advisor regarding the possible existence of economies of scale in connection with the management of the Fund. The Board concluded that economies of scale are difficult to measure and predict with precision, especially on a fund-by-fund basis. The Board concluded that the Advisor is appropriately sharing economies of scale through its competitive fee structure, offering competitive fees from fund inception, and through reinvestment in its business to provide shareholders enhanced and expanded services.
Comparison to Other Funds’ Fees. The management agreement provides that the Fund pays the Advisor a single, all-inclusive (or unified) management fee for providing all services necessary for the management and operation of the Fund, other than brokerage expenses, expenses attributable to short sales, taxes, interest, extraordinary expenses, the fees and expenses of the Fund’s independent Directors (including their independent legal counsel), and expenses incurred in connection with the provision of shareholder services and distribution services under a plan adopted pursuant to Rule 12b-1 under the 1940 Act. Under the unified fee structure, the Advisor is responsible for providing all investment advisory, custody, audit, administrative, compliance, recordkeeping, marketing, and shareholder services, or arranging and supervising third parties to provide such services. By contrast, most other funds are charged a variety of fees, including an investment advisory fee, a transfer agency fee, an administrative fee, distribution charges, and other expenses. Other than their investment advisory fees and any applicable Rule 12b-1 distribution fees, all other components of the total fees charged by these other funds may be increased without shareholder approval. The Board believes the unified fee structure is a benefit to Fund shareholders because it clearly discloses to shareholders the cost of owning Fund shares, and, since the unified fee cannot be increased without a vote of Fund shareholders, it shifts to the Advisor the risk of increased costs of operating the Fund and provides a direct incentive to minimize administrative inefficiencies. Part of the Board’s analysis of fee levels involves reviewing certain evaluative data compiled by an independent provider and comparing the Fund’s unified fee to the total expense ratio of peer funds. The unified fee charged to shareholders of the Fund was slightly above the median of the total expense ratios of the Fund’s peer group. The Board concluded that the management fee paid by the Fund to the Advisor under the management agreement is reasonable in light of the services provided to the Fund.
Comparison to Fees and Services Provided to Other Clients of the Advisor. The Board also requested and received information from the Advisor concerning the nature of the services, fees, costs, and profitability of its advisory services to advisory clients other than the Fund. They observed that these varying types of client accounts require different services and involve different regulatory and entrepreneurial risks than the management of the Fund. The Board analyzed this
information and concluded that the fees charged and services provided to the Fund were reasonable by comparison.
Payments to Intermediaries. The Directors also requested and received a description of payments made to intermediaries by the Fund and the Advisor and services provided by intermediaries. These payments include various payments made by the Fund or the Advisor to different types of intermediaries and recordkeepers for distribution and service activities provided for the Fund. The Directors reviewed such information and received representations from the Advisor that all such payments by the Fund were made pursuant to the Fund’s Rule 12b-1 Plan and that all such payments by the Advisor were made from the Advisor’s resources and reasonable profits. The Board found such payments to be reasonable in scope and purpose.
Collateral or “Fall-Out” Benefits Derived by the Advisor. The Board considered the existence of collateral benefits the Advisor may receive as a result of its relationship with the Fund. The Board noted that the Advisor’s primary business is managing mutual funds and it generally does not use fund or shareholder information to generate profits in other lines of business, and therefore does not derive any significant collateral benefits from them. The Board noted that the Advisor may receive proprietary research from broker-dealers that execute fund portfolio transactions. The Board also determined that the Advisor is able to provide investment management services to certain clients other than the Fund, at least in part, due to its existing infrastructure built to serve the fund complex. The Board noted that the assets of those other accounts are, where applicable, included with the assets of the Fund to determine breakpoints in the management fee schedule.
Existing Relationship. The Board also considered whether there was any reason for not continuing the existing arrangement with the Advisor. In this regard, the Board was mindful of the potential disruptions of the Fund’s operations and various risks, uncertainties, and other effects that could occur as a result of a decision not to continue such relationship. In particular, the Board recognized that most shareholders have invested in the Fund on the strength of the Advisor’s industry standing and reputation and in the expectation that the Advisor will have a continuing role in providing advisory services to the Fund.
Conclusion of the Directors. As a result of this process, the Board, including all of the independent Directors and assisted by the advice of independent legal counsel, taking into account all of the factors discussed above and the information provided by the Advisor and others in connection with its review and throughout the year, concluded that the management agreement between the Fund and the Advisor is fair and reasonable in light of the services provided and should be renewed.
Retirement Account Information
As required by law, distributions you receive from certain retirement accounts are subject to federal income tax withholding, unless you elect not to have withholding apply*. Tax will be withheld on the total amount withdrawn even though you may be receiving amounts that are not subject to withholding, such as nondeductible contributions. In such case, excess amounts of withholding could occur. You may adjust your withholding election so that a greater or lesser amount will be withheld.
If you don’t want us to withhold on this amount, you must notify us to not withhold the federal income tax. You may notify us in writing or in certain situations by telephone or through other electronic means. For systematic withdrawals, your withholding election will remain in effect until revoked or changed by filing a new election. You have the right to revoke your election at any time and change your withholding percentage for future distributions.
Remember, even if you elect not to have income tax withheld, you are liable for paying income tax on the taxable portion of your withdrawal. If you elect not to have income tax withheld or you don’t have enough income tax withheld, you may be responsible for payment of estimated tax. You may incur penalties under the estimated tax rules if your withholding and estimated tax payments are not sufficient. You can reduce or defer the income tax on a distribution by directly or indirectly rolling such distribution over to another IRA or eligible plan. You should consult your tax advisor for additional information.
State tax will be withheld if, at the time of your distribution, your address is within one of the mandatory withholding states and you have federal income tax withheld (or as otherwise required by state law). State taxes will be withheld from your distribution in accordance with the respective state rules.
*Some 403(b), 457 and qualified retirement plan distributions may be subject to 20% mandatory withholding, as they are subject to special tax and withholding rules. Your plan administrator or plan sponsor is required to provide you with a special tax notice explaining those rules at the time you request a distribution. If applicable, federal and/or state taxes may be withheld from your distribution amount.
Proxy Voting Policies
Descriptions of the principles and policies that the fund's investment advisor uses in exercising the voting rights associated with the securities purchased and/or held by the fund are available without charge, upon request, by calling 1-800-345-2021 or visiting the "About Us" page of American Century Investments’ website at americancentury.com. A description of the policies is also available on the Securities and Exchange Commission’s website at sec.gov. Information regarding how the investment advisor voted proxies relating to portfolio securities during the most recent 12-month period ended June 30 is available on the "About Us" page at americancentury.com. It is also available at sec.gov.
Quarterly Portfolio Disclosure
The fund files its complete schedule of portfolio holdings with the Securities and Exchange Commission (SEC) for the first and third quarters of each fiscal year on Form N-Q. The fund’s Forms N-Q are available on the SEC’s website at sec.gov, and may be reviewed and copied at the SEC’s Public Reference Room in Washington, DC. Information on the operation of the Public Reference Room may be obtained by calling 1-800-SEC-0330. The fund also makes its complete schedule of portfolio holdings for the most recent quarter of its fiscal year available on its website at americancentury.com and, upon request, by calling 1-800-345-2021.
Other Tax Information
The following information is provided pursuant to provisions of the Internal Revenue Code.
The fund hereby designates up to the maximum amount allowable as qualified dividend income for the fiscal year ended June 30, 2018.
For corporate taxpayers, the fund hereby designates $8,417,315, or up to the maximum amount allowable, of ordinary income distributions paid during the fiscal year ended June 30, 2018 as qualified for the corporate dividends received deduction.
The fund hereby designates $20,203,670 as qualified short-term capital gain distributions for purposes of Internal Revenue Code Section 871 for the fiscal year ended June 30, 2018.
The fund hereby designates $53,278,469, or up to the maximum amount allowable, as long-term capital gain distributions (20% rate gain distributions) for the fiscal year ended June 30, 2018.
The fund utilized earnings and profits of $10,568,975 distributed to shareholders on redemption of shares as part of the dividends paid deduction (tax equalization).
|
| | |
| |
| | | |
| Contact Us | americancentury.com | |
| Automated Information Line | 1-800-345-8765 | |
| Investor Services Representative | 1-800-345-2021
or 816-531-5575 | |
| Investors Using Advisors | 1-800-378-9878 | |
Business, Not-For-Profit, Employer-Sponsored
Retirement Plans | 1-800-345-3533 | |
Banks and Trust Companies, Broker-Dealers,
Financial Professionals, Insurance Companies | 1-800-345-6488 | |
| Telecommunications Relay Service for the Deaf | 711 | |
| | | |
| American Century Quantitative Equity Funds, Inc. | |
| | | |
Investment Advisor: American Century Investment Management, Inc. Kansas City, Missouri | |
| | | |
| This report and the statements it contains are submitted for the general information of our shareholders. The report is not authorized for distribution to prospective investors unless preceded or accompanied by an effective prospectus. | |
| | | |
©2018 American Century Proprietary Holdings, Inc. All rights reserved.
CL-ANN-92989 1808 | |
|
| |
| | |
| | Annual Report |
| | |
| | June 30, 2018 |
| | |
| | Equity Growth Fund |
| | Investor Class (BEQGX) |
| | I Class (AMEIX) |
| | A Class (BEQAX) |
| | C Class (AEYCX) |
| | R Class (AEYRX) |
| | R5 Class (AEYGX) |
|
| | |
| President's Letter | 2 |
|
| Performance | 3 |
|
| Portfolio Commentary | |
|
| Fund Characteristics | |
|
| Shareholder Fee Example | |
|
| Schedule of Investments | |
|
| Statement of Assets and Liabilities | |
|
| Statement of Operations | |
|
| Statement of Changes in Net Assets | |
|
| Notes to Financial Statements | |
|
| Financial Highlights | |
|
| Report of Independent Registered Public Accounting Firm | |
|
| Management | |
|
| Approval of Management Agreement | |
|
| Additional Information | |
|
Any opinions expressed in this report reflect those of the author as of the date of the report, and do not necessarily represent the opinions of American Century Investments® or any other person in the American Century Investments organization. Any such opinions are subject to change at any time based upon market or other conditions and American Century Investments disclaims any responsibility to update such opinions. These opinions may not be relied upon as investment advice and, because investment decisions made by American Century Investments funds are based on numerous factors, may not be relied upon as an indication of trading intent on behalf of any American Century Investments fund. Security examples are used for representational purposes only and are not intended as recommendations to purchase or sell securities. Performance information for comparative indices and securities is provided to American Century Investments by third party vendors. To the best of American Century Investments’ knowledge, such information is accurate at the time of printing.
Jonathan Thomas
Dear Investor:
Thank you for reviewing this annual report for the period ended June 30, 2018. Annual reports help convey important information about fund returns, including market factors that affected performance during the reporting period. For additional, updated investment and market insights, we encourage you to visit our website, americancentury.com.
Volatility’s Return Challenged Financial Markets
Broad U.S. and global stock market indices generally rallied for the first half of the 12-month period. A favorable backdrop of robust corporate earnings results, improving global economic growth, and relatively low interest rates, combined with the effects of U.S. tax reform, drove stock prices higher. For the six months ended December 31, 2017, U.S. stocks (S&P 500 Index) returned 11.42%. U.S. bond returns were also positive, but much more subdued, as the Federal Reserve (the Fed) continued its rate-normalization efforts and interest rates edged higher. The Bloomberg Barclays U.S. Aggregate Bond Index returned 1.24% for the six-month period.
In early February, a force that was largely dormant during 2017—volatility—re-emerged, as better-than-expected economic data triggered expectations for rising inflation, higher interest rates, and a more-hawkish Fed. In response, U.S. Treasury yields climbed to their highest levels in several years, and stock prices plunged. Economic data released in subsequent months were more in line with market expectations, while corporate earnings results remained healthy. These factors helped calm the market unrest, and stocks generally recovered their earlier losses. Nevertheless, rising interest rates, geopolitical tensions, and the mounting threat of a global trade war continued to provide periodic headwinds for investors.
Despite the return of volatility, U.S. stocks (S&P 500 Index) gained14.37% for the 12-month period. Meanwhile, rising U.S. Treasury yields, particularly in the second half of the period, took a toll on bonds and other interest-rate-sensitive investments, including gold, utilities stocks, and real estate investment trusts (REITs). Investment-grade bonds (Bloomberg Barclays U.S. Aggregate Bond Index) returned -0.40% for the 12 months.
With volatility resurfacing, inflationary pressures building, Treasury yields rising, and the implications of U.S. tariff and trade policy still unfolding, investors likely will face new opportunities and challenges in the months ahead. We believe this scenario warrants a disciplined, diversified, and risk-aware approach, using professionally managed portfolios in pursuit of investment goals. We appreciate your continued trust and confidence in us.
Sincerely,
Jonathan Thomas
President and Chief Executive Officer
American Century Investments
|
| | | | | | |
| Total Returns as of June 30, 2018 |
| | | | Average Annual Returns | |
| | Ticker Symbol | 1 year | 5 years | 10 years | Since Inception | Inception Date |
| Investor Class | BEQGX | 15.62% | 11.90% | 9.18% | — | 5/9/91 |
| S&P 500 Index | — | 14.37% | 13.41% | 10.16% | — | — |
| I Class | AMEIX | 15.87% | 12.13% | 9.40% | — | 1/2/98 |
| A Class | BEQAX | | | | | 10/9/97 |
| No sales charge | | 15.32% | 11.62% | 8.91% | — | |
| With sales charge | | 8.68% | 10.31% | 8.26% | — | |
| C Class | AEYCX | 14.48% | 10.79% | 8.10% | — | 7/18/01 |
| R Class | AEYRX | 15.06% | 11.34% | 8.63% | — | 7/29/05 |
| R5 Class | AEYGX | 15.83% | — | — | 15.16% | 4/10/17 |
Average annual returns since inception are presented when ten years of performance history is not available.
Sales charges include initial sales charges and contingent deferred sales charges (CDSCs), as applicable. A Class shares have a 5.75% maximum initial sales charge and may be subject to a maximum CDSC of 1.00%. C Class shares redeemed within 12 months of purchase are subject to a maximum CDSC of 1.00%. The SEC requires that mutual funds provide performance information net of maximum sales charges in all cases where charges could be applied.
Data presented reflect past performance. Past performance is no guarantee of future results. Current performance may be higher or lower than the performance shown. Total returns for periods less than one year are not annualized. Investment return and principal value will fluctuate, and redemption value may be more or less than original cost. Data assumes reinvestment of dividends and capital gains, and none of the charts reflect the deduction of taxes that a shareholder would pay on fund distributions or the redemption of fund shares. To obtain performance data current to the most recent month end, please call 1-800-345-2021 or visit americancentury.com. For additional information about the fund, please consult the prospectus.
|
|
| Growth of $10,000 Over 10 Years |
| $10,000 investment made June 30, 2008 |
| Performance for other share classes will vary due to differences in fee structure. |
|
| |
| Value on June 30, 2018 |
| | Investor Class — $24,073 |
| |
| | S&P 500 Index — $26,340 |
| |
|
| | | | | |
| Total Annual Fund Operating Expenses | | | |
| Investor Class | I Class | A Class | C Class | R Class | R5 Class |
| 0.67% | 0.47% | 0.92% | 1.67% | 1.17% | 0.47% |
The total annual fund operating expenses shown is as stated in the fund’s prospectus current as of the date of this report. The prospectus may vary from the expense ratio shown elsewhere in this report because it is based on a different time period, includes acquired fund fees and expenses, and, if applicable, does not include fee waivers or expense reimbursements.
Data presented reflect past performance. Past performance is no guarantee of future results. Current performance may be higher or lower than the performance shown. Total returns for periods less than one year are not annualized. Investment return and principal value will fluctuate, and redemption value may be more or less than original cost. Data assumes reinvestment of dividends and capital gains, and none of the charts reflect the deduction of taxes that a shareholder would pay on fund distributions or the redemption of fund shares. To obtain performance data current to the most recent month end, please call 1-800-345-2021 or visit americancentury.com. For additional information about the fund, please consult the prospectus.
Portfolio Managers: Claudia Musat and Steven Rossi
Performance Summary
Equity Growth returned 15.62%* for the fiscal year ended June 30, 2018, compared with the 14.37% return of its benchmark, the S&P 500 Index.
Equity Growth advanced during the fiscal year, outperforming its benchmark, the S&P 500 Index. Security selection in the industrials and consumer staples sectors and positioning in the consumer discretionary sector contributed the most to fund performance, while health care and energy positioning detracted from relative performance.
Equity Growth’s stock selection process incorporates factors of valuation, quality, growth, and sentiment, while striving to minimize unintended risks along industries and other risk characteristics. For the fiscal year, the net factor contribution was positive, with quality, growth, and sentiment helping the most, while valuation detracted.
Stock Choices Across Several Sectors Benefited Relative Returns
Stock choices in industrials were the largest drivers of the fund’s 12-month results. An underweight position to industrial conglomerate General Electric was the top contributor for the period. We have since exited the position. Avoidance of many relatively poor-performing stocks within the airlines, air freight and logistics, and building products industries also contributed.
Positioning within consumer staples was also beneficial to relative returns. A comparative lack of exposure to tobacco companies which struggled during the period, such as Philip Morris International and Altria Group, was additive. As consumer attitudes towards tobacco change, Philip Morris had trouble launching its new smokeless cigarette product line, which hurt the stock. In addition, security selection within the beverages and food products industries also contributed to relative performance. Underweights to PepsiCo and The Coca-Cola Company, which have also been under pressure due to shifting consumer preferences, benefited results. We have since closed our position in both of these companies.
Stock choices in the consumer discretionary sector also helped returns, particularly within the hotels, restaurants, and leisure industry. A portfolio-only position in Vail Resorts, a hospitality and resort company that has been purchasing land over the past year, was a strong contributor within the industry. Avoiding or underweighting several positions within media also helped. An underweight to Comcast was one of the largest contributing positions to relative returns within the sector. We have since exited our position. Several textiles, apparel, and luxury goods companies also contributed, such as Deckers Outdoor. The outdoor goods and apparel company’s stock price rose during the period from strong quarterly earnings and ended the 12-month period as one of the top-ten contributing stocks.
*All fund returns referenced in this commentary are for Investor Class shares. Performance for other share classes will vary due to differences in fee structure; when Investor Class performance exceeds that of the fund's benchmark, other share classes may not. See page 3 for returns for all share classes.
Health Care and Energy Detracted
Positioning within the health care sector was the largest overall detractor from relative returns during the period. Stock selection within health care equipment and supplies was the most prominent source of underperformance. Zimmer Biomet Holdings was a leading detractor from relative performance in the industry, as were overweights to Hologic and The Cooper Companies. We have since exited these positions. Elsewhere in the sector, an overweight to biotechnology firm Celgene was a significant detractor.
Stock selection within the energy sector also hurt relative results. Security selection decisions within the energy equipment and services and oil, gas, and consumable fuels industries also dampened returns.
A Look Ahead
Our disciplined, objective, and systematic investment strategy is designed to take advantage of opportunities at the individual company level. We believe this approach is the most powerful way to capitalize on market inefficiencies that lead to the mispricing of individual stocks. Our strategy is designed to provide investors with well-diversified and risk-managed exposure to broad U.S. equities. As such, we do not see significant deviations in sector weightings versus the S&P 500 Index. Nevertheless, we can point to select sectors and industries where we are finding more or less investment opportunity.
At period-end, information technology remains the most overweight sector. Software and services stocks represent one of the most attractive industry groups we see. Semiconductor and semiconductor equipment companies also scored very highly along multiple dimensions of our stock selection model. Consumer discretionary is also attractive, with consumer services companies a significant overweight, followed by the consumer durables and apparel industry group. Conversely, our utilities sector underweight position reflects a lack of opportunity in this area across most factors in the stock selection model. A lack of exposure to the materials and telecommunication services sectors is also driven by a comparative lack of opportunity. We see a number of stocks in the materials sector in particular as having unattractive growth and sentiment characteristics. In addition, our underweight in the consumer staples sector derives in part from our lack of exposure to the food, beverage, and tobacco industry group, which scores poorly on growth, quality, and sentiment. Elsewhere in the sector, companies in the food and staples retailing industry group score poorly on our growth metrics.
|
| |
| JUNE 30, 2018 |
| Top Ten Holdings | % of net assets |
| Microsoft Corp. | 4.0% |
| Alphabet, Inc., Class A | 3.8% |
| Amazon.com, Inc. | 3.7% |
| Apple, Inc. | 3.4% |
| Facebook, Inc., Class A | 2.8% |
| JPMorgan Chase & Co. | 2.4% |
| UnitedHealth Group, Inc. | 2.0% |
| Chevron Corp. | 1.9% |
| Pfizer, Inc. | 1.8% |
| Bank of America Corp. | 1.7% |
| | |
| Top Five Industries | % of net assets |
| Software | 7.9% |
| Internet Software and Services | 7.3% |
| Banks | 7.1% |
| Oil, Gas and Consumable Fuels | 5.4% |
| Semiconductors and Semiconductor Equipment | 5.3% |
| | |
| Types of Investments in Portfolio | % of net assets |
| Common Stocks | 98.9% |
| Temporary Cash Investments | 2.7% |
| Other Assets and Liabilities | (1.6)% |
Fund shareholders may incur two types of costs: (1) transaction costs, including sales charges (loads) on purchase payments and redemption/exchange fees; and (2) ongoing costs, including management fees; distribution and service (12b-1) fees; and other fund expenses. This example is intended to help you understand your ongoing costs (in dollars) of investing in your fund and to compare these costs with the ongoing cost of investing in other mutual funds.
The example is based on an investment of $1,000 made at the beginning of the period and held for the entire period from January 1, 2018 to June 30, 2018.
Actual Expenses
The table provides information about actual account values and actual expenses for each class. You may use the information, together with the amount you invested, to estimate the expenses that you paid over the period. First, identify the share class you own. Then simply divide your account value by $1,000 (for example, an $8,600 account value divided by $1,000 = 8.6), then multiply the result by the number under the heading “Expenses Paid During Period” to estimate the expenses you paid on your account during this period.
If you hold Investor Class shares of any American Century Investments fund, or I Class shares of the American Century Diversified Bond Fund, in an American Century Investments account (i.e., not a financial intermediary or retirement plan account), American Century Investments may charge you a $12.50 semiannual account maintenance fee if the value of those shares is less than $10,000. We will redeem shares automatically in one of your accounts to pay the $12.50 fee. In determining your total eligible investment amount, we will include your investments in all personal accounts (including American Century Investments Brokerage accounts) registered under your Social Security number. Personal accounts include individual accounts, joint accounts, UGMA/UTMA accounts, personal trusts, Coverdell Education Savings Accounts and IRAs (including traditional, Roth, Rollover, SEP-, SARSEP- and SIMPLE-IRAs), and certain other retirement accounts. If you have only business, business retirement, employer-sponsored or American Century Investments Brokerage accounts, you are currently not subject to this fee. If you are subject to the Account Maintenance Fee, your account value could be reduced by the fee amount.
Hypothetical Example for Comparison Purposes
The table also provides information about hypothetical account values and hypothetical expenses based on the actual expense ratio of each class of your fund and an assumed rate of return of 5% per year before expenses, which is not the actual return of a fund’s share class. The hypothetical account values and expenses may not be used to estimate the actual ending account balance or expenses you paid for the period. You may use this information to compare the ongoing costs of investing in your fund and other funds. To do so, compare this 5% hypothetical example with the 5% hypothetical examples that appear in the shareholder reports of the other funds.
Please note that the expenses shown in the table are meant to highlight your ongoing costs only and do not reflect any transactional costs, such as sales charges (loads) or redemption/exchange fees. Therefore, the table is useful in comparing ongoing costs only, and will not help you determine the relative total costs of owning different funds. In addition, if these transactional costs were included, your costs would have been higher.
|
| | | | |
| | Beginning
Account Value
1/1/18 | Ending
Account Value
6/30/18 | Expenses Paid
During Period(1)
1/1/18 - 6/30/18 |
Annualized
Expense Ratio(1) |
| Actual | | | | |
| Investor Class | $1,000 | $1,033.70 | $3.33 | 0.66% |
| I Class | $1,000 | $1,034.60 | $2.32 | 0.46% |
| A Class | $1,000 | $1,032.50 | $4.59 | 0.91% |
| C Class | $1,000 | $1,028.70 | $8.35 | 1.66% |
| R Class | $1,000 | $1,031.00 | $5.84 | 1.16% |
| R5 Class | $1,000 | $1,034.60 | $2.32 | 0.46% |
| Hypothetical | | | | |
| Investor Class | $1,000 | $1,021.52 | $3.31 | 0.66% |
| I Class | $1,000 | $1,022.51 | $2.31 | 0.46% |
| A Class | $1,000 | $1,020.28 | $4.56 | 0.91% |
| C Class | $1,000 | $1,016.56 | $8.30 | 1.66% |
| R Class | $1,000 | $1,019.04 | $5.81 | 1.16% |
| R5 Class | $1,000 | $1,022.51 | $2.31 | 0.46% |
| |
| (1) | Expenses are equal to the class's annualized expense ratio listed in the table above, multiplied by the average account value over the period, multiplied by 181, the number of days in the most recent fiscal half-year, divided by 365, to reflect the one-half year period. Annualized expense ratio reflects actual expenses, including any applicable fee waivers or expense reimbursements and excluding any acquired fund fees and expenses. |
JUNE 30, 2018
|
| | | | | |
| | Shares | Value |
| COMMON STOCKS — 98.9% | | |
| Aerospace and Defense — 4.6% | | |
| Boeing Co. (The) | 119,239 |
| $ | 40,005,877 |
|
| Curtiss-Wright Corp. | 59,016 |
| 7,024,084 |
|
| General Dynamics Corp. | 137,148 |
| 25,565,759 |
|
| Lockheed Martin Corp. | 109,545 |
| 32,362,880 |
|
| Raytheon Co. | 101,867 |
| 19,678,667 |
|
| Textron, Inc. | 267,264 |
| 17,615,370 |
|
| | | 142,252,637 |
|
| Banks — 7.1% | | |
| Bank of America Corp. | 1,905,207 |
| 53,707,785 |
|
| BB&T Corp. | 22,775 |
| 1,148,771 |
|
| Citigroup, Inc. | 7,820 |
| 523,314 |
|
| Fifth Third Bancorp | 32,973 |
| 946,325 |
|
| JPMorgan Chase & Co. | 706,841 |
| 73,652,832 |
|
| SunTrust Banks, Inc. | 417,133 |
| 27,539,121 |
|
| U.S. Bancorp | 651,978 |
| 32,611,940 |
|
| Wells Fargo & Co. | 494,792 |
| 27,431,269 |
|
| | | 217,561,357 |
|
| Beverages — 1.7% | | |
| Constellation Brands, Inc., Class A | 130,528 |
| 28,568,664 |
|
| Molson Coors Brewing Co., Class B | 330,756 |
| 22,504,638 |
|
| | | 51,073,302 |
|
| Biotechnology — 4.4% | | |
| AbbVie, Inc. | 383,224 |
| 35,505,704 |
|
Alexion Pharmaceuticals, Inc.(1) | 71,495 |
| 8,876,104 |
|
| Amgen, Inc. | 236,519 |
| 43,659,042 |
|
Biogen, Inc.(1) | 112,562 |
| 32,669,995 |
|
Celgene Corp.(1) | 176,606 |
| 14,026,048 |
|
| | | 134,736,893 |
|
| Building Products — 0.3% | | |
| Owens Corning | 129,308 |
| 8,194,248 |
|
| Capital Markets — 1.6% | | |
| Affiliated Managers Group, Inc. | 92,134 |
| 13,697,562 |
|
| BGC Partners, Inc., Class A | 207,840 |
| 2,352,749 |
|
| Evercore, Inc., Class A | 217,934 |
| 22,981,140 |
|
| MSCI, Inc. | 53,067 |
| 8,778,874 |
|
| | | 47,810,325 |
|
| Chemicals — 1.6% | | |
| Air Products & Chemicals, Inc. | 126,266 |
| 19,663,404 |
|
| Eastman Chemical Co. | 253,527 |
| 25,342,559 |
|
| Huntsman Corp. | 53,391 |
| 1,559,017 |
|
|
| | | | | |
| | Shares | Value |
| WR Grace & Co. | 32,674 |
| $ | 2,395,331 |
|
| | | 48,960,311 |
|
| Commercial Services and Supplies — 0.2% | | |
| MSA Safety, Inc. | 53,825 |
| 5,185,501 |
|
| Pitney Bowes, Inc. | 192,960 |
| 1,653,667 |
|
| | | 6,839,168 |
|
| Communications Equipment — 1.7% | | |
| Cisco Systems, Inc. | 1,204,216 |
| 51,817,414 |
|
| Consumer Finance — 2.7% | | |
| American Express Co. | 340,931 |
| 33,411,238 |
|
| Discover Financial Services | 344,936 |
| 24,286,944 |
|
| Synchrony Financial | 782,663 |
| 26,125,291 |
|
| | | 83,823,473 |
|
| Diversified Consumer Services — 0.9% | | |
| Graham Holdings Co., Class B | 2,676 |
| 1,568,404 |
|
Grand Canyon Education, Inc.(1) | 45,154 |
| 5,039,638 |
|
| H&R Block, Inc. | 915,845 |
| 20,862,949 |
|
| | | 27,470,991 |
|
| Diversified Financial Services — 0.8% | | |
Berkshire Hathaway, Inc., Class B(1) | 135,018 |
| 25,201,110 |
|
| Diversified Telecommunication Services — 0.5% | | |
| AT&T, Inc. | 366,324 |
| 11,762,653 |
|
| Verizon Communications, Inc. | 59,557 |
| 2,996,313 |
|
| | | 14,758,966 |
|
Electric Utilities† | | |
| Portland General Electric Co. | 33,109 |
| 1,415,741 |
|
| Energy Equipment and Services — 1.0% | | |
| Halliburton Co. | 658,252 |
| 29,660,835 |
|
| Equity Real Estate Investment Trusts (REITs) — 3.1% | | |
| Gaming and Leisure Properties, Inc. | 288,777 |
| 10,338,217 |
|
| Highwoods Properties, Inc. | 80,377 |
| 4,077,525 |
|
| Host Hotels & Resorts, Inc. | 31,933 |
| 672,828 |
|
| Park Hotels & Resorts, Inc. | 777,188 |
| 23,805,269 |
|
| PotlatchDeltic Corp. | 445,804 |
| 22,669,133 |
|
| PS Business Parks, Inc. | 11,212 |
| 1,440,742 |
|
| Senior Housing Properties Trust | 117,010 |
| 2,116,711 |
|
| Weingarten Realty Investors | 188,577 |
| 5,810,057 |
|
| Weyerhaeuser Co. | 694,525 |
| 25,322,382 |
|
| | | 96,252,864 |
|
| Food Products — 0.8% | | |
| Conagra Brands, Inc. | 65,055 |
| 2,324,415 |
|
| Mondelez International, Inc., Class A | 222,114 |
| 9,106,674 |
|
Nomad Foods Ltd.(1) | 209,717 |
| 4,024,469 |
|
| Pinnacle Foods, Inc. | 122,089 |
| 7,943,111 |
|
| | | 23,398,669 |
|
| Health Care Equipment and Supplies — 3.6% | | |
| Abbott Laboratories | 616,685 |
| 37,611,618 |
|
|
| | | | | |
| | Shares | Value |
Edwards Lifesciences Corp.(1) | 19,939 |
| $ | 2,902,520 |
|
Haemonetics Corp.(1) | 41,810 |
| 3,749,521 |
|
| Hill-Rom Holdings, Inc. | 133,160 |
| 11,630,194 |
|
Intuitive Surgical, Inc.(1) | 76,060 |
| 36,393,189 |
|
| Medtronic plc | 38,149 |
| 3,265,936 |
|
| STERIS plc | 59,495 |
| 6,247,570 |
|
Varian Medical Systems, Inc.(1) | 83,275 |
| 9,470,033 |
|
| | | 111,270,581 |
|
| Health Care Providers and Services — 2.4% | | |
| Cigna Corp. | 33,341 |
| 5,666,303 |
|
Express Scripts Holding Co.(1) | 77,159 |
| 5,957,446 |
|
| UnitedHealth Group, Inc. | 247,524 |
| 60,727,538 |
|
| | | 72,351,287 |
|
| Health Care Technology — 0.6% | | |
Cerner Corp.(1) | 329,439 |
| 19,697,158 |
|
| Hotels, Restaurants and Leisure — 2.6% | | |
| Las Vegas Sands Corp. | 343,075 |
| 26,197,207 |
|
| Marriott International, Inc., Class A | 217,458 |
| 27,530,183 |
|
| Vail Resorts, Inc. | 100,047 |
| 27,431,887 |
|
| | | 81,159,277 |
|
| Household Durables — 0.1% | | |
| Garmin Ltd. | 44,805 |
| 2,733,105 |
|
| Household Products — 1.0% | | |
| Kimberly-Clark Corp. | 261,459 |
| 27,542,091 |
|
| Procter & Gamble Co. (The) | 24,787 |
| 1,934,873 |
|
| | | 29,476,964 |
|
| Independent Power and Renewable Electricity Producers — 0.1% | |
| NRG Energy, Inc. | 137,034 |
| 4,206,944 |
|
| Industrial Conglomerates — 1.2% | | |
| Honeywell International, Inc. | 262,349 |
| 37,791,373 |
|
| Insurance — 1.1% | | |
| First American Financial Corp. | 62,101 |
| 3,211,864 |
|
| Hartford Financial Services Group, Inc. (The) | 501,764 |
| 25,655,193 |
|
| Torchmark Corp. | 77,193 |
| 6,284,282 |
|
| | | 35,151,339 |
|
| Internet and Direct Marketing Retail — 3.7% | | |
Amazon.com, Inc.(1) | 67,237 |
| 114,289,453 |
|
| Internet Software and Services — 7.3% | | |
Alphabet, Inc., Class A(1) | 102,753 |
| 116,027,660 |
|
eBay, Inc.(1) | 325,944 |
| 11,818,730 |
|
Facebook, Inc., Class A(1) | 450,023 |
| 87,448,469 |
|
| LogMeIn, Inc. | 75,597 |
| 7,805,390 |
|
| | | 223,100,249 |
|
| IT Services — 2.8% | | |
Acxiom Corp.(1) | 40,091 |
| 1,200,725 |
|
| DXC Technology Co. | 39,136 |
| 3,154,753 |
|
| International Business Machines Corp. | 281,998 |
| 39,395,120 |
|
|
| | | | | |
| | Shares | Value |
Teradata Corp.(1) | 29,658 |
| $ | 1,190,769 |
|
| Total System Services, Inc. | 267,604 |
| 22,617,890 |
|
| Visa, Inc., Class A | 138,348 |
| 18,324,193 |
|
| | | 85,883,450 |
|
Leisure Products† | | |
| Brunswick Corp. | 15,972 |
| 1,029,875 |
|
| Machinery — 2.6% | | |
| Caterpillar, Inc. | 247,447 |
| 33,571,134 |
|
| Ingersoll-Rand plc | 279,453 |
| 25,075,318 |
|
| Oshkosh Corp. | 161,805 |
| 11,378,128 |
|
| PACCAR, Inc. | 32,743 |
| 2,028,756 |
|
| Toro Co. (The) | 145,098 |
| 8,742,155 |
|
| | | 80,795,491 |
|
| Media — 0.6% | | |
| CBS Corp., Class B | 285,090 |
| 16,027,760 |
|
| Walt Disney Co. (The) | 16,797 |
| 1,760,493 |
|
| | | 17,788,253 |
|
| Multiline Retail — 1.7% | | |
| Kohl's Corp. | 396,076 |
| 28,873,940 |
|
| Macy's, Inc. | 607,243 |
| 22,729,106 |
|
| | | 51,603,046 |
|
| Oil, Gas and Consumable Fuels — 5.4% | | |
| Chevron Corp. | 456,849 |
| 57,759,419 |
|
| Exxon Mobil Corp. | 275,266 |
| 22,772,756 |
|
| HollyFrontier Corp. | 343,925 |
| 23,534,788 |
|
| Marathon Petroleum Corp. | 422,297 |
| 29,628,357 |
|
| PBF Energy, Inc., Class A | 67,849 |
| 2,844,909 |
|
| Phillips 66 | 266,677 |
| 29,950,494 |
|
| | | 166,490,723 |
|
| Paper and Forest Products — 0.3% | | |
| Louisiana-Pacific Corp. | 334,784 |
| 9,112,820 |
|
| Personal Products — 0.5% | | |
Edgewell Personal Care Co.(1) | 306,599 |
| 15,470,986 |
|
| Pharmaceuticals — 4.1% | | |
| Allergan plc | 67,623 |
| 11,274,106 |
|
| Bristol-Myers Squibb Co. | 63,632 |
| 3,521,395 |
|
| Johnson & Johnson | 389,364 |
| 47,245,428 |
|
| Merck & Co., Inc. | 175,673 |
| 10,663,351 |
|
| Pfizer, Inc. | 1,505,696 |
| 54,626,651 |
|
| | | 127,330,931 |
|
| Professional Services — 0.6% | | |
| Robert Half International, Inc. | 300,280 |
| 19,548,228 |
|
| Real Estate Management and Development — 0.6% | | |
| Jones Lang LaSalle, Inc. | 119,681 |
| 19,865,849 |
|
| Road and Rail — 0.2% | | |
| Ryder System, Inc. | 63,756 |
| 4,581,506 |
|
| | | |
|
| | | | | |
| | Shares | Value |
| Semiconductors and Semiconductor Equipment — 5.3% | | |
| Applied Materials, Inc. | 600,241 |
| $ | 27,725,132 |
|
| Broadcom, Inc. | 113,997 |
| 27,660,232 |
|
| Intel Corp. | 1,078,190 |
| 53,596,825 |
|
| Lam Research Corp. | 159,792 |
| 27,620,047 |
|
| Skyworks Solutions, Inc. | 139,565 |
| 13,488,957 |
|
| Texas Instruments, Inc. | 121,519 |
| 13,397,470 |
|
| | | 163,488,663 |
|
| Software — 7.9% | | |
| Activision Blizzard, Inc. | 318,383 |
| 24,298,990 |
|
Adobe Systems, Inc.(1) | 175,436 |
| 42,773,051 |
|
Electronic Arts, Inc.(1) | 220,618 |
| 31,111,550 |
|
| Microsoft Corp. | 1,248,967 |
| 123,160,636 |
|
| Oracle Corp. (New York) | 411,361 |
| 18,124,566 |
|
Synopsys, Inc.(1) | 49,910 |
| 4,270,799 |
|
| | | 243,739,592 |
|
| Specialty Retail — 2.2% | | |
AutoZone, Inc.(1) | 38,289 |
| 25,689,239 |
|
| Best Buy Co., Inc. | 194,639 |
| 14,516,176 |
|
| Ross Stores, Inc. | 332,140 |
| 28,148,865 |
|
| | | 68,354,280 |
|
| Technology Hardware, Storage and Peripherals — 3.7% | | |
| Apple, Inc. | 558,783 |
| 103,436,321 |
|
| Western Digital Corp. | 148,930 |
| 11,528,671 |
|
| | | 114,964,992 |
|
| Textiles, Apparel and Luxury Goods — 2.6% | | |
Deckers Outdoor Corp.(1) | 252,560 |
| 28,511,499 |
|
Michael Kors Holdings Ltd.(1) | 394,424 |
| 26,268,638 |
|
| Tapestry, Inc. | 555,520 |
| 25,948,339 |
|
| | | 80,728,476 |
|
| Tobacco — 0.1% | | |
| Altria Group, Inc. | 33,903 |
| 1,925,351 |
|
| Trading Companies and Distributors — 0.2% | | |
United Rentals, Inc.(1) | 35,008 |
| 5,167,881 |
|
| Wireless Telecommunication Services — 0.8% | | |
T-Mobile US, Inc.(1) | 389,214 |
| 23,255,536 |
|
TOTAL COMMON STOCKS
(Cost $2,274,463,018) | | 3,043,581,963 |
|
| TEMPORARY CASH INVESTMENTS — 2.7% | | |
| Repurchase Agreement, BMO Capital Markets Corp., (collateralized by various U.S. Treasury obligations, 1.375% - 3.75%, 2/15/19 - 11/15/47, valued at $45,572,414), in a joint trading account at 1.75%, dated 6/29/18, due 7/2/18 (Delivery value $44,658,926) | | 44,652,414 |
|
| Repurchase Agreement, Fixed Income Clearing Corp., (collateralized by various U.S. Treasury obligations, 2.125%, 5/15/25, valued at $37,961,628), at 0.90%, dated 6/29/18, due 7/2/18 (Delivery value $37,219,791) | | 37,217,000 |
|
|
| | | | | |
| | Shares | Value |
| State Street Institutional U.S. Government Money Market Fund, Premier Class | 166,357 |
| $ | 166,357 |
|
TOTAL TEMPORARY CASH INVESTMENTS
(Cost $82,035,771) | | 82,035,771 |
|
TOTAL INVESTMENT SECURITIES — 101.6%
(Cost $2,356,498,789) | | 3,125,617,734 |
|
| OTHER ASSETS AND LIABILITIES — (1.6)% | | (47,912,587 | ) |
| TOTAL NET ASSETS — 100.0% | | $ | 3,077,705,147 |
|
|
| | |
| NOTES TO SCHEDULE OF INVESTMENTS |
| |
| † | Category is less than 0.05% of total net assets. |
See Notes to Financial Statements.
|
|
| Statement of Assets and Liabilities |
|
| | | |
| JUNE 30, 2018 | |
| Assets | |
| Investment securities, at value (cost of $2,356,498,789) | $ | 3,125,617,734 |
|
| Deposits with broker for futures contracts | 2,318,425 |
|
| Receivable for investments sold | 17,043,394 |
|
| Receivable for capital shares sold | 531,370 |
|
| Receivable for variation margin on futures contracts | 81,881 |
|
| Dividends and interest receivable | 3,030,302 |
|
| | 3,148,623,106 |
|
| | |
| Liabilities | |
| Payable for investments purchased | 13,963,011 |
|
| Payable for capital shares redeemed | 55,259,767 |
|
| Accrued management fees | 1,656,693 |
|
| Distribution and service fees payable | 38,488 |
|
| | 70,917,959 |
|
| | |
| Net Assets | $ | 3,077,705,147 |
|
| | |
| Net Assets Consist of: | |
| Capital (par value and paid-in surplus) | $ | 2,116,625,254 |
|
| Undistributed net realized gain | 191,960,948 |
|
| Net unrealized appreciation | 769,118,945 |
|
| | $ | 3,077,705,147 |
|
|
| | | | | | |
| | Net Assets | Shares Outstanding | Net Asset Value Per Share |
| Investor Class, $0.01 Par Value |
| $2,557,773,448 |
| 76,665,311 |
| $33.36 |
| I Class, $0.01 Par Value |
| $392,858,921 |
| 11,765,533 |
| $33.39 |
| A Class, $0.01 Par Value |
| $91,749,678 |
| 2,753,431 |
| $33.32* |
| C Class, $0.01 Par Value |
| $11,190,815 |
| 339,075 |
| $33.00 |
| R Class, $0.01 Par Value |
| $22,575,844 |
| 677,076 |
| $33.34 |
| R5 Class, $0.01 Par Value |
| $1,556,441 |
| 46,609 |
| $33.39 |
*Maximum offering price $35.35 (net asset value divided by 0.9425).
See Notes to Financial Statements.
|
| | | |
| YEAR ENDED JUNE 30, 2018 | |
| Investment Income (Loss) | |
| Income: | |
| Dividends (net of foreign taxes withheld of $1,806) | $ | 62,479,417 |
|
| Interest | 213,231 |
|
| | 62,692,648 |
|
| | |
| Expenses: | |
| Management fees | 20,104,310 |
|
| Distribution and service fees: | |
| A Class | 265,545 |
|
| C Class | 121,336 |
|
| R Class | 126,661 |
|
| Directors' fees and expenses | 195,382 |
|
| Other expenses | 85 |
|
| | 20,813,319 |
|
| | |
| Net investment income (loss) | 41,879,329 |
|
| | |
| Realized and Unrealized Gain (Loss) | |
| Net realized gain (loss) on: | |
| Investment transactions | 293,697,938 |
|
| Futures contract transactions | 455,159 |
|
| | 294,153,097 |
|
| | |
| Change in net unrealized appreciation (depreciation) on investments | 128,926,557 |
|
| | |
| Net realized and unrealized gain (loss) | 423,079,654 |
|
| | |
| Net Increase (Decrease) in Net Assets Resulting from Operations | $ | 464,958,983 |
|
See Notes to Financial Statements.
|
|
| Statement of Changes in Net Assets |
|
| | | | | | |
| YEARS ENDED JUNE 30, 2018 AND JUNE 30, 2017 |
| Increase (Decrease) in Net Assets | June 30, 2018 | June 30, 2017 |
| Operations | | |
| Net investment income (loss) | $ | 41,879,329 |
| $ | 43,081,013 |
|
| Net realized gain (loss) | 294,153,097 |
| 232,791,478 |
|
| Change in net unrealized appreciation (depreciation) | 128,926,557 |
| 251,097,101 |
|
| Net increase (decrease) in net assets resulting from operations | 464,958,983 |
| 526,969,592 |
|
| | | |
| Distributions to Shareholders | | |
| From net investment income: | | |
| Investor Class | (31,401,314 | ) | (33,467,426 | ) |
| I Class | (6,265,397 | ) | (7,117,543 | ) |
| A Class | (1,028,392 | ) | (1,454,889 | ) |
| C Class | (29,746 | ) | (38,797 | ) |
| R Class | (196,109 | ) | (253,077 | ) |
| R5 Class | (10,135 | ) | (17 | ) |
| From net realized gains: | | |
| Investor Class | (214,992,641 | ) | (12,737,507 | ) |
| I Class | (36,795,961 | ) | (2,370,475 | ) |
| A Class | (8,661,590 | ) | (706,633 | ) |
| C Class | (1,021,801 | ) | (62,292 | ) |
| R Class | (1,781,358 | ) | (151,947 | ) |
| R5 Class | (63,540 | ) | — |
|
| Decrease in net assets from distributions | (302,247,984 | ) | (58,360,603 | ) |
| | | |
| Capital Share Transactions | | |
| Net increase (decrease) in net assets from capital share transactions (Note 5) | (259,690,200 | ) | (422,174,359 | ) |
| | | |
| Net increase (decrease) in net assets | (96,979,201 | ) | 46,434,630 |
|
| | | |
| Net Assets | | |
| Beginning of period | 3,174,684,348 |
| 3,128,249,718 |
|
| End of period | $ | 3,077,705,147 |
| $ | 3,174,684,348 |
|
| | | |
See Notes to Financial Statements.
|
|
| Notes to Financial Statements |
JUNE 30, 2018
1. Organization
American Century Quantitative Equity Funds, Inc. (the corporation) is registered under the Investment Company Act of 1940, as amended (the 1940 Act), as an open-end management investment company and is organized as a Maryland corporation. Equity Growth Fund (the fund) is one fund in a series issued by the corporation. The fund’s investment objective is to seek long-term capital growth by investing in common stocks.
The fund offers the Investor Class, I Class, A Class, C Class, R Class and R5 Class. The A Class may incur an initial sales charge. The A Class and C Class may be subject to a contingent deferred sales charge. Sale of the R5 Class commenced on April 10, 2017.
2. Significant Accounting Policies
The following is a summary of significant accounting policies consistently followed by the fund in preparation of its financial statements. The fund is an investment company and follows accounting and reporting guidance in accordance with accounting principles generally accepted in the United States of America. This may require management to make certain estimates and assumptions at the date of the financial statements. Actual results could differ from these estimates. Management evaluated the impact of events or transactions occurring through the date the financial statements were issued that would merit recognition or disclosure.
Investment Valuations — The fund determines the fair value of its investments and computes its net asset value per share at the close of regular trading (usually 4 p.m. Eastern time) on the New York Stock Exchange (NYSE) on each day the NYSE is open. The Board of Directors has adopted valuation policies and procedures to guide the investment advisor in the fund’s investment valuation process and to provide methodologies for the oversight of the fund’s pricing function.
Equity securities that are listed or traded on a domestic securities exchange are valued at the last reported sales price or at the official closing price as provided by the exchange. Equity securities traded on foreign securities exchanges are generally valued at the closing price of such securities on the exchange where primarily traded or at the close of the NYSE, if that is earlier. If no last sales price is reported, or if local convention or regulation so provides, the mean of the latest bid and asked prices may be used. Securities traded over-the-counter are valued at the mean of the latest bid and asked prices, the last sales price, or the official closing price.
Open-end management investment companies are valued at the reported net asset value per share. Repurchase agreements are valued at cost, which approximates fair value. Exchange-traded futures contracts are valued at the settlement price as provided by the appropriate exchange.
If the fund determines that the market price for an investment is not readily available or the valuation methods mentioned above do not reflect an investment’s fair value, such investment is valued as determined in good faith by the Board of Directors or its delegate, in accordance with policies and procedures adopted by the Board of Directors. In its determination of fair value, the fund may review several factors including, but not limited to, market information regarding the specific investment or comparable investments and correlation with other investment types, futures indices or general market indicators. Circumstances that may cause the fund to use these procedures to value an investment include, but are not limited to: an investment has been declared in default or is distressed; trading in a security has been suspended during the trading day or a security is not actively trading on its principal exchange; prices received from a regular pricing source are deemed unreliable; or there is a foreign market holiday and no trading occurred.
The fund monitors for significant events occurring after the close of an investment’s primary exchange but before the fund’s net asset value per share is determined. Significant events may include, but are not limited to: corporate announcements and transactions; governmental action and political unrest that could impact a specific investment or an investment sector; or armed conflicts, natural disasters and similar events that could affect investments in a specific country or region. The fund also monitors for significant fluctuations between domestic and foreign markets, as evidenced by the U.S. market or such other indicators that the Board of Directors, or its delegate, deems appropriate. If significant fluctuations in foreign markets are identified, the fund may apply a model-derived factor to the closing price of equity securities traded on foreign securities exchanges. The factor is based on observable market data as provided by an independent pricing service.
Security Transactions — Security transactions are accounted for as of the trade date. Net realized gains and losses are determined on the identified cost basis, which is also used for federal income tax purposes.
Investment Income — Dividend income less foreign taxes withheld, if any, is recorded as of the ex-dividend date. Distributions received on securities that represent a return of capital or long-term capital gain are recorded as a reduction of cost of investments and/or as a realized gain. The fund may estimate the components of distributions received that may be considered nontaxable distributions or long-term capital gain distributions for income tax purposes. Interest income is recorded on the accrual basis and includes accretion of discounts and amortization of premiums.
Repurchase Agreements — The fund may enter into repurchase agreements with institutions that American Century Investment Management, Inc. (ACIM) (the investment advisor) has determined are creditworthy pursuant to criteria adopted by the Board of Directors. The fund requires that the collateral, represented by securities, received in a repurchase transaction be transferred to the custodian in a manner sufficient to enable the fund to obtain those securities in the event of a default under the repurchase agreement. ACIM monitors, on a daily basis, the securities transferred to ensure the value, including accrued interest, of the securities under each repurchase agreement is equal to or greater than amounts owed to the fund under each repurchase agreement.
Joint Trading Account — Pursuant to an Exemptive Order issued by the Securities and Exchange Commission, the fund, along with certain other funds in the American Century Investments family of funds, may transfer uninvested cash balances into a joint trading account. These balances are invested in one or more repurchase agreements that are collateralized by U.S. Treasury or Agency obligations.
Segregated Assets — In accordance with the 1940 Act, the fund segregates assets on its books and records to cover certain types of investment securities and other financial instruments. ACIM monitors, on a daily basis, the securities segregated to ensure the fund designates a sufficient amount of liquid assets, marked-to-market daily. The fund may also receive assets or be required to pledge assets at the custodian bank or with a broker for collateral requirements.
Income Tax Status — It is the fund’s policy to distribute substantially all net investment income and net realized gains to shareholders and to otherwise qualify as a regulated investment company under provisions of the Internal Revenue Code. Accordingly, no provision has been made for income taxes. The fund files U.S. federal, state, local and non-U.S. tax returns as applicable. The fund's tax returns are subject to examination by the relevant taxing authority until expiration of the applicable statute of limitations, which is generally three years from the date of filing but can be longer in certain jurisdictions. At this time, management believes there are no uncertain tax positions which, based on their technical merit, would not be sustained upon examination and for which it is reasonably possible that the total amounts of unrecognized tax benefits will significantly change in the next twelve months.
Multiple Class — All shares of the fund represent an equal pro rata interest in the net assets of the class to which such shares belong, and have identical voting, dividend, liquidation and other rights and the same terms and conditions, except for class specific expenses and exclusive rights to vote on matters affecting only individual classes. Income, non-class specific expenses, and realized and unrealized capital gains and losses of the fund are allocated to each class of shares based on their relative net assets.
Distributions to Shareholders — Distributions from net investment income, if any, are generally declared and paid quarterly. Distributions from net realized gains, if any, are generally declared and paid annually. The fund may elect to treat a portion of its payment to a redeeming shareholder, which represents the pro rata share of undistributed net investment income and net realized gains, as a distribution for federal income tax purposes (tax equalization).
Indemnifications — Under the corporation’s organizational documents, its officers and directors are indemnified against certain liabilities arising out of the performance of their duties to the fund. In addition, in the normal course of business, the fund enters into contracts that provide general indemnifications. The maximum exposure under these arrangements is unknown as this would involve future claims that may be made against a fund. The risk of material loss from such claims is considered by management to be remote.
3. Fees and Transactions with Related Parties
Certain officers and directors of the corporation are also officers and/or directors of American Century Companies, Inc. (ACC). The corporation’s investment advisor, ACIM, the corporation's distributor, American Century Investment Services, Inc. (ACIS), and the corporation’s transfer agent, American Century Services, LLC, are wholly owned, directly or indirectly, by ACC. Various funds issued by American Century Asset Allocation Portfolios, Inc. own, in aggregate, 15% of the shares of the fund.
Management Fees — The corporation has entered into a management agreement with ACIM, under which ACIM provides the fund with investment advisory and management services in exchange for a single, unified management fee (the fee) per class. The agreement provides that all expenses of managing and operating the fund, except distribution and service fees, brokerage expenses, taxes, interest, fees and expenses of the independent directors (including legal counsel fees), and extraordinary expenses, will be paid by ACIM. The fee is computed and accrued daily based on each class's daily net assets and paid monthly in arrears. The difference in the fee among the classes is a result of their separate arrangements for non-Rule 12b-1 shareholder services. It is not the result of any difference in advisory or custodial fees or other expenses related to the management of the fund's assets, which do not vary by class. The fee consists of (1) an Investment Category Fee based on the daily net assets of the fund and certain other accounts managed by the investment advisor that are in the same broad investment category as the fund and (2) a Complex Fee based on the assets of all the funds in the American Century Investments family of funds.
The Investment Category Fee range, the Complex Fee range and the effective annual management fee for each class for the period ended June 30, 2018 are as follows:
|
| | | |
| | Investment Category Fee Range | Complex Fee Range | Effective Annual Management Fee |
| Investor Class | 0.3380% to 0.5200% | 0.2500% to 0.3100% | 0.66% |
| I Class | 0.0500% to 0.1100% | 0.46% |
| A Class | 0.2500% to 0.3100% | 0.66% |
| C Class | 0.2500% to 0.3100% | 0.66% |
| R Class | 0.2500% to 0.3100% | 0.66% |
| R5 Class | 0.0500% to 0.1100% | 0.46% |
Distribution and Service Fees — The Board of Directors has adopted a separate Master Distribution and Individual Shareholder Services Plan for each of the A Class, C Class and R Class (collectively the plans), pursuant to Rule 12b-1 of the 1940 Act. The plans provide that the A Class will pay ACIS an annual distribution and service fee of 0.25%. The plans provide that the C Class will pay ACIS an annual distribution and service fee of 1.00%, of which 0.25% is paid for individual shareholder services and 0.75% is paid for distribution services. The plans provide that the R Class will pay ACIS an annual distribution and service fee of 0.50%. The fees are computed and accrued daily based on each class’s daily net assets and paid monthly in arrears. The fees are used to pay financial intermediaries for distribution and individual shareholder services. Fees incurred under the plans during the period ended June 30, 2018 are detailed in the Statement of Operations.
Directors' Fees and Expenses — The Board of Directors is responsible for overseeing the investment advisor’s management and operations of the fund. The directors receive detailed information about the fund and its investment advisor regularly throughout the year, and meet at least quarterly with management of the investment advisor to review reports about fund operations. The fund’s officers do not receive compensation from the fund.
Interfund Transactions — The fund may enter into security transactions with other American Century Investments funds and other client accounts of the investment advisor, in accordance with the 1940 Act rules and procedures adopted by the Board of Directors. The rules and procedures require, among other things, that these transactions be effected at the independent current market price of the security. During the period, the interfund purchases and sales were $34,076,119 and $29,039,245, respectively. The effect of interfund transactions on the Statement of Operations was $2,774,138 in net realized gain (loss) on investment transactions.
4. Investment Transactions
Purchases and sales of investment securities, excluding short-term investments, for the period ended June 30, 2018 were $2,651,990,702 and $3,166,786,297, respectively.
5. Capital Share Transactions
Transactions in shares of the fund were as follows:
|
| | | | | | | | | | |
| | Year ended June 30, 2018 | Year ended June 30, 2017(1) |
| | Shares | Amount | Shares | Amount |
| Investor Class/Shares Authorized | 680,000,000 |
| | 680,000,000 |
| |
| Sold | 5,332,130 |
| $ | 176,276,961 |
| 6,627,026 |
| $ | 199,762,445 |
|
| Issued in reinvestment of distributions | 7,487,792 |
| 242,830,271 |
| 1,512,409 |
| 45,450,842 |
|
| Redeemed | (16,133,813 | ) | (536,282,918 | ) | (18,862,508 | ) | (565,180,257 | ) |
| | (3,313,891 | ) | (117,175,686 | ) | (10,723,073 | ) | (319,966,970 | ) |
| I Class/Shares Authorized | 120,000,000 |
| | 120,000,000 |
| |
| Sold | 2,342,307 |
| 79,141,119 |
| 2,152,026 |
| 64,332,914 |
|
| Issued in reinvestment of distributions | 1,289,658 |
| 41,897,285 |
| 308,973 |
| 9,295,788 |
|
| Redeemed | (6,678,723 | ) | (221,437,781 | ) | (4,176,477 | ) | (124,209,609 | ) |
| | (3,046,758 | ) | (100,399,377 | ) | (1,715,478 | ) | (50,580,907 | ) |
| A Class/Shares Authorized | 45,000,000 |
| | 45,000,000 |
| |
| Sold | 421,446 |
| 14,067,450 |
| 557,149 |
| 16,638,469 |
|
| Issued in reinvestment of distributions | 270,453 |
| 8,749,209 |
| 65,899 |
| 1,973,904 |
|
| Redeemed | (1,621,912 | ) | (54,197,067 | ) | (2,206,127 | ) | (66,655,485 | ) |
| | (930,013 | ) | (31,380,408 | ) | (1,583,079 | ) | (48,043,112 | ) |
| C Class/Shares Authorized | 20,000,000 |
| | 20,000,000 |
| |
| Sold | 23,907 |
| 790,510 |
| 56,616 |
| 1,667,233 |
|
| Issued in reinvestment of distributions | 31,653 |
| 1,011,259 |
| 3,246 |
| 96,253 |
|
| Redeemed | (90,399 | ) | (2,995,989 | ) | (147,272 | ) | (4,341,361 | ) |
| | (34,839 | ) | (1,194,220 | ) | (87,410 | ) | (2,577,875 | ) |
| R Class/Shares Authorized | 20,000,000 |
| | 20,000,000 |
| |
| Sold | 242,105 |
| 8,043,308 |
| 430,732 |
| 12,875,097 |
|
| Issued in reinvestment of distributions | 61,122 |
| 1,977,467 |
| 13,485 |
| 404,919 |
|
| Redeemed | (631,699 | ) | (21,132,880 | ) | (479,021 | ) | (14,290,528 | ) |
| | (328,472 | ) | (11,112,105 | ) | (34,804 | ) | (1,010,512 | ) |
| R5 Class/Shares Authorized | 50,000,000 |
| | 50,000,000 |
| |
| Sold | 44,805 |
| 1,518,831 |
| 160 |
| 5,000 |
|
| Issued in reinvestment of distributions | 2,265 |
| 73,675 |
| 1 |
| 17 |
|
| Redeemed | (622 | ) | (20,910 | ) | — |
| — |
|
| | 46,448 |
| 1,571,596 |
| 161 |
| 5,017 |
|
| Net increase (decrease) | (7,607,525 | ) | $ | (259,690,200 | ) | (14,143,683 | ) | $ | (422,174,359 | ) |
| |
| (1) | April 10, 2017 (commencement of sale) through June 30, 2017 for the R5 Class. |
6. Fair Value Measurements
The fund’s investments valuation process is based on several considerations and may use multiple inputs to determine the fair value of the investments held by the fund. In conformity with accounting principles generally accepted in the United States of America, the inputs used to determine a valuation are classified into three broad levels.
• Level 1 valuation inputs consist of unadjusted quoted prices in an active market for identical investments.
• Level 2 valuation inputs consist of direct or indirect observable market data (including quoted prices for comparable investments, evaluations of subsequent market events, interest rates, prepayment speeds, credit risk, etc.). These inputs also consist of quoted prices for identical investments initially expressed in local currencies that are adjusted through translation into U.S. dollars.
• Level 3 valuation inputs consist of unobservable data (including a fund’s own assumptions).
The level classification is based on the lowest level input that is significant to the fair valuation measurement. The valuation inputs are not necessarily an indication of the risks associated with investing in these securities or other financial instruments. There were no significant transfers between levels during the period.
The following is a summary of the level classifications as of period end. The Schedule of Investments provides additional information on the fund’s portfolio holdings.
|
| | | | | | | | |
| | Level 1 | Level 2 | Level 3 |
| Assets | | | |
| Investment Securities | | | |
| Common Stocks | $ | 3,043,581,963 |
| — |
| — |
|
| Temporary Cash Investments | 166,357 |
| $ | 81,869,414 |
| — |
|
| | $ | 3,043,748,320 |
| $ | 81,869,414 |
| — |
|
7. Derivative Instruments
Equity Price Risk — The fund is subject to equity price risk in the normal course of pursuing its investment objectives. A fund may enter into futures contracts based on an equity index in order to manage its exposure to changes in market conditions. A fund may purchase futures contracts to gain exposure to increases in market value or sell futures contracts to protect against a decline in market value. Upon entering into a futures contract, a fund is required to deposit either cash or securities in an amount equal to a certain percentage of the contract value (initial margin). Subsequent payments (variation margin) are made or received daily, in cash, by a fund. The variation margin is equal to the daily change in the contract value and is recorded as unrealized gains and losses. A fund recognizes a realized gain or loss when the contract is closed or expires. Net realized and unrealized gains or losses occurring during the holding period of futures contracts are a component of net realized gain (loss) on futures contract transactions and change in net unrealized appreciation (depreciation) on futures contracts, respectively. One of the risks of entering into futures contracts is the possibility that the change in value of the contract may not correlate with the changes in value of the underlying securities. During the period, the fund participated in equity price risk derivative instruments for temporary investment purposes.
The value of equity price risk derivative instruments as of June 30, 2018, is disclosed on the Statement
of Assets and Liabilities as an asset of $81,881 in receivable for variation margin on futures contracts. For the year ended June 30, 2018, the effect of equity price risk derivative instruments on the Statement of Operations was $455,159 in net realized gain (loss) on futures contract transactions.
8. Federal Tax Information
The tax character of distributions paid during the years ended June 30, 2018 and June 30, 2017 were as follows:
|
| | | | | | |
| | 2018 | 2017 |
| Distributions Paid From | | |
| Ordinary income | $ | 109,701,359 |
| $ | 42,331,749 |
|
| Long-term capital gains | $ | 192,546,625 |
| $ | 16,028,854 |
|
The book-basis character of distributions made during the year from net investment income or net realized gains may differ from their ultimate characterization for federal income tax purposes. These differences reflect the differing character of certain income items and net realized gains and losses for financial statement and tax purposes, and may result in reclassification among certain capital accounts on the financial statements.
As of period end, the federal tax cost of investments and the components of distributable earnings on a tax-basis were as follows:
|
| | | |
| Federal tax cost of investments | $ | 2,362,050,709 |
|
| Gross tax appreciation of investments | $ | 812,197,636 |
|
| Gross tax depreciation of investments | (48,630,611 | ) |
| Net tax appreciation (depreciation) of investments | $ | 763,567,025 |
|
| Undistributed ordinary income | $ | 53,460,228 |
|
| Accumulated long-term gains | $ | 144,052,640 |
|
The difference between book-basis and tax-basis unrealized appreciation (depreciation) is attributable primarily to the tax deferral of losses on wash sales.
|
| | | | | | | | | | | | | | | |
| For a Share Outstanding Throughout the Years Ended June 30 (except as noted) | | | | | | |
| Per-Share Data | | | | | | | | Ratios and Supplemental Data | | |
| | | Income From Investment Operations: | Distributions From: | | | Ratio to Average Net Assets of: | | |
| | Net Asset
Value,
Beginning
of Period | Net
Investment
Income
(Loss)(1) | Net Realized and Unrealized Gain (Loss) | Total From
Investment
Operations | Net
Investment
Income | Net
Realized
Gains | Total
Distributions | Net Asset
Value,
End
of Period | Total
Return(2) | Operating
Expenses | Net
Investment
Income
(Loss) | Portfolio
Turnover
Rate | Net Assets, End of Period (in thousands) |
| Investor Class | | | | | | | | | | | |
| 2018 | $31.79 | 0.43 | 4.40 | 4.83 | (0.40) | (2.86) | (3.26) | $33.36 | 15.62% | 0.66% | 1.30% | 84% |
| $2,557,773 |
|
| 2017 | $27.44 | 0.40 | 4.50 | 4.90 | (0.40) | (0.15) | (0.55) | $31.79 | 17.99% | 0.67% | 1.34% | 85% |
| $2,542,710 |
|
| 2016 | $30.56 | 0.41 | (1.29) | (0.88) | (0.40) | (1.84) | (2.24) | $27.44 | (2.78)% | 0.67% | 1.45% | 91% |
| $2,488,951 |
|
| 2015 | $32.75 | 0.46 | 1.37 | 1.83 | (0.43) | (3.59) | (4.02) | $30.56 | 5.93% | 0.67% | 1.45% | 86% |
| $2,886,976 |
|
| 2014 | $27.74 | 0.44 | 6.31 | 6.75 | (0.43) | (1.31) | (1.74) | $32.75 | 24.92% | 0.67% | 1.45% | 80% |
| $2,568,711 |
|
| I Class | | | | | | | | | | | |
| 2018 | $31.82 | 0.50 | 4.40 | 4.90 | (0.47) | (2.86) | (3.33) | $33.39 | 15.87% | 0.46% | 1.50% | 84% |
| $392,859 |
|
| 2017 | $27.46 | 0.46 | 4.51 | 4.97 | (0.46) | (0.15) | (0.61) | $31.82 | 18.21% | 0.47% | 1.54% | 85% |
| $471,260 |
|
| 2016 | $30.58 | 0.46 | (1.29) | (0.83) | (0.45) | (1.84) | (2.29) | $27.46 | (2.58)% | 0.47% | 1.65% | 91% |
| $453,858 |
|
| 2015 | $32.77 | 0.53 | 1.37 | 1.90 | (0.50) | (3.59) | (4.09) | $30.58 | 6.13% | 0.47% | 1.65% | 86% |
| $497,333 |
|
| 2014 | $27.75 | 0.50 | 6.32 | 6.82 | (0.49) | (1.31) | (1.80) | $32.77 | 25.19% | 0.47% | 1.65% | 80% |
| $450,166 |
|
| A Class | | | | | | | | | | | | | |
| 2018 | $31.76 | 0.35 | 4.39 | 4.74 | (0.32) | (2.86) | (3.18) | $33.32 | 15.32% | 0.91% | 1.05% | 84% |
| $91,750 |
|
| 2017 | $27.41 | 0.32 | 4.50 | 4.82 | (0.32) | (0.15) | (0.47) | $31.76 | 17.71% | 0.92% | 1.09% | 85% |
| $116,980 |
|
| 2016 | $30.53 | 0.33 | (1.29) | (0.96) | (0.32) | (1.84) | (2.16) | $27.41 | (3.03)% | 0.92% | 1.20% | 91% |
| $144,365 |
|
| 2015 | $32.72 | 0.38 | 1.37 | 1.75 | (0.35) | (3.59) | (3.94) | $30.53 | 5.67% | 0.92% | 1.20% | 86% |
| $195,262 |
|
| 2014 | $27.72 | 0.37 | 6.29 | 6.66 | (0.35) | (1.31) | (1.66) | $32.72 | 24.59% | 0.92% | 1.20% | 80% |
| $298,677 |
|
|
| | | | | | | | | | | | | | | |
| For a Share Outstanding Throughout the Years Ended June 30 (except as noted) | | | | | | |
| Per-Share Data | | | | | | | | Ratios and Supplemental Data | | |
| | | Income From Investment Operations: | Distributions From: | | | Ratio to Average Net Assets of: | | |
| | Net Asset
Value,
Beginning
of Period | Net
Investment
Income
(Loss)(1) | Net Realized and Unrealized Gain (Loss) | Total From
Investment
Operations | Net
Investment
Income | Net
Realized
Gains | Total
Distributions | Net Asset
Value,
End
of Period | Total
Return(2) | Operating
Expenses | Net
Investment
Income
(Loss) | Portfolio
Turnover
Rate | Net Assets, End of Period (in thousands) |
| C Class | | | | | | | | | | | | | |
| 2018 | $31.50 | 0.10 | 4.34 | 4.44 | (0.08) | (2.86) | (2.94) | $33.00 | 14.48% | 1.66% | 0.30% | 84% |
| $11,191 |
|
| 2017 | $27.19 | 0.10 | 4.46 | 4.56 | (0.10) | (0.15) | (0.25) | $31.50 | 16.78% | 1.67% | 0.34% | 85% |
| $11,777 |
|
| 2016 | $30.29 | 0.12 | (1.27) | (1.15) | (0.11) | (1.84) | (1.95) | $27.19 | (3.73)% | 1.67% | 0.45% | 91% |
| $12,542 |
|
| 2015 | $32.50 | 0.15 | 1.35 | 1.50 | (0.12) | (3.59) | (3.71) | $30.29 | 4.87% | 1.67% | 0.45% | 86% |
| $16,342 |
|
| 2014 | $27.54 | 0.14 | 6.25 | 6.39 | (0.12) | (1.31) | (1.43) | $32.50 | 23.68% | 1.67% | 0.45% | 80% |
| $13,447 |
|
| R Class | | | | | | | | | | | | | |
| 2018 | $31.78 | 0.28 | 4.37 | 4.65 | (0.23) | (2.86) | (3.09) | $33.34 | 15.06% | 1.16% | 0.80% | 84% |
| $22,576 |
|
| 2017 | $27.43 | 0.25 | 4.50 | 4.75 | (0.25) | (0.15) | (0.40) | $31.78 | 17.37% | 1.17% | 0.84% | 85% |
| $31,953 |
|
| 2016 | $30.54 | 0.27 | (1.29) | (1.02) | (0.25) | (1.84) | (2.09) | $27.43 | (3.24)% | 1.17% | 0.95% | 91% |
| $28,535 |
|
| 2015 | $32.74 | 0.32 | 1.35 | 1.67 | (0.28) | (3.59) | (3.87) | $30.54 | 5.38% | 1.17% | 0.95% | 86% |
| $30,271 |
|
| 2014 | $27.73 | 0.29 | 6.30 | 6.59 | (0.27) | (1.31) | (1.58) | $32.74 | 24.31% | 1.17% | 0.95% | 80% |
| $12,795 |
|
| R5 Class | | | | | | | | | | | | |
| 2018 | $31.82 | 0.43 | 4.47 | 4.90 | (0.47) | (2.86) | (3.33) | $33.39 | 15.83% | 0.46% | 1.50% | 84% |
| $1,556 |
|
2017(3) | $31.12 | 0.11 | 0.69 | 0.80 | (0.10) | — | (0.10) | $31.82 | 2.58% | 0.47%(4) | 1.60%(4) | 85%(5) |
| $5 |
|
|
|
| Notes to Financial Highlights |
| |
| (1) | Computed using average shares outstanding throughout the period. |
| |
| (2) | Total returns are calculated based on the net asset value of the last business day and do not reflect applicable sales charges, if any. Total returns for periods less than one year are not annualized. |
| |
| (3) | April 10, 2017 (commencement of sale) through June 30, 2017. |
| |
| (5) | Portfolio turnover is calculated at the fund level. Percentage indicated was calculated for the year ended June 30, 2017. |
See Notes to Financial Statements.
|
|
| Report of Independent Registered Public Accounting Firm |
To the Board of Directors of American Century Quantitative Equity Funds, Inc. and Shareholders of Equity Growth Fund
Opinion on the Financial Statements
We have audited the accompanying statement of assets and liabilities, including the schedule of investments, of Equity Growth Fund (one of the funds constituting American Century Quantitative Equity Funds, Inc., referred to hereafter as the "Fund") as of June 30, 2018, the related statement of operations for the year ended June 30, 2018, the statement of changes in net assets for each of the two years in the period ended June 30, 2018, including the related notes, and the financial highlights for each of the periods indicated therein (collectively referred to as the “financial statements”). In our opinion, the financial statements present fairly, in all material respects, the financial position of the Fund as of June 30, 2018, the results of its operations for the year then ended, the changes in its net assets for each of the two years in the period ended June 30, 2018 and the financial highlights for each of the periods indicated therein in conformity with accounting principles generally accepted in the United States of America.
Basis for Opinion
These financial statements are the responsibility of the Fund’s management. Our responsibility is to express an opinion on the Fund’s financial statements based on our audits. We are a public accounting firm registered with the Public Company Accounting Oversight Board (United States) (“PCAOB”) and are required to be independent with respect to the Fund in accordance with the U.S. federal securities laws and the applicable rules and regulations of the Securities and Exchange Commission and the PCAOB.
We conducted our audits of these financial statements in accordance with the standards of the PCAOB. Those standards require that we plan and perform the audit to obtain reasonable assurance about whether the financial statements are free of material misstatement, whether due to error or fraud.
Our audits included performing procedures to assess the risks of material misstatement of the financial statements, whether due to error or fraud, and performing procedures that respond to those risks. Such procedures included examining, on a test basis, evidence regarding the amounts and disclosures in the financial statements. Our audits also included evaluating the accounting principles used and significant estimates made by management, as well as evaluating the overall presentation of the financial statements. Our procedures included confirmation of securities owned as of June 30, 2018 by correspondence with the custodian and brokers; when replies were not received from brokers, we performed other auditing procedures. We believe that our audits provide a reasonable basis for our opinion.
/s/ PricewaterhouseCoopers LLP
Kansas City, Missouri
August 16, 2018
We have served as the auditor of one or more investment companies in American Century Investments since 1997.
The Board of Directors
The individuals listed below serve as directors of the funds. Each director will continue to serve in this capacity until death, retirement, resignation or removal from office. The board has adopted a mandatory retirement age for directors who are not “interested persons,” as that term is defined in the Investment Company Act (independent directors). Independent directors shall retire by December 31 of the year in which they reach their 75th birthday; provided, however, that on or after January 1, 2022, independent trustees shall retire on December 31 of the year in which they reach their 76th birthday.
Mr. Thomas is an “interested person” because he currently serves as President and Chief Executive Officer of American Century Companies, Inc. (ACC), the parent company of American Century Investment Management, Inc. (ACIM or the advisor). The other directors (more than three-fourths of the total number) are independent. They are not employees, directors or officers of, and have no financial interest in, ACC or any of its wholly owned, direct or indirect, subsidiaries, including ACIM, American Century Investment Services, Inc. (ACIS) and American Century Services, LLC (ACS), and they do not have any other affiliations, positions or relationships that would cause them to be considered “interested persons” under the Investment Company Act. The directors serve in this capacity for eight (in the case of Jonathan S. Thomas, 16; and Ronald J. Gilson, 9) registered investment companies in the American Century Investments family of funds.
The following table presents additional information about the directors. The mailing address for each director other than Mr. Thomas is 1665 Charleston Road, Mountain View, California 94043. The mailing address for Mr. Thomas is 4500 Main Street, Kansas City, Missouri 64111.
|
| | | | | |
Name
(Year of Birth) | Position(s) Held with Funds | Length of Time Served | Principal Occupation(s) During Past 5 Years | Number of American Century Portfolios Overseen by Director | Other Directorships Held During Past 5 Years |
| Independent Directors |
|
|
Tanya S. Beder
(1955) | Director | Since 2011 | Chairman and CEO, SBCC Group Inc. (independent advisory services) (2006 to present) | 45 | CYS Investments, Inc.; Nabors Industries Ltd. |
Jeremy I. Bulow
(1954) | Director | Since 2011 | Professor of Economics, Stanford University, Graduate School of Business (1979 to present) | 45 | None |
Anne Casscells
(1958) | Director | Since 2016 | Co-Chief Executive Officer and Chief Investment Officer, Aetos Alternatives Management (investment advisory firm) (2001 to present); Lecturer in Accounting, Stanford University, Graduate School of Business (2009 to present) | 45 | None |
|
| | | | | |
Name
(Year of Birth) | Position(s) Held with Funds | Length of Time Served | Principal Occupation(s) During Past 5 Years | Number of American Century Portfolios Overseen by Director | Other Directorships Held During Past 5 Years |
| Independent Directors |
|
|
Ronald J. Gilson
(1946) | Director and Chairman of the Board | Since 1995
(Chairman since 2005) | Charles J. Meyers Professor of Law and Business, Emeritus, Stanford Law School (1979 to 2016); Marc and Eva Stern Professor of Law and Business, Columbia University School of Law (1992 to present) | 47 | None |
Frederick L. A. Grauer
(1946) | Director | Since 2008 | Senior Advisor, iShares by BlackRock, Inc. (investment management firm) (2010 to 2011, 2013 to 2015); Senior Advisor, Course Hero (an educational technology company) (2015 to present) | 45 | None |
Jonathan D. Levin
(1972) | Director | Since 2016 | Philip H. Knight Professor and Dean, Graduate School of Business, Stanford University (2016 to present); Professor, Stanford University, (2000 to present); Chair, Department of Economics, Stanford University (2011 to 2014) | 45 | None |
Peter F. Pervere
(1947) | Director | Since 2007 | Retired | 45 | None |
John B. Shoven
(1947) | Director | Since 2002 | Charles R. Schwab Professor of Economics, Stanford University (1973 to present) | 45 | Cadence Design Systems; Exponent; Financial Engines |
| Interested Director |
|
|
Jonathan S. Thomas
(1963) | Director and President | Since 2007 | President and Chief Executive Officer, ACC (2007 to present). Also serves as Chief Executive Officer, ACS; Executive Vice President, ACIM; Director, ACC, ACIM and other ACC subsidiaries | 115 | BioMed Valley Discoveries, Inc. |
The Statement of Additional Information has additional information about the fund's directors and is available without charge, upon request, by calling 1-800-345-2021.
Officers
The following table presents certain information about the executive officers of the funds. Each officer serves as an officer for each of the 16 (in the case of Robert J. Leach, 15) investment companies in the American Century family of funds, unless otherwise noted. No officer is compensated for his or her service as an officer of the funds. The listed officers are interested persons of the funds and are appointed or re-appointed on an annual basis. The mailing address for each officer listed below is 4500 Main Street, Kansas City, Missouri 64111.
|
| | |
Name
(Year of Birth) | Offices with the Funds | Principal Occupation(s) During the Past Five Years |
Jonathan S. Thomas
(1963) | Director and President since 2007 | President and Chief Executive Officer, ACC (2007 to present). Also serves as Chief Executive Officer, ACS; Executive Vice President, ACIM; Director, ACC, ACIM and other ACC subsidiaries |
Amy D. Shelton
(1964) | Chief Compliance Officer and Vice President since 2014 | Chief Compliance Officer, American Century funds, (2014 to present); Chief Compliance Officer, ACIM (2014 to present); Chief Compliance Officer, ACIS (2009 to present); Vice President, Client Interactions and Marketing, ACIS (2013 to 2014). Also serves as Vice President, ACIS |
Charles A. Etherington
(1957) | General Counsel since 2007 and Senior Vice President since 2006 | Attorney, ACC (1994 to present); Vice President, ACC (2005 to present); General Counsel, ACC (2007 to present). Also serves as General Counsel, ACIM, ACS, ACIS and other ACC subsidiaries; and Senior Vice President, ACIM and ACS |
C. Jean Wade
(1964) | Vice President,Treasurer and Chief Financial Officer since 2012 | Senior Vice President, ACS (2017 to present); Vice President, ACS (2000 to 2017) |
Robert J. Leach
(1966) | Vice President since 2006 and Assistant Treasurer since 2012 | Vice President, ACS (2000 to present) |
David H. Reinmiller
(1963) | Vice President since 2000 | Attorney, ACC (1994 to present). Also serves as Vice President, ACIM and ACS |
Ward D. Stauffer
(1960) | Secretary since 2005 | Attorney, ACC (2003 to present) |
|
|
| Approval of Management Agreement |
At a meeting held on June 19, 2018, the Fund’s Board of Directors (the "Board") unanimously approved the renewal of the management agreement pursuant to which American Century Investment Management, Inc. (the “Advisor”) acts as the investment advisor for the Fund. Under Section 15(c) of the Investment Company Act, contracts for investment advisory services are required to be reviewed, evaluated, and approved by a majority of a fund’s directors/trustees, including a majority of the independent Directors, each year. The Board regards this annual evaluation and renewal as one of its most important responsibilities.
The independent Directors have memorialized a statement regarding the relationship between their ongoing obligations to oversee and evaluate the performance of the Advisor and their annual consideration of renewal of the management agreement. In that statement, the independent Directors noted that their assessment of the Advisor’s performance is an ongoing process that takes place over the entire year and is informed by all of the extensive information that the Board and its committees receive and consider over time. This information, together with the additional materials provided specifically in connection with the review, are central to the Board’s assessment of the Advisor’s performance and its determination whether to renew the Fund’s management agreement.
Prior to its consideration of the renewal of the management agreement, the Board requested and reviewed extensive data and analysis relating to the proposed renewal. This information and analysis was compiled by the Advisor and certain independent providers of evaluation data concerning the Fund and the services provided to the Fund by the Advisor.
In connection with its consideration of the renewal of the management agreement, the Board’s review and evaluation of the services provided by the Advisor included, but was not limited to, the following:
| |
| • | the nature, extent, and quality of investment management, shareholder services, and other services provided to the Fund; |
| |
| • | the wide range of other programs and services the Advisor provides to the Fund and its shareholders on a routine and non-routine basis; |
| |
| • | the investment performance of the Fund, including data comparing the Fund’s performance to appropriate benchmarks and/or a peer group of other mutual funds with similar investment objectives and strategies; |
| |
| • | the cost of owning the Fund compared to the cost of owning similar funds; |
| |
| • | the Advisor’s compliance policies, procedures, and regulatory experience; |
| |
| • | financial data showing the cost of services provided to the Fund, the profitability of the Fund to the Advisor, and the overall profitability of the Advisor; |
| |
| • | strategic plans of the Advisor; |
| |
| • | any economies of scale associated with the Advisor’s management of the Fund and other accounts; |
| |
| • | services provided and charges to other investment management clients of the Advisor; |
| |
| • | acquired fund fees and expenses; |
| |
| • | payments and practices in connection with financial intermediaries holding shares of the Fund and the services provided by intermediaries in connection therewith; and |
| |
| • | any collateral benefits derived by the Advisor from the management of the Fund. |
In keeping with its practice, the Board held two in-person meetings to review and discuss the information provided in response to their request and held active discussions with the Advisor regarding the renewal of the management agreement. The independent Directors had the benefit of the advice of their independent counsel throughout the process.
Factors Considered
The Directors considered all of the information provided by the Advisor, the independent data providers, and the independent Directors’ independent counsel in connection with the approval. They determined that the information was sufficient for them to evaluate the management agreement for the Fund. In connection with their review, the Directors did not identify any single factor as being all-important or controlling and each Director may have attributed different levels of importance to different factors. In deciding to renew the management agreement, the Board based its decision on a number of factors, including the following:
Nature, Extent and Quality of Services - Generally. Under the management agreement, the Advisor is responsible for providing or arranging for all services necessary for the operation of the Fund. The Board noted that the Advisor provides or arranges at its own expense a wide variety of services including:
| |
| • | constructing and designing the Fund |
| |
| • | portfolio research and security selection |
| |
| • | initial capitalization/funding |
| |
| • | daily valuation of the Fund’s portfolio |
| |
| • | shareholder servicing and transfer agency, including shareholder confirmations, recordkeeping, and communications |
| |
| • | legal services (except the independent Directors’ counsel) |
| |
| • | regulatory and portfolio compliance |
| |
| • | marketing and distribution (except amounts paid by the Fund under Rule 12b-1 plans) |
The Board noted that many of these services have expanded over time in terms of both quantity and complexity in response to shareholder demands, competition in the industry, changing distribution channels, and the changing regulatory environment.
Investment Management, Shareholder, and Other Services. The nature of the investment management services provided to the Fund is quite complex and allows Fund shareholders access to professional money management, instant diversification of their investments within an asset class, the opportunity to easily diversify among asset classes by investing in or exchanging among various American Century Investments funds, and liquidity. In evaluating investment performance, the Board expects the Advisor to manage the Fund in accordance with its investment objectives and approved strategies. Further, the Directors recognize that the Advisor has an obligation to seek the best execution of fund trades. In providing these services, the Advisor utilizes teams of investment professionals (portfolio managers, analysts, research assistants, and securities traders) who require extensive information technology, research, training, compliance, and other systems to conduct their business. The Board, directly and through its Portfolio Committee, regularly reviews investment performance information for the Fund, together with comparative information for appropriate benchmarks and/or peer groups of similarly-managed funds, over different time horizons. The Directors also review detailed performance information during the management agreement approval process. If performance concerns are identified, the Fund receives special reviews until performance improves, during which the Board discusses with the Advisor the reasons for such results (e.g., market conditions, security selection) and any efforts being undertaken to improve performance. The Fund’s performance was above its benchmark for the one-year period and below its benchmark for the three-, five-, and ten-year periods reviewed by the Board. The Board found the investment management services provided by the Advisor to the Fund to be satisfactory and consistent with the management agreement.
Under the management agreement, the Advisor provides the Fund with a comprehensive package of transfer agency, shareholder, and other services. The Board, directly and through various committees of the Board, regularly reviews reports and evaluations of such services at its regular meetings. These reports include, but are not limited to, information regarding the operational efficiency and accuracy of the shareholder and transfer agency services provided, staffing levels, shareholder satisfaction (as measured by external as well as internal sources), technology support, new products and services offered to Fund shareholders, securities trading activities, portfolio valuation services, auditing services, and legal and operational compliance activities. The Board found the services provided by the Advisor to the Fund under the management agreement to be competitive and of high quality.
Costs of Services and Profitability. The Advisor provides detailed information concerning its cost of providing various services to the Fund, its profitability in managing the Fund, its overall profitability, and its financial condition. The Directors have reviewed with the Advisor the methodology used to prepare this financial information. This information is considered in evaluating the Advisor’s financial condition, its ability to continue to provide services under the management agreement, and the reasonableness of the current management fee. The Board concluded that the Advisor’s profits were reasonable in light of the services provided to the Fund.
Economies of Scale. The Board also reviewed information provided by the Advisor regarding the possible existence of economies of scale in connection with the management of the Fund. The Board concluded that economies of scale are difficult to measure and predict with precision, especially on a fund-by-fund basis. The Board concluded that the Advisor is appropriately sharing economies of scale through its competitive fee structure, offering competitive fees from fund inception, and through reinvestment in its business to provide shareholders enhanced and expanded services.
Comparison to Other Funds’ Fees. The management agreement provides that the Fund pays the Advisor a single, all-inclusive (or unified) management fee for providing all services necessary for the management and operation of the Fund, other than brokerage expenses, expenses attributable to short sales, taxes, interest, extraordinary expenses, the fees and expenses of the Fund’s independent Directors (including their independent legal counsel), and expenses incurred in connection with the provision of shareholder services and distribution services under a plan adopted pursuant to Rule 12b-1 under the 1940 Act. Under the unified fee structure, the Advisor is responsible for providing all investment advisory, custody, audit, administrative, compliance, recordkeeping, marketing, and shareholder services, or arranging and supervising third parties to provide such services. By contrast, most other funds are charged a variety of fees, including an investment advisory fee, a transfer agency fee, an administrative fee, distribution charges, and other expenses. Other than their investment advisory fees and any applicable Rule 12b-1 distribution fees, all other components of the total fees charged by these other funds may be increased without shareholder approval. The Board believes the unified fee structure is a benefit to Fund shareholders because it clearly discloses to shareholders the cost of owning Fund shares, and, since the unified fee cannot be increased without a vote of Fund shareholders, it shifts to the Advisor the risk of increased costs of operating the Fund and provides a direct incentive to minimize administrative inefficiencies. Part of the Board’s analysis of fee levels involves reviewing certain evaluative data compiled by an independent provider and comparing the Fund’s unified fee to the total expense ratio of peer funds. The unified fee charged to shareholders of the Fund was in the lowest quartile of the total expense ratios of the Fund’s peer group. The Board concluded that the management fee paid by the Fund to the Advisor under the management agreement is reasonable in light of the services provided to the Fund.
Comparison to Fees and Services Provided to Other Clients of the Advisor. The Board also requested and received information from the Advisor concerning the nature of the services, fees, costs, and profitability of its advisory services to advisory clients other than the Fund. They observed that these varying types of client accounts require different services and involve different regulatory and entrepreneurial risks than the management of the Fund. The Board analyzed this
information and concluded that the fees charged and services provided to the Fund were reasonable by comparison.
Payments to Intermediaries. The Directors also requested and received a description of payments made to intermediaries by the Fund and the Advisor and services provided by intermediaries. These payments include various payments made by the Fund or the Advisor to different types of intermediaries and recordkeepers for distribution and service activities provided for the Fund. The Directors reviewed such information and received representations from the Advisor that all such payments by the Fund were made pursuant to the Fund’s Rule 12b-1 Plan and that all such payments by the Advisor were made from the Advisor’s resources and reasonable profits. The Board found such payments to be reasonable in scope and purpose.
Collateral or “Fall-Out” Benefits Derived by the Advisor. The Board considered the existence of collateral benefits the Advisor may receive as a result of its relationship with the Fund. The Board noted that the Advisor’s primary business is managing mutual funds and it generally does not use fund or shareholder information to generate profits in other lines of business, and therefore does not derive any significant collateral benefits from them. The Board noted that the Advisor may receive proprietary research from broker-dealers that execute fund portfolio transactions. The Board also determined that the Advisor is able to provide investment management services to certain clients other than the Fund, at least in part, due to its existing infrastructure built to serve the fund complex. The Board noted that the assets of those other accounts are, where applicable, included with the assets of the Fund to determine breakpoints in the management fee schedule.
Existing Relationship. The Board also considered whether there was any reason for not continuing the existing arrangement with the Advisor. In this regard, the Board was mindful of the potential disruptions of the Fund’s operations and various risks, uncertainties, and other effects that could occur as a result of a decision not to continue such relationship. In particular, the Board recognized that most shareholders have invested in the Fund on the strength of the Advisor’s industry standing and reputation and in the expectation that the Advisor will have a continuing role in providing advisory services to the Fund.
Conclusion of the Directors. As a result of this process, the Board, including all of the independent Directors and assisted by the advice of independent legal counsel, taking into account all of the factors discussed above and the information provided by the Advisor and others in connection with its review and throughout the year, concluded that the management agreement between the Fund and the Advisor is fair and reasonable in light of the services provided and should be renewed.
Retirement Account Information
As required by law, distributions you receive from certain retirement accounts are subject to federal income tax withholding, unless you elect not to have withholding apply*. Tax will be withheld on the total amount withdrawn even though you may be receiving amounts that are not subject to withholding, such as nondeductible contributions. In such case, excess amounts of withholding could occur. You may adjust your withholding election so that a greater or lesser amount will be withheld.
If you don’t want us to withhold on this amount, you must notify us to not withhold the federal income tax. You may notify us in writing or in certain situations by telephone or through other electronic means. For systematic withdrawals, your withholding election will remain in effect until revoked or changed by filing a new election. You have the right to revoke your election at any time and change your withholding percentage for future distributions.
Remember, even if you elect not to have income tax withheld, you are liable for paying income tax on the taxable portion of your withdrawal. If you elect not to have income tax withheld or you don’t have enough income tax withheld, you may be responsible for payment of estimated tax. You may incur penalties under the estimated tax rules if your withholding and estimated tax payments are not sufficient. You can reduce or defer the income tax on a distribution by directly or indirectly rolling such distribution over to another IRA or eligible plan. You should consult your tax advisor for additional information.
State tax will be withheld if, at the time of your distribution, your address is within one of the mandatory withholding states and you have federal income tax withheld (or as otherwise required by state law). State taxes will be withheld from your distribution in accordance with the respective state rules.
*Some 403(b), 457 and qualified retirement plan distributions may be subject to 20% mandatory withholding, as they are subject to special tax and withholding rules. Your plan administrator or plan sponsor is required to provide you with a special tax notice explaining those rules at the time you request a distribution. If applicable, federal and/or state taxes may be withheld from your distribution amount.
Proxy Voting Policies
Descriptions of the principles and policies that the fund's investment advisor uses in exercising the voting rights associated with the securities purchased and/or held by the fund are available without charge, upon request, by calling 1-800-345-2021 or visiting the "About Us" page of American Century Investments’ website at americancentury.com. A description of the policies is also available on the Securities and Exchange Commission’s website at sec.gov. Information regarding how the investment advisor voted proxies relating to portfolio securities during the most recent 12-month period ended June 30 is available on the "About Us" page at americancentury.com. It is also available at sec.gov.
Quarterly Portfolio Disclosure
The fund files its complete schedule of portfolio holdings with the Securities and Exchange Commission (SEC) for the first and third quarters of each fiscal year on Form N-Q. The fund’s Forms N-Q are available on the SEC’s website at sec.gov, and may be reviewed and copied at the SEC’s Public Reference Room in Washington, DC. Information on the operation of the Public Reference Room may be obtained by calling 1-800-SEC-0330. The fund also makes its complete schedule of portfolio holdings for the most recent quarter of its fiscal year available on its website at americancentury.com and, upon request, by calling 1-800-345-2021.
Other Tax Information
The following information is provided pursuant to provisions of the Internal Revenue Code.
The fund hereby designates up to the maximum amount allowable as qualified dividend income for the fiscal year ended June 30, 2018.
For corporate taxpayers, the fund hereby designates $65,612,814, or up to the maximum amount allowable, of ordinary income distributions paid during the fiscal year ended June 30, 2018 as qualified for the corporate dividends received deduction.
The fund hereby designates $74,821,476 as qualified short-term capital gain distributions for purposes of Internal Revenue Code Section 871 for the fiscal year ended June 30, 2018.
The fund hereby designates $204,715,787, or up to the maximum amount allowable, as long-term capital gain distributions (20% rate gain distributions) for the fiscal year ended June 30, 2018.
The fund utilized earnings and profits of $18,038,841, distributed to shareholders on redemption of shares as part of the dividends paid deduction (tax equalization).
|
| | |
| |
| | | |
| Contact Us | americancentury.com | |
| Automated Information Line | 1-800-345-8765 | |
| Investor Services Representative | 1-800-345-2021
or 816-531-5575 | |
| Investors Using Advisors | 1-800-378-9878 | |
Business, Not-For-Profit, Employer-Sponsored
Retirement Plans | 1-800-345-3533 | |
Banks and Trust Companies, Broker-Dealers,
Financial Professionals, Insurance Companies | 1-800-345-6488 | |
| Telecommunications Relay Service for the Deaf | 711 | |
| | | |
| American Century Quantitative Equity Funds, Inc. | |
| | | |
Investment Advisor: American Century Investment Management, Inc. Kansas City, Missouri | |
| | | |
| This report and the statements it contains are submitted for the general information of our shareholders. The report is not authorized for distribution to prospective investors unless preceded or accompanied by an effective prospectus. | |
| | | |
©2018 American Century Proprietary Holdings, Inc. All rights reserved.
CL-ANN-92990 1808 | |
|
| |
| | |
| | Annual Report |
| | |
| | June 30, 2018 |
| | |
| | Global Gold Fund |
| | Investor Class (BGEIX) |
| | I Class (AGGNX) |
| | A Class (ACGGX) |
| | C Class (AGYCX) |
| | R Class (AGGWX) |
|
| | |
| President's Letter | 2 |
|
| Performance | 3 |
|
| Portfolio Commentary | |
|
| Fund Characteristics | |
|
| Shareholder Fee Example | |
|
| Schedule of Investments | |
|
| Statement of Assets and Liabilities | |
|
| Statement of Operations | |
|
| Statement of Changes in Net Assets | |
|
| Notes to Financial Statements | |
|
| Financial Highlights | |
|
| Report of Independent Registered Public Accounting Firm | |
|
| Management | |
|
| Approval of Management Agreement | |
|
| Additional Information | |
|
Any opinions expressed in this report reflect those of the author as of the date of the report, and do not necessarily represent the opinions of American Century Investments® or any other person in the American Century Investments organization. Any such opinions are subject to change at any time based upon market or other conditions and American Century Investments disclaims any responsibility to update such opinions. These opinions may not be relied upon as investment advice and, because investment decisions made by American Century Investments funds are based on numerous factors, may not be relied upon as an indication of trading intent on behalf of any American Century Investments fund. Security examples are used for representational purposes only and are not intended as recommendations to purchase or sell securities. Performance information for comparative indices and securities is provided to American Century Investments by third party vendors. To the best of American Century Investments’ knowledge, such information is accurate at the time of printing.
Jonathan Thomas
Dear Investor:
Thank you for reviewing this annual report for the period ended June 30, 2018. Annual reports help convey important information about fund returns, including market factors that affected performance during the reporting period. For additional, updated investment and market insights, we encourage you to visit our website, americancentury.com.
Volatility’s Return Challenged Financial Markets
Broad U.S. and global stock market indices generally rallied for the first half of the 12-month period. A favorable backdrop of robust corporate earnings results, improving global economic growth, and relatively low interest rates, combined with the effects of U.S. tax reform, drove stock prices higher. For the six months ended December 31, 2017, U.S. stocks (S&P 500 Index) returned 11.42%. U.S. bond returns were also positive, but much more subdued, as the Federal Reserve (the Fed) continued its rate-normalization efforts and interest rates edged higher. The Bloomberg Barclays U.S. Aggregate Bond Index returned 1.24% for the six-month period.
In early February, a force that was largely dormant during 2017—volatility—re-emerged, as better-than-expected economic data triggered expectations for rising inflation, higher interest rates, and a more-hawkish Fed. In response, U.S. Treasury yields climbed to their highest levels in several years, and stock prices plunged. Economic data released in subsequent months were more in line with market expectations, while corporate earnings results remained healthy. These factors helped calm the market unrest, and stocks generally recovered their earlier losses. Nevertheless, rising interest rates, geopolitical tensions, and the mounting threat of a global trade war continued to provide periodic headwinds for investors.
Despite the return of volatility, U.S. stocks (S&P 500 Index) gained14.37% for the 12-month period. Meanwhile, rising U.S. Treasury yields, particularly in the second half of the period, took a toll on bonds and other interest-rate-sensitive investments, including gold, utilities stocks, and real estate investment trusts (REITs). Investment-grade bonds (Bloomberg Barclays U.S. Aggregate Bond Index) returned -0.40% for the 12 months.
With volatility resurfacing, inflationary pressures building, Treasury yields rising, and the implications of U.S. tariff and trade policy still unfolding, investors likely will face new opportunities and challenges in the months ahead. We believe this scenario warrants a disciplined, diversified, and risk-aware approach, using professionally managed portfolios in pursuit of investment goals. We appreciate your continued trust and confidence in us.
Sincerely,
Jonathan Thomas
President and Chief Executive Officer
American Century Investments
|
| | | | | |
| Total Returns as of June 30, 2018 |
| | Average Annual Returns | |
| | Ticker Symbol | 1 year | 5 years | 10 years | Inception Date |
| Investor Class | BGEIX | 4.00% | 0.33% | -5.21% | 8/17/88 |
| NYSE Arca Gold Miners Index | — | 2.43% | -0.56% | -6.38% | — |
| MSCI World Index | — | 11.09% | 9.93% | 6.26% | — |
| I Class | AGGNX | 4.21% | 0.54% | -5.01% | 9/28/07 |
| A Class | ACGGX | | | | 5/6/98 |
| No sales charge | | 3.58% | 0.07% | -5.46% | |
| With sales charge | | -2.33% | -1.11% | -6.01% | |
| C Class | AGYCX | 2.95% | -0.65% | -6.14% | 9/28/07 |
| R Class | AGGWX | 3.35% | -0.17% | -5.68% | 9/28/07 |
Sales charges include initial sales charges and contingent deferred sales charges (CDSCs), as applicable.
A Class shares have a 5.75% maximum initial sales charge and may be subject to a maximum CDSC of 1.00%. C Class shares redeemed within 12 months of purchase are subject to a maximum CDSC of 1.00%. The SEC requires that mutual funds provide performance information net of maximum sales charges in all cases where charges could be applied.
Data presented reflect past performance. Past performance is no guarantee of future results. Current performance may be higher or lower than the performance shown. Total returns for periods less than one year are not annualized. Investment return and principal value will fluctuate, and redemption value may be more or less than original cost. Data assumes reinvestment of dividends and capital gains, and none of the charts reflect the deduction of taxes that a shareholder would pay on fund distributions or the redemption of fund shares. To obtain performance data current to the most recent month end, please call 1-800-345-2021 or visit americancentury.com. For additional information about the fund, please consult the prospectus.
|
|
| Growth of $10,000 Over 10 Years |
| $10,000 investment made June 30, 2008 |
| Performance for other share classes will vary due to differences in fee structure. |
|
| |
| Value on June 30, 2018 |
| | Investor Class — $5,855 |
| |
| | NYSE Arca Gold Miners Index — $5,171 |
| |
| | MSCI World Index — $18,351 |
| |
|
| | | | |
| Total Annual Fund Operating Expenses |
| Investor Class | I Class | A Class | C Class | R Class |
| 0.67% | 0.47% | 0.92% | 1.67% | 1.17% |
The total annual fund operating expenses shown is as stated in the fund’s prospectus current as of the date of this report. The prospectus may vary from the expense ratio shown elsewhere in this report because it is based on a different time period, includes acquired fund fees and expenses, and, if applicable, does not include fee waivers or expense reimbursements.
Data presented reflect past performance. Past performance is no guarantee of future results. Current performance may be higher or lower than the performance shown. Total returns for periods less than one year are not annualized. Investment return and principal value will fluctuate, and redemption value may be more or less than original cost. Data assumes reinvestment of dividends and capital gains, and none of the charts reflect the deduction of taxes that a shareholder would pay on fund distributions or the redemption of fund shares. To obtain performance data current to the most recent month end, please call 1-800-345-2021 or visit americancentury.com. For additional information about the fund, please consult the prospectus.
Portfolio Managers: Yulin Long and Elizabeth Xie
Performance Summary
Global Gold rose 4.00%* for the 12 months ended June 30, 2018. The portfolio’s benchmark, the NYSE Arca Gold Miners Index, gained 2.43%. The fund’s return reflects operating expenses, while the benchmark’s return does not. By comparison, the MSCI World Index, a broad measure of global equity market performance, returned 11.09%.
Gold Price Rose Modestly; Supply and Demand Conditions Mixed
Gold prices were volatile but ultimately finished the period slightly higher. According to the World Gold Council, the price per ounce of gold began and ended the period in the neighborhood of $1,250. In between, gold traded as low as about $1,210 and as high as $1,355.
Gold supply edged higher year over year through the first quarter of 2018, the latest period for which data were available. Mine production increased slightly; in addition, above-ground supply from both producer hedging and recycling activity rose fractionally.
While supply inched up, demand for the precious metal fell to the lowest level in nearly a decade. Looking at the underlying components of demand, investment demand was mixed as exchange-traded fund (ETF) holdings increased in absolute terms, but rose at a much slower pace than a year ago. Buyers were presumably put off by a stronger U.S. dollar (gold is priced in dollars, so a stronger dollar makes gold more expensive for foreign buyers) and higher U.S. interest rates (higher rates on interest-bearing assets typically reduce the appeal of gold). Jewelry demand was little changed—stronger growth and a rising middle class supported demand in China; however, Indian buyers were dissuaded by weakness in the rupee relative to the dollar. Elsewhere, central banks were net buyers of gold once again during the fiscal year, continuing a nearly decade-long streak of being net buyers rather than sellers.
Key Contributors
Kirkland Lake Gold was the leading contributor to relative performance, as the Canada-based miner reported solid financial and operational results and initiated a dividend. Australian gold producer Northern Star Resources was another source of strength, generating solid operational growth while generating and deploying free cash flow in shareholder friendly ways.
Several other contributions to relative performance came from underweight positions in poor-performing Canadian miners, including Eldorado Gold, Tahoe Resources, Torex Gold Resources, and New Gold. Eldorado reported losses and suspended its dividend payout. Tahoe, Torex, and New Gold suffered because of production disruptions and/or cost overruns. We eliminated our holdings in Eldorado, Torex, and New Gold.
* All fund returns referenced in this commentary are for Investor Class shares. Performance for other share classes will vary due to differences in fee structures; when Investor Class performance exceeds that of the fund’s benchmark, other share classes may not. See page 3 for returns for all share classes.
Notable Detractors
In a reversal from the prior year, when Gold Standard Ventures was the leading contributor to performance relative to the benchmark, the Nevada miner was the largest relative detractor for the fiscal year ended June 30, 2018. The company raised capital during the period through a series of public offerings and private placements, diluting the position of existing shareholders. As a result, we eliminated our position in the company.
It detracted from relative results to have little or no exposure to Australian miners Independence Group and Evolution Mining, as well as an underweight position in Canada-based Yamana Gold. We had some exposure to Evolution and Yamana, but less than the index. These stocks performed well, so being underweight hurt relative performance.
Portfolio Positioning
We see a number of factors that suggest a positive long-term outlook for gold, while the near-term outlook is mixed. In terms of long-term supports for gold’s price, fiscal conditions in the U.S., Europe, and Japan are characterized by historically high and rising levels of debt. Similarly, “real” short-term interest rates (stated interest rates minus the rate of inflation) are negative throughout much of the developed world. Negative real rates and excessive debt levels are typically associated with inflation. In addition, the ongoing development of emerging markets economies, particularly China and India, suggest increasing demand for gold as a status symbol and savings vehicle.
Near term, however, we see a number of factors that complicate the outlook. We have often said in the past that gold can be thought of as a gauge of investor confidence in leading central banks, financial markets, and the U.S. dollar in particular. At present, stocks are near record highs, corporate profit growth is surging, investors appear confident in central bankers’ ability to manage the global economy, and the dollar is gaining in strength. The inflation outlook, too, is mixed. On the one hand, inflation has been edging up around the developed world, housing prices and rents are increasing, and rising barriers to global trade also suggest higher prices on a whole range of goods. On the other hand, investor surveys and market-based gauges of inflation expectations all suggest only modest increases in inflation going forward.
In terms of the stocks of gold producers, valuations appear fairly attractive. The stocks have significantly underperformed the broader market since the Financial Crisis—with inflation low, central banks propping up markets, and stocks surging since 2009, gold and gold miners have lagged the market by a wide margin. Gold stocks also appear fairly attractive relative to their historical valuation. Of course, assets that are cheap can remain cheap for an extended period of time, so it is impossible to know when that gap might close. Nevertheless, we continue to believe that a small allocation to gold and gold company stocks as part of a larger portfolio can help improve a portfolio’s diversification and risk-adjusted return over time.
|
| |
| JUNE 30, 2018 |
| Top Ten Holdings | % of net assets |
| Newmont Mining Corp. | 11.8% |
| Franco-Nevada Corp.* | 7.6% |
| Barrick Gold Corp. | 7.5% |
| Wheaton Precious Metals Corp. | 5.4% |
| Goldcorp, Inc.* | 4.9% |
| Newcrest Mining Ltd. | 4.5% |
| Randgold Resources Ltd. ADR | 4.5% |
| Agnico Eagle Mines Ltd.* | 4.1% |
| Royal Gold, Inc. | 3.8% |
| Kirkland Lake Gold Ltd. | 3.7% |
| *Includes shares traded on all exchanges. | |
| | |
| Geographic Composition | % of net assets |
| Canada | 52.6% |
| Australia | 15.6% |
| United States | 15.6% |
| United Kingdom | 5.9% |
| South Africa | 3.8% |
| China | 1.7% |
| Peru | 1.5% |
| Russia | 0.3% |
| Exchange-Traded Funds | 1.0% |
| Cash and Equivalents | 2.0%** |
| **Includes temporary cash investments and other assets and liabilities. | |
| | |
| Types of Investments in Portfolio | % of net assets |
| Foreign Common Stocks | 81.4% |
| Domestic Common Stocks | 15.6% |
| Exchange-Traded Funds | 1.0% |
| Total Equity Exposure | 98.0% |
| Temporary Cash Investments | 0.1% |
| Other Assets and Liabilities | 1.9% |
Fund shareholders may incur two types of costs: (1) transaction costs, including sales charges (loads) on purchase payments and redemption/exchange fees; and (2) ongoing costs, including management fees; distribution and service (12b-1) fees; and other fund expenses. This example is intended to help you understand your ongoing costs (in dollars) of investing in your fund and to compare these costs with the ongoing cost of investing in other mutual funds.
The example is based on an investment of $1,000 made at the beginning of the period and held for the entire period from January 1, 2018 to June 30, 2018.
Actual Expenses
The table provides information about actual account values and actual expenses for each class. You may use the information, together with the amount you invested, to estimate the expenses that you paid over the period. First, identify the share class you own. Then simply divide your account value by $1,000 (for example, an $8,600 account value divided by $1,000 = 8.6), then multiply the result by the number under the heading “Expenses Paid During Period” to estimate the expenses you paid on your account during this period.
If you hold Investor Class shares of any American Century Investments fund, or I Class shares of the American Century Diversified Bond Fund, in an American Century Investments account (i.e., not a financial intermediary or retirement plan account), American Century Investments may charge you a $12.50 semiannual account maintenance fee if the value of those shares is less than $10,000. We will redeem shares automatically in one of your accounts to pay the $12.50 fee. In determining your total eligible investment amount, we will include your investments in all personal accounts (including American Century Investments Brokerage accounts) registered under your Social Security number. Personal accounts include individual accounts, joint accounts, UGMA/UTMA accounts, personal trusts, Coverdell Education Savings Accounts and IRAs (including traditional, Roth, Rollover, SEP-, SARSEP- and SIMPLE-IRAs), and certain other retirement accounts. If you have only business, business retirement, employer-sponsored or American Century Investments Brokerage accounts, you are currently not subject to this fee. If you are subject to the Account Maintenance Fee, your account value could be reduced by the fee amount.
Hypothetical Example for Comparison Purposes
The table also provides information about hypothetical account values and hypothetical expenses based on the actual expense ratio of each class of your fund and an assumed rate of return of 5% per year before expenses, which is not the actual return of a fund’s share class. The hypothetical account values and expenses may not be used to estimate the actual ending account balance or expenses you paid for the period. You may use this information to compare the ongoing costs of investing in your fund and other funds. To do so, compare this 5% hypothetical example with the 5% hypothetical examples that appear in the shareholder reports of the other funds.
Please note that the expenses shown in the table are meant to highlight your ongoing costs only and do not reflect any transactional costs, such as sales charges (loads) or redemption/exchange fees. Therefore, the table is useful in comparing ongoing costs only, and will not help you determine the relative total costs of owning different funds. In addition, if these transactional costs were included, your costs would have been higher.
|
| | | | |
| | Beginning
Account Value
1/1/18 | Ending
Account Value
6/30/18 | Expenses Paid
During Period(1)
1/1/18 - 6/30/18 | Annualized
Expense Ratio(1) |
| Actual |
| Investor Class | $1,000 | $980.60 | $3.24 | 0.66% |
| I Class | $1,000 | $981.90 | $2.26 | 0.46% |
| A Class | $1,000 | $979.00 | $4.47 | 0.91% |
| C Class | $1,000 | $975.70 | $8.13 | 1.66% |
| R Class | $1,000 | $977.70 | $5.69 | 1.16% |
| Hypothetical |
| Investor Class | $1,000 | $1,021.52 | $3.31 | 0.66% |
| I Class | $1,000 | $1,022.51 | $2.31 | 0.46% |
| A Class | $1,000 | $1,020.28 | $4.56 | 0.91% |
| C Class | $1,000 | $1,016.56 | $8.30 | 1.66% |
| R Class | $1,000 | $1,019.04 | $5.81 | 1.16% |
| |
| (1) | Expenses are equal to the class's annualized expense ratio listed in the table above, multiplied by the average account value over the period, multiplied by 181, the number of days in the most recent fiscal half-year, divided by 365, to reflect the one-half year period. Annualized expense ratio reflects actual expenses, including any applicable fee waivers or expense reimbursements and excluding any acquired fund fees and expenses. |
JUNE 30, 2018
|
| | | | | |
| | Shares | Value |
| COMMON STOCKS — 97.0% | | |
| Australia — 15.6% | | |
| Evolution Mining Ltd. | 2,372,600 |
| $ | 6,203,689 |
|
Gold Road Resources Ltd.(1) | 5,909,090 |
| 3,247,865 |
|
| Newcrest Mining Ltd. | 1,045,213 |
| 16,942,782 |
|
| Northern Star Resources Ltd. | 2,012,900 |
| 10,872,175 |
|
| OZ Minerals Ltd. | 180,000 |
| 1,254,097 |
|
Ramelius Resources Ltd.(1) | 1,549,200 |
| 670,915 |
|
| Regis Resources Ltd. | 1,778,400 |
| 6,772,344 |
|
Saracen Mineral Holdings Ltd.(1) | 3,508,900 |
| 5,702,847 |
|
| St. Barbara Ltd. | 1,960,400 |
| 7,037,319 |
|
| | | 58,704,033 |
|
| Canada — 52.6% | | |
| Agnico Eagle Mines Ltd. | 126,766 |
| 5,811,575 |
|
| Agnico Eagle Mines Ltd. (New York) | 210,000 |
| 9,624,300 |
|
| Alamos Gold, Inc., Class A (New York) | 214,600 |
| 1,221,074 |
|
B2Gold Corp.(1) | 224,382 |
| 582,012 |
|
B2Gold Corp. (New York)(1) | 454,700 |
| 1,173,126 |
|
| Barrick Gold Corp. | 2,137,412 |
| 28,064,219 |
|
Centerra Gold, Inc.(1) | 1,284,700 |
| 7,143,465 |
|
Continental Gold, Inc.(1) | 270,400 |
| 779,535 |
|
Detour Gold Corp.(1) | 295,801 |
| 2,659,543 |
|
Fortuna Silver Mines, Inc.(1) | 416,700 |
| 2,366,856 |
|
| Franco-Nevada Corp. | 151,893 |
| 11,085,942 |
|
| Franco-Nevada Corp. (New York) | 243,800 |
| 17,802,276 |
|
GoGold Resources, Inc.(1) | 5,526,925 |
| 1,765,724 |
|
| Goldcorp, Inc. | 733,776 |
| 10,074,664 |
|
| Goldcorp, Inc. (New York) | 618,800 |
| 8,483,748 |
|
Guyana Goldfields, Inc.(1) | 721,621 |
| 2,695,135 |
|
IAMGOLD Corp. (New York)(1) | 1,155,600 |
| 6,714,036 |
|
Kinross Gold Corp. (New York)(1) | 2,827,857 |
| 10,632,742 |
|
| Kirkland Lake Gold Ltd. | 660,900 |
| 13,995,707 |
|
| Lucara Diamond Corp. | 357,700 |
| 574,105 |
|
| OceanaGold Corp. | 783,653 |
| 2,175,738 |
|
Orezone Gold Corp.(1) | 5,400,000 |
| 3,327,121 |
|
| Pan American Silver Corp. (NASDAQ) | 556,300 |
| 9,957,770 |
|
Premier Gold Mines Ltd.(1) | 339,100 |
| 673,222 |
|
Roxgold, Inc.(1) | 2,860,300 |
| 2,436,798 |
|
Sandstorm Gold Ltd.(1) | 345,000 |
| 1,550,945 |
|
Sandstorm Gold Ltd. (New York)(1) | 259,700 |
| 1,168,650 |
|
SEMAFO, Inc.(1) | 516,100 |
| 1,495,714 |
|
| Silvercorp Metals, Inc. | 584,900 |
| 1,543,835 |
|
SSR Mining, Inc.(1) | 471,000 |
| 4,648,770 |
|
|
| | | | | |
| | Shares | Value |
| Tahoe Resources, Inc. | 768,000 |
| $ | 3,778,560 |
|
| Wheaton Precious Metals Corp. | 926,900 |
| 20,447,414 |
|
| Yamana Gold, Inc. (New York) | 477,181 |
| 1,383,825 |
|
| | | 197,838,146 |
|
| China — 1.7% | | |
| Zijin Mining Group Co. Ltd., H Shares | 16,510,000 |
| 6,261,793 |
|
| Peru — 1.5% | | |
| Cia de Minas Buenaventura SAA ADR | 424,500 |
| 5,785,935 |
|
| Russia — 0.3% | | |
| Alrosa PJSC | 747,600 |
| 1,189,985 |
|
| South Africa — 3.8% | | |
| AngloGold Ashanti Ltd. | 225,302 |
| 1,839,108 |
|
| AngloGold Ashanti Ltd. ADR | 322,976 |
| 2,651,633 |
|
| Gold Fields Ltd. | 1,638,310 |
| 5,836,585 |
|
| Gold Fields Ltd. ADR | 1,057,400 |
| 3,774,918 |
|
| | | 14,102,244 |
|
| United Kingdom — 5.9% | | |
| Centamin plc | 2,915,900 |
| 4,578,160 |
|
| Hochschild Mining plc | 398,800 |
| 1,001,737 |
|
| Randgold Resources Ltd. ADR | 217,800 |
| 16,790,202 |
|
| | | 22,370,099 |
|
| United States — 15.6% | | |
| Newmont Mining Corp. | 1,173,414 |
| 44,249,442 |
|
| Royal Gold, Inc. | 154,521 |
| 14,345,730 |
|
| | | 58,595,172 |
|
TOTAL COMMON STOCKS
(Cost $269,531,156) | | 364,847,407 |
|
| EXCHANGE-TRADED FUNDS — 1.0% | | |
VanEck Vectors Gold Miners ETF
(Cost $4,151,412) | 170,700 |
| 3,808,317 |
|
| TEMPORARY CASH INVESTMENTS — 0.1% | | |
Repurchase Agreement, BMO Capital Markets Corp., (collateralized by various U.S. Treasury obligations, 1.375% - 3.75%, 2/15/19 - 11/15/47, valued at $157,542), in a joint trading account at 1.75%, dated 6/29/18, due 7/2/18 (Delivery value $154,384) | | 154,361 |
|
| Repurchase Agreement, Fixed Income Clearing Corp., (collateralized by various U.S. Treasury obligations, 2.75%, 2/15/28, valued at $135,196), at 0.90%, dated 6/29/18, due 7/2/18 (Delivery value $128,010) | | 128,000 |
|
| State Street Institutional U.S. Government Money Market Fund, Premier Class | 808 |
| 808 |
|
TOTAL TEMPORARY CASH INVESTMENTS
(Cost $283,169) | | 283,169 |
|
TOTAL INVESTMENT SECURITIES — 98.1%
(Cost $273,965,737) | | 368,938,893 |
|
| OTHER ASSETS AND LIABILITIES — 1.9% | | 7,299,778 |
|
| TOTAL NET ASSETS — 100.0% | | $ | 376,238,671 |
|
|
| | |
| NOTES TO SCHEDULE OF INVESTMENTS |
| ADR | - | American Depositary Receipt |
See Notes to Financial Statements.
|
|
| Statement of Assets and Liabilities |
|
| | | |
| JUNE 30, 2018 |
| Assets |
| Investment securities, at value (cost of $273,965,737) | $ | 368,938,893 |
|
| Foreign currency holdings, at value (cost of $210,391) | 210,467 |
|
| Receivable for investments sold | 8,108,269 |
|
| Receivable for capital shares sold | 101,365 |
|
| Dividends and interest receivable | 15,538 |
|
| | 377,374,532 |
|
| | |
| Liabilities | |
| Payable for investments purchased | 851,694 |
|
| Payable for capital shares redeemed | 78,188 |
|
| Accrued management fees | 200,148 |
|
| Distribution and service fees payable | 5,831 |
|
| | 1,135,861 |
|
| | |
| Net Assets | $ | 376,238,671 |
|
| | |
| Net Assets Consist of: | |
| Capital (par value and paid-in surplus) | $ | 430,487,631 |
|
| Distributions in excess of net investment income | (9,874,940 | ) |
| Accumulated net realized loss | (139,427,429 | ) |
| Net unrealized appreciation | 95,053,409 |
|
| | $ | 376,238,671 |
|
|
| | | | | | |
| | Net Assets | Shares Outstanding | Net Asset Value Per Share |
| Investor Class, $0.01 Par Value |
| $347,311,439 |
| 40,490,093 |
| $8.58 |
| I Class, $0.01 Par Value |
| $13,464,118 |
| 1,553,712 |
| $8.67 |
| A Class, $0.01 Par Value |
| $7,475,345 |
| 889,479 |
| $8.40* |
| C Class, $0.01 Par Value |
| $2,463,273 |
| 306,905 |
| $8.03 |
| R Class, $0.01 Par Value |
| $5,524,496 |
| 663,888 |
| $8.32 |
*Maximum offering price $8.91 (net asset value divided by 0.9425).
See Notes to Financial Statements.
|
| | | |
| YEAR ENDED JUNE 30, 2018 |
| Investment Income (Loss) |
| Income: | |
| Dividends (net of foreign taxes withheld of $315,203) | $ | 4,364,975 |
|
| Interest | 11,584 |
|
| | 4,376,559 |
|
| | |
| Expenses: | |
| Management fees | 2,510,324 |
|
| Distribution and service fees: | |
| A Class | 20,370 |
|
| C Class | 23,609 |
|
| R Class | 24,870 |
|
| Directors' fees and expenses | 23,788 |
|
| Other expenses | 4,863 |
|
| | 2,607,824 |
|
| | |
| Net investment income (loss) | 1,768,735 |
|
| | |
| Realized and Unrealized Gain (Loss) | |
| Net realized gain (loss) on: | |
| Investment transactions | (3,312,067 | ) |
| Foreign currency translation transactions | (60,894 | ) |
| | (3,372,961 | ) |
| | |
| Change in net unrealized appreciation (depreciation) on: | |
| Investments | 16,392,761 |
|
| Translation of assets and liabilities in foreign currencies | 85,517 |
|
| | 16,478,278 |
|
| | |
| Net realized and unrealized gain (loss) | 13,105,317 |
|
| | |
| Net Increase (Decrease) in Net Assets Resulting from Operations | $ | 14,874,052 |
|
See Notes to Financial Statements.
|
|
| Statement of Changes in Net Assets |
|
| | | | | | |
| YEARS ENDED JUNE 30, 2018 AND JUNE 30, 2017 |
| Increase (Decrease) in Net Assets | June 30, 2018 | June 30, 2017 |
| Operations | | |
| Net investment income (loss) | $ | 1,768,735 |
| $ | 169,423 |
|
| Net realized gain (loss) | (3,372,961 | ) | 9,234,055 |
|
| Change in net unrealized appreciation (depreciation) | 16,478,278 |
| (124,262,775 | ) |
| Net increase (decrease) in net assets resulting from operations | 14,874,052 |
| (114,859,297 | ) |
| | | |
| Distributions to Shareholders | | |
| From net investment income: | | |
| Investor Class | — |
| (32,679,261 | ) |
| I Class | — |
| (1,045,125 | ) |
| A Class | — |
| (904,841 | ) |
| C Class | — |
| (174,344 | ) |
| R Class | — |
| (385,450 | ) |
| Decrease in net assets from distributions | — |
| (35,189,021 | ) |
| | | |
| Capital Share Transactions | | |
| Net increase (decrease) in net assets from capital share transactions (Note 5) | (19,266,702 | ) | 16,997,949 |
|
| | | |
| Redemption Fees | | |
| Increase in net assets from redemption fees | 10,437 |
| 178,360 |
|
| | | |
| Net increase (decrease) in net assets | (4,382,213 | ) | (132,872,009 | ) |
| | | |
| Net Assets | | |
| Beginning of period | 380,620,884 |
| 513,492,893 |
|
| End of period | $ | 376,238,671 |
| $ | 380,620,884 |
|
| | | |
| Distributions in excess of net investment income | $ | (9,874,940 | ) | $ | (23,835,652 | ) |
See Notes to Financial Statements.
|
|
| Notes to Financial Statements |
JUNE 30, 2018
1. Organization
American Century Quantitative Equity Funds, Inc. (the corporation) is registered under the Investment Company Act of 1940, as amended (the 1940 Act), as an open-end management investment company and is organized as a Maryland corporation. Global Gold Fund (the fund) is one fund in a series issued by the corporation. The fund’s investment objective is to seek to realize a total return (capital growth and dividends) consistent with investment in securities of companies that are engaged in mining, processing, fabricating or distributing gold or other precious metals throughout the world.
The fund offers the Investor Class, I Class, A Class, C Class and R Class. The A Class may incur an initial sales charge. The A Class and C Class may be subject to a contingent deferred sales charge.
2. Significant Accounting Policies
The following is a summary of significant accounting policies consistently followed by the fund in preparation of its financial statements. The fund is an investment company and follows accounting and reporting guidance in accordance with accounting principles generally accepted in the United States of America. This may require management to make certain estimates and assumptions at the date of the financial statements. Actual results could differ from these estimates. Management evaluated the impact of events or transactions occurring through the date the financial statements were issued that would merit recognition or disclosure.
Investment Valuations — The fund determines the fair value of its investments and computes its net asset value per share at the close of regular trading (usually 4 p.m. Eastern time) on the New York Stock Exchange (NYSE) on each day the NYSE is open. The Board of Directors has adopted valuation policies and procedures to guide the investment advisor in the fund’s investment valuation process and to provide methodologies for the oversight of the fund’s pricing function.
Equity securities that are listed or traded on a domestic securities exchange are valued at the last reported sales price or at the official closing price as provided by the exchange. Equity securities traded on foreign securities exchanges are generally valued at the closing price of such securities on the exchange where primarily traded or at the close of the NYSE, if that is earlier. If no last sales price is reported, or if local convention or regulation so provides, the mean of the latest bid and asked prices may be used. Securities traded over-the-counter are valued at the mean of the latest bid and asked prices, the last sales price, or the official closing price. Equity securities initially expressed in local currencies are translated into U.S. dollars at the mean of the appropriate currency exchange rate at the close of the NYSE as provided by an independent pricing service.
Open-end management investment companies are valued at the reported net asset value per share. Repurchase agreements are valued at cost, which approximates fair value.
If the fund determines that the market price for an investment is not readily available or the valuation methods mentioned above do not reflect an investment’s fair value, such investment is valued as determined in good faith by the Board of Directors or its delegate, in accordance with policies and procedures adopted by the Board of Directors. In its determination of fair value, the fund may review several factors including, but not limited to, market information regarding the specific investment or comparable investments and correlation with other investment types, futures indices or general market indicators. Circumstances that may cause the fund to use these procedures to value an investment include, but are not limited to: an investment has been declared in default or is distressed; trading in a security has been suspended during the trading day or a security is not actively trading on its principal exchange; prices received from a regular pricing source are deemed unreliable; or there is a foreign market holiday and no trading occurred.
The fund monitors for significant events occurring after the close of an investment’s primary exchange but before the fund’s net asset value per share is determined. Significant events may include, but are not limited to: corporate announcements and transactions; governmental action and political unrest that could impact a specific investment or an investment sector; or armed conflicts, natural disasters and similar events that could affect investments in a specific country or region. The fund also monitors for significant fluctuations between domestic and foreign markets, as evidenced by the U.S. market or such other indicators that the Board of Directors, or its delegate, deems appropriate. If significant fluctuations in foreign markets are identified, the fund may apply a model-derived factor to the closing price of equity securities traded on foreign securities exchanges. The factor is based on observable market data as provided by an independent pricing service.
Security Transactions — Security transactions are accounted for as of the trade date. Net realized gains and losses are determined on the identified cost basis, which is also used for federal income tax purposes.
Investment Income — Dividend income less foreign taxes withheld, if any, is recorded as of the ex-dividend date. Distributions received on securities that represent a return of capital or long-term capital gain are recorded as a reduction of cost of investments and/or as a realized gain. The fund may estimate the components of distributions received that may be considered nontaxable distributions or long-term capital gain distributions for income tax purposes. Interest income is recorded on the accrual basis and includes accretion of discounts and amortization of premiums.
Foreign Currency Translations — All assets and liabilities initially expressed in foreign currencies are translated into U.S. dollars at prevailing exchange rates at period end. The fund may enter into spot foreign currency exchange contracts to facilitate transactions denominated in a foreign currency. Purchases and sales of investment securities, dividend and interest income, spot foreign currency exchange contracts, and expenses are translated at the rates of exchange prevailing on the respective dates of such transactions. Net realized and unrealized foreign currency exchange gains or losses related to investment securities are a component of net realized gain (loss) on investment transactions and change in net unrealized appreciation (depreciation) on investments, respectively.
Repurchase Agreements — The fund may enter into repurchase agreements with institutions that American Century Investment Management, Inc. (ACIM) (the investment advisor) has determined are creditworthy pursuant to criteria adopted by the Board of Directors. The fund requires that the collateral, represented by securities, received in a repurchase transaction be transferred to the custodian in a manner sufficient to enable the fund to obtain those securities in the event of a default under the repurchase agreement. ACIM monitors, on a daily basis, the securities transferred to ensure the value, including accrued interest, of the securities under each repurchase agreement is equal to or greater than amounts owed to the fund under each repurchase agreement.
Joint Trading Account — Pursuant to an Exemptive Order issued by the Securities and Exchange Commission, the fund, along with certain other funds in the American Century Investments family of funds, may transfer uninvested cash balances into a joint trading account. These balances are invested in one or more repurchase agreements that are collateralized by U.S. Treasury or Agency obligations.
Income Tax Status — It is the fund’s policy to distribute substantially all net investment income and net realized gains to shareholders and to otherwise qualify as a regulated investment company under provisions of the Internal Revenue Code. Accordingly, no provision has been made for income taxes. The fund files U.S. federal, state, local and non-U.S. tax returns as applicable. The fund's tax returns are subject to examination by the relevant taxing authority until expiration of the applicable statute of limitations, which is generally three years from the date of filing but can be longer in certain jurisdictions. At this time, management believes there are no uncertain tax positions which, based on their technical merit, would not be sustained upon examination and for which it is reasonably possible that the total amounts of unrecognized tax benefits will significantly change in the next twelve months.
Multiple Class — All shares of the fund represent an equal pro rata interest in the net assets of the class to which such shares belong, and have identical voting, dividend, liquidation and other rights and the same terms and conditions, except for class specific expenses and exclusive rights to vote on matters affecting only individual classes. Income, non-class specific expenses, and realized and unrealized capital gains and losses of the fund are allocated to each class of shares based on their relative net assets.
Distributions to Shareholders — Distributions from net investment income, if any, are generally declared and paid semiannually. Distributions from net realized gains, if any, are generally declared and paid annually.
Redemption Fees — Prior to October 9, 2017, the fund may have imposed a 1.00% redemption fee on shares held less than 60 days. The fee was not applicable to all classes. The redemption fee was retained by the fund to help cover transaction costs that long-term investors may bear when the fund sells securities to meet investor redemptions.
Indemnifications — Under the corporation’s organizational documents, its officers and directors are indemnified against certain liabilities arising out of the performance of their duties to the fund. In addition, in the normal course of business, the fund enters into contracts that provide general indemnifications. The maximum exposure under these arrangements is unknown as this would involve future claims that may be made against a fund. The risk of material loss from such claims is considered by management to be remote.
3. Fees and Transactions with Related Parties
Certain officers and directors of the corporation are also officers and/or directors of American Century Companies, Inc. (ACC). The corporation’s investment advisor, ACIM, the corporation's distributor, American Century Investment Services, Inc. (ACIS), and the corporation’s transfer agent, American Century Services, LLC, are wholly owned, directly or indirectly, by ACC.
Management Fees — The corporation has entered into a management agreement with ACIM, under which ACIM provides the fund with investment advisory and management services in exchange for a single, unified management fee (the fee) per class. The agreement provides that all expenses of managing and operating the fund, except distribution and service fees, brokerage expenses, taxes, interest, fees and expenses of the independent directors (including legal counsel fees), and extraordinary expenses, will be paid by ACIM. The fee is computed and accrued daily based on each class’s daily net assets and paid monthly in arrears. The difference in the fee among the classes is a result of their separate arrangements for non-Rule 12b-1 shareholder services. It is not the result of any difference in advisory or custodial fees or other expenses related to the management of the fund’s assets, which do not vary by class. The fee consists of (1) an Investment Category Fee based on the daily net assets of the fund and certain other accounts managed by the investment advisor that are in the same broad investment category as the fund and (2) a Complex Fee based on the assets of all the funds in the American Century Investments family of funds.
The Investment Category Fee range, the Complex Fee range and the effective annual management fee for each class for the period ended June 30, 2018 are as follows:
|
| | | |
| | Investment Category Fee Range | Complex Fee Range | Effective Annual Management Fee |
| Investor Class | 0.3380%
to 0.5200% | 0.2500% to 0.3100% | 0.66% |
| I Class | 0.0500% to 0.1100% | 0.46% |
| A Class | 0.2500% to 0.3100% | 0.66% |
| C Class | 0.2500% to 0.3100% | 0.66% |
| R Class | 0.2500% to 0.3100% | 0.66% |
Distribution and Service Fees — The Board of Directors has adopted a separate Master Distribution and Individual Shareholder Services Plan for each of the A Class, C Class and R Class (collectively the plans), pursuant to Rule 12b-1 of the 1940 Act. The plans provide that the A Class will pay ACIS an annual distribution and service fee of 0.25%. The plans provide that the C Class will pay ACIS an annual distribution and service fee of 1.00%, of which 0.25% is paid for individual shareholder services and 0.75% is paid for distribution services. The plans provide that the R Class will pay ACIS an annual distribution and service fee of 0.50%. The fees are computed and accrued daily based on each class’s daily net assets and paid monthly in arrears. The fees are used to pay financial intermediaries for distribution and individual shareholder services. Fees incurred under the plans during the period ended June 30, 2018 are detailed in the Statement of Operations.
Directors' Fees and Expenses — The Board of Directors is responsible for overseeing the investment advisor’s management and operations of the fund. The directors receive detailed information about the fund and its investment advisor regularly throughout the year, and meet at least quarterly with management of the investment advisor to review reports about fund operations. The fund’s officers do not receive compensation from the fund.
Interfund Transactions — The fund may enter into security transactions with other American Century Investments funds and other client accounts of the investment advisor, in accordance with the 1940 Act rules and procedures adopted by the Board of Directors. The rules and procedures require, among other things, that these transactions be effected at the independent current market price of the security. There were no interfund transactions during the period.
4. Investment Transactions
Purchases and sales of investment securities, excluding short-term investments, for the period ended June 30, 2018 were $140,642,285 and $162,323,821, respectively.
5. Capital Share Transactions
Transactions in shares of the fund were as follows:
|
| | | | | | | | | | |
| | Year ended
June 30, 2018 | Year ended
June 30, 2017 |
| | Shares | Amount | Shares | Amount |
| Investor Class/Shares Authorized | 360,000,000 |
| | 360,000,000 |
| |
| Sold | 4,889,599 |
| $ | 42,188,999 |
| 10,704,655 |
| $ | 110,256,797 |
|
| Issued in reinvestment of distributions | — |
| — |
| 4,085,554 |
| 30,519,087 |
|
| Redeemed | (6,948,239 | ) | (59,883,390 | ) | (12,984,754 | ) | (125,559,336 | ) |
| | (2,058,640 | ) | (17,694,391 | ) | 1,805,455 |
| 15,216,548 |
|
| I Class/Shares Authorized | 30,000,000 |
| | 30,000,000 |
| |
| Sold | 783,804 |
| 6,828,597 |
| 1,102,574 |
| 10,569,599 |
|
| Issued in reinvestment of distributions | — |
| — |
| 138,979 |
| 1,045,125 |
|
| Redeemed | (998,465 | ) | (8,657,027 | ) | (799,462 | ) | (7,595,695 | ) |
| | (214,661 | ) | (1,828,430 | ) | 442,091 |
| 4,019,029 |
|
| A Class/Shares Authorized | 20,000,000 |
| | 20,000,000 |
| |
| Sold | 468,886 |
| 3,956,561 |
| 876,933 |
| 8,516,443 |
|
| Issued in reinvestment of distributions | — |
| — |
| 117,864 |
| 866,298 |
|
| Redeemed | (553,185 | ) | (4,670,101 | ) | (1,345,884 | ) | (12,815,510 | ) |
| | (84,299 | ) | (713,540 | ) | (351,087 | ) | (3,432,769 | ) |
| C Class/Shares Authorized | 15,000,000 |
| | 15,000,000 |
| |
| Sold | 76,000 |
| 609,071 |
| 160,479 |
| 1,429,925 |
|
| Issued in reinvestment of distributions | — |
| — |
| 23,759 |
| 168,452 |
|
| Redeemed | (61,872 | ) | (498,848 | ) | (125,312 | ) | (1,140,613 | ) |
| | 14,128 |
| 110,223 |
| 58,926 |
| 457,764 |
|
| R Class/Shares Authorized | 20,000,000 |
| | 20,000,000 |
| |
| Sold | 229,235 |
| 1,920,049 |
| 363,848 |
| 3,499,635 |
|
| Issued in reinvestment of distributions | — |
| — |
| 52,801 |
| 385,450 |
|
| Redeemed | (126,663 | ) | (1,060,613 | ) | (309,653 | ) | (3,147,708 | ) |
| | 102,572 |
| 859,436 |
| 106,996 |
| 737,377 |
|
| Net increase (decrease) | (2,240,900 | ) | $ | (19,266,702 | ) | 2,062,381 |
| $ | 16,997,949 |
|
6. Fair Value Measurements
The fund’s investments valuation process is based on several considerations and may use multiple inputs to determine the fair value of the investments held by the fund. In conformity with accounting principles generally accepted in the United States of America, the inputs used to determine a valuation are classified into three broad levels.
• Level 1 valuation inputs consist of unadjusted quoted prices in an active market for identical investments.
• Level 2 valuation inputs consist of direct or indirect observable market data (including quoted prices for comparable investments, evaluations of subsequent market events, interest rates, prepayment speeds, credit risk, etc.). These inputs also consist of quoted prices for identical investments initially expressed in local currencies that are adjusted through translation into U.S. dollars.
• Level 3 valuation inputs consist of unobservable data (including a fund’s own assumptions).
The level classification is based on the lowest level input that is significant to the fair valuation measurement. The valuation inputs are not necessarily an indication of the risks associated with investing in these securities or other financial instruments. There were no significant transfers between levels during the period.
The following is a summary of the level classifications as of period end. The Schedule of Investments provides additional information on the fund’s portfolio holdings.
|
| | | | | | | | |
| | Level 1 | Level 2 | Level 3 |
| Assets | | | |
| Investment Securities | | | |
| Common Stocks | | | |
| Australia | — |
| $ | 58,704,033 |
| — |
|
| Canada | $ | 127,467,366 |
| 70,370,780 |
| — |
|
| China | — |
| 6,261,793 |
| — |
|
| Russia | — |
| 1,189,985 |
| — |
|
| South Africa | 6,426,551 |
| 7,675,693 |
| — |
|
| United Kingdom | 16,790,202 |
| 5,579,897 |
| — |
|
| Other Countries | 64,381,107 |
| — |
| — |
|
| Exchange-Traded Funds | 3,808,317 |
| — |
| — |
|
| Temporary Cash Investments | 808 |
| 282,361 |
| — |
|
| | $ | 218,874,351 |
| $ | 150,064,542 |
| — |
|
7. Risk Factors
There are certain risks involved in investing in foreign securities. These risks include those resulting from future adverse political, social and economic developments, fluctuations in currency exchange rates, the possible imposition of exchange controls, and other foreign laws or restrictions. Investing in emerging markets may accentuate these risks.
The fund concentrates its investments in a narrow segment of the total market. Because of this, the fund may be subject to greater risk and market fluctuations than a portfolio representing a broader range of industries. Gold stocks are generally considered speculative because of high share price volatility. The price of gold will likely impact the value of the companies in which the fund invests. The price of gold will fluctuate, sometimes considerably. Though many investors believe that gold investments hedge against inflation, currency devaluations and stock market declines, there is no guarantee that these historical inverse relationships will continue.
8. Federal Tax Information
The tax character of distributions paid during the years ended June 30, 2018 and June 30, 2017 were as follows:
|
| | | | | |
| | 2018 | 2017 |
| Distributions Paid From | | |
| Ordinary Income | — |
| $ | 35,189,021 |
|
| Long-term capital gains | — |
| — |
|
The book-basis character of distributions made during the year from net investment income or net realized gains may differ from their ultimate characterization for federal income tax purposes. These differences reflect the differing character of certain income items and net realized gains and losses for financial statement and tax purposes, and may result in reclassification among certain capital accounts on the financial statements.
The reclassifications, which are primarily due to gains on investments in passive foreign investment companies, were made to capital $(229,089), distributions in excess of net investment income $12,191,977, and accumulated net realized loss $(11,962,888).
As of period end, the federal tax cost of investments and the components of distributable earnings on a tax-basis were as follows:
|
| | | |
| Federal tax cost of investments | $ | 288,268,923 |
|
| Gross tax appreciation of investments | $ | 98,094,909 |
|
| Gross tax depreciation of investments | (17,424,939 | ) |
| Net tax appreciation (depreciation) of investments | 80,669,970 |
|
| Net tax appreciation (depreciation) on translation of assets and liabilities in foreign currencies | 80,253 |
|
| Net tax appreciation (depreciation) | $ | 80,750,223 |
|
| Undistributed ordinary income | — |
|
| Accumulated short-term capital losses | $ | (32,394,062 | ) |
| Accumulated long-term capital losses | $ | (102,583,302 | ) |
| Late-year ordinary loss deferral | $ | (21,819 | ) |
The difference between book-basis and tax-basis unrealized appreciation (depreciation) is attributable primarily to the realization to ordinary income for tax purposes of unrealized gains on investments in passive foreign investment companies.
Accumulated capital losses represent net capital loss carryovers that may be used to offset future realized capital gains for federal income tax purposes. The capital loss carryovers may be carried forward for an unlimited period. Future capital loss carryover utilization in any given year may be subject to Internal Revenue Code limitations.
Loss deferrals represent certain qualified losses that the fund has elected to treat as having been incurred in the following fiscal year for federal income tax purposes.
|
| | | | | | | | | | | | | |
| For a Share Outstanding Throughout the Years Ended June 30 (except as noted) |
| Per-Share Data | | | | Ratios and Supplemental Data | |
| | | Income From Investment Operations: | | | | Ratio to Average Net Assets of: | | |
| | Net Asset Value, Beginning of Period | Net Investment Income (Loss)(1) | Net Realized and Unrealized Gain (Loss) | Total From Investment Operations | Distributions From Net Investment Income | Net Asset Value, End of Period | Total Return(2) | Operating Expenses | Net Investment Income (Loss) | Portfolio Turnover Rate | Net Assets, End of Period (in thousands) |
| Investor Class | | | | | | | | | |
| 2018 | $8.25 | 0.04 | 0.29 | 0.33 | — | $8.58 | 4.00% | 0.66% | 0.47% | 37% |
| $347,311 |
|
| 2017 | $11.66 | —(3) | (2.57) | (2.57) | (0.84) | $8.25 | (21.33)% | 0.67% | 0.05% | 27% |
| $351,207 |
|
| 2016 | $7.21 | —(3) | 4.45 | 4.45 | — | $11.66 | 61.72% | 0.68% | 0.06% | 11% |
| $474,952 |
|
| 2015 | $11.08 | 0.02 | (3.64) | (3.62) | (0.25) | $7.21 | (32.61)% | 0.67% | 0.21% | 17% |
| $288,172 |
|
| 2014 | $9.72 | 0.04 | 1.32 | 1.36 | — | $11.08 | 13.99% | 0.67% | 0.40% | 29% |
| $455,211 |
|
| I Class | | | | | | | | | |
| 2018 | $8.32 | 0.06 | 0.29 | 0.35 | — | $8.67 | 4.21% | 0.46% | 0.67% | 37% |
| $13,464 |
|
| 2017 | $11.75 | 0.02 | (2.60) | (2.58) | (0.85) | $8.32 | (21.17)% | 0.47% | 0.25% | 27% |
| $14,717 |
|
| 2016 | $7.25 | 0.02 | 4.48 | 4.50 | — | $11.75 | 62.07% | 0.48% | 0.26% | 11% |
| $15,579 |
|
| 2015 | $11.14 | 0.04 | (3.67) | (3.63) | (0.26) | $7.25 | (32.48)% | 0.47% | 0.41% | 17% |
| $9,639 |
|
| 2014 | $9.75 | 0.06 | 1.33 | 1.39 | — | $11.14 | 14.26% | 0.47% | 0.60% | 29% |
| $14,375 |
|
| A Class | | | | | | | | |
| 2018 | $8.11 | 0.02 | 0.27 | 0.29 | — | $8.40 | 3.58% | 0.91% | 0.22% | 37% |
| $7,475 |
|
| 2017 | $11.47 | (0.02) | (2.52) | (2.54) | (0.82) | $8.11 | (21.45)% | 0.92% | (0.20)% | 27% |
| $7,895 |
|
| 2016 | $7.11 | (0.01) | 4.37 | 4.36 | — | $11.47 | 61.32% | 0.93% | (0.19)% | 11% |
| $15,196 |
|
| 2015 | $10.94 | (0.01) | (3.59) | (3.60) | (0.23) | $7.11 | (32.84)% | 0.92% | (0.04)% | 17% |
| $7,732 |
|
| 2014 | $9.61 | 0.01 | 1.32 | 1.33 | — | $10.94 | 13.84% | 0.92% | 0.15% | 29% |
| $18,387 |
|
|
| | | | | | | | | | | | | |
| For a Share Outstanding Throughout the Years Ended June 30 (except as noted) |
| Per-Share Data | | | | Ratios and Supplemental Data | |
| | | Income From Investment Operations: | | | | Ratio to Average Net Assets of: | | |
| | Net Asset Value, Beginning of Period | Net Investment Income (Loss)(1) | Net Realized and Unrealized Gain (Loss) | Total From Investment Operations | Distributions From Net Investment Income | Net Asset Value, End of Period | Total Return(2) | Operating Expenses | Net Investment Income (Loss) | Portfolio Turnover Rate | Net Assets, End of Period (in thousands) |
| C Class | | | | | | | | |
| 2018 | $7.80 | (0.04) | 0.27 | 0.23 | — | $8.03 | 2.95% | 1.66% | (0.53)% | 37% |
| $2,463 |
|
| 2017 | $11.07 | (0.09) | (2.43) | (2.52) | (0.75) | $7.80 | (22.04)% | 1.67% | (0.95)% | 27% |
| $2,284 |
|
| 2016 | $6.91 | (0.06) | 4.22 | 4.16 | — | $11.07 | 60.20% | 1.68% | (0.94)% | 11% |
| $2,589 |
|
| 2015 | $10.64 | (0.07) | (3.48) | (3.55) | (0.18) | $6.91 | (33.36)% | 1.67% | (0.79)% | 17% |
| $2,024 |
|
| 2014 | $9.42 | (0.06) | 1.28 | 1.22 | — | $10.64 | 12.95% | 1.67% | (0.60)% | 29% |
| $3,465 |
|
| R Class | | | | | | | | |
| 2018 | $8.05 | —(3) | 0.27 | 0.27 | — | $8.32 | 3.35% | 1.16% | (0.03)% | 37% |
| $5,524 |
|
| 2017 | $11.39 | (0.04) | (2.50) | (2.54) | (0.80) | $8.05 | (21.63)% | 1.17% | (0.45)% | 27% |
| $4,517 |
|
| 2016 | $7.08 | (0.03) | 4.34 | 4.31 | — | $11.39 | 60.88% | 1.18% | (0.44)% | 11% |
| $5,176 |
|
| 2015 | $10.89 | (0.02) | (3.58) | (3.60) | (0.21) | $7.08 | (32.98)% | 1.17% | (0.29)% | 17% |
| $2,534 |
|
| 2014 | $9.59 | (0.01) | 1.31 | 1.30 | — | $10.89 | 13.56% | 1.17% | (0.10)% | 29% |
| $3,494 |
|
|
|
| Notes to Financial Highlights |
| |
| (1) | Computed using average shares outstanding throughout the period. |
| |
| (2) | Total returns are calculated based on the net asset value of the last business day and do not reflect applicable sales charges, if any. Total returns for periods less than one year are not annualized. |
| |
| (3) | Per-share amount was less than $0.005. |
See Notes to Financial Statements.
|
|
| Report of Independent Registered Public Accounting Firm |
To the Board of Directors of American Century Quantitative Equity Funds, Inc. and Shareholders of Global Gold Fund
Opinion on the Financial Statements
We have audited the accompanying statement of assets and liabilities, including the schedule of investments, of Global Gold Fund (one of the funds constituting American Century Quantitative Equity Funds, Inc., referred to hereafter as the "Fund") as of June 30, 2018, the related statement of operations for the year ended June 30, 2018, the statement of changes in net assets for each of the two years in the period ended June 30, 2018, including the related notes, and the financial highlights for each of the five years in the period ended June 30, 2018 (collectively referred to as the “financial statements”). In our opinion, the financial statements present fairly, in all material respects, the financial position of the Fund as of June 30, 2018, the results of its operations for the year then ended, the changes in its net assets for each of the two years in the period ended June 30, 2018 and the financial highlights for each of the five years in the period ended June 30, 2018 in conformity with accounting principles generally accepted in the United States of America.
Basis for Opinion
These financial statements are the responsibility of the Fund’s management. Our responsibility is to express an opinion on the Fund’s financial statements based on our audits. We are a public accounting firm registered with the Public Company Accounting Oversight Board (United States) (“PCAOB”) and are required to be independent with respect to the Fund in accordance with the U.S. federal securities laws and the applicable rules and regulations of the Securities and Exchange Commission and the PCAOB.
We conducted our audits of these financial statements in accordance with the standards of the PCAOB. Those standards require that we plan and perform the audit to obtain reasonable assurance about whether the financial statements are free of material misstatement, whether due to error or fraud.
Our audits included performing procedures to assess the risks of material misstatement of the financial statements, whether due to error or fraud, and performing procedures that respond to those risks. Such procedures included examining, on a test basis, evidence regarding the amounts and disclosures in the financial statements. Our audits also included evaluating the accounting principles used and significant estimates made by management, as well as evaluating the overall presentation of the financial statements. Our procedures included confirmation of securities owned as of June 30, 2018 by correspondence with the custodian and brokers; when replies were not received from brokers, we performed other auditing procedures. We believe that our audits provide a reasonable basis for our opinion.
/s/ PricewaterhouseCoopers LLP
Kansas City, Missouri
August 16, 2018
We have served as the auditor of one or more investment companies in American Century Investments since 1997.
The Board of Directors
The individuals listed below serve as directors of the funds. Each director will continue to serve in this capacity until death, retirement, resignation or removal from office. The board has adopted a mandatory retirement age for directors who are not “interested persons,” as that term is defined in the Investment Company Act (independent directors). Independent directors shall retire by December 31 of the year in which they reach their 75th birthday; provided, however, that on or after January 1, 2022, independent trustees shall retire on December 31 of the year in which they reach their 76th birthday.
Mr. Thomas is an “interested person” because he currently serves as President and Chief Executive Officer of American Century Companies, Inc. (ACC), the parent company of American Century Investment Management, Inc. (ACIM or the advisor). The other directors (more than three-fourths of the total number) are independent. They are not employees, directors or officers of, and have no financial interest in, ACC or any of its wholly owned, direct or indirect, subsidiaries, including ACIM, American Century Investment Services, Inc. (ACIS) and American Century Services, LLC (ACS), and they do not have any other affiliations, positions or relationships that would cause them to be considered “interested persons” under the Investment Company Act. The directors serve in this capacity for eight (in the case of Jonathan S. Thomas, 16; and Ronald J. Gilson, 9) registered investment companies in the American Century Investments family of funds.
The following table presents additional information about the directors. The mailing address for each director other than Mr. Thomas is 1665 Charleston Road, Mountain View, California 94043. The mailing address for Mr. Thomas is 4500 Main Street, Kansas City, Missouri 64111.
|
| | | | | |
Name
(Year of Birth) | Position(s) Held with Funds | Length of Time Served | Principal Occupation(s) During Past 5 Years | Number of American Century Portfolios Overseen by Director | Other Directorships Held During Past 5 Years |
| Independent Directors |
|
|
Tanya S. Beder
(1955) | Director | Since 2011 | Chairman and CEO, SBCC Group Inc. (independent advisory services) (2006 to present) | 45 | CYS Investments, Inc.; Nabors Industries Ltd. |
Jeremy I. Bulow
(1954) | Director | Since 2011 | Professor of Economics, Stanford University, Graduate School of Business (1979 to present) | 45 | None |
Anne Casscells
(1958) | Director | Since 2016 | Co-Chief Executive Officer and Chief Investment Officer, Aetos Alternatives Management (investment advisory firm) (2001 to present); Lecturer in Accounting, Stanford University, Graduate School of Business (2009 to present) | 45 | None |
|
| | | | | |
Name
(Year of Birth) | Position(s) Held with Funds | Length of Time Served | Principal Occupation(s) During Past 5 Years | Number of American Century Portfolios Overseen by Director | Other Directorships Held During Past 5 Years |
| Independent Directors |
|
|
Ronald J. Gilson
(1946) | Director and Chairman of the Board | Since 1995
(Chairman since 2005) | Charles J. Meyers Professor of Law and Business, Emeritus, Stanford Law School (1979 to 2016); Marc and Eva Stern Professor of Law and Business, Columbia University School of Law (1992 to present) | 47 | None |
Frederick L. A. Grauer
(1946) | Director | Since 2008 | Senior Advisor, iShares by BlackRock, Inc. (investment management firm) (2010 to 2011, 2013 to 2015); Senior Advisor, Course Hero (an educational technology company) (2015 to present) | 45 | None |
Jonathan D. Levin
(1972) | Director | Since 2016 | Philip H. Knight Professor and Dean, Graduate School of Business, Stanford University (2016 to present); Professor, Stanford University, (2000 to present); Chair, Department of Economics, Stanford University (2011 to 2014) | 45 | None |
Peter F. Pervere
(1947) | Director | Since 2007 | Retired | 45 | None |
John B. Shoven
(1947) | Director | Since 2002 | Charles R. Schwab Professor of Economics, Stanford University (1973 to present) | 45 | Cadence Design Systems; Exponent; Financial Engines |
| Interested Director |
|
|
Jonathan S. Thomas
(1963) | Director and President | Since 2007 | President and Chief Executive Officer, ACC (2007 to present). Also serves as Chief Executive Officer, ACS; Executive Vice President, ACIM; Director, ACC, ACIM and other ACC subsidiaries | 115 | BioMed Valley Discoveries, Inc. |
The Statement of Additional Information has additional information about the fund's directors and is available without charge, upon request, by calling 1-800-345-2021.
Officers
The following table presents certain information about the executive officers of the funds. Each officer serves as an officer for each of the 16 (in the case of Robert J. Leach, 15) investment companies in the American Century family of funds, unless otherwise noted. No officer is compensated for his or her service as an officer of the funds. The listed officers are interested persons of the funds and are appointed or re-appointed on an annual basis. The mailing address for each officer listed below is 4500 Main Street, Kansas City, Missouri 64111.
|
| | |
Name
(Year of Birth) | Offices with the Funds | Principal Occupation(s) During the Past Five Years |
Jonathan S. Thomas
(1963) | Director and President since 2007 | President and Chief Executive Officer, ACC (2007 to present). Also serves as Chief Executive Officer, ACS; Executive Vice President, ACIM; Director, ACC, ACIM and other ACC subsidiaries |
Amy D. Shelton
(1964) | Chief Compliance Officer and Vice President since 2014 | Chief Compliance Officer, American Century funds, (2014 to present); Chief Compliance Officer, ACIM (2014 to present); Chief Compliance Officer, ACIS (2009 to present); Vice President, Client Interactions and Marketing, ACIS (2013 to 2014). Also serves as Vice President, ACIS |
Charles A. Etherington
(1957) | General Counsel since 2007 and Senior Vice President since 2006 | Attorney, ACC (1994 to present); Vice President, ACC (2005 to present); General Counsel, ACC (2007 to present). Also serves as General Counsel, ACIM, ACS, ACIS and other ACC subsidiaries; and Senior Vice President, ACIM and ACS |
C. Jean Wade
(1964) | Vice President,Treasurer and Chief Financial Officer since 2012 | Senior Vice President, ACS (2017 to present); Vice President, ACS (2000 to 2017) |
Robert J. Leach
(1966) | Vice President since 2006 and Assistant Treasurer since 2012 | Vice President, ACS (2000 to present) |
David H. Reinmiller
(1963) | Vice President since 2000 | Attorney, ACC (1994 to present). Also serves as Vice President, ACIM and ACS |
Ward D. Stauffer
(1960) | Secretary since 2005 | Attorney, ACC (2003 to present) |
|
|
| Approval of Management Agreement |
At a meeting held on June 19, 2018, the Fund’s Board of Directors (the "Board") unanimously approved the renewal of the management agreement pursuant to which American Century Investment Management, Inc. (the “Advisor”) acts as the investment advisor for the Fund. Under Section 15(c) of the Investment Company Act, contracts for investment advisory services are required to be reviewed, evaluated, and approved by a majority of a fund’s directors/trustees, including a majority of the independent Directors, each year. The Board regards this annual evaluation and renewal as one of its most important responsibilities.
The independent Directors have memorialized a statement regarding the relationship between their ongoing obligations to oversee and evaluate the performance of the Advisor and their annual consideration of renewal of the management agreement. In that statement, the independent Directors noted that their assessment of the Advisor’s performance is an ongoing process that takes place over the entire year and is informed by all of the extensive information that the Board and its committees receive and consider over time. This information, together with the additional materials provided specifically in connection with the review, are central to the Board’s assessment of the Advisor’s performance and its determination whether to renew the Fund’s management agreement.
Prior to its consideration of the renewal of the management agreement, the Board requested and reviewed extensive data and analysis relating to the proposed renewal. This information and analysis was compiled by the Advisor and certain independent providers of evaluation data concerning the Fund and the services provided to the Fund by the Advisor.
In connection with its consideration of the renewal of the management agreement, the Board’s review and evaluation of the services provided by the Advisor included, but was not limited to, the following:
| |
| • | the nature, extent, and quality of investment management, shareholder services, and other services provided to the Fund; |
| |
| • | the wide range of other programs and services the Advisor provides to the Fund and its shareholders on a routine and non-routine basis; |
| |
| • | the investment performance of the Fund, including data comparing the Fund’s performance to appropriate benchmarks and/or a peer group of other mutual funds with similar investment objectives and strategies; |
| |
| • | the cost of owning the Fund compared to the cost of owning similar funds; |
| |
| • | the Advisor’s compliance policies, procedures, and regulatory experience; |
| |
| • | financial data showing the cost of services provided to the Fund, the profitability of the Fund to the Advisor, and the overall profitability of the Advisor; |
| |
| • | strategic plans of the Advisor; |
| |
| • | any economies of scale associated with the Advisor’s management of the Fund and other accounts; |
| |
| • | services provided and charges to other investment management clients of the Advisor; |
| |
| • | acquired fund fees and expenses; |
| |
| • | payments and practices in connection with financial intermediaries holding shares of the Fund and the services provided by intermediaries in connection therewith; and |
| |
| • | any collateral benefits derived by the Advisor from the management of the Fund. |
In keeping with its practice, the Board held two in-person meetings to review and discuss the information provided in response to their request and held active discussions with the Advisor regarding the renewal of the management agreement. The independent Directors had the benefit of the advice of their independent counsel throughout the process.
Factors Considered
The Directors considered all of the information provided by the Advisor, the independent data providers, and the independent Directors’ independent counsel in connection with the approval. They determined that the information was sufficient for them to evaluate the management agreement for the Fund. In connection with their review, the Directors did not identify any single factor as being all-important or controlling and each Director may have attributed different levels of importance to different factors. In deciding to renew the management agreement, the Board based its decision on a number of factors, including the following:
Nature, Extent and Quality of Services - Generally. Under the management agreement, the Advisor is responsible for providing or arranging for all services necessary for the operation of the Fund. The Board noted that the Advisor provides or arranges at its own expense a wide variety of services including:
| |
| • | constructing and designing the Fund |
| |
| • | portfolio research and security selection |
| |
| • | initial capitalization/funding |
| |
| • | daily valuation of the Fund’s portfolio |
| |
| • | shareholder servicing and transfer agency, including shareholder confirmations, recordkeeping, and communications |
| |
| • | legal services (except the independent Directors’ counsel) |
| |
| • | regulatory and portfolio compliance |
| |
| • | marketing and distribution (except amounts paid by the Fund under Rule 12b-1 plans) |
The Board noted that many of these services have expanded over time in terms of both quantity and complexity in response to shareholder demands, competition in the industry, changing distribution channels, and the changing regulatory environment.
Investment Management, Shareholder, and Other Services. The nature of the investment management services provided to the Fund is quite complex and allows Fund shareholders access to professional money management, instant diversification of their investments within an asset class, the opportunity to easily diversify among asset classes by investing in or exchanging among various American Century Investments funds, and liquidity. In evaluating investment performance, the Board expects the Advisor to manage the Fund in accordance with its investment objectives and approved strategies. Further, the Directors recognize that the Advisor has an obligation to seek the best execution of fund trades. In providing these services, the Advisor utilizes teams of investment professionals (portfolio managers, analysts, research assistants, and securities traders) who require extensive information technology, research, training, compliance, and other systems to conduct their business. The Board, directly and through its Portfolio Committee, regularly reviews investment performance information for the Fund, together with comparative information for appropriate benchmarks and/or peer groups of similarly-managed funds, over different time horizons. The Directors also review detailed performance information during the management agreement approval process. If performance concerns are identified, the Fund receives special reviews until performance improves, during which the Board discusses with the Advisor the reasons for such results (e.g., market conditions, security selection) and any efforts being undertaken to improve performance. The Fund’s performance was above its benchmark for the three-, five-, and ten-year periods and below its benchmark for the one-year period reviewed by the Board. The Board found the investment management services provided by the Advisor to the Fund to be satisfactory and consistent with the management agreement.
Under the management agreement, the Advisor provides the Fund with a comprehensive package of transfer agency, shareholder, and other services. The Board, directly and through various committees of the Board, regularly reviews reports and evaluations of such services at its regular meetings. These reports include, but are not limited to, information regarding the operational efficiency and accuracy of the shareholder and transfer agency services provided, staffing levels, shareholder satisfaction (as measured by external as well as internal sources), technology support, new products and services offered to Fund shareholders, securities trading activities, portfolio valuation services, auditing services, and legal and operational compliance activities. The Board found the services provided by the Advisor to the Fund under the management agreement to be competitive and of high quality.
Costs of Services and Profitability. The Advisor provides detailed information concerning its cost of providing various services to the Fund, its profitability in managing the Fund, its overall profitability, and its financial condition. The Directors have reviewed with the Advisor the methodology used to prepare this financial information. This information is considered in evaluating the Advisor’s financial condition, its ability to continue to provide services under the management agreement, and the reasonableness of the current management fee. The Board concluded that the Advisor’s profits were reasonable in light of the services provided to the Fund.
Economies of Scale. The Board also reviewed information provided by the Advisor regarding the possible existence of economies of scale in connection with the management of the Fund. The Board concluded that economies of scale are difficult to measure and predict with precision, especially on a fund-by-fund basis. The Board concluded that the Advisor is appropriately sharing economies of scale through its competitive fee structure, offering competitive fees from fund inception, and through reinvestment in its business to provide shareholders enhanced and expanded services.
Comparison to Other Funds’ Fees. The management agreement provides that the Fund pays the Advisor a single, all-inclusive (or unified) management fee for providing all services necessary for the management and operation of the Fund, other than brokerage expenses, expenses attributable to short sales, taxes, interest, extraordinary expenses, the fees and expenses of the Fund’s independent Directors (including their independent legal counsel), and expenses incurred in connection with the provision of shareholder services and distribution services under a plan adopted pursuant to Rule 12b-1 under the 1940 Act. Under the unified fee structure, the Advisor is responsible for providing all investment advisory, custody, audit, administrative, compliance, recordkeeping, marketing, and shareholder services, or arranging and supervising third parties to provide such services. By contrast, most other funds are charged a variety of fees, including an investment advisory fee, a transfer agency fee, an administrative fee, distribution charges, and other expenses. Other than their investment advisory fees and any applicable Rule 12b-1 distribution fees, all other components of the total fees charged by these other funds may be increased without shareholder approval. The Board believes the unified fee structure is a benefit to Fund shareholders because it clearly discloses to shareholders the cost of owning Fund shares, and, since the unified fee cannot be increased without a vote of Fund shareholders, it shifts to the Advisor the risk of increased costs of operating the Fund and provides a direct incentive to minimize administrative inefficiencies. Part of the Board’s analysis of fee levels involves reviewing certain evaluative data compiled by an independent provider and comparing the Fund’s unified fee to the total expense ratio of peer funds. The unified fee charged to shareholders of the Fund was the lowest of the total expense ratios of the Fund’s peer universe. The Board concluded that the management fee paid by the Fund to the Advisor under the management agreement is reasonable in light of the services provided to the Fund.
Comparison to Fees and Services Provided to Other Clients of the Advisor. The Board also requested and received information from the Advisor concerning the nature of the services, fees, costs, and profitability of its advisory services to advisory clients other than the Fund. They observed that these varying types of client accounts require different services and involve different regulatory and entrepreneurial risks than the management of the Fund. The Board analyzed this
information and concluded that the fees charged and services provided to the Fund were reasonable by comparison.
Payments to Intermediaries. The Directors also requested and received a description of payments made to intermediaries by the Fund and the Advisor and services provided by intermediaries. These payments include various payments made by the Fund or the Advisor to different types of intermediaries and recordkeepers for distribution and service activities provided for the Fund. The Directors reviewed such information and received representations from the Advisor that all such payments by the Fund were made pursuant to the Fund’s Rule 12b-1 Plan and that all such payments by the Advisor were made from the Advisor’s resources and reasonable profits. The Board found such payments to be reasonable in scope and purpose.
Collateral or “Fall-Out” Benefits Derived by the Advisor. The Board considered the existence of collateral benefits the Advisor may receive as a result of its relationship with the Fund. The Board noted that the Advisor’s primary business is managing mutual funds and it generally does not use fund or shareholder information to generate profits in other lines of business, and therefore does not derive any significant collateral benefits from them. The Board noted that the Advisor may receive proprietary research from broker-dealers that execute fund portfolio transactions. The Board also determined that the Advisor is able to provide investment management services to certain clients other than the Fund, at least in part, due to its existing infrastructure built to serve the fund complex. The Board noted that the assets of those other accounts are, where applicable, included with the assets of the Fund to determine breakpoints in the management fee schedule.
Existing Relationship. The Board also considered whether there was any reason for not continuing the existing arrangement with the Advisor. In this regard, the Board was mindful of the potential disruptions of the Fund’s operations and various risks, uncertainties, and other effects that could occur as a result of a decision not to continue such relationship. In particular, the Board recognized that most shareholders have invested in the Fund on the strength of the Advisor’s industry standing and reputation and in the expectation that the Advisor will have a continuing role in providing advisory services to the Fund.
Conclusion of the Directors. As a result of this process, the Board, including all of the independent Directors and assisted by the advice of independent legal counsel, taking into account all of the factors discussed above and the information provided by the Advisor and others in connection with its review and throughout the year, concluded that the management agreement between the Fund and the Advisor is fair and reasonable in light of the services provided and should be renewed.
Retirement Account Information
As required by law, distributions you receive from certain retirement accounts are subject to federal income tax withholding, unless you elect not to have withholding apply*. Tax will be withheld on the total amount withdrawn even though you may be receiving amounts that are not subject to withholding, such as nondeductible contributions. In such case, excess amounts of withholding could occur. You may adjust your withholding election so that a greater or lesser amount will be withheld.
If you don’t want us to withhold on this amount, you must notify us to not withhold the federal income tax. You may notify us in writing or in certain situations by telephone or through other electronic means. For systematic withdrawals, your withholding election will remain in effect until revoked or changed by filing a new election. You have the right to revoke your election at any time and change your withholding percentage for future distributions.
Remember, even if you elect not to have income tax withheld, you are liable for paying income tax on the taxable portion of your withdrawal. If you elect not to have income tax withheld or you don’t have enough income tax withheld, you may be responsible for payment of estimated tax. You may incur penalties under the estimated tax rules if your withholding and estimated tax payments are not sufficient. You can reduce or defer the income tax on a distribution by directly or indirectly rolling such distribution over to another IRA or eligible plan. You should consult your tax advisor for additional information.
State tax will be withheld if, at the time of your distribution, your address is within one of the mandatory withholding states and you have federal income tax withheld (or as otherwise required by state law). State taxes will be withheld from your distribution in accordance with the respective state rules.
*Some 403(b), 457 and qualified retirement plan distributions may be subject to 20% mandatory withholding, as they are subject to special tax and withholding rules. Your plan administrator or plan sponsor is required to provide you with a special tax notice explaining those rules at the time you request a distribution. If applicable, federal and/or state taxes may be withheld from your distribution amount.
Proxy Voting Policies
Descriptions of the principles and policies that the fund's investment advisor uses in exercising the voting rights associated with the securities purchased and/or held by the fund are available without charge, upon request, by calling 1-800-345-2021 or visiting the "About Us" page of American Century Investments’ website at americancentury.com. A description of the policies is also available on the Securities and Exchange Commission’s website at sec.gov. Information regarding how the investment advisor voted proxies relating to portfolio securities during the most recent 12-month period ended June 30 is available on the "About Us" page at americancentury.com. It is also available at sec.gov.
Quarterly Portfolio Disclosure
The fund files its complete schedule of portfolio holdings with the Securities and Exchange Commission (SEC) for the first and third quarters of each fiscal year on Form N-Q. The fund’s Forms N-Q are available on the SEC’s website at sec.gov, and may be reviewed and copied at the SEC’s Public Reference Room in Washington, DC. Information on the operation of the Public Reference Room may be obtained by calling 1-800-SEC-0330. The fund also makes its complete schedule of portfolio holdings for the most recent quarter of its fiscal year available on its website at americancentury.com and, upon request, by calling 1-800-345-2021.
|
| | |
| |
| | | |
| Contact Us | americancentury.com | |
| Automated Information Line | 1-800-345-8765 | |
| Investor Services Representative | 1-800-345-2021
or 816-531-5575 | |
| Investors Using Advisors | 1-800-378-9878 | |
Business, Not-For-Profit, Employer-Sponsored
Retirement Plans | 1-800-345-3533 | |
Banks and Trust Companies, Broker-Dealers,
Financial Professionals, Insurance Companies | 1-800-345-6488 | |
| Telecommunications Relay Service for the Deaf | 711 | |
| | | |
| American Century Quantitative Equity Funds, Inc. | |
| | | |
Investment Advisor: American Century Investment Management, Inc. Kansas City, Missouri | |
| | | |
| This report and the statements it contains are submitted for the general information of our shareholders. The report is not authorized for distribution to prospective investors unless preceded or accompanied by an effective prospectus. | |
| | | |
©2018 American Century Proprietary Holdings, Inc. All rights reserved.
CL-ANN-92988 1808 | |
|
| |
| | |
| | Annual Report |
| | |
| | June 30, 2018 |
| | |
| | Income & Growth Fund |
| | Investor Class (BIGRX) |
| | I Class (AMGIX) |
| | A Class (AMADX) |
| | C Class (ACGCX) |
| | R Class (AICRX) |
| | R5 Class (AICGX) |
|
| | |
| President's Letter | 2 |
|
| Performance | 3 |
|
| Portfolio Commentary | |
|
| Fund Characteristics | |
|
| Shareholder Fee Example | |
|
| Schedule of Investments | |
|
| Statement of Assets and Liabilities | |
|
| Statement of Operations | |
|
| Statement of Changes in Net Assets | |
|
| Notes to Financial Statements | |
|
| Financial Highlights | |
|
| Report of Independent Registered Public Accounting Firm | |
|
| Management | |
|
| Approval of Management Agreement | |
|
| Additional Information | |
|
Any opinions expressed in this report reflect those of the author as of the date of the report, and do not necessarily represent the opinions of American Century Investments® or any other person in the American Century Investments organization. Any such opinions are subject to change at any time based upon market or other conditions and American Century Investments disclaims any responsibility to update such opinions. These opinions may not be relied upon as investment advice and, because investment decisions made by American Century Investments funds are based on numerous factors, may not be relied upon as an indication of trading intent on behalf of any American Century Investments fund. Security examples are used for representational purposes only and are not intended as recommendations to purchase or sell securities. Performance information for comparative indices and securities is provided to American Century Investments by third party vendors. To the best of American Century Investments’ knowledge, such information is accurate at the time of printing.
Jonathan Thomas
Dear Investor:
Thank you for reviewing this annual report for the period ended June 30, 2018. Annual reports help convey important information about fund returns, including market factors that affected performance during the reporting period. For additional, updated investment and market insights, we encourage you to visit our website, americancentury.com.
Volatility’s Return Challenged Financial Markets
Broad U.S. and global stock market indices generally rallied for the first half of the 12-month period. A favorable backdrop of robust corporate earnings results, improving global economic growth, and relatively low interest rates, combined with the effects of U.S. tax reform, drove stock prices higher. For the six months ended December 31, 2017, U.S. stocks (S&P 500 Index) returned 11.42%. U.S. bond returns were also positive, but much more subdued, as the Federal Reserve (the Fed) continued its rate-normalization efforts and interest rates edged higher. The Bloomberg Barclays U.S. Aggregate Bond Index returned 1.24% for the six-month period.
In early February, a force that was largely dormant during 2017—volatility—re-emerged, as better-than-expected economic data triggered expectations for rising inflation, higher interest rates, and a more-hawkish Fed. In response, U.S. Treasury yields climbed to their highest levels in several years, and stock prices plunged. Economic data released in subsequent months were more in line with market expectations, while corporate earnings results remained healthy. These factors helped calm the market unrest, and stocks generally recovered their earlier losses. Nevertheless, rising interest rates, geopolitical tensions, and the mounting threat of a global trade war continued to provide periodic headwinds for investors.
Despite the return of volatility, U.S. stocks (S&P 500 Index) gained14.37% for the 12-month period. Meanwhile, rising U.S. Treasury yields, particularly in the second half of the period, took a toll on bonds and other interest-rate-sensitive investments, including gold, utilities stocks, and real estate investment trusts (REITs). Investment-grade bonds (Bloomberg Barclays U.S. Aggregate Bond Index) returned -0.40% for the 12 months.
With volatility resurfacing, inflationary pressures building, Treasury yields rising, and the implications of U.S. tariff and trade policy still unfolding, investors likely will face new opportunities and challenges in the months ahead. We believe this scenario warrants a disciplined, diversified, and risk-aware approach, using professionally managed portfolios in pursuit of investment goals. We appreciate your continued trust and confidence in us.
Sincerely,
Jonathan Thomas
President and Chief Executive Officer
American Century Investments
|
| | | | | | |
| Total Returns as of June 30, 2018 |
| | | | Average Annual Returns | |
| | Ticker Symbol | 1 year | 5 years | 10 years | Since Inception | Inception Date |
| Investor Class | BIGRX | 14.32% | 11.41% | 8.97% | — | 12/17/90 |
| S&P 500 Index | — | 14.37% | 13.41% | 10.16% | — | — |
| I Class | AMGIX | 14.55% | 11.63% | 9.19% | — | 1/28/98 |
| A Class | AMADX | | | | | 12/15/97 |
| No sales charge | | 14.03% | 11.13% | 8.70% | — | |
| With sales charge | | 7.47% | 9.82% | 8.06% | — | |
| C Class | ACGCX | 13.18% | 10.30% | 7.89% | — | 6/28/01 |
| R Class | AICRX | 13.73% | 10.85% | 8.42% | — | 8/29/03 |
| R5 Class | AICGX | 14.52% | — | — | 13.27% | 4/10/17 |
Average annual returns since inception are presented when ten years of performance history is not available.
Sales charges include initial sales charges and contingent deferred sales charges (CDSCs), as applicable. A Class shares have a 5.75% maximum initial sales charge and may be subject to a maximum CDSC of 1.00%. C Class shares redeemed within 12 months of purchase are subject to a maximum CDSC of 1.00%. The SEC requires that mutual funds provide performance information net of maximum sales charges in all cases where charges could be applied.
Data presented reflect past performance. Past performance is no guarantee of future results. Current performance may be higher or lower than the performance shown. Total returns for periods less than one year are not annualized. Investment return and principal value will fluctuate, and redemption value may be more or less than original cost. Data assumes reinvestment of dividends and capital gains, and none of the charts reflect the deduction of taxes that a shareholder would pay on fund distributions or the redemption of fund shares. To obtain performance data current to the most recent month end, please call 1-800-345-2021 or visit americancentury.com. For additional information about the fund, please consult the prospectus.
|
|
| Growth of $10,000 Over 10 Years |
| $10,000 investment made June 30, 2008 |
| Performance for other share classes will vary due to differences in fee structure. |
|
| |
| Value on June 30, 2018 |
| | Investor Class — $23,614 |
| |
| | S&P 500 Index — $26,340 |
| |
|
| | | | | |
| Total Annual Fund Operating Expenses | |
| Investor Class | I Class | A Class | C Class | R Class | R5 Class |
| 0.67% | 0.47% | 0.92% | 1.67% | 1.17% | 0.47% |
The total annual fund operating expenses shown is as stated in the fund’s prospectus current as of the date of this report. The prospectus may vary from the expense ratio shown elsewhere in this report because it is based on a different time period, includes acquired fund fees and expenses, and, if applicable, does not include fee waivers or expense reimbursements.
Data presented reflect past performance. Past performance is no guarantee of future results. Current performance may be higher or lower than the performance shown. Total returns for periods less than one year are not annualized. Investment return and principal value will fluctuate, and redemption value may be more or less than original cost. Data assumes reinvestment of dividends and capital gains, and none of the charts reflect the deduction of taxes that a shareholder would pay on fund distributions or the redemption of fund shares. To obtain performance data current to the most recent month end, please call 1-800-345-2021 or visit americancentury.com. For additional information about the fund, please consult the prospectus.
Portfolio Managers: Brian Garbe and Claudia Musat
Performance Summary
Income & Growth returned 14.32%* for the fiscal year ended June 30, 2018, compared with the 14.37% return of its benchmark, the S&P 500 Index.
Income & Growth advanced during the fiscal year, performing in line with its benchmark, the S&P 500 Index. Positioning in the industrials, energy, and consumer staples sectors led fund performance, while information technology and real estate positions detracted from relative performance.
Income & Growth’s stock selection process incorporates factors of valuation, quality, growth, and sentiment with a valuation tilt, while striving to minimize unintended risks along industries and other risk characteristics. Within the fund, quality, growth, and sentiment factors contributed, while valuation detracted.
Stock Selection Benefits Returns in Industrials and Energy
Stock choices in industrials drove the fund’s 12-month results. An underweight position to industrial conglomerate General Electric was the top contributor for the period. We have since exited the position. Avoidance of many index positions within the airlines and building products industries also contributed. In addition, stock choices within the electrical equipment, instruments and components industries were also additive.
Within energy, stock decisions made the sector a main contributor to performance. Overweights to oil, gas and consumable fuels industry companies such as HollyFrontier and Valero Energy were major contributors to returns for the fiscal year. Both companies benefited from rising commodity prices throughout the period.
Positioning within consumer staples also benefited relative returns. Underweights to tobacco companies Philip Morris International and Altria Group were additive and were among the top contributors to relative performance for the period. These companies’ stocks have been under pressure due to declining sales stemming from shifting consumer preferences. We have since closed our position in Philip Morris International. Underweights to beverages companies PepsiCo and The Coca-Cola Company also helped returns, as these companies’ sales have also been under pressure from changing consumer tastes. We have since exited these positions. Positioning within food and staples retailing also benefited returns.
Stock Choices in Information Technology, Real Estate, and Health Care Dampen Returns
Stock selection within information technology detracted from relative performance for the period. Within the IT services industry, a lack of exposure relative to the benchmark to payment processing companies Mastercard, Visa, and PayPal Holdings, detracted from relative returns. In software, a lack of exposure to Adobe Systems was the primary detractor. Elsewhere in the sector, an underweight to Facebook hurt relative returns.
*All fund returns referenced in this commentary are for Investor Class shares. Performance for other share classes will vary due to differences in fee structure; when Investor Class performance exceeds that of the fund's benchmark, other share classes may not. See page 3 for returns for all share classes.
Stock selection within real estate also hurt relative results. Investments in equity real estate investment trusts (REITs) struggled in the rising rate environment, dampening returns.
Stock choices within the health care sector also detracted during the period. Stock selection within the health care equipment and supplies industry was the most prominent source of underperformance relative to the benchmark. Elsewhere in the sector, an overweight to CVS Health was a leading detractor, as was positioning among pharmaceutical companies.
Portfolio Positioning
We employ a structured, disciplined investment approach for both stock selection and portfolio construction. We incorporate measures of valuation, quality, growth, and sentiment into our stock-selection process, with the aim of producing consistent long-term performance. We seek to maintain balanced exposure to our fundamentally based, multidimension drivers of stock returns, applying bottom-up research and analysis on individual stocks to determine positioning. As a result of this approach and our risk-control process, which seeks to limit active risk at the sector and industry level, we will have only modest sector overweights/underweights at any given time. At period-end, energy was our largest sector overweight compared with the benchmark. We see opportunity in the sector and added to our holdings during the year. Real estate was another notable sector overweight, reflecting attractive dividend yields consistent with the portfolio’s income mandate. In addition, we continue to maintain our long-time overweight to information technology. We are finding strong investment opportunities along multiple measures of our stock-selection model across many industry groups in the sector, particularly in semiconductors and semiconductor equipment. Conversely, we are comparatively underweight consumer staples and consumer discretionary stocks. Within consumer staples, our underweight is in part due to our underweights to the food and staples retailing and food, beverage, and tobacco industries, which score poorly on multiple factors. The consumer discretionary underweight is driven by a relative lack of exposure to the retailing and media industry groups. These industries score poorly in our factor model, particularly the growth category.
|
| |
| JUNE 30, 2018 |
| Top Ten Holdings | % of net assets |
| Microsoft Corp. | 4.1% |
| Alphabet, Inc.* | 3.7% |
| Apple, Inc. | 3.3% |
| Exxon Mobil Corp. | 2.3% |
| JPMorgan Chase & Co. | 2.2% |
| Amazon.com, Inc. | 2.0% |
| Chevron Corp. | 1.9% |
| Intel Corp. | 1.9% |
| Pfizer, Inc. | 1.8% |
| AT&T, Inc. | 1.7% |
| *Includes all classes of the issuer held by the fund. | |
| | |
| Top Five Industries | % of net assets |
| Oil, Gas and Consumable Fuels | 7.2% |
| Banks | 7.0% |
| Software | 7.0% |
| Pharmaceuticals | 6.9% |
| Semiconductors and Semiconductor Equipment | 6.1% |
| | |
| Types of Investments in Portfolio | % of net assets |
| Common Stocks | 98.7% |
| Temporary Cash Investments | 1.2% |
| Other Assets and Liabilities | 0.1% |
Fund shareholders may incur two types of costs: (1) transaction costs, including sales charges (loads) on purchase payments and redemption/exchange fees; and (2) ongoing costs, including management fees; distribution and service (12b-1) fees; and other fund expenses. This example is intended to help you understand your ongoing costs (in dollars) of investing in your fund and to compare these costs with the ongoing cost of investing in other mutual funds.
The example is based on an investment of $1,000 made at the beginning of the period and held for the entire period from January 1, 2018 to June 30, 2018.
Actual Expenses
The table provides information about actual account values and actual expenses for each class. You may use the information, together with the amount you invested, to estimate the expenses that you paid over the period. First, identify the share class you own. Then simply divide your account value by $1,000 (for example, an $8,600 account value divided by $1,000 = 8.6), then multiply the result by the number under the heading “Expenses Paid During Period” to estimate the expenses you paid on your account during this period.
If you hold Investor Class shares of any American Century Investments fund, or I Class shares of the American Century Diversified Bond Fund, in an American Century Investments account (i.e., not a financial intermediary or retirement plan account), American Century Investments may charge you a $12.50 semiannual account maintenance fee if the value of those shares is less than $10,000. We will redeem shares automatically in one of your accounts to pay the $12.50 fee. In determining your total eligible investment amount, we will include your investments in all personal accounts (including American Century Investments Brokerage accounts) registered under your Social Security number. Personal accounts include individual accounts, joint accounts, UGMA/UTMA accounts, personal trusts, Coverdell Education Savings Accounts and IRAs (including traditional, Roth, Rollover, SEP-, SARSEP- and SIMPLE-IRAs), and certain other retirement accounts. If you have only business, business retirement, employer-sponsored or American Century Investments Brokerage accounts, you are currently not subject to this fee. If you are subject to the Account Maintenance Fee, your account value could be reduced by the fee amount.
Hypothetical Example for Comparison Purposes
The table also provides information about hypothetical account values and hypothetical expenses based on the actual expense ratio of each class of your fund and an assumed rate of return of 5% per year before expenses, which is not the actual return of a fund’s share class. The hypothetical account values and expenses may not be used to estimate the actual ending account balance or expenses you paid for the period. You may use this information to compare the ongoing costs of investing in your fund and other funds. To do so, compare this 5% hypothetical example with the 5% hypothetical examples that appear in the shareholder reports of the other funds.
Please note that the expenses shown in the table are meant to highlight your ongoing costs only and do not reflect any transactional costs, such as sales charges (loads) or redemption/exchange fees. Therefore, the table is useful in comparing ongoing costs only, and will not help you determine the relative total costs of owning different funds. In addition, if these transactional costs were included, your costs would have been higher.
|
| | | | |
| | Beginning
Account Value
1/1/18 | Ending
Account Value
6/30/18 | Expenses Paid
During Period(1)
1/1/18 - 6/30/18 | Annualized
Expense Ratio(1) |
| Actual | | | | |
| Investor Class | $1,000 | $1,015.90 | $3.30 | 0.66% |
| I Class | $1,000 | $1,016.80 | $2.30 | 0.46% |
| A Class | $1,000 | $1,014.80 | $4.55 | 0.91% |
| C Class | $1,000 | $1,011.00 | $8.28 | 1.66% |
| R Class | $1,000 | $1,013.30 | $5.79 | 1.16% |
| R5 Class | $1,000 | $1,016.80 | $2.30 | 0.46% |
| Hypothetical | | | | |
| Investor Class | $1,000 | $1,021.52 | $3.31 | 0.66% |
| I Class | $1,000 | $1,022.51 | $2.31 | 0.46% |
| A Class | $1,000 | $1,020.28 | $4.56 | 0.91% |
| C Class | $1,000 | $1,016.56 | $8.30 | 1.66% |
| R Class | $1,000 | $1,019.04 | $5.81 | 1.16% |
| R5 Class | $1,000 | $1,022.51 | $2.31 | 0.46% |
| |
| (1) | Expenses are equal to the class's annualized expense ratio listed in the table above, multiplied by the average account value over the period, multiplied by 181, the number of days in the most recent fiscal half-year, divided by 365, to reflect the one-half year period. Annualized expense ratio reflects actual expenses, including any applicable fee waivers or expense reimbursements and excluding any acquired fund fees and expenses. |
JUNE 30, 2018
|
| | | | | |
| | Shares | Value |
| COMMON STOCKS — 98.7% | | |
| Aerospace and Defense — 4.5% | | |
| Boeing Co. (The) | 101,297 |
| $ | 33,986,156 |
|
| General Dynamics Corp. | 110,009 |
| 20,506,778 |
|
| Lockheed Martin Corp. | 76,972 |
| 22,739,838 |
|
| Raytheon Co. | 112,573 |
| 21,746,852 |
|
| | | 98,979,624 |
|
| Automobiles — 0.5% | | |
| Ford Motor Co. | 909,702 |
| 10,070,401 |
|
| Banks — 7.0% | | |
| Bank of America Corp. | 920,361 |
| 25,944,977 |
|
| BB&T Corp. | 175,730 |
| 8,863,821 |
|
| JPMorgan Chase & Co. | 477,395 |
| 49,744,559 |
|
| PNC Financial Services Group, Inc. (The) | 52,715 |
| 7,121,796 |
|
| SunTrust Banks, Inc. | 267,806 |
| 17,680,552 |
|
| U.S. Bancorp | 472,691 |
| 23,644,004 |
|
| Wells Fargo & Co. | 420,959 |
| 23,337,967 |
|
| | | 156,337,676 |
|
| Beverages — 0.8% | | |
| Constellation Brands, Inc., Class A | 3,746 |
| 819,887 |
|
| Molson Coors Brewing Co., Class B | 246,102 |
| 16,744,780 |
|
| | | 17,564,667 |
|
| Biotechnology — 4.2% | | |
| AbbVie, Inc. | 329,593 |
| 30,536,791 |
|
| Amgen, Inc. | 165,317 |
| 30,515,865 |
|
Biogen, Inc.(1) | 16,211 |
| 4,705,081 |
|
| Gilead Sciences, Inc. | 373,320 |
| 26,445,989 |
|
| | | 92,203,726 |
|
| Capital Markets — 0.6% | | |
| Affiliated Managers Group, Inc. | 38,940 |
| 5,789,210 |
|
| FactSet Research Systems, Inc. | 33,743 |
| 6,684,488 |
|
| State Street Corp. | 7,937 |
| 738,855 |
|
| | | 13,212,553 |
|
| Chemicals — 3.7% | | |
| Air Products & Chemicals, Inc. | 132,726 |
| 20,669,420 |
|
| Eastman Chemical Co. | 184,738 |
| 18,466,410 |
|
| LyondellBasell Industries NV, Class A | 187,586 |
| 20,606,322 |
|
| Praxair, Inc. | 139,305 |
| 22,031,086 |
|
| | | 81,773,238 |
|
| Communications Equipment — 1.6% | | |
| Cisco Systems, Inc. | 847,906 |
| 36,485,395 |
|
| Consumer Finance — 1.4% | | |
| Discover Financial Services | 194,689 |
| 13,708,053 |
|
|
| | | | | |
| | Shares | Value |
| Synchrony Financial | 533,279 |
| $ | 17,800,853 |
|
| | | 31,508,906 |
|
| Containers and Packaging — 0.8% | | |
| WestRock Co. | 294,303 |
| 16,781,157 |
|
| Diversified Consumer Services — 0.7% | | |
| H&R Block, Inc. | 718,113 |
| 16,358,614 |
|
| Diversified Financial Services — 0.7% | | |
Berkshire Hathaway, Inc., Class B(1) | 85,040 |
| 15,872,716 |
|
| Diversified Telecommunication Services — 2.5% | | |
| AT&T, Inc. | 1,208,287 |
| 38,798,098 |
|
| Verizon Communications, Inc. | 316,233 |
| 15,909,682 |
|
| | | 54,707,780 |
|
| Electric Utilities — 0.5% | | |
| Portland General Electric Co. | 83,563 |
| 3,573,154 |
|
| PPL Corp. | 255,743 |
| 7,301,463 |
|
| | | 10,874,617 |
|
| Electronic Equipment, Instruments and Components — 0.7% | | |
| National Instruments Corp. | 391,263 |
| 16,425,221 |
|
| Energy Equipment and Services — 1.8% | | |
| Halliburton Co. | 474,241 |
| 21,369,299 |
|
| Schlumberger Ltd. | 289,386 |
| 19,397,544 |
|
| | | 40,766,843 |
|
| Equity Real Estate Investment Trusts (REITs) — 5.3% | | |
| Apple Hospitality REIT, Inc. | 570,778 |
| 10,205,511 |
|
| Kimco Realty Corp. | 767,414 |
| 13,038,364 |
|
| Lexington Realty Trust | 386,723 |
| 3,376,092 |
|
| Park Hotels & Resorts, Inc. | 345,149 |
| 10,571,914 |
|
| Select Income REIT | 582,658 |
| 13,092,325 |
|
| Senior Housing Properties Trust | 957,309 |
| 17,317,720 |
|
| Tanger Factory Outlet Centers, Inc. | 297,437 |
| 6,986,795 |
|
| VEREIT, Inc. | 2,350,782 |
| 17,489,818 |
|
| Weingarten Realty Investors | 339,918 |
| 10,472,873 |
|
| Weyerhaeuser Co. | 224,361 |
| 8,180,202 |
|
| WP Carey, Inc. | 96,541 |
| 6,405,495 |
|
| | | 117,137,109 |
|
| Food Products — 0.8% | | |
| Hershey Co. (The) | 65,142 |
| 6,062,115 |
|
| Mondelez International, Inc., Class A | 282,198 |
| 11,570,118 |
|
| | | 17,632,233 |
|
| Health Care Equipment and Supplies — 1.3% | | |
| Abbott Laboratories | 183,202 |
| 11,173,490 |
|
| Medtronic plc | 217,874 |
| 18,652,193 |
|
| | | 29,825,683 |
|
| Health Care Providers and Services — 1.3% | | |
| Cigna Corp. | 13,052 |
| 2,218,187 |
|
| CVS Health Corp. | 98,826 |
| 6,359,453 |
|
| | | |
|
| | | | | |
| | Shares | Value |
| UnitedHealth Group, Inc. | 87,369 |
| $ | 21,435,111 |
|
| | | 30,012,751 |
|
| Hotels, Restaurants and Leisure — 1.3% | | |
| Las Vegas Sands Corp. | 264,411 |
| 20,190,424 |
|
| Marriott International, Inc., Class A | 61,733 |
| 7,815,398 |
|
| | | 28,005,822 |
|
| Household Durables — 0.8% | | |
| Garmin Ltd. | 285,494 |
| 17,415,134 |
|
| Household Products — 1.0% | | |
| Kimberly-Clark Corp. | 200,408 |
| 21,110,979 |
|
| Procter & Gamble Co. (The) | 17,586 |
| 1,372,763 |
|
| | | 22,483,742 |
|
| Industrial Conglomerates — 0.7% | | |
| 3M Co. | 1,895 |
| 372,785 |
|
| Honeywell International, Inc. | 110,486 |
| 15,915,508 |
|
| | | 16,288,293 |
|
| Insurance — 2.2% | | |
| Allstate Corp. (The) | 65,013 |
| 5,933,737 |
|
| Assurant, Inc. | 54,353 |
| 5,624,992 |
|
| First American Financial Corp. | 139,011 |
| 7,189,649 |
|
| Hartford Financial Services Group, Inc. (The) | 201,030 |
| 10,278,664 |
|
| MetLife, Inc. | 464,202 |
| 20,239,207 |
|
| | | 49,266,249 |
|
| Internet and Direct Marketing Retail — 2.0% | | |
Amazon.com, Inc.(1) | 26,544 |
| 45,119,491 |
|
| Internet Software and Services — 5.6% | | |
Alphabet, Inc., Class A(1) | 65,512 |
| 73,975,495 |
|
Alphabet, Inc., Class C(1) | 7,240 |
| 8,077,306 |
|
Facebook, Inc., Class A(1) | 132,941 |
| 25,833,095 |
|
| LogMeIn, Inc. | 151,234 |
| 15,614,911 |
|
| | | 123,500,807 |
|
| IT Services — 2.0% | | |
| Accenture plc, Class A | 7,698 |
| 1,259,316 |
|
| Broadridge Financial Solutions, Inc. | 19,689 |
| 2,266,204 |
|
| International Business Machines Corp. | 200,458 |
| 28,003,983 |
|
| MAXIMUS, Inc. | 87,503 |
| 5,434,811 |
|
| Visa, Inc., Class A | 63,516 |
| 8,412,694 |
|
| | | 45,377,008 |
|
| Machinery — 3.2% | | |
| Caterpillar, Inc. | 187,821 |
| 25,481,675 |
|
| Cummins, Inc. | 101,743 |
| 13,531,819 |
|
| Ingersoll-Rand plc | 221,255 |
| 19,853,211 |
|
| PACCAR, Inc. | 65,342 |
| 4,048,590 |
|
| Toro Co. (The) | 149,166 |
| 8,987,252 |
|
| | | 71,902,547 |
|
| Mortgage Real Estate Investment Trusts (REITs) — 1.1% | | |
| Chimera Investment Corp. | 403,398 |
| 7,374,116 |
|
|
| | | | | |
| | Shares | Value |
| Two Harbors Investment Corp. | 1,073,549 |
| $ | 16,962,074 |
|
| | | 24,336,190 |
|
| Multiline Retail — 1.0% | | |
| Kohl's Corp. | 291,533 |
| 21,252,756 |
|
| Oil, Gas and Consumable Fuels — 7.2% | | |
| Chevron Corp. | 329,164 |
| 41,616,204 |
|
| Exxon Mobil Corp. | 610,945 |
| 50,543,480 |
|
| HollyFrontier Corp. | 208,481 |
| 14,266,355 |
|
| Marathon Petroleum Corp. | 267,117 |
| 18,740,929 |
|
| Phillips 66 | 145,274 |
| 16,315,723 |
|
| Valero Energy Corp. | 167,081 |
| 18,517,587 |
|
| | | 160,000,278 |
|
| Pharmaceuticals — 6.9% | | |
| Allergan plc | 111,551 |
| 18,597,783 |
|
| Bristol-Myers Squibb Co. | 477,667 |
| 26,434,092 |
|
| Eli Lilly & Co. | 226,934 |
| 19,364,278 |
|
| Johnson & Johnson | 200,331 |
| 24,308,163 |
|
| Merck & Co., Inc. | 380,807 |
| 23,114,985 |
|
| Pfizer, Inc. | 1,115,858 |
| 40,483,328 |
|
| | | 152,302,629 |
|
| Road and Rail — 0.8% | | |
| Ryder System, Inc. | 254,590 |
| 18,294,837 |
|
| Semiconductors and Semiconductor Equipment — 6.1% | | |
| Applied Materials, Inc. | 441,069 |
| 20,372,977 |
|
| Broadcom, Inc. | 54,351 |
| 13,187,727 |
|
| Intel Corp. | 831,099 |
| 41,313,931 |
|
| KLA-Tencor Corp. | 85,497 |
| 8,766,007 |
|
| Lam Research Corp. | 36,106 |
| 6,240,922 |
|
| QUALCOMM, Inc. | 267,490 |
| 15,011,539 |
|
| Skyworks Solutions, Inc. | 31,419 |
| 3,036,646 |
|
| Texas Instruments, Inc. | 240,530 |
| 26,518,433 |
|
| | | 134,448,182 |
|
| Software — 7.0% | | |
| Activision Blizzard, Inc. | 323,702 |
| 24,704,937 |
|
| CA, Inc. | 21,940 |
| 782,161 |
|
| Intuit, Inc. | 51,157 |
| 10,451,631 |
|
| Microsoft Corp. | 913,950 |
| 90,124,609 |
|
| Oracle Corp. (New York) | 646,580 |
| 28,488,315 |
|
| | | 154,551,653 |
|
| Specialty Retail — 1.4% | | |
| Best Buy Co., Inc. | 241,298 |
| 17,996,005 |
|
| Ross Stores, Inc. | 147,994 |
| 12,542,491 |
|
| | | 30,538,496 |
|
| Technology Hardware, Storage and Peripherals — 4.2% | | |
| Apple, Inc. | 400,013 |
| 74,046,407 |
|
| Seagate Technology plc | 321,205 |
| 18,138,446 |
|
| | | 92,184,853 |
|
|
| | | | | |
| | Shares | Value |
| Textiles, Apparel and Luxury Goods — 1.8% | | |
| Ralph Lauren Corp. | 3,780 |
| $ | 475,222 |
|
| Tapestry, Inc. | 409,214 |
| 19,114,386 |
|
| VF Corp. | 250,350 |
| 20,408,532 |
|
| | | 39,998,140 |
|
| Tobacco — 1.2% | | |
| Altria Group, Inc. | 475,327 |
| 26,993,820 |
|
| Trading Companies and Distributors — 0.5% | | |
| W.W. Grainger, Inc. | 35,776 |
| 11,033,318 |
|
TOTAL COMMON STOCKS
(Cost $1,681,798,776) | | 2,189,825,155 |
|
| TEMPORARY CASH INVESTMENTS — 1.2% | | |
| Repurchase Agreement, BMO Capital Markets Corp., (collateralized by various U.S. Treasury obligations, 1.375% - 3.75%, 2/15/19 - 11/15/47, valued at $15,188,202), in a joint trading account at 1.75%, dated 6/29/18, due 7/2/18 (Delivery value $14,883,758) | | 14,881,588 |
|
| Repurchase Agreement, Fixed Income Clearing Corp., (collateralized by various U.S. Treasury obligations, 2.75%, 2/15/28, valued at $12,653,321), at 0.90%, dated 6/29/18, due 7/2/18 (Delivery value $12,403,930) | | 12,403,000 |
|
| State Street Institutional U.S. Government Money Market Fund, Premier Class | 114,997 |
| 114,997 |
|
TOTAL TEMPORARY CASH INVESTMENTS
(Cost $27,399,585) | | 27,399,585 |
|
TOTAL INVESTMENT SECURITIES — 99.9%
(Cost $1,709,198,361) | | 2,217,224,740 |
|
| OTHER ASSETS AND LIABILITIES — 0.1% | | 2,529,424 |
|
| TOTAL NET ASSETS — 100.0% | | $ | 2,219,754,164 |
|
|
| | |
| NOTES TO SCHEDULE OF INVESTMENTS |
See Notes to Financial Statements.
|
|
| Statement of Assets and Liabilities |
|
| | | |
| JUNE 30, 2018 | |
| Assets | |
| Investment securities, at value (cost of $1,709,198,361) | $ | 2,217,224,740 |
|
| Receivable for capital shares sold | 899,443 |
|
| Dividends and interest receivable | 4,022,992 |
|
| | 2,222,147,175 |
|
| | |
| Liabilities | |
| Payable for capital shares redeemed | 1,167,093 |
|
| Accrued management fees | 1,175,382 |
|
| Distribution and service fees payable | 50,536 |
|
| | 2,393,011 |
|
| | |
| Net Assets | $ | 2,219,754,164 |
|
| | |
| Net Assets Consist of: | |
| Capital (par value and paid-in surplus) | $ | 1,562,247,282 |
|
| Undistributed net investment income | 2,543,974 |
|
| Undistributed net realized gain | 146,936,529 |
|
| Net unrealized appreciation | 508,026,379 |
|
| | $ | 2,219,754,164 |
|
|
| | | | | | |
| | Net Assets | Shares Outstanding | Net Asset Value Per Share |
| Investor Class, $0.01 Par Value |
| $1,751,738,301 |
| 44,226,425 |
| $39.61 |
| I Class, $0.01 Par Value |
| $274,687,361 |
| 6,926,050 |
| $39.66 |
| A Class, $0.01 Par Value |
| $155,232,525 |
| 3,924,921 |
| $39.55* |
| C Class, $0.01 Par Value |
| $8,556,503 |
| 216,733 |
| $39.48 |
| R Class, $0.01 Par Value |
| $25,298,331 |
| 638,930 |
| $39.59 |
| R5 Class, $0.01 Par Value |
| $4,241,143 |
| 106,925 |
| $39.66 |
*Maximum offering price $41.96 (net asset value divided by 0.9425).
See Notes to Financial Statements.
|
| | | |
| YEAR ENDED JUNE 30, 2018 | |
| Investment Income (Loss) | |
| Income: | |
| Dividends (net of foreign taxes withheld of $78,568) | $ | 65,566,920 |
|
| Interest | 172,607 |
|
| | 65,739,527 |
|
| | |
| Expenses: | |
| Management fees | 13,937,029 |
|
| Distribution and service fees: | |
| A Class | 400,562 |
|
| C Class | 76,830 |
|
| R Class | 139,683 |
|
| Directors' fees and expenses | 133,779 |
|
| | 14,687,883 |
|
| | |
| Net investment income (loss) | 51,051,644 |
|
| | |
| Realized and Unrealized Gain (Loss) | |
| Net realized gain (loss) on investment transactions | 180,526,468 |
|
| Change in net unrealized appreciation (depreciation) on investments | 58,020,952 |
|
| | |
| Net realized and unrealized gain (loss) | 238,547,420 |
|
| | |
| Net Increase (Decrease) in Net Assets Resulting from Operations | $ | 289,599,064 |
|
See Notes to Financial Statements.
|
|
| Statement of Changes in Net Assets |
|
| | | | | | |
| YEARS ENDED JUNE 30, 2018 AND JUNE 30, 2017 |
| Increase (Decrease) in Net Assets | June 30, 2018 | June 30, 2017 |
| Operations | | |
| Net investment income (loss) | $ | 51,051,644 |
| $ | 43,921,020 |
|
| Net realized gain (loss) | 180,526,468 |
| 166,356,130 |
|
| Change in net unrealized appreciation (depreciation) | 58,020,952 |
| 90,199,587 |
|
| Net increase (decrease) in net assets resulting from operations | 289,599,064 |
| 300,476,737 |
|
| | | |
| Distributions to Shareholders | | |
| From net investment income: | | |
| Investor Class | (39,274,876 | ) | (34,419,168 | ) |
| I Class | (5,820,706 | ) | (3,932,048 | ) |
| A Class | (3,170,464 | ) | (3,421,166 | ) |
| C Class | (93,791 | ) | (78,600 | ) |
| R Class | (480,039 | ) | (415,721 | ) |
| R5 Class | (39,086 | ) | (876 | ) |
| From net realized gains: | | |
| Investor Class | (115,716,614 | ) | (26,526,679 | ) |
| I Class | (17,297,217 | ) | (2,969,981 | ) |
| A Class | (10,744,526 | ) | (3,357,390 | ) |
| C Class | (492,924 | ) | (117,408 | ) |
| R Class | (1,858,973 | ) | (400,365 | ) |
| R5 Class | (70,441 | ) | — |
|
| Decrease in net assets from distributions | (195,059,657 | ) | (75,639,402 | ) |
| | | |
| Capital Share Transactions | | |
| Net increase (decrease) in net assets from capital share transactions (Note 5) | 60,088,088 |
| (74,413,641 | ) |
| | | |
| Net increase (decrease) in net assets | 154,627,495 |
| 150,423,694 |
|
| | | |
| Net Assets | | |
| Beginning of period | 2,065,126,669 |
| 1,914,702,975 |
|
| End of period | $ | 2,219,754,164 |
| $ | 2,065,126,669 |
|
| | | |
| Undistributed net investment income | $ | 2,543,974 |
| $ | 1,615,488 |
|
See Notes to Financial Statements.
|
|
| Notes to Financial Statements |
JUNE 30, 2018
1. Organization
American Century Quantitative Equity Funds, Inc. (the corporation) is registered under the Investment Company Act of 1940, as amended (the 1940 Act), as an open-end management investment company and is organized as a Maryland corporation. Income & Growth Fund (the fund) is one fund in a series issued by the corporation. The fund’s investment objective is to seek long-term capital growth by investing in common stocks. Income is a secondary objective.
The fund offers the Investor Class, I Class, A Class, C Class, R Class and R5 Class. The A Class may incur an initial sales charge. The A Class and C Class may be subject to a contingent deferred sales charge. Sale of the R5 Class commenced on April 10, 2017.
2. Significant Accounting Policies
The following is a summary of significant accounting policies consistently followed by the fund in preparation of its financial statements. The fund is an investment company and follows accounting and reporting guidance in accordance with accounting principles generally accepted in the United States of America. This may require management to make certain estimates and assumptions at the date of the financial statements. Actual results could differ from these estimates. Management evaluated the impact of events or transactions occurring through the date the financial statements were issued that would merit recognition or disclosure.
Investment Valuations — The fund determines the fair value of its investments and computes its net asset value per share at the close of regular trading (usually 4 p.m. Eastern time) on the New York Stock Exchange (NYSE) on each day the NYSE is open. The Board of Directors has adopted valuation policies and procedures to guide the investment advisor in the fund’s investment valuation process and to provide methodologies for the oversight of the fund’s pricing function.
Equity securities that are listed or traded on a domestic securities exchange are valued at the last reported sales price or at the official closing price as provided by the exchange. Equity securities traded on foreign securities exchanges are generally valued at the closing price of such securities on the exchange where primarily traded or at the close of the NYSE, if that is earlier. If no last sales price is reported, or if local convention or regulation so provides, the mean of the latest bid and asked prices may be used. Securities traded over-the-counter are valued at the mean of the latest bid and asked prices, the last sales price, or the official closing price.
Open-end management investment companies are valued at the reported net asset value per share. Repurchase agreements are valued at cost, which approximates fair value.
If the fund determines that the market price for an investment is not readily available or the valuation methods mentioned above do not reflect an investment’s fair value, such investment is valued as determined in good faith by the Board of Directors or its delegate, in accordance with policies and procedures adopted by the Board of Directors. In its determination of fair value, the fund may review several factors including, but not limited to, market information regarding the specific investment or comparable investments and correlation with other investment types, futures indices or general market indicators. Circumstances that may cause the fund to use these procedures to value an investment include, but are not limited to: an investment has been declared in default or is distressed; trading in a security has been suspended during the trading day or a security is not actively trading on its principal exchange; prices received from a regular pricing source are deemed unreliable; or there is a foreign market holiday and no trading occurred.
The fund monitors for significant events occurring after the close of an investment’s primary exchange but before the fund’s net asset value per share is determined. Significant events may include, but are not limited to: corporate announcements and transactions; governmental action and political unrest that could impact a specific investment or an investment sector; or armed conflicts, natural disasters and similar events that could affect investments in a specific country or region. The fund also monitors for significant fluctuations between domestic and foreign markets, as evidenced by the U.S. market or such other indicators that the Board of Directors, or its delegate, deems appropriate. If significant fluctuations in foreign markets are identified, the
fund may apply a model-derived factor to the closing price of equity securities traded on foreign securities exchanges. The factor is based on observable market data as provided by an independent pricing service.
Security Transactions — Security transactions are accounted for as of the trade date. Net realized gains and losses are determined on the identified cost basis, which is also used for federal income tax purposes.
Investment Income — Dividend income less foreign taxes withheld, if any, is recorded as of the ex-dividend date. Distributions received on securities that represent a return of capital or long-term capital gain are recorded as a reduction of cost of investments and/or as a realized gain. The fund may estimate the components of distributions received that may be considered nontaxable distributions or long-term capital gain distributions for income tax purposes. Interest income is recorded on the accrual basis and includes accretion of discounts and amortization of premiums.
Repurchase Agreements — The fund may enter into repurchase agreements with institutions that American Century Investment Management, Inc. (ACIM) (the investment advisor) has determined are creditworthy pursuant to criteria adopted by the Board of Directors. The fund requires that the collateral, represented by securities, received in a repurchase transaction be transferred to the custodian in a manner sufficient to enable the fund to obtain those securities in the event of a default under the repurchase agreement. ACIM monitors, on a daily basis, the securities transferred to ensure the value, including accrued interest, of the securities under each repurchase agreement is equal to or greater than amounts owed to the fund under each repurchase agreement.
Joint Trading Account — Pursuant to an Exemptive Order issued by the Securities and Exchange Commission, the fund, along with certain other funds in the American Century Investments family of funds, may transfer uninvested cash balances into a joint trading account. These balances are invested in one or more repurchase agreements that are collateralized by U.S. Treasury or Agency obligations.
Income Tax Status — It is the fund’s policy to distribute substantially all net investment income and net realized gains to shareholders and to otherwise qualify as a regulated investment company under provisions of the Internal Revenue Code. Accordingly, no provision has been made for income taxes. The fund files U.S. federal, state, local and non-U.S. tax returns as applicable. The fund's tax returns are subject to examination by the relevant taxing authority until expiration of the applicable statute of limitations, which is generally three years from the date of filing but can be longer in certain jurisdictions. At this time, management believes there are no uncertain tax positions which, based on their technical merit, would not be sustained upon examination and for which it is reasonably possible that the total amounts of unrecognized tax benefits will significantly change in the next twelve months.
Multiple Class — All shares of the fund represent an equal pro rata interest in the net assets of the class to which such shares belong, and have identical voting, dividend, liquidation and other rights and the same terms and conditions, except for class specific expenses and exclusive rights to vote on matters affecting only individual classes. Income, non-class specific expenses, and realized and unrealized capital gains and losses of the fund are allocated to each class of shares based on their relative net assets.
Distributions to Shareholders — Distributions from net investment income, if any, are generally declared and paid quarterly. Distributions from net realized gains, if any, are generally declared and paid annually.
Indemnifications — Under the corporation’s organizational documents, its officers and directors are indemnified against certain liabilities arising out of the performance of their duties to the fund. In addition, in the normal course of business, the fund enters into contracts that provide general indemnifications. The maximum exposure under these arrangements is unknown as this would involve future claims that may be made against a fund. The risk of material loss from such claims is considered by management to be remote.
3. Fees and Transactions with Related Parties
Certain officers and directors of the corporation are also officers and/or directors of American Century Companies, Inc. (ACC). The corporation’s investment advisor, ACIM, the corporation's distributor, American Century Investment Services, Inc. (ACIS), and the corporation’s transfer agent, American Century Services, LLC, are wholly owned, directly or indirectly, by ACC.
Management Fees — The corporation has entered into a management agreement with ACIM, under which ACIM provides the fund with investment advisory and management services in exchange for a single, unified management fee (the fee) per class. The agreement provides that all expenses of managing and operating the fund, except distribution and service fees, brokerage expenses, taxes, interest, fees and expenses of the
independent directors (including legal counsel fees), and extraordinary expenses, will be paid by ACIM. The fee is computed and accrued daily based on each class's daily net assets and paid monthly in arrears. The difference in the fee among the classes is a result of their separate arrangements for non-Rule 12b-1 shareholder services. It is not the result of any difference in advisory or custodial fees or other expenses related to the management of the fund's assets, which do not vary by class. The fee consists of (1) an Investment Category Fee based on the daily net assets of the fund and certain other accounts managed by the investment advisor that are in the same broad investment category as the fund and (2) a Complex Fee based on the assets of all the funds in the American Century Investments family of funds.
The Investment Category Fee range, the Complex Fee range and the effective annual management fee for each class for the period ended June 30, 2018 are as follows:
|
| | | |
| | Investment Category Fee Range | Complex Fee Range | Effective Annual Management Fee |
| Investor Class | 0.3380% to 0.5200% | 0.2500% to 0.3100% | 0.66% |
| I Class | 0.0500% to 0.1100% | 0.46% |
| A Class | 0.2500% to 0.3100% | 0.66% |
| C Class | 0.2500% to 0.3100% | 0.66% |
| R Class | 0.2500% to 0.3100% | 0.66% |
| R5 Class | 0.0500% to 0.1100% | 0.46% |
Distribution and Service Fees — The Board of Directors has adopted a separate Master Distribution and Individual Shareholder Services Plan for each of the A Class, C Class and R Class (collectively the plans), pursuant to Rule 12b-1 of the 1940 Act. The plans provide that the A Class will pay ACIS an annual distribution and service fee of 0.25%. The plans provide that the C Class will pay ACIS an annual distribution and service fee of 1.00%, of which 0.25% is paid for individual shareholder services and 0.75% is paid for distribution services. The plans provide that the R Class will pay ACIS an annual distribution and service fee of 0.50%. The fees are computed and accrued daily based on each class’s daily net assets and paid monthly in arrears. The fees are used to pay financial intermediaries for distribution and individual shareholder services. Fees incurred under the plans during the period ended June 30, 2018 are detailed in the Statement of Operations.
Directors' Fees and Expenses — The Board of Directors is responsible for overseeing the investment advisor’s management and operations of the fund. The directors receive detailed information about the fund and its investment advisor regularly throughout the year, and meet at least quarterly with management of the investment advisor to review reports about fund operations. The fund’s officers do not receive compensation from the fund.
Interfund Transactions — The fund may enter into security transactions with other American Century Investments funds and other client accounts of the investment advisor, in accordance with the 1940 Act rules and procedures adopted by the Board of Directors. The rules and procedures require, among other things, that these transactions be effected at the independent current market price of the security. During the period, the interfund purchases and sales were $12,384,362 and $13,940,859, respectively. The effect of interfund transactions on the Statement of Operations was $289,017 in net realized gain (loss) on investment transactions.
4. Investment Transactions
Purchases and sales of investment securities, excluding short-term investments, for the period ended June 30, 2018 were $1,660,913,265 and $1,748,708,520, respectively.
5. Capital Share Transactions
Transactions in shares of the fund were as follows:
|
| | | | | | | | | | |
| | Year ended June 30, 2018 | Year ended June 30, 2017(1) |
| | Shares | Amount | Shares | Amount |
| Investor Class/Shares Authorized | 370,000,000 |
| | 370,000,000 |
| |
| Sold | 3,270,833 |
| $ | 128,998,737 |
| 3,084,504 |
| $ | 111,718,105 |
|
| Issued in reinvestment of distributions | 3,770,568 |
| 148,574,725 |
| 1,597,377 |
| 58,360,090 |
|
| Redeemed | (7,433,451 | ) | (293,866,762 | ) | (5,816,135 | ) | (211,734,127 | ) |
| | (392,050 | ) | (16,293,300 | ) | (1,134,254 | ) | (41,655,932 | ) |
| I Class/Shares Authorized | 40,000,000 |
| | 40,000,000 |
| |
| Sold | 2,780,758 |
| 110,115,067 |
| 3,717,548 |
| 136,630,528 |
|
| Issued in reinvestment of distributions | 582,477 |
| 22,993,886 |
| 188,583 |
| 6,896,938 |
|
| Redeemed | (1,223,728 | ) | (48,844,162 | ) | (2,878,847 | ) | (106,659,157 | ) |
| | 2,139,507 |
| 84,264,791 |
| 1,027,284 |
| 36,868,309 |
|
| A Class/Shares Authorized | 50,000,000 |
| | 50,000,000 |
| |
| Sold | 522,616 |
| 20,782,157 |
| 818,053 |
| 29,492,371 |
|
| Issued in reinvestment of distributions | 321,189 |
| 12,629,052 |
| 174,011 |
| 6,335,289 |
|
| Redeemed | (1,063,137 | ) | (42,165,557 | ) | (2,911,497 | ) | (107,408,127 | ) |
| | (219,332 | ) | (8,754,348 | ) | (1,919,433 | ) | (71,580,467 | ) |
| C Class/Shares Authorized | 15,000,000 |
| | 15,000,000 |
| |
| Sold | 64,499 |
| 2,548,008 |
| 41,848 |
| 1,525,253 |
|
| Issued in reinvestment of distributions | 12,980 |
| 508,562 |
| 4,561 |
| 165,960 |
|
| Redeemed | (55,721 | ) | (2,197,171 | ) | (50,565 | ) | (1,861,809 | ) |
| | 21,758 |
| 859,399 |
| (4,156 | ) | (170,596 | ) |
| R Class/Shares Authorized | 20,000,000 |
| | 20,000,000 |
| |
| Sold | 178,677 |
| 7,068,133 |
| 306,714 |
| 11,145,580 |
|
| Issued in reinvestment of distributions | 19,416 |
| 763,688 |
| 7,605 |
| 277,704 |
|
| Redeemed | (299,498 | ) | (11,926,030 | ) | (260,870 | ) | (9,471,903 | ) |
| | (101,405 | ) | (4,094,209 | ) | 53,449 |
| 1,951,381 |
|
| R5 Class/Shares Authorized | 50,000,000 |
| | 50,000,000 |
| |
| Sold | 107,538 |
| 4,314,570 |
| 4,673 |
| 175,683 |
|
| Issued in reinvestment of distributions | 2,762 |
| 109,527 |
| 23 |
| 876 |
|
| Redeemed | (7,995 | ) | (318,342 | ) | (76 | ) | (2,895 | ) |
| | 102,305 |
| 4,105,755 |
| 4,620 |
| 173,664 |
|
| Net increase (decrease) | 1,550,783 |
| $ | 60,088,088 |
| (1,972,490 | ) | $ | (74,413,641 | ) |
| |
| (1) | April 10, 2017 (commencement of sale) through June 30, 2017 for the R5 Class. |
6. Fair Value Measurements
The fund’s investments valuation process is based on several considerations and may use multiple inputs to determine the fair value of the investments held by the fund. In conformity with accounting principles generally accepted in the United States of America, the inputs used to determine a valuation are classified into three broad levels.
| |
| • | Level 1 valuation inputs consist of unadjusted quoted prices in an active market for identical investments. |
| |
| • | Level 2 valuation inputs consist of direct or indirect observable market data (including quoted prices for comparable investments, evaluations of subsequent market events, interest rates, prepayment speeds, credit risk, etc.). These inputs also consist of quoted prices for identical investments initially expressed in local currencies that are adjusted through translation into U.S. dollars. |
| |
| • | Level 3 valuation inputs consist of unobservable data (including a fund’s own assumptions). |
The level classification is based on the lowest level input that is significant to the fair valuation measurement. The valuation inputs are not necessarily an indication of the risks associated with investing in these securities or other financial instruments. There were no significant transfers between levels during the period.
The following is a summary of the level classifications as of period end. The Schedule of Investments provides additional information on the fund’s portfolio holdings.
|
| | | | | | | | |
| | Level 1 | Level 2 | Level 3 |
| Assets | | | |
| Investment Securities | | | |
| Common Stocks | $ | 2,189,825,155 |
| — |
| — |
|
| Temporary Cash Investments | 114,997 |
| $ | 27,284,588 |
| — |
|
| | $ | 2,189,940,152 |
| $ | 27,284,588 |
| — |
|
7. Federal Tax Information
The tax character of distributions paid during the years ended June 30, 2018 and June 30, 2017 were as follows:
|
| | | | | | |
| | 2018 | 2017 |
| Distributions Paid From | | |
| Ordinary income | $ | 95,582,825 |
| $ | 57,377,754 |
|
| Long-term capital gains | $ | 99,476,832 |
| $ | 18,261,648 |
|
The book-basis character of distributions made during the year from net investment income or net realized gains may differ from their ultimate characterization for federal income tax purposes. These differences reflect the differing character of certain income items and net realized gains and losses for financial statement and tax purposes, and may result in reclassification among certain capital accounts on the financial statements.
As of period end, the federal tax cost of investments and the components of distributable earnings on a tax-basis were as follows:
|
| | | |
| Federal tax cost of investments | $ | 1,707,697,853 |
|
| Gross tax appreciation of investments | $ | 564,932,277 |
|
| Gross tax depreciation of investments | (55,405,390 | ) |
| Net tax appreciation (depreciation) of investments | $ | 509,526,887 |
|
| Undistributed ordinary income | $ | 28,954,781 |
|
| Accumulated long-term gains | $ | 119,025,214 |
|
The difference between book-basis and tax-basis unrealized appreciation (depreciation) is attributable
primarily to the tax deferral of losses on wash sales and the return of capital dividends received.
|
| | | | | | | | | | | | | | | |
| For a Share Outstanding Throughout the Years Ended June 30 (except as noted) |
| Per-Share Data | | | | | | | Ratios and Supplemental Data |
| | | Income From Investment Operations: | Distributions From: | | | Ratio to Average Net Assets of: | | |
| | Net Asset Value, Beginning of Period | Net Investment Income (Loss)(1) | Net Realized and Unrealized Gain (Loss) | Total From Investment Operations | Net Investment Income | Net
Realized
Gains | Total
Distributions | Net Asset Value, End of Period | Total Return(2) | Operating Expenses | Net Investment Income (Loss) | Portfolio Turnover Rate | Net Assets, End of Period (in thousands) |
| Investor Class | | | | | | | | | | | |
| 2018 | $37.90 | 0.93 | 4.40 | 5.33 | (0.88) | (2.74) | (3.62) | $39.61 | 14.32% | 0.66% | 2.33% | 77% |
| $1,751,738 |
|
| 2017 | $33.91 | 0.79 | 4.55 | 5.34 | (0.76) | (0.59) | (1.35) | $37.90 | 15.95% | 0.67% | 2.16% | 81% |
| $1,691,048 |
|
| 2016 | $36.78 | 0.82 | (0.61) | 0.21 | (0.84) | (2.24) | (3.08) | $33.91 | 1.00% | 0.68% | 2.40% | 79% |
| $1,551,664 |
|
| 2015 | $38.52 | 0.81 | 0.29 | 1.10 | (0.79) | (2.05) | (2.84) | $36.78 | 2.87% | 0.67% | 2.11% | 79% |
| $1,655,693 |
|
| 2014 | $31.58 | 0.77 | 6.95 | 7.72 | (0.78) | — | (0.78) | $38.52 | 24.66% | 0.67% | 2.17% | 76% |
| $1,708,291 |
|
| I Class | | | | | | | | | | | |
| 2018 | $37.94 | 0.99 | 4.43 | 5.42 | (0.96) | (2.74) | (3.70) | $39.66 | 14.55% | 0.46% | 2.53% | 77% |
| $274,687 |
|
| 2017 | $33.95 | 0.86 | 4.55 | 5.41 | (0.83) | (0.59) | (1.42) | $37.94 | 16.16% | 0.47% | 2.36% | 81% |
| $181,620 |
|
| 2016 | $36.82 | 0.88 | (0.60) | 0.28 | (0.91) | (2.24) | (3.15) | $33.95 | 1.21% | 0.48% | 2.60% | 79% |
| $127,626 |
|
| 2015 | $38.55 | 0.88 | 0.30 | 1.18 | (0.86) | (2.05) | (2.91) | $36.82 | 3.10% | 0.47% | 2.31% | 79% |
| $125,872 |
|
| 2014 | $31.61 | 0.84 | 6.95 | 7.79 | (0.85) | — | (0.85) | $38.55 | 24.89% | 0.47% | 2.37% | 76% |
| $89,218 |
|
| A Class | | | | | | | | | | | | | |
| 2018 | $37.85 | 0.83 | 4.39 | 5.22 | (0.78) | (2.74) | (3.52) | $39.55 | 14.03% | 0.91% | 2.08% | 77% |
| $155,233 |
|
| 2017 | $33.87 | 0.69 | 4.55 | 5.24 | (0.67) | (0.59) | (1.26) | $37.85 | 15.65% | 0.92% | 1.91% | 81% |
| $156,863 |
|
| 2016 | $36.74 | 0.73 | (0.61) | 0.12 | (0.75) | (2.24) | (2.99) | $33.87 | 0.75% | 0.93% | 2.15% | 79% |
| $205,390 |
|
| 2015 | $38.48 | 0.71 | 0.29 | 1.00 | (0.69) | (2.05) | (2.74) | $36.74 | 2.62% | 0.92% | 1.86% | 79% |
| $239,515 |
|
| 2014 | $31.55 | 0.68 | 6.94 | 7.62 | (0.69) | — | (0.69) | $38.48 | 24.34% | 0.92% | 1.92% | 76% |
| $232,471 |
|
|
| | | | | | | | | | | | | | | |
| For a Share Outstanding Throughout the Years Ended June 30 (except as noted) |
| Per-Share Data | | | | | | | Ratios and Supplemental Data |
| | | Income From Investment Operations: | Distributions From: | | | Ratio to Average Net Assets of: | | |
| | Net Asset Value, Beginning of Period | Net Investment Income (Loss)(1) | Net Realized and Unrealized Gain (Loss) | Total From Investment Operations | Net Investment Income | Net
Realized
Gains | Total
Distributions | Net Asset Value, End of Period | Total Return(2) | Operating Expenses | Net Investment Income (Loss) | Portfolio Turnover Rate | Net Assets, End of Period (in thousands) |
| C Class | | | | | | | | | | | | | |
| 2018 | $37.79 | 0.53 | 4.39 | 4.92 | (0.49) | (2.74) | (3.23) | $39.48 | 13.18% | 1.66% | 1.33% | 77% |
| $8,557 |
|
| 2017 | $33.82 | 0.42 | 4.53 | 4.95 | (0.39) | (0.59) | (0.98) | $37.79 | 14.77% | 1.67% | 1.16% | 81% |
| $7,368 |
|
| 2016 | $36.68 | 0.47 | (0.60) | (0.13) | (0.49) | (2.24) | (2.73) | $33.82 | 0.01% | 1.68% | 1.40% | 79% |
| $6,734 |
|
| 2015 | $38.42 | 0.42 | 0.29 | 0.71 | (0.40) | (2.05) | (2.45) | $36.68 | 1.86% | 1.67% | 1.11% | 79% |
| $8,195 |
|
| 2014 | $31.50 | 0.41 | 6.93 | 7.34 | (0.42) | — | (0.42) | $38.42 | 23.42% | 1.67% | 1.17% | 76% |
| $5,445 |
|
| R Class | | | | | | | | | | | | | |
| 2018 | $37.89 | 0.73 | 4.40 | 5.13 | (0.69) | (2.74) | (3.43) | $39.59 | 13.73% | 1.16% | 1.83% | 77% |
| $25,298 |
|
| 2017 | $33.91 | 0.60 | 4.55 | 5.15 | (0.58) | (0.59) | (1.17) | $37.89 | 15.34% | 1.17% | 1.66% | 81% |
| $28,052 |
|
| 2016 | $36.77 | 0.65 | (0.60) | 0.05 | (0.67) | (2.24) | (2.91) | $33.91 | 0.52% | 1.18% | 1.90% | 79% |
| $23,290 |
|
| 2015 | $38.51 | 0.60 | 0.31 | 0.91 | (0.60) | (2.05) | (2.65) | $36.77 | 2.36% | 1.17% | 1.61% | 79% |
| $15,663 |
|
| 2014 | $31.57 | 0.59 | 6.95 | 7.54 | (0.60) | — | (0.60) | $38.51 | 24.05% | 1.17% | 1.67% | 76% |
| $3,577 |
|
| R5 Class | | | | | | | | | | | | | |
| 2018 | $37.95 | 0.91 | 4.50 | 5.41 | (0.96) | (2.74) | (3.70) | $39.66 | 14.52% | 0.46% | 2.53% | 77% |
| $4,241 |
|
2017(3) | $37.51 | 0.20 | 0.43 | 0.63 | (0.19) | — | (0.19) | $37.95 | 1.68% | 0.47%(4) | 2.37%(4) | 81%(5) |
| $175 |
|
|
|
| Notes to Financial Highlights |
| |
| (1) | Computed using average shares outstanding throughout the period. |
| |
| (2) | Total returns are calculated based on the net asset value of the last business day and do not reflect applicable sales charges, if any. Total returns for periods less than one year are not annualized. |
| |
| (3) | April 10, 2017 (commencement of sale) through June 30, 2017. |
| |
| (5) | Portfolio turnover is calculated at the fund level. Percentage indicated was calculated for the year ended June 30, 2017. |
See Notes to Financial Statements.
|
|
| Report of Independent Registered Public Accounting Firm |
To the Board of Directors of American Century Quantitative Equity Funds, Inc. and Shareholders of Income & Growth Fund
Opinion on the Financial Statements
We have audited the accompanying statement of assets and liabilities, including the schedule of investments, of Income & Growth Fund (one of the funds constituting American Century Quantitative Equity Funds, Inc., referred to hereafter as the "Fund") as of June 30, 2018, the related statement of operations for the year ended June 30, 2018, the statement of changes in net assets for each of the two years in the period ended June 30, 2018, including the related notes, and the financial highlights for each of the periods indicated therein (collectively referred to as the “financial statements”). In our opinion, the financial statements present fairly, in all material respects, the financial position of the Fund as of June 30, 2018, the results of its operations for the year then ended, the changes in its net assets for each of the two years in the period ended June 30, 2018 and the financial highlights for each of the periods indicated therein in conformity with accounting principles generally accepted in the United States of America.
Basis for Opinion
These financial statements are the responsibility of the Fund’s management. Our responsibility is to express an opinion on the Fund’s financial statements based on our audits. We are a public accounting firm registered with the Public Company Accounting Oversight Board (United States) (“PCAOB”) and are required to be independent with respect to the Fund in accordance with the U.S. federal securities laws and the applicable rules and regulations of the Securities and Exchange Commission and the PCAOB.
We conducted our audits of these financial statements in accordance with the standards of the PCAOB. Those standards require that we plan and perform the audit to obtain reasonable assurance about whether the financial statements are free of material misstatement, whether due to error or fraud.
Our audits included performing procedures to assess the risks of material misstatement of the financial statements, whether due to error or fraud, and performing procedures that respond to those risks. Such procedures included examining, on a test basis, evidence regarding the amounts and disclosures in the financial statements. Our audits also included evaluating the accounting principles used and significant estimates made by management, as well as evaluating the overall presentation of the financial statements. Our procedures included confirmation of securities owned as of June 30, 2018 by correspondence with the custodian and brokers. We believe that our audits provide a reasonable basis for our opinion.
/s/ PricewaterhouseCoopers LLP
Kansas City, Missouri
August 16, 2018
We have served as the auditor of one or more investment companies in American Century Investments since 1997.
The Board of Directors
The individuals listed below serve as directors of the funds. Each director will continue to serve in this capacity until death, retirement, resignation or removal from office. The board has adopted a mandatory retirement age for directors who are not “interested persons,” as that term is defined in the Investment Company Act (independent directors). Independent directors shall retire by December 31 of the year in which they reach their 75th birthday; provided, however, that on or after January 1, 2022, independent trustees shall retire on December 31 of the year in which they reach their 76th birthday.
Mr. Thomas is an “interested person” because he currently serves as President and Chief Executive Officer of American Century Companies, Inc. (ACC), the parent company of American Century Investment Management, Inc. (ACIM or the advisor). The other directors (more than three-fourths of the total number) are independent. They are not employees, directors or officers of, and have no financial interest in, ACC or any of its wholly owned, direct or indirect, subsidiaries, including ACIM, American Century Investment Services, Inc. (ACIS) and American Century Services, LLC (ACS), and they do not have any other affiliations, positions or relationships that would cause them to be considered “interested persons” under the Investment Company Act. The directors serve in this capacity for eight (in the case of Jonathan S. Thomas, 16; and Ronald J. Gilson, 9) registered investment companies in the American Century Investments family of funds.
The following table presents additional information about the directors. The mailing address for each director other than Mr. Thomas is 1665 Charleston Road, Mountain View, California 94043. The mailing address for Mr. Thomas is 4500 Main Street, Kansas City, Missouri 64111.
|
| | | | | |
Name
(Year of Birth) | Position(s) Held with Funds | Length of Time Served | Principal Occupation(s) During Past 5 Years | Number of American Century Portfolios Overseen by Director | Other Directorships Held During Past 5 Years |
| Independent Directors |
|
|
Tanya S. Beder
(1955) | Director | Since 2011 | Chairman and CEO, SBCC Group Inc. (independent advisory services) (2006 to present) | 45 | CYS Investments, Inc.; Nabors Industries Ltd. |
Jeremy I. Bulow
(1954) | Director | Since 2011 | Professor of Economics, Stanford University, Graduate School of Business (1979 to present) | 45 | None |
Anne Casscells
(1958) | Director | Since 2016 | Co-Chief Executive Officer and Chief Investment Officer, Aetos Alternatives Management (investment advisory firm) (2001 to present); Lecturer in Accounting, Stanford University, Graduate School of Business (2009 to present) | 45 | None |
|
| | | | | |
Name
(Year of Birth) | Position(s) Held with Funds | Length of Time Served | Principal Occupation(s) During Past 5 Years | Number of American Century Portfolios Overseen by Director | Other Directorships Held During Past 5 Years |
| Independent Directors |
|
|
Ronald J. Gilson
(1946) | Director and Chairman of the Board | Since 1995
(Chairman since 2005) | Charles J. Meyers Professor of Law and Business, Emeritus, Stanford Law School (1979 to 2016); Marc and Eva Stern Professor of Law and Business, Columbia University School of Law (1992 to present) | 47 | None |
Frederick L. A. Grauer
(1946) | Director | Since 2008 | Senior Advisor, iShares by BlackRock, Inc. (investment management firm) (2010 to 2011, 2013 to 2015); Senior Advisor, Course Hero (an educational technology company) (2015 to present) | 45 | None |
Jonathan D. Levin
(1972) | Director | Since 2016 | Philip H. Knight Professor and Dean, Graduate School of Business, Stanford University (2016 to present); Professor, Stanford University, (2000 to present); Chair, Department of Economics, Stanford University (2011 to 2014) | 45 | None |
Peter F. Pervere
(1947) | Director | Since 2007 | Retired | 45 | None |
John B. Shoven
(1947) | Director | Since 2002 | Charles R. Schwab Professor of Economics, Stanford University (1973 to present) | 45 | Cadence Design Systems; Exponent; Financial Engines |
| Interested Director |
|
|
Jonathan S. Thomas
(1963) | Director and President | Since 2007 | President and Chief Executive Officer, ACC (2007 to present). Also serves as Chief Executive Officer, ACS; Executive Vice President, ACIM; Director, ACC, ACIM and other ACC subsidiaries | 115 | BioMed Valley Discoveries, Inc. |
The Statement of Additional Information has additional information about the fund's directors and is available without charge, upon request, by calling 1-800-345-2021.
Officers
The following table presents certain information about the executive officers of the funds. Each officer serves as an officer for each of the 16 (in the case of Robert J. Leach, 15) investment companies in the American Century family of funds, unless otherwise noted. No officer is compensated for his or her service as an officer of the funds. The listed officers are interested persons of the funds and are appointed or re-appointed on an annual basis. The mailing address for each officer listed below is 4500 Main Street, Kansas City, Missouri 64111.
|
| | |
Name
(Year of Birth) | Offices with the Funds | Principal Occupation(s) During the Past Five Years |
Jonathan S. Thomas
(1963) | Director and President since 2007 | President and Chief Executive Officer, ACC (2007 to present). Also serves as Chief Executive Officer, ACS; Executive Vice President, ACIM; Director, ACC, ACIM and other ACC subsidiaries |
Amy D. Shelton
(1964) | Chief Compliance Officer and Vice President since 2014 | Chief Compliance Officer, American Century funds, (2014 to present); Chief Compliance Officer, ACIM (2014 to present); Chief Compliance Officer, ACIS (2009 to present); Vice President, Client Interactions and Marketing, ACIS (2013 to 2014). Also serves as Vice President, ACIS |
Charles A. Etherington
(1957) | General Counsel since 2007 and Senior Vice President since 2006 | Attorney, ACC (1994 to present); Vice President, ACC (2005 to present); General Counsel, ACC (2007 to present). Also serves as General Counsel, ACIM, ACS, ACIS and other ACC subsidiaries; and Senior Vice President, ACIM and ACS |
C. Jean Wade
(1964) | Vice President,Treasurer and Chief Financial Officer since 2012 | Senior Vice President, ACS (2017 to present); Vice President, ACS (2000 to 2017) |
Robert J. Leach
(1966) | Vice President since 2006 and Assistant Treasurer since 2012 | Vice President, ACS (2000 to present) |
David H. Reinmiller
(1963) | Vice President since 2000 | Attorney, ACC (1994 to present). Also serves as Vice President, ACIM and ACS |
Ward D. Stauffer
(1960) | Secretary since 2005 | Attorney, ACC (2003 to present) |
|
|
| Approval of Management Agreement |
At a meeting held on June 19, 2018, the Fund’s Board of Directors (the "Board") unanimously approved the renewal of the management agreement pursuant to which American Century Investment Management, Inc. (the “Advisor”) acts as the investment advisor for the Fund. Under Section 15(c) of the Investment Company Act, contracts for investment advisory services are required to be reviewed, evaluated, and approved by a majority of a fund’s directors/trustees, including a majority of the independent Directors, each year. The Board regards this annual evaluation and renewal as one of its most important responsibilities.
The independent Directors have memorialized a statement regarding the relationship between their ongoing obligations to oversee and evaluate the performance of the Advisor and their annual consideration of renewal of the management agreement. In that statement, the independent Directors noted that their assessment of the Advisor’s performance is an ongoing process that takes place over the entire year and is informed by all of the extensive information that the Board and its committees receive and consider over time. This information, together with the additional materials provided specifically in connection with the review, are central to the Board’s assessment of the Advisor’s performance and its determination whether to renew the Fund’s management agreement.
Prior to its consideration of the renewal of the management agreement, the Board requested and reviewed extensive data and analysis relating to the proposed renewal. This information and analysis was compiled by the Advisor and certain independent providers of evaluation data concerning the Fund and the services provided to the Fund by the Advisor.
In connection with its consideration of the renewal of the management agreement, the Board’s review and evaluation of the services provided by the Advisor included, but was not limited to, the following:
| |
| • | the nature, extent, and quality of investment management, shareholder services, and other services provided to the Fund; |
| |
| • | the wide range of other programs and services the Advisor provides to the Fund and its shareholders on a routine and non-routine basis; |
| |
| • | the investment performance of the Fund, including data comparing the Fund’s performance to appropriate benchmarks and/or a peer group of other mutual funds with similar investment objectives and strategies; |
| |
| • | the cost of owning the Fund compared to the cost of owning similar funds; |
| |
| • | the Advisor’s compliance policies, procedures, and regulatory experience; |
| |
| • | financial data showing the cost of services provided to the Fund, the profitability of the Fund to the Advisor, and the overall profitability of the Advisor; |
| |
| • | strategic plans of the Advisor; |
| |
| • | any economies of scale associated with the Advisor’s management of the Fund and other accounts; |
| |
| • | services provided and charges to other investment management clients of the Advisor; |
| |
| • | acquired fund fees and expenses; |
| |
| • | payments and practices in connection with financial intermediaries holding shares of the Fund and the services provided by intermediaries in connection therewith; and |
| |
| • | any collateral benefits derived by the Advisor from the management of the Fund. |
In keeping with its practice, the Board held two in-person meetings to review and discuss the information provided in response to their request and held active discussions with the Advisor regarding the renewal of the management agreement. The independent Directors had the benefit of the advice of their independent counsel throughout the process.
Factors Considered
The Directors considered all of the information provided by the Advisor, the independent data providers, and the independent Directors’ independent counsel in connection with the approval. They determined that the information was sufficient for them to evaluate the management agreement for the Fund. In connection with their review, the Directors did not identify any single factor as being all-important or controlling and each Director may have attributed different levels of importance to different factors. In deciding to renew the management agreement, the Board based its decision on a number of factors, including the following:
Nature, Extent and Quality of Services - Generally. Under the management agreement, the Advisor is responsible for providing or arranging for all services necessary for the operation of the Fund. The Board noted that the Advisor provides or arranges at its own expense a wide variety of services including:
| |
| • | constructing and designing the Fund |
| |
| • | portfolio research and security selection |
| |
| • | initial capitalization/funding |
| |
| • | daily valuation of the Fund’s portfolio |
| |
| • | shareholder servicing and transfer agency, including shareholder confirmations, recordkeeping, and communications |
| |
| • | legal services (except the independent Directors’ counsel) |
| |
| • | regulatory and portfolio compliance |
| |
| • | marketing and distribution (except amounts paid by the Fund under Rule 12b-1 plans) |
The Board noted that many of these services have expanded over time in terms of both quantity and complexity in response to shareholder demands, competition in the industry, changing distribution channels, and the changing regulatory environment.
Investment Management, Shareholder, and Other Services. The nature of the investment management services provided to the Fund is quite complex and allows Fund shareholders access to professional money management, instant diversification of their investments within an asset class, the opportunity to easily diversify among asset classes by investing in or exchanging among various American Century Investments funds, and liquidity. In evaluating investment performance, the Board expects the Advisor to manage the Fund in accordance with its investment objectives and approved strategies. Further, the Directors recognize that the Advisor has an obligation to seek the best execution of fund trades. In providing these services, the Advisor utilizes teams of investment professionals (portfolio managers, analysts, research assistants, and securities traders) who require extensive information technology, research, training, compliance, and other systems to conduct their business. The Board, directly and through its Portfolio Committee, regularly reviews investment performance information for the Fund, together with comparative information for appropriate benchmarks and/or peer groups of similarly-managed funds, over different time horizons. The Directors also review detailed performance information during the management agreement approval process. If performance concerns are identified, the Fund receives special reviews until performance improves, during which the Board discusses with the Advisor the reasons for such results (e.g., market conditions, security selection) and any efforts being undertaken to improve performance. The Fund’s performance was below its benchmark for the one-, three-, five-, and ten-year periods reviewed by the Board. The Board found the investment management services provided by the Advisor to the Fund to be satisfactory and consistent with the management agreement.
Under the management agreement, the Advisor provides the Fund with a comprehensive package of transfer agency, shareholder, and other services. The Board, directly and through various committees of the Board, regularly reviews reports and evaluations of such services at its regular meetings. These reports include, but are not limited to, information regarding the operational efficiency and accuracy of the shareholder and transfer agency services provided, staffing levels, shareholder satisfaction (as measured by external as well as internal sources), technology support, new products and services offered to Fund shareholders, securities trading activities, portfolio valuation services, auditing services, and legal and operational compliance activities. The Board found the services provided by the Advisor to the Fund under the management agreement to be competitive and of high quality.
Costs of Services and Profitability. The Advisor provides detailed information concerning its cost of providing various services to the Fund, its profitability in managing the Fund, its overall profitability, and its financial condition. The Directors have reviewed with the Advisor the methodology used to prepare this financial information. This information is considered in evaluating the Advisor’s financial condition, its ability to continue to provide services under the management agreement, and the reasonableness of the current management fee. The Board concluded that the Advisor’s profits were reasonable in light of the services provided to the Fund.
Economies of Scale. The Board also reviewed information provided by the Advisor regarding the possible existence of economies of scale in connection with the management of the Fund. The Board concluded that economies of scale are difficult to measure and predict with precision, especially on a fund-by-fund basis. The Board concluded that the Advisor is appropriately sharing economies of scale through its competitive fee structure, offering competitive fees from fund inception, and through reinvestment in its business to provide shareholders enhanced and expanded services.
Comparison to Other Funds’ Fees. The management agreement provides that the Fund pays the Advisor a single, all-inclusive (or unified) management fee for providing all services necessary for the management and operation of the Fund, other than brokerage expenses, expenses attributable to short sales, taxes, interest, extraordinary expenses, the fees and expenses of the Fund’s independent Directors (including their independent legal counsel), and expenses incurred in connection with the provision of shareholder services and distribution services under a plan adopted pursuant to Rule 12b-1 under the 1940 Act. Under the unified fee structure, the Advisor is responsible for providing all investment advisory, custody, audit, administrative, compliance, recordkeeping, marketing, and shareholder services, or arranging and supervising third parties to provide such services. By contrast, most other funds are charged a variety of fees, including an investment advisory fee, a transfer agency fee, an administrative fee, distribution charges, and other expenses. Other than their investment advisory fees and any applicable Rule 12b-1 distribution fees, all other components of the total fees charged by these other funds may be increased without shareholder approval. The Board believes the unified fee structure is a benefit to Fund shareholders because it clearly discloses to shareholders the cost of owning Fund shares, and, since the unified fee cannot be increased without a vote of Fund shareholders, it shifts to the Advisor the risk of increased costs of operating the Fund and provides a direct incentive to minimize administrative inefficiencies. Part of the Board’s analysis of fee levels involves reviewing certain evaluative data compiled by an independent provider and comparing the Fund’s unified fee to the total expense ratio of peer funds. The unified fee charged to shareholders of the Fund was in the lowest quartile of the total expense ratios of the Fund’s peer group. The Board concluded that the management fee paid by the Fund to the Advisor under the management agreement is reasonable in light of the services provided to the Fund.
Comparison to Fees and Services Provided to Other Clients of the Advisor. The Board also requested and received information from the Advisor concerning the nature of the services, fees, costs, and profitability of its advisory services to advisory clients other than the Fund. They observed that these varying types of client accounts require different services and involve different regulatory and entrepreneurial risks than the management of the Fund. The Board analyzed this
information and concluded that the fees charged and services provided to the Fund were reasonable by comparison.
Payments to Intermediaries. The Directors also requested and received a description of payments made to intermediaries by the Fund and the Advisor and services provided by intermediaries. These payments include various payments made by the Fund or the Advisor to different types of intermediaries and recordkeepers for distribution and service activities provided for the Fund. The Directors reviewed such information and received representations from the Advisor that all such payments by the Fund were made pursuant to the Fund’s Rule 12b-1 Plan and that all such payments by the Advisor were made from the Advisor’s resources and reasonable profits. The Board found such payments to be reasonable in scope and purpose.
Collateral or “Fall-Out” Benefits Derived by the Advisor. The Board considered the existence of collateral benefits the Advisor may receive as a result of its relationship with the Fund. The Board noted that the Advisor’s primary business is managing mutual funds and it generally does not use fund or shareholder information to generate profits in other lines of business, and therefore does not derive any significant collateral benefits from them. The Board noted that the Advisor may receive proprietary research from broker-dealers that execute fund portfolio transactions. The Board also determined that the Advisor is able to provide investment management services to certain clients other than the Fund, at least in part, due to its existing infrastructure built to serve the fund complex. The Board noted that the assets of those other accounts are, where applicable, included with the assets of the Fund to determine breakpoints in the management fee schedule.
Existing Relationship. The Board also considered whether there was any reason for not continuing the existing arrangement with the Advisor. In this regard, the Board was mindful of the potential disruptions of the Fund’s operations and various risks, uncertainties, and other effects that could occur as a result of a decision not to continue such relationship. In particular, the Board recognized that most shareholders have invested in the Fund on the strength of the Advisor’s industry standing and reputation and in the expectation that the Advisor will have a continuing role in providing advisory services to the Fund.
Conclusion of the Directors. As a result of this process, the Board, including all of the independent Directors and assisted by the advice of independent legal counsel, taking into account all of the factors discussed above and the information provided by the Advisor and others in connection with its review and throughout the year, concluded that the management agreement between the Fund and the Advisor is fair and reasonable in light of the services provided and should be renewed.
Retirement Account Information
As required by law, distributions you receive from certain retirement accounts are subject to federal income tax withholding, unless you elect not to have withholding apply*. Tax will be withheld on the total amount withdrawn even though you may be receiving amounts that are not subject to withholding, such as nondeductible contributions. In such case, excess amounts of withholding could occur. You may adjust your withholding election so that a greater or lesser amount will be withheld.
If you don’t want us to withhold on this amount, you must notify us to not withhold the federal income tax. You may notify us in writing or in certain situations by telephone or through other electronic means. For systematic withdrawals, your withholding election will remain in effect until revoked or changed by filing a new election. You have the right to revoke your election at any time and change your withholding percentage for future distributions.
Remember, even if you elect not to have income tax withheld, you are liable for paying income tax on the taxable portion of your withdrawal. If you elect not to have income tax withheld or you don’t have enough income tax withheld, you may be responsible for payment of estimated tax. You may incur penalties under the estimated tax rules if your withholding and estimated tax payments are not sufficient. You can reduce or defer the income tax on a distribution by directly or indirectly rolling such distribution over to another IRA or eligible plan. You should consult your tax advisor for additional information.
State tax will be withheld if, at the time of your distribution, your address is within one of the mandatory withholding states and you have federal income tax withheld (or as otherwise required by state law). State taxes will be withheld from your distribution in accordance with the respective state rules.
*Some 403(b), 457 and qualified retirement plan distributions may be subject to 20% mandatory withholding, as they are subject to special tax and withholding rules. Your plan administrator or plan sponsor is required to provide you with a special tax notice explaining those rules at the time you request a distribution. If applicable, federal and/or state taxes may be withheld from your distribution amount.
Proxy Voting Policies
Descriptions of the principles and policies that the fund's investment advisor uses in exercising the voting rights associated with the securities purchased and/or held by the fund are available without charge, upon request, by calling 1-800-345-2021 or visiting the "About Us" page of American Century Investments’ website at americancentury.com. A description of the policies is also available on the Securities and Exchange Commission’s website at sec.gov. Information regarding how the investment advisor voted proxies relating to portfolio securities during the most recent 12-month period ended June 30 is available on the "About Us" page at americancentury.com. It is also available at sec.gov.
Quarterly Portfolio Disclosure
The fund files its complete schedule of portfolio holdings with the Securities and Exchange Commission (SEC) for the first and third quarters of each fiscal year on Form N-Q. The fund’s Forms N-Q are available on the SEC’s website at sec.gov, and may be reviewed and copied at the SEC’s Public Reference Room in Washington, DC. Information on the operation of the Public Reference Room may be obtained by calling 1-800-SEC-0330. The fund also makes its complete schedule of portfolio holdings for the most recent quarter of its fiscal year available on its website at americancentury.com and, upon request, by calling 1-800-345-2021.
Other Tax Information
The following information is provided pursuant to provisions of the Internal Revenue Code.
The fund hereby designates up to the maximum amount allowable as qualified dividend income for the fiscal year ended June 30, 2018.
For corporate taxpayers, the fund hereby designates $51,980,494, or up to the maximum amount allowable, of ordinary income distributions paid during the fiscal year ended June 30, 2018 as qualified for the corporate dividends received deduction.
The fund hereby designates $46,703,863 as qualified short-term capital gain distributions for purposes of Internal Revenue Code Section 871 for the fiscal year ended June 30, 2018.
The fund hereby designates $99,476,832, or up to the maximum amount allowable, as long-term capital gain distributions (20% rate gain distributions) for the fiscal year ended June 30, 2018.
|
| | |
| |
| | | |
| Contact Us | americancentury.com | |
| Automated Information Line | 1-800-345-8765 | |
| Investor Services Representative | 1-800-345-2021
or 816-531-5575 | |
| Investors Using Advisors | 1-800-378-9878 | |
Business, Not-For-Profit, Employer-Sponsored
Retirement Plans | 1-800-345-3533 | |
Banks and Trust Companies, Broker-Dealers,
Financial Professionals, Insurance Companies | 1-800-345-6488 | |
| Telecommunications Relay Service for the Deaf | 711 | |
| | | |
| American Century Quantitative Equity Funds, Inc. | |
| | | |
Investment Advisor: American Century Investment Management, Inc. Kansas City, Missouri | |
| | | |
| This report and the statements it contains are submitted for the general information of our shareholders. The report is not authorized for distribution to prospective investors unless preceded or accompanied by an effective prospectus. | |
| | | |
©2018 American Century Proprietary Holdings, Inc. All rights reserved.
CL-ANN-92991 1808 | |
|
| |
| | |
| | Annual Report |
| | |
| | June 30, 2018 |
| | |
| | International Core Equity Fund |
| | Investor Class (ACIMX) |
| | I Class (ACIUX) |
| | A Class (ACIQX) |
| | C Class (ACIKX) |
| | R Class (ACIRX) |
|
| | |
| President's Letter | 2 |
|
| Performance | 3 |
|
| Portfolio Commentary | |
|
| Fund Characteristics | |
|
| Shareholder Fee Example | |
|
| Schedule of Investments | |
|
| Statement of Assets and Liabilities | |
|
| Statement of Operations | |
|
| Statement of Changes in Net Assets | |
|
| Notes to Financial Statements | |
|
| Financial Highlights | |
|
| Report of Independent Registered Public Accounting Firm | |
|
| Management | |
|
| Approval of Management Agreement | |
|
| Additional Information | |
|
Any opinions expressed in this report reflect those of the author as of the date of the report, and do not necessarily represent the opinions of American Century Investments® or any other person in the American Century Investments organization. Any such opinions are subject to change at any time based upon market or other conditions and American Century Investments disclaims any responsibility to update such opinions. These opinions may not be relied upon as investment advice and, because investment decisions made by American Century Investments funds are based on numerous factors, may not be relied upon as an indication of trading intent on behalf of any American Century Investments fund. Security examples are used for representational purposes only and are not intended as recommendations to purchase or sell securities. Performance information for comparative indices and securities is provided to American Century Investments by third party vendors. To the best of American Century Investments’ knowledge, such information is accurate at the time of printing.
Jonathan Thomas
Dear Investor:
Thank you for reviewing this annual report for the period ended June 30, 2018. Annual reports help convey important information about fund returns, including market factors that affected performance during the reporting period. For additional, updated investment and market insights, we encourage you to visit our website, americancentury.com.
Volatility’s Return Challenged Financial Markets
Broad U.S. and global stock market indices generally rallied for the first half of the 12-month period. A favorable backdrop of robust corporate earnings results, improving global economic growth, and relatively low interest rates, combined with the effects of U.S. tax reform, drove stock prices higher. For the six months ended December 31, 2017, U.S. stocks (S&P 500 Index) returned 11.42%. U.S. bond returns were also positive, but much more subdued, as the Federal Reserve (the Fed) continued its rate-normalization efforts and interest rates edged higher. The Bloomberg Barclays U.S. Aggregate Bond Index returned 1.24% for the six-month period.
In early February, a force that was largely dormant during 2017—volatility—re-emerged, as better-than-expected economic data triggered expectations for rising inflation, higher interest rates, and a more-hawkish Fed. In response, U.S. Treasury yields climbed to their highest levels in several years, and stock prices plunged. Economic data released in subsequent months were more in line with market expectations, while corporate earnings results remained healthy. These factors helped calm the market unrest, and stocks generally recovered their earlier losses. Nevertheless, rising interest rates, geopolitical tensions, and the mounting threat of a global trade war continued to provide periodic headwinds for investors.
Despite the return of volatility, U.S. stocks (S&P 500 Index) gained14.37% for the 12-month period. Meanwhile, rising U.S. Treasury yields, particularly in the second half of the period, took a toll on bonds and other interest-rate-sensitive investments, including gold, utilities stocks, and real estate investment trusts (REITs). Investment-grade bonds (Bloomberg Barclays U.S. Aggregate Bond Index) returned -0.40% for the 12 months.
With volatility resurfacing, inflationary pressures building, Treasury yields rising, and the implications of U.S. tariff and trade policy still unfolding, investors likely will face new opportunities and challenges in the months ahead. We believe this scenario warrants a disciplined, diversified, and risk-aware approach, using professionally managed portfolios in pursuit of investment goals. We appreciate your continued trust and confidence in us.
Sincerely,
Jonathan Thomas
President and Chief Executive Officer
American Century Investments
|
| | | | | |
| Total Returns as of June 30, 2018 |
| | Average Annual Returns | |
| | Ticker Symbol | 1 year | 5 years | 10 years | Inception Date |
| Investor Class | ACIMX | 4.69% | 5.86% | 1.97% | 11/30/06 |
| MSCI EAFE Index | — | 6.84% | 6.44% | 2.84% | — |
| I Class | ACIUX | 4.89% | 6.09% | 2.18% | 11/30/06 |
| A Class | ACIQX | | | | 11/30/06 |
| No sales charge | | 4.41% | 5.64% | 1.73% | |
| With sales charge | | -1.59% | 4.41% | 1.14% | |
| C Class | ACIKX | 3.54% | 4.82% | 0.96% | 11/30/06 |
| R Class | ACIRX | 4.17% | 5.37% | 1.47% | 11/30/06 |
Sales charges include initial sales charges and contingent deferred sales charges (CDSCs), as applicable. A Class shares have a 5.75% maximum initial sales charge and may be subject to a maximum CDSC of 1.00%. C Class shares redeemed within 12 months of purchase are subject to a maximum CDSC of 1.00%. The SEC requires that mutual funds provide performance information net of maximum sales charges in all cases where charges could be applied.
Data presented reflect past performance. Past performance is no guarantee of future results. Current performance may be higher or lower than the performance shown. Total returns for periods less than one year are not annualized. Investment return and principal value will fluctuate, and redemption value may be more or less than original cost. Data assumes reinvestment of dividends and capital gains, and none of the charts reflect the deduction of taxes that a shareholder would pay on fund distributions or the redemption of fund shares. To obtain performance data current to the most recent month end, please call 1-800-345-2021 or visit americancentury.com. For additional information about the fund, please consult the prospectus.
|
|
| Growth of $10,000 Over 10 Years |
| $10,000 investment made June 30, 2008 |
| Performance for other share classes will vary due to differences in fee structure. |
|
| |
| Value on June 30, 2018 |
| | Investor Class — $12,153 |
| |
| | MSCI EAFE Index — $13,236 |
| |
|
| | | | |
| Total Annual Fund Operating Expenses |
| Investor Class | I Class | A Class | C Class | R Class |
| 1.16% | 0.96% | 1.41% | 2.16% | 1.66% |
The total annual fund operating expenses shown is as stated in the fund’s prospectus current as of the date of this report. The prospectus may vary from the expense ratio shown elsewhere in this report because it is based on a different time period, includes acquired fund fees and expenses, and, if applicable, does not include fee waivers or expense reimbursements.
Data presented reflect past performance. Past performance is no guarantee of future results. Current performance may be higher or lower than the performance shown. Total returns for periods less than one year are not annualized. Investment return and principal value will fluctuate, and redemption value may be more or less than original cost. Data assumes reinvestment of dividends and capital gains, and none of the charts reflect the deduction of taxes that a shareholder would pay on fund distributions or the redemption of fund shares. To obtain performance data current to the most recent month end, please call 1-800-345-2021 or visit americancentury.com. For additional information about the fund, please consult the prospectus.
Portfolio Managers: Elizabeth Xie and Vinod Chandrashekaran
Performance Summary
The International Core Equity Fund returned 4.69%* for the fiscal year ended June 30, 2018, compared with the 6.84% return of its benchmark, the MSCI EAFE Index.
International Core Equity gained but trailed the MSCI EAFE Index. Stock selection in the consumer discretionary, industrials, and energy sectors weighed on the fund’s relative results, while materials and health care sectors holdings aided relative returns. From a geographical perspective, underperformance was most pronounced in stock choices from France and Japan, while stock selection in Norway and China was beneficial. The fund’s stock selection process incorporates factors of valuation, quality, and momentum, while striving to minimize unintended risks along industries and other risk characteristics. Stock selection insights based on valuation detracted from performance, while quality, sentiment, and growth insights were additive.
Stock Choices Across Several Sectors Detracted From Relative Returns
Stock choices in the consumer discretionary sector were the largest driver of underperformance. Selection within media companies weighed on relative returns, particularly overweight positions in Germany-based ProSiebenSat.1 Media and France-based Eutelsat Communications. We have since exited our position in ProSiebenSat.1 Media. In the textiles, apparel, and luxury goods industry, an overweight to jewelry company Pandora was one of the largest detractors for the period. We believe the stock remains a good investment opportunity due to its high valuation and quality scores. An overweight to household appliance company Electrolux also detracted.
Within industrials, stock selection also hindered returns. An overweight to electrical equipment company Vestas Wind Systems was one of the leading detractors from relative performance. The company reported disappointing profit growth amid intense competition and pricing pressure in the market for wind power. We have since exited our position in the stock. Positioning within transportation infrastructure and trading companies and distributors also detracted.
Stock selection within energy also negatively affected the portfolio. Within the oil, gas, and consumable fuels industry, underweights to U.K.-based BP and Royal Dutch Shell weighed on results. We had some exposure to these stocks, but less than the index, which detracted from relative performance as stronger energy prices meant these stocks performed well during the period.
Over the past 12 months, France, Japan, Germany, Netherlands, and the U.K. were the largest country detractors. In general, stock selection decisions and underweight allocations to these geographies, where stocks rose, were responsible for the underperformance.
*All fund returns referenced in this commentary are for Investor Class shares. Performance for other share classes will vary due to differences in fee structure; when Investor Class performance exceeds that of the fund's benchmark, other share classes may not. See page 3 for returns for all share classes.
Materials and Health Care Were Additive
Stock selection within the materials sector contributed to relative returns, particularly within the metals and mining industry, where several of the portfolio’s leading contributors reside. A position in Evraz was a top-contributing stock for the period, scoring highly on all dimensions of our stock selection model. We have since exited the position. Overweights to Rio Tinto and BHP Billiton were also top contributors. These stocks benefited from the recovery in commodity prices from multiyear lows reached in 2016. Positioning within paper and forest products was also additive, as was containers and packaging.
Pharmaceuticals holdings also contributed to relative returns, making the health care sector one of the leading sources of strength. An overweight to H Lundbeck was one of the top contributing positions for the period. The Denmark-based drug company maintains high scores for quality and sentiment. An underweight to poor-performing pharmaceutical company Sanofi also benefited relative results.
Allocations to Norway, China, South Korea, and Singapore were the largest contributors to relative returns on a country basis.
Portfolio Positioning
We utilize a structured, disciplined investment approach for both stock selection and portfolio construction. At the sector level, telecommunication services was the fund’s largest overweight position. Based on our model, we believe it offers high-quality earnings growth at attractive valuations. Consumer discretionary was another notable overweight position. This reflects an allocation to automobiles and components companies, which rate highly on our valuation and growth metrics. Key underweights are in the financials sector, where we see a lack of opportunity in banks and insurance, which are characterized by low growth scores. In the consumer staples sector, our underweight reflects a comparative lack of exposure to food, beverage, and tobacco and household and personal products companies. These stocks are unattractive according to our measures of growth and valuation. On a country basis, the fund invests in a number of emerging markets outside the MSCI EAFE benchmark. We increased our emerging markets exposure during the period. Our largest exposures outside of the index at period-end were South Korea and Taiwan. In developed markets, our largest relative overweight is in Japan. The biggest relative underweights were in Germany and Australia.
|
| |
| JUNE 30, 2018 |
| Top Ten Holdings | % of net assets |
| Roche Holding AG | 1.9% |
| Royal Dutch Shell plc, B Shares | 1.6% |
| Rio Tinto plc | 1.6% |
| GlaxoSmithKline plc | 1.5% |
| BHP Billiton plc | 1.5% |
| Toyota Motor Corp. | 1.4% |
| iShares MSCI EAFE ETF | 1.3% |
| Novartis AG | 1.2% |
| BNP Paribas SA | 1.2% |
| Eni SpA | 1.2% |
| | |
| Investments by Country | % of net assets |
| Japan | 25.2% |
| United Kingdom | 17.7% |
| France | 7.8% |
| Switzerland | 6.7% |
| Germany | 6.3% |
| Netherlands | 4.4% |
| Australia | 3.9% |
| Hong Kong | 3.0% |
| Spain | 2.7% |
| Italy | 2.5% |
| Sweden | 2.3% |
| South Korea | 2.1% |
| Other Countries | 12.7% |
| Exchange-Traded Funds* | 2.0% |
| Cash and Equivalents** | 0.7% |
* Category may increase exposure to the countries indicated. The Schedule of Investments provides additional information on the fund's portfolio holdings. |
| ** Includes temporary cash investments and other assets and liabilities. |
| | |
| Types of Investments in Portfolio | % of net assets |
| Common Stocks | 97.3% |
| Exchange-Traded Funds | 2.0% |
| Total Equity Exposure | 99.3% |
| Temporary Cash Investments | 0.2% |
| Other Assets and Liabilities | 0.5% |
Fund shareholders may incur two types of costs: (1) transaction costs, including sales charges (loads) on purchase payments and redemption/exchange fees; and (2) ongoing costs, including management fees; distribution and service (12b-1) fees; and other fund expenses. This example is intended to help you understand your ongoing costs (in dollars) of investing in your fund and to compare these costs with the ongoing cost of investing in other mutual funds.
The example is based on an investment of $1,000 made at the beginning of the period and held for the entire period from January 1, 2018 to June 30, 2018.
Actual Expenses
The table provides information about actual account values and actual expenses for each class. You may use the information, together with the amount you invested, to estimate the expenses that you paid over the period. First, identify the share class you own. Then simply divide your account value by $1,000 (for example, an $8,600 account value divided by $1,000 = 8.6), then multiply the result by the number under the heading “Expenses Paid During Period” to estimate the expenses you paid on your account during this period.
If you hold Investor Class shares of any American Century Investments fund, or I Class shares of the American Century Diversified Bond Fund, in an American Century Investments account (i.e., not a financial intermediary or retirement plan account), American Century Investments may charge you a $12.50 semiannual account maintenance fee if the value of those shares is less than $10,000. We will redeem shares automatically in one of your accounts to pay the $12.50 fee. In determining your total eligible investment amount, we will include your investments in all personal accounts (including American Century Investments Brokerage accounts) registered under your Social Security number. Personal accounts include individual accounts, joint accounts, UGMA/UTMA accounts, personal trusts, Coverdell Education Savings Accounts and IRAs (including traditional, Roth, Rollover, SEP-, SARSEP- and SIMPLE-IRAs), and certain other retirement accounts. If you have only business, business retirement, employer-sponsored or American Century Investments Brokerage accounts, you are currently not subject to this fee. If you are subject to the Account Maintenance Fee, your account value could be reduced by the fee amount.
Hypothetical Example for Comparison Purposes
The table also provides information about hypothetical account values and hypothetical expenses based on the actual expense ratio of each class of your fund and an assumed rate of return of 5% per year before expenses, which is not the actual return of a fund’s share class. The hypothetical account values and expenses may not be used to estimate the actual ending account balance or expenses you paid for the period. You may use this information to compare the ongoing costs of investing in your fund and other funds. To do so, compare this 5% hypothetical example with the 5% hypothetical examples that appear in the shareholder reports of the other funds.
Please note that the expenses shown in the table are meant to highlight your ongoing costs only and do not reflect any transactional costs, such as sales charges (loads) or redemption/exchange fees. Therefore, the table is useful in comparing ongoing costs only, and will not help you determine the relative total costs of owning different funds. In addition, if these transactional costs were included, your costs would have been higher.
|
| | | | |
| | Beginning
Account Value
1/1/18 | Ending
Account Value
6/30/18 | Expenses Paid
During Period(1)
1/1/18 - 6/30/18 | Annualized
Expense Ratio(1) |
| Actual |
| Investor Class | $1,000 | $961.40 | $5.59 | 1.15% |
| I Class | $1,000 | $962.50 | $4.62 | 0.95% |
| A Class | $1,000 | $960.40 | $6.81 | 1.40% |
| C Class | $1,000 | $957.20 | $10.43 | 2.15% |
| R Class | $1,000 | $959.30 | $8.02 | 1.65% |
| Hypothetical |
| Investor Class | $1,000 | $1,019.09 | $5.76 | 1.15% |
| I Class | $1,000 | $1,020.08 | $4.76 | 0.95% |
| A Class | $1,000 | $1,017.85 | $7.00 | 1.40% |
| C Class | $1,000 | $1,014.13 | $10.74 | 2.15% |
| R Class | $1,000 | $1,016.61 | $8.25 | 1.65% |
| |
| (1) | Expenses are equal to the class's annualized expense ratio listed in the table above, multiplied by the average account value over the period, multiplied by 181, the number of days in the most recent fiscal half-year, divided by 365, to reflect the one-half year period. Annualized expense ratio reflects actual expenses, including any applicable fee waivers or expense reimbursements and excluding any acquired fund fees and expenses. |
JUNE 30, 2018
|
| | | | | |
| | Shares | Value |
| COMMON STOCKS — 97.3% | | |
| Australia — 3.9% | | |
| Aristocrat Leisure Ltd. | 13,651 |
| $ | 312,165 |
|
| Australia & New Zealand Banking Group Ltd. | 16,385 |
| 342,430 |
|
| CIMIC Group Ltd. | 7,238 |
| 226,579 |
|
| Qantas Airways Ltd. | 32,853 |
| 149,767 |
|
| Wesfarmers Ltd. | 3,116 |
| 113,824 |
|
| Whitehaven Coal Ltd. | 21,574 |
| 92,283 |
|
| | | 1,237,048 |
|
| Austria — 0.8% | | |
| OMV AG | 4,421 |
| 250,759 |
|
| Brazil — 0.4% | | |
| Banco Bradesco SA Preference Shares | 7,623 |
| 52,672 |
|
| Petroleo Brasileiro SA ADR | 10,000 |
| 88,400 |
|
| | | 141,072 |
|
| China — 1.2% | | |
| China Petroleum & Chemical Corp., H Shares | 176,000 |
| 157,255 |
|
| Country Garden Holdings Co. Ltd. | 46,000 |
| 80,912 |
|
Country Garden Services Holdings Co. Ltd.(1) | 5,287 |
| 6,779 |
|
| Tencent Holdings Ltd. | 1,500 |
| 75,291 |
|
| Weichai Power Co. Ltd., H Shares | 35,000 |
| 48,269 |
|
| | | 368,506 |
|
| Denmark — 1.6% | | |
| H Lundbeck A/S | 4,132 |
| 290,408 |
|
| Novo Nordisk A/S, B Shares | 1,063 |
| 49,318 |
|
| Pandora A/S | 2,587 |
| 180,767 |
|
| | | 520,493 |
|
| Finland — 1.4% | | |
| Nokia Oyj | 12,974 |
| 74,695 |
|
| UPM-Kymmene Oyj | 6,396 |
| 228,708 |
|
| Valmet Oyj | 8,045 |
| 155,205 |
|
| | | 458,608 |
|
| France — 7.8% | | |
| BNP Paribas SA | 6,058 |
| 376,294 |
|
| CNP Assurances | 10,564 |
| 240,441 |
|
| Dassault Aviation SA | 135 |
| 257,290 |
|
| Eutelsat Communications SA | 4,226 |
| 87,673 |
|
| Faurecia SA | 3,647 |
| 260,308 |
|
| Kering SA | 117 |
| 66,076 |
|
| Metropole Television SA | 7,556 |
| 151,153 |
|
| Orange SA | 15,149 |
| 253,778 |
|
| Peugeot SA | 12,321 |
| 281,438 |
|
| Safran SA | 715 |
| 86,879 |
|
|
| | | | | |
| | Shares | Value |
| Sanofi | 1,317 |
| $ | 105,583 |
|
| Societe Generale SA | 1,319 |
| 55,629 |
|
| TOTAL SA | 4,562 |
| 278,149 |
|
| | | 2,500,691 |
|
| Germany — 6.3% | | |
| adidas AG | 781 |
| 170,508 |
|
| BASF SE | 1,265 |
| 121,003 |
|
| Bayer AG | 2,184 |
| 240,637 |
|
| Covestro AG | 2,868 |
| 255,950 |
|
| Deutsche Lufthansa AG | 6,117 |
| 147,155 |
|
Deutsche Telekom AG(1) | 21,848 |
| 338,572 |
|
| HOCHTIEF AG | 367 |
| 66,345 |
|
| HUGO BOSS AG | 1,459 |
| 132,489 |
|
| Rheinmetall AG | 1,584 |
| 174,917 |
|
| Schaeffler AG Preference Shares | 16,710 |
| 217,580 |
|
| Siemens AG | 500 |
| 66,109 |
|
| Wacker Neuson SE | 3,407 |
| 86,576 |
|
| | | 2,017,841 |
|
| Hong Kong — 3.0% | | |
Health and Happiness H&H International Holdings Ltd.(1) | 33,500 |
| 231,002 |
|
| Hongkong Land Holdings Ltd. | 14,700 |
| 105,105 |
|
| Sands China Ltd. | 50,000 |
| 267,347 |
|
| Swire Properties Ltd. | 66,200 |
| 244,698 |
|
| Wharf Holdings Ltd. (The) | 39,000 |
| 125,268 |
|
| | | 973,420 |
|
| India — 0.4% | | |
| Hindustan Petroleum Corp. Ltd. | 13,542 |
| 51,231 |
|
| Tata Steel Ltd. | 10,164 |
| 84,224 |
|
| | | 135,455 |
|
| Israel — 0.3% | | |
| Mizrahi Tefahot Bank Ltd. | 5,846 |
| 107,587 |
|
| Italy — 2.5% | | |
| Eni SpA | 20,255 |
| 376,237 |
|
| EXOR NV | 1,404 |
| 94,605 |
|
Fiat Chrysler Automobiles NV(1) | 13,671 |
| 260,772 |
|
| Societa Iniziative Autostradali e Servizi SpA | 4,951 |
| 74,585 |
|
| | | 806,199 |
|
| Japan — 25.2% | | |
| Asahi Kasei Corp. | 7,400 |
| 94,108 |
|
| Astellas Pharma, Inc. | 20,300 |
| 309,684 |
|
| Brother Industries Ltd. | 7,400 |
| 146,242 |
|
| Canon, Inc. | 9,900 |
| 324,680 |
|
| cocokara fine, Inc. | 2,200 |
| 135,320 |
|
| Daiichikosho Co., Ltd. | 1,600 |
| 77,316 |
|
| Daiwa Securities Group, Inc. | 6,000 |
| 34,862 |
|
| Eisai Co. Ltd. | 3,900 |
| 274,900 |
|
| Hitachi Construction Machinery Co. Ltd. | 7,900 |
| 256,876 |
|
|
| | | | | |
| | Shares | Value |
| Honda Motor Co. Ltd. | 400 |
| $ | 11,753 |
|
| Kajima Corp. | 27,000 |
| 209,240 |
|
| KDDI Corp. | 8,800 |
| 240,914 |
|
| Kirin Holdings Co. Ltd. | 12,300 |
| 329,178 |
|
| Mebuki Financial Group, Inc. | 35,200 |
| 118,271 |
|
| Mitsubishi Chemical Holdings Corp. | 20,600 |
| 172,555 |
|
| Mitsubishi Corp. | 8,100 |
| 225,189 |
|
| Mitsubishi UFJ Financial Group, Inc. | 42,600 |
| 242,829 |
|
| Mixi, Inc. | 800 |
| 20,261 |
|
| Nihon Unisys Ltd. | 9,100 |
| 228,825 |
|
| Nippon Telegraph & Telephone Corp. | 6,500 |
| 295,660 |
|
| NTT DOCOMO, Inc. | 9,300 |
| 237,088 |
|
| Pola Orbis Holdings, Inc. | 2,900 |
| 127,693 |
|
| Recruit Holdings Co. Ltd. | 12,500 |
| 346,159 |
|
| SBI Holdings, Inc. | 5,000 |
| 128,890 |
|
| Sega Sammy Holdings, Inc. | 16,900 |
| 289,719 |
|
| SoftBank Group Corp. | 700 |
| 50,410 |
|
| Sony Corp. | 5,600 |
| 286,487 |
|
| Square Enix Holdings Co. Ltd. | 5,300 |
| 260,416 |
|
| Stanley Electric Co. Ltd. | 6,800 |
| 232,164 |
|
| Subaru Corp. | 9,100 |
| 265,073 |
|
| Sumitomo Mitsui Financial Group, Inc. | 1,600 |
| 62,228 |
|
| Suntory Beverage & Food Ltd. | 1,000 |
| 42,722 |
|
| Suzuken Co. Ltd. | 3,100 |
| 131,319 |
|
| Suzuki Motor Corp. | 5,500 |
| 303,925 |
|
| Taisei Corp. | 3,800 |
| 209,710 |
|
| Tokuyama Corp. | 2,900 |
| 93,117 |
|
| Tokyo Electron Ltd. | 1,700 |
| 292,047 |
|
| Toshiba TEC Corp. | 22,000 |
| 134,128 |
|
| Toyota Motor Corp. | 6,900 |
| 446,850 |
|
| Trend Micro, Inc. | 1,900 |
| 108,459 |
|
| TS Tech Co. Ltd. | 6,000 |
| 250,644 |
|
| Ulvac, Inc. | 1,400 |
| 53,615 |
|
| | | 8,101,526 |
|
| Malaysia — 0.9% | | |
| CIMB Group Holdings Bhd | 41,900 |
| 56,530 |
|
| Hong Leong Financial Group Bhd | 31,300 |
| 139,473 |
|
| Malayan Banking Bhd | 39,100 |
| 87,115 |
|
| | | 283,118 |
|
| Netherlands — 4.4% | | |
| ASML Holding NV | 1,115 |
| 220,966 |
|
| ASR Nederland NV | 5,522 |
| 225,572 |
|
| ING Groep NV | 13,183 |
| 189,791 |
|
| Koninklijke Ahold Delhaize NV | 14,586 |
| 349,272 |
|
| Koninklijke Philips NV | 8,056 |
| 342,679 |
|
| Unilever NV CVA | 1,355 |
| 75,613 |
|
| | | 1,403,893 |
|
|
| | | | | |
| | Shares | Value |
| New Zealand — 0.4% | | |
a2 Milk Co. Ltd.(1) | 17,873 |
| $ | 138,728 |
|
| Norway — 1.4% | | |
| Equinor ASA | 11,509 |
| 305,801 |
|
| Marine Harvest ASA | 4,672 |
| 93,046 |
|
| Salmar ASA | 1,080 |
| 45,325 |
|
| | | 444,172 |
|
| Singapore — 1.9% | | |
| Oversea-Chinese Banking Corp. Ltd. | 37,000 |
| 316,095 |
|
| United Overseas Bank Ltd. | 15,600 |
| 306,390 |
|
| | | 622,485 |
|
| South Africa — 0.4% | | |
| Barclays Africa Group Ltd. | 5,291 |
| 61,710 |
|
| Nedbank Group Ltd. | 4,123 |
| 75,015 |
|
| | | 136,725 |
|
| South Korea — 2.1% | | |
| Hanwha Corp. | 2,730 |
| 77,283 |
|
| LG Household & Health Care Ltd. Preference Shares | 270 |
| 176,851 |
|
| Samsung Electronics Co. Ltd. | 4,700 |
| 196,729 |
|
| SK Hynix, Inc. | 2,706 |
| 208,079 |
|
| | | 658,942 |
|
| Spain — 2.7% | | |
| Aena SME SA | 1,112 |
| 201,931 |
|
| Banco Bilbao Vizcaya Argentaria SA | 7,665 |
| 54,370 |
|
Fomento de Construcciones y Contratas SA(1) | 18,446 |
| 232,645 |
|
| Mapfre SA | 19,993 |
| 60,354 |
|
| Telefonica SA | 36,707 |
| 312,025 |
|
| | | 861,325 |
|
| Sweden — 2.3% | | |
| Atlas Copco AB, A Shares | 2,604 |
| 75,822 |
|
| Electrolux AB, Series B | 6,884 |
| 156,791 |
|
Epiroc AB, A Shares(1) | 2,604 |
| 27,326 |
|
| Industrivarden AB, C Shares | 10,789 |
| 209,233 |
|
| Kinnevik AB, B Shares | 1,347 |
| 46,154 |
|
| Sandvik AB | 11,666 |
| 207,095 |
|
| | | 722,421 |
|
| Switzerland — 6.7% | | |
Inficon Holding AG(1) | 428 |
| 218,473 |
|
| Nestle SA | 3,944 |
| 306,264 |
|
| Novartis AG | 5,113 |
| 388,677 |
|
| Partners Group Holding AG | 388 |
| 285,035 |
|
| Roche Holding AG | 2,739 |
| 610,003 |
|
| Zurich Insurance Group AG | 1,164 |
| 345,686 |
|
| | | 2,154,138 |
|
| Taiwan — 1.6% | | |
| Formosa Chemicals & Fibre Corp. | 31,000 |
| 123,538 |
|
| Formosa Plastics Corp. | 50,000 |
| 184,496 |
|
|
| | | | | |
| | Shares | Value |
| Taiwan Semiconductor Manufacturing Co. Ltd. ADR | 2,500 |
| $ | 91,400 |
|
| Uni-President Enterprises Corp. | 42,000 |
| 106,624 |
|
| | | 506,058 |
|
| United Kingdom — 17.7% | | |
| 3i Group plc | 9,400 |
| 111,725 |
|
| Anglo American plc | 14,316 |
| 320,208 |
|
| Antofagasta plc | 17,684 |
| 231,051 |
|
| BAE Systems plc | 38,346 |
| 327,327 |
|
| BHP Billiton plc | 20,922 |
| 471,058 |
|
| BP plc | 10,000 |
| 76,321 |
|
| BT Group plc | 14,626 |
| 42,041 |
|
| Centrica plc | 34,423 |
| 71,620 |
|
| Direct Line Insurance Group plc | 51,024 |
| 230,905 |
|
| easyJet plc | 3,372 |
| 74,452 |
|
| GlaxoSmithKline plc | 23,987 |
| 484,287 |
|
| Hikma Pharmaceuticals plc | 1,994 |
| 39,500 |
|
| HSBC Holdings plc | 19,341 |
| 181,408 |
|
| Imperial Brands plc | 7,448 |
| 277,389 |
|
Indivior plc(1) | 9,505 |
| 48,069 |
|
| International Consolidated Airlines Group SA | 31,433 |
| 276,113 |
|
| Investec plc | 17,620 |
| 125,107 |
|
| Legal & General Group plc | 37,276 |
| 130,859 |
|
| Marks & Spencer Group plc | 8,185 |
| 31,877 |
|
| National Express Group plc | 47,929 |
| 254,029 |
|
| Rio Tinto plc | 9,319 |
| 516,671 |
|
| Royal Dutch Shell plc, B Shares | 14,665 |
| 525,175 |
|
| Royal Mail plc | 34,747 |
| 231,763 |
|
| Standard Life Aberdeen plc | 31,982 |
| 137,472 |
|
Tullow Oil plc(1) | 22,238 |
| 71,904 |
|
| Unilever plc | 691 |
| 38,229 |
|
| Vodafone Group plc | 149,025 |
| 361,529 |
|
| | | 5,688,089 |
|
TOTAL COMMON STOCKS
(Cost $30,716,868) | | 31,239,299 |
|
| EXCHANGE-TRADED FUNDS — 2.0% | | |
| iShares MSCI EAFE ETF | 6,000 |
| 401,820 |
|
| iShares MSCI Japan ETF | 4,136 |
| 239,516 |
|
TOTAL EXCHANGE-TRADED FUNDS
(Cost $629,614) | | 641,336 |
|
| TEMPORARY CASH INVESTMENTS — 0.2% | | |
State Street Institutional U.S. Government Money Market Fund, Premier Class
(Cost $67,723) | 67,723 |
| 67,723 |
|
TOTAL INVESTMENT SECURITIES — 99.5%
(Cost $31,414,205) | | 31,948,358 |
|
| OTHER ASSETS AND LIABILITIES — 0.5% | | 165,110 |
|
| TOTAL NET ASSETS — 100.0% | | $ | 32,113,468 |
|
|
| | |
| MARKET SECTOR DIVERSIFICATION | |
| (as a % of net assets) | |
| Financials | 16.4 | % |
| Industrials | 15.0 | % |
| Consumer Discretionary | 14.7 | % |
| Health Care | 10.3 | % |
| Materials | 9.1 | % |
| Information Technology | 8.3 | % |
| Consumer Staples | 7.8 | % |
| Energy | 7.1 | % |
| Telecommunication Services | 6.6 | % |
| Real Estate | 1.8 | % |
| Utilities | 0.2 | % |
| Exchange-Traded Funds | 2.0 | % |
| Cash and Equivalents* | 0.7 | % |
* Includes temporary cash investments and other assets and liabilities.
|
| | |
| NOTES TO SCHEDULE OF INVESTMENTS |
| ADR | - | American Depositary Receipt |
| CVA | - | Certificaten Van Aandelen |
See Notes to Financial Statements.
|
|
| Statement of Assets and Liabilities |
|
| | | |
| JUNE 30, 2018 | |
| Assets | |
| Investment securities, at value (cost of $31,414,205) | $ | 31,948,358 |
|
| Foreign currency holdings, at value (cost of $17,608) | 17,572 |
|
| Receivable for capital shares sold | 41,415 |
|
| Dividends and interest receivable | 141,784 |
|
| | 32,149,129 |
|
| | |
| Liabilities | |
| Payable for capital shares redeemed | 3,590 |
|
| Accrued management fees | 30,065 |
|
| Distribution and service fees payable | 2,006 |
|
| | 35,661 |
|
| | |
| Net Assets | $ | 32,113,468 |
|
| | |
| Net Assets Consist of: | |
| Capital (par value and paid-in surplus) | $ | 31,313,589 |
|
| Undistributed net investment income | 338,330 |
|
| Accumulated net realized loss | (71,534 | ) |
| Net unrealized appreciation | 533,083 |
|
| | $ | 32,113,468 |
|
|
| | | | | | |
| | Net Assets | Shares Outstanding | Net Asset Value Per Share |
| Investor Class, $0.01 Par Value |
| $20,459,017 |
| 2,221,162 |
| $9.21 |
| I Class, $0.01 Par Value |
| $5,755,932 |
| 623,550 |
| $9.23 |
| A Class, $0.01 Par Value |
| $4,271,847 |
| 463,312 |
| $9.22* |
| C Class, $0.01 Par Value |
| $986,880 |
| 107,715 |
| $9.16 |
| R Class, $0.01 Par Value |
| $639,792 |
| 69,631 |
| $9.19 |
* Maximum offering price $9.78 (net asset value divided by 0.9425).
See Notes to Financial Statements.
|
| | | |
| YEAR ENDED JUNE 30, 2018 |
| Investment Income (Loss) |
| Income: | |
| Dividends (net of foreign taxes withheld of $96,057) | $ | 1,053,975 |
|
| Interest | 3,472 |
|
| | 1,057,447 |
|
| | |
| Expenses: | |
| Management fees | 375,242 |
|
| Distribution and service fees: | |
| A Class | 10,139 |
|
| C Class | 11,701 |
|
| R Class | 3,514 |
|
| Directors' fees and expenses | 2,065 |
|
| Other expenses | 926 |
|
| | 403,587 |
|
| | |
| Net investment income (loss) | 653,860 |
|
| | |
| Realized and Unrealized Gain (Loss) |
| Net realized gain (loss) on: | |
| Investment transactions (net of foreign tax expenses paid (refunded) of $1,927) | 2,912,690 |
|
| Foreign currency translation transactions | 6,563 |
|
| | 2,919,253 |
|
| | |
| Change in net unrealized appreciation (depreciation) on: | |
| Investments (includes (increase) decrease in accrued foreign taxes of $8,912) | (2,117,762 | ) |
| Translation of assets and liabilities in foreign currencies | (3,517 | ) |
| | (2,121,279 | ) |
| | |
| Net realized and unrealized gain (loss) | 797,974 |
|
| | |
| Net Increase (Decrease) in Net Assets Resulting from Operations | $ | 1,451,834 |
|
See Notes to Financial Statements.
|
|
| Statement of Changes in Net Assets |
|
| | | | | | |
| YEARS ENDED JUNE 30, 2018 AND JUNE 30, 2017 |
| Increase (Decrease) in Net Assets | June 30, 2018 | June 30, 2017 |
| Operations | | |
| Net investment income (loss) | $ | 653,860 |
| $ | 619,263 |
|
| Net realized gain (loss) | 2,919,253 |
| 1,330,949 |
|
| Change in net unrealized appreciation (depreciation) | (2,121,279 | ) | 3,183,851 |
|
| Net increase (decrease) in net assets resulting from operations | 1,451,834 |
| 5,134,063 |
|
| | | |
| Distributions to Shareholders | | |
| From net investment income: | | |
| Investor Class | (516,137 | ) | (587,847 | ) |
| I Class | (127,810 | ) | (41,732 | ) |
| A Class | (83,615 | ) | (131,570 | ) |
| C Class | (15,744 | ) | (17,203 | ) |
| R Class | (11,337 | ) | (13,240 | ) |
| Decrease in net assets from distributions | (754,643 | ) | (791,592 | ) |
| | | |
| Capital Share Transactions | | |
| Net increase (decrease) in net assets from capital share transactions (Note 5) | 1,205,674 |
| (3,134,230 | ) |
| | | |
| Redemption Fees | | |
| Increase in net assets from redemption fees | 1,256 |
| 14,164 |
|
| | | |
| Net increase (decrease) in net assets | 1,904,121 |
| 1,222,405 |
|
| | | |
| Net Assets | | |
| Beginning of period | 30,209,347 |
| 28,986,942 |
|
| End of period | $ | 32,113,468 |
| $ | 30,209,347 |
|
| | | |
| Undistributed net investment income | $ | 338,330 |
| $ | 271,686 |
|
See Notes to Financial Statements.
|
|
| Notes to Financial Statements |
JUNE 30, 2018
1. Organization
American Century Quantitative Equity Funds, Inc. (the corporation) is registered under the Investment Company Act of 1940, as amended (the 1940 Act), as an open-end management investment company and is organized as a Maryland corporation. International Core Equity Fund (the fund) is one fund in a series issued by the corporation. The fund’s investment objective is to seek long-term capital growth.
The fund offers the Investor Class, I Class, A Class, C Class and R Class. The A Class may incur an initial sales charge. The A Class and C Class may be subject to a contingent deferred sales charge.
2. Significant Accounting Policies
The following is a summary of significant accounting policies consistently followed by the fund in preparation of its financial statements. The fund is an investment company and follows accounting and reporting guidance in accordance with accounting principles generally accepted in the United States of America. This may require management to make certain estimates and assumptions at the date of the financial statements. Actual results could differ from these estimates. Management evaluated the impact of events or transactions occurring through the date the financial statements were issued that would merit recognition or disclosure.
Investment Valuations — The fund determines the fair value of its investments and computes its net asset value per share at the close of regular trading (usually 4 p.m. Eastern time) on the New York Stock Exchange (NYSE) on each day the NYSE is open. The Board of Directors has adopted valuation policies and procedures to guide the investment advisor in the fund’s investment valuation process and to provide methodologies for the oversight of the fund’s pricing function.
Equity securities that are listed or traded on a domestic securities exchange are valued at the last reported sales price or at the official closing price as provided by the exchange. Equity securities traded on foreign securities exchanges are generally valued at the closing price of such securities on the exchange where primarily traded or at the close of the NYSE, if that is earlier. If no last sales price is reported, or if local convention or regulation so provides, the mean of the latest bid and asked prices may be used. Securities traded over-the-counter are valued at the mean of the latest bid and asked prices, the last sales price, or the official closing price. Equity securities initially expressed in local currencies are translated into U.S. dollars at the mean of the appropriate currency exchange rate at the close of the NYSE as provided by an independent pricing service.
Open-end management investment companies are valued at the reported net asset value per share.
If the fund determines that the market price for an investment is not readily available or the valuation methods mentioned above do not reflect an investment’s fair value, such investment is valued as determined in good faith by the Board of Directors or its delegate, in accordance with policies and procedures adopted by the Board of Directors. In its determination of fair value, the fund may review several factors including, but not limited to, market information regarding the specific investment or comparable investments and correlation with other investment types, futures indices or general market indicators. Circumstances that may cause the fund to use these procedures to value an investment include, but are not limited to: an investment has been declared in default or is distressed; trading in a security has been suspended during the trading day or a security is not actively trading on its principal exchange; prices received from a regular pricing source are deemed unreliable; or there is a foreign market holiday and no trading occurred.
The fund monitors for significant events occurring after the close of an investment’s primary exchange but before the fund’s net asset value per share is determined. Significant events may include, but are not limited to: corporate announcements and transactions; governmental action and political unrest that could impact a specific investment or an investment sector; or armed conflicts, natural disasters and similar events that could affect investments in a specific country or region. The fund also monitors for significant fluctuations between domestic and foreign markets, as evidenced by the U.S. market or such other indicators that the Board of Directors, or its delegate, deems appropriate. If significant fluctuations in foreign markets are identified, the fund may apply a model-derived factor to the closing price of equity securities traded on foreign securities exchanges. The factor is based on observable market data as provided by an independent pricing service.
Security Transactions — Security transactions are accounted for as of the trade date. Net realized gains and losses are determined on the identified cost basis, which is also used for federal income tax purposes. Certain countries impose taxes on realized gains on the sale of securities registered in their country. The fund records the foreign tax expense, if any, on an accrual basis. The foreign tax expense on realized gains and unrealized appreciation reduces the net realized gain (loss) on investment transactions and net unrealized appreciation (depreciation) on investments, respectively.
Investment Income — Dividend income less foreign taxes withheld, if any, is recorded as of the ex-dividend date. Distributions received on securities that represent a return of capital or long-term capital gain are recorded as a reduction of cost of investments and/or as a realized gain. The fund may estimate the components of distributions received that may be considered nontaxable distributions or long-term capital gain distributions for income tax purposes. Interest income is recorded on the accrual basis and includes accretion of discounts and amortization of premiums.
Foreign Currency Translations — All assets and liabilities initially expressed in foreign currencies are translated into U.S. dollars at prevailing exchange rates at period end. The fund may enter into spot foreign currency exchange contracts to facilitate transactions denominated in a foreign currency. Purchases and sales of investment securities, dividend and interest income, spot foreign currency exchange contracts, and expenses are translated at the rates of exchange prevailing on the respective dates of such transactions. Net realized and unrealized foreign currency exchange gains or losses related to investment securities are a component of net realized gain (loss) on investment transactions and change in net unrealized appreciation (depreciation) on investments, respectively.
Income Tax Status — It is the fund’s policy to distribute substantially all net investment income and net realized gains to shareholders and to otherwise qualify as a regulated investment company under provisions of the Internal Revenue Code. Accordingly, no provision has been made for income taxes. The fund files U.S. federal, state, local and non-U.S. tax returns as applicable. The fund's tax returns are subject to examination by the relevant taxing authority until expiration of the applicable statute of limitations, which is generally three years from the date of filing but can be longer in certain jurisdictions. At this time, management believes there are no uncertain tax positions which, based on their technical merit, would not be sustained upon examination and for which it is reasonably possible that the total amounts of unrecognized tax benefits will significantly change in the next twelve months.
Multiple Class — All shares of the fund represent an equal pro rata interest in the net assets of the class to which such shares belong, and have identical voting, dividend, liquidation and other rights and the same terms and conditions, except for class specific expenses and exclusive rights to vote on matters affecting only individual classes. Income, non-class specific expenses, and realized and unrealized capital gains and losses of the fund are allocated to each class of shares based on their relative net assets.
Distributions to Shareholders — Distributions from net investment income and net realized gains, if any, are generally declared and paid annually.
Redemption Fees — Prior to October 9, 2017, the fund may have imposed a 2.00% redemption fee on shares held less than 60 days. The fee was not applicable to all classes. The redemption fee was retained by the fund to help cover transaction costs that long-term investors may bear when the fund sells securities to meet investor redemptions.
Indemnifications — Under the corporation’s organizational documents, its officers and directors are indemnified against certain liabilities arising out of the performance of their duties to the fund. In addition, in the normal course of business, the fund enters into contracts that provide general indemnifications. The maximum exposure under these arrangements is unknown as this would involve future claims that may be made against a fund. The risk of material loss from such claims is considered by management to be remote.
3. Fees and Transactions with Related Parties
Certain officers and directors of the corporation are also officers and/or directors of American Century Companies, Inc. (ACC). The corporation’s investment advisor, American Century Investment Management, Inc. (ACIM), the corporation's distributor, American Century Investment Services, Inc. (ACIS), and the corporation’s transfer agent, American Century Services, LLC, are wholly owned, directly or indirectly, by ACC.
Management Fees — The corporation has entered into a management agreement with ACIM, under which ACIM provides the fund with investment advisory and management services in exchange for a single, unified management fee (the fee) per class. The agreement provides that all expenses of managing and operating the fund, except distribution and service fees, brokerage expenses, taxes, interest, fees and expenses of the independent directors (including legal counsel fees), and extraordinary expenses, will be paid by ACIM. The fee is computed and accrued daily based on each class's daily net assets and paid monthly in arrears. The difference in the fee among the classes is a result of their separate arrangements for non-Rule 12b-1 shareholder services. It is not the result of any difference in advisory or custodial fees or other expenses related to the management of the fund’s assets, which do not vary by class. The fee consists of (1) an Investment Category Fee based on the daily net assets of the fund and certain other accounts managed by the investment advisor that are in the same broad investment category as the fund and (2) a Complex Fee based on the assets of all the funds in the American Century Investments family of funds.
The Investment Category Fee range, the Complex Fee range and the effective annual management fee for each class for the period ended June 30, 2018 are as follows:
|
| | | |
| | Investment Category Fee Range | Complex Fee Range | Effective Annual Management Fee |
| Investor Class | 0.8180%
to 1.0000% | 0.2500% to 0.3100% | 1.14% |
| I Class | 0.0500% to 0.1100% | 0.94% |
| A Class | 0.2500% to 0.3100% | 1.14% |
| C Class | 0.2500% to 0.3100% | 1.14% |
| R Class | 0.2500% to 0.3100% | 1.14% |
Distribution and Service Fees — The Board of Directors has adopted a separate Master Distribution and Individual Shareholder Services Plan for each of the A Class, C Class and R Class (collectively the plans), pursuant to Rule 12b-1 of the 1940 Act. The plans provide that the A Class will pay ACIS an annual distribution and service fee of 0.25%. The plans provide that the C Class will pay ACIS an annual distribution and service fee of 1.00%, of which 0.25% is paid for individual shareholder services and 0.75% is paid for distribution services. The plans provide that the R Class will pay ACIS an annual distribution and service fee of 0.50%. The fees are computed and accrued daily based on each class’s daily net assets and paid monthly in arrears. The fees are used to pay financial intermediaries for distribution and individual shareholder services. Fees incurred under the plans during the period ended June 30, 2018 are detailed in the Statement of Operations.
Directors' Fees and Expenses — The Board of Directors is responsible for overseeing the investment advisor’s management and operations of the fund. The directors receive detailed information about the fund and its investment advisor regularly throughout the year, and meet at least quarterly with management of the investment advisor to review reports about fund operations. The fund’s officers do not receive compensation from the fund.
Interfund Transactions — The fund may enter into security transactions with other American Century Investments funds and other client accounts of the investment advisor, in accordance with the 1940 Act rules and procedures adopted by the Board of Directors. The rules and procedures require, among other things, that these transactions be effected at the independent current market price of the security. During the period, the interfund sales were $186,706 and there were no interfund purchases. The effect of interfund transactions on the Statement of Operations was $(6,478) in net realized gain (loss) on investment transactions.
4. Investment Transactions
Purchases and sales of investment securities, excluding short-term investments, for the period ended June 30, 2018 were $34,150,141 and $32,913,864, respectively.
5. Capital Share Transactions
Transactions in shares of the fund were as follows:
|
| | | | | | | | | | |
| | Year ended June 30, 2018 | Year ended
June 30, 2017 |
| | Shares | Amount | Shares | Amount |
| Investor Class/Shares Authorized | 40,000,000 |
| | 40,000,000 |
| |
| Sold | 645,731 |
| $ | 6,175,791 |
| 1,400,301 |
| $ | 11,621,285 |
|
| Issued in reinvestment of distributions | 53,279 |
| 506,681 |
| 73,609 |
| 571,945 |
|
| Redeemed | (802,902 | ) | (7,685,849 | ) | (1,698,539 | ) | (13,938,911 | ) |
| | (103,892 | ) | (1,003,377 | ) | (224,629 | ) | (1,745,681 | ) |
| I Class/Shares Authorized | 25,000,000 |
| | 25,000,000 |
| |
| Sold | 350,565 |
| 3,358,023 |
| 405,635 |
| 3,562,135 |
|
| Issued in reinvestment of distributions | 13,145 |
| 125,144 |
| 5,364 |
| 41,732 |
|
| Redeemed | (196,352 | ) | (1,911,066 | ) | (107,974 | ) | (878,910 | ) |
| | 167,358 |
| 1,572,101 |
| 303,025 |
| 2,724,957 |
|
| A Class/Shares Authorized | 20,000,000 |
| | 20,000,000 |
| |
| Sold | 149,264 |
| 1,427,760 |
| 79,860 |
| 659,464 |
|
| Issued in reinvestment of distributions | 8,758 |
| 83,549 |
| 16,881 |
| 131,504 |
|
| Redeemed | (61,528 | ) | (590,835 | ) | (565,166 | ) | (4,769,422 | ) |
| | 96,494 |
| 920,474 |
| (468,425 | ) | (3,978,454 | ) |
| C Class/Shares Authorized | 15,000,000 |
| | 15,000,000 |
| |
| Sold | 13,943 |
| 130,619 |
| 29,282 |
| 243,300 |
|
| Issued in reinvestment of distributions | 1,529 |
| 14,542 |
| 2,029 |
| 15,765 |
|
| Redeemed | (34,929 | ) | (336,899 | ) | (52,144 | ) | (420,543 | ) |
| | (19,457 | ) | (191,738 | ) | (20,833 | ) | (161,478 | ) |
| R Class/Shares Authorized | 15,000,000 |
| | 15,000,000 |
| |
| Sold | 17,529 |
| 166,488 |
| 13,164 |
| 111,074 |
|
| Issued in reinvestment of distributions | 1,192 |
| 11,337 |
| 1,704 |
| 13,240 |
|
| Redeemed | (27,973 | ) | (269,611 | ) | (11,773 | ) | (97,888 | ) |
| | (9,252 | ) | (91,786 | ) | 3,095 |
| 26,426 |
|
| Net increase (decrease) | 131,251 |
| $ | 1,205,674 |
| (407,767 | ) | $ | (3,134,230 | ) |
6. Fair Value Measurements
The fund’s investments valuation process is based on several considerations and may use multiple inputs to determine the fair value of the investments held by the fund. In conformity with accounting principles generally accepted in the United States of America, the inputs used to determine a valuation are classified into three broad levels.
• Level 1 valuation inputs consist of unadjusted quoted prices in an active market for identical investments.
• Level 2 valuation inputs consist of direct or indirect observable market data (including quoted prices for comparable investments, evaluations of subsequent market events, interest rates, prepayment speeds, credit risk, etc.). These inputs also consist of quoted prices for identical investments initially expressed in local currencies that are adjusted through translation into U.S. dollars.
• Level 3 valuation inputs consist of unobservable data (including a fund’s own assumptions).
The level classification is based on the lowest level input that is significant to the fair valuation measurement. The valuation inputs are not necessarily an indication of the risks associated with investing in these securities or other financial instruments. There were no significant transfers between levels during the period.
The following is a summary of the level classifications as of period end. The Schedule of Investments provides additional information on the fund’s portfolio holdings.
|
| | | | | | | | |
| | Level 1 | Level 2 | Level 3 |
| Assets | | | |
| Investment Securities | | | |
| Common Stocks | $ | 179,800 |
| $ | 31,059,499 |
| — |
|
| Exchange-Traded Funds | 641,336 |
| — |
| — |
|
| Temporary Cash Investments | 67,723 |
| — |
| — |
|
| | $ | 888,859 |
| $ | 31,059,499 |
| — |
|
7. Risk Factors
There are certain risks involved in investing in foreign securities. These risks include those resulting from future adverse political, social and economic developments, fluctuations in currency exchange rates, the possible imposition of exchange controls, and other foreign laws or restrictions. Investing in emerging markets may accentuate these risks.
8. Federal Tax Information
The tax character of distributions paid during the years ended June 30, 2018 and June 30, 2017 were as follows:
|
| | | | | | |
| | 2018 | 2017 |
| Distributions Paid From | | |
| Ordinary income | $ | 754,643 |
| $ | 791,592 |
|
| Long-term capital gains | — |
| — |
|
The book-basis character of distributions made during the year from net investment income or net realized gains may differ from their ultimate characterization for federal income tax purposes. These differences reflect the differing character of certain income items and net realized gains and losses for financial statement and tax purposes, and may result in reclassification among certain capital accounts on the financial statements.
The reclassifications, which are primarily due to the expiration of capital loss carryovers, were made to capital
$(1,979,923), undistributed net investment income $167,427, and accumulated net realized loss $1,812,496.
As of period end, the federal tax cost of investments and the components of distributable earnings on a tax-basis were as follows:
|
| | | |
| Federal tax cost of investments | $ | 31,418,049 |
|
| Gross tax appreciation of investments | $ | 2,435,443 |
|
| Gross tax depreciation of investments | (1,905,134 | ) |
| Net tax appreciation (depreciation) of investments | 530,309 |
|
| Net tax appreciation (depreciation) on translation of assets and liabilities in foreign currencies | (1,070 | ) |
| Net tax appreciation (depreciation) | $ | 529,239 |
|
| Undistributed ordinary income | $ | 339,900 |
|
| Accumulated short-term capital losses | $ | (69,260 | ) |
The difference between book-basis and tax-basis unrealized appreciation (depreciation) is attributable primarily to the tax deferral of losses on wash sales.
Accumulated capital losses represent net capital loss carryovers that may be used to offset future realized capital gains for federal income tax purposes. The capital loss carryovers may be carried forward for an unlimited period. Future capital loss carryover utilization in any given year may be subject to Internal Revenue Code limitations.
|
| | | | | | | | | | | | | |
| For a Share Outstanding Throughout the Years Ended June 30 (except as noted) |
| Per-Share Data | | | Ratios and Supplemental Data | | |
| | | Income From Investment Operations: | | | | Ratio to Average Net Assets of: | | |
| | Net Asset Value, Beginning of Period | Net Investment Income (Loss)(1) | Net Realized and Unrealized Gain (Loss) | Total From Investment Operations | Distributions From Net Investment Income | Net Asset Value, End of Period | Total Return(2) | Operating Expenses | Net Investment Income (Loss) | Portfolio Turnover Rate | Net Assets, End of Period (in thousands) |
| Investor Class | | | | | | | |
| 2018 | $9.01 | 0.19 | 0.23 | 0.42 | (0.22) | $9.21 | 4.69% | 1.15% | 1.97% | 99% |
| $20,459 |
|
| 2017 | $7.71 | 0.18 | 1.33 | 1.51 | (0.21) | $9.01 | 19.92% | 1.15% | 2.19% | 113% |
| $20,938 |
|
| 2016 | $8.89 | 0.16 | (1.18) | (1.02) | (0.16) | $7.71 | (11.53)% | 1.17% | 1.94% | 117% |
| $19,646 |
|
| 2015 | $9.68 | 0.24 | (0.75) | (0.51) | (0.28) | $8.89 | (5.11)% | 1.15% | 2.67% | 96% |
| $22,366 |
|
| 2014 | $7.77 | 0.26 | 1.76 | 2.02 | (0.11) | $9.68 | 26.15% | 1.15% | 2.61% | 125% |
| $11,859 |
|
| I Class | | | | | | | |
| 2018 | $9.02 | 0.22 | 0.23 | 0.45 | (0.24) | $9.23 | 4.89% | 0.95% | 2.17% | 99% |
| $5,756 |
|
| 2017 | $7.72 | 0.20 | 1.33 | 1.53 | (0.23) | $9.02 | 20.26% | 0.95% | 2.39% | 113% |
| $4,117 |
|
| 2016 | $8.90 | 0.17 | (1.17) | (1.00) | (0.18) | $7.72 | (11.34)% | 0.97% | 2.14% | 117% |
| $1,183 |
|
| 2015 | $9.69 | 0.26 | (0.75) | (0.49) | (0.30) | $8.90 | (4.91)% | 0.95% | 2.87% | 96% |
| $1,621 |
|
| 2014 | $7.78 | 0.28 | 1.76 | 2.04 | (0.13) | $9.69 | 26.37% | 0.95% | 2.81% | 125% |
| $921 |
|
| A Class | | | | | | | |
| 2018 | $9.01 | 0.17 | 0.23 | 0.40 | (0.19) | $9.22 | 4.41% | 1.40% | 1.72% | 99% |
| $4,272 |
|
| 2017 | $7.71 | 0.15 | 1.34 | 1.49 | (0.19) | $9.01 | 19.74% | 1.40% | 1.94% | 113% |
| $3,307 |
|
| 2016 | $8.89 | 0.13 | (1.17) | (1.04) | (0.14) | $7.71 | (11.75)% | 1.42% | 1.69% | 117% |
| $6,441 |
|
| 2015 | $9.67 | 0.24 | (0.76) | (0.52) | (0.26) | $8.89 | (5.25)% | 1.40% | 2.42% | 96% |
| $8,196 |
|
| 2014 | $7.76 | 0.16 | 1.84 | 2.00 | (0.09) | $9.67 | 25.87% | 1.40% | 2.36% | 125% |
| $3,164 |
|
|
| | | | | | | | | | | | | |
| For a Share Outstanding Throughout the Years Ended June 30 (except as noted) |
| Per-Share Data | | | Ratios and Supplemental Data | | |
| | | Income From Investment Operations: | | | | Ratio to Average Net Assets of: | | |
| | Net Asset Value, Beginning of Period | Net Investment Income (Loss)(1) | Net Realized and Unrealized Gain (Loss) | Total From Investment Operations | Distributions From Net Investment Income | Net Asset Value, End of Period | Total Return(2) | Operating Expenses | Net Investment Income (Loss) | Portfolio Turnover Rate | Net Assets, End of Period (in thousands) |
| C Class | | | | | | | |
| 2018 | $8.96 | 0.08 | 0.24 | 0.32 | (0.12) | $9.16 | 3.54% | 2.15% | 0.97% | 99% |
| $987 |
|
| 2017 | $7.66 | 0.10 | 1.33 | 1.43 | (0.13) | $8.96 | 18.96% | 2.15% | 1.19% | 113% |
| $1,139 |
|
| 2016 | $8.84 | 0.08 | (1.18) | (1.10) | (0.08) | $7.66 | (12.48)% | 2.17% | 0.94% | 117% |
| $1,134 |
|
| 2015 | $9.62 | 0.13 | (0.72) | (0.59) | (0.19) | $8.84 | (6.02)% | 2.15% | 1.67% | 96% |
| $1,141 |
|
| 2014 | $7.72 | 0.14 | 1.78 | 1.92 | (0.02) | $9.62 | 24.92% | 2.15% | 1.61% | 125% |
| $1,081 |
|
| R Class | | | | | | | |
| 2018 | $8.98 | 0.13 | 0.25 | 0.38 | (0.17) | $9.19 | 4.17% | 1.65% | 1.47% | 99% |
| $640 |
|
| 2017 | $7.69 | 0.14 | 1.32 | 1.46 | (0.17) | $8.98 | 19.36% | 1.65% | 1.69% | 113% |
| $709 |
|
| 2016 | $8.86 | 0.12 | (1.17) | (1.05) | (0.12) | $7.69 | (11.90)% | 1.67% | 1.44% | 117% |
| $583 |
|
| 2015 | $9.65 | 0.16 | (0.72) | (0.56) | (0.23) | $8.86 | (5.61)% | 1.65% | 2.17% | 96% |
| $538 |
|
| 2014 | $7.74 | 0.19 | 1.79 | 1.98 | (0.07) | $9.65 | 25.62% | 1.65% | 2.11% | 125% |
| $1,242 |
|
|
|
| Notes to Financial Highlights |
| |
| (1) | Computed using average shares outstanding throughout the period. |
| |
| (2) | Total returns are calculated based on the net asset value of the last business day and do not reflect applicable sales charges, if any. Total returns for periods less than one year are not annualized. |
See Notes to Financial Statements.
|
|
| Report of Independent Registered Public Accounting Firm |
To the Board of Directors of American Century Quantitative Equity Funds, Inc. and Shareholders of International Core Equity Fund
Opinion on the Financial Statements
We have audited the accompanying statement of assets and liabilities, including the schedule of investments, of International Core Equity Fund (one of the funds constituting American Century Quantitative Equity Funds, Inc., referred to hereafter as the "Fund") as of June 30, 2018, the related statement of operations for the year ended June 30, 2018, the statement of changes in net assets for each of the two years in the period ended June 30, 2018, including the related notes, and the financial highlights for each of the five years in the period ended June 30, 2018 (collectively referred to as the “financial statements”). In our opinion, the financial statements present fairly, in all material respects, the financial position of the Fund as of June 30, 2018, the results of its operations for the year then ended, the changes in its net assets for each of the two years in the period ended June 30, 2018 and the financial highlights for each of the five years in the period ended June 30, 2018 in conformity with accounting principles generally accepted in the United States of America.
Basis for Opinion
These financial statements are the responsibility of the Fund’s management. Our responsibility is to express an opinion on the Fund’s financial statements based on our audits. We are a public accounting firm registered with the Public Company Accounting Oversight Board (United States) (“PCAOB”) and are required to be independent with respect to the Fund in accordance with the U.S. federal securities laws and the applicable rules and regulations of the Securities and Exchange Commission and the PCAOB.
We conducted our audits of these financial statements in accordance with the standards of the PCAOB. Those standards require that we plan and perform the audit to obtain reasonable assurance about whether the financial statements are free of material misstatement, whether due to error or fraud.
Our audits included performing procedures to assess the risks of material misstatement of the financial statements, whether due to error or fraud, and performing procedures that respond to those risks. Such procedures included examining, on a test basis, evidence regarding the amounts and disclosures in the financial statements. Our audits also included evaluating the accounting principles used and significant estimates made by management, as well as evaluating the overall presentation of the financial statements. Our procedures included confirmation of securities owned as of June 30, 2018 by correspondence with the custodian and brokers. We believe that our audits provide a reasonable basis for our opinion.
/s/ PricewaterhouseCoopers LLP
Kansas City, Missouri
August 16, 2018
We have served as the auditor of one or more investment companies in American Century Investments since 1997.
The Board of Directors
The individuals listed below serve as directors of the funds. Each director will continue to serve in this capacity until death, retirement, resignation or removal from office. The board has adopted a mandatory retirement age for directors who are not “interested persons,” as that term is defined in the Investment Company Act (independent directors). Independent directors shall retire by December 31 of the year in which they reach their 75th birthday; provided, however, that on or after January 1, 2022, independent trustees shall retire on December 31 of the year in which they reach their 76th birthday.
Mr. Thomas is an “interested person” because he currently serves as President and Chief Executive Officer of American Century Companies, Inc. (ACC), the parent company of American Century Investment Management, Inc. (ACIM or the advisor). The other directors (more than three-fourths of the total number) are independent. They are not employees, directors or officers of, and have no financial interest in, ACC or any of its wholly owned, direct or indirect, subsidiaries, including ACIM, American Century Investment Services, Inc. (ACIS) and American Century Services, LLC (ACS), and they do not have any other affiliations, positions or relationships that would cause them to be considered “interested persons” under the Investment Company Act. The directors serve in this capacity for eight (in the case of Jonathan S. Thomas, 16; and Ronald J. Gilson, 9) registered investment companies in the American Century Investments family of funds.
The following table presents additional information about the directors. The mailing address for each director other than Mr. Thomas is 1665 Charleston Road, Mountain View, California 94043. The mailing address for Mr. Thomas is 4500 Main Street, Kansas City, Missouri 64111.
|
| | | | | |
Name
(Year of Birth) | Position(s) Held with Funds | Length of Time Served | Principal Occupation(s) During Past 5 Years | Number of American Century Portfolios Overseen by Director | Other Directorships Held During Past 5 Years |
| Independent Directors |
|
|
Tanya S. Beder
(1955) | Director | Since 2011 | Chairman and CEO, SBCC Group Inc. (independent advisory services) (2006 to present) | 45 | CYS Investments, Inc.; Nabors Industries Ltd. |
Jeremy I. Bulow
(1954) | Director | Since 2011 | Professor of Economics, Stanford University, Graduate School of Business (1979 to present) | 45 | None |
Anne Casscells
(1958) | Director | Since 2016 | Co-Chief Executive Officer and Chief Investment Officer, Aetos Alternatives Management (investment advisory firm) (2001 to present); Lecturer in Accounting, Stanford University, Graduate School of Business (2009 to present) | 45 | None |
|
| | | | | |
Name
(Year of Birth) | Position(s) Held with Funds | Length of Time Served | Principal Occupation(s) During Past 5 Years | Number of American Century Portfolios Overseen by Director | Other Directorships Held During Past 5 Years |
| Independent Directors |
|
|
Ronald J. Gilson
(1946) | Director and Chairman of the Board | Since 1995
(Chairman since 2005) | Charles J. Meyers Professor of Law and Business, Emeritus, Stanford Law School (1979 to 2016); Marc and Eva Stern Professor of Law and Business, Columbia University School of Law (1992 to present) | 47 | None |
Frederick L. A. Grauer
(1946) | Director | Since 2008 | Senior Advisor, iShares by BlackRock, Inc. (investment management firm) (2010 to 2011, 2013 to 2015); Senior Advisor, Course Hero (an educational technology company) (2015 to present) | 45 | None |
Jonathan D. Levin
(1972) | Director | Since 2016 | Philip H. Knight Professor and Dean, Graduate School of Business, Stanford University (2016 to present); Professor, Stanford University, (2000 to present); Chair, Department of Economics, Stanford University (2011 to 2014) | 45 | None |
Peter F. Pervere
(1947) | Director | Since 2007 | Retired | 45 | None |
John B. Shoven
(1947) | Director | Since 2002 | Charles R. Schwab Professor of Economics, Stanford University (1973 to present) | 45 | Cadence Design Systems; Exponent; Financial Engines |
| Interested Director |
|
|
Jonathan S. Thomas
(1963) | Director and President | Since 2007 | President and Chief Executive Officer, ACC (2007 to present). Also serves as Chief Executive Officer, ACS; Executive Vice President, ACIM; Director, ACC, ACIM and other ACC subsidiaries | 115 | BioMed Valley Discoveries, Inc. |
The Statement of Additional Information has additional information about the fund's directors and is available without charge, upon request, by calling 1-800-345-2021.
Officers
The following table presents certain information about the executive officers of the funds. Each officer serves as an officer for each of the 16 (in the case of Robert J. Leach, 15) investment companies in the American Century family of funds, unless otherwise noted. No officer is compensated for his or her service as an officer of the funds. The listed officers are interested persons of the funds and are appointed or re-appointed on an annual basis. The mailing address for each officer listed below is 4500 Main Street, Kansas City, Missouri 64111.
|
| | |
Name
(Year of Birth) | Offices with the Funds | Principal Occupation(s) During the Past Five Years |
Jonathan S. Thomas
(1963) | Director and President since 2007 | President and Chief Executive Officer, ACC (2007 to present). Also serves as Chief Executive Officer, ACS; Executive Vice President, ACIM; Director, ACC, ACIM and other ACC subsidiaries |
Amy D. Shelton
(1964) | Chief Compliance Officer and Vice President since 2014 | Chief Compliance Officer, American Century funds, (2014 to present); Chief Compliance Officer, ACIM (2014 to present); Chief Compliance Officer, ACIS (2009 to present); Vice President, Client Interactions and Marketing, ACIS (2013 to 2014). Also serves as Vice President, ACIS |
Charles A. Etherington
(1957) | General Counsel since 2007 and Senior Vice President since 2006 | Attorney, ACC (1994 to present); Vice President, ACC (2005 to present); General Counsel, ACC (2007 to present). Also serves as General Counsel, ACIM, ACS, ACIS and other ACC subsidiaries; and Senior Vice President, ACIM and ACS |
C. Jean Wade
(1964) | Vice President,Treasurer and Chief Financial Officer since 2012 | Senior Vice President, ACS (2017 to present); Vice President, ACS (2000 to 2017) |
Robert J. Leach
(1966) | Vice President since 2006 and Assistant Treasurer since 2012 | Vice President, ACS (2000 to present) |
David H. Reinmiller
(1963) | Vice President since 2000 | Attorney, ACC (1994 to present). Also serves as Vice President, ACIM and ACS |
Ward D. Stauffer
(1960) | Secretary since 2005 | Attorney, ACC (2003 to present) |
|
|
| Approval of Management Agreement |
At a meeting held on June 19, 2018, the Fund’s Board of Directors (the "Board") unanimously approved the renewal of the management agreement pursuant to which American Century Investment Management, Inc. (the “Advisor”) acts as the investment advisor for the Fund. Under Section 15(c) of the Investment Company Act, contracts for investment advisory services are required to be reviewed, evaluated, and approved by a majority of a fund’s directors/trustees, including a majority of the independent Directors, each year. The Board regards this annual evaluation and renewal as one of its most important responsibilities.
The independent Directors have memorialized a statement regarding the relationship between their ongoing obligations to oversee and evaluate the performance of the Advisor and their annual consideration of renewal of the management agreement. In that statement, the independent Directors noted that their assessment of the Advisor’s performance is an ongoing process that takes place over the entire year and is informed by all of the extensive information that the Board and its committees receive and consider over time. This information, together with the additional materials provided specifically in connection with the review, are central to the Board’s assessment of the Advisor’s performance and its determination whether to renew the Fund’s management agreement.
Prior to its consideration of the renewal of the management agreement, the Board requested and reviewed extensive data and analysis relating to the proposed renewal. This information and analysis was compiled by the Advisor and certain independent providers of evaluation data concerning the Fund and the services provided to the Fund by the Advisor.
In connection with its consideration of the renewal of the management agreement, the Board’s review and evaluation of the services provided by the Advisor included, but was not limited to, the following:
| |
| • | the nature, extent, and quality of investment management, shareholder services, and other services provided to the Fund; |
| |
| • | the wide range of other programs and services the Advisor provides to the Fund and its shareholders on a routine and non-routine basis; |
| |
| • | the investment performance of the Fund, including data comparing the Fund’s performance to appropriate benchmarks and/or a peer group of other mutual funds with similar investment objectives and strategies; |
| |
| • | the cost of owning the Fund compared to the cost of owning similar funds; |
| |
| • | the Advisor’s compliance policies, procedures, and regulatory experience; |
| |
| • | financial data showing the cost of services provided to the Fund, the profitability of the Fund to the Advisor, and the overall profitability of the Advisor; |
| |
| • | strategic plans of the Advisor; |
| |
| • | any economies of scale associated with the Advisor’s management of the Fund and other accounts; |
| |
| • | services provided and charges to other investment management clients of the Advisor; |
| |
| • | acquired fund fees and expenses; |
| |
| • | payments and practices in connection with financial intermediaries holding shares of the Fund and the services provided by intermediaries in connection therewith; and |
| |
| • | any collateral benefits derived by the Advisor from the management of the Fund. |
In keeping with its practice, the Board held two in-person meetings to review and discuss the information provided in response to their request and held active discussions with the Advisor regarding the renewal of the management agreement. The independent Directors had the benefit of the advice of their independent counsel throughout the process.
Factors Considered
The Directors considered all of the information provided by the Advisor, the independent data providers, and the independent Directors’ independent counsel in connection with the approval. They determined that the information was sufficient for them to evaluate the management agreement for the Fund. In connection with their review, the Directors did not identify any single factor as being all-important or controlling and each Director may have attributed different levels of importance to different factors. In deciding to renew the management agreement, the Board based its decision on a number of factors, including the following:
Nature, Extent and Quality of Services - Generally. Under the management agreement, the Advisor is responsible for providing or arranging for all services necessary for the operation of the Fund. The Board noted that the Advisor provides or arranges at its own expense a wide variety of services including:
| |
| • | constructing and designing the Fund |
| |
| • | portfolio research and security selection |
| |
| • | initial capitalization/funding |
| |
| • | daily valuation of the Fund’s portfolio |
| |
| • | shareholder servicing and transfer agency, including shareholder confirmations, recordkeeping, and communications |
| |
| • | legal services (except the independent Directors’ counsel) |
| |
| • | regulatory and portfolio compliance |
| |
| • | marketing and distribution (except amounts paid by the Fund under Rule 12b-1 plans) |
The Board noted that many of these services have expanded over time in terms of both quantity and complexity in response to shareholder demands, competition in the industry, changing distribution channels, and the changing regulatory environment.
Investment Management, Shareholder, and Other Services. The nature of the investment management services provided to the Fund is quite complex and allows Fund shareholders access to professional money management, instant diversification of their investments within an asset class, the opportunity to easily diversify among asset classes by investing in or exchanging among various American Century Investments funds, and liquidity. In evaluating investment performance, the Board expects the Advisor to manage the Fund in accordance with its investment objectives and approved strategies. Further, the Directors recognize that the Advisor has an obligation to seek the best execution of fund trades. In providing these services, the Advisor utilizes teams of investment professionals (portfolio managers, analysts, research assistants, and securities traders) who require extensive information technology, research, training, compliance, and other systems to conduct their business. The Board, directly and through its Portfolio Committee, regularly reviews investment performance information for the Fund, together with comparative information for appropriate benchmarks and/or peer groups of similarly-managed funds, over different time horizons. The Directors also review detailed performance information during the management agreement approval process. If performance concerns are identified, the Fund receives special reviews until performance improves, during which the Board discusses with the Advisor the reasons for such results (e.g., market conditions, security selection) and any efforts being undertaken to improve performance. The Fund’s performance was above its benchmark for the one-, three-, five-, and ten-year periods reviewed by the Board. The Board found the investment management services provided by the Advisor to the Fund to be satisfactory and consistent with the management agreement.
Under the management agreement, the Advisor provides the Fund with a comprehensive package of transfer agency, shareholder, and other services. The Board, directly and through various committees of the Board, regularly reviews reports and evaluations of such services at its regular meetings. These reports include, but are not limited to, information regarding the operational efficiency and accuracy of the shareholder and transfer agency services provided, staffing levels, shareholder satisfaction (as measured by external as well as internal sources), technology support, new products and services offered to Fund shareholders, securities trading activities, portfolio valuation services, auditing services, and legal and operational compliance activities. The Board found the services provided by the Advisor to the Fund under the management agreement to be competitive and of high quality.
Costs of Services and Profitability. The Advisor provides detailed information concerning its cost of providing various services to the Fund, its profitability in managing the Fund, its overall profitability, and its financial condition. The Directors have reviewed with the Advisor the methodology used to prepare this financial information. This information is considered in evaluating the Advisor’s financial condition, its ability to continue to provide services under the management agreement, and the reasonableness of the current management fee. The Board concluded that the Advisor’s profits were reasonable in light of the services provided to the Fund.
Economies of Scale. The Board also reviewed information provided by the Advisor regarding the possible existence of economies of scale in connection with the management of the Fund. The Board concluded that economies of scale are difficult to measure and predict with precision, especially on a fund-by-fund basis. The Board concluded that the Advisor is appropriately sharing economies of scale through its competitive fee structure, offering competitive fees from fund inception, and through reinvestment in its business to provide shareholders enhanced and expanded services.
Comparison to Other Funds’ Fees. The management agreement provides that the Fund pays the Advisor a single, all-inclusive (or unified) management fee for providing all services necessary for the management and operation of the Fund, other than brokerage expenses, expenses attributable to short sales, taxes, interest, extraordinary expenses, the fees and expenses of the Fund’s independent Directors (including their independent legal counsel), and expenses incurred in connection with the provision of shareholder services and distribution services under a plan adopted pursuant to Rule 12b-1 under the 1940 Act. Under the unified fee structure, the Advisor is responsible for providing all investment advisory, custody, audit, administrative, compliance, recordkeeping, marketing, and shareholder services, or arranging and supervising third parties to provide such services. By contrast, most other funds are charged a variety of fees, including an investment advisory fee, a transfer agency fee, an administrative fee, distribution charges, and other expenses. Other than their investment advisory fees and any applicable Rule 12b-1 distribution fees, all other components of the total fees charged by these other funds may be increased without shareholder approval. The Board believes the unified fee structure is a benefit to Fund shareholders because it clearly discloses to shareholders the cost of owning Fund shares, and, since the unified fee cannot be increased without a vote of Fund shareholders, it shifts to the Advisor the risk of increased costs of operating the Fund and provides a direct incentive to minimize administrative inefficiencies. Part of the Board’s analysis of fee levels involves reviewing certain evaluative data compiled by an independent provider and comparing the Fund’s unified fee to the total expense ratio of peer funds. The unified fee charged to shareholders of the Fund was in the lowest quartile of the total expense ratios of the Fund’s peer universe. The Board concluded that the management fee paid by the Fund to the Advisor under the management agreement is reasonable in light of the services provided to the Fund.
Comparison to Fees and Services Provided to Other Clients of the Advisor. The Board also requested and received information from the Advisor concerning the nature of the services, fees, costs, and profitability of its advisory services to advisory clients other than the Fund. They observed that these varying types of client accounts require different services and involve different regulatory and entrepreneurial risks than the management of the Fund. The Board analyzed this
information and concluded that the fees charged and services provided to the Fund were reasonable by comparison.
Payments to Intermediaries. The Directors also requested and received a description of payments made to intermediaries by the Fund and the Advisor and services provided by intermediaries. These payments include various payments made by the Fund or the Advisor to different types of intermediaries and recordkeepers for distribution and service activities provided for the Fund. The Directors reviewed such information and received representations from the Advisor that all such payments by the Fund were made pursuant to the Fund’s Rule 12b-1 Plan and that all such payments by the Advisor were made from the Advisor’s resources and reasonable profits. The Board found such payments to be reasonable in scope and purpose.
Collateral or “Fall-Out” Benefits Derived by the Advisor. The Board considered the existence of collateral benefits the Advisor may receive as a result of its relationship with the Fund. The Board noted that the Advisor’s primary business is managing mutual funds and it generally does not use fund or shareholder information to generate profits in other lines of business, and therefore does not derive any significant collateral benefits from them. The Board noted that the Advisor may receive proprietary research from broker-dealers that execute fund portfolio transactions. The Board also determined that the Advisor is able to provide investment management services to certain clients other than the Fund, at least in part, due to its existing infrastructure built to serve the fund complex. The Board noted that the assets of those other accounts are, where applicable, included with the assets of the Fund to determine breakpoints in the management fee schedule.
Existing Relationship. The Board also considered whether there was any reason for not continuing the existing arrangement with the Advisor. In this regard, the Board was mindful of the potential disruptions of the Fund’s operations and various risks, uncertainties, and other effects that could occur as a result of a decision not to continue such relationship. In particular, the Board recognized that most shareholders have invested in the Fund on the strength of the Advisor’s industry standing and reputation and in the expectation that the Advisor will have a continuing role in providing advisory services to the Fund.
Conclusion of the Directors. As a result of this process, the Board, including all of the independent Directors and assisted by the advice of independent legal counsel, taking into account all of the factors discussed above and the information provided by the Advisor and others in connection with its review and throughout the year, concluded that the management agreement between the Fund and the Advisor is fair and reasonable in light of the services provided and should be renewed.
Retirement Account Information
As required by law, distributions you receive from certain retirement accounts are subject to federal income tax withholding, unless you elect not to have withholding apply*. Tax will be withheld on the total amount withdrawn even though you may be receiving amounts that are not subject to withholding, such as nondeductible contributions. In such case, excess amounts of withholding could occur. You may adjust your withholding election so that a greater or lesser amount will be withheld.
If you don’t want us to withhold on this amount, you must notify us to not withhold the federal income tax. You may notify us in writing or in certain situations by telephone or through other electronic means. For systematic withdrawals, your withholding election will remain in effect until revoked or changed by filing a new election. You have the right to revoke your election at any time and change your withholding percentage for future distributions.
Remember, even if you elect not to have income tax withheld, you are liable for paying income tax on the taxable portion of your withdrawal. If you elect not to have income tax withheld or you don’t have enough income tax withheld, you may be responsible for payment of estimated tax. You may incur penalties under the estimated tax rules if your withholding and estimated tax payments are not sufficient. You can reduce or defer the income tax on a distribution by directly or indirectly rolling such distribution over to another IRA or eligible plan. You should consult your tax advisor for additional information.
State tax will be withheld if, at the time of your distribution, your address is within one of the mandatory withholding states and you have federal income tax withheld (or as otherwise required by state law). State taxes will be withheld from your distribution in accordance with the respective state rules.
*Some 403(b), 457 and qualified retirement plan distributions may be subject to 20% mandatory withholding, as they are subject to special tax and withholding rules. Your plan administrator or plan sponsor is required to provide you with a special tax notice explaining those rules at the time you request a distribution. If applicable, federal and/or state taxes may be withheld from your distribution amount.
Proxy Voting Policies
Descriptions of the principles and policies that the fund's investment advisor uses in exercising the voting rights associated with the securities purchased and/or held by the fund are available without charge, upon request, by calling 1-800-345-2021 or visiting the "About Us" page of American Century Investments’ website at americancentury.com. A description of the policies is also available on the Securities and Exchange Commission’s website at sec.gov. Information regarding how the investment advisor voted proxies relating to portfolio securities during the most recent 12-month period ended June 30 is available on the "About Us" page at americancentury.com. It is also available at sec.gov.
Quarterly Portfolio Disclosure
The fund files its complete schedule of portfolio holdings with the Securities and Exchange Commission (SEC) for the first and third quarters of each fiscal year on Form N-Q. The fund’s Forms N-Q are available on the SEC’s website at sec.gov, and may be reviewed and copied at the SEC’s Public Reference Room in Washington, DC. Information on the operation of the Public Reference Room may be obtained by calling 1-800-SEC-0330. The fund also makes its complete schedule of portfolio holdings for the most recent quarter of its fiscal year available on its website at americancentury.com and, upon request, by calling 1-800-345-2021.
Other Tax Information
The following information is provided pursuant to provisions of the Internal Revenue Code.
The fund hereby designates up to the maximum amount allowable as qualified dividend income for the fiscal year ended June 30, 2018.
For the fiscal year ended June 30, 2018, the fund intends to pass through to shareholders foreign source income of $1,129,443 and foreign taxes paid of $96,057, or up to the maximum amount allowable, as a foreign tax credit. Foreign source income and foreign tax expense per outstanding share on June 30, 2018 are $0.3241 and $0.0276, respectively.
|
| | |
| |
| | | |
| Contact Us | americancentury.com | |
| Automated Information Line | 1-800-345-8765 | |
| Investor Services Representative | 1-800-345-2021
or 816-531-5575 | |
| Investors Using Advisors | 1-800-378-9878 | |
Business, Not-For-Profit, Employer-Sponsored
Retirement Plans | 1-800-345-3533 | |
Banks and Trust Companies, Broker-Dealers,
Financial Professionals, Insurance Companies | 1-800-345-6488 | |
| Telecommunications Relay Service for the Deaf | 711 | |
| | | |
| American Century Quantitative Equity Funds, Inc. | |
| | | |
Investment Advisor: American Century Investment Management, Inc. Kansas City, Missouri | |
| | | |
| This report and the statements it contains are submitted for the general information of our shareholders. The report is not authorized for distribution to prospective investors unless preceded or accompanied by an effective prospectus. | |
| | | |
©2018 American Century Proprietary Holdings, Inc. All rights reserved.
CL-ANN-92985 1808 | |
|
| |
| | |
| | Annual Report |
| | |
| | June 30, 2018 |
| | |
| | Multi-Asset Real Return Fund |
| | Investor Class (ASIOX) |
| | I Class (ASINX) |
| | A Class (ASIDX) |
| | C Class (ASIZX) |
| | R Class (ASIUX) |
| | R5 Class (AMRUX) |
|
| | |
| President's Letter | 2 |
|
| Performance | 3 |
|
| Portfolio Commentary | |
|
| Fund Characteristics | |
|
| Shareholder Fee Example | |
|
| Schedule of Investments | |
|
| Statement of Assets and Liabilities | |
|
| Statement of Operations | |
|
| Statement of Changes in Net Assets | |
|
| Notes to Financial Statements | |
|
| Financial Highlights | |
|
| Report of Independent Registered Public Accounting Firm | |
|
| Management | |
|
| Approval of Management Agreement | |
|
| Additional Information | |
|
Any opinions expressed in this report reflect those of the author as of the date of the report, and do not necessarily represent the opinions of American Century Investments® or any other person in the American Century Investments organization. Any such opinions are subject to change at any time based upon market or other conditions and American Century Investments disclaims any responsibility to update such opinions. These opinions may not be relied upon as investment advice and, because investment decisions made by American Century Investments funds are based on numerous factors, may not be relied upon as an indication of trading intent on behalf of any American Century Investments fund. Security examples are used for representational purposes only and are not intended as recommendations to purchase or sell securities. Performance information for comparative indices and securities is provided to American Century Investments by third party vendors. To the best of American Century Investments’ knowledge, such information is accurate at the time of printing.
Jonathan Thomas
Dear Investor:
Thank you for reviewing this annual report for the period ended June 30, 2018. Annual reports help convey important information about fund returns, including market factors that affected performance during the reporting period. For additional, updated investment and market insights, we encourage you to visit our website, americancentury.com.
Volatility’s Return Challenged Financial Markets
Broad U.S. and global stock market indices generally rallied for the first half of the 12-month period. A favorable backdrop of robust corporate earnings results, improving global economic growth, and relatively low interest rates, combined with the effects of U.S. tax reform, drove stock prices higher. For the six months ended December 31, 2017, U.S. stocks (S&P 500 Index) returned 11.42%. U.S. bond returns were also positive, but much more subdued, as the Federal Reserve (the Fed) continued its rate-normalization efforts and interest rates edged higher. The Bloomberg Barclays U.S. Aggregate Bond Index returned 1.24% for the six-month period.
In early February, a force that was largely dormant during 2017—volatility—re-emerged, as better-than-expected economic data triggered expectations for rising inflation, higher interest rates, and a more-hawkish Fed. In response, U.S. Treasury yields climbed to their highest levels in several years, and stock prices plunged. Economic data released in subsequent months were more in line with market expectations, while corporate earnings results remained healthy. These factors helped calm the market unrest, and stocks generally recovered their earlier losses. Nevertheless, rising interest rates, geopolitical tensions, and the mounting threat of a global trade war continued to provide periodic headwinds for investors.
Despite the return of volatility, U.S. stocks (S&P 500 Index) gained14.37% for the 12-month period. Meanwhile, rising U.S. Treasury yields, particularly in the second half of the period, took a toll on bonds and other interest-rate-sensitive investments, including gold, utilities stocks, and real estate investment trusts (REITs). Investment-grade bonds (Bloomberg Barclays U.S. Aggregate Bond Index) returned -0.40% for the 12 months.
With volatility resurfacing, inflationary pressures building, Treasury yields rising, and the implications of U.S. tariff and trade policy still unfolding, investors likely will face new opportunities and challenges in the months ahead. We believe this scenario warrants a disciplined, diversified, and risk-aware approach, using professionally managed portfolios in pursuit of investment goals. We appreciate your continued trust and confidence in us.
Sincerely,
Jonathan Thomas
President and Chief Executive Officer
American Century Investments
|
| | | | | |
| Total Returns as of June 30, 2018 |
| | | | Average Annual Returns | |
| | Ticker Symbol | 1 year | 5 years | Since Inception | Inception Date |
| Investor Class | ASIOX | 7.57% | 1.44% | 1.09% | 4/30/10 |
| Bloomberg Barclays U.S. Treasury Inflation Protected Securities (TIPS) Index | — | 2.11% | 1.68% | 2.89% | — |
| I Class | ASINX | 7.74% | 1.64% | 1.29% | 4/30/10 |
| A Class | ASIDX |
| |
| 4/30/10 |
| No sales charge | | 7.15% | 1.19% | 0.83% | |
| With sales charge | | 1.03% | 0.01% | 0.10% | |
| C Class | ASIZX | 6.42% | 0.43% | 0.07% | 4/30/10 |
| R Class | ASIUX | 6.98% | 0.94% | 0.58% | 4/30/10 |
| R5 Class | AMRUX | 7.74% | — | 7.00% | 4/10/17 |
Fund returns would have been lower if a portion of the fees had not been waived.
Sales charges include initial sales charges and contingent deferred sales charges (CDSCs), as applicable.
A Class shares have a 5.75% maximum initial sales charge and may be subject to a maximum CDSC of 1.00%. C Class shares redeemed within 12 months of purchase are subject to a maximum CDSC of 1.00%. The SEC requires that mutual funds provide performance information net of maximum sales charges in all cases where charges could be applied.
Data presented reflect past performance. Past performance is no guarantee of future results. Current performance may be higher or lower than the performance shown. Total returns for periods less than one year are not annualized. Investment return and principal value will fluctuate, and redemption value may be more or less than original cost. Data assumes reinvestment of dividends and capital gains, and none of the charts reflect the deduction of taxes that a shareholder would pay on fund distributions or the redemption of fund shares. To obtain performance data current to the most recent month end, please call 1-800-345-2021 or visit americancentury.com. For additional information about the fund, please consult the prospectus.
|
|
| Growth of $10,000 Over Life of Class |
| $10,000 investment made April 30, 2010 |
| Performance for other share classes will vary due to differences in fee structure. |
|
| |
| Value on June 30, 2018 |
| | Investor Class — $10,925 |
| |
| | Bloomberg Barclays U.S. Treasury Inflation Protected Securities (TIPS) Index — $12,626 |
| |
Ending value of Investor Class would have been lower if a portion of the fees had not been waived.
|
| | | | | |
| Total Annual Fund Operating Expenses | |
| Investor Class | I Class | A Class | C Class | R Class | R5 Class |
| 1.13% | 0.93% | 1.38% | 2.13% | 1.63% | 0.93% |
The total annual fund operating expenses shown is as stated in the fund’s prospectus current as of the date of this report. The prospectus may vary from the expense ratio shown elsewhere in this report because it is based on a different time period, includes acquired fund fees and expenses, and, if applicable, does not include fee waivers or expense reimbursements.
Data presented reflect past performance. Past performance is no guarantee of future results. Current performance may be higher or lower than the performance shown. Total returns for periods less than one year are not annualized. Investment return and principal value will fluctuate, and redemption value may be more or less than original cost. Data assumes reinvestment of dividends and capital gains, and none of the charts reflect the deduction of taxes that a shareholder would pay on fund distributions or the redemption of fund shares. To obtain performance data current to the most recent month end, please call 1-800-345-2021 or visit americancentury.com. For additional information about the fund, please consult the prospectus.
Portfolio Managers: Bob Gahagan, Brian Howell, John Lovito, Steven Brown, and Peruvemba Satish
Performance Summary
For the 12 months ended June 30, 2018, Multi-Asset Real Return returned 7.57%.* The Bloomberg Barclays U.S. Treasury Inflation Protected Securities (TIPS) Index returned 2.11%. Fund returns reflect operating expenses, while index returns do not.
The fund’s performance reflected the generally positive backdrop for equity, fixed-income, and commodities investments that typically provide investor protection against the primary sources of inflation. The all-TIPS benchmark advanced modestly and outperformed nominal U.S. Treasuries, as the market’s longer-term inflation expectations increased during the period.
U.S. Current Inflation and Inflation Expectations Moved Higher
Although the U.S. economic growth rate slowed during the 12-month reporting period, most economic forecasts suggested gross domestic product (GDP) is poised to accelerate. In its June 2018 economic outlook, the Federal Reserve (the Fed) indicated it expects GDP to reach 2.8% (annualized) for 2018, compared with 2.3% in 2017. Against this backdrop, key measures of U.S. inflation and inflation expectations increased steadily. For example, year-over-year headline inflation, as measured by the Consumer Price Index (CPI), climbed from 1.6% in June 2017 to 2.9% in June 2018. Soaring energy prices—particularly oil, which rose more than 60% (West Texas Intermediate Crude) for the period—accounted for the majority of the gain. Core CPI, which does not include food and energy prices, increased at a more modest pace, from 1.7% in June 2017 to 2.3% in June 2018. Similarly, the Fed’s preferred measure of U.S. inflation, core personal consumption expenditures, increased from 1.5% in June 2017 to the Fed's target level of 2.0% in June 2018.
The market’s expectations for longer-term inflation, as measured by the 10-year breakeven rate (the yield difference between 10-year TIPS and nominal 10-year U.S. Treasuries), also steadily increased, from 174 basis points (bps) in June 2017 to 213 bps a year later. Theoretically, the breakeven rate indicates the market’s expectations for U.S. inflation for the next 10 years (1.74% in June 2017 versus 2.13% as of June 2018).
Meanwhile, the environment of modest economic growth and inflation continued to support the Fed’s tightening policy. The central bank implemented three rate hikes during the reporting period, lifting the federal funds rate target to a range of 1.75% to 2.00%. The Fed also continued making balance sheet cuts.
Inflation Trends Modest and Mixed Outside the U.S.
Outside the U.S., developed markets central banks pursued different paths than the Fed, maintaining aggressive stimulus programs in an effort to boost growth and inflation. Overall, non-U.S. developed markets economic growth generally increased in the first half of the reporting period
* All fund returns referenced in this commentary are for Investor Class shares. Returns would have been lower if a portion of the fees had not been waived. Performance for other share classes will vary due to differences in fee structures; when Investor Class performance exceeds that of the fund’s benchmark, other share classes may not. See page 3 for returns for all share classes.
but slowed in the final months, while inflation trends remained mixed. At the end of June 2018, year-over-year headline inflation in the eurozone was 2.0%, up from 1.3% a year earlier, largely due to rising energy and food prices. After climbing to 3.1% in November 2017, annualized inflation in the U.K. headed lower to end the period at 2.4%. In Japan, the annual inflation rate reached 1.5% in February 2018 but ended the reporting period at 0.7%.
Sector Allocations Contributed to Performance
Equities were strong contributors to portfolio performance, benefiting from a favorable growth and inflation environment. Although heightened volatility and global trade war fears slowed broad stock market performance in the second half of the reporting period, stocks rallied overall, bolstered by upbeat corporate earnings reports, modest economic growth, and the positive effects of U.S. tax reform. Within the portfolio’s equity component, we favored exposure to the information technology, health care, and industrials sectors.
Our exposure to commodities also contributed significantly to performance, as energy markets rallied sharply in the 12-month period. In particular, our holdings in energy futures (via an exchange-traded fund) and resource equities contributed to results. Elsewhere, exposure to global real estate investment trusts (REITs) also aided performance. Despite rising interest rates and a stronger U.S. dollar, global property stocks generally contributed to portfolio performance, as improving earnings and economic growth expectations aided the broad real estate sector, particularly in the U.S. Our holdings among industrial, lodging/resorts, and self-storage REITs added value. From a regional perspective, exposure in the U.K., U.S., and Japan contributed to performance.
The portfolio’s fixed-income component was a more modest contributor, as rising interest rates and heightened volatility, particularly in early 2018, weighed on performance. Overall, though, our holdings in securitized bonds, investment-grade and high-yield corporate bonds, emerging markets bonds, and inflation-linked securities, including inflation swaps, generally outperformed the all-TIPS benchmark and lifted portfolio performance.
The portfolio’s non-dollar currency overlay strategy contributed to performance, primarily due to select exposure to emerging markets.
Outlook Favors REITs, Equities
During the reporting period, we reduced the portfolio’s fixed-income exposure in favor of increasing the portfolio’s global REITs exposure. After underperforming midway through the period on fears of rising interest rates, global REITs appeared attractively valued, particularly given our expectations for interest rates to remain range-bound. We also reduced exposure to commodities, using the proceeds to increase the portfolio’s position in equities. We have a more optimistic outlook for equities, due to improving economic fundamentals and solid corporate profits. Within the equity allocation, we boosted exposure to U.S. equities, particularly the information technology and health care sectors, where we believe the economic backdrop and corporate earnings growth rates are particularly compelling.
Looking ahead, we continue to believe stabilization in commodities prices coupled with modest global growth and continued wage growth will create higher current inflation and lead to modestly higher inflation expectations than are currently priced into the financial markets.
|
| |
| JUNE 30, 2018 |
| Types of Investments in Portfolio | % of net assets |
| Domestic Common Stocks | 44.5% |
| Foreign Common Stocks* | 10.8% |
| Collateralized Mortgage Obligations | 10.5% |
| Corporate Bonds | 9.9% |
| Sovereign Governments and Agencies | 3.7% |
| Commercial Mortgage-Backed Securities | 3.4% |
| Asset-Backed Securities | 3.1% |
| Collateralized Loan Obligations | 2.9% |
| Exchange-Traded Funds | 1.4% |
| U.S. Treasury Securities | 0.6% |
| Temporary Cash Investments | 18.8% |
| Other Assets and Liabilities | (9.6)%** |
*Includes depositary shares, dual listed securities and foreign ordinary shares.
**Amount relates primarily to payable for investments purchased, but not settled, at period end.
Fund shareholders may incur two types of costs: (1) transaction costs, including sales charges (loads) on purchase payments and redemption/exchange fees; and (2) ongoing costs, including management fees; distribution and service (12b-1) fees; and other fund expenses. This example is intended to help you understand your ongoing costs (in dollars) of investing in your fund and to compare these costs with the ongoing cost of investing in other mutual funds.
The example is based on an investment of $1,000 made at the beginning of the period and held for the entire period from January 1, 2018 to June 30, 2018.
Actual Expenses
The table provides information about actual account values and actual expenses for each class. You may use the information, together with the amount you invested, to estimate the expenses that you paid over the period. First, identify the share class you own. Then simply divide your account value by $1,000 (for example, an $8,600 account value divided by $1,000 = 8.6), then multiply the result by the number under the heading “Expenses Paid During Period” to estimate the expenses you paid on your account during this period.
If you hold Investor Class shares of any American Century Investments fund, or I Class shares of the American Century Diversified Bond Fund, in an American Century Investments account (i.e., not a financial intermediary or retirement plan account), American Century Investments may charge you a $12.50 semiannual account maintenance fee if the value of those shares is less than $10,000. We will redeem shares automatically in one of your accounts to pay the $12.50 fee. In determining your total eligible investment amount, we will include your investments in all personal accounts (including American Century Investments Brokerage accounts) registered under your Social Security number. Personal accounts include individual accounts, joint accounts, UGMA/UTMA accounts, personal trusts, Coverdell Education Savings Accounts and IRAs (including traditional, Roth, Rollover, SEP-, SARSEP- and SIMPLE-IRAs), and certain other retirement accounts. If you have only business, business retirement, employer-sponsored or American Century Investments Brokerage accounts, you are currently not subject to this fee. If you are subject to the Account Maintenance Fee, your account value could be reduced by the fee amount.
Hypothetical Example for Comparison Purposes
The table also provides information about hypothetical account values and hypothetical expenses based on the actual expense ratio of each class of your fund and an assumed rate of return of 5% per year before expenses, which is not the actual return of a fund’s share class. The hypothetical account values and expenses may not be used to estimate the actual ending account balance or expenses you paid for the period. You may use this information to compare the ongoing costs of investing in your fund and other funds. To do so, compare this 5% hypothetical example with the 5% hypothetical examples that appear in the shareholder reports of the other funds.
Please note that the expenses shown in the table are meant to highlight your ongoing costs only and do not reflect any transactional costs, such as sales charges (loads) or redemption/exchange fees. Therefore, the table is useful in comparing ongoing costs only, and will not help you determine the relative total costs of owning different funds. In addition, if these transactional costs were included, your costs would have been higher.
|
| | | | |
| | Beginning
Account Value
1/1/18 | Ending
Account Value
6/30/18 | Expenses Paid
During Period(1)
1/1/18 - 6/30/18 | Annualized
Expense Ratio(1) |
| Actual |
| Investor Class | $1,000 | $1,009.70 | $4.43 | 0.89% |
| I Class | $1,000 | $1,010.70 | $3.44 | 0.69% |
| A Class | $1,000 | $1,008.30 | $5.68 | 1.14% |
| C Class | $1,000 | $1,005.00 | $9.40 | 1.89% |
| R Class | $1,000 | $1,007.90 | $6.92 | 1.39% |
| R5 Class | $1,000 | $1,010.70 | $3.44 | 0.69% |
| Hypothetical |
| Investor Class | $1,000 | $1,020.38 | $4.46 | 0.89% |
| I Class | $1,000 | $1,021.37 | $3.46 | 0.69% |
| A Class | $1,000 | $1,019.14 | $5.71 | 1.14% |
| C Class | $1,000 | $1,015.42 | $9.45 | 1.89% |
| R Class | $1,000 | $1,017.90 | $6.95 | 1.39% |
| R5 Class | $1,000 | $1,021.37 | $3.46 | 0.69% |
| |
| (1) | Expenses are equal to the class's annualized expense ratio listed in the table above, multiplied by the average account value over the period, multiplied by 181, the number of days in the most recent fiscal half-year, divided by 365, to reflect the one-half year period. Annualized expense ratio reflects actual expenses, including any applicable fee waivers or expense reimbursements and excluding any acquired fund fees and expenses. |
JUNE 30, 2018
|
| | | | | | | |
| | | Shares/ Principal Amount | Value |
| COMMON STOCKS — 55.3% | | | |
| Aerospace and Defense — 2.3% | | | |
| Boeing Co. (The) | | 180 |
| $ | 60,392 |
|
| Lockheed Martin Corp. | | 173 |
| 51,110 |
|
| Raytheon Co. | | 393 |
| 75,920 |
|
| TransDigm Group, Inc. | | 266 |
| 91,807 |
|
| United Technologies Corp. | | 543 |
| 67,891 |
|
| | | | 347,120 |
|
| Air Freight and Logistics — 0.4% | | | |
XPO Logistics, Inc.(1) | | 663 |
| 66,419 |
|
| Banks — 2.5% | | | |
| Bank of America Corp. | | 2,275 |
| 64,132 |
|
| BB&T Corp. | | 1,261 |
| 63,605 |
|
| Comerica, Inc. | | 718 |
| 65,281 |
|
| JPMorgan Chase & Co. | | 628 |
| 65,438 |
|
| Regions Financial Corp. | | 3,607 |
| 64,132 |
|
SVB Financial Group(1) | | 199 |
| 57,463 |
|
| | | | 380,051 |
|
| Biotechnology — 1.2% | | | |
Alexion Pharmaceuticals, Inc.(1) | | 573 |
| 71,138 |
|
BioMarin Pharmaceutical, Inc.(1) | | 570 |
| 53,694 |
|
Vertex Pharmaceuticals, Inc.(1) | | 334 |
| 56,767 |
|
| | | | 181,599 |
|
| Capital Markets — 0.6% | | | |
| Bank of New York Mellon Corp. (The) | | 1,230 |
| 66,334 |
|
| Brookfield Asset Management, Inc., Class A | | 566 |
| 22,960 |
|
| | | | 89,294 |
|
| Chemicals — 2.3% | | | |
| Air Liquide SA | | 160 |
| 19,983 |
|
| Albemarle Corp. | | 251 |
| 23,677 |
|
| Ashland Global Holdings, Inc. | | 216 |
| 16,887 |
|
| Celanese Corp., Series A | | 168 |
| 18,658 |
|
| CF Industries Holdings, Inc. | | 442 |
| 19,625 |
|
| Chemours Co. (The) | | 446 |
| 19,785 |
|
| Eastman Chemical Co. | | 179 |
| 17,893 |
|
| FMC Corp. | | 216 |
| 19,269 |
|
| Huntsman Corp. | | 689 |
| 20,119 |
|
| Johnson Matthey plc | | 254 |
| 12,132 |
|
| LyondellBasell Industries NV, Class A | | 169 |
| 18,565 |
|
| Methanex Corp. | | 282 |
| 19,940 |
|
| Nutrien Ltd. | | 361 |
| 19,631 |
|
| Sherwin-Williams Co. (The) | | 42 |
| 17,118 |
|
| Sika AG | | 144 |
| 19,979 |
|
|
| | | | | | | |
| | | Shares/ Principal Amount | Value |
| Umicore SA | | 300 |
| $ | 17,219 |
|
| Westlake Chemical Corp. | | 194 |
| 20,880 |
|
| WR Grace & Co. | | 264 |
| 19,354 |
|
| | | | 340,714 |
|
| Communications Equipment — 0.5% | | | |
| Cisco Systems, Inc. | | 1,553 |
| 66,826 |
|
| Construction Materials — 0.3% | | | |
| Martin Marietta Materials, Inc. | | 230 |
| 51,366 |
|
| Consumer Finance — 0.4% | | | |
| Synchrony Financial | | 1,780 |
| 59,416 |
|
| Electric Utilities — 1.5% | | | |
| Exelon Corp. | | 1,491 |
| 63,517 |
|
| FirstEnergy Corp. | | 1,794 |
| 64,422 |
|
| NextEra Energy, Inc. | | 570 |
| 95,207 |
|
| | | | 223,146 |
|
| Electronic Equipment, Instruments and Components — 0.4% | | |
IPG Photonics Corp.(1) | | 299 |
| 65,968 |
|
| Equity Real Estate Investment Trusts (REITs) — 12.1% | | | |
| Agree Realty Corp. | | 373 |
| 19,683 |
|
| Alexandria Real Estate Equities, Inc. | | 327 |
| 41,257 |
|
| Allied Properties Real Estate Investment Trust | | 926 |
| 29,478 |
|
| American Homes 4 Rent, Class A | | 1,845 |
| 40,922 |
|
| Boardwalk Real Estate Investment Trust | | 350 |
| 12,159 |
|
| Camden Property Trust | | 611 |
| 55,680 |
|
| CapitaLand Commercial Trust | | 10,700 |
| 13,036 |
|
| Charter Hall Group | | 7,738 |
| 37,337 |
|
| Columbia Property Trust, Inc. | | 1,439 |
| 32,680 |
|
| CubeSmart | | 1,044 |
| 33,638 |
|
| CyrusOne, Inc. | | 852 |
| 49,723 |
|
| Derwent London plc | | 510 |
| 20,906 |
|
| Duke Realty Corp. | | 2,610 |
| 75,768 |
|
| Equinix, Inc. | | 81 |
| 34,821 |
|
| Extra Space Storage, Inc. | | 447 |
| 44,615 |
|
| Gecina SA | | 440 |
| 73,632 |
|
| GGP, Inc. | | 2,724 |
| 55,651 |
|
| GLP J-Reit | | 28 |
| 29,741 |
|
| Goodman Group | | 7,602 |
| 54,121 |
|
| HCP, Inc. | | 2,204 |
| 56,907 |
|
| Host Hotels & Resorts, Inc. | | 1,839 |
| 38,748 |
|
| Hudson Pacific Properties, Inc. | | 1,395 |
| 49,425 |
|
| Inmobiliaria Colonial Socimi SA | | 1,873 |
| 20,703 |
|
| Invesco Office J-Reit, Inc. | | 142 |
| 19,675 |
|
| Invitation Homes, Inc. | | 1,646 |
| 37,957 |
|
| Japan Hotel REIT Investment Corp. | | 47 |
| 35,235 |
|
| Kimco Realty Corp. | | 3,057 |
| 51,938 |
|
| Link REIT | | 5,500 |
| 50,229 |
|
| Mid-America Apartment Communities, Inc. | | 132 |
| 13,288 |
|
|
| | | | | | | |
| | | Shares/ Principal Amount | Value |
| Orix JREIT, Inc. | | 20 |
| $ | 31,956 |
|
| Prologis, Inc. | | 535 |
| 35,144 |
|
| Rayonier, Inc. | | 1,107 |
| 42,830 |
|
| Regency Centers Corp. | | 566 |
| 35,137 |
|
| Retail Properties of America, Inc., Class A | | 4,716 |
| 60,270 |
|
| Sabra Health Care REIT, Inc. | | 1,330 |
| 28,901 |
|
| Safestore Holdings plc | | 2,903 |
| 21,053 |
|
SBA Communications Corp.(1) | | 180 |
| 29,722 |
|
| Segro plc | | 7,803 |
| 68,935 |
|
| Simon Property Group, Inc. | | 859 |
| 146,193 |
|
| Spirit Realty Capital, Inc. | | 2,681 |
| 21,528 |
|
| STORE Capital Corp. | | 1,045 |
| 28,633 |
|
| Sun Communities, Inc. | | 758 |
| 74,193 |
|
| UDR, Inc. | | 1,146 |
| 43,021 |
|
| UNITE Group plc (The) | | 3,988 |
| 45,316 |
|
| | | | 1,841,785 |
|
| Food and Staples Retailing — 0.4% | | | |
| Walmart, Inc. | | 708 |
| 60,640 |
|
| Food Products — 0.9% | | | |
| Archer-Daniels-Midland Co. | | 1,594 |
| 73,053 |
|
| Bunge Ltd. | | 871 |
| 60,717 |
|
| | | | 133,770 |
|
| Health Care Equipment and Supplies — 3.0% | | | |
ABIOMED, Inc.(1) | | 162 |
| 66,266 |
|
| Baxter International, Inc. | | 926 |
| 68,376 |
|
Boston Scientific Corp.(1) | | 2,059 |
| 67,329 |
|
Edwards Lifesciences Corp.(1) | | 499 |
| 72,640 |
|
ICU Medical, Inc.(1) | | 176 |
| 51,682 |
|
Intuitive Surgical, Inc.(1) | | 128 |
| 61,246 |
|
| Teleflex, Inc. | | 268 |
| 71,880 |
|
| | | | 459,419 |
|
| Health Care Providers and Services — 1.5% | | | |
| Anthem, Inc. | | 304 |
| 72,361 |
|
| UnitedHealth Group, Inc. | | 329 |
| 80,717 |
|
WellCare Health Plans, Inc.(1) | | 326 |
| 80,274 |
|
| | | | 233,352 |
|
| Hotels, Restaurants and Leisure — 1.2% | | | |
| Darden Restaurants, Inc. | | 744 |
| 79,653 |
|
GreenTree Hospitality Group Ltd. ADR(1) | | 593 |
| 10,727 |
|
| Huazhu Group Ltd. ADR | | 292 |
| 12,261 |
|
| Las Vegas Sands Corp. | | 946 |
| 72,237 |
|
| | | | 174,878 |
|
| Household Durables — 0.1% | | | |
Neinor Homes SA(1) | | 740 |
| 13,861 |
|
| Industrial Conglomerates — 0.5% | | | |
| Honeywell International, Inc. | | 543 |
| 78,219 |
|
|
| | | | | | | |
| | | Shares/ Principal Amount | Value |
| Internet and Direct Marketing Retail — 0.9% | | | |
Amazon.com, Inc.(1) | | 47 |
| $ | 79,891 |
|
Netflix, Inc.(1) | | 154 |
| 60,280 |
|
| | | | 140,171 |
|
| Internet Software and Services — 0.4% | | | |
Alphabet, Inc., Class A(1) | | 55 |
| 62,105 |
|
| IT Services — 3.3% | | | |
| Capgemini SE | | 483 |
| 64,330 |
|
| Fidelity National Information Services, Inc. | | 696 |
| 73,797 |
|
FleetCor Technologies, Inc.(1) | | 238 |
| 50,135 |
|
GDS Holdings Ltd. ADR(1) | | 562 |
| 22,531 |
|
InterXion Holding NV(1) | | 475 |
| 29,649 |
|
| MasterCard, Inc., Class A | | 341 |
| 67,013 |
|
| Total System Services, Inc. | | 793 |
| 67,024 |
|
| Visa, Inc., Class A | | 509 |
| 67,417 |
|
| Wirecard AG | | 367 |
| 59,123 |
|
| | | | 501,019 |
|
| Life Sciences Tools and Services — 0.9% | | | |
ICON plc(1) | | 473 |
| 62,687 |
|
Illumina, Inc.(1) | | 281 |
| 78,480 |
|
| | | | 141,167 |
|
| Machinery — 0.4% | | | |
| Wabtec Corp. | | 623 |
| 61,415 |
|
| Media — 0.4% | | | |
| Altice USA, Inc., Class A | | 3,687 |
| 62,900 |
|
| Metals and Mining — 0.6% | | | |
Alcoa Corp.(1) | | 381 |
| 17,861 |
|
Allegheny Technologies, Inc.(1) | | 669 |
| 16,805 |
|
| BHP Billiton Ltd. | | 696 |
| 17,466 |
|
| Rio Tinto plc ADR | | 341 |
| 18,919 |
|
| United States Steel Corp. | | 478 |
| 16,611 |
|
| | | | 87,662 |
|
| Mortgage Real Estate Investment Trusts (REITs) — 0.1% | | | |
| Starwood Property Trust, Inc. | | 846 |
| 18,367 |
|
| Multi-Utilities — 0.7% | | | |
| CenterPoint Energy, Inc. | | 1,750 |
| 48,493 |
|
| Public Service Enterprise Group, Inc. | | 993 |
| 53,761 |
|
| | | | 102,254 |
|
| Oil, Gas and Consumable Fuels — 4.2% | | | |
| Anadarko Petroleum Corp. | | 231 |
| 16,921 |
|
| Antero Midstream Partners LP | | 2,574 |
| 75,985 |
|
| BP plc | | 2,263 |
| 17,271 |
|
Centennial Resource Development, Inc., Class A(1) | | 962 |
| 17,374 |
|
Cheniere Energy, Inc.(1) | | 337 |
| 21,969 |
|
| Chevron Corp. | | 138 |
| 17,447 |
|
Concho Resources, Inc.(1) | | 136 |
| 18,816 |
|
| ConocoPhillips | | 257 |
| 17,892 |
|
|
| | | | | | | |
| | | Shares/ Principal Amount | Value |
Continental Resources, Inc.(1) | | 260 |
| $ | 16,838 |
|
| Diamondback Energy, Inc. | | 137 |
| 18,025 |
|
| Encana Corp. | | 1,366 |
| 17,841 |
|
| Energy Transfer Equity LP | | 984 |
| 16,974 |
|
| Eni SpA | | 941 |
| 17,334 |
|
| EnLink Midstream Partners LP | | 745 |
| 11,570 |
|
| Enterprise Products Partners LP | | 615 |
| 17,017 |
|
| Equinor ASA | | 658 |
| 17,265 |
|
| Magellan Midstream Partners LP | | 1,142 |
| 78,889 |
|
| Marathon Oil Corp. | | 817 |
| 17,043 |
|
| Marathon Petroleum Corp. | | 281 |
| 19,715 |
|
| Murphy Oil Corp. | | 518 |
| 17,493 |
|
| Occidental Petroleum Corp. | | 208 |
| 17,405 |
|
Parsley Energy, Inc., Class A(1) | | 601 |
| 18,198 |
|
| Plains All American Pipeline LP | | 3,180 |
| 75,175 |
|
| Repsol SA | | 888 |
| 17,297 |
|
| TOTAL SA | | 328 |
| 19,998 |
|
| Valero Energy Corp. | | 179 |
| 19,839 |
|
| | | | 637,591 |
|
| Paper and Forest Products — 0.2% | | | |
| Metsa Board Oyj | | 1,527 |
| 17,280 |
|
| Mondi plc | | 633 |
| 17,134 |
|
| | | | 34,414 |
|
| Pharmaceuticals — 0.9% | | | |
Jazz Pharmaceuticals plc(1) | | 377 |
| 64,957 |
|
| Merck & Co., Inc. | | 1,152 |
| 69,927 |
|
| | | | 134,884 |
|
| Real Estate Management and Development — 3.4% | | | |
| Aroundtown SA | | 5,029 |
| 41,316 |
|
| CapitaLand Ltd. | | 6,100 |
| 14,148 |
|
| Central Pattana PCL | | 5,800 |
| 12,211 |
|
| China Resources Land Ltd. | | 6,000 |
| 20,228 |
|
| CK Asset Holdings Ltd. | | 2,000 |
| 15,882 |
|
| Corp. Inmobiliaria Vesta SAB de CV | | 6,806 |
| 8,910 |
|
| Country Garden Holdings Co. Ltd. | | 5,000 |
| 8,795 |
|
Godrej Properties Ltd.(1) | | 514 |
| 5,394 |
|
| KWG Property Holding Ltd. | | 9,500 |
| 11,939 |
|
| Longfor Properties Co. Ltd. | | 8,000 |
| 21,566 |
|
| Mitsui Fudosan Co. Ltd. | | 2,100 |
| 50,719 |
|
| New World Development Co. Ltd. | | 7,000 |
| 9,850 |
|
| Shimao Property Holdings Ltd. | | 8,000 |
| 21,005 |
|
| Sumitomo Realty & Development Co. Ltd. | | 2,000 |
| 73,865 |
|
| Sun Hung Kai Properties Ltd. | | 2,750 |
| 41,501 |
|
| Swire Properties Ltd. | | 4,600 |
| 17,003 |
|
| UOL Group Ltd. | | 3,400 |
| 19,015 |
|
| VGP NV | | 155 |
| 11,259 |
|
| Vonovia SE | | 1,704 |
| 81,110 |
|
|
| | | | | | | |
| | | Shares/ Principal Amount | Value |
| Wharf Real Estate Investment Co. Ltd. | | 5,000 |
| $ | 35,593 |
|
| | | | 521,309 |
|
| Road and Rail — 0.9% | | | |
| CSX Corp. | | 1,238 |
| 78,960 |
|
| Schneider National, Inc., Class B | | 2,228 |
| 61,292 |
|
| | | | 140,252 |
|
| Semiconductors and Semiconductor Equipment — 2.1% | | | |
| Applied Materials, Inc. | | 1,171 |
| 54,089 |
|
| Microchip Technology, Inc. | | 621 |
| 56,480 |
|
Micron Technology, Inc.(1) | | 1,433 |
| 75,147 |
|
| NVIDIA Corp. | | 318 |
| 75,334 |
|
Silicon Laboratories, Inc.(1) | | 619 |
| 61,652 |
|
| | | | 322,702 |
|
| Software — 3.8% | | | |
Adobe Systems, Inc.(1) | | 316 |
| 77,044 |
|
Fortinet, Inc.(1) | | 988 |
| 61,681 |
|
| Microsoft Corp. | | 764 |
| 75,338 |
|
Proofpoint, Inc.(1) | | 555 |
| 63,997 |
|
PTC, Inc.(1) | | 684 |
| 64,166 |
|
salesforce.com, Inc.(1) | | 580 |
| 79,112 |
|
ServiceNow, Inc.(1) | | 441 |
| 76,059 |
|
Splunk, Inc.(1) | | 780 |
| 77,306 |
|
| | | | 574,703 |
|
TOTAL COMMON STOCKS (Cost $7,806,596) | | | 8,410,758 |
|
COLLATERALIZED MORTGAGE OBLIGATIONS(2) — 10.5% | | | |
| Private Sponsor Collateralized Mortgage Obligations — 6.8% | | |
| ABN Amro Mortgage Corp., Series 2003-6, Class 1A4, 5.50%, 5/25/33 | | $ | 3,407 |
| 3,508 |
|
Bear Stearns Adjustable Rate Mortgage Trust, Series 2004-12, Class 2A1, VRN, 3.66%, 7/1/18(3) | | 34,829 |
| 35,347 |
|
Citigroup Mortgage Loan Trust, Inc., Series 2004-UST1, Class A4, VRN, 4.02%, 7/1/18(3) | | 21,213 |
| 20,783 |
|
Citigroup Mortgage Loan Trust, Inc., Series 2005-4, Class A, VRN, 3.59%, 7/1/18(3) | | 29,664 |
| 30,100 |
|
| Countrywide Home Loan Mortgage Pass-Through Trust, Series 2004-4, Class A19, 5.25%, 5/25/34 | | 30,443 |
| 31,102 |
|
| Countrywide Home Loan Mortgage Pass-Through Trust, Series 2004-5, Class 2A4, 5.50%, 5/25/34 | | 4,620 |
| 4,698 |
|
First Horizon Mortgage Pass-Through Trust, Series 2005-AR3, Class 4A1, VRN, 3.99%, 7/1/18(3) | | 16,825 |
| 16,889 |
|
GSR Mortgage Loan Trust, Series 2005-AR6, Class 2A1, VRN, 3.68%, 7/1/18(3) | | 31,339 |
| 32,042 |
|
JPMorgan Mortgage Trust, Series 2005-A6, Class 7A1, VRN, 3.66%, 7/1/18(3) | | 31,016 |
| 30,326 |
|
JPMorgan Mortgage Trust, Series 2006-A3, Class 7A1, VRN, 3.82%, 7/1/18(3) | | 7,103 |
| 7,229 |
|
JPMorgan Mortgage Trust, Series 2016-1, Class A7 SEQ, VRN, 3.50%, 7/1/18(3)(4) | | 100,000 |
| 97,671 |
|
PHHMC Mortgage Pass-Through Certificates, Series 2007-6, Class A1, VRN, 5.90%, 7/1/18(3) | | 1,261 |
| 1,302 |
|
|
| | | | | | | |
| | | Shares/ Principal Amount | Value |
| Thornburg Mortgage Securities Trust, Series 2004-3, Class A, VRN, 2.83%, 7/25/18, resets monthly off the 1-month LIBOR plus 0.74% | | $ | 10,282 |
| $ | 10,159 |
|
Thornburg Mortgage Securities Trust, Series 2006-4, Class A2B, VRN, 3.69%, 7/25/18(3) | | 75,754 |
| 73,938 |
|
| WaMu Mortgage Pass-Through Certificates, Series 2003-S11, Class 3A5, 5.95%, 11/25/33 | | 6,734 |
| 6,845 |
|
| Wells Fargo Mortgage-Backed Securities Trust, Series 2005-17, Class 2A1, 5.50%, 1/25/36 | | 69,044 |
| 69,487 |
|
| Wells Fargo Mortgage-Backed Securities Trust, Series 2005-18, Class 1A1, 5.50%, 1/25/36 | | 58,952 |
| 58,695 |
|
Wells Fargo Mortgage-Backed Securities Trust, Series 2005-AR16, Class 3A2, VRN, 3.89%, 7/1/18(3) | | 23,176 |
| 23,556 |
|
Wells Fargo Mortgage-Backed Securities Trust, Series 2005-AR7, Class 1A1, VRN, 4.35%, 7/1/18(3) | | 11,278 |
| 11,424 |
|
| Wells Fargo Mortgage-Backed Securities Trust, Series 2006-10, Class A4 SEQ, 6.00%, 8/25/36 | | 26,874 |
| 26,952 |
|
| Wells Fargo Mortgage-Backed Securities Trust, Series 2006-4, Class 2A1, 6.00%, 4/25/36 | | 31,687 |
| 31,538 |
|
| Wells Fargo Mortgage-Backed Securities Trust, Series 2006-9, Class 1A9 SEQ, 6.00%, 8/25/36 | | 11,554 |
| 11,528 |
|
Wells Fargo Mortgage-Backed Securities Trust, Series 2006-AR1, Class 2A5 SEQ, VRN, 3.97%, 7/1/18(3) | | 36,491 |
| 35,743 |
|
Wells Fargo Mortgage-Backed Securities Trust, Series 2006-AR10, Class 5A6 SEQ, VRN, 4.28%, 7/1/18(3) | | 157,194 |
| 159,747 |
|
Wells Fargo Mortgage-Backed Securities Trust, Series 2006-AR12, Class 1A1, VRN, 3.86%, 7/1/18(3) | | 67,698 |
| 67,944 |
|
Wells Fargo Mortgage-Backed Securities Trust, Series 2006-AR15, Class A1, VRN, 3.60%, 7/1/18(3) | | 17,735 |
| 17,459 |
|
| Wells Fargo Mortgage-Backed Securities Trust, Series 2007-11, Class A3 SEQ, 6.00%, 8/25/37 | | 14,973 |
| 14,915 |
|
| Wells Fargo Mortgage-Backed Securities Trust, Series 2007-13, Class A1, 6.00%, 9/25/37 | | 18,390 |
| 18,463 |
|
| Wells Fargo Mortgage-Backed Securities Trust, Series 2007-14, Class 2A2, 5.50%, 10/25/22 | | 2,968 |
| 3,035 |
|
| Wells Fargo Mortgage-Backed Securities Trust, Series 2007-16, Class 1A1, 6.00%, 12/28/37 | | 4,334 |
| 4,404 |
|
| Wells Fargo Mortgage-Backed Securities Trust, Series 2007-8, Class 1A5 SEQ, 6.00%, 7/25/37 | | 57,857 |
| 57,806 |
|
Wells Fargo Mortgage-Backed Securities Trust, Series 2007-AR10, Class 1A1, VRN, 3.73%, 7/1/18(3) | | 3,736 |
| 3,589 |
|
WinWater Mortgage Loan Trust, Series 2014-1, Class A4 SEQ, VRN, 3.50%, 7/1/18(3)(4) | | 10,790 |
| 10,806 |
|
| | | | 1,029,030 |
|
| U.S. Government Agency Collateralized Mortgage Obligations — 3.7% | |
| FNMA, Series 2017-C07, Class 1M2, VRN, 4.49%, 7/25/18, resets monthly off the 1-month LIBOR plus 2.40% | | 300,000 |
| 306,521 |
|
| FNMA, Series 2018-C02, Class 2M1, VRN, 2.74%, 7/25/18, resets monthly off the 1-month LIBOR plus 0.65% | | 262,893 |
| 263,004 |
|
| | | | 569,525 |
|
TOTAL COLLATERALIZED MORTGAGE OBLIGATIONS (Cost $1,581,929) | | | 1,598,555 |
|
| CORPORATE BONDS — 9.9% | | | |
| Aerospace and Defense — 0.1% | | | |
| United Technologies Corp., 3.75%, 11/1/46 | | 10,000 |
| 8,769 |
|
|
| | | | | | | |
| | | Shares/ Principal Amount | Value |
| Air Freight and Logistics — 0.1% | | | |
| United Parcel Service, Inc., 3.40%, 11/15/46 | | $ | 10,000 |
| $ | 8,828 |
|
| Banks — 0.1% | | | |
| Bank of America Corp., MTN, 3.25%, 10/21/27 | | 15,000 |
| 13,990 |
|
| Citigroup, Inc., 4.45%, 9/29/27 | | 10,000 |
| 9,850 |
|
| | | | 23,840 |
|
| Beverages — 0.1% | | | |
| Anheuser-Busch InBev Finance, Inc., 3.65%, 2/1/26 | | 10,000 |
| 9,803 |
|
| Chemicals — 0.5% | | | |
| Ashland LLC, 4.75%, 8/15/22 | | 75,000 |
| 75,636 |
|
| Consumer Discretionary — 0.1% | | | |
| NIKE, Inc., 3.375%, 11/1/46 | | 10,000 |
| 8,892 |
|
| Consumer Finance — 0.6% | | | |
| CIT Group, Inc., 5.00%, 8/15/22 | | 40,000 |
| 40,550 |
|
| GLP Capital LP / GLP Financing II, Inc., 4.875%, 11/1/20 | | 50,000 |
| 50,687 |
|
| | | | 91,237 |
|
| Containers and Packaging — 0.6% | | | |
| Berry Global, Inc., 5.50%, 5/15/22 | | 50,000 |
| 50,507 |
|
Reynolds Group Issuer, Inc. / Reynolds Group Issuer LLC / Reynolds Group Issuer Lu, 5.125%, 7/15/23(4) | | 50,000 |
| 49,438 |
|
| | | | 99,945 |
|
| Diversified Financial Services — 0.2% | | | |
| Morgan Stanley, MTN, 5.625%, 9/23/19 | | 20,000 |
| 20,615 |
|
| MUFG Union Bank N.A., 2.625%, 9/26/18 | | 10,000 |
| 9,998 |
|
| | | | 30,613 |
|
| Equity Real Estate Investment Trusts (REITs) — 0.5% | | | |
| Crown Castle International Corp., 5.25%, 1/15/23 | | 75,000 |
| 78,643 |
|
| Gas Utilities — 0.2% | | | |
| Andeavor Logistics LP / Tesoro Logistics Finance Corp., 6.25%, 10/15/22 | | 19,000 |
| 19,705 |
|
| MPLX LP, 4.875%, 6/1/25 | | 10,000 |
| 10,294 |
|
| | | | 29,999 |
|
| Health Care Providers and Services — 1.1% | | | |
| DaVita, Inc., 5.75%, 8/15/22 | | 50,000 |
| 50,875 |
|
Fresenius Medical Care US Finance II, Inc., 5.625%, 7/31/19(4) | | 70,000 |
| 71,725 |
|
| HCA, Inc., 4.25%, 10/15/19 | | 50,000 |
| 50,500 |
|
| | | | 173,100 |
|
| Hotels, Restaurants and Leisure — 0.6% | | | |
1011778 BC ULC / New Red Finance, Inc., 5.00%, 10/15/25(4) | | 40,000 |
| 38,048 |
|
| Boyd Gaming Corp., 6.875%, 5/15/23 | | 50,000 |
| 52,562 |
|
| | | | 90,610 |
|
Industrial Conglomerates† | | | |
| General Electric Co., 4.125%, 10/9/42 | | 5,000 |
| 4,651 |
|
| Internet Software and Services — 0.3% | | | |
| Netflix, Inc., 5.375%, 2/1/21 | | 40,000 |
| 41,312 |
|
| IT Services — 0.3% | | | |
First Data Corp., 7.00%, 12/1/23(4) | | 50,000 |
| 52,204 |
|
|
| | | | | | | |
| | | Shares/ Principal Amount | Value |
| Media — 1.1% | | | |
| CCO Holdings LLC / CCO Holdings Capital Corp., 5.25%, 9/30/22 | | $ | 40,000 |
| $ | 40,275 |
|
CCO Holdings LLC / CCO Holdings Capital Corp., 5.125%, 5/1/27(4) | | 40,000 |
| 37,450 |
|
| Charter Communications Operating LLC / Charter Communications Operating Capital, 6.48%, 10/23/45 | | 10,000 |
| 10,567 |
|
Nielsen Finance LLC / Nielsen Finance Co., 5.00%, 4/15/22(4) | | 70,000 |
| 68,957 |
|
| Time Warner Cable LLC, 4.50%, 9/15/42 | | 10,000 |
| 8,239 |
|
| | | | 165,488 |
|
| Metals and Mining — 1.0% | | | |
| Freeport-McMoRan, Inc., 3.55%, 3/1/22 | | 50,000 |
| 47,625 |
|
Novelis Corp., 6.25%, 8/15/24(4) | | 50,000 |
| 50,125 |
|
| Teck Resources Ltd., 4.75%, 1/15/22 | | 50,000 |
| 50,354 |
|
| | | | 148,104 |
|
| Multi-Utilities — 0.6% | | | |
Calpine Corp., 5.875%, 1/15/24(4) | | 50,000 |
| 49,625 |
|
| Duke Energy Progress LLC, 3.70%, 10/15/46 | | 10,000 |
| 9,219 |
|
| Exelon Generation Co. LLC, 5.60%, 6/15/42 | | 5,000 |
| 5,040 |
|
| IPALCO Enterprises, Inc., 3.45%, 7/15/20 | | 30,000 |
| 30,020 |
|
| | | | 93,904 |
|
| Oil, Gas and Consumable Fuels — 1.8% | | | |
| Antero Resources Corp., 5.125%, 12/1/22 | | 50,000 |
| 50,375 |
|
| Carrizo Oil & Gas, Inc., 6.25%, 4/15/23 | | 50,000 |
| 50,875 |
|
Chesapeake Energy Corp., 8.00%, 12/15/22(4) | | 24,000 |
| 25,283 |
|
| Newfield Exploration Co., 5.75%, 1/30/22 | | 40,000 |
| 41,850 |
|
| Oasis Petroleum, Inc., 6.875%, 3/15/22 | | 50,000 |
| 50,985 |
|
| Suburban Propane Partners LP / Suburban Energy Finance Corp., 5.50%, 6/1/24 | | 50,000 |
| 48,750 |
|
| | | | 268,118 |
|
TOTAL CORPORATE BONDS (Cost $1,529,964) | | | 1,503,696 |
|
| SOVEREIGN GOVERNMENTS AND AGENCIES — 3.7% | | | |
| Dominican Republic — 1.1% | | | |
| Dominican Republic International Bond, 6.875%, 1/29/26 | | 150,000 |
| 159,511 |
|
| Russia — 2.1% | | | |
| Russian Foreign Bond - Eurobond, 12.75%, 6/24/28 | | 200,000 |
| 326,422 |
|
| South Africa — 0.5% | | | |
| Republic of South Africa Government Bond, 7.75%, 2/28/23 | ZAR | 1,000,000 |
| 71,531 |
|
TOTAL SOVEREIGN GOVERNMENTS AND AGENCIES (Cost $581,921) | | | 557,464 |
|
COMMERCIAL MORTGAGE-BACKED SECURITIES(2) — 3.4% | | |
Commercial Mortgage Pass-Through Certificates, Series 2014-CR15, Class B, VRN, 4.85%, 7/1/18(3) | | $ | 50,000 |
| 52,518 |
|
| Commercial Mortgage Trust, Series 2016-CD1, Class AM, 2.93%, 8/10/49 | | 25,000 |
| 23,462 |
|
Commercial Mortgage Trust, Series 2016-CD2, Class A4 SEQ, VRN, 3.53%, 7/1/18(3) | | 50,000 |
| 49,644 |
|
Core Industrial Trust, Series 2015-CALW, Class B, 3.25%, 2/10/34(4) | | 50,000 |
| 49,591 |
|
|
| | | | | | | |
| | | Shares/ Principal Amount | Value |
Core Industrial Trust, Series 2015-TEXW, Class B, 3.33%, 2/10/34(4) | | $ | 50,000 |
| $ | 49,654 |
|
GS Mortgage Securities Trust, Series 2016-GS2, Class B, VRN, 3.76%, 7/1/18(3) | | 75,000 |
| 73,668 |
|
Hudson Yards Mortgage Trust, Series 2016-10HY, Class B, VRN, 3.08%, 7/1/18(3)(4) | | 50,000 |
| 47,055 |
|
| JPMorgan Chase Commercial Mortgage Securities Trust, Series 2016-JP2, Class B, 3.46%, 8/15/49 | | 50,000 |
| 47,900 |
|
| JPMorgan Chase Commercial Mortgage Securities Trust, Series 2016-JP3, Class AS, 3.14%, 8/15/49 | | 50,000 |
| 47,374 |
|
| Morgan Stanley Capital I Trust, Series 2016-UB11, Class A4 SEQ, 2.78%, 8/15/49 | | 75,000 |
| 70,398 |
|
TOTAL COMMERCIAL MORTGAGE-BACKED SECURITIES (Cost $545,843) | | | 511,264 |
|
ASSET-BACKED SECURITIES(2) — 3.1% | | | |
Colony Starwood Homes, Series 2016-2A, Class A, VRN, 3.32%, 7/17/18, resets monthly off the 1-month LIBOR plus 1.25%(4) | | 48,953 |
| 49,187 |
|
Goodgreen, Series 2018-1A, Class A, VRN, 3.93%, 7/15/18(3)(4) | | 98,624 |
| 99,190 |
|
Hilton Grand Vacations Trust, Series 2014-AA, Class A SEQ, 1.77%, 11/25/26(4) | | 19,375 |
| 19,055 |
|
Invitation Homes Trust, Series 2018-SFR2, Class C, VRN, 3.35%, 7/17/18, resets monthly off the 1-month LIBOR plus 1.28%(4) | | 100,000 |
| 100,574 |
|
MVW Owner Trust, Series 2014-1A, Class B, 2.70%, 9/22/31(4) | | 65,451 |
| 63,796 |
|
MVW Owner Trust, Series 2016-1A, Class A SEQ, 2.25%, 12/20/33(4) | | 13,317 |
| 12,995 |
|
MVW Owner Trust, Series 2017-1A, Class B, 2.75%, 12/20/34(4) | | 43,036 |
| 41,791 |
|
Progress Residential Trust, Series 2016-SFR2, Class A SEQ, VRN, 3.49%, 7/17/18, resets monthly off the 1-month LIBOR plus 1.40%(4) | | 24,975 |
| 25,081 |
|
Sierra Timeshare Receivables Funding LLC, Series 2015-1A, Class A SEQ, 2.40%, 3/22/32(4) | | 17,979 |
| 17,841 |
|
Sierra Timeshare Receivables Funding LLC, Series 2015-2A, Class A SEQ, 2.43%, 6/20/32(4) | | 20,141 |
| 19,951 |
|
Sierra Timeshare Receivables Funding LLC, Series 2016-2A, Class A SEQ, 2.33%, 7/20/33(4) | | 16,263 |
| 16,059 |
|
TOTAL ASSET-BACKED SECURITIES (Cost $468,344) | | | 465,520 |
|
COLLATERALIZED LOAN OBLIGATIONS(2) — 2.9% | | | |
Bean Creek CLO Ltd., Series 2015-1A, Class BR, VRN, 3.81%, 7/20/18, resets quarterly off the 3-month LIBOR plus 1.45%(4) | | 200,000 |
| 197,323 |
|
CIFC Funding Ltd., Series 2013-3RA, Class A2, VRN, 3.75%, 10/24/18, resets quarterly off the 3-month LIBOR plus 1.40%(4) | | 250,000 |
| 246,638 |
|
TOTAL COLLATERALIZED LOAN OBLIGATIONS (Cost $450,000) | | | 443,961 |
|
| EXCHANGE-TRADED FUNDS — 1.4% | | | |
Invesco DB Base Metals Fund(1) | | 5,797 |
| 101,969 |
|
Invesco DB Energy Fund(1) | | 6,749 |
| 115,273 |
|
TOTAL EXCHANGE-TRADED FUNDS (Cost $162,898) | | | 217,242 |
|
| U.S. TREASURY SECURITIES — 0.6% | | | |
U.S. Treasury Inflation Indexed Notes, 2.375%, 1/15/25(5) (Cost $90,976) | | $ | 79,762 |
| 88,467 |
|
|
| | | | | | | |
| | | Shares/ Principal Amount | Value |
| TEMPORARY CASH INVESTMENTS — 18.8% | | | |
| State Street Institutional U.S. Government Money Market Fund, Premier Class | | 2,006,021 |
| $ | 2,006,021 |
|
U.S. Treasury Bills 1.67%, 7/5/18(6) | | $ | 750,000 |
| 749,897 |
|
U.S. Treasury Bills 1.86%, 8/2/18(6) | | 100,000 |
| 99,848 |
|
TOTAL TEMPORARY CASH INVESTMENTS (Cost $2,855,756) | | | 2,855,766 |
|
TOTAL INVESTMENT SECURITIES — 109.6% (Cost $16,074,227) | | | 16,652,693 |
|
OTHER ASSETS AND LIABILITIES(7) — (9.6)% | | | (1,460,067 | ) |
| TOTAL NET ASSETS — 100.0% | | | $ | 15,192,626 |
|
FORWARD FOREIGN CURRENCY EXCHANGE CONTRACTS
|
| | | | | | | | | |
| Currency Purchased | Currency Sold | Counterparty | Settlement Date | Unrealized Appreciation
(Depreciation) |
| USD | 85,414 |
| AUD | 115,569 | JPMorgan Chase Bank N.A. | 9/28/18 | $ | (135 | ) |
| USD | 16,266 |
| AUD | 22,009 | JPMorgan Chase Bank N.A. | 9/28/18 | (26 | ) |
| USD | 4,934 |
| AUD | 6,679 | JPMorgan Chase Bank N.A. | 9/28/18 | (10 | ) |
| USD | 608 |
| AUD | 824 | JPMorgan Chase Bank N.A. | 9/28/18 | (1 | ) |
| CAD | 344,976 |
| USD | 259,733 | Morgan Stanley | 9/19/18 | 3,021 |
|
| CAD | 25,395 |
| USD | 19,327 | Morgan Stanley | 9/19/18 | 15 |
|
| CAD | 1,404 |
| USD | 1,057 | Morgan Stanley | 9/28/18 | 13 |
|
| USD | 30,842 |
| CAD | 41,038 | Morgan Stanley | 9/28/18 | (420 | ) |
| USD | 23,686 |
| CAD | 31,517 | Morgan Stanley | 9/28/18 | (322 | ) |
| USD | 1,344 |
| CAD | 1,784 | Morgan Stanley | 9/28/18 | (14 | ) |
| USD | 5,106 |
| CAD | 6,775 | Morgan Stanley | 9/28/18 | (54 | ) |
| USD | 1,095 |
| CAD | 1,461 | Morgan Stanley | 9/28/18 | (18 | ) |
| USD | 1,736 |
| CAD | 2,300 | Morgan Stanley | 9/28/18 | (16 | ) |
| USD | 5,787 |
| CAD | 7,595 | Morgan Stanley | 9/28/18 | 1 |
|
| CHF | 26,389 |
| USD | 27,133 | UBS AG | 9/19/18 | (307 | ) |
| CHF | 16,245 |
| USD | 16,599 | UBS AG | 9/19/18 | (85 | ) |
| CHF | 5,544 |
| USD | 5,586 | UBS AG | 9/19/18 | 49 |
|
| CHF | 384 |
| USD | 392 | UBS AG | 9/28/18 | (1 | ) |
| USD | 766,964 |
| CHF | 751,525 | UBS AG | 9/19/18 | 2,998 |
|
| USD | 12,048 |
| CHF | 11,901 | UBS AG | 9/19/18 | (50 | ) |
| USD | 59,192 |
| CHF | 58,395 | UBS AG | 9/19/18 | (169 | ) |
| USD | 16,122 |
| CHF | 15,854 | UBS AG | 9/28/18 | (7 | ) |
| USD | 411 |
| CHF | 407 | UBS AG | 9/28/18 | (3 | ) |
| USD | 3,030 |
| CHF | 2,980 | UBS AG | 9/28/18 | (2 | ) |
| EUR | 2,688 |
| USD | 3,154 | Credit Suisse AG | 9/28/18 | 5 |
|
| USD | 5,473 |
| EUR | 4,645 | Credit Suisse AG | 9/28/18 | 13 |
|
| USD | 180,833 |
| EUR | 153,608 | Credit Suisse AG | 9/28/18 | 274 |
|
| USD | 61,606 |
| EUR | 52,331 | Credit Suisse AG | 9/28/18 | 93 |
|
| USD | 40,249 |
| EUR | 34,189 | Credit Suisse AG | 9/28/18 | 61 |
|
| USD | 2,507 |
| EUR | 2,154 | Credit Suisse AG | 9/28/18 | (25 | ) |
| USD | 909 |
| EUR | 781 | Credit Suisse AG | 9/28/18 | (9 | ) |
| USD | 57,984 |
| EUR | 49,346 | Credit Suisse AG | 9/28/18 | (20 | ) |
|
| | | | | | | | | |
| Currency Purchased | Currency Sold | Counterparty | Settlement Date | Unrealized Appreciation
(Depreciation) |
| USD | 47,993 |
| EUR | 40,843 | Credit Suisse AG | 9/28/18 | $ | (17 | ) |
| USD | 65,230 |
| EUR | 55,513 | Credit Suisse AG | 9/28/18 | (23 | ) |
| GBP | 1 |
| USD | 1 | Morgan Stanley | 9/19/18 | — |
|
| USD | 62,433 |
| GBP | 46,845 | Morgan Stanley | 9/28/18 | 370 |
|
| USD | 30,615 |
| GBP | 22,971 | Morgan Stanley | 9/28/18 | 182 |
|
| USD | 2,398 |
| GBP | 1,811 | Morgan Stanley | 9/28/18 | (1 | ) |
| USD | 15,866 |
| GBP | 11,982 | Morgan Stanley | 9/28/18 | (8 | ) |
| HKD | 82,629 |
| USD | 10,546 | Morgan Stanley | 9/28/18 | 2 |
|
| HKD | 97,179 |
| USD | 12,402 | Morgan Stanley | 9/28/18 | 3 |
|
| HKD | 225,768 |
| USD | 28,814 | Morgan Stanley | 9/28/18 | 3 |
|
| USD | 269,490 |
| HKD | 2,112,301 | Morgan Stanley | 9/28/18 | (129 | ) |
| USD | 23,507 |
| HKD | 184,169 | Morgan Stanley | 9/28/18 | (1 | ) |
| HUF | 4,030,200 |
| USD | 15,106 | UBS AG | 9/19/18 | (749 | ) |
| HUF | 2,004,068 |
| USD | 7,424 | UBS AG | 9/19/18 | (285 | ) |
| HUF | 123,418,178 |
| USD | 446,197 | UBS AG | 9/19/18 | (6,533 | ) |
| USD | 477,156 |
| HUF | 129,452,446 | UBS AG | 9/19/18 | 15,995 |
|
| JPY | 74,414,888 |
| USD | 683,650 | JPMorgan Chase Bank N.A. | 9/19/18 | (7,894 | ) |
| JPY | 482,296 |
| USD | 4,400 | JPMorgan Chase Bank N.A. | 9/19/18 | (21 | ) |
| JPY | 5,972,016 |
| USD | 54,198 | JPMorgan Chase Bank N.A. | 9/19/18 | 34 |
|
| USD | 10,781 |
| JPY | 1,177,347 | JPMorgan Chase Bank N.A. | 9/19/18 | 90 |
|
| USD | 14,245 |
| JPY | 1,549,790 | JPMorgan Chase Bank N.A. | 9/19/18 | 172 |
|
| USD | 6,027 |
| JPY | 660,617 | JPMorgan Chase Bank N.A. | 9/19/18 | 28 |
|
| USD | 104,831 |
| JPY | 11,445,740 | Morgan Stanley | 9/28/18 | 822 |
|
| USD | 20,797 |
| JPY | 2,281,800 | Morgan Stanley | 9/28/18 | 62 |
|
| KRW | 17,207,351 |
| USD | 16,129 | Goldman Sachs & Co. | 9/19/18 | (642 | ) |
| KRW | 435,651,182 |
| USD | 395,328 | Goldman Sachs & Co. | 9/19/18 | (3,211 | ) |
| USD | 416,508 |
| KRW | 445,372,212 | Goldman Sachs & Co. | 9/19/18 | 15,642 |
|
| USD | 6,740 |
| KRW | 7,486,321 | Goldman Sachs & Co. | 9/19/18 | 1 |
|
| NOK | 3,889,451 |
| USD | 481,368 | Goldman Sachs & Co. | 9/19/18 | (2,332 | ) |
| NOK | 67,909 |
| USD | 8,324 | Goldman Sachs & Co. | 9/19/18 | 40 |
|
| NOK | 135,617 |
| USD | 16,688 | Goldman Sachs & Co. | 9/19/18 | 15 |
|
| USD | 16,750 |
| NOK | 134,127 | Goldman Sachs & Co. | 9/19/18 | 231 |
|
| USD | 8,985 |
| NOK | 72,230 | Goldman Sachs & Co. | 9/19/18 | 88 |
|
| USD | 6,236 |
| NOK | 50,340 | Goldman Sachs & Co. | 9/19/18 | 36 |
|
| USD | 258,896 |
| NOK | 2,108,500 | Goldman Sachs & Co. | 9/19/18 | (793 | ) |
| USD | 12,697 |
| NOK | 102,586 | Goldman Sachs & Co. | 9/28/18 | 58 |
|
| USD | 680 |
| NOK | 5,547 | Goldman Sachs & Co. | 9/28/18 | (4 | ) |
| USD | 3,580 |
| NOK | 29,093 | Goldman Sachs & Co. | 9/28/18 | (5 | ) |
| PEN | 2,245,985 |
| USD | 683,751 | Goldman Sachs & Co. | 9/19/18 | (1,715 | ) |
| USD | 23,914 |
| PEN | 78,297 | Goldman Sachs & Co. | 9/19/18 | 138 |
|
| USD | 10,667 |
| PEN | 34,930 | Goldman Sachs & Co. | 9/19/18 | 60 |
|
| USD | 646,878 |
| PEN | 2,132,758 | Goldman Sachs & Co. | 9/19/18 | (774 | ) |
| USD | 23,230 |
| SGD | 31,475 | Goldman Sachs & Co. | 9/28/18 | 86 |
|
| TRY | 1,898,805 |
| USD | 394,860 | Goldman Sachs & Co. | 9/19/18 | 5,000 |
|
| TRY | 65,433 |
| USD | 13,527 | Goldman Sachs & Co. | 9/19/18 | 252 |
|
| USD | 17,261 |
| TRY | 80,734 | Goldman Sachs & Co. | 9/19/18 | 260 |
|
|
| | | | | | | | | |
| Currency Purchased | Currency Sold | Counterparty | Settlement Date | Unrealized Appreciation
(Depreciation) |
| USD | 10,715 |
| TRY | 50,054 | Goldman Sachs & Co. | 9/19/18 | $ | 174 |
|
| USD | 372,834 |
| TRY | 1,833,450 | Goldman Sachs & Co. | 9/19/18 | (13,264 | ) |
| USD | 5,875 |
| ZAR | 75,854 | UBS AG | 9/19/18 | 401 |
|
| USD | 72,483 |
| ZAR | 933,904 | UBS AG | 9/19/18 | 5,081 |
|
| | | | | | | $ | 11,774 |
|
|
| | | | | | | | | | | |
| FUTURES CONTRACTS PURCHASED |
| Reference Entity | Contracts | Expiration
Date | Notional
Amount | Underlying
Contract
Value | Unrealized
Appreciation
(Depreciation) |
| S&P 500 E-Mini | 2 | September 2018 | USD | 100 |
| $ | 272,160 |
| $ | 757 |
|
| U.S. Treasury 10-Year Notes | 1 | September 2018 | USD | 100,000 |
| 120,187 |
| 654 |
|
| U.S. Treasury 10-Year Ultra Notes | 2 | September 2018 | USD | 200,000 |
| 256,469 |
| 2,183 |
|
| | | | | | $ | 648,816 |
| $ | 3,594 |
|
|
| | | | | | | | | | | |
| FUTURES CONTRACTS SOLD |
| Reference Entity | Contracts | Expiration
Date | Notional
Amount | Underlying
Contract
Value | Unrealized
Appreciation
(Depreciation) |
| Euro-Bobl 5-Year Bonds | 1 | September 2018 | EUR | 100,000 |
| $ | 154,348 |
| $ | (755 | ) |
| Euro-Bund 10-Year Bonds | 1 | September 2018 | EUR | 100,000 |
| 189,826 |
| (2,080 | ) |
| NASDAQ 100 E-Mini | 1 | September 2018 | USD | 20 |
| 141,335 |
| (659 | ) |
| U.K. Gilt 10-Year Bonds | 1 | September 2018 | GBP | 100,000 |
| 162,408 |
| (1,770 | ) |
| | | | | | $ | 647,917 |
| $ | (5,264 | ) |
|
| | | | | | | | | | | | | | | |
| CENTRALLY CLEARED TOTAL RETURN SWAP AGREEMENTS | |
| Floating Rate Index | Pay/Receive Floating Rate Index | Fixed Rate | Termination Date | Notional Amount | Premiums Paid (Received) | Unrealized Appreciation (Depreciation) | Value |
| CPURNSA | Receive | 2.24% | 08/19/19 | $ | 500,000 |
| $ | 503 |
| $ | (19,241 | ) | $ | (18,738 | ) |
|
| | | | | | | | | | |
| TOTAL RETURN SWAP AGREEMENTS |
| Counterparty | Floating
Rate Index | Pay/Receive
Floating Rate Index | Fixed Rate | Termination
Date | Notional
Amount | Value* |
| Bank of America N.A. | CPURNSA | Receive | 2.21% | 3/13/19 | $ | 1,000,000 |
| $ | (32,344 | ) |
| Bank of America N.A. | CPURNSA | Receive | 1.41% | 8/27/20 | $ | 700,000 |
| 19,803 |
|
| | | | | | | $ | (12,541 | ) |
*Amount represents value and unrealized appreciation (depreciation).
|
| | |
| NOTES TO SCHEDULE OF INVESTMENTS |
| ADR | - | American Depositary Receipt |
| AUD | - | Australian Dollar |
| CAD | - | Canadian Dollar |
| CHF | - | Swiss Franc |
| CPURNSA | - | U.S. Consumer Price Index Urban Consumers Not Seasonally Adjusted Index |
| EUR | - | Euro |
| FNMA | - | Federal National Mortgage Association |
| GBP | - | British Pound |
| HKD | - | Hong Kong Dollar |
| HUF | - | Hungarian Forint |
| JPY | - | Japanese Yen |
| KRW | - | South Korean Won |
| LIBOR | - | London Interbank Offered Rate |
| MTN | - | Medium Term Note |
| NOK | - | Norwegian Krone |
| PEN | - | Peruvian Sol |
| resets | - | The frequency with which a security's coupon changes, based on current market conditions or an underlying index. |
| SEQ | - | Sequential Payer |
| SGD | - | Singapore Dollar |
| TRY | - | Turkish Lira |
| USD | - | United States Dollar |
| VRN | - | Variable Rate Note. Interest reset date is indicated. Rate shown is effective at the period end. |
| ZAR | - | South African Rand |
| |
| † | Category is less than 0.05% of total net assets. |
| |
| (2) | Final maturity date indicated, unless otherwise noted. |
| |
| (3) | The interest rate resets periodically based on the weighted average coupons of the underlying mortgage-related or asset-backed obligations. |
| |
| (4) | Security was purchased pursuant to Rule 144A under the Securities Act of 1933 and may be sold in transactions exempt from registration, normally to qualified institutional investors. The aggregate value of these securities at the period end was $1,607,113, which represented 10.6% of total net assets. |
| |
| (5) | Security, or a portion thereof, has been pledged at the custodian bank or with a broker for collateral requirements on forward foreign currency exchange contracts, futures contracts and/or swap agreements. At the period end, the aggregate value of securities pledged was $23,815. |
| |
| (6) | The rate indicated is the yield to maturity at purchase for non-interest bearing securities. For interest bearing securities, the stated coupon rate is shown. |
| |
| (7) | Amount relates primarily to payable for investments purchased, but not settled, at period end. |
See Notes to Financial Statements.
|
|
| Statement of Assets and Liabilities |
|
| | | |
| JUNE 30, 2018 |
| Assets |
| Investment securities, at value (cost of $16,074,227) | $ | 16,652,693 |
|
| Cash | 56 |
|
| Foreign currency holdings, at value (cost of $264) | 282 |
|
| Deposits with broker for futures contracts | 4,093 |
|
| Receivable for investments sold | 121,167 |
|
| Receivable for capital shares sold | 46,466 |
|
| Receivable for variation margin on futures contracts | 926 |
|
| Unrealized appreciation on forward foreign currency exchange contracts | 51,869 |
|
| Swap agreements, at value | 19,803 |
|
| Interest and dividends receivable | 55,716 |
|
| Other assets | 183 |
|
| | 16,953,254 |
|
| | |
| Liabilities | |
| Payable for investments purchased | 1,654,653 |
|
| Payable for capital shares redeemed | 21,322 |
|
| Payable for variation margin on futures contracts | 76 |
|
| Payable for variation margin on swap agreements | 70 |
|
| Unrealized depreciation on forward foreign currency exchange contracts | 40,095 |
|
| Swap agreements, at value | 32,344 |
|
| Accrued management fees | 10,592 |
|
| Distribution and service fees payable | 1,476 |
|
| | 1,760,628 |
|
| | |
| Net Assets | $ | 15,192,626 |
|
| | |
| Net Assets Consist of: | |
| Capital (par value and paid-in surplus) | $ | 19,988,640 |
|
| Undistributed net investment income | 186,361 |
|
| Accumulated net realized loss | (5,539,032 | ) |
| Net unrealized appreciation | 556,657 |
|
| | $ | 15,192,626 |
|
|
| | | | | | |
| | Net Assets | Shares Outstanding | Net Asset Value Per Share |
| Investor Class, $0.01 Par Value |
| $9,066,914 |
| 876,292 |
| $10.35 |
| I Class, $0.01 Par Value |
| $2,813,050 |
| 270,563 |
| $10.40 |
| A Class, $0.01 Par Value |
| $1,891,772 |
| 184,356 |
| $10.26* |
| C Class, $0.01 Par Value |
| $1,283,915 |
| 130,206 |
| $9.86 |
| R Class, $0.01 Par Value |
| $14,732 |
| 1,453 |
| $10.14 |
| R5 Class, $0.01 Par Value |
| $122,243 |
| 11,759 |
| $10.40 |
*Maximum offering price $10.89 (net asset value divided by 0.9425).
See Notes to Financial Statements.
|
| | | |
| YEAR ENDED JUNE 30, 2018 |
| Investment Income (Loss) |
| Income: | |
| Interest (net of foreign taxes withheld of $181) | $ | 233,898 |
|
| Dividends (net of foreign taxes withheld of $6,394) | 164,158 |
|
| | 398,056 |
|
| | |
| Expenses: | |
| Management fees | 166,654 |
|
| Distribution and service fees: | |
| A Class | 4,822 |
|
| C Class | 14,612 |
|
| R Class | 533 |
|
| Directors' fees and expenses | 979 |
|
| Other expenses | 2,348 |
|
| | 189,948 |
|
Fees waived(1) | (31,845 | ) |
| | 158,103 |
|
| | |
| Net investment income (loss) | 239,953 |
|
| | |
| Realized and Unrealized Gain (Loss) |
| Net realized gain (loss) on: | |
| Investment transactions | 988,347 |
|
| Forward foreign currency exchange contract transactions | 166,109 |
|
| Futures contract transactions | (134,239 | ) |
| Written options contract transactions | 8,878 |
|
| Swap agreement transactions | 40,600 |
|
| Foreign currency translation transactions | (580 | ) |
| | 1,069,115 |
|
| | |
| Change in net unrealized appreciation (depreciation) on: | |
| Investments | (180,518 | ) |
| Forward foreign currency exchange contracts | 46,528 |
|
| Futures contracts | (1,513 | ) |
| Swap agreements | 11,746 |
|
| Translation of assets and liabilities in foreign currencies | (181 | ) |
| | (123,938 | ) |
| | |
| Net realized and unrealized gain (loss) | 945,177 |
|
| | |
| Net Increase (Decrease) in Net Assets Resulting from Operations | $ | 1,185,130 |
|
| |
| (1) | Amount consists of $20,545, $4,232, $3,858, $2,922, $213 and $75 for Investor Class, I Class, A Class, C Class, R Class and R5 Class, respectively. |
See Notes to Financial Statements.
|
|
| Statement of Changes in Net Assets |
|
| | | | | | |
| YEARS ENDED JUNE 30, 2018 AND JUNE 30, 2017 |
| Increase (Decrease) in Net Assets | June 30, 2018 | June 30, 2017 |
| Operations | | |
| Net investment income (loss) | $ | 239,953 |
| $ | 305,710 |
|
| Net realized gain (loss) | 1,069,115 |
| 296,474 |
|
| Change in net unrealized appreciation (depreciation) | (123,938 | ) | 71,862 |
|
| Net increase (decrease) in net assets resulting from operations | 1,185,130 |
| 674,046 |
|
| | | |
| Distributions to Shareholders | | |
| From net investment income: | | |
| Investor Class | (170,131 | ) | — |
|
| I Class | (70,277 | ) | — |
|
| A Class | (31,819 | ) | — |
|
| C Class | (12,518 | ) | — |
|
| R Class | (1,346 | ) | — |
|
| R5 Class | (653 | ) | — |
|
| Decrease in net assets from distributions | (286,744 | ) | — |
|
| | | |
| Capital Share Transactions | | |
| Net increase (decrease) in net assets from capital share transactions (Note 5) | (4,301,001 | ) | (4,694,573 | ) |
| | | |
| Net increase (decrease) in net assets | (3,402,615 | ) | (4,020,527 | ) |
| | | |
| Net Assets | | |
| Beginning of period | 18,595,241 |
| 22,615,768 |
|
| End of period | $ | 15,192,626 |
| $ | 18,595,241 |
|
| | | |
| Undistributed (distributions in excess of) net investment income | $ | 186,361 |
| $ | (26,416 | ) |
See Notes to Financial Statements.
|
|
| Notes to Financial Statements |
JUNE 30, 2018
1. Organization
American Century Quantitative Equity Funds, Inc. (the corporation) is registered under the Investment Company Act of 1940, as amended (the 1940 Act), as an open-end management investment company and is organized as a Maryland corporation. Multi-Asset Real Return Fund (the fund) is one fund in a series issued by the corporation. The fund’s investment objective is to seek total real return.
The fund offers the Investor Class, I Class, A Class, C Class, R Class and R5 Class. The A Class may incur an initial sales charge. The A Class and C Class may be subject to a contingent deferred sales charge. Sale of the R5 Class commenced on April 10, 2017.
2. Significant Accounting Policies
The following is a summary of significant accounting policies consistently followed by the fund in preparation of its financial statements. The fund is an investment company and follows accounting and reporting guidance in accordance with accounting principles generally accepted in the United States of America. This may require management to make certain estimates and assumptions at the date of the financial statements. Actual results could differ from these estimates. Management evaluated the impact of events or transactions occurring through the date the financial statements were issued that would merit recognition or disclosure.
Investment Valuations — The fund determines the fair value of its investments and computes its net asset value per share at the close of regular trading (usually 4 p.m. Eastern time) on the New York Stock Exchange (NYSE) on each day the NYSE is open. The Board of Directors has adopted valuation policies and procedures to guide the investment advisor in the fund’s investment valuation process and to provide methodologies for the oversight of the fund’s pricing function.
Fixed income securities are valued at the evaluated mean as provided by independent pricing services or at the mean of the most recent bid and asked prices as provided by investment dealers. Corporate bonds, U.S. Treasury and Government Agency securities, convertible bonds, municipal securities, and sovereign governments and agencies are valued using market models that consider trade data, quotations from dealers and active market makers, relevant yield curve and spread data, creditworthiness, trade data or market information on comparable securities, and other relevant security specific information. Mortgage-related and asset-backed securities are valued based on models that consider trade data, prepayment and default projections, benchmark yield and spread data and estimated cash flows of each tranche of the issuer. Collateralized loan obligations are valued based on discounted cash flow models that consider trade and economic data, prepayment assumptions and default projections. Fixed income securities initially expressed in local currencies are translated into U.S. dollars at the mean of the appropriate currency exchange rate at the close of the NYSE as provided by an independent pricing service.
Equity securities that are listed or traded on a domestic securities exchange are valued at the last reported sales price or at the official closing price as provided by the exchange. Equity securities traded on foreign securities exchanges are generally valued at the closing price of such securities on the exchange where primarily traded or at the close of the NYSE, if that is earlier. If no last sales price is reported, or if local convention or regulation so provides, the mean of the latest bid and asked prices may be used. Securities traded over-the-counter are valued at the mean of the latest bid and asked prices, the last sales price, or the official closing price. Equity securities initially expressed in local currencies are translated into U.S. dollars at the mean of the appropriate currency exchange rate at the close of the NYSE as provided by an independent pricing service.
Open-end management investment companies are valued at the reported net asset value per share. Exchange-traded futures are valued at the settlement price as provided by the appropriate exchange. Exchange-traded options contracts are valued at a mean as provided by independent pricing services. Swap agreements are valued at an evaluated mean as provided by independent pricing services or independent brokers. Forward foreign currency exchange contracts are valued at the mean of the appropriate forward exchange rate at the close of the NYSE as provided by an independent pricing service. Investments initially expressed in local currencies are translated into U.S. dollars at the mean of the appropriate currency exchange rate at the close of the NYSE as provided by an independent pricing service.
If the fund determines that the market price for an investment is not readily available or the valuation methods mentioned above do not reflect an investment’s fair value, such investment is valued as determined in good faith by the Board of Directors or its delegate, in accordance with policies and procedures adopted by the Board of Directors. In its determination of fair value, the fund may review several factors including, but not limited to, market information regarding the specific investment or comparable investments and correlation with other investment types, futures indices or general market indicators. Circumstances that may cause the fund to use these procedures to value an investment include, but are not limited to: an investment has been declared in default or is distressed; trading in a security has been suspended during the trading day or a security is not actively trading on its principal exchange; prices received from a regular pricing source are deemed unreliable; or there is a foreign market holiday and no trading occurred.
The fund monitors for significant events occurring after the close of an investment’s primary exchange but before the fund’s net asset value per share is determined. Significant events may include, but are not limited to: corporate announcements and transactions; governmental action and political unrest that could impact a specific investment or an investment sector; or armed conflicts, natural disasters and similar events that could affect investments in a specific country or region. The fund also monitors for significant fluctuations between domestic and foreign markets, as evidenced by the U.S. market or such other indicators that the Board of Directors, or its delegate, deems appropriate. If significant fluctuations in foreign markets are identified, the fund may apply a model-derived factor to the closing price of equity securities traded on foreign securities exchanges. The factor is based on observable market data as provided by an independent pricing service.
Security Transactions — Security transactions are accounted for as of the trade date. Net realized gains and losses are determined on the identified cost basis, which is also used for federal income tax purposes.
Investment Income — Dividend income less foreign taxes withheld, if any, is recorded as of the ex-dividend date. Distributions received on securities that represent a return of capital or long-term capital gain are recorded as a reduction of cost of investments and/or as a realized gain. The fund may estimate the components of distributions received that may be considered nontaxable distributions or long-term capital gain distributions for income tax purposes. Interest income less foreign taxes withheld, if any, is recorded on the accrual basis and includes paydown gain (loss) and accretion of discounts and amortization of premiums. Inflation adjustments related to inflation-linked debt securities are reflected as interest income.
Foreign Currency Translations — All assets and liabilities initially expressed in foreign currencies are translated into U.S. dollars at prevailing exchange rates at period end. The fund may enter into spot foreign currency exchange contracts to facilitate transactions denominated in a foreign currency. Purchases and sales of investment securities, dividend and interest income, spot foreign currency exchange contracts, and expenses are translated at the rates of exchange prevailing on the respective dates of such transactions. Net realized and unrealized foreign currency exchange gains or losses related to investment securities are a component of net realized gain (loss) on investment transactions and change in net unrealized appreciation (depreciation) on investments, respectively.
Income Tax Status — It is the fund’s policy to distribute substantially all net investment income and net realized gains to shareholders and to otherwise qualify as a regulated investment company under provisions of the Internal Revenue Code. Accordingly, no provision has been made for income taxes. The fund files U.S. federal, state, local and non-U.S. tax returns as applicable. The fund's tax returns are subject to examination by the relevant taxing authority until expiration of the applicable statute of limitations, which is generally three years from the date of filing but can be longer in certain jurisdictions. At this time, management believes there are no uncertain tax positions which, based on their technical merit, would not be sustained upon examination and for which it is reasonably possible that the total amounts of unrecognized tax benefits will significantly change in the next twelve months.
Segregated Assets — In accordance with the 1940 Act, the fund segregates assets on its books and records to cover certain types of investment securities and other financial instruments. American Century Investment Management, Inc. (ACIM) (the investment advisor) monitors, on a daily basis, the securities segregated to ensure the fund designates a sufficient amount of liquid assets, marked-to-market daily. The fund may also receive assets or be required to pledge assets at the custodian bank or with a broker for collateral requirements.
Multiple Class — All shares of the fund represent an equal pro rata interest in the net assets of the class to which such shares belong, and have identical voting, dividend, liquidation and other rights and the same terms and conditions, except for class specific expenses and exclusive rights to vote on matters affecting only individual classes. Income, non-class specific expenses, and realized and unrealized capital gains and losses of the fund are allocated to each class of shares based on their relative net assets.
Distributions to Shareholders — Distributions from net investment income, if any, are generally declared and paid quarterly. Distributions from net realized gains, if any, are generally declared and paid annually.
Indemnifications — Under the corporation’s organizational documents, its officers and directors are indemnified against certain liabilities arising out of the performance of their duties to the fund. In addition, in the normal course of business, the fund enters into contracts that provide general indemnifications. The maximum exposure under these arrangements is unknown as this would involve future claims that may be made against a fund. The risk of material loss from such claims is considered by management to be remote.
3. Fees and Transactions with Related Parties
Certain officers and directors of the corporation are also officers and/or directors of American Century Companies, Inc. (ACC). The corporation’s investment advisor, ACIM, the corporation's distributor, American Century Investment Services, Inc. (ACIS), and the corporation’s transfer agent, American Century Services, LLC, are wholly owned, directly or indirectly, by ACC.
Management Fees — The corporation has entered into a management agreement with ACIM, under which ACIM provides the fund with investment advisory and management services in exchange for a single, unified management fee (the fee) per class. The agreement provides that all expenses of managing and operating the fund, except distribution and service fees, brokerage expenses, taxes, interest, fees and expenses of the independent directors (including legal counsel fees), and extraordinary expenses, will be paid by ACIM. The fee is computed and accrued daily based on each class's daily net assets and paid monthly in arrears. The difference in the fee among the classes is a result of their separate arrangements for non-Rule 12b-1 shareholder services. It is not the result of any difference in advisory or custodial fees or other expenses related to the management of the fund’s assets, which do not vary by class. The fee consists of (1) an Investment Category Fee based on the daily net assets of the fund and certain other accounts managed by the investment advisor that are in the same broad investment category as the fund and (2) a Complex Fee based on the assets of all the funds in the American Century Investments family of funds. The investment advisor agreed to waive 0.20% of the fund's management fee from July 1, 2017 through July 31, 2018, at which time the waiver was terminated and the Investment Category Fee range was decreased by 0.20%.
The Investment Category Fee range, the Complex Fee range and the effective annual management fee before and after waiver for each class for the period ended June 30, 2018 are as follows:
|
| | | | |
| | | | Effective Annual Management Fee |
| | Investment Category Fee Range | Complex Fee Range | Before Waiver | After Waiver |
| Investor Class | 0.7754%
to 0.8929%* | 0.2500% to 0.3100% | 1.07% | 0.87% |
| I Class | 0.0500% to 0.1100% | 0.87% | 0.67% |
| A Class | 0.2500% to 0.3100% | 1.07% | 0.87% |
| C Class | 0.2500% to 0.3100% | 1.07% | 0.87% |
| R Class | 0.2500% to 0.3100% | 1.07% | 0.87% |
| R5 Class | 0.0500% to 0.1100% | 0.87% | 0.67% |
*Effective August 1, 2018, the rates for the Investment Category Fee range from 0.5754% to 0.6929%.
Distribution and Service Fees — The Board of Directors has adopted a separate Master Distribution and Individual Shareholder Services Plan for each of the A Class, C Class and R Class (collectively the plans), pursuant to Rule 12b-1 of the 1940 Act. The plans provide that the A Class will pay ACIS an annual distribution and service fee of 0.25%. The plans provide that the C Class will pay ACIS an annual distribution and service fee of 1.00%, of which 0.25% is paid for individual shareholder services and 0.75% is paid for distribution services. The plans provide that the R Class will pay ACIS an annual distribution and service fee of 0.50%. The fees are computed and accrued daily based on each class’s daily net assets and paid monthly in arrears. The fees are used to pay financial intermediaries for distribution and individual shareholder services. Fees incurred under the plans during the period ended June 30, 2018 are detailed in the Statement of Operations.
Directors' Fees and Expenses — The Board of Directors is responsible for overseeing the investment advisor’s management and operations of the fund. The directors receive detailed information about the fund and its investment advisor regularly throughout the year, and meet at least quarterly with management of the investment advisor to review reports about fund operations. The fund’s officers do not receive compensation from the fund.
Interfund Transactions — The fund may enter into security transactions with other American Century Investments funds and other client accounts of the investment advisor, in accordance with the 1940 Act rules and procedures adopted by the Board of Directors. The rules and procedures require, among other things, that these transactions be effected at the independent current market price of the security. During the period, the interfund purchases and sales were $275,727 and $350,269, respectively. The effect of interfund transactions on the Statement of Operations was $(14,848) in net realized gain (loss) on investment transactions.
4. Investment Transactions
Purchases of investment securities, excluding short-term investments, for the period ended June 30, 2018 totaled $23,673,518, of which $606,246 represented U.S. Treasury and Government Agency obligations.
Sales of investment securities, excluding short-term investments, for the period ended June 30, 2018 totaled $28,242,041, of which $2,990,802 represented U.S. Treasury and Government Agency obligations.
5. Capital Share Transactions
Transactions in shares of the fund were as follows:
|
| | | | | | | | | | |
| | Year ended
June 30, 2018 | Year ended June 30, 2017(1) |
| | Shares | Amount | Shares | Amount |
| Investor Class/Shares Authorized | 50,000,000 |
| | 50,000,000 |
| |
| Sold | 62,533 |
| $ | 643,979 |
| 540,569 |
| $ | 5,231,779 |
|
| Issued in reinvestment of distributions | 14,619 |
| 151,114 |
| — |
| — |
|
| Redeemed | (552,338 | ) | (5,598,099 | ) | (697,961 | ) | (6,635,097 | ) |
| | (475,186 | ) | (4,803,006 | ) | (157,392 | ) | (1,403,318 | ) |
| I Class/Shares Authorized | 25,000,000 |
| | 25,000,000 |
| |
| Sold | 533,646 |
| 5,492,235 |
| 90,757 |
| 878,637 |
|
| Issued in reinvestment of distributions | 6,593 |
| 68,443 |
| — |
| — |
|
| Redeemed | (432,897 | ) | (4,446,801 | ) | (73,901 | ) | (703,297 | ) |
| | 107,342 |
| 1,113,877 |
| 16,856 |
| 175,340 |
|
| A Class/Shares Authorized | 30,000,000 |
| | 30,000,000 |
| |
| Sold | 16,417 |
| 169,772 |
| 9,220 |
| 86,459 |
|
| Issued in reinvestment of distributions | 3,091 |
| 31,697 |
| — |
| — |
|
| Redeemed | (37,137 | ) | (373,227 | ) | (296,295 | ) | (2,852,863 | ) |
| | (17,629 | ) | (171,758 | ) | (287,075 | ) | (2,766,404 | ) |
| C Class/Shares Authorized | 20,000,000 |
| | 20,000,000 |
| |
| Sold | 8,025 |
| 77,245 |
| 1,629 |
| 14,706 |
|
| Issued in reinvestment of distributions | 1,216 |
| 11,969 |
| — |
| — |
|
| Redeemed | (55,980 | ) | (541,372 | ) | (78,906 | ) | (723,749 | ) |
| | (46,739 | ) | (452,158 | ) | (77,277 | ) | (709,043 | ) |
| R Class/Shares Authorized | 15,000,000 |
| | 15,000,000 |
| |
| Sold | 322 |
| 3,242 |
| 1,038 |
| 9,826 |
|
| Issued in reinvestment of distributions | 133 |
| 1,346 |
| — |
| — |
|
| Redeemed | (10,729 | ) | (109,135 | ) | (627 | ) | (5,974 | ) |
| | (10,274 | ) | (104,547 | ) | 411 |
| 3,852 |
|
| R5 Class/Shares Authorized | 50,000,000 |
| | 50,000,000 |
| |
| Sold | 11,190 |
| 115,994 |
| 512 |
| 5,000 |
|
| Issued in reinvestment of distributions | 62 |
| 653 |
| — |
| — |
|
| Redeemed | (5 | ) | (56 | ) | — |
| — |
|
| | 11,247 |
| 116,591 |
| 512 |
| 5,000 |
|
| Net increase (decrease) | (431,239 | ) | $ | (4,301,001 | ) | (503,965 | ) | $ | (4,694,573 | ) |
| |
| (1) | April 10, 2017 (commencement of sale) through June 30, 2017 for the R5 Class. |
6. Fair Value Measurements
The fund’s investments valuation process is based on several considerations and may use multiple inputs to determine the fair value of the investments held by the fund. In conformity with accounting principles generally accepted in the United States of America, the inputs used to determine a valuation are classified into three broad levels.
• Level 1 valuation inputs consist of unadjusted quoted prices in an active market for identical investments.
• Level 2 valuation inputs consist of direct or indirect observable market data (including quoted prices for comparable investments, evaluations of subsequent market events, interest rates, prepayment speeds, credit risk, etc.). These inputs also consist of quoted prices for identical investments initially expressed in local currencies that are adjusted through translation into U.S. dollars.
• Level 3 valuation inputs consist of unobservable data (including a fund’s own assumptions).
The level classification is based on the lowest level input that is significant to the fair valuation measurement. The valuation inputs are not necessarily an indication of the risks associated with investing in these securities or other financial instruments. There were no significant transfers between levels during the period.
The following is a summary of the level classifications as of period end. The Schedule of Investments provides additional information on the fund’s portfolio holdings.
|
| | | | | | | | |
| | Level 1 | Level 2 | Level 3 |
| Assets | | | |
| Investment Securities | | | |
| Common Stocks | | | |
| Capital Markets | $ | 66,334 |
| $ | 22,960 |
| — |
|
| Chemicals | 251,461 |
| 89,253 |
| — |
|
| Equity Real Estate Investment Trusts (REITs) | 1,278,273 |
| 563,512 |
| — |
|
| Household Durables | — |
| 13,861 |
| — |
|
| IT Services | 377,566 |
| 123,453 |
| — |
|
| Metals and Mining | 70,196 |
| 17,466 |
| — |
|
| Oil, Gas and Consumable Fuels | 530,585 |
| 107,006 |
| — |
|
| Paper and Forest Products | — |
| 34,414 |
| — |
|
| Real Estate Management and Development | — |
| 521,309 |
| — |
|
| Other Industries | 4,343,109 |
| — |
| — |
|
| Collateralized Mortgage Obligations | — |
| 1,598,555 |
| — |
|
| Corporate Bonds | — |
| 1,503,696 |
| — |
|
| Sovereign Governments and Agencies | — |
| 557,464 |
| — |
|
| Commercial Mortgage-Backed Securities | — |
| 511,264 |
| — |
|
| Asset-Backed Securities | — |
| 465,520 |
| — |
|
| Collateralized Loan Obligations | — |
| 443,961 |
| — |
|
| Exchange-Traded Funds | 217,242 |
| — |
| — |
|
| U.S. Treasury Securities | — |
| 88,467 |
| — |
|
| Temporary Cash Investments | 2,006,021 |
| 849,745 |
| — |
|
| | $ | 9,140,787 |
| $ | 7,511,906 |
| — |
|
| Other Financial Instruments | | | |
| Futures Contracts | $ | 3,594 |
| — |
| — |
|
| Swap Agreements | — |
| $ | 19,803 |
| — |
|
| Forward Foreign Currency Exchange Contracts | — |
| 51,869 |
| — |
|
| | 3,594 |
| $ | 71,672 |
| — |
|
| | | | |
| Liabilities | | | |
| Other Financial Instruments | | | |
| Futures Contracts | $ | 659 |
| $ | 4,605 |
| — |
|
| Swap Agreements | — |
| 51,082 |
| — |
|
| Forward Foreign Currency Exchange Contracts | — |
| 40,095 |
| — |
|
| | $ | 659 |
| $ | 95,782 |
| — |
|
7. Derivative Instruments
Credit Risk — The fund is subject to credit risk in the normal course of pursuing its investment objectives. The value of a bond generally declines as the credit quality of its issuer declines. Credit default swap agreements enable a fund to buy/sell protection against a credit event of a specific issuer or index. A fund may attempt to enhance returns by selling protection or attempt to mitigate credit risk by buying protection. The buyer/seller of credit protection against a security or basket of securities may pay/receive an up-front or periodic payment to compensate for/against potential default events. Changes in value, including the periodic amounts of interest to be paid or received on swap agreements, are recorded as unrealized appreciation (depreciation) on swap agreements. Upon entering into a centrally cleared swap, a fund is required to deposit cash or securities (initial margin) with a financial intermediary in an amount equal to a certain percentage of the notional amount. Subsequent payments (variation margin) are made or received daily, in cash, by a fund. The variation margin is equal to the daily change in the value and is a component of unrealized gains and losses. Realized gain or loss is recorded upon receipt or payment of a periodic settlement or termination of swap agreements. Net realized and unrealized gains or losses occurring during the holding period of swap agreements are a component of net realized gain (loss) on swap agreement transactions and change in net unrealized appreciation (depreciation) on swap agreements, respectively. The risks of entering into swap agreements include the possible lack of liquidity, failure of the counterparty to meet its obligations, and that there may be unfavorable changes in the underlying investments or instruments. The fund's average notional amount held during the period was $727,727.
Equity Price Risk — The fund is subject to equity price risk in the normal course of pursuing its investment objectives. A fund may enter into futures contracts or option contracts based on an equity index or specific security in order to manage its exposure to changes in market conditions. The risks of entering into equity price risk derivative instruments include the possible lack of liquidity, failure of the counterparty to meet its obligations, and that there may be unfavorable changes in the underlying investments or instruments.
A fund may purchase or write an option contract to protect against declines in market value on the underlying index or security. A purchased option contract provides the fund a right, but not an obligation, to buy (call) or sell (put) an equity-related asset at a specified exercise price within a certain period or on a specific date. A written option contract holds the corresponding obligation to sell (call writing) or buy (put writing) the underlying equity-related asset if the purchaser exercises the option contract. The buyer pays the seller an initial purchase price (premium) for this right. Option contracts purchased by a fund are accounted for in the same manner as marketable portfolio securities. The premium received by a fund for option contracts written is recorded as a liability and valued daily. The proceeds from securities sold through the exercise of option contracts are decreased by the premium paid to purchase the option contracts. A fund may recognize a realized gain or loss when the option contract is closed, exercised or expires. Net realized and unrealized gains or losses occurring during the holding period of purchased options contracts are a component of net realized gain (loss) on investment transactions and change in net unrealized appreciation (depreciation) on investments, respectively. Net realized and unrealized gains or losses occurring during the holding period of written options contracts are a component of net realized gain (loss) on written options contract transactions and change in net unrealized appreciation (depreciation) on written options contracts, respectively. The fund’s average exposure to these equity price risk derivative instruments held during the period was 102 written options contracts.
A fund may purchase futures contracts to gain exposure to increases in market value or sell futures contracts to protect against a decline in market value. Upon entering into a futures contract, a fund is required to deposit either cash or securities in an amount equal to a certain percentage of the contract value (initial margin). Subsequent payments (variation margin) are made or received daily, in cash, by a fund. The variation margin is equal to the daily change in the contract value and is recorded as unrealized gains and losses. A fund recognizes a realized gain or loss when the contract is closed or expires. Net realized and unrealized gains or
losses occurring during the holding period of futures contracts are a component of net realized gain (loss) on futures contract transactions and change in net unrealized appreciation (depreciation) on futures contracts, respectively. The fund's average notional exposure to these equity price risk derivative instruments held during the period was $66 futures contracts purchased and $20 futures contracts sold.
Foreign Currency Risk — The fund is subject to foreign currency exchange rate risk in the normal course of pursuing its investment objectives. The value of foreign investments held by a fund may be significantly affected by changes in foreign currency exchange rates. The dollar value of a foreign security generally decreases when the value of the dollar rises against the foreign currency in which the security is denominated and tends to increase when the value of the dollar declines against such foreign currency. A fund may enter into forward foreign currency exchange contracts to reduce a fund's exposure to foreign currency exchange rate fluctuations or to gain exposure to the fluctuations in the value of foreign currencies. The net U.S. dollar
value of foreign currency underlying all contractual commitments held by a fund and the resulting unrealized appreciation or depreciation are determined daily. Realized gain or loss is recorded upon the termination of the contract. Net realized and unrealized gains or losses occurring during the holding period of forward foreign currency exchange contracts are a component of net realized gain (loss) on forward foreign currency exchange contract transactions and change in net unrealized appreciation (depreciation) on forward foreign currency exchange contracts, respectively. A fund bears the risk of an unfavorable change in the foreign currency exchange rate underlying the forward contract. Additionally, losses, up to the fair value, may arise if the counterparties do not perform under the contract terms. The fund's average U.S. dollar exposure to foreign currency risk derivative instruments held during the period was $23,132,822.
Interest Rate Risk — The fund is subject to interest rate risk in the normal course of pursuing its investment objectives. A fund may enter into futures contracts or interest rate swap agreements in order to manage its exposure to changes in market conditions. The value of bonds generally declines as interest rates rise. The risks of entering into interest rate risk derivative instruments include the possible lack of liquidity, failure of the counterparty to meet its obligations, and that there may be unfavorable changes in the underlying investments or instruments.
A fund may enter into futures contracts based on a bond index or a specific underlying security. A fund may purchase futures contracts to gain exposure to increases in market value or sell futures contracts to protect against a decline in market value. Upon entering into a futures contract, a fund will segregate cash, cash equivalents or other appropriate liquid securities on its records in amounts sufficient to meet requirements. Subsequent payments (variation margin) are made or received daily, in cash, by a fund. The variation margin is equal to the daily change in the contract value and is recorded as unrealized gains and losses. A fund recognizes a realized gain or loss when the futures contract is closed or expires. Net realized and unrealized gains or losses occurring during the holding period of futures contracts are a component of net realized gain (loss) on futures contract transactions and change in net unrealized appreciation (depreciation) on futures contracts, respectively. The fund's average notional exposure to these interest rate risk derivative instruments held during the period was $808,333 futures contracts purchased and $413,539 futures contracts sold.
A fund may enter into interest rate swap agreements to gain exposure to declines in interest rates, to protect against increases in interest rates, or to maintain its ability to generate income at prevailing interest rates. A fund will segregate cash, cash equivalents or other appropriate liquid securities on its records in amounts sufficient to meet requirements. Changes in value, including the periodic amounts of interest to be paid or received on swap agreements, are recorded as unrealized appreciation (depreciation) on swap agreements. Realized gain or loss is recorded upon receipt or payment of a periodic settlement or termination of swap agreements. Net realized and unrealized gains or losses occurring during the holding period of swap agreements are a component of net realized gain (loss) on swap agreement transactions and change in net unrealized appreciation (depreciation) on swap agreements, respectively. The fund's average notional amount on interest rate swap agreements held during the period was $1,878,100.
Other Contracts — A fund may enter into total return swap agreements in order to attempt to obtain or preserve a particular return or spread at a lower cost than obtaining a return or spread through purchases and/or sales of instruments in other markets or gain exposure to certain markets in the most economical way possible. A fund will segregate cash, cash equivalents or other appropriate liquid securities on its records in amounts sufficient to meet requirements. Changes in value, including the periodic amounts of interest to be paid or received on swap agreements, are recorded as unrealized appreciation (depreciation) on swap agreements. Upon entering into a centrally cleared swap, a fund is required to deposit cash or securities (initial margin) with a financial intermediary in an amount equal to a certain percentage of the notional amount. Subsequent payments (variation margin) are made or received daily, in cash, by a fund. The variation margin is equal to the daily change in the value and is a component of unrealized gains and losses. Realized gain or loss is recorded upon receipt or payment of a periodic settlement or termination of swap agreements. Net realized and unrealized gains or losses occurring during the holding period of swap agreements are a component of net realized gain (loss) on swap agreement transactions and change in net unrealized appreciation (depreciation) on swap agreements, respectively. The risks of entering into swap agreements include the possible lack of liquidity, failure of the counterparty to meet its obligations, and that there may be unfavorable changes in the underlying investments or instruments, including inflationary risk. The fund's average notional amount held during the period was $2,533,333.
Value of Derivative Instruments as of June 30, 2018
|
| | | | | | | | |
| | Asset Derivatives | | Liability Derivatives | |
| Type of Risk Exposure | Location on Statement of Assets and Liabilities | Value | Location on Statement of Assets and Liabilities | Value |
| Equity Price Risk | Receivable for variation margin on futures contracts* | $ | 661 |
| Payable for variation margin on futures contracts* | — |
|
| Foreign Currency Risk | Unrealized appreciation on forward foreign currency exchange contracts | 51,869 |
| Unrealized depreciation on forward foreign currency exchange contracts | $ | 40,095 |
|
| Interest Rate Risk | Receivable for variation margin on futures contracts* | 265 |
| Payable for variation margin on futures contracts* | 76 |
|
| Other Contracts | Receivable for variation margin on swap agreements* | — |
| Payable for variation margin on swap agreements* | 70 |
|
| Other Contracts | Swap agreements | 19,803 |
| Swap agreements | 32,344 |
|
| | | $ | 72,598 |
| | $ | 72,585 |
|
| |
| * | Included in the unrealized appreciation (depreciation) on futures contracts or centrally cleared swap agreements, as applicable, as reported in the Schedule of Investments. |
Effect of Derivative Instruments on the Statement of Operations for the Year Ended June 30, 2018
|
| | | | | | | | |
| | Net Realized Gain (Loss) | | Change in Net Unrealized Appreciation (Depreciation) | |
| Type of Risk Exposure | Location on Statement of Operations | Value | Location on Statement of Operations | Value |
| Credit Risk | Net realized gain (loss) on swap agreement transactions | $ | 48,382 |
| Change in net unrealized appreciation (depreciation) on swap agreements | $ | (19,389 | ) |
| Equity Price Risk | Net realized gain (loss) on futures contract transactions | (37,777 | ) | Change in net unrealized appreciation (depreciation) on futures contracts | 255 |
|
| Equity Price Risk | Net realized gain (loss) on written options contract transactions | 8,878 |
| Change in net unrealized appreciation (depreciation) on written options contracts | — |
|
| Foreign Currency Risk | Net realized gain (loss) on forward foreign currency exchange contract transactions | 166,109 |
| Change in net unrealized appreciation (depreciation) on forward foreign currency exchange contracts | 46,528 |
|
| Interest Rate Risk | Net realized gain (loss) on futures contract transactions | (96,462 | ) | Change in net unrealized appreciation (depreciation) on futures contracts | (1,768 | ) |
| Interest Rate Risk | Net realized gain (loss) on swap agreement transactions | (8,882 | ) | Change in net unrealized appreciation (depreciation) on swap agreements | — |
|
| Other Contracts | Net realized gain (loss) on swap agreement transactions | 1,100 |
| Change in net unrealized appreciation (depreciation) on swap agreements | 31,135 |
|
| | | $ | 81,348 |
| | $ | 56,761 |
|
8. Risk Factors
There are certain risks involved in investing in foreign securities. These risks include those resulting from future adverse political, social and economic developments, fluctuations in currency exchange rates, the possible imposition of exchange controls, and other foreign laws or restrictions. Investing in emerging markets may accentuate these risks.
There are certain risks involved with investing in forward foreign currency exchange contracts. Changes in the value of foreign currencies against the U.S. dollar could result in gains or losses to the fund. The value of a share of the fund is determined in U.S. dollars. As a result, the fund could recognize a gain or loss based solely upon a change in the exchange rate between the foreign currency and the U.S. dollar. Changes in
exchange rates may increase losses and lower gains from the fund’s investments. The overall impact on the fund may be significant depending on the currencies represented in the portfolio and how each one appreciates or depreciates in relation to the U.S. dollar. Currency trends are unpredictable and exchange rates in foreign currencies may fluctuate significantly over short periods of time for a number of reasons, including changes in interest rates, intervention (or the failure to intervene) by U.S. or foreign governments, central banks or Supranational entities, or by the imposition of currency controls or other political developments in the United States or abroad.
The fund’s commodity-related investments may be subject to greater volatility than investments in traditional securities. The value of the fund’s commodity-related investments may be affected by changes in overall market movements, interest rate changes, and volatility in commodity-related indexes. The value of these investments may also be affected by factors affecting a particular commodity, such as weather, disease, embargoes, tariffs, taxes and economic, political and regulatory developments.
The fund may be subject to certain risks similar to those associated with direct investment in real estate including but not limited to: local or regional economic conditions, changes in zoning laws, changes in property values, property tax increases, overbuilding, increased competition, environmental contamination, natural disasters, and interest rate risk.
The fund’s investment process may result in high portfolio turnover, which could mean high transaction costs, affecting both performance and capital gains tax liabilities to investors.
9. Federal Tax Information
The tax character of distributions paid during the years ended June 30, 2018 and June 30, 2017 were as follows:
|
| | | | | |
| | 2018 | 2017 |
| Distributions Paid From | | |
| Ordinary Income | $ | 286,744 |
| — |
|
| Long-term capital gains | — |
| — |
|
The book-basis character of distributions made during the year from net investment income or net realized gains may differ from their ultimate characterization for federal income tax purposes. These differences reflect the differing character of certain income items and net realized gains and losses for financial statement and tax purposes, and may result in reclassification among certain capital accounts on the financial statements.
The reclassifications, which are primarily due to foreign currency gains and losses, were made to capital $10, undistributed net investment income $259,568, and accumulated net realized loss $(259,578).
As of period end, the federal tax cost of investments and the components of distributable earnings on a tax-basis were as follows:
|
| | | |
| Federal tax cost of investments | $ | 16,179,610 |
|
| Gross tax appreciation of investments | $ | 713,600 |
|
| Gross tax depreciation of investments | (240,517 | ) |
| Net tax appreciation (depreciation) of investments | 473,083 |
|
| Net tax appreciation (depreciation) on derivatives and translation of assets and liabilities in foreign currencies | (34,125 | ) |
| Net tax appreciation (depreciation) | $ | 438,958 |
|
| Undistributed ordinary income | $ | 245,174 |
|
| Accumulated short-term capital losses | $ | (3,180,237 | ) |
Accumulated long-term capital losses
| $ | (2,299,909 | ) |
The difference between book-basis and tax-basis unrealized appreciation (depreciation) is attributable primarily to the tax deferral of losses on wash sales and the realization to ordinary income for tax purposes of unrealized gains on investments in passive foreign investment companies.
Accumulated capital losses represent net capital loss carryovers that may be used to offset future realized capital gains for federal income tax purposes. The capital loss carryovers may be carried forward for an unlimited period. Future capital loss carryover utilization in any given year may be subject to Internal Revenue Code limitations.
10. Recently Issued Accounting Standards
In March 2017, the Financial Accounting Standards Board (FASB) issued Accounting Standards Update No.2017-08, “Receivables - Nonrefundable Fees and Other Costs (Subtopic 310-20), Premium Amortization on Purchased Callable Debt Securities” (ASU 2017-08). ASU 2017-08 amends the amortization period for certain purchased callable debt securities held at a premium, shortening such period to the earliest call date. The amendments are effective for fiscal years, and interim periods within those fiscal years, beginning after December 15, 2018. Management is currently evaluating the impact that adopting ASU 2017-08 will have on the financial statements.
|
| | | | | | | | | | | | | | | |
| For a Share Outstanding Throughout the Years Ended June 30 (except as noted) |
| Per-Share Data | Ratios and Supplemental Data |
| | | Income From Investment Operations: | | | | Ratio to Average Net Assets of: | | |
| | Net Asset Value, Beginning of Period | Net Investment Income (Loss)(1) | Net Realized and Unrealized Gain (Loss) | Total From Investment Operations | Distributions From Net Investment Income | Net Asset Value, End of Period | Total Return(2) | Operating Expenses | Operating Expenses (before expense waiver) | Net Investment Income (Loss) | Net Investment Income (Loss) (before expense waiver) | Portfolio Turnover Rate | Net Assets, End of Period (in thousands) |
| Investor Class |
| 2018 | $9.80 | 0.16 | 0.58 | 0.74 | (0.19) | $10.35 | 7.57% | 0.89% | 1.09% | 1.61% | 1.41% | 160% |
| $9,067 |
|
| 2017 | $9.43 | 0.16 | 0.21 | 0.37 | — | $9.80 | 3.92% | 0.89% | 1.09% | 1.68% | 1.48% | 173% |
| $13,250 |
|
| 2016 | $9.54 | 0.04 | (0.15) | (0.11) | — | $9.43 | (1.15)% | 0.90% | 1.10% | 0.47% | 0.27% | 152% |
| $14,230 |
|
| 2015 | $10.50 | 0.02 | (0.89) | (0.87) | (0.09) | $9.54 | (8.35)% | 0.89% | 1.09% | 0.24% | 0.04% | 93% |
| $24,054 |
|
| 2014 | $9.92 | 0.03 | 0.57 | 0.60 | (0.02) | $10.50 | 6.09% | 0.91% | 1.09% | 0.27% | 0.09% | 87% |
| $28,261 |
|
| I Class |
| 2018 | $9.85 | 0.19 | 0.57 | 0.76 | (0.21) | $10.40 | 7.74% | 0.69% | 0.89% | 1.81% | 1.61% | 160% |
| $2,813 |
|
| 2017 | $9.46 | 0.18 | 0.21 | 0.39 | — | $9.85 | 4.12% | 0.69% | 0.89% | 1.88% | 1.68% | 173% |
| $1,608 |
|
| 2016 | $9.55 | 0.08 | (0.17) | (0.09) | — | $9.46 | (0.94)% | 0.70% | 0.90% | 0.67% | 0.47% | 152% |
| $1,384 |
|
| 2015 | $10.53 | 0.04 | (0.89) | (0.85) | (0.13) | $9.55 | (8.15)% | 0.69% | 0.89% | 0.44% | 0.24% | 93% |
| $1,102 |
|
| 2014 | $9.94 | 0.05 | 0.58 | 0.63 | (0.04) | $10.53 | 6.28% | 0.71% | 0.89% | 0.47% | 0.29% | 87% |
| $1,360 |
|
|
| | | | | | | | | | | | | | | |
| For a Share Outstanding Throughout the Years Ended June 30 (except as noted) |
| Per-Share Data | Ratios and Supplemental Data |
| | | Income From Investment Operations: | | | | Ratio to Average Net Assets of: | | |
| | Net Asset Value, Beginning of Period | Net Investment Income (Loss)(1) | Net Realized and Unrealized Gain (Loss) | Total From Investment Operations | Distributions From Net Investment Income | Net Asset Value, End of Period | Total Return(2) | Operating Expenses | Operating Expenses (before expense waiver) | Net Investment Income (Loss) | Net Investment Income (Loss) (before expense waiver) | Portfolio Turnover Rate | Net Assets, End of Period (in thousands) |
| A Class |
| 2018 | $9.73 | 0.14 | 0.56 | 0.70 | (0.17) | $10.26 | 7.15% | 1.14% | 1.34% | 1.36% | 1.16% | 160% |
| $1,892 |
|
| 2017 | $9.38 | 0.13 | 0.22 | 0.35 | — | $9.73 | 3.73% | 1.14% | 1.34% | 1.43% | 1.23% | 173% |
| $1,964 |
|
| 2016 | $9.51 | 0.03 | (0.16) | (0.13) | — | $9.38 | (1.37)% | 1.15% | 1.35% | 0.22% | 0.02% | 152% |
| $4,587 |
|
| 2015 | $10.45 | —(3) | (0.89) | (0.89) | (0.05) | $9.51 | (8.59)% | 1.14% | 1.34% | (0.01)% | (0.21)% | 93% |
| $8,385 |
|
| 2014 | $9.87 | —(3) | 0.58 | 0.58 | — | $10.45 | 5.88% | 1.16% | 1.34% | 0.02% | (0.16)% | 87% |
| $14,044 |
|
| C Class |
| 2018 | $9.35 | 0.06 | 0.54 | 0.60 | (0.09) | $9.86 | 6.42% | 1.89% | 2.09% | 0.61% | 0.41% | 160% |
| $1,284 |
|
| 2017 | $9.09 | 0.06 | 0.20 | 0.26 | — | $9.35 | 2.86% | 1.89% | 2.09% | 0.68% | 0.48% | 173% |
| $1,655 |
|
| 2016 | $9.28 | (0.05) | (0.14) | (0.19) | — | $9.09 | (2.05)% | 1.90% | 2.10% | (0.53)% | (0.73)% | 152% |
| $2,310 |
|
| 2015 | $10.23 | (0.08) | (0.87) | (0.95) | — | $9.28 | (9.29)% | 1.89% | 2.09% | (0.76)% | (0.96)% | 93% |
| $5,479 |
|
| 2014 | $9.74 | (0.07) | 0.56 | 0.49 | — | $10.23 | 5.03% | 1.91% | 2.09% | (0.73)% | (0.91)% | 87% |
| $9,029 |
|
| R Class |
| 2018 | $9.61 | 0.11 | 0.56 | 0.67 | (0.14) | $10.14 | 6.98% | 1.39% | 1.59% | 1.11% | 0.91% | 160% |
| $15 |
|
| 2017 | $9.29 | 0.11 | 0.21 | 0.32 | — | $9.61 | 3.44% | 1.39% | 1.59% | 1.18% | 0.98% | 173% |
| $113 |
|
| 2016 | $9.44 | 0.01 | (0.16) | (0.15) | — | $9.29 | (1.59)% | 1.40% | 1.60% | (0.03)% | (0.23)% | 152% |
| $105 |
|
| 2015 | $10.38 | (0.03) | (0.89) | (0.92) | (0.02) | $9.44 | (8.88)% | 1.39% | 1.59% | (0.26)% | (0.46)% | 93% |
| $106 |
|
| 2014 | $9.83 | (0.02) | 0.57 | 0.55 | — | $10.38 | 5.60% | 1.41% | 1.59% | (0.23)% | (0.41)% | 87% |
| $116 |
|
| R5 Class | | | | | | | | | | | | |
| 2018 | $9.85 | 0.19 | 0.57 | 0.76 | (0.21) | $10.40 | 7.74% | 0.69% | 0.89% | 1.81% | 1.61% | 160% |
| $122 |
|
2017(4) | $9.77 | 0.05 | 0.03 | 0.08 | — | $9.85 | 0.82% | 0.69%(5) | 0.89%(5) | 2.42%(5) | 2.22%(5) | 173%(6) |
| $5 |
|
|
|
| Notes to Financial Highlights |
| |
| (1) | Computed using average shares outstanding throughout the period. |
| |
| (2) | Total returns are calculated based on the net asset value of the last business day and do not reflect applicable sales charges, if any. Total returns for periods less than one year are not annualized. |
| |
| (3) | Per-share amount was less than $0.005. |
| |
| (4) | April 10, 2017 (commencement of sale) through June 30, 2017. |
| |
| (6) | Portfolio turnover is calculated at the fund level. Percentage indicated was calculated for the year ended June 30, 2017. |
See Notes to Financial Statements.
|
|
| Report of Independent Registered Public Accounting Firm |
To the Board of Directors of American Century Quantitative Equity Funds, Inc. and Shareholders of Multi-Asset Real Return Fund
Opinion on the Financial Statements
We have audited the accompanying statement of assets and liabilities, including the schedule of investments, of Multi-Asset Real Return Fund (one of the funds constituting American Century Quantitative Equity Funds, Inc., referred to hereafter as the "Fund") as of June 30, 2018, the related statement of operations for the year ended June 30, 2018, the statement of changes in net assets for each of the two years in the period ended June 30, 2018, including the related notes, and the financial highlights for each of the periods indicated therein (collectively referred to as the “financial statements”). In our opinion, the financial statements present fairly, in all material respects, the financial position of the Fund as of June 30, 2018, the results of its operations for the year then ended, the changes in its net assets for each of the two years in the period ended June 30, 2018 and the financial highlights for each of the periods indicated therein in conformity with accounting principles generally accepted in the United States of America.
Basis for Opinion
These financial statements are the responsibility of the Fund’s management. Our responsibility is to express an opinion on the Fund’s financial statements based on our audits. We are a public accounting firm registered with the Public Company Accounting Oversight Board (United States) (“PCAOB”) and are required to be independent with respect to the Fund in accordance with the U.S. federal securities laws and the applicable rules and regulations of the Securities and Exchange Commission and the PCAOB.
We conducted our audits of these financial statements in accordance with the standards of the PCAOB. Those standards require that we plan and perform the audit to obtain reasonable assurance about whether the financial statements are free of material misstatement, whether due to error or fraud.
Our audits included performing procedures to assess the risks of material misstatement of the financial statements, whether due to error or fraud, and performing procedures that respond to those risks. Such procedures included examining, on a test basis, evidence regarding the amounts and disclosures in the financial statements. Our audits also included evaluating the accounting principles used and significant estimates made by management, as well as evaluating the overall presentation of the financial statements. Our procedures included confirmation of securities owned as of June 30, 2018 by correspondence with the custodian and brokers; when replies were not received from brokers, we performed other auditing procedures. We believe that our audits provide a reasonable basis for our opinion.
/s/ PricewaterhouseCoopers LLP
Kansas City, Missouri
August 16, 2018
We have served as the auditor of one or more investment companies in American Century Investments since 1997.
The Board of Directors
The individuals listed below serve as directors of the funds. Each director will continue to serve in this capacity until death, retirement, resignation or removal from office. The board has adopted a mandatory retirement age for directors who are not “interested persons,” as that term is defined in the Investment Company Act (independent directors). Independent directors shall retire by December 31 of the year in which they reach their 75th birthday; provided, however, that on or after January 1, 2022, independent trustees shall retire on December 31 of the year in which they reach their 76th birthday.
Mr. Thomas is an “interested person” because he currently serves as President and Chief Executive Officer of American Century Companies, Inc. (ACC), the parent company of American Century Investment Management, Inc. (ACIM or the advisor). The other directors (more than three-fourths of the total number) are independent. They are not employees, directors or officers of, and have no financial interest in, ACC or any of its wholly owned, direct or indirect, subsidiaries, including ACIM, American Century Investment Services, Inc. (ACIS) and American Century Services, LLC (ACS), and they do not have any other affiliations, positions or relationships that would cause them to be considered “interested persons” under the Investment Company Act. The directors serve in this capacity for eight (in the case of Jonathan S. Thomas, 16; and Ronald J. Gilson, 9) registered investment companies in the American Century Investments family of funds.
The following table presents additional information about the directors. The mailing address for each director other than Mr. Thomas is 1665 Charleston Road, Mountain View, California 94043. The mailing address for Mr. Thomas is 4500 Main Street, Kansas City, Missouri 64111.
|
| | | | | |
Name
(Year of Birth) | Position(s) Held with Funds | Length of Time Served | Principal Occupation(s) During Past 5 Years | Number of American Century Portfolios Overseen by Director | Other Directorships Held During Past 5 Years |
| Independent Directors |
|
|
Tanya S. Beder
(1955) | Director | Since 2011 | Chairman and CEO, SBCC Group Inc. (independent advisory services) (2006 to present) | 45 | CYS Investments, Inc.; Nabors Industries Ltd. |
Jeremy I. Bulow
(1954) | Director | Since 2011 | Professor of Economics, Stanford University, Graduate School of Business (1979 to present) | 45 | None |
Anne Casscells
(1958) | Director | Since 2016 | Co-Chief Executive Officer and Chief Investment Officer, Aetos Alternatives Management (investment advisory firm) (2001 to present); Lecturer in Accounting, Stanford University, Graduate School of Business (2009 to present) | 45 | None |
|
| | | | | |
Name
(Year of Birth) | Position(s) Held with Funds | Length of Time Served | Principal Occupation(s) During Past 5 Years | Number of American Century Portfolios Overseen by Director | Other Directorships Held During Past 5 Years |
| Independent Directors |
|
|
Ronald J. Gilson
(1946) | Director and Chairman of the Board | Since 1995
(Chairman since 2005) | Charles J. Meyers Professor of Law and Business, Emeritus, Stanford Law School (1979 to 2016); Marc and Eva Stern Professor of Law and Business, Columbia University School of Law (1992 to present) | 47 | None |
Frederick L. A. Grauer
(1946) | Director | Since 2008 | Senior Advisor, iShares by BlackRock, Inc. (investment management firm) (2010 to 2011, 2013 to 2015); Senior Advisor, Course Hero (an educational technology company) (2015 to present) | 45 | None |
Jonathan D. Levin
(1972) | Director | Since 2016 | Philip H. Knight Professor and Dean, Graduate School of Business, Stanford University (2016 to present); Professor, Stanford University, (2000 to present); Chair, Department of Economics, Stanford University (2011 to 2014) | 45 | None |
Peter F. Pervere
(1947) | Director | Since 2007 | Retired | 45 | None |
John B. Shoven
(1947) | Director | Since 2002 | Charles R. Schwab Professor of Economics, Stanford University (1973 to present) | 45 | Cadence Design Systems; Exponent; Financial Engines |
| Interested Director |
|
|
Jonathan S. Thomas
(1963) | Director and President | Since 2007 | President and Chief Executive Officer, ACC (2007 to present). Also serves as Chief Executive Officer, ACS; Executive Vice President, ACIM; Director, ACC, ACIM and other ACC subsidiaries | 115 | BioMed Valley Discoveries, Inc. |
The Statement of Additional Information has additional information about the fund's directors and is available without charge, upon request, by calling 1-800-345-2021.
Officers
The following table presents certain information about the executive officers of the funds. Each officer serves as an officer for each of the 16 (in the case of Robert J. Leach, 15) investment companies in the American Century family of funds, unless otherwise noted. No officer is compensated for his or her service as an officer of the funds. The listed officers are interested persons of the funds and are appointed or re-appointed on an annual basis. The mailing address for each officer listed below is 4500 Main Street, Kansas City, Missouri 64111.
|
| | |
Name
(Year of Birth) | Offices with the Funds | Principal Occupation(s) During the Past Five Years |
Jonathan S. Thomas
(1963) | Director and President since 2007 | President and Chief Executive Officer, ACC (2007 to present). Also serves as Chief Executive Officer, ACS; Executive Vice President, ACIM; Director, ACC, ACIM and other ACC subsidiaries |
Amy D. Shelton
(1964) | Chief Compliance Officer and Vice President since 2014 | Chief Compliance Officer, American Century funds, (2014 to present); Chief Compliance Officer, ACIM (2014 to present); Chief Compliance Officer, ACIS (2009 to present); Vice President, Client Interactions and Marketing, ACIS (2013 to 2014). Also serves as Vice President, ACIS |
Charles A. Etherington
(1957) | General Counsel since 2007 and Senior Vice President since 2006 | Attorney, ACC (1994 to present); Vice President, ACC (2005 to present); General Counsel, ACC (2007 to present). Also serves as General Counsel, ACIM, ACS, ACIS and other ACC subsidiaries; and Senior Vice President, ACIM and ACS |
C. Jean Wade
(1964) | Vice President,Treasurer and Chief Financial Officer since 2012 | Senior Vice President, ACS (2017 to present); Vice President, ACS (2000 to 2017) |
Robert J. Leach
(1966) | Vice President since 2006 and Assistant Treasurer since 2012 | Vice President, ACS (2000 to present) |
David H. Reinmiller
(1963) | Vice President since 2000 | Attorney, ACC (1994 to present). Also serves as Vice President, ACIM and ACS |
Ward D. Stauffer
(1960) | Secretary since 2005 | Attorney, ACC (2003 to present) |
|
|
| Approval of Management Agreement |
At a meeting held on June 19, 2018, the Fund’s Board of Directors (the "Board") unanimously approved the renewal of the management agreement pursuant to which American Century Investment Management, Inc. (the “Advisor”) acts as the investment advisor for the Fund. Under Section 15(c) of the Investment Company Act, contracts for investment advisory services are required to be reviewed, evaluated, and approved by a majority of a fund’s directors/trustees, including a majority of the independent Directors, each year. The Board regards this annual evaluation and renewal as one of its most important responsibilities.
The independent Directors have memorialized a statement regarding the relationship between their ongoing obligations to oversee and evaluate the performance of the Advisor and their annual consideration of renewal of the management agreement. In that statement, the independent Directors noted that their assessment of the Advisor’s performance is an ongoing process that takes place over the entire year and is informed by all of the extensive information that the Board and its committees receive and consider over time. This information, together with the additional materials provided specifically in connection with the review, are central to the Board’s assessment of the Advisor’s performance and its determination whether to renew the Fund’s management agreement.
Prior to its consideration of the renewal of the management agreement, the Board requested and reviewed extensive data and analysis relating to the proposed renewal. This information and analysis was compiled by the Advisor and certain independent providers of evaluation data concerning the Fund and the services provided to the Fund by the Advisor.
In connection with its consideration of the renewal of the management agreement, the Board’s review and evaluation of the services provided by the Advisor included, but was not limited to, the following:
| |
| • | the nature, extent, and quality of investment management, shareholder services, and other services provided to the Fund; |
| |
| • | the wide range of other programs and services the Advisor provides to the Fund and its shareholders on a routine and non-routine basis; |
| |
| • | the investment performance of the Fund, including data comparing the Fund’s performance to appropriate benchmarks and/or a peer group of other mutual funds with similar investment objectives and strategies; |
| |
| • | the cost of owning the Fund compared to the cost of owning similar funds; |
| |
| • | the Advisor’s compliance policies, procedures, and regulatory experience; |
| |
| • | financial data showing the cost of services provided to the Fund, the profitability of the Fund to the Advisor, and the overall profitability of the Advisor; |
| |
| • | strategic plans of the Advisor; |
| |
| • | any economies of scale associated with the Advisor’s management of the Fund and other accounts; |
| |
| • | services provided and charges to other investment management clients of the Advisor; |
| |
| • | acquired fund fees and expenses; |
| |
| • | payments and practices in connection with financial intermediaries holding shares of the Fund and the services provided by intermediaries in connection therewith; and |
| |
| • | any collateral benefits derived by the Advisor from the management of the Fund. |
In keeping with its practice, the Board held two in-person meetings to review and discuss the information provided in response to their request and held active discussions with the Advisor regarding the renewal of the management agreement. The independent Directors had the benefit of the advice of their independent counsel throughout the process.
Factors Considered
The Directors considered all of the information provided by the Advisor, the independent data providers, and the independent Directors’ independent counsel in connection with the approval. They determined that the information was sufficient for them to evaluate the management agreement for the Fund. In connection with their review, the Directors did not identify any single factor as being all-important or controlling and each Director may have attributed different levels of importance to different factors. In deciding to renew the management agreement, the Board based its decision on a number of factors, including the following:
Nature, Extent and Quality of Services - Generally. Under the management agreement, the Advisor is responsible for providing or arranging for all services necessary for the operation of the Fund. The Board noted that the Advisor provides or arranges at its own expense a wide variety of services including:
| |
| • | constructing and designing the Fund |
| |
| • | portfolio research and security selection |
| |
| • | initial capitalization/funding |
| |
| • | daily valuation of the Fund’s portfolio |
| |
| • | shareholder servicing and transfer agency, including shareholder confirmations, recordkeeping, and communications |
| |
| • | legal services (except the independent Directors’ counsel) |
| |
| • | regulatory and portfolio compliance |
| |
| • | marketing and distribution (except amounts paid by the Fund under Rule 12b-1 plans) |
The Board noted that many of these services have expanded over time in terms of both quantity and complexity in response to shareholder demands, competition in the industry, changing distribution channels, and the changing regulatory environment.
Investment Management, Shareholder, and Other Services. The nature of the investment management services provided to the Fund is quite complex and allows Fund shareholders access to professional money management, instant diversification of their investments within an asset class, the opportunity to easily diversify among asset classes by investing in or exchanging among various American Century Investments funds, and liquidity. In evaluating investment performance, the Board expects the Advisor to manage the Fund in accordance with its investment objectives and approved strategies. Further, the Directors recognize that the Advisor has an obligation to seek the best execution of fund trades. In providing these services, the Advisor utilizes teams of investment professionals (portfolio managers, analysts, research assistants, and securities traders) who require extensive information technology, research, training, compliance, and other systems to conduct their business. The Board, directly and through its Portfolio Committee, regularly reviews investment performance information for the Fund, together with comparative information for appropriate benchmarks and/or peer groups of similarly-managed funds, over different time horizons. The Directors also review detailed performance information during the management agreement approval process. If performance concerns are identified, the Fund receives special reviews until performance improves, during which the Board discusses with the Advisor the reasons for such results (e.g., market conditions, security selection) and any efforts being undertaken to improve performance. The Fund’s performance was above its benchmark for the one-, three-, and five-year periods reviewed by the Board. The Board found the investment management services provided by the Advisor to the Fund to be satisfactory and consistent with the management agreement.
Under the management agreement, the Advisor provides the Fund with a comprehensive package of transfer agency, shareholder, and other services. The Board, directly and through various committees of the Board, regularly reviews reports and evaluations of such services at its regular meetings. These reports include, but are not limited to, information regarding the operational efficiency and accuracy of the shareholder and transfer agency services provided, staffing levels, shareholder satisfaction (as measured by external as well as internal sources), technology support, new products and services offered to Fund shareholders, securities trading activities, portfolio valuation services, auditing services, and legal and operational compliance activities. The Board found the services provided by the Advisor to the Fund under the management agreement to be competitive and of high quality.
Costs of Services and Profitability. The Advisor provides detailed information concerning its cost of providing various services to the Fund, its profitability in managing the Fund, its overall profitability, and its financial condition. The Directors have reviewed with the Advisor the methodology used to prepare this financial information. This information is considered in evaluating the Advisor’s financial condition, its ability to continue to provide services under the management agreement, and the reasonableness of the current management fee. The Board concluded that the Advisor’s profits were reasonable in light of the services provided to the Fund.
Economies of Scale. The Board also reviewed information provided by the Advisor regarding the possible existence of economies of scale in connection with the management of the Fund. The Board concluded that economies of scale are difficult to measure and predict with precision, especially on a fund-by-fund basis. The Board concluded that the Advisor is appropriately sharing economies of scale through its competitive fee structure, offering competitive fees from fund inception, and through reinvestment in its business to provide shareholders enhanced and expanded services.
Comparison to Other Funds’ Fees. The management agreement provides that the Fund pays the Advisor a single, all-inclusive (or unified) management fee for providing all services necessary for the management and operation of the Fund, other than brokerage expenses, expenses attributable to short sales, taxes, interest, extraordinary expenses, the fees and expenses of the Fund’s independent Directors (including their independent legal counsel), and expenses incurred in connection with the provision of shareholder services and distribution services under a plan adopted pursuant to Rule 12b-1 under the 1940 Act. Under the unified fee structure, the Advisor is responsible for providing all investment advisory, custody, audit, administrative, compliance, recordkeeping, marketing, and shareholder services, or arranging and supervising third parties to provide such services. By contrast, most other funds are charged a variety of fees, including an investment advisory fee, a transfer agency fee, an administrative fee, distribution charges, and other expenses. Other than their investment advisory fees and any applicable Rule 12b-1 distribution fees, all other components of the total fees charged by these other funds may be increased without shareholder approval. The Board believes the unified fee structure is a benefit to Fund shareholders because it clearly discloses to shareholders the cost of owning Fund shares, and, since the unified fee cannot be increased without a vote of Fund shareholders, it shifts to the Advisor the risk of increased costs of operating the Fund and provides a direct incentive to minimize administrative inefficiencies. Part of the Board’s analysis of fee levels involves reviewing certain evaluative data compiled by an independent provider and comparing the Fund’s unified fee to the total expense ratio of peer funds. The unified fee charged to shareholders of the Fund was in the lowest quartile of the total expense ratios of the Fund’s peer universe. The Board concluded that the management fee paid by the Fund to the Advisor under the management agreement is reasonable in light of the services provided to the Fund.
Comparison to Fees and Services Provided to Other Clients of the Advisor. The Board also requested and received information from the Advisor concerning the nature of the services, fees, costs, and profitability of its advisory services to advisory clients other than the Fund. They observed that these varying types of client accounts require different services and involve different regulatory and entrepreneurial risks than the management of the Fund. The Board analyzed this
information and concluded that the fees charged and services provided to the Fund were reasonable by comparison.
Payments to Intermediaries. The Directors also requested and received a description of payments made to intermediaries by the Fund and the Advisor and services provided by intermediaries. These payments include various payments made by the Fund or the Advisor to different types of intermediaries and recordkeepers for distribution and service activities provided for the Fund. The Directors reviewed such information and received representations from the Advisor that all such payments by the Fund were made pursuant to the Fund’s Rule 12b-1 Plan and that all such payments by the Advisor were made from the Advisor’s resources and reasonable profits. The Board found such payments to be reasonable in scope and purpose.
Collateral or “Fall-Out” Benefits Derived by the Advisor. The Board considered the existence of collateral benefits the Advisor may receive as a result of its relationship with the Fund. The Board noted that the Advisor’s primary business is managing mutual funds and it generally does not use fund or shareholder information to generate profits in other lines of business, and therefore does not derive any significant collateral benefits from them. The Board noted that the Advisor may receive proprietary research from broker-dealers that execute fund portfolio transactions. The Board also determined that the Advisor is able to provide investment management services to certain clients other than the Fund, at least in part, due to its existing infrastructure built to serve the fund complex. The Board noted that the assets of those other accounts are, where applicable, included with the assets of the Fund to determine breakpoints in the management fee schedule.
Existing Relationship. The Board also considered whether there was any reason for not continuing the existing arrangement with the Advisor. In this regard, the Board was mindful of the potential disruptions of the Fund’s operations and various risks, uncertainties, and other effects that could occur as a result of a decision not to continue such relationship. In particular, the Board recognized that most shareholders have invested in the Fund on the strength of the Advisor’s industry standing and reputation and in the expectation that the Advisor will have a continuing role in providing advisory services to the Fund.
Conclusion of the Directors. As a result of this process, the Board, including all of the independent Directors and assisted by the advice of independent legal counsel, taking into account all of the factors discussed above and the information provided by the Advisor and others in connection with its review and throughout the year, concluded that the management agreement between the Fund and the Advisor is fair and reasonable in light of the services provided and should be renewed.
Retirement Account Information
As required by law, distributions you receive from certain retirement accounts are subject to federal income tax withholding, unless you elect not to have withholding apply*. Tax will be withheld on the total amount withdrawn even though you may be receiving amounts that are not subject to withholding, such as nondeductible contributions. In such case, excess amounts of withholding could occur. You may adjust your withholding election so that a greater or lesser amount will be withheld.
If you don’t want us to withhold on this amount, you must notify us to not withhold the federal income tax. You may notify us in writing or in certain situations by telephone or through other electronic means. For systematic withdrawals, your withholding election will remain in effect until revoked or changed by filing a new election. You have the right to revoke your election at any time and change your withholding percentage for future distributions.
Remember, even if you elect not to have income tax withheld, you are liable for paying income tax on the taxable portion of your withdrawal. If you elect not to have income tax withheld or you don’t have enough income tax withheld, you may be responsible for payment of estimated tax. You may incur penalties under the estimated tax rules if your withholding and estimated tax payments are not sufficient. You can reduce or defer the income tax on a distribution by directly or indirectly rolling such distribution over to another IRA or eligible plan. You should consult your tax advisor for additional information.
State tax will be withheld if, at the time of your distribution, your address is within one of the mandatory withholding states and you have federal income tax withheld (or as otherwise required by state law). State taxes will be withheld from your distribution in accordance with the respective state rules.
*Some 403(b), 457 and qualified retirement plan distributions may be subject to 20% mandatory withholding, as they are subject to special tax and withholding rules. Your plan administrator or plan sponsor is required to provide you with a special tax notice explaining those rules at the time you request a distribution. If applicable, federal and/or state taxes may be withheld from your distribution amount.
Proxy Voting Policies
Descriptions of the principles and policies that the fund's investment advisor uses in exercising the voting rights associated with the securities purchased and/or held by the fund are available without charge, upon request, by calling 1-800-345-2021 or visiting the "About Us" page of American Century Investments’ website at americancentury.com. A description of the policies is also available on the Securities and Exchange Commission’s website at sec.gov. Information regarding how the investment advisor voted proxies relating to portfolio securities during the most recent 12-month period ended June 30 is available on the "About Us" page at americancentury.com. It is also available at sec.gov.
Quarterly Portfolio Disclosure
The fund files its complete schedule of portfolio holdings with the Securities and Exchange Commission (SEC) for the first and third quarters of each fiscal year on Form N-Q. The fund’s Forms N-Q are available on the SEC’s website at sec.gov, and may be reviewed and copied at the SEC’s Public Reference Room in Washington, DC. Information on the operation of the Public Reference Room may be obtained by calling 1-800-SEC-0330. The fund also makes its complete schedule of portfolio holdings for the most recent quarter of its fiscal year available on its website at americancentury.com and, upon request, by calling 1-800-345-2021.
Other Tax Information
The following information is provided pursuant to provisions of the Internal Revenue Code.
The fund hereby designates up to the maximum amount allowable as qualified dividend income for the fiscal year ended June 30, 2018.
For corporate taxpayers, the fund hereby designates $67,093, or up to the maximum amount allowable, of ordinary income distributions paid during the fiscal year ended June 30, 2018 as qualified for the corporate dividends received deduction.
|
| | |
| |
| | | |
| Contact Us | americancentury.com | |
| Automated Information Line | 1-800-345-8765 | |
| Investor Services Representative | 1-800-345-2021
or 816-531-5575 | |
| Investors Using Advisors | 1-800-378-9878 | |
Business, Not-For-Profit, Employer-Sponsored
Retirement Plans | 1-800-345-3533 | |
Banks and Trust Companies, Broker-Dealers,
Financial Professionals, Insurance Companies | 1-800-345-6488 | |
| Telecommunications Relay Service for the Deaf | 711 | |
| | | |
| American Century Quantitative Equity Funds, Inc. | |
| | | |
Investment Advisor: American Century Investment Management, Inc. Kansas City, Missouri | |
| | | |
| This report and the statements it contains are submitted for the general information of our shareholders. The report is not authorized for distribution to prospective investors unless preceded or accompanied by an effective prospectus. | |
| | | |
©2018 American Century Proprietary Holdings, Inc. All rights reserved.
CL-ANN-92993 1808 | |
|
| |
| | |
| | Annual Report |
| | |
| | June 30, 2018 |
| | |
| | NT Core Equity Plus Fund |
| | G Class (ACNKX) |
|
| | |
| Performance | 2 |
|
| Portfolio Commentary | |
|
| Fund Characteristics | |
|
| Shareholder Fee Example | |
|
| Schedule of Investments | |
|
| Statement of Assets and Liabilities | |
|
| Statement of Operations | |
|
| Statement of Changes in Net Assets | |
|
| Statement of Cash Flows | |
|
| Notes to Financial Statements | |
|
| Financial Highlights | |
|
| Report of Independent Registered Public Accounting Firm | |
|
| Management | |
|
| Approval of Management Agreement | |
|
| Additional Information | |
|
Any opinions expressed in this report reflect those of the author as of the date of the report, and do not necessarily represent the opinions of American Century Investments® or any other person in the American Century Investments organization. Any such opinions are subject to change at any time based upon market or other conditions and American Century Investments disclaims any responsibility to update such opinions. These opinions may not be relied upon as investment advice and, because investment decisions made by American Century Investments funds are based on numerous factors, may not be relied upon as an indication of trading intent on behalf of any American Century Investments fund. Security examples are used for representational purposes only and are not intended as recommendations to purchase or sell securities. Performance information for comparative indices and securities is provided to American Century Investments by third party vendors. To the best of American Century Investments’ knowledge, such information is accurate at the time of printing.
|
| | | | | |
| Total Returns as of June 30, 2018 |
| | | | Average Annual Returns | |
| | Ticker Symbol | 1 year | 5 years | Since Inception | Inception Date |
| G Class | ACNKX | 14.82% | 11.80% | 13.82% | 12/1/11 |
| S&P 500 Index | — | 14.37% | 13.41% | 14.99% | — |
Fund returns would have been lower if a portion of the fees had not been waived. Prior to July 31, 2017, the G Class was referred to as the Institutional Class.
|
|
| Growth of $10,000 Over Life of Class |
| $10,000 investment made December 1, 2011 |
|
| |
| Value on June 30, 2018 |
| | G Class — $23,451 |
| |
| | S&P 500 Index — $25,085 |
| |
Ending value of G Class would have been lower if a portion of the fees had not been waived.
|
| |
| Total Annual Fund Operating Expenses |
| G Class | 1.79% |
The total annual fund operating expenses shown is as stated in the fund’s prospectus current as of the date of this report. The prospectus may vary from the expense ratio shown elsewhere in this report because it is based on a different time period, includes acquired fund fees and expenses, and, if applicable, does not include fee waivers or expense reimbursements.
Data presented reflect past performance. Past performance is no guarantee of future results. Current performance may be higher or lower than the performance shown. Total returns for periods less than one year are not annualized. Investment return and principal value will fluctuate, and redemption value may be more or less than original cost. Data assumes reinvestment of dividends and capital gains, and none of the charts reflect the deduction of taxes that a shareholder would pay on fund distributions or the redemption of fund shares. To obtain performance data current to the most recent month end, please call 1-800-345-2021 or visit americancentury.com. For additional information about the fund, please consult the prospectus.
Portfolio Managers: Claudia Musat and Steven Rossi
Performance Summary
NT Core Equity Plus returned 14.82%* for the fiscal year ended June 30, 2018, compared with the 14.37% return of its benchmark, the S&P 500 Index.
NT Core Equity Plus advanced during the fiscal year and outperformed its benchmark, the S&P 500 Index. The fund is managed to have a 100% net exposure to the equity market by investing approximately 130% of its net assets in long positions, while 30% of its net assets are sold short. The proceeds from the securities sold short are used to fund the purchase of the additional 30% of long positions.
NT Core Equity Plus’ stock selection process incorporates factors of valuation, quality, growth, and sentiment, while striving to minimize unintended risks along industries and other risk characteristics. Within the fund, overall performance was aided by growth, sentiment, and quality factors, while the valuation factor detracted. Stock selection in consumer staples, consumer discretionary, and financials benefited relative performance, while choices in the health care, energy, and materials sectors detracted.
Consumer Sectors and Financials Were Additive
Within consumer staples, the absence of tobacco companies helped relative returns. The stock of companies such as Philip Morris International and Altria Group have been depressed due to falling sales and shifting consumer tastes. Philip Morris International’s stock fell due to poor sales of its new smokeless tobacco product. Elsewhere in the sector, positioning within beverage companies helped performance. A long position in The Boston Beer Company contributed to relative returns. We have since exited the position. Underweights to PepsiCo and The Coca-Cola Company were also additive, as the companies’ stock has been under pressure due to changing consumer preferences. We have since closed both of the positions.
Stock selection within the consumer discretionary sector also helped relative results. Long positions in textiles, apparel, and luxury goods companies Deckers Outdoor and Ralph Lauren contributed to relative performance. Underweights, shorts, or avoidance of various media companies was also additive. Stock choices in the distributors industry also boosted relative returns. A short position in Core-Mark Holding Company was among one of the portfolio’s top contributors for the period.
Stock Choices Across Several Sectors Detracted From Relative Returns
Picks in the health care sector detracted. Several short positions in the biotechnology industry detracted from relative performance. In health care equipment and supplies, short positions in Insulet and ICU Medical were among the portfolio’s largest detractors. While Insulet’s stock rose during the period, the company has poor factor model scores for quality, valuation, and sentiment. ICU Medical scores poorly for valuation. We have since exited the position. Elsewhere in the sector, positions in pharmaceuticals companies also hurt relative returns.
Stock selection within energy also negatively affected the portfolio. Within the oil, gas, and consumable fuels industry, a short position in SM Energy dampened results. The company scores poorly across all four stock selection model factors. In addition, long positions in Newfield Exploration and Apache hurt results. We have since exited the positions.
*Fund returns would have been lower if a portion of the fees had not been waived.
Within the materials sector, stock selection among chemicals companies was the largest headwind. A short position in CF Industries Holdings detracted, as did a long position in Platform Specialty Products. We have since exited the position.
A Look Ahead
Our disciplined, objective, and systematic investment strategy is designed to take advantage of opportunities at the individual company level. We believe this approach is the most powerful way to capitalize on market inefficiencies that lead to the mispricing of individual stocks. Our strategy is designed to provide investors with well-diversified and risk-controlled exposure to broad U.S. equities. As such, we do not seek significant deviations in sector weightings versus the S&P 500 Index. Nevertheless, we can point to select sectors and industries where we are finding more or less investment opportunity.
At period-end, consumer discretionary was the most overweight sector. According to our factor model, retailing and consumer durables and apparel offer some of the best growth opportunities in the current environment. We increased our exposure to this area during the period, increasing our relative overweight position in order to take advantage of these opportunities. Information technology ended the period as the second largest relative overweight. Based on our factor model, we believe there are significant opportunities for growth in the software and services and semiconductors and semiconductor equipment industries. These companies are attractive among multiple dimensions of our stock selection model. Conversely, our largest underweight at period-end was in the consumer staples sector, where our underweight is driven by a lack of exposure to the food, beverage, and tobacco industry group, which scores poorly on growth and quality. In addition, we are underweight utilities. Our model also shows a lack of opportunity in the space, particularly based upon poor quality and growth factors.
|
| |
| JUNE 30, 2018 |
| Top Ten Long Holdings | % of net assets |
| Alphabet, Inc., Class A | 3.69% |
| Amazon.com, Inc. | 3.67% |
| Microsoft Corp. | 3.25% |
| Apple, Inc. | 3.15% |
| Facebook, Inc., Class A | 2.72% |
| JPMorgan Chase & Co. | 2.37% |
| Bank of America Corp. | 1.98% |
| Intel Corp. | 1.87% |
| UnitedHealth Group, Inc. | 1.84% |
| Cisco Systems, Inc. | 1.81% |
| | |
| Top Five Short Holdings | % of net assets |
| 2U, Inc. | (0.89)% |
| NOW, Inc. | (0.87)% |
| SiteOne Landscape Supply, Inc. | (0.86)% |
| SM Energy Co. | (0.85)% |
| Sterling Bancorp | (0.82)% |
| | |
| Types of Investments in Portfolio | % of net assets |
| Common Stocks | 129.0% |
| Common Stocks Sold Short | (29.8)% |
| Temporary Cash Investments | 1.3% |
| Other Assets and Liabilities | (0.5)% |
Fund shareholders may incur two types of costs: (1) transaction costs, including sales charges (loads) on purchase payments and redemption/exchange fees; and (2) ongoing costs, including management fees; distribution and service (12b-1) fees; and other fund expenses. This example is intended to help you understand your ongoing costs (in dollars) of investing in your fund and to compare these costs with the ongoing cost of investing in other mutual funds.
The example is based on an investment of $1,000 made at the beginning of the period and held for the entire period from January 1, 2018 to June 30, 2018.
Actual Expenses
The table provides information about actual account values and actual expenses for each class. You may use the information, together with the amount you invested, to estimate the expenses that you paid over the period. First, identify the share class you own. Then simply divide your account value by $1,000 (for example, an $8,600 account value divided by $1,000 = 8.6), then multiply the result by the number under the heading “Expenses Paid During Period” to estimate the expenses you paid on your account during this period.
Hypothetical Example for Comparison Purposes
The table also provides information about hypothetical account values and hypothetical expenses based on the actual expense ratio of each class of your fund and an assumed rate of return of 5% per year before expenses, which is not the actual return of a fund’s share class. The hypothetical account values and expenses may not be used to estimate the actual ending account balance or expenses you paid for the period. You may use this information to compare the ongoing costs of investing in your fund and other funds. To do so, compare this 5% hypothetical example with the 5% hypothetical examples that appear in the shareholder reports of the other funds.
Please note that the expenses shown in the table are meant to highlight your ongoing costs only and do not reflect any transactional costs, such as sales charges (loads) or redemption/exchange fees. Therefore, the table is useful in comparing ongoing costs only, and will not help you determine the relative total costs of owning different funds. In addition, if these transactional costs were included, your costs would have been higher.
|
| | | | |
| | Beginning
Account Value
1/1/18 | Ending
Account Value
6/30/18 | Expenses Paid
During Period(1)
1/1/18 - 6/30/18 | Annualized Expense Ratio(1) |
| Actual | | | | |
| G Class | $1,000 | $1,026.40 | $2.81 | 0.56% |
| Hypothetical | | | | |
| G Class | $1,000 | $1,022.02 | $2.81 | 0.56% |
| |
| (1) | Expenses are equal to the class's annualized expense ratio listed in the table above, multiplied by the average account value over the period, multiplied by 181, the number of days in the most recent fiscal half-year, divided by 365, to reflect the one-half year period. Annualized expense ratio reflects actual expenses, including any applicable fee waivers or expense reimbursements and excluding any acquired fund fees and expenses. |
JUNE 30, 2018
|
| | | | | |
| | Shares | Value |
| COMMON STOCKS — 129.0% | | |
| Aerospace and Defense — 5.2% | | |
Boeing Co. (The)(1) | 24,115 |
| $ | 8,090,824 |
|
| Curtiss-Wright Corp. | 20,681 |
| 2,461,453 |
|
General Dynamics Corp.(1) | 26,670 |
| 4,971,555 |
|
Lockheed Martin Corp.(1) | 18,340 |
| 5,418,186 |
|
| Raytheon Co. | 17,750 |
| 3,428,945 |
|
Teledyne Technologies, Inc.(2) | 4,606 |
| 916,870 |
|
| Textron, Inc. | 73,044 |
| 4,814,330 |
|
| | | 30,102,163 |
|
| Auto Components — 0.7% | | |
Visteon Corp.(2) | 31,525 |
| 4,074,291 |
|
| Banks — 10.1% | | |
Bank of America Corp.(1) | 403,428 |
| 11,372,635 |
|
BB&T Corp.(1) | 97,186 |
| 4,902,062 |
|
| Citigroup, Inc. | 46,215 |
| 3,092,708 |
|
| Fifth Third Bancorp | 155,866 |
| 4,473,354 |
|
| First Citizens BancShares, Inc., Class A | 5,702 |
| 2,299,617 |
|
| First Hawaiian, Inc. | 19,376 |
| 562,292 |
|
JPMorgan Chase & Co.(1) | 130,465 |
| 13,594,453 |
|
SunTrust Banks, Inc.(1) | 79,522 |
| 5,250,042 |
|
U.S. Bancorp(1) | 125,658 |
| 6,285,413 |
|
| Wells Fargo & Co. | 108,693 |
| 6,025,940 |
|
| | | 57,858,516 |
|
| Beverages — 1.2% | | |
| Constellation Brands, Inc., Class A | 12,115 |
| 2,651,610 |
|
| Molson Coors Brewing Co., Class B | 60,402 |
| 4,109,752 |
|
| | | 6,761,362 |
|
| Biotechnology — 3.7% | | |
AbbVie, Inc.(1) | 53,447 |
| 4,951,865 |
|
Alexion Pharmaceuticals, Inc.(2) | 17,783 |
| 2,207,759 |
|
| Amgen, Inc. | 25,379 |
| 4,684,710 |
|
Biogen, Inc.(2) | 10,049 |
| 2,916,622 |
|
Celgene Corp.(2) | 37,007 |
| 2,939,096 |
|
| Gilead Sciences, Inc. | 33,585 |
| 2,379,161 |
|
Regeneron Pharmaceuticals, Inc.(2) | 3,508 |
| 1,210,225 |
|
| | | 21,289,438 |
|
| Building Products — 0.6% | | |
| Owens Corning | 50,845 |
| 3,222,048 |
|
| Capital Markets — 1.9% | | |
| Affiliated Managers Group, Inc. | 24,853 |
| 3,694,895 |
|
| BGC Partners, Inc., Class A | 129,494 |
| 1,465,872 |
|
Evercore, Inc., Class A(1) | 49,477 |
| 5,217,350 |
|
| FactSet Research Systems, Inc. | 1,940 |
| 384,314 |
|
| | | 10,762,431 |
|
| Chemicals — 3.2% | | |
| Air Products & Chemicals, Inc. | 31,082 |
| 4,840,400 |
|
|
| | | | | |
| | Shares | Value |
| Chemours Co. (The) | 21,570 |
| $ | 956,845 |
|
| Eastman Chemical Co. | 40,773 |
| 4,075,669 |
|
| Huntsman Corp. | 151,054 |
| 4,410,777 |
|
| WR Grace & Co. | 59,021 |
| 4,326,829 |
|
| | | 18,610,520 |
|
| Commercial Services and Supplies — 1.5% | | |
| Herman Miller, Inc. | 84,547 |
| 2,866,143 |
|
| MSA Safety, Inc. | 50,778 |
| 4,891,953 |
|
| Pitney Bowes, Inc. | 81,392 |
| 697,529 |
|
| | | 8,455,625 |
|
| Communications Equipment — 2.5% | | |
Ciena Corp.(2) | 79,019 |
| 2,094,794 |
|
Cisco Systems, Inc.(1) | 241,918 |
| 10,409,732 |
|
F5 Networks, Inc.(2) | 12,274 |
| 2,116,651 |
|
| | | 14,621,177 |
|
| Construction and Engineering — 0.5% | | |
| EMCOR Group, Inc. | 37,312 |
| 2,842,428 |
|
| Consumer Finance — 2.4% | | |
| American Express Co. | 50,522 |
| 4,951,156 |
|
| Discover Financial Services | 39,303 |
| 2,767,324 |
|
OneMain Holdings, Inc.(2) | 37,149 |
| 1,236,690 |
|
| Synchrony Financial | 147,733 |
| 4,931,328 |
|
| | | 13,886,498 |
|
| Containers and Packaging — 0.1% | | |
Berry Global Group, Inc.(2) | 12,796 |
| 587,848 |
|
| Diversified Consumer Services — 2.0% | | |
Adtalem Global Education, Inc.(2) | 92,007 |
| 4,425,537 |
|
| Graham Holdings Co., Class B | 5,706 |
| 3,344,286 |
|
Grand Canyon Education, Inc.(2) | 33,900 |
| 3,783,579 |
|
| | | 11,553,402 |
|
| Diversified Financial Services — 0.7% | | |
Berkshire Hathaway, Inc., Class B(2) | 21,366 |
| 3,987,964 |
|
| Diversified Telecommunication Services — 0.7% | | |
| AT&T, Inc. | 111,143 |
| 3,568,789 |
|
| Verizon Communications, Inc. | 10,003 |
| 503,251 |
|
| | | 4,072,040 |
|
| Electrical Equipment — 0.2% | | |
Generac Holdings, Inc.(2) | 10,232 |
| 529,301 |
|
nVent Electric plc(2) | 20,528 |
| 515,253 |
|
| | | 1,044,554 |
|
| Electronic Equipment, Instruments and Components — 0.6% | | |
| Jabil, Inc. | 3,709 |
| 102,591 |
|
Zebra Technologies Corp., Class A(2) | 25,333 |
| 3,628,952 |
|
| | | 3,731,543 |
|
| Energy Equipment and Services — 2.1% | | |
Diamond Offshore Drilling, Inc.(2) | 157,644 |
| 3,288,454 |
|
Halliburton Co.(1) | 120,712 |
| 5,439,283 |
|
| Schlumberger Ltd. | 51,308 |
| 3,439,175 |
|
| | | 12,166,912 |
|
| Equity Real Estate Investment Trusts (REITs) — 4.7% | | |
| Forest City Realty Trust, Inc., Class A | 138,596 |
| 3,161,375 |
|
|
| | | | | |
| | Shares | Value |
| Gaming and Leisure Properties, Inc. | 90,498 |
| $ | 3,239,828 |
|
| Host Hotels & Resorts, Inc. | 61,558 |
| 1,297,027 |
|
| Park Hotels & Resorts, Inc. | 146,559 |
| 4,489,102 |
|
| PotlatchDeltic Corp. | 86,793 |
| 4,413,424 |
|
| PS Business Parks, Inc. | 36,596 |
| 4,702,586 |
|
| Ryman Hospitality Properties, Inc. | 19,330 |
| 1,607,289 |
|
| Select Income REIT | 88,323 |
| 1,984,618 |
|
| Weingarten Realty Investors | 67,334 |
| 2,074,561 |
|
| | | 26,969,810 |
|
| Food and Staples Retailing — 0.6% | | |
Performance Food Group Co.(2) | 79,991 |
| 2,935,670 |
|
United Natural Foods, Inc.(2) | 9,170 |
| 391,192 |
|
| | | 3,326,862 |
|
| Food Products — 0.6% | | |
Nomad Foods Ltd.(2) | 111,276 |
| 2,135,386 |
|
| Pinnacle Foods, Inc. | 17,680 |
| 1,150,261 |
|
| | | 3,285,647 |
|
| Health Care Equipment and Supplies — 6.2% | | |
Abbott Laboratories(1) | 115,961 |
| 7,072,462 |
|
| Cooper Cos., Inc. (The) | 1,694 |
| 398,852 |
|
Edwards Lifesciences Corp.(2) | 18,369 |
| 2,673,975 |
|
Globus Medical, Inc., Class A(1)(2) | 98,373 |
| 4,963,902 |
|
Haemonetics Corp.(2) | 25,612 |
| 2,296,884 |
|
| Hill-Rom Holdings, Inc. | 49,851 |
| 4,353,986 |
|
Intuitive Surgical, Inc.(2) | 6,849 |
| 3,277,110 |
|
Masimo Corp.(2) | 5,845 |
| 570,764 |
|
| Medtronic plc | 42,128 |
| 3,606,578 |
|
| STERIS plc | 20,257 |
| 2,127,188 |
|
Varian Medical Systems, Inc.(2) | 12,392 |
| 1,409,218 |
|
| Zimmer Biomet Holdings, Inc. | 25,944 |
| 2,891,199 |
|
| | | 35,642,118 |
|
| Health Care Providers and Services — 3.3% | | |
| Cigna Corp. | 28,192 |
| 4,791,230 |
|
Express Scripts Holding Co.(2) | 15,338 |
| 1,184,247 |
|
| Humana, Inc. | 7,976 |
| 2,373,897 |
|
UnitedHealth Group, Inc.(1) | 43,134 |
| 10,582,496 |
|
| | | 18,931,870 |
|
| Health Care Technology — 1.0% | | |
athenahealth, Inc.(2) | 6,012 |
| 956,750 |
|
Cerner Corp.(2) | 81,348 |
| 4,863,797 |
|
| | | 5,820,547 |
|
| Hotels, Restaurants and Leisure — 2.0% | | |
Hilton Grand Vacations, Inc.(2) | 28,139 |
| 976,423 |
|
| International Speedway Corp., Class A | 15,526 |
| 694,012 |
|
| Las Vegas Sands Corp. | 62,679 |
| 4,786,169 |
|
| Marriott International, Inc., Class A | 33,362 |
| 4,223,629 |
|
| Vail Resorts, Inc. | 2,717 |
| 744,974 |
|
| | | 11,425,207 |
|
| Household Durables — 1.4% | | |
| Garmin Ltd. | 36,665 |
| 2,236,565 |
|
| KB Home | 63,753 |
| 1,736,632 |
|
|
| | | | | |
| | Shares | Value |
| PulteGroup, Inc. | 71,654 |
| $ | 2,060,052 |
|
| Toll Brothers, Inc. | 57,389 |
| 2,122,819 |
|
| | | 8,156,068 |
|
| Household Products — 0.9% | | |
| Kimberly-Clark Corp. | 48,067 |
| 5,063,378 |
|
| Procter & Gamble Co. (The) | 1,137 |
| 88,754 |
|
| | | 5,152,132 |
|
| Independent Power and Renewable Electricity Producers — 0.8% | |
| AES Corp. | 332,838 |
| 4,463,358 |
|
| Industrial Conglomerates — 1.2% | | |
Honeywell International, Inc.(1) | 47,053 |
| 6,777,985 |
|
| Insurance — 1.0% | | |
| Assurant, Inc. | 6,569 |
| 679,826 |
|
| Hanover Insurance Group, Inc. (The) | 5,031 |
| 601,506 |
|
| Hartford Financial Services Group, Inc. (The) | 86,028 |
| 4,398,612 |
|
| | | 5,679,944 |
|
| Internet and Direct Marketing Retail — 4.2% | | |
Amazon.com, Inc.(2) | 12,382 |
| 21,046,923 |
|
Shutterfly, Inc.(2) | 31,094 |
| 2,799,393 |
|
| | | 23,846,316 |
|
| Internet Software and Services — 7.9% | | |
Alphabet, Inc., Class A(1)(2) | 18,742 |
| 21,163,279 |
|
eBay, Inc.(2) | 103,315 |
| 3,746,202 |
|
Facebook, Inc., Class A(1)(2) | 80,360 |
| 15,615,555 |
|
| LogMeIn, Inc. | 3,745 |
| 386,671 |
|
Stamps.com, Inc.(2) | 17,666 |
| 4,470,382 |
|
| | | 45,382,089 |
|
| IT Services — 3.6% | | |
| Accenture plc, Class A | 20,644 |
| 3,377,152 |
|
Acxiom Corp.(2) | 83,637 |
| 2,504,928 |
|
| Convergys Corp. | 11,266 |
| 275,341 |
|
| International Business Machines Corp. | 51,934 |
| 7,255,180 |
|
| Total System Services, Inc. | 45,592 |
| 3,853,436 |
|
| Visa, Inc., Class A | 27,346 |
| 3,621,977 |
|
| | | 20,888,014 |
|
| Leisure Products — 0.7% | | |
| Brunswick Corp. | 64,715 |
| 4,172,823 |
|
| Machinery — 4.3% | | |
| Allison Transmission Holdings, Inc. | 94,708 |
| 3,834,727 |
|
Caterpillar, Inc.(1) | 34,524 |
| 4,683,871 |
|
| Hillenbrand, Inc. | 18,398 |
| 867,466 |
|
| Ingersoll-Rand plc | 58,090 |
| 5,212,416 |
|
| Oshkosh Corp. | 52,729 |
| 3,707,903 |
|
| Pentair plc | 37,817 |
| 1,591,339 |
|
| Terex Corp. | 84,921 |
| 3,582,817 |
|
| Toro Co. (The) | 20,690 |
| 1,246,573 |
|
| | | 24,727,112 |
|
| Media — 0.5% | | |
AMC Networks, Inc., Class A(2) | 33,962 |
| 2,112,436 |
|
| Walt Disney Co. (The) | 6,726 |
| 704,952 |
|
| | | 2,817,388 |
|
|
| | | | | |
| | Shares | Value |
| Metals and Mining — 0.3% | | |
| Reliance Steel & Aluminum Co. | 18,890 |
| $ | 1,653,631 |
|
| Multiline Retail — 1.1% | | |
| Kohl's Corp. | 51,442 |
| 3,750,122 |
|
| Macy's, Inc. | 74,272 |
| 2,780,001 |
|
| | | 6,530,123 |
|
| Oil, Gas and Consumable Fuels — 8.1% | | |
Chevron Corp.(1) | 59,017 |
| 7,461,519 |
|
| ConocoPhillips | 26,907 |
| 1,873,265 |
|
Continental Resources, Inc.(2) | 38,659 |
| 2,503,557 |
|
Exxon Mobil Corp.(1) | 71,222 |
| 5,892,196 |
|
HollyFrontier Corp.(1) | 72,891 |
| 4,987,931 |
|
| Marathon Petroleum Corp. | 53,490 |
| 3,752,858 |
|
| PBF Energy, Inc., Class A | 97,403 |
| 4,084,108 |
|
| Phillips 66 | 47,011 |
| 5,279,806 |
|
| Plains GP Holdings LP, Class A | 176,493 |
| 4,219,948 |
|
Southwestern Energy Co.(2) | 863,751 |
| 4,577,880 |
|
| Valero Energy Corp. | 14,507 |
| 1,607,811 |
|
| | | 46,240,879 |
|
| Paper and Forest Products — 0.8% | | |
| Louisiana-Pacific Corp. | 161,563 |
| 4,397,745 |
|
| Personal Products — 1.6% | | |
Edgewell Personal Care Co.(2) | 98,218 |
| 4,956,080 |
|
Nu Skin Enterprises, Inc., Class A(1) | 53,004 |
| 4,144,383 |
|
| | | 9,100,463 |
|
| Pharmaceuticals — 4.7% | | |
| Allergan plc | 17,133 |
| 2,856,414 |
|
| Bristol-Myers Squibb Co. | 66,565 |
| 3,683,707 |
|
| Eli Lilly & Co. | 6,898 |
| 588,606 |
|
Horizon Pharma plc(2) | 84,368 |
| 1,397,134 |
|
Johnson & Johnson(1) | 57,640 |
| 6,994,038 |
|
| Merck & Co., Inc. | 42,666 |
| 2,589,826 |
|
Pfizer, Inc.(1) | 185,392 |
| 6,726,022 |
|
| Zoetis, Inc. | 24,047 |
| 2,048,564 |
|
| | | 26,884,311 |
|
| Professional Services — 2.4% | | |
ASGN, Inc.(2) | 1,949 |
| 152,392 |
|
| Dun & Bradstreet Corp. (The) | 36,147 |
| 4,433,430 |
|
| Insperity, Inc. | 24,762 |
| 2,358,580 |
|
| ManpowerGroup, Inc. | 31,282 |
| 2,692,129 |
|
| Robert Half International, Inc. | 59,566 |
| 3,877,747 |
|
| | | 13,514,278 |
|
| Real Estate Management and Development — 0.6% | | |
| Jones Lang LaSalle, Inc. | 22,313 |
| 3,703,735 |
|
| Road and Rail — 0.7% | | |
| Ryder System, Inc. | 12,581 |
| 904,071 |
|
| Werner Enterprises, Inc. | 75,911 |
| 2,850,458 |
|
| | | 3,754,529 |
|
| Semiconductors and Semiconductor Equipment — 5.7% | | |
Advanced Energy Industries, Inc.(2) | 10,800 |
| 627,372 |
|
| Applied Materials, Inc. | 109,781 |
| 5,070,784 |
|
|
| | | | | |
| | Shares | Value |
| Broadcom, Inc. | 19,400 |
| $ | 4,707,216 |
|
Intel Corp.(1) | 216,197 |
| 10,747,153 |
|
| KLA-Tencor Corp. | 12,045 |
| 1,234,974 |
|
Lam Research Corp.(1) | 28,986 |
| 5,010,230 |
|
| MKS Instruments, Inc. | 8,054 |
| 770,768 |
|
| Skyworks Solutions, Inc. | 3,273 |
| 316,335 |
|
Texas Instruments, Inc.(1) | 38,334 |
| 4,226,324 |
|
| | | 32,711,156 |
|
| Software — 8.5% | | |
Activision Blizzard, Inc.(1) | 75,574 |
| 5,767,808 |
|
Adobe Systems, Inc.(2) | 23,971 |
| 5,844,369 |
|
Cadence Design Systems, Inc.(2) | 101,344 |
| 4,389,209 |
|
Citrix Systems, Inc.(2) | 19,785 |
| 2,074,259 |
|
Electronic Arts, Inc.(2) | 8,799 |
| 1,240,835 |
|
| Intuit, Inc. | 13,760 |
| 2,811,237 |
|
Microsoft Corp.(1) | 188,837 |
| 18,621,217 |
|
| Oracle Corp. (New York) | 71,511 |
| 3,150,775 |
|
Synopsys, Inc.(2) | 57,028 |
| 4,879,886 |
|
VMware, Inc., Class A(2) | 1,054 |
| 154,906 |
|
| | | 48,934,501 |
|
| Specialty Retail — 1.4% | | |
AutoZone, Inc.(2) | 6,439 |
| 4,320,118 |
|
| Best Buy Co., Inc. | 34,799 |
| 2,595,309 |
|
| Ross Stores, Inc. | 14,789 |
| 1,253,368 |
|
| | | 8,168,795 |
|
| Technology Hardware, Storage and Peripherals — 3.9% | | |
Apple, Inc.(1) | 97,734 |
| 18,091,541 |
|
| Western Digital Corp. | 54,370 |
| 4,208,781 |
|
| | | 22,300,322 |
|
| Textiles, Apparel and Luxury Goods — 2.7% | | |
Deckers Outdoor Corp.(1)(2) | 48,011 |
| 5,419,962 |
|
Michael Kors Holdings Ltd.(2) | 76,105 |
| 5,068,593 |
|
Ralph Lauren Corp.(1) | 31,770 |
| 3,994,124 |
|
| Tapestry, Inc. | 22,227 |
| 1,038,223 |
|
| | | 15,520,902 |
|
| Thrifts and Mortgage Finance — 0.2% | | |
Essent Group Ltd.(2) | 27,879 |
| 998,626 |
|
| Trading Companies and Distributors — 0.7% | | |
United Rentals, Inc.(2) | 27,916 |
| 4,120,960 |
|
| Wireless Telecommunication Services — 0.8% | | |
T-Mobile US, Inc.(2) | 74,147 |
| 4,430,283 |
|
TOTAL COMMON STOCKS
(Cost $590,789,829) | | 740,061,289 |
|
| TEMPORARY CASH INVESTMENTS — 1.3% | | |
| Repurchase Agreement, BMO Capital Markets Corp., (collateralized by various U.S. Treasury obligations, 1.375% - 3.75%, 2/15/19 - 11/15/47, valued at $4,017,252), in a joint trading account at 1.75%, dated 6/29/18, due 7/2/18 (Delivery value $3,936,727) | | 3,936,153 |
|
| Repurchase Agreement, Fixed Income Clearing Corp., (collateralized by various U.S. Treasury obligations, 2.75%, 2/15/28, valued at $3,349,850), at 0.90%, dated 6/29/18, due 7/2/18 (Delivery value $3,280,246) | | 3,280,000 |
|
|
| | | | | |
| | Shares | Value |
| State Street Institutional U.S. Government Money Market Fund, Premier Class | 30,653 |
| $ | 30,653 |
|
TOTAL TEMPORARY CASH INVESTMENTS
(Cost $7,246,806) | | 7,246,806 |
|
TOTAL INVESTMENT SECURITIES BEFORE SECURITIES SOLD SHORT — 130.3%
(Cost $598,036,635) | 747,308,095 |
|
| COMMON STOCKS SOLD SHORT — (29.8)% | | |
| Aerospace and Defense — (0.6)% | | |
| BWX Technologies, Inc. | (54,076 | ) | (3,370,016 | ) |
| Airlines — (0.5)% | | |
| Allegiant Travel Co. | (4,191 | ) | (582,339 | ) |
| Spirit Airlines, Inc. | (66,320 | ) | (2,410,732 | ) |
| | | (2,993,071 | ) |
| Banks — (3.1)% | | |
| Home BancShares, Inc. | (182,134 | ) | (4,108,943 | ) |
| Pinnacle Financial Partners, Inc. | (71,208 | ) | (4,368,611 | ) |
| Sterling Bancorp | (200,792 | ) | (4,718,612 | ) |
| Texas Capital Bancshares, Inc. | (11,965 | ) | (1,094,798 | ) |
| United Bankshares, Inc. | (92,023 | ) | (3,349,637 | ) |
| | | (17,640,601 | ) |
| Biotechnology — (1.4)% | | |
| Alnylam Pharmaceuticals, Inc. | (8,553 | ) | (842,385 | ) |
| Blueprint Medicines Corp. | (17,609 | ) | (1,117,819 | ) |
| FibroGen, Inc. | (23,714 | ) | (1,484,497 | ) |
| Global Blood Therapeutics, Inc. | (30,093 | ) | (1,360,204 | ) |
| Sage Therapeutics, Inc. | (9,810 | ) | (1,535,559 | ) |
| Sarepta Therapeutics, Inc. | (11,974 | ) | (1,582,723 | ) |
| | | (7,923,187 | ) |
| Capital Markets — (0.5)% | | |
| Brookfield Asset Management, Inc., Class A | (55,600 | ) | (2,254,024 | ) |
| Eaton Vance Corp. | (14,609 | ) | (762,444 | ) |
| | | (3,016,468 | ) |
| Chemicals — (1.0)% | | |
| Ecolab, Inc. | (5,154 | ) | (723,261 | ) |
| HB Fuller Co. | (20,213 | ) | (1,085,034 | ) |
| Mosaic Co. (The) | (51,696 | ) | (1,450,072 | ) |
| Valvoline, Inc. | (124,705 | ) | (2,689,887 | ) |
| | | (5,948,254 | ) |
| Commercial Services and Supplies — (1.2)% | | |
| Covanta Holding Corp. | (252,299 | ) | (4,162,933 | ) |
| Healthcare Services Group, Inc. | (66,136 | ) | (2,856,414 | ) |
| | | (7,019,347 | ) |
| Communications Equipment — (0.4)% | | |
| EchoStar Corp., Class A | (46,544 | ) | (2,066,554 | ) |
| Construction and Engineering — (0.4)% | | |
| MasTec, Inc. | (44,920 | ) | (2,279,690 | ) |
Construction Materials† | | |
| Vulcan Materials Co. | (805 | ) | (103,893 | ) |
| Consumer Finance — (0.7)% | | |
| SLM Corp. | (365,789 | ) | (4,188,284 | ) |
| Distributors — (0.5)% | | |
| Core-Mark Holding Co., Inc. | (133,613 | ) | (3,033,015 | ) |
|
| | | | | |
| | Shares | Value |
| Diversified Telecommunication Services — (0.7)% | | |
| Zayo Group Holdings, Inc. | (103,820 | ) | $ | (3,787,354 | ) |
| Electronic Equipment, Instruments and Components — (0.8)% | | |
| II-VI, Inc. | (102,717 | ) | (4,463,054 | ) |
| Energy Equipment and Services — (0.4)% | | |
| Patterson-UTI Energy, Inc. | (131,171 | ) | (2,361,078 | ) |
| Food and Staples Retailing — (0.5)% | | |
| Casey's General Stores, Inc. | (8,922 | ) | (937,524 | ) |
| PriceSmart, Inc. | (21,126 | ) | (1,911,903 | ) |
| | | (2,849,427 | ) |
| Health Care Equipment and Supplies — (1.7)% | | |
| Avanos Medical, Inc. | (81,900 | ) | (4,688,775 | ) |
| Insulet Corp. | (48,610 | ) | (4,165,877 | ) |
| Integra LifeSciences Holdings Corp. | (13,131 | ) | (845,768 | ) |
| | | (9,700,420 | ) |
| Health Care Providers and Services — (0.6)% | | |
| Henry Schein, Inc. | (39,239 | ) | (2,850,321 | ) |
| LifePoint Health, Inc. | (17,110 | ) | (834,968 | ) |
| | | (3,685,289 | ) |
| Independent Power and Renewable Electricity Producers — (0.2)% | |
| Ormat Technologies, Inc. | (20,328 | ) | (1,081,246 | ) |
| Insurance — (0.1)% | | |
| RLI Corp. | (12,563 | ) | (831,545 | ) |
| Internet Software and Services — (0.9)% | | |
| 2U, Inc. | (61,197 | ) | (5,113,621 | ) |
| IT Services — (0.9)% | | |
| Gartner, Inc. | (32,995 | ) | (4,385,036 | ) |
| WEX, Inc. | (5,538 | ) | (1,054,878 | ) |
| | | (5,439,914 | ) |
| Leisure Products — (0.1)% | | |
| Mattel, Inc. | (40,913 | ) | (671,791 | ) |
| Life Sciences Tools and Services — (0.1)% | | |
| Syneos Health, Inc. | (16,735 | ) | (784,872 | ) |
| Machinery — (2.3)% | | |
| Colfax Corp. | (136,656 | ) | (4,188,506 | ) |
| Flowserve Corp. | (47,735 | ) | (1,928,494 | ) |
| John Bean Technologies Corp. | (35,481 | ) | (3,154,261 | ) |
| Middleby Corp. (The) | (8,432 | ) | (880,470 | ) |
| Trinity Industries, Inc. | (80,501 | ) | (2,757,964 | ) |
| | | (12,909,695 | ) |
| Marine — (0.2)% | | |
| Kirby Corp. | (15,610 | ) | (1,304,996 | ) |
| Media — (0.3)% | | |
| Loral Space & Communications, Inc. | (44,171 | ) | (1,660,830 | ) |
| Metals and Mining — (0.4)% | | |
| New Gold, Inc. | (1,120,951 | ) | (2,331,578 | ) |
| Multi-Utilities — (0.2)% | | |
| NiSource, Inc. | (40,841 | ) | (1,073,301 | ) |
| Oil, Gas and Consumable Fuels — (3.4)% | | |
| Cheniere Energy, Inc. | (52,363 | ) | (3,413,544 | ) |
| Parsley Energy, Inc., Class A | (23,898 | ) | (723,631 | ) |
|
| | | | | |
| | Shares | Value |
| PDC Energy, Inc. | (6,974 | ) | $ | (421,578 | ) |
| QEP Resources, Inc. | (73,864 | ) | (905,573 | ) |
| RSP Permian, Inc. | (9,772 | ) | (430,164 | ) |
| SM Energy Co. | (190,149 | ) | (4,884,928 | ) |
| Targa Resources Corp. | (92,608 | ) | (4,583,170 | ) |
| WPX Energy, Inc. | (234,312 | ) | (4,224,645 | ) |
| | | (19,587,233 | ) |
| Personal Products — (0.5)% | | |
| Coty, Inc., Class A | (186,963 | ) | (2,636,178 | ) |
| Pharmaceuticals — (0.1)% | | |
| Medicines Co. (The) | (15,966 | ) | (585,952 | ) |
| Professional Services — (0.1)% | | |
| TriNet Group, Inc. | (5,673 | ) | (317,348 | ) |
| Real Estate Management and Development — (1.3)% | | |
| Howard Hughes Corp. (The) | (29,291 | ) | (3,881,058 | ) |
| Kennedy-Wilson Holdings, Inc. | (163,623 | ) | (3,460,626 | ) |
| | | (7,341,684 | ) |
| Semiconductors and Semiconductor Equipment — (0.7)% | | |
| Cree, Inc. | (95,749 | ) | (3,980,286 | ) |
| Software — (0.5)% | | |
| Ellie Mae, Inc. | (3,049 | ) | (316,608 | ) |
| Guidewire Software, Inc. | (8,966 | ) | (796,001 | ) |
| HubSpot, Inc. | (11,734 | ) | (1,471,444 | ) |
| | | (2,584,053 | ) |
| Specialty Retail — (0.6)% | | |
| Monro, Inc. | (58,264 | ) | (3,385,138 | ) |
| Thrifts and Mortgage Finance — (0.1)% | | |
| TFS Financial Corp. | (18,654 | ) | (294,174 | ) |
| Trading Companies and Distributors — (1.7)% | | |
| NOW, Inc. | (376,238 | ) | (5,015,253 | ) |
| SiteOne Landscape Supply, Inc. | (58,625 | ) | (4,922,740 | ) |
| | | (9,937,993 | ) |
| Transportation Infrastructure — (0.1)% | | |
| Macquarie Infrastructure Corp. | (7,768 | ) | (327,811 | ) |
TOTAL COMMON STOCKS SOLD SHORT
(Proceeds $166,113,129) | | (170,610,241 | ) |
| OTHER ASSETS AND LIABILITIES — (0.5)% | | (3,001,051 | ) |
| TOTAL NET ASSETS — 100.0% | | $ | 573,696,803 |
|
|
| | |
| NOTES TO SCHEDULE OF INVESTMENTS |
| |
| † | Category is less than 0.05% of total net assets. |
| |
| (1) | Security, or a portion thereof, has been pledged at the custodian bank or with a broker for collateral requirements on securities sold short. At the period end, the aggregate value of securities pledged was $217,678,001. |
See Notes to Financial Statements.
|
|
| Statement of Assets and Liabilities |
|
| | | |
| JUNE 30, 2018 |
| Assets |
| Investment securities, at value (cost of $598,036,635) | $ | 747,308,095 |
|
| Receivable for investments sold | 27,421,058 |
|
| Dividends and interest receivable | 549,568 |
|
| | 775,278,721 |
|
| | |
| Liabilities | |
| Securities sold short, at value (proceeds of $166,113,129) | 170,610,241 |
|
| Payable for investments purchased | 29,647,276 |
|
| Payable for capital shares redeemed | 1,043,700 |
|
| Dividend expense payable on securities sold short | 137,655 |
|
| Fees and charges payable on borrowings for securities sold short | 143,046 |
|
| | 201,581,918 |
|
| | |
| Net Assets | $ | 573,696,803 |
|
| | |
| G Class Capital Shares, $0.01 Par Value | |
| Shares authorized | 320,000,000 |
|
| Shares outstanding | 33,959,569 |
|
| | |
| Net Asset Value Per Share | $ | 16.89 |
|
| | |
| Net Assets Consist of: | |
| Capital (par value and paid-in surplus) | $ | 385,155,149 |
|
| Undistributed net investment income | 364,504 |
|
| Undistributed net realized gain | 43,402,802 |
|
| Net unrealized appreciation | 144,774,348 |
|
| | $ | 573,696,803 |
|
See Notes to Financial Statements.
|
| | | |
| YEAR ENDED JUNE 30, 2018 |
| Investment Income (Loss) |
| Income: | |
| Dividends (net of foreign taxes withheld of $4,633) | $ | 14,230,649 |
|
| Interest | 54,704 |
|
| | 14,285,353 |
|
| | |
| Expenses: | |
| Dividend expense on securities sold short | 1,834,029 |
|
| Fees and charges on borrowings for securities sold short | 1,557,964 |
|
| Management fees | 6,555,037 |
|
| Directors' fees and expenses | 36,957 |
|
| Other expenses | 5,759 |
|
| | 9,989,746 |
|
| Fees waived | (6,012,090 | ) |
| | 3,977,656 |
|
| | |
| Net investment income (loss) | 10,307,697 |
|
| | |
| Realized and Unrealized Gain (Loss) | |
| Net realized gain (loss) on: | |
| Investment transactions | 75,608,356 |
|
| Securities sold short transactions | (28,262,856 | ) |
| Futures contract transactions | 131,013 |
|
| | 47,476,513 |
|
| | |
| Change in net unrealized appreciation (depreciation) on: | |
| Investments | 31,035,858 |
|
| Securities sold short | (3,089,346 | ) |
| | 27,946,512 |
|
| | |
| Net realized and unrealized gain (loss) | 75,423,025 |
|
| | |
| Net Increase (Decrease) in Net Assets Resulting from Operations | $ | 85,730,722 |
|
See Notes to Financial Statements.
|
|
| Statement of Changes in Net Assets |
|
| | | | | | |
| YEARS ENDED JUNE 30, 2018 AND JUNE 30, 2017 |
| Increase (Decrease) in Net Assets | June 30, 2018 | June 30, 2017 |
| Operations | | |
| Net investment income (loss) | $ | 10,307,697 |
| $ | 3,652,664 |
|
| Net realized gain (loss) | 47,476,513 |
| 32,046,186 |
|
| Change in net unrealized appreciation (depreciation) | 27,946,512 |
| 50,337,004 |
|
| Net increase (decrease) in net assets resulting from operations | 85,730,722 |
| 86,035,854 |
|
| | | |
| Distributions to Shareholders | | |
| From net investment income | (9,744,111 | ) | (3,349,951 | ) |
| From net realized gains | (8,776,632 | ) | — |
|
| Decrease in net assets from distributions | (18,520,743 | ) | (3,349,951 | ) |
| | | |
| Capital Share Transactions | | |
| Proceeds from shares sold | 18,649,225 |
| 54,665,713 |
|
| Proceeds from reinvestment of distributions | 18,520,743 |
| 3,349,951 |
|
| Payments for shares redeemed | (129,145,890 | ) | (72,342,852 | ) |
| Net increase (decrease) in net assets from capital share transactions | (91,975,922 | ) | (14,327,188 | ) |
| | | |
| Net increase (decrease) in net assets | (24,765,943 | ) | 68,358,715 |
|
| | | |
| Net Assets | | |
| Beginning of period | 598,462,746 |
| 530,104,031 |
|
| End of period | $ | 573,696,803 |
| $ | 598,462,746 |
|
| | | |
| Undistributed net investment income | $ | 364,504 |
| $ | 11,855 |
|
| | | |
| Transactions in Shares of the Fund | | |
| Sold | 1,133,604 |
| 3,811,732 |
|
| Issued in reinvestment of distributions | 1,098,889 |
| 220,247 |
|
| Redeemed | (7,709,753 | ) | (5,065,000 | ) |
| Net increase (decrease) in shares of the fund | (5,477,260 | ) | (1,033,021 | ) |
See Notes to Financial Statements.
|
| | | |
| YEAR ENDED JUNE 30, 2018 |
| Cash Flows From (Used In) Operating Activities | |
| Net increase (decrease) in net assets resulting from operations | $ | 85,730,722 |
|
| Adjustments to reconcile net increase (decrease) in net assets resulting from operations to net cash from (used in) operating activities: | |
| Purchases of investment securities | (580,511,624 | ) |
| Proceeds from investments sold | 718,035,819 |
|
| Purchases to cover securities sold short | (194,055,846 | ) |
| Proceeds from securities sold short | 156,333,856 |
|
| (Increase) decrease in short-term investments | 579,776 |
|
| (Increase) decrease in receivable for investments sold | (27,421,058 | ) |
| (Increase) decrease in dividends and interest receivable | 164,890 |
|
| Increase (decrease) in payable for investments purchased | 29,647,276 |
|
| Increase (decrease) in accrued management fees | (540,297 | ) |
| Increase (decrease) in dividend expense payable on securities sold short | (68,546 | ) |
| Increase (decrease) in fees and charges payable on borrowings for securities sold short | 17,388 |
|
| Change in net unrealized (appreciation) depreciation on investments | (31,035,858 | ) |
| Net realized (gain) loss on investment transactions | (75,608,356 | ) |
| Change in net unrealized (appreciation) depreciation on securities sold short | 3,089,346 |
|
| Net realized (gain) loss on securities sold short transactions | 28,262,856 |
|
| Net cash from (used in) operating activities | 112,620,344 |
|
| | |
| Cash Flows From (Used In) Financing Activities | |
| Proceeds from shares sold | 18,990,961 |
|
| Payments for shares redeemed | (131,611,305 | ) |
| Net cash from (used in) financing activities | (112,620,344 | ) |
| | |
| Net Increase (Decrease) In Cash | — |
|
| Cash at beginning of period | — |
|
| Cash at end of period | — |
|
| | |
| Supplemental disclosure of cash flow information: | |
| Non cash financing activities not included herein consist of all reinvestment of distributions of $18,520,743. |
See Notes to Financial Statements.
|
|
| Notes to Financial Statements |
JUNE 30, 2018
1. Organization
American Century Quantitative Equity Funds, Inc. (the corporation) is registered under the Investment Company Act of 1940, as amended (the 1940 Act), as an open-end management investment company and is organized as a Maryland corporation. NT Core Equity Plus Fund (the fund) is one fund in a series issued by the corporation. The fund’s investment objective is to seek long-term capital growth. The fund is not permitted to invest in securities issued by companies assigned the Global Industry Classification Standard or the Bloomberg Industry Classification Standard for the tobacco industry. The fund offers the G Class (formerly Institutional class).
2. Significant Accounting Policies
The following is a summary of significant accounting policies consistently followed by the fund in preparation of its financial statements. The fund is an investment company and follows accounting and reporting guidance in accordance with accounting principles generally accepted in the United States of America. This may require management to make certain estimates and assumptions at the date of the financial statements. Actual results could differ from these estimates. Management evaluated the impact of events or transactions occurring through the date the financial statements were issued that would merit recognition or disclosure.
Investment Valuations — The fund determines the fair value of its investments and computes its net asset value per share at the close of regular trading (usually 4 p.m. Eastern time) on the New York Stock Exchange (NYSE) on each day the NYSE is open. The Board of Directors has adopted valuation policies and procedures to guide the investment advisor in the fund’s investment valuation process and to provide methodologies for the oversight of the fund’s pricing function.
Equity securities that are listed or traded on a domestic securities exchange are valued at the last reported sales price or at the official closing price as provided by the exchange. Equity securities traded on foreign securities exchanges are generally valued at the closing price of such securities on the exchange where primarily traded or at the close of the NYSE, if that is earlier. If no last sales price is reported, or if local convention or regulation so provides, the mean of the latest bid and asked prices may be used. Securities traded over-the-counter are valued at the mean of the latest bid and asked prices, the last sales price, or the official closing price.
Open-end management investment companies are valued at the reported net asset value per share. Repurchase agreements are valued at cost, which approximates fair value. Exchange-traded futures contracts are valued at the settlement price as provided by the appropriate exchange.
If the fund determines that the market price for an investment is not readily available or the valuation methods mentioned above do not reflect an investment’s fair value, such investment is valued as determined in good faith by the Board of Directors or its delegate, in accordance with policies and procedures adopted by the Board of Directors. In its determination of fair value, the fund may review several factors including, but not limited to, market information regarding the specific investment or comparable investments and correlation with other investment types, futures indices or general market indicators. Circumstances that may cause the fund to use these procedures to value an investment include, but are not limited to: an investment has been declared in default or is distressed; trading in a security has been suspended during the trading day or a security is not actively trading on its principal exchange; prices received from a regular pricing source are deemed unreliable; or there is a foreign market holiday and no trading occurred.
The fund monitors for significant events occurring after the close of an investment’s primary exchange but before the fund’s net asset value per share is determined. Significant events may include, but are not limited to: corporate announcements and transactions; governmental action and political unrest that could impact a specific investment or an investment sector; or armed conflicts, natural disasters and similar events that could affect investments in a specific country or region. The fund also monitors for significant fluctuations between domestic and foreign markets, as evidenced by the U.S. market or such other indicators that the Board of Directors, or its delegate, deems appropriate. If significant fluctuations in foreign markets are identified, the fund may apply a model-derived factor to the closing price of equity securities traded on foreign securities exchanges. The factor is based on observable market data as provided by an independent pricing service.
Security Transactions — Security transactions are accounted for as of the trade date. Net realized gains and losses are determined on the identified cost basis, which is also used for federal income tax purposes.
Investment Income — Dividend income less foreign taxes withheld, if any, is recorded as of the ex-dividend date. Distributions received on securities that represent a return of capital or long-term capital gain are recorded as a reduction of cost of investments and/or as a realized gain. The fund may estimate the components of distributions received that may be considered nontaxable distributions or long-term capital gain distributions for income tax purposes. Interest income is recorded on the accrual basis and includes accretion of discounts and amortization of premiums.
Securities Sold Short — The fund enters into short sales, which is selling securities it does not own, as part of its normal investment activities. Upon selling a security short, the fund will segregate cash, cash equivalents or other appropriate liquid securities in at least an amount equal to the current market value of the securities sold short until the fund replaces the borrowed security. Interest earned on segregated cash for securities sold short, if any, is reflected as interest income. The fund is required to pay any dividends or interest due on securities sold short. Such dividends and interest are recorded as an expense. The fund may pay fees or charges on the assets borrowed for securities sold short. These fees are calculated daily based upon the value of each security sold short and a rate that is dependent on the availability of such security. Liabilities for securities sold short are valued daily and changes in value are recorded as change in net unrealized appreciation (depreciation) on securities sold short. The fund records realized gain (loss) on a security sold short when it is terminated by the fund and includes as a component of net realized gain (loss) on securities sold short transactions.
Repurchase Agreements — The fund may enter into repurchase agreements with institutions that American Century Investment Management, Inc. (ACIM) (the investment advisor) has determined are creditworthy pursuant to criteria adopted by the Board of Directors. The fund requires that the collateral, represented by securities, received in a repurchase transaction be transferred to the custodian in a manner sufficient to enable the fund to obtain those securities in the event of a default under the repurchase agreement. ACIM monitors, on a daily basis, the securities transferred to ensure the value, including accrued interest, of the securities under each repurchase agreement is equal to or greater than amounts owed to the fund under each repurchase agreement.
Joint Trading Account — Pursuant to an Exemptive Order issued by the Securities and Exchange Commission, the fund, along with certain other funds in the American Century Investments family of funds, may transfer uninvested cash balances into a joint trading account. These balances are invested in one or more repurchase agreements that are collateralized by U.S. Treasury or Agency obligations.
Segregated Assets — In accordance with the 1940 Act, the fund segregates assets on its books and records to cover certain types of investment securities and other financial instruments. ACIM monitors, on a daily basis, the securities segregated to ensure the fund designates a sufficient amount of liquid assets, marked-to-market daily. The fund may also receive assets or be required to pledge assets at the custodian bank or with a broker for collateral requirements.
Income Tax Status — It is the fund’s policy to distribute substantially all net investment income and net realized gains to shareholders and to otherwise qualify as a regulated investment company under provisions of the Internal Revenue Code. Accordingly, no provision has been made for income taxes. The fund files U.S. federal, state, local and non-U.S. tax returns as applicable. The fund's tax returns are subject to examination by the relevant taxing authority until expiration of the applicable statute of limitations, which is generally three years from the date of filing but can be longer in certain jurisdictions. At this time, management believes there are no uncertain tax positions which, based on their technical merit, would not be sustained upon examination and for which it is reasonably possible that the total amounts of unrecognized tax benefits will significantly change in the next twelve months.
Distributions to Shareholders — Distributions from net investment income, if any, are generally declared and paid semiannually. Distributions from net realized gains, if any, are generally declared and paid annually.
Indemnifications — Under the corporation’s organizational documents, its officers and directors are indemnified against certain liabilities arising out of the performance of their duties to the fund. In addition, in the normal course of business, the fund enters into contracts that provide general indemnifications. The maximum exposure under these arrangements is unknown as this would involve future claims that may be made against a fund. The risk of material loss from such claims is considered by management to be remote.
Statement of Cash Flows — The Statement of Cash Flows has been prepared using the indirect method which requires net increase (decrease) in net assets resulting from operations to be adjusted to reconcile to net cash from (used in) operating activities. The beginning of period and end of period cash is the amount of domestic and foreign currency included in the fund's Statement of Assets and Liabilities and represents the cash on hand at the custodian bank and does not include any short-term investments or deposits for securities sold short.
3. Fees and Transactions with Related Parties
Certain officers and directors of the corporation are also officers and/or directors of American Century Companies, Inc. (ACC). The corporation’s investment advisor, ACIM, the corporation's distributor, American Century Investment Services, Inc., and the corporation’s transfer agent, American Century Services, LLC, are wholly owned, directly or indirectly, by ACC. Various funds issued by American Century Asset Allocation Portfolios, Inc. own, in aggregate, 100% of the shares of the fund. Related parties do not invest in the fund for the purpose of exercising management or control.
Management Fees — The corporation has entered into a management agreement with ACIM, under which ACIM provides the fund with investment advisory and management services in exchange for a single, unified management fee (the fee). The agreement provides that all expenses of managing and operating the fund, except expenses on securities sold short, brokerage expenses, taxes, interest, fees and expenses of the independent directors (including legal counsel fees), and extraordinary expenses, will be paid by ACIM. The fee is computed and accrued daily based on the daily net assets of the fund and paid monthly in arrears. The fee consists of (1) an Investment Category Fee based on the daily net assets of the fund and certain other accounts managed by the investment advisor that are in the same broad investment category as the fund and (2) a Complex Fee based on the assets of all the funds in the American Century Investments family of funds. The rates for the Investment Category Fee range from 0.9680% to 1.1500%. The rates for the Complex Fee range from 0.0500% to 0.1100%. Effective July 31, 2017, the investment advisor agreed to waive the G Class's management fee in its entirety. The investment advisor expects this waiver to remain in effect permanently and cannot terminate it without the approval of the Board of Directors. The effective annual management fee for the period ended June 30, 2018 was 1.09% before waiver and 0.09% after waiver.
Directors' Fees and Expenses — The Board of Directors is responsible for overseeing the investment advisor’s management and operations of the fund. The directors receive detailed information about the fund and its investment advisor regularly throughout the year, and meet at least quarterly with management of the investment advisor to review reports about fund operations. The fund’s officers do not receive compensation from the fund.
Interfund Transactions — The fund may enter into security transactions with other American Century Investments funds and other client accounts of the investment advisor, in accordance with the 1940 Act rules and procedures adopted by the Board of Directors. The rules and procedures require, among other things, that these transactions be effected at the independent current market price of the security. During the period, the interfund purchases and sales were $7,881,356 and $8,493,287, respectively. The effect of interfund transactions on the Statement of Operations was $1,651,386 in net realized gain (loss) on investment transactions.
4. Investment Transactions
Purchases and sales of investment securities and securities sold short, excluding short-term investments, for the period ended June 30, 2018 were $773,698,996 and $871,919,608, respectively.
5. Fair Value Measurements
The fund’s investments valuation process is based on several considerations and may use multiple inputs to determine the fair value of the investments held by the fund. In conformity with accounting principles generally accepted in the United States of America, the inputs used to determine a valuation are classified into three broad levels.
| |
| • | Level 1 valuation inputs consist of unadjusted quoted prices in an active market for identical investments. |
| |
| • | Level 2 valuation inputs consist of direct or indirect observable market data (including quoted prices for comparable investments, evaluations of subsequent market events, interest rates, prepayment speeds, credit risk, etc.). These inputs also consist of quoted prices for identical investments initially expressed in local currencies that are adjusted through translation into U.S. dollars. |
| |
| • | Level 3 valuation inputs consist of unobservable data (including a fund’s own assumptions). |
The level classification is based on the lowest level input that is significant to the fair valuation measurement. The valuation inputs are not necessarily an indication of the risks associated with investing in these securities or other financial instruments. There were no significant transfers between levels during the period.
The following is a summary of the level classifications as of period end. The Schedule of Investments provides additional information on the fund’s portfolio holdings.
|
| | | | | | | | |
| | Level 1 | Level 2 | Level 3 |
| Assets |
| Investment Securities | | | |
| Common Stocks | $ | 740,061,289 |
| — |
| — |
|
| Temporary Cash Investments | 30,653 |
| $ | 7,216,153 |
| — |
|
| | $ | 740,091,942 |
| $ | 7,216,153 |
| — |
|
| | | | |
| Liabilities |
| Securities Sold Short | | | |
| Common Stocks | $ | 170,610,241 |
| — |
| — |
|
6. Derivative Instruments
Equity Price Risk —The fund is subject to equity price risk in the normal course of pursuing its investment objectives. A fund may enter into futures contracts based on an equity index in order to manage its exposure to changes in market conditions. A fund may purchase futures contracts to gain exposure to increases in market value or sell futures contracts to protect against a decline in market value. Upon entering into a futures contract, a fund is required to deposit either cash or securities in an amount equal to a certain percentage of the contract value (initial margin). Subsequent payments (variation margin) are made or received daily, in cash, by a fund. The variation margin is equal to the daily change in the contract value and is recorded as unrealized gains and losses. A fund recognizes a realized gain or loss when the contract is closed or expires. Net realized and unrealized gains or losses occurring during the holding period of futures contracts are a component of net realized gain (loss) on futures contract transactions and change in net unrealized appreciation (depreciation) on futures contracts, respectively. One of the risks of entering into futures contracts is the possibility that the change in value of the contract may not correlate with the changes in value of the underlying securities. During the period, the fund participated in equity price risk derivative instruments for temporary investment purposes.
At period end, the fund did not have any derivative instruments disclosed on the Statement of Assets and Liabilities. For the year ended June 30, 2018, the effect of equity price risk derivative instruments on the Statement of Operations was $131,013 in net realized gain (loss) on futures contract transactions.
7. Risk Factors
The fund is subject to short sales risk. If the market price of a security increases after the fund borrows the security, the fund may suffer a loss when it replaces the borrowed security at the higher price. Any loss will be increased by the amount of compensation, interest or dividends, and transaction costs the fund must pay to the lender of the borrowed security.
The fund's investment strategy utilizes leverage, which can increase market exposure and subject the fund to greater risk and higher volatility.
If the fund is overweighted in a stock or sector, any negative development related to that stock or sector will have a greater impact on the fund than other funds that are not overweighted in that stock or sector.
The fund’s investment process may result in high portfolio turnover, which could mean high transaction costs, affecting both performance and capital gains tax liabilities to investors.
8. Federal Tax Information
The tax character of distributions paid during the years ended June 30, 2018 and June 30, 2017 were as follows:
|
| | | | | | |
| | 2018 | 2017 |
| Distributions Paid From | | |
| Ordinary income | $ | 9,744,111 |
| $ | 3,349,951 |
|
| Long-term capital gains | $ | 8,776,632 |
| — |
|
The book-basis character of distributions made during the year from net investment income or net realized gains may differ from their ultimate characterization for federal income tax purposes. These differences reflect the differing character of certain income items and net realized gains and losses for financial statement and tax purposes, and may result in reclassification among certain capital accounts on the financial statements.
As of period end, the federal tax cost of investments and the components of distributable earnings on a tax-basis were as follows:
|
| | | |
| Federal tax cost of investments | $ | 598,334,266 |
|
| Gross tax appreciation of investments | $ | 162,791,421 |
|
| Gross tax depreciation of investments | (13,817,592 | ) |
| Net tax appreciation (depreciation) of investments | 148,973,829 |
|
| Gross tax appreciation on securities sold short | 9,149,871 |
|
| Gross tax depreciation on securities sold short | (15,556,369 | ) |
| Net tax appreciation (depreciation) | $ | 142,567,331 |
|
| Undistributed ordinary income | $ | 364,504 |
|
| Accumulated long-term gains | $ | 45,609,819 |
|
The difference between book-basis and tax-basis unrealized appreciation (depreciation) is attributable primarily to the tax deferral of losses on unsettled short positions.
|
| | | | | | | | | | | | | | | | | | |
| For a Share Outstanding Throughout the Years Ended June 30 (except as noted) |
| Per-Share Data | | | | | | | | Ratios and Supplemental Data | | |
| | | Income From Investment Operations: | Distributions From: | | | Ratio to Average Net Assets of: | | |
| | Net Asset Value, Beginning of Period | Net Investment Income (Loss)(1) | Net Realized and Unrealized Gain (Loss) | Total From Investment Operations | Net Investment Income | Net Realized Gains | Total Distributions | Net Asset Value, End of Period | Total Return(2) | Operating Expenses | Operating Expenses (before expense waiver) | Operating Expenses (excluding expenses on securities sold short) | Net
Investment Income
(Loss) | Net Investment Income (Loss)(before expense waiver) | Portfolio Turnover Rate | Net Assets, End of Period (in thousands) |
G Class(3) | | | | | | | | | | | | | |
| 2018 | $15.18 | 0.28 | 1.95 | 2.23 | (0.28) | (0.24) | (0.52) | $16.89 | 14.82% | 0.66% | 1.66% | 0.10% | 1.71% | 0.71% | 100% |
| $573,697 |
|
| 2017 | $13.10 | 0.09 | 2.08 | 2.17 | (0.09) | — | (0.09) | $15.18 | 16.45% | 1.79% | 1.79% | 1.10% | 0.64% | 0.64% | 111% |
| $598,463 |
|
| 2016 | $14.41 | 0.14 | (0.44) | (0.30) | (0.12) | (0.89) | (1.01) | $13.10 | (1.96)% | 1.68% | 1.68% | 1.10% | 1.01% | 1.01% | 109% |
| $530,104 |
|
| 2015 | $15.55 | 0.16 | 0.58 | 0.74 | (0.14) | (1.74) | (1.88) | $14.41 | 4.86% | 1.53% | 1.53% | 1.10% | 1.03% | 1.03% | 106% |
| $474,697 |
|
| 2014 | $13.05 | 0.13 | 3.33 | 3.46 | (0.12) | (0.84) | (0.96) | $15.55 | 27.10% | 1.57% | 1.57% | 1.10% | 0.88% | 0.88% | 104% |
| $386,877 |
|
|
|
| Notes to Financial Highlights |
| |
| (1) | Computed using average shares outstanding throughout the period. |
| |
| (2) | Total returns are calculated based on the net asset value of the last business day. Total returns for periods less than one year are not annualized. |
| |
| (3) | Prior to July 31, 2017, the G Class was referred to as the Institutional Class. |
See Notes to Financial Statements.
|
|
| Report of Independent Registered Public Accounting Firm |
To the Board of Directors of American Century Quantitative Equity Funds, Inc. and Shareholders of NT Core Equity Plus Fund
Opinion on the Financial Statements
We have audited the accompanying statement of assets and liabilities, including the schedule of investments, of NT Core Equity Plus Fund (one of the funds constituting American Century Quantitative Equity Funds, Inc., referred to hereafter as the "Fund") as of June 30, 2018, the related statements of operations and cash flows for the year ended June 30, 2018, the statement of changes in net assets for each of the two years in the period ended June 30, 2018, including the related notes, and the financial highlights for each of the five years in the period ended June 30, 2018 (collectively referred to as the “financial statements”). In our opinion, the financial statements present fairly, in all material respects, the financial position of the Fund as of June 30, 2018, the results of its operations and its cash flows for the year then ended, the changes in its net assets for each of the two years in the period ended June 30, 2018 and the financial highlights for each of the five years in the period ended June 30, 2018 in conformity with accounting principles generally accepted in the United States of America.
Basis for Opinion
These financial statements are the responsibility of the Fund’s management. Our responsibility is to express an opinion on the Fund’s financial statements based on our audits. We are a public accounting firm registered with the Public Company Accounting Oversight Board (United States) (“PCAOB”) and are required to be independent with respect to the Fund in accordance with the U.S. federal securities laws and the applicable rules and regulations of the Securities and Exchange Commission and the PCAOB.
We conducted our audits of these financial statements in accordance with the standards of the PCAOB. Those standards require that we plan and perform the audit to obtain reasonable assurance about whether the financial statements are free of material misstatement, whether due to error or fraud.
Our audits included performing procedures to assess the risks of material misstatement of the financial statements, whether due to error or fraud, and performing procedures that respond to those risks. Such procedures included examining, on a test basis, evidence regarding the amounts and disclosures in the financial statements. Our audits also included evaluating the accounting principles used and significant estimates made by management, as well as evaluating the overall presentation of the financial statements. Our procedures included confirmation of securities owned as of June 30, 2018 by correspondence with the custodian and brokers; when replies were not received from brokers, we performed other auditing procedures. We believe that our audits provide a reasonable basis for our opinion.
/s/ PricewaterhouseCoopers LLP
Kansas City, Missouri
August 16, 2018
We have served as the auditor of one or more investment companies in American Century Investments since 1997.
The Board of Directors
The individuals listed below serve as directors of the funds. Each director will continue to serve in this capacity until death, retirement, resignation or removal from office. The board has adopted a mandatory retirement age for directors who are not “interested persons,” as that term is defined in the Investment Company Act (independent directors). Independent directors shall retire by December 31 of the year in which they reach their 75th birthday; provided, however, that on or after January 1, 2022, independent trustees shall retire on December 31 of the year in which they reach their 76th birthday.
Mr. Thomas is an “interested person” because he currently serves as President and Chief Executive Officer of American Century Companies, Inc. (ACC), the parent company of American Century Investment Management, Inc. (ACIM or the advisor). The other directors (more than three-fourths of the total number) are independent. They are not employees, directors or officers of, and have no financial interest in, ACC or any of its wholly owned, direct or indirect, subsidiaries, including ACIM, American Century Investment Services, Inc. (ACIS) and American Century Services, LLC (ACS), and they do not have any other affiliations, positions or relationships that would cause them to be considered “interested persons” under the Investment Company Act. The directors serve in this capacity for eight (in the case of Jonathan S. Thomas, 16; and Ronald J. Gilson, 9) registered investment companies in the American Century Investments family of funds.
The following table presents additional information about the directors. The mailing address for each director other than Mr. Thomas is 1665 Charleston Road, Mountain View, California 94043. The mailing address for Mr. Thomas is 4500 Main Street, Kansas City, Missouri 64111.
|
| | | | | |
Name
(Year of Birth) | Position(s) Held with Funds | Length of Time Served | Principal Occupation(s) During Past 5 Years | Number of American Century Portfolios Overseen by Director | Other Directorships Held During Past 5 Years |
| Independent Directors |
|
|
Tanya S. Beder
(1955) | Director | Since 2011 | Chairman and CEO, SBCC Group Inc. (independent advisory services) (2006 to present) | 45 | CYS Investments, Inc.; Nabors Industries Ltd. |
Jeremy I. Bulow
(1954) | Director | Since 2011 | Professor of Economics, Stanford University, Graduate School of Business (1979 to present) | 45 | None |
Anne Casscells
(1958) | Director | Since 2016 | Co-Chief Executive Officer and Chief Investment Officer, Aetos Alternatives Management (investment advisory firm) (2001 to present); Lecturer in Accounting, Stanford University, Graduate School of Business (2009 to present) | 45 | None |
|
| | | | | |
Name
(Year of Birth) | Position(s) Held with Funds | Length of Time Served | Principal Occupation(s) During Past 5 Years | Number of American Century Portfolios Overseen by Director | Other Directorships Held During Past 5 Years |
| Independent Directors |
|
|
Ronald J. Gilson
(1946) | Director and Chairman of the Board | Since 1995
(Chairman since 2005) | Charles J. Meyers Professor of Law and Business, Emeritus, Stanford Law School (1979 to 2016); Marc and Eva Stern Professor of Law and Business, Columbia University School of Law (1992 to present) | 47 | None |
Frederick L. A. Grauer
(1946) | Director | Since 2008 | Senior Advisor, iShares by BlackRock, Inc. (investment management firm) (2010 to 2011, 2013 to 2015); Senior Advisor, Course Hero (an educational technology company) (2015 to present) | 45 | None |
Jonathan D. Levin
(1972) | Director | Since 2016 | Philip H. Knight Professor and Dean, Graduate School of Business, Stanford University (2016 to present); Professor, Stanford University, (2000 to present); Chair, Department of Economics, Stanford University (2011 to 2014) | 45 | None |
Peter F. Pervere
(1947) | Director | Since 2007 | Retired | 45 | None |
John B. Shoven
(1947) | Director | Since 2002 | Charles R. Schwab Professor of Economics, Stanford University (1973 to present) | 45 | Cadence Design Systems; Exponent; Financial Engines |
| Interested Director |
|
|
Jonathan S. Thomas
(1963) | Director and President | Since 2007 | President and Chief Executive Officer, ACC (2007 to present). Also serves as Chief Executive Officer, ACS; Executive Vice President, ACIM; Director, ACC, ACIM and other ACC subsidiaries | 115 | BioMed Valley Discoveries, Inc. |
The Statement of Additional Information has additional information about the fund's directors and is available without charge, upon request, by calling 1-800-345-2021.
Officers
The following table presents certain information about the executive officers of the funds. Each officer serves as an officer for each of the 16 (in the case of Robert J. Leach, 15) investment companies in the American Century family of funds, unless otherwise noted. No officer is compensated for his or her service as an officer of the funds. The listed officers are interested persons of the funds and are appointed or re-appointed on an annual basis. The mailing address for each officer listed below is 4500 Main Street, Kansas City, Missouri 64111.
|
| | |
Name
(Year of Birth) | Offices with the Funds | Principal Occupation(s) During the Past Five Years |
Jonathan S. Thomas
(1963) | Director and President since 2007 | President and Chief Executive Officer, ACC (2007 to present). Also serves as Chief Executive Officer, ACS; Executive Vice President, ACIM; Director, ACC, ACIM and other ACC subsidiaries |
Amy D. Shelton
(1964) | Chief Compliance Officer and Vice President since 2014 | Chief Compliance Officer, American Century funds, (2014 to present); Chief Compliance Officer, ACIM (2014 to present); Chief Compliance Officer, ACIS (2009 to present); Vice President, Client Interactions and Marketing, ACIS (2013 to 2014). Also serves as Vice President, ACIS |
Charles A. Etherington
(1957) | General Counsel since 2007 and Senior Vice President since 2006 | Attorney, ACC (1994 to present); Vice President, ACC (2005 to present); General Counsel, ACC (2007 to present). Also serves as General Counsel, ACIM, ACS, ACIS and other ACC subsidiaries; and Senior Vice President, ACIM and ACS |
C. Jean Wade
(1964) | Vice President,Treasurer and Chief Financial Officer since 2012 | Senior Vice President, ACS (2017 to present); Vice President, ACS (2000 to 2017) |
Robert J. Leach
(1966) | Vice President since 2006 and Assistant Treasurer since 2012 | Vice President, ACS (2000 to present) |
David H. Reinmiller
(1963) | Vice President since 2000 | Attorney, ACC (1994 to present). Also serves as Vice President, ACIM and ACS |
Ward D. Stauffer
(1960) | Secretary since 2005 | Attorney, ACC (2003 to present) |
|
|
| Approval of Management Agreement |
At a meeting held on June 19, 2018, the Fund’s Board of Directors (the "Board") unanimously approved the renewal of the management agreement pursuant to which American Century Investment Management, Inc. (the “Advisor”) acts as the investment advisor for the Fund. Under Section 15(c) of the Investment Company Act, contracts for investment advisory services are required to be reviewed, evaluated, and approved by a majority of a fund’s directors/trustees, including a majority of the independent Directors, each year. The Board regards this annual evaluation and renewal as one of its most important responsibilities.
The independent Directors have memorialized a statement regarding the relationship between their ongoing obligations to oversee and evaluate the performance of the Advisor and their annual consideration of renewal of the management agreement. In that statement, the independent Directors noted that their assessment of the Advisor’s performance is an ongoing process that takes place over the entire year and is informed by all of the extensive information that the Board and its committees receive and consider over time. This information, together with the additional materials provided specifically in connection with the review, are central to the Board’s assessment of the Advisor’s performance and its determination whether to renew the Fund’s management agreement.
Prior to its consideration of the renewal of the management agreement, the Board requested and reviewed extensive data and analysis relating to the proposed renewal. This information and analysis was compiled by the Advisor and certain independent providers of evaluation data concerning the Fund and the services provided to the Fund by the Advisor.
In connection with its consideration of the renewal of the management agreement, the Board’s review and evaluation of the services provided by the Advisor included, but was not limited to, the following:
| |
| • | the nature, extent, and quality of investment management, shareholder services, and other services provided to the Fund; |
| |
| • | the wide range of other programs and services the Advisor provides to the Fund and its shareholders on a routine and non-routine basis; |
| |
| • | the investment performance of the Fund, including data comparing the Fund’s performance to appropriate benchmarks and/or a peer group of other mutual funds with similar investment objectives and strategies; |
| |
| • | the cost of owning the Fund compared to the cost of owning similar funds; |
| |
| • | the Advisor’s compliance policies, procedures, and regulatory experience; |
| |
| • | financial data showing the cost of services provided to the Fund, the profitability of the Fund to the Advisor, and the overall profitability of the Advisor; |
| |
| • | strategic plans of the Advisor; |
| |
| • | any economies of scale associated with the Advisor’s management of the Fund and other accounts; |
| |
| • | services provided and charges to other investment management clients of the Advisor; |
| |
| • | acquired fund fees and expenses; |
| |
| • | payments and practices in connection with financial intermediaries holding shares of the Fund and the services provided by intermediaries in connection therewith; and |
| |
| • | any collateral benefits derived by the Advisor from the management of the Fund. |
In keeping with its practice, the Board held two in-person meetings to review and discuss the information provided in response to their request and held active discussions with the Advisor regarding the renewal of the management agreement. The independent Directors had the benefit of the advice of their independent counsel throughout the process.
Factors Considered
The Directors considered all of the information provided by the Advisor, the independent data providers, and the independent Directors’ independent counsel in connection with the approval. They determined that the information was sufficient for them to evaluate the management agreement for the Fund. In connection with their review, the Directors did not identify any single factor as being all-important or controlling and each Director may have attributed different levels of importance to different factors. In deciding to renew the management agreement, the Board based its decision on a number of factors, including the following:
Nature, Extent and Quality of Services - Generally. Under the management agreement, the Advisor is responsible for providing or arranging for all services necessary for the operation of the Fund. The Board noted that the Advisor provides or arranges at its own expense a wide variety of services including:
| |
| • | constructing and designing the Fund |
| |
| • | portfolio research and security selection |
| |
| • | initial capitalization/funding |
| |
| • | daily valuation of the Fund’s portfolio |
| |
| • | shareholder servicing and transfer agency, including shareholder confirmations, recordkeeping, and communications |
| |
| • | legal services (except the independent Directors’ counsel) |
| |
| • | regulatory and portfolio compliance |
| |
| • | marketing and distribution (except amounts paid by the Fund under Rule 12b-1 plans) |
The Board noted that many of these services have expanded over time in terms of both quantity and complexity in response to shareholder demands, competition in the industry, changing distribution channels, and the changing regulatory environment.
Investment Management, Shareholder, and Other Services. The nature of the investment management services provided to the Fund is quite complex and allows Fund shareholders access to professional money management, instant diversification of their investments within an asset class, the opportunity to easily diversify among asset classes by investing in or exchanging among various American Century Investments funds, and liquidity. In evaluating investment performance, the Board expects the Advisor to manage the Fund in accordance with its investment objectives and approved strategies. Further, the Directors recognize that the Advisor has an obligation to seek the best execution of fund trades. In providing these services, the Advisor utilizes teams of investment professionals (portfolio managers, analysts, research assistants, and securities traders) who require extensive information technology, research, training, compliance, and other systems to conduct their business. The Board, directly and through its Portfolio Committee, regularly reviews investment performance information for the Fund, together with comparative information for appropriate benchmarks and/or peer groups of similarly-managed funds, over different time horizons. The Directors also review detailed performance information during the management agreement approval process. If performance concerns are identified, the Fund receives special reviews until performance improves, during which the Board discusses with the Advisor the reasons for such results (e.g., market conditions, security selection) and any efforts being undertaken to improve performance. The Fund’s performance was below its benchmark for the one-, three-, and five-year periods reviewed by the Board. The Board found the investment management services provided by the Advisor to the Fund to be satisfactory and consistent with the management agreement.
Under the management agreement, the Advisor provides the Fund with a comprehensive package of transfer agency, shareholder, and other services. The Board, directly and through various committees of the Board, regularly reviews reports and evaluations of such services at its regular meetings. These reports include, but are not limited to, information regarding the operational efficiency and accuracy of the shareholder and transfer agency services provided, staffing levels, shareholder satisfaction (as measured by external as well as internal sources), technology support, new products and services offered to Fund shareholders, securities trading activities, portfolio valuation services, auditing services, and legal and operational compliance activities. The Board found the services provided by the Advisor to the Fund under the management agreement to be competitive and of high quality.
Costs of Services and Profitability. The Advisor provides detailed information concerning its cost of providing various services to the Fund, its profitability in managing the Fund, its overall profitability, and its financial condition. The Directors have reviewed with the Advisor the methodology used to prepare this financial information. This information is considered in evaluating the Advisor’s financial condition, its ability to continue to provide services under the management agreement, and the reasonableness of the current management fee. The Board concluded that the Advisor’s profits were reasonable in light of the services provided to the Fund.
Economies of Scale. The Board also reviewed information provided by the Advisor regarding the possible existence of economies of scale in connection with the management of the Fund. The Board concluded that economies of scale are difficult to measure and predict with precision, especially on a fund-by-fund basis. The Board concluded that the Advisor is appropriately sharing economies of scale through its competitive fee structure, offering competitive fees from fund inception, and through reinvestment in its business to provide shareholders enhanced and expanded services.
Comparison to Other Funds’ Fees. The management agreement provides that the Fund pays the Advisor a single, all-inclusive (or unified) management fee for providing all services necessary for the management and operation of the Fund, other than brokerage expenses, expenses attributable to short sales, taxes, interest, extraordinary expenses, the fees and expenses of the Fund’s independent Directors (including their independent legal counsel), and expenses incurred in connection with the provision of shareholder services and distribution services under a plan adopted pursuant to Rule 12b-1 under the 1940 Act. Under the unified fee structure, the Advisor is responsible for providing all investment advisory, custody, audit, administrative, compliance, recordkeeping, marketing, and shareholder services, or arranging and supervising third parties to provide such services. By contrast, most other funds are charged a variety of fees, including an investment advisory fee, a transfer agency fee, an administrative fee, distribution charges, and other expenses. Other than their investment advisory fees and any applicable Rule 12b-1 distribution fees, all other components of the total fees charged by these other funds may be increased without shareholder approval. The Board believes the unified fee structure is a benefit to Fund shareholders because it clearly discloses to shareholders the cost of owning Fund shares, and, since the unified fee cannot be increased without a vote of Fund shareholders, it shifts to the Advisor the risk of increased costs of operating the Fund and provides a direct incentive to minimize administrative inefficiencies. Part of the Board’s analysis of fee levels involves reviewing certain evaluative data compiled by an independent provider and comparing the Fund’s unified fee to the total expense ratio of peer funds. The unified fee charged to shareholders of the Fund was in the lowest quartile of the total expense ratios of the Fund’s peer group. The Board concluded that the management fee paid by the Fund to the Advisor under the management agreement is reasonable in light of the services provided to the Fund.
Comparison to Fees and Services Provided to Other Clients of the Advisor. The Board also requested and received information from the Advisor concerning the nature of the services, fees, costs, and profitability of its advisory services to advisory clients other than the Fund. They observed that these varying types of client accounts require different services and involve different regulatory and entrepreneurial risks than the management of the Fund. The Board analyzed this
information and concluded that the fees charged and services provided to the Fund were reasonable by comparison.
Payments to Intermediaries. The Directors also requested and received a description of payments made to intermediaries by the Fund and the Advisor and services provided by intermediaries. These payments include various payments made by the Fund or the Advisor to different types of intermediaries and recordkeepers for distribution and service activities provided for the Fund. The Directors reviewed such information and received representations from the Advisor that all such payments by the Fund were made pursuant to the Fund’s Rule 12b-1 Plan and that all such payments by the Advisor were made from the Advisor’s resources and reasonable profits. The Board found such payments to be reasonable in scope and purpose.
Collateral or “Fall-Out” Benefits Derived by the Advisor. The Board considered the existence of collateral benefits the Advisor may receive as a result of its relationship with the Fund. The Board noted that the Advisor’s primary business is managing mutual funds and it generally does not use fund or shareholder information to generate profits in other lines of business, and therefore does not derive any significant collateral benefits from them. The Board noted that the Advisor may receive proprietary research from broker-dealers that execute fund portfolio transactions. The Board also determined that the Advisor is able to provide investment management services to certain clients other than the Fund, at least in part, due to its existing infrastructure built to serve the fund complex. The Board noted that the assets of those other accounts are, where applicable, included with the assets of the Fund to determine breakpoints in the management fee schedule.
Existing Relationship. The Board also considered whether there was any reason for not continuing the existing arrangement with the Advisor. In this regard, the Board was mindful of the potential disruptions of the Fund’s operations and various risks, uncertainties, and other effects that could occur as a result of a decision not to continue such relationship. In particular, the Board recognized that most shareholders have invested in the Fund on the strength of the Advisor’s industry standing and reputation and in the expectation that the Advisor will have a continuing role in providing advisory services to the Fund.
Conclusion of the Directors. As a result of this process, the Board, including all of the independent Directors and assisted by the advice of independent legal counsel, taking into account all of the factors discussed above and the information provided by the Advisor and others in connection with its review and throughout the year, concluded that the management agreement between the Fund and the Advisor is fair and reasonable in light of the services provided and should be renewed.
Retirement Account Information
As required by law, distributions you receive from certain retirement accounts are subject to federal income tax withholding, unless you elect not to have withholding apply*. Tax will be withheld on the total amount withdrawn even though you may be receiving amounts that are not subject to withholding, such as nondeductible contributions. In such case, excess amounts of withholding could occur. You may adjust your withholding election so that a greater or lesser amount will be withheld.
If you don’t want us to withhold on this amount, you must notify us to not withhold the federal income tax. You may notify us in writing or in certain situations by telephone or through other electronic means. For systematic withdrawals, your withholding election will remain in effect until revoked or changed by filing a new election. You have the right to revoke your election at any time and change your withholding percentage for future distributions.
Remember, even if you elect not to have income tax withheld, you are liable for paying income tax on the taxable portion of your withdrawal. If you elect not to have income tax withheld or you don’t have enough income tax withheld, you may be responsible for payment of estimated tax. You may incur penalties under the estimated tax rules if your withholding and estimated tax payments are not sufficient. You can reduce or defer the income tax on a distribution by directly or indirectly rolling such distribution over to another IRA or eligible plan. You should consult your tax advisor for additional information.
State tax will be withheld if, at the time of your distribution, your address is within one of the mandatory withholding states and you have federal income tax withheld (or as otherwise required by state law). State taxes will be withheld from your distribution in accordance with the respective state rules.
*Some 403(b), 457 and qualified retirement plan distributions may be subject to 20% mandatory withholding, as they are subject to special tax and withholding rules. Your plan administrator or plan sponsor is required to provide you with a special tax notice explaining those rules at the time you request a distribution. If applicable, federal and/or state taxes may be withheld from your distribution amount.
Proxy Voting Policies
Descriptions of the principles and policies that the fund's investment advisor uses in exercising the voting rights associated with the securities purchased and/or held by the fund are available without charge, upon request, by calling 1-800-345-2021 or visiting the "About Us" page of American Century Investments’ website at americancentury.com. A description of the policies is also available on the Securities and Exchange Commission’s website at sec.gov. Information regarding how the investment advisor voted proxies relating to portfolio securities during the most recent 12-month period ended June 30 is available on the "About Us" page at americancentury.com. It is also available at sec.gov.
Quarterly Portfolio Disclosure
The fund files its complete schedule of portfolio holdings with the Securities and Exchange Commission (SEC) for the first and third quarters of each fiscal year on Form N-Q. The fund’s Forms N-Q are available on the SEC’s website at sec.gov, and may be reviewed and copied at the SEC’s Public Reference Room in Washington, DC. Information on the operation of the Public Reference Room may be obtained by calling 1-800-SEC-0330. The fund also makes its complete schedule of portfolio holdings for the most recent quarter of its fiscal year available on its website at americancentury.com and, upon request, by calling 1-800-345-2021.
Other Tax Information
The following information is provided pursuant to provisions of the Internal Revenue Code.
The fund hereby designates up to the maximum amount allowable as qualified dividend income for the fiscal year ended June 30, 2018.
For corporate taxpayers, the fund hereby designates $9,744,111, or up to the maximum amount allowable, of ordinary income distributions paid during the fiscal year ended June 30, 2018 as qualified for the corporate dividends received deduction.
The fund hereby designates $8,776,632, or up to the maximum amount allowable, as long-term capital gain distributions (20% rate gain distributions) for the fiscal year ended June 30, 2018.
|
| | |
| |
| | | |
| Contact Us | americancentury.com | |
| Automated Information Line | 1-800-345-8765 | |
| Investor Services Representative | 1-800-345-2021
or 816-531-5575 | |
| Investors Using Advisors | 1-800-378-9878 | |
Business, Not-For-Profit, Employer-Sponsored
Retirement Plans | 1-800-345-3533 | |
Banks and Trust Companies, Broker-Dealers,
Financial Professionals, Insurance Companies | 1-800-345-6488 | |
| Telecommunications Relay Service for the Deaf | 711 | |
| | | |
| American Century Quantitative Equity Funds, Inc. | |
| | | |
Investment Advisor: American Century Investment Management, Inc. Kansas City, Missouri | |
| | | |
| This report and the statements it contains are submitted for the general information of our shareholders. The report is not authorized for distribution to prospective investors unless preceded or accompanied by an effective prospectus. | |
| | | |
©2018 American Century Proprietary Holdings, Inc. All rights reserved.
CL-ANN-92999 1808 | |
|
| |
| | |
| | Annual Report |
| | |
| | June 30, 2018 |
| | |
| | NT Disciplined Growth Fund |
| | Investor Class (ANTDX) |
| | G Class (ANDGX) |
|
| | |
| Performance | 2 |
|
| Portfolio Commentary | |
|
| Fund Characteristics | |
|
| Shareholder Fee Example | |
|
| Schedule of Investments | |
|
| Statement of Assets and Liabilities | |
|
| Statement of Operations | |
|
| Statement of Changes in Net Assets | |
|
| Notes to Financial Statements | |
|
| Financial Highlights | |
|
| Report of Independent Registered Public Accounting Firm | |
|
| Management | |
|
| Approval of Management Agreement | |
|
| Additional Information | |
|
Any opinions expressed in this report reflect those of the author as of the date of the report, and do not necessarily represent the opinions of American Century Investments® or any other person in the American Century Investments organization. Any such opinions are subject to change at any time based upon market or other conditions and American Century Investments disclaims any responsibility to update such opinions. These opinions may not be relied upon as investment advice and, because investment decisions made by American Century Investments funds are based on numerous factors, may not be relied upon as an indication of trading intent on behalf of any American Century Investments fund. Security examples are used for representational purposes only and are not intended as recommendations to purchase or sell securities. Performance information for comparative indices and securities is provided to American Century Investments by third party vendors. To the best of American Century Investments’ knowledge, such information is accurate at the time of printing.
|
| | | | |
| Total Returns as of June 30, 2018 |
| | | | Average Annual Returns | |
| | Ticker Symbol | 1 year | Since Inception | Inception Date |
| Investor Class | ANTDX | 18.85% | 10.12% | 3/19/15 |
| Russell 1000 Growth Index | — | 22.51% | 13.24% | — |
| G Class | ANDGX | 19.98% | 10.59% | 3/19/15 |
G Class returns would have been lower if a portion of the fees had not been waived. Prior to July 31, 2017, the G Class was referred to as the Institutional Class.
|
|
| Growth of $10,000 Over Life of Class |
| $10,000 investment made March 19, 2015 |
| Performance for other share classes will vary due to differences in fee structure. |
|
| |
| Value on June 30, 2018 |
| | Investor Class — $13,725 |
| |
| | Russell 1000 Growth Index — $15,046 |
| |
|
| |
| Total Annual Fund Operating Expenses |
| Investor Class | G Class |
| 1.02% | 0.82% |
The total annual fund operating expenses shown is as stated in the fund’s prospectus current as of the date of this report. The prospectus may vary from the expense ratio shown elsewhere in this report because it is based on a different time period, includes acquired fund fees and expenses, and, if applicable, does not include fee waivers or expense reimbursements.
Data presented reflect past performance. Past performance is no guarantee of future results. Current performance may be higher or lower than the performance shown. Total returns for periods less than one year are not annualized. Investment return and principal value will fluctuate, and redemption value may be more or less than original cost. Data assumes reinvestment of dividends and capital gains, and none of the charts reflect the deduction of taxes that a shareholder would pay on fund distributions or the redemption of fund shares. To obtain performance data current to the most recent month end, please call 1-800-345-2021 or visit americancentury.com. For additional information about the fund, please consult the prospectus.
Portfolio Managers: Yulin Long and Tsuyoshi Ozaki
Tsuyoshi Ozaki joined the portfolio management team in 2017.
Performance Summary
The NT Disciplined Growth Fund returned 19.98%* for the fiscal year ended June 30, 2018, compared with the 22.51% return of its benchmark, the Russell 1000 Growth Index.
The NT Disciplined Growth Fund advanced during the fiscal year, but underperformed its benchmark, the Russell 1000 Growth Index. Stock selection in the health care and information technology sectors detracted, while positioning in consumer staples and industrials benefited relative performance.
NT Disciplined Growth’s stock selection process incorporates factors of valuation, quality, growth, and sentiment, while striving to minimize unintended risks along industries and other risk characteristics. Within the fund, overall performance was aided by growth, sentiment, and quality factors, while the value factor detracted.
Stock Choices Across Several Sectors Detracted From Relative Returns
Picks in the health care sector were the largest drivers of relative underperformance. Selections in the biotechnology industry, such as AbbVie, Celgene, and Regeneron Pharmaceuticals, were among the leading detractors for the period. In health care equipment and supplies, a portfolio-only position in Zimmer Biomet Holdings was also among the largest detractors. Elsewhere in the sector, holdings among pharmaceuticals companies and health care providers and services companies also hurt relative returns. We eliminated our stakes in Regeneron and Zimmer Biomet during the period.
Stock selection within information technology also negatively affected the portfolio. Positioning in the IT services industry, such as payment processing companies like MasterCard and PayPal Holdings, detracted from relative returns. We eliminated our position in PayPal. Stock choices in technology hardware, storage, and peripherals were also negative, particularly an overweight to Western Digital. In semiconductors and semiconductor equipment, an underweight to NVIDIA was among one of the largest detractors from relative performance for the period.
Within the consumer discretionary sector, an underweight to streaming services company Netflix was a large detractor. Netflix reported strong subscriber growth, and the stock rose. The portfolio has some exposure to the stock but less than the index, maintaining an underweight to the stock due to its poor quality, valuation, and sentiment scores. In addition to Netflix, positioning in the leisure products, multiline retail, and household durables industries hurt relative performance.
Consumer Staples and Industrials Were Additive
Within consumer staples, the absence of tobacco companies helped relative returns. The stock of companies such as Altria Group and Philip Morris International have been depressed due to falling
*All fund returns referenced in this commentary are for G Class shares. G Class returns would have been lower if a portion of the fees had not been waived. Performance for other share classes will vary due to differences in fee structure; when G Class performance exceeds that of the fund's benchmark, other share classes may not. See page 2 for returns for all share classes.
sales and shifting consumer tastes. Philip Morris’ stock fell due to poor sales of its new smokeless tobacco product. Elsewhere in the sector, a portfolio-only position in diet and nutrition product company Medifast benefited returns and was among the top contributors for the period.
Underweights to beverages companies such as Coca-Cola Co. and PepsiCo also helped performance, as the companies’ stock has been under pressure due to changing consumer preferences.
Stock selection within the industrials sector also helped relative results. Overweights to several aerospace and defense companies helped relative returns. In particular, an overweight to Boeing was among the top contributors for the period. Positioning within the professional services industry also boosted relative returns. Human resources company Insperity was a strong contributor, as its stock rose during the period on the back of a tight job market. Elsewhere in the sector, avoidance of selected poor-performing air freight and logistics companies and airlines companies was also additive.
A Look Ahead
Our disciplined, objective, and systematic investment strategy is designed to take advantage of opportunities at the individual company level. We believe this approach is the most powerful way to capitalize on market inefficiencies that lead to the mispricing of individual stocks. As a result of this approach, our sector and industry allocations reflect where we are finding the greatest opportunities among individual companies at a given time.
At period-end, consumer discretionary was the most overweight sector. According to our factor model, consumer durables and apparel offer some of the best growth opportunities in the current environment. We increased our relative overweight position in order to take advantage of these opportunities. Health care was among our largest active weights during the period. Based on our factor model, we believe there are significant opportunities in the pharmaceuticals and biotechnology industries. Conversely, we are underweight the financials and consumer staples sectors. Diversified financials companies show a lack of opportunity and are comparatively unattractive in terms of growth metrics. Our model also identifies a lack of opportunity in the insurance space. In the consumer staples sector, our underweight is driven by a lack of exposure to the food, beverage, and tobacco industry group, which scores poorly on growth, quality, and sentiment.
|
| |
| JUNE 30, 2018 |
| Top Ten Holdings | % of net assets |
| Apple, Inc. | 7.6% |
| Alphabet, Inc., Class A | 6.0% |
| Amazon.com, Inc. | 5.3% |
| Microsoft Corp. | 5.2% |
| Facebook, Inc., Class A | 4.3% |
| UnitedHealth Group, Inc. | 2.7% |
| Visa, Inc., Class A | 2.4% |
| Boeing Co. (The) | 2.1% |
| Adobe Systems, Inc. | 1.9% |
| AbbVie, Inc. | 1.8% |
| | |
| Top Five Industries | % of net assets |
| Software | 12.2% |
| Internet Software and Services | 10.9% |
| Technology Hardware, Storage and Peripherals | 8.7% |
| Internet and Direct Marketing Retail | 6.6% |
| IT Services | 6.0% |
| | |
| Types of Investments in Portfolio | % of net assets |
| Common Stocks | 100.0% |
| Temporary Cash Investments | 0.7% |
| Other Assets and Liabilities | (0.7)% |
Fund shareholders may incur two types of costs: (1) transaction costs, including sales charges (loads) on purchase payments and redemption/exchange fees; and (2) ongoing costs, including management fees; distribution and service (12b-1) fees; and other fund expenses. This example is intended to help you understand your ongoing costs (in dollars) of investing in your fund and to compare these costs with the ongoing cost of investing in other mutual funds.
The example is based on an investment of $1,000 made at the beginning of the period and held for the entire period from January 1, 2018 to June 30, 2018.
Actual Expenses
The table provides information about actual account values and actual expenses for each class. You may use the information, together with the amount you invested, to estimate the expenses that you paid over the period. First, identify the share class you own. Then simply divide your account value by $1,000 (for example, an $8,600 account value divided by $1,000 = 8.6), then multiply the result by the number under the heading “Expenses Paid During Period” to estimate the expenses you paid on your account during this period.
Hypothetical Example for Comparison Purposes
The table also provides information about hypothetical account values and hypothetical expenses based on the actual expense ratio of each class of your fund and an assumed rate of return of 5% per year before expenses, which is not the actual return of a fund’s share class. The hypothetical account values and expenses may not be used to estimate the actual ending account balance or expenses you paid for the period. You may use this information to compare the ongoing costs of investing in your fund and other funds. To do so, compare this 5% hypothetical example with the 5% hypothetical examples that appear in the shareholder reports of the other funds.
Please note that the expenses shown in the table are meant to highlight your ongoing costs only and do not reflect any transactional costs, such as sales charges (loads) or redemption/exchange fees. Therefore, the table is useful in comparing ongoing costs only, and will not help you determine the relative total costs of owning different funds. In addition, if these transactional costs were included, your costs would have been higher.
|
| | | | |
| | Beginning
Account Value
1/1/18 | Ending
Account Value
6/30/18 | Expenses Paid
During Period(1)
1/1/18 - 6/30/18 |
Annualized
Expense Ratio(1) |
| Actual | | | | |
| Investor Class | $1,000 | $1,056.60 | $5.15 | 1.01% |
| G Class | $1,000 | $1,061.70 | $0.05 | 0.01% |
| Hypothetical | | | | |
| Investor Class | $1,000 | $1,019.79 | $5.06 | 1.01% |
| G Class | $1,000 | $1,024.74 | $0.05 | 0.01% |
| |
| (1) | Expenses are equal to the class's annualized expense ratio listed in the table above, multiplied by the average account value over the period, multiplied by 181, the number of days in the most recent fiscal half-year, divided by 365, to reflect the one-half year period. Annualized expense ratio reflects actual expenses, including any applicable fee waivers or expense reimbursements and excluding any acquired fund fees and expenses. |
JUNE 30, 2018
|
| | | | | |
| | Shares | Value |
| COMMON STOCKS — 100.0% | | |
| Aerospace and Defense — 4.4% | | |
Astronics Corp.(1) | 1,326 |
| $ | 47,696 |
|
| Boeing Co. (The) | 33,957 |
| 11,392,913 |
|
| Curtiss-Wright Corp. | 14,498 |
| 1,725,552 |
|
| Lockheed Martin Corp. | 22,177 |
| 6,551,751 |
|
| Raytheon Co. | 24,236 |
| 4,681,911 |
|
| | | 24,399,823 |
|
| Auto Components — 0.4% | | |
Stoneridge, Inc.(1) | 2,699 |
| 94,843 |
|
Visteon Corp.(1) | 16,913 |
| 2,185,836 |
|
| | | 2,280,679 |
|
| Banks — 0.2% | | |
| Central Pacific Financial Corp. | 44,228 |
| 1,267,132 |
|
| Beverages — 1.3% | | |
| Coca-Cola Co. (The) | 16,888 |
| 740,708 |
|
| Constellation Brands, Inc., Class A | 25,456 |
| 5,571,555 |
|
| PepsiCo, Inc. | 8,626 |
| 939,112 |
|
| | | 7,251,375 |
|
| Biotechnology — 5.8% | | |
| AbbVie, Inc. | 106,923 |
| 9,906,416 |
|
Alexion Pharmaceuticals, Inc.(1) | 41,686 |
| 5,175,317 |
|
| Amgen, Inc. | 30,110 |
| 5,558,005 |
|
Biogen, Inc.(1) | 23,405 |
| 6,793,067 |
|
Celgene Corp.(1) | 59,873 |
| 4,755,114 |
|
| | | 32,187,919 |
|
| Capital Markets — 0.4% | | |
| BGC Partners, Inc., Class A | 20,880 |
| 236,362 |
|
| Cboe Global Markets, Inc. | 18,707 |
| 1,946,837 |
|
| | | 2,183,199 |
|
| Chemicals — 0.7% | | |
Kraton Corp.(1) | 22,839 |
| 1,053,792 |
|
| LyondellBasell Industries NV, Class A | 3,238 |
| 355,694 |
|
| Praxair, Inc. | 14,040 |
| 2,220,426 |
|
| Scotts Miracle-Gro Co. (The) | 644 |
| 53,555 |
|
| | | 3,683,467 |
|
| Commercial Services and Supplies — 0.8% | | |
| McGrath RentCorp | 18,090 |
| 1,144,554 |
|
| MSA Safety, Inc. | 33,650 |
| 3,241,841 |
|
| | | 4,386,395 |
|
| Communications Equipment — 0.6% | | |
F5 Networks, Inc.(1) | 11,922 |
| 2,055,949 |
|
|
| | | | | |
| | Shares | Value |
Palo Alto Networks, Inc.(1) | 6,822 |
| $ | 1,401,716 |
|
| | | 3,457,665 |
|
| Diversified Consumer Services — 0.7% | | |
Cambium Learning Group, Inc.(1) | 14,993 |
| 167,172 |
|
Grand Canyon Education, Inc.(1) | 34,125 |
| 3,808,691 |
|
| | | 3,975,863 |
|
| Diversified Telecommunication Services — 0.1% | | |
Vonage Holdings Corp.(1) | 49,494 |
| 637,978 |
|
| Electrical Equipment — 0.2% | | |
| AMETEK, Inc. | 15,644 |
| 1,128,871 |
|
| Energy Equipment and Services — 0.8% | | |
| Halliburton Co. | 96,739 |
| 4,359,059 |
|
| Equity Real Estate Investment Trusts (REITs) — 0.7% | | |
| PotlatchDeltic Corp. | 24,540 |
| 1,247,859 |
|
| PS Business Parks, Inc. | 20,588 |
| 2,645,558 |
|
| | | 3,893,417 |
|
Food and Staples Retailing† | | |
| Walgreens Boots Alliance, Inc. | 1,073 |
| 64,396 |
|
| Health Care Equipment and Supplies — 1.3% | | |
Edwards Lifesciences Corp.(1) | 9,745 |
| 1,418,580 |
|
Haemonetics Corp.(1) | 16,460 |
| 1,476,133 |
|
Intuitive Surgical, Inc.(1) | 8,301 |
| 3,971,862 |
|
Orthofix International NV(1) | 7,247 |
| 411,774 |
|
| | | 7,278,349 |
|
| Health Care Providers and Services — 4.6% | | |
| Cigna Corp. | 24,953 |
| 4,240,762 |
|
Express Scripts Holding Co.(1) | 36,999 |
| 2,856,693 |
|
Tivity Health, Inc.(1) | 29,427 |
| 1,035,830 |
|
| UnitedHealth Group, Inc. | 59,773 |
| 14,664,708 |
|
WellCare Health Plans, Inc.(1) | 9,860 |
| 2,427,927 |
|
| | | 25,225,920 |
|
| Health Care Technology — 0.1% | | |
athenahealth, Inc.(1) | 712 |
| 113,307 |
|
| HealthStream, Inc. | 6,154 |
| 168,066 |
|
| | | 281,373 |
|
| Hotels, Restaurants and Leisure — 3.2% | | |
| Las Vegas Sands Corp. | 78,619 |
| 6,003,347 |
|
| Marriott International, Inc., Class A | 41,819 |
| 5,294,285 |
|
| McDonald's Corp. | 4,712 |
| 738,323 |
|
| Ruth's Hospitality Group, Inc. | 1,852 |
| 51,949 |
|
| Vail Resorts, Inc. | 11,651 |
| 3,194,588 |
|
| Wynn Resorts Ltd. | 14,800 |
| 2,476,632 |
|
| | | 17,759,124 |
|
| Household Durables — 1.0% | | |
| PulteGroup, Inc. | 145,508 |
| 4,183,355 |
|
| Toll Brothers, Inc. | 26,832 |
| 992,516 |
|
|
| | | | | |
| | Shares | Value |
William Lyon Homes, Class A(1) | 14,485 |
| $ | 336,052 |
|
| | | 5,511,923 |
|
| Household Products — 1.0% | | |
| Kimberly-Clark Corp. | 49,709 |
| 5,236,346 |
|
| Independent Power and Renewable Electricity Producers — 0.8% | |
| NRG Energy, Inc. | 134,239 |
| 4,121,137 |
|
| Industrial Conglomerates — 1.8% | | |
| 3M Co. | 16,512 |
| 3,248,241 |
|
| Honeywell International, Inc. | 46,751 |
| 6,734,481 |
|
| | | 9,982,722 |
|
| Insurance — 0.9% | | |
| Infinity Property & Casualty Corp. | 34,031 |
| 4,844,313 |
|
| Internet and Direct Marketing Retail — 6.6% | | |
Amazon.com, Inc.(1) | 17,087 |
| 29,044,483 |
|
Booking Holdings, Inc.(1) | 11 |
| 22,298 |
|
Netflix, Inc.(1) | 4,517 |
| 1,768,089 |
|
| Nutrisystem, Inc. | 47,121 |
| 1,814,158 |
|
| PetMed Express, Inc. | 10,530 |
| 463,847 |
|
Shutterfly, Inc.(1) | 36,100 |
| 3,250,083 |
|
| | | 36,362,958 |
|
| Internet Software and Services — 10.9% | | |
Alphabet, Inc., Class A(1) | 29,507 |
| 33,319,010 |
|
Facebook, Inc., Class A(1) | 122,826 |
| 23,867,548 |
|
| LogMeIn, Inc. | 16,404 |
| 1,693,713 |
|
Stamps.com, Inc.(1) | 4,101 |
| 1,037,758 |
|
| | | 59,918,029 |
|
| IT Services — 6.0% | | |
| Accenture plc, Class A | 15,360 |
| 2,512,742 |
|
| CSG Systems International, Inc. | 87,468 |
| 3,574,817 |
|
| DXC Technology Co. | 16,104 |
| 1,298,143 |
|
| International Business Machines Corp. | 53,090 |
| 7,416,673 |
|
| MasterCard, Inc., Class A | 11,482 |
| 2,256,443 |
|
Syntel, Inc.(1) | 43,138 |
| 1,384,298 |
|
Unisys Corp.(1) | 77,452 |
| 999,131 |
|
| Visa, Inc., Class A | 100,559 |
| 13,319,040 |
|
| | | 32,761,287 |
|
| Machinery — 2.1% | | |
| Caterpillar, Inc. | 48,378 |
| 6,563,444 |
|
| Hyster-Yale Materials Handling, Inc. | 117 |
| 7,517 |
|
| Ingersoll-Rand plc | 54,181 |
| 4,861,661 |
|
Lydall, Inc.(1) | 1,865 |
| 81,407 |
|
| | | 11,514,029 |
|
| Media — 1.0% | | |
| Comcast Corp., Class A | 50,976 |
| 1,672,522 |
|
| Entravision Communications Corp., Class A | 183,924 |
| 919,620 |
|
tronc, Inc.(1) | 25,792 |
| 445,686 |
|
|
| | | | | |
| | Shares | Value |
| Walt Disney Co. (The) | 23,654 |
| $ | 2,479,176 |
|
| | | 5,517,004 |
|
| Multiline Retail — 0.8% | | |
Dollar Tree, Inc.(1) | 52,806 |
| 4,488,510 |
|
| Oil, Gas and Consumable Fuels — 0.8% | | |
Continental Resources, Inc.(1) | 68,283 |
| 4,422,007 |
|
| Personal Products — 0.5% | | |
| Medifast, Inc. | 16,880 |
| 2,703,501 |
|
| Pharmaceuticals — 3.9% | | |
| Allergan plc | 23,507 |
| 3,919,087 |
|
| Bristol-Myers Squibb Co. | 95,956 |
| 5,310,205 |
|
| Eli Lilly & Co. | 53,113 |
| 4,532,132 |
|
| Johnson & Johnson | 22,000 |
| 2,669,480 |
|
| Zoetis, Inc. | 56,599 |
| 4,821,669 |
|
| | | 21,252,573 |
|
| Professional Services — 2.1% | | |
ASGN, Inc.(1) | 22,844 |
| 1,786,172 |
|
| Insperity, Inc. | 47,734 |
| 4,546,664 |
|
| Kforce, Inc. | 9,550 |
| 327,565 |
|
| Robert Half International, Inc. | 74,539 |
| 4,852,489 |
|
TrueBlue, Inc.(1) | 8,764 |
| 236,190 |
|
| | | 11,749,080 |
|
Real Estate Management and Development† | | |
| Newmark Group, Inc., Class A | 10,908 |
| 155,221 |
|
| Semiconductors and Semiconductor Equipment — 4.6% | | |
| Applied Materials, Inc. | 124,350 |
| 5,743,727 |
|
| Broadcom, Inc. | 31,435 |
| 7,627,388 |
|
| Lam Research Corp. | 15,140 |
| 2,616,949 |
|
| MKS Instruments, Inc. | 28,086 |
| 2,687,830 |
|
| NVIDIA Corp. | 8,548 |
| 2,025,021 |
|
NXP Semiconductors NV(1) | 11,831 |
| 1,292,773 |
|
| Skyworks Solutions, Inc. | 17,913 |
| 1,731,292 |
|
| Texas Instruments, Inc. | 16,791 |
| 1,851,208 |
|
| | | 25,576,188 |
|
| Software — 12.2% | | |
| Activision Blizzard, Inc. | 90,720 |
| 6,923,750 |
|
Adobe Systems, Inc.(1) | 42,332 |
| 10,320,965 |
|
Cadence Design Systems, Inc.(1) | 107,848 |
| 4,670,897 |
|
Electronic Arts, Inc.(1) | 50,431 |
| 7,111,780 |
|
| Microsoft Corp. | 289,960 |
| 28,592,955 |
|
Red Hat, Inc.(1) | 19,616 |
| 2,635,802 |
|
salesforce.com, Inc.(1) | 19,889 |
| 2,712,860 |
|
Synopsys, Inc.(1) | 48,741 |
| 4,170,767 |
|
| | | 67,139,776 |
|
| Specialty Retail — 4.3% | | |
Asbury Automotive Group, Inc.(1) | 47,610 |
| 3,263,666 |
|
AutoZone, Inc.(1) | 6,823 |
| 4,577,755 |
|
|
| | | | | |
| | Shares | Value |
Burlington Stores, Inc.(1) | 31,273 |
| $ | 4,707,525 |
|
| Home Depot, Inc. (The) | 26,156 |
| 5,103,036 |
|
| Ross Stores, Inc. | 68,354 |
| 5,793,001 |
|
| | | 23,444,983 |
|
| Technology Hardware, Storage and Peripherals — 8.7% | | |
| Apple, Inc. | 225,038 |
| 41,656,784 |
|
| NetApp, Inc. | 29,063 |
| 2,282,317 |
|
| Western Digital Corp. | 51,346 |
| 3,974,694 |
|
| | | 47,913,795 |
|
| Textiles, Apparel and Luxury Goods — 2.8% | | |
| Columbia Sportswear Co. | 23,475 |
| 2,147,258 |
|
Deckers Outdoor Corp.(1) | 37,035 |
| 4,180,881 |
|
Michael Kors Holdings Ltd.(1) | 68,456 |
| 4,559,170 |
|
| Oxford Industries, Inc. | 5,720 |
| 474,646 |
|
| Tapestry, Inc. | 89,334 |
| 4,172,791 |
|
| | | 15,534,746 |
|
| Thrifts and Mortgage Finance — 0.1% | | |
| Merchants Bancorp | 5,686 |
| 162,222 |
|
Nationstar Mortgage Holdings, Inc.(1) | 28,935 |
| 507,230 |
|
| | | 669,452 |
|
| Wireless Telecommunication Services — 0.8% | | |
T-Mobile US, Inc.(1) | 76,488 |
| 4,570,158 |
|
TOTAL COMMON STOCKS
(Cost $429,598,180) | | 551,091,742 |
|
| TEMPORARY CASH INVESTMENTS — 0.7% | | |
| Repurchase Agreement, BMO Capital Markets Corp., (collateralized by various U.S. Treasury obligations, 1.375% - 3.75%, 2/15/19 - 11/15/47, valued at $2,095,728), in a joint trading account at 1.75%, dated 6/29/18, due 7/2/18 (Delivery value $2,053,719) | | 2,053,420 |
|
| Repurchase Agreement, Fixed Income Clearing Corp., (collateralized by various U.S. Treasury obligations, 2.75%, 2/15/28, valued at $1,747,530), at 0.90%, dated 6/29/18, due 7/2/18 (Delivery value $1,711,128) | | 1,711,000 |
|
| State Street Institutional U.S. Government Money Market Fund, Premier Class | 7,114 |
| 7,114 |
|
TOTAL TEMPORARY CASH INVESTMENTS
(Cost $3,771,534) | | 3,771,534 |
|
TOTAL INVESTMENT SECURITIES — 100.7%
(Cost $433,369,714) | | 554,863,276 |
|
| OTHER ASSETS AND LIABILITIES — (0.7)% | | (3,853,892 | ) |
| TOTAL NET ASSETS — 100.0% | | $ | 551,009,384 |
|
|
| | |
| NOTES TO SCHEDULE OF INVESTMENTS |
| |
| † | Category is less than 0.05% of total net assets. |
See Notes to Financial Statements.
|
|
| Statement of Assets and Liabilities |
|
| | | |
| JUNE 30, 2018 |
| Assets |
| Investment securities, at value (cost of $433,369,714) | $ | 554,863,276 |
|
| Dividends and interest receivable | 168,233 |
|
| | 555,031,509 |
|
| | |
| Liabilities | |
| Payable for capital shares redeemed | 3,920,212 |
|
| Accrued management fees | 101,913 |
|
| | 4,022,125 |
|
| | |
| Net Assets | $ | 551,009,384 |
|
| | |
| Net Assets Consist of: | |
| Capital (par value and paid-in surplus) | $ | 393,378,659 |
|
| Undistributed net investment income | 164,289 |
|
| Undistributed net realized gain | 35,972,874 |
|
| Net unrealized appreciation | 121,493,562 |
|
| | $ | 551,009,384 |
|
|
| | | | | | |
| | Net Assets | Shares Outstanding | Net Asset Value Per Share |
| Investor Class, $0.01 Par Value |
| $120,907,048 |
| 9,210,203 |
| $13.13 |
| G Class, $0.01 Par Value |
| $430,102,336 |
| 32,738,033 |
| $13.14 |
See Notes to Financial Statements.
|
| | | |
| YEAR ENDED JUNE 30, 2018 | |
| Investment Income (Loss) | |
| Income: | |
| Dividends | $ | 6,968,254 |
|
| Interest | 41,571 |
|
| | 7,009,825 |
|
| | |
| Expenses: | |
| Management fees | 4,826,273 |
|
| Directors' fees and expenses | 34,812 |
|
| Other expenses | 4,759 |
|
| | 4,865,844 |
|
| Fees waived - G Class | (3,359,282 | ) |
| | 1,506,562 |
|
| | |
| Net investment income (loss) | 5,503,263 |
|
| | |
| Realized and Unrealized Gain (Loss) | |
| Net realized gain (loss) on: | |
| Investment transactions | 60,408,912 |
|
| Futures contract transactions | (425,598 | ) |
| | 59,983,314 |
|
| | |
| Change in net unrealized appreciation (depreciation) on investments | 38,144,547 |
|
| | |
| Net realized and unrealized gain (loss) | 98,127,861 |
|
| | |
| Net Increase (Decrease) in Net Assets Resulting from Operations | $ | 103,631,124 |
|
See Notes to Financial Statements.
|
|
| Statement of Changes in Net Assets |
|
| | | | | | |
| YEARS ENDED JUNE 30, 2018 AND JUNE 30, 2017 |
| Increase (Decrease) in Net Assets | June 30, 2018 | June 30, 2017 |
| Operations | | |
| Net investment income (loss) | $ | 5,503,263 |
| $ | 3,592,873 |
|
| Net realized gain (loss) | 59,983,314 |
| 29,377,873 |
|
| Change in net unrealized appreciation (depreciation) | 38,144,547 |
| 67,527,807 |
|
| Net increase (decrease) in net assets resulting from operations | 103,631,124 |
| 100,498,553 |
|
| | | |
| Distributions to Shareholders | | |
| From net investment income: | | |
| Investor Class | (261,486 | ) | (512,555 | ) |
| G Class | (4,961,641 | ) | (3,074,161 | ) |
| From net realized gains: | | |
| Investor Class | (3,353,326 | ) | — |
|
| G Class | (13,395,221 | ) | — |
|
| Decrease in net assets from distributions | (21,971,674 | ) | (3,586,716 | ) |
| | | |
| Capital Share Transactions | | |
| Net increase (decrease) in net assets from capital share transactions (Note 5) | (86,893,311 | ) | (31,183,966 | ) |
| | | |
| Net increase (decrease) in net assets | (5,233,861 | ) | 65,727,871 |
|
| | | |
| Net Assets | | |
| Beginning of period | 556,243,245 |
| 490,515,374 |
|
| End of period | $ | 551,009,384 |
| $ | 556,243,245 |
|
| | | |
| Undistributed net investment income | $ | 164,289 |
| $ | 116,448 |
|
See Notes to Financial Statements.
|
|
| Notes to Financial Statements |
JUNE 30, 2018
1. Organization
American Century Quantitative Equity Funds, Inc. (the corporation) is registered under the Investment Company Act of 1940, as amended (the 1940 Act), as an open-end management investment company and is organized as a Maryland corporation. NT Disciplined Growth Fund (the fund) is one fund in a series issued by the corporation. The fund’s investment objective is to seek long-term capital growth. The fund is not permitted to invest in securities issued by companies assigned the Global Industry Classification Standard or the Bloomberg Industry Classification Standard for the tobacco industry. The fund offers the Investor Class and G Class (formerly Institutional Class).
2. Significant Accounting Policies
The following is a summary of significant accounting policies consistently followed by the fund in preparation of its financial statements. The fund is an investment company and follows accounting and reporting guidance in accordance with accounting principles generally accepted in the United States of America. This may require management to make certain estimates and assumptions at the date of the financial statements. Actual results could differ from these estimates. Management evaluated the impact of events or transactions occurring through the date the financial statements were issued that would merit recognition or disclosure.
Investment Valuations — The fund determines the fair value of its investments and computes its net asset value per share at the close of regular trading (usually 4 p.m. Eastern time) on the New York Stock Exchange (NYSE) on each day the NYSE is open. The Board of Directors has adopted valuation policies and procedures to guide the investment advisor in the fund’s investment valuation process and to provide methodologies for the oversight of the fund’s pricing function.
Equity securities that are listed or traded on a domestic securities exchange are valued at the last reported sales price or at the official closing price as provided by the exchange. Equity securities traded on foreign securities exchanges are generally valued at the closing price of such securities on the exchange where primarily traded or at the close of the NYSE, if that is earlier. If no last sales price is reported, or if local convention or regulation so provides, the mean of the latest bid and asked prices may be used. Securities traded over-the-counter are valued at the mean of the latest bid and asked prices, the last sales price, or the official closing price.
Open-end management investment companies are valued at the reported net asset value per share. Repurchase agreements are valued at cost, which approximates fair value. Exchange-traded futures contracts are valued at the settlement price as provided by the appropriate exchange.
If the fund determines that the market price for an investment is not readily available or the valuation methods mentioned above do not reflect an investment’s fair value, such investment is valued as determined in good faith by the Board of Directors or its delegate, in accordance with policies and procedures adopted by the Board of Directors. In its determination of fair value, the fund may review several factors including, but not limited to, market information regarding the specific investment or comparable investments and correlation with other investment types, futures indices or general market indicators. Circumstances that may cause the fund to use these procedures to value an investment include, but are not limited to: an investment has been declared in default or is distressed; trading in a security has been suspended during the trading day or a security is not actively trading on its principal exchange; prices received from a regular pricing source are deemed unreliable; or there is a foreign market holiday and no trading occurred.
The fund monitors for significant events occurring after the close of an investment’s primary exchange but before the fund’s net asset value per share is determined. Significant events may include, but are not limited to: corporate announcements and transactions; governmental action and political unrest that could impact a specific investment or an investment sector; or armed conflicts, natural disasters and similar events that could affect investments in a specific country or region. The fund also monitors for significant fluctuations between domestic and foreign markets, as evidenced by the U.S. market or such other indicators that the Board of Directors, or its delegate, deems appropriate. If significant fluctuations in foreign markets are identified, the fund may apply a model-derived factor to the closing price of equity securities traded on foreign securities exchanges. The factor is based on observable market data as provided by an independent pricing service.
Security Transactions — Security transactions are accounted for as of the trade date. Net realized gains and losses are determined on the identified cost basis, which is also used for federal income tax purposes.
Investment Income — Dividend income less foreign taxes withheld, if any, is recorded as of the ex-dividend date. Distributions received on securities that represent a return of capital or long-term capital gain are recorded as a reduction of cost of investments and/or as a realized gain. The fund may estimate the components of distributions received that may be considered nontaxable distributions or long-term capital gain distributions for income tax purposes. Interest income is recorded on the accrual basis and includes accretion of discounts and amortization of premiums.
Repurchase Agreements — The fund may enter into repurchase agreements with institutions that American Century Investment Management, Inc. (ACIM) (the investment advisor) has determined are creditworthy pursuant to criteria adopted by the Board of Directors. The fund requires that the collateral, represented by securities, received in a repurchase transaction be transferred to the custodian in a manner sufficient to enable the fund to obtain those securities in the event of a default under the repurchase agreement. ACIM monitors, on a daily basis, the securities transferred to ensure the value, including accrued interest, of the securities under each repurchase agreement is equal to or greater than amounts owed to the fund under each repurchase agreement.
Joint Trading Account — Pursuant to an Exemptive Order issued by the Securities and Exchange Commission, the fund, along with certain other funds in the American Century Investments family of funds, may transfer uninvested cash balances into a joint trading account. These balances are invested in one or more repurchase agreements that are collateralized by U.S. Treasury or Agency obligations.
Segregated Assets — In accordance with the 1940 Act, the fund segregates assets on its books and records to cover certain types of investment securities and other financial instruments. ACIM monitors, on a daily basis, the securities segregated to ensure the fund designates a sufficient amount of liquid assets, marked-to-market daily. The fund may also receive assets or be required to pledge assets at the custodian bank or with a broker for collateral requirements.
Income Tax Status — It is the fund’s policy to distribute substantially all net investment income and net realized gains to shareholders and to otherwise qualify as a regulated investment company under provisions of the Internal Revenue Code. Accordingly, no provision has been made for income taxes. The fund files U.S. federal, state, local and non-U.S. tax returns as applicable. The fund's tax returns are subject to examination by the relevant taxing authority until expiration of the applicable statute of limitations, which is generally three years from the date of filing but can be longer in certain jurisdictions. At this time, management believes there are no uncertain tax positions which, based on their technical merit, would not be sustained upon examination and for which it is reasonably possible that the total amounts of unrecognized tax benefits will significantly change in the next twelve months.
Multiple Class — All shares of the fund represent an equal pro rata interest in the net assets of the class to which such shares belong, and have identical voting, dividend, liquidation and other rights and the same terms and conditions, except for class specific expenses and exclusive rights to vote on matters affecting only individual classes. Income, non-class specific expenses, and realized and unrealized capital gains and losses of the fund are allocated to each class of shares based on their relative net assets.
Distributions to Shareholders — Distributions from net investment income, if any, are generally declared and paid semiannually. Distributions from net realized gains, if any, are generally declared and paid annually.
Indemnifications — Under the corporation’s organizational documents, its officers and directors are indemnified against certain liabilities arising out of the performance of their duties to the fund. In addition, in the normal course of business, the fund enters into contracts that provide general indemnifications. The maximum exposure under these arrangements is unknown as this would involve future claims that may be made against a fund. The risk of material loss from such claims is considered by management to be remote.
3. Fees and Transactions with Related Parties
Certain officers and directors of the corporation are also officers and/or directors of American Century Companies, Inc. (ACC). The corporation’s investment advisor, ACIM, the corporation's distributor, American Century Investment Services, Inc., and the corporation’s transfer agent, American Century Services, LLC, are wholly owned, directly or indirectly, by ACC. Various funds issued by American Century Asset Allocation Portfolios, Inc. own, in aggregate, 100% of the shares of the fund. Related parties do not invest in the fund for the purpose of exercising management or control.
Management Fees — The corporation has entered into a management agreement with ACIM, under which ACIM provides the fund with investment advisory and management services in exchange for a single, unified management fee (the fee) per class. The agreement provides that all expenses of managing and operating the fund, except brokerage expenses, taxes, interest, fees and expenses of the independent directors (including legal counsel fees), and extraordinary expenses, will be paid by ACIM. The fee is computed and accrued daily based on each class's daily net assets and paid monthly in arrears. The difference in the fee among the classes is a result of their separate arrangements for non-Rule 12b-1 shareholder services, which may be provided indirectly through another American Century Investments mutual fund. It is not the result of any difference in advisory or custodial fees or other expenses related to the management of the fund’s assets, which do not vary by class. The fee consists of (1) an Investment Category Fee based on the daily net assets of the fund and certain other accounts managed by the investment advisor that are in the same broad investment category as the fund and (2) a Complex Fee based on the assets of all the funds in the American Century Investments family of funds. Effective July 31, 2017, the investment advisor agreed to waive the G Class’s management fee in its entirety. The investment advisor expects this waiver to remain in effect permanently and cannot terminate it without the approval of the Board of Directors.
The Investment Category Fee range, the Complex Fee range and the effective annual management fee for each class for the period ended June 30, 2018 are as follows:
|
| | | |
| | Investment Category Fee Range | Complex Fee Range | Effective Annual Management Fee |
| Investor Class | 0.6880% to 0.8700% | 0.2500% to 0.3100% | 1.00% |
| G Class | 0.0500% to 0.1100% | 0.06%(1) |
(1) Effective annual management fee before waiver was 0.80%.
Directors' Fees and Expenses — The Board of Directors is responsible for overseeing the investment advisor’s management and operations of the fund. The directors receive detailed information about the fund and its investment advisor regularly throughout the year, and meet at least quarterly with management of the investment advisor to review reports about fund operations. The fund’s officers do not receive compensation from the fund.
Interfund Transactions — The fund may enter into security transactions with other American Century Investments funds and other client accounts of the investment advisor, in accordance with the 1940 Act rules and procedures adopted by the Board of Directors. The rules and procedures require, among other things, that these transactions be effected at the independent current market price of the security. During the period, the interfund purchases and sales were $11,782,196 and $8,302,834, respectively. The effect of interfund transactions on the Statement of Operations was $563,817 in net realized gain (loss) on investment transactions.
4. Investment Transactions
Purchases and sales of investment securities, excluding short-term investments, for the period ended June 30, 2018 were $591,094,609 and $689,925,886, respectively.
5. Capital Share Transactions
Transactions in shares of the fund were as follows:
|
| | | | | | | | | | |
| | Year ended June 30, 2018 | Year ended
June 30, 2017 |
| | Shares | Amount | Shares | Amount |
| Investor Class/Shares Authorized | 80,000,000 |
| | 80,000,000 |
| |
| Sold | 216,714 |
| $ | 2,721,186 |
| 23,128 |
| $ | 244,486 |
|
| Issued in reinvestment of distributions | 290,418 |
| 3,614,812 |
| 47,142 |
| 512,555 |
|
| Redeemed | (628,753 | ) | (7,892,158 | ) | (487,931 | ) | (5,114,073 | ) |
| | (121,621 | ) | (1,556,160 | ) | (417,661 | ) | (4,357,032 | ) |
| G Class/Shares Authorized | 330,000,000 |
| | 330,000,000 |
| |
| Sold | 902,193 |
| 11,218,441 |
| 3,204,067 |
| 33,030,327 |
|
| Issued in reinvestment of distributions | 1,459,107 |
| 18,356,862 |
| 282,723 |
| 3,074,161 |
|
| Redeemed | (9,039,547 | ) | (114,912,454 | ) | (5,983,642 | ) | (62,931,422 | ) |
| | (6,678,247 | ) | (85,337,151 | ) | (2,496,852 | ) | (26,826,934 | ) |
| Net increase (decrease) | (6,799,868 | ) | $ | (86,893,311 | ) | (2,914,513 | ) | $ | (31,183,966 | ) |
6. Fair Value Measurements
The fund’s investments valuation process is based on several considerations and may use multiple inputs to determine the fair value of the investments held by the fund. In conformity with accounting principles generally accepted in the United States of America, the inputs used to determine a valuation are classified into three broad levels.
• Level 1 valuation inputs consist of unadjusted quoted prices in an active market for identical investments.
• Level 2 valuation inputs consist of direct or indirect observable market data (including quoted prices for comparable investments, evaluations of subsequent market events, interest rates, prepayment speeds, credit risk, etc.). These inputs also consist of quoted prices for identical investments initially expressed in local currencies that are adjusted through translation into U.S. dollars.
• Level 3 valuation inputs consist of unobservable data (including a fund’s own assumptions).
The level classification is based on the lowest level input that is significant to the fair valuation measurement. The valuation inputs are not necessarily an indication of the risks associated with investing in these securities or other financial instruments. There were no significant transfers between levels during the period.
The following is a summary of the level classifications as of period end. The Schedule of Investments provides additional information on the fund’s portfolio holdings.
|
| | | | | | | | |
| | Level 1 | Level 2 | Level 3 |
| Assets |
| Investment Securities | | | |
| Common Stocks | $ | 551,091,742 |
| — |
| — |
|
| Temporary Cash Investments | 7,114 |
| $ | 3,764,420 |
| — |
|
| | $ | 551,098,856 |
| $ | 3,764,420 |
| — |
|
7. Derivative Instruments
Equity Price Risk — The fund is subject to equity price risk in the normal course of pursuing its investment objectives. A fund may enter into futures contracts based on an equity index in order to manage its exposure to changes in market conditions. A fund may purchase futures contracts to gain exposure to increases in market value or sell futures contracts to protect against a decline in market value. Upon entering into a futures contract, a fund is required to deposit either cash or securities in an amount equal to a certain percentage of the contract value (initial margin). Subsequent payments (variation margin) are made or received daily, in cash, by a fund. The variation margin is equal to the daily change in the contract value and is recorded as unrealized gains and losses. A fund recognizes a realized gain or loss when the contract is closed or expires.
Net realized and unrealized gains or losses occurring during the holding period of futures contracts are a component of net realized gain (loss) on futures contract transactions and change in net unrealized appreciation (depreciation) on futures contracts, respectively. One of the risks of entering into futures contracts is the possibility that the change in value of the contract may not correlate with the changes in value of the underlying securities. During the period, the fund participated in equity price risk derivative instruments for temporary investment purposes.
At period end, the fund did not have any derivative instruments disclosed on the Statement of Assets and Liabilities. For the year ended June 30, 2018, the effect of equity price risk derivative instruments on the Statement of Operations was $(425,598) in net realized gain (loss) on futures contract transactions.
8. Risk Factors
The fund’s investment process may result in high portfolio turnover, which could mean high transaction costs, affecting both performance and capital gains tax liabilities to investors.
9. Federal Tax Information
The tax character of distributions paid during the years ended June 30, 2018 and June 30, 2017 were as follows:
|
| | | | | | |
| | 2018 | 2017 |
| Distributions Paid From | | |
| Ordinary income | $ | 10,461,192 |
| $ | 3,586,716 |
|
| Long-term capital gains | $ | 11,510,482 |
| — |
|
The book-basis character of distributions made during the year from net investment income or net realized gains may differ from their ultimate characterization for federal income tax purposes. These differences reflect the differing character of certain income items and net realized gains and losses for financial statement and tax purposes, and may result in reclassification among certain capital accounts on the financial statements.
As of period end, the federal tax cost of investments and the components of distributable earnings on a tax-basis were as follows:
|
| | | |
| Federal tax cost of investments | $ | 434,345,900 |
|
| Gross tax appreciation of investments | $ | 130,953,988 |
|
| Gross tax depreciation of investments | (10,436,612 | ) |
| Net tax appreciation (depreciation) of investments | $ | 120,517,376 |
|
| Undistributed ordinary income | $ | 16,103,260 |
|
| Accumulated long-term gains | $ | 21,010,089 |
|
The difference between book-basis and tax-basis unrealized appreciation (depreciation) is attributable primarily to the tax deferral of losses on wash sales.
|
| | | | | | | | | | | | | | | |
| For a Share Outstanding Throughout the Years Ended June 30 (except as noted) |
| Per-Share Data | | | | | | | | Ratios and Supplemental Data | | |
| | | Income From Investment Operations: | Distributions From: | | | Ratio to Average Net Assets of: | | |
| | Net Asset Value, Beginning of Period | Net Investment Income (Loss)(1) | Net Realized and Unrealized Gain (Loss) | Total From Investment Operations | Net Investment Income | Net
Realized
Gains | Total
Distributions | Net Asset Value, End of Period | Total Return(2) | Operating Expenses | Net Investment Income (Loss) | Portfolio Turnover Rate | Net Assets, End of Period (in thousands) |
| Investor Class | | | | | | | | | | |
| 2018 | $11.41 | 0.03 | 2.10 | 2.13 | (0.03) | (0.38) | (0.41) | $13.13 | 18.85% | 1.01% | 0.22% | 105% |
| $120,907 |
|
| 2017 | $9.49 | 0.05 | 1.92 | 1.97 | (0.05) | — | (0.05) | $11.41 | 20.83% | 1.02% | 0.51% | 131% |
| $106,476 |
|
| 2016 | $9.77 | 0.06 | (0.27) | (0.21) | (0.07) | — | (0.07) | $9.49 | (2.18)% | 1.02% | 0.62% | 118% |
| $92,560 |
|
2015(3) | $10.00 | 0.02 | (0.25) | (0.23) | — | — | — | $9.77 | (2.30)% | 1.01%(4) | 0.55%(4) | 29% |
| $94,459 |
|
G Class(5) | | | | | | | | | | |
| 2018 | $11.41 | 0.15 | 2.10 | 2.25 | (0.14) | (0.38) | (0.52) | $13.14 | 19.98% | 0.07%(6) | 1.16%(6) | 105% |
| $430,102 |
|
| 2017 | $9.49 | 0.08 | 1.92 | 2.00 | (0.08) | — | (0.08) | $11.41 | 21.08% | 0.82% | 0.71% | 131% |
| $449,768 |
|
| 2016 | $9.78 | 0.08 | (0.28) | (0.20) | (0.09) | — | (0.09) | $9.49 | (2.03)% | 0.82% | 0.82% | 118% |
| $397,955 |
|
2015(3) | $10.00 | 0.02 | (0.24) | (0.22) | — | — | — | $9.78 | (2.20)% | 0.81%(4) | 0.75%(4) | 29% |
| $357,113 |
|
|
|
| Notes to Financial Highlights |
| |
| (1) | Computed using average shares outstanding throughout the period. |
| |
| (2) | Total returns are calculated based on the net asset value of the last business day. Total returns for periods less than one year are not annualized. |
| |
| (3) | March 19, 2015 (fund inception) through June 30, 2015. |
| |
| (5) | Prior to July 31, 2017, the G Class was referred to as the Institutional Class. |
| |
| (6) | The ratio of operating expenses to average net assets before expense waiver and the ratio of net investment income (loss) to average net assets before expense waiver was 0.81% and 0.42%, respectively. |
See Notes to Financial Statements.
|
|
| Report of Independent Registered Public Accounting Firm |
To the Board of Directors of American Century Quantitative Equity Funds, Inc. and Shareholders of NT Disciplined Growth Fund
Opinion on the Financial Statements
We have audited the accompanying statement of assets and liabilities, including the schedule of investments, of NT Disciplined Growth Fund (one of the funds constituting American Century Quantitative Equity Funds, Inc., referred to hereafter as the "Fund") as of June 30, 2018, the related statement of operations for the year ended June 30, 2018, the statement of changes in net assets for each of the two years in the period ended June 30, 2018, including the related notes, and the financial highlights for each of the periods indicated therein (collectively referred to as the “financial statements”). In our opinion, the financial statements present fairly, in all material respects, the financial position of the Fund as of June 30, 2018, the results of its operations for the year then ended, the changes in its net assets for each of the two years in the period ended June 30, 2018 and the financial highlights for each of the periods indicated therein in conformity with accounting principles generally accepted in the United States of America.
Basis for Opinion
These financial statements are the responsibility of the Fund’s management. Our responsibility is to express an opinion on the Fund’s financial statements based on our audits. We are a public accounting firm registered with the Public Company Accounting Oversight Board (United States) (“PCAOB”) and are required to be independent with respect to the Fund in accordance with the U.S. federal securities laws and the applicable rules and regulations of the Securities and Exchange Commission and the PCAOB.
We conducted our audits of these financial statements in accordance with the standards of the PCAOB. Those standards require that we plan and perform the audit to obtain reasonable assurance about whether the financial statements are free of material misstatement, whether due to error or fraud.
Our audits included performing procedures to assess the risks of material misstatement of the financial statements, whether due to error or fraud, and performing procedures that respond to those risks. Such procedures included examining, on a test basis, evidence regarding the amounts and disclosures in the financial statements. Our audits also included evaluating the accounting principles used and significant estimates made by management, as well as evaluating the overall presentation of the financial statements. Our procedures included confirmation of securities owned as of June 30, 2018 by correspondence with the custodian and brokers. We believe that our audits provide a reasonable basis for our opinion.
/s/ PricewaterhouseCoopers LLP
Kansas City, Missouri
August 16, 2018
We have served as the auditor of one or more investment companies in American Century Investments since 1997.
The Board of Directors
The individuals listed below serve as directors of the funds. Each director will continue to serve in this capacity until death, retirement, resignation or removal from office. The board has adopted a mandatory retirement age for directors who are not “interested persons,” as that term is defined in the Investment Company Act (independent directors). Independent directors shall retire by December 31 of the year in which they reach their 75th birthday; provided, however, that on or after January 1, 2022, independent trustees shall retire on December 31 of the year in which they reach their 76th birthday.
Mr. Thomas is an “interested person” because he currently serves as President and Chief Executive Officer of American Century Companies, Inc. (ACC), the parent company of American Century Investment Management, Inc. (ACIM or the advisor). The other directors (more than three-fourths of the total number) are independent. They are not employees, directors or officers of, and have no financial interest in, ACC or any of its wholly owned, direct or indirect, subsidiaries, including ACIM, American Century Investment Services, Inc. (ACIS) and American Century Services, LLC (ACS), and they do not have any other affiliations, positions or relationships that would cause them to be considered “interested persons” under the Investment Company Act. The directors serve in this capacity for eight (in the case of Jonathan S. Thomas, 16; and Ronald J. Gilson, 9) registered investment companies in the American Century Investments family of funds.
The following table presents additional information about the directors. The mailing address for each director other than Mr. Thomas is 1665 Charleston Road, Mountain View, California 94043. The mailing address for Mr. Thomas is 4500 Main Street, Kansas City, Missouri 64111.
|
| | | | | |
Name
(Year of Birth) | Position(s) Held with Funds | Length of Time Served | Principal Occupation(s) During Past 5 Years | Number of American Century Portfolios Overseen by Director | Other Directorships Held During Past 5 Years |
| Independent Directors |
|
|
Tanya S. Beder
(1955) | Director | Since 2011 | Chairman and CEO, SBCC Group Inc. (independent advisory services) (2006 to present) | 45 | CYS Investments, Inc.; Nabors Industries Ltd. |
Jeremy I. Bulow
(1954) | Director | Since 2011 | Professor of Economics, Stanford University, Graduate School of Business (1979 to present) | 45 | None |
Anne Casscells
(1958) | Director | Since 2016 | Co-Chief Executive Officer and Chief Investment Officer, Aetos Alternatives Management (investment advisory firm) (2001 to present); Lecturer in Accounting, Stanford University, Graduate School of Business (2009 to present) | 45 | None |
|
| | | | | |
Name
(Year of Birth) | Position(s) Held with Funds | Length of Time Served | Principal Occupation(s) During Past 5 Years | Number of American Century Portfolios Overseen by Director | Other Directorships Held During Past 5 Years |
| Independent Directors |
|
|
Ronald J. Gilson
(1946) | Director and Chairman of the Board | Since 1995
(Chairman since 2005) | Charles J. Meyers Professor of Law and Business, Emeritus, Stanford Law School (1979 to 2016); Marc and Eva Stern Professor of Law and Business, Columbia University School of Law (1992 to present) | 47 | None |
Frederick L. A. Grauer
(1946) | Director | Since 2008 | Senior Advisor, iShares by BlackRock, Inc. (investment management firm) (2010 to 2011, 2013 to 2015); Senior Advisor, Course Hero (an educational technology company) (2015 to present) | 45 | None |
Jonathan D. Levin
(1972) | Director | Since 2016 | Philip H. Knight Professor and Dean, Graduate School of Business, Stanford University (2016 to present); Professor, Stanford University, (2000 to present); Chair, Department of Economics, Stanford University (2011 to 2014) | 45 | None |
Peter F. Pervere
(1947) | Director | Since 2007 | Retired | 45 | None |
John B. Shoven
(1947) | Director | Since 2002 | Charles R. Schwab Professor of Economics, Stanford University (1973 to present) | 45 | Cadence Design Systems; Exponent; Financial Engines |
| Interested Director |
|
|
Jonathan S. Thomas
(1963) | Director and President | Since 2007 | President and Chief Executive Officer, ACC (2007 to present). Also serves as Chief Executive Officer, ACS; Executive Vice President, ACIM; Director, ACC, ACIM and other ACC subsidiaries | 115 | BioMed Valley Discoveries, Inc. |
The Statement of Additional Information has additional information about the fund's directors and is available without charge, upon request, by calling 1-800-345-2021.
Officers
The following table presents certain information about the executive officers of the funds. Each officer serves as an officer for each of the 16 (in the case of Robert J. Leach, 15) investment companies in the American Century family of funds, unless otherwise noted. No officer is compensated for his or her service as an officer of the funds. The listed officers are interested persons of the funds and are appointed or re-appointed on an annual basis. The mailing address for each officer listed below is 4500 Main Street, Kansas City, Missouri 64111.
|
| | |
Name
(Year of Birth) | Offices with the Funds | Principal Occupation(s) During the Past Five Years |
Jonathan S. Thomas
(1963) | Director and President since 2007 | President and Chief Executive Officer, ACC (2007 to present). Also serves as Chief Executive Officer, ACS; Executive Vice President, ACIM; Director, ACC, ACIM and other ACC subsidiaries |
Amy D. Shelton
(1964) | Chief Compliance Officer and Vice President since 2014 | Chief Compliance Officer, American Century funds, (2014 to present); Chief Compliance Officer, ACIM (2014 to present); Chief Compliance Officer, ACIS (2009 to present); Vice President, Client Interactions and Marketing, ACIS (2013 to 2014). Also serves as Vice President, ACIS |
Charles A. Etherington
(1957) | General Counsel since 2007 and Senior Vice President since 2006 | Attorney, ACC (1994 to present); Vice President, ACC (2005 to present); General Counsel, ACC (2007 to present). Also serves as General Counsel, ACIM, ACS, ACIS and other ACC subsidiaries; and Senior Vice President, ACIM and ACS |
C. Jean Wade
(1964) | Vice President,Treasurer and Chief Financial Officer since 2012 | Senior Vice President, ACS (2017 to present); Vice President, ACS (2000 to 2017) |
Robert J. Leach
(1966) | Vice President since 2006 and Assistant Treasurer since 2012 | Vice President, ACS (2000 to present) |
David H. Reinmiller
(1963) | Vice President since 2000 | Attorney, ACC (1994 to present). Also serves as Vice President, ACIM and ACS |
Ward D. Stauffer
(1960) | Secretary since 2005 | Attorney, ACC (2003 to present) |
|
|
| Approval of Management Agreement |
At a meeting held on June 19, 2018, the Fund’s Board of Directors (the "Board") unanimously approved the renewal of the management agreement pursuant to which American Century Investment Management, Inc. (the “Advisor”) acts as the investment advisor for the Fund. Under Section 15(c) of the Investment Company Act, contracts for investment advisory services are required to be reviewed, evaluated, and approved by a majority of a fund’s directors/trustees, including a majority of the independent Directors, each year. The Board regards this annual evaluation and renewal as one of its most important responsibilities.
The independent Directors have memorialized a statement regarding the relationship between their ongoing obligations to oversee and evaluate the performance of the Advisor and their annual consideration of renewal of the management agreement. In that statement, the independent Directors noted that their assessment of the Advisor’s performance is an ongoing process that takes place over the entire year and is informed by all of the extensive information that the Board and its committees receive and consider over time. This information, together with the additional materials provided specifically in connection with the review, are central to the Board’s assessment of the Advisor’s performance and its determination whether to renew the Fund’s management agreement.
Prior to its consideration of the renewal of the management agreement, the Board requested and reviewed extensive data and analysis relating to the proposed renewal. This information and analysis was compiled by the Advisor and certain independent providers of evaluation data concerning the Fund and the services provided to the Fund by the Advisor.
In connection with its consideration of the renewal of the management agreement, the Board’s review and evaluation of the services provided by the Advisor included, but was not limited to, the following:
| |
| • | the nature, extent, and quality of investment management, shareholder services, and other services provided to the Fund; |
| |
| • | the wide range of other programs and services the Advisor provides to the Fund and its shareholders on a routine and non-routine basis; |
| |
| • | the investment performance of the Fund, including data comparing the Fund’s performance to appropriate benchmarks and/or a peer group of other mutual funds with similar investment objectives and strategies; |
| |
| • | the cost of owning the Fund compared to the cost of owning similar funds; |
| |
| • | the Advisor’s compliance policies, procedures, and regulatory experience; |
| |
| • | financial data showing the cost of services provided to the Fund, the profitability of the Fund to the Advisor, and the overall profitability of the Advisor; |
| |
| • | strategic plans of the Advisor; |
| |
| • | any economies of scale associated with the Advisor’s management of the Fund and other accounts; |
| |
| • | services provided and charges to other investment management clients of the Advisor; |
| |
| • | acquired fund fees and expenses; |
| |
| • | payments and practices in connection with financial intermediaries holding shares of the Fund and the services provided by intermediaries in connection therewith; and |
| |
| • | any collateral benefits derived by the Advisor from the management of the Fund. |
In keeping with its practice, the Board held two in-person meetings to review and discuss the information provided in response to their request and held active discussions with the Advisor regarding the renewal of the management agreement. The independent Directors had the benefit of the advice of their independent counsel throughout the process.
Factors Considered
The Directors considered all of the information provided by the Advisor, the independent data providers, and the independent Directors’ independent counsel in connection with the approval. They determined that the information was sufficient for them to evaluate the management agreement for the Fund. In connection with their review, the Directors did not identify any single factor as being all-important or controlling and each Director may have attributed different levels of importance to different factors. In deciding to renew the management agreement, the Board based its decision on a number of factors, including the following:
Nature, Extent and Quality of Services - Generally. Under the management agreement, the Advisor is responsible for providing or arranging for all services necessary for the operation of the Fund. The Board noted that the Advisor provides or arranges at its own expense a wide variety of services including:
| |
| • | constructing and designing the Fund |
| |
| • | portfolio research and security selection |
| |
| • | initial capitalization/funding |
| |
| • | daily valuation of the Fund’s portfolio |
| |
| • | shareholder servicing and transfer agency, including shareholder confirmations, recordkeeping, and communications |
| |
| • | legal services (except the independent Directors’ counsel) |
| |
| • | regulatory and portfolio compliance |
| |
| • | marketing and distribution (except amounts paid by the Fund under Rule 12b-1 plans) |
The Board noted that many of these services have expanded over time in terms of both quantity and complexity in response to shareholder demands, competition in the industry, changing distribution channels, and the changing regulatory environment.
Investment Management, Shareholder, and Other Services. The nature of the investment management services provided to the Fund is quite complex and allows Fund shareholders access to professional money management, instant diversification of their investments within an asset class, the opportunity to easily diversify among asset classes by investing in or exchanging among various American Century Investments funds, and liquidity. In evaluating investment performance, the Board expects the Advisor to manage the Fund in accordance with its investment objectives and approved strategies. Further, the Directors recognize that the Advisor has an obligation to seek the best execution of fund trades. In providing these services, the Advisor utilizes teams of investment professionals (portfolio managers, analysts, research assistants, and securities traders) who require extensive information technology, research, training, compliance, and other systems to conduct their business. The Board, directly and through its Portfolio Committee, regularly reviews investment performance information for the Fund, together with comparative information for appropriate benchmarks and/or peer groups of similarly-managed funds, over different time horizons. The Directors also review detailed performance information during the management agreement approval process. If performance concerns are identified, the Fund receives special reviews until performance improves, during which the Board discusses with the Advisor the reasons for such results (e.g., market conditions, security selection) and any efforts being undertaken to improve performance. The Fund’s performance was below its benchmark for the one-year period reviewed by the Board. The Board found the investment management services provided by the Advisor to the Fund to be satisfactory and consistent with the management agreement.
Under the management agreement, the Advisor provides the Fund with a comprehensive package of transfer agency, shareholder, and other services. The Board, directly and through various committees of the Board, regularly reviews reports and evaluations of such services at its regular meetings. These reports include, but are not limited to, information regarding the operational efficiency and accuracy of the shareholder and transfer agency services provided, staffing levels, shareholder satisfaction (as measured by external as well as internal sources), technology support, new products and services offered to Fund shareholders, securities trading activities, portfolio valuation services, auditing services, and legal and operational compliance activities. The Board found the services provided by the Advisor to the Fund under the management agreement to be competitive and of high quality.
Costs of Services and Profitability. The Advisor provides detailed information concerning its cost of providing various services to the Fund, its profitability in managing the Fund, its overall profitability, and its financial condition. The Directors have reviewed with the Advisor the methodology used to prepare this financial information. This information is considered in evaluating the Advisor’s financial condition, its ability to continue to provide services under the management agreement, and the reasonableness of the current management fee. The Board concluded that the Advisor’s profits were reasonable in light of the services provided to the Fund.
Economies of Scale. The Board also reviewed information provided by the Advisor regarding the possible existence of economies of scale in connection with the management of the Fund. The Board concluded that economies of scale are difficult to measure and predict with precision, especially on a fund-by-fund basis. The Board concluded that the Advisor is appropriately sharing economies of scale through its competitive fee structure, offering competitive fees from fund inception, and through reinvestment in its business to provide shareholders enhanced and expanded services.
Comparison to Other Funds’ Fees. The management agreement provides that the Fund pays the Advisor a single, all-inclusive (or unified) management fee for providing all services necessary for the management and operation of the Fund, other than brokerage expenses, expenses attributable to short sales, taxes, interest, extraordinary expenses, the fees and expenses of the Fund’s independent Directors (including their independent legal counsel), and expenses incurred in connection with the provision of shareholder services and distribution services under a plan adopted pursuant to Rule 12b-1 under the 1940 Act. Under the unified fee structure, the Advisor is responsible for providing all investment advisory, custody, audit, administrative, compliance, recordkeeping, marketing, and shareholder services, or arranging and supervising third parties to provide such services. By contrast, most other funds are charged a variety of fees, including an investment advisory fee, a transfer agency fee, an administrative fee, distribution charges, and other expenses. Other than their investment advisory fees and any applicable Rule 12b-1 distribution fees, all other components of the total fees charged by these other funds may be increased without shareholder approval. The Board believes the unified fee structure is a benefit to Fund shareholders because it clearly discloses to shareholders the cost of owning Fund shares, and, since the unified fee cannot be increased without a vote of Fund shareholders, it shifts to the Advisor the risk of increased costs of operating the Fund and provides a direct incentive to minimize administrative inefficiencies. Part of the Board’s analysis of fee levels involves reviewing certain evaluative data compiled by an independent provider and comparing the Fund’s unified fee to the total expense ratio of peer funds. The unified fee charged to shareholders of the Fund was slightly above the median of the total expense ratios of the Fund’s peer group. The Board concluded that the management fee paid by the Fund to the Advisor under the management agreement is reasonable in light of the services provided to the Fund.
Comparison to Fees and Services Provided to Other Clients of the Advisor. The Board also requested and received information from the Advisor concerning the nature of the services, fees, costs, and profitability of its advisory services to advisory clients other than the Fund. They observed that these varying types of client accounts require different services and involve different regulatory and entrepreneurial risks than the management of the Fund. The Board analyzed this
information and concluded that the fees charged and services provided to the Fund were reasonable by comparison.
Payments to Intermediaries. The Directors also requested and received a description of payments made to intermediaries by the Fund and the Advisor and services provided by intermediaries. These payments include various payments made by the Fund or the Advisor to different types of intermediaries and recordkeepers for distribution and service activities provided for the Fund. The Directors reviewed such information and received representations from the Advisor that all such payments by the Fund were made pursuant to the Fund’s Rule 12b-1 Plan and that all such payments by the Advisor were made from the Advisor’s resources and reasonable profits. The Board found such payments to be reasonable in scope and purpose.
Collateral or “Fall-Out” Benefits Derived by the Advisor. The Board considered the existence of collateral benefits the Advisor may receive as a result of its relationship with the Fund. The Board noted that the Advisor’s primary business is managing mutual funds and it generally does not use fund or shareholder information to generate profits in other lines of business, and therefore does not derive any significant collateral benefits from them. The Board noted that the Advisor may receive proprietary research from broker-dealers that execute fund portfolio transactions. The Board also determined that the Advisor is able to provide investment management services to certain clients other than the Fund, at least in part, due to its existing infrastructure built to serve the fund complex. The Board noted that the assets of those other accounts are, where applicable, included with the assets of the Fund to determine breakpoints in the management fee schedule.
Existing Relationship. The Board also considered whether there was any reason for not continuing the existing arrangement with the Advisor. In this regard, the Board was mindful of the potential disruptions of the Fund’s operations and various risks, uncertainties, and other effects that could occur as a result of a decision not to continue such relationship. In particular, the Board recognized that most shareholders have invested in the Fund on the strength of the Advisor’s industry standing and reputation and in the expectation that the Advisor will have a continuing role in providing advisory services to the Fund.
Conclusion of the Directors. As a result of this process, the Board, including all of the independent Directors and assisted by the advice of independent legal counsel, taking into account all of the factors discussed above and the information provided by the Advisor and others in connection with its review and throughout the year, concluded that the management agreement between the Fund and the Advisor is fair and reasonable in light of the services provided and should be renewed.
Retirement Account Information
As required by law, distributions you receive from certain retirement accounts are subject to federal income tax withholding, unless you elect not to have withholding apply*. Tax will be withheld on the total amount withdrawn even though you may be receiving amounts that are not subject to withholding, such as nondeductible contributions. In such case, excess amounts of withholding could occur. You may adjust your withholding election so that a greater or lesser amount will be withheld.
If you don’t want us to withhold on this amount, you must notify us to not withhold the federal income tax. You may notify us in writing or in certain situations by telephone or through other electronic means. For systematic withdrawals, your withholding election will remain in effect until revoked or changed by filing a new election. You have the right to revoke your election at any time and change your withholding percentage for future distributions.
Remember, even if you elect not to have income tax withheld, you are liable for paying income tax on the taxable portion of your withdrawal. If you elect not to have income tax withheld or you don’t have enough income tax withheld, you may be responsible for payment of estimated tax. You may incur penalties under the estimated tax rules if your withholding and estimated tax payments are not sufficient. You can reduce or defer the income tax on a distribution by directly or indirectly rolling such distribution over to another IRA or eligible plan. You should consult your tax advisor for additional information.
State tax will be withheld if, at the time of your distribution, your address is within one of the mandatory withholding states and you have federal income tax withheld (or as otherwise required by state law). State taxes will be withheld from your distribution in accordance with the respective state rules.
*Some 403(b), 457 and qualified retirement plan distributions may be subject to 20% mandatory withholding, as they are subject to special tax and withholding rules. Your plan administrator or plan sponsor is required to provide you with a special tax notice explaining those rules at the time you request a distribution. If applicable, federal and/or state taxes may be withheld from your distribution amount.
Proxy Voting Policies
Descriptions of the principles and policies that the fund's investment advisor uses in exercising the voting rights associated with the securities purchased and/or held by the fund are available without charge, upon request, by calling 1-800-345-2021 or visiting the "About Us" page of American Century Investments’ website at americancentury.com. A description of the policies is also available on the Securities and Exchange Commission’s website at sec.gov. Information regarding how the investment advisor voted proxies relating to portfolio securities during the most recent 12-month period ended June 30 is available on the "About Us" page at americancentury.com. It is also available at sec.gov.
Quarterly Portfolio Disclosure
The fund files its complete schedule of portfolio holdings with the Securities and Exchange Commission (SEC) for the first and third quarters of each fiscal year on Form N-Q. The fund’s Forms N-Q are available on the SEC’s website at sec.gov, and may be reviewed and copied at the SEC’s Public Reference Room in Washington, DC. Information on the operation of the Public Reference Room may be obtained by calling 1-800-SEC-0330. The fund also makes its complete schedule of portfolio holdings for the most recent quarter of its fiscal year available on its website at americancentury.com and, upon request, by calling 1-800-345-2021.
Other Tax Information
The following information is provided pursuant to provisions of the Internal Revenue Code.
The fund hereby designates up to the maximum amount allowable as qualified dividend income for
the fiscal year ended June 30, 2018.
For corporate taxpayers, the fund hereby designates $6,468,448, or up to the maximum amount
allowable, of ordinary income distributions paid during the fiscal year ended June 30, 2018 as
qualified for the corporate dividends received deduction.
The fund hereby designates $5,238,065 as qualified short-term capital gain distributions for purposes of Internal Revenue Code Section 871 for the fiscal year ended June 30, 2018.
The fund hereby designates $11,510,482, or up to the maximum amount allowable, as long-term capital gain distributions (20% rate gain distributions) for the fiscal year ended June 30, 2018.
|
| | |
| |
| | | |
| Contact Us | americancentury.com | |
| Automated Information Line | 1-800-345-8765 | |
| Investor Services Representative | 1-800-345-2021
or 816-531-5575 | |
| Investors Using Advisors | 1-800-378-9878 | |
Business, Not-For-Profit, Employer-Sponsored
Retirement Plans | 1-800-345-3533 | |
Banks and Trust Companies, Broker-Dealers,
Financial Professionals, Insurance Companies | 1-800-345-6488 | |
| Telecommunications Relay Service for the Deaf | 711 | |
| | | |
| American Century Quantitative Equity Funds, Inc. | |
| | | |
Investment Advisor: American Century Investment Management, Inc. Kansas City, Missouri | |
| | | |
| This report and the statements it contains are submitted for the general information of our shareholders. The report is not authorized for distribution to prospective investors unless preceded or accompanied by an effective prospectus. | |
| | | |
©2018 American Century Proprietary Holdings, Inc. All rights reserved.
CL-ANN-93000 1808 | |
��
|
| |
| | |
| | Annual Report |
| | |
| | June 30, 2018 |
| | |
| | NT Equity Growth Fund |
| | G Class (ACLEX) |
|
| | |
| Performance | 2 |
|
| Portfolio Commentary | |
|
| Fund Characteristics | |
|
| Shareholder Fee Example | |
|
| Schedule of Investments | |
|
| Statement of Assets and Liabilities | |
|
| Statement of Operations | |
|
| Statement of Changes in Net Assets | |
|
| Notes to Financial Statements | |
|
| Financial Highlights | |
|
| Report of Independent Registered Public Accounting Firm | |
|
| Management | |
|
| Approval of Management Agreement | |
|
| Additional Information | |
|
Any opinions expressed in this report reflect those of the author as of the date of the report, and do not necessarily represent the opinions of American Century Investments® or any other person in the American Century Investments organization. Any such opinions are subject to change at any time based upon market or other conditions and American Century Investments disclaims any responsibility to update such opinions. These opinions may not be relied upon as investment advice and, because investment decisions made by American Century Investments funds are based on numerous factors, may not be relied upon as an indication of trading intent on behalf of any American Century Investments fund. Security examples are used for representational purposes only and are not intended as recommendations to purchase or sell securities. Performance information for comparative indices and securities is provided to American Century Investments by third party vendors. To the best of American Century Investments’ knowledge, such information is accurate at the time of printing.
|
| | | | | |
| Total Returns as of June 30, 2018 |
| | | | Average Annual Returns | |
| | Ticker Symbol | 1 year | 5 years | 10 years | Inception Date |
| G Class | ACLEX | 16.11% | 12.12% | 9.38% | 5/12/06 |
| S&P 500 Index | — | 14.37% | 13.41% | 10.16% | — |
Fund returns would have been lower if a portion of the fees had not been waived.
Prior to July 31, 2017, the G Class was referred to as the Institutional Class.
|
|
| Growth of $10,000 Over 10 Years |
| $10,000 investment made June 30, 2008 |
|
| |
| Value on June 30, 2018 |
| | G Class — $24,514 |
| |
| | S&P 500 Index — $26,340 |
| |
Ending value of G Class would have been lower if a portion of the fees had not been waived.
|
|
| Total Annual Fund Operating Expenses |
G Class 0.47% |
The total annual fund operating expenses shown is as stated in the fund’s prospectus current as of the date of this report. The prospectus may vary from the expense ratio shown elsewhere in this report because it is based on a different time period, includes acquired fund fees and expenses, and, if applicable, does not include fee waivers or expense reimbursements.
Data presented reflect past performance. Past performance is no guarantee of future results. Current performance may be higher or lower than the performance shown. Total returns for periods less than one year are not annualized. Investment return and principal value will fluctuate, and redemption value may be more or less than original cost. Data assumes reinvestment of dividends and capital gains, and none of the charts reflect the deduction of taxes that a shareholder would pay on fund distributions or the redemption of fund shares. To obtain performance data current to the most recent month end, please call 1-800-345-2021 or visit americancentury.com. For additional information about the fund, please consult the prospectus.
Portfolio Managers: Claudia Musat and Steven Rossi
Performance Summary
NT Equity Growth returned 16.11%* for the fiscal year ended June 30, 2018, compared with the 14.37% return of its benchmark, the S&P 500 Index.
NT Equity Growth advanced during the fiscal year, outperforming its benchmark, the S&P 500 Index. Security selection in the industrials and consumer staples sectors and positioning in the consumer discretionary sector contributed the most to fund performance, while health care and energy positions detracted from relative performance.
NT Equity Growth’s stock selection process incorporates factors of valuation, quality, growth, and sentiment, while striving to minimize unintended risks along industries and other risk characteristics. For the fiscal year, the net factor contribution was positive, with quality, growth, and sentiment helping the most, while valuation detracted.
Stock Choices Across Several Sectors Benefited Relative Returns
Stock choices in industrials were the largest drivers of the fund’s 12-month results. An underweight position to industrial conglomerate General Electric was a top contributor for the period. We have since exited the position. Avoidance of many relatively poor-performing stocks within the airlines, air freight and logistics, and building products industries also contributed.
Positioning within consumer staples was also beneficial to relative returns. Avoidance of tobacco companies was additive since several struggled during the period such as Philip Morris International and Altria Group. As consumer attitudes towards tobacco change, Philip Morris had trouble launching its new smokeless cigarette product line, which hurt the stock. In addition, positioning within the beverages and food products industries also contributed to relative performance. Underweights to PepsiCo and The Coca-Cola Company, which have also been under pressure due to shifting consumer preferences, benefited results. We have since closed our positions in both companies.
Stock choices in the consumer discretionary sector also helped returns, particularly within the hotels, restaurants, and leisure industry. A portfolio-only position in Vail Resorts, a hospitality and resort company that has been purchasing land over the past year, was a strong contributor within the industry. Avoiding or underweighting several positions within media also helped. An underweight to Comcast was one of the largest contributing positions to relative returns within the sector. We have since exited the position. Several textiles, apparel, and luxury goods companies also contributed, such as Deckers Outdoor. The outdoor goods and apparel company’s stock price rose during the period from strong quarterly earnings and ended the 12-month period as one of the top-ten contributing stocks.
Health Care and Energy Detracted
Positioning within the health care sector was the largest overall detractor from relative returns during the period. Stock selection within health care equipment and supplies was the most prominent source of underperformance. Zimmer Biomet Holdings was a leading detractor from relative performance in the industry as were overweights to Hologic and The Cooper Companies. We have since exited these positions. Elsewhere in the sector, an overweight to biotechnology firm Celgene was a significant detractor.
*Fund returns would have been lower if a portion of fees had not been waived.
Stock selection within the energy sector also hurt relative results. Security selection decisions within the energy equipment and services and oil, gas, and consumable fuels industries dampened returns.
A Look Ahead
Our disciplined, objective, and systematic investment strategy is designed to take advantage of opportunities at the individual company level. We believe this approach is the most powerful way to capitalize on market inefficiencies that lead to the mispricing of individual stocks. Our strategy is designed to provide investors with well-diversified and risk-managed exposure to broad U.S. equities. As such, we do not see significant deviations in sector weightings versus the S&P 500 Index. Nevertheless, we can point to select sectors and industries where we are finding more or less investment opportunity.
At period-end, information technology remains the most overweight sector. Software and services stocks represent one of the most attractive industry groups we see. Semiconductor and semiconductor equipment companies also scored very highly along multiple dimensions of our stock selection model. Consumer discretionary is also attractive, with consumer services companies are a significant overweight, followed by the consumer durables and apparel industry group. Conversely, our utilities sector underweight position reflects a lack of opportunity in this area across most factors in the stock selection model. In addition, our underweight in the consumer staples sector derives in part from our lack of exposure to the food, beverage, and tobacco industry group, which scores poorly on growth, quality, and sentiment. Elsewhere in the sector, companies in the food and staples retailing industry group score poorly on our growth metrics.
|
| |
| JUNE 30, 2018 |
| Top Ten Holdings | % of net assets |
| Microsoft Corp. | 4.2% |
| Alphabet, Inc., Class A | 3.8% |
| Amazon.com, Inc. | 3.7% |
| Apple, Inc. | 3.3% |
| Facebook, Inc., Class A | 2.8% |
| JPMorgan Chase & Co. | 2.4% |
| UnitedHealth Group, Inc. | 1.9% |
| Chevron Corp. | 1.9% |
| Pfizer, Inc. | 1.8% |
| Bank of America Corp. | 1.7% |
| | |
| Top Five Industries | % of net assets |
| Software | 8.0% |
| Internet Software and Services | 7.3% |
| Banks | 7.2% |
| Oil, Gas and Consumable Fuels | 5.4% |
| Semiconductors and Semiconductor Equipment | 5.3% |
| | |
| Types of Investments in Portfolio | % of net assets |
| Common Stocks | 98.8% |
| Temporary Cash Investments | 1.2% |
| Other Assets and Liabilities | —* |
*Category is less than 0.05% of total net assets.
Fund shareholders may incur two types of costs: (1) transaction costs, including sales charges (loads) on purchase payments and redemption/exchange fees; and (2) ongoing costs, including management fees; distribution and service (12b-1) fees; and other fund expenses. This example is intended to help you understand your ongoing costs (in dollars) of investing in your fund and to compare these costs with the ongoing cost of investing in other mutual funds.
The example is based on an investment of $1,000 made at the beginning of the period and held for the entire period from January 1, 2018 to June 30, 2018.
Actual Expenses
The table provides information about actual account values and actual expenses for each class. You may use the information, together with the amount you invested, to estimate the expenses that you paid over the period. First, identify the share class you own. Then simply divide your account value by $1,000 (for example, an $8,600 account value divided by $1,000 = 8.6), then multiply the result by the number under the heading “Expenses Paid During Period” to estimate the expenses you paid on your account during this period.
Hypothetical Example for Comparison Purposes
The table also provides information about hypothetical account values and hypothetical expenses based on the actual expense ratio of each class of your fund and an assumed rate of return of 5% per year before expenses, which is not the actual return of a fund’s share class. The hypothetical account values and expenses may not be used to estimate the actual ending account balance or expenses you paid for the period. You may use this information to compare the ongoing costs of investing in your fund and other funds. To do so, compare this 5% hypothetical example with the 5% hypothetical examples that appear in the shareholder reports of the other funds.
Please note that the expenses shown in the table are meant to highlight your ongoing costs only and do not reflect any transactional costs, such as sales charges (loads) or redemption/exchange fees. Therefore, the table is useful in comparing ongoing costs only, and will not help you determine the relative total costs of owning different funds. In addition, if these transactional costs were included, your costs would have been higher.
|
| | | | |
| | Beginning
Account Value
1/1/18 | Ending
Account Value
6/30/18 | Expenses Paid
During Period(1)
1/1/18 - 6/30/18 |
Annualized
Expense Ratio(1) |
| Actual | | | | |
| G Class | $1,000 | $1,036.80 | $0.05 | 0.01% |
| Hypothetical | | | | |
| G Class | $1,000 | $1,024.74 | $0.05 | 0.01% |
| |
| (1) | Expenses are equal to the class's annualized expense ratio listed in the table above, multiplied by the average account value over the period, multiplied by 181, the number of days in the most recent fiscal half-year, divided by 365, to reflect the one-half year period. Annualized expense ratio reflects actual expenses, including any applicable fee waivers or expense reimbursements and excluding any acquired fund fees and expenses. |
JUNE 30, 2018
|
| | | | | |
| | Shares | Value |
| COMMON STOCKS — 98.8% | | |
| Aerospace and Defense — 4.7% | | |
| Boeing Co. (The) | 64,266 |
| $ | 21,561,885 |
|
| Curtiss-Wright Corp. | 31,339 |
| 3,729,968 |
|
| General Dynamics Corp. | 83,488 |
| 15,562,998 |
|
| Lockheed Martin Corp. | 59,540 |
| 17,589,902 |
|
| Raytheon Co. | 53,955 |
| 10,423,027 |
|
| Textron, Inc. | 145,792 |
| 9,609,151 |
|
| | | 78,476,931 |
|
| Banks — 7.2% | | |
| Bank of America Corp. | 1,022,661 |
| 28,828,814 |
|
| BB&T Corp. | 6,519 |
| 328,818 |
|
| Citigroup, Inc. | 4,505 |
| 301,475 |
|
| Fifth Third Bancorp | 10,722 |
| 307,721 |
|
| JPMorgan Chase & Co. | 384,163 |
| 40,029,785 |
|
| SunTrust Banks, Inc. | 245,880 |
| 16,232,998 |
|
| U.S. Bancorp | 359,302 |
| 17,972,286 |
|
| Wells Fargo & Co. | 288,926 |
| 16,018,057 |
|
| | | 120,019,954 |
|
| Beverages — 1.7% | | |
| Constellation Brands, Inc., Class A | 71,151 |
| 15,572,819 |
|
| Molson Coors Brewing Co., Class B | 180,487 |
| 12,280,336 |
|
| | | 27,853,155 |
|
| Biotechnology — 4.4% | | |
| AbbVie, Inc. | 207,568 |
| 19,231,175 |
|
Alexion Pharmaceuticals, Inc.(1) | 38,328 |
| 4,758,421 |
|
| Amgen, Inc. | 128,413 |
| 23,703,756 |
|
Biogen, Inc.(1) | 60,582 |
| 17,583,320 |
|
Celgene Corp.(1) | 101,330 |
| 8,047,628 |
|
| | | 73,324,300 |
|
| Building Products — 0.3% | | |
| Owens Corning | 71,339 |
| 4,520,752 |
|
| Capital Markets — 1.5% | | |
| Affiliated Managers Group, Inc. | 49,738 |
| 7,394,548 |
|
| BGC Partners, Inc., Class A | 94,677 |
| 1,071,744 |
|
| Evercore, Inc., Class A | 116,905 |
| 12,327,632 |
|
| MSCI, Inc. | 27,002 |
| 4,466,941 |
|
| | | 25,260,865 |
|
| Chemicals — 1.6% | | |
| Air Products & Chemicals, Inc. | 69,684 |
| 10,851,889 |
|
| Eastman Chemical Co. | 137,950 |
| 13,789,482 |
|
| Huntsman Corp. | 27,698 |
| 808,782 |
|
|
| | | | | |
| | Shares | Value |
| WR Grace & Co. | 16,301 |
| $ | 1,195,026 |
|
| | | 26,645,179 |
|
| Commercial Services and Supplies — 0.2% | | |
| MSA Safety, Inc. | 27,885 |
| 2,686,441 |
|
| Pitney Bowes, Inc. | 102,049 |
| 874,560 |
|
| | | 3,561,001 |
|
| Communications Equipment — 1.7% | | |
| Cisco Systems, Inc. | 653,435 |
| 28,117,308 |
|
| Consumer Finance — 2.7% | | |
| American Express Co. | 185,754 |
| 18,203,892 |
|
| Discover Financial Services | 187,562 |
| 13,206,241 |
|
| Synchrony Financial | 425,627 |
| 14,207,429 |
|
| | | 45,617,562 |
|
| Diversified Consumer Services — 0.9% | | |
| Graham Holdings Co., Class B | 1,531 |
| 897,319 |
|
Grand Canyon Education, Inc.(1) | 23,467 |
| 2,619,152 |
|
| H&R Block, Inc. | 501,542 |
| 11,425,127 |
|
| | | 14,941,598 |
|
| Diversified Financial Services — 0.7% | | |
Berkshire Hathaway, Inc., Class B(1) | 64,417 |
| 12,023,433 |
|
| Diversified Telecommunication Services — 0.5% | | |
| AT&T, Inc. | 192,724 |
| 6,188,362 |
|
| Verizon Communications, Inc. | 30,012 |
| 1,509,904 |
|
| | | 7,698,266 |
|
| Electric Utilities — 0.1% | | |
| Portland General Electric Co. | 56,289 |
| 2,406,918 |
|
| Energy Equipment and Services — 1.0% | | |
| Halliburton Co. | 361,121 |
| 16,272,112 |
|
| Equity Real Estate Investment Trusts (REITs) — 3.1% | | |
| Gaming and Leisure Properties, Inc. | 156,848 |
| 5,615,158 |
|
| Highwoods Properties, Inc. | 40,249 |
| 2,041,832 |
|
| Host Hotels & Resorts, Inc. | 16,020 |
| 337,541 |
|
| Park Hotels & Resorts, Inc. | 412,011 |
| 12,619,897 |
|
| PotlatchDeltic Corp. | 248,158 |
| 12,618,834 |
|
| PS Business Parks, Inc. | 7,032 |
| 903,612 |
|
| Senior Housing Properties Trust | 62,951 |
| 1,138,784 |
|
| Weingarten Realty Investors | 102,458 |
| 3,156,731 |
|
| Weyerhaeuser Co. | 380,945 |
| 13,889,255 |
|
| | | 52,321,644 |
|
| Food Products — 0.8% | | |
| Conagra Brands, Inc. | 35,076 |
| 1,253,265 |
|
| Mondelez International, Inc., Class A | 120,627 |
| 4,945,707 |
|
Nomad Foods Ltd.(1) | 109,958 |
| 2,110,094 |
|
| Pinnacle Foods, Inc. | 65,744 |
| 4,277,305 |
|
| | | 12,586,371 |
|
| Health Care Equipment and Supplies — 3.6% | | |
| Abbott Laboratories | 334,557 |
| 20,404,631 |
|
|
| | | | | |
| | Shares | Value |
Edwards Lifesciences Corp.(1) | 10,979 |
| $ | 1,598,213 |
|
Haemonetics Corp.(1) | 22,356 |
| 2,004,886 |
|
| Hill-Rom Holdings, Inc. | 73,564 |
| 6,425,080 |
|
Intuitive Surgical, Inc.(1) | 41,200 |
| 19,713,376 |
|
| Medtronic plc | 18,490 |
| 1,582,929 |
|
| STERIS plc | 32,315 |
| 3,393,398 |
|
Varian Medical Systems, Inc.(1) | 45,011 |
| 5,118,651 |
|
| | | 60,241,164 |
|
| Health Care Providers and Services — 2.3% | | |
| Cigna Corp. | 18,769 |
| 3,189,792 |
|
Express Scripts Holding Co.(1) | 40,313 |
| 3,112,567 |
|
| UnitedHealth Group, Inc. | 132,260 |
| 32,448,668 |
|
| | | 38,751,027 |
|
| Health Care Technology — 0.6% | | |
Cerner Corp.(1) | 179,232 |
| 10,716,281 |
|
| Hotels, Restaurants and Leisure — 2.6% | | |
| Las Vegas Sands Corp. | 188,193 |
| 14,370,417 |
|
| Marriott International, Inc., Class A | 117,510 |
| 14,876,766 |
|
| Vail Resorts, Inc. | 52,961 |
| 14,521,377 |
|
| | | 43,768,560 |
|
| Household Durables — 0.1% | | |
| Garmin Ltd. | 26,292 |
| 1,603,812 |
|
| Household Products — 0.9% | | |
| Kimberly-Clark Corp. | 143,486 |
| 15,114,815 |
|
| Procter & Gamble Co. (The) | 2,528 |
| 197,336 |
|
| | | 15,312,151 |
|
| Independent Power and Renewable Electricity Producers — 0.1% | |
| NRG Energy, Inc. | 75,150 |
| 2,307,105 |
|
| Industrial Conglomerates — 1.2% | | |
| Honeywell International, Inc. | 139,775 |
| 20,134,589 |
|
| Insurance — 1.1% | | |
| First American Financial Corp. | 33,181 |
| 1,716,121 |
|
| Hartford Financial Services Group, Inc. (The) | 273,914 |
| 14,005,223 |
|
| Torchmark Corp. | 39,680 |
| 3,230,349 |
|
| | | 18,951,693 |
|
| Internet and Direct Marketing Retail — 3.7% | | |
Amazon.com, Inc.(1) | 36,399 |
| 61,871,020 |
|
| Internet Software and Services — 7.3% | | |
Alphabet, Inc., Class A(1) | 55,762 |
| 62,965,893 |
|
eBay, Inc.(1) | 180,450 |
| 6,543,117 |
|
Facebook, Inc., Class A(1) | 244,384 |
| 47,488,699 |
|
| LogMeIn, Inc. | 41,105 |
| 4,244,091 |
|
| | | 121,241,800 |
|
| IT Services — 2.7% | | |
Acxiom Corp.(1) | 16,383 |
| 490,671 |
|
| DXC Technology Co. | 19,674 |
| 1,585,921 |
|
| International Business Machines Corp. | 151,124 |
| 21,112,023 |
|
|
| | | | | |
| | Shares | Value |
Teradata Corp.(1) | 9,549 |
| $ | 383,392 |
|
| Total System Services, Inc. | 144,440 |
| 12,208,069 |
|
| Visa, Inc., Class A | 72,779 |
| 9,639,579 |
|
| | | 45,419,655 |
|
Leisure Products† | | |
| Brunswick Corp. | 5,583 |
| 359,992 |
|
| Machinery — 2.7% | | |
| Caterpillar, Inc. | 131,598 |
| 17,853,901 |
|
| Ingersoll-Rand plc | 149,947 |
| 13,454,744 |
|
| Oshkosh Corp. | 89,387 |
| 6,285,694 |
|
| PACCAR, Inc. | 17,109 |
| 1,060,073 |
|
| Toro Co. (The) | 98,392 |
| 5,928,118 |
|
| | | 44,582,530 |
|
| Media — 0.6% | | |
| CBS Corp., Class B | 156,308 |
| 8,787,636 |
|
| Walt Disney Co. (The) | 9,733 |
| 1,020,115 |
|
| | | 9,807,751 |
|
| Multiline Retail — 1.7% | | |
| Kohl's Corp. | 216,742 |
| 15,800,492 |
|
| Macy's, Inc. | 330,298 |
| 12,363,054 |
|
| | | 28,163,546 |
|
| Oil, Gas and Consumable Fuels — 5.4% | | |
| Chevron Corp. | 245,904 |
| 31,089,643 |
|
| Exxon Mobil Corp. | 142,732 |
| 11,808,218 |
|
| HollyFrontier Corp. | 187,251 |
| 12,813,586 |
|
| Marathon Petroleum Corp. | 231,540 |
| 16,244,846 |
|
| PBF Energy, Inc., Class A | 38,581 |
| 1,617,701 |
|
| Phillips 66 | 145,557 |
| 16,347,507 |
|
| | | 89,921,501 |
|
| Paper and Forest Products — 0.3% | | |
| Louisiana-Pacific Corp. | 177,804 |
| 4,839,825 |
|
| Personal Products — 0.5% | | |
Edgewell Personal Care Co.(1) | 165,065 |
| 8,329,180 |
|
| Pharmaceuticals — 4.2% | | |
| Allergan plc | 36,382 |
| 6,065,607 |
|
| Bristol-Myers Squibb Co. | 33,934 |
| 1,877,907 |
|
| Johnson & Johnson | 209,700 |
| 25,444,998 |
|
| Merck & Co., Inc. | 110,193 |
| 6,688,715 |
|
| Pfizer, Inc. | 809,606 |
| 29,372,506 |
|
| | | 69,449,733 |
|
| Professional Services — 0.6% | | |
| Robert Half International, Inc. | 165,150 |
| 10,751,265 |
|
| Real Estate Management and Development — 0.6% | | |
| Jones Lang LaSalle, Inc. | 63,460 |
| 10,533,725 |
|
| Road and Rail — 0.1% | | |
| Ryder System, Inc. | 32,687 |
| 2,348,888 |
|
| | | |
|
| | | | | |
| | Shares | Value |
| Semiconductors and Semiconductor Equipment — 5.3% | | |
| Applied Materials, Inc. | 325,667 |
| $ | 15,042,559 |
|
| Broadcom, Inc. | 61,512 |
| 14,925,271 |
|
| Intel Corp. | 577,625 |
| 28,713,739 |
|
| Lam Research Corp. | 84,901 |
| 14,675,138 |
|
| Skyworks Solutions, Inc. | 75,555 |
| 7,302,391 |
|
| Texas Instruments, Inc. | 77,956 |
| 8,594,649 |
|
| | | 89,253,747 |
|
| Software — 8.0% | | |
| Activision Blizzard, Inc. | 171,478 |
| 13,087,201 |
|
Adobe Systems, Inc.(1) | 94,210 |
| 22,969,340 |
|
Electronic Arts, Inc.(1) | 117,736 |
| 16,603,131 |
|
| Microsoft Corp. | 707,305 |
| 69,747,346 |
|
| Oracle Corp. (New York) | 219,676 |
| 9,678,925 |
|
Synopsys, Inc.(1) | 26,695 |
| 2,284,291 |
|
| | | 134,370,234 |
|
| Specialty Retail — 2.2% | | |
AutoZone, Inc.(1) | 20,919 |
| 14,035,185 |
|
| Best Buy Co., Inc. | 105,740 |
| 7,886,089 |
|
| Ross Stores, Inc. | 180,281 |
| 15,278,815 |
|
| | | 37,200,089 |
|
| Technology Hardware, Storage and Peripherals — 3.7% | | |
| Apple, Inc. | 302,008 |
| 55,904,701 |
|
| Western Digital Corp. | 78,998 |
| 6,115,235 |
|
| | | 62,019,936 |
|
| Textiles, Apparel and Luxury Goods — 2.6% | | |
Deckers Outdoor Corp.(1) | 136,443 |
| 15,403,050 |
|
Michael Kors Holdings Ltd.(1) | 214,867 |
| 14,310,142 |
|
| Tapestry, Inc. | 303,405 |
| 14,172,048 |
|
| | | 43,885,240 |
|
| Trading Companies and Distributors — 0.2% | | |
United Rentals, Inc.(1) | 19,921 |
| 2,940,738 |
|
| Wireless Telecommunication Services — 0.8% | | |
T-Mobile US, Inc.(1) | 213,026 |
| 12,728,304 |
|
TOTAL COMMON STOCKS
(Cost $1,277,806,667) | | 1,653,452,430 |
|
| TEMPORARY CASH INVESTMENTS — 1.2% | | |
| Repurchase Agreement, BMO Capital Markets Corp., (collateralized by various U.S. Treasury obligations, 1.375% - 3.75%, 2/15/19 - 11/15/47, valued at $10,969,011), in a joint trading account at 1.75%, dated 6/29/18, due 7/2/18 (Delivery value $10,749,139) | | 10,747,572 |
|
| Repurchase Agreement, Fixed Income Clearing Corp., (collateralized by various U.S. Treasury obligations, 2.75%, 2/15/28, valued at $9,138,231), at 0.90%, dated 6/29/18, due 7/2/18 (Delivery value $8,958,672) | | 8,958,000 |
|
|
| | | | | |
| | Shares | Value |
| State Street Institutional U.S. Government Money Market Fund, Premier Class | 76,094 |
| $ | 76,094 |
|
TOTAL TEMPORARY CASH INVESTMENTS
(Cost $19,781,666) | | 19,781,666 |
|
TOTAL INVESTMENT SECURITIES — 100.0%
(Cost $1,297,588,333) | | 1,673,234,096 |
|
OTHER ASSETS AND LIABILITIES† | | (394,321 | ) |
| TOTAL NET ASSETS — 100.0% | | $ | 1,672,839,775 |
|
|
| | |
| NOTES TO SCHEDULE OF INVESTMENTS |
† Category is less than 0.05% of total net assets.
See Notes to Financial Statements.
|
|
| Statement of Assets and Liabilities |
|
| | | |
| JUNE 30, 2018 | |
| Assets | |
| Investment securities, at value (cost of $1,297,588,333) | $ | 1,673,234,096 |
|
| Receivable for investments sold | 7,245,408 |
|
| Dividends and interest receivable | 1,610,484 |
|
| | 1,682,089,988 |
|
| | |
| Liabilities | |
| Payable for investments purchased | 8,262,723 |
|
| Payable for capital shares redeemed | 987,490 |
|
| | 9,250,213 |
|
| | |
| Net Assets | $ | 1,672,839,775 |
|
| | |
| G Class Capital Shares, $0.01 Par Value | |
| Shares authorized | 985,000,000 |
|
| Shares outstanding | 119,282,815 |
|
| | |
| Net Asset Value Per Share | $ | 14.02 |
|
| | |
| Net Assets Consist of: | |
| Capital (par value and paid-in surplus) | $ | 1,183,792,067 |
|
| Undistributed net realized gain | 113,401,945 |
|
| Net unrealized appreciation | 375,645,763 |
|
| | $ | 1,672,839,775 |
|
See Notes to Financial Statements.
|
| | | |
| YEAR ENDED JUNE 30, 2018 | |
| Investment Income (Loss) | |
| Income: | |
| Dividends (net of foreign taxes withheld of $1,044) | $ | 34,649,318 |
|
| Interest | 125,855 |
|
| | 34,775,173 |
|
| | |
| Expenses: | |
| Management fees | 8,056,407 |
|
| Directors' fees and expenses | 108,090 |
|
| Other expenses | 10,726 |
|
| | 8,175,223 |
|
| Fees waived | (7,383,099 | ) |
| | 792,124 |
|
| | |
| Net investment income (loss) | 33,983,049 |
|
| | |
| Realized and Unrealized Gain (Loss) | |
| Net realized gain (loss) on: | |
| Investment transactions | 164,698,675 |
|
| Futures contract transactions | 123,170 |
|
| | 164,821,845 |
|
| | |
| Change in net unrealized appreciation (depreciation) on investments | 71,664,277 |
|
| | |
| Net realized and unrealized gain (loss) | 236,486,122 |
|
| | |
| Net Increase (Decrease) in Net Assets Resulting from Operations | $ | 270,469,171 |
|
See Notes to Financial Statements.
|
|
| Statement of Changes in Net Assets |
|
| | | | | | |
| YEARS ENDED JUNE 30, 2018 AND JUNE 30, 2017 |
| Increase (Decrease) in Net Assets | June 30, 2018 | June 30, 2017 |
| Operations | | |
| Net investment income (loss) | $ | 33,983,049 |
| $ | 25,919,340 |
|
| Net realized gain (loss) | 164,821,845 |
| 94,080,270 |
|
| Change in net unrealized appreciation (depreciation) | 71,664,277 |
| 158,967,315 |
|
| Net increase (decrease) in net assets resulting from operations | 270,469,171 |
| 278,966,925 |
|
| | | |
| Distributions to Shareholders | | |
| From net investment income | (32,706,722 | ) | (25,334,765 | ) |
| From net realized gains | (99,893,791 | ) | — |
|
| Decrease in net assets from distributions | (132,600,513 | ) | (25,334,765 | ) |
| | | |
| Capital Share Transactions | | |
| Proceeds from shares sold | 80,237,665 |
| 185,621,609 |
|
| Proceeds from reinvestment of distributions | 132,600,513 |
| 25,334,765 |
|
| Payments for shares redeemed | (449,428,027 | ) | (256,712,800 | ) |
| Net increase (decrease) in net assets from capital share transactions | (236,589,849 | ) | (45,756,426 | ) |
| | | |
| Net increase (decrease) in net assets | (98,721,191 | ) | 207,875,734 |
|
| | | |
| Net Assets | | |
| Beginning of period | 1,771,560,966 |
| 1,563,685,232 |
|
| End of period | $ | 1,672,839,775 |
| $ | 1,771,560,966 |
|
| | | |
| Undistributed net investment income | — |
| $ | 846,591 |
|
| | | |
| Transactions in Shares of the Fund | | |
| Sold | 5,859,218 |
| 15,239,268 |
|
| Issued in reinvestment of distributions | 9,709,545 |
| 2,045,908 |
|
| Redeemed | (32,236,842 | ) | (20,979,841 | ) |
| Net increase (decrease) in shares of the fund | (16,668,079 | ) | (3,694,665 | ) |
See Notes to Financial Statements.
|
|
| Notes to Financial Statements |
JUNE 30, 2018
1. Organization
American Century Quantitative Equity Funds, Inc. (the corporation) is registered under the Investment Company Act of 1940, as amended (the 1940 Act), as an open-end management investment company and is organized as a Maryland corporation. NT Equity Growth Fund (the fund) is one fund in a series issued by the corporation. The fund’s investment objective is to seek long-term capital growth. The fund is not permitted to invest in securities issued by companies assigned the Global Industry Classification Standard or the Bloomberg Industry Classification Standard for the tobacco industry. The fund offers the G Class (formerly Institutional Class).
2. Significant Accounting Policies
The following is a summary of significant accounting policies consistently followed by the fund in preparation of its financial statements. The fund is an investment company and follows accounting and reporting guidance in accordance with accounting principles generally accepted in the United States of America. This may require management to make certain estimates and assumptions at the date of the financial statements. Actual results could differ from these estimates. Management evaluated the impact of events or transactions occurring through the date the financial statements were issued that would merit recognition or disclosure.
Investment Valuations — The fund determines the fair value of its investments and computes its net asset value per share at the close of regular trading (usually 4 p.m. Eastern time) on the New York Stock Exchange (NYSE) on each day the NYSE is open. The Board of Directors has adopted valuation policies and procedures to guide the investment advisor in the fund’s investment valuation process and to provide methodologies for the oversight of the fund’s pricing function.
Equity securities that are listed or traded on a domestic securities exchange are valued at the last reported sales price or at the official closing price as provided by the exchange. Equity securities traded on foreign securities exchanges are generally valued at the closing price of such securities on the exchange where primarily traded or at the close of the NYSE, if that is earlier. If no last sales price is reported, or if local convention or regulation so provides, the mean of the latest bid and asked prices may be used. Securities traded over-the-counter are valued at the mean of the latest bid and asked prices, the last sales price, or the official closing price.
Open-end management investment companies are valued at the reported net asset value per share. Repurchase agreements are valued at cost, which approximates fair value. Exchange-traded futures contracts are valued at the settlement price as provided by the appropriate exchange.
If the fund determines that the market price for an investment is not readily available or the valuation methods mentioned above do not reflect an investment’s fair value, such investment is valued as determined in good faith by the Board of Directors or its delegate, in accordance with policies and procedures adopted by the Board of Directors. In its determination of fair value, the fund may review several factors including, but not limited to, market information regarding the specific investment or comparable investments and correlation with other investment types, futures indices or general market indicators. Circumstances that may cause the fund to use these procedures to value an investment include, but are not limited to: an investment has been declared in default or is distressed; trading in a security has been suspended during the trading day or a security is not actively trading on its principal exchange; prices received from a regular pricing source are deemed unreliable; or there is a foreign market holiday and no trading occurred.
The fund monitors for significant events occurring after the close of an investment’s primary exchange but before the fund’s net asset value per share is determined. Significant events may include, but are not limited to: corporate announcements and transactions; governmental action and political unrest that could impact a specific investment or an investment sector; or armed conflicts, natural disasters and similar events that could affect investments in a specific country or region. The fund also monitors for significant fluctuations between domestic and foreign markets, as evidenced by the U.S. market or such other indicators that the Board of Directors, or its delegate, deems appropriate. If significant fluctuations in foreign markets are identified, the fund may apply a model-derived factor to the closing price of equity securities traded on foreign securities exchanges. The factor is based on observable market data as provided by an independent pricing service.
Security Transactions — Security transactions are accounted for as of the trade date. Net realized gains and losses are determined on the identified cost basis, which is also used for federal income tax purposes.
Investment Income — Dividend income less foreign taxes withheld, if any, is recorded as of the ex-dividend date. Distributions received on securities that represent a return of capital or long-term capital gain are recorded as a reduction of cost of investments and/or as a realized gain. The fund may estimate the components of distributions received that may be considered nontaxable distributions or long-term capital gain distributions for income tax purposes. Interest income is recorded on the accrual basis and includes accretion of discounts and amortization of premiums.
Repurchase Agreements — The fund may enter into repurchase agreements with institutions that American Century Investment Management, Inc. (ACIM) (the investment advisor) has determined are creditworthy pursuant to criteria adopted by the Board of Directors. The fund requires that the collateral, represented by securities, received in a repurchase transaction be transferred to the custodian in a manner sufficient to enable the fund to obtain those securities in the event of a default under the repurchase agreement. ACIM monitors, on a daily basis, the securities transferred to ensure the value, including accrued interest, of the securities under each repurchase agreement is equal to or greater than amounts owed to the fund under each repurchase agreement.
Joint Trading Account — Pursuant to an Exemptive Order issued by the Securities and Exchange Commission, the fund, along with certain other funds in the American Century Investments family of funds, may transfer uninvested cash balances into a joint trading account. These balances are invested in one or more repurchase agreements that are collateralized by U.S. Treasury or Agency obligations.
Segregated Assets — In accordance with the 1940 Act, the fund segregates assets on its books and records to cover certain types of investment securities and other financial instruments. ACIM monitors, on a daily basis, the securities segregated to ensure the fund designates a sufficient amount of liquid assets, marked-to-market daily. The fund may also receive assets or be required to pledge assets at the custodian bank or with a broker for collateral requirements.
Income Tax Status — It is the fund’s policy to distribute substantially all net investment income and net realized gains to shareholders and to otherwise qualify as a regulated investment company under provisions of the Internal Revenue Code. Accordingly, no provision has been made for income taxes. The fund files U.S. federal, state, local and non-U.S. tax returns as applicable. The fund's tax returns are subject to examination by the relevant taxing authority until expiration of the applicable statute of limitations, which is generally three years from the date of filing but can be longer in certain jurisdictions. At this time, management believes there are no uncertain tax positions which, based on their technical merit, would not be sustained upon examination and for which it is reasonably possible that the total amounts of unrecognized tax benefits will significantly change in the next twelve months.
Distributions to Shareholders — Distributions from net investment income, if any, are generally declared and paid quarterly. Distributions from net realized gains, if any, are generally declared and paid annually. The fund may elect to treat a portion of its payment to a redeeming shareholder, which represents the pro rata share of undistributed net investment income and net realized gains, as a distribution for federal income tax purposes (tax equalization).
Indemnifications — Under the corporation’s organizational documents, its officers and directors are indemnified against certain liabilities arising out of the performance of their duties to the fund. In addition, in the normal course of business, the fund enters into contracts that provide general indemnifications. The maximum exposure under these arrangements is unknown as this would involve future claims that may be made against a fund. The risk of material loss from such claims is considered by management to be remote.
3. Fees and Transactions with Related Parties
Certain officers and directors of the corporation are also officers and/or directors of American Century Companies, Inc. (ACC). The corporation’s investment advisor, ACIM, the corporation's distributor, American Century Investment Services, Inc., and the corporation’s transfer agent, American Century Services, LLC, are wholly owned, directly or indirectly, by ACC. Various funds issued by American Century Asset Allocation Portfolios, Inc. own, in aggregate, 100% of the shares of the fund. Related parties do not invest in the fund for the purpose of exercising management or control.
Management Fees — The corporation has entered into a management agreement with ACIM, under which ACIM provides the fund with investment advisory and management services in exchange for a single, unified
management fee (the fee). The agreement provides that all expenses of managing and operating the fund, except brokerage expenses, taxes, interest, fees and expenses of the independent directors (including legal counsel fees), and extraordinary expenses, will be paid by ACIM. The fee is computed and accrued daily based on the daily net assets of the fund and paid monthly in arrears. The fee consists of (1) an Investment Category Fee based on the daily net assets of the fund and certain other accounts managed by the investment advisor that are in the same broad investment category as the fund and (2) a Complex Fee based on the assets of all the funds in the American Century Investments family of funds. The rates for the Investment Category Fee range from 0.3380% to 0.5200%. The rates for the Complex Fee range from 0.0500% to 0.1100%. Effective July 31, 2017, the investment advisor agreed to waive the G Class's management fee in its entirety. The investment advisor expects this waiver to remain in effect permanently and cannot terminate it without the approval of the Board of Directors. The effective annual management fee for the period ended June 30, 2018 was 0.46% before waiver and 0.04% after waiver.
Directors' Fees and Expenses — The Board of Directors is responsible for overseeing the investment advisor’s management and operations of the fund. The directors receive detailed information about the fund and its investment advisor regularly throughout the year, and meet at least quarterly with management of the investment advisor to review reports about fund operations. The fund’s officers do not receive compensation from the fund.
Interfund Transactions — The fund may enter into security transactions with other American Century Investments funds and other client accounts of the investment advisor, in accordance with the 1940 Act rules and procedures adopted by the Board of Directors. The rules and procedures require, among other things, that these transactions be effected at the independent current market price of the security. During the period, the interfund purchases and sales were $20,986,731 and $17,375,477, respectively. The effect of interfund transactions on the Statement of Operations was $1,774,382 in net realized gain (loss) on investment transactions.
4. Investment Transactions
Purchases and sales of investment securities, excluding short-term investments, for the period ended
June 30, 2018 were $1,445,752,063 and $1,786,604,580, respectively.
5. Fair Value Measurements
The fund’s investments valuation process is based on several considerations and may use multiple inputs to determine the fair value of the investments held by the fund. In conformity with accounting principles generally accepted in the United States of America, the inputs used to determine a valuation are classified into three broad levels.
• Level 1 valuation inputs consist of unadjusted quoted prices in an active market for identical investments.
• Level 2 valuation inputs consist of direct or indirect observable market data (including quoted prices for comparable investments, evaluations of subsequent market events, interest rates, prepayment speeds, credit risk, etc.). These inputs also consist of quoted prices for identical investments initially expressed in local currencies that are adjusted through translation into U.S. dollars.
• Level 3 valuation inputs consist of unobservable data (including a fund’s own assumptions).
The level classification is based on the lowest level input that is significant to the fair valuation measurement. The valuation inputs are not necessarily an indication of the risks associated with investing in these securities or other financial instruments. There were no significant transfers between levels during the period.
The following is a summary of the level classifications as of period end. The Schedule of Investments provides additional information on the fund’s portfolio holdings.
|
| | | | | | | | |
| | Level 1 | Level 2 | Level 3 |
| Assets | | | |
| Investment Securities | | | |
| Common Stocks | $ | 1,653,452,430 |
| — |
| — |
|
| Temporary Cash Investments | 76,094 |
| $ | 19,705,572 |
| — |
|
| | $ | 1,653,528,524 |
| $ | 19,705,572 |
| — |
|
6. Derivative Instruments
Equity Price Risk — The fund is subject to equity price risk in the normal course of pursuing its investment objectives. A fund may enter into futures contracts based on an equity index in order to manage its exposure to changes in market conditions. A fund may purchase futures contracts to gain exposure to increases in market value or sell futures contracts to protect against a decline in market value. Upon entering into a futures contract, a fund is required to deposit either cash or securities in an amount equal to a certain percentage of the contract value (initial margin). Subsequent payments (variation margin) are made or received daily, in cash, by a fund. The variation margin is equal to the daily change in the contract value and is recorded as unrealized gains and losses. A fund recognizes a realized gain or loss when the contract is closed or expires. Net realized and unrealized gains or losses occurring during the holding period of futures contracts are a component of net realized gain (loss) on futures contract transactions and change in net unrealized appreciation (depreciation) on futures contracts, respectively. One of the risks of entering into futures contracts is the possibility that the change in value of the contract may not correlate with the changes in value of the underlying securities. During the period, the fund participated in equity price risk derivative instruments for temporary investment purposes.
At period end, the fund did not have any derivative instruments disclosed on the Statement of Assets and Liabilities. For the year ended June 30, 2018, the effect of equity price risk derivative instruments on the Statement of Operations was $123,170 in net realized gain (loss) on futures contract transactions.
7. Federal Tax Information
The tax character of distributions paid during the years ended June 30, 2018 and June 30, 2017 were as follows:
|
| | | | | | |
| | 2018 | 2017 |
| Distributions Paid From | | |
| Ordinary income | $ | 45,641,004 |
| $ | 25,334,765 |
|
| Long-term capital gains | $ | 86,959,509 |
| — |
|
The book-basis character of distributions made during the year from net investment income or net realized gains may differ from their ultimate characterization for federal income tax purposes. These differences reflect the differing character of certain income items and net realized gains and losses for financial statement and tax purposes, and may result in reclassification among certain capital accounts on the financial statements.
As of period end, the federal tax cost of investments and the components of distributable earnings on a tax-basis were as follows:
|
| | | |
| Federal tax cost of investments | $ | 1,301,126,049 |
|
| Gross tax appreciation of investments | $ | 398,562,533 |
|
| Gross tax depreciation of investments | (26,454,486 | ) |
| Net tax appreciation (depreciation) of investments | $ | 372,108,047 |
|
| Undistributed ordinary income | $ | 32,160,483 |
|
| Accumulated long-term gains | $ | 84,779,178 |
|
The difference between book-basis and tax-basis unrealized appreciation (depreciation) is attributable primarily to the tax deferral of losses on wash sales.
|
| | | | | | | | | | | | | | | | | |
| For a Share Outstanding Throughout the Years Ended June 30 (except as noted) | | | | | |
| Per-Share Data | | | | Ratios and Supplemental Data |
| | | Income From Investment Operations: | Distributions From: | | | Ratio to Average Net Assets of: | | |
| | Net Asset Value, Beginning of Period | Net Investment Income (Loss)(1) | Net Realized and Unrealized Gain (Loss) | Total From Investment Operations | Net Investment Income | Net Realized Gains | Total Distributions | Net Asset Value, End of Period | Total Return(2) | Operating Expenses | Operating
Expenses
(before
expense
waiver) | Net Investment Income (Loss) | Net
Investment
Income
(Loss)
(before
expense
waiver) | Portfolio Turnover Rate | Net Assets, End of Period (in thousands) |
G Class(3) | | | | | | | | | | | | |
| 2018 | $13.03 | 0.27 | 1.79 | 2.06 | (0.26) | (0.81) | (1.07) | $14.02 | 16.11% | 0.04% | 0.46% | 1.93% | 1.51% | 83% |
| $1,672,840 |
|
| 2017 | $11.20 | 0.19 | 1.83 | 2.02 | (0.19) | — | (0.19) | $13.03 | 18.09% | 0.47% | 0.47% | 1.54% | 1.54% | 88% |
| $1,771,561 |
|
| 2016 | $12.30 | 0.19 | (0.53) | (0.34) | (0.19) | (0.57) | (0.76) | $11.20 | (2.65)% | 0.47% | 0.47% | 1.65% | 1.65% | 94% |
| $1,563,685 |
|
| 2015 | $13.04 | 0.21 | 0.53 | 0.74 | (0.20) | (1.28) | (1.48) | $12.30 | 5.97% | 0.47% | 0.47% | 1.66% | 1.66% | 84% |
| $1,381,049 |
|
| 2014 | $11.58 | 0.20 | 2.59 | 2.79 | (0.19) | (1.14) | (1.33) | $13.04 | 25.29% | 0.47% | 0.47% | 1.64% | 1.64% | 77% |
| $1,124,703 |
|
|
|
| Notes to Financial Highlights |
| |
| (1) | Computed using average shares outstanding throughout the period. |
| |
| (2) | Total returns are calculated based on the net asset value of the last business day. Total returns for periods less than one year are not annualized. |
| |
| (3) | Prior to July 31, 2017, the G Class was referred to as the Institutional Class. |
See Notes to Financial Statements.
|
|
| Report of Independent Registered Public Accounting Firm |
To the Board of Directors of American Century Quantitative Equity Funds, Inc. and Shareholders of NT Equity Growth Fund
Opinion on the Financial Statements
We have audited the accompanying statement of assets and liabilities, including the schedule of investments, of NT Equity Growth Fund (one of the funds constituting American Century Quantitative Equity Funds, Inc., referred to hereafter as the "Fund") as of June 30, 2018, the related statement of operations for the year ended June 30, 2018, the statement of changes in net assets for each of the two years in the period ended June 30, 2018, including the related notes, and the financial highlights for each of the five years in the period ended June 30, 2018 (collectively referred to as the “financial statements”). In our opinion, the financial statements present fairly, in all material respects, the financial position of the Fund as of June 30, 2018, the results of its operations for the year then ended, the changes in its net assets for each of the two years in the period ended June 30, 2018 and the financial highlights for each of the five years in the period ended June 30, 2018 in conformity with accounting principles generally accepted in the United States of America.
Basis for Opinion
These financial statements are the responsibility of the Fund’s management. Our responsibility is to express an opinion on the Fund’s financial statements based on our audits. We are a public accounting firm registered with the Public Company Accounting Oversight Board (United States) (“PCAOB”) and are required to be independent with respect to the Fund in accordance with the U.S. federal securities laws and the applicable rules and regulations of the Securities and Exchange Commission and the PCAOB.
We conducted our audits of these financial statements in accordance with the standards of the PCAOB. Those standards require that we plan and perform the audit to obtain reasonable assurance about whether the financial statements are free of material misstatement, whether due to error or fraud.
Our audits included performing procedures to assess the risks of material misstatement of the financial statements, whether due to error or fraud, and performing procedures that respond to those risks. Such procedures included examining, on a test basis, evidence regarding the amounts and disclosures in the financial statements. Our audits also included evaluating the accounting principles used and significant estimates made by management, as well as evaluating the overall presentation of the financial statements. Our procedures included confirmation of securities owned as of June 30, 2018 by correspondence with the custodian and brokers; when replies were not received from brokers, we performed other auditing procedures. We believe that our audits provide a reasonable basis for our opinion.
/s/ PricewaterhouseCoopers LLP
Kansas City, Missouri
August 16, 2018
We have served as the auditor of one or more investment companies in American Century Investments since 1997.
The Board of Directors
The individuals listed below serve as directors of the funds. Each director will continue to serve in this capacity until death, retirement, resignation or removal from office. The board has adopted a mandatory retirement age for directors who are not “interested persons,” as that term is defined in the Investment Company Act (independent directors). Independent directors shall retire by December 31 of the year in which they reach their 75th birthday; provided, however, that on or after January 1, 2022, independent trustees shall retire on December 31 of the year in which they reach their 76th birthday.
Mr. Thomas is an “interested person” because he currently serves as President and Chief Executive Officer of American Century Companies, Inc. (ACC), the parent company of American Century Investment Management, Inc. (ACIM or the advisor). The other directors (more than three-fourths of the total number) are independent. They are not employees, directors or officers of, and have no financial interest in, ACC or any of its wholly owned, direct or indirect, subsidiaries, including ACIM, American Century Investment Services, Inc. (ACIS) and American Century Services, LLC (ACS), and they do not have any other affiliations, positions or relationships that would cause them to be considered “interested persons” under the Investment Company Act. The directors serve in this capacity for eight (in the case of Jonathan S. Thomas, 16; and Ronald J. Gilson, 9) registered investment companies in the American Century Investments family of funds.
The following table presents additional information about the directors. The mailing address for each director other than Mr. Thomas is 1665 Charleston Road, Mountain View, California 94043. The mailing address for Mr. Thomas is 4500 Main Street, Kansas City, Missouri 64111.
|
| | | | | |
Name
(Year of Birth) | Position(s) Held with Funds | Length of Time Served | Principal Occupation(s) During Past 5 Years | Number of American Century Portfolios Overseen by Director | Other Directorships Held During Past 5 Years |
| Independent Directors |
|
|
Tanya S. Beder
(1955) | Director | Since 2011 | Chairman and CEO, SBCC Group Inc. (independent advisory services) (2006 to present) | 45 | CYS Investments, Inc.; Nabors Industries Ltd. |
Jeremy I. Bulow
(1954) | Director | Since 2011 | Professor of Economics, Stanford University, Graduate School of Business (1979 to present) | 45 | None |
Anne Casscells
(1958) | Director | Since 2016 | Co-Chief Executive Officer and Chief Investment Officer, Aetos Alternatives Management (investment advisory firm) (2001 to present); Lecturer in Accounting, Stanford University, Graduate School of Business (2009 to present) | 45 | None |
|
| | | | | |
Name
(Year of Birth) | Position(s) Held with Funds | Length of Time Served | Principal Occupation(s) During Past 5 Years | Number of American Century Portfolios Overseen by Director | Other Directorships Held During Past 5 Years |
| Independent Directors |
|
|
Ronald J. Gilson
(1946) | Director and Chairman of the Board | Since 1995
(Chairman since 2005) | Charles J. Meyers Professor of Law and Business, Emeritus, Stanford Law School (1979 to 2016); Marc and Eva Stern Professor of Law and Business, Columbia University School of Law (1992 to present) | 47 | None |
Frederick L. A. Grauer
(1946) | Director | Since 2008 | Senior Advisor, iShares by BlackRock, Inc. (investment management firm) (2010 to 2011, 2013 to 2015); Senior Advisor, Course Hero (an educational technology company) (2015 to present) | 45 | None |
Jonathan D. Levin
(1972) | Director | Since 2016 | Philip H. Knight Professor and Dean, Graduate School of Business, Stanford University (2016 to present); Professor, Stanford University, (2000 to present); Chair, Department of Economics, Stanford University (2011 to 2014) | 45 | None |
Peter F. Pervere
(1947) | Director | Since 2007 | Retired | 45 | None |
John B. Shoven
(1947) | Director | Since 2002 | Charles R. Schwab Professor of Economics, Stanford University (1973 to present) | 45 | Cadence Design Systems; Exponent; Financial Engines |
| Interested Director |
|
|
Jonathan S. Thomas
(1963) | Director and President | Since 2007 | President and Chief Executive Officer, ACC (2007 to present). Also serves as Chief Executive Officer, ACS; Executive Vice President, ACIM; Director, ACC, ACIM and other ACC subsidiaries | 115 | BioMed Valley Discoveries, Inc. |
The Statement of Additional Information has additional information about the fund's directors and is available without charge, upon request, by calling 1-800-345-2021.
Officers
The following table presents certain information about the executive officers of the funds. Each officer serves as an officer for each of the 16 (in the case of Robert J. Leach, 15) investment companies in the American Century family of funds, unless otherwise noted. No officer is compensated for his or her service as an officer of the funds. The listed officers are interested persons of the funds and are appointed or re-appointed on an annual basis. The mailing address for each officer listed below is 4500 Main Street, Kansas City, Missouri 64111.
|
| | |
Name
(Year of Birth) | Offices with the Funds | Principal Occupation(s) During the Past Five Years |
Jonathan S. Thomas
(1963) | Director and President since 2007 | President and Chief Executive Officer, ACC (2007 to present). Also serves as Chief Executive Officer, ACS; Executive Vice President, ACIM; Director, ACC, ACIM and other ACC subsidiaries |
Amy D. Shelton
(1964) | Chief Compliance Officer and Vice President since 2014 | Chief Compliance Officer, American Century funds, (2014 to present); Chief Compliance Officer, ACIM (2014 to present); Chief Compliance Officer, ACIS (2009 to present); Vice President, Client Interactions and Marketing, ACIS (2013 to 2014). Also serves as Vice President, ACIS |
Charles A. Etherington
(1957) | General Counsel since 2007 and Senior Vice President since 2006 | Attorney, ACC (1994 to present); Vice President, ACC (2005 to present); General Counsel, ACC (2007 to present). Also serves as General Counsel, ACIM, ACS, ACIS and other ACC subsidiaries; and Senior Vice President, ACIM and ACS |
C. Jean Wade
(1964) | Vice President,Treasurer and Chief Financial Officer since 2012 | Senior Vice President, ACS (2017 to present); Vice President, ACS (2000 to 2017) |
Robert J. Leach
(1966) | Vice President since 2006 and Assistant Treasurer since 2012 | Vice President, ACS (2000 to present) |
David H. Reinmiller
(1963) | Vice President since 2000 | Attorney, ACC (1994 to present). Also serves as Vice President, ACIM and ACS |
Ward D. Stauffer
(1960) | Secretary since 2005 | Attorney, ACC (2003 to present) |
|
|
| Approval of Management Agreement |
At a meeting held on June 19, 2018, the Fund’s Board of Directors (the "Board") unanimously approved the renewal of the management agreement pursuant to which American Century Investment Management, Inc. (the “Advisor”) acts as the investment advisor for the Fund. Under Section 15(c) of the Investment Company Act, contracts for investment advisory services are required to be reviewed, evaluated, and approved by a majority of a fund’s directors/trustees, including a majority of the independent Directors, each year. The Board regards this annual evaluation and renewal as one of its most important responsibilities.
The independent Directors have memorialized a statement regarding the relationship between their ongoing obligations to oversee and evaluate the performance of the Advisor and their annual consideration of renewal of the management agreement. In that statement, the independent Directors noted that their assessment of the Advisor’s performance is an ongoing process that takes place over the entire year and is informed by all of the extensive information that the Board and its committees receive and consider over time. This information, together with the additional materials provided specifically in connection with the review, are central to the Board’s assessment of the Advisor’s performance and its determination whether to renew the Fund’s management agreement.
Prior to its consideration of the renewal of the management agreement, the Board requested and reviewed extensive data and analysis relating to the proposed renewal. This information and analysis was compiled by the Advisor and certain independent providers of evaluation data concerning the Fund and the services provided to the Fund by the Advisor.
In connection with its consideration of the renewal of the management agreement, the Board’s review and evaluation of the services provided by the Advisor included, but was not limited to, the following:
| |
| • | the nature, extent, and quality of investment management, shareholder services, and other services provided to the Fund; |
| |
| • | the wide range of other programs and services the Advisor provides to the Fund and its shareholders on a routine and non-routine basis; |
| |
| • | the investment performance of the Fund, including data comparing the Fund’s performance to appropriate benchmarks and/or a peer group of other mutual funds with similar investment objectives and strategies; |
| |
| • | the cost of owning the Fund compared to the cost of owning similar funds; |
| |
| • | the Advisor’s compliance policies, procedures, and regulatory experience; |
| |
| • | financial data showing the cost of services provided to the Fund, the profitability of the Fund to the Advisor, and the overall profitability of the Advisor; |
| |
| • | strategic plans of the Advisor; |
| |
| • | any economies of scale associated with the Advisor’s management of the Fund and other accounts; |
| |
| • | services provided and charges to other investment management clients of the Advisor; |
| |
| • | acquired fund fees and expenses; |
| |
| • | payments and practices in connection with financial intermediaries holding shares of the Fund and the services provided by intermediaries in connection therewith; and |
| |
| • | any collateral benefits derived by the Advisor from the management of the Fund. |
In keeping with its practice, the Board held two in-person meetings to review and discuss the information provided in response to their request and held active discussions with the Advisor regarding the renewal of the management agreement. The independent Directors had the benefit of the advice of their independent counsel throughout the process.
Factors Considered
The Directors considered all of the information provided by the Advisor, the independent data providers, and the independent Directors’ independent counsel in connection with the approval. They determined that the information was sufficient for them to evaluate the management agreement for the Fund. In connection with their review, the Directors did not identify any single factor as being all-important or controlling and each Director may have attributed different levels of importance to different factors. In deciding to renew the management agreement, the Board based its decision on a number of factors, including the following:
Nature, Extent and Quality of Services - Generally. Under the management agreement, the Advisor is responsible for providing or arranging for all services necessary for the operation of the Fund. The Board noted that the Advisor provides or arranges at its own expense a wide variety of services including:
| |
| • | constructing and designing the Fund |
| |
| • | portfolio research and security selection |
| |
| • | initial capitalization/funding |
| |
| • | daily valuation of the Fund’s portfolio |
| |
| • | shareholder servicing and transfer agency, including shareholder confirmations, recordkeeping, and communications |
| |
| • | legal services (except the independent Directors’ counsel) |
| |
| • | regulatory and portfolio compliance |
| |
| • | marketing and distribution (except amounts paid by the Fund under Rule 12b-1 plans) |
The Board noted that many of these services have expanded over time in terms of both quantity and complexity in response to shareholder demands, competition in the industry, changing distribution channels, and the changing regulatory environment.
Investment Management, Shareholder, and Other Services. The nature of the investment management services provided to the Fund is quite complex and allows Fund shareholders access to professional money management, instant diversification of their investments within an asset class, the opportunity to easily diversify among asset classes by investing in or exchanging among various American Century Investments funds, and liquidity. In evaluating investment performance, the Board expects the Advisor to manage the Fund in accordance with its investment objectives and approved strategies. Further, the Directors recognize that the Advisor has an obligation to seek the best execution of fund trades. In providing these services, the Advisor utilizes teams of investment professionals (portfolio managers, analysts, research assistants, and securities traders) who require extensive information technology, research, training, compliance, and other systems to conduct their business. The Board, directly and through its Portfolio Committee, regularly reviews investment performance information for the Fund, together with comparative information for appropriate benchmarks and/or peer groups of similarly-managed funds, over different time horizons. The Directors also review detailed performance information during the management agreement approval process. If performance concerns are identified, the Fund receives special reviews until performance improves, during which the Board discusses with the Advisor the reasons for such results (e.g., market conditions, security selection) and any efforts being undertaken to improve performance. The Fund’s performance was above its benchmark for the one-year period and below its benchmark for the three-, five-, and ten-year periods reviewed by the Board. The Board found the investment management services provided by the Advisor to the Fund to be satisfactory and consistent with the management agreement.
Under the management agreement, the Advisor provides the Fund with a comprehensive package of transfer agency, shareholder, and other services. The Board, directly and through various committees of the Board, regularly reviews reports and evaluations of such services at its regular meetings. These reports include, but are not limited to, information regarding the operational efficiency and accuracy of the shareholder and transfer agency services provided, staffing levels, shareholder satisfaction (as measured by external as well as internal sources), technology support, new products and services offered to Fund shareholders, securities trading activities, portfolio valuation services, auditing services, and legal and operational compliance activities. The Board found the services provided by the Advisor to the Fund under the management agreement to be competitive and of high quality.
Costs of Services and Profitability. The Advisor provides detailed information concerning its cost of providing various services to the Fund, its profitability in managing the Fund, its overall profitability, and its financial condition. The Directors have reviewed with the Advisor the methodology used to prepare this financial information. This information is considered in evaluating the Advisor’s financial condition, its ability to continue to provide services under the management agreement, and the reasonableness of the current management fee. The Board concluded that the Advisor’s profits were reasonable in light of the services provided to the Fund.
Economies of Scale. The Board also reviewed information provided by the Advisor regarding the possible existence of economies of scale in connection with the management of the Fund. The Board concluded that economies of scale are difficult to measure and predict with precision, especially on a fund-by-fund basis. The Board concluded that the Advisor is appropriately sharing economies of scale through its competitive fee structure, offering competitive fees from fund inception, and through reinvestment in its business to provide shareholders enhanced and expanded services.
Comparison to Other Funds’ Fees. The management agreement provides that the Fund pays the Advisor a single, all-inclusive (or unified) management fee for providing all services necessary for the management and operation of the Fund, other than brokerage expenses, expenses attributable to short sales, taxes, interest, extraordinary expenses, the fees and expenses of the Fund’s independent Directors (including their independent legal counsel), and expenses incurred in connection with the provision of shareholder services and distribution services under a plan adopted pursuant to Rule 12b-1 under the 1940 Act. Under the unified fee structure, the Advisor is responsible for providing all investment advisory, custody, audit, administrative, compliance, recordkeeping, marketing, and shareholder services, or arranging and supervising third parties to provide such services. By contrast, most other funds are charged a variety of fees, including an investment advisory fee, a transfer agency fee, an administrative fee, distribution charges, and other expenses. Other than their investment advisory fees and any applicable Rule 12b-1 distribution fees, all other components of the total fees charged by these other funds may be increased without shareholder approval. The Board believes the unified fee structure is a benefit to Fund shareholders because it clearly discloses to shareholders the cost of owning Fund shares, and, since the unified fee cannot be increased without a vote of Fund shareholders, it shifts to the Advisor the risk of increased costs of operating the Fund and provides a direct incentive to minimize administrative inefficiencies. Part of the Board’s analysis of fee levels involves reviewing certain evaluative data compiled by an independent provider and comparing the Fund’s unified fee to the total expense ratio of peer funds. The unified fee charged to shareholders of the Fund was in the lowest quartile of the total expense ratios of the Fund’s peer group. The Board concluded that the management fee paid by the Fund to the Advisor under the management agreement is reasonable in light of the services provided to the Fund.
Comparison to Fees and Services Provided to Other Clients of the Advisor. The Board also requested and received information from the Advisor concerning the nature of the services, fees, costs, and profitability of its advisory services to advisory clients other than the Fund. They observed that these varying types of client accounts require different services and involve different regulatory and entrepreneurial risks than the management of the Fund. The Board analyzed this
information and concluded that the fees charged and services provided to the Fund were reasonable by comparison.
Payments to Intermediaries. The Directors also requested and received a description of payments made to intermediaries by the Fund and the Advisor and services provided by intermediaries. These payments include various payments made by the Fund or the Advisor to different types of intermediaries and recordkeepers for distribution and service activities provided for the Fund. The Directors reviewed such information and received representations from the Advisor that all such payments by the Fund were made pursuant to the Fund’s Rule 12b-1 Plan and that all such payments by the Advisor were made from the Advisor’s resources and reasonable profits. The Board found such payments to be reasonable in scope and purpose.
Collateral or “Fall-Out” Benefits Derived by the Advisor. The Board considered the existence of collateral benefits the Advisor may receive as a result of its relationship with the Fund. The Board noted that the Advisor’s primary business is managing mutual funds and it generally does not use fund or shareholder information to generate profits in other lines of business, and therefore does not derive any significant collateral benefits from them. The Board noted that the Advisor may receive proprietary research from broker-dealers that execute fund portfolio transactions. The Board also determined that the Advisor is able to provide investment management services to certain clients other than the Fund, at least in part, due to its existing infrastructure built to serve the fund complex. The Board noted that the assets of those other accounts are, where applicable, included with the assets of the Fund to determine breakpoints in the management fee schedule.
Existing Relationship. The Board also considered whether there was any reason for not continuing the existing arrangement with the Advisor. In this regard, the Board was mindful of the potential disruptions of the Fund’s operations and various risks, uncertainties, and other effects that could occur as a result of a decision not to continue such relationship. In particular, the Board recognized that most shareholders have invested in the Fund on the strength of the Advisor’s industry standing and reputation and in the expectation that the Advisor will have a continuing role in providing advisory services to the Fund.
Conclusion of the Directors. As a result of this process, the Board, including all of the independent Directors and assisted by the advice of independent legal counsel, taking into account all of the factors discussed above and the information provided by the Advisor and others in connection with its review and throughout the year, concluded that the management agreement between the Fund and the Advisor is fair and reasonable in light of the services provided and should be renewed.
Retirement Account Information
As required by law, distributions you receive from certain retirement accounts are subject to federal income tax withholding, unless you elect not to have withholding apply*. Tax will be withheld on the total amount withdrawn even though you may be receiving amounts that are not subject to withholding, such as nondeductible contributions. In such case, excess amounts of withholding could occur. You may adjust your withholding election so that a greater or lesser amount will be withheld.
If you don’t want us to withhold on this amount, you must notify us to not withhold the federal income tax. You may notify us in writing or in certain situations by telephone or through other electronic means. For systematic withdrawals, your withholding election will remain in effect until revoked or changed by filing a new election. You have the right to revoke your election at any time and change your withholding percentage for future distributions.
Remember, even if you elect not to have income tax withheld, you are liable for paying income tax on the taxable portion of your withdrawal. If you elect not to have income tax withheld or you don’t have enough income tax withheld, you may be responsible for payment of estimated tax. You may incur penalties under the estimated tax rules if your withholding and estimated tax payments are not sufficient. You can reduce or defer the income tax on a distribution by directly or indirectly rolling such distribution over to another IRA or eligible plan. You should consult your tax advisor for additional information.
State tax will be withheld if, at the time of your distribution, your address is within one of the mandatory withholding states and you have federal income tax withheld (or as otherwise required by state law). State taxes will be withheld from your distribution in accordance with the respective state rules.
*Some 403(b), 457 and qualified retirement plan distributions may be subject to 20% mandatory withholding, as they are subject to special tax and withholding rules. Your plan administrator or plan sponsor is required to provide you with a special tax notice explaining those rules at the time you request a distribution. If applicable, federal and/or state taxes may be withheld from your distribution amount.
Proxy Voting Policies
Descriptions of the principles and policies that the fund's investment advisor uses in exercising the voting rights associated with the securities purchased and/or held by the fund are available without charge, upon request, by calling 1-800-345-2021 or visiting the "About Us" page of American Century Investments’ website at americancentury.com. A description of the policies is also available on the Securities and Exchange Commission’s website at sec.gov. Information regarding how the investment advisor voted proxies relating to portfolio securities during the most recent 12-month period ended June 30 is available on the "About Us" page at americancentury.com. It is also available at sec.gov.
Quarterly Portfolio Disclosure
The fund files its complete schedule of portfolio holdings with the Securities and Exchange Commission (SEC) for the first and third quarters of each fiscal year on Form N-Q. The fund’s Forms N-Q are available on the SEC’s website at sec.gov, and may be reviewed and copied at the SEC’s Public Reference Room in Washington, DC. Information on the operation of the Public Reference Room may be obtained by calling 1-800-SEC-0330. The fund also makes its complete schedule of portfolio holdings for the most recent quarter of its fiscal year available on its website at americancentury.com and, upon request, by calling 1-800-345-2021.
Other Tax Information
The following information is provided pursuant to provisions of the Internal Revenue Code.
The fund hereby designates up to the maximum amount allowable as qualified dividend income for the fiscal year ended June 30, 2018.
For corporate taxpayers, the fund hereby designates $37,422,403, or up to the maximum amount allowable, of ordinary income distributions paid during the fiscal year ended June 30, 2018 as qualified for the corporate dividends received deduction.
The fund hereby designates $15,205,247 as qualified short-term capital gain distributions for purposes of Internal Revenue Code Section 871 for the fiscal year ended June 30, 2018.
The fund hereby designates $93,554,753, or up to the maximum amount allowable, as long-term capital gain distributions (20% rate gain distributions) for the fiscal year ended June 30, 2018.
The fund utilized earnings and profits of $10,368,356 distributed to shareholders on redemption of shares as part of the dividends paid deduction (tax equalization).
|
| | |
| |
| | | |
| Contact Us | americancentury.com | |
| Automated Information Line | 1-800-345-8765 | |
| Investor Services Representative | 1-800-345-2021
or 816-531-5575 | |
| Investors Using Advisors | 1-800-378-9878 | |
Business, Not-For-Profit, Employer-Sponsored
Retirement Plans | 1-800-345-3533 | |
Banks and Trust Companies, Broker-Dealers,
Financial Professionals, Insurance Companies | 1-800-345-6488 | |
| Telecommunications Relay Service for the Deaf | 711 | |
| | | |
| American Century Quantitative Equity Funds, Inc. | |
| | | |
Investment Advisor: American Century Investment Management, Inc. Kansas City, Missouri | |
| | | |
| This report and the statements it contains are submitted for the general information of our shareholders. The report is not authorized for distribution to prospective investors unless preceded or accompanied by an effective prospectus. | |
| | | |
©2018 American Century Proprietary Holdings, Inc. All rights reserved.
CL-ANN-92997 1808 | |
|
| |
| | |
| | Annual Report |
| | |
| | June 30, 2018 |
| | |
| | NT Small Company Fund |
| | G Class (ACLOX) |
|
| | |
| Performance | 2 |
|
| Portfolio Commentary | |
|
| Fund Characteristics | |
|
| Shareholder Fee Example | |
|
| Schedule of Investments | |
|
| Statement of Assets and Liabilities | |
|
| Statement of Operations | |
|
| Statement of Changes in Net Assets | |
|
| Notes to Financial Statements | |
|
| Financial Highlights | |
|
| Report of Independent Registered Public Accounting Firm | |
|
| Management | |
|
| Approval of Management Agreement | |
|
| Additional Information | |
|
Any opinions expressed in this report reflect those of the author as of the date of the report, and do not necessarily represent the opinions of American Century Investments® or any other person in the American Century Investments organization. Any such opinions are subject to change at any time based upon market or other conditions and American Century Investments disclaims any responsibility to update such opinions. These opinions may not be relied upon as investment advice and, because investment decisions made by American Century Investments funds are based on numerous factors, may not be relied upon as an indication of trading intent on behalf of any American Century Investments fund. Security examples are used for representational purposes only and are not intended as recommendations to purchase or sell securities. Performance information for comparative indices and securities is provided to American Century Investments by third party vendors. To the best of American Century Investments’ knowledge, such information is accurate at the time of printing.
|
| | | | | |
| Total Returns as of June 30, 2018 |
| | | | Average Annual Returns | |
| | Ticker Symbol | 1 year | 5 years | 10 years | Inception Date |
| G Class | ACLOX | 14.13% | 11.11% | 8.68% | 5/12/06 |
| Russell 2000 Index | — | 17.57% | 12.45% | 10.59% | — |
Fund returns would have been lower if a portion of the fees had not been waived. Prior to July 31, 2017, the G Class was referred to as the Institutional Class.
|
|
| Growth of $10,000 Over 10 Years |
| $10,000 investment made June 30, 2008 |
|
| |
| Value on June 30, 2018 |
| | G Class — $23,005 |
| |
| | Russell 2000 Index — $27,387 |
| |
Ending value of G Class would have been lower if a portion of the fees had not been waived.
|
| |
Total Annual Fund Operating Expenses |
| G Class | 0.67% |
The total annual fund operating expenses shown is as stated in the fund’s prospectus current as of the date of this report. The prospectus may vary from the expense ratio shown elsewhere in this report because it is based on a different time period, includes acquired fund fees and expenses, and, if applicable, does not include fee waivers or expense reimbursements.
Data presented reflect past performance. Past performance is no guarantee of future results. Current performance may be higher or lower than the performance shown. Total returns for periods less than one year are not annualized. Investment return and principal value will fluctuate, and redemption value may be more or less than original cost. Data assumes reinvestment of dividends and capital gains, and none of the charts reflect the deduction of taxes that a shareholder would pay on fund distributions or the redemption of fund shares. To obtain performance data current to the most recent month end, please call 1-800-345-2021 or visit americancentury.com. For additional information about the fund, please consult the prospectus.
Portfolio Managers: Brian Garbe and Steve Rossi
Performance Summary
The NT Small Company Fund returned 14.13%* for the fiscal year ended June 30, 2018, compared with the 17.57% return of its benchmark, the Russell 2000 Index.
NT Small Company rose during the fiscal year, but trailed the return of its benchmark, the Russell 2000 Index. NT Small Company’s stock selection process incorporates factors of valuation, quality, growth, and sentiment, while striving to minimize unintended risks along industries and other risk characteristics. The fund’s valuation and growth factors detracted from relative results, while quality and sentiment insights were supportive. Stock choices in the industrials, health care, and energy sectors detracted from performance, while holdings in the consumer staples and consumer discretionary sectors benefited fund results.
Stock Choices Across Several Sectors Detracted From Relative Returns
Stock choices were the largest driver of the fund’s twelve-month results. Picks in the industrials sector detracted most from performance. Overweights to positions in the machinery industry were other sources of weakness. Positions within the construction and engineering industry, in particular an overweight to Argan, also detracted. We have since exited the position. Elsewhere in the sector, an underweight to car rental company Avis Budget Group and an overweight to Aircastle also hurt relative returns.
Stock selection within health care also negatively affected the portfolio, particularly within the biotechnology industry. Overweights to companies such as Calithera Biosciences, MiMedx Group, and Akebia Therapeutics weighed on returns as the industry struggled for much of the period with worries about regulation and restrictions on pricing. Elsewhere in the sector, an underweight position in pharmaceuticals company Nektar Therapeutics weighed on relative results. We have since exited the position.
Within the energy sector, positioning within the energy equipment and services and oil, gas and consumable fuels industries detracted. Overweights to companies such as McDermott International and Smart Sand, among others, weighed on returns. Avoidance of several index holdings, which appreciated during the period, also detracted within the sector.
Consumer Sectors, Real Estate, and Financials Were Additive
In consumer staples, stock choices within the personal products industry were the largest drivers of positive returns. An overweight to diet and nutrition product company Medifast was among the top contributors for the period. A lack of exposure to poor-performing household products and beverages companies was also additive.
Stock selection within the consumer discretionary sector also helped relative results. Choices within the auto components industry were particularly helpful. An overweight to Stoneridge was among the top contributors to portfolio performance. In the internet software and services industry, online craft hub Etsy was also a top contributor. Elsewhere in the sector, overweights to Deckers Outdoor and Malibu Boats also boosted relative returns as a strong economic environment throughout the fiscal year supported consumer spending, which benefited these companies’ revenue growth.
* Fund returns would have been lower if a portion of the fees had not been waived.
Many areas of the real estate and financials sectors were hurt by rising rates and a flattening yield curve. In real estate, a relative lack of exposure to equity real estate investment trusts benefited returns. In financials, overweights to several capital markets companies such as Evercore and Houlihan Lokey were additive. We have since exited Houlihan Lokey. Relative underweights to the banks and equity real estate investment trust industries also helped returns.
Portfolio Positioning
Our disciplined, objective, and systematic investment strategy is designed to take advantage of opportunities at the individual company level. We believe this approach is the most powerful way to capitalize on market inefficiencies that lead to the mispricing of individual stocks. As a result, our sector weights reflect where we are finding opportunities at a given time.
At period-end, the portfolio’s largest relative overweights were in the materials, consumer discretionary, and industrials sectors. Based on the solid scores across all four factors of our model, we believe the stocks in the materials sector offer favorable investment opportunities. We increased our exposure to the consumer discretionary sector over the course of the period, believing there are opportunities within the retailing and consumer durables and apparel industries. These industries score positively within our model, particularly for quality and sentiment. Conversely, we reduced our exposure to financials during the period. The sector is now among the largest relative underweight positions. We feel there is a comparative lack of opportunity in the sector, particularly within the banks and insurance industries, both of which score poorly for quality. The utilities sector also shows a lack of opportunity, scoring poorly for quality and growth. It was a significant relative underweight at period-end.
|
| |
| JUNE 30, 2018 |
| Top Ten Holdings | % of net assets |
| Haemonetics Corp. | 0.9% |
| Adtalem Global Education, Inc. | 0.8% |
| Ingevity Corp. | 0.8% |
| Louisiana-Pacific Corp. | 0.8% |
| Vishay Intertechnology, Inc. | 0.8% |
| Vonage Holdings Corp. | 0.8% |
| MSA Safety, Inc. | 0.8% |
| KEMET Corp. | 0.8% |
| Integer Holdings Corp. | 0.7% |
| Curtiss-Wright Corp. | 0.7% |
| | |
| Top Five Industries | % of net assets |
| Banks | 8.2% |
| Internet Software and Services | 5.5% |
| Biotechnology | 5.2% |
| Equity Real Estate Investment Trusts (REITs) | 4.7% |
| Semiconductors and Semiconductor Equipment | 4.6% |
| | |
| Types of Investments in Portfolio | % of net assets |
| Common Stocks | 99.5% |
| Temporary Cash Investments | 0.8% |
| Other Assets and Liabilities | (0.3)% |
Fund shareholders may incur two types of costs: (1) transaction costs, including sales charges (loads) on purchase payments and redemption/exchange fees; and (2) ongoing costs, including management fees; distribution and service (12b-1) fees; and other fund expenses. This example is intended to help you understand your ongoing costs (in dollars) of investing in your fund and to compare these costs with the ongoing cost of investing in other mutual funds.
The example is based on an investment of $1,000 made at the beginning of the period and held for the entire period from January 1, 2018 to June 30, 2018.
Actual Expenses
The table provides information about actual account values and actual expenses for each class. You may use the information, together with the amount you invested, to estimate the expenses that you paid over the period. First, identify the share class you own. Then simply divide your account value by $1,000 (for example, an $8,600 account value divided by $1,000 = 8.6), then multiply the result by the number under the heading “Expenses Paid During Period” to estimate the expenses you paid on your account during this period.
Hypothetical Example for Comparison Purposes
The table also provides information about hypothetical account values and hypothetical expenses based on the actual expense ratio of each class of your fund and an assumed rate of return of 5% per year before expenses, which is not the actual return of a fund’s share class. The hypothetical account values and expenses may not be used to estimate the actual ending account balance or expenses you paid for the period. You may use this information to compare the ongoing costs of investing in your fund and other funds. To do so, compare this 5% hypothetical example with the 5% hypothetical examples that appear in the shareholder reports of the other funds.
Please note that the expenses shown in the table are meant to highlight your ongoing costs only and do not reflect any transactional costs, such as sales charges (loads) or redemption/exchange fees. Therefore, the table is useful in comparing ongoing costs only, and will not help you determine the relative total costs of owning different funds. In addition, if these transactional costs were included, your costs would have been higher.
|
| | | | |
| | Beginning
Account Value
1/1/18 | Ending
Account Value
6/30/18 | Expenses Paid
During Period(1)
1/1/18 - 6/30/18 |
Annualized
Expense Ratio(1) |
| Actual | | | | |
| G Class | $1,000 | $1,054.00 | $0.05 | 0.01% |
| Hypothetical | | | | |
| G Class | $1,000 | $1,024.74 | $0.05 | 0.01% |
| |
| (1) | Expenses are equal to the class's annualized expense ratio listed in the table above, multiplied by the average account value over the period, multiplied by 181, the number of days in the most recent fiscal half-year, divided by 365, to reflect the one-half year period. Annualized expense ratio reflects actual expenses, including any applicable fee waivers or expense reimbursements and excluding any acquired fund fees and expenses. |
JUNE 30, 2018
|
| | | | | |
| | Shares | Value |
| COMMON STOCKS — 99.5% | | |
| Aerospace and Defense — 1.0% | | |
| Curtiss-Wright Corp. | 26,493 |
| $ | 3,153,197 |
|
| Moog, Inc., Class A | 14,838 |
| 1,156,770 |
|
| | | 4,309,967 |
|
| Air Freight and Logistics — 0.1% | | |
| Forward Air Corp. | 7,311 |
| 431,934 |
|
| Auto Components — 0.6% | | |
Stoneridge, Inc.(1) | 77,660 |
| 2,728,972 |
|
| Banks — 8.2% | | |
Bancorp, Inc. (The)(1) | 208,665 |
| 2,182,636 |
|
| Bank of NT Butterfield & Son Ltd. (The) | 53,533 |
| 2,447,529 |
|
| Boston Private Financial Holdings, Inc. | 30,182 |
| 479,894 |
|
| Camden National Corp. | 8,459 |
| 386,661 |
|
| Central Pacific Financial Corp. | 84,265 |
| 2,414,192 |
|
Customers Bancorp, Inc.(1) | 67,532 |
| 1,916,558 |
|
| Enterprise Financial Services Corp. | 36,423 |
| 1,965,021 |
|
| Financial Institutions, Inc. | 31,131 |
| 1,024,210 |
|
| First Citizens BancShares, Inc., Class A | 7,490 |
| 3,020,717 |
|
| First Interstate Bancsystem, Inc., Class A | 22,297 |
| 940,933 |
|
Franklin Financial Network, Inc.(1) | 72,611 |
| 2,730,174 |
|
| Heartland Financial USA, Inc. | 7,051 |
| 386,747 |
|
| Heritage Commerce Corp. | 25,872 |
| 439,565 |
|
| Hilltop Holdings, Inc. | 104,685 |
| 2,310,398 |
|
| Independent Bank Corp. | 42,796 |
| 1,091,298 |
|
| International Bancshares Corp. | 68,250 |
| 2,921,100 |
|
| MB Financial, Inc. | 14,610 |
| 682,287 |
|
| OFG Bancorp | 79,747 |
| 1,120,445 |
|
| Southside Bancshares, Inc. | 3,350 |
| 112,828 |
|
| Trico Bancshares | 18,357 |
| 687,470 |
|
| UMB Financial Corp. | 36,702 |
| 2,797,794 |
|
| United Community Banks, Inc. | 91,669 |
| 2,811,488 |
|
| | | 34,869,945 |
|
| Biotechnology — 5.2% | | |
Akebia Therapeutics, Inc.(1) | 119,374 |
| 1,191,353 |
|
Amicus Therapeutics, Inc.(1) | 87,660 |
| 1,369,249 |
|
Ardelyx, Inc.(1) | 36,219 |
| 134,010 |
|
Calithera Biosciences, Inc.(1) | 192,123 |
| 960,615 |
|
ChemoCentryx, Inc.(1) | 56,354 |
| 742,182 |
|
CytomX Therapeutics, Inc.(1) | 53,712 |
| 1,227,856 |
|
Emergent BioSolutions, Inc.(1) | 28,687 |
| 1,448,407 |
|
Enanta Pharmaceuticals, Inc.(1) | 11,144 |
| 1,291,590 |
|
Exelixis, Inc.(1) | 59,473 |
| 1,279,859 |
|
|
| | | | | |
| | Shares | Value |
Genomic Health, Inc.(1) | 26,625 |
| $ | 1,341,900 |
|
Halozyme Therapeutics, Inc.(1) | 88,351 |
| 1,490,481 |
|
Ligand Pharmaceuticals, Inc.(1) | 8,558 |
| 1,772,961 |
|
Loxo Oncology, Inc.(1) | 10,704 |
| 1,856,930 |
|
MiMedx Group, Inc.(1) | 50,332 |
| 321,621 |
|
Pieris Pharmaceuticals, Inc.(1) | 160,150 |
| 811,961 |
|
Protagonist Therapeutics, Inc.(1) | 48,111 |
| 323,306 |
|
PTC Therapeutics, Inc.(1) | 31,381 |
| 1,058,481 |
|
Puma Biotechnology, Inc.(1) | 5,841 |
| 345,495 |
|
REGENXBIO, Inc.(1) | 5,193 |
| 372,598 |
|
Retrophin, Inc.(1) | 34,446 |
| 938,998 |
|
Sangamo Therapeutics, Inc.(1) | 93,768 |
| 1,331,506 |
|
Vanda Pharmaceuticals, Inc.(1) | 20,882 |
| 397,802 |
|
| | | 22,009,161 |
|
| Building Products — 0.3% | | |
Patrick Industries, Inc.(1) | 12,907 |
| 733,763 |
|
| Universal Forest Products, Inc. | 12,699 |
| 465,037 |
|
| | | 1,198,800 |
|
| Capital Markets — 2.0% | | |
| Artisan Partners Asset Management, Inc., Class A | 24,113 |
| 727,007 |
|
| BrightSphere Investment Group plc | 83,581 |
| 1,191,865 |
|
| Evercore, Inc., Class A | 27,741 |
| 2,925,289 |
|
| Investment Technology Group, Inc. | 14,371 |
| 300,641 |
|
| Piper Jaffray Cos. | 33,491 |
| 2,573,783 |
|
| Stifel Financial Corp. | 15,643 |
| 817,347 |
|
| | | 8,535,932 |
|
| Chemicals — 3.7% | | |
| Chemours Co. (The) | 44,045 |
| 1,953,836 |
|
| FutureFuel Corp. | 10,727 |
| 150,285 |
|
Ingevity Corp.(1) | 43,321 |
| 3,502,936 |
|
| KMG Chemicals, Inc. | 17,253 |
| 1,272,927 |
|
Koppers Holdings, Inc.(1) | 22,349 |
| 857,084 |
|
Kraton Corp.(1) | 51,411 |
| 2,372,104 |
|
| Kronos Worldwide, Inc. | 18,147 |
| 408,852 |
|
| Minerals Technologies, Inc. | 28,149 |
| 2,121,027 |
|
OMNOVA Solutions, Inc.(1) | 74,100 |
| 770,640 |
|
| Stepan Co. | 26,807 |
| 2,091,214 |
|
| | | 15,500,905 |
|
| Commercial Services and Supplies — 3.7% | | |
| ACCO Brands Corp. | 151,222 |
| 2,094,425 |
|
| Brady Corp., Class A | 68,274 |
| 2,631,963 |
|
| Deluxe Corp. | 18,636 |
| 1,233,890 |
|
| Herman Miller, Inc. | 70,116 |
| 2,376,932 |
|
| McGrath RentCorp | 12,760 |
| 807,325 |
|
| MSA Safety, Inc. | 33,271 |
| 3,205,328 |
|
| Quad/Graphics, Inc. | 103,184 |
| 2,149,323 |
|
|
| | | | | |
| | Shares | Value |
SP Plus Corp.(1) | 37,167 |
| $ | 1,382,612 |
|
| | | 15,881,798 |
|
| Communications Equipment — 1.0% | | |
Aerohive Networks, Inc.(1) | 33,802 |
| 134,194 |
|
Ciena Corp.(1) | 57,688 |
| 1,529,309 |
|
| Comtech Telecommunications Corp. | 6,249 |
| 199,218 |
|
Extreme Networks, Inc.(1) | 102,348 |
| 814,690 |
|
| InterDigital, Inc. | 19,767 |
| 1,599,150 |
|
| | | 4,276,561 |
|
| Construction and Engineering — 1.5% | | |
| EMCOR Group, Inc. | 41,202 |
| 3,138,768 |
|
| KBR, Inc. | 34,660 |
| 621,107 |
|
| Primoris Services Corp. | 93,286 |
| 2,540,178 |
|
Sterling Construction Co., Inc.(1) | 10,919 |
| 142,275 |
|
| | | 6,442,328 |
|
| Consumer Finance — 0.5% | | |
Enova International, Inc.(1) | 56,864 |
| 2,078,379 |
|
| Containers and Packaging — 0.6% | | |
| Greif, Inc., Class A | 42,696 |
| 2,258,191 |
|
| Myers Industries, Inc. | 6,689 |
| 128,429 |
|
| | | 2,386,620 |
|
| Diversified Consumer Services — 1.3% | | |
Adtalem Global Education, Inc.(1) | 73,215 |
| 3,521,641 |
|
Grand Canyon Education, Inc.(1) | 16,147 |
| 1,802,167 |
|
K12, Inc.(1) | 1,338 |
| 21,903 |
|
| | | 5,345,711 |
|
| Diversified Financial Services — 0.5% | | |
On Deck Capital, Inc.(1) | 314,144 |
| 2,199,008 |
|
| Diversified Telecommunication Services — 0.9% | | |
| Frontier Communications Corp. | 70,452 |
| 377,623 |
|
Ooma, Inc.(1) | 12,651 |
| 179,012 |
|
Vonage Holdings Corp.(1) | 254,408 |
| 3,279,319 |
|
| | | 3,835,954 |
|
| Electric Utilities — 0.3% | | |
| Portland General Electric Co. | 25,069 |
| 1,071,950 |
|
| Spark Energy, Inc., Class A | 17,590 |
| 171,503 |
|
| | | 1,243,453 |
|
| Electrical Equipment — 1.0% | | |
Atkore International Group, Inc.(1) | 55,223 |
| 1,146,982 |
|
Generac Holdings, Inc.(1) | 57,713 |
| 2,985,493 |
|
| | | 4,132,475 |
|
| Electronic Equipment, Instruments and Components — 2.2% | | |
Electro Scientific Industries, Inc.(1) | 124,984 |
| 1,970,998 |
|
KEMET Corp.(1) | 132,566 |
| 3,201,469 |
|
Tech Data Corp.(1) | 3,070 |
| 252,108 |
|
TTM Technologies, Inc.(1) | 64 |
| 1,128 |
|
| Vishay Intertechnology, Inc. | 146,784 |
| 3,405,389 |
|
|
| | | | | |
| | Shares | Value |
Vishay Precision Group, Inc.(1) | 9,719 |
| $ | 370,780 |
|
| | | 9,201,872 |
|
| Energy Equipment and Services — 2.7% | | |
| Archrock, Inc. | 232,708 |
| 2,792,496 |
|
Exterran Corp.(1) | 88,581 |
| 2,218,068 |
|
Mammoth Energy Services, Inc.(1) | 6,353 |
| 215,748 |
|
Matrix Service Co.(1) | 16,680 |
| 306,078 |
|
McDermott International, Inc.(1) | 121,187 |
| 2,381,325 |
|
Newpark Resources, Inc.(1) | 50,996 |
| 553,307 |
|
Smart Sand, Inc.(1) | 164,005 |
| 870,867 |
|
Superior Energy Services, Inc.(1) | 123,379 |
| 1,201,711 |
|
Unit Corp.(1) | 38,288 |
| 978,641 |
|
| | | 11,518,241 |
|
| Equity Real Estate Investment Trusts (REITs) — 4.7% | | |
| Braemar Hotels & Resorts, Inc. | 41,190 |
| 470,390 |
|
| CareTrust REIT, Inc. | 69,058 |
| 1,152,578 |
|
| Chatham Lodging Trust | 44,221 |
| 938,370 |
|
| Chesapeake Lodging Trust | 83,654 |
| 2,646,813 |
|
| City Office REIT, Inc. | 63,535 |
| 815,154 |
|
| Front Yard Residential Corp. | 100,220 |
| 1,044,292 |
|
InfraREIT, Inc.(1) | 13,760 |
| 305,059 |
|
| Investors Real Estate Trust | 30,295 |
| 167,531 |
|
| Mack-Cali Realty Corp. | 11,459 |
| 232,389 |
|
| MedEquities Realty Trust, Inc. | 211,494 |
| 2,330,664 |
|
| One Liberty Properties, Inc. | 3,305 |
| 87,285 |
|
| Pebblebrook Hotel Trust | 71,929 |
| 2,790,845 |
|
| PotlatchDeltic Corp. | 56,340 |
| 2,864,889 |
|
| PS Business Parks, Inc. | 23,731 |
| 3,049,433 |
|
| Select Income REIT | 28,785 |
| 646,799 |
|
| Terreno Realty Corp. | 12,075 |
| 454,865 |
|
| | | 19,997,356 |
|
| Food and Staples Retailing — 0.7% | | |
United Natural Foods, Inc.(1) | 66,393 |
| 2,832,325 |
|
| Food Products — 0.4% | | |
Cal-Maine Foods, Inc.(1) | 33,180 |
| 1,521,303 |
|
| Health Care Equipment and Supplies — 4.5% | | |
AngioDynamics, Inc.(1) | 81,826 |
| 1,819,810 |
|
| Atrion Corp. | 268 |
| 160,639 |
|
| CONMED Corp. | 24,026 |
| 1,758,703 |
|
Globus Medical, Inc., Class A(1) | 62,279 |
| 3,142,598 |
|
Haemonetics Corp.(1) | 41,768 |
| 3,745,754 |
|
Integer Holdings Corp.(1) | 48,842 |
| 3,157,635 |
|
Lantheus Holdings, Inc.(1) | 32,470 |
| 472,439 |
|
LivaNova plc(1) | 22,536 |
| 2,249,544 |
|
Orthofix International NV(1) | 34,514 |
| 1,961,086 |
|
STAAR Surgical Co.(1) | 25,841 |
| 801,071 |
|
| | | 19,269,279 |
|
|
| | | | | |
| | Shares | Value |
| Health Care Providers and Services — 2.0% | | |
Addus HomeCare Corp.(1) | 3,892 |
| $ | 222,817 |
|
Amedisys, Inc.(1) | 15,924 |
| 1,360,865 |
|
Molina Healthcare, Inc.(1) | 9,030 |
| 884,398 |
|
Tenet Healthcare Corp.(1) | 13,060 |
| 438,424 |
|
Tivity Health, Inc.(1) | 70,994 |
| 2,498,989 |
|
WellCare Health Plans, Inc.(1) | 12,504 |
| 3,078,985 |
|
| | | 8,484,478 |
|
| Hotels, Restaurants and Leisure — 1.1% | | |
| Bloomin' Brands, Inc. | 29,569 |
| 594,337 |
|
| Brinker International, Inc. | 15,483 |
| 736,991 |
|
Eldorado Resorts, Inc.(1) | 7,013 |
| 274,208 |
|
| International Speedway Corp., Class A | 59,213 |
| 2,646,821 |
|
Penn National Gaming, Inc.(1) | 16,690 |
| 560,617 |
|
| | | 4,812,974 |
|
| Household Durables — 1.4% | | |
Beazer Homes USA, Inc.(1) | 71,996 |
| 1,061,941 |
|
| La-Z-Boy, Inc. | 15,116 |
| 462,550 |
|
| M.D.C. Holdings, Inc. | 48,734 |
| 1,499,545 |
|
Taylor Morrison Home Corp., Class A(1) | 112,754 |
| 2,343,028 |
|
William Lyon Homes, Class A(1) | 25,919 |
| 601,321 |
|
| | | 5,968,385 |
|
| Independent Power and Renewable Electricity Producers — 0.6% | |
| NRG Yield, Inc., Class A | 22,536 |
| 384,239 |
|
| TerraForm Power, Inc., Class A | 167,232 |
| 1,956,614 |
|
| | | 2,340,853 |
|
| Insurance — 1.9% | | |
| CNO Financial Group, Inc. | 127,649 |
| 2,430,437 |
|
| FBL Financial Group, Inc., Class A | 1,684 |
| 132,615 |
|
Health Insurance Innovations, Inc., Class A(1) | 73,317 |
| 2,371,805 |
|
| Stewart Information Services Corp. | 61,213 |
| 2,636,444 |
|
| Universal Insurance Holdings, Inc. | 14,845 |
| 521,059 |
|
| | | 8,092,360 |
|
| Internet and Direct Marketing Retail — 1.8% | | |
Groupon, Inc.(1) | 566,316 |
| 2,435,159 |
|
| Nutrisystem, Inc. | 58,051 |
| 2,234,963 |
|
Shutterfly, Inc.(1) | 33,258 |
| 2,994,218 |
|
| | | 7,664,340 |
|
| Internet Software and Services — 5.5% | | |
Appfolio, Inc., Class A(1) | 9,861 |
| 603,000 |
|
Blucora, Inc.(1) | 68,833 |
| 2,546,821 |
|
Care.com, Inc.(1) | 122,015 |
| 2,547,673 |
|
Cornerstone OnDemand, Inc.(1) | 14,853 |
| 704,478 |
|
Endurance International Group Holdings, Inc.(1) | 151,060 |
| 1,503,047 |
|
Envestnet, Inc.(1) | 53,674 |
| 2,949,386 |
|
Etsy, Inc.(1) | 73,624 |
| 3,106,197 |
|
LivePerson, Inc.(1) | 27,474 |
| 579,702 |
|
|
| | | | | |
| | Shares | Value |
New Relic, Inc.(1) | 21,550 |
| $ | 2,167,715 |
|
QuinStreet, Inc.(1) | 211,139 |
| 2,681,465 |
|
SPS Commerce, Inc.(1) | 16,090 |
| 1,182,293 |
|
Stamps.com, Inc.(1) | 6,881 |
| 1,741,237 |
|
TechTarget, Inc.(1) | 28,917 |
| 821,243 |
|
Web.com Group, Inc.(1) | 5,651 |
| 146,078 |
|
| | | 23,280,335 |
|
| IT Services — 0.2% | | |
Everi Holdings, Inc.(1) | 100,183 |
| 721,318 |
|
| Leisure Products — 1.2% | | |
Malibu Boats, Inc., Class A(1) | 69,789 |
| 2,926,951 |
|
MCBC Holdings, Inc.(1) | 77,215 |
| 2,235,374 |
|
| | | 5,162,325 |
|
| Life Sciences Tools and Services — 0.9% | | |
| Luminex Corp. | 48,470 |
| 1,431,319 |
|
Medpace Holdings, Inc.(1) | 58,677 |
| 2,523,111 |
|
| | | 3,954,430 |
|
| Machinery — 3.0% | | |
| Columbus McKinnon Corp. | 19,253 |
| 834,810 |
|
Commercial Vehicle Group, Inc.(1) | 7,561 |
| 55,498 |
|
| Global Brass & Copper Holdings, Inc. | 68,733 |
| 2,154,780 |
|
Harsco Corp.(1) | 106,669 |
| 2,357,385 |
|
| Hillenbrand, Inc. | 9,163 |
| 432,035 |
|
| Hyster-Yale Materials Handling, Inc. | 2,416 |
| 155,228 |
|
| Kadant, Inc. | 6,516 |
| 626,513 |
|
Meritor, Inc.(1) | 102,549 |
| 2,109,433 |
|
SPX FLOW, Inc.(1) | 21,519 |
| 941,887 |
|
TriMas Corp.(1) | 45,938 |
| 1,350,577 |
|
| Watts Water Technologies, Inc., Class A | 21,690 |
| 1,700,496 |
|
| | | 12,718,642 |
|
| Marine — 0.1% | | |
Genco Shipping & Trading Ltd.(1) | 18,448 |
| 285,944 |
|
| Media — 1.5% | | |
| Emerald Expositions Events, Inc. | 15,543 |
| 320,186 |
|
| Entravision Communications Corp., Class A | 183,208 |
| 916,040 |
|
| New Media Investment Group, Inc. | 123,658 |
| 2,285,200 |
|
| Nexstar Media Group, Inc., Class A | 28,513 |
| 2,092,854 |
|
tronc, Inc.(1) | 34,937 |
| 603,711 |
|
| | | 6,217,991 |
|
| Metals and Mining — 1.9% | | |
Cleveland-Cliffs, Inc.(1) | 48,287 |
| 407,059 |
|
| Kaiser Aluminum Corp. | 25,782 |
| 2,684,164 |
|
| Schnitzer Steel Industries, Inc., Class A | 85,038 |
| 2,865,781 |
|
| Worthington Industries, Inc. | 49,197 |
| 2,064,798 |
|
| | | 8,021,802 |
|
| Oil, Gas and Consumable Fuels — 1.6% | | |
| Delek US Holdings, Inc. | 58,747 |
| 2,947,337 |
|
|
| | | | | |
| | Shares | Value |
| Evolution Petroleum Corp. | 16,089 |
| $ | 158,477 |
|
| NACCO Industries, Inc., Class A | 33,050 |
| 1,115,437 |
|
Overseas Shipholding Group, Inc., Class A(1) | 47,162 |
| 182,989 |
|
| Peabody Energy Corp. | 25,962 |
| 1,180,752 |
|
| Teekay Corp. | 120,009 |
| 930,070 |
|
W&T Offshore, Inc.(1) | 26,582 |
| 190,061 |
|
| | | 6,705,123 |
|
| Paper and Forest Products — 0.8% | | |
| Louisiana-Pacific Corp. | 125,343 |
| 3,411,837 |
|
| Personal Products — 0.8% | | |
| Medifast, Inc. | 16,537 |
| 2,648,566 |
|
| Natural Health Trends Corp. | 32,449 |
| 811,874 |
|
| | | 3,460,440 |
|
| Pharmaceuticals — 2.1% | | |
ANI Pharmaceuticals, Inc.(1) | 12,736 |
| 850,765 |
|
Aratana Therapeutics, Inc.(1) | 15,920 |
| 67,660 |
|
Corcept Therapeutics, Inc.(1) | 86,907 |
| 1,366,178 |
|
Depomed, Inc.(1) | 147,455 |
| 983,525 |
|
Horizon Pharma plc(1) | 87,208 |
| 1,444,164 |
|
Innoviva, Inc.(1) | 103,729 |
| 1,431,460 |
|
| Phibro Animal Health Corp., Class A | 26,542 |
| 1,222,259 |
|
Supernus Pharmaceuticals, Inc.(1) | 27,401 |
| 1,639,950 |
|
| | | 9,005,961 |
|
| Professional Services — 2.4% | | |
ASGN, Inc.(1) | 37,463 |
| 2,929,232 |
|
| Barrett Business Services, Inc. | 11,251 |
| 1,086,509 |
|
| BG Staffing, Inc. | 5,456 |
| 126,852 |
|
| Heidrick & Struggles International, Inc. | 60,919 |
| 2,132,165 |
|
| ICF International, Inc. | 4,825 |
| 342,816 |
|
| Kforce, Inc. | 31,128 |
| 1,067,691 |
|
TriNet Group, Inc.(1) | 10,353 |
| 579,147 |
|
TrueBlue, Inc.(1) | 67,277 |
| 1,813,115 |
|
| | | 10,077,527 |
|
| Real Estate Management and Development — 0.2% | | |
Marcus & Millichap, Inc.(1) | 17,375 |
| 677,799 |
|
| RMR Group, Inc. (The), Class A | 4,168 |
| 326,979 |
|
| | | 1,004,778 |
|
| Road and Rail — 1.8% | | |
| ArcBest Corp. | 43,091 |
| 1,969,259 |
|
Avis Budget Group, Inc.(1) | 44,818 |
| 1,456,585 |
|
Covenant Transportation Group, Inc., Class A(1) | 27,172 |
| 855,918 |
|
USA Truck, Inc.(1) | 6,734 |
| 158,047 |
|
| Werner Enterprises, Inc. | 69,571 |
| 2,612,391 |
|
YRC Worldwide, Inc.(1) | 41,751 |
| 419,597 |
|
| | | 7,471,797 |
|
| | | |
| | | |
|
| | | | | |
| | Shares | Value |
| Semiconductors and Semiconductor Equipment — 4.6% | | |
Advanced Energy Industries, Inc.(1) | 37,797 |
| $ | 2,195,628 |
|
Amkor Technology, Inc.(1) | 158,438 |
| 1,360,982 |
|
| Cabot Microelectronics Corp. | 16,132 |
| 1,735,158 |
|
| Cohu, Inc. | 27,801 |
| 681,402 |
|
Diodes, Inc.(1) | 70,379 |
| 2,425,964 |
|
| Entegris, Inc. | 85,453 |
| 2,896,857 |
|
Lattice Semiconductor Corp.(1) | 65,745 |
| 431,287 |
|
| MKS Instruments, Inc. | 32,871 |
| 3,145,755 |
|
Nanometrics, Inc.(1) | 62,890 |
| 2,226,935 |
|
Rudolph Technologies, Inc.(1) | 46,916 |
| 1,388,714 |
|
SMART Global Holdings, Inc.(1) | 27,170 |
| 865,908 |
|
| | | 19,354,590 |
|
| Software — 3.7% | | |
A10 Networks, Inc.(1) | 19,579 |
| 121,977 |
|
Aspen Technology, Inc.(1) | 27,599 |
| 2,559,531 |
|
Fair Isaac Corp.(1) | 12,587 |
| 2,433,319 |
|
Imperva, Inc.(1) | 32,936 |
| 1,589,162 |
|
Model N, Inc.(1) | 32,956 |
| 612,982 |
|
| Pegasystems, Inc. | 27,317 |
| 1,496,972 |
|
| Progress Software Corp. | 63,562 |
| 2,467,477 |
|
Rosetta Stone, Inc.(1) | 24,045 |
| 385,441 |
|
Upland Software, Inc.(1) | 9,312 |
| 320,054 |
|
Verint Systems, Inc.(1) | 9,046 |
| 401,190 |
|
Zendesk, Inc.(1) | 53,819 |
| 2,932,597 |
|
Zix Corp.(1) | 104,452 |
| 562,996 |
|
| | | 15,883,698 |
|
| Specialty Retail — 4.1% | | |
| Abercrombie & Fitch Co., Class A | 54,181 |
| 1,326,351 |
|
| American Eagle Outfitters, Inc. | 89,632 |
| 2,083,944 |
|
Asbury Automotive Group, Inc.(1) | 37,164 |
| 2,547,592 |
|
Barnes & Noble Education, Inc.(1) | 166,281 |
| 937,825 |
|
| Buckle, Inc. (The) | 90,167 |
| 2,425,492 |
|
| Children's Place, Inc. (The) | 2,914 |
| 352,011 |
|
| Citi Trends, Inc. | 5,026 |
| 137,913 |
|
| Haverty Furniture Cos., Inc. | 9,120 |
| 196,992 |
|
Hibbett Sports, Inc.(1) | 83,871 |
| 1,920,646 |
|
Party City Holdco, Inc.(1) | 159,147 |
| 2,426,992 |
|
| Shoe Carnival, Inc. | 22,464 |
| 728,957 |
|
| Tailored Brands, Inc. | 90,194 |
| 2,301,751 |
|
| | | 17,386,466 |
|
| Technology Hardware, Storage and Peripherals — 0.1% | | |
Pure Storage, Inc., Class A(1) | 18,463 |
| 440,896 |
|
| Textiles, Apparel and Luxury Goods — 2.0% | | |
Crocs, Inc.(1) | 43,292 |
| 762,372 |
|
Deckers Outdoor Corp.(1) | 27,870 |
| 3,146,244 |
|
| Movado Group, Inc. | 15,069 |
| 727,833 |
|
|
| | | | | |
| | Shares | Value |
| Oxford Industries, Inc. | 23,605 |
| $ | 1,958,743 |
|
Perry Ellis International, Inc.(1) | 76,539 |
| 2,079,565 |
|
| | | 8,674,757 |
|
| Thrifts and Mortgage Finance — 2.4% | | |
Essent Group Ltd.(1) | 73,349 |
| 2,627,361 |
|
Flagstar Bancorp, Inc.(1) | 67,069 |
| 2,297,784 |
|
| Meta Financial Group, Inc. | 12,621 |
| 1,229,285 |
|
Nationstar Mortgage Holdings, Inc.(1) | 63,715 |
| 1,116,924 |
|
| TrustCo Bank Corp. NY | 60,882 |
| 541,850 |
|
| Washington Federal, Inc. | 70,715 |
| 2,312,381 |
|
| | | 10,125,585 |
|
| Trading Companies and Distributors — 2.1% | | |
| Aircastle Ltd. | 111,076 |
| 2,277,058 |
|
| Applied Industrial Technologies, Inc. | 44,272 |
| 3,105,681 |
|
| Kaman Corp. | 13,569 |
| 945,623 |
|
Rush Enterprises, Inc., Class A(1) | 59,029 |
| 2,560,678 |
|
| | | 8,889,040 |
|
| Wireless Telecommunication Services — 0.1% | | |
| Spok Holdings, Inc. | 38,772 |
| 583,519 |
|
TOTAL COMMON STOCKS
(Cost $362,324,523) | | 421,950,470 |
|
| TEMPORARY CASH INVESTMENTS — 0.8% | | |
| Repurchase Agreement, BMO Capital Markets Corp., (collateralized by various U.S. Treasury obligations, 1.375% - 3.75%, 2/15/19 - 11/15/47, valued at $1,949,163), in a joint trading account at 1.75%, dated 6/29/18, due 7/2/18 (Delivery value $1,910,093) | | 1,909,814 |
|
| Repurchase Agreement, Fixed Income Clearing Corp., (collateralized by various U.S. Treasury obligations, 2.75%, 2/15/28, valued at $1,627,356), at 0.90%, dated 6/29/18, due 7/2/18 (Delivery value $1,591,119) | | 1,591,000 |
|
| State Street Institutional U.S. Government Money Market Fund, Premier Class | 2,639 |
| 2,639 |
|
TOTAL TEMPORARY CASH INVESTMENTS
(Cost $3,503,453) | | 3,503,453 |
|
TOTAL INVESTMENT SECURITIES — 100.3%
(Cost $365,827,976) | | 425,453,923 |
|
| OTHER ASSETS AND LIABILITIES — (0.3)% | | (1,425,620 | ) |
| TOTAL NET ASSETS — 100.0% | | $ | 424,028,303 |
|
|
|
| NOTES TO SCHEDULE OF INVESTMENTS |
See Notes to Financial Statements.
|
|
| Statement of Assets and Liabilities |
|
| | | |
| JUNE 30, 2018 | |
| Assets | |
| Investment securities, at value (cost of $365,827,976) | $ | 425,453,923 |
|
| Receivable for investments sold | 7,322,237 |
|
| Receivable for capital shares sold | 19,381 |
|
| Dividends and interest receivable | 254,293 |
|
| | 433,049,834 |
|
| | |
| Liabilities | |
| Payable for investments purchased | 7,007,112 |
|
| Payable for capital shares redeemed | 2,014,419 |
|
| | 9,021,531 |
|
| | |
| Net Assets | $ | 424,028,303 |
|
| | |
| G Class Capital Shares, $0.01 Par Value | |
| Shares authorized | 340,000,000 |
|
| Shares outstanding | 41,767,057 |
|
| | |
| Net Asset Value Per Share | $ | 10.15 |
|
| | |
| Net Assets Consist of: | |
| Capital (par value and paid-in surplus) | $ | 332,097,079 |
|
| Undistributed net investment income | 1,825,955 |
|
| Undistributed net realized gain | 30,479,322 |
|
| Net unrealized appreciation | 59,625,947 |
|
| | $ | 424,028,303 |
|
See Notes to Financial Statements.
|
| | | |
| YEAR ENDED JUNE 30, 2018 | |
| Investment Income (Loss) | |
| Income: | |
| Dividends (net of foreign taxes withheld of $2,765) | $ | 4,201,338 |
|
| Interest | 37,272 |
|
| | 4,238,610 |
|
| | |
| Expenses: | |
| Management fees | 2,909,532 |
|
| Directors' fees and expenses | 27,141 |
|
| Other expenses | 6,450 |
|
| | 2,943,123 |
|
| Fees waived | (2,669,063 | ) |
| | 274,060 |
|
| | |
| Net investment income (loss) | 3,964,550 |
|
| | |
| Realized and Unrealized Gain (Loss) | |
| Net realized gain (loss) on: | |
| Investment transactions | 44,140,621 |
|
| Futures contract transactions | (151,170 | ) |
| | 43,989,451 |
|
| | |
| Change in net unrealized appreciation (depreciation) on investments | 12,517,018 |
|
| | |
| Net realized and unrealized gain (loss) | 56,506,469 |
|
| | |
| Net Increase (Decrease) in Net Assets Resulting from Operations | $ | 60,471,019 |
|
See Notes to Financial Statements.
|
|
| Statement of Changes in Net Assets |
|
| | | | | | |
| YEARS ENDED JUNE 30, 2018 AND JUNE 30, 2017 |
| Increase (Decrease) in Net Assets | June 30, 2018 | June 30, 2017 |
| Operations | | |
| Net investment income (loss) | $ | 3,964,550 |
| $ | 2,388,947 |
|
| Net realized gain (loss) | 43,989,451 |
| 56,660,011 |
|
| Change in net unrealized appreciation (depreciation) | 12,517,018 |
| 23,760,498 |
|
| Net increase (decrease) in net assets resulting from operations | 60,471,019 |
| 82,809,456 |
|
| | | |
| Distributions to Shareholders | | |
| From net investment income | (2,762,976 | ) | (2,490,014 | ) |
| From net realized gains | (56,272,650 | ) | — |
|
| Decrease in net assets from distributions | (59,035,626 | ) | (2,490,014 | ) |
| | | |
| Capital Share Transactions | | |
| Proceeds from shares sold | 29,785,693 |
| 74,053,520 |
|
| Proceeds from reinvestment of distributions | 59,035,626 |
| 2,490,014 |
|
| Payments for shares redeemed | (105,178,093 | ) | (110,250,526 | ) |
| Net increase (decrease) in net assets from capital share transactions | (16,356,774 | ) | (33,706,992 | ) |
| | | |
| Net increase (decrease) in net assets | (14,921,381 | ) | 46,612,450 |
|
| | | |
| Net Assets | | |
| Beginning of period | 438,949,684 |
| 392,337,234 |
|
| End of period | $ | 424,028,303 |
| $ | 438,949,684 |
|
| | | |
| Undistributed net investment income | $ | 1,825,955 |
| $ | 847,777 |
|
| | | |
| Transactions in Shares of the Fund | | |
| Sold | 2,936,932 |
| 7,748,770 |
|
| Issued in reinvestment of distributions | 6,185,583 |
| 266,197 |
|
| Redeemed | (10,098,030 | ) | (11,379,065 | ) |
| Net increase (decrease) in shares of the fund | (975,515 | ) | (3,364,098 | ) |
See Notes to Financial Statements.
|
|
| Notes to Financial Statements |
JUNE 30, 2018
1. Organization
American Century Quantitative Equity Funds, Inc. (the corporation) is registered under the Investment Company Act of 1940, as amended (the 1940 Act), as an open-end management investment company and is organized as a Maryland corporation. NT Small Company Fund (the fund) is one fund in a series issued by the corporation. The fund’s investment objective is to seek long-term capital growth. The fund is not permitted to invest in securities issued by companies assigned the Global Industry Classification Standard or the Bloomberg Industry Classification Standard for the tobacco industry. The fund offers the G Class (formerly Institutional Class).
2. Significant Accounting Policies
The following is a summary of significant accounting policies consistently followed by the fund in preparation of its financial statements. The fund is an investment company and follows accounting and reporting guidance in accordance with accounting principles generally accepted in the United States of America. This may require management to make certain estimates and assumptions at the date of the financial statements. Actual results could differ from these estimates. Management evaluated the impact of events or transactions occurring through the date the financial statements were issued that would merit recognition or disclosure.
Investment Valuations — The fund determines the fair value of its investments and computes its net asset value per share at the close of regular trading (usually 4 p.m. Eastern time) on the New York Stock Exchange (NYSE) on each day the NYSE is open. The Board of Directors has adopted valuation policies and procedures to guide the investment advisor in the fund’s investment valuation process and to provide methodologies for the oversight of the fund’s pricing function.
Equity securities that are listed or traded on a domestic securities exchange are valued at the last reported sales price or at the official closing price as provided by the exchange. Equity securities traded on foreign securities exchanges are generally valued at the closing price of such securities on the exchange where primarily traded or at the close of the NYSE, if that is earlier. If no last sales price is reported, or if local convention or regulation so provides, the mean of the latest bid and asked prices may be used. Securities traded over-the-counter are valued at the mean of the latest bid and asked prices, the last sales price, or the official closing price.
Open-end management investment companies are valued at the reported net asset value per share. Repurchase agreements are valued at cost, which approximates fair value. Exchange-traded futures contracts are valued at the settlement price as provided by the appropriate exchange.
If the fund determines that the market price for an investment is not readily available or the valuation methods mentioned above do not reflect an investment’s fair value, such investment is valued as determined in good faith by the Board of Directors or its delegate, in accordance with policies and procedures adopted by the Board of Directors. In its determination of fair value, the fund may review several factors including, but not limited to, market information regarding the specific investment or comparable investments and correlation with other investment types, futures indices or general market indicators. Circumstances that may cause the fund to use these procedures to value an investment include, but are not limited to: an investment has been declared in default or is distressed; trading in a security has been suspended during the trading day or a security is not actively trading on its principal exchange; prices received from a regular pricing source are deemed unreliable; or there is a foreign market holiday and no trading occurred.
The fund monitors for significant events occurring after the close of an investment’s primary exchange but before the fund’s net asset value per share is determined. Significant events may include, but are not limited to: corporate announcements and transactions; governmental action and political unrest that could impact a specific investment or an investment sector; or armed conflicts, natural disasters and similar events that could affect investments in a specific country or region. The fund also monitors for significant fluctuations between domestic and foreign markets, as evidenced by the U.S. market or such other indicators that the Board of Directors, or its delegate, deems appropriate. If significant fluctuations in foreign markets are identified, the fund may apply a model-derived factor to the closing price of equity securities traded on foreign securities exchanges. The factor is based on observable market data as provided by an independent pricing service.
Security Transactions — Security transactions are accounted for as of the trade date. Net realized gains and losses are determined on the identified cost basis, which is also used for federal income tax purposes.
Investment Income — Dividend income less foreign taxes withheld, if any, is recorded as of the ex-dividend date. Distributions received on securities that represent a return of capital or long-term capital gain are recorded as a reduction of cost of investments and/or as a realized gain. The fund may estimate the components of distributions received that may be considered nontaxable distributions or long-term capital gain distributions for income tax purposes. Interest income is recorded on the accrual basis and includes accretion of discounts and amortization of premiums.
Repurchase Agreements — The fund may enter into repurchase agreements with institutions that American Century Investment Management, Inc. (ACIM) (the investment advisor) has determined are creditworthy pursuant to criteria adopted by the Board of Directors. The fund requires that the collateral, represented by securities, received in a repurchase transaction be transferred to the custodian in a manner sufficient to enable the fund to obtain those securities in the event of a default under the repurchase agreement. ACIM monitors, on a daily basis, the securities transferred to ensure the value, including accrued interest, of the securities under each repurchase agreement is equal to or greater than amounts owed to the fund under each repurchase agreement.
Joint Trading Account — Pursuant to an Exemptive Order issued by the Securities and Exchange Commission, the fund, along with certain other funds in the American Century Investments family of funds, may transfer uninvested cash balances into a joint trading account. These balances are invested in one or more repurchase agreements that are collateralized by U.S. Treasury or Agency obligations.
Segregated Assets — In accordance with the 1940 Act, the fund segregates assets on its books and records to cover certain types of investment securities and other financial instruments. ACIM monitors, on a daily basis, the securities segregated to ensure the fund designates a sufficient amount of liquid assets, marked-to-market daily. The fund may also receive assets or be required to pledge assets at the custodian bank or with a broker for collateral requirements.
Income Tax Status — It is the fund’s policy to distribute substantially all net investment income and net realized gains to shareholders and to otherwise qualify as a regulated investment company under provisions of the Internal Revenue Code. Accordingly, no provision has been made for income taxes. The fund files U.S. federal, state, local and non-U.S. tax returns as applicable. The fund's tax returns are subject to examination by the relevant taxing authority until expiration of the applicable statute of limitations, which is generally three years from the date of filing but can be longer in certain jurisdictions. At this time, management believes there are no uncertain tax positions which, based on their technical merit, would not be sustained upon examination and for which it is reasonably possible that the total amounts of unrecognized tax benefits will significantly change in the next twelve months.
Distributions to Shareholders — Distributions from net investment income, if any, are generally declared and paid quarterly. Distributions from net realized gains, if any, are generally declared and paid annually.
Indemnifications — Under the corporation’s organizational documents, its officers and directors are indemnified against certain liabilities arising out of the performance of their duties to the fund. In addition, in the normal course of business, the fund enters into contracts that provide general indemnifications. The maximum exposure under these arrangements is unknown as this would involve future claims that may be made against a fund. The risk of material loss from such claims is considered by management to be remote.
3. Fees and Transactions with Related Parties
Certain officers and directors of the corporation are also officers and/or directors of American Century Companies, Inc. (ACC). The corporation’s investment advisor, ACIM, the corporation's distributor, American Century Investment Services, Inc., and the corporation’s transfer agent, American Century Services, LLC, are wholly owned, directly or indirectly, by ACC. Various funds issued by American Century Asset Allocation Portfolios, Inc. own, in aggregate, 100% of the shares of the fund. Related parties do not invest in the fund for the purpose of exercising management or control.
Management Fees — The corporation has entered into a management agreement with ACIM, under which ACIM provides the fund with investment advisory and management services in exchange for a single, unified management fee (the fee). The agreement provides that all expenses of managing and operating the fund, except brokerage expenses, taxes, interest, fees and expenses of the independent directors (including legal counsel fees), and extraordinary expenses, will be paid by ACIM. The fee is computed and accrued daily
based on the daily net assets of the fund and paid monthly in arrears. The fee consists of (1) an Investment Category Fee based on the daily net assets of the fund and certain other accounts managed by the investment advisor that are in the same broad investment category as the fund and (2) a Complex Fee based on the assets of all the funds in the American Century Investments family of funds. The rates for the Investment Category Fee range from 0.5380% to 0.7200%. The rates for the Complex Fee range from 0.0500% to 0.1100%. The investment advisor agreed to waive the fund's management fee in its entirety. The investment advisor expects this waiver to remain in effect permanently and cannot terminate it without the approval of the Board of Directors. The effective annual management fee for the period ended June 30, 2018 was 0.66% before waiver and 0.06% after waiver.
Directors' Fees and Expenses — The Board of Directors is responsible for overseeing the investment advisor’s management and operations of the fund. The directors receive detailed information about the fund and its investment advisor regularly throughout the year, and meet at least quarterly with management of the investment advisor to review reports about fund operations. The fund’s officers do not receive compensation from the fund.
Interfund Transactions — The fund may enter into security transactions with other American Century Investments funds and other client accounts of the investment advisor, in accordance with the 1940 Act rules and procedures adopted by the Board of Directors. The rules and procedures require, among other things, that these transactions be effected at the independent current market price of the security. During the period, the interfund purchases and sales were $3,789,841 and $1,119,824, respectively. The effect of interfund transactions on the Statement of Operations was $134,618 in net realized gain (loss) on investment transactions.
4. Investment Transactions
Purchases and sales of investment securities, excluding short-term investments, for the period ended June 30, 2018 were $433,997,343 and $510,830,891, respectively.
5. Fair Value Measurements
The fund’s investments valuation process is based on several considerations and may use multiple inputs to determine the fair value of the investments held by the fund. In conformity with accounting principles generally accepted in the United States of America, the inputs used to determine a valuation are classified into three broad levels.
| |
| • | Level 1 valuation inputs consist of unadjusted quoted prices in an active market for identical investments. |
| |
| • | Level 2 valuation inputs consist of direct or indirect observable market data (including quoted prices for comparable investments, evaluations of subsequent market events, interest rates, prepayment speeds, credit risk, etc.). These inputs also consist of quoted prices for identical investments initially expressed in local currencies that are adjusted through translation into U.S. dollars. |
| |
| • | Level 3 valuation inputs consist of unobservable data (including a fund’s own assumptions). |
The level classification is based on the lowest level input that is significant to the fair valuation measurement. The valuation inputs are not necessarily an indication of the risks associated with investing in these securities or other financial instruments. There were no significant transfers between levels during the period.
The following is a summary of the level classifications as of period end. The Schedule of Investments provides additional information on the fund’s portfolio holdings. |
| | | | | | | | |
| | Level 1 | Level 2 | Level 3 |
| Assets | | | |
| Investment Securities | | | |
| Common Stocks | $ | 421,950,470 |
| — |
| — |
|
| Temporary Cash Investments | 2,639 |
| $ | 3,500,814 |
| — |
|
| | $ | 421,953,109 |
| $ | 3,500,814 |
| — |
|
6. Derivative Instruments
Equity Price Risk — The fund is subject to equity price risk in the normal course of pursuing its investment objectives. A fund may enter into futures contracts based on an equity index in order to manage its exposure to changes in market conditions. A fund may purchase futures contracts to gain exposure to increases in market value or sell futures contracts to protect against a decline in market value. Upon entering into a futures contract, a fund is required to deposit either cash or securities in an amount equal to a certain percentage of the contract value (initial margin). Subsequent payments (variation margin) are made or received daily, in cash, by a fund. The variation margin is equal to the daily change in the contract value and is recorded as unrealized gains and losses. A fund recognizes a realized gain or loss when the contract is closed or expires. Net realized and unrealized gains or losses occurring during the holding period of futures contracts are a component of net realized gain (loss) on futures contract transactions and change in net unrealized appreciation (depreciation) on futures contracts, respectively. One of the risks of entering into futures contracts is the possibility that the change in value of the contract may not correlate with the changes in value of the underlying securities. During the period, the fund participated in equity price risk derivative instruments for temporary investment purposes.
At period end, the fund did not have any derivative instruments disclosed on the Statement of Assets and Liabilities. For the year ended June 30, 2018, the effect of equity price risk derivative instruments on the Statement of Operations was $(151,170) in net realized gain (loss) on futures contract transactions.
7. Risk Factors
The fund invests in common stocks of small companies. Because of this, the fund may be subject to greater risk and market fluctuations than a fund investing in larger, more established companies.
8. Federal Tax Information
The tax character of distributions paid during the years ended June 30, 2018 and June 30, 2017 were as follows:
|
| | | | | | |
| | 2018 | 2017 |
| Distributions Paid From | | |
| Ordinary income | $ | 4,543,376 |
| $ | 2,490,014 |
|
| Long-term capital gains | $ | 54,492,250 |
| — |
|
The book-basis character of distributions made during the year from net investment income or net realized gains may differ from their ultimate characterization for federal income tax purposes. These differences reflect the differing character of certain income items and net realized gains and losses for financial statement and tax purposes, and may result in reclassification among certain capital accounts on the financial statements.
As of period end, the federal tax cost of investments and the components of distributable earnings on a tax-basis were as follows:
|
| | | |
| Federal tax cost of investments | $ | 367,003,314 |
|
| Gross tax appreciation of investments | $ | 71,692,171 |
|
| Gross tax depreciation of investments | (13,241,562 | ) |
| Net tax appreciation (depreciation) of investments | $ | 58,450,609 |
|
| Undistributed ordinary income | $ | 3,919,937 |
|
| Accumulated long-term gains | $ | 29,560,678 |
|
The difference between book-basis and tax-basis unrealized appreciation (depreciation) is attributable primarily to the tax deferral of losses on wash sales.
|
| | | | | | | | | | | | | | | | | |
| For a Share Outstanding Throughout the Years Ended June 30 (except as noted) | | | | | |
| Per-Share Data | | | | | | | Ratios and Supplemental Data | |
| | | Income From Investment Operations: | Distributions From: | | | Ratio to Average Net Assets of: | | |
| | Net Asset Value, Beginning of Period | Net Investment Income (Loss)(1) | Net Realized and Unrealized Gain (Loss) | Total From Investment Operations | Net Investment Income | Net Realized Gains | Total Distributions | Net Asset Value, End of Period | Total Return(2) | Operating
Expenses | Operating
Expenses
(before
expense
waiver) | Net
Investment
Income
(Loss) | Net
Investment
Income
(Loss)
(before
expense
waiver) | Portfolio
Turnover
Rate | Net
Assets,
End of
Period
(in thousands) |
G Class(3) | | | | | | | | | | | | |
| 2018 | $10.27 | 0.09 | 1.26 | 1.35 | (0.06) | (1.41) | (1.47) | $10.15 | 14.13% | 0.06% | 0.66% | 0.90% | 0.30% | 99% |
| $424,028 |
|
| 2017 | $8.51 | 0.05 | 1.77 | 1.82 | (0.06) | — | (0.06) | $10.27 | 21.42% | 0.67% | 0.67% | 0.57% | 0.57% | 118% |
| $438,950 |
|
| 2016 | $10.13 | 0.05 | (0.89) | (0.84) | (0.05) | (0.73) | (0.78) | $8.51 | (8.27)% | 0.67% | 0.67% | 0.56% | 0.56% | 107% |
| $392,337 |
|
| 2015 | $11.00 | 0.04 | 0.41 | 0.45 | (0.03) | (1.29) | (1.32) | $10.13 | 5.12% | 0.67% | 0.67% | 0.43% | 0.43% | 119% |
| $353,174 |
|
| 2014 | $9.89 | 0.04 | 2.48 | 2.52 | (0.04) | (1.37) | (1.41) | $11.00 | 26.77% | 0.67% | 0.67% | 0.38% | 0.38% | 96% |
| $371,130 |
|
|
|
| Notes to Financial Highlights |
| |
| (1) | Computed using average shares outstanding throughout the period. |
| |
| (2) | Total returns are calculated based on the net asset value of the last business day. Total returns for periods less than one year are not annualized. |
| |
| (3) | Prior to July 31, 2017, the G Class was referred to as the Institutional Class. |
See Notes to Financial Statements.
|
|
| Report of Independent Registered Public Accounting Firm |
To the Board of Directors of American Century Quantitative Equity Funds, Inc. and Shareholders of NT Small Company Fund
Opinion on the Financial Statements
We have audited the accompanying statement of assets and liabilities, including the schedule of investments, of NT Small Company Fund (one of the funds constituting American Century Quantitative Equity Funds, Inc., referred to hereafter as the "Fund") as of June 30, 2018, the related statement of operations for the year ended June 30, 2018, the statement of changes in net assets for each of the two years in the period ended June 30, 2018, including the related notes, and the financial highlights for each of the five years in the period ended June 30, 2018 (collectively referred to as the “financial statements”). In our opinion, the financial statements present fairly, in all material respects, the financial position of the Fund as of June 30, 2018, the results of its operations for the year then ended, the changes in its net assets for each of the two years in the period ended June 30, 2018 and the financial highlights for each of the five years in the period ended June 30, 2018 in conformity with accounting principles generally accepted in the United States of America.
Basis for Opinion
These financial statements are the responsibility of the Fund’s management. Our responsibility is to express an opinion on the Fund’s financial statements based on our audits. We are a public accounting firm registered with the Public Company Accounting Oversight Board (United States) (“PCAOB”) and are required to be independent with respect to the Fund in accordance with the U.S. federal securities laws and the applicable rules and regulations of the Securities and Exchange Commission and the PCAOB.
We conducted our audits of these financial statements in accordance with the standards of the PCAOB. Those standards require that we plan and perform the audit to obtain reasonable assurance about whether the financial statements are free of material misstatement, whether due to error or fraud.
Our audits included performing procedures to assess the risks of material misstatement of the financial statements, whether due to error or fraud, and performing procedures that respond to those risks. Such procedures included examining, on a test basis, evidence regarding the amounts and disclosures in the financial statements. Our audits also included evaluating the accounting principles used and significant estimates made by management, as well as evaluating the overall presentation of the financial statements. Our procedures included confirmation of securities owned as of June 30, 2018 by correspondence with the custodian and brokers; when replies were not received from brokers, we performed other auditing procedures. We believe that our audits provide a reasonable basis for our opinion.
/s/ PricewaterhouseCoopers LLP
Kansas City, Missouri
August 16, 2018
We have served as the auditor of one or more investment companies in American Century Investments since 1997.
The Board of Directors
The individuals listed below serve as directors of the funds. Each director will continue to serve in this capacity until death, retirement, resignation or removal from office. The board has adopted a mandatory retirement age for directors who are not “interested persons,” as that term is defined in the Investment Company Act (independent directors). Independent directors shall retire by December 31 of the year in which they reach their 75th birthday; provided, however, that on or after January 1, 2022, independent trustees shall retire on December 31 of the year in which they reach their 76th birthday.
Mr. Thomas is an “interested person” because he currently serves as President and Chief Executive Officer of American Century Companies, Inc. (ACC), the parent company of American Century Investment Management, Inc. (ACIM or the advisor). The other directors (more than three-fourths of the total number) are independent. They are not employees, directors or officers of, and have no financial interest in, ACC or any of its wholly owned, direct or indirect, subsidiaries, including ACIM, American Century Investment Services, Inc. (ACIS) and American Century Services, LLC (ACS), and they do not have any other affiliations, positions or relationships that would cause them to be considered “interested persons” under the Investment Company Act. The directors serve in this capacity for eight (in the case of Jonathan S. Thomas, 16; and Ronald J. Gilson, 9) registered investment companies in the American Century Investments family of funds.
The following table presents additional information about the directors. The mailing address for each director other than Mr. Thomas is 1665 Charleston Road, Mountain View, California 94043. The mailing address for Mr. Thomas is 4500 Main Street, Kansas City, Missouri 64111.
|
| | | | | |
Name
(Year of Birth) | Position(s) Held with Funds | Length of Time Served | Principal Occupation(s) During Past 5 Years | Number of American Century Portfolios Overseen by Director | Other Directorships Held During Past 5 Years |
| Independent Directors |
|
|
Tanya S. Beder
(1955) | Director | Since 2011 | Chairman and CEO, SBCC Group Inc. (independent advisory services) (2006 to present) | 45 | CYS Investments, Inc.; Nabors Industries Ltd. |
Jeremy I. Bulow
(1954) | Director | Since 2011 | Professor of Economics, Stanford University, Graduate School of Business (1979 to present) | 45 | None |
Anne Casscells
(1958) | Director | Since 2016 | Co-Chief Executive Officer and Chief Investment Officer, Aetos Alternatives Management (investment advisory firm) (2001 to present); Lecturer in Accounting, Stanford University, Graduate School of Business (2009 to present) | 45 | None |
|
| | | | | |
Name
(Year of Birth) | Position(s) Held with Funds | Length of Time Served | Principal Occupation(s) During Past 5 Years | Number of American Century Portfolios Overseen by Director | Other Directorships Held During Past 5 Years |
| Independent Directors |
|
|
Ronald J. Gilson
(1946) | Director and Chairman of the Board | Since 1995
(Chairman since 2005) | Charles J. Meyers Professor of Law and Business, Emeritus, Stanford Law School (1979 to 2016); Marc and Eva Stern Professor of Law and Business, Columbia University School of Law (1992 to present) | 47 | None |
Frederick L. A. Grauer
(1946) | Director | Since 2008 | Senior Advisor, iShares by BlackRock, Inc. (investment management firm) (2010 to 2011, 2013 to 2015); Senior Advisor, Course Hero (an educational technology company) (2015 to present) | 45 | None |
Jonathan D. Levin
(1972) | Director | Since 2016 | Philip H. Knight Professor and Dean, Graduate School of Business, Stanford University (2016 to present); Professor, Stanford University, (2000 to present); Chair, Department of Economics, Stanford University (2011 to 2014) | 45 | None |
Peter F. Pervere
(1947) | Director | Since 2007 | Retired | 45 | None |
John B. Shoven
(1947) | Director | Since 2002 | Charles R. Schwab Professor of Economics, Stanford University (1973 to present) | 45 | Cadence Design Systems; Exponent; Financial Engines |
| Interested Director |
|
|
Jonathan S. Thomas
(1963) | Director and President | Since 2007 | President and Chief Executive Officer, ACC (2007 to present). Also serves as Chief Executive Officer, ACS; Executive Vice President, ACIM; Director, ACC, ACIM and other ACC subsidiaries | 115 | BioMed Valley Discoveries, Inc. |
The Statement of Additional Information has additional information about the fund's directors and is available without charge, upon request, by calling 1-800-345-2021.
Officers
The following table presents certain information about the executive officers of the funds. Each officer serves as an officer for each of the 16 (in the case of Robert J. Leach, 15) investment companies in the American Century family of funds, unless otherwise noted. No officer is compensated for his or her service as an officer of the funds. The listed officers are interested persons of the funds and are appointed or re-appointed on an annual basis. The mailing address for each officer listed below is 4500 Main Street, Kansas City, Missouri 64111.
|
| | |
Name
(Year of Birth) | Offices with the Funds | Principal Occupation(s) During the Past Five Years |
Jonathan S. Thomas
(1963) | Director and President since 2007 | President and Chief Executive Officer, ACC (2007 to present). Also serves as Chief Executive Officer, ACS; Executive Vice President, ACIM; Director, ACC, ACIM and other ACC subsidiaries |
Amy D. Shelton
(1964) | Chief Compliance Officer and Vice President since 2014 | Chief Compliance Officer, American Century funds, (2014 to present); Chief Compliance Officer, ACIM (2014 to present); Chief Compliance Officer, ACIS (2009 to present); Vice President, Client Interactions and Marketing, ACIS (2013 to 2014). Also serves as Vice President, ACIS |
Charles A. Etherington
(1957) | General Counsel since 2007 and Senior Vice President since 2006 | Attorney, ACC (1994 to present); Vice President, ACC (2005 to present); General Counsel, ACC (2007 to present). Also serves as General Counsel, ACIM, ACS, ACIS and other ACC subsidiaries; and Senior Vice President, ACIM and ACS |
C. Jean Wade
(1964) | Vice President,Treasurer and Chief Financial Officer since 2012 | Senior Vice President, ACS (2017 to present); Vice President, ACS (2000 to 2017) |
Robert J. Leach
(1966) | Vice President since 2006 and Assistant Treasurer since 2012 | Vice President, ACS (2000 to present) |
David H. Reinmiller
(1963) | Vice President since 2000 | Attorney, ACC (1994 to present). Also serves as Vice President, ACIM and ACS |
Ward D. Stauffer
(1960) | Secretary since 2005 | Attorney, ACC (2003 to present) |
|
|
| Approval of Management Agreement |
At a meeting held on June 19, 2018, the Fund’s Board of Directors (the "Board") unanimously approved the renewal of the management agreement pursuant to which American Century Investment Management, Inc. (the “Advisor”) acts as the investment advisor for the Fund. Under Section 15(c) of the Investment Company Act, contracts for investment advisory services are required to be reviewed, evaluated, and approved by a majority of a fund’s directors/trustees, including a majority of the independent Directors, each year. The Board regards this annual evaluation and renewal as one of its most important responsibilities.
The independent Directors have memorialized a statement regarding the relationship between their ongoing obligations to oversee and evaluate the performance of the Advisor and their annual consideration of renewal of the management agreement. In that statement, the independent Directors noted that their assessment of the Advisor’s performance is an ongoing process that takes place over the entire year and is informed by all of the extensive information that the Board and its committees receive and consider over time. This information, together with the additional materials provided specifically in connection with the review, are central to the Board’s assessment of the Advisor’s performance and its determination whether to renew the Fund’s management agreement.
Prior to its consideration of the renewal of the management agreement, the Board requested and reviewed extensive data and analysis relating to the proposed renewal. This information and analysis was compiled by the Advisor and certain independent providers of evaluation data concerning the Fund and the services provided to the Fund by the Advisor.
In connection with its consideration of the renewal of the management agreement, the Board’s review and evaluation of the services provided by the Advisor included, but was not limited to, the following:
| |
| • | the nature, extent, and quality of investment management, shareholder services, and other services provided to the Fund; |
| |
| • | the wide range of other programs and services the Advisor provides to the Fund and its shareholders on a routine and non-routine basis; |
| |
| • | the investment performance of the Fund, including data comparing the Fund’s performance to appropriate benchmarks and/or a peer group of other mutual funds with similar investment objectives and strategies; |
| |
| • | the cost of owning the Fund compared to the cost of owning similar funds; |
| |
| • | the Advisor’s compliance policies, procedures, and regulatory experience; |
| |
| • | financial data showing the cost of services provided to the Fund, the profitability of the Fund to the Advisor, and the overall profitability of the Advisor; |
| |
| • | strategic plans of the Advisor; |
| |
| • | any economies of scale associated with the Advisor’s management of the Fund and other accounts; |
| |
| • | services provided and charges to other investment management clients of the Advisor; |
| |
| • | acquired fund fees and expenses; |
| |
| • | payments and practices in connection with financial intermediaries holding shares of the Fund and the services provided by intermediaries in connection therewith; and |
| |
| • | any collateral benefits derived by the Advisor from the management of the Fund. |
In keeping with its practice, the Board held two in-person meetings to review and discuss the information provided in response to their request and held active discussions with the Advisor regarding the renewal of the management agreement. The independent Directors had the benefit of the advice of their independent counsel throughout the process.
Factors Considered
The Directors considered all of the information provided by the Advisor, the independent data providers, and the independent Directors’ independent counsel in connection with the approval. They determined that the information was sufficient for them to evaluate the management agreement for the Fund. In connection with their review, the Directors did not identify any single factor as being all-important or controlling and each Director may have attributed different levels of importance to different factors. In deciding to renew the management agreement, the Board based its decision on a number of factors, including the following:
Nature, Extent and Quality of Services - Generally. Under the management agreement, the Advisor is responsible for providing or arranging for all services necessary for the operation of the Fund. The Board noted that the Advisor provides or arranges at its own expense a wide variety of services including:
| |
| • | constructing and designing the Fund |
| |
| • | portfolio research and security selection |
| |
| • | initial capitalization/funding |
| |
| • | daily valuation of the Fund’s portfolio |
| |
| • | shareholder servicing and transfer agency, including shareholder confirmations, recordkeeping, and communications |
| |
| • | legal services (except the independent Directors’ counsel) |
| |
| • | regulatory and portfolio compliance |
| |
| • | marketing and distribution (except amounts paid by the Fund under Rule 12b-1 plans) |
The Board noted that many of these services have expanded over time in terms of both quantity and complexity in response to shareholder demands, competition in the industry, changing distribution channels, and the changing regulatory environment.
Investment Management, Shareholder, and Other Services. The nature of the investment management services provided to the Fund is quite complex and allows Fund shareholders access to professional money management, instant diversification of their investments within an asset class, the opportunity to easily diversify among asset classes by investing in or exchanging among various American Century Investments funds, and liquidity. In evaluating investment performance, the Board expects the Advisor to manage the Fund in accordance with its investment objectives and approved strategies. Further, the Directors recognize that the Advisor has an obligation to seek the best execution of fund trades. In providing these services, the Advisor utilizes teams of investment professionals (portfolio managers, analysts, research assistants, and securities traders) who require extensive information technology, research, training, compliance, and other systems to conduct their business. The Board, directly and through its Portfolio Committee, regularly reviews investment performance information for the Fund, together with comparative information for appropriate benchmarks and/or peer groups of similarly-managed funds, over different time horizons. The Directors also review detailed performance information during the management agreement approval process. If performance concerns are identified, the Fund receives special reviews until performance improves, during which the Board discusses with the Advisor the reasons for such results (e.g., market conditions, security selection) and any efforts being undertaken to improve performance. The Fund’s performance was above its benchmark for the five-year period and below its benchmark for the one-, three-, and ten-year periods reviewed by the Board. The Board found the investment management services provided by the Advisor to the Fund to be satisfactory and consistent with the management agreement.
Under the management agreement, the Advisor provides the Fund with a comprehensive package of transfer agency, shareholder, and other services. The Board, directly and through various committees of the Board, regularly reviews reports and evaluations of such services at its regular meetings. These reports include, but are not limited to, information regarding the operational efficiency and accuracy of the shareholder and transfer agency services provided, staffing levels, shareholder satisfaction (as measured by external as well as internal sources), technology support, new products and services offered to Fund shareholders, securities trading activities, portfolio valuation services, auditing services, and legal and operational compliance activities. The Board found the services provided by the Advisor to the Fund under the management agreement to be competitive and of high quality.
Costs of Services and Profitability. The Advisor provides detailed information concerning its cost of providing various services to the Fund, its profitability in managing the Fund, its overall profitability, and its financial condition. The Directors have reviewed with the Advisor the methodology used to prepare this financial information. This information is considered in evaluating the Advisor’s financial condition, its ability to continue to provide services under the management agreement, and the reasonableness of the current management fee. The Board concluded that the Advisor’s profits were reasonable in light of the services provided to the Fund.
Economies of Scale. The Board also reviewed information provided by the Advisor regarding the possible existence of economies of scale in connection with the management of the Fund. The Board concluded that economies of scale are difficult to measure and predict with precision, especially on a fund-by-fund basis. The Board concluded that the Advisor is appropriately sharing economies of scale through its competitive fee structure, offering competitive fees from fund inception, and through reinvestment in its business to provide shareholders enhanced and expanded services.
Comparison to Other Funds’ Fees. The management agreement provides that the Fund pays the Advisor a single, all-inclusive (or unified) management fee for providing all services necessary for the management and operation of the Fund, other than brokerage expenses, expenses attributable to short sales, taxes, interest, extraordinary expenses, the fees and expenses of the Fund’s independent Directors (including their independent legal counsel), and expenses incurred in connection with the provision of shareholder services and distribution services under a plan adopted pursuant to Rule 12b-1 under the 1940 Act. Under the unified fee structure, the Advisor is responsible for providing all investment advisory, custody, audit, administrative, compliance, recordkeeping, marketing, and shareholder services, or arranging and supervising third parties to provide such services. By contrast, most other funds are charged a variety of fees, including an investment advisory fee, a transfer agency fee, an administrative fee, distribution charges, and other expenses. Other than their investment advisory fees and any applicable Rule 12b-1 distribution fees, all other components of the total fees charged by these other funds may be increased without shareholder approval. The Board believes the unified fee structure is a benefit to Fund shareholders because it clearly discloses to shareholders the cost of owning Fund shares, and, since the unified fee cannot be increased without a vote of Fund shareholders, it shifts to the Advisor the risk of increased costs of operating the Fund and provides a direct incentive to minimize administrative inefficiencies. Part of the Board’s analysis of fee levels involves reviewing certain evaluative data compiled by an independent provider and comparing the Fund’s unified fee to the total expense ratio of peer funds. The unified fee charged to shareholders of the Fund was the lowest of the total expense ratios of the Fund’s peer group. The Board concluded that the management fee paid by the Fund to the Advisor under the management agreement is reasonable in light of the services provided to the Fund.
Comparison to Fees and Services Provided to Other Clients of the Advisor. The Board also requested and received information from the Advisor concerning the nature of the services, fees, costs, and profitability of its advisory services to advisory clients other than the Fund. They observed that these varying types of client accounts require different services and involve different regulatory and entrepreneurial risks than the management of the Fund. The Board analyzed this
information and concluded that the fees charged and services provided to the Fund were reasonable by comparison.
Payments to Intermediaries. The Directors also requested and received a description of payments made to intermediaries by the Fund and the Advisor and services provided by intermediaries. These payments include various payments made by the Fund or the Advisor to different types of intermediaries and recordkeepers for distribution and service activities provided for the Fund. The Directors reviewed such information and received representations from the Advisor that all such payments by the Fund were made pursuant to the Fund’s Rule 12b-1 Plan and that all such payments by the Advisor were made from the Advisor’s resources and reasonable profits. The Board found such payments to be reasonable in scope and purpose.
Collateral or “Fall-Out” Benefits Derived by the Advisor. The Board considered the existence of collateral benefits the Advisor may receive as a result of its relationship with the Fund. The Board noted that the Advisor’s primary business is managing mutual funds and it generally does not use fund or shareholder information to generate profits in other lines of business, and therefore does not derive any significant collateral benefits from them. The Board noted that the Advisor may receive proprietary research from broker-dealers that execute fund portfolio transactions. The Board also determined that the Advisor is able to provide investment management services to certain clients other than the Fund, at least in part, due to its existing infrastructure built to serve the fund complex. The Board noted that the assets of those other accounts are, where applicable, included with the assets of the Fund to determine breakpoints in the management fee schedule.
Existing Relationship. The Board also considered whether there was any reason for not continuing the existing arrangement with the Advisor. In this regard, the Board was mindful of the potential disruptions of the Fund’s operations and various risks, uncertainties, and other effects that could occur as a result of a decision not to continue such relationship. In particular, the Board recognized that most shareholders have invested in the Fund on the strength of the Advisor’s industry standing and reputation and in the expectation that the Advisor will have a continuing role in providing advisory services to the Fund.
Conclusion of the Directors. As a result of this process, the Board, including all of the independent Directors and assisted by the advice of independent legal counsel, taking into account all of the factors discussed above and the information provided by the Advisor and others in connection with its review and throughout the year, concluded that the management agreement between the Fund and the Advisor is fair and reasonable in light of the services provided and should be renewed.
Retirement Account Information
As required by law, distributions you receive from certain retirement accounts are subject to federal income tax withholding, unless you elect not to have withholding apply*. Tax will be withheld on the total amount withdrawn even though you may be receiving amounts that are not subject to withholding, such as nondeductible contributions. In such case, excess amounts of withholding could occur. You may adjust your withholding election so that a greater or lesser amount will be withheld.
If you don’t want us to withhold on this amount, you must notify us to not withhold the federal income tax. You may notify us in writing or in certain situations by telephone or through other electronic means. For systematic withdrawals, your withholding election will remain in effect until revoked or changed by filing a new election. You have the right to revoke your election at any time and change your withholding percentage for future distributions.
Remember, even if you elect not to have income tax withheld, you are liable for paying income tax on the taxable portion of your withdrawal. If you elect not to have income tax withheld or you don’t have enough income tax withheld, you may be responsible for payment of estimated tax. You may incur penalties under the estimated tax rules if your withholding and estimated tax payments are not sufficient. You can reduce or defer the income tax on a distribution by directly or indirectly rolling such distribution over to another IRA or eligible plan. You should consult your tax advisor for additional information.
State tax will be withheld if, at the time of your distribution, your address is within one of the mandatory withholding states and you have federal income tax withheld (or as otherwise required by state law). State taxes will be withheld from your distribution in accordance with the respective state rules.
*Some 403(b), 457 and qualified retirement plan distributions may be subject to 20% mandatory withholding, as they are subject to special tax and withholding rules. Your plan administrator or plan sponsor is required to provide you with a special tax notice explaining those rules at the time you request a distribution. If applicable, federal and/or state taxes may be withheld from your distribution amount.
Proxy Voting Policies
Descriptions of the principles and policies that the fund's investment advisor uses in exercising the voting rights associated with the securities purchased and/or held by the fund are available without charge, upon request, by calling 1-800-345-2021 or visiting the "About Us" page of American Century Investments’ website at americancentury.com. A description of the policies is also available on the Securities and Exchange Commission’s website at sec.gov. Information regarding how the investment advisor voted proxies relating to portfolio securities during the most recent 12-month period ended June 30 is available on the "About Us" page at americancentury.com. It is also available at sec.gov.
Quarterly Portfolio Disclosure
The fund files its complete schedule of portfolio holdings with the Securities and Exchange Commission (SEC) for the first and third quarters of each fiscal year on Form N-Q. The fund’s Forms N-Q are available on the SEC’s website at sec.gov, and may be reviewed and copied at the SEC’s Public Reference Room in Washington, DC. Information on the operation of the Public Reference Room may be obtained by calling 1-800-SEC-0330. The fund also makes its complete schedule of portfolio holdings for the most recent quarter of its fiscal year available on its website at americancentury.com and, upon request, by calling 1-800-345-2021.
Other Tax Information
The following information is provided pursuant to provisions of the Internal Revenue Code.
The fund hereby designates up to the maximum amount allowable as qualified dividend income for the fiscal year ended June 30, 2018.
For corporate taxpayers, the fund hereby designates $4,447,819, or up to the maximum amount allowable, of ordinary income distributions paid during the fiscal year ended June 30, 2018 as qualified for the corporate dividends received deduction.
The fund hereby designates $1,780,400 as qualified short-term capital gain distributions for purposes of Internal Revenue Code Section 871 for the fiscal year ended June 30, 2018.
The fund hereby designates $54,492,250 or up to the maximum amount allowable, as long-term capital gain distributions (20% rate gain distributions) for the fiscal year ended June 30, 2018.
|
| | |
| |
| | | |
| Contact Us | americancentury.com | |
| Automated Information Line | 1-800-345-8765 | |
| Investor Services Representative | 1-800-345-2021
or 816-531-5575 | |
| Investors Using Advisors | 1-800-378-9878 | |
Business, Not-For-Profit, Employer-Sponsored
Retirement Plans | 1-800-345-3533 | |
Banks and Trust Companies, Broker-Dealers,
Financial Professionals, Insurance Companies | 1-800-345-6488 | |
| Telecommunications Relay Service for the Deaf | 711 | |
| | | |
| American Century Quantitative Equity Funds, Inc. | |
| | | |
Investment Advisor: American Century Investment Management, Inc. Kansas City, Missouri | |
| | | |
| This report and the statements it contains are submitted for the general information of our shareholders. The report is not authorized for distribution to prospective investors unless preceded or accompanied by an effective prospectus. | |
| | | |
©2018 American Century Proprietary Holdings, Inc. All rights reserved.
CL-ANN-92998 1808 | |
|
| |
| | |
| | Annual Report |
| | |
| | June 30, 2018 |
| | |
| | Small Company Fund |
| | Investor Class (ASQIX) |
| | I Class (ASCQX) |
| | A Class (ASQAX) |
| | C Class (ASQCX) |
| | R Class (ASCRX) |
| | R5 Class (ASQGX) |
|
| | |
| President's Letter | 2 |
|
| Performance | 3 |
|
| Portfolio Commentary | |
|
| Fund Characteristics | |
|
| Shareholder Fee Example | |
|
| Schedule of Investments | |
|
| Statement of Assets and Liabilities | |
|
| Statement of Operations | |
|
| Statement of Changes in Net Assets | |
|
| Notes to Financial Statements | |
|
| Financial Highlights | |
|
| Report of Independent Registered Public Accounting Firm | |
|
| Management | |
|
| Approval of Management Agreement | |
|
| Additional Information | |
|
Any opinions expressed in this report reflect those of the author as of the date of the report, and do not necessarily represent the opinions of American Century Investments® or any other person in the American Century Investments organization. Any such opinions are subject to change at any time based upon market or other conditions and American Century Investments disclaims any responsibility to update such opinions. These opinions may not be relied upon as investment advice and, because investment decisions made by American Century Investments funds are based on numerous factors, may not be relied upon as an indication of trading intent on behalf of any American Century Investments fund. Security examples are used for representational purposes only and are not intended as recommendations to purchase or sell securities. Performance information for comparative indices and securities is provided to American Century Investments by third party vendors. To the best of American Century Investments’ knowledge, such information is accurate at the time of printing.
Jonathan Thomas
Dear Investor:
Thank you for reviewing this annual report for the period ended June 30, 2018. Annual reports help convey important information about fund returns, including market factors that affected performance during the reporting period. For additional, updated investment and market insights, we encourage you to visit our website, americancentury.com.
Volatility’s Return Challenged Financial Markets
Broad U.S. and global stock market indices generally rallied for the first half of the 12-month period. A favorable backdrop of robust corporate earnings results, improving global economic growth, and relatively low interest rates, combined with the effects of U.S. tax reform, drove stock prices higher. For the six months ended December 31, 2017, U.S. stocks (S&P 500 Index) returned 11.42%. U.S. bond returns were also positive, but much more subdued, as the Federal Reserve (the Fed) continued its rate-normalization efforts and interest rates edged higher. The Bloomberg Barclays U.S. Aggregate Bond Index returned 1.24% for the six-month period.
In early February, a force that was largely dormant during 2017—volatility—re-emerged, as better-than-expected economic data triggered expectations for rising inflation, higher interest rates, and a more-hawkish Fed. In response, U.S. Treasury yields climbed to their highest levels in several years, and stock prices plunged. Economic data released in subsequent months were more in line with market expectations, while corporate earnings results remained healthy. These factors helped calm the market unrest, and stocks generally recovered their earlier losses. Nevertheless, rising interest rates, geopolitical tensions, and the mounting threat of a global trade war continued to provide periodic headwinds for investors.
Despite the return of volatility, U.S. stocks (S&P 500 Index) gained14.37% for the 12-month period. Meanwhile, rising U.S. Treasury yields, particularly in the second half of the period, took a toll on bonds and other interest-rate-sensitive investments, including gold, utilities stocks, and real estate investment trusts (REITs). Investment-grade bonds (Bloomberg Barclays U.S. Aggregate Bond Index) returned -0.40% for the 12 months.
With volatility resurfacing, inflationary pressures building, Treasury yields rising, and the implications of U.S. tariff and trade policy still unfolding, investors likely will face new opportunities and challenges in the months ahead. We believe this scenario warrants a disciplined, diversified, and risk-aware approach, using professionally managed portfolios in pursuit of investment goals. We appreciate your continued trust and confidence in us.
Sincerely,
Jonathan Thomas
President and Chief Executive Officer
American Century Investments
|
| | | | | | |
| Total Returns as of June 30, 2018 |
| | | | Average Annual Returns | |
| | Ticker Symbol | 1 year | 5 years | 10 years | Since Inception | Inception Date |
| Investor Class | ASQIX | 13.18% | 10.67% | 8.47% | — | 7/31/98 |
| Russell 2000 Index | — | 17.57% | 12.45% | 10.59% | — | — |
| I Class | ASCQX | 13.42% | 10.88% | 8.69% | — | 10/1/99 |
| A Class | ASQAX | | | |
| 9/7/00 |
| No sales charge | | 12.90% | 10.40% | 8.19% | — | |
| With sales charge | | 6.39% | 9.10% | 7.55% | — | |
| C Class | ASQCX | 12.01% | 9.57% | — | 11.65% | 3/1/10 |
| R Class | ASCRX | 12.56% | 10.12% | 7.93% | — | 8/29/03 |
| R5 Class | ASQGX | 13.34% | — | — | 12.13% | 4/10/17 |
Average annual returns since inception are presented when ten years of performance history is not available.
Prior to March 1, 2010, the A Class was referred to as the Advisor Class and did not have a front-end sales charge. Performance prior to that date has been adjusted to reflect this charge.
Sales charges include initial sales charges and contingent deferred sales charges (CDSCs), as applicable. A Class shares have a 5.75% maximum initial sales charge and may be subject to a maximum CDSC of 1.00%. C Class shares redeemed within 12 months of purchase are subject to a maximum CDSC of 1.00%. The SEC requires that mutual funds provide performance information net of maximum sales charges in all cases where charges could be applied.
Data presented reflect past performance. Past performance is no guarantee of future results. Current performance may be higher or lower than the performance shown. Total returns for periods less than one year are not annualized. Investment return and principal value will fluctuate, and redemption value may be more or less than original cost. Data assumes reinvestment of dividends and capital gains, and none of the charts reflect the deduction of taxes that a shareholder would pay on fund distributions or the redemption of fund shares. To obtain performance data current to the most recent month end, please call 1-800-345-2021 or visit americancentury.com. For additional information about the fund, please consult the prospectus.
|
|
| Growth of $10,000 Over 10 Years |
| $10,000 investment made June 30, 2008 |
| Performance for other share classes will vary due to differences in fee structure. |
|
| |
| Value on June 30, 2018 |
| | Investor Class — $22,557 |
| |
| | Russell 2000 Index — $27,387 |
| |
|
| | | | | |
| Total Annual Fund Operating Expenses |
| Investor Class | I Class | A Class | C Class | R Class | R5 Class |
| 0.87% | 0.67% | 1.12% | 1.87% | 1.37% | 0.67% |
The total annual fund operating expenses shown is as stated in the fund’s prospectus current as of the date of this report. The prospectus may vary from the expense ratio shown elsewhere in this report because it is based on a different time period, includes acquired fund fees and expenses, and, if applicable, does not include fee waivers or expense reimbursements.
Data presented reflect past performance. Past performance is no guarantee of future results. Current performance may be higher or lower than the performance shown. Total returns for periods less than one year are not annualized. Investment return and principal value will fluctuate, and redemption value may be more or less than original cost. Data assumes reinvestment of dividends and capital gains, and none of the charts reflect the deduction of taxes that a shareholder would pay on fund distributions or the redemption of fund shares. To obtain performance data current to the most recent month end, please call 1-800-345-2021 or visit americancentury.com. For additional information about the fund, please consult the prospectus.
Portfolio Managers: Brian Garbe and Steven Rossi
Performance Summary
The Small Company Fund returned 13.18%* for the fiscal year ended June 30, 2018, compared with the 17.57% return of its benchmark, the Russell 2000 Index.
Small Company rose during the fiscal year, but trailed the return of its benchmark, the Russell 2000 Index. Small Company’s stock selection process incorporates factors of valuation, quality, growth, and sentiment, while striving to minimize unintended risks along industries and other risk characteristics. The fund’s valuation and growth factors detracted from relative results, while quality and sentiment insights were supportive. Stock choices in the industrials, health care, and energy sectors detracted from performance, while holdings in the consumer staples and consumer discretionary sectors benefited fund results.
Stock Choices Across Several Sectors Detracted From Relative Returns
Stock choices were the largest driver of the fund’s twelve-month results. Picks in the industrials sector detracted most from performance. Overweight positions in the machinery industry were other sources of weakness. Positions within the construction and engineering industry, in particular an overweight to Argan, also detracted. We have since exited the position. Elsewhere in the sector, an underweight to car rental company Avis Budget Group and an overweight to Aircastle also hurt relative returns.
Stock selection within health care also negatively affected the portfolio, particularly within the biotechnology industry. Overweights to companies such as Calithera Biosciences, MiMedx Group, and Akebia Therapeutics weighed on returns as the industry struggled for much of the period with worries about regulation and restrictions on pricing. Elsewhere in the sector, an underweight position in pharmaceuticals company Nektar Therapeutics weighed on relative results. We have since exited the position.
Within the energy sector, positioning within the energy equipment and services and oil, gas and consumable fuels industries detracted. Overweights to companies such as McDermott International and Smart Sand, among others, weighed on returns. Avoidance of several index holdings, which appreciated during the period, also detracted within the sector.
Consumer Sectors, Real Estate, and Financials Were Additive
In consumer staples, stock choices within the personal products industry were the largest drivers of positive returns. An overweight to diet and nutrition product company Medifast was among the top contributors for the period. A lack of exposure to poor-performing household products and beverages companies was also additive.
*All fund returns referenced in this commentary are for Investor Class shares. Performance for other share classes will vary due to differences in fee structure; when Investor Class performance exceeds that of the fund's benchmark, other share classes may not. See page 3 for returns for all share classes.
Stock selection within the consumer discretionary sector also helped relative results. Choices within the auto components industry were particularly helpful. An overweight to Stoneridge was among the top contributors to portfolio performance. In the internet software and services industry, online craft hub Etsy was also a top contributor. Elsewhere in the sector, overweights to Deckers Outdoor and Malibu Boats also boosted relative returns as a strong economic environment throughout the fiscal year supported consumer spending, which benefited these companies’ revenue growth.
Many areas of the real estate and financials sectors were hurt by rising rates and a flattening yield curve. In real estate, a relative lack of exposure to equity real estate investment trusts benefited returns. In financials, overweights to several capital markets companies such as Evercore and Houlihan Lokey were additive. We have since exited our position in Houlihan Lokey. A relative underweight to the banks and equity real estate investment trust industries also helped returns.
Portfolio Positioning
Our disciplined, objective, and systematic investment strategy is designed to take advantage of opportunities at the individual company level. We believe this approach is the most powerful way to capitalize on market inefficiencies that lead to the mispricing of individual stocks. As a result, our sector weights reflect where we are finding opportunities at a given time.
At period-end, the portfolio’s largest relative overweights were in the materials, consumer discretionary, and industrials sectors. Based on the solid scores across all four factors of our model, we believe the stocks in the materials sector offer favorable investment opportunities. We increased our exposure to the consumer discretionary sector over the course of the period, believing there are opportunities within the retailing and consumer durables and apparel industries. These industries score positively within our model, particularly for quality and sentiment. Conversely, we reduced our exposure to financials during the period. The sector is now among the largest relative underweight positions. We feel there is a comparative lack of opportunity in the sector, particularly within the banks and insurance industries, both of which score poorly for quality. The utilities sector also shows a lack of opportunity, scoring poorly for quality and growth. It was a significant relative underweight at period-end.
|
| |
| JUNE 30, 2018 |
| Top Ten Holdings | % of net assets |
| Haemonetics Corp. | 0.9% |
| Ingevity Corp. | 0.8% |
| Adtalem Global Education, Inc. | 0.8% |
| Vishay Intertechnology, Inc. | 0.8% |
| Louisiana-Pacific Corp. | 0.8% |
| Vonage Holdings Corp. | 0.8% |
| KEMET Corp. | 0.8% |
| Curtiss-Wright Corp. | 0.8% |
| Integer Holdings Corp. | 0.8% |
| MSA Safety, Inc. | 0.8% |
| | |
| Top Five Industries | % of net assets |
| Banks | 8.3% |
| Internet Software and Services | 5.5% |
| Biotechnology | 5.2% |
| Equity Real Estate Investment Trusts (REITs) | 4.7% |
| Health Care Equipment and Supplies | 4.6% |
| | |
| Types of Investments in Portfolio | % of net assets |
| Common Stocks | 100.1% |
| Temporary Cash Investments | 0.1% |
| Other Assets and Liabilities | (0.2)% |
Fund shareholders may incur two types of costs: (1) transaction costs, including sales charges (loads) on purchase payments and redemption/exchange fees; and (2) ongoing costs, including management fees; distribution and service (12b-1) fees; and other fund expenses. This example is intended to help you understand your ongoing costs (in dollars) of investing in your fund and to compare these costs with the ongoing cost of investing in other mutual funds.
The example is based on an investment of $1,000 made at the beginning of the period and held for the entire period from January 1, 2018 to June 30, 2018.
Actual Expenses
The table provides information about actual account values and actual expenses for each class. You may use the information, together with the amount you invested, to estimate the expenses that you paid over the period. First, identify the share class you own. Then simply divide your account value by $1,000 (for example, an $8,600 account value divided by $1,000 = 8.6), then multiply the result by the number under the heading “Expenses Paid During Period” to estimate the expenses you paid on your account during this period.
If you hold Investor Class shares of any American Century Investments fund, or I Class shares of the American Century Diversified Bond Fund, in an American Century Investments account (i.e., not a financial intermediary or retirement plan account), American Century Investments may charge you a $12.50 semiannual account maintenance fee if the value of those shares is less than $10,000. We will redeem shares automatically in one of your accounts to pay the $12.50 fee. In determining your total eligible investment amount, we will include your investments in all personal accounts (including American Century Investments Brokerage accounts) registered under your Social Security number. Personal accounts include individual accounts, joint accounts, UGMA/UTMA accounts, personal trusts, Coverdell Education Savings Accounts and IRAs (including traditional, Roth, Rollover, SEP-, SARSEP- and SIMPLE-IRAs), and certain other retirement accounts. If you have only business, business retirement, employer-sponsored or American Century Investments Brokerage accounts, you are currently not subject to this fee. If you are subject to the Account Maintenance Fee, your account value could be reduced by the fee amount.
Hypothetical Example for Comparison Purposes
The table also provides information about hypothetical account values and hypothetical expenses based on the actual expense ratio of each class of your fund and an assumed rate of return of 5% per year before expenses, which is not the actual return of a fund’s share class. The hypothetical account values and expenses may not be used to estimate the actual ending account balance or expenses you paid for the period. You may use this information to compare the ongoing costs of investing in your fund and other funds. To do so, compare this 5% hypothetical example with the 5% hypothetical examples that appear in the shareholder reports of the other funds.
Please note that the expenses shown in the table are meant to highlight your ongoing costs only and do not reflect any transactional costs, such as sales charges (loads) or redemption/exchange fees. Therefore, the table is useful in comparing ongoing costs only, and will not help you determine the relative total costs of owning different funds. In addition, if these transactional costs were included, your costs would have been higher.
|
| | | | |
| | Beginning
Account Value
1/1/18 | Ending
Account Value
6/30/18 | Expenses Paid
During Period(1)
1/1/18 - 6/30/18 |
Annualized
Expense Ratio(1) |
| Actual | | | | |
| Investor Class | $1,000 | $1,050.70 | $4.37 | 0.86% |
| I Class | $1,000 | $1,051.70 | $3.36 | 0.66% |
| A Class | $1,000 | $1,049.20 | $5.64 | 1.11% |
| C Class | $1,000 | $1,045.50 | $9.43 | 1.86% |
| R Class | $1,000 | $1,047.50 | $6.90 | 1.36% |
| R5 Class | $1,000 | $1,051.70 | $3.36 | 0.66% |
| Hypothetical | | | | |
| Investor Class | $1,000 | $1,020.53 | $4.31 | 0.86% |
| I Class | $1,000 | $1,021.52 | $3.31 | 0.66% |
| A Class | $1,000 | $1,019.29 | $5.56 | 1.11% |
| C Class | $1,000 | $1,015.57 | $9.30 | 1.86% |
| R Class | $1,000 | $1,018.05 | $6.81 | 1.36% |
| R5 Class | $1,000 | $1,021.52 | $3.31 | 0.66% |
| |
| (1) | Expenses are equal to the class's annualized expense ratio listed in the table above, multiplied by the average account value over the period, multiplied by 181, the number of days in the most recent fiscal half-year, divided by 365, to reflect the one-half year period. Annualized expense ratio reflects actual expenses, including any applicable fee waivers or expense reimbursements and excluding any acquired fund fees and expenses. |
JUNE 30, 2018
|
| | | | | |
| | Shares | Value |
| COMMON STOCKS — 100.1% | | |
| Aerospace and Defense — 1.1% | | |
| Curtiss-Wright Corp. | 42,211 |
| $ | 5,023,953 |
|
| Moog, Inc., Class A | 24,918 |
| 1,942,607 |
|
| | | 6,966,560 |
|
| Air Freight and Logistics — 0.1% | | |
| Forward Air Corp. | 12,031 |
| 710,791 |
|
| Auto Components — 0.7% | | |
Stoneridge, Inc.(1) | 123,334 |
| 4,333,957 |
|
| Banks — 8.3% | | |
Bancorp, Inc. (The)(1) | 318,153 |
| 3,327,880 |
|
| Bank of NT Butterfield & Son Ltd. (The) | 86,445 |
| 3,952,265 |
|
| Boston Private Financial Holdings, Inc. | 57,090 |
| 907,731 |
|
| Camden National Corp. | 14,469 |
| 661,378 |
|
| Central Pacific Financial Corp. | 129,334 |
| 3,705,419 |
|
Customers Bancorp, Inc.(1) | 104,321 |
| 2,960,630 |
|
| Enterprise Financial Services Corp. | 58,904 |
| 3,177,871 |
|
| Financial Institutions, Inc. | 45,088 |
| 1,483,395 |
|
| First Citizens BancShares, Inc., Class A | 11,416 |
| 4,604,073 |
|
| First Interstate Bancsystem, Inc., Class A | 34,900 |
| 1,472,780 |
|
Franklin Financial Network, Inc.(1) | 111,968 |
| 4,209,997 |
|
| Heartland Financial USA, Inc. | 11,210 |
| 614,869 |
|
| Heritage Commerce Corp. | 42,183 |
| 716,689 |
|
| Hilltop Holdings, Inc. | 167,587 |
| 3,698,645 |
|
| Independent Bank Corp. | 75,106 |
| 1,915,203 |
|
| International Bancshares Corp. | 104,880 |
| 4,488,864 |
|
| MB Financial, Inc. | 24,617 |
| 1,149,614 |
|
| OFG Bancorp | 129,585 |
| 1,820,669 |
|
| Southside Bancshares, Inc. | 6,326 |
| 213,060 |
|
| Trico Bancshares | 26,866 |
| 1,006,132 |
|
| UMB Financial Corp. | 57,192 |
| 4,359,746 |
|
| United Community Banks, Inc. | 144,157 |
| 4,421,295 |
|
| | | 54,868,205 |
|
| Biotechnology — 5.2% | | |
Akebia Therapeutics, Inc.(1) | 183,887 |
| 1,835,192 |
|
Amicus Therapeutics, Inc.(1) | 139,191 |
| 2,174,163 |
|
Ardelyx, Inc.(1) | 56,811 |
| 210,201 |
|
Calithera Biosciences, Inc.(1) | 299,684 |
| 1,498,420 |
|
ChemoCentryx, Inc.(1) | 89,592 |
| 1,179,927 |
|
CytomX Therapeutics, Inc.(1) | 82,783 |
| 1,892,419 |
|
Emergent BioSolutions, Inc.(1) | 47,670 |
| 2,406,858 |
|
Enanta Pharmaceuticals, Inc.(1) | 17,747 |
| 2,056,877 |
|
Exelixis, Inc.(1) | 91,186 |
| 1,962,323 |
|
|
| | | | | |
| | Shares | Value |
Genomic Health, Inc.(1) | 39,117 |
| $ | 1,971,497 |
|
Halozyme Therapeutics, Inc.(1) | 143,217 |
| 2,416,071 |
|
Ligand Pharmaceuticals, Inc.(1) | 13,275 |
| 2,750,182 |
|
Loxo Oncology, Inc.(1) | 17,055 |
| 2,958,701 |
|
MiMedx Group, Inc.(1) | 71,567 |
| 457,313 |
|
Pieris Pharmaceuticals, Inc.(1) | 251,921 |
| 1,277,240 |
|
Protagonist Therapeutics, Inc.(1) | 77,868 |
| 523,273 |
|
PTC Therapeutics, Inc.(1) | 50,670 |
| 1,709,099 |
|
Puma Biotechnology, Inc.(1) | 9,627 |
| 569,437 |
|
REGENXBIO, Inc.(1) | 8,613 |
| 617,983 |
|
Retrophin, Inc.(1) | 52,256 |
| 1,424,499 |
|
Sangamo Therapeutics, Inc.(1) | 144,927 |
| 2,057,963 |
|
Vanda Pharmaceuticals, Inc.(1) | 32,523 |
| 619,563 |
|
| | | 34,569,201 |
|
| Building Products — 0.3% | | |
Patrick Industries, Inc.(1) | 21,009 |
| 1,194,362 |
|
| Universal Forest Products, Inc. | 20,463 |
| 749,355 |
|
| | | 1,943,717 |
|
| Capital Markets — 2.0% | | |
| Artisan Partners Asset Management, Inc., Class A | 38,053 |
| 1,147,298 |
|
| BrightSphere Investment Group plc | 130,490 |
| 1,860,787 |
|
| Evercore, Inc., Class A | 43,757 |
| 4,614,175 |
|
| Investment Technology Group, Inc. | 22,278 |
| 466,056 |
|
| Piper Jaffray Cos. | 52,608 |
| 4,042,925 |
|
| Stifel Financial Corp. | 24,719 |
| 1,291,568 |
|
| | | 13,422,809 |
|
| Chemicals — 3.7% | | |
| Chemours Co. (The) | 70,376 |
| 3,121,879 |
|
| FutureFuel Corp. | 8,446 |
| 118,328 |
|
Ingevity Corp.(1) | 68,498 |
| 5,538,748 |
|
| KMG Chemicals, Inc. | 26,356 |
| 1,944,546 |
|
Koppers Holdings, Inc.(1) | 33,237 |
| 1,274,639 |
|
Kraton Corp.(1) | 80,320 |
| 3,705,965 |
|
| Kronos Worldwide, Inc. | 28,215 |
| 635,684 |
|
| Minerals Technologies, Inc. | 44,024 |
| 3,317,208 |
|
OMNOVA Solutions, Inc.(1) | 116,745 |
| 1,214,148 |
|
| Stepan Co. | 42,352 |
| 3,303,880 |
|
| | | 24,175,025 |
|
| Commercial Services and Supplies — 3.8% | | |
| ACCO Brands Corp. | 243,301 |
| 3,369,719 |
|
| Brady Corp., Class A | 108,689 |
| 4,189,961 |
|
| Deluxe Corp. | 29,999 |
| 1,986,234 |
|
| Herman Miller, Inc. | 111,462 |
| 3,778,562 |
|
| McGrath RentCorp | 20,802 |
| 1,316,143 |
|
| MSA Safety, Inc. | 52,012 |
| 5,010,836 |
|
| Quad/Graphics, Inc. | 158,156 |
| 3,294,389 |
|
|
| | | | | |
| | Shares | Value |
SP Plus Corp.(1) | 60,237 |
| $ | 2,240,816 |
|
| | | 25,186,660 |
|
| Communications Equipment — 1.0% | | |
Aerohive Networks, Inc.(1) | 42,458 |
| 168,558 |
|
Ciena Corp.(1) | 93,926 |
| 2,489,978 |
|
| Comtech Telecommunications Corp. | 9,441 |
| 300,979 |
|
Extreme Networks, Inc.(1) | 155,367 |
| 1,236,722 |
|
| InterDigital, Inc. | 29,758 |
| 2,407,422 |
|
| | | 6,603,659 |
|
| Construction and Engineering — 1.5% | | |
| EMCOR Group, Inc. | 62,966 |
| 4,796,750 |
|
| KBR, Inc. | 50,374 |
| 902,702 |
|
| Primoris Services Corp. | 146,855 |
| 3,998,862 |
|
Sterling Construction Co., Inc.(1) | 15,700 |
| 204,571 |
|
| | | 9,902,885 |
|
| Consumer Finance — 0.5% | | |
Enova International, Inc.(1) | 88,745 |
| 3,243,630 |
|
| Containers and Packaging — 0.6% | | |
| Greif, Inc., Class A | 67,708 |
| 3,581,076 |
|
| Myers Industries, Inc. | 11,241 |
| 215,827 |
|
| | | 3,796,903 |
|
| Diversified Consumer Services — 1.3% | | |
Adtalem Global Education, Inc.(1) | 115,101 |
| 5,536,358 |
|
Grand Canyon Education, Inc.(1) | 25,055 |
| 2,796,389 |
|
K12, Inc.(1) | 2,647 |
| 43,331 |
|
| | | 8,376,078 |
|
| Diversified Financial Services — 0.5% | | |
On Deck Capital, Inc.(1) | 499,698 |
| 3,497,886 |
|
| Diversified Telecommunication Services — 0.9% | | |
| Frontier Communications Corp. | 110,108 |
| 590,179 |
|
Ooma, Inc.(1) | 17,295 |
| 244,724 |
|
Vonage Holdings Corp.(1) | 403,431 |
| 5,200,226 |
|
| | | 6,035,129 |
|
| Electric Utilities — 0.3% | | |
| Portland General Electric Co. | 35,591 |
| 1,521,871 |
|
| Spark Energy, Inc., Class A | 27,481 |
| 267,940 |
|
| | | 1,789,811 |
|
| Electrical Equipment — 1.0% | | |
Atkore International Group, Inc.(1) | 85,973 |
| 1,785,659 |
|
Generac Holdings, Inc.(1) | 91,357 |
| 4,725,898 |
|
| | | 6,511,557 |
|
| Electronic Equipment, Instruments and Components — 2.2% | | |
Electro Scientific Industries, Inc.(1) | 197,712 |
| 3,117,918 |
|
KEMET Corp.(1) | 210,928 |
| 5,093,911 |
|
Tech Data Corp.(1) | 4,396 |
| 361,000 |
|
TTM Technologies, Inc.(1) | 102 |
| 1,799 |
|
| Vishay Intertechnology, Inc. | 232,606 |
| 5,396,459 |
|
|
| | | | | |
| | Shares | Value |
Vishay Precision Group, Inc.(1) | 14,555 |
| $ | 555,273 |
|
| | | 14,526,360 |
|
| Energy Equipment and Services — 2.7% | | |
| Archrock, Inc. | 361,773 |
| 4,341,276 |
|
Exterran Corp.(1) | 138,896 |
| 3,477,956 |
|
Mammoth Energy Services, Inc.(1) | 9,875 |
| 335,355 |
|
Matrix Service Co.(1) | 24,133 |
| 442,841 |
|
McDermott International, Inc.(1) | 193,487 |
| 3,802,019 |
|
Newpark Resources, Inc.(1) | 77,995 |
| 846,246 |
|
Smart Sand, Inc.(1) | 261,740 |
| 1,389,839 |
|
Superior Energy Services, Inc.(1) | 196,928 |
| 1,918,079 |
|
Unit Corp.(1) | 62,438 |
| 1,595,915 |
|
| | | 18,149,526 |
|
| Equity Real Estate Investment Trusts (REITs) — 4.7% | | |
| Braemar Hotels & Resorts, Inc. | 67,070 |
| 765,939 |
|
| CareTrust REIT, Inc. | 108,741 |
| 1,814,887 |
|
| Chatham Lodging Trust | 66,590 |
| 1,413,040 |
|
| Chesapeake Lodging Trust | 129,774 |
| 4,106,049 |
|
| City Office REIT, Inc. | 88,963 |
| 1,141,395 |
|
| Front Yard Residential Corp. | 159,143 |
| 1,658,270 |
|
InfraREIT, Inc.(1) | 22,265 |
| 493,615 |
|
| Investors Real Estate Trust | 54,796 |
| 303,022 |
|
| Mack-Cali Realty Corp. | 21,299 |
| 431,944 |
|
| MedEquities Realty Trust, Inc. | 332,574 |
| 3,664,965 |
|
| One Liberty Properties, Inc. | 7,077 |
| 186,904 |
|
| Pebblebrook Hotel Trust | 113,999 |
| 4,423,161 |
|
| PotlatchDeltic Corp. | 87,570 |
| 4,452,935 |
|
| PS Business Parks, Inc. | 37,053 |
| 4,761,311 |
|
| Select Income REIT | 47,674 |
| 1,071,235 |
|
| Terreno Realty Corp. | 15,854 |
| 597,220 |
|
| | | 31,285,892 |
|
| Food and Staples Retailing — 0.7% | | |
United Natural Foods, Inc.(1) | 103,562 |
| 4,417,955 |
|
| Food Products — 0.4% | | |
Cal-Maine Foods, Inc.(1) | 51,935 |
| 2,381,220 |
|
| Health Care Equipment and Supplies — 4.6% | | |
AngioDynamics, Inc.(1) | 131,083 |
| 2,915,286 |
|
| Atrion Corp. | 371 |
| 222,377 |
|
| CONMED Corp. | 37,634 |
| 2,754,809 |
|
Globus Medical, Inc., Class A(1) | 96,916 |
| 4,890,381 |
|
Haemonetics Corp.(1) | 65,914 |
| 5,911,168 |
|
Integer Holdings Corp.(1) | 77,543 |
| 5,013,155 |
|
Lantheus Holdings, Inc.(1) | 52,842 |
| 768,851 |
|
LivaNova plc(1) | 37,002 |
| 3,693,540 |
|
Orthofix International NV(1) | 54,639 |
| 3,104,588 |
|
STAAR Surgical Co.(1) | 41,164 |
| 1,276,084 |
|
| | | 30,550,239 |
|
|
| | | | | |
| | Shares | Value |
| Health Care Providers and Services — 2.0% | | |
Addus HomeCare Corp.(1) | 5,867 |
| $ | 335,886 |
|
Amedisys, Inc.(1) | 24,980 |
| 2,134,791 |
|
Molina Healthcare, Inc.(1) | 14,308 |
| 1,401,325 |
|
Tenet Healthcare Corp.(1) | 21,047 |
| 706,548 |
|
Tivity Health, Inc.(1) | 110,263 |
| 3,881,257 |
|
WellCare Health Plans, Inc.(1) | 19,311 |
| 4,755,141 |
|
| | | 13,214,948 |
|
| Hotels, Restaurants and Leisure — 1.1% | | |
| Bloomin' Brands, Inc. | 51,721 |
| 1,039,592 |
|
| Brinker International, Inc. | 24,629 |
| 1,172,340 |
|
Eldorado Resorts, Inc.(1) | 10,880 |
| 425,408 |
|
| International Speedway Corp., Class A | 90,331 |
| 4,037,796 |
|
Penn National Gaming, Inc.(1) | 27,271 |
| 916,033 |
|
| | | 7,591,169 |
|
| Household Durables — 1.4% | | |
Beazer Homes USA, Inc.(1) | 109,688 |
| 1,617,898 |
|
| La-Z-Boy, Inc. | 24,745 |
| 757,197 |
|
| M.D.C. Holdings, Inc. | 77,560 |
| 2,386,521 |
|
Taylor Morrison Home Corp., Class A(1) | 178,512 |
| 3,709,480 |
|
William Lyon Homes, Class A(1) | 40,021 |
| 928,487 |
|
| | | 9,399,583 |
|
| Independent Power and Renewable Electricity Producers — 0.6% | |
| NRG Yield, Inc., Class A | 35,494 |
| 605,173 |
|
| TerraForm Power, Inc., Class A | 263,321 |
| 3,080,855 |
|
| | | 3,686,028 |
|
| Insurance — 1.9% | | |
| CNO Financial Group, Inc. | 197,014 |
| 3,751,147 |
|
| FBL Financial Group, Inc., Class A | 2,991 |
| 235,541 |
|
Health Insurance Innovations, Inc., Class A(1) | 115,099 |
| 3,723,453 |
|
| Stewart Information Services Corp. | 96,258 |
| 4,145,832 |
|
| Universal Insurance Holdings, Inc. | 22,970 |
| 806,247 |
|
| | | 12,662,220 |
|
| Internet and Direct Marketing Retail — 1.8% | | |
Groupon, Inc.(1) | 887,549 |
| 3,816,460 |
|
| Nutrisystem, Inc. | 92,020 |
| 3,542,770 |
|
Shutterfly, Inc.(1) | 51,493 |
| 4,635,915 |
|
| | | 11,995,145 |
|
| Internet Software and Services — 5.5% | | |
Appfolio, Inc., Class A(1) | 16,229 |
| 992,403 |
|
Blucora, Inc.(1) | 106,895 |
| 3,955,115 |
|
Care.com, Inc.(1) | 191,627 |
| 4,001,172 |
|
Cornerstone OnDemand, Inc.(1) | 22,127 |
| 1,049,484 |
|
Endurance International Group Holdings, Inc.(1) | 235,897 |
| 2,347,175 |
|
Envestnet, Inc.(1) | 84,983 |
| 4,669,816 |
|
Etsy, Inc.(1) | 116,576 |
| 4,918,342 |
|
LivePerson, Inc.(1) | 42,049 |
| 887,234 |
|
|
| | | | | |
| | Shares | Value |
New Relic, Inc.(1) | 34,466 |
| $ | 3,466,935 |
|
QuinStreet, Inc.(1) | 327,357 |
| 4,157,434 |
|
SPS Commerce, Inc.(1) | 26,000 |
| 1,910,480 |
|
Stamps.com, Inc.(1) | 10,484 |
| 2,652,976 |
|
TechTarget, Inc.(1) | 45,613 |
| 1,295,409 |
|
Web.com Group, Inc.(1) | 12,351 |
| 319,273 |
|
| | | 36,623,248 |
|
| IT Services — 0.2% | | |
Everi Holdings, Inc.(1) | 148,366 |
| 1,068,235 |
|
| Leisure Products — 1.2% | | |
Malibu Boats, Inc., Class A(1) | 109,791 |
| 4,604,634 |
|
MCBC Holdings, Inc.(1) | 120,868 |
| 3,499,129 |
|
| | | 8,103,763 |
|
| Life Sciences Tools and Services — 0.9% | | |
| Luminex Corp. | 72,541 |
| 2,142,136 |
|
Medpace Holdings, Inc.(1) | 92,616 |
| 3,982,488 |
|
| | | 6,124,624 |
|
| Machinery — 3.0% | | |
| Columbus McKinnon Corp. | 30,983 |
| 1,343,423 |
|
Commercial Vehicle Group, Inc.(1) | 13,212 |
| 96,976 |
|
| Global Brass & Copper Holdings, Inc. | 106,454 |
| 3,337,333 |
|
Harsco Corp.(1) | 165,519 |
| 3,657,970 |
|
| Hillenbrand, Inc. | 16,499 |
| 777,928 |
|
| Hyster-Yale Materials Handling, Inc. | 2,442 |
| 156,898 |
|
| Kadant, Inc. | 10,533 |
| 1,012,748 |
|
Meritor, Inc.(1) | 162,567 |
| 3,344,003 |
|
SPX FLOW, Inc.(1) | 33,352 |
| 1,459,817 |
|
TriMas Corp.(1) | 73,116 |
| 2,149,610 |
|
| Watts Water Technologies, Inc., Class A | 34,539 |
| 2,707,858 |
|
| | | 20,044,564 |
|
| Marine — 0.1% | | |
Genco Shipping & Trading Ltd.(1) | 28,070 |
| 435,085 |
|
| Media — 1.5% | | |
| Emerald Expositions Events, Inc. | 25,090 |
| 516,854 |
|
| Entravision Communications Corp., Class A | 299,790 |
| 1,498,950 |
|
| New Media Investment Group, Inc. | 195,769 |
| 3,617,811 |
|
| Nexstar Media Group, Inc., Class A | 44,720 |
| 3,282,448 |
|
tronc, Inc.(1) | 57,460 |
| 992,909 |
|
| | | 9,908,972 |
|
| Metals and Mining — 1.9% | | |
Cleveland-Cliffs, Inc.(1) | 79,352 |
| 668,938 |
|
| Kaiser Aluminum Corp. | 40,348 |
| 4,200,630 |
|
| Schnitzer Steel Industries, Inc., Class A | 134,157 |
| 4,521,091 |
|
| Worthington Industries, Inc. | 77,491 |
| 3,252,297 |
|
| | | 12,642,956 |
|
| Oil, Gas and Consumable Fuels — 1.6% | | |
| Delek US Holdings, Inc. | 92,832 |
| 4,657,381 |
|
|
| | | | | |
| | Shares | Value |
| Evolution Petroleum Corp. | 22,541 |
| $ | 222,029 |
|
| NACCO Industries, Inc., Class A | 52,946 |
| 1,786,928 |
|
Overseas Shipholding Group, Inc., Class A(1) | 74,148 |
| 287,694 |
|
| Peabody Energy Corp. | 38,902 |
| 1,769,263 |
|
| Teekay Corp. | 187,450 |
| 1,452,738 |
|
W&T Offshore, Inc.(1) | 40,847 |
| 292,056 |
|
| | | 10,468,089 |
|
| Paper and Forest Products — 0.8% | | |
| Louisiana-Pacific Corp. | 196,034 |
| 5,336,045 |
|
| Personal Products — 0.8% | | |
| Medifast, Inc. | 25,598 |
| 4,099,776 |
|
| Natural Health Trends Corp. | 50,924 |
| 1,274,118 |
|
| | | 5,373,894 |
|
| Pharmaceuticals — 2.1% | | |
ANI Pharmaceuticals, Inc.(1) | 19,690 |
| 1,315,292 |
|
Aratana Therapeutics, Inc.(1) | 24,993 |
| 106,220 |
|
Corcept Therapeutics, Inc.(1) | 134,346 |
| 2,111,919 |
|
Depomed, Inc.(1) | 233,779 |
| 1,559,306 |
|
Horizon Pharma plc(1) | 130,375 |
| 2,159,010 |
|
Innoviva, Inc.(1) | 160,452 |
| 2,214,238 |
|
| Phibro Animal Health Corp., Class A | 42,706 |
| 1,966,611 |
|
Supernus Pharmaceuticals, Inc.(1) | 43,181 |
| 2,584,383 |
|
| | | 14,016,979 |
|
| Professional Services — 2.4% | | |
ASGN, Inc.(1) | 57,861 |
| 4,524,152 |
|
| Barrett Business Services, Inc. | 17,518 |
| 1,691,713 |
|
| BG Staffing, Inc. | 7,529 |
| 175,049 |
|
| Heidrick & Struggles International, Inc. | 95,227 |
| 3,332,945 |
|
| ICF International, Inc. | 9,110 |
| 647,265 |
|
| Kforce, Inc. | 48,129 |
| 1,650,825 |
|
TriNet Group, Inc.(1) | 15,466 |
| 865,168 |
|
TrueBlue, Inc.(1) | 105,342 |
| 2,838,967 |
|
| | | 15,726,084 |
|
| Real Estate Management and Development — 0.2% | | |
Marcus & Millichap, Inc.(1) | 26,959 |
| 1,051,670 |
|
| RMR Group, Inc. (The), Class A | 5,957 |
| 467,327 |
|
| | | 1,518,997 |
|
| Road and Rail — 1.8% | | |
| ArcBest Corp. | 67,088 |
| 3,065,922 |
|
Avis Budget Group, Inc.(1) | 68,504 |
| 2,226,380 |
|
Covenant Transportation Group, Inc., Class A(1) | 40,028 |
| 1,260,882 |
|
USA Truck, Inc.(1) | 9,486 |
| 222,636 |
|
| Werner Enterprises, Inc. | 109,712 |
| 4,119,685 |
|
YRC Worldwide, Inc.(1) | 68,795 |
| 691,390 |
|
| | | 11,586,895 |
|
| | | |
| | | |
|
| | | | | |
| | Shares | Value |
| Semiconductors and Semiconductor Equipment — 4.5% | | |
Advanced Energy Industries, Inc.(1) | 59,235 |
| $ | 3,440,961 |
|
Amkor Technology, Inc.(1) | 249,869 |
| 2,146,375 |
|
| Cabot Microelectronics Corp. | 25,090 |
| 2,698,680 |
|
| Cohu, Inc. | 45,642 |
| 1,118,686 |
|
Diodes, Inc.(1) | 109,619 |
| 3,778,567 |
|
| Entegris, Inc. | 129,617 |
| 4,394,016 |
|
Lattice Semiconductor Corp.(1) | 101,268 |
| 664,318 |
|
| MKS Instruments, Inc. | 49,258 |
| 4,713,991 |
|
Nanometrics, Inc.(1) | 99,035 |
| 3,506,829 |
|
Rudolph Technologies, Inc.(1) | 75,792 |
| 2,243,443 |
|
SMART Global Holdings, Inc.(1) | 42,584 |
| 1,357,152 |
|
| | | 30,063,018 |
|
| Software — 3.7% | | |
A10 Networks, Inc.(1) | 38,260 |
| 238,360 |
|
Aspen Technology, Inc.(1) | 43,179 |
| 4,004,421 |
|
Fair Isaac Corp.(1) | 17,559 |
| 3,394,506 |
|
Imperva, Inc.(1) | 51,120 |
| 2,466,540 |
|
Model N, Inc.(1) | 51,249 |
| 953,231 |
|
| Pegasystems, Inc. | 43,804 |
| 2,400,459 |
|
| Progress Software Corp. | 100,158 |
| 3,888,134 |
|
Rosetta Stone, Inc.(1) | 44,068 |
| 706,410 |
|
Upland Software, Inc.(1) | 14,932 |
| 513,213 |
|
Verint Systems, Inc.(1) | 15,183 |
| 673,366 |
|
Zendesk, Inc.(1) | 83,721 |
| 4,561,957 |
|
Zix Corp.(1) | 161,236 |
| 869,062 |
|
| | | 24,669,659 |
|
| Specialty Retail — 4.1% | | |
| Abercrombie & Fitch Co., Class A | 85,022 |
| 2,081,338 |
|
| American Eagle Outfitters, Inc. | 140,692 |
| 3,271,089 |
|
Asbury Automotive Group, Inc.(1) | 57,318 |
| 3,929,149 |
|
Barnes & Noble Education, Inc.(1) | 264,378 |
| 1,491,092 |
|
| Buckle, Inc. (The) | 140,809 |
| 3,787,762 |
|
| Children's Place, Inc. (The) | 4,382 |
| 529,346 |
|
| Citi Trends, Inc. | 8,634 |
| 236,917 |
|
| Haverty Furniture Cos., Inc. | 12,623 |
| 272,657 |
|
Hibbett Sports, Inc.(1) | 131,136 |
| 3,003,014 |
|
Party City Holdco, Inc.(1) | 247,864 |
| 3,779,926 |
|
| Shoe Carnival, Inc. | 34,697 |
| 1,125,918 |
|
| Tailored Brands, Inc. | 141,159 |
| 3,602,378 |
|
| | | 27,110,586 |
|
| Technology Hardware, Storage and Peripherals — 0.1% | | |
Pure Storage, Inc., Class A(1) | 29,491 |
| 704,245 |
|
| Textiles, Apparel and Luxury Goods — 2.1% | | |
Crocs, Inc.(1) | 66,773 |
| 1,175,873 |
|
Deckers Outdoor Corp.(1) | 43,950 |
| 4,961,515 |
|
| Movado Group, Inc. | 23,590 |
| 1,139,397 |
|
|
| | | | | |
| | Shares | Value |
| Oxford Industries, Inc. | 37,399 |
| $ | 3,103,369 |
|
Perry Ellis International, Inc.(1) | 118,473 |
| 3,218,911 |
|
| | | 13,599,065 |
|
| Thrifts and Mortgage Finance — 2.4% | | |
Essent Group Ltd.(1) | 114,922 |
| 4,116,506 |
|
Flagstar Bancorp, Inc.(1) | 100,989 |
| 3,459,883 |
|
| Meta Financial Group, Inc. | 20,400 |
| 1,986,960 |
|
Nationstar Mortgage Holdings, Inc.(1) | 98,832 |
| 1,732,525 |
|
| Trustco Bank Corp. NY | 110,081 |
| 979,721 |
|
| Washington Federal, Inc. | 102,333 |
| 3,346,289 |
|
| | | 15,621,884 |
|
| Tobacco — 0.1% | | |
| Turning Point Brands, Inc. | 15,075 |
| 480,893 |
|
| Trading Companies and Distributors — 2.1% | | |
| Aircastle Ltd. | 174,229 |
| 3,571,694 |
|
| Applied Industrial Technologies, Inc. | 69,731 |
| 4,891,630 |
|
| Kaman Corp. | 21,113 |
| 1,471,365 |
|
Rush Enterprises, Inc., Class A(1) | 93,326 |
| 4,048,482 |
|
| | | 13,983,171 |
|
| Wireless Telecommunication Services — 0.1% | | |
| Spok Holdings, Inc. | 56,316 |
| 847,556 |
|
TOTAL COMMON STOCKS
(Cost $574,796,967) | | 661,853,255 |
|
| TEMPORARY CASH INVESTMENTS — 0.1% | | |
| Repurchase Agreement, BMO Capital Markets Corp., (collateralized by various U.S. Treasury obligations, 1.375% - 3.75%, 2/15/19 - 11/15/47, valued at $365,022), in a joint trading account at 1.75%, dated 6/29/18, due 7/2/18 (Delivery value $357,705) | | 357,653 |
|
| Repurchase Agreement, Fixed Income Clearing Corp., (collateralized by various U.S. Treasury obligations, 2.75%, 2/15/28, valued at $305,442), at 0.90%, dated 6/29/18, due 7/2/18 (Delivery value $298,022) | | 298,000 |
|
| State Street Institutional U.S. Government Money Market Fund, Premier Class | 452 |
| 452 |
|
TOTAL TEMPORARY CASH INVESTMENTS
(Cost $656,105) | | 656,105 |
|
TOTAL INVESTMENT SECURITIES — 100.2%
(Cost $575,453,072) | | 662,509,360 |
|
| OTHER ASSETS AND LIABILITIES — (0.2)% | | (1,471,079 | ) |
| TOTAL NET ASSETS — 100.0% | | $ | 661,038,281 |
|
|
|
| NOTES TO SCHEDULE OF INVESTMENTS |
See Notes to Financial Statements.
|
|
| Statement of Assets and Liabilities |
|
| | | |
| JUNE 30, 2018 |
| Assets |
| Investment securities, at value (cost of $575,453,072) | $ | 662,509,360 |
|
| Receivable for investments sold | 11,763,662 |
|
| Receivable for capital shares sold | 79,599 |
|
| Dividends and interest receivable | 402,260 |
|
| | 674,754,881 |
|
| | |
| Liabilities | |
| Payable for investments purchased | 11,018,548 |
|
| Payable for capital shares redeemed | 2,200,618 |
|
| Accrued management fees | 484,074 |
|
| Distribution and service fees payable | 13,360 |
|
| | 13,716,600 |
|
| | |
| Net Assets | $ | 661,038,281 |
|
| | |
| Net Assets Consist of: | |
| Capital (par value and paid-in surplus) | $ | 536,768,993 |
|
| Undistributed net investment income | 144,806 |
|
| Undistributed net realized gain | 37,068,194 |
|
| Net unrealized appreciation | 87,056,288 |
|
| | $ | 661,038,281 |
|
|
| | | | | | |
| | Net Assets | Shares Outstanding | Net Asset Value Per Share |
| Investor Class, $0.01 Par Value |
| $592,614,862 |
| 36,656,168 |
| $16.17 |
| I Class, $0.01 Par Value |
| $27,212,737 |
| 1,673,831 |
| $16.26 |
| A Class, $0.01 Par Value |
| $23,970,329 |
| 1,518,920 |
| $15.78* |
| C Class, $0.01 Par Value |
| $1,988,875 |
| 131,207 |
| $15.16 |
| R Class, $0.01 Par Value |
| $15,038,369 |
| 973,294 |
| $15.45 |
| R5 Class, $0.01 Par Value |
| $213,109 |
| 13,099 |
| $16.27 |
*Maximum offering price $16.74 (net asset value divided by 0.9425).
See Notes to Financial Statements.
|
| | | |
| YEAR ENDED JUNE 30, 2018 |
| Investment Income (Loss) |
| Income: | |
| Dividends (net of foreign taxes withheld of $4,257) | $ | 6,564,802 |
|
| Interest | 53,678 |
|
| | 6,618,480 |
|
| | |
| Expenses: | |
| Management fees | 5,784,014 |
|
| Distribution and service fees: | |
| A Class | 68,348 |
|
| C Class | 18,148 |
|
| R Class | 81,841 |
|
| Directors' fees and expenses | 41,543 |
|
| Other expenses | 974 |
|
| | 5,994,868 |
|
| | |
| Net investment income (loss) | 623,612 |
|
| | |
| Realized and Unrealized Gain (Loss) | |
| Net realized gain (loss) on: | |
| Investment transactions | 54,034,732 |
|
| Futures contract transactions | 455,241 |
|
| | 54,489,973 |
|
| | |
| Change in net unrealized appreciation (depreciation) on investments | 29,995,696 |
|
| | |
| Net realized and unrealized gain (loss) | 84,485,669 |
|
| | |
| Net Increase (Decrease) in Net Assets Resulting from Operations | $ | 85,109,281 |
|
See Notes to Financial Statements.
|
|
| Statement of Changes in Net Assets |
|
| | | | | | |
| YEARS ENDED JUNE 30, 2018 AND JUNE 30, 2017 |
| Increase (Decrease) in Net Assets | June 30, 2018 | June 30, 2017 |
| Operations | | |
| Net investment income (loss) | $ | 623,612 |
| $ | 2,362,622 |
|
| Net realized gain (loss) | 54,489,973 |
| 107,264,915 |
|
| Change in net unrealized appreciation (depreciation) | 29,995,696 |
| 25,400,140 |
|
| Net increase (decrease) in net assets resulting from operations | 85,109,281 |
| 135,027,677 |
|
| | | |
| Distributions to Shareholders | | |
| From net investment income: | | |
| Investor Class | (785,449 | ) | (2,297,524 | ) |
| I Class | (64,889 | ) | (198,792 | ) |
| A Class | — |
| (54,373 | ) |
| R5 Class | (11 | ) | — |
|
| From net realized gains: | | |
| Investor Class | (29,880,393 | ) | — |
|
| I Class | (1,245,832 | ) | — |
|
| A Class | (1,379,611 | ) | — |
|
| C Class | (87,493 | ) | — |
|
| R Class | (829,884 | ) | — |
|
| R5 Class | (5,641 | ) | — |
|
| Decrease in net assets from distributions | (34,279,203 | ) | (2,550,689 | ) |
| | | |
| Capital Share Transactions | | |
| Net increase (decrease) in net assets from capital share transactions (Note 5) | (60,229,187 | ) | (202,281,383 | ) |
| | | |
| Net increase (decrease) in net assets | (9,399,109 | ) | (69,804,395 | ) |
| | | |
| Net Assets | | |
| Beginning of period | 670,437,390 |
| 740,241,785 |
|
| End of period | $ | 661,038,281 |
| $ | 670,437,390 |
|
| | | |
| Undistributed net investment income | $ | 144,806 |
| $ | 742,164 |
|
See Notes to Financial Statements.
|
|
| Notes to Financial Statements |
JUNE 30, 2018
1. Organization
American Century Quantitative Equity Funds, Inc. (the corporation) is registered under the Investment Company Act of 1940, as amended (the 1940 Act), as an open-end management investment company and is organized as a Maryland corporation. Small Company Fund (the fund) is one fund in a series issued by the corporation. The fund’s investment objective is to seek long-term capital growth by investing primarily in common stocks of small companies.
The fund offers the Investor Class, I Class, A Class, C Class, R Class and R5 Class. The A Class may incur an initial sales charge. The A Class and C Class may be subject to a contingent deferred sales charge. Sale of the R5 Class commenced on April 10, 2017.
2. Significant Accounting Policies
The following is a summary of significant accounting policies consistently followed by the fund in preparation of its financial statements. The fund is an investment company and follows accounting and reporting guidance in accordance with accounting principles generally accepted in the United States of America. This may require management to make certain estimates and assumptions at the date of the financial statements. Actual results could differ from these estimates. Management evaluated the impact of events or transactions occurring through the date the financial statements were issued that would merit recognition or disclosure.
Investment Valuations — The fund determines the fair value of its investments and computes its net asset value per share at the close of regular trading (usually 4 p.m. Eastern time) on the New York Stock Exchange (NYSE) on each day the NYSE is open. The Board of Directors has adopted valuation policies and procedures to guide the investment advisor in the fund’s investment valuation process and to provide methodologies for the oversight of the fund’s pricing function.
Equity securities that are listed or traded on a domestic securities exchange are valued at the last reported sales price or at the official closing price as provided by the exchange. Equity securities traded on foreign securities exchanges are generally valued at the closing price of such securities on the exchange where primarily traded or at the close of the NYSE, if that is earlier. If no last sales price is reported, or if local convention or regulation so provides, the mean of the latest bid and asked prices may be used. Securities traded over-the-counter are valued at the mean of the latest bid and asked prices, the last sales price, or the official closing price.
Open-end management investment companies are valued at the reported net asset value per share. Repurchase agreements are valued at cost, which approximates fair value. Exchange-traded futures contracts are valued at the settlement price as provided by the appropriate exchange.
If the fund determines that the market price for an investment is not readily available or the valuation methods mentioned above do not reflect an investment’s fair value, such investment is valued as determined in good faith by the Board of Directors or its delegate, in accordance with policies and procedures adopted by the Board of Directors. In its determination of fair value, the fund may review several factors including, but not limited to, market information regarding the specific investment or comparable investments and correlation with other investment types, futures indices or general market indicators. Circumstances that may cause the fund to use these procedures to value an investment include, but are not limited to: an investment has been declared in default or is distressed; trading in a security has been suspended during the trading day or a security is not actively trading on its principal exchange; prices received from a regular pricing source are deemed unreliable; or there is a foreign market holiday and no trading occurred.
The fund monitors for significant events occurring after the close of an investment’s primary exchange but before the fund’s net asset value per share is determined. Significant events may include, but are not limited to: corporate announcements and transactions; governmental action and political unrest that could impact a specific investment or an investment sector; or armed conflicts, natural disasters and similar events that could affect investments in a specific country or region. The fund also monitors for significant fluctuations between domestic and foreign markets, as evidenced by the U.S. market or such other indicators that the Board of Directors, or its delegate, deems appropriate. If significant fluctuations in foreign markets are identified, the
fund may apply a model-derived factor to the closing price of equity securities traded on foreign securities exchanges. The factor is based on observable market data as provided by an independent pricing service.
Security Transactions — Security transactions are accounted for as of the trade date. Net realized gains and losses are determined on the identified cost basis, which is also used for federal income tax purposes.
Investment Income — Dividend income less foreign taxes withheld, if any, is recorded as of the ex-dividend date. Distributions received on securities that represent a return of capital or long-term capital gain are recorded as a reduction of cost of investments and/or as a realized gain. The fund may estimate the components of distributions received that may be considered nontaxable distributions or long-term capital gain distributions for income tax purposes. Interest income is recorded on the accrual basis and includes accretion of discounts and amortization of premiums.
Repurchase Agreements — The fund may enter into repurchase agreements with institutions that American Century Investment Management, Inc. (ACIM) (the investment advisor) has determined are creditworthy pursuant to criteria adopted by the Board of Directors. The fund requires that the collateral, represented by securities, received in a repurchase transaction be transferred to the custodian in a manner sufficient to enable the fund to obtain those securities in the event of a default under the repurchase agreement. ACIM monitors, on a daily basis, the securities transferred to ensure the value, including accrued interest, of the securities under each repurchase agreement is equal to or greater than amounts owed to the fund under each repurchase agreement.
Joint Trading Account — Pursuant to an Exemptive Order issued by the Securities and Exchange Commission, the fund, along with certain other funds in the American Century Investments family of funds, may transfer uninvested cash balances into a joint trading account. These balances are invested in one or more repurchase agreements that are collateralized by U.S. Treasury or Agency obligations.
Segregated Assets — In accordance with the 1940 Act, the fund segregates assets on its books and records to cover certain types of investment securities and other financial instruments. ACIM monitors, on a daily basis, the securities segregated to ensure the fund designates a sufficient amount of liquid assets, marked-to-market daily. The fund may also receive assets or be required to pledge assets at the custodian bank or with a broker for collateral requirements.
Income Tax Status — It is the fund’s policy to distribute substantially all net investment income and net realized gains to shareholders and to otherwise qualify as a regulated investment company under provisions of the Internal Revenue Code. Accordingly, no provision has been made for income taxes. The fund files U.S. federal, state, local and non-U.S. tax returns as applicable. The fund's tax returns are subject to examination by the relevant taxing authority until expiration of the applicable statute of limitations, which is generally three years from the date of filing but can be longer in certain jurisdictions. At this time, management believes there are no uncertain tax positions which, based on their technical merit, would not be sustained upon examination and for which it is reasonably possible that the total amounts of unrecognized tax benefits will significantly change in the next twelve months.
Multiple Class — All shares of the fund represent an equal pro rata interest in the net assets of the class to which such shares belong, and have identical voting, dividend, liquidation and other rights and the same terms and conditions, except for class specific expenses and exclusive rights to vote on matters affecting only individual classes. Income, non-class specific expenses, and realized and unrealized capital gains and losses of the fund are allocated to each class of shares based on their relative net assets.
Distributions to Shareholders — Distributions from net investment income, if any, are generally declared and paid quarterly. Distributions from net realized gains, if any, are generally declared and paid annually. The fund may elect to treat a portion of its payment to a redeeming shareholder, which represents the pro rata share of undistributed net investment income and net realized gains, as a distribution for federal income tax purposes (tax equalization).
Indemnifications — Under the corporation’s organizational documents, its officers and directors are indemnified against certain liabilities arising out of the performance of their duties to the fund. In addition, in the normal course of business, the fund enters into contracts that provide general indemnifications. The maximum exposure under these arrangements is unknown as this would involve future claims that may be made against a fund. The risk of material loss from such claims is considered by management to be remote.
3. Fees and Transactions with Related Parties
Certain officers and directors of the corporation are also officers and/or directors of American Century Companies, Inc. (ACC). The corporation’s investment advisor, ACIM, the corporation's distributor, American Century Investment Services, Inc. (ACIS), and the corporation’s transfer agent, American Century Services, LLC, are wholly owned, directly or indirectly, by ACC. Various funds issued by American Century Asset Allocation Portfolios, Inc. own, in aggregate, 13% of the shares of the fund.
Management Fees — The corporation has entered into a management agreement with ACIM, under which ACIM provides the fund with investment advisory and management services in exchange for a single, unified management fee (the fee) per class. The agreement provides that all expenses of managing and operating the fund, except distribution and service fees, brokerage expenses, taxes, interest, fees and expenses of the independent directors (including legal counsel fees), and extraordinary expenses, will be paid by ACIM. The fee is computed and accrued daily based on each class's daily net assets and paid monthly in arrears. The difference in the fee among the classes is a result of their separate arrangements for non-Rule 12b-1 shareholder services. It is not the result of any difference in advisory or custodial fees or other expenses related to the management of the fund’s assets, which do not vary by class. The fee consists of (1) an Investment Category Fee based on the daily net assets of the fund and certain other accounts managed by the investment advisor that are in the same broad investment category as the fund and (2) a Complex Fee based on the assets of all the funds in the American Century Investments family of funds.
The Investment Category Fee range, the Complex Fee range and the effective annual management fee for each class for the period ended June 30, 2018 are as follows:
|
| | | |
| | Investment Category Fee Range | Complex Fee Range | Effective Annual Management Fee |
| Investor Class | 0.5380%
to 0.7200% | 0.2500% to 0.3100% | 0.86% |
| I Class | 0.0500% to 0.1100% | 0.66% |
| A Class | 0.2500% to 0.3100% | 0.86% |
| C Class | 0.2500% to 0.3100% | 0.86% |
| R Class | 0.2500% to 0.3100% | 0.86% |
| R5 Class | 0.0500% to 0.1100% | 0.66% |
Distribution and Service Fees — The Board of Directors has adopted a separate Master Distribution and Individual Shareholder Services Plan for each of the A Class, C Class and R Class (collectively the plans), pursuant to Rule 12b-1 of the 1940 Act. The plans provide that the A Class will pay ACIS an annual distribution and service fee of 0.25%. The plans provide that the C Class will pay ACIS an annual distribution and service fee of 1.00%, of which 0.25% is paid for individual shareholder services and 0.75% is paid for distribution services. The plans provide that the R Class will pay ACIS an annual distribution and service fee of 0.50%. The fees are computed and accrued daily based on each class’s daily net assets and paid monthly in arrears. The fees are used to pay financial intermediaries for distribution and individual shareholder services. Fees incurred under the plans during the period ended June 30, 2018 are detailed in the Statement of Operations.
Directors' Fees and Expenses — The Board of Directors is responsible for overseeing the investment advisor’s management and operations of the fund. The directors receive detailed information about the fund and its investment advisor regularly throughout the year, and meet at least quarterly with management of the investment advisor to review reports about fund operations. The fund’s officers do not receive compensation from the fund.
Interfund Transactions — The fund may enter into security transactions with other American Century Investments funds and other client accounts of the investment advisor, in accordance with the 1940 Act rules and procedures adopted by the Board of Directors. The rules and procedures require, among other things, that these transactions be effected at the independent current market price of the security. During the period, the interfund purchases and sales were $5,810,626 and $740,582, respectively. The effect of interfund transactions on the Statement of Operations was $141,762 in net realized gain (loss) on investment transactions.
4. Investment Transactions
Purchases and sales of investment securities, excluding short-term investments, for the period ended June 30, 2018 were $617,372,243 and $705,190,727, respectively.
5. Capital Share Transactions
Transactions in shares of the fund were as follows:
|
| | | | | | | | | | |
| | Year ended June 30, 2018 | Year ended June 30, 2017(1) |
| | Shares | Amount | Shares | Amount |
| Investor Class/Shares Authorized | 340,000,000 |
| | 340,000,000 |
| |
| Sold | 7,270,277 |
| $ | 111,592,178 |
| 4,269,043 |
| $ | 59,905,387 |
|
| Issued in reinvestment of distributions | 1,991,057 |
| 30,226,281 |
| 167,883 |
| 2,272,354 |
|
| Redeemed | (12,109,286 | ) | (189,122,443 | ) | (17,472,669 | ) | (239,897,722 | ) |
| | (2,847,952 | ) | (47,303,984 | ) | (13,035,743 | ) | (177,719,981 | ) |
| I Class/Shares Authorized | 35,000,000 |
| | 35,000,000 |
| |
| Sold | 538,945 |
| 8,483,548 |
| 635,020 |
| 9,184,764 |
|
| Issued in reinvestment of distributions | 85,455 |
| 1,303,311 |
| 14,703 |
| 198,717 |
|
| Redeemed | (661,717 | ) | (10,287,095 | ) | (1,661,935 | ) | (22,580,690 | ) |
| | (37,317 | ) | (500,236 | ) | (1,012,212 | ) | (13,197,209 | ) |
| A Class/Shares Authorized | 35,000,000 |
| | 35,000,000 |
| |
| Sold | 249,098 |
| 3,779,255 |
| 617,311 |
| 8,519,411 |
|
| Issued in reinvestment of distributions | 77,935 |
| 1,156,559 |
| 3,570 |
| 46,715 |
|
| Redeemed | (955,491 | ) | (14,557,608 | ) | (1,357,649 | ) | (18,976,416 | ) |
| | (628,458 | ) | (9,621,794 | ) | (736,768 | ) | (10,410,290 | ) |
| C Class/Shares Authorized | 15,000,000 |
| | 15,000,000 |
| |
| Sold | 30,730 |
| 452,208 |
| 42,301 |
| 582,739 |
|
| Issued in reinvestment of distributions | 5,737 |
| 82,103 |
| — |
| — |
|
| Redeemed | (24,649 | ) | (363,944 | ) | (60,067 | ) | (828,370 | ) |
| | 11,818 |
| 170,367 |
| (17,766 | ) | (245,631 | ) |
| R Class/Shares Authorized | 20,000,000 |
| | 20,000,000 |
| |
| Sold | 271,949 |
| 4,056,105 |
| 406,701 |
| 5,613,958 |
|
| Issued in reinvestment of distributions | 46,547 |
| 677,257 |
| — |
| — |
|
| Redeemed | (525,637 | ) | (7,911,493 | ) | (464,861 | ) | (6,327,230 | ) |
| | (207,141 | ) | (3,178,131 | ) | (58,160 | ) | (713,272 | ) |
| R5 Class/Shares Authorized | 50,000,000 |
| | 50,000,000 |
| |
| Sold | 12,393 |
| 198,939 |
| 336 |
| 5,000 |
|
| Issued in reinvestment of distributions | 370 |
| 5,652 |
| — |
| — |
|
| | 12,763 |
| 204,591 |
| 336 |
| 5,000 |
|
| Net increase (decrease) | (3,696,287 | ) | $ | (60,229,187 | ) | (14,860,313 | ) | $ | (202,281,383 | ) |
| |
| (1) | April 10, 2017 (commencement of sale) through June 30, 2017 for the R5 Class. |
6. Fair Value Measurements
The fund’s investments valuation process is based on several considerations and may use multiple inputs to determine the fair value of the investments held by the fund. In conformity with accounting principles generally accepted in the United States of America, the inputs used to determine a valuation are classified into three broad levels.
| |
| • | Level 1 valuation inputs consist of unadjusted quoted prices in an active market for identical investments. |
| |
| • | Level 2 valuation inputs consist of direct or indirect observable market data (including quoted prices for comparable investments, evaluations of subsequent market events, interest rates, prepayment speeds, credit risk, etc.). These inputs also consist of quoted prices for identical investments initially expressed in local currencies that are adjusted through translation into U.S. dollars. |
| |
| • | Level 3 valuation inputs consist of unobservable data (including a fund’s own assumptions). |
The level classification is based on the lowest level input that is significant to the fair valuation measurement. The valuation inputs are not necessarily an indication of the risks associated with investing in these securities or other financial instruments. There were no significant transfers between levels during the period.
The following is a summary of the level classifications as of period end. The Schedule of Investments provides additional information on the fund’s portfolio holdings.
|
| | | | | | | | |
| | Level 1 | Level 2 | Level 3 |
| Assets | | | |
| Investment Securities | | | |
| Common Stocks | $ | 661,853,255 |
| — |
| — |
|
| Temporary Cash Investments | 452 |
| $ | 655,653 |
| — |
|
| | $ | 661,853,707 |
| $ | 655,653 |
| — |
|
7. Derivative Instruments
Equity Price Risk — The fund is subject to equity price risk in the normal course of pursuing its investment objectives. A fund may enter into futures contracts based on an equity index in order to manage its exposure to changes in market conditions. A fund may purchase futures contracts to gain exposure to increases in market value or sell futures contracts to protect against a decline in market value. Upon entering into a futures contract, a fund is required to deposit either cash or securities in an amount equal to a certain percentage of the contract value (initial margin). Subsequent payments (variation margin) are made or received daily, in cash, by a fund. The variation margin is equal to the daily change in the contract value and is recorded as unrealized gains and losses. A fund recognizes a realized gain or loss when the contract is closed or expires. Net realized and unrealized gains or losses occurring during the holding period of futures contracts are a component of net realized gain (loss) on futures contract transactions and change in net unrealized appreciation (depreciation) on futures contracts, respectively. One of the risks of entering into futures contracts is the possibility that the change in value of the contract may not correlate with the changes in value of the underlying securities. During the period, the fund participated in equity price risk derivative instruments for temporary investment purposes.
At period end, the fund did not have any derivative instruments disclosed on the Statement of Assets and Liabilities. For the year ended June 30, 2018, the effect of equity price risk derivative instruments on the Statement of Operations was $455,241 in net realized gain (loss) on futures contract transactions.
8. Risk Factors
The fund invests in common stocks of small companies. Because of this, the fund may be subject to greater risk and market fluctuations than a fund investing in larger, more established companies.
9. Federal Tax Information
The tax character of distributions paid during the years ended June 30, 2018 and June 30, 2017 were as follows:
|
| | | | | | |
| | 2018 | 2017 |
| Distributions Paid From | | |
| Ordinary income | $ | 850,349 |
| $ | 2,550,689 |
|
| Long-term capital gains | $ | 33,428,854 |
| — |
|
The book-basis character of distributions made during the year from net investment income or net realized gains may differ from their ultimate characterization for federal income tax purposes. These differences reflect the differing character of certain income items and net realized gains and losses for financial statement and tax purposes, and may result in reclassification among certain capital accounts on the financial statements.
As of period end, the federal tax cost of investments and the components of distributable earnings on a tax-basis were as follows:
|
| | | |
| Federal tax cost of investments | $ | 575,518,273 |
|
| Gross tax appreciation of investments | $ | 108,874,052 |
|
| Gross tax depreciation of investments | (21,882,965 | ) |
| Net tax appreciation (depreciation) of investments | $ | 86,991,087 |
|
| Undistributed ordinary income | $ | 375,686 |
|
| Accumulated long-term gains | $ | 36,902,515 |
|
The difference between book-basis and tax-basis unrealized appreciation (depreciation) is attributable
primarily to the tax deferral of losses on wash sales and the return of capital dividends received.
|
| | | | | | | | | | | | | | | |
| For a Share Outstanding Throughout the Years Ended June 30 (except as noted) |
| Per-Share Data | | | | | | | Ratios and Supplemental Data |
| | | Income From Investment Operations: | Distributions From: | | | Ratio to Average Net Assets of: | | |
| | Net Asset Value, Beginning of Period | Net Investment Income (Loss)(1) | Net Realized and Unrealized Gain (Loss) | Total From Investment Operations | Net Investment Income | Net
Realized
Gains | Total
Distributions | Net Asset Value, End of Period | Total Return(2) | Operating Expenses | Net Investment Income (Loss) | Portfolio Turnover Rate | Net Assets, End of Period (in thousands) |
| Investor Class | | | | | | | | | | | |
| 2018 | $15.04 | 0.02 | 1.91 | 1.93 | (0.02) | (0.78) | (0.80) | $16.17 | 13.18% | 0.86% | 0.11% | 92% |
| $592,615 |
|
| 2017 | $12.46 | 0.05 | 2.58 | 2.63 | (0.05) | — | (0.05) | $15.04 | 21.19% | 0.87% | 0.37% | 90% |
| $594,198 |
|
| 2016 | $13.68 | 0.04 | (1.22) | (1.18) | (0.04) | — | (0.04) | $12.46 | (8.63)% | 0.88% | 0.36% | 93% |
| $654,517 |
|
| 2015 | $13.10 | 0.03 | 0.56 | 0.59 | (0.01) | — | (0.01) | $13.68 | 4.51% | 0.87% | 0.25% | 100% |
| $464,592 |
|
| 2014 | $10.36 | 0.02 | 2.75 | 2.77 | (0.03) | — | (0.03) | $13.10 | 26.79% | 0.87% | 0.18% | 83% |
| $342,090 |
|
| I Class | | | | | | | | | | | |
| 2018 | $15.11 | 0.05 | 1.92 | 1.97 | (0.04) | (0.78) | (0.82) | $16.26 | 13.42% | 0.66% | 0.31% | 92% |
| $27,213 |
|
| 2017 | $12.52 | 0.08 | 2.59 | 2.67 | (0.08) | — | (0.08) | $15.11 | 21.41% | 0.67% | 0.57% | 90% |
| $25,863 |
|
| 2016 | $13.76 | 0.07 | (1.24) | (1.17) | (0.07) | — | (0.07) | $12.52 | (8.50)% | 0.68% | 0.56% | 93% |
| $34,094 |
|
| 2015 | $13.15 | 0.06 | 0.57 | 0.63 | (0.02) | — | (0.02) | $13.76 | 4.77% | 0.67% | 0.45% | 100% |
| $39,483 |
|
| 2014 | $10.41 | 0.05 | 2.76 | 2.81 | (0.07) | — | (0.07) | $13.15 | 27.02% | 0.67% | 0.38% | 83% |
| $39,805 |
|
| A Class | | | | | | | | | | | | | |
| 2018 | $14.72 | (0.02) | 1.86 | 1.84 | — | (0.78) | (0.78) | $15.78 | 12.90% | 1.11% | (0.14)% | 92% |
| $23,970 |
|
| 2017 | $12.19 | 0.02 | 2.53 | 2.55 | (0.02) | — | (0.02) | $14.72 | 20.85% | 1.12% | 0.12% | 90% |
| $31,600 |
|
| 2016 | $13.39 | 0.01 | (1.20) | (1.19) | (0.01) | — | (0.01) | $12.19 | (8.89)% | 1.13% | 0.11% | 93% |
| $35,153 |
|
| 2015 | $12.84 | —(3) | 0.55 | 0.55 | —(3) | — | —(3) | $13.39 | 4.30% | 1.12% | 0.00%(4) | 100% |
| $47,471 |
|
| 2014 | $10.15 | (0.01) | 2.70 | 2.69 | —(3) | — | —(3) | $12.84 | 26.54% | 1.12% | (0.07)% | 83% |
| $38,437 |
|
|
| | | | | | | | | | | | | | | |
| For a Share Outstanding Throughout the Years Ended June 30 (except as noted) |
| Per-Share Data | | | | | | | Ratios and Supplemental Data |
| | | Income From Investment Operations: | Distributions From: | | | Ratio to Average Net Assets of: | | |
| | Net Asset Value, Beginning of Period | Net Investment Income (Loss)(1) | Net Realized and Unrealized Gain (Loss) | Total From Investment Operations | Net Investment Income | Net
Realized
Gains | Total
Distributions | Net Asset Value, End of Period | Total Return(2) | Operating Expenses | Net Investment Income (Loss) | Portfolio Turnover Rate | Net Assets, End of Period (in thousands) |
| C Class | | | | | | | | | | | | | |
| 2018 | $14.27 | (0.13) | 1.80 | 1.67 | — | (0.78) | (0.78) | $15.16 | 12.01% | 1.86% | (0.89)% | 92% |
| $1,989 |
|
| 2017 | $11.89 | (0.08) | 2.46 | 2.38 | — | — | — | $14.27 | 20.02% | 1.87% | (0.63)% | 90% |
| $1,703 |
|
| 2016 | $13.15 | (0.07) | (1.19) | (1.26) | — | — | — | $11.89 | (9.58)% | 1.88% | (0.64)% | 93% |
| $1,631 |
|
| 2015 | $12.70 | (0.09) | 0.54 | 0.45 | — | — | — | $13.15 | 3.54% | 1.87% | (0.75)% | 100% |
| $1,212 |
|
| 2014 | $10.12 | (0.10) | 2.68 | 2.58 | — | — | — | $12.70 | 25.49% | 1.87% | (0.82)% | 83% |
| $685 |
|
| R Class | | | | | | | | | | | | | |
| 2018 | $14.46 | (0.06) | 1.83 | 1.77 | — | (0.78) | (0.78) | $15.45 | 12.56% | 1.36% | (0.39)% | 92% |
| $15,038 |
|
| 2017 | $11.99 | (0.02) | 2.49 | 2.47 | — | — | — | $14.46 | 20.60% | 1.37% | (0.13)% | 90% |
| $17,067 |
|
| 2016 | $13.19 | (0.01) | (1.19) | (1.20) | — | — | — | $11.99 | (9.10)% | 1.38% | (0.14)% | 93% |
| $14,847 |
|
| 2015 | $12.68 | (0.03) | 0.54 | 0.51 | — | — | — | $13.19 | 4.02% | 1.37% | (0.25)% | 100% |
| $5,185 |
|
| 2014 | $10.05 | (0.04) | 2.67 | 2.63 | — | — | — | $12.68 | 26.17% | 1.37% | (0.32)% | 83% |
| $2,743 |
|
| R5 Class | | | | | | | | | | | | | |
| 2018 | $15.12 | 0.06 | 1.90 | 1.96 | (0.03) | (0.78) | (0.81) | $16.27 | 13.34% | 0.66% | 0.31% | 92% |
| $213 |
|
2017(5) | $14.90 | 0.02 | 0.20 | 0.22 | — | — | — | $15.12 | 1.48% | 0.67%(6) | 0.51%(6) | 90%(7) |
| $5 |
|
|
|
| Notes to Financial Highlights |
| |
| (1) | Computed using average shares outstanding throughout the period. |
| |
| (2) | Total returns are calculated based on the net asset value of the last business day and do not reflect applicable sales charges, if any. Total returns for periods less than one year are not annualized. |
| |
| (3) | Per-share amount was less than $0.005. |
| |
| (4) | Ratio was less than 0.005%. |
| |
| (5) | April 10, 2017 (commencement of sale) through June 30, 2017. |
| |
| (7) | Portfolio turnover is calculated at the fund level. Percentage indicated was calculated for the year ended June 30, 2017. |
See Notes to Financial Statements.
|
|
| Report of Independent Registered Public Accounting Firm |
To the Board of Directors of American Century Quantitative Equity Funds, Inc. and Shareholders of Small Company Fund
Opinion on the Financial Statements
We have audited the accompanying statement of assets and liabilities, including the schedule of investments, of Small Company Fund (one of the funds constituting American Century Quantitative Equity Funds, Inc., referred to hereafter as the "Fund") as of June 30, 2018, the related statement of operations for the year ended June 30, 2018, the statement of changes in net assets for each of the two years in the period ended June 30, 2018, including the related notes, and the financial highlights for each of the periods indicated therein (collectively referred to as the “financial statements”). In our opinion, the financial statements present fairly, in all material respects, the financial position of the Fund as of June 30, 2018, the results of its operations for the year then ended, the changes in its net assets for each of the two years in the period ended June 30, 2018 and the financial highlights for each of the periods indicated therein in conformity with accounting principles generally accepted in the United States of America.
Basis for Opinion
These financial statements are the responsibility of the Fund’s management. Our responsibility is to express an opinion on the Fund’s financial statements based on our audits. We are a public accounting firm registered with the Public Company Accounting Oversight Board (United States) (“PCAOB”) and are required to be independent with respect to the Fund in accordance with the U.S. federal securities laws and the applicable rules and regulations of the Securities and Exchange Commission and the PCAOB.
We conducted our audits of these financial statements in accordance with the standards of the PCAOB. Those standards require that we plan and perform the audit to obtain reasonable assurance about whether the financial statements are free of material misstatement, whether due to error or fraud.
Our audits included performing procedures to assess the risks of material misstatement of the financial statements, whether due to error or fraud, and performing procedures that respond to those risks. Such procedures included examining, on a test basis, evidence regarding the amounts and disclosures in the financial statements. Our audits also included evaluating the accounting principles used and significant estimates made by management, as well as evaluating the overall presentation of the financial statements. Our procedures included confirmation of securities owned as of June 30, 2018 by correspondence with the custodian and brokers; when replies were not received from brokers, we performed other auditing procedures. We believe that our audits provide a reasonable basis for our opinion.
/s/ PricewaterhouseCoopers LLP
Kansas City, Missouri
August 16, 2018
We have served as the auditor of one or more investment companies in American Century Investments since 1997.
The Board of Directors
The individuals listed below serve as directors of the funds. Each director will continue to serve in this capacity until death, retirement, resignation or removal from office. The board has adopted a mandatory retirement age for directors who are not “interested persons,” as that term is defined in the Investment Company Act (independent directors). Independent directors shall retire by December 31 of the year in which they reach their 75th birthday; provided, however, that on or after January 1, 2022, independent trustees shall retire on December 31 of the year in which they reach their 76th birthday.
Mr. Thomas is an “interested person” because he currently serves as President and Chief Executive Officer of American Century Companies, Inc. (ACC), the parent company of American Century Investment Management, Inc. (ACIM or the advisor). The other directors (more than three-fourths of the total number) are independent. They are not employees, directors or officers of, and have no financial interest in, ACC or any of its wholly owned, direct or indirect, subsidiaries, including ACIM, American Century Investment Services, Inc. (ACIS) and American Century Services, LLC (ACS), and they do not have any other affiliations, positions or relationships that would cause them to be considered “interested persons” under the Investment Company Act. The directors serve in this capacity for eight (in the case of Jonathan S. Thomas, 16; and Ronald J. Gilson, 9) registered investment companies in the American Century Investments family of funds.
The following table presents additional information about the directors. The mailing address for each director other than Mr. Thomas is 1665 Charleston Road, Mountain View, California 94043. The mailing address for Mr. Thomas is 4500 Main Street, Kansas City, Missouri 64111.
|
| | | | | |
Name
(Year of Birth) | Position(s) Held with Funds | Length of Time Served | Principal Occupation(s) During Past 5 Years | Number of American Century Portfolios Overseen by Director | Other Directorships Held During Past 5 Years |
| Independent Directors |
|
|
Tanya S. Beder
(1955) | Director | Since 2011 | Chairman and CEO, SBCC Group Inc. (independent advisory services) (2006 to present) | 45 | CYS Investments, Inc.; Nabors Industries Ltd. |
Jeremy I. Bulow
(1954) | Director | Since 2011 | Professor of Economics, Stanford University, Graduate School of Business (1979 to present) | 45 | None |
Anne Casscells
(1958) | Director | Since 2016 | Co-Chief Executive Officer and Chief Investment Officer, Aetos Alternatives Management (investment advisory firm) (2001 to present); Lecturer in Accounting, Stanford University, Graduate School of Business (2009 to present) | 45 | None |
|
| | | | | |
Name
(Year of Birth) | Position(s) Held with Funds | Length of Time Served | Principal Occupation(s) During Past 5 Years | Number of American Century Portfolios Overseen by Director | Other Directorships Held During Past 5 Years |
| Independent Directors |
|
|
Ronald J. Gilson
(1946) | Director and Chairman of the Board | Since 1995
(Chairman since 2005) | Charles J. Meyers Professor of Law and Business, Emeritus, Stanford Law School (1979 to 2016); Marc and Eva Stern Professor of Law and Business, Columbia University School of Law (1992 to present) | 47 | None |
Frederick L. A. Grauer
(1946) | Director | Since 2008 | Senior Advisor, iShares by BlackRock, Inc. (investment management firm) (2010 to 2011, 2013 to 2015); Senior Advisor, Course Hero (an educational technology company) (2015 to present) | 45 | None |
Jonathan D. Levin
(1972) | Director | Since 2016 | Philip H. Knight Professor and Dean, Graduate School of Business, Stanford University (2016 to present); Professor, Stanford University, (2000 to present); Chair, Department of Economics, Stanford University (2011 to 2014) | 45 | None |
Peter F. Pervere
(1947) | Director | Since 2007 | Retired | 45 | None |
John B. Shoven
(1947) | Director | Since 2002 | Charles R. Schwab Professor of Economics, Stanford University (1973 to present) | 45 | Cadence Design Systems; Exponent; Financial Engines |
| Interested Director |
|
|
Jonathan S. Thomas
(1963) | Director and President | Since 2007 | President and Chief Executive Officer, ACC (2007 to present). Also serves as Chief Executive Officer, ACS; Executive Vice President, ACIM; Director, ACC, ACIM and other ACC subsidiaries | 115 | BioMed Valley Discoveries, Inc. |
The Statement of Additional Information has additional information about the fund's directors and is available without charge, upon request, by calling 1-800-345-2021.
Officers
The following table presents certain information about the executive officers of the funds. Each officer serves as an officer for each of the 16 (in the case of Robert J. Leach, 15) investment companies in the American Century family of funds, unless otherwise noted. No officer is compensated for his or her service as an officer of the funds. The listed officers are interested persons of the funds and are appointed or re-appointed on an annual basis. The mailing address for each officer listed below is 4500 Main Street, Kansas City, Missouri 64111.
|
| | |
Name
(Year of Birth) | Offices with the Funds | Principal Occupation(s) During the Past Five Years |
Jonathan S. Thomas
(1963) | Director and President since 2007 | President and Chief Executive Officer, ACC (2007 to present). Also serves as Chief Executive Officer, ACS; Executive Vice President, ACIM; Director, ACC, ACIM and other ACC subsidiaries |
Amy D. Shelton
(1964) | Chief Compliance Officer and Vice President since 2014 | Chief Compliance Officer, American Century funds, (2014 to present); Chief Compliance Officer, ACIM (2014 to present); Chief Compliance Officer, ACIS (2009 to present); Vice President, Client Interactions and Marketing, ACIS (2013 to 2014). Also serves as Vice President, ACIS |
Charles A. Etherington
(1957) | General Counsel since 2007 and Senior Vice President since 2006 | Attorney, ACC (1994 to present); Vice President, ACC (2005 to present); General Counsel, ACC (2007 to present). Also serves as General Counsel, ACIM, ACS, ACIS and other ACC subsidiaries; and Senior Vice President, ACIM and ACS |
C. Jean Wade
(1964) | Vice President,Treasurer and Chief Financial Officer since 2012 | Senior Vice President, ACS (2017 to present); Vice President, ACS (2000 to 2017) |
Robert J. Leach
(1966) | Vice President since 2006 and Assistant Treasurer since 2012 | Vice President, ACS (2000 to present) |
David H. Reinmiller
(1963) | Vice President since 2000 | Attorney, ACC (1994 to present). Also serves as Vice President, ACIM and ACS |
Ward D. Stauffer
(1960) | Secretary since 2005 | Attorney, ACC (2003 to present) |
|
|
| Approval of Management Agreement |
At a meeting held on June 19, 2018, the Fund’s Board of Directors (the "Board") unanimously approved the renewal of the management agreement pursuant to which American Century Investment Management, Inc. (the “Advisor”) acts as the investment advisor for the Fund. Under Section 15(c) of the Investment Company Act, contracts for investment advisory services are required to be reviewed, evaluated, and approved by a majority of a fund’s directors/trustees, including a majority of the independent Directors, each year. The Board regards this annual evaluation and renewal as one of its most important responsibilities.
The independent Directors have memorialized a statement regarding the relationship between their ongoing obligations to oversee and evaluate the performance of the Advisor and their annual consideration of renewal of the management agreement. In that statement, the independent Directors noted that their assessment of the Advisor’s performance is an ongoing process that takes place over the entire year and is informed by all of the extensive information that the Board and its committees receive and consider over time. This information, together with the additional materials provided specifically in connection with the review, are central to the Board’s assessment of the Advisor’s performance and its determination whether to renew the Fund’s management agreement.
Prior to its consideration of the renewal of the management agreement, the Board requested and reviewed extensive data and analysis relating to the proposed renewal. This information and analysis was compiled by the Advisor and certain independent providers of evaluation data concerning the Fund and the services provided to the Fund by the Advisor.
In connection with its consideration of the renewal of the management agreement, the Board’s review and evaluation of the services provided by the Advisor included, but was not limited to, the following:
| |
| • | the nature, extent, and quality of investment management, shareholder services, and other services provided to the Fund; |
| |
| • | the wide range of other programs and services the Advisor provides to the Fund and its shareholders on a routine and non-routine basis; |
| |
| • | the investment performance of the Fund, including data comparing the Fund’s performance to appropriate benchmarks and/or a peer group of other mutual funds with similar investment objectives and strategies; |
| |
| • | the cost of owning the Fund compared to the cost of owning similar funds; |
| |
| • | the Advisor’s compliance policies, procedures, and regulatory experience; |
| |
| • | financial data showing the cost of services provided to the Fund, the profitability of the Fund to the Advisor, and the overall profitability of the Advisor; |
| |
| • | strategic plans of the Advisor; |
| |
| • | any economies of scale associated with the Advisor’s management of the Fund and other accounts; |
| |
| • | services provided and charges to other investment management clients of the Advisor; |
| |
| • | acquired fund fees and expenses; |
| |
| • | payments and practices in connection with financial intermediaries holding shares of the Fund and the services provided by intermediaries in connection therewith; and |
| |
| • | any collateral benefits derived by the Advisor from the management of the Fund. |
In keeping with its practice, the Board held two in-person meetings to review and discuss the information provided in response to their request and held active discussions with the Advisor regarding the renewal of the management agreement. The independent Directors had the benefit of the advice of their independent counsel throughout the process.
Factors Considered
The Directors considered all of the information provided by the Advisor, the independent data providers, and the independent Directors’ independent counsel in connection with the approval. They determined that the information was sufficient for them to evaluate the management agreement for the Fund. In connection with their review, the Directors did not identify any single factor as being all-important or controlling and each Director may have attributed different levels of importance to different factors. In deciding to renew the management agreement, the Board based its decision on a number of factors, including the following:
Nature, Extent and Quality of Services - Generally. Under the management agreement, the Advisor is responsible for providing or arranging for all services necessary for the operation of the Fund. The Board noted that the Advisor provides or arranges at its own expense a wide variety of services including:
| |
| • | constructing and designing the Fund |
| |
| • | portfolio research and security selection |
| |
| • | initial capitalization/funding |
| |
| • | daily valuation of the Fund’s portfolio |
| |
| • | shareholder servicing and transfer agency, including shareholder confirmations, recordkeeping, and communications |
| |
| • | legal services (except the independent Directors’ counsel) |
| |
| • | regulatory and portfolio compliance |
| |
| • | marketing and distribution (except amounts paid by the Fund under Rule 12b-1 plans) |
The Board noted that many of these services have expanded over time in terms of both quantity and complexity in response to shareholder demands, competition in the industry, changing distribution channels, and the changing regulatory environment.
Investment Management, Shareholder, and Other Services. The nature of the investment management services provided to the Fund is quite complex and allows Fund shareholders access to professional money management, instant diversification of their investments within an asset class, the opportunity to easily diversify among asset classes by investing in or exchanging among various American Century Investments funds, and liquidity. In evaluating investment performance, the Board expects the Advisor to manage the Fund in accordance with its investment objectives and approved strategies. Further, the Directors recognize that the Advisor has an obligation to seek the best execution of fund trades. In providing these services, the Advisor utilizes teams of investment professionals (portfolio managers, analysts, research assistants, and securities traders) who require extensive information technology, research, training, compliance, and other systems to conduct their business. The Board, directly and through its Portfolio Committee, regularly reviews investment performance information for the Fund, together with comparative information for appropriate benchmarks and/or peer groups of similarly-managed funds, over different time horizons. The Directors also review detailed performance information during the management agreement approval process. If performance concerns are identified, the Fund receives special reviews until performance improves, during which the Board discusses with the Advisor the reasons for such results (e.g., market conditions, security selection) and any efforts being undertaken to improve performance. The Fund’s performance was above its benchmark for the five-year period and below its benchmark for the one-, three-, and ten-year periods reviewed by the Board. The Board found the investment management services provided by the Advisor to the Fund to be satisfactory and consistent with the management agreement.
Under the management agreement, the Advisor provides the Fund with a comprehensive package of transfer agency, shareholder, and other services. The Board, directly and through various committees of the Board, regularly reviews reports and evaluations of such services at its regular meetings. These reports include, but are not limited to, information regarding the operational efficiency and accuracy of the shareholder and transfer agency services provided, staffing levels, shareholder satisfaction (as measured by external as well as internal sources), technology support, new products and services offered to Fund shareholders, securities trading activities, portfolio valuation services, auditing services, and legal and operational compliance activities. The Board found the services provided by the Advisor to the Fund under the management agreement to be competitive and of high quality.
Costs of Services and Profitability. The Advisor provides detailed information concerning its cost of providing various services to the Fund, its profitability in managing the Fund, its overall profitability, and its financial condition. The Directors have reviewed with the Advisor the methodology used to prepare this financial information. This information is considered in evaluating the Advisor’s financial condition, its ability to continue to provide services under the management agreement, and the reasonableness of the current management fee. The Board concluded that the Advisor’s profits were reasonable in light of the services provided to the Fund.
Economies of Scale. The Board also reviewed information provided by the Advisor regarding the possible existence of economies of scale in connection with the management of the Fund. The Board concluded that economies of scale are difficult to measure and predict with precision, especially on a fund-by-fund basis. The Board concluded that the Advisor is appropriately sharing economies of scale through its competitive fee structure, offering competitive fees from fund inception, and through reinvestment in its business to provide shareholders enhanced and expanded services.
Comparison to Other Funds’ Fees. The management agreement provides that the Fund pays the Advisor a single, all-inclusive (or unified) management fee for providing all services necessary for the management and operation of the Fund, other than brokerage expenses, expenses attributable to short sales, taxes, interest, extraordinary expenses, the fees and expenses of the Fund’s independent Directors (including their independent legal counsel), and expenses incurred in connection with the provision of shareholder services and distribution services under a plan adopted pursuant to Rule 12b-1 under the 1940 Act. Under the unified fee structure, the Advisor is responsible for providing all investment advisory, custody, audit, administrative, compliance, recordkeeping, marketing, and shareholder services, or arranging and supervising third parties to provide such services. By contrast, most other funds are charged a variety of fees, including an investment advisory fee, a transfer agency fee, an administrative fee, distribution charges, and other expenses. Other than their investment advisory fees and any applicable Rule 12b-1 distribution fees, all other components of the total fees charged by these other funds may be increased without shareholder approval. The Board believes the unified fee structure is a benefit to Fund shareholders because it clearly discloses to shareholders the cost of owning Fund shares, and, since the unified fee cannot be increased without a vote of Fund shareholders, it shifts to the Advisor the risk of increased costs of operating the Fund and provides a direct incentive to minimize administrative inefficiencies. Part of the Board’s analysis of fee levels involves reviewing certain evaluative data compiled by an independent provider and comparing the Fund’s unified fee to the total expense ratio of peer funds. The unified fee charged to shareholders of the Fund was the lowest of the total expense ratios of the Fund’s peer group. The Board concluded that the management fee paid by the Fund to the Advisor under the management agreement is reasonable in light of the services provided to the Fund.
Comparison to Fees and Services Provided to Other Clients of the Advisor. The Board also requested and received information from the Advisor concerning the nature of the services, fees, costs, and profitability of its advisory services to advisory clients other than the Fund. They observed that these varying types of client accounts require different services and involve different regulatory and entrepreneurial risks than the management of the Fund. The Board analyzed this
information and concluded that the fees charged and services provided to the Fund were reasonable by comparison.
Payments to Intermediaries. The Directors also requested and received a description of payments made to intermediaries by the Fund and the Advisor and services provided by intermediaries. These payments include various payments made by the Fund or the Advisor to different types of intermediaries and recordkeepers for distribution and service activities provided for the Fund. The Directors reviewed such information and received representations from the Advisor that all such payments by the Fund were made pursuant to the Fund’s Rule 12b-1 Plan and that all such payments by the Advisor were made from the Advisor’s resources and reasonable profits. The Board found such payments to be reasonable in scope and purpose.
Collateral or “Fall-Out” Benefits Derived by the Advisor. The Board considered the existence of collateral benefits the Advisor may receive as a result of its relationship with the Fund. The Board noted that the Advisor’s primary business is managing mutual funds and it generally does not use fund or shareholder information to generate profits in other lines of business, and therefore does not derive any significant collateral benefits from them. The Board noted that the Advisor may receive proprietary research from broker-dealers that execute fund portfolio transactions. The Board also determined that the Advisor is able to provide investment management services to certain clients other than the Fund, at least in part, due to its existing infrastructure built to serve the fund complex. The Board noted that the assets of those other accounts are, where applicable, included with the assets of the Fund to determine breakpoints in the management fee schedule.
Existing Relationship. The Board also considered whether there was any reason for not continuing the existing arrangement with the Advisor. In this regard, the Board was mindful of the potential disruptions of the Fund’s operations and various risks, uncertainties, and other effects that could occur as a result of a decision not to continue such relationship. In particular, the Board recognized that most shareholders have invested in the Fund on the strength of the Advisor’s industry standing and reputation and in the expectation that the Advisor will have a continuing role in providing advisory services to the Fund.
Conclusion of the Directors. As a result of this process, the Board, including all of the independent Directors and assisted by the advice of independent legal counsel, taking into account all of the factors discussed above and the information provided by the Advisor and others in connection with its review and throughout the year, concluded that the management agreement between the Fund and the Advisor is fair and reasonable in light of the services provided and should be renewed.
Retirement Account Information
As required by law, distributions you receive from certain retirement accounts are subject to federal income tax withholding, unless you elect not to have withholding apply*. Tax will be withheld on the total amount withdrawn even though you may be receiving amounts that are not subject to withholding, such as nondeductible contributions. In such case, excess amounts of withholding could occur. You may adjust your withholding election so that a greater or lesser amount will be withheld.
If you don’t want us to withhold on this amount, you must notify us to not withhold the federal income tax. You may notify us in writing or in certain situations by telephone or through other electronic means. For systematic withdrawals, your withholding election will remain in effect until revoked or changed by filing a new election. You have the right to revoke your election at any time and change your withholding percentage for future distributions.
Remember, even if you elect not to have income tax withheld, you are liable for paying income tax on the taxable portion of your withdrawal. If you elect not to have income tax withheld or you don’t have enough income tax withheld, you may be responsible for payment of estimated tax. You may incur penalties under the estimated tax rules if your withholding and estimated tax payments are not sufficient. You can reduce or defer the income tax on a distribution by directly or indirectly rolling such distribution over to another IRA or eligible plan. You should consult your tax advisor for additional information.
State tax will be withheld if, at the time of your distribution, your address is within one of the mandatory withholding states and you have federal income tax withheld (or as otherwise required by state law). State taxes will be withheld from your distribution in accordance with the respective state rules.
*Some 403(b), 457 and qualified retirement plan distributions may be subject to 20% mandatory withholding, as they are subject to special tax and withholding rules. Your plan administrator or plan sponsor is required to provide you with a special tax notice explaining those rules at the time you request a distribution. If applicable, federal and/or state taxes may be withheld from your distribution amount.
Proxy Voting Policies
Descriptions of the principles and policies that the fund's investment advisor uses in exercising the voting rights associated with the securities purchased and/or held by the fund are available without charge, upon request, by calling 1-800-345-2021 or visiting the "About Us" page of American Century Investments’ website at americancentury.com. A description of the policies is also available on the Securities and Exchange Commission’s website at sec.gov. Information regarding how the investment advisor voted proxies relating to portfolio securities during the most recent 12-month period ended June 30 is available on the "About Us" page at americancentury.com. It is also available at sec.gov.
Quarterly Portfolio Disclosure
The fund files its complete schedule of portfolio holdings with the Securities and Exchange Commission (SEC) for the first and third quarters of each fiscal year on Form N-Q. The fund’s Forms N-Q are available on the SEC’s website at sec.gov, and may be reviewed and copied at the SEC’s Public Reference Room in Washington, DC. Information on the operation of the Public Reference Room may be obtained by calling 1-800-SEC-0330. The fund also makes its complete schedule of portfolio holdings for the most recent quarter of its fiscal year available on its website at americancentury.com and, upon request, by calling 1-800-345-2021.
Other Tax Information
The following information is provided pursuant to provisions of the Internal Revenue Code.
The fund hereby designates up to the maximum amount allowable as qualified dividend income for the fiscal year ended June 30, 2018.
For corporate taxpayers, the fund hereby designates $850,349, or up to the maximum amount allowable, of ordinary income distributions paid during the fiscal year ended June 30, 2018 as qualified for the corporate dividends received deduction.
The fund hereby designates $36,758,781, or up to the maximum amount allowable, as long-term capital gain distributions (20% rate gain distributions) for the fiscal year ended June 30, 2018.
The fund hereby designates $14,887 as qualified short-term capital gain distributions for purposes of Internal Revenue Code Section 871 for the fiscal year ended June 30, 2018.
The fund utilized earnings and profits of $3,361,127 distributed to shareholders on redemption of shares as part of the dividends paid deduction (tax equalization).
|
| | |
| |
| | | |
| Contact Us | americancentury.com | |
| Automated Information Line | 1-800-345-8765 | |
| Investor Services Representative | 1-800-345-2021
or 816-531-5575 | |
| Investors Using Advisors | 1-800-378-9878 | |
Business, Not-For-Profit, Employer-Sponsored
Retirement Plans | 1-800-345-3533 | |
Banks and Trust Companies, Broker-Dealers,
Financial Professionals, Insurance Companies | 1-800-345-6488 | |
| Telecommunications Relay Service for the Deaf | 711 | |
| | | |
| American Century Quantitative Equity Funds, Inc. | |
| | | |
Investment Advisor: American Century Investment Management, Inc. Kansas City, Missouri | |
| | | |
| This report and the statements it contains are submitted for the general information of our shareholders. The report is not authorized for distribution to prospective investors unless preceded or accompanied by an effective prospectus. | |
| | | |
©2018 American Century Proprietary Holdings, Inc. All rights reserved.
CL-ANN-92992 1808 | |
|
| |
| | |
| | Annual Report |
| | |
| | June 30, 2018 |
| | |
| | Utilities Fund |
| | Investor Class (BULIX) |
|
| | |
| President's Letter | 2 |
|
| Performance | 3 |
|
| Portfolio Commentary | |
|
| Fund Characteristics | |
|
| Shareholder Fee Example | |
|
| Schedule of Investments | |
|
| Statement of Assets and Liabilities | |
|
| Statement of Operations | |
|
| Statement of Changes in Net Assets | |
|
| Notes to Financial Statements | |
|
| Financial Highlights | |
|
| Report of Independent Registered Public Accounting Firm | |
|
| Management | |
|
| Approval of Management Agreement | |
|
| Additional Information | |
|
Any opinions expressed in this report reflect those of the author as of the date of the report, and do not necessarily represent the opinions of American Century Investments® or any other person in the American Century Investments organization. Any such opinions are subject to change at any time based upon market or other conditions and American Century Investments disclaims any responsibility to update such opinions. These opinions may not be relied upon as investment advice and, because investment decisions made by American Century Investments funds are based on numerous factors, may not be relied upon as an indication of trading intent on behalf of any American Century Investments fund. Security examples are used for representational purposes only and are not intended as recommendations to purchase or sell securities. Performance information for comparative indices and securities is provided to American Century Investments by third party vendors. To the best of American Century Investments’ knowledge, such information is accurate at the time of printing.
Jonathan Thomas
Dear Investor:
Thank you for reviewing this annual report for the period ended June 30, 2018. Annual reports help convey important information about fund returns, including market factors that affected performance during the reporting period. For additional, updated investment and market insights, we encourage you to visit our website, americancentury.com.
Volatility’s Return Challenged Financial Markets
Broad U.S. and global stock market indices generally rallied for the first half of the 12-month period. A favorable backdrop of robust corporate earnings results, improving global economic growth, and relatively low interest rates, combined with the effects of U.S. tax reform, drove stock prices higher. For the six months ended December 31, 2017, U.S. stocks (S&P 500 Index) returned 11.42%. U.S. bond returns were also positive, but much more subdued, as the Federal Reserve (the Fed) continued its rate-normalization efforts and interest rates edged higher. The Bloomberg Barclays U.S. Aggregate Bond Index returned 1.24% for the six-month period.
In early February, a force that was largely dormant during 2017—volatility—re-emerged, as better-than-expected economic data triggered expectations for rising inflation, higher interest rates, and a more-hawkish Fed. In response, U.S. Treasury yields climbed to their highest levels in several years, and stock prices plunged. Economic data released in subsequent months were more in line with market expectations, while corporate earnings results remained healthy. These factors helped calm the market unrest, and stocks generally recovered their earlier losses. Nevertheless, rising interest rates, geopolitical tensions, and the mounting threat of a global trade war continued to provide periodic headwinds for investors.
Despite the return of volatility, U.S. stocks (S&P 500 Index) gained14.37% for the 12-month period. Meanwhile, rising U.S. Treasury yields, particularly in the second half of the period, took a toll on bonds and other interest-rate-sensitive investments, including gold, utilities stocks, and real estate investment trusts (REITs). Investment-grade bonds (Bloomberg Barclays U.S. Aggregate Bond Index) returned -0.40% for the 12 months.
With volatility resurfacing, inflationary pressures building, Treasury yields rising, and the implications of U.S. tariff and trade policy still unfolding, investors likely will face new opportunities and challenges in the months ahead. We believe this scenario warrants a disciplined, diversified, and risk-aware approach, using professionally managed portfolios in pursuit of investment goals. We appreciate your continued trust and confidence in us.
Sincerely,
Jonathan Thomas
President and Chief Executive Officer
American Century Investments
|
| | | | | |
| Total Returns as of June 30, 2018 |
| | | | Average Annual Returns | |
| | Ticker Symbol | 1 year | 5 years | 10 years | Inception Date |
| Investor Class | BULIX | -0.06% | 7.61% | 5.95% | 3/1/93 |
| Russell 3000 Utilities Index | — | 3.27% | 8.21% | 6.89% | — |
| S&P 500 Index | — | 14.37% | 13.41% | 10.16% | — |
|
|
| Growth of $10,000 Over 10 Years |
| $10,000 investment made June 30, 2008 |
|
| |
| Value on June 30, 2018 |
| | Investor Class — $17,823 |
| |
| | Russell 3000 Utilities Index — $19,470 |
| |
| | S&P 500 Index — $26,340 |
| |
|
|
| Total Annual Fund Operating Expenses |
Investor Class 0.67% |
The total annual fund operating expenses shown is as stated in the fund’s prospectus current as of the date of this report. The prospectus may vary from the expense ratio shown elsewhere in this report because it is based on a different time period, includes acquired fund fees and expenses, and, if applicable, does not include fee waivers or expense reimbursements.
Data presented reflect past performance. Past performance is no guarantee of future results. Current performance may be higher or lower than the performance shown. Total returns for periods less than one year are not annualized. Investment return and principal value will fluctuate, and redemption value may be more or less than original cost. Data assumes reinvestment of dividends and capital gains, and none of the charts reflect the deduction of taxes that a shareholder would pay on fund distributions or the redemption of fund shares. To obtain performance data current to the most recent month end, please call 1-800-345-2021 or visit americancentury.com. For additional information about the fund, please consult the prospectus.
Portfolio Managers: Yulin Long and Tsuyoshi Ozaki
During the period, Tsuyoshi Ozaki joined the fund's management team.
Performance Summary
Utilities returned -0.06% for the 12 months ended June 30, 2018, trailing the 3.27% return of its benchmark, the Russell 3000 Utilities Index. By comparison, the S&P 500 Index, a broad market measure, returned 14.37%.
The Russell 3000 Utilities Index is primarily made up of utilities and telecommunication services stocks but includes smaller allocations to other sectors. In the benchmark, the utilities sector, which made up more than 60% of the index on average during the reporting period, returned almost 5%. The telecommunication services sector, which represented nearly 40% of the index on average, gained roughly 1%. Information technology stocks, a tiny segment of the index, rose 4.5%. Compared with the Russell 3000 Utilities Index, the portfolio's underperformance was largely a result of stock selection decisions in the utilities sector.
Positive Growth Outweighed by Rising Interest Rates
U.S. utility stock performance was limited by rising interest rates during the reporting period. Utility stocks are characterized by their comparatively high dividend payouts and steady dividend growth. As a result, they are attractive to income-oriented investors as an alternative or complement to bonds. Historically, when bond yields rise, utility stocks become comparatively less attractive and underperform. In addition, utilities companies can carry significant amounts of debt to finance large capital spending programs, which means higher interest rates increase their borrowing costs. Despite these challenges, improving economic growth was reflected in higher electricity demand. In addition, an emphasis on investment in more efficient and environmentally friendly plants and equipment in recent years all combined to support utility company earnings and dividend growth. This reflects the fact that utilities companies’ return on investment is predetermined by regulators, which may provide a consistent, attractive path to growth.
Electric Utilities Stocks Detracted the Most
The main source of weakness relative to the benchmark was electric utilities companies. These stocks tend to be highly capital intensive and sensitive to rising interest rates. Electric utilities Spark Energy, PG&E, PPL, NextEra Energy, and Edison International were some of the leading detractors from performance for the fiscal year.
Positioning in the water utilities industry also detracted from relative results. The portfolio had no exposure to the industry, which was among the better-performing segments of the benchmark. Fund performance was also limited by holdings among gas utilities. Here National Fuel Gas was the leading detractor.
Telecommunication Services Another Source of Weakness
Stock selection in the telecommunication services sector also detracted from relative performance. Diversified telecommunication services firm CenturyLink was the main source of weakness in the sector. The company reported disappointing earnings and faced investor uncertainty around its acquisition of Level 3 Communications during the period. An underweight allocation to wireless carrier Verizon Communications also detracted, as the stock rebounded after a difficult period of intense competition in the industry.
In the information technology sector, internet and software services company j2 Global was the leading detractor. The stock declined early in the reporting period after reporting disappointing revenues and earnings. Nevertheless, the company announced a dividend increase, and reported positive earnings growth in subsequent quarters.
Key Contributors Varied
Notable individual contributions came from stock choices in both utilities and telecommunication services sectors. It was beneficial to underweight AT&T, which is engaged in an attempt to take over Time Warner and drive subscriber growth through content. Northeast energy provider Public Service Enterprise Group was another source of strength on the prospect of higher customer utility rates and closures of older, higher-cost plants.
Portfolio Positioning
We employ a structured, disciplined investment approach. We incorporate both growth and valuation measures into our stock selection process and attempt to balance the portfolio’s risk and expected return. We continue to overweight utilities and information technology stocks relative to the benchmark. The telecommunication services sector is significantly underweight because of only modest exposure to diversified telecommunication services firms.
|
| |
| JUNE 30, 2018 |
| Top Ten Holdings | % of net assets |
| AT&T, Inc. | 12.3% |
| Verizon Communications, Inc. | 12.3% |
| Exelon Corp. | 4.8% |
| Southern Co. (The) | 4.7% |
| Public Service Enterprise Group, Inc. | 4.7% |
| PG&E Corp. | 4.7% |
| PPL Corp. | 4.7% |
| Edison International | 4.6% |
| Entergy Corp. | 4.2% |
| CenterPoint Energy, Inc. | 3.9% |
| | |
| Sub-Industry Allocation | % of net assets |
| Electric Utilities | 42.0% |
| Integrated Telecommunication Services | 24.6% |
| Multi-Utilities | 14.8% |
| Gas Utilities | 7.4% |
| Independent Power Producers and Energy Traders | 7.0% |
| Wireless Telecommunication Services | 2.5% |
| Internet Software and Services | 0.4% |
| Alternative Carriers | 0.4% |
| Cash and Equivalents* | 0.9% |
| *Includes temporary cash investments and other assets and liabilities. | |
| | |
| Types of Investments in Portfolio | % of net assets |
| Common Stocks | 99.1% |
| Temporary Cash Investments | 0.6% |
| Other Assets and Liabilities | 0.3% |
Fund shareholders may incur two types of costs: (1) transaction costs, including sales charges (loads) on purchase payments and redemption/exchange fees; and (2) ongoing costs, including management fees; distribution and service (12b-1) fees; and other fund expenses. This example is intended to help you understand your ongoing costs (in dollars) of investing in your fund and to compare these costs with the ongoing cost of investing in other mutual funds.
The example is based on an investment of $1,000 made at the beginning of the period and held for the entire period from January 1, 2018 to June 30, 2018.
Actual Expenses
The table provides information about actual account values and actual expenses for each class. You may use the information, together with the amount you invested, to estimate the expenses that you paid over the period. First, identify the share class you own. Then simply divide your account value by $1,000 (for example, an $8,600 account value divided by $1,000 = 8.6), then multiply the result by the number under the heading “Expenses Paid During Period” to estimate the expenses you paid on your account during this period.
If you hold Investor Class shares of any American Century Investments fund, or I Class shares of the American Century Diversified Bond Fund, in an American Century Investments account (i.e., not a financial intermediary or retirement plan account), American Century Investments may charge you a $12.50 semiannual account maintenance fee if the value of those shares is less than $10,000. We will redeem shares automatically in one of your accounts to pay the $12.50 fee. In determining your total eligible investment amount, we will include your investments in all personal accounts (including American Century Investments Brokerage accounts) registered under your Social Security number. Personal accounts include individual accounts, joint accounts, UGMA/UTMA accounts, personal trusts, Coverdell Education Savings Accounts and IRAs (including traditional, Roth, Rollover, SEP-, SARSEP- and SIMPLE-IRAs), and certain other retirement accounts. If you have only business, business retirement, employer-sponsored or American Century Investments Brokerage accounts, you are currently not subject to this fee. If you are subject to the Account Maintenance Fee, your account value could be reduced by the fee amount.
Hypothetical Example for Comparison Purposes
The table also provides information about hypothetical account values and hypothetical expenses based on the actual expense ratio of each class of your fund and an assumed rate of return of 5% per year before expenses, which is not the actual return of a fund’s share class. The hypothetical account values and expenses may not be used to estimate the actual ending account balance or expenses you paid for the period. You may use this information to compare the ongoing costs of investing in your fund and other funds. To do so, compare this 5% hypothetical example with the 5% hypothetical examples that appear in the shareholder reports of the other funds.
Please note that the expenses shown in the table are meant to highlight your ongoing costs only and do not reflect any transactional costs, such as sales charges (loads) or redemption/exchange fees. Therefore, the table is useful in comparing ongoing costs only, and will not help you determine the relative total costs of owning different funds. In addition, if these transactional costs were included, your costs would have been higher.
|
| | | | |
| | Beginning
Account Value
1/1/18 | Ending
Account Value
6/30/18 | Expenses Paid
During Period(1)
1/1/18 - 6/30/18 |
Annualized
Expense Ratio(1) |
| Actual | | | | |
| Investor Class | $1,000 | $995.80 | $3.32 | 0.67% |
| Hypothetical | | | | |
| Investor Class | $1,000 | $1,021.47 | $3.36 | 0.67% |
| |
| (1) | Expenses are equal to the class's annualized expense ratio listed in the table above, multiplied by the average account value over the period, multiplied by 181, the number of days in the most recent fiscal half-year, divided by 365, to reflect the one-half year period. Annualized expense ratio reflects actual expenses, including any applicable fee waivers or expense reimbursements and excluding any acquired fund fees and expenses. |
JUNE 30, 2018
|
| | | | | |
| | Shares | Value |
| COMMON STOCKS — 99.1% | | |
| Alternative Carriers — 0.4% | | |
| CenturyLink, Inc. | 82,258 |
| $ | 1,533,289 |
|
| Electric Utilities — 42.0% | | |
| American Electric Power Co., Inc. | 75,971 |
| 5,260,992 |
|
| Duke Energy Corp. | 179,704 |
| 14,210,992 |
|
| Edison International | 292,027 |
| 18,476,548 |
|
| Entergy Corp. | 213,284 |
| 17,231,214 |
|
| Exelon Corp. | 452,949 |
| 19,295,627 |
|
| FirstEnergy Corp. | 365,371 |
| 13,120,473 |
|
| Hawaiian Electric Industries, Inc. | 296,445 |
| 10,168,063 |
|
| NextEra Energy, Inc. | 50,158 |
| 8,377,891 |
|
| OGE Energy Corp. | 114,570 |
| 4,034,010 |
|
| PG&E Corp. | 450,348 |
| 19,166,811 |
|
| PPL Corp. | 669,136 |
| 19,103,833 |
|
| Southern Co. (The) | 415,723 |
| 19,252,132 |
|
| Spark Energy, Inc., Class A | 277,129 |
| 2,702,008 |
|
| | | 170,400,594 |
|
| Gas Utilities — 7.4% | | |
| National Fuel Gas Co. | 230,562 |
| 12,210,563 |
|
| South Jersey Industries, Inc. | 120,802 |
| 4,043,243 |
|
| UGI Corp. | 266,639 |
| 13,883,893 |
|
| | | 30,137,699 |
|
| Independent Power Producers and Energy Traders — 7.0% | | |
| AES Corp. | 1,028,771 |
| 13,795,819 |
|
| NRG Energy, Inc. | 440,889 |
| 13,535,292 |
|
| NRG Yield, Inc., Class A | 75,281 |
| 1,283,541 |
|
| | | 28,614,652 |
|
| Integrated Telecommunication Services — 24.6% | | |
| AT&T, Inc. | 1,559,332 |
| 50,070,151 |
|
| Verizon Communications, Inc. | 986,923 |
| 49,652,096 |
|
| | | 99,722,247 |
|
| Internet Software and Services — 0.4% | | |
| j2 Global, Inc. | 18,896 |
| 1,636,583 |
|
| Multi-Utilities — 14.8% | | |
| Ameren Corp. | 167,474 |
| 10,190,793 |
|
| Black Hills Corp. | 138 |
| 8,447 |
|
| CenterPoint Energy, Inc. | 571,661 |
| 15,840,726 |
|
| Dominion Energy, Inc. | 85,847 |
| 5,853,049 |
|
| NorthWestern Corp. | 119,537 |
| 6,843,493 |
|
| Public Service Enterprise Group, Inc. | 354,379 |
| 19,186,079 |
|
| SCANA Corp. | 52,512 |
| 2,022,762 |
|
| | | 59,945,349 |
|
|
| | | | | |
| | Shares | Value |
| Wireless Telecommunication Services — 2.5% | | |
| Spok Holdings, Inc. | 202,267 |
| $ | 3,044,119 |
|
T-Mobile US, Inc.(1) | 121,651 |
| 7,268,647 |
|
| | | 10,312,766 |
|
TOTAL COMMON STOCKS
(Cost $346,988,752) | | 402,303,179 |
|
| TEMPORARY CASH INVESTMENTS — 0.6% | | |
| Repurchase Agreement, BMO Capital Markets Corp., (collateralized by various U.S. Treasury obligations, 1.375% - 3.75%, 2/15/19 - 11/15/47, valued at $1,226,358), in a joint trading account at 1.75%, dated 6/29/18, due 7/2/18 (Delivery value $1,201,776) | | 1,201,601 |
|
| Repurchase Agreement, Fixed Income Clearing Corp., (collateralized by various U.S. Treasury obligations, 2.75%, 2/15/28, valued at $1,021,479), at 0.90%, dated 6/29/18, due 7/2/18 (Delivery value $1,001,075) | | 1,001,000 |
|
| State Street Institutional U.S. Government Money Market Fund, Premier Class | 1,673 |
| 1,673 |
|
TOTAL TEMPORARY CASH INVESTMENTS
(Cost $2,204,274) | | 2,204,274 |
|
TOTAL INVESTMENT SECURITIES — 99.7%
(Cost $349,193,026) | | 404,507,453 |
|
| OTHER ASSETS AND LIABILITIES — 0.3% | | 1,336,204 |
|
| TOTAL NET ASSETS — 100.0% | | $ | 405,843,657 |
|
|
| |
| NOTES TO SCHEDULE OF INVESTMENTS |
See Notes to Financial Statements.
|
|
| Statement of Assets and Liabilities |
|
| | | |
| JUNE 30, 2018 |
| Assets |
| Investment securities, at value (cost of $349,193,026) | $ | 404,507,453 |
|
| Receivable for investments sold | 12,202,342 |
|
| Receivable for capital shares sold | 52,655 |
|
| Dividends and interest receivable | 633,160 |
|
| | 417,395,610 |
|
| | |
| Liabilities | |
| Payable for investments purchased | 10,949,190 |
|
| Payable for capital shares redeemed | 387,465 |
|
| Accrued management fees | 215,298 |
|
| | 11,551,953 |
|
| | |
| Net Assets | $ | 405,843,657 |
|
| | |
| Investor Class Capital Shares, $0.01 Par Value | |
| Shares authorized | 260,000,000 |
|
| Shares outstanding | 24,085,541 |
|
| | |
| Net Asset Value Per Share | $ | 16.85 |
|
| | |
| Net Assets Consist of: | |
| Capital (par value and paid-in surplus) | $ | 351,829,018 |
|
| Undistributed net investment income | 315,821 |
|
| Accumulated net realized loss | (1,614,735 | ) |
| Net unrealized appreciation | 55,313,553 |
|
| | $ | 405,843,657 |
|
See Notes to Financial Statements.
|
| | | |
| YEAR ENDED JUNE 30, 2018 |
| Investment Income (Loss) |
| Income: | |
| Dividends | $ | 18,788,674 |
|
| Interest | 17,454 |
|
| | 18,806,128 |
|
| | |
| Expenses: | |
| Management fees | 3,107,176 |
|
| Directors' fees and expenses | 29,476 |
|
| Other expenses | 6,711 |
|
| | 3,143,363 |
|
| | |
| Net investment income (loss) | 15,662,765 |
|
| | |
| Realized and Unrealized Gain (Loss) | |
| Net realized gain (loss) on investment transactions | 948,911 |
|
| | |
| Change in net unrealized appreciation (depreciation) on: | |
| Investments | (17,700,602 | ) |
| Translation of assets and liabilities in foreign currencies | 115 |
|
| | (17,700,487 | ) |
| | |
| Net realized and unrealized gain (loss) | (16,751,576 | ) |
| | |
| Net Increase (Decrease) in Net Assets Resulting from Operations | $ | (1,088,811 | ) |
See Notes to Financial Statements.
|
|
| Statement of Changes in Net Assets |
|
| | | | | | |
| YEARS ENDED JUNE 30, 2018 AND JUNE 30, 2017 |
| Increase (Decrease) in Net Assets | June 30, 2018 | June 30, 2017 |
| Operations | | |
| Net investment income (loss) | $ | 15,662,765 |
| $ | 18,504,751 |
|
| Net realized gain (loss) | 948,911 |
| 37,075,159 |
|
| Change in net unrealized appreciation (depreciation) | (17,700,487 | ) | (55,787,756 | ) |
| Net increase (decrease) in net assets resulting from operations | (1,088,811 | ) | (207,846 | ) |
| | | |
| Distributions to Shareholders | | |
| From net investment income | (15,058,609 | ) | (18,074,662 | ) |
| From net realized gains | (20,066,722 | ) | (22,385,358 | ) |
| Decrease in net assets from distributions | (35,125,331 | ) | (40,460,020 | ) |
| | | |
| Capital Share Transactions | | |
| Proceeds from shares sold | 51,770,202 |
| 180,590,229 |
|
| Proceeds from reinvestment of distributions | 33,504,690 |
| 38,889,473 |
|
| Payments for shares redeemed | (184,096,682 | ) | (278,274,127 | ) |
| Net increase (decrease) in net assets from capital share transactions | (98,821,790 | ) | (58,794,425 | ) |
| | | |
| Net increase (decrease) in net assets | (135,035,932 | ) | (99,462,291 | ) |
| | | |
| Net Assets | | |
| Beginning of period | 540,879,589 |
| 640,341,880 |
|
| End of period | $ | 405,843,657 |
| $ | 540,879,589 |
|
| | | |
| Undistributed net investment income | $ | 315,821 |
| — |
|
| | | |
| Transactions in Shares of the Fund | | |
| Sold | 2,935,538 |
| 9,671,577 |
|
| Issued in reinvestment of distributions | 1,910,190 |
| 2,103,074 |
|
| Redeemed | (10,579,560 | ) | (15,044,931 | ) |
| Net increase (decrease) in shares of the fund | (5,733,832 | ) | (3,270,280 | ) |
See Notes to Financial Statements.
|
|
| Notes to Financial Statements |
JUNE 30, 2018
1. Organization
American Century Quantitative Equity Funds, Inc. (the corporation) is registered under the Investment Company Act of 1940, as amended (the 1940 Act), as an open-end management investment company and is organized as a Maryland corporation. Utilities Fund (the fund) is one fund in a series issued by the corporation. The fund’s investment objectives are to seek current income and long-term growth of capital and income. The fund invests at least 80% of its assets in equity securities of companies engaged in the utilities industry. The fund offers the Investor Class.
2. Significant Accounting Policies
The following is a summary of significant accounting policies consistently followed by the fund in preparation of its financial statements. The fund is an investment company and follows accounting and reporting guidance in accordance with accounting principles generally accepted in the United States of America. This may require management to make certain estimates and assumptions at the date of the financial statements. Actual results could differ from these estimates. Management evaluated the impact of events or transactions occurring through the date the financial statements were issued that would merit recognition or disclosure.
Investment Valuations — The fund determines the fair value of its investments and computes its net asset value per share at the close of regular trading (usually 4 p.m. Eastern time) on the New York Stock Exchange (NYSE) on each day the NYSE is open. The Board of Directors has adopted valuation policies and procedures to guide the investment advisor in the fund’s investment valuation process and to provide methodologies for the oversight of the fund’s pricing function.
Equity securities that are listed or traded on a domestic securities exchange are valued at the last reported sales price or at the official closing price as provided by the exchange. Equity securities traded on foreign securities exchanges are generally valued at the closing price of such securities on the exchange where primarily traded or at the close of the NYSE, if that is earlier. If no last sales price is reported, or if local convention or regulation so provides, the mean of the latest bid and asked prices may be used. Securities traded over-the-counter are valued at the mean of the latest bid and asked prices, the last sales price, or the official closing price. Equity securities initially expressed in local currencies are translated into U.S. dollars at the mean of the appropriate currency exchange rate at the close of the NYSE as provided by an independent pricing service.
Open-end management investment companies are valued at the reported net asset value per share. Repurchase agreements are valued at cost, which approximates fair value.
If the fund determines that the market price for an investment is not readily available or the valuation methods mentioned above do not reflect an investment’s fair value, such investment is valued as determined in good faith by the Board of Directors or its delegate, in accordance with policies and procedures adopted by the Board of Directors. In its determination of fair value, the fund may review several factors including, but not limited to, market information regarding the specific investment or comparable investments and correlation with other investment types, futures indices or general market indicators. Circumstances that may cause the fund to use these procedures to value an investment include, but are not limited to: an investment has been declared in default or is distressed; trading in a security has been suspended during the trading day or a security is not actively trading on its principal exchange; prices received from a regular pricing source are deemed unreliable; or there is a foreign market holiday and no trading occurred.
The fund monitors for significant events occurring after the close of an investment’s primary exchange but before the fund’s net asset value per share is determined. Significant events may include, but are not limited to: corporate announcements and transactions; governmental action and political unrest that could impact a specific investment or an investment sector; or armed conflicts, natural disasters and similar events that could affect investments in a specific country or region. The fund also monitors for significant fluctuations between domestic and foreign markets, as evidenced by the U.S. market or such other indicators that the Board of Directors, or its delegate, deems appropriate. If significant fluctuations in foreign markets are identified, the fund may apply a model-derived factor to the closing price of equity securities traded on foreign securities exchanges. The factor is based on observable market data as provided by an independent pricing service.
Security Transactions — Security transactions are accounted for as of the trade date. Net realized gains and losses are determined on the identified cost basis, which is also used for federal income tax purposes.
Investment Income — Dividend income less foreign taxes withheld, if any, is recorded as of the ex-dividend date. Distributions received on securities that represent a return of capital or long-term capital gain are recorded as a reduction of cost of investments and/or as a realized gain. The fund may estimate the components of distributions received that may be considered nontaxable distributions or long-term capital gain distributions for income tax purposes. Interest income is recorded on the accrual basis and includes accretion of discounts and amortization of premiums.
Foreign Currency Translations — All assets and liabilities initially expressed in foreign currencies are translated into U.S. dollars at prevailing exchange rates at period end. The fund may enter into spot foreign currency exchange contracts to facilitate transactions denominated in a foreign currency. Purchases and sales of investment securities, dividend and interest income, spot foreign currency exchange contracts, and expenses are translated at the rates of exchange prevailing on the respective dates of such transactions. Net realized and unrealized foreign currency exchange gains or losses related to investment securities are a component of net realized gain (loss) on investment transactions and change in net unrealized appreciation (depreciation) on investments, respectively.
Repurchase Agreements — The fund may enter into repurchase agreements with institutions that American Century Investment Management, Inc. (ACIM) (the investment advisor) has determined are creditworthy pursuant to criteria adopted by the Board of Directors. The fund requires that the collateral, represented by securities, received in a repurchase transaction be transferred to the custodian in a manner sufficient to enable the fund to obtain those securities in the event of a default under the repurchase agreement. ACIM monitors, on a daily basis, the securities transferred to ensure the value, including accrued interest, of the securities under each repurchase agreement is equal to or greater than amounts owed to the fund under each repurchase agreement.
Joint Trading Account — Pursuant to an Exemptive Order issued by the Securities and Exchange Commission, the fund, along with certain other funds in the American Century Investments family of funds, may transfer uninvested cash balances into a joint trading account. These balances are invested in one or more repurchase agreements that are collateralized by U.S. Treasury or Agency obligations.
Income Tax Status — It is the fund’s policy to distribute substantially all net investment income and net realized gains to shareholders and to otherwise qualify as a regulated investment company under provisions of the Internal Revenue Code. Accordingly, no provision has been made for income taxes. The fund files U.S. federal, state, local and non-U.S. tax returns as applicable. The fund's tax returns are subject to examination by the relevant taxing authority until expiration of the applicable statute of limitations, which is generally three years from the date of filing but can be longer in certain jurisdictions. At this time, management believes there are no uncertain tax positions which, based on their technical merit, would not be sustained upon examination and for which it is reasonably possible that the total amounts of unrecognized tax benefits will significantly change in the next twelve months.
Distributions to Shareholders — Distributions from net investment income, if any, are generally declared and paid quarterly. Distributions from net realized gains, if any, are generally declared and paid annually.
Indemnifications — Under the corporation’s organizational documents, its officers and directors are indemnified against certain liabilities arising out of the performance of their duties to the fund. In addition, in the normal course of business, the fund enters into contracts that provide general indemnifications. The maximum exposure under these arrangements is unknown as this would involve future claims that may be made against a fund. The risk of material loss from such claims is considered by management to be remote.
3. Fees and Transactions with Related Parties
Certain officers and directors of the corporation are also officers and/or directors of American Century Companies, Inc. (ACC). The corporation’s investment advisor, ACIM, the corporation's distributor, American Century Investment Services, Inc., and the corporation’s transfer agent, American Century Services, LLC, are wholly owned, directly or indirectly, by ACC.
Management Fees — The corporation has entered into a management agreement with ACIM, under which ACIM provides the fund with investment advisory and management services in exchange for a single, unified management fee (the fee). The agreement provides that all expenses of managing and operating the fund, except brokerage expenses, taxes, interest, fees and expenses of the independent directors (including legal counsel fees), and extraordinary expenses, will be paid by ACIM. The fee is computed and accrued daily based on the daily net assets of the fund and paid monthly in arrears. The fee consists of (1) an Investment Category Fee based on the daily net assets of the fund and certain other accounts managed by the investment advisor that are in the same broad investment category as the fund and (2) a Complex Fee based on the assets of all the funds in the American Century Investments family of funds. The rates for the Investment Category Fee range from 0.3380% to 0.5200%. The rates for the Complex Fee range from 0.2500% to 0.3100%. The effective annual management fee for the period ended June 30, 2018 was 0.66%.
Directors' Fees and Expenses — The Board of Directors is responsible for overseeing the investment advisor’s management and operations of the fund. The directors receive detailed information about the fund and its investment advisor regularly throughout the year, and meet at least quarterly with management of the investment advisor to review reports about fund operations. The fund’s officers do not receive compensation from the fund.
Interfund Transactions — The fund may enter into security transactions with other American Century Investments funds and other client accounts of the investment advisor, in accordance with the 1940 Act rules and procedures adopted by the Board of Directors. The rules and procedures require, among other things, that these transactions be effected at the independent current market price of the security. During the period, the interfund sales were $3,249,341 and there were no interfund purchases. The effect of interfund transactions on the Statement of Operations was $(546,454) in net realized gain (loss) on investment transactions.
4. Investment Transactions
Purchases and sales of investment securities, excluding short-term investments, for the period ended
June 30, 2018 were $224,864,984 and $341,434,236, respectively.
5. Fair Value Measurements
The fund’s investments valuation process is based on several considerations and may use multiple inputs to determine the fair value of the investments held by the fund. In conformity with accounting principles generally accepted in the United States of America, the inputs used to determine a valuation are classified into three broad levels.
| |
| • | Level 1 valuation inputs consist of unadjusted quoted prices in an active market for identical investments. |
| |
| • | Level 2 valuation inputs consist of direct or indirect observable market data (including quoted prices for comparable investments, evaluations of subsequent market events, interest rates, prepayment speeds, credit risk, etc.). These inputs also consist of quoted prices for identical investments initially expressed in local currencies that are adjusted through translation into U.S. dollars. |
| |
| • | Level 3 valuation inputs consist of unobservable data (including a fund’s own assumptions). |
The level classification is based on the lowest level input that is significant to the fair valuation measurement. The valuation inputs are not necessarily an indication of the risks associated with investing in these securities or other financial instruments. There were no significant transfers between levels during the period.
The following is a summary of the level classifications as of period end. The Schedule of Investments provides additional information on the fund’s portfolio holdings.
|
| | | | | | | | |
| | Level 1 | Level 2 | Level 3 |
| Assets | | | |
| Investment Securities | | | |
| Common Stocks | $ | 402,303,179 |
| — |
| — |
|
| Temporary Cash Investments | 1,673 |
| $ | 2,202,601 |
| — |
|
| | $ | 402,304,852 |
| $ | 2,202,601 |
| — |
|
6. Risk Factors
The fund concentrates its investments in a narrow segment of the total market. Because of this, the fund may be subject to greater risk and market fluctuations than a portfolio representing a broader range of industries.
7. Federal Tax Information
The tax character of distributions paid during the years ended June 30, 2018 and June 30, 2017 were as follows:
|
| | | | | | |
| | 2018 | 2017 |
| Distributions Paid From | | |
| Ordinary income | $ | 18,583,068 |
| $ | 24,748,611 |
|
| Long-term capital gains | $ | 16,542,263 |
| $ | 15,711,409 |
|
The book-basis character of distributions made during the year from net investment income or net realized gains may differ from their ultimate characterization for federal income tax purposes. These differences reflect the differing character of certain income items and net realized gains and losses for financial statement and tax purposes, and may result in reclassification among certain capital accounts on the financial statements.
As of period end, the federal tax cost of investments and the components of distributable earnings on a tax-basis were as follows:
|
| | | |
| Federal tax cost of investments | $ | 351,170,861 |
|
| Gross tax appreciation of investments | $ | 62,778,272 |
|
| Gross tax depreciation of investments | (9,441,680 | ) |
| Net tax appreciation (depreciation) of investments | 53,336,592 |
|
Net tax appreciation (depreciation) on translation of assets and liabilities in foreign currencies | (874 | ) |
| Net tax appreciation (depreciation) | $ | 53,335,718 |
|
| Undistributed ordinary income | $ | 315,821 |
|
| Accumulated long-term gains | $ | 363,100 |
|
The difference between book-basis and tax-basis unrealized appreciation (depreciation) is attributable primarily to the tax deferral of losses on wash sales.
|
| | | | | | | | | | | | | | | |
| For a Share Outstanding Throughout the Years Ended June 30 (except as noted) | | | |
| Per-Share Data | | | | | | | Ratios and Supplemental Data | |
| | | Income From Investment Operations: | Distributions From: | | | Ratio to Average Net Assets of: | | |
| | Net Asset Value, Beginning of Period | Net Investment Income (Loss)(1) | Net Realized and Unrealized Gain (Loss) | Total From Investment Operations | Net Investment Income | Net Realized Gains | Total Distributions | Net Asset Value, End of Period | Total Return(2) | Operating Expenses | Net Investment Income (Loss) | Portfolio Turnover Rate | Net Assets, End of Period (in thousands) |
| Investor Class | | | | | | | | | | |
| 2018 | $18.14 | 0.58 | (0.58) | —(3) | (0.56) | (0.73) | (1.29) | $16.85 | (0.06)% | 0.67% | 3.31% | 48% |
| $405,844 |
|
| 2017 | $19.35 | 0.59 | (0.48) | 0.11 | (0.58) | (0.74) | (1.32) | $18.14 | 0.61% | 0.67% | 3.17% | 39% |
| $540,880 |
|
| 2016 | $16.28 | 0.57 | 3.44 | 4.01 | (0.54) | (0.40) | (0.94) | $19.35 | 25.76% | 0.68% | 3.35% | 36% |
| $640,342 |
|
| 2015 | $18.03 | 0.55 | (0.98) | (0.43) | (0.58) | (0.74) | (1.32) | $16.28 | (2.73)% | 0.67% | 3.14% | 40% |
| $348,382 |
|
| 2014 | $16.90 | 0.58 | 2.13 | 2.71 | (0.58) | (1.00) | (1.58) | $18.03 | 17.35% | 0.67% | 3.41% | 45% |
| $414,840 |
|
|
|
| Notes to Financial Highlights |
| |
| (1) | Computed using average shares outstanding throughout the period. |
| |
| (2) | Total returns are calculated based on the net asset value of the last business day. Total returns for periods less than one year are not annualized. |
| |
| (3) | Per share amount was less than $0.005. |
See Notes to Financial Statements.
|
|
| Report of Independent Registered Public Accounting Firm |
To the Board of Directors of American Century Quantitative Equity Funds, Inc. and Shareholders of Utilities Fund
Opinion on the Financial Statements
We have audited the accompanying statement of assets and liabilities, including the schedule of investments, of Utilities Fund (one of the funds constituting American Century Quantitative Equity Funds, Inc., referred to hereafter as the "Fund") as of June 30, 2018, the related statement of operations for the year ended June 30, 2018, the statement of changes in net assets for each of the two years in the period ended June 30, 2018, including the related notes, and the financial highlights for each of the five years in the period ended June 30, 2018 (collectively referred to as the “financial statements”). In our opinion, the financial statements present fairly, in all material respects, the financial position of the Fund as of June 30, 2018, the results of its operations for the year then ended, the changes in its net assets for each of the two years in the period ended June 30, 2018 and the financial highlights for each of the five years in the period ended June 30, 2018 in conformity with accounting principles generally accepted in the United States of America.
Basis for Opinion
These financial statements are the responsibility of the Fund’s management. Our responsibility is to express an opinion on the Fund’s financial statements based on our audits. We are a public accounting firm registered with the Public Company Accounting Oversight Board (United States) (“PCAOB”) and are required to be independent with respect to the Fund in accordance with the U.S. federal securities laws and the applicable rules and regulations of the Securities and Exchange Commission and the PCAOB.
We conducted our audits of these financial statements in accordance with the standards of the PCAOB. Those standards require that we plan and perform the audit to obtain reasonable assurance about whether the financial statements are free of material misstatement, whether due to error or fraud.
Our audits included performing procedures to assess the risks of material misstatement of the financial statements, whether due to error or fraud, and performing procedures that respond to those risks. Such procedures included examining, on a test basis, evidence regarding the amounts and disclosures in the financial statements. Our audits also included evaluating the accounting principles used and significant estimates made by management, as well as evaluating the overall presentation of the financial statements. Our procedures included confirmation of securities owned as of June 30, 2018 by correspondence with the custodian and brokers; when replies were not received from brokers, we performed other auditing procedures. We believe that our audits provide a reasonable basis for our opinion.
/s/ PricewaterhouseCoopers LLP
Kansas City, Missouri
August 16, 2018
We have served as the auditor of one or more investment companies in American Century Investments since 1997.
The Board of Directors
The individuals listed below serve as directors of the funds. Each director will continue to serve in this capacity until death, retirement, resignation or removal from office. The board has adopted a mandatory retirement age for directors who are not “interested persons,” as that term is defined in the Investment Company Act (independent directors). Independent directors shall retire by December 31 of the year in which they reach their 75th birthday; provided, however, that on or after January 1, 2022, independent trustees shall retire on December 31 of the year in which they reach their 76th birthday.
Mr. Thomas is an “interested person” because he currently serves as President and Chief Executive Officer of American Century Companies, Inc. (ACC), the parent company of American Century Investment Management, Inc. (ACIM or the advisor). The other directors (more than three-fourths of the total number) are independent. They are not employees, directors or officers of, and have no financial interest in, ACC or any of its wholly owned, direct or indirect, subsidiaries, including ACIM, American Century Investment Services, Inc. (ACIS) and American Century Services, LLC (ACS), and they do not have any other affiliations, positions or relationships that would cause them to be considered “interested persons” under the Investment Company Act. The directors serve in this capacity for eight (in the case of Jonathan S. Thomas, 16; and Ronald J. Gilson, 9) registered investment companies in the American Century Investments family of funds.
The following table presents additional information about the directors. The mailing address for each director other than Mr. Thomas is 1665 Charleston Road, Mountain View, California 94043. The mailing address for Mr. Thomas is 4500 Main Street, Kansas City, Missouri 64111.
|
| | | | | |
Name
(Year of Birth) | Position(s) Held with Funds | Length of Time Served | Principal Occupation(s) During Past 5 Years | Number of American Century Portfolios Overseen by Director | Other Directorships Held During Past 5 Years |
| Independent Directors |
|
|
Tanya S. Beder
(1955) | Director | Since 2011 | Chairman and CEO, SBCC Group Inc. (independent advisory services) (2006 to present) | 45 | CYS Investments, Inc.; Nabors Industries Ltd. |
Jeremy I. Bulow
(1954) | Director | Since 2011 | Professor of Economics, Stanford University, Graduate School of Business (1979 to present) | 45 | None |
Anne Casscells
(1958) | Director | Since 2016 | Co-Chief Executive Officer and Chief Investment Officer, Aetos Alternatives Management (investment advisory firm) (2001 to present); Lecturer in Accounting, Stanford University, Graduate School of Business (2009 to present) | 45 | None |
|
| | | | | |
Name
(Year of Birth) | Position(s) Held with Funds | Length of Time Served | Principal Occupation(s) During Past 5 Years | Number of American Century Portfolios Overseen by Director | Other Directorships Held During Past 5 Years |
| Independent Directors |
|
|
Ronald J. Gilson
(1946) | Director and Chairman of the Board | Since 1995
(Chairman since 2005) | Charles J. Meyers Professor of Law and Business, Emeritus, Stanford Law School (1979 to 2016); Marc and Eva Stern Professor of Law and Business, Columbia University School of Law (1992 to present) | 47 | None |
Frederick L. A. Grauer
(1946) | Director | Since 2008 | Senior Advisor, iShares by BlackRock, Inc. (investment management firm) (2010 to 2011, 2013 to 2015); Senior Advisor, Course Hero (an educational technology company) (2015 to present) | 45 | None |
Jonathan D. Levin
(1972) | Director | Since 2016 | Philip H. Knight Professor and Dean, Graduate School of Business, Stanford University (2016 to present); Professor, Stanford University, (2000 to present); Chair, Department of Economics, Stanford University (2011 to 2014) | 45 | None |
Peter F. Pervere
(1947) | Director | Since 2007 | Retired | 45 | None |
John B. Shoven
(1947) | Director | Since 2002 | Charles R. Schwab Professor of Economics, Stanford University (1973 to present) | 45 | Cadence Design Systems; Exponent; Financial Engines |
| Interested Director |
|
|
Jonathan S. Thomas
(1963) | Director and President | Since 2007 | President and Chief Executive Officer, ACC (2007 to present). Also serves as Chief Executive Officer, ACS; Executive Vice President, ACIM; Director, ACC, ACIM and other ACC subsidiaries | 115 | BioMed Valley Discoveries, Inc. |
The Statement of Additional Information has additional information about the fund's directors and is available without charge, upon request, by calling 1-800-345-2021.
Officers
The following table presents certain information about the executive officers of the funds. Each officer serves as an officer for each of the 16 (in the case of Robert J. Leach, 15) investment companies in the American Century family of funds, unless otherwise noted. No officer is compensated for his or her service as an officer of the funds. The listed officers are interested persons of the funds and are appointed or re-appointed on an annual basis. The mailing address for each officer listed below is 4500 Main Street, Kansas City, Missouri 64111.
|
| | |
Name
(Year of Birth) | Offices with the Funds | Principal Occupation(s) During the Past Five Years |
Jonathan S. Thomas
(1963) | Director and President since 2007 | President and Chief Executive Officer, ACC (2007 to present). Also serves as Chief Executive Officer, ACS; Executive Vice President, ACIM; Director, ACC, ACIM and other ACC subsidiaries |
Amy D. Shelton
(1964) | Chief Compliance Officer and Vice President since 2014 | Chief Compliance Officer, American Century funds, (2014 to present); Chief Compliance Officer, ACIM (2014 to present); Chief Compliance Officer, ACIS (2009 to present); Vice President, Client Interactions and Marketing, ACIS (2013 to 2014). Also serves as Vice President, ACIS |
Charles A. Etherington
(1957) | General Counsel since 2007 and Senior Vice President since 2006 | Attorney, ACC (1994 to present); Vice President, ACC (2005 to present); General Counsel, ACC (2007 to present). Also serves as General Counsel, ACIM, ACS, ACIS and other ACC subsidiaries; and Senior Vice President, ACIM and ACS |
C. Jean Wade
(1964) | Vice President,Treasurer and Chief Financial Officer since 2012 | Senior Vice President, ACS (2017 to present); Vice President, ACS (2000 to 2017) |
Robert J. Leach
(1966) | Vice President since 2006 and Assistant Treasurer since 2012 | Vice President, ACS (2000 to present) |
David H. Reinmiller
(1963) | Vice President since 2000 | Attorney, ACC (1994 to present). Also serves as Vice President, ACIM and ACS |
Ward D. Stauffer
(1960) | Secretary since 2005 | Attorney, ACC (2003 to present) |
|
|
| Approval of Management Agreement |
At a meeting held on June 19, 2018, the Fund’s Board of Directors (the "Board") unanimously approved the renewal of the management agreement pursuant to which American Century Investment Management, Inc. (the “Advisor”) acts as the investment advisor for the Fund. Under Section 15(c) of the Investment Company Act, contracts for investment advisory services are required to be reviewed, evaluated, and approved by a majority of a fund’s directors/trustees, including a majority of the independent Directors, each year. The Board regards this annual evaluation and renewal as one of its most important responsibilities.
The independent Directors have memorialized a statement regarding the relationship between their ongoing obligations to oversee and evaluate the performance of the Advisor and their annual consideration of renewal of the management agreement. In that statement, the independent Directors noted that their assessment of the Advisor’s performance is an ongoing process that takes place over the entire year and is informed by all of the extensive information that the Board and its committees receive and consider over time. This information, together with the additional materials provided specifically in connection with the review, are central to the Board’s assessment of the Advisor’s performance and its determination whether to renew the Fund’s management agreement.
Prior to its consideration of the renewal of the management agreement, the Board requested and reviewed extensive data and analysis relating to the proposed renewal. This information and analysis was compiled by the Advisor and certain independent providers of evaluation data concerning the Fund and the services provided to the Fund by the Advisor.
In connection with its consideration of the renewal of the management agreement, the Board’s review and evaluation of the services provided by the Advisor included, but was not limited to, the following:
| |
| • | the nature, extent, and quality of investment management, shareholder services, and other services provided to the Fund; |
| |
| • | the wide range of other programs and services the Advisor provides to the Fund and its shareholders on a routine and non-routine basis; |
| |
| • | the investment performance of the Fund, including data comparing the Fund’s performance to appropriate benchmarks and/or a peer group of other mutual funds with similar investment objectives and strategies; |
| |
| • | the cost of owning the Fund compared to the cost of owning similar funds; |
| |
| • | the Advisor’s compliance policies, procedures, and regulatory experience; |
| |
| • | financial data showing the cost of services provided to the Fund, the profitability of the Fund to the Advisor, and the overall profitability of the Advisor; |
| |
| • | strategic plans of the Advisor; |
| |
| • | any economies of scale associated with the Advisor’s management of the Fund and other accounts; |
| |
| • | services provided and charges to other investment management clients of the Advisor; |
| |
| • | acquired fund fees and expenses; |
| |
| • | payments and practices in connection with financial intermediaries holding shares of the Fund and the services provided by intermediaries in connection therewith; and |
| |
| • | any collateral benefits derived by the Advisor from the management of the Fund. |
In keeping with its practice, the Board held two in-person meetings to review and discuss the information provided in response to their request and held active discussions with the Advisor regarding the renewal of the management agreement. The independent Directors had the benefit of the advice of their independent counsel throughout the process.
Factors Considered
The Directors considered all of the information provided by the Advisor, the independent data providers, and the independent Directors’ independent counsel in connection with the approval. They determined that the information was sufficient for them to evaluate the management agreement for the Fund. In connection with their review, the Directors did not identify any single factor as being all-important or controlling and each Director may have attributed different levels of importance to different factors. In deciding to renew the management agreement, the Board based its decision on a number of factors, including the following:
Nature, Extent and Quality of Services - Generally. Under the management agreement, the Advisor is responsible for providing or arranging for all services necessary for the operation of the Fund. The Board noted that the Advisor provides or arranges at its own expense a wide variety of services including:
| |
| • | constructing and designing the Fund |
| |
| • | portfolio research and security selection |
| |
| • | initial capitalization/funding |
| |
| • | daily valuation of the Fund’s portfolio |
| |
| • | shareholder servicing and transfer agency, including shareholder confirmations, recordkeeping, and communications |
| |
| • | legal services (except the independent Directors’ counsel) |
| |
| • | regulatory and portfolio compliance |
| |
| • | marketing and distribution (except amounts paid by the Fund under Rule 12b-1 plans) |
The Board noted that many of these services have expanded over time in terms of both quantity and complexity in response to shareholder demands, competition in the industry, changing distribution channels, and the changing regulatory environment.
Investment Management, Shareholder, and Other Services. The nature of the investment management services provided to the Fund is quite complex and allows Fund shareholders access to professional money management, instant diversification of their investments within an asset class, the opportunity to easily diversify among asset classes by investing in or exchanging among various American Century Investments funds, and liquidity. In evaluating investment performance, the Board expects the Advisor to manage the Fund in accordance with its investment objectives and approved strategies. Further, the Directors recognize that the Advisor has an obligation to seek the best execution of fund trades. In providing these services, the Advisor utilizes teams of investment professionals (portfolio managers, analysts, research assistants, and securities traders) who require extensive information technology, research, training, compliance, and other systems to conduct their business. The Board, directly and through its Portfolio Committee, regularly reviews investment performance information for the Fund, together with comparative information for appropriate benchmarks and/or peer groups of similarly-managed funds, over different time horizons. The Directors also review detailed performance information during the management agreement approval process. If performance concerns are identified, the Fund receives special reviews until performance improves, during which the Board discusses with the Advisor the reasons for such results (e.g., market conditions, security selection) and any efforts being undertaken to improve performance. The Fund’s performance was below its benchmark for the one-, three-, five-, and ten-year periods reviewed by the Board. The Board found the investment management services provided by the Advisor to the Fund to be satisfactory and consistent with the management agreement.
Under the management agreement, the Advisor provides the Fund with a comprehensive package of transfer agency, shareholder, and other services. The Board, directly and through various committees of the Board, regularly reviews reports and evaluations of such services at its regular meetings. These reports include, but are not limited to, information regarding the operational efficiency and accuracy of the shareholder and transfer agency services provided, staffing levels, shareholder satisfaction (as measured by external as well as internal sources), technology support, new products and services offered to Fund shareholders, securities trading activities, portfolio valuation services, auditing services, and legal and operational compliance activities. The Board found the services provided by the Advisor to the Fund under the management agreement to be competitive and of high quality.
Costs of Services and Profitability. The Advisor provides detailed information concerning its cost of providing various services to the Fund, its profitability in managing the Fund, its overall profitability, and its financial condition. The Directors have reviewed with the Advisor the methodology used to prepare this financial information. This information is considered in evaluating the Advisor’s financial condition, its ability to continue to provide services under the management agreement, and the reasonableness of the current management fee. The Board concluded that the Advisor’s profits were reasonable in light of the services provided to the Fund.
Economies of Scale. The Board also reviewed information provided by the Advisor regarding the possible existence of economies of scale in connection with the management of the Fund. The Board concluded that economies of scale are difficult to measure and predict with precision, especially on a fund-by-fund basis. The Board concluded that the Advisor is appropriately sharing economies of scale through its competitive fee structure, offering competitive fees from fund inception, and through reinvestment in its business to provide shareholders enhanced and expanded services.
Comparison to Other Funds’ Fees. The management agreement provides that the Fund pays the Advisor a single, all-inclusive (or unified) management fee for providing all services necessary for the management and operation of the Fund, other than brokerage expenses, expenses attributable to short sales, taxes, interest, extraordinary expenses, the fees and expenses of the Fund’s independent Directors (including their independent legal counsel), and expenses incurred in connection with the provision of shareholder services and distribution services under a plan adopted pursuant to Rule 12b-1 under the 1940 Act. Under the unified fee structure, the Advisor is responsible for providing all investment advisory, custody, audit, administrative, compliance, recordkeeping, marketing, and shareholder services, or arranging and supervising third parties to provide such services. By contrast, most other funds are charged a variety of fees, including an investment advisory fee, a transfer agency fee, an administrative fee, distribution charges, and other expenses. Other than their investment advisory fees and any applicable Rule 12b-1 distribution fees, all other components of the total fees charged by these other funds may be increased without shareholder approval. The Board believes the unified fee structure is a benefit to Fund shareholders because it clearly discloses to shareholders the cost of owning Fund shares, and, since the unified fee cannot be increased without a vote of Fund shareholders, it shifts to the Advisor the risk of increased costs of operating the Fund and provides a direct incentive to minimize administrative inefficiencies. Part of the Board’s analysis of fee levels involves reviewing certain evaluative data compiled by an independent provider and comparing the Fund’s unified fee to the total expense ratio of peer funds. The unified fee charged to shareholders of the Fund was in the lowest quartile of the total expense ratios of the Fund’s peer universe. The Board concluded that the management fee paid by the Fund to the Advisor under the management agreement is reasonable in light of the services provided to the Fund.
Comparison to Fees and Services Provided to Other Clients of the Advisor. The Board also requested and received information from the Advisor concerning the nature of the services, fees, costs, and profitability of its advisory services to advisory clients other than the Fund. They observed that these varying types of client accounts require different services and involve different regulatory and entrepreneurial risks than the management of the Fund. The Board analyzed this
information and concluded that the fees charged and services provided to the Fund were reasonable by comparison.
Payments to Intermediaries. The Directors also requested and received a description of payments made to intermediaries by the Fund and the Advisor and services provided by intermediaries. These payments include various payments made by the Fund or the Advisor to different types of intermediaries and recordkeepers for distribution and service activities provided for the Fund. The Directors reviewed such information and received representations from the Advisor that all such payments by the Fund were made pursuant to the Fund’s Rule 12b-1 Plan and that all such payments by the Advisor were made from the Advisor’s resources and reasonable profits. The Board found such payments to be reasonable in scope and purpose.
Collateral or “Fall-Out” Benefits Derived by the Advisor. The Board considered the existence of collateral benefits the Advisor may receive as a result of its relationship with the Fund. The Board noted that the Advisor’s primary business is managing mutual funds and it generally does not use fund or shareholder information to generate profits in other lines of business, and therefore does not derive any significant collateral benefits from them. The Board noted that the Advisor may receive proprietary research from broker-dealers that execute fund portfolio transactions. The Board also determined that the Advisor is able to provide investment management services to certain clients other than the Fund, at least in part, due to its existing infrastructure built to serve the fund complex. The Board noted that the assets of those other accounts are, where applicable, included with the assets of the Fund to determine breakpoints in the management fee schedule.
Existing Relationship. The Board also considered whether there was any reason for not continuing the existing arrangement with the Advisor. In this regard, the Board was mindful of the potential disruptions of the Fund’s operations and various risks, uncertainties, and other effects that could occur as a result of a decision not to continue such relationship. In particular, the Board recognized that most shareholders have invested in the Fund on the strength of the Advisor’s industry standing and reputation and in the expectation that the Advisor will have a continuing role in providing advisory services to the Fund.
Conclusion of the Directors. As a result of this process, the Board, including all of the independent Directors and assisted by the advice of independent legal counsel, taking into account all of the factors discussed above and the information provided by the Advisor and others in connection with its review and throughout the year, concluded that the management agreement between the Fund and the Advisor is fair and reasonable in light of the services provided and should be renewed.
Retirement Account Information
As required by law, distributions you receive from certain retirement accounts are subject to federal income tax withholding, unless you elect not to have withholding apply*. Tax will be withheld on the total amount withdrawn even though you may be receiving amounts that are not subject to withholding, such as nondeductible contributions. In such case, excess amounts of withholding could occur. You may adjust your withholding election so that a greater or lesser amount will be withheld.
If you don’t want us to withhold on this amount, you must notify us to not withhold the federal income tax. You may notify us in writing or in certain situations by telephone or through other electronic means. For systematic withdrawals, your withholding election will remain in effect until revoked or changed by filing a new election. You have the right to revoke your election at any time and change your withholding percentage for future distributions.
Remember, even if you elect not to have income tax withheld, you are liable for paying income tax on the taxable portion of your withdrawal. If you elect not to have income tax withheld or you don’t have enough income tax withheld, you may be responsible for payment of estimated tax. You may incur penalties under the estimated tax rules if your withholding and estimated tax payments are not sufficient. You can reduce or defer the income tax on a distribution by directly or indirectly rolling such distribution over to another IRA or eligible plan. You should consult your tax advisor for additional information.
State tax will be withheld if, at the time of your distribution, your address is within one of the mandatory withholding states and you have federal income tax withheld (or as otherwise required by state law). State taxes will be withheld from your distribution in accordance with the respective state rules.
*Some 403(b), 457 and qualified retirement plan distributions may be subject to 20% mandatory withholding, as they are subject to special tax and withholding rules. Your plan administrator or plan sponsor is required to provide you with a special tax notice explaining those rules at the time you request a distribution. If applicable, federal and/or state taxes may be withheld from your distribution amount.
Proxy Voting Policies
Descriptions of the principles and policies that the fund's investment advisor uses in exercising the voting rights associated with the securities purchased and/or held by the fund are available without charge, upon request, by calling 1-800-345-2021 or visiting the "About Us" page of American Century Investments’ website at americancentury.com. A description of the policies is also available on the Securities and Exchange Commission’s website at sec.gov. Information regarding how the investment advisor voted proxies relating to portfolio securities during the most recent 12-month period ended June 30 is available on the "About Us" page at americancentury.com. It is also available at sec.gov.
Quarterly Portfolio Disclosure
The fund files its complete schedule of portfolio holdings with the Securities and Exchange Commission (SEC) for the first and third quarters of each fiscal year on Form N-Q. The fund’s Forms N-Q are available on the SEC’s website at sec.gov, and may be reviewed and copied at the SEC’s Public Reference Room in Washington, DC. Information on the operation of the Public Reference Room may be obtained by calling 1-800-SEC-0330. The fund also makes its complete schedule of portfolio holdings for the most recent quarter of its fiscal year available on its website at americancentury.com and, upon request, by calling 1-800-345-2021.
Other Tax Information
The following information is provided pursuant to provisions of the Internal Revenue Code.
The fund hereby designates up to the maximum amount allowable as qualified dividend income for the fiscal year ended June 30, 2018.
For corporate taxpayers, the fund hereby designates $16,937,226, or up to the maximum amount allowable, of ordinary income distributions paid during the fiscal year ended June 30, 2018 as qualified for the corporate dividends received deduction.
The fund hereby designates $3,523,407 as qualified short-term capital gain distributions for purposes of Internal Revenue Code Section 871 for the fiscal year ended June 30, 2018.
The fund hereby designates $16,542,263, or up to the maximum amount allowable, as long-term capital gain distributions (20% rate gain distributions) for the fiscal year ended June 30, 2018.
|
| | |
| |
| | | |
| Contact Us | americancentury.com | |
| Automated Information Line | 1-800-345-8765 | |
| Investor Services Representative | 1-800-345-2021
or 816-531-5575 | |
| Investors Using Advisors | 1-800-378-9878 | |
Business, Not-For-Profit, Employer-Sponsored
Retirement Plans | 1-800-345-3533 | |
Banks and Trust Companies, Broker-Dealers,
Financial Professionals, Insurance Companies | 1-800-345-6488 | |
| Telecommunications Relay Service for the Deaf | 711 | |
| | | |
| American Century Quantitative Equity Funds, Inc. | |
| | | |
Investment Advisor: American Century Investment Management, Inc. Kansas City, Missouri | |
| | | |
| This report and the statements it contains are submitted for the general information of our shareholders. The report is not authorized for distribution to prospective investors unless preceded or accompanied by an effective prospectus. | |
| | | |
©2018 American Century Proprietary Holdings, Inc. All rights reserved.
CL-ANN-92986 1808 | |
ITEM 2. CODE OF ETHICS.
| |
| (a) | The registrant has adopted a Code of Ethics for Senior Financial Officers that applies to the registrant’s principal executive officer, principal financial officer, principal accounting officer, and persons performing similar functions. |
| |
| (f) | The registrant’s Code of Ethics for Senior Financial Officers was filed as Exhibit 12 (a)(1) to American Century Asset Allocation Portfolios, Inc.’s Annual Certified Shareholder Report on Form N-CSR, File No. 811-21591, on September 29, 2005, and is incorporated herein by reference. |
ITEM 3. AUDIT COMMITTEE FINANCIAL EXPERT.
| |
| (a)(1) | The registrant's board has determined that the registrant has at least one audit committee financial expert serving on its audit committee. |
| |
| (a)(2) | Tanya S. Beder, Anne Casscells, Peter F. Pervere and Ronald J. Gilson are the registrant's designated audit committee financial experts. They are "independent" as defined in Item 3 of Form N-CSR. |
ITEM 4. PRINCIPAL ACCOUNTANT FEES AND SERVICES.
The aggregate fees billed for each of the last two fiscal years for professional services rendered by the principal accountant for the audit of the registrant’s annual financial statements or services that are normally provided by the accountant in connection with statutory and regulatory filings or engagements for those fiscal years were as follows:
FY 2017: $477,427
FY 2018: $412,559
The aggregate fees billed in each of the last two fiscal years for assurance and related services by the principal accountant that are reasonably related to the performance of the audit of the registrant’s financial statements and are not reported under paragraph (a) of this Item were as follows:
For services rendered to the registrant:
FY 2017:$0
FY 2018:$0
Fees required to be approved pursuant to paragraph (c)(7)(ii) of Rule 2-01 of Regulation S-X (relating to certain engagements for non-audit services with the registrant’s investment adviser and its affiliates):
FY 2017:$0
FY 2018:$0
(c)Tax Fees.
The aggregate fees billed in each of the last two fiscal years for professional services rendered by the principal accountant for tax compliance, tax advice, and tax planning were as follows:
For services rendered to the registrant:
FY 2017: $0
FY 2018: $0
Fees required to be approved pursuant to paragraph (c)(7)(ii) of Rule 2-01 of Regulation S-X (relating to certain engagements for non-audit services with the registrant’s investment adviser and its affiliates):
FY 2017: $0
FY 2018: $0
(d)All Other Fees.
The aggregate fees billed in each of the last two fiscal years for products and services provided by the principal accountant, other than the services reported in paragraphs (a) through (c) of this Item were as follows:
For services rendered to the registrant:
FY 2017:$0
FY 2018:$0
Fees required to be approved pursuant to paragraph (c)(7)(ii) of Rule 2-01 of Regulation S-X (relating to certain engagements for non-audit services with the registrant’s investment adviser and its affiliates):
FY 2017:$0
FY 2018:$0
(e)(1)In accordance with paragraph (c)(7)(i)(A) of Rule 2-01 of Regulation S-X, before the accountant is engaged by the registrant to render audit or non-audit services, the engagement is approved by the registrant’s audit committee. Pursuant to paragraph (c)(7)(ii) of Rule 2-01 of Regulation S-X, the registrant’s audit committee also pre-approves its accountant’s engagements for non-audit services with the registrant’s investment adviser, its parent company, and any entity controlled by, or under common control with the investment adviser that provides ongoing services to the registrant, if the engagement relates directly to the operations and financial reporting of the registrant.
| |
| (e)(2) | All services described in each of paragraphs (b) through (d) of this Item were pre-approved before the engagement by the registrant’s audit committee pursuant to paragraph (c)(7)(i)(A) of Rule 2-01 of Regulation S-X. Consequently, none of such services were required to be approved by the audit committee pursuant to paragraph (c)(7)(i)(C). |
| |
| (f) | The percentage of hours expended on the principal accountant’s engagement to audit the registrant’s financial statements for the most recent fiscal year that were attributed to work performed by persons other than the principal accountant’s full-time, permanent employees was less than 50%. |
| |
| (g) | The aggregate non-audit fees billed by the registrant’s accountant for services rendered to the registrant, and rendered to the registrant’s investment adviser (not including any sub-adviser whose role is primarily portfolio management and is subcontracted with or overseen by another investment adviser), and any entity controlling, controlled by, or under common control with the adviser that provides ongoing services to the registrant for each of the last two fiscal years of the registrant were as follows: |
FY 2017: $132,646
FY 2018: $182,303
| |
| (h) | The registrant’s investment adviser and accountant have notified the registrant’s audit committee of all non-audit services that were rendered by the registrant’s accountant to the registrant’s investment adviser, its parent company, and any entity controlled by, or under common control with the investment adviser that provides services to the registrant, which services were not required to be pre-approved pursuant to paragraph (c)(7)(ii) of Rule 2-01 of Regulation S-X. The notification provided to the registrant’s audit committee included sufficient details regarding such services to allow the registrant’s audit committee to consider the continuing independence of its principal accountant. |
ITEM 5. AUDIT COMMITTEE OF LISTED REGISTRANTS.
Not applicable.
ITEM 6. INVESTMENTS.
| |
| (a) | The schedule of investments is included as part of the report to stockholders filed under Item 1 of this Form. |
ITEM 7. DISCLOSURE OF PROXY VOTING POLICIES AND PROCEDURES FOR CLOSED-END MANAGEMENT INVESTMENT COMPANIES.
Not applicable.
ITEM 8. PORTFOLIO MANAGERS OF CLOSED-END MANAGEMENT INVESTMENT COMPANIES.
Not applicable.
ITEM 9. PURCHASES OF EQUITY SECURITIES BY CLOSED-END MANAGEMENT INVESTMENT COMPANY AND AFFILIATED PURCHASERS.
Not applicable.
ITEM 10. SUBMISSION OF MATTERS TO A VOTE OF SECURITY HOLDERS.
During the reporting period, there were no material changes to the procedures by which shareholders may recommend nominees to the registrant’s board.
ITEM 11. CONTROLS AND PROCEDURES.
| |
| (a) | The registrant's principal executive officer and principal financial officer have concluded that the registrant's disclosure controls and procedures (as defined in Rule 30a-3(c) under the Investment Company Act of 1940) are effective based on their evaluation of these controls and procedures as of a date within 90 days of the filing date of this report. |
| |
| (b) | There were no changes in the registrant's internal control over financial reporting (as defined in Rule 30a-3(d) under the Investment Company Act of 1940) that occurred during the period covered by this report that have materially affected, or are reasonably likely to materially affect, the registrant's internal control over financial reporting. |
ITEM 12. DISCLOSURE OF SECURITIES LENDING ACTIVITIES FOR CLOSED-END MANAGEMENT INVESTMENT COMPANIES.
Not applicable.
ITEM 13. EXHIBITS.
| |
| (a)(1) | Registrant’s Code of Ethics for Senior Financial Officers, which is the subject of the disclosure required by Item 2 of Form N-CSR, was filed as Exhibit 12(a)(1) to American Century Asset Allocation Portfolios, Inc.’s Certified Shareholder Report on Form N-CSR, File No. 811-21591, on September 29, 2005. |
| |
| (a)(2) | Separate certifications by the registrant’s principal executive officer and principal financial officer, pursuant to Section 302 of the Sarbanes-Oxley Act of 2002 and Rule 30a-2(a) under the Investment Company Act of 1940, are filed and attached hereto as EX-99.CERT. |
(b) A certification by the registrant’s chief executive officer and chief financial officer, pursuant to Section 906 of the Sarbanes-Oxley Act of 2002, is furnished and attached hereto as EX-99.906CERT.
SIGNATURES
Pursuant to the requirements of the Securities Exchange Act of 1934 and the Investment Company Act of 1940, the registrant has duly caused this report to be signed on its behalf by the undersigned, thereunto duly authorized.
|
| | | | |
| Registrant: | American Century Quantitative Equity Funds, Inc. |
| | | | |
| By: | /s/ Jonathan S. Thomas | |
| | Name: | Jonathan S. Thomas | |
| | Title: | President | |
| | | | |
| Date: | August 23, 2018 | |
Pursuant to the requirements of the Securities Exchange Act of 1934 and the Investment Company Act of 1940, this report has been signed below by the following persons on behalf of the registrant and in the capacities and on the dates indicated.
|
| | | |
| By: | /s/ Jonathan S. Thomas | |
| | Name: | Jonathan S. Thomas | |
| | Title: | President | |
| | | (principal executive officer) | |
| | | | |
| Date: | August 23, 2018 | |
|
| | | |
| By: | /s/ C. Jean Wade | |
| | Name: | C. Jean Wade | |
| | Title: | Vice President, Treasurer, and | |
| | | Chief Financial Officer | |
| | | (principal financial officer) | |
| | | | |
| Date: | August 23, 2018 | |