UNITED STATES
SECURITIES AND EXCHANGE COMMISSION
Washington, D.C. 20549
FORM N-CSR
CERTIFIED SHAREHOLDER REPORT OF REGISTERED
MANAGEMENT INVESTMENT COMPANIES
| Investment Company Act file number | 811-05447 | |||||
| AMERICAN CENTURY QUANTITATIVE EQUITY FUNDS, INC. | ||||||
| (Exact name of registrant as specified in charter) | ||||||
| 4500 MAIN STREET, KANSAS CITY, MISSOURI | 64111 | |||||
| (Address of principal executive offices) | (Zip Code) | |||||
CHARLES A. ETHERINGTON 4500 MAIN STREET, KANSAS CITY, MISSOURI 64111 | ||||||
| (Name and address of agent for service) | ||||||
| Registrant’s telephone number, including area code: | 816-531-5575 | |||||
| Date of fiscal year end: | 06-30 | |||||
| Date of reporting period: | 06-30-2016 | |||||
ITEM 1. REPORTS TO STOCKHOLDERS.
| ANNUAL REPORT |  |
| JUNE 30, 2016 | |
AC Alternatives® Equity Market Neutral Fund

3
4
| Table of Contents |
| President's Letter | 2 | |
| Performance | 3 | |
| Portfolio Commentary | ||
| Fund Characteristics | ||
| Shareholder Fee Example | ||
| Schedule of Investments | ||
| Statement of Assets and Liabilities | ||
| Statement of Operations | ||
| Statement of Changes in Net Assets | ||
| Notes to Financial Statements | ||
| Financial Highlights | ||
| Report of Independent Registered Public Accounting Firm | ||
| Management | ||
| Approval of Management Agreement | ||
| Proxy Voting Results | ||
| Additional Information | ||
Any opinions expressed in this report reflect those of the author as of the date of the report, and do not necessarily represent the opinions of American Century Investments® or any other person in the American Century Investments organization. Any such opinions are subject to change at any time based upon market or other conditions and American Century Investments disclaims any responsibility to update such opinions. These opinions may not be relied upon as investment advice and, because investment decisions made by American Century Investments funds are based on numerous factors, may not be relied upon as an indication of trading intent on behalf of any American Century Investments fund. Security examples are used for representational purposes only and are not intended as recommendations to purchase or sell securities. Performance information for comparative indices and securities is provided to American Century Investments by third party vendors. To the best of American Century Investments’ knowledge, such information is accurate at the time of printing.
| President’s Letter |
 Jonathan Thomas
Dear Investor:
Thank you for reviewing this annual report for the 12 months ended June 30, 2016. It provides investment performance and portfolio information for the reporting period, plus longer-term historical performance data.
Annual reports remain important vehicles for conveying information about fund returns, including market and economic factors that affected performance during the reporting period. For additional, updated investment and market insights, we encourage you to visit our website, americancentury.com.
Market Volatility Increased, But Not for the Reasons Anticipated
Going into this reporting period, investors anticipated increased market volatility and uncertainty as the Federal Reserve (the Fed) appeared poised to raise short-term interest rates toward more historically normal levels. This policy change was expected to affect investor sentiment, U.S. Treasury yield behavior, relative currency values, inflation expectations, and corporate costs and earnings.
This Fed-centric outlook didn’t fully account for global factors, which ultimately drove sentiment, volatility, and performance during the reporting period. During 2015, the primary catalyst was China, where slowing economic growth, currency devaluations, and massive monetary policy easing sent shock waves through the global markets. The Fed ended up delaying (until December 2015) its only small rate hike during the reporting period. Afterward, China-related events repeated in January and early February this year, further delaying Fed action.
Oil was another catalyst—its price collapses devalued entire market sectors and contributed to broad market volatility and negative sentiment. Later, as China and oil appeared to stabilize, Brexit occurred—the unexpected decision by United Kingdom voters to leave the European Union. This produced more shock waves, and altered central bank policies around the world. In this environment, relatively defensive assets performed best for the 12 months, including the stocks of gold-producing companies, utilities, real estate investment trusts (REITs), and long-maturity U.S. Treasury securities.
Looking ahead, we believe the markets face further uncertainty and volatility as they digest Brexit, the Italian bank crisis, China’s economic mysteries, and the U.S. presidential election. Negative interest rates in Europe and Japan represent part of the market’s response to the global macroeconomic climate. These negative rates are suppressing interest rates around the world while driving up the value of the U.S. dollar and U.S. bonds. In a broad sense, stocks also benefit from the central bank stimulus that is driving interest rates into negative territory, and from relative yield advantages as bond yields are pushed lower. It’s an unusual and challenging environment. We appreciate your continued trust in us.
Sincerely,

Jonathan Thomas
President and Chief Executive Officer
American Century Investments
2
| Performance |
| Total Returns as of June 30, 2016 | |||||
Average Annual Returns | |||||
| Ticker Symbol | 1 year | 5 years | 10 years | Inception Date | |
| Investor Class | ALHIX | -0.99% | 1.20% | 0.25% | 9/30/05 |
Barclays U.S. 1-3 Month Treasury Bill Index | — | 0.14% | 0.06% | 0.96% | — |
| Institutional Class | ALISX | -0.71% | 1.41% | 0.46% | 9/30/05 |
| A Class | ALIAX | 9/30/05 | |||
| No sales charge | -1.28% | 0.94% | 0.01% | ||
| With sales charge | -6.92% | -0.26% | -0.58% | ||
| C Class | ALICX | -1.86% | 0.20% | -0.74% | 9/30/05 |
| R Class | ALIRX | -1.41% | 0.70% | -0.24% | 9/30/05 |
Sales charges include initial sales charges and contingent deferred sales charges (CDSCs), as applicable. A Class shares have a 5.75% maximum initial sales charge and may be subject to a maximum CDSC of 1.00%. C Class shares redeemed within 12 months of purchase are subject to a maximum CDSC of 1.00%. The SEC requires that mutual funds provide performance information net of maximum sales charges in all cases where charges could be applied.
Data presented reflect past performance. Past performance is no guarantee of future results. Current performance may be higher or lower than the performance shown. Total returns for periods less than one year are not annualized. Investment return and principal value will fluctuate, and redemption value may be more or less than original cost. Data assumes reinvestment of dividends and capital gains, and none of the charts reflect the deduction of taxes that a shareholder would pay on fund distributions or the redemption of fund shares. To obtain performance data current to the most recent month end, please call 1-800-345-2021 or visit americancentury.com. For additional information about the fund, please consult the prospectus.
3
| Growth of $10,000 Over 10 Years |
| $10,000 investment made June 30, 2006 |
| Performance for other share classes will vary due to differences in fee structure. |
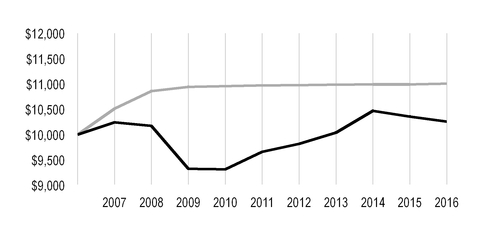
| Value on June 30, 2016 | |
| Investor Class — $10,253 | |
| Barclays U.S. 1-3 Month Treasury Bill Index — $11,005 | |
| Total Annual Fund Operating Expenses | ||||
| Investor Class | Institutional Class | A Class | C Class | R Class |
| 2.91% | 2.71% | 3.16% | 3.91% | 3.41% |
The total annual fund operating expenses shown is as stated in the fund’s prospectus current as of the date of this report. The prospectus may vary from the expense ratio shown elsewhere in this report because it is based on a different time period, includes acquired fund fees and expenses, and, if applicable, does not include fee waivers or expense reimbursements.
Data presented reflect past performance. Past performance is no guarantee of future results. Current performance may be higher or lower than the performance shown. Total returns for periods less than one year are not annualized. Investment return and principal value will fluctuate, and redemption value may be more or less than original cost. Data assumes reinvestment of dividends and capital gains, and none of the charts reflect the deduction of taxes that a shareholder would pay on fund distributions or the redemption of fund shares. To obtain performance data current to the most recent month end, please call 1-800-345-2021 or visit americancentury.com. For additional information about the fund, please consult the prospectus.
4
| Portfolio Commentary |
Portfolio Managers: Brian Garbe and Claudia Musat
Performance Summary
AC Alternatives Equity Market Neutral returned -0.99%* for the fiscal year ended June 30, 2016, compared with the 0.14% return of its benchmark, the Barclays U.S. 1-3 Month Treasury Bill Index.
AC Alternatives Equity Market Neutral is managed to produce capital appreciation independent of equity market conditions, so its benchmark is a cash-equivalent asset: the three-month U.S. Treasury bill. During the period under review, the fund declined and was unable to keep pace with its benchmark.
The portfolio’s stock selection process incorporates factors of valuation, quality, growth, and sentiment, while striving to minimize unintended risks along industries and other risk characteristics. Within the fund, quality and sentiment factors were supportive, while valuation characteristics detracted. Growth insights were relatively neutral.
Industrials Sector Led Detractors
The industrials sector was a leading detractor from returns, led by the decline of Avis Budget Group, one of the largest car and truck rental services to businesses and consumers around the globe. The company’s shares fell on lower-than-anticipated revenues and management’s lowered full-year guidance in its third-quarter financial results announcement. We exited our long position and initiated a short position in the stock.
Consumer staples was also an area of weakness. The fund’s investment in Avon Products detracted as the beauty products company’s stock price fell steeply due to lower-than-expected revenues and concerns about dwindling market share, and we exited our position. In financials, residential real estate services provider Realogy Holdings, with brands such as Coldwell Banker and Century 21, slumped as the company’s fourth-quarter revenue and profits fell short of expectations. Management cited new advance three-day closing disclosure regulations for the weakness, noting that transaction volume across the industry declined. We remain optimistic about the holding based on its strong valuation profile and above-average quality and growth measures.
Although the fund’s short positions (a trade made to benefit from a stock’s decline) in aggregate benefited results, several top individual detractors were short holdings, including Royal Gold, a gold and precious metals company, which rallied sharply together with advancing gold prices during the second half of the period. Similarly, shares of RSP Permian, an oil and natural gas company, climbed on the coattails of oil prices, which advanced to over $50 per barrel at the end of the reporting period. While remaining short in both securities hurt fund results, our positioning in those companies is driven by unattractive quality, growth, and valuation characteristics.
* All fund returns referenced in this commentary are for Investor Class shares. Performance for other share classes will vary due to differences in fee structure; when Investor Class performance exceeds that of the fund's benchmark, other share classes may not. See page 3 for returns for all share classes.
5
Health Care, Materials, and Energy Sectors Benefited Results
A number of short health care positions helped to bolster the sector’s contribution, including Brookdale Senior Living, an operator of senior living communities, whose stock price fell after reporting disappointing fourth-quarter results. Elsewhere, a short position in SunEdison was a key contributor after the solar energy company’s stock fell after a quarterly earnings miss early in the year. We exited the fund’s short position.
Short positions in the materials and energy sectors also aided the fund’s performance, particularly during the first half of the reporting period when the prices of commodities and oil fell, pressuring the share prices of companies in those sectors. In materials, a short position in Allegheny Technologies was beneficial as the specialty materials and components producer’s stock price declined amid weakening sales and overcapacity. Likewise, shorting natural gas processer Williams Companies helped results as its stock price declined together with the broad sector. We ultimately exited the short position.
Conversely, several long positions in those sectors aided results during the latter part of the fiscal year, as commodities and oil rallied. In the energy sector, Oneok, a company engaged in the gathering, processing, storage and transportation of natural gas, gained on favorable first-quarter results. The company revealed solid volume growth in natural gas gathered and processed, and natural gas liquids gathered and fractionated.
A Look Ahead
At the sector level, the fund’s leading net long positions are in the health care and consumer staples sectors. After the dramatic sell-off in 2015, health care names, particularly in the biotech space, are compelling based on valuation factors, and growth and quality metrics also are favorable. In consumer staples companies, we are finding opportunities in household goods manufacturers. The consumer discretionary and financials sectors, where the fund maintains net short positions, continue to face challenges, in our opinion. In consumer discretionary, growth scores are not favorable, particularly among specialty retailers. In fundamental terms, many of these traditional brick-and-mortar retailers face challenging business conditions and have poor growth and quality rankings. Our disciplined, objective, and systematic investment strategy is designed to take advantage of opportunities at the individual company level, in both the long and short portions of the portfolio. We believe this approach is the most powerful way to capitalize on market inefficiencies that lead to the mispricing of individual stocks.
6
| Fund Characteristics |
| JUNE 30, 2016 | |
| Top Ten Long Holdings | % of net assets |
| Oneok, Inc. | 0.75% |
| Huntington Ingalls Industries, Inc. | 0.73% |
| Nu Skin Enterprises, Inc., Class A | 0.73% |
| Lamar Advertising Co., Class A | 0.69% |
| Cabot Corp. | 0.68% |
| Medidata Solutions, Inc. | 0.67% |
| Moog, Inc., Class A | 0.66% |
| Owens Corning | 0.66% |
| Electronic Arts, Inc. | 0.65% |
| Berry Plastics Group, Inc. | 0.64% |
| Top Ten Short Holdings | % of net assets |
| Olin Corp. | (0.76)% |
| Royal Gold, Inc. | (0.73)% |
| Tribune Media Co. | (0.71)% |
| Dominion Resources, Inc. | (0.71)% |
| RSP Permian, Inc. | (0.70)% |
| Oshkosh Corp. | (0.70)% |
| Duke Realty Corp. | (0.70)% |
| Yahoo!, Inc. | (0.70)% |
| WhiteWave Foods Co. (The), Class A | (0.69)% |
| Assurant, Inc. | (0.68)% |
| Types of Investments in Portfolio | % of net assets |
| Common Stocks | 94.5% |
| Common Stocks Sold Short | (94.3)% |
| Temporary Cash Investments | 2.3% |
| Other Assets and Liabilities* | 97.5% |
*Amount relates primarily to deposits with broker for securities sold short at period end.
7
| Shareholder Fee Example |
Fund shareholders may incur two types of costs: (1) transaction costs, including sales charges (loads) on purchase payments and redemption/exchange fees; and (2) ongoing costs, including management fees; distribution and service (12b-1) fees; and other fund expenses. This example is intended to help you understand your ongoing costs (in dollars) of investing in your fund and to compare these costs with the ongoing cost of investing in other mutual funds.
The example is based on an investment of $1,000 made at the beginning of the period and held for the entire period from January 1, 2016 to June 30, 2016.
Actual Expenses
The table provides information about actual account values and actual expenses for each class. You may use the information, together with the amount you invested, to estimate the expenses that you paid over the period. First, identify the share class you own. Then simply divide your account value by $1,000 (for example, an $8,600 account value divided by $1,000 = 8.6), then multiply the result by the number under the heading “Expenses Paid During Period” to estimate the expenses you paid on your account during this period.
If you hold Investor Class shares of any American Century Investments fund, or Institutional Class shares of the American Century Diversified Bond Fund, in an American Century Investments account (i.e., not a financial intermediary or retirement plan account), American Century Investments may charge you a $12.50 semiannual account maintenance fee if the value of those shares is less than $10,000. We will redeem shares automatically in one of your accounts to pay the $12.50 fee. In determining your total eligible investment amount, we will include your investments in all personal accounts (including American Century Investments Brokerage accounts) registered under your Social Security number. Personal accounts include individual accounts, joint accounts, UGMA/UTMA accounts, personal trusts, Coverdell Education Savings Accounts and IRAs (including traditional, Roth, Rollover, SEP-, SARSEP- and SIMPLE-IRAs), and certain other retirement accounts. If you have only business, business retirement, employer-sponsored or American Century Investments Brokerage accounts, you are currently not subject to this fee. If you are subject to the Account Maintenance Fee, your account value could be reduced by the fee amount.
Hypothetical Example for Comparison Purposes
The table also provides information about hypothetical account values and hypothetical expenses based on the actual expense ratio of each class of your fund and an assumed rate of return of 5% per year before expenses, which is not the actual return of a fund’s share class. The hypothetical account values and expenses may not be used to estimate the actual ending account balance or expenses you paid for the period. You may use this information to compare the ongoing costs of investing in your fund and other funds. To do so, compare this 5% hypothetical example with the 5% hypothetical examples that appear in the shareholder reports of the other funds.
Please note that the expenses shown in the table are meant to highlight your ongoing costs only and do not reflect any transactional costs, such as sales charges (loads) or redemption/exchange fees. Therefore, the table is useful in comparing ongoing costs only, and will not help you determine the relative total costs of owning different funds. In addition, if these transactional costs were included, your costs would have been higher.
8
| Beginning Account Value 1/1/16 | Ending Account Value 6/30/16 | Expenses Paid During Period(1) 1/1/16 - 6/30/16 | Annualized Expense Ratio(1) | |
| Actual | ||||
| Investor Class | $1,000 | $982.20 | $14.29 | 2.90% |
| Institutional Class | $1,000 | $983.30 | $13.31 | 2.70% |
| A Class | $1,000 | $980.90 | $15.51 | 3.15% |
| C Class | $1,000 | $977.50 | $19.18 | 3.90% |
| R Class | $1,000 | $979.50 | $16.73 | 3.40% |
| Hypothetical | ||||
| Investor Class | $1,000 | $1,010.44 | $14.50 | 2.90% |
| Institutional Class | $1,000 | $1,011.44 | $13.50 | 2.70% |
| A Class | $1,000 | $1,009.20 | $15.74 | 3.15% |
| C Class | $1,000 | $1,005.47 | $19.45 | 3.90% |
| R Class | $1,000 | $1,007.96 | $16.97 | 3.40% |
| (1) | Expenses are equal to the class's annualized expense ratio listed in the table above, multiplied by the average account value over the period, multiplied by 182, the number of days in the most recent fiscal half-year, divided by 366, to reflect the one-half year period. |
9
| Schedule of Investments |
JUNE 30, 2016
| Shares | Value | |||
| COMMON STOCKS — 94.5% | ||||
| Aerospace and Defense — 3.0% | ||||
B/E Aerospace, Inc.(1) | 7,346 | $ | 339,202 | |
| Boeing Co. (The) | 1,272 | 165,195 | ||
BWX Technologies, Inc.(1) | 6,613 | 236,547 | ||
| Huntington Ingalls Industries, Inc. | 5,249 | 881,989 | ||
Moog, Inc., Class A(1)(2) | 14,898 | 803,300 | ||
Spirit AeroSystems Holdings, Inc., Class A(1)(2) | 13,828 | 594,604 | ||
Textron, Inc.(1) | 17,936 | 655,740 | ||
| 3,676,577 | ||||
| Air Freight and Logistics — 0.5% | ||||
Expeditors International of Washington, Inc.(1) | 13,134 | 644,091 | ||
| Airlines — 1.6% | ||||
Delta Air Lines, Inc.(1) | 13,524 | 492,679 | ||
Hawaiian Holdings, Inc.(2) | 9,370 | 355,685 | ||
JetBlue Airways Corp.(1)(2) | 36,055 | 597,071 | ||
United Continental Holdings, Inc.(1)(2) | 12,670 | 519,977 | ||
| 1,965,412 | ||||
| Auto Components — 1.3% | ||||
Cooper Tire & Rubber Co.(1) | 17,270 | 514,992 | ||
Goodyear Tire & Rubber Co. (The)(1) | 21,046 | 540,040 | ||
| Lear Corp. | 4,667 | 474,914 | ||
| 1,529,946 | ||||
| Banks — 1.3% | ||||
Citigroup, Inc.(1) | 13,014 | 551,663 | ||
PacWest Bancorp(1) | 13,105 | 521,317 | ||
TCF Financial Corp.(1) | 41,723 | 527,796 | ||
| 1,600,776 | ||||
| Beverages — 0.6% | ||||
PepsiCo, Inc.(1) | 6,765 | 716,684 | ||
| Biotechnology — 2.2% | ||||
| AbbVie, Inc. | 9,945 | 615,695 | ||
| Amgen, Inc. | 1,969 | 299,583 | ||
Biogen, Inc.(2) | 1,098 | 265,518 | ||
Celgene Corp.(2) | 2,173 | 214,323 | ||
| Gilead Sciences, Inc. | 2,787 | 232,492 | ||
Medivation, Inc.(1)(2) | 4,698 | 283,290 | ||
Myriad Genetics, Inc.(1)(2) | 8,734 | 267,260 | ||
United Therapeutics Corp.(1)(2) | 4,230 | 448,042 | ||
| 2,626,203 | ||||
| Building Products — 1.6% | ||||
Masonite International Corp.(2) | 5,583 | 369,260 | ||
Owens Corning(1) | 15,405 | 793,666 | ||
USG Corp.(1)(2) | 26,290 | 708,778 | ||
| 1,871,704 | ||||
| Capital Markets — 2.9% | ||||
Affiliated Managers Group, Inc.(2) | 3,720 | 523,665 | ||
10
| Shares | Value | |||
Artisan Partners Asset Management, Inc., Class A(1) | 21,084 | $ | 583,605 | |
| Eaton Vance Corp. | 17,280 | 610,675 | ||
Evercore Partners, Inc., Class A(1) | 12,036 | 531,871 | ||
Federated Investors, Inc., Class B(1) | 25,531 | 734,782 | ||
WisdomTree Investments, Inc.(1) | 56,381 | 551,970 | ||
| 3,536,568 | ||||
| Chemicals — 4.2% | ||||
| Air Products & Chemicals, Inc. | 4,908 | 697,132 | ||
Cabot Corp.(1) | 18,075 | 825,305 | ||
Dow Chemical Co. (The)(1) | 10,574 | 525,634 | ||
Eastman Chemical Co.(1) | 8,997 | 610,896 | ||
Minerals Technologies, Inc.(1) | 12,235 | 694,948 | ||
PolyOne Corp.(1) | 17,701 | 623,783 | ||
| PPG Industries, Inc. | 5,568 | 579,907 | ||
| W.R. Grace & Co. | 7,657 | 560,569 | ||
| 5,118,174 | ||||
| Commercial Services and Supplies — 1.7% | ||||
Deluxe Corp.(1) | 11,734 | 778,786 | ||
Herman Miller, Inc.(1) | 25,717 | 768,681 | ||
RR Donnelley & Sons Co.(1) | 28,573 | 483,455 | ||
| 2,030,922 | ||||
| Communications Equipment — 1.5% | ||||
Ciena Corp.(1)(2) | 35,892 | 672,975 | ||
F5 Networks, Inc.(2) | 1,988 | 226,314 | ||
Juniper Networks, Inc.(1) | 20,617 | 463,676 | ||
Polycom, Inc.(1)(2) | 44,576 | 501,480 | ||
| 1,864,445 | ||||
| Construction and Engineering — 1.3% | ||||
AECOM(1)(2) | 13,814 | 438,871 | ||
| Chicago Bridge & Iron Co. NV, New York Shares | 14,903 | 516,091 | ||
Quanta Services, Inc.(2) | 26,059 | 602,484 | ||
| 1,557,446 | ||||
| Consumer Finance — 1.1% | ||||
American Express Co.(1) | 7,618 | 462,870 | ||
Discover Financial Services(1) | 12,041 | 645,277 | ||
Synchrony Financial(1)(2) | 8,438 | 213,312 | ||
| 1,321,459 | ||||
| Containers and Packaging — 2.0% | ||||
Avery Dennison Corp.(1) | 7,202 | 538,349 | ||
Berry Plastics Group, Inc.(1)(2) | 20,094 | 780,652 | ||
Graphic Packaging Holding Co.(1) | 52,595 | 659,541 | ||
| Sealed Air Corp. | 10,106 | 464,573 | ||
| 2,443,115 | ||||
| Diversified Consumer Services — 0.8% | ||||
Houghton Mifflin Harcourt Co.(1)(2) | 21,146 | 330,512 | ||
ServiceMaster Global Holdings, Inc.(1)(2) | 16,392 | 652,402 | ||
| 982,914 | ||||
| Diversified Financial Services — 1.5% | ||||
Morningstar, Inc.(1) | 5,796 | 473,997 | ||
MSCI, Inc., Class A(1) | 8,837 | 681,509 | ||
11
| Shares | Value | |||
Nasdaq, Inc.(1) | 9,427 | $ | 609,644 | |
| 1,765,150 | ||||
| Diversified Telecommunication Services — 0.3% | ||||
| AT&T, Inc. | 3,041 | 131,402 | ||
Level 3 Communications, Inc.(2) | 3,555 | 183,047 | ||
| 314,449 | ||||
| Electric Utilities — 0.6% | ||||
FirstEnergy Corp.(1) | 18,067 | 630,719 | ||
NextEra Energy, Inc.(1) | 738 | 96,235 | ||
| 726,954 | ||||
| Electronic Equipment, Instruments and Components — 1.2% | ||||
| Belden, Inc. | 9,709 | 586,132 | ||
VeriFone Systems, Inc.(1)(2) | 20,090 | 372,469 | ||
Zebra Technologies Corp., Class A(2) | 10,742 | 538,174 | ||
| 1,496,775 | ||||
| Energy Equipment and Services — 1.8% | ||||
| Diamond Offshore Drilling, Inc. | 14,231 | 346,240 | ||
Dril-Quip, Inc.(1)(2) | 10,383 | 606,679 | ||
Ensco plc, Class A(1) | 64,706 | 628,295 | ||
Rowan Cos. plc(1) | 36,644 | 647,133 | ||
| 2,228,347 | ||||
| Food and Staples Retailing — 0.9% | ||||
SUPERVALU, Inc.(1)(2) | 84,498 | 398,831 | ||
Wal-Mart Stores, Inc.(1) | 9,473 | 691,718 | ||
| 1,090,549 | ||||
| Food Products — 3.3% | ||||
Cal-Maine Foods, Inc.(1) | 11,917 | 528,161 | ||
Dean Foods Co.(1) | 36,949 | 668,407 | ||
| Fresh Del Monte Produce, Inc. | 2,504 | 136,293 | ||
General Mills, Inc.(1) | 9,581 | 683,317 | ||
| Ingredion, Inc. | 5,041 | 652,356 | ||
Pilgrim's Pride Corp.(1) | 29,199 | 743,991 | ||
Seaboard Corp.(2) | 222 | 637,282 | ||
| 4,049,807 | ||||
| Gas Utilities — 1.8% | ||||
ONE Gas, Inc.(1) | 10,683 | 711,381 | ||
| Southwest Gas Corp. | 8,524 | 670,924 | ||
UGI Corp.(1) | 17,192 | 777,938 | ||
| 2,160,243 | ||||
| Health Care Equipment and Supplies — 2.2% | ||||
Abbott Laboratories(1) | 15,914 | 625,579 | ||
| C.R. Bard, Inc. | 3,275 | 770,149 | ||
Hologic, Inc.(1)(2) | 17,528 | 606,469 | ||
ResMed, Inc.(1) | 6,769 | 428,004 | ||
St. Jude Medical, Inc.(1) | 2,160 | 168,480 | ||
| 2,598,681 | ||||
| Health Care Providers and Services — 3.2% | ||||
Aetna, Inc.(1) | 5,913 | 722,155 | ||
| AmerisourceBergen Corp. | 7,828 | 620,917 | ||
Express Scripts Holding Co.(1)(2) | 9,124 | 691,599 | ||
| HealthSouth Corp. | 14,156 | 549,536 | ||
12
| Shares | Value | |||
Laboratory Corp. of America Holdings(2) | 4,753 | $ | 619,173 | |
Owens & Minor, Inc.(1) | 14,774 | 552,252 | ||
WellCare Health Plans, Inc.(2) | 795 | 85,288 | ||
| 3,840,920 | ||||
| Health Care Technology — 1.5% | ||||
Allscripts Healthcare Solutions, Inc.(1)(2) | 49,837 | 632,930 | ||
Medidata Solutions, Inc.(1)(2) | 17,256 | 808,789 | ||
Veeva Systems, Inc., Class A(1)(2) | 10,062 | 343,315 | ||
| 1,785,034 | ||||
| Hotels, Restaurants and Leisure — 4.0% | ||||
Bloomin' Brands, Inc.(1) | 38,370 | 685,672 | ||
Boyd Gaming Corp.(1)(2) | 27,839 | 512,238 | ||
Brinker International, Inc.(1) | 12,939 | 589,113 | ||
Carnival Corp.(1) | 14,010 | 619,242 | ||
| Churchill Downs, Inc. | 4,780 | 604,001 | ||
| Cracker Barrel Old Country Store, Inc. | 2,944 | 504,808 | ||
Darden Restaurants, Inc.(1) | 10,294 | 652,022 | ||
Diamond Resorts International, Inc.(1)(2) | 10,036 | 300,678 | ||
La Quinta Holdings, Inc.(1)(2) | 30,531 | 348,053 | ||
| 4,815,827 | ||||
| Household Durables — 0.8% | ||||
D.R. Horton, Inc.(1) | 17,169 | 540,480 | ||
Garmin Ltd.(1) | 7,440 | 315,605 | ||
| Whirlpool Corp. | 850 | 141,644 | ||
| 997,729 | ||||
| Household Products — 0.7% | ||||
Procter & Gamble Co. (The)(1) | 7,319 | 619,700 | ||
| Spectrum Brands Holdings, Inc. | 2,116 | 252,460 | ||
| 872,160 | ||||
| Independent Power and Renewable Electricity Producers — 0.5% | ||||
Ormat Technologies, Inc.(1) | 14,435 | 631,676 | ||
| Industrial Conglomerates — 0.9% | ||||
Carlisle Cos., Inc.(1) | 7,091 | 749,377 | ||
| Danaher Corp. | 3,543 | 357,843 | ||
| 1,107,220 | ||||
| Insurance — 2.5% | ||||
| Aflac, Inc. | 9,033 | 651,821 | ||
| Arthur J. Gallagher & Co. | 3,364 | 160,126 | ||
Aspen Insurance Holdings Ltd.(1) | 14,259 | 661,333 | ||
Genworth Financial, Inc., Class A(2) | 19,069 | 49,198 | ||
Hanover Insurance Group, Inc. (The)(1) | 7,916 | 669,852 | ||
| National General Holdings Corp. | 6,977 | 149,447 | ||
Prudential Financial, Inc.(1) | 9,468 | 675,447 | ||
| 3,017,224 | ||||
| Internet and Catalog Retail — 1.0% | ||||
Amazon.com, Inc.(2) | 816 | 583,946 | ||
Liberty Interactive Corp. QVC Group, Class A(1)(2) | 26,545 | 673,447 | ||
| 1,257,393 | ||||
| Internet Software and Services — 1.9% | ||||
Alphabet, Inc., Class A(2) | 820 | 576,894 | ||
Endurance International Group Holdings, Inc.(1)(2) | 36,218 | 325,600 | ||
13
| Shares | Value | |||
Facebook, Inc., Class A(2) | 5,117 | $ | 584,771 | |
GoDaddy, Inc., Class A(2) | 8,287 | 258,471 | ||
VeriSign, Inc.(1)(2) | 5,980 | 517,031 | ||
| 2,262,767 | ||||
| IT Services — 3.6% | ||||
Amdocs Ltd.(1) | 12,957 | 747,878 | ||
Convergys Corp.(1) | 12,215 | 305,375 | ||
CoreLogic, Inc.(2) | 5,727 | 220,375 | ||
| Global Payments, Inc. | 1,272 | 90,795 | ||
| Leidos Holdings, Inc. | 6,758 | 323,506 | ||
NeuStar, Inc., Class A(1)(2) | 28,917 | 679,839 | ||
PayPal Holdings, Inc.(1)(2) | 9,406 | 343,413 | ||
Syntel, Inc.(1)(2) | 13,563 | 613,861 | ||
Teradata Corp.(1)(2) | 22,198 | 556,504 | ||
Xerox Corp.(1) | 49,421 | 469,005 | ||
| 4,350,551 | ||||
| Leisure Products — 0.7% | ||||
Brunswick Corp.(1) | 12,862 | 582,906 | ||
| Mattel, Inc. | 9,689 | 303,169 | ||
| 886,075 | ||||
| Life Sciences Tools and Services — 0.7% | ||||
Bruker Corp.(1) | 24,831 | 564,657 | ||
INC Research Holdings, Inc., Class A(1)(2) | 6,471 | 246,739 | ||
| 811,396 | ||||
| Machinery — 3.1% | ||||
| Allison Transmission Holdings, Inc. | 5,289 | 149,308 | ||
| ITT, Inc. | 7,813 | 249,860 | ||
Kennametal, Inc.(1) | 33,543 | 741,636 | ||
PACCAR, Inc.(1) | 12,539 | 650,398 | ||
Stanley Black & Decker, Inc.(1) | 6,346 | 705,802 | ||
Timken Co. (The)(1) | 18,424 | 564,880 | ||
| Toro Co. (The) | 6,787 | 598,613 | ||
| Woodward, Inc. | 1,730 | 99,717 | ||
| 3,760,214 | ||||
| Media — 1.9% | ||||
AMC Networks, Inc., Class A(1)(2) | 9,427 | 569,579 | ||
Cinemark Holdings, Inc.(1) | 17,682 | 644,686 | ||
Regal Entertainment Group, Class A(1) | 28,562 | 629,506 | ||
Scripps Networks Interactive, Inc., Class A(1) | 1,826 | 113,705 | ||
Viacom, Inc., Class B(1) | 8,336 | 345,694 | ||
| 2,303,170 | ||||
| Metals and Mining — 2.7% | ||||
| Barrick Gold Corp. | 33,725 | 720,029 | ||
Carpenter Technology Corp.(1) | 22,144 | 729,202 | ||
Commercial Metals Co.(1) | 26,966 | 455,725 | ||
Kinross Gold Corp. New York Shares(2) | 38,529 | 188,407 | ||
| Reliance Steel & Aluminum Co. | 3,666 | 281,915 | ||
Steel Dynamics, Inc.(1) | 24,963 | 611,593 | ||
Worthington Industries, Inc.(1) | 7,792 | 329,602 | ||
| 3,316,473 | ||||
14
| Shares | Value | |||
| Multi-Utilities — 0.1% | ||||
| CenterPoint Energy, Inc. | 2,665 | $ | 63,960 | |
| Multiline Retail — 1.1% | ||||
Big Lots, Inc.(1) | 14,100 | 706,551 | ||
Target Corp.(1) | 8,617 | 601,639 | ||
| 1,308,190 | ||||
| Oil, Gas and Consumable Fuels — 2.5% | ||||
| Apache Corp. | 10,583 | 589,156 | ||
Oneok, Inc.(1) | 19,075 | 905,109 | ||
| PBF Energy, Inc., Class A | 10,499 | 249,666 | ||
Southwestern Energy Co.(1)(2) | 43,843 | 551,545 | ||
| Targa Resources Corp. | 2,179 | 91,823 | ||
World Fuel Services Corp.(1) | 13,705 | 650,850 | ||
| 3,038,149 | ||||
| Personal Products — 1.1% | ||||
Herbalife Ltd.(1)(2) | 7,536 | 441,082 | ||
Nu Skin Enterprises, Inc., Class A(1) | 19,041 | 879,504 | ||
| 1,320,586 | ||||
| Pharmaceuticals — 0.8% | ||||
Jazz Pharmaceuticals plc(2) | 1,954 | 276,120 | ||
Mallinckrodt plc(1)(2) | 8,266 | 502,408 | ||
Merck & Co., Inc.(1) | 4,068 | 234,357 | ||
| 1,012,885 | ||||
| Professional Services — 0.4% | ||||
TriNet Group, Inc.(1)(2) | 24,403 | 507,338 | ||
| Real Estate Investment Trusts (REITs) — 4.9% | ||||
| American Tower Corp. | 2,368 | 269,028 | ||
| CoreSite Realty Corp. | 1,136 | 100,752 | ||
| Corporate Office Properties Trust | 7,232 | 213,850 | ||
Equity Lifestyle Properties, Inc.(1) | 9,157 | 733,018 | ||
Gaming and Leisure Properties, Inc.(1) | 19,472 | 671,395 | ||
| Host Hotels & Resorts, Inc. | 6,806 | 110,325 | ||
Lamar Advertising Co., Class A(1) | 12,684 | 840,949 | ||
Liberty Property Trust(1) | 15,553 | 617,765 | ||
RLJ Lodging Trust(1) | 21,255 | 455,920 | ||
Ryman Hospitality Properties, Inc.(1) | 12,894 | 653,081 | ||
Sunstone Hotel Investors, Inc.(1) | 49,812 | 601,231 | ||
VEREIT, Inc.(1) | 8,673 | 87,944 | ||
| WP Carey, Inc. | 8,925 | 619,574 | ||
| 5,974,832 | ||||
| Real Estate Management and Development — 0.5% | ||||
Realogy Holdings Corp.(1)(2) | 20,883 | 606,025 | ||
| Road and Rail — 0.2% | ||||
| Landstar System, Inc. | 1,375 | 94,407 | ||
Swift Transportation Co.(2) | 7,746 | 119,366 | ||
| 213,773 | ||||
| Semiconductors and Semiconductor Equipment — 1.8% | ||||
NVIDIA Corp.(1) | 6,408 | 301,240 | ||
ON Semiconductor Corp.(1)(2) | 46,894 | 413,605 | ||
Qorvo, Inc.(2) | 4,826 | 266,685 | ||
| QUALCOMM, Inc. | 1,557 | 83,408 | ||
15
| Shares | Value | |||
Synaptics, Inc.(1)(2) | 7,413 | $ | 398,449 | |
Teradyne, Inc.(1) | 33,675 | 663,061 | ||
| 2,126,448 | ||||
| Software — 3.1% | ||||
Cadence Design Systems, Inc.(1)(2) | 22,731 | 552,363 | ||
Citrix Systems, Inc.(2) | 4,394 | 351,916 | ||
Electronic Arts, Inc.(1)(2) | 10,376 | 786,086 | ||
Mentor Graphics Corp.(1) | 13,855 | 294,557 | ||
MicroStrategy, Inc., Class A(2) | 2,121 | 371,218 | ||
Nuance Communications, Inc.(1)(2) | 19,908 | 311,162 | ||
Synopsys, Inc.(1)(2) | 10,953 | 592,338 | ||
VMware, Inc., Class A(1)(2) | 7,864 | 449,978 | ||
| 3,709,618 | ||||
| Specialty Retail — 3.5% | ||||
Abercrombie & Fitch Co., Class A(1) | 24,949 | 444,342 | ||
American Eagle Outfitters, Inc.(1) | 45,130 | 718,921 | ||
Best Buy Co., Inc.(1) | 20,473 | 626,474 | ||
Chico's FAS, Inc.(1) | 50,725 | 543,265 | ||
Foot Locker, Inc.(1) | 8,844 | 485,182 | ||
Michaels Cos., Inc. (The)(1)(2) | 25,504 | 725,334 | ||
O'Reilly Automotive, Inc.(2) | 315 | 85,396 | ||
| Williams-Sonoma, Inc. | 11,558 | 602,518 | ||
| 4,231,432 | ||||
| Technology Hardware, Storage and Peripherals — 0.3% | ||||
NetApp, Inc.(1) | 14,596 | 358,916 | ||
| Textiles, Apparel and Luxury Goods — 1.0% | ||||
| Carter's, Inc. | 5,816 | 619,230 | ||
PVH Corp.(1) | 6,159 | 580,362 | ||
| 1,199,592 | ||||
| Thrifts and Mortgage Finance — 0.6% | ||||
Essent Group Ltd.(1)(2) | 35,561 | 775,585 | ||
| Tobacco — 1.1% | ||||
Philip Morris International, Inc.(1) | 6,751 | 686,712 | ||
Vector Group Ltd.(1) | 26,872 | 602,470 | ||
| 1,289,182 | ||||
| Wireless Telecommunication Services — 0.6% | ||||
T-Mobile US, Inc.(1)(2) | 15,928 | 689,205 | ||
TOTAL COMMON STOCKS (Cost $111,742,545) | 114,358,936 | |||
| TEMPORARY CASH INVESTMENTS — 2.3% | ||||
| Repurchase Agreement, Fixed Income Clearing Corp., (collateralized by various U.S. Treasury obligations, 3.00%, 11/15/45, valued at $2,831,669), at 0.20%, dated 6/30/16, due 7/1/16 (Delivery value $2,774,015) | 2,774,000 | |||
| State Street Institutional Liquid Reserves Fund, Premier Class | 1,975 | 1,975 | ||
TOTAL TEMPORARY CASH INVESTMENTS (Cost $2,775,975) | 2,775,975 | |||
TOTAL INVESTMENT SECURITIES BEFORE SECURITIES SOLD SHORT — 96.8% (Cost $114,518,520) | 117,134,911 | |||
| COMMON STOCKS SOLD SHORT — (94.3)% | ||||
| Aerospace and Defense — (2.2)% | ||||
| Hexcel Corp. | (13,962) | (581,378) | ||
| KLX, Inc. | (18,044) | (559,364 | ) | |
16
| Shares | Value | |||
| Lockheed Martin Corp. | (454) | $ | (112,669 | ) |
| Raytheon Co. | (5,561) | (756,018 | ) | |
| TransDigm Group, Inc. | (2,313) | (609,915 | ) | |
| (2,619,344 | ) | |||
| Air Freight and Logistics — (0.4)% | ||||
| FedEx Corp. | (3,397) | (515,597 | ) | |
| Airlines — (0.9)% | ||||
| Allegiant Travel Co. | (2,882) | (436,623 | ) | |
| Spirit Airlines, Inc. | (15,485) | (694,812 | ) | |
| (1,131,435 | ) | |||
| Auto Components — (0.1)% | ||||
| Magna International, Inc. | (4,450) | (156,061 | ) | |
| Banks — (1.8)% | ||||
| Associated Banc-Corp | (21,093) | (361,745 | ) | |
| Cullen/Frost Bankers, Inc. | (3,376) | (215,152 | ) | |
| Texas Capital Bancshares, Inc. | (1,268) | (59,292 | ) | |
| UMB Financial Corp. | (11,333) | (603,029 | ) | |
| Webster Financial Corp. | (12,604) | (427,906 | ) | |
| Wintrust Financial Corp. | (9,000) | (459,000 | ) | |
| (2,126,124 | ) | |||
| Beverages — (1.9)% | ||||
| Brown-Forman Corp., Class B | (5,930) | (591,577 | ) | |
| Constellation Brands, Inc., Class A | (1,145) | (189,383 | ) | |
| Constellation Brands, Inc., Class B | (1,129) | (184,659 | ) | |
| Molson Coors Brewing Co., Class B | (6,531) | (660,480 | ) | |
| Monster Beverage Corp. | (4,229) | (679,643 | ) | |
| (2,305,742 | ) | |||
| Biotechnology — (1.8)% | ||||
| Alnylam Pharmaceuticals, Inc. | (4,262) | (236,498 | ) | |
| Bluebird Bio, Inc. | (6,607) | (286,017 | ) | |
| Ionis Pharmaceuticals, Inc. | (5,295) | (123,321 | ) | |
| Neurocrine Biosciences, Inc. | (6,061) | (275,472 | ) | |
| Novavax, Inc. | (35,888) | (260,906 | ) | |
| Portola Pharmaceuticals, Inc. | (11,068) | (261,205 | ) | |
| Puma Biotechnology, Inc. | (6,528) | (194,469 | ) | |
| Radius Health, Inc. | (8,019) | (294,698 | ) | |
| Ultragenyx Pharmaceutical, Inc. | (4,260) | (208,357 | ) | |
| (2,140,943 | ) | |||
| Capital Markets — (3.0)% | ||||
| BGC Partners, Inc., Class A | (19,056) | (165,978 | ) | |
| BlackRock, Inc. | (772) | (264,433 | ) | |
| Charles Schwab Corp. (The) | (24,570) | (621,867 | ) | |
| Goldman Sachs Group, Inc. (The) | (4,061) | (603,383 | ) | |
| Invesco Ltd. | (18,423) | (470,523 | ) | |
| Morgan Stanley | (13,895) | (360,992 | ) | |
| Northern Trust Corp. | (8,614) | (570,764 | ) | |
| Stifel Financial Corp. | (17,105) | (537,952 | ) | |
| (3,595,892 | ) | |||
| Chemicals — (3.2)% | ||||
| Albemarle Corp. | (4,746) | (376,405 | ) | |
| Axalta Coating Systems Ltd. | (7,086) | (187,991 | ) | |
17
| Shares | Value | |||
| Balchem Corp. | (10,118) | $ | (603,539 | ) |
| CF Industries Holdings, Inc. | (21,147) | (509,643) | ||
| FMC Corp. | (12,680) | (587,211) | ||
| NewMarket Corp. | (149) | (61,742) | ||
| Olin Corp. | (37,174) | (923,402) | ||
| Potash Corp. of Saskatchewan, Inc. | (36,011) | (584,819) | ||
| (3,834,752) | ||||
| Commercial Services and Supplies — (2.6)% | ||||
| Copart, Inc. | (13,745) | (673,643) | ||
| Covanta Holding Corp. | (36,045) | (592,940) | ||
| KAR Auction Services, Inc. | (16,193) | (675,896) | ||
| Stericycle, Inc. | (6,100) | (635,132) | ||
| Waste Connections, Inc. | (8,303) | (598,231) | ||
| (3,175,842) | ||||
| Communications Equipment — (0.6)% | ||||
| EchoStar Corp., Class A | (17,491) | (694,393) | ||
| Construction and Engineering — (0.6)% | ||||
| Dycom Industries, Inc. | (7,863) | (705,783) | ||
| Consumer Finance — (1.8)% | ||||
| Capital One Financial Corp. | (6,429) | (408,306) | ||
| Navient Corp. | (46,238) | (552,544) | ||
| Santander Consumer USA Holdings, Inc. | (55,959) | (578,057) | ||
| SLM Corp. | (95,619) | (590,925) | ||
| (2,129,832) | ||||
| Containers and Packaging — (1.5)% | ||||
| AptarGroup, Inc. | (7,787) | (616,185) | ||
| Ball Corp. | (8,733) | (631,309) | ||
| Silgan Holdings, Inc. | (12,091) | (622,203) | ||
| (1,869,697) | ||||
| Distributors — (0.5)% | ||||
| LKQ Corp. | (18,392) | (583,026) | ||
| Diversified Financial Services — (0.6)% | ||||
| Leucadia National Corp. | (40,243) | (697,411) | ||
| Diversified Telecommunication Services — (1.7)% | ||||
| Frontier Communications Corp. | (113,803) | (562,187) | ||
| SBA Communications Corp., Class A | (7,022) | (757,954) | ||
| Zayo Group Holdings, Inc. | (27,503) | (768,159) | ||
| (2,088,300) | ||||
| Electric Utilities — (1.3)% | ||||
| Edison International | (9,496) | (737,554) | ||
| Pinnacle West Capital Corp. | (2,324) | (188,384) | ||
| PNM Resources, Inc. | (19,369) | (686,437) | ||
| (1,612,375) | ||||
| Electrical Equipment — (0.5)% | ||||
| Hubbell, Inc. | (5,795) | (611,199) | ||
| Electronic Equipment, Instruments and Components — (2.7)% | ||||
| Amphenol Corp., Class A | (14,119) | (809,442) | ||
| Anixter International, Inc. | (9,451) | (503,549) | ||
| CDW Corp. | (14,912) | (597,673) | ||
| Corning, Inc. | (30,191) | (618,312) | ||
| Jabil Circuit, Inc. | (24,973) | (461,251 | ) | |
18
| Shares | Value | |||
| TE Connectivity Ltd. | (5,043) | $ | (288,006 | ) |
| (3,278,233) | ||||
| Energy Equipment and Services — (0.8)% | ||||
| Bristow Group, Inc. | (12,447) | (142,020) | ||
| Halliburton Co. | (5,820) | (263,588) | ||
| Oil States International, Inc. | (16,457) | (541,106) | ||
| (946,714) | ||||
| Food and Staples Retailing — (1.0)% | ||||
| Costco Wholesale Corp. | (4,069) | (638,996) | ||
| Whole Foods Market, Inc. | (16,183) | (518,179) | ||
| (1,157,175) | ||||
| Food Products — (2.0)% | ||||
| Archer-Daniels-Midland Co. | (14,251) | (611,226) | ||
| J&J Snack Foods Corp. | (5,768) | (687,949) | ||
| JM Smucker Co. (The) | (693) | (105,620) | ||
| Pinnacle Foods, Inc. | (4,670) | (216,174) | ||
| WhiteWave Foods Co. (The), Class A | (17,891) | (839,804) | ||
| (2,460,773) | ||||
| Gas Utilities — (1.0)% | ||||
| Atmos Energy Corp. | (6,009) | (488,652) | ||
| Spire, Inc. | (2,476) | (175,400) | ||
| WGL Holdings, Inc. | (8,496) | (601,432) | ||
| (1,265,484) | ||||
| Health Care Equipment and Supplies — (1.0)% | ||||
| STERIS plc | (9,057) | (622,669) | ||
| Stryker Corp. | (4,758) | (570,151) | ||
| (1,192,820) | ||||
| Health Care Providers and Services — (4.5)% | ||||
| Acadia Healthcare Co., Inc. | (11,871) | (657,653) | ||
| Brookdale Senior Living, Inc. | (37,595) | (580,467) | ||
| Centene Corp. | (8,964) | (639,761) | ||
| Chemed Corp. | (4,617) | (629,343) | ||
| Community Health Systems, Inc. | (12,528) | (150,962) | ||
| Envision Healthcare Holdings, Inc. | (14,179) | (359,721) | ||
| Henry Schein, Inc. | (3,490) | (617,032) | ||
| Patterson Cos., Inc. | (14,041) | (672,424) | ||
| Premier, Inc., Class A | (18,864) | (616,853) | ||
| Team Health Holdings, Inc. | (14,076) | (572,471) | ||
| (5,496,687) | ||||
| Hotels, Restaurants and Leisure — (4.2)% | ||||
| Chipotle Mexican Grill, Inc. | (1,539) | (619,847) | ||
| Hyatt Hotels Corp., Class A | (10,677) | (524,668) | ||
| Las Vegas Sands Corp. | (11,186) | (486,479) | ||
| MGM Resorts International | (36,355) | (822,714) | ||
| Panera Bread Co., Class A | (3,598) | (762,560) | ||
| Texas Roadhouse, Inc. | (16,095) | (733,932) | ||
| Wendy's Co. (The) | (64,310) | (618,662) | ||
| Wynn Resorts Ltd. | (5,800) | (525,712) | ||
| (5,094,574) | ||||
19
| Shares | Value | |||
| Household Durables — (2.3)% | ||||
| CalAtlantic Group, Inc. | (20,940) | $ | (768,708 | ) |
| Lennar Corp., Class A | (10,782) | (497,050) | ||
| M.D.C. Holdings, Inc. | (15,377) | (374,276) | ||
| Newell Brands, Inc. | (9,701) | (471,178) | ||
| PulteGroup, Inc. | (37,627) | (733,350) | ||
| (2,844,562) | ||||
| Insurance — (4.0)% | ||||
| Allied World Assurance Co. Holdings AG | (15,361) | (539,786) | ||
| American International Group, Inc. | (7,072) | (374,038) | ||
| Assurant, Inc. | (9,595) | (828,144) | ||
| Assured Guaranty Ltd. | (23,310) | (591,375) | ||
| Enstar Group Ltd. | (3,685) | (596,933) | ||
| Loews Corp. | (9,293) | (381,849) | ||
| MBIA, Inc. | (85,192) | (581,861) | ||
| ProAssurance Corp. | (10,791) | (577,858) | ||
| RLI Corp. | (2,357) | (162,115) | ||
| Willis Towers Watson plc | (1,736) | (215,802) | ||
| (4,849,761) | ||||
| Internet and Catalog Retail — (0.5)% | ||||
| Expedia, Inc. | (5,877) | (624,725) | ||
| Internet Software and Services — (0.7)% | ||||
| Yahoo!, Inc. | (22,448) | (843,147) | ||
| IT Services — (5.0)% | ||||
| Automatic Data Processing, Inc. | (2,596) | (238,495) | ||
| DST Systems, Inc. | (5,896) | (686,471) | ||
| EPAM Systems, Inc. | (8,569) | (551,072) | ||
| Fidelity National Information Services, Inc. | (10,393) | (765,756) | ||
| Fiserv, Inc. | (6,639) | (721,859) | ||
| FleetCor Technologies, Inc. | (432) | (61,832) | ||
| Gartner, Inc. | (7,438) | (724,536) | ||
| MasterCard, Inc., Class A | (7,002) | (616,596) | ||
| MAXIMUS, Inc. | (12,967) | (717,983) | ||
| Science Applications International Corp. | (7,914) | (461,782) | ||
| Visa, Inc., A Shares | (7,684) | (569,922) | ||
| (6,116,304) | ||||
| Machinery — (1.9)% | ||||
| Caterpillar, Inc. | (2,162) | (163,901) | ||
| Donaldson Co., Inc. | (21,221) | (729,154) | ||
| Flowserve Corp. | (4,328) | (195,496) | ||
| IDEX Corp. | (3,902) | (320,354) | ||
| Oshkosh Corp. | (17,804) | (849,429) | ||
| (2,258,334) | ||||
| Marine — (0.6)% | ||||
| Kirby Corp. | (12,239) | (763,591) | ||
| Media — (2.7)% | ||||
| Charter Communications, Inc., Class A | (2,030) | (464,139) | ||
| IMAX Corp. | (17,054) | (502,752) | ||
| Lions Gate Entertainment Corp. | (31,471) | (636,658) | ||
| Live Nation Entertainment, Inc. | (15,234) | (357,999) | ||
| Loral Space & Communications, Inc. | (11,865) | (418,479) | ||
20
| Shares | Value | |||
| Tribune Media Co. | (22,004) | $ | (862,117 | ) |
| (3,242,144) | ||||
| Metals and Mining — (1.8)% | ||||
| Allegheny Technologies, Inc. | (40,929) | (521,845) | ||
| Compass Minerals International, Inc. | (8,721) | (647,011) | ||
| Royal Gold, Inc. | (12,324) | (887,574) | ||
| United States Steel Corp. | (5,737) | (96,726) | ||
| (2,153,156) | ||||
| Multi-Utilities — (1.6)% | ||||
| Dominion Resources, Inc. | (10,971) | (854,970) | ||
| DTE Energy Co. | (2,148) | (212,910) | ||
| Public Service Enterprise Group, Inc. | (2,000) | (93,220) | ||
| SCANA Corp. | (5,843) | (442,081) | ||
| Sempra Energy | (3,048) | (347,533) | ||
| (1,950,714) | ||||
| Multiline Retail — (1.1)% | ||||
| Dollar Tree, Inc. | (8,679) | (817,909) | ||
| Macy's, Inc. | (14,765) | (496,252) | ||
| (1,314,161) | ||||
| Oil, Gas and Consumable Fuels — (4.0)% | ||||
| Cabot Oil & Gas Corp. | (7,645) | (196,782) | ||
| Concho Resources, Inc. | (4,194) | (500,218) | ||
| Gulfport Energy Corp. | (9,904) | (309,599) | ||
| Kosmos Energy Ltd. | (100,964) | (550,254) | ||
| Marathon Petroleum Corp. | (5,612) | (213,032) | ||
| Occidental Petroleum Corp. | (5,681) | (429,256) | ||
| Phillips 66 | (4,131) | (327,754) | ||
| Pioneer Natural Resources Co. | (2,165) | (327,370) | ||
| RSP Permian, Inc. | (24,397) | (851,211) | ||
| SemGroup Corp., Class A | (19,300) | (628,408) | ||
| Spectra Energy Corp. | (13,465) | (493,223) | ||
| (4,827,107) | ||||
| Paper and Forest Products — (1.1)% | ||||
| KapStone Paper and Packaging Corp. | (44,367) | (577,214) | ||
| Louisiana-Pacific Corp. | (43,405) | (753,077) | ||
| (1,330,291) | ||||
| Personal Products — (0.6)% | ||||
| Edgewell Personal Care Co. | (8,112) | (684,734) | ||
| Pharmaceuticals — (1.3)% | ||||
| Intra-Cellular Therapies, Inc. | (7,620) | (295,808) | ||
| Medicines Co. (The) | (20,374) | (685,178) | ||
| Nektar Therapeutics | (19,956) | (283,974) | ||
| Pacira Pharmaceuticals, Inc. | (8,742) | (294,868) | ||
| (1,559,828) | ||||
| Professional Services — (1.0)% | ||||
| Equifax, Inc. | (4,897) | (628,775) | ||
| IHS, Inc., Class A | (4,771) | (551,575) | ||
| (1,180,350) | ||||
| Real Estate Investment Trusts (REITs) — (3.6)% | ||||
| Alexandria Real Estate Equities, Inc. | (1,584) | (163,976) | ||
| Duke Realty Corp. | (31,752) | (846,508) | ||
21
| Shares | Value | |||
| Forest City Realty Trust, Inc. | (29,853) | $ | (666,020 | ) |
| Highwoods Properties, Inc. | (10,536) | (556,301) | ||
| Hudson Pacific Properties, Inc. | (13,389) | (390,691) | ||
| National Retail Properties, Inc. | (3,627) | (187,589) | ||
| Paramount Group, Inc. | (41,011) | (653,715) | ||
| Potlatch Corp. | (21,423) | (730,524) | ||
| SL Green Realty Corp. | (2,021) | (215,176) | ||
| (4,410,500) | ||||
| Real Estate Management and Development — (1.1)% | ||||
| Howard Hughes Corp. (The) | (7,169) | (819,560) | ||
| Kennedy-Wilson Holdings, Inc. | (29,783) | (564,686) | ||
| (1,384,246) | ||||
| Road and Rail — (1.6)% | ||||
| Avis Budget Group, Inc. | (4,825) | (155,510) | ||
| Genesee & Wyoming, Inc., Class A | (9,685) | (570,931) | ||
| JB Hunt Transport Services, Inc. | (959) | (77,612) | ||
| Knight Transportation, Inc. | (22,944) | (609,851) | ||
| Union Pacific Corp. | (6,699) | (584,488) | ||
| (1,998,392) | ||||
| Semiconductors and Semiconductor Equipment — (1.4)% | ||||
| Cypress Semiconductor Corp. | (64,384) | (679,251) | ||
| MACOM Technology Solutions Holdings, Inc. | (16,347) | (539,124) | ||
| Micron Technology, Inc. | (34,526) | (475,078) | ||
| (1,693,453) | ||||
| Software — (1.6)% | ||||
| CDK Global, Inc. | (14,361) | (796,892) | ||
| Proofpoint, Inc. | (4,030) | (254,253) | ||
| SS&C Technologies Holdings, Inc. | (21,978) | (617,142) | ||
| Ultimate Software Group, Inc. (The) | (1,488) | (312,911) | ||
| (1,981,198) | ||||
| Specialty Retail — (3.9)% | ||||
| AutoNation, Inc. | (5,007) | (235,229) | ||
| CarMax, Inc. | (13,617) | (667,641) | ||
| CST Brands, Inc. | (17,869) | (769,796) | ||
| DSW, Inc., Class A | (25,511) | (540,323) | ||
| Guess?, Inc. | (38,442) | (578,552) | ||
| Home Depot, Inc. (The) | (5,288) | (675,225) | ||
| Lithia Motors, Inc., Class A | (1,059) | (75,263) | ||
| Murphy USA, Inc. | (1,685) | (124,960) | ||
| Restoration Hardware Holdings, Inc. | (11,848) | (339,801) | ||
| Tractor Supply Co. | (7,391) | (673,911) | ||
| (4,680,701) | ||||
| Textiles, Apparel and Luxury Goods — (2.2)% | ||||
| Columbia Sportswear Co. | (3,062) | (176,187) | ||
| G-III Apparel Group Ltd. | (15,347) | (701,665) | ||
| Hanesbrands, Inc. | (25,054) | (629,607) | ||
| lululemon athletica, Inc. | (5,175) | (382,225) | ||
| Under Armour, Inc., Class A | (8,321) | (333,922) | ||
| VF Corp. | (7,281) | (447,709) | ||
| (2,671,315) | ||||
22
| Shares | Value | |||
| Thrifts and Mortgage Finance — (1.0)% | ||||
| New York Community Bancorp, Inc. | (38,942) | $ | (583,741 | ) |
| TFS Financial Corp. | (33,847) | (582,845) | ||
| (1,166,586) | ||||
| Tobacco — (0.6)% | ||||
| Reynolds American, Inc. | (12,670) | (683,293) | ||
| Trading Companies and Distributors — (0.9)% | ||||
| Watsco, Inc. | (3,187) | (448,379) | ||
| WW Grainger, Inc. | (2,920) | (663,570) | ||
| (1,111,949) | ||||
| Transportation Infrastructure — (0.7)% | ||||
| Macquarie Infrastructure Corp. | (11,128) | (824,028) | ||
| Water Utilities — (0.6)% | ||||
| Aqua America, Inc. | (19,334) | (689,450) | ||
| Wireless Telecommunication Services — (0.7)% | ||||
| Telephone & Data Systems, Inc. | (20,773) | (616,127) | ||
| United States Cellular Corp. | (5,132) | (201,534) | ||
| (817,661) | ||||
TOTAL COMMON STOCKS SOLD SHORT (Proceeds $115,193,932) | (114,141,889) | |||
OTHER ASSETS AND LIABILITIES(3) — 97.5% | 118,071,702 | |||
| TOTAL NET ASSETS — 100.0% | $ | 121,064,724 | ||
| NOTES TO SCHEDULE OF INVESTMENTS | ||
| (1) | Security, or a portion thereof, has been pledged at the custodian bank or with a broker for collateral requirements on securities sold short. At the period end, the aggregate value of securities pledged was $65,780,873. |
| (2) | Non-income producing. |
| (3) | Amount relates primarily to deposits with broker for securities sold short at period end. |
See Notes to Financial Statements.
23
| Statement of Assets and Liabilities |
| JUNE 30, 2016 | |||
| Assets | |||
| Investment securities, at value (cost of $114,518,520) | $ | 117,134,911 | |
| Cash | 1,326 | ||
| Deposits with broker for securities sold short | 118,314,964 | ||
| Receivable for capital shares sold | 191,033 | ||
| Dividends and interest receivable | 112,994 | ||
| 235,755,228 | |||
| Liabilities | |||
| Securities sold short, at value (proceeds of $115,193,932) | 114,141,889 | ||
| Payable for capital shares redeemed | 289,348 | ||
| Accrued management fees | 133,416 | ||
| Distribution and service fees payable | 9,776 | ||
| Dividend expense payable on securities sold short | 105,387 | ||
| Accrued other expenses | 10,688 | ||
| 114,690,504 | |||
| Net Assets | $ | 121,064,724 | |
| Net Assets Consist of: | |||
| Capital (par value and paid-in surplus) | $ | 124,372,841 | |
| Accumulated net investment loss | (687,915 | ) | |
| Accumulated net realized loss | (6,288,636 | ) | |
| Net unrealized appreciation | 3,668,434 | ||
| $ | 121,064,724 | ||
| Net Assets | Shares Outstanding | Net Asset Value Per Share | ||||
| Investor Class, $0.01 Par Value | $84,898,900 | 7,712,111 | $11.01 | |||
| Institutional Class, $0.01 Par Value | $14,129,012 | 1,259,452 | $11.22 | |||
| A Class, $0.01 Par Value | $11,112,644 | 1,032,312 | $10.76* | |||
| C Class, $0.01 Par Value | $7,182,054 | 717,714 | $10.01 | |||
| R Class, $0.01 Par Value | $3,742,114 | 356,096 | $10.51 | |||
See Notes to Financial Statements.
24
| Statement of Operations |
| YEAR ENDED JUNE 30, 2016 | |||
| Investment Income (Loss) | |||
| Income: | |||
| Dividends (net of foreign taxes withheld of $599) | $ | 1,697,636 | |
| Interest | 5,709 | ||
| 1,703,345 | |||
| Expenses: | |||
| Dividend expense on securities sold short | 1,435,798 | ||
| Broker fees and charges on securities sold short | 110,811 | ||
| Management fees | 1,374,017 | ||
| Distribution and service fees: | |||
| A Class | 36,808 | ||
| C Class | 70,985 | ||
| R Class | 13,826 | ||
| Directors' fees and expenses | 5,870 | ||
| Other expenses | 11,065 | ||
| 3,059,180 | |||
| Net investment income (loss) | (1,355,835 | ) | |
| Realized and Unrealized Gain (Loss) | |||
| Net realized gain (loss) on: | |||
| Investment transactions | (2,713,786 | ) | |
| Securities sold short transactions | (349,191 | ) | |
| Foreign currency transactions | 16 | ||
| (3,062,961 | ) | ||
| Change in net unrealized appreciation (depreciation) on: | |||
| Investments | (1,321,934 | ) | |
| Securities sold short | 3,902,150 | ||
| 2,580,216 | |||
| Net realized and unrealized gain (loss) | (482,745 | ) | |
| Net Increase (Decrease) in Net Assets Resulting from Operations | $ | (1,838,580 | ) |
See Notes to Financial Statements.
25
| Statement of Changes in Net Assets |
| YEARS ENDED JUNE 30, 2016 AND JUNE 30, 2015 | ||||||
| Increase (Decrease) in Net Assets | June 30, 2016 | June 30, 2015 | ||||
| Operations | ||||||
| Net investment income (loss) | $ | (1,355,835 | ) | $ | (1,664,733 | ) |
| Net realized gain (loss) | (3,062,961 | ) | 5,308,610 | |||
| Change in net unrealized appreciation (depreciation) | 2,580,216 | (4,872,509 | ) | |||
| Net increase (decrease) in net assets resulting from operations | (1,838,580 | ) | (1,228,632 | ) | ||
| Capital Share Transactions | ||||||
| Net increase (decrease) in net assets from capital share transactions (Note 5) | 29,402,657 | (11,523,563 | ) | |||
| Net increase (decrease) in net assets | 27,564,077 | (12,752,195 | ) | |||
| Net Assets | ||||||
| Beginning of period | 93,500,647 | 106,252,842 | ||||
| End of period | $ | 121,064,724 | $ | 93,500,647 | ||
| Accumulated net investment loss | $ | (687,915 | ) | $ | (1,453,092 | ) |
See Notes to Financial Statements.
26
| Notes to Financial Statements |
JUNE 30, 2016
1. Organization
American Century Quantitative Equity Funds, Inc. (the corporation) is registered under the Investment Company Act of 1940, as amended (the 1940 Act), as an open-end management investment company and is organized as a Maryland corporation. AC Alternatives Equity Market Neutral Fund (the fund) is one fund in a series issued by the corporation. The fund’s investment objective is to seek capital appreciation independent of equity market conditions.
The fund offers the Investor Class, the Institutional Class, the A Class, the C Class and the R Class. The A Class may incur an initial sales charge. The A Class and C Class may be subject to a contingent deferred sales charge. The share classes differ principally in their respective sales charges and distribution and shareholder servicing expenses and arrangements. The Institutional Class is made available to institutional shareholders or through financial intermediaries whose clients do not require the same level of shareholder and administrative services as shareholders of other classes. As a result, the Institutional Class is charged a lower unified management fee.
2. Significant Accounting Policies
The following is a summary of significant accounting policies consistently followed by the fund in preparation of its financial statements. The fund is an investment company and follows accounting and reporting guidance in accordance with accounting principles generally accepted in the United States of America. This may require management to make certain estimates and assumptions at the date of the financial statements. Actual results could differ from these estimates. Management evaluated the impact of events or transactions occurring through the date the financial statements were issued that would merit recognition or disclosure.
Investment Valuations — The fund determines the fair value of its investments and computes its net asset value per share at the close of regular trading (usually 4 p.m. Eastern time) on the New York Stock Exchange (NYSE) on each day the NYSE is open. The Board of Directors has adopted valuation policies and procedures to guide the investment advisor in the fund’s investment valuation process and to provide methodologies for the oversight of the fund’s pricing function.
Equity securities that are listed or traded on a domestic securities exchange are valued at the last reported sales price or at the official closing price as provided by the exchange. Equity securities traded on foreign securities exchanges are generally valued at the closing price of such securities on the exchange where primarily traded or at the close of the NYSE, if that is earlier. If no last sales price is reported, or if local convention or regulation so provides, the mean of the latest bid and asked prices may be used. Securities traded over-the-counter are valued at the mean of the latest bid and asked prices, the last sales price, or the official closing price. Equity securities initially expressed in local currencies are translated into U.S. dollars at the mean of the appropriate currency exchange rate at the close of the NYSE as provided by an independent pricing service.
Open-end management investment companies are valued at the reported net asset value per share. Repurchase agreements are valued at cost, which approximates fair value.
If the fund determines that the market price for an investment is not readily available or the valuation methods mentioned above do not reflect an investment’s fair value, such investment is valued as determined in good faith by the Board of Directors or its delegate, in accordance with policies and procedures adopted by the Board of Directors. In its determination of fair value, the fund may review several factors including, but not limited to, market information regarding the specific investment or comparable investments and correlation with other investment types, futures indices or general market indicators. Circumstances that may cause the fund to use these procedures to value an investment include, but are not limited to: an investment has been declared in default or is distressed; trading in a security has been suspended during the trading day or a security is not actively trading on its principal exchange; prices received from a regular pricing source are deemed unreliable; or there is a foreign market holiday and no trading occurred.
The fund monitors for significant events occurring after the close of an investment’s primary exchange but before the fund’s net asset value per share is determined. Significant events may include, but are not limited
27
to: corporate announcements and transactions; governmental action and political unrest that could impact a specific investment or an investment sector; or armed conflicts, natural disasters and similar events that could affect investments in a specific country or region. The fund also monitors for significant fluctuations between domestic and foreign markets, as evidenced by the U.S. market or such other indicators that the Board of Directors, or its delegate, deems appropriate. If significant fluctuations in foreign markets are identified, the fund may apply a model-derived factor to the closing price of equity securities traded on foreign securities exchanges. The factor is based on observable market data as provided by an independent pricing service.
Security Transactions — Security transactions are accounted for as of the trade date. Net realized gains and losses are determined on the identified cost basis, which is also used for federal income tax purposes.
Investment Income — Dividend income less foreign taxes withheld, if any, is recorded as of the ex-dividend date. Distributions received on securities that represent a return of capital or long-term capital gain are recorded as a reduction of cost of investments and/or as a realized gain. The fund may estimate the components of distributions received that may be considered nontaxable distributions or long-term capital gain distributions for income tax purposes. Interest income is recorded on the accrual basis and includes accretion of discounts and amortization of premiums.
Securities Sold Short — The fund enters into short sales, which is selling securities it does not own, as part of its normal investment activities. Upon selling a security short, the fund will segregate cash, cash equivalents or other appropriate liquid securities in at least an amount equal to the current market value of the securities sold short until the fund replaces the borrowed security. Interest earned on segregated cash for securities sold short is reflected as interest income. The fund is required to pay any dividends or interest due on securities sold short. Such dividends and interest are recorded as an expense. The fund may pay fees or charges to the broker on the assets borrowed for securities sold short. These fees are calculated daily based upon the value of each security sold short and a rate that is dependent on the availability of such security. Liabilities for securities sold short are valued daily and changes in value are recorded as change in net unrealized appreciation (depreciation) on securities sold short. The fund records realized gain (loss) on a security sold short when it is terminated by the fund and includes as a component of net realized gain (loss) on securities sold short transactions.
Foreign Currency Translations — All assets and liabilities initially expressed in foreign currencies are translated into U.S. dollars at prevailing exchange rates at period end. The fund may enter into spot foreign currency exchange contracts to facilitate transactions denominated in a foreign currency. Purchases and sales of investment securities, dividend and interest income, spot foreign currency exchange contracts, and expenses are translated at the rates of exchange prevailing on the respective dates of such transactions. Net realized and unrealized foreign currency exchange gains or losses related to investment securities are a component of net realized gain (loss) on investment transactions and change in net unrealized appreciation (depreciation) on investments, respectively. Net realized and unrealized foreign currency exchange gains or losses related to securities sold short are a component of net realized gain (loss) on securities sold short transactions and change in net unrealized appreciation (depreciation) on securities sold short, respectively.
Repurchase Agreements — The fund may enter into repurchase agreements with institutions that American Century Investment Management, Inc. (ACIM) (the investment advisor) has determined are creditworthy pursuant to criteria adopted by the Board of Directors. The fund requires that the collateral, represented by securities, received in a repurchase transaction be transferred to the custodian in a manner sufficient to enable the fund to obtain those securities in the event of a default under the repurchase agreement. ACIM monitors, on a daily basis, the securities transferred to ensure the value, including accrued interest, of the securities under each repurchase agreement is equal to or greater than amounts owed to the fund under each repurchase agreement.
Joint Trading Account — Pursuant to an Exemptive Order issued by the Securities and Exchange Commission, the fund, along with certain other funds in the American Century Investments family of funds, may transfer uninvested cash balances into a joint trading account. These balances are invested in one or more repurchase agreements that are collateralized by U.S. Treasury or Agency obligations.
Segregated Assets — In accordance with the 1940 Act, the fund segregates assets on its books and records to cover certain types of investments, including, but not limited to, futures contracts and short sales. ACIM monitors, on a daily basis, the securities segregated to ensure the fund designates a sufficient amount of liquid assets, marked-to-market daily. The fund may also receive assets or be required to pledge assets at the custodian bank or with a broker for margin requirements on futures contracts and short sales.
28
Income Tax Status — It is the fund’s policy to distribute substantially all net investment income and net realized gains to shareholders and to otherwise qualify as a regulated investment company under provisions of the Internal Revenue Code. Accordingly, no provision has been made for income taxes. The fund files U.S. federal, state, local and non-U.S. tax returns as applicable. The fund's tax returns are subject to examination by the relevant taxing authority until expiration of the applicable statute of limitations, which is generally three years from the date of filing but can be longer in certain jurisdictions. At this time, management believes there are no uncertain tax positions which, based on their technical merit, would not be sustained upon examination and for which it is reasonably possible that the total amounts of unrecognized tax benefits will significantly change in the next twelve months.
Multiple Class — All shares of the fund represent an equal pro rata interest in the net assets of the class to which such shares belong, and have identical voting, dividend, liquidation and other rights and the same terms and conditions, except for class specific expenses and exclusive rights to vote on matters affecting only individual classes. Income, non-class specific expenses, and realized and unrealized capital gains and losses of the fund are allocated to each class of shares based on their relative net assets.
Distributions to Shareholders — Distributions from net investment income, if any, are generally declared and paid semiannually. Distributions from net realized gains, if any, are generally declared and paid annually.
Indemnifications — Under the corporation’s organizational documents, its officers and directors are indemnified against certain liabilities arising out of the performance of their duties to the fund. In addition, in the normal course of business, the fund enters into contracts that provide general indemnifications. The maximum exposure under these arrangements is unknown as this would involve future claims that may be made against a fund. The risk of material loss from such claims is considered by management to be remote.
3. Fees and Transactions with Related Parties
Certain officers and directors of the corporation are also officers and/or directors of American Century Companies, Inc. (ACC). The corporation’s investment advisor, ACIM, the corporation's distributor, American Century Investment Services, Inc. (ACIS), and the corporation’s transfer agent, American Century Services, LLC, are wholly owned, directly or indirectly, by ACC.
Management Fees — The corporation has entered into a management agreement with ACIM, under which ACIM provides the fund with investment advisory and management services in exchange for a single, unified management fee (the fee) per class. The agreement provides that all expenses of managing and operating the fund, except distribution and service fees, expenses on securities sold short, brokerage expenses, taxes, interest, fees and expenses of the independent directors (including legal counsel fees), and extraordinary expenses, will be paid by ACIM. The fee is computed and accrued daily based on each class’s daily net assets and paid monthly in arrears. The fee consists of (1) an Investment Category Fee based on the daily net assets of the fund and certain other accounts managed by the investment advisor that are in the same broad investment category as the fund and (2) a Complex Fee based on the assets of all the funds in the American Century Investments family of funds. The rates for the Investment Category Fee range from 1.0480% to 1.2300%. The rates for the Complex Fee range from 0.2500% to 0.3100% for the Investor Class, A Class, C Class and R Class. The rates for the Complex Fee range from 0.0500% to 0.1100% for the Institutional Class. The effective annual management fee for each class for the year ended June 30, 2016 was 1.38% for the Investor Class, A Class, C Class and R Class and 1.18% for the Institutional Class.
Distribution and Service Fees — The Board of Directors has adopted a separate Master Distribution and Individual Shareholder Services Plan for each of the A Class, C Class and R Class (collectively the plans), pursuant to Rule 12b-1 of the 1940 Act. The plans provide that the A Class will pay ACIS an annual distribution and service fee of 0.25%. The plans provide that the C Class will pay ACIS an annual distribution and service fee of 1.00%, of which 0.25% is paid for individual shareholder services and 0.75% is paid for distribution services. The plans provide that the R Class will pay ACIS an annual distribution and service fee of 0.50%. The fees are computed and accrued daily based on each class’s daily net assets and paid monthly in arrears. The fees are used to pay financial intermediaries for distribution and individual shareholder services. Fees incurred under the plans during the year ended June 30, 2016 are detailed in the Statement of Operations.
Directors' Fees and Expenses — The Board of Directors is responsible for overseeing the investment advisor’s management and operations of the fund. The directors receive detailed information about the fund and its investment advisor regularly throughout the year, and meet at least quarterly with management of the investment advisor to review reports about fund operations. The fund’s officers do not receive compensation from the fund.
29
Interfund Transactions — The fund may enter into security transactions with other American Century Investments funds and other client accounts of the investment advisor, in accordance with the 1940 Act rules and procedures adopted by the Board of Directors. The rules and procedures require, among other things, that these transactions be effected at the independent current market price of the security. During the period, the interfund purchases and sales were $892,113 and $190,711, respectively.
4. Investment Transactions
Purchases and sales of investment securities and securities sold short, excluding short-term investments, for the year ended June 30, 2016 were $228,006,891 and $226,946,595, respectively.
5. Capital Share Transactions
Transactions in shares of the fund were as follows:
| Year ended June 30, 2016 | Year ended June 30, 2015 | |||||||||
| Shares | Amount | Shares | Amount | |||||||
| Investor Class/Shares Authorized | 40,000,000 | 40,000,000 | ||||||||
| Sold | 7,699,895 | $ | 86,785,727 | 5,311,573 | $ | 59,900,281 | ||||
| Redeemed | (5,139,376 | ) | (57,746,120 | ) | (4,666,469 | ) | (52,488,240 | ) | ||
| 2,560,519 | 29,039,607 | 645,104 | 7,412,041 | |||||||
| Institutional Class/Shares Authorized | 30,000,000 | 30,000,000 | ||||||||
| Sold | 885,383 | 10,064,206 | 976,227 | 11,193,730 | ||||||
| Redeemed | (467,104 | ) | (5,329,278 | ) | (1,608,708 | ) | (18,384,088 | ) | ||
| 418,279 | 4,734,928 | (632,481 | ) | (7,190,358 | ) | |||||
| A Class/Shares Authorized | 20,000,000 | 20,000,000 | ||||||||
| Sold | 322,144 | 3,551,731 | 829,380 | 9,205,624 | ||||||
| Redeemed | (953,516 | ) | (10,455,920 | ) | (2,005,491 | ) | (22,268,911 | ) | ||
| (631,372 | ) | (6,904,189 | ) | (1,176,111 | ) | (13,063,287 | ) | |||
| C Class/Shares Authorized | 20,000,000 | 20,000,000 | ||||||||
| Sold | 316,151 | 3,245,429 | 180,581 | 1,875,918 | ||||||
| Redeemed | (226,832 | ) | (2,325,283 | ) | (102,013 | ) | (1,059,772 | ) | ||
| 89,319 | 920,146 | 78,568 | 816,146 | |||||||
| R Class/Shares Authorized | 20,000,000 | 20,000,000 | ||||||||
| Sold | 248,096 | 2,653,916 | 133,226 | 1,443,496 | ||||||
| Redeemed | (97,099 | ) | (1,041,751 | ) | (86,698 | ) | (941,601 | ) | ||
| 150,997 | 1,612,165 | 46,528 | 501,895 | |||||||
| Net increase (decrease) | 2,587,742 | $ | 29,402,657 | (1,038,392 | ) | $ | (11,523,563 | ) | ||
6. Fair Value Measurements
The fund’s investments valuation process is based on several considerations and may use multiple inputs to determine the fair value of the investments held by the fund. In conformity with accounting principles generally accepted in the United States of America, the inputs used to determine a valuation are classified into three broad levels.
| • | Level 1 valuation inputs consist of unadjusted quoted prices in an active market for identical investments. |
| • | Level 2 valuation inputs consist of direct or indirect observable market data (including quoted prices for comparable investments, evaluations of subsequent market events, interest rates, prepayment speeds, credit risk, etc.). These inputs also consist of quoted prices for identical investments initially expressed in local currencies that are adjusted through translation into U.S. dollars. |
| • | Level 3 valuation inputs consist of unobservable data (including a fund’s own assumptions). |
The level classification is based on the lowest level input that is significant to the fair valuation measurement. The valuation inputs are not necessarily an indication of the risks associated with investing in these securities or other financial instruments. There were no significant transfers between levels during the period.
30
The following is a summary of the level classifications as of period end. The Schedule of Investments provides additional information on the fund’s portfolio holdings.
| Level 1 | Level 2 | Level 3 | ||||||
| Assets | ||||||||
| Investment Securities | ||||||||
| Common Stocks | $ | 114,358,936 | — | — | ||||
| Temporary Cash Investments | 1,975 | $ | 2,774,000 | — | ||||
| $ | 114,360,911 | $ | 2,774,000 | — | ||||
| Liabilities | ||||||||
| Securities Sold Short | ||||||||
| Common Stocks | $ | 114,141,889 | — | — | ||||
7. Risk Factors
The fund’s investment process may result in high portfolio turnover, which could mean high transaction costs, affecting both performance and capital gains tax liabilities to investors.
The fund is subject to short sales risk. If the market price of a security increases after the fund borrows the security, the fund may suffer a loss when it replaces the borrowed security at the higher price. Any loss will be increased by the amount of compensation, interest or dividends, and transaction costs the fund must pay to the lender of the borrowed security.
If the fund is overweighted in a stock or sector, any negative development related to that stock or sector will have a greater impact on the fund than other funds that are not overweighted in that stock or sector.
The fund's investment strategy utilizes leverage, which can increase market exposure and subject the fund to greater risk and higher volatility.
8. Federal Tax Information
The book-basis character of distributions made during the year from net investment income or net realized gains may differ from their ultimate characterization for federal income tax purposes. These differences reflect the differing character of certain income items and net realized gains and losses for financial statement and tax purposes, and may result in reclassification among certain capital accounts on the financial statements. There were no distributions paid by the fund during the years ended June 30, 2016 and June 30, 2015.
The reclassifications, which are primarily due to net operating losses, were made to capital $(2,139,610), accumulated net investment loss $2,121,012, and accumulated net realized loss $18,598.
As of June 30, 2016, the federal tax cost of investments and the components of distributable earnings on a tax-basis were as follows:
| Federal tax cost of investments | $ | 114,597,822 | |
| Gross tax appreciation of investments | $ | 9,426,302 | |
| Gross tax depreciation of investments | (6,889,213 | ) | |
| Net tax appreciation (depreciation) of investments | 2,537,089 | ||
| Net tax appreciation (depreciation) on securities sold short | 762,327 | ||
| Net tax appreciation (depreciation) | $ | 3,299,416 | |
| Undistributed ordinary income | — | ||
| Accumulated short-term capital losses | $ | (5,426,764 | ) |
| Accumulated long-term capital losses | $ | (492,854 | ) |
| Late-year ordinary loss deferral | $ | (687,915 | ) |
The difference between book-basis and tax-basis unrealized appreciation (depreciation) is attributable primarily to the tax deferral of losses on wash sales.
31
Accumulated capital losses represent net capital loss carryovers that may be used to offset future realized capital gains for federal income tax purposes. The capital loss carryovers may be carried forward for an unlimited period. Future capital loss carryover utilization in any given year may be subject to Internal Revenue Code limitations.
Loss deferrals represent certain qualified losses that the fund has elected to treat as having been incurred in the following fiscal year for federal income tax purposes.
32
| Financial Highlights |
| For a Share Outstanding Throughout the Years Ended June 30 (except as noted) | |||||||||||||
| Per-Share Data | Ratios and Supplemental Data | ||||||||||||
| Income From Investment Operations: | Ratio to Average Net Assets of: | ||||||||||||
Net Asset Value, Beginning of Period | Net Investment Income (Loss)(1) | Net Realized and Unrealized Gain (Loss) | Total From Investment Operations | Net Asset Value, End of Period | Total Return(2) | Operating Expenses | Operating Expenses (excluding expenses on securities sold short) | Net Investment Income (Loss) | Portfolio Turnover Rate | Net Assets, End of Period (in thousands) | |||
| Investor Class | |||||||||||||
| 2016 | $11.12 | (0.14) | 0.03 | (0.11) | $11.01 | (0.99)% | 2.93% | 1.40% | (1.25)% | 235% | $84,899 | ||
| 2015 | $11.24 | (0.16) | 0.04 | (0.12) | $11.12 | (1.07)% | 2.91% | 1.38% | (1.42)% | 243% | $57,263 | ||
| 2014 | $10.78 | (0.17) | 0.63 | 0.46 | $11.24 | 4.27% | 2.92% | 1.38% | (1.56)% | 226% | $50,641 | ||
| 2013 | $10.54 | (0.11) | 0.35 | 0.24 | $10.78 | 2.28% | 3.07% | 1.39% | (1.00)% | 222% | $17,916 | ||
| 2012 | $10.37 | (0.22) | 0.39 | 0.17 | $10.54 | 1.64% | 3.38% | 1.40% | (2.07)% | 252% | $23,019 | ||
| Institutional Class | |||||||||||||
| 2016 | $11.30 | (0.12) | 0.04 | (0.08) | $11.22 | (0.71)% | 2.73% | 1.20% | (1.05)% | 235% | $14,129 | ||
| 2015 | $11.41 | (0.14) | 0.03 | (0.11) | $11.30 | (0.96)% | 2.71% | 1.18% | (1.22)% | 243% | $9,509 | ||
| 2014 | $10.92 | (0.15) | 0.64 | 0.49 | $11.41 | 4.49% | 2.72% | 1.18% | (1.36)% | 226% | $16,810 | ||
| 2013 | $10.65 | (0.08) | 0.35 | 0.27 | $10.92 | 2.54% | 2.87% | 1.19% | (0.80)% | 222% | $4,491 | ||
| 2012 | $10.46 | (0.20) | 0.39 | 0.19 | $10.65 | 1.82% | 3.18% | 1.20% | (1.87)% | 252% | $5,618 | ||
| A Class | |||||||||||||
| 2016 | $10.90 | (0.17) | 0.03 | (0.14) | $10.76 | (1.28)% | 3.18% | 1.65% | (1.50)% | 235% | $11,113 | ||
| 2015 | $11.04 | (0.19) | 0.05 | (0.14) | $10.90 | (1.27)% | 3.16% | 1.63% | (1.67)% | 243% | $18,129 | ||
| 2014 | $10.62 | (0.20) | 0.62 | 0.42 | $11.04 | 3.95% | 3.17% | 1.63% | (1.81)% | 226% | $31,354 | ||
| 2013 | $10.41 | (0.13) | 0.34 | 0.21 | $10.62 | 2.02% | 3.32% | 1.64% | (1.25)% | 222% | $17,545 | ||
| 2012 | $10.27 | (0.24) | 0.38 | 0.14 | $10.41 | 1.36% | 3.63% | 1.65% | (2.32)% | 252% | $32,386 | ||
| For a Share Outstanding Throughout the Years Ended June 30 (except as noted) | |||||||||||||
| Per-Share Data | Ratios and Supplemental Data | ||||||||||||
| Income From Investment Operations: | Ratio to Average Net Assets of: | ||||||||||||
Net Asset Value, Beginning of Period | Net Investment Income (Loss)(1) | Net Realized and Unrealized Gain (Loss) | Total From Investment Operations | Net Asset Value, End of Period | Total Return(2) | Operating Expenses | Operating Expenses (excluding expenses on securities sold short) | Net Investment Income (Loss) | Portfolio Turnover Rate | Net Assets, End of Period (in thousands) | |||
| C Class | |||||||||||||
| 2016 | $10.20 | (0.23) | 0.04 | (0.19) | $10.01 | (1.86)% | 3.93% | 2.40% | (2.25)% | 235% | $7,182 | ||
| 2015 | $10.42 | (0.25) | 0.03 | (0.22) | $10.20 | (2.11)% | 3.91% | 2.38% | (2.42)% | 243% | $6,413 | ||
| 2014 | $10.10 | (0.26) | 0.58 | 0.32 | $10.42 | 3.17% | 3.92% | 2.38% | (2.56)% | 226% | $5,729 | ||
| 2013 | $9.97 | (0.20) | 0.33 | 0.13 | $10.10 | 1.30% | 4.07% | 2.39% | (2.00)% | 222% | $4,377 | ||
| 2012 | $9.91 | (0.31) | 0.37 | 0.06 | $9.97 | 0.61% | 4.38% | 2.40% | (3.07)% | 252% | $5,815 | ||
| R Class | |||||||||||||
| 2016 | $10.66 | (0.19) | 0.04 | (0.15) | $10.51 | (1.41)% | 3.43% | 1.90% | (1.75)% | 235% | $3,742 | ||
| 2015 | $10.83 | (0.21) | 0.04 | (0.17) | $10.66 | (1.57)% | 3.41% | 1.88% | (1.92)% | 243% | $2,187 | ||
| 2014 | $10.45 | (0.22) | 0.60 | 0.38 | $10.83 | 3.64% | 3.42% | 1.88% | (2.06)% | 226% | $1,718 | ||
| 2013 | $10.26 | (0.16) | 0.35 | 0.19 | $10.45 | 1.85% | 3.57% | 1.89% | (1.50)% | 222% | $1,604 | ||
| 2012 | $10.15 | (0.26) | 0.37 | 0.11 | $10.26 | 1.08% | 3.88% | 1.90% | (2.57)% | 252% | $1,039 | ||
| Notes to Financial Highlights |
| (1) | Computed using average shares outstanding throughout the period. |
| (2) | Total returns are calculated based on the net asset value of the last business day and do not reflect applicable sales charges, if any. Total returns for periods less than one year are not annualized. |
See Notes to Financial Statements.
| Report of Independent Registered Public Accounting Firm |
To the Directors of the American Century Quantitative Equity Funds, Inc. and Shareholders of the AC Alternatives Equity Market Neutral Fund:
In our opinion, the accompanying statement of assets and liabilities, including the schedule of investments, and the related statements of operations and of changes in net assets and the financial highlights present fairly, in all material respects, the financial position of the AC Alternatives Equity Market Neutral Fund (one of the sixteen funds comprising the American Century Quantitative Equity Funds, Inc., hereafter referred to as the “Fund”) at June 30, 2016, the results of its operations for the year then ended, the changes in its net assets for each of the two years in the period then ended and the financial highlights for each of the five years in the period then ended, in conformity with accounting principles generally accepted in the United States of America. These financial statements and financial highlights (hereafter referred to as "financial statements") are the responsibility of the Fund's management. Our responsibility is to express an opinion on these financial statements based on our audits. We conducted our audits of these financial statements in accordance with the standards of the Public Company Accounting Oversight Board (United States). Those standards require that we plan and perform the audit to obtain reasonable assurance about whether the financial statements are free of material misstatement. An audit includes examining, on a test basis, evidence supporting the amounts and disclosures in the financial statements, assessing the accounting principles used and significant estimates made by management, and evaluating the overall financial statement presentation. We believe that our audits, which included confirmation of securities at June 30, 2016 by correspondence with the custodian and brokers, provide a reasonable basis for our opinion.
PricewaterhouseCoopers LLP
Kansas City, Missouri
August 17, 2016
35
| Management |
Board of Directors
The individuals listed below serve as directors of the funds. Each director will continue to serve in this capacity until death, retirement, resignation or removal from office. The board has adopted a mandatory retirement age for directors who are not “interested persons,” as that term is defined in the Investment Company Act (independent directors). Independent directors shall retire on December 31 of the year in which they reach their 75th birthday; provided, however, that on or after January 1, 2022, independent directors shall retire on December 31 of the year in which they reach their 76th birthday.
Mr. Thomas is an “interested person” because he currently serves as President and Chief Executive Officer of American Century Companies, Inc. (ACC), the parent company of American Century Investment Management, Inc. (ACIM or the advisor). The other directors (more than three-fourths of the total number) are independent. They are not employees, directors or officers of, and have no financial interest in, ACC or any of its wholly owned, direct or indirect, subsidiaries, including ACIM, American Century Investment Services, Inc. (ACIS) and American Century Services, LLC (ACS), and they do not have any other affiliations, positions or relationships that would cause them to be considered “interested persons” under the Investment Company Act. The directors serve in this capacity for eight (in the case of Mr. Thomas, 15) registered investment companies in the American Century Investments family of funds.
The following table presents additional information about the directors. The mailing address for each director other than Mr. Thomas is 1665 Charleston Road, Mountain View, California 94043. The mailing address for Mr. Thomas is 4500 Main Street, Kansas City, Missouri 64111.
Name (Year of Birth) | Position(s) Held with Funds | Length of Time Served | Principal Occupation(s) During Past 5 Years | Number of American Century Portfolios Overseen by Director | Other Directorships Held During Past 5 Years |
| Independent Directors | |||||
| Tanya S. Beder (1955) | Director | Since 2011 | Chairman and CEO, SBCC Group Inc. (independent advisory services) (2006 to present) | 45 | CYS Investments, Inc. (NYSE mortgage arbitrage REIT) |
| Jeremy I. Bulow (1954) | Director | Since 2011 | Professor of Economics, Stanford University, Graduate School of Business (1979 to present) | 45 | None |
| Anne Casscells (1958) | Director | Since 2016 | Co-Chief Executive Officer and Chief Investment Officer, Aetos Alternatives Management (investment advisory firm) (2001 to present); Lecturer in Accounting, Stanford University, Graduate School of Business (2009 to present) | 45 | None |
36
Name (Year of Birth) | Position(s) Held with Funds | Length of Time Served | Principal Occupation(s) During Past 5 Years | Number of American Century Portfolios Overseen by Director | Other Directorships Held During Past 5 Years |
| Independent Directors | |||||
| Ronald J. Gilson (1946) | Director and Chairman of the Board | Since 1995 (Chairman since 2005) | Charles J. Meyers Professor of Law and Business, Emeritus, Stanford Law School (1979 to present); Marc and Eva Stern Professor of Law and Business, Columbia University School of Law (1992 to present) | 45 | None |
| Frederick L. A. Grauer (1946) | Director | Since 2008 | Senior Advisor, iShares by BlackRock, Inc. (investment management firm) (2010 to 2011, 2013 to present); Senior Advisor, Course Hero (an educational technology company) (2015 to present) | 45 | None |
| Jonathan D. Levin (1972) | Director | Since 2016 | Holbrook Working Professor of Price Theory, Stanford University, (2000 to present); Chair, Department of Economics, Stanford University (2011 to 2014) | 45 | None |
| Peter F. Pervere (1947) | Director | Since 2007 | Retired | 45 | None |
| John B. Shoven (1947) | Director | Since 2002 | Charles R. Schwab Professor of Economics, Stanford University (1973 to present) | 45 | Cadence Design Systems; Exponent; Financial Engines |
| Interested Director | |||||
| Jonathan S. Thomas (1963) | Director and President | Since 2007 | President and Chief Executive Officer, ACC (March 2007 to present). Also serves as Chief Executive Officer, ACS; Executive Vice President, ACIM; Director, ACC, ACIM and other ACC subsidiaries | 128 | BioMed Valley Discoveries, Inc. |
The Statement of Additional Information has additional information about the fund's directors and is available without charge, upon request, by calling 1-800-345-2021.
37
Officers
The following table presents certain information about the executive officers of the funds. Each officer serves as an officer for each of the 15 investment companies in the American Century family of funds, unless otherwise noted. No officer is compensated for his or her service as an officer of the funds. The listed officers are interested persons of the funds and are appointed or re-appointed on an annual basis. The mailing address for each of the officers listed below is 4500 Main Street, Kansas City, Missouri 64111.
Name (Year of Birth) | Offices with the Funds | Principal Occupation(s) During the Past Five Years |
| Jonathan S. Thomas (1963) | Director and President since 2007 | President and Chief Executive Officer, ACC (March 2007 to present). Also serves as Chief Executive Officer, ACS; Executive Vice President, ACIM; Director, ACC, ACIM and other ACC subsidiaries |
| Amy D. Shelton (1964) | Chief Compliance Officer and Vice President since 2014 | Chief Compliance Officer, American Century funds, (March 2014 to present); Chief Compliance Officer, ACIM (February 2014 to present); Chief Compliance Officer, ACIS (October 2009 to present); Vice President, Client Interactions and Marketing, ACIS (February 2013 to January 2014); Director, Client Interactions and Marketing, ACIS (June 2007 to January 2013). Also serves as Vice President, ACIS |
| Charles A. Etherington (1957) | General Counsel since 2007 and Senior Vice President since 2006 | Attorney, ACC (February 1994 to present); Vice President, ACC (November 2005 to present); General Counsel, ACC (March 2007 to present). Also serves as General Counsel, ACIM, ACS, ACIS and other ACC subsidiaries; and Senior Vice President, ACIM and ACS |
| C. Jean Wade (1964) | Vice President, Treasurer and Chief Financial Officer since 2012 | Vice President, ACS (February 2000 to present) |
| Robert J. Leach (1966) | Vice President since 2006 and Assistant Treasurer since 2012 | Vice President, ACS (February 2000 to present) |
| David H. Reinmiller (1963) | Vice President since 2001 | Attorney, ACC (January 1994 to present); Associate General Counsel, ACC (January 2001 to present). Also serves as Vice President, ACIM and ACS |
| Ward D. Stauffer (1960) | Secretary since 2005 | Attorney, ACC (June 2003 to present) |
38
| Approval of Management Agreement |
At a meeting held on June 14, 2016, the Fund’s Board of Directors (the "Board") unanimously approved the renewal of the management agreement pursuant to which American Century Investment Management, Inc. (the “Advisor”) acts as the investment advisor for the Fund. Under Section 15(c) of the Investment Company Act, contracts for investment advisory services are required to be reviewed, evaluated, and approved by a majority of a fund’s directors/trustees, including a majority of the independent Directors, each year. The Board regards this annual evaluation and renewal as one of its most important responsibilities.
The independent Directors have memorialized a statement regarding the relationship between their ongoing obligations to oversee and evaluate the performance of the Advisor and their annual consideration of renewal of the management agreement. In that statement, the independent Directors noted that their assessment of the Advisor’s performance is an ongoing process that takes place over the entire year and is informed by all of the extensive information that the Board and its committees receive and consider over time. This information, together with the additional materials provided specifically in connection with the review, are central to the Board’s assessment of the Advisor’s performance and its determination whether to renew the Fund’s management agreement.
Prior to its consideration of the renewal of the management agreement, the Board requested and reviewed extensive data and analysis relating to the proposed renewal. This information and analysis was compiled by the Advisor and certain independent providers of evaluation data concerning the Fund and the services provided to the Fund by the Advisor.
In connection with its consideration of the renewal of the management agreement, the Board’s review and evaluation of the services provided by the Advisor included, but was not limited to, the following:
| • | the nature, extent, and quality of investment management, shareholder services, and other services provided by the Advisor to the Fund; |
| • | the wide range of other programs and services the Advisor provides to the Fund and its shareholders on a routine and non-routine basis; |
| • | the investment performance of the Fund, including data comparing the Fund’s performance to appropriate benchmarks and/or a peer group of other mutual funds with similar investment objectives and strategies; |
| • | the cost of owning the Fund compared to the cost of owning similar funds; |
| • | the Advisor’s compliance policies, procedures, and regulatory experience; |
| • | financial data showing the cost of services provided to the Fund, the profitability of the Fund to the Advisor, and the overall profitability of the Advisor; |
| • | possible economies of scale associated with the Advisor’s management of the Fund and other accounts under its management; |
| • | data comparing services provided and charges to other investment management clients of the Advisor; |
| • | acquired fund fees and expenses; |
| • | payments by the Fund and the Advisor to financial intermediaries whose clients are investors in the Fund; and |
| • | any collateral benefits derived by the Advisor from the management of the Fund. |
In keeping with its practice, the Board held two in-person meetings to review and discuss the information provided in response to their request. The independent Directors also had the benefit of the advice of their independent counsel throughout the process.
39
Factors Considered
The Directors considered all of the information provided by the Advisor, the independent data providers, and the independent Directors’ independent counsel in connection with the approval. They determined that the information was sufficient for them to evaluate the management agreement for the Fund. In connection with their review, the Directors did not identify any single factor as being all-important or controlling and each Director may have attributed different levels of importance to different factors. In deciding to renew the management agreement, the Board based its decision on a number of factors, including the following:
Nature, Extent and Quality of Services - Generally. Under the management agreement, the Advisor is responsible for providing or arranging for all services necessary for the operation of the Fund. The Board noted that under the management agreement, the Advisor provides or arranges at its own expense a wide variety of services including:
| • | constructing and designing the Fund |
| • | portfolio research and security selection |
| • | initial capitalization/funding |
| • | securities trading |
| • | Fund administration |
| • | custody of Fund assets |
| • | daily valuation of the Fund’s portfolio |
| • | shareholder servicing and transfer agency, including shareholder confirmations, recordkeeping, and communications |
| • | legal services (except the independent Directors’ counsel) |
| • | regulatory and portfolio compliance |
| • | financial reporting |
| • | marketing and distribution (except amounts paid by the Fund under Rule 12b-1 plans) |
The Board noted that many of these services have expanded over time in terms of both quantity and complexity in response to shareholder demands, competition in the industry, changing distribution channels, and the changing regulatory environment.
Investment Management, Shareholder, and Other Services. The nature of the investment management services provided to the Fund is quite complex and allows Fund shareholders access to professional money management, instant diversification of their investments within an asset class, the opportunity to easily diversify among asset classes by investing in or exchanging among various American Century Investments funds, and liquidity. In evaluating investment performance, the Board expects the Advisor to manage the Fund in accordance with its investment objectives and approved strategies. Further, the Directors recognize that the Advisor has an obligation to seek the best execution of fund trades. In providing these services, the Advisor utilizes teams of investment professionals (portfolio managers, analysts, research assistants, and securities traders) who require extensive information technology, research, training, compliance, and other systems to conduct their business. The Board, directly and through its Portfolio Committee, regularly reviews investment performance information for the Fund, together with comparative information for appropriate benchmarks and/or peer groups of similarly-managed funds, over different time horizons. The Directors also review detailed performance information during the management agreement approval process. If performance concerns are identified, the Fund receives special reviews until performance improves, during which the Board discusses with the Advisor the reasons for such results (e.g., market conditions, security selection) and any efforts being undertaken to improve performance. The Fund’s performance was above its benchmark for the one-, three-, five-, and ten-year periods reviewed by the Board. The Board found the investment management services provided by the Advisor to the Fund to be satisfactory and consistent with the management agreement.
40
Under the management agreement, the Advisor provides the Fund with a comprehensive package of transfer agency, shareholder, and other services. The Board, directly and through various committees of the Board, regularly reviews reports and evaluations of such services at its regular meetings. These reports include, but are not limited to, information regarding the operational efficiency and accuracy of the shareholder and transfer agency services provided, staffing levels, shareholder satisfaction (as measured by external as well as internal sources), technology support, new products and services offered to Fund shareholders, securities trading activities, portfolio valuation services, auditing services, and legal and operational compliance activities. Certain aspects of shareholder and transfer agency service level efficiency and the quality of securities trading activities are measured by independent third party providers and are presented in comparison to other fund groups not managed by the Advisor.
The Board found the services provided by the Advisor to the Fund under the management agreement to be competitive and of high quality.
Costs of Services and Profitability. The Advisor provides detailed information concerning its cost of providing various services to the Fund, its profitability in managing the Fund, its overall profitability, and its financial condition. The Directors have reviewed with the Advisor the methodology used to prepare this financial information. This information is considered in evaluating the Advisor’s financial condition, its ability to continue to provide services under the management agreement, and the reasonableness of the current management fee. The Board concluded that the Advisor’s profits were reasonable in light of the services provided to the Fund.
Economies of Scale. The Board also reviewed information provided by the Advisor regarding the possible existence of economies of scale in connection with the management of the Fund. The Board concluded that economies of scale are difficult to measure and predict with precision, especially on a fund-by-fund basis. The Board concluded that the Advisor is appropriately sharing economies of scale through its competitive fee structure, offering competitive fees from fund inception, and through reinvestment in its business to provide shareholders enhanced and expanded services.
Comparison to Other Funds’ Fees. The management agreement provides that the Fund pays the Advisor a single, all-inclusive (or unified) management fee for providing all services necessary for the management and operation of the Fund, other than brokerage expenses, expenses attributable to short sales, taxes, interest, extraordinary expenses, the fees and expenses of the Fund’s independent Directors (including their independent legal counsel), and expenses incurred in connection with the provision of shareholder services and distribution services under a plan adopted pursuant to Rule 12b-1 under the 1940 Act. Under the unified fee structure, the Advisor is responsible for providing all investment advisory, custody, audit, administrative, compliance, recordkeeping, marketing, and shareholder services, or arranging and supervising third parties to provide such services. By contrast, most other funds are charged a variety of fees, including an investment advisory fee, a transfer agency fee, an administrative fee, distribution charges, and other expenses. Other than their investment advisory fees and any applicable Rule 12b-1 fees, all other components of the total fees charged by these other funds may be increased without shareholder approval. The Board believes the unified fee structure is a benefit to Fund shareholders because it clearly discloses to shareholders the cost of owning Fund shares, and, since the unified fee cannot be increased without a vote of Fund shareholders, it shifts to the Advisor the risk of increased costs of operating the Fund and provides a direct incentive to minimize administrative inefficiencies. Part of the Board’s analysis of fee levels involves reviewing certain evaluative data compiled by an independent provider and comparing the Fund’s unified fee to the total expense ratio of peer funds. The unified fee charged to shareholders of the Fund was below the median of the total expense ratios of the Fund’s peer universe. The Board concluded that the management fee paid by the Fund to the Advisor under the management agreement is reasonable in light of the services provided to the Fund.
41
Comparison to Fees and Services Provided to Other Clients of the Advisor. The Board also requested and received information from the Advisor concerning the nature of the services, fees, costs, and profitability of its advisory services to advisory clients other than the Fund. They observed that these varying types of client accounts require different services and involve different regulatory and entrepreneurial risks than the management of the Fund. The Board analyzed this information and concluded that the fees charged and services provided to the Fund were reasonable by comparison.
Payments to Intermediaries. The Directors also requested and received a description of payments made to intermediaries by the Fund and the Advisor. These payments include various payments made by the Fund or the Advisor to different types of intermediaries and recordkeepers for distribution and service activities provided for the Fund.
Collateral or “Fall-Out” Benefits Derived by the Advisor. The Board considered the existence of collateral benefits the Advisor may receive as a result of its relationship with the Fund. The Board noted that the Advisor’s primary business is managing mutual funds and it generally does not use fund or shareholder information to generate profits in other lines of business, and therefore does not derive any significant collateral benefits from them. The Board noted that the Advisor receives proprietary research from broker-dealers that execute fund portfolio transactions. The Board also determined that the Advisor is able to provide investment management services to certain clients other than the Fund, at least in part, due to its existing infrastructure built to serve the fund complex. The Board concluded, however, that the assets of those other clients are not material to the analysis and, where applicable, may be included with the assets of the Fund to determine breakpoints in the management fee schedule.
Existing Relationship. The Board also considered whether there was any reason for not continuing the existing arrangement with the Advisor. In this regard, the Board was mindful of the potential disruptions of the Fund’s operations and various risks, uncertainties, and other effects that could occur as a result of a decision not to continue such relationship. In particular, the Board recognized that most shareholders have invested in the Fund on the strength of the Advisor’s industry standing and reputation and in the expectation that the Advisor will have a continuing role in providing advisory services to the Fund.
Conclusion of the Directors. As a result of this process, the Board, including all of the independent Directors and assisted by the advice of independent legal counsel, taking into account all of the factors discussed above and the information provided by the Advisor and others in connection with its review and throughout the year, concluded that the management agreement between the Fund and the Advisor is fair and reasonable in light of the services provided and should be renewed.
42
| Proxy Voting Results |
A special meeting of shareholders was held on June 13, 2016, to vote on the following proposal. The proposal received the required number of votes and was adopted. A summary of voting results is listed below.
To elect four directors to the Board of Directors of American Century Quantitative Equity Funds, Inc.:
| Affirmative | Withhold | ||||||
| Tanya S. Beder | $ | 8,473,153,264 | $ | 121,459,590 | |||
| Jeremy I. Bulow | $ | 8,469,793,581 | $ | 124,819,273 | |||
| Anne Casscells | $ | 8,465,895,232 | $ | 128,717,622 | |||
| Jonathan D. Levin | $ | 8,468,929,867 | $ | 125,682,987 | |||
The other directors whose term of office continued after the meeting include Jonathan S. Thomas, Ronald J. Gilson, Frederick L. A. Grauer, Peter F. Pervere and John B. Shoven.
43
| Additional Information |
Retirement Account Information
As required by law, distributions you receive from certain IRAs are subject to federal income tax withholding, unless you elect not to have withholding apply. Tax will be withheld on the total amount withdrawn even though you may be receiving amounts that are not subject to withholding, such as nondeductible contributions. In such case, excess amounts of withholding could occur. You may adjust your withholding election so that a greater or lesser amount will be withheld.
If you don’t want us to withhold on this amount, you must notify us to not withhold the federal income tax. You may notify us in writing or in certain situations by telephone or through other electronic means. For systematic withdrawals, your withholding election will remain in effect until revoked or changed by filing a new election. You have the right to revoke your election at any time.
Remember, even if you elect not to have income tax withheld, you are liable for paying income tax on the taxable portion of your withdrawal. If you elect not to have income tax withheld or you don’t have enough income tax withheld, you may be responsible for payment of estimated tax. You may incur penalties under the estimated tax rules if your withholding and estimated tax payments are not sufficient. You can reduce or defer the income tax on a distribution by directly or indirectly rolling such distribution over to another IRA or eligible plan. You should consult your tax advisor for additional information.
State tax will be withheld if, at the time of your distribution, your address is within one of the mandatory withholding states and you have federal income tax withheld (or as otherwise required by state law). State taxes will be withheld from your distribution in accordance with the respective state rules.
Distributions you receive from 403(b), 457 and qualified plans are subject to special tax and withholding rules. Your plan administrator or plan sponsor is required to provide you with a special tax notice explaining those rules at the time you request a distribution. If applicable, federal and/or state taxes may be withheld from your distribution amount.
Proxy Voting Policies
Descriptions of the principles and policies that the fund's investment advisor uses in exercising the voting rights associated with the securities purchased and/or held by the fund are available without charge, upon request, by calling 1-800-345-2021 or visiting the "About Us" page of American Century Investments’ website at americancentury.com. A description of the policies is also available on the Securities and Exchange Commission’s website at sec.gov. Information regarding how the investment advisor voted proxies relating to portfolio securities during the most recent 12-month period ended June 30 is available on the "About Us" page at americancentury.com. It is also available at sec.gov.
Quarterly Portfolio Disclosure
The fund files its complete schedule of portfolio holdings with the Securities and Exchange Commission (SEC) for the first and third quarters of each fiscal year on Form N-Q. The fund’s Forms N-Q are available on the SEC’s website at sec.gov, and may be reviewed and copied at the SEC’s Public Reference Room in Washington, DC. Information on the operation of the Public Reference Room may be obtained by calling 1-800-SEC-0330. The fund also makes its complete schedule of portfolio holdings for the most recent quarter of its fiscal year available on its website at americancentury.com and, upon request, by calling 1-800-345-2021.
44
 | ||
| Contact Us | americancentury.com | |
| Automated Information Line | 1-800-345-8765 | |
| Investor Services Representative | 1-800-345-2021 or 816-531-5575 | |
| Investors Using Advisors | 1-800-378-9878 | |
| Business, Not-For-Profit, Employer-Sponsored Retirement Plans | 1-800-345-3533 | |
| Banks and Trust Companies, Broker-Dealers, Financial Professionals, Insurance Companies | 1-800-345-6488 | |
| Telecommunications Relay Service for the Deaf | 711 | |
| American Century Quantitative Equity Funds, Inc. | ||
Investment Advisor: American Century Investment Management, Inc. Kansas City, Missouri | ||
| This report and the statements it contains are submitted for the general information of our shareholders. The report is not authorized for distribution to prospective investors unless preceded or accompanied by an effective prospectus. | ||
| ©2016 American Century Proprietary Holdings, Inc. All rights reserved. CL-ANN-89951 1608 | ||
| Annual Report | |
| June 30, 2016 | |
| Core Equity Plus Fund | |
| Table of Contents |
| President's Letter | 2 | |
| Performance | 3 | |
| Portfolio Commentary | ||
| Fund Characteristics | ||
| Shareholder Fee Example | ||
| Schedule of Investments | ||
| Statement of Assets and Liabilities | ||
| Statement of Operations | ||
| Statement of Changes in Net Assets | ||
| Statement of Cash Flows | ||
| Notes to Financial Statements | ||
| Financial Highlights | ||
| Report of Independent Registered Public Accounting Firm | ||
| Management | ||
| Approval of Management Agreement | ||
| Proxy Voting Results | ||
| Additional Information | ||
Any opinions expressed in this report reflect those of the author as of the date of the report, and do not necessarily represent the opinions of American Century Investments® or any other person in the American Century Investments organization. Any such opinions are subject to change at any time based upon market or other conditions and American Century Investments disclaims any responsibility to update such opinions. These opinions may not be relied upon as investment advice and, because investment decisions made by American Century Investments funds are based on numerous factors, may not be relied upon as an indication of trading intent on behalf of any American Century Investments fund. Security examples are used for representational purposes only and are not intended as recommendations to purchase or sell securities. Performance information for comparative indices and securities is provided to American Century Investments by third party vendors. To the best of American Century Investments’ knowledge, such information is accurate at the time of printing.
| President’s Letter |
Jonathan ThomasDear Investor:
Thank you for reviewing this annual report for the 12 months ended June 30, 2016. It provides investment performance and portfolio information for the reporting period, plus longer-term historical performance data.
Annual reports remain important vehicles for conveying information about fund returns, including market and economic factors that affected performance during the reporting period. For additional, updated investment and market insights, we encourage you to visit our website, americancentury.com.
Market Volatility Increased, But Not for the Reasons Anticipated
Going into this reporting period, investors anticipated increased market volatility and uncertainty as the Federal Reserve (the Fed) appeared poised to raise short-term interest rates toward more historically normal levels. This policy change was expected to affect investor sentiment, U.S. Treasury yield behavior, relative currency values, inflation expectations, and corporate costs and earnings.
This Fed-centric outlook didn’t fully account for global factors, which ultimately drove sentiment, volatility, and performance during the reporting period. During 2015, the primary catalyst was China, where slowing economic growth, currency devaluations, and massive monetary policy easing sent shock waves through the global markets. The Fed ended up delaying (until December 2015) its only small rate hike during the reporting period. Afterward, China-related events repeated in January and early February this year, further delaying Fed action.
Oil was another catalyst—its price collapses devalued entire market sectors and contributed to broad market volatility and negative sentiment. Later, as China and oil appeared to stabilize, Brexit occurred—the unexpected decision by United Kingdom voters to leave the European Union. This produced more shock waves, and altered central bank policies around the world. In this environment, relatively defensive assets performed best for the 12 months, including the stocks of gold-producing companies, utilities, real estate investment trusts (REITs), and long-maturity U.S. Treasury securities.
Looking ahead, we believe the markets face further uncertainty and volatility as they digest Brexit, the Italian bank crisis, China’s economic mysteries, and the U.S. presidential election. Negative interest rates in Europe and Japan represent part of the market’s response to the global macroeconomic climate. These negative rates are suppressing interest rates around the world while driving up the value of the U.S. dollar and U.S. bonds. In a broad sense, stocks also benefit from the central bank stimulus that is driving interest rates into negative territory, and from relative yield advantages as bond yields are pushed lower. It’s an unusual and challenging environment. We appreciate your continued trust in us.
Sincerely,
Jonathan Thomas
President and Chief Executive Officer
American Century Investments
2
| Performance |
| Total Returns as of June 30, 2016 | ||||
Average Annual Returns | ||||
| Ticker Symbol | 1 year | Since Inception | Inception Date | |
| Investor Class | ACPVX | -2.13% | 12.30% | 10/31/11 |
| S&P 500 Index | — | 3.99% | 14.12% | — |
| Institutional Class | ACPKX | -1.91% | 12.54% | 10/31/11 |
| A Class | ACPQX | 10/31/11 | ||
| No sales charge | -2.35% | 12.04% | ||
| With sales charge | -7.93% | 10.63% | ||
| C Class | ACPHX | -3.09% | 11.19% | 10/31/11 |
| R Class | ACPWX | -2.62% | 11.74% | 10/31/11 |
Sales charges include initial sales charges and contingent deferred sales charges (CDSCs), as applicable. A Class shares have a 5.75% maximum initial sales charge and may be subject to a maximum CDSC of 1.00%. C Class shares redeemed within 12 months of purchase are subject to a maximum CDSC of 1.00%. The SEC requires that mutual funds provide performance information net of maximum sales charges in all cases where charges could be applied.
Data presented reflect past performance. Past performance is no guarantee of future results. Current performance may be higher or lower than the performance shown. Total returns for periods less than one year are not annualized. Investment return and principal value will fluctuate, and redemption value may be more or less than original cost. Data assumes reinvestment of dividends and capital gains, and none of the charts reflect the deduction of taxes that a shareholder would pay on fund distributions or the redemption of fund shares. To obtain performance data current to the most recent month end, please call 1-800-345-2021 or visit americancentury.com. For additional information about the fund, please consult the prospectus.
3
| Growth of $10,000 Over Life of Class |
| $10,000 investment made October 31, 2011 |
| Performance for other share classes will vary due to differences in fee structure. |
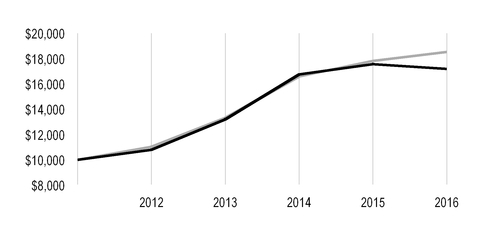
| Value on June 30, 2016 | |
| Investor Class — $17,189 | |
| S&P 500 Index — $18,527 | |
| Total Annual Fund Operating Expenses | ||||
| Investor Class | Institutional Class | A Class | C Class | R Class |
| 1.73% | 1.53% | 1.98% | 2.73% | 2.23% |
The total annual fund operating expenses shown is as stated in the fund’s prospectus current as of the date of this report. The prospectus may vary from the expense ratio shown elsewhere in this report because it is based on a different time period, includes acquired fund fees and expenses, and, if applicable, does not include fee waivers or expense reimbursements.
Data presented reflect past performance. Past performance is no guarantee of future results. Current performance may be higher or lower than the performance shown. Total returns for periods less than one year are not annualized. Investment return and principal value will fluctuate, and redemption value may be more or less than original cost. Data assumes reinvestment of dividends and capital gains, and none of the charts reflect the deduction of taxes that a shareholder would pay on fund distributions or the redemption of fund shares. To obtain performance data current to the most recent month end, please call 1-800-345-2021 or visit americancentury.com. For additional information about the fund, please consult the prospectus.
4
| Portfolio Commentary |
Portfolio Managers: Scott Wittman and Claudia Musat
In May 2016, portfolio manager Bill Martin left the fund's management team.
Performance Summary
Core Equity Plus returned -2.13%* for the fiscal year ended June 30, 2016, compared with the 3.99% return of its benchmark, the S&P 500 Index.
Core Equity Plus declined for the 12-month period, underperforming the return of its benchmark, the S&P 500 Index. The fund is managed to have a 100% net exposure to the equity market by investing approximately 130% of its net assets in long positions, while 30% of its net assets are sold short. The proceeds from the securities sold short are used to fund the purchase of the additional 30% of long positions The portfolio’s stock selection process incorporates factors of valuation, quality, growth, and sentiment while striving to minimize unintended risks along industries and other risk characteristics. Within the fund, valuation-based factors proved most difficult, although sentiment and growth indicators also detracted from performance. Security selection in the financials, consumer discretionary, and industrials sectors weighed on relative performance the most, while health care and information technology sector holdings were relative contributors.
Financials Sector Led Detractors
Security selection in the financials sector was the principal detractor from the fund’s twelve-month results. Shares of commercial real estate services company Jones Lang LaSalle, a portfolio-only position, declined sharply on disappointing quarterly earnings in early 2016 during a difficult environment for financial stocks. A number of capital markets holdings also weighed on the sector’s results, including Legg Mason, an overweight position relative to the benchmark. The asset manager’s stock price came under pressure after reporting a quarterly net loss and announcing several strategic acquisitions and agreements. We ultimately liquidated our positions in both holdings.
The consumer discretionary sector was also an area of underperformance during the twelve-month period. A portfolio-only position in GoPro detracted as the wearable camera maker’s stock slumped on concerns about economic growth in China and a bleak outlook for wearable camera demand. Wolverine World Wide, which owns a portfolio of footwear brands including Keds, Merrell, and Hush Puppies, fell on disappointing quarterly sales results amid a difficult global retail and consumer environment. We subsequently exited the portfolio’s stake in both positions.
Key detraction on an individual holding level came from two short positions (a trade made to benefit from a stock’s decline) in the materials sector. Royal Gold and Hecla Mining, both precious metals companies, rallied sharply together with advancing gold prices during the second half of the period. We maintain our short positions based on weakness across most characteristics.
| * | All fund returns referenced in this commentary are for Investor Class shares. Performance for other share classes will vary due to differences in fee structure; when Investor Class performance exceeds that of the fund's benchmark, other share classes may not. See page 3 for returns for all share classes. |
5
Health Care Sector Contributed
Security selection among health care companies helped position the sector as a leading relative outperformer in the fund. A number of short position were especially beneficial. These included Brookdale Senior Living, an operator of senior living communities, and Acadia Healthcare, a provider of behavioral health treatment services, both key sector contributors. Brookdale Senior Living stock fell after the company reported disappointing fourth-quarter results. Similarly, shares of Acadia Healthcare weakened as its fourth-quarter earnings fell short of expectations.
The information technology sector was also an area of strength, led by a short position in SunEdison. The solar energy company’s stock fell after a quarterly earnings miss early in the year, and we unwound the fund’s short position. Sector contribution also came from Applied Materials, a long position. The semiconductor maker’s shares moved up on the heels of strong quarterly earnings reports and higher future guidance as the company captured market share from competitors and anticipated higher demand. Elsewhere in the fund, key individual contribution stemmed from Newmont Mining, which rose on the recovery in precious metals prices.
A Look Ahead
At period-end, consumer staples and information technology were the fund’s largest overweight positions on a sector basis. In consumer staples, we are finding opportunities in household goods manufacturers. We think that software and internet software and services companies are attractive in the information technology sector, where key themes are mobile, search, cloud computing, big data, and the shift to digital/online retail. This is creating growth and quality opportunities. Valuation and sentiment also are positive for select firms in these industries. After the dramatic sell-off in 2015, health care names, particularly in the biotech space, are compelling based on valuation factors. Growth and quality metrics also are favorable. The financials and consumer discretionary sectors, both portfolio underweights, continue to face challenges, in our opinion. In financials, we find that large-cap real estate investment trusts and diversified financial services firms are challenged across virtually all dimensions. Growth scores are not favorable in consumer discretionary, particularly among specialty retailers. In fundamental terms, many of these traditional brick-and-mortar retailers face challenging business conditions and have poor growth and quality rankings. Our disciplined, objective, and systematic investment strategy is designed to take advantage of opportunities at the individual company level in both the long and short portions of the portfolio. We believe this approach is the most powerful way to capitalize on market inefficiencies that lead to the mispricing of individual stocks.
6
| Fund Characteristics |
| JUNE 30, 2016 | |
| Top Ten Long Holdings | % of net assets |
| Alphabet, Inc., Class A | 2.81% |
| Apple, Inc. | 2.57% |
| Amazon.com, Inc. | 2.42% |
| Microsoft Corp. | 2.36% |
| Exxon Mobil Corp. | 2.13% |
| Verizon Communications, Inc. | 2.05% |
| Procter & Gamble Co. (The) | 1.98% |
| Johnson & Johnson | 1.87% |
| PepsiCo, Inc. | 1.77% |
| Intel Corp. | 1.73% |
| Top Five Short Holdings | % of net assets |
| Louisiana-Pacific Corp. | (0.88)% |
| Royal Gold, Inc. | (0.87)% |
| Olin Corp. | (0.87)% |
| Waste Connections, Inc. | (0.77)% |
| CST Brands, Inc. | (0.76)% |
| Types of Investments in Portfolio | % of net assets |
| Common Stocks | 127.9% |
| Common Stocks Sold Short | (29.0)% |
| Temporary Cash Investments | 1.1% |
| Other Assets and Liabilities | —* |
*Category is less than 0.05% of total net assets.
7
| Shareholder Fee Example |
Fund shareholders may incur two types of costs: (1) transaction costs, including sales charges (loads) on purchase payments and redemption/exchange fees; and (2) ongoing costs, including management fees; distribution and service (12b-1) fees; and other fund expenses. This example is intended to help you understand your ongoing costs (in dollars) of investing in your fund and to compare these costs with the ongoing cost of investing in other mutual funds.
The example is based on an investment of $1,000 made at the beginning of the period and held for the entire period from January 1, 2016 to June 30, 2016.
Actual Expenses
The table provides information about actual account values and actual expenses for each class. You may use the information, together with the amount you invested, to estimate the expenses that you paid over the period. First, identify the share class you own. Then simply divide your account value by $1,000 (for example, an $8,600 account value divided by $1,000 = 8.6), then multiply the result by the number under the heading “Expenses Paid During Period” to estimate the expenses you paid on your account during this period.
If you hold Investor Class shares of any American Century Investments fund, or Institutional Class shares of the American Century Diversified Bond Fund, in an American Century Investments account (i.e., not a financial intermediary or retirement plan account), American Century Investments may charge you a $12.50 semiannual account maintenance fee if the value of those shares is less than $10,000. We will redeem shares automatically in one of your accounts to pay the $12.50 fee. In determining your total eligible investment amount, we will include your investments in all personal accounts (including American Century Investments Brokerage accounts) registered under your Social Security number. Personal accounts include individual accounts, joint accounts, UGMA/UTMA accounts, personal trusts, Coverdell Education Savings Accounts and IRAs (including traditional, Roth, Rollover, SEP-, SARSEP- and SIMPLE-IRAs), and certain other retirement accounts. If you have only business, business retirement, employer-sponsored or American Century Investments Brokerage accounts, you are currently not subject to this fee. If you are subject to the Account Maintenance Fee, your account value could be reduced by the fee amount.
Hypothetical Example for Comparison Purposes
The table also provides information about hypothetical account values and hypothetical expenses based on the actual expense ratio of each class of your fund and an assumed rate of return of 5% per year before expenses, which is not the actual return of a fund’s share class. The hypothetical account values and expenses may not be used to estimate the actual ending account balance or expenses you paid for the period. You may use this information to compare the ongoing costs of investing in your fund and other funds. To do so, compare this 5% hypothetical example with the 5% hypothetical examples that appear in the shareholder reports of the other funds.
Please note that the expenses shown in the table are meant to highlight your ongoing costs only and do not reflect any transactional costs, such as sales charges (loads) or redemption/exchange fees. Therefore, the table is useful in comparing ongoing costs only, and will not help you determine the relative total costs of owning different funds. In addition, if these transactional costs were included, your costs would have been higher.
8
| Beginning Account Value 1/1/16 | Ending Account Value 6/30/16 | Expenses Paid During Period(1) 1/1/16 - 6/30/16 | Annualized Expense Ratio(1) | |
| Actual | ||||
| Investor Class | $1,000 | $1,009.60 | $9.79 | 1.96% |
| Institutional Class | $1,000 | $1,011.30 | $8.80 | 1.76% |
| A Class | $1,000 | $1,008.40 | $11.04 | 2.21% |
| C Class | $1,000 | $1,005.00 | $14.76 | 2.96% |
| R Class | $1,000 | $1,007.30 | $12.28 | 2.46% |
| Hypothetical | ||||
| Investor Class | $1,000 | $1,015.12 | $9.82 | 1.96% |
| Institutional Class | $1,000 | $1,016.11 | $8.82 | 1.76% |
| A Class | $1,000 | $1,013.87 | $11.07 | 2.21% |
| C Class | $1,000 | $1,010.14 | $14.79 | 2.96% |
| R Class | $1,000 | $1,012.63 | $12.31 | 2.46% |
| (1) | Expenses are equal to the class's annualized expense ratio listed in the table above, multiplied by the average account value over the period, multiplied by 182, the number of days in the most recent fiscal half-year, divided by 366, to reflect the one-half year period. |
9
| Schedule of Investments |
JUNE 30, 2016
| Shares | Value | |||
| COMMON STOCKS — 127.9% | ||||
| Aerospace and Defense — 4.0% | ||||
B/E Aerospace, Inc.(1) | 9,064 | $ | 418,530 | |
Boeing Co. (The)(1) | 14,819 | 1,924,544 | ||
Honeywell International, Inc.(1) | 10,148 | 1,180,415 | ||
Huntington Ingalls Industries, Inc.(1) | 8,114 | 1,363,395 | ||
Spirit AeroSystems Holdings, Inc., Class A(1)(2) | 24,804 | 1,066,572 | ||
Textron, Inc.(1) | 15,603 | 570,446 | ||
| 6,523,902 | ||||
| Airlines — 1.6% | ||||
Delta Air Lines, Inc.(1) | 18,233 | 664,228 | ||
JetBlue Airways Corp.(1)(2) | 52,408 | 867,877 | ||
United Continental Holdings, Inc.(1)(2) | 25,805 | 1,059,037 | ||
| 2,591,142 | ||||
| Auto Components — 1.1% | ||||
Goodyear Tire & Rubber Co. (The)(1) | 41,915 | 1,075,539 | ||
| Lear Corp. | 6,887 | 700,821 | ||
| 1,776,360 | ||||
| Automobiles — 0.1% | ||||
Ford Motor Co.(1) | 8,340 | 104,833 | ||
| Banks — 3.1% | ||||
Bank of America Corp.(1) | 7,035 | 93,354 | ||
Citigroup, Inc.(1) | 56,015 | 2,374,476 | ||
JPMorgan Chase & Co.(1) | 12,089 | 751,211 | ||
| TCF Financial Corp. | 90,310 | 1,142,422 | ||
Wells Fargo & Co.(1) | 15,022 | 710,991 | ||
| 5,072,454 | ||||
| Beverages — 2.5% | ||||
Coca-Cola Co. (The)(1) | 4,501 | 204,030 | ||
Dr Pepper Snapple Group, Inc.(1) | 10,774 | 1,041,092 | ||
PepsiCo, Inc.(1) | 26,975 | 2,857,731 | ||
| 4,102,853 | ||||
| Biotechnology — 4.1% | ||||
AbbVie, Inc.(1) | 20,505 | 1,269,464 | ||
Amgen, Inc.(1) | 9,038 | 1,375,132 | ||
Biogen, Inc.(1)(2) | 3,305 | 799,215 | ||
Celgene Corp.(1)(2) | 10,087 | 994,881 | ||
Gilead Sciences, Inc.(1) | 16,240 | 1,354,741 | ||
Medivation, Inc.(2) | 2,930 | 176,679 | ||
Myriad Genetics, Inc.(2) | 11,511 | 352,237 | ||
United Therapeutics Corp.(1)(2) | 3,462 | 366,695 | ||
| 6,689,044 | ||||
| Building Products — 1.7% | ||||
Masonite International Corp.(2) | 1,596 | 105,559 | ||
Owens Corning(1) | 25,449 | 1,311,133 | ||
USG Corp.(1)(2) | 50,501 | 1,361,507 | ||
| 2,778,199 | ||||
10
| Shares | Value | |||
| Capital Markets — 0.9% | ||||
Ameriprise Financial, Inc.(1) | 8,498 | $ | 763,545 | |
Artisan Partners Asset Management, Inc., Class A(1) | 4,679 | 129,515 | ||
| Eaton Vance Corp. | 14,738 | 520,841 | ||
| 1,413,901 | ||||
| Chemicals — 4.7% | ||||
Air Products & Chemicals, Inc.(1) | 11,057 | 1,570,536 | ||
Cabot Corp.(1) | 27,082 | 1,236,564 | ||
Dow Chemical Co. (The)(1) | 35,622 | 1,770,770 | ||
Minerals Technologies, Inc.(1) | 20,441 | 1,161,049 | ||
PPG Industries, Inc.(1) | 13,458 | 1,401,651 | ||
| RPM International, Inc. | 8,430 | 421,078 | ||
| 7,561,648 | ||||
| Commercial Services and Supplies — 1.5% | ||||
Deluxe Corp.(1) | 17,495 | 1,161,143 | ||
Herman Miller, Inc.(1) | 43,020 | 1,285,868 | ||
| 2,447,011 | ||||
| Communications Equipment — 2.4% | ||||
Ciena Corp.(2) | 27,715 | 519,656 | ||
Cisco Systems, Inc.(1) | 94,966 | 2,724,575 | ||
Juniper Networks, Inc.(1) | 29,975 | 674,138 | ||
| 3,918,369 | ||||
| Consumer Finance — 2.0% | ||||
| American Express Co. | 12,175 | 739,753 | ||
Discover Financial Services(1) | 27,426 | 1,469,759 | ||
Synchrony Financial(1)(2) | 41,374 | 1,045,935 | ||
| 3,255,447 | ||||
| Containers and Packaging — 1.9% | ||||
Avery Dennison Corp.(1) | 10,434 | 779,941 | ||
Berry Plastics Group, Inc.(1)(2) | 32,462 | 1,261,149 | ||
Graphic Packaging Holding Co.(1) | 32,478 | 407,274 | ||
| Sealed Air Corp. | 12,372 | 568,741 | ||
| 3,017,105 | ||||
| Diversified Financial Services — 1.6% | ||||
Berkshire Hathaway, Inc., Class B(1)(2) | 6,295 | 911,453 | ||
| MSCI, Inc., Class A | 4,612 | 355,677 | ||
Nasdaq, Inc.(1) | 19,697 | 1,273,805 | ||
| 2,540,935 | ||||
| Diversified Telecommunication Services — 3.6% | ||||
AT&T, Inc.(1) | 57,577 | 2,487,902 | ||
Verizon Communications, Inc.(1) | 59,443 | 3,319,297 | ||
| 5,807,199 | ||||
| Electric Utilities — 0.2% | ||||
| FirstEnergy Corp. | 9,923 | 346,412 | ||
| Electronic Equipment, Instruments and Components — 0.1% | ||||
| Belden, Inc. | 3,204 | 193,425 | ||
| Energy Equipment and Services — 1.8% | ||||
Atwood Oceanics, Inc.(1) | 25,430 | 318,384 | ||
Diamond Offshore Drilling, Inc.(1) | 31,632 | 769,606 | ||
Dril-Quip, Inc.(2) | 10,023 | 585,644 | ||
11
| Shares | Value | |||
Rowan Cos. plc(1) | 69,290 | $ | 1,223,661 | |
| 2,897,295 | ||||
| Food and Staples Retailing — 2.1% | ||||
CVS Health Corp.(1) | 7,683 | 735,570 | ||
SUPERVALU, Inc.(1)(2) | 83,112 | 392,289 | ||
Wal-Mart Stores, Inc.(1) | 31,595 | 2,307,067 | ||
| 3,434,926 | ||||
| Food Products — 4.9% | ||||
| Cal-Maine Foods, Inc. | 11,833 | 524,439 | ||
Dean Foods Co.(1) | 54,368 | 983,517 | ||
| Fresh Del Monte Produce, Inc. | 5,779 | 314,551 | ||
General Mills, Inc.(1) | 15,188 | 1,083,208 | ||
Hormel Foods Corp.(1) | 31,088 | 1,137,821 | ||
Ingredion, Inc.(1) | 9,015 | 1,166,631 | ||
Pilgrim's Pride Corp.(1) | 42,817 | 1,090,977 | ||
Seaboard Corp.(2) | 114 | 327,253 | ||
Tyson Foods, Inc., Class A(1) | 20,301 | 1,355,904 | ||
| 7,984,301 | ||||
| Gas Utilities — 1.6% | ||||
ONE Gas, Inc.(1) | 19,943 | 1,328,004 | ||
| Southwest Gas Corp. | 9,155 | 720,590 | ||
UGI Corp.(1) | 11,032 | 499,198 | ||
| 2,547,792 | ||||
| Health Care Equipment and Supplies — 4.7% | ||||
Abbott Laboratories(1) | 42,560 | 1,673,034 | ||
| Becton Dickinson and Co. | 1,592 | 269,987 | ||
Boston Scientific Corp.(1)(2) | 15,390 | 359,664 | ||
| C.R. Bard, Inc. | 7,229 | 1,699,972 | ||
Hologic, Inc.(1)(2) | 19,894 | 688,332 | ||
| Medtronic plc | 9,219 | 799,933 | ||
| ResMed, Inc. | 9,709 | 613,900 | ||
St. Jude Medical, Inc.(1) | 18,098 | 1,411,644 | ||
| 7,516,466 | ||||
| Health Care Providers and Services — 3.3% | ||||
Aetna, Inc.(1) | 14,170 | 1,730,582 | ||
AmerisourceBergen Corp.(1) | 12,789 | 1,014,423 | ||
| Cigna Corp. | 2,238 | 286,442 | ||
Express Scripts Holding Co.(1)(2) | 23,086 | 1,749,919 | ||
Laboratory Corp. of America Holdings(2) | 3,993 | 520,168 | ||
| 5,301,534 | ||||
| Health Care Technology — 0.6% | ||||
Allscripts Healthcare Solutions, Inc.(1)(2) | 44,801 | 568,973 | ||
Medidata Solutions, Inc.(2) | 9,172 | 429,891 | ||
| 998,864 | ||||
| Hotels, Restaurants and Leisure — 3.7% | ||||
Bloomin' Brands, Inc.(1) | 69,622 | 1,244,145 | ||
Brinker International, Inc.(1) | 22,849 | 1,040,315 | ||
Carnival Corp.(1) | 29,280 | 1,294,176 | ||
| Churchill Downs, Inc. | 3,194 | 403,594 | ||
Darden Restaurants, Inc.(1) | 19,207 | 1,216,571 | ||
12
| Shares | Value | |||
| McDonald's Corp. | 7,115 | $ | 856,219 | |
| 6,055,020 | ||||
| Household Products — 2.9% | ||||
| Clorox Co. (The) | 3,979 | 550,654 | ||
| Kimberly-Clark Corp. | 6,640 | 912,867 | ||
Procter & Gamble Co. (The)(1) | 37,840 | 3,203,913 | ||
| 4,667,434 | ||||
| Industrial Conglomerates — 3.3% | ||||
| 3M Co. | 4,658 | 815,709 | ||
Carlisle Cos., Inc.(1) | 13,649 | 1,442,426 | ||
Danaher Corp.(1) | 17,457 | 1,763,157 | ||
General Electric Co.(1) | 42,870 | 1,349,548 | ||
| 5,370,840 | ||||
| Insurance — 3.0% | ||||
| Aflac, Inc. | 12,018 | 867,219 | ||
Aspen Insurance Holdings Ltd.(1) | 25,596 | 1,187,143 | ||
Hanover Insurance Group, Inc. (The)(1) | 14,471 | 1,224,536 | ||
Prudential Financial, Inc.(1) | 21,498 | 1,533,667 | ||
| 4,812,565 | ||||
| Internet and Catalog Retail — 2.4% | ||||
Amazon.com, Inc.(2) | 5,472 | 3,915,873 | ||
| Internet Software and Services — 4.3% | ||||
Alphabet, Inc., Class A(1)(2) | 6,455 | 4,541,286 | ||
Facebook, Inc., Class A(1)(2) | 20,266 | 2,315,999 | ||
VeriSign, Inc.(2) | 985 | 85,163 | ||
| 6,942,448 | ||||
| IT Services — 2.8% | ||||
Cognizant Technology Solutions Corp., Class A(2) | 6,800 | 389,232 | ||
International Business Machines Corp.(1) | 16,120 | 2,446,694 | ||
PayPal Holdings, Inc.(1)(2) | 18,497 | 675,325 | ||
Teradata Corp.(2) | 3,399 | 85,213 | ||
Xerox Corp.(1) | 98,443 | 934,224 | ||
| 4,530,688 | ||||
| Leisure Products — 0.3% | ||||
| Brunswick Corp. | 2,392 | 108,406 | ||
| Hasbro, Inc. | 4,263 | 358,049 | ||
| 466,455 | ||||
| Life Sciences Tools and Services — 1.4% | ||||
Bruker Corp.(1) | 21,783 | 495,346 | ||
Thermo Fisher Scientific, Inc.(1) | 12,216 | 1,805,036 | ||
| 2,300,382 | ||||
| Machinery — 2.3% | ||||
| ITT, Inc. | 12,231 | 391,147 | ||
PACCAR, Inc.(1) | 21,640 | 1,122,467 | ||
Stanley Black & Decker, Inc.(1) | 14,462 | 1,608,464 | ||
| Timken Co. (The) | 21,113 | 647,324 | ||
| 3,769,402 | ||||
| Media — 4.8% | ||||
AMC Networks, Inc., Class A(1)(2) | 15,939 | 963,034 | ||
CBS Corp., Class B(1) | 25,141 | 1,368,676 | ||
| Cinemark Holdings, Inc. | 29,156 | 1,063,028 | ||
13
| Shares | Value | |||
Comcast Corp., Class A(1) | 2,326 | $ | 151,632 | |
MSG Networks, Inc., Class A(2) | 8,317 | 127,583 | ||
| Regal Entertainment Group, Class A | 35,552 | 783,566 | ||
Time Warner, Inc.(1) | 22,520 | 1,656,121 | ||
Viacom, Inc., Class B(1) | 15,191 | 629,971 | ||
Walt Disney Co. (The)(1) | 11,148 | 1,090,497 | ||
| 7,834,108 | ||||
| Metals and Mining — 3.7% | ||||
Carpenter Technology Corp.(1) | 39,399 | 1,297,409 | ||
Newmont Mining Corp.(1) | 47,336 | 1,851,784 | ||
Nucor Corp.(1) | 27,088 | 1,338,418 | ||
| Reliance Steel & Aluminum Co. | 5,314 | 408,647 | ||
Steel Dynamics, Inc.(1) | 44,778 | 1,097,061 | ||
| 5,993,319 | ||||
| Multiline Retail — 0.9% | ||||
Target Corp.(1) | 21,554 | 1,504,900 | ||
| Oil, Gas and Consumable Fuels — 4.1% | ||||
| Apache Corp. | 3,708 | 206,424 | ||
Chevron Corp.(1) | 16,694 | 1,750,032 | ||
Exxon Mobil Corp.(1) | 36,830 | 3,452,444 | ||
World Fuel Services Corp.(1) | 24,926 | 1,183,736 | ||
| 6,592,636 | ||||
| Personal Products — 0.4% | ||||
Herbalife Ltd.(1)(2) | 10,492 | 614,097 | ||
| Pharmaceuticals — 5.6% | ||||
Jazz Pharmaceuticals plc(2) | 2,460 | 347,622 | ||
Johnson & Johnson(1) | 24,940 | 3,025,222 | ||
Merck & Co., Inc.(1) | 47,941 | 2,761,881 | ||
Mylan NV(1)(2) | 23,603 | 1,020,594 | ||
Pfizer, Inc.(1) | 54,089 | 1,904,474 | ||
| 9,059,793 | ||||
| Real Estate Investment Trusts (REITs) — 3.7% | ||||
Host Hotels & Resorts, Inc.(1) | 77,549 | 1,257,069 | ||
| Iron Mountain, Inc. | 13,047 | 519,662 | ||
Lamar Advertising Co., Class A(1) | 22,278 | 1,477,031 | ||
| PS Business Parks, Inc. | 7,581 | 804,193 | ||
RLJ Lodging Trust(1) | 43,499 | 933,054 | ||
Sunstone Hotel Investors, Inc.(1) | 78,114 | 942,836 | ||
| 5,933,845 | ||||
| Real Estate Management and Development — 0.7% | ||||
Realogy Holdings Corp.(1)(2) | 36,376 | 1,055,632 | ||
| Semiconductors and Semiconductor Equipment — 4.6% | ||||
Analog Devices, Inc.(1) | 10,113 | 572,800 | ||
Applied Materials, Inc.(1) | 59,059 | 1,415,644 | ||
| Broadcom Ltd. | 2,007 | 311,888 | ||
Intel Corp.(1) | 85,100 | 2,791,280 | ||
| NVIDIA Corp. | 2,241 | 105,350 | ||
QUALCOMM, Inc.(1) | 35,061 | 1,878,218 | ||
Teradyne, Inc.(1) | 20,844 | 410,418 | ||
| 7,485,598 | ||||
14
| Shares | Value | |||
| Software — 7.1% | ||||
Activision Blizzard, Inc.(1) | 2,066 | $ | 81,876 | |
Adobe Systems, Inc.(2) | 10,119 | 969,299 | ||
Cadence Design Systems, Inc.(1)(2) | 48,065 | 1,167,979 | ||
Electronic Arts, Inc.(2) | 9,151 | 693,280 | ||
Mentor Graphics Corp.(1) | 21,300 | 452,838 | ||
Microsoft Corp.(1) | 74,705 | 3,822,655 | ||
Oracle Corp.(1) | 57,268 | 2,343,979 | ||
Synopsys, Inc.(1)(2) | 25,422 | 1,374,822 | ||
VMware, Inc., Class A(2) | 11,163 | 638,747 | ||
| 11,545,475 | ||||
| Specialty Retail — 2.7% | ||||
American Eagle Outfitters, Inc.(1) | 75,842 | 1,208,163 | ||
| Best Buy Co., Inc. | 31,752 | 971,611 | ||
Foot Locker, Inc.(1) | 20,595 | 1,129,842 | ||
Michaels Cos., Inc. (The)(2) | 18,434 | 524,263 | ||
| Williams-Sonoma, Inc. | 9,758 | 508,684 | ||
| 4,342,563 | ||||
| Technology Hardware, Storage and Peripherals — 3.9% | ||||
Apple, Inc.(1) | 43,499 | 4,158,504 | ||
EMC Corp.(1) | 68,390 | 1,858,156 | ||
| HP, Inc. | 13,091 | 164,292 | ||
| NetApp, Inc. | 4,230 | 104,016 | ||
| 6,284,968 | ||||
| Thrifts and Mortgage Finance — 0.9% | ||||
Essent Group Ltd.(1)(2) | 65,732 | 1,433,615 | ||
| Tobacco — 1.1% | ||||
Philip Morris International, Inc.(1) | 16,950 | 1,724,154 | ||
| Trading Companies and Distributors — 0.6% | ||||
HD Supply Holdings, Inc.(1)(2) | 25,505 | 888,084 | ||
| Wireless Telecommunication Services — 0.6% | ||||
T-Mobile US, Inc.(1)(2) | 21,654 | 936,969 | ||
TOTAL COMMON STOCKS (Cost $184,993,861) | 206,882,280 | |||
| TEMPORARY CASH INVESTMENTS — 1.1% | ||||
| Repurchase Agreement, Fixed Income Clearing Corp., (collateralized by various U.S. Treasury obligations, 3.00%, 11/15/45, valued at $1,820,769), at 0.20%, dated 6/30/16, due 7/1/16 (Delivery value $1,781,010) | 1,781,000 | |||
| State Street Institutional Liquid Reserves Fund, Premier Class | 1,343 | 1,343 | ||
TOTAL TEMPORARY CASH INVESTMENTS (Cost $1,782,343) | 1,782,343 | |||
TOTAL INVESTMENT SECURITIES BEFORE SECURITIES SOLD SHORT — 129.0% (Cost $186,776,204) | 208,664,623 | |||
| COMMON STOCKS SOLD SHORT — (29.0)% | ||||
| Aerospace and Defense — (0.4)% | ||||
| Hexcel Corp. | (17,069) | (710,753) | ||
| Airlines — (0.6)% | ||||
| Spirit Airlines, Inc. | (22,341) | (1,002,441) | ||
| Biotechnology — (0.6)% | ||||
| Bluebird Bio, Inc. | (6,548) | (283,463) | ||
| Neurocrine Biosciences, Inc. | (2,432) | (110,534) | ||
| Radius Health, Inc. | (6,185) | (227,299) | ||
15
| Shares | Value | |||
| Ultragenyx Pharmaceutical, Inc. | (7,155) | $ | (349,951 | ) |
| (971,247) | ||||
| Chemicals — (1.5)% | ||||
| CF Industries Holdings, Inc. | (41,028) | (988,775 | ) | |
| Olin Corp. | (56,813) | (1,411,235) | ||
| (2,400,010) | ||||
| Commercial Services and Supplies — (1.4)% | ||||
| Covanta Holding Corp. | (57,199) | (940,924) | ||
| Waste Connections, Inc. | (17,184) | (1,238,107) | ||
| (2,179,031) | ||||
| Communications Equipment — (0.1)% | ||||
| EchoStar Corp., Class A | (5,616) | (222,955) | ||
| Containers and Packaging — (0.4)% | ||||
| Ball Corp. | (9,451) | (683,213) | ||
| Distributors — (0.3)% | ||||
| LKQ Corp. | (17,692) | (560,836) | ||
| Diversified Financial Services — (0.7)% | ||||
| Leucadia National Corp. | (67,347) | (1,167,123) | ||
| Diversified Telecommunication Services — (0.7)% | ||||
| Frontier Communications Corp. | (157,020) | (775,679) | ||
| Zayo Group Holdings, Inc. | (11,960) | (334,043) | ||
| (1,109,722) | ||||
| Electric Utilities — (0.6)% | ||||
| PNM Resources, Inc. | (26,237) | (929,839) | ||
| Electronic Equipment, Instruments and Components — (0.4)% | ||||
| Anixter International, Inc. | (10,531) | (561,092) | ||
| Food Products — (1.0)% | ||||
| J&J Snack Foods Corp. | (8,498) | (1,013,556) | ||
| WhiteWave Foods Co. (The), Class A | (11,753) | (551,686) | ||
| (1,565,242) | ||||
| Health Care Providers and Services — (2.9)% | ||||
| Acadia Healthcare Co., Inc. | (19,386) | (1,073,985) | ||
| Brookdale Senior Living, Inc. | (56,903) | (878,582) | ||
| Centene Corp. | (4,571) | (326,232) | ||
| Envision Healthcare Holdings, Inc. | (8,955) | (227,188) | ||
| Henry Schein, Inc. | (2,341) | (413,889) | ||
| Patterson Cos., Inc. | (6,818) | (326,514) | ||
| Premier, Inc., Class A | (9,677) | (316,438) | ||
| Team Health Holdings, Inc. | (28,191) | (1,146,528) | ||
| (4,709,356) | ||||
| Hotels, Restaurants and Leisure — (0.9)% | ||||
| Chipotle Mexican Grill, Inc. | (745) | (300,056) | ||
| MGM Resorts International | (47,467) | (1,074,179) | ||
| Texas Roadhouse, Inc. | (2,032) | (92,659) | ||
| (1,466,894) | ||||
| Household Durables — (0.9)% | ||||
| CalAtlantic Group, Inc. | (26,347) | (967,198) | ||
| Lennar Corp., Class A | (9,786) | (451,135) | ||
| (1,418,333) | ||||
| Insurance — (1.4)% | ||||
| Assurant, Inc. | (13,622) | (1,175,715) | ||
16
| Shares | Value | |||
| MBIA, Inc. | (131,996) | $ | (901,533 | ) |
| ProAssurance Corp. | (2,784) | (149,083) | ||
| (2,226,331 | ) | |||
| Internet Software and Services — (0.1)% | ||||
| Yahoo!, Inc. | (5,072) | (190,504) | ||
| IT Services — (1.6)% | ||||
| DST Systems, Inc. | (942) | (109,677) | ||
| EPAM Systems, Inc. | (11,501) | (739,629) | ||
| Fidelity National Information Services, Inc. | (8,255) | (608,229) | ||
| MAXIMUS, Inc. | (19,555) | (1,082,760) | ||
| (2,540,295) | ||||
| Marine — (0.7)% | ||||
| Kirby Corp. | (18,228) | (1,137,245) | ||
| Media — (1.2)% | ||||
| Lions Gate Entertainment Corp. | (11,252) | (227,628) | ||
| Loral Space & Communications, Inc. | (20,714) | (730,582) | ||
| Tribune Media Co. | (23,321) | (913,717) | ||
| (1,871,927) | ||||
| Metals and Mining — (2.3)% | ||||
| Allegheny Technologies, Inc. | (20,024) | (255,306) | ||
| Compass Minerals International, Inc. | (13,054) | (968,476) | ||
| Hecla Mining Co. | (217,035) | (1,106,879) | ||
| Royal Gold, Inc. | (19,617) | (1,412,816) | ||
| (3,743,477) | ||||
| Multiline Retail — (0.7)% | ||||
| Dollar Tree, Inc. | (12,229) | (1,152,461) | ||
| Oil, Gas and Consumable Fuels — (0.2)% | ||||
| SemGroup Corp., Class A | (7,389) | (240,586) | ||
| Paper and Forest Products — (0.9)% | ||||
| Louisiana-Pacific Corp. | (81,890) | (1,420,791) | ||
| Pharmaceuticals — (0.8)% | ||||
| Medicines Co. (The) | (29,033) | (976,380) | ||
| Nektar Therapeutics | (26,495) | (377,024) | ||
| (1,353,404) | ||||
| Real Estate Investment Trusts (REITs) — (0.1)% | ||||
| Potlatch Corp. | (3,416) | (116,485) | ||
| Real Estate Management and Development — (0.6)% | ||||
| Howard Hughes Corp. (The) | (4,253) | (486,203) | ||
| Kennedy-Wilson Holdings, Inc. | (24,319) | (461,089) | ||
| (947,292) | ||||
| Road and Rail — (0.7)% | ||||
| Genesee & Wyoming, Inc., Class A | (20,195) | (1,190,495) | ||
| Semiconductors and Semiconductor Equipment — (0.5)% | ||||
| MACOM Technology Solutions Holdings, Inc. | (24,883) | (820,641) | ||
| Software — (0.5)% | ||||
| CDK Global, Inc. | (3,510) | (194,770) | ||
| SS&C Technologies Holdings, Inc. | (24,210) | (679,817) | ||
| (874,587) | ||||
| Specialty Retail — (1.9)% | ||||
| Cabela's, Inc. | (8,471) | (424,058) | ||
| CarMax, Inc. | (20,636) | (1,011,783) | ||
17
| Shares | Value | |||
| CST Brands, Inc. | (28,598) | $ | (1,232,002 | ) |
| Guess?, Inc. | (30,013) | (451,696) | ||
| (3,119,539 | ) | |||
| Textiles, Apparel and Luxury Goods — (0.4)% | ||||
| G-III Apparel Group Ltd. | (15,051) | (688,132) | ||
| Transportation Infrastructure — (0.7)% | ||||
| Macquarie Infrastructure Corp. | (15,240) | (1,128,522) | ||
| Water Utilities — (0.2)% | ||||
| Aqua America, Inc. | (6,959) | (248,158) | ||
| Wireless Telecommunication Services — (0.1)% | ||||
| United States Cellular Corp. | (4,232) | (166,191) | ||
TOTAL COMMON STOCKS SOLD SHORT (Proceeds $48,501,070) | (46,835,150) | |||
OTHER ASSETS AND LIABILITIES† | (25,378) | |||
| TOTAL NET ASSETS — 100.0% | $ | 161,804,095 | ||
| NOTES TO SCHEDULE OF INVESTMENTS | ||
| † | Category is less than 0.05% of total net assets. |
| (1) | Security, or a portion thereof, has been pledged at the custodian bank or with a broker for collateral requirements on securities sold short. At the period end, the aggregate value of securities pledged was $148,480,911. |
| (2) | Non-income producing. |
See Notes to Financial Statements.
18
| Statement of Assets and Liabilities |
| JUNE 30, 2016 | |||
| Assets | |||
| Investment securities, at value (cost of $186,776,204) | $ | 208,664,623 | |
| Deposits with broker for securities sold short | 19,630 | ||
| Receivable for capital shares sold | 623 | ||
| Dividends and interest receivable | 202,261 | ||
| 208,887,137 | |||
| Liabilities | |||
| Securities sold short, at value (proceeds of $48,501,070) | 46,835,150 | ||
| Payable for capital shares redeemed | 6,658 | ||
| Accrued management fees | 170,484 | ||
| Distribution and service fees payable | 461 | ||
| Dividend expense payable on securities sold short | 35,115 | ||
| Broker fees and charges payable on securities sold short | 33,991 | ||
| Accrued other expenses | 1,183 | ||
| 47,083,042 | |||
| Net Assets | $ | 161,804,095 | |
| Net Assets Consist of: | |||
| Capital (par value and paid-in surplus) | $ | 145,183,463 | |
| Accumulated net realized loss | (6,933,707 | ) | |
| Net unrealized appreciation | 23,554,339 | ||
| $ | 161,804,095 | ||
| Net Assets | Shares Outstanding | Net Asset Value Per Share | ||||
| Investor Class, $0.01 Par Value | $159,174,206 | 12,927,247 | $12.31 | |||
| Institutional Class, $0.01 Par Value | $1,381,224 | 112,235 | $12.31 | |||
| A Class, $0.01 Par Value | $882,466 | 71,762 | $12.30* | |||
| C Class, $0.01 Par Value | $309,684 | 25,621 | $12.09 | |||
| R Class, $0.01 Par Value | $56,515 | 4,610 | $12.26 | |||
*Maximum offering price $13.05 (net asset value divided by 0.9425).
See Notes to Financial Statements.
19
| Statement of Operations |
| YEAR ENDED JUNE 30, 2016 | |||
| Investment Income (Loss) | |||
| Income: | |||
| Dividends | $ | 4,351,631 | |
| Interest | 3,152 | ||
| 4,354,783 | |||
| Expenses: | |||
| Dividend expense on securities sold short | 557,797 | ||
| Broker fees and charges on securities sold short | 388,394 | ||
| Management fees | 2,079,336 | ||
| Distribution and service fees: | |||
| A Class | 1,882 | ||
| C Class | 4,972 | ||
| R Class | 137 | ||
| Directors' fees and expenses | 9,433 | ||
| Other expenses | 1,509 | ||
| 3,043,460 | |||
| Net investment income (loss) | 1,311,323 | ||
| Realized and Unrealized Gain (Loss) | |||
| Net realized gain (loss) on: | |||
| Investment transactions | (9,504,729 | ) | |
| Securities sold short transactions | 3,153,584 | ||
| Foreign currency transactions | 116 | ||
| (6,351,029 | ) | ||
| Change in net unrealized appreciation (depreciation) on: | |||
| Investments | (919,913 | ) | |
| Securities sold short | 2,596,481 | ||
| 1,676,568 | |||
| Net realized and unrealized gain (loss) | (4,674,461 | ) | |
| Net Increase (Decrease) in Net Assets Resulting from Operations | $ | (3,363,138 | ) |
See Notes to Financial Statements.
20
| Statement of Changes in Net Assets |
| YEARS ENDED JUNE 30, 2016 AND JUNE 30, 2015 | ||||||
| Increase (Decrease) in Net Assets | June 30, 2016 | June 30, 2015 | ||||
| Operations | ||||||
| Net investment income (loss) | $ | 1,311,323 | $ | 1,349,221 | ||
| Net realized gain (loss) | (6,351,029 | ) | 19,838,312 | |||
| Change in net unrealized appreciation (depreciation) | 1,676,568 | (13,642,770 | ) | |||
| Net increase (decrease) in net assets resulting from operations | (3,363,138 | ) | 7,544,763 | |||
| Distributions to Shareholders | ||||||
| From net investment income: | ||||||
| Investor Class | (1,287,596 | ) | (1,232,745 | ) | ||
| Institutional Class | (16,067 | ) | (26,296 | ) | ||
| A Class | (5,852 | ) | (4,050 | ) | ||
| C Class | (1,059 | ) | — | |||
| R Class | (302 | ) | (277 | ) | ||
| From net realized gains: | ||||||
| Investor Class | (13,258,512 | ) | (18,776,418 | ) | ||
| Institutional Class | (129,583 | ) | (402,248 | ) | ||
| A Class | (64,406 | ) | (95,019 | ) | ||
| C Class | (44,210 | ) | (78,672 | ) | ||
| R Class | (1,535 | ) | (22,123 | ) | ||
| Decrease in net assets from distributions | (14,809,122 | ) | (20,637,848 | ) | ||
| Capital Share Transactions | ||||||
| Net increase (decrease) in net assets from capital share transactions (Note 5) | 13,089,322 | 23,670,442 | ||||
| Net increase (decrease) in net assets | (5,082,938 | ) | 10,577,357 | |||
| Net Assets | ||||||
| Beginning of period | 166,887,033 | 156,309,676 | ||||
| End of period | $ | 161,804,095 | $ | 166,887,033 | ||
| Undistributed net investment income | — | $ | 57,387 | |||
See Notes to Financial Statements.
21
| Statement of Cash Flows |
| YEAR ENDED JUNE 30, 2016 | |||
| Cash Flows From (Used In) Operating Activities | |||
| Net increase (decrease) in net assets resulting from operations | $ | (3,363,138 | ) |
| Adjustments to reconcile net increase (decrease) in net assets resulting from operations to net cash from (used in) operating activities: | |||
| Purchases of investment securities | (162,754,793 | ) | |
| Proceeds from investments sold | 159,632,170 | ||
| Purchases to cover securities sold short | (59,477,902 | ) | |
| Proceeds from securities sold short | 62,878,220 | ||
| (Increase) decrease in short-term investments | (227,372 | ) | |
| (Increase) decrease in deposits with broker for securities sold short | 136,393 | ||
| (Increase) decrease in receivable for investments sold | 10,043,312 | ||
| (Increase) decrease in dividends and interest receivable | 19,752 | ||
| Increase (decrease) in payable for investments purchased | (9,861,119 | ) | |
| Increase (decrease) in accrued management fees | (10,636 | ) | |
| Increase (decrease) in distribution and service fees payable | (322 | ) | |
| Increase (decrease) in dividend expense payable on securities sold short | 10,769 | ||
| Increase (decrease) in broker fees and charges payable on securities sold short | 33,991 | ||
| Increase (decrease) in accrued other expenses | 1,183 | ||
| Change in net unrealized (appreciation) depreciation on investments | 919,913 | ||
| Net realized (gain) loss on investment transactions | 9,504,729 | ||
| Change in net unrealized (appreciation) depreciation on securities sold short | (2,596,481 | ) | |
| Net realized (gain) loss on securities sold short transactions | (3,153,584 | ) | |
| Net cash from (used in) operating activities | 1,735,085 | ||
| Cash Flows From (Used In) Financing Activities | |||
| Proceeds from shares sold | 6,493,852 | ||
| Payments for shares redeemed | (8,176,458 | ) | |
| Distributions paid, net of reinvestments | (52,479 | ) | |
| Net cash from (used in) financing activities | (1,735,085 | ) | |
| Net Increase (Decrease) In Cash | — | ||
| Cash at beginning of period | — | ||
| Cash at end of period | — | ||
| Supplemental disclosure of cash flow information: | |||
| Non cash financing activities not included herein consist of all reinvestment of distributions of $14,756,643. | |||
See Notes to Financial Statements.
22
| Notes to Financial Statements |
JUNE 30, 2016
1. Organization
American Century Quantitative Equity Funds, Inc. (the corporation) is registered under the Investment Company Act of 1940, as amended (the 1940 Act), as an open-end management investment company and is organized as a Maryland corporation. Core Equity Plus Fund (the fund) is one fund in a series issued by the corporation. The fund’s investment objective is to seek long-term capital growth.
The fund offers the Investor Class, the Institutional Class, the A Class, the C Class and the R Class. The A Class may incur an initial sales charge. The A Class and C Class may be subject to a contingent deferred sales charge. The share classes differ principally in their respective sales charges and distribution and shareholder servicing expenses and arrangements. The Institutional Class is made available to institutional shareholders or through financial intermediaries whose clients do not require the same level of shareholder and administrative services as shareholders of other classes. As a result, the Institutional Class is charged a lower unified management fee.
2. Significant Accounting Policies
The following is a summary of significant accounting policies consistently followed by the fund in preparation of its financial statements. The fund is an investment company and follows accounting and reporting guidance in accordance with accounting principles generally accepted in the United States of America. This may require management to make certain estimates and assumptions at the date of the financial statements. Actual results could differ from these estimates. Management evaluated the impact of events or transactions occurring through the date the financial statements were issued that would merit recognition or disclosure.
Investment Valuations — The fund determines the fair value of its investments and computes its net asset value per share at the close of regular trading (usually 4 p.m. Eastern time) on the New York Stock Exchange (NYSE) on each day the NYSE is open. The Board of Directors has adopted valuation policies and procedures to guide the investment advisor in the fund’s investment valuation process and to provide methodologies for the oversight of the fund’s pricing function.
Equity securities that are listed or traded on a domestic securities exchange are valued at the last reported sales price or at the official closing price as provided by the exchange. Equity securities traded on foreign securities exchanges are generally valued at the closing price of such securities on the exchange where primarily traded or at the close of the NYSE, if that is earlier. If no last sales price is reported, or if local convention or regulation so provides, the mean of the latest bid and asked prices may be used. Securities traded over-the-counter are valued at the mean of the latest bid and asked prices, the last sales price, or the official closing price. Equity securities initially expressed in local currencies are translated into U.S. dollars at the mean of the appropriate currency exchange rate at the close of the NYSE as provided by an independent pricing service.
Open-end management investment companies are valued at the reported net asset value per share. Repurchase agreements are valued at cost, which approximates fair value.
If the fund determines that the market price for an investment is not readily available or the valuation methods mentioned above do not reflect an investment’s fair value, such investment is valued as determined in good faith by the Board of Directors or its delegate, in accordance with policies and procedures adopted by the Board of Directors. In its determination of fair value, the fund may review several factors including, but not limited to, market information regarding the specific investment or comparable investments and correlation with other investment types, futures indices or general market indicators. Circumstances that may cause the fund to use these procedures to value an investment include, but are not limited to: an investment has been declared in default or is distressed; trading in a security has been suspended during the trading day or a security is not actively trading on its principal exchange; prices received from a regular pricing source are deemed unreliable; or there is a foreign market holiday and no trading occurred.
The fund monitors for significant events occurring after the close of an investment’s primary exchange but before the fund’s net asset value per share is determined. Significant events may include, but are not limited to: corporate announcements and transactions; governmental action and political unrest that could impact a
23
specific investment or an investment sector; or armed conflicts, natural disasters and similar events that could affect investments in a specific country or region. The fund also monitors for significant fluctuations between domestic and foreign markets, as evidenced by the U.S. market or such other indicators that the Board of Directors, or its delegate, deems appropriate. If significant fluctuations in foreign markets are identified, the fund may apply a model-derived factor to the closing price of equity securities traded on foreign securities exchanges. The factor is based on observable market data as provided by an independent pricing service.
Security Transactions — Security transactions are accounted for as of the trade date. Net realized gains and losses are determined on the identified cost basis, which is also used for federal income tax purposes.
Investment Income — Dividend income less foreign taxes withheld, if any, is recorded as of the ex-dividend date. Distributions received on securities that represent a return of capital or long-term capital gain are recorded as a reduction of cost of investments and/or as a realized gain. The fund may estimate the components of distributions received that may be considered nontaxable distributions or long-term capital gain distributions for income tax purposes. Interest income is recorded on the accrual basis and includes accretion of discounts and amortization of premiums.
Securities Sold Short — The fund enters into short sales, which is selling securities it does not own, as part of its normal investment activities. Upon selling a security short, the fund will segregate cash, cash equivalents or other appropriate liquid securities in at least an amount equal to the current market value of the securities sold short until the fund replaces the borrowed security. Interest earned on segregated cash for securities sold short is reflected as interest income. The fund is required to pay any dividends or interest due on securities sold short. Such dividends and interest are recorded as an expense. The fund may pay fees or charges to the broker on the assets borrowed for securities sold short. These fees are calculated daily based upon the value of each security sold short and a rate that is dependent on the availability of such security. Liabilities for securities sold short are valued daily and changes in value are recorded as change in net unrealized appreciation (depreciation) on securities sold short. The fund records realized gain (loss) on a security sold short when it is terminated by the fund and includes as a component of net realized gain (loss) on securities sold short transactions.
Foreign Currency Translations — All assets and liabilities initially expressed in foreign currencies are translated into U.S. dollars at prevailing exchange rates at period end. The fund may enter into spot foreign currency exchange contracts to facilitate transactions denominated in a foreign currency. Purchases and sales of investment securities, dividend and interest income, spot foreign currency exchange contracts, and expenses are translated at the rates of exchange prevailing on the respective dates of such transactions. Net realized and unrealized foreign currency exchange gains or losses related to investment securities are a component of net realized gain (loss) on investment transactions and change in net unrealized appreciation (depreciation) on investments, respectively. Net realized and unrealized foreign currency exchange gains or losses related to securities sold short are a component of net realized gain (loss) on securities sold short transactions and change in net unrealized appreciation (depreciation) on securities sold short, respectively.
Repurchase Agreements — The fund may enter into repurchase agreements with institutions that American Century Investment Management, Inc. (ACIM) (the investment advisor) has determined are creditworthy pursuant to criteria adopted by the Board of Directors. The fund requires that the collateral, represented by securities, received in a repurchase transaction be transferred to the custodian in a manner sufficient to enable the fund to obtain those securities in the event of a default under the repurchase agreement. ACIM monitors, on a daily basis, the securities transferred to ensure the value, including accrued interest, of the securities under each repurchase agreement is equal to or greater than amounts owed to the fund under each repurchase agreement.
Joint Trading Account — Pursuant to an Exemptive Order issued by the Securities and Exchange Commission, the fund, along with certain other funds in the American Century Investments family of funds, may transfer uninvested cash balances into a joint trading account. These balances are invested in one or more repurchase agreements that are collateralized by U.S. Treasury or Agency obligations.
Segregated Assets — In accordance with the 1940 Act, the fund segregates assets on its books and records to cover certain types of investments, including, but not limited to, futures contracts and short sales. ACIM monitors, on a daily basis, the securities segregated to ensure the fund designates a sufficient amount of liquid assets, marked-to-market daily. The fund may also receive assets or be required to pledge assets at the custodian bank or with a broker for margin requirements on futures contracts and short sales.
Income Tax Status — It is the fund’s policy to distribute substantially all net investment income and net realized gains to shareholders and to otherwise qualify as a regulated investment company under provisions
24
of the Internal Revenue Code. Accordingly, no provision has been made for income taxes. The fund files U.S. federal, state, local and non-U.S. tax returns as applicable. The fund's tax returns are subject to examination by the relevant taxing authority until expiration of the applicable statute of limitations, which is generally three years from the date of filing but can be longer in certain jurisdictions. At this time, management believes there are no uncertain tax positions which, based on their technical merit, would not be sustained upon examination and for which it is reasonably possible that the total amounts of unrecognized tax benefits will significantly change in the next twelve months.
Multiple Class — All shares of the fund represent an equal pro rata interest in the net assets of the class to which such shares belong, and have identical voting, dividend, liquidation and other rights and the same terms and conditions, except for class specific expenses and exclusive rights to vote on matters affecting only individual classes. Income, non-class specific expenses, and realized and unrealized capital gains and losses of the fund are allocated to each class of shares based on their relative net assets.
Distributions to Shareholders — Distributions from net investment income, if any, are generally declared and paid semiannually. Distributions from net realized gains, if any, are generally declared and paid annually.
Indemnifications — Under the corporation’s organizational documents, its officers and directors are indemnified against certain liabilities arising out of the performance of their duties to the fund. In addition, in the normal course of business, the fund enters into contracts that provide general indemnifications. The maximum exposure under these arrangements is unknown as this would involve future claims that may be made against a fund. The risk of material loss from such claims is considered by management to be remote.
Statement of Cash Flows — The Statement of Cash Flows has been prepared using the indirect method which requires net increase (decrease) in net assets resulting from operations to be adjusted to reconcile to net cash from (used in) operating activities. The beginning of period and end of period cash is the amount of domestic and foreign currency included in the fund's Statement of Assets and Liabilities and represents the cash on hand at the custodian bank and does not include any short-term investments or deposits with brokers for securities sold short.
3. Fees and Transactions with Related Parties
Certain officers and directors of the corporation are also officers and/or directors of American Century Companies, Inc. (ACC). The corporation’s investment advisor, ACIM, the corporation's distributor, American Century Investment Services, Inc. (ACIS), and the corporation’s transfer agent, American Century Services, LLC, are wholly owned, directly or indirectly, by ACC. Various funds issued by American Century Asset Allocation Portfolios, Inc. and American Century Strategic Asset Allocations, Inc. own, in aggregate, 93% of the shares of the fund. Related parties do not invest in the fund for the purpose of exercising management or control.
Management Fees — The corporation has entered into a management agreement with ACIM, under which ACIM provides the fund with investment advisory and management services in exchange for a single, unified management fee (the fee) per class. The agreement provides that all expenses of managing and operating the fund, except distribution and service fees, expenses on securities sold short, brokerage expenses, taxes, interest, fees and expenses of the independent directors (including legal counsel fees), and extraordinary expenses, will be paid by ACIM. The fee is computed and accrued daily based on each class’s daily net assets and paid monthly in arrears. The fee consists of (1) an Investment Category Fee based on the daily net assets of the fund and certain other accounts managed by the investment advisor that are in the same broad investment category as the fund and (2) a Complex Fee based on the assets of all the funds in the American Century Investments family of funds. The rates for the Investment Category Fee range from 0.9680% to 1.1500%. The rates for the Complex Fee range from 0.2500% to 0.3100% for the Investor Class, A Class, C Class and R Class. The rates for the Complex Fee range from 0.0500% to 0.1100% for the Institutional Class. The effective annual management fee for each class for the year ended June 30, 2016 was 1.29% for the Investor Class, A Class, C Class and R Class and 1.09% for the Institutional Class.
Distribution and Service Fees — The Board of Directors has adopted a separate Master Distribution and Individual Shareholder Services Plan for each of the A Class, C Class and R Class (collectively the plans), pursuant to Rule 12b-1 of the 1940 Act. The plans provide that the A Class will pay ACIS an annual distribution and service fee of 0.25%. The plans provide that the C Class will pay ACIS an annual distribution and service fee of 1.00%, of which 0.25% is paid for individual shareholder services and 0.75% is paid for distribution services. The plans provide that the R Class will pay ACIS an annual distribution and service fee of 0.50%. The fees are computed and accrued daily based on each class’s daily net assets and paid monthly in arrears.
25
The fees are used to pay financial intermediaries for distribution and individual shareholder services. Fees incurred under the plans during the year ended June 30, 2016 are detailed in the Statement of Operations.
Directors' Fees and Expenses — The Board of Directors is responsible for overseeing the investment advisor’s management and operations of the fund. The directors receive detailed information about the fund and its investment advisor regularly throughout the year, and meet at least quarterly with management of the investment advisor to review reports about fund operations. The fund’s officers do not receive compensation from the fund.
Interfund Transactions — The fund may enter into security transactions with other American Century Investments funds and other client accounts of the investment advisor, in accordance with the 1940 Act rules and procedures adopted by the Board of Directors. The rules and procedures require, among other things, that these transactions be effected at the independent current market price of the security. During the period, the interfund purchases and sales were $269,919 and $2,224,667, respectively.
4. Investment Transactions
Purchases and sales of investment securities and securities sold short, excluding short-term investments, for the year ended June 30, 2016 were $222,230,253 and $222,204,753, respectively.
5. Capital Share Transactions
Transactions in shares of the fund were as follows:
| Year ended June 30, 2016 | Year ended June 30, 2015 | |||||||||
| Shares | Amount | Shares | Amount | |||||||
| Investor Class/Shares Authorized | 100,000,000 | 100,000,000 | ||||||||
| Sold | 432,523 | $ | 5,333,145 | 1,406,752 | $ | 20,361,600 | ||||
| Issued in reinvestment of distributions | 1,175,741 | 14,493,629 | 1,445,917 | 19,965,882 | ||||||
| Redeemed | (486,853 | ) | (6,311,730 | ) | (874,930 | ) | (12,704,161 | ) | ||
| 1,121,411 | 13,515,044 | 1,977,739 | 27,623,321 | |||||||
| Institutional Class/Shares Authorized | 25,000,000 | 30,000,000 | ||||||||
| Sold | 50,649 | 663,297 | 3,136 | 48,379 | ||||||
| Issued in reinvestment of distributions | 11,796 | 145,650 | 30,989 | 428,544 | ||||||
| Redeemed | (84,009 | ) | (1,105,435 | ) | (296,499 | ) | (4,411,976 | ) | ||
| (21,564 | ) | (296,488 | ) | (262,374 | ) | (3,935,053 | ) | |||
| A Class/Shares Authorized | 15,000,000 | 15,000,000 | ||||||||
| Sold | 25,629 | 319,890 | 11,300 | 166,833 | ||||||
| Issued in reinvestment of distributions | 5,706 | 70,258 | 7,183 | 99,069 | ||||||
| Redeemed | (17,458 | ) | (216,881 | ) | (10,400 | ) | (149,820 | ) | ||
| 13,877 | 173,267 | 8,083 | 116,082 | |||||||
| C Class/Shares Authorized | 15,000,000 | 15,000,000 | ||||||||
| Sold | 9,466 | 126,047 | 10,465 | 147,523 | ||||||
| Issued in reinvestment of distributions | 3,734 | 45,269 | 5,781 | 78,672 | ||||||
| Redeemed | (41,357 | ) | (521,268 | ) | (13,629 | ) | (202,879 | ) | ||
| (28,157 | ) | (349,952 | ) | 2,617 | 23,316 | |||||
| R Class/Shares Authorized | 15,000,000 | 15,000,000 | ||||||||
| Sold | 3,980 | 48,203 | 1,175 | 16,782 | ||||||
| Issued in reinvestment of distributions | 150 | 1,837 | 1,630 | 22,400 | ||||||
| Redeemed | (203 | ) | (2,589 | ) | (13,801 | ) | (196,406 | ) | ||
| 3,927 | 47,451 | (10,996 | ) | (157,224 | ) | |||||
| Net increase (decrease) | 1,089,494 | $ | 13,089,322 | 1,715,069 | $ | 23,670,442 | ||||
26
6. Fair Value Measurements
The fund’s investments valuation process is based on several considerations and may use multiple inputs to determine the fair value of the investments held by the fund. In conformity with accounting principles generally accepted in the United States of America, the inputs used to determine a valuation are classified into three broad levels.
| • | Level 1 valuation inputs consist of unadjusted quoted prices in an active market for identical investments. |
| • | Level 2 valuation inputs consist of direct or indirect observable market data (including quoted prices for comparable investments, evaluations of subsequent market events, interest rates, prepayment speeds, credit risk, etc.). These inputs also consist of quoted prices for identical investments initially expressed in local currencies that are adjusted through translation into U.S. dollars. |
| • | Level 3 valuation inputs consist of unobservable data (including a fund’s own assumptions). |
The level classification is based on the lowest level input that is significant to the fair valuation measurement. The valuation inputs are not necessarily an indication of the risks associated with investing in these securities or other financial instruments. There were no significant transfers between levels during the period.
The following is a summary of the level classifications as of period end. The Schedule of Investments provides additional information on the fund’s portfolio holdings.
| Level 1 | Level 2 | Level 3 | ||||||
| Assets | ||||||||
| Investment Securities | ||||||||
| Common Stocks | $ | 206,882,280 | — | — | ||||
| Temporary Cash Investments | 1,343 | $ | 1,781,000 | — | ||||
| $ | 206,883,623 | $ | 1,781,000 | — | ||||
| Liabilities | ||||||||
| Securities Sold Short | ||||||||
| Common Stocks | $ | 46,835,150 | — | — | ||||
7. Risk Factors
The fund is subject to short sales risk. If the market price of a security increases after the fund borrows the security, the fund may suffer a loss when it replaces the borrowed security at the higher price. Any loss will be increased by the amount of compensation, interest or dividends, and transaction costs the fund must pay to the lender of the borrowed security.
The fund's investment strategy utilizes leverage, which can increase market exposure and subject the fund to greater risk and higher volatility.
If the fund is overweighted in a stock or sector, any negative development related to that stock or sector will have a greater impact on the fund than other funds that are not overweighted in that stock or sector.
The fund’s investment process may result in high portfolio turnover, which could mean high transaction costs, affecting both performance and capital gains tax liabilities to investors.
27
8. Federal Tax Information
The tax character of distributions paid during the years ended June 30, 2016 and June 30, 2015 were as follows:
| 2016 | 2015 | |||||
| Distributions Paid From | ||||||
| Ordinary income | $ | 1,310,764 | $ | 2,984,097 | ||
| Long-term capital gains | $ | 13,498,358 | $ | 17,653,751 | ||
The book-basis character of distributions made during the year from net investment income or net realized gains may differ from their ultimate characterization for federal income tax purposes. These differences reflect the differing character of certain income items and net realized gains and losses for financial statement and tax purposes, and may result in reclassification among certain capital accounts on the financial statements.
As of June 30, 2016, the federal tax cost of investments and the components of distributable earnings on a tax-basis were as follows:
| Federal tax cost of investments | $ | 186,786,794 | |
| Gross tax appreciation of investments | $ | 29,857,599 | |
| Gross tax depreciation of investments | (7,979,770 | ) | |
| Net tax appreciation (depreciation) of investments | 21,877,829 | ||
| Net tax appreciation (depreciation) on securities sold short | 1,651,145 | ||
| Net tax appreciation (depreciation) | $ | 23,528,974 | |
| Undistributed ordinary income | — | ||
| Accumulated short-term capital losses | $ | (6,908,342 | ) |
The difference between book-basis and tax-basis unrealized appreciation (depreciation) is attributable primarily to the tax deferral of losses on wash sales.
Accumulated capital losses represent net capital loss carryovers that may be used to offset future realized capital gains for federal income tax purposes. The capital loss carryovers may be carried forward for an unlimited period. Future capital loss carryover utilization in any given year may be subject to Internal Revenue Code limitations.
28
| Financial Highlights |
| For a Share Outstanding Throughout the Years Ended June 30 (except as noted) | ||||||||||||||||
| Per-Share Data | Ratios and Supplemental Data | |||||||||||||||
| Income From Investment Operations: | Distributions From: | Ratio to Average Net Assets of: | ||||||||||||||
Net Asset Value, Beginning of Period | Net Investment Income (Loss)(1) | Net Realized and Unrealized Gain (Loss) | Total From Investment Operations | Net Investment Income | Net Realized Gains | Total Distributions | Net Asset Value, End of Period | Total Return(2) | Operating Expenses | Operating Expenses (excluding expenses on securities sold short) | Net Investment Income (Loss) | Portfolio Turnover Rate | Net Assets, End of Period (in thousands) | |||
| Investor Class | ||||||||||||||||
| 2016 | $13.85 | 0.10 | (0.40) | (0.30) | (0.10) | (1.14) | (1.24) | $12.31 | (2.13)% | 1.89% | 1.30% | 0.82% | 107% | $159,174 | ||
| 2015 | $15.12 | 0.12 | 0.59 | 0.71 | (0.11) | (1.87) | (1.98) | $13.85 | 4.84% | 1.73% | 1.30% | 0.82% | 106% | $163,487 | ||
| 2014 | $12.84 | 0.10 | 3.25 | 3.35 | (0.11) | (0.96) | (1.07) | $15.12 | 26.86% | 1.77% | 1.30% | 0.69% | 104% | $148,620 | ||
| 2013 | $10.79 | 0.14 | 2.23 | 2.37 | (0.14) | (0.18) | (0.32) | $12.84 | 22.33% | 1.87% | 1.30% | 1.15% | 107% | $114,444 | ||
2012(3) | $10.00 | 0.03 | 0.76 | 0.79 | —(4) | — | —(4) | $10.79 | 7.95% | 2.06%(5) | 1.31%(5) | 0.39%(5) | 105% | $84,116 | ||
| Institutional Class | ||||||||||||||||
| 2016 | $13.85 | 0.13 | (0.39) | (0.26) | (0.14) | (1.14) | (1.28) | $12.31 | (1.91)% | 1.69% | 1.10% | 1.02% | 107% | $1,381 | ||
| 2015 | $15.13 | 0.15 | 0.57 | 0.72 | (0.13) | (1.87) | (2.00) | $13.85 | 5.04% | 1.53% | 1.10% | 1.02% | 106% | $1,854 | ||
| 2014 | $12.84 | 0.13 | 3.26 | 3.39 | (0.14) | (0.96) | (1.10) | $15.13 | 27.19% | 1.57% | 1.10% | 0.89% | 104% | $5,993 | ||
| 2013 | $10.80 | 0.15 | 2.25 | 2.40 | (0.18) | (0.18) | (0.36) | $12.84 | 22.45% | 1.67% | 1.10% | 1.35% | 107% | $4,427 | ||
2012(3) | $10.00 | 0.06 | 0.75 | 0.81 | (0.01) | — | (0.01) | $10.80 | 8.19% | 1.86%(5) | 1.11%(5) | 0.59%(5) | 105% | $534 | ||
| A Class | ||||||||||||||||
| 2016 | $13.84 | 0.07 | (0.39) | (0.32) | (0.08) | (1.14) | (1.22) | $12.30 | (2.35)% | 2.14% | 1.55% | 0.57% | 107% | $882 | ||
| 2015 | $15.12 | 0.08 | 0.58 | 0.66 | (0.07) | (1.87) | (1.94) | $13.84 | 4.59% | 1.98% | 1.55% | 0.57% | 106% | $801 | ||
| 2014 | $12.84 | 0.06 | 3.25 | 3.31 | (0.07) | (0.96) | (1.03) | $15.12 | 26.55% | 2.02% | 1.55% | 0.44% | 104% | $753 | ||
| 2013 | $10.78 | 0.10 | 2.24 | 2.34 | (0.10) | (0.18) | (0.28) | $12.84 | 22.01% | 2.12% | 1.55% | 0.90% | 107% | $515 | ||
2012(3) | $10.00 | 0.04 | 0.74 | 0.78 | —(4) | — | —(4) | $10.78 | 7.80% | 2.31%(5) | 1.56%(5) | 0.14%(5) | 105% | $231 | ||
| For a Share Outstanding Throughout the Years Ended June 30 (except as noted) | ||||||||||||||||
| Per-Share Data | Ratios and Supplemental Data | |||||||||||||||
| Income From Investment Operations: | Distributions From: | Ratio to Average Net Assets of: | ||||||||||||||
Net Asset Value, Beginning of Period | Net Investment Income (Loss)(1) | Net Realized and Unrealized Gain (Loss) | Total From Investment Operations | Net Investment Income | Net Realized Gains | Total Distributions | Net Asset Value, End of Period | Total Return(2) | Operating Expenses | Operating Expenses (excluding expenses on securities sold short) | Net Investment Income (Loss) | Portfolio Turnover Rate | Net Assets, End of Period (in thousands) | |||
| C Class | ||||||||||||||||
| 2016 | $13.69 | (0.02) | (0.40) | (0.42) | (0.04) | (1.14) | (1.18) | $12.09 | (3.09)% | 2.89% | 2.30% | (0.18)% | 107% | $310 | ||
| 2015 | $15.01 | (0.03) | 0.58 | 0.55 | — | (1.87) | (1.87) | $13.69 | 3.77% | 2.73% | 2.30% | (0.18)% | 106% | $736 | ||
| 2014 | $12.78 | (0.05) | 3.24 | 3.19 | — | (0.96) | (0.96) | $15.01 | 25.66% | 2.77% | 2.30% | (0.31)% | 104% | $768 | ||
| 2013 | $10.73 | 0.01 | 2.22 | 2.23 | — | (0.18) | (0.18) | $12.78 | 20.99% | 2.87% | 2.30% | 0.15% | 107% | $449 | ||
2012(3) | $10.00 | —(4) | 0.73 | 0.73 | — | — | — | $10.73 | 7.30% | 3.06%(5) | 2.31%(5) | (0.61)%(5) | 105% | $112 | ||
| R Class | ||||||||||||||||
| 2016 | $13.83 | 0.03 | (0.39) | (0.36) | (0.07) | (1.14) | (1.21) | $12.26 | (2.62)% | 2.39% | 1.80% | 0.32% | 107% | $57 | ||
| 2015 | $15.11 | 0.04 | 0.59 | 0.63 | (0.04) | (1.87) | (1.91) | $13.83 | 4.28% | 2.23% | 1.80% | 0.32% | 106% | $9 | ||
| 2014 | $12.83 | 0.03 | 3.25 | 3.28 | (0.04) | (0.96) | (1.00) | $15.11 | 26.27% | 2.27% | 1.80% | 0.19% | 104% | $176 | ||
| 2013 | $10.76 | 0.08 | 2.23 | 2.31 | (0.06) | (0.18) | (0.24) | $12.83 | 21.70% | 2.37% | 1.80% | 0.65% | 107% | $137 | ||
2012(3) | $10.00 | 0.03 | 0.73 | 0.76 | — | — | — | $10.76 | 7.60% | 2.56%(5) | 1.81%(5) | (0.11)%(5) | 105% | $112 | ||
| Notes to Financial Highlights |
| (1) | Computed using average shares outstanding throughout the period. |
| (2) | Total returns are calculated based on the net asset value of the last business day and do not reflect applicable sales charges, if any. Total returns for periods less than one year are not annualized. |
| (3) | October 31, 2011 (fund inception) through June 30, 2012. |
| (4) | Per-share amount was less than $0.005. |
| (5) | Annualized. |
See Notes to Financial Statements.
| Report of Independent Registered Public Accounting Firm |
To the Directors of the American Century Quantitative Equity Funds, Inc. and Shareholders of the Core Equity Plus Fund:
In our opinion, the accompanying statement of assets and liabilities, including the schedule of investments, and the related statements of operations, of changes in net assets and of cash flows and the financial highlights present fairly, in all material respects, the financial position of the Core Equity Plus Fund (one of the sixteen funds comprising the American Century Quantitative Equity Funds, Inc., hereafter referred to as the “Fund”) at June 30, 2016, the results of its operations and its cash flows for the year then ended, the changes in its net assets for each of the two years in the period then ended and the financial highlights for each of the periods presented, in conformity with accounting principles generally accepted in the United States of America. These financial statements and financial highlights (hereafter referred to as "financial statements") are the responsibility of the Fund's management. Our responsibility is to express an opinion on these financial statements based on our audits. We conducted our audits of these financial statements in accordance with the standards of the Public Company Accounting Oversight Board (United States). Those standards require that we plan and perform the audit to obtain reasonable assurance about whether the financial statements are free of material misstatement. An audit includes examining, on a test basis, evidence supporting the amounts and disclosures in the financial statements, assessing the accounting principles used and significant estimates made by management, and evaluating the overall financial statement presentation. We believe that our audits, which included confirmation of securities at June 30, 2016 by correspondence with the custodian and brokers, provide a reasonable basis for our opinion.
PricewaterhouseCoopers LLP
Kansas City, Missouri
August 17, 2016
31
| Management |
Board of Directors
The individuals listed below serve as directors of the funds. Each director will continue to serve in this capacity until death, retirement, resignation or removal from office. The board has adopted a mandatory retirement age for directors who are not “interested persons,” as that term is defined in the Investment Company Act (independent directors). Independent directors shall retire on December 31 of the year in which they reach their 75th birthday; provided, however, that on or after January 1, 2022, independent directors shall retire on December 31 of the year in which they reach their 76th birthday.
Mr. Thomas is an “interested person” because he currently serves as President and Chief Executive Officer of American Century Companies, Inc. (ACC), the parent company of American Century Investment Management, Inc. (ACIM or the advisor). The other directors (more than three-fourths of the total number) are independent. They are not employees, directors or officers of, and have no financial interest in, ACC or any of its wholly owned, direct or indirect, subsidiaries, including ACIM, American Century Investment Services, Inc. (ACIS) and American Century Services, LLC (ACS), and they do not have any other affiliations, positions or relationships that would cause them to be considered “interested persons” under the Investment Company Act. The directors serve in this capacity for eight (in the case of Mr. Thomas, 15) registered investment companies in the American Century Investments family of funds.
The following table presents additional information about the directors. The mailing address for each director other than Mr. Thomas is 1665 Charleston Road, Mountain View, California 94043. The mailing address for Mr. Thomas is 4500 Main Street, Kansas City, Missouri 64111.
Name (Year of Birth) | Position(s) Held with Funds | Length of Time Served | Principal Occupation(s) During Past 5 Years | Number of American Century Portfolios Overseen by Director | Other Directorships Held During Past 5 Years |
| Independent Directors | |||||
| Tanya S. Beder (1955) | Director | Since 2011 | Chairman and CEO, SBCC Group Inc. (independent advisory services) (2006 to present) | 45 | CYS Investments, Inc. (NYSE mortgage arbitrage REIT) |
| Jeremy I. Bulow (1954) | Director | Since 2011 | Professor of Economics, Stanford University, Graduate School of Business (1979 to present) | 45 | None |
| Anne Casscells (1958) | Director | Since 2016 | Co-Chief Executive Officer and Chief Investment Officer, Aetos Alternatives Management (investment advisory firm) (2001 to present); Lecturer in Accounting, Stanford University, Graduate School of Business (2009 to present) | 45 | None |
32
Name (Year of Birth) | Position(s) Held with Funds | Length of Time Served | Principal Occupation(s) During Past 5 Years | Number of American Century Portfolios Overseen by Director | Other Directorships Held During Past 5 Years |
| Independent Directors | |||||
| Ronald J. Gilson (1946) | Director and Chairman of the Board | Since 1995 (Chairman since 2005) | Charles J. Meyers Professor of Law and Business, Emeritus, Stanford Law School (1979 to present); Marc and Eva Stern Professor of Law and Business, Columbia University School of Law (1992 to present) | 45 | None |
| Frederick L. A. Grauer (1946) | Director | Since 2008 | Senior Advisor, iShares by BlackRock, Inc. (investment management firm) (2010 to 2011, 2013 to present); Senior Advisor, Course Hero (an educational technology company) (2015 to present) | 45 | None |
| Jonathan D. Levin (1972) | Director | Since 2016 | Holbrook Working Professor of Price Theory, Stanford University, (2000 to present); Chair, Department of Economics, Stanford University (2011 to 2014) | 45 | None |
| Peter F. Pervere (1947) | Director | Since 2007 | Retired | 45 | None |
| John B. Shoven (1947) | Director | Since 2002 | Charles R. Schwab Professor of Economics, Stanford University (1973 to present) | 45 | Cadence Design Systems; Exponent; Financial Engines |
| Interested Director | |||||
| Jonathan S. Thomas (1963) | Director and President | Since 2007 | President and Chief Executive Officer, ACC (March 2007 to present). Also serves as Chief Executive Officer, ACS; Executive Vice President, ACIM; Director, ACC, ACIM and other ACC subsidiaries | 128 | BioMed Valley Discoveries, Inc. |
The Statement of Additional Information has additional information about the fund's directors and is available without charge, upon request, by calling 1-800-345-2021.
33
Officers
The following table presents certain information about the executive officers of the funds. Each officer serves as an officer for each of the 15 investment companies in the American Century family of funds, unless otherwise noted. No officer is compensated for his or her service as an officer of the funds. The listed officers are interested persons of the funds and are appointed or re-appointed on an annual basis. The mailing address for each of the officers listed below is 4500 Main Street, Kansas City, Missouri 64111.
Name (Year of Birth) | Offices with the Funds | Principal Occupation(s) During the Past Five Years |
| Jonathan S. Thomas (1963) | Director and President since 2007 | President and Chief Executive Officer, ACC (March 2007 to present). Also serves as Chief Executive Officer, ACS; Executive Vice President, ACIM; Director, ACC, ACIM and other ACC subsidiaries |
| Amy D. Shelton (1964) | Chief Compliance Officer and Vice President since 2014 | Chief Compliance Officer, American Century funds, (March 2014 to present); Chief Compliance Officer, ACIM (February 2014 to present); Chief Compliance Officer, ACIS (October 2009 to present); Vice President, Client Interactions and Marketing, ACIS (February 2013 to January 2014); Director, Client Interactions and Marketing, ACIS (June 2007 to January 2013). Also serves as Vice President, ACIS |
| Charles A. Etherington (1957) | General Counsel since 2007 and Senior Vice President since 2006 | Attorney, ACC (February 1994 to present); Vice President, ACC (November 2005 to present); General Counsel, ACC (March 2007 to present). Also serves as General Counsel, ACIM, ACS, ACIS and other ACC subsidiaries; and Senior Vice President, ACIM and ACS |
| C. Jean Wade (1964) | Vice President, Treasurer and Chief Financial Officer since 2012 | Vice President, ACS (February 2000 to present) |
| Robert J. Leach (1966) | Vice President since 2006 and Assistant Treasurer since 2012 | Vice President, ACS (February 2000 to present) |
| David H. Reinmiller (1963) | Vice President since 2001 | Attorney, ACC (January 1994 to present); Associate General Counsel, ACC (January 2001 to present). Also serves as Vice President, ACIM and ACS |
| Ward D. Stauffer (1960) | Secretary since 2005 | Attorney, ACC (June 2003 to present) |
34
| Approval of Management Agreement |
At a meeting held on June 14, 2016, the Fund’s Board of Directors (the "Board") unanimously approved the renewal of the management agreement pursuant to which American Century Investment Management, Inc. (the “Advisor”) acts as the investment advisor for the Fund. Under Section 15(c) of the Investment Company Act, contracts for investment advisory services are required to be reviewed, evaluated, and approved by a majority of a fund’s directors/trustees, including a majority of the independent Directors, each year. The Board regards this annual evaluation and renewal as one of its most important responsibilities.
The independent Directors have memorialized a statement regarding the relationship between their ongoing obligations to oversee and evaluate the performance of the Advisor and their annual consideration of renewal of the management agreement. In that statement, the independent Directors noted that their assessment of the Advisor’s performance is an ongoing process that takes place over the entire year and is informed by all of the extensive information that the Board and its committees receive and consider over time. This information, together with the additional materials provided specifically in connection with the review, are central to the Board’s assessment of the Advisor’s performance and its determination whether to renew the Fund’s management agreement.
Prior to its consideration of the renewal of the management agreement, the Board requested and reviewed extensive data and analysis relating to the proposed renewal. This information and analysis was compiled by the Advisor and certain independent providers of evaluation data concerning the Fund and the services provided to the Fund by the Advisor.
In connection with its consideration of the renewal of the management agreement, the Board’s review and evaluation of the services provided by the Advisor included, but was not limited to, the following:
| • | the nature, extent, and quality of investment management, shareholder services, and other services provided by the Advisor to the Fund; |
| • | the wide range of other programs and services the Advisor provides to the Fund and its shareholders on a routine and non-routine basis; |
| • | the investment performance of the Fund, including data comparing the Fund’s performance to appropriate benchmarks and/or a peer group of other mutual funds with similar investment objectives and strategies; |
| • | the cost of owning the Fund compared to the cost of owning similar funds; |
| • | the Advisor’s compliance policies, procedures, and regulatory experience; |
| • | financial data showing the cost of services provided to the Fund, the profitability of the Fund to the Advisor, and the overall profitability of the Advisor; |
| • | possible economies of scale associated with the Advisor’s management of the Fund and other accounts under its management; |
| • | data comparing services provided and charges to other investment management clients of the Advisor; |
| • | acquired fund fees and expenses; |
| • | payments by the Fund and the Advisor to financial intermediaries whose clients are investors in the Fund; and |
| • | any collateral benefits derived by the Advisor from the management of the Fund. |
In keeping with its practice, the Board held two in-person meetings to review and discuss the information provided in response to their request. The independent Directors also had the benefit of the advice of their independent counsel throughout the process.
35
Factors Considered
The Directors considered all of the information provided by the Advisor, the independent data providers, and the independent Directors’ independent counsel in connection with the approval. They determined that the information was sufficient for them to evaluate the management agreement for the Fund. In connection with their review, the Directors did not identify any single factor as being all-important or controlling and each Director may have attributed different levels of importance to different factors. In deciding to renew the management agreement, the Board based its decision on a number of factors, including the following:
Nature, Extent and Quality of Services - Generally. Under the management agreement, the Advisor is responsible for providing or arranging for all services necessary for the operation of the Fund. The Board noted that under the management agreement, the Advisor provides or arranges at its own expense a wide variety of services including:
| • | constructing and designing the Fund |
| • | portfolio research and security selection |
| • | initial capitalization/funding |
| • | securities trading |
| • | Fund administration |
| • | custody of Fund assets |
| • | daily valuation of the Fund’s portfolio |
| • | shareholder servicing and transfer agency, including shareholder confirmations, recordkeeping, and communications |
| • | legal services (except the independent Directors’ counsel) |
| • | regulatory and portfolio compliance |
| • | financial reporting |
| • | marketing and distribution (except amounts paid by the Fund under Rule 12b-1 plans) |
The Board noted that many of these services have expanded over time in terms of both quantity and complexity in response to shareholder demands, competition in the industry, changing distribution channels, and the changing regulatory environment.
Investment Management, Shareholder, and Other Services. The nature of the investment management services provided to the Fund is quite complex and allows Fund shareholders access to professional money management, instant diversification of their investments within an asset class, the opportunity to easily diversify among asset classes by investing in or exchanging among various American Century Investments funds, and liquidity. In evaluating investment performance, the Board expects the Advisor to manage the Fund in accordance with its investment objectives and approved strategies. Further, the Directors recognize that the Advisor has an obligation to seek the best execution of fund trades. In providing these services, the Advisor utilizes teams of investment professionals (portfolio managers, analysts, research assistants, and securities traders) who require extensive information technology, research, training, compliance, and other systems to conduct their business. The Board, directly and through its Portfolio Committee, regularly reviews investment performance information for the Fund, together with comparative information for appropriate benchmarks and/or peer groups of similarly-managed funds, over different time horizons. The Directors also review detailed performance information during the management agreement approval process. If performance concerns are identified, the Fund receives special reviews until performance improves, during which the Board discusses with the Advisor the reasons for such results (e.g., market conditions, security selection) and any efforts being undertaken to improve performance. The Fund’s performance was above its benchmark for the three-year period and below its benchmark for the one-year period reviewed by the Board. The Board discussed the Fund’s performance with the Advisor and was satisfied with the efforts being undertaken by the Advisor. The Board found the investment management services provided by the Advisor to the Fund to be satisfactory and consistent with the management agreement.
36
Under the management agreement, the Advisor provides the Fund with a comprehensive package of transfer agency, shareholder, and other services. The Board, directly and through various committees of the Board, regularly reviews reports and evaluations of such services at its regular meetings. These reports include, but are not limited to, information regarding the operational efficiency and accuracy of the shareholder and transfer agency services provided, staffing levels, shareholder satisfaction (as measured by external as well as internal sources), technology support, new products and services offered to Fund shareholders, securities trading activities, portfolio valuation services, auditing services, and legal and operational compliance activities. Certain aspects of shareholder and transfer agency service level efficiency and the quality of securities trading activities are measured by independent third party providers and are presented in comparison to other fund groups not managed by the Advisor.
The Board found the services provided by the Advisor to the Fund under the management agreement to be competitive and of high quality.
Costs of Services and Profitability. The Advisor provides detailed information concerning its cost of providing various services to the Fund, its profitability in managing the Fund, its overall profitability, and its financial condition. The Directors have reviewed with the Advisor the methodology used to prepare this financial information. This information is considered in evaluating the Advisor’s financial condition, its ability to continue to provide services under the management agreement, and the reasonableness of the current management fee. The Board concluded that the Advisor’s profits were reasonable in light of the services provided to the Fund.
Economies of Scale. The Board also reviewed information provided by the Advisor regarding the possible existence of economies of scale in connection with the management of the Fund. The Board concluded that economies of scale are difficult to measure and predict with precision, especially on a fund-by-fund basis. The Board concluded that the Advisor is appropriately sharing economies of scale through its competitive fee structure, offering competitive fees from fund inception, and through reinvestment in its business to provide shareholders enhanced and expanded services.
Comparison to Other Funds’ Fees. The management agreement provides that the Fund pays the Advisor a single, all-inclusive (or unified) management fee for providing all services necessary for the management and operation of the Fund, other than brokerage expenses, expenses attributable to short sales, taxes, interest, extraordinary expenses, the fees and expenses of the Fund’s independent Directors (including their independent legal counsel), and expenses incurred in connection with the provision of shareholder services and distribution services under a plan adopted pursuant to Rule 12b-1 under the 1940 Act. Under the unified fee structure, the Advisor is responsible for providing all investment advisory, custody, audit, administrative, compliance, recordkeeping, marketing, and shareholder services, or arranging and supervising third parties to provide such services. By contrast, most other funds are charged a variety of fees, including an investment advisory fee, a transfer agency fee, an administrative fee, distribution charges, and other expenses. Other than their investment advisory fees and any applicable Rule 12b-1 fees, all other components of the total fees charged by these other funds may be increased without shareholder approval. The Board believes the unified fee structure is a benefit to Fund shareholders because it clearly discloses to shareholders the cost of owning Fund shares, and, since the unified fee cannot be increased without a vote of Fund shareholders, it shifts to the Advisor the risk of increased costs of operating the Fund and provides a direct incentive to minimize administrative inefficiencies. Part of the Board’s analysis of fee levels involves reviewing certain evaluative data compiled by an independent provider and comparing the Fund’s unified fee to the total expense ratio of peer funds. The unified fee charged to shareholders of the Fund was below the median of the total expense ratios of the Fund’s peer group. The Board concluded that the management fee paid by the Fund to the Advisor under the management agreement is reasonable in light of the services provided to the Fund.
37
Comparison to Fees and Services Provided to Other Clients of the Advisor. The Board also requested and received information from the Advisor concerning the nature of the services, fees, costs, and profitability of its advisory services to advisory clients other than the Fund. They observed that these varying types of client accounts require different services and involve different regulatory and entrepreneurial risks than the management of the Fund. The Board analyzed this information and concluded that the fees charged and services provided to the Fund were reasonable by comparison.
Payments to Intermediaries. The Directors also requested and received a description of payments made to intermediaries by the Fund and the Advisor. These payments include various payments made by the Fund or the Advisor to different types of intermediaries and recordkeepers for distribution and service activities provided for the Fund.
Collateral or “Fall-Out” Benefits Derived by the Advisor. The Board considered the existence of collateral benefits the Advisor may receive as a result of its relationship with the Fund. The Board noted that the Advisor’s primary business is managing mutual funds and it generally does not use fund or shareholder information to generate profits in other lines of business, and therefore does not derive any significant collateral benefits from them. The Board noted that the Advisor receives proprietary research from broker-dealers that execute fund portfolio transactions. The Board also determined that the Advisor is able to provide investment management services to certain clients other than the Fund, at least in part, due to its existing infrastructure built to serve the fund complex. The Board concluded, however, that the assets of those other clients are not material to the analysis and, where applicable, may be included with the assets of the Fund to determine breakpoints in the management fee schedule.
Existing Relationship. The Board also considered whether there was any reason for not continuing the existing arrangement with the Advisor. In this regard, the Board was mindful of the potential disruptions of the Fund’s operations and various risks, uncertainties, and other effects that could occur as a result of a decision not to continue such relationship. In particular, the Board recognized that most shareholders have invested in the Fund on the strength of the Advisor’s industry standing and reputation and in the expectation that the Advisor will have a continuing role in providing advisory services to the Fund.
Conclusion of the Directors. As a result of this process, the Board, including all of the independent Directors and assisted by the advice of independent legal counsel, taking into account all of the factors discussed above and the information provided by the Advisor and others in connection with its review and throughout the year, concluded that the management agreement between the Fund and the Advisor is fair and reasonable in light of the services provided and should be renewed.
38
| Proxy Voting Results |
A special meeting of shareholders was held on June 13, 2016, to vote on the following proposal. The proposal received the required number of votes and was adopted. A summary of voting results is listed below.
To elect four directors to the Board of Directors of American Century Quantitative Equity Funds, Inc.:
| Affirmative | Withhold | ||||||
| Tanya S. Beder | $ | 8,473,153,264 | $ | 121,459,590 | |||
| Jeremy I. Bulow | $ | 8,469,793,581 | $ | 124,819,273 | |||
| Anne Casscells | $ | 8,465,895,232 | $ | 128,717,622 | |||
| Jonathan D. Levin | $ | 8,468,929,867 | $ | 125,682,987 | |||
The other directors whose term of office continued after the meeting include Jonathan S. Thomas, Ronald J. Gilson, Frederick L. A. Grauer, Peter F. Pervere and John B. Shoven.
39
| Additional Information |
Retirement Account Information
As required by law, distributions you receive from certain IRAs are subject to federal income tax withholding, unless you elect not to have withholding apply. Tax will be withheld on the total amount withdrawn even though you may be receiving amounts that are not subject to withholding, such as nondeductible contributions. In such case, excess amounts of withholding could occur. You may adjust your withholding election so that a greater or lesser amount will be withheld.
If you don’t want us to withhold on this amount, you must notify us to not withhold the federal income tax. You may notify us in writing or in certain situations by telephone or through other electronic means. For systematic withdrawals, your withholding election will remain in effect until revoked or changed by filing a new election. You have the right to revoke your election at any time.
Remember, even if you elect not to have income tax withheld, you are liable for paying income tax on the taxable portion of your withdrawal. If you elect not to have income tax withheld or you don’t have enough income tax withheld, you may be responsible for payment of estimated tax. You may incur penalties under the estimated tax rules if your withholding and estimated tax payments are not sufficient. You can reduce or defer the income tax on a distribution by directly or indirectly rolling such distribution over to another IRA or eligible plan. You should consult your tax advisor for additional information.
State tax will be withheld if, at the time of your distribution, your address is within one of the mandatory withholding states and you have federal income tax withheld (or as otherwise required by state law). State taxes will be withheld from your distribution in accordance with the respective state rules.
Distributions you receive from 403(b), 457 and qualified plans are subject to special tax and withholding rules. Your plan administrator or plan sponsor is required to provide you with a special tax notice explaining those rules at the time you request a distribution. If applicable, federal and/or state taxes may be withheld from your distribution amount.
Proxy Voting Policies
Descriptions of the principles and policies that the fund's investment advisor uses in exercising the voting rights associated with the securities purchased and/or held by the fund are available without charge, upon request, by calling 1-800-345-2021 or visiting the "About Us" page of American Century Investments’ website at americancentury.com. A description of the policies is also available on the Securities and Exchange Commission’s website at sec.gov. Information regarding how the investment advisor voted proxies relating to portfolio securities during the most recent 12-month period ended June 30 is available on the "About Us" page at americancentury.com. It is also available at sec.gov.
Quarterly Portfolio Disclosure
The fund files its complete schedule of portfolio holdings with the Securities and Exchange Commission (SEC) for the first and third quarters of each fiscal year on Form N-Q. The fund’s Forms N-Q are available on the SEC’s website at sec.gov, and may be reviewed and copied at the SEC’s Public Reference Room in Washington, DC. Information on the operation of the Public Reference Room may be obtained by calling 1-800-SEC-0330. The fund also makes its complete schedule of portfolio holdings for the most recent quarter of its fiscal year available on its website at americancentury.com and, upon request, by calling 1-800-345-2021.
40
Other Tax Information
The following information is provided pursuant to provisions of the Internal Revenue Code.
The fund hereby designates up to the maximum amount allowable as qualified dividend income for the fiscal year ended June 30, 2016.
For corporate taxpayers, the fund hereby designates $1,310,764, or up to the maximum amount allowable, of ordinary income distributions paid during the fiscal year ended June 30, 2016 as qualified for the corporate dividends received deduction.
The fund hereby designates $13,498,358, or up to the maximum amount allowable, as long-term capital gain distributions (20% rate gain distributions) for the fiscal year ended June 30, 2016.
41
| Notes |
42
| Notes |
43
| Notes |
44
| ||
| Contact Us | americancentury.com | |
| Automated Information Line | 1-800-345-8765 | |
| Investor Services Representative | 1-800-345-2021 or 816-531-5575 | |
| Investors Using Advisors | 1-800-378-9878 | |
| Business, Not-For-Profit, Employer-Sponsored Retirement Plans | 1-800-345-3533 | |
| Banks and Trust Companies, Broker-Dealers, Financial Professionals, Insurance Companies | 1-800-345-6488 | |
| Telecommunications Relay Service for the Deaf | 711 | |
| American Century Quantitative Equity Funds, Inc. | ||
Investment Advisor: American Century Investment Management, Inc. Kansas City, Missouri | ||
| This report and the statements it contains are submitted for the general information of our shareholders. The report is not authorized for distribution to prospective investors unless preceded or accompanied by an effective prospectus. | ||
| ©2016 American Century Proprietary Holdings, Inc. All rights reserved. CL-ANN-89958 1608 | ||
| Annual Report | |
| June 30, 2016 | |
| Disciplined Growth Fund | |
47
48
| Table of Contents |
| President's Letter | 2 | |
| Performance | 3 | |
| Portfolio Commentary | ||
| Fund Characteristics | ||
| Shareholder Fee Example | ||
| Schedule of Investments | ||
| Statement of Assets and Liabilities | ||
| Statement of Operations | ||
| Statement of Changes in Net Assets | ||
| Notes to Financial Statements | ||
| Financial Highlights | ||
| Report of Independent Registered Public Accounting Firm | ||
| Management | ||
| Approval of Management Agreement | ||
| Proxy Voting Results | ||
| Additional Information | ||
Any opinions expressed in this report reflect those of the author as of the date of the report, and do not necessarily represent the opinions of American Century Investments® or any other person in the American Century Investments organization. Any such opinions are subject to change at any time based upon market or other conditions and American Century Investments disclaims any responsibility to update such opinions. These opinions may not be relied upon as investment advice and, because investment decisions made by American Century Investments funds are based on numerous factors, may not be relied upon as an indication of trading intent on behalf of any American Century Investments fund. Security examples are used for representational purposes only and are not intended as recommendations to purchase or sell securities. Performance information for comparative indices and securities is provided to American Century Investments by third party vendors. To the best of American Century Investments’ knowledge, such information is accurate at the time of printing.
| President’s Letter |
Jonathan ThomasDear Investor:
Thank you for reviewing this annual report for the 12 months ended June 30, 2016. It provides investment performance and portfolio information for the reporting period, plus longer-term historical performance data.
Annual reports remain important vehicles for conveying information about fund returns, including market and economic factors that affected performance during the reporting period. For additional, updated investment and market insights, we encourage you to visit our website, americancentury.com.
Market Volatility Increased, But Not for the Reasons Anticipated
Going into this reporting period, investors anticipated increased market volatility and uncertainty as the Federal Reserve (the Fed) appeared poised to raise short-term interest rates toward more historically normal levels. This policy change was expected to affect investor sentiment, U.S. Treasury yield behavior, relative currency values, inflation expectations, and corporate costs and earnings.
This Fed-centric outlook didn’t fully account for global factors, which ultimately drove sentiment, volatility, and performance during the reporting period. During 2015, the primary catalyst was China, where slowing economic growth, currency devaluations, and massive monetary policy easing sent shock waves through the global markets. The Fed ended up delaying (until December 2015) its only small rate hike during the reporting period. Afterward, China-related events repeated in January and early February this year, further delaying Fed action.
Oil was another catalyst—its price collapses devalued entire market sectors and contributed to broad market volatility and negative sentiment. Later, as China and oil appeared to stabilize, Brexit occurred—the unexpected decision by United Kingdom voters to leave the European Union. This produced more shock waves, and altered central bank policies around the world. In this environment, relatively defensive assets performed best for the 12 months, including the stocks of gold-producing companies, utilities, real estate investment trusts (REITs), and long-maturity U.S. Treasury securities.
Looking ahead, we believe the markets face further uncertainty and volatility as they digest Brexit, the Italian bank crisis, China’s economic mysteries, and the U.S. presidential election. Negative interest rates in Europe and Japan represent part of the market’s response to the global macroeconomic climate. These negative rates are suppressing interest rates around the world while driving up the value of the U.S. dollar and U.S. bonds. In a broad sense, stocks also benefit from the central bank stimulus that is driving interest rates into negative territory, and from relative yield advantages as bond yields are pushed lower. It’s an unusual and challenging environment. We appreciate your continued trust in us.
Sincerely,
Jonathan Thomas
President and Chief Executive Officer
American Century Investments
2
| Performance |
| Total Returns as of June 30, 2016 | ||||||
Average Annual Returns | ||||||
Ticker Symbol | 1 year | 5 years | 10 years | Since Inception | Inception Date | |
| Investor Class | ADSIX | -2.08% | 10.48% | 7.72% | — | 9/30/05 |
| Russell 1000 Growth Index | — | 3.02% | 12.33% | 8.77% | — | — |
| Institutional Class | ADCIX | -1.95% | 10.70% | 7.93% | — | 9/30/05 |
| A Class | ADCVX | — | 9/30/05 | |||
| No sales charge | -2.35% | 10.21% | 7.45% | — | ||
| With sales charge | -7.95% | 8.92% | 6.82% | — | ||
| C Class | ADCCX | -3.11% | 9.39% | — | 5.35% | 9/28/07 |
| R Class | ADRRX | -2.60% | 9.93% | 7.18% | — | 9/30/05 |
Average annual returns since inception are presented when ten years of performance history is not available.
Prior to September 4, 2007, the A Class was referred to as the Advisor Class and did not have a front-end sales charge. Performance prior to that date has been adjusted to reflect this charge.
Sales charges include initial sales charges and contingent deferred sales charges (CDSCs), as applicable. A Class shares have a 5.75% maximum initial sales charge and may be subject to a maximum CDSC of 1.00%. C Class shares redeemed within 12 months of purchase are subject to a maximum CDSC of 1.00%. The SEC requires that mutual funds provide performance information net of maximum sales charges in all cases where charges could be applied.
Data presented reflect past performance. Past performance is no guarantee of future results. Current performance may be higher or lower than the performance shown. Total returns for periods less than one year are not annualized. Investment return and principal value will fluctuate, and redemption value may be more or less than original cost. Data assumes reinvestment of dividends and capital gains, and none of the charts reflect the deduction of taxes that a shareholder would pay on fund distributions or the redemption of fund shares. To obtain performance data current to the most recent month end, please call 1-800-345-2021 or visit americancentury.com. For additional information about the fund, please consult the prospectus.
3
| Growth of $10,000 Over 10 Years |
| $10,000 investment made June 30, 2006 |
| Performance for other share classes will vary due to differences in fee structure. |
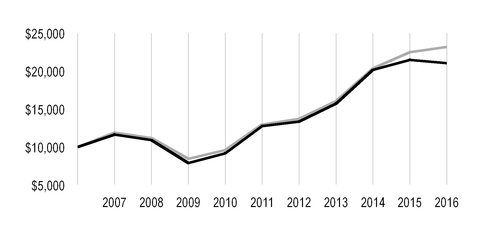
| Value on June 30, 2016 | |
| Investor Class — $21,050 | |
| Russell 1000 Growth Index — $23,205 | |
| Total Annual Fund Operating Expenses | ||||
| Investor Class | Institutional Class | A Class | C Class | R Class |
| 1.02% | 0.82% | 1.27% | 2.02% | 1.52% |
The total annual fund operating expenses shown is as stated in the fund’s prospectus current as of the date of this report. The prospectus may vary from the expense ratio shown elsewhere in this report because it is based on a different time period, includes acquired fund fees and expenses, and, if applicable, does not include fee waivers or expense reimbursements.
Data presented reflect past performance. Past performance is no guarantee of future results. Current performance may be higher or lower than the performance shown. Total returns for periods less than one year are not annualized. Investment return and principal value will fluctuate, and redemption value may be more or less than original cost. Data assumes reinvestment of dividends and capital gains, and none of the charts reflect the deduction of taxes that a shareholder would pay on fund distributions or the redemption of fund shares. To obtain performance data current to the most recent month end, please call 1-800-345-2021 or visit americancentury.com. For additional information about the fund, please consult the prospectus.
4
| Portfolio Commentary |
Portfolio Manager: Lynette Pang
In May 2016, portfolio manager Bill Martin left the fund's management team.
Performance Summary
Disciplined Growth returned -2.08%* for the fiscal year ended June 30, 2016, compared with the 3.02% return of its benchmark, the Russell 1000 Growth Index.
Disciplined Growth declined during the 12-month period, underperforming its benchmark, the Russell 1000 Growth Index. Stock selection in the consumer discretionary sector was a leading detractor from fund results, although industrials and financials holdings were also key underperformers. Conversely, positioning in telecommunication services and materials aided relative returns, as did information technology sector holdings.
Disciplined Growth’s stock selection process incorporates factors of valuation, quality, growth, and sentiment while striving to minimize unintended risks along industries and other risk characteristics. Within the fund, valuation factors detracted from selection results, while quality and growth were supportive. Sentiment factors were largely neutral.
Consumer Discretionary Sector Pressured Results
Consumer discretionary sector holdings were key drivers of the fund’s underperformance during the 12-month period. An overweight position, relative to the benchmark, in GoPro detracted as the wearable camera maker’s stock slumped on concerns about economic growth in China and a bleak outlook for wearable camera demand. An overweight position in specialty retailer Aaron’s also pressured results. The company’s stock slumped as lower same-store sales and significant escalation in bad debt expense caused the rent-to-own home goods retailer to miss quarterly earnings and revenue expectations and lower its future guidance. An overweight position in restaurant franchise operator Brinker International dampened results due to softer-than-expected sales at its Chili’s casual restaurants. We subsequently exited the portfolio’s stake in each position.
The fund’s industrials holdings also weighed on returns, led by an overweight position in United Continental Holdings. The airline weakened on disappointing financial results, driven by declining unit revenue due in part to a strong dollar and subsequently lower demand from international travelers. At home, falling oil prices earlier in the year hurt travel demand in its Houston hub, the center of the U.S. energy industry, contributing to management’s disappointing second-quarter outlook. Our investment in the stock is supported by above-average profiles across all factors.
A number of positions in the financials sector weighed on the fund’s returns. Shares of commercial real estate services company Jones Lang LaSalle, a portfolio overweight, declined sharply on disappointing quarterly earnings in early 2016 during a difficult environment for financial stocks. We ultimately liquidated our position in the holding. Elsewhere, several health care stocks pressured fund returns including an overweight position in Biogen. The biopharmaceutical holding’s share price fell sharply on disappointing revenue and lowered earnings guidance for 2015 as a result of declining sales of its Tecfidera multiple sclerosis treatment. Nevertheless, we believe the holding’s attractive valuation and growth characteristics support our positioning.
| * | All fund returns referenced in this commentary are for Investor Class shares. Performance for other share classes will vary due to differences in fee structure; when Investor Class performance exceeds that of the fund's benchmark, other share classes may not. See page 3 for returns for all share classes. |
5
Telecommunication Services Aided Returns
Telecommunication services sector positioning contributed to the fund’s relative returns, especially overweight exposure to a number of diversified telecommunication services providers. An overweight in Verizon Communications aided fund results after the telecommunications giant surpassed quarterly financial expectations on solid subscriber growth in its mobile and FiOS divisions. Positioning in the materials sector also benefited relative returns, although no single holding was a leading contributor.
Semiconductor manufacturers helped to bolster information technology returns, positioning that sector as a key contributor. Key outperformance came from an overweight position in Applied Materials. The semiconductor maker’s shares moved up on the heels of strong quarterly earnings reports and higher future guidance as the company captured market share from competitors and anticipated higher demand. Key sector contribution also stemmed from Cadence Design Systems, a maker of hardware and software products for validating chip designs, whose fourth-quarter financial results beat Wall Street expectations, due in part to strong sales of its new Palladium Z1 enterprise emulation platform. We opted to lock in gains and sold our stake in the holding.
Positioning in the energy sector, particularly an underweight to oil, gas and consumable fuels holdings, benefited results as oil prices sank to their lowest levels since early 2009 on widening oversupply and uncertain future demand during the first half of the year. In this environment, not holding natural gas processer Williams Companies was beneficial as its stock price declined steeply on weak energy sector returns. Elsewhere, an overweight position in Tyson Foods was beneficial as the poultry processor’s stock price reached new highs after beating quarterly earnings projections and raising future profit guidance.
A Look Ahead
At period-end, information technology and consumer staples were the fund’s largest overweight positions on a sector basis. We think that software and internet software and services companies are attractive in the information technology sector, where key themes are mobile, search, cloud computing, big data, and the shift to digital/online retail. This is creating growth and quality opportunities. Valuation and sentiment also are positive for select firms in these industries. In consumer staples, we are finding opportunities in household goods manufacturers. After the dramatic sell-off in 2015, health care names, particularly in the biotech space, are compelling based on valuation factors. Growth and quality metrics also are favorable. The consumer discretionary and financials sectors, both portfolio underweights, continue to face challenges, in our opinion. Growth scores are not favorable in consumer discretionary, particularly among specialty retailers. In fundamental terms, many of these traditional brick-and-mortar retailers face challenging business conditions and have poor growth and quality rankings. We find that large-cap real estate investment trusts and diversified financial services firms are challenged across virtually all dimensions. Our disciplined, objective, and systematic investment strategy is designed to take advantage of opportunities at the individual company level. We believe this approach is the most powerful way to capitalize on market inefficiencies that lead to the mispricing of individual stocks.
6
| Fund Characteristics |
| JUNE 30, 2016 | |
| Top Ten Holdings | % of net assets |
| Alphabet, Inc., Class A | 4.8% |
| Apple, Inc. | 4.2% |
| Amazon.com, Inc. | 3.4% |
| Facebook, Inc., Class A | 3.2% |
| Microsoft Corp. | 3.0% |
| Walt Disney Co. (The) | 2.4% |
| PepsiCo, Inc. | 2.1% |
| Amgen, Inc. | 1.9% |
| AbbVie, Inc. | 1.8% |
| Verizon Communications, Inc. | 1.8% |
| Top Five Industries | % of net assets |
| Software | 9.2% |
| Internet Software and Services | 8.7% |
| Biotechnology | 8.0% |
| Media | 6.3% |
| Technology Hardware, Storage and Peripherals | 5.0% |
| Types of Investments in Portfolio | % of net assets |
| Common Stocks | 99.3% |
| Temporary Cash Investments | 0.8% |
| Other Assets and Liabilities | (0.1)% |
7
| Shareholder Fee Example |
Fund shareholders may incur two types of costs: (1) transaction costs, including sales charges (loads) on purchase payments and redemption/exchange fees; and (2) ongoing costs, including management fees; distribution and service (12b-1) fees; and other fund expenses. This example is intended to help you understand your ongoing costs (in dollars) of investing in your fund and to compare these costs with the ongoing cost of investing in other mutual funds.
The example is based on an investment of $1,000 made at the beginning of the period and held for the entire period from January 1, 2016 to June 30, 2016.
Actual Expenses
The table provides information about actual account values and actual expenses for each class. You may use the information, together with the amount you invested, to estimate the expenses that you paid over the period. First, identify the share class you own. Then simply divide your account value by $1,000 (for example, an $8,600 account value divided by $1,000 = 8.6), then multiply the result by the number under the heading “Expenses Paid During Period” to estimate the expenses you paid on your account during this period.
If you hold Investor Class shares of any American Century Investments fund, or Institutional Class shares of the American Century Diversified Bond Fund, in an American Century Investments account (i.e., not a financial intermediary or retirement plan account), American Century Investments may charge you a $12.50 semiannual account maintenance fee if the value of those shares is less than $10,000. We will redeem shares automatically in one of your accounts to pay the $12.50 fee. In determining your total eligible investment amount, we will include your investments in all personal accounts (including American Century Investments Brokerage accounts) registered under your Social Security number. Personal accounts include individual accounts, joint accounts, UGMA/UTMA accounts, personal trusts, Coverdell Education Savings Accounts and IRAs (including traditional, Roth, Rollover, SEP-, SARSEP- and SIMPLE-IRAs), and certain other retirement accounts. If you have only business, business retirement, employer-sponsored or American Century Investments Brokerage accounts, you are currently not subject to this fee. If you are subject to the Account Maintenance Fee, your account value could be reduced by the fee amount.
Hypothetical Example for Comparison Purposes
The table also provides information about hypothetical account values and hypothetical expenses based on the actual expense ratio of each class of your fund and an assumed rate of return of 5% per year before expenses, which is not the actual return of a fund’s share class. The hypothetical account values and expenses may not be used to estimate the actual ending account balance or expenses you paid for the period. You may use this information to compare the ongoing costs of investing in your fund and other funds. To do so, compare this 5% hypothetical example with the 5% hypothetical examples that appear in the shareholder reports of the other funds.
Please note that the expenses shown in the table are meant to highlight your ongoing costs only and do not reflect any transactional costs, such as sales charges (loads) or redemption/exchange fees. Therefore, the table is useful in comparing ongoing costs only, and will not help you determine the relative total costs of owning different funds. In addition, if these transactional costs were included, your costs would have been higher.
8
| Beginning Account Value 1/1/16 | Ending Account Value 6/30/16 | Expenses Paid During Period(1) 1/1/16 - 6/30/16 | Annualized Expense Ratio(1) | |
| Actual | ||||
| Investor Class | $1,000 | $1,004.50 | $5.13 | 1.03% |
| Institutional Class | $1,000 | $1,005.40 | $4.14 | 0.83% |
| A Class | $1,000 | $1,003.40 | $6.38 | 1.28% |
| C Class | $1,000 | $999.40 | $10.09 | 2.03% |
| R Class | $1,000 | $1,001.70 | $7.61 | 1.53% |
| Hypothetical | ||||
| Investor Class | $1,000 | $1,019.74 | $5.17 | 1.03% |
| Institutional Class | $1,000 | $1,020.74 | $4.17 | 0.83% |
| A Class | $1,000 | $1,018.50 | $6.42 | 1.28% |
| C Class | $1,000 | $1,014.77 | $10.17 | 2.03% |
| R Class | $1,000 | $1,017.26 | $7.67 | 1.53% |
| (1) | Expenses are equal to the class's annualized expense ratio listed in the table above, multiplied by the average account value over the period, multiplied by 182, the number of days in the most recent fiscal half-year, divided by 366, to reflect the one-half year period. |
9
| Schedule of Investments |
JUNE 30, 2016
| Shares | Value | |||
| COMMON STOCKS — 99.3% | ||||
| Aerospace and Defense — 2.6% | ||||
| B/E Aerospace, Inc. | 172,147 | $ | 7,948,888 | |
| Boeing Co. (The) | 106,404 | 13,818,687 | ||
| Honeywell International, Inc. | 8,308 | 966,387 | ||
| 22,733,962 | ||||
| Airlines — 2.4% | ||||
| Delta Air Lines, Inc. | 166,908 | 6,080,458 | ||
Hawaiian Holdings, Inc.(1) | 142,509 | 5,409,642 | ||
JetBlue Airways Corp.(1) | 404,259 | 6,694,529 | ||
United Continental Holdings, Inc.(1) | 68,831 | 2,824,824 | ||
| 21,009,453 | ||||
| Auto Components — 0.9% | ||||
Cooper-Standard Holding, Inc.(1) | 15,758 | 1,244,724 | ||
| Lear Corp. | 62,167 | 6,326,114 | ||
| 7,570,838 | ||||
| Beverages — 2.9% | ||||
| Coca-Cola Co. (The) | 169,398 | 7,678,811 | ||
| PepsiCo, Inc. | 171,991 | 18,220,727 | ||
| 25,899,538 | ||||
| Biotechnology — 8.0% | ||||
| AbbVie, Inc. | 262,988 | 16,281,587 | ||
| Amgen, Inc. | 112,786 | 17,160,390 | ||
Biogen, Inc.(1) | 37,551 | 9,080,583 | ||
Celgene Corp.(1) | 107,352 | 10,588,128 | ||
| Gilead Sciences, Inc. | 174,778 | 14,579,981 | ||
Incyte Corp.(1) | 11,382 | 910,332 | ||
United Therapeutics Corp.(1) | 19,265 | 2,040,549 | ||
| 70,641,550 | ||||
| Building Products — 0.3% | ||||
USG Corp.(1) | 103,840 | 2,799,526 | ||
| Capital Markets — 0.5% | ||||
| Federated Investors, Inc., Class B | 153,385 | 4,414,420 | ||
| Chemicals — 2.6% | ||||
| Air Products & Chemicals, Inc. | 70,148 | 9,963,822 | ||
| PPG Industries, Inc. | 85,903 | 8,946,797 | ||
| Sherwin-Williams Co. (The) | 14,661 | 4,305,496 | ||
| 23,216,115 | ||||
| Communications Equipment — 1.1% | ||||
Arista Networks, Inc.(1) | 68,913 | 4,436,619 | ||
Ciena Corp.(1) | 284,454 | 5,333,513 | ||
F5 Networks, Inc.(1) | 29 | 3,301 | ||
| 9,773,433 | ||||
| Consumer Finance — 0.1% | ||||
| American Express Co. | 20,333 | 1,235,433 | ||
| Containers and Packaging — 0.2% | ||||
| Avery Dennison Corp. | 20,043 | 1,498,214 | ||
10
| Shares | Value | |||
| Diversified Telecommunication Services — 2.6% | ||||
| AT&T, Inc. | 159,905 | $ | 6,909,495 | |
| Verizon Communications, Inc. | 287,350 | 16,045,624 | ||
| 22,955,119 | ||||
| Food and Staples Retailing — 2.0% | ||||
| CVS Health Corp. | 31,295 | 2,996,183 | ||
| Sysco Corp. | 144,870 | 7,350,704 | ||
| Walgreens Boots Alliance, Inc. | 87,613 | 7,295,535 | ||
| 17,642,422 | ||||
| Food Products — 4.3% | ||||
| Campbell Soup Co. | 45,242 | 3,009,950 | ||
| General Mills, Inc. | 153,422 | 10,942,057 | ||
| Hormel Foods Corp. | 209,068 | 7,651,889 | ||
| Ingredion, Inc. | 61,120 | 7,909,539 | ||
| Tyson Foods, Inc., Class A | 125,220 | 8,363,444 | ||
| 37,876,879 | ||||
| Gas Utilities — 0.2% | ||||
| Southwest Gas Corp. | 18,288 | 1,439,448 | ||
| Health Care Equipment and Supplies — 4.3% | ||||
| Baxter International, Inc. | 28,430 | 1,285,605 | ||
| Becton Dickinson and Co. | 47,267 | 8,016,010 | ||
Boston Scientific Corp.(1) | 229,677 | 5,367,551 | ||
| C.R. Bard, Inc. | 39,025 | 9,177,119 | ||
Hologic, Inc.(1) | 159,286 | 5,511,296 | ||
| ResMed, Inc. | 128,822 | 8,145,415 | ||
| 37,502,996 | ||||
| Health Care Providers and Services — 3.0% | ||||
| AmerisourceBergen Corp. | 88,880 | 7,049,962 | ||
Express Scripts Holding Co.(1) | 145,907 | 11,059,751 | ||
Laboratory Corp. of America Holdings(1) | 34,293 | 4,467,349 | ||
| UnitedHealth Group, Inc. | 27,801 | 3,925,501 | ||
| 26,502,563 | ||||
| Health Care Technology — 0.4% | ||||
Medidata Solutions, Inc.(1) | 71,980 | 3,373,703 | ||
| Hotels, Restaurants and Leisure — 3.0% | ||||
| Bob Evans Farms, Inc. | 38,212 | 1,450,145 | ||
| Churchill Downs, Inc. | 32,186 | 4,067,023 | ||
| Darden Restaurants, Inc. | 113,992 | 7,220,253 | ||
| McDonald's Corp. | 89,431 | 10,762,127 | ||
| Starbucks Corp. | 48,700 | 2,781,744 | ||
| 26,281,292 | ||||
| Household Products — 2.1% | ||||
| Clorox Co. (The) | 62,305 | 8,622,389 | ||
| Kimberly-Clark Corp. | 69,484 | 9,552,660 | ||
| 18,175,049 | ||||
| Industrial Conglomerates — 2.0% | ||||
| 3M Co. | 6,379 | 1,117,091 | ||
| Carlisle Cos., Inc. | 78,540 | 8,300,107 | ||
| Danaher Corp. | 77,403 | 7,817,703 | ||
| 17,234,901 | ||||
11
| Shares | Value | |||
| Insurance — 1.1% | ||||
| Aon plc | 1,727 | $ | 188,640 | |
| Arthur J. Gallagher & Co. | 162,880 | 7,753,088 | ||
| Universal Insurance Holdings, Inc. | 110,630 | 2,055,506 | ||
| 9,997,234 | ||||
| Internet and Catalog Retail — 3.6% | ||||
Amazon.com, Inc.(1) | 41,526 | 29,716,836 | ||
Shutterfly, Inc.(1) | 38,096 | 1,775,655 | ||
| 31,492,491 | ||||
| Internet Software and Services — 8.7% | ||||
Alphabet, Inc., Class A(1) | 59,878 | 42,125,969 | ||
Facebook, Inc., Class A(1) | 249,827 | 28,550,230 | ||
GoDaddy, Inc., Class A(1) | 121,479 | 3,788,930 | ||
| j2 Global, Inc. | 31,776 | 2,007,290 | ||
Twitter, Inc.(1) | 31,867 | 538,871 | ||
| 77,011,290 | ||||
| IT Services — 4.2% | ||||
CoreLogic, Inc.(1) | 39,780 | 1,530,734 | ||
| CSG Systems International, Inc. | 154,124 | 6,212,738 | ||
| Global Payments, Inc. | 78,291 | 5,588,412 | ||
| International Business Machines Corp. | 94,963 | 14,413,484 | ||
PayPal Holdings, Inc.(1) | 26,866 | 980,878 | ||
Syntel, Inc.(1) | 10,580 | 478,851 | ||
Teradata Corp.(1) | 33,223 | 832,901 | ||
| Travelport Worldwide Ltd. | 132,574 | 1,708,879 | ||
| Visa, Inc., Class A | 75,426 | 5,594,346 | ||
| 37,341,223 | ||||
| Leisure Products — 0.6% | ||||
Smith & Wesson Holding Corp.(1) | 178,134 | 4,841,682 | ||
| Life Sciences Tools and Services — 0.8% | ||||
| Bruker Corp. | 54,440 | 1,237,966 | ||
| Thermo Fisher Scientific, Inc. | 38,878 | 5,744,613 | ||
| 6,982,579 | ||||
| Machinery — 0.9% | ||||
| Stanley Black & Decker, Inc. | 9,034 | 1,004,762 | ||
| Toro Co. (The) | 76,667 | 6,762,029 | ||
| 7,766,791 | ||||
| Media — 6.3% | ||||
AMC Networks, Inc., Class A(1) | 67,136 | 4,056,357 | ||
| CBS Corp., Class B | 101,151 | 5,506,660 | ||
| Cinemark Holdings, Inc. | 69,939 | 2,549,976 | ||
| Comcast Corp., Class A | 79,415 | 5,177,064 | ||
| Time Warner, Inc. | 123,051 | 9,049,171 | ||
| Viacom, Inc., Class B | 203,854 | 8,453,825 | ||
| Walt Disney Co. (The) | 212,308 | 20,767,969 | ||
| 55,561,022 | ||||
| Metals and Mining — 0.7% | ||||
| Steel Dynamics, Inc. | 256,213 | 6,277,219 | ||
| Multiline Retail — 0.8% | ||||
| Target Corp. | 101,547 | 7,090,012 | ||
12
| Shares | Value | |||
| Pharmaceuticals — 1.6% | ||||
| Bristol-Myers Squibb Co. | 37,117 | $ | 2,729,955 | |
| Johnson & Johnson | 19,495 | 2,364,743 | ||
| Merck & Co., Inc. | 94,980 | 5,471,798 | ||
Mylan NV(1) | 30,029 | 1,298,454 | ||
| Pfizer, Inc. | 59,180 | 2,083,728 | ||
| 13,948,678 | ||||
| Real Estate Investment Trusts (REITs) — 1.2% | ||||
| American Tower Corp. | 87,523 | 9,943,488 | ||
| Armada Hoffler Properties, Inc. | 27,464 | 377,355 | ||
| 10,320,843 | ||||
| Semiconductors and Semiconductor Equipment — 3.1% | ||||
| Applied Materials, Inc. | 345,219 | 8,274,899 | ||
| Broadcom Ltd. | 8,492 | 1,319,657 | ||
| Intel Corp. | 247,421 | 8,115,409 | ||
| NVIDIA Corp. | 41,438 | 1,948,000 | ||
| QUALCOMM, Inc. | 150,689 | 8,072,410 | ||
| 27,730,375 | ||||
| Software — 9.2% | ||||
Adobe Systems, Inc.(1) | 121,625 | 11,650,459 | ||
Citrix Systems, Inc.(1) | 73,255 | 5,866,993 | ||
Electronic Arts, Inc.(1) | 129,897 | 9,840,997 | ||
| Intuit, Inc. | 81,310 | 9,075,009 | ||
Manhattan Associates, Inc.(1) | 5,884 | 377,341 | ||
| Microsoft Corp. | 520,927 | 26,655,834 | ||
| Oracle Corp. | 176,381 | 7,219,274 | ||
salesforce.com, inc.(1) | 106,580 | 8,463,518 | ||
VMware, Inc., Class A(1) | 33,418 | 1,912,178 | ||
| 81,061,603 | ||||
| Specialty Retail — 3.0% | ||||
| American Eagle Outfitters, Inc. | 468,287 | 7,459,812 | ||
| Foot Locker, Inc. | 106,873 | 5,863,053 | ||
| Home Depot, Inc. (The) | 50,308 | 6,423,829 | ||
Michaels Cos., Inc. (The)(1) | 92,128 | 2,620,120 | ||
| Williams-Sonoma, Inc. | 80,723 | 4,208,090 | ||
| 26,574,904 | ||||
| Technology Hardware, Storage and Peripherals — 5.0% | ||||
| Apple, Inc. | 387,635 | 37,057,906 | ||
| EMC Corp. | 258,316 | 7,018,446 | ||
| 44,076,352 | ||||
| Thrifts and Mortgage Finance — 0.3% | ||||
Essent Group Ltd.(1) | 109,514 | 2,388,500 | ||
| Tobacco — 1.5% | ||||
| Altria Group, Inc. | 64,364 | 4,438,541 | ||
| Philip Morris International, Inc. | 89,326 | 9,086,241 | ||
| 13,524,782 | ||||
| Trading Companies and Distributors — 0.8% | ||||
HD Supply Holdings, Inc.(1) | 197,072 | 6,862,047 | ||
| Wireless Telecommunication Services — 0.4% | ||||
T-Mobile US, Inc.(1) | 75,172 | 3,252,692 | ||
TOTAL COMMON STOCKS (Cost $790,556,298) | 873,879,173 | |||
13
| Shares | Value | |||
| TEMPORARY CASH INVESTMENTS — 0.8% | ||||
| Repurchase Agreement, Fixed Income Clearing Corp., (collateralized by various U.S. Treasury obligations, 3.00%, 11/15/45, valued at $7,409,438), at 0.20%, dated 6/30/16, due 7/1/16 (Delivery value $7,262,040) | $ | 7,262,000 | ||
| State Street Institutional Liquid Reserves Fund, Premier Class | 5,067 | 5,067 | ||
TOTAL TEMPORARY CASH INVESTMENTS (Cost $7,267,067) | 7,267,067 | |||
TOTAL INVESTMENT SECURITIES — 100.1% (Cost $797,823,365) | 881,146,240 | |||
| OTHER ASSETS AND LIABILITIES — (0.1)% | (799,283) | |||
| TOTAL NET ASSETS — 100.0% | $ | 880,346,957 | ||
| NOTES TO SCHEDULE OF INVESTMENTS | ||
| (1) | Non-income producing. |
See Notes to Financial Statements.
14
| Statement of Assets and Liabilities |
| JUNE 30, 2016 | |||
| Assets | |||
| Investment securities, at value (cost of $797,823,365) | $ | 881,146,240 | |
| Receivable for investments sold | 7,319,851 | ||
| Receivable for capital shares sold | 403,625 | ||
| Dividends and interest receivable | 757,854 | ||
| 889,627,570 | |||
| Liabilities | |||
| Payable for investments purchased | 6,808,969 | ||
| Payable for capital shares redeemed | 1,686,554 | ||
| Accrued management fees | 685,792 | ||
| Distribution and service fees payable | 70,271 | ||
| Accrued other expenses | 29,027 | ||
| 9,280,613 | |||
| Net Assets | $ | 880,346,957 | |
| Net Assets Consist of: | |||
| Capital (par value and paid-in surplus) | $ | 849,096,099 | |
| Undistributed net investment income | 267,990 | ||
| Accumulated net realized loss | (52,340,007 | ) | |
| Net unrealized appreciation | 83,322,875 | ||
| $ | 880,346,957 | ||
| Net Assets | Shares Outstanding | Net Asset Value Per Share | ||||
| Investor Class, $0.01 Par Value | $370,901,126 | 20,201,936 | $18.36 | |||
| Institutional Class, $0.01 Par Value | $318,575,842 | 17,301,818 | $18.41 | |||
| A Class, $0.01 Par Value | $133,041,728 | 7,279,094 | $18.28* | |||
| C Class, $0.01 Par Value | $45,049,811 | 2,567,920 | $17.54 | |||
| R Class, $0.01 Par Value | $12,778,450 | 707,368 | $18.06 | |||
*Maximum offering price $19.40 (net asset value divided by 0.9425).
See Notes to Financial Statements.
15
| Statement of Operations |
| YEAR ENDED JUNE 30, 2016 | |||
| Investment Income (Loss) | |||
| Income: | |||
| Dividends | $ | 16,645,225 | |
| Interest | 6,150 | ||
| 16,651,375 | |||
| Expenses: | |||
| Management fees | 9,441,248 | ||
| Distribution and service fees: | |||
| A Class | 384,347 | ||
| C Class | 483,111 | ||
| R Class | 67,696 | ||
| Directors' fees and expenses | 58,927 | ||
| Other expenses | 48,433 | ||
| 10,483,762 | |||
| Net investment income (loss) | 6,167,613 | ||
| Realized and Unrealized Gain (Loss) | |||
| Net realized gain (loss) on investment transactions | (50,302,756 | ) | |
| Change in net unrealized appreciation (depreciation) on investments | 17,824,145 | ||
| Net realized and unrealized gain (loss) | (32,478,611 | ) | |
| Net Increase (Decrease) in Net Assets Resulting from Operations | $ | (26,310,998 | ) |
See Notes to Financial Statements.
16
| Statement of Changes in Net Assets |
| YEARS ENDED JUNE 30, 2016 AND JUNE 30, 2015 | ||||||
| Increase (Decrease) in Net Assets | June 30, 2016 | June 30, 2015 | ||||
| Operations | ||||||
| Net investment income (loss) | $ | 6,167,613 | $ | 5,608,117 | ||
| Net realized gain (loss) | (50,302,756 | ) | 28,675,321 | |||
| Change in net unrealized appreciation (depreciation) | 17,824,145 | 6,359,529 | ||||
| Net increase (decrease) in net assets resulting from operations | (26,310,998 | ) | 40,642,967 | |||
| Distributions to Shareholders | ||||||
| From net investment income: | ||||||
| Investor Class | (2,500,197 | ) | (2,671,637 | ) | ||
| Institutional Class | (2,715,100 | ) | (2,014,427 | ) | ||
| A Class | (741,706 | ) | (490,407 | ) | ||
| C Class | (100,599 | ) | — | |||
| R Class | (56,992 | ) | (18,566 | ) | ||
| From net realized gains: | ||||||
| Investor Class | (6,223,594 | ) | (18,348,244 | ) | ||
| Institutional Class | (4,767,664 | ) | (5,613,156 | ) | ||
| A Class | (2,177,250 | ) | (5,223,057 | ) | ||
| C Class | (716,902 | ) | (1,471,637 | ) | ||
| R Class | (188,083 | ) | (294,749 | ) | ||
| Decrease in net assets from distributions | (20,188,087 | ) | (36,145,880 | ) | ||
| Capital Share Transactions | ||||||
| Net increase (decrease) in net assets from capital share transactions (Note 5) | (185,657,854 | ) | 728,536,103 | |||
| Net increase (decrease) in net assets | (232,156,939 | ) | 733,033,190 | |||
| Net Assets | ||||||
| Beginning of period | 1,112,503,896 | 379,470,706 | ||||
| End of period | $ | 880,346,957 | $ | 1,112,503,896 | ||
| Undistributed net investment income | $ | 267,990 | $ | 311,872 | ||
See Notes to Financial Statements.
17
| Notes to Financial Statements |
JUNE 30, 2016
1. Organization
American Century Quantitative Equity Funds, Inc. (the corporation) is registered under the Investment Company Act of 1940, as amended (the 1940 Act), as an open-end management investment company and is organized as a Maryland corporation. Disciplined Growth Fund (the fund) is one fund in a series issued by the corporation. The fund’s investment objective is to seek long-term capital growth.
The fund offers the Investor Class, the Institutional Class, the A Class, the C Class and the R Class. The A Class may incur an initial sales charge. The A Class and C Class may be subject to a contingent deferred sales charge. The share classes differ principally in their respective sales charges and distribution and shareholder servicing expenses and arrangements. The Institutional Class is made available to institutional shareholders or through financial intermediaries whose clients do not require the same level of shareholder and administrative services as shareholders of other classes. As a result, the Institutional Class is charged a lower unified management fee.
2. Significant Accounting Policies
The following is a summary of significant accounting policies consistently followed by the fund in preparation of its financial statements. The fund is an investment company and follows accounting and reporting guidance in accordance with accounting principles generally accepted in the United States of America. This may require management to make certain estimates and assumptions at the date of the financial statements. Actual results could differ from these estimates. Management evaluated the impact of events or transactions occurring through the date the financial statements were issued that would merit recognition or disclosure.
Investment Valuations — The fund determines the fair value of its investments and computes its net asset value per share at the close of regular trading (usually 4 p.m. Eastern time) on the New York Stock Exchange (NYSE) on each day the NYSE is open. The Board of Directors has adopted valuation policies and procedures to guide the investment advisor in the fund’s investment valuation process and to provide methodologies for the oversight of the fund’s pricing function.
Equity securities that are listed or traded on a domestic securities exchange are valued at the last reported sales price or at the official closing price as provided by the exchange. Equity securities traded on foreign securities exchanges are generally valued at the closing price of such securities on the exchange where primarily traded or at the close of the NYSE, if that is earlier. If no last sales price is reported, or if local convention or regulation so provides, the mean of the latest bid and asked prices may be used. Securities traded over-the-counter are valued at the mean of the latest bid and asked prices, the last sales price, or the official closing price.
Open-end management investment companies are valued at the reported net asset value per share. Repurchase agreements are valued at cost, which approximates fair value.
If the fund determines that the market price for an investment is not readily available or the valuation methods mentioned above do not reflect an investment’s fair value, such investment is valued as determined in good faith by the Board of Directors or its delegate, in accordance with policies and procedures adopted by the Board of Directors. In its determination of fair value, the fund may review several factors including, but not limited to, market information regarding the specific investment or comparable investments and correlation with other investment types, futures indices or general market indicators. Circumstances that may cause the fund to use these procedures to value an investment include, but are not limited to: an investment has been declared in default or is distressed; trading in a security has been suspended during the trading day or a security is not actively trading on its principal exchange; prices received from a regular pricing source are deemed unreliable; or there is a foreign market holiday and no trading occurred.
The fund monitors for significant events occurring after the close of an investment’s primary exchange but before the fund’s net asset value per share is determined. Significant events may include, but are not limited to: corporate announcements and transactions; governmental action and political unrest that could impact a
18
specific investment or an investment sector; or armed conflicts, natural disasters and similar events that could affect investments in a specific country or region. The fund also monitors for significant fluctuations between domestic and foreign markets, as evidenced by the U.S. market or such other indicators that the Board of Directors, or its delegate, deems appropriate. If significant fluctuations in foreign markets are identified, the fund may apply a model-derived factor to the closing price of equity securities traded on foreign securities exchanges. The factor is based on observable market data as provided by an independent pricing service.
Security Transactions — Security transactions are accounted for as of the trade date. Net realized gains and losses are determined on the identified cost basis, which is also used for federal income tax purposes.
Investment Income — Dividend income less foreign taxes withheld, if any, is recorded as of the ex-dividend date. Distributions received on securities that represent a return of capital or long-term capital gain are recorded as a reduction of cost of investments and/or as a realized gain. The fund may estimate the components of distributions received that may be considered nontaxable distributions or long-term capital gain distributions for income tax purposes. Interest income is recorded on the accrual basis and includes accretion of discounts and amortization of premiums.
Repurchase Agreements — The fund may enter into repurchase agreements with institutions that American Century Investment Management, Inc. (ACIM) (the investment advisor) has determined are creditworthy pursuant to criteria adopted by the Board of Directors. The fund requires that the collateral, represented by securities, received in a repurchase transaction be transferred to the custodian in a manner sufficient to enable the fund to obtain those securities in the event of a default under the repurchase agreement. ACIM monitors, on a daily basis, the securities transferred to ensure the value, including accrued interest, of the securities under each repurchase agreement is equal to or greater than amounts owed to the fund under each repurchase agreement.
Joint Trading Account — Pursuant to an Exemptive Order issued by the Securities and Exchange Commission, the fund, along with certain other funds in the American Century Investments family of funds, may transfer uninvested cash balances into a joint trading account. These balances are invested in one or more repurchase agreements that are collateralized by U.S. Treasury or Agency obligations.
Income Tax Status — It is the fund’s policy to distribute substantially all net investment income and net realized gains to shareholders and to otherwise qualify as a regulated investment company under provisions of the Internal Revenue Code. Accordingly, no provision has been made for income taxes. The fund files U.S. federal, state, local and non-U.S. tax returns as applicable. The fund's tax returns are subject to examination by the relevant taxing authority until expiration of the applicable statute of limitations, which is generally three years from the date of filing but can be longer in certain jurisdictions. At this time, management believes there are no uncertain tax positions which, based on their technical merit, would not be sustained upon examination and for which it is reasonably possible that the total amounts of unrecognized tax benefits will significantly change in the next twelve months.
Multiple Class — All shares of the fund represent an equal pro rata interest in the net assets of the class to which such shares belong, and have identical voting, dividend, liquidation and other rights and the same terms and conditions, except for class specific expenses and exclusive rights to vote on matters affecting only individual classes. Income, non-class specific expenses, and realized and unrealized capital gains and losses of the fund are allocated to each class of shares based on their relative net assets.
Distributions to Shareholders — Distributions from net investment income, if any, are generally declared and paid semiannually. Distributions from net realized gains, if any, are generally declared and paid annually.
Indemnifications — Under the corporation’s organizational documents, its officers and directors are indemnified against certain liabilities arising out of the performance of their duties to the fund. In addition, in the normal course of business, the fund enters into contracts that provide general indemnifications. The maximum exposure under these arrangements is unknown as this would involve future claims that may be made against a fund. The risk of material loss from such claims is considered by management to be remote.
3. Fees and Transactions with Related Parties
Certain officers and directors of the corporation are also officers and/or directors of American Century Companies, Inc. (ACC). The corporation’s investment advisor, ACIM, the corporation's distributor, American Century Investment Services, Inc. (ACIS), and the corporation’s transfer agent, American Century Services, LLC, are wholly owned, directly or indirectly, by ACC.
19
Management Fees — The corporation has entered into a management agreement with ACIM, under which ACIM provides the fund with investment advisory and management services in exchange for a single, unified management fee (the fee) per class. The agreement provides that all expenses of managing and operating the fund, except distribution and service fees, brokerage expenses, taxes, interest, fees and expenses of the independent directors (including legal counsel fees), and extraordinary expenses, will be paid by ACIM. The fee is computed and accrued daily based on each class’s daily net assets and paid monthly in arrears. The fee consists of (1) an Investment Category Fee based on the daily net assets of the fund and certain other accounts managed by the investment advisor that are in the same broad investment category as the fund and (2) a Complex Fee based on the assets of all the funds in the American Century Investments family of funds. The rates for the Investment Category Fee range from 0.6880% to 0.8700%. The rates for the Complex Fee range from 0.2500% to 0.3100% for the Investor Class, A Class, C Class and R Class. The rates for the Complex Fee range from 0.0500% to 0.1100% for the Institutional Class. The effective annual management fee for each class for the year ended June 30, 2016 was 1.02% for the Investor Class, A Class, C Class and R Class and 0.82% for the Institutional Class.
Distribution and Service Fees — The Board of Directors has adopted a separate Master Distribution and Individual Shareholder Services Plan for each of the A Class, C Class and R Class (collectively the plans), pursuant to Rule 12b-1 of the 1940 Act. The plans provide that the A Class will pay ACIS an annual distribution and service fee of 0.25%. The plans provide that the C Class will pay ACIS an annual distribution and service fee of 1.00%, of which 0.25% is paid for individual shareholder services and 0.75% is paid for distribution services. The plans provide that the R Class will pay ACIS an annual distribution and service fee of 0.50%. The fees are computed and accrued daily based on each class’s daily net assets and paid monthly in arrears. The fees are used to pay financial intermediaries for distribution and individual shareholder services. Fees incurred under the plans during the year ended June 30, 2016 are detailed in the Statement of Operations.
Directors' Fees and Expenses — The Board of Directors is responsible for overseeing the investment advisor’s management and operations of the fund. The directors receive detailed information about the fund and its investment advisor regularly throughout the year, and meet at least quarterly with management of the investment advisor to review reports about fund operations. The fund’s officers do not receive compensation from the fund.
Interfund Transactions — The fund may enter into security transactions with other American Century Investments funds and other client accounts of the investment advisor, in accordance with the 1940 Act rules and procedures adopted by the Board of Directors. The rules and procedures require, among other things, that these transactions be effected at the independent current market price of the security. During the period, the interfund purchases and sales were $6,632,122 and $21,300,391, respectively.
4. Investment Transactions
Purchases and sales of investment securities, excluding short-term investments, for the year ended June 30, 2016 were $1,114,124,736 and $1,311,141,329, respectively.
20
5. Capital Share Transactions
Transactions in shares of the fund were as follows:
| Year ended June 30, 2016 | Year ended June 30, 2015 | |||||||||
| Shares | Amount | Shares | Amount | |||||||
| Investor Class/Shares Authorized | 200,000,000 | 200,000,000 | ||||||||
| Sold | 5,847,975 | $ | 107,729,732 | 21,236,844 | $ | 406,035,361 | ||||
| Issued in reinvestment of distributions | 462,419 | 8,480,658 | 1,099,840 | 20,609,340 | ||||||
| Redeemed | (12,349,400 | ) | (227,091,954 | ) | (8,122,681 | ) | (156,118,768 | ) | ||
| (6,039,006 | ) | (110,881,564 | ) | 14,214,003 | 270,525,933 | |||||
| Institutional Class/Shares Authorized | 150,000,000 | 150,000,000 | ||||||||
| Sold | 5,461,873 | 101,292,787 | 20,277,130 | 392,872,857 | ||||||
| Issued in reinvestment of distributions | 298,670 | 5,498,045 | 283,822 | 5,357,757 | ||||||
| Redeemed | (7,838,683 | ) | (145,312,571 | ) | (2,576,823 | ) | (50,045,269 | ) | ||
| (2,078,140 | ) | (38,521,739 | ) | 17,984,129 | 348,185,345 | |||||
| A Class/Shares Authorized | 70,000,000 | 70,000,000 | ||||||||
| Sold | 1,948,114 | 35,961,434 | 6,484,498 | 124,219,376 | ||||||
| Issued in reinvestment of distributions | 142,543 | 2,603,369 | 275,678 | 5,138,431 | ||||||
| Redeemed | (3,891,117 | ) | (70,909,356 | ) | (2,769,790 | ) | (52,912,280 | ) | ||
| (1,800,460 | ) | (32,344,553 | ) | 3,990,386 | 76,445,527 | |||||
| C Class/Shares Authorized | 20,000,000 | 20,000,000 | ||||||||
| Sold | 427,817 | 7,581,525 | 1,569,146 | 29,150,005 | ||||||
| Issued in reinvestment of distributions | 42,542 | 747,140 | 74,840 | 1,343,387 | ||||||
| Redeemed | (637,771 | ) | (11,195,176 | ) | (262,184 | ) | (4,852,263 | ) | ||
| (167,412 | ) | (2,866,511 | ) | 1,381,802 | 25,641,129 | |||||
| R Class/Shares Authorized | 20,000,000 | 20,000,000 | ||||||||
| Sold | 132,560 | 2,411,524 | 568,739 | 10,787,048 | ||||||
| Issued in reinvestment of distributions | 13,566 | 245,075 | 16,996 | 313,315 | ||||||
| Redeemed | (203,493 | ) | (3,700,086 | ) | (176,423 | ) | (3,362,194 | ) | ||
| (57,367 | ) | (1,043,487 | ) | 409,312 | 7,738,169 | |||||
| Net increase (decrease) | (10,142,385 | ) | $ | (185,657,854 | ) | 37,979,632 | $ | 728,536,103 | ||
6. Fair Value Measurements
The fund’s investments valuation process is based on several considerations and may use multiple inputs to determine the fair value of the investments held by the fund. In conformity with accounting principles generally accepted in the United States of America, the inputs used to determine a valuation are classified into three broad levels.
| • | Level 1 valuation inputs consist of unadjusted quoted prices in an active market for identical investments. |
| • | Level 2 valuation inputs consist of direct or indirect observable market data (including quoted prices for comparable investments, evaluations of subsequent market events, interest rates, prepayment speeds, credit risk, etc.). These inputs also consist of quoted prices for identical investments initially expressed in local currencies that are adjusted through translation into U.S. dollars. |
| • | Level 3 valuation inputs consist of unobservable data (including a fund’s own assumptions). |
The level classification is based on the lowest level input that is significant to the fair valuation measurement. The valuation inputs are not necessarily an indication of the risks associated with investing in these securities or other financial instruments. There were no significant transfers between levels during the period.
21
The following is a summary of the level classifications as of period end. The Schedule of Investments provides additional information on the fund’s portfolio holdings.
| Level 1 | Level 2 | Level 3 | ||||||
| Assets | ||||||||
| Investment Securities | ||||||||
| Common Stocks | $ | 873,879,173 | — | — | ||||
| Temporary Cash Investments | 5,067 | $ | 7,262,000 | — | ||||
| $ | 873,884,240 | $ | 7,262,000 | — | ||||
7. Risk Factors
The fund’s investment process may result in high portfolio turnover, which could mean high transaction costs, affecting both performance and capital gains tax liabilities to investors.
8. Federal Tax Information
The tax character of distributions paid during the years ended June 30, 2016 and June 30, 2015 were as follows:
| 2016 | 2015 | |||||
| Distributions Paid From | ||||||
| Ordinary income | $ | 14,740,532 | $ | 17,573,781 | ||
| Long-term capital gains | $ | 5,447,555 | $ | 18,572,099 | ||
The book-basis character of distributions made during the year from net investment income or net realized gains may differ from their ultimate characterization for federal income tax purposes. These differences reflect the differing character of certain income items and net realized gains and losses for financial statement and tax purposes, and may result in reclassification among certain capital accounts on the financial statements.
As of June 30, 2016, the federal tax cost of investments and the components of distributable earnings on a tax-basis were as follows:
| Federal tax cost of investments | $ | 800,211,479 | |
| Gross tax appreciation of investments | $ | 100,896,529 | |
| Gross tax depreciation of investments | (19,961,768 | ) | |
| Net tax appreciation (depreciation) of investments | $ | 80,934,761 | |
| Undistributed ordinary income | $ | 267,990 | |
| Accumulated short-term capital losses | $ | (49,951,893 | ) |
The difference between book-basis and tax-basis unrealized appreciation (depreciation) is attributable primarily to the tax deferral of losses on wash sales.
Accumulated capital losses represent net capital loss carryovers that may be used to offset future realized capital gains for federal income tax purposes. The capital loss carryovers may be carried forward for an unlimited period. Future capital loss carryover utilization in any given year may be subject to Internal Revenue Code limitations.
22
| Financial Highlights |
| For a Share Outstanding Throughout the Years Ended June 30 (except as noted) | |||||||||||||||
| Per-Share Data | Ratios and Supplemental Data | ||||||||||||||
| Income From Investment Operations: | Distributions From: | Ratio to Average Net Assets of: | |||||||||||||
| Net Asset Value, Beginning of Period | Net Investment Income (Loss)(1) | Net Realized and Unrealized Gain (Loss) | Total From Investment Operations | Net Investment Income | Net Realized Gains | Total Distributions | Net Asset Value, End of Period | Total Return(2) | Operating Expenses | Net Investment Income (Loss) | Portfolio Turnover Rate | Net Assets, End of Period (in thousands) | |||
| Investor Class | |||||||||||||||
| 2016 | $19.15 | 0.12 | (0.53) | (0.41) | (0.12) | (0.26) | (0.38) | $18.36 | (2.08)% | 1.03% | 0.64% | 113% | $370,901 | ||
| 2015 | $18.82 | 0.14 | 1.09 | 1.23 | (0.11) | (0.79) | (0.90) | $19.15 | 6.59% | 1.02% | 0.75% | 108% | $502,389 | ||
| 2014 | $15.56 | 0.12 | 4.15 | 4.27 | (0.11) | (0.90) | (1.01) | $18.82 | 28.05% | 1.02% | 0.70% | 102% | $226,370 | ||
| 2013 | $13.38 | 0.16 | 2.19 | 2.35 | (0.17) | — | (0.17) | $15.56 | 17.70% | 1.03% | 1.07% | 94% | $109,366 | ||
| 2012 | $12.85 | 0.09 | 0.50 | 0.59 | (0.06) | — | (0.06) | $13.38 | 4.68% | 1.04% | 0.73% | 94% | $57,780 | ||
| Institutional Class | |||||||||||||||
| 2016 | $19.20 | 0.16 | (0.53) | (0.37) | (0.16) | (0.26) | (0.42) | $18.41 | (1.95)% | 0.83% | 0.84% | 113% | $318,576 | ||
| 2015 | $18.87 | 0.20 | 1.06 | 1.26 | (0.14) | (0.79) | (0.93) | $19.20 | 6.84% | 0.82% | 0.95% | 108% | $372,011 | ||
| 2014 | $15.60 | 0.16 | 4.15 | 4.31 | (0.14) | (0.90) | (1.04) | $18.87 | 28.30% | 0.82% | 0.90% | 102% | $26,334 | ||
| 2013 | $13.42 | 0.19 | 2.20 | 2.39 | (0.21) | — | (0.21) | $15.60 | 17.99% | 0.83% | 1.27% | 94% | $10,124 | ||
| 2012 | $12.89 | 0.10 | 0.52 | 0.62 | (0.09) | — | (0.09) | $13.42 | 4.87% | 0.84% | 0.93% | 94% | $878 | ||
| A Class | |||||||||||||||
| 2016 | $19.09 | 0.07 | (0.52) | (0.45) | (0.10) | (0.26) | (0.36) | $18.28 | (2.35)% | 1.28% | 0.39% | 113% | $133,042 | ||
| 2015 | $18.77 | 0.09 | 1.08 | 1.17 | (0.06) | (0.79) | (0.85) | $19.09 | 6.35% | 1.27% | 0.50% | 108% | $173,300 | ||
| 2014 | $15.52 | 0.08 | 4.13 | 4.21 | (0.06) | (0.90) | (0.96) | $18.77 | 27.75% | 1.27% | 0.45% | 102% | $95,509 | ||
| 2013 | $13.33 | 0.12 | 2.19 | 2.31 | (0.12) | — | (0.12) | $15.52 | 17.42% | 1.28% | 0.82% | 94% | $51,897 | ||
| 2012 | $12.80 | 0.07 | 0.49 | 0.56 | (0.03) | — | (0.03) | $13.33 | 4.44% | 1.29% | 0.48% | 94% | $15,726 | ||
| For a Share Outstanding Throughout the Years Ended June 30 (except as noted) | |||||||||||||||
| Per-Share Data | Ratios and Supplemental Data | ||||||||||||||
| Income From Investment Operations: | Distributions From: | Ratio to Average Net Assets of: | |||||||||||||
| Net Asset Value, Beginning of Period | Net Investment Income (Loss)(1) | Net Realized and Unrealized Gain (Loss) | Total From Investment Operations | Net Investment Income | Net Realized Gains | Total Distributions | Net Asset Value, End of Period | Total Return(2) | Operating Expenses | Net Investment Income (Loss) | Portfolio Turnover Rate | Net Assets, End of Period (in thousands) | |||
| C Class | |||||||||||||||
| 2016 | $18.41 | (0.06) | (0.51) | (0.57) | (0.04) | (0.26) | (0.30) | $17.54 | (3.11)% | 2.03% | (0.36)% | 113% | $45,050 | ||
| 2015 | $18.21 | (0.05) | 1.04 | 0.99 | — | (0.79) | (0.79) | $18.41 | 5.56% | 2.02% | (0.25)% | 108% | $50,355 | ||
| 2014 | $15.14 | (0.05) | 4.02 | 3.97 | — | (0.90) | (0.90) | $18.21 | 26.80% | 2.02% | (0.30)% | 102% | $24,646 | ||
| 2013 | $12.99 | 0.01 | 2.14 | 2.15 | — | — | — | $15.14 | 16.55% | 2.03% | 0.07% | 94% | $9,580 | ||
| 2012 | $12.53 | (0.03) | 0.49 | 0.46 | — | — | — | $12.99 | 3.67% | 2.04% | (0.27)% | 94% | $3,389 | ||
| R Class | |||||||||||||||
| 2016 | $18.89 | 0.03 | (0.52) | (0.49) | (0.08) | (0.26) | (0.34) | $18.06 | (2.60)% | 1.53% | 0.14% | 113% | $12,778 | ||
| 2015 | $18.60 | 0.04 | 1.06 | 1.10 | (0.02) | (0.79) | (0.81) | $18.89 | 6.06% | 1.52% | 0.25% | 108% | $14,449 | ||
| 2014 | $15.39 | 0.03 | 4.10 | 4.13 | (0.02) | (0.90) | (0.92) | $18.60 | 27.41% | 1.52% | 0.20% | 102% | $6,611 | ||
| 2013 | $13.20 | 0.09 | 2.17 | 2.26 | (0.07) | — | (0.07) | $15.39 | 17.16% | 1.53% | 0.57% | 94% | $5,368 | ||
| 2012 | $12.68 | 0.02 | 0.50 | 0.52 | —(3) | — | —(3) | $13.20 | 4.13% | 1.54% | 0.23% | 94% | $897 | ||
| Notes to Financial Highlights |
| (1) | Computed using average shares outstanding throughout the period. |
| (2) | Total returns are calculated based on the net asset value of the last business day and do not reflect applicable sales charges, if any. Total returns for periods less than one year are not annualized. |
| (3) | Per-share amount was less than $0.005. |
See Notes to Financial Statements.
| Report of Independent Registered Public Accounting Firm |
To the Directors of the American Century Quantitative Equity Funds, Inc. and Shareholders of the Disciplined Growth Fund:
In our opinion, the accompanying statement of assets and liabilities, including the schedule of investments, and the related statements of operations and of changes in net assets and the financial highlights present fairly, in all material respects, the financial position of the Disciplined Growth Fund (one of the sixteen funds comprising the American Century Quantitative Equity Funds, Inc., hereafter referred to as the “Fund”) at June 30, 2016, the results of its operations for the year then ended, the changes in its net assets for each of the two years in the period then ended and the financial highlights for each of the five years in the period then ended, in conformity with accounting principles generally accepted in the United States of America. These financial statements and financial highlights (hereafter referred to as "financial statements") are the responsibility of the Fund's management. Our responsibility is to express an opinion on these financial statements based on our audits. We conducted our audits of these financial statements in accordance with the standards of the Public Company Accounting Oversight Board (United States). Those standards require that we plan and perform the audit to obtain reasonable assurance about whether the financial statements are free of material misstatement. An audit includes examining, on a test basis, evidence supporting the amounts and disclosures in the financial statements, assessing the accounting principles used and significant estimates made by management, and evaluating the overall financial statement presentation. We believe that our audits, which included confirmation of securities at June 30, 2016 by correspondence with the custodian and brokers, provide a reasonable basis for our opinion.
PricewaterhouseCoopers LLP
Kansas City, Missouri
August 17, 2016
25
| Management |
Board of Directors
The individuals listed below serve as directors of the funds. Each director will continue to serve in this capacity until death, retirement, resignation or removal from office. The board has adopted a mandatory retirement age for directors who are not “interested persons,” as that term is defined in the Investment Company Act (independent directors). Independent directors shall retire on December 31 of the year in which they reach their 75th birthday; provided, however, that on or after January 1, 2022, independent directors shall retire on December 31 of the year in which they reach their 76th birthday.
Mr. Thomas is an “interested person” because he currently serves as President and Chief Executive Officer of American Century Companies, Inc. (ACC), the parent company of American Century Investment Management, Inc. (ACIM or the advisor). The other directors (more than three-fourths of the total number) are independent. They are not employees, directors or officers of, and have no financial interest in, ACC or any of its wholly owned, direct or indirect, subsidiaries, including ACIM, American Century Investment Services, Inc. (ACIS) and American Century Services, LLC (ACS), and they do not have any other affiliations, positions or relationships that would cause them to be considered “interested persons” under the Investment Company Act. The directors serve in this capacity for eight (in the case of Mr. Thomas, 15) registered investment companies in the American Century Investments family of funds.
The following table presents additional information about the directors. The mailing address for each director other than Mr. Thomas is 1665 Charleston Road, Mountain View, California 94043. The mailing address for Mr. Thomas is 4500 Main Street, Kansas City, Missouri 64111.
Name (Year of Birth) | Position(s) Held with Funds | Length of Time Served | Principal Occupation(s) During Past 5 Years | Number of American Century Portfolios Overseen by Director | Other Directorships Held During Past 5 Years |
| Independent Directors | |||||
| Tanya S. Beder (1955) | Director | Since 2011 | Chairman and CEO, SBCC Group Inc. (independent advisory services) (2006 to present) | 45 | CYS Investments, Inc. (NYSE mortgage arbitrage REIT) |
| Jeremy I. Bulow (1954) | Director | Since 2011 | Professor of Economics, Stanford University, Graduate School of Business (1979 to present) | 45 | None |
| Anne Casscells (1958) | Director | Since 2016 | Co-Chief Executive Officer and Chief Investment Officer, Aetos Alternatives Management (investment advisory firm) (2001 to present); Lecturer in Accounting, Stanford University, Graduate School of Business (2009 to present) | 45 | None |
26
Name (Year of Birth) | Position(s) Held with Funds | Length of Time Served | Principal Occupation(s) During Past 5 Years | Number of American Century Portfolios Overseen by Director | Other Directorships Held During Past 5 Years |
| Independent Directors | |||||
| Ronald J. Gilson (1946) | Director and Chairman of the Board | Since 1995 (Chairman since 2005) | Charles J. Meyers Professor of Law and Business, Emeritus, Stanford Law School (1979 to present); Marc and Eva Stern Professor of Law and Business, Columbia University School of Law (1992 to present) | 45 | None |
| Frederick L. A. Grauer (1946) | Director | Since 2008 | Senior Advisor, iShares by BlackRock, Inc. (investment management firm) (2010 to 2011, 2013 to present); Senior Advisor, Course Hero (an educational technology company) (2015 to present) | 45 | None |
| Jonathan D. Levin (1972) | Director | Since 2016 | Holbrook Working Professor of Price Theory, Stanford University, (2000 to present); Chair, Department of Economics, Stanford University (2011 to 2014) | 45 | None |
| Peter F. Pervere (1947) | Director | Since 2007 | Retired | 45 | None |
| John B. Shoven (1947) | Director | Since 2002 | Charles R. Schwab Professor of Economics, Stanford University (1973 to present) | 45 | Cadence Design Systems; Exponent; Financial Engines |
| Interested Director | |||||
| Jonathan S. Thomas (1963) | Director and President | Since 2007 | President and Chief Executive Officer, ACC (March 2007 to present). Also serves as Chief Executive Officer, ACS; Executive Vice President, ACIM; Director, ACC, ACIM and other ACC subsidiaries | 128 | BioMed Valley Discoveries, Inc. |
The Statement of Additional Information has additional information about the fund's directors and is available without charge, upon request, by calling 1-800-345-2021.
27
Officers
The following table presents certain information about the executive officers of the funds. Each officer serves as an officer for each of the 15 investment companies in the American Century family of funds, unless otherwise noted. No officer is compensated for his or her service as an officer of the funds. The listed officers are interested persons of the funds and are appointed or re-appointed on an annual basis. The mailing address for each of the officers listed below is 4500 Main Street, Kansas City, Missouri 64111.
Name (Year of Birth) | Offices with the Funds | Principal Occupation(s) During the Past Five Years |
| Jonathan S. Thomas (1963) | Director and President since 2007 | President and Chief Executive Officer, ACC (March 2007 to present). Also serves as Chief Executive Officer, ACS; Executive Vice President, ACIM; Director, ACC, ACIM and other ACC subsidiaries |
| Amy D. Shelton (1964) | Chief Compliance Officer and Vice President since 2014 | Chief Compliance Officer, American Century funds, (March 2014 to present); Chief Compliance Officer, ACIM (February 2014 to present); Chief Compliance Officer, ACIS (October 2009 to present); Vice President, Client Interactions and Marketing, ACIS (February 2013 to January 2014); Director, Client Interactions and Marketing, ACIS (June 2007 to January 2013). Also serves as Vice President, ACIS |
| Charles A. Etherington (1957) | General Counsel since 2007 and Senior Vice President since 2006 | Attorney, ACC (February 1994 to present); Vice President, ACC (November 2005 to present); General Counsel, ACC (March 2007 to present). Also serves as General Counsel, ACIM, ACS, ACIS and other ACC subsidiaries; and Senior Vice President, ACIM and ACS |
| C. Jean Wade (1964) | Vice President, Treasurer and Chief Financial Officer since 2012 | Vice President, ACS (February 2000 to present) |
| Robert J. Leach (1966) | Vice President since 2006 and Assistant Treasurer since 2012 | Vice President, ACS (February 2000 to present) |
| David H. Reinmiller (1963) | Vice President since 2001 | Attorney, ACC (January 1994 to present); Associate General Counsel, ACC (January 2001 to present). Also serves as Vice President, ACIM and ACS |
| Ward D. Stauffer (1960) | Secretary since 2005 | Attorney, ACC (June 2003 to present) |
28
| Approval of Management Agreement |
At a meeting held on June 14, 2016, the Fund’s Board of Directors (the "Board") unanimously approved the renewal of the management agreement pursuant to which American Century Investment Management, Inc. (the “Advisor”) acts as the investment advisor for the Fund. Under Section 15(c) of the Investment Company Act, contracts for investment advisory services are required to be reviewed, evaluated, and approved by a majority of a fund’s directors/trustees, including a majority of the independent Directors, each year. The Board regards this annual evaluation and renewal as one of its most important responsibilities.
The independent Directors have memorialized a statement regarding the relationship between their ongoing obligations to oversee and evaluate the performance of the Advisor and their annual consideration of renewal of the management agreement. In that statement, the independent Directors noted that their assessment of the Advisor’s performance is an ongoing process that takes place over the entire year and is informed by all of the extensive information that the Board and its committees receive and consider over time. This information, together with the additional materials provided specifically in connection with the review, are central to the Board’s assessment of the Advisor’s performance and its determination whether to renew the Fund’s management agreement.
Prior to its consideration of the renewal of the management agreement, the Board requested and reviewed extensive data and analysis relating to the proposed renewal. This information and analysis was compiled by the Advisor and certain independent providers of evaluation data concerning the Fund and the services provided to the Fund by the Advisor.
In connection with its consideration of the renewal of the management agreement, the Board’s review and evaluation of the services provided by the Advisor included, but was not limited to, the following:
| • | the nature, extent, and quality of investment management, shareholder services, and other services provided by the Advisor to the Fund; |
| • | the wide range of other programs and services the Advisor provides to the Fund and its shareholders on a routine and non-routine basis; |
| • | the investment performance of the Fund, including data comparing the Fund’s performance to appropriate benchmarks and/or a peer group of other mutual funds with similar investment objectives and strategies; |
| • | the cost of owning the Fund compared to the cost of owning similar funds; |
| • | the Advisor’s compliance policies, procedures, and regulatory experience; |
| • | financial data showing the cost of services provided to the Fund, the profitability of the Fund to the Advisor, and the overall profitability of the Advisor; |
| • | possible economies of scale associated with the Advisor’s management of the Fund and other accounts under its management; |
| • | data comparing services provided and charges to other investment management clients of the Advisor; |
| • | acquired fund fees and expenses; |
| • | payments by the Fund and the Advisor to financial intermediaries whose clients are investors in the Fund; and |
| • | any collateral benefits derived by the Advisor from the management of the Fund. |
In keeping with its practice, the Board held two in-person meetings to review and discuss the information provided in response to their request. The independent Directors also had the benefit of the advice of their independent counsel throughout the process.
29
Factors Considered
The Directors considered all of the information provided by the Advisor, the independent data providers, and the independent Directors’ independent counsel in connection with the approval. They determined that the information was sufficient for them to evaluate the management agreement for the Fund. In connection with their review, the Directors did not identify any single factor as being all-important or controlling and each Director may have attributed different levels of importance to different factors. In deciding to renew the management agreement, the Board based its decision on a number of factors, including the following:
Nature, Extent and Quality of Services - Generally. Under the management agreement, the Advisor is responsible for providing or arranging for all services necessary for the operation of the Fund. The Board noted that under the management agreement, the Advisor provides or arranges at its own expense a wide variety of services including:
| • | constructing and designing the Fund |
| • | portfolio research and security selection |
| • | initial capitalization/funding |
| • | securities trading |
| • | Fund administration |
| • | custody of Fund assets |
| • | daily valuation of the Fund’s portfolio |
| • | shareholder servicing and transfer agency, including shareholder confirmations, recordkeeping, and communications |
| • | legal services (except the independent Directors’ counsel) |
| • | regulatory and portfolio compliance |
| • | financial reporting |
| • | marketing and distribution (except amounts paid by the Fund under Rule 12b-1 plans) |
The Board noted that many of these services have expanded over time in terms of both quantity and complexity in response to shareholder demands, competition in the industry, changing distribution channels, and the changing regulatory environment.
Investment Management, Shareholder, and Other Services. The nature of the investment management services provided to the Fund is quite complex and allows Fund shareholders access to professional money management, instant diversification of their investments within an asset class, the opportunity to easily diversify among asset classes by investing in or exchanging among various American Century Investments funds, and liquidity. In evaluating investment performance, the Board expects the Advisor to manage the Fund in accordance with its investment objectives and approved strategies. Further, the Directors recognize that the Advisor has an obligation to seek the best execution of fund trades. In providing these services, the Advisor utilizes teams of investment professionals (portfolio managers, analysts, research assistants, and securities traders) who require extensive information technology, research, training, compliance, and other systems to conduct their business. The Board, directly and through its Portfolio Committee, regularly reviews investment performance information for the Fund, together with comparative information for appropriate benchmarks and/or peer groups of similarly-managed funds, over different time horizons. The Directors also review detailed performance information during the management agreement approval process. If performance concerns are identified, the Fund receives special reviews until performance improves, during which the Board discusses with the Advisor the reasons for such results (e.g., market conditions, security selection) and any efforts being undertaken to improve performance. The Fund’s performance was above its benchmark for the ten-year period and below its benchmark for the one-, three-, and five-year periods reviewed by the Board. The Board discussed the Fund's performance with the Advisor and was satisfied with the efforts being undertaken by the Advisor. The Board found the investment management services provided by the Advisor to the Fund to be satisfactory and consistent with the management agreement.
30
Under the management agreement, the Advisor provides the Fund with a comprehensive package of transfer agency, shareholder, and other services. The Board, directly and through various committees of the Board, regularly reviews reports and evaluations of such services at its regular meetings. These reports include, but are not limited to, information regarding the operational efficiency and accuracy of the shareholder and transfer agency services provided, staffing levels, shareholder satisfaction (as measured by external as well as internal sources), technology support, new products and services offered to Fund shareholders, securities trading activities, portfolio valuation services, auditing services, and legal and operational compliance activities. Certain aspects of shareholder and transfer agency service level efficiency and the quality of securities trading activities are measured by independent third party providers and are presented in comparison to other fund groups not managed by the Advisor.
The Board found the services provided by the Advisor to the Fund under the management agreement to be competitive and of high quality.
Costs of Services and Profitability. The Advisor provides detailed information concerning its cost of providing various services to the Fund, its profitability in managing the Fund, its overall profitability, and its financial condition. The Directors have reviewed with the Advisor the methodology used to prepare this financial information. This information is considered in evaluating the Advisor’s financial condition, its ability to continue to provide services under the management agreement, and the reasonableness of the current management fee. The Board concluded that the Advisor’s profits were reasonable in light of the services provided to the Fund.
Economies of Scale. The Board also reviewed information provided by the Advisor regarding the possible existence of economies of scale in connection with the management of the Fund. The Board concluded that economies of scale are difficult to measure and predict with precision, especially on a fund-by-fund basis. The Board concluded that the Advisor is appropriately sharing economies of scale through its competitive fee structure, offering competitive fees from fund inception, and through reinvestment in its business to provide shareholders enhanced and expanded services.
Comparison to Other Funds’ Fees. The management agreement provides that the Fund pays the Advisor a single, all-inclusive (or unified) management fee for providing all services necessary for the management and operation of the Fund, other than brokerage expenses, expenses attributable to short sales, taxes, interest, extraordinary expenses, the fees and expenses of the Fund’s independent Directors (including their independent legal counsel), and expenses incurred in connection with the provision of shareholder services and distribution services under a plan adopted pursuant to Rule 12b-1 under the 1940 Act. Under the unified fee structure, the Advisor is responsible for providing all investment advisory, custody, audit, administrative, compliance, recordkeeping, marketing, and shareholder services, or arranging and supervising third parties to provide such services. By contrast, most other funds are charged a variety of fees, including an investment advisory fee, a transfer agency fee, an administrative fee, distribution charges, and other expenses. Other than their investment advisory fees and any applicable Rule 12b-1 fees, all other components of the total fees charged by these other funds may be increased without shareholder approval. The Board believes the unified fee structure is a benefit to Fund shareholders because it clearly discloses to shareholders the cost of owning Fund shares, and, since the unified fee cannot be increased without a vote of Fund shareholders, it shifts to the Advisor the risk of increased costs of operating the Fund and provides a direct incentive to minimize administrative inefficiencies. Part of the Board’s analysis of fee levels involves reviewing certain evaluative data compiled by an independent provider and comparing the Fund’s unified fee to the total expense ratio of peer funds. The unified fee charged to shareholders of the Fund was at the median of the total expense ratios of the Fund’s peer group. The Board concluded that the management fee paid by the Fund to the Advisor under the management agreement is reasonable in light of the services provided to the Fund.
31
Comparison to Fees and Services Provided to Other Clients of the Advisor. The Board also requested and received information from the Advisor concerning the nature of the services, fees, costs, and profitability of its advisory services to advisory clients other than the Fund. They observed that these varying types of client accounts require different services and involve different regulatory and entrepreneurial risks than the management of the Fund. The Board analyzed this information and concluded that the fees charged and services provided to the Fund were reasonable by comparison.
Payments to Intermediaries. The Directors also requested and received a description of payments made to intermediaries by the Fund and the Advisor. These payments include various payments made by the Fund or the Advisor to different types of intermediaries and recordkeepers for distribution and service activities provided for the Fund.
Collateral or “Fall-Out” Benefits Derived by the Advisor. The Board considered the existence of collateral benefits the Advisor may receive as a result of its relationship with the Fund. The Board noted that the Advisor’s primary business is managing mutual funds and it generally does not use fund or shareholder information to generate profits in other lines of business, and therefore does not derive any significant collateral benefits from them. The Board noted that the Advisor receives proprietary research from broker-dealers that execute fund portfolio transactions. The Board also determined that the Advisor is able to provide investment management services to certain clients other than the Fund, at least in part, due to its existing infrastructure built to serve the fund complex. The Board concluded, however, that the assets of those other clients are not material to the analysis and, where applicable, may be included with the assets of the Fund to determine breakpoints in the management fee schedule.
Existing Relationship. The Board also considered whether there was any reason for not continuing the existing arrangement with the Advisor. In this regard, the Board was mindful of the potential disruptions of the Fund’s operations and various risks, uncertainties, and other effects that could occur as a result of a decision not to continue such relationship. In particular, the Board recognized that most shareholders have invested in the Fund on the strength of the Advisor’s industry standing and reputation and in the expectation that the Advisor will have a continuing role in providing advisory services to the Fund.
Conclusion of the Directors. As a result of this process, the Board, including all of the independent Directors and assisted by the advice of independent legal counsel, taking into account all of the factors discussed above and the information provided by the Advisor and others in connection with its review and throughout the year, concluded that the management agreement between the Fund and the Advisor is fair and reasonable in light of the services provided and should be renewed.
32
| Proxy Voting Results |
A special meeting of shareholders was held on June 13, 2016, to vote on the following proposal. The proposal received the required number of votes and was adopted. A summary of voting results is listed below.
To elect four directors to the Board of Directors of American Century Quantitative Equity Funds, Inc.:
| Affirmative | Withhold | ||||||
| Tanya S. Beder | $ | 8,473,153,264 | $ | 121,459,590 | |||
| Jeremy I. Bulow | $ | 8,469,793,581 | $ | 124,819,273 | |||
| Anne Casscells | $ | 8,465,895,232 | $ | 128,717,622 | |||
| Jonathan D. Levin | $ | 8,468,929,867 | $ | 125,682,987 | |||
The other directors whose term of office continued after the meeting include Jonathan S. Thomas, Ronald J. Gilson, Frederick L. A. Grauer, Peter F. Pervere and John B. Shoven.
33
| Additional Information |
Retirement Account Information
As required by law, distributions you receive from certain IRAs are subject to federal income tax withholding, unless you elect not to have withholding apply. Tax will be withheld on the total amount withdrawn even though you may be receiving amounts that are not subject to withholding, such as nondeductible contributions. In such case, excess amounts of withholding could occur. You may adjust your withholding election so that a greater or lesser amount will be withheld.
If you don’t want us to withhold on this amount, you must notify us to not withhold the federal income tax. You may notify us in writing or in certain situations by telephone or through other electronic means. For systematic withdrawals, your withholding election will remain in effect until revoked or changed by filing a new election. You have the right to revoke your election at any time.
Remember, even if you elect not to have income tax withheld, you are liable for paying income tax on the taxable portion of your withdrawal. If you elect not to have income tax withheld or you don’t have enough income tax withheld, you may be responsible for payment of estimated tax. You may incur penalties under the estimated tax rules if your withholding and estimated tax payments are not sufficient. You can reduce or defer the income tax on a distribution by directly or indirectly rolling such distribution over to another IRA or eligible plan. You should consult your tax advisor for additional information.
State tax will be withheld if, at the time of your distribution, your address is within one of the mandatory withholding states and you have federal income tax withheld (or as otherwise required by state law). State taxes will be withheld from your distribution in accordance with the respective state rules.
Distributions you receive from 403(b), 457 and qualified plans are subject to special tax and withholding rules. Your plan administrator or plan sponsor is required to provide you with a special tax notice explaining those rules at the time you request a distribution. If applicable, federal and/or state taxes may be withheld from your distribution amount.
Proxy Voting Policies
Descriptions of the principles and policies that the fund's investment advisor uses in exercising the voting rights associated with the securities purchased and/or held by the fund are available without charge, upon request, by calling 1-800-345-2021 or visiting the "About Us" page of American Century Investments’ website at americancentury.com. A description of the policies is also available on the Securities and Exchange Commission’s website at sec.gov. Information regarding how the investment advisor voted proxies relating to portfolio securities during the most recent 12-month period ended June 30 is available on the "About Us" page at americancentury.com. It is also available at sec.gov.
Quarterly Portfolio Disclosure
The fund files its complete schedule of portfolio holdings with the Securities and Exchange Commission (SEC) for the first and third quarters of each fiscal year on Form N-Q. The fund’s Forms N-Q are available on the SEC’s website at sec.gov, and may be reviewed and copied at the SEC’s Public Reference Room in Washington, DC. Information on the operation of the Public Reference Room may be obtained by calling 1-800-SEC-0330. The fund also makes its complete schedule of portfolio holdings for the most recent quarter of its fiscal year available on its website at americancentury.com and, upon request, by calling 1-800-345-2021.
34
Other Tax Information
The following information is provided pursuant to provisions of the Internal Revenue Code.
The fund hereby designates up to the maximum amount allowable as qualified dividend income for the fiscal year ended June 30, 2016.
For corporate taxpayers, the fund hereby designates $9,914,767, or up to the maximum amount allowable, of ordinary income distributions paid during the fiscal year ended June 30, 2016 as qualified for the corporate dividends received deduction.
The fund hereby designates $8,622,180 as qualified short-term capital gain distributions for purposes of Internal Revenue Code Section 871 for the fiscal year ended June 30, 2016.
The fund hereby designates $5,447,555, or up to the maximum amount allowable, as long-term capital gain distributions (20% rate gain distributions) for the fiscal year ended June 30, 2016.
35
| Notes |
36
| ||
| Contact Us | americancentury.com | |
| Automated Information Line | 1-800-345-8765 | |
| Investor Services Representative | 1-800-345-2021 or 816-531-5575 | |
| Investors Using Advisors | 1-800-378-9878 | |
| Business, Not-For-Profit, Employer-Sponsored Retirement Plans | 1-800-345-3533 | |
| Banks and Trust Companies, Broker-Dealers, Financial Professionals, Insurance Companies | 1-800-345-6488 | |
| Telecommunications Relay Service for the Deaf | 711 | |
| American Century Quantitative Equity Funds, Inc. | ||
Investment Advisor: American Century Investment Management, Inc. Kansas City, Missouri | ||
| This report and the statements it contains are submitted for the general information of our shareholders. The report is not authorized for distribution to prospective investors unless preceded or accompanied by an effective prospectus. | ||
| ©2016 American Century Proprietary Holdings, Inc. All rights reserved. CL-ANN-89953 1608 | ||
| Annual Report | |
| June 30, 2016 | |
| Disciplined Growth Plus Fund | |
| Table of Contents |
| President's Letter | 2 | |
| Performance | 3 | |
| Portfolio Commentary | ||
| Fund Characteristics | ||
| Shareholder Fee Example | ||
| Schedule of Investments | ||
| Statement of Assets and Liabilities | ||
| Statement of Operations | ||
| Statement of Changes in Net Assets | ||
| Statement of Cash Flows | ||
| Notes to Financial Statements | ||
| Financial Highlights | ||
| Report of Independent Registered Public Accounting Firm | ||
| Management | ||
| Approval of Management Agreement | ||
| Proxy Voting Results | ||
| Additional Information | ||
Any opinions expressed in this report reflect those of the author as of the date of the report, and do not necessarily represent the opinions of American Century Investments® or any other person in the American Century Investments organization. Any such opinions are subject to change at any time based upon market or other conditions and American Century Investments disclaims any responsibility to update such opinions. These opinions may not be relied upon as investment advice and, because investment decisions made by American Century Investments funds are based on numerous factors, may not be relied upon as an indication of trading intent on behalf of any American Century Investments fund. Security examples are used for representational purposes only and are not intended as recommendations to purchase or sell securities. Performance information for comparative indices and securities is provided to American Century Investments by third party vendors. To the best of American Century Investments’ knowledge, such information is accurate at the time of printing.
| President’s Letter |
Jonathan ThomasDear Investor:
Thank you for reviewing this annual report for the 12 months ended June 30, 2016. It provides investment performance and portfolio information for the reporting period, plus longer-term historical performance data.
Annual reports remain important vehicles for conveying information about fund returns, including market and economic factors that affected performance during the reporting period. For additional, updated investment and market insights, we encourage you to visit our website, americancentury.com.
Market Volatility Increased, But Not for the Reasons Anticipated
Going into this reporting period, investors anticipated increased market volatility and uncertainty as the Federal Reserve (the Fed) appeared poised to raise short-term interest rates toward more historically normal levels. This policy change was expected to affect investor sentiment, U.S. Treasury yield behavior, relative currency values, inflation expectations, and corporate costs and earnings.
This Fed-centric outlook didn’t fully account for global factors, which ultimately drove sentiment, volatility, and performance during the reporting period. During 2015, the primary catalyst was China, where slowing economic growth, currency devaluations, and massive monetary policy easing sent shock waves through the global markets. The Fed ended up delaying (until December 2015) its only small rate hike during the reporting period. Afterward, China-related events repeated in January and early February this year, further delaying Fed action.
Oil was another catalyst—its price collapses devalued entire market sectors and contributed to broad market volatility and negative sentiment. Later, as China and oil appeared to stabilize, Brexit occurred—the unexpected decision by United Kingdom voters to leave the European Union. This produced more shock waves, and altered central bank policies around the world. In this environment, relatively defensive assets performed best for the 12 months, including the stocks of gold-producing companies, utilities, real estate investment trusts (REITs), and long-maturity U.S. Treasury securities.
Looking ahead, we believe the markets face further uncertainty and volatility as they digest Brexit, the Italian bank crisis, China’s economic mysteries, and the U.S. presidential election. Negative interest rates in Europe and Japan represent part of the market’s response to the global macroeconomic climate. These negative rates are suppressing interest rates around the world while driving up the value of the U.S. dollar and U.S. bonds. In a broad sense, stocks also benefit from the central bank stimulus that is driving interest rates into negative territory, and from relative yield advantages as bond yields are pushed lower. It’s an unusual and challenging environment. We appreciate your continued trust in us.
Sincerely,
Jonathan Thomas
President and Chief Executive Officer
American Century Investments
2
| Performance |
| Total Returns as of June 30, 2016 | ||||
| Average Annual Returns | ||||
| Ticker Symbol | 1 year | Since Inception | Inception Date | |
| Investor Class | ACDJX | -1.40% | 13.47% | 10/31/11 |
| Russell 1000 Growth Index | — | 3.02% | 14.17% | — |
| Institutional Class | ACDKX | -1.26% | 13.68% | 10/31/11 |
| A Class | ACDQX | 10/31/11 | ||
| No sales charge | -1.72% | 13.17% | ||
| With sales charge | -7.36% | 11.74% | ||
| C Class | ACDHX | -2.38% | 12.34% | 10/31/11 |
| R Class | ACDWX | -1.91% | 12.90% | 10/31/11 |
Sales charges include initial sales charges and contingent deferred sales charges (CDSCs), as applicable. A Class shares have a 5.75% maximum initial sales charge and may be subject to a maximum CDSC of 1.00%. C Class shares redeemed within 12 months of purchase are subject to a maximum CDSC of 1.00%. The SEC requires that mutual funds provide performance information net of maximum sales charges in all cases where charges could be applied.
Data presented reflect past performance. Past performance is no guarantee of future results. Current performance may be higher or lower than the performance shown. Total returns for periods less than one year are not annualized. Investment return and principal value will fluctuate, and redemption value may be more or less than original cost. Data assumes reinvestment of dividends and capital gains, and none of the charts reflect the deduction of taxes that a shareholder would pay on fund distributions or the redemption of fund shares. To obtain performance data current to the most recent month end, please call 1-800-345-2021 or visit americancentury.com. For additional information about the fund, please consult the prospectus.
3
| Growth of $10,000 Over Life of Class |
| $10,000 investment made October 31, 2011 |
| Performance for other share classes will vary due to differences in fee structure. |
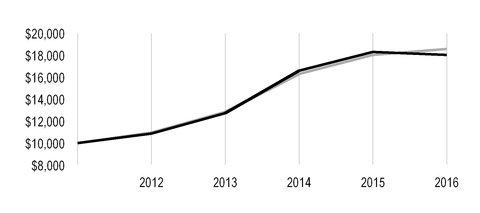
| Value on June 30, 2016 | |
| Investor Class — $18,037 | |
| Russell 1000 Growth Index — $18,567 | |
| Total Annual Fund Operating Expenses | ||||
| Investor Class | Institutional Class | A Class | C Class | R Class |
| 1.80% | 1.60% | 2.05% | 2.80% | 2.30% |
The total annual fund operating expenses shown is as stated in the fund’s prospectus current as of the date of this report. The prospectus may vary from the expense ratio shown elsewhere in this report because it is based on a different time period, includes acquired fund fees and expenses, and, if applicable, does not include fee waivers or expense reimbursements.
Data presented reflect past performance. Past performance is no guarantee of future results. Current performance may be higher or lower than the performance shown. Total returns for periods less than one year are not annualized. Investment return and principal value will fluctuate, and redemption value may be more or less than original cost. Data assumes reinvestment of dividends and capital gains, and none of the charts reflect the deduction of taxes that a shareholder would pay on fund distributions or the redemption of fund shares. To obtain performance data current to the most recent month end, please call 1-800-345-2021 or visit americancentury.com. For additional information about the fund, please consult the prospectus.
4
| Portfolio Commentary |
Portfolio Managers: Scott Wittman and Lynette Pang
In May 2016, portfolio manager Bill Martin left the fund's management team.
Performance Summary
Disciplined Growth Plus returned -1.40%* for the fiscal year ended June 30, 2016, compared with the 3.02% return of its benchmark, the Russell 1000 Growth Index.
Disciplined Growth Plus declined during the 12-month period, underperforming its benchmark, the Russell 1000 Growth Index. The fund’s stock selection process incorporates factors of valuation, quality, growth, and sentiment while striving to minimize unintended risks along industries and other risk characteristics. Within the fund, valuation proved most difficult, while growth indicators benefited the returns. Stock selection in the industrials sector was a leading detractor from fund results, although the financials sector also weighed on returns. Conversely, security selection in the materials and health care sectors aided relative returns.
Industrials Sector Led Detractors
Several portfolio-only industrials holdings that declined steeply positioned the sector as a leading detractor from fund returns. Among these was ARC Document Solutions, a document solutions provider for the architectural, engineering, and construction industries. The company’s lower-than-expected financial results sent its share price plunging as delays in key managed print services contracts and lower demand for large-format printing pressured earnings. A position in Astronics, an aerospace and defense supplier of high-performance lighting and safety systems, was detrimental following its steep price decline on disappointing third-quarter growth in the aerospace sector. We subsequently sold our investments in both companies.
Consumer discretionary holdings also weighed on results, including an overweight position, relative to the index, in GoPro. The wearable camera maker’s stock slumped on concerns about economic growth in China and a bleak outlook for wearable camera demand, and we liquidated the fund’s position. Similarly, restaurant franchise operator Brinker International dampened results due to softer-than-expected sales at its Chili’s casual restaurants. We maintain the portfolio overweight based on strong valuation and quality metrics.
A number of information technology holdings were key detractors. An overweight position in VMware, a virtualization infrastructure solutions provider, weighed on returns as its stock fell on investor worries about its uncertain future following announcement of a merger between its majority owner EMC and Dell. We maintain our positioning based on the stock’s attractive valuation, sentiment, and quality attributes.
Materials and Health Care Outperformed
Stock selection among materials holdings, particularly in chemicals companies, was a leading relative contributor to the fund’s 12-month results. Prominent outperformers included Trinseo, a portfolio-only investment. The maker of emulsion polymers and plastics advanced on quarterly
earnings results that exceeded expectations. Attractive valuation, quality, and growth factors support our overweight exposure in the holding. Another key contributor was a short position (a trade made to benefit from a stock’s price decline) in LSB Industries, a chemicals and heating,
* All fund returns referenced in this commentary are for Investor Class shares. Performance for other share classes will vary due to differences in fee structure; when Investor Class performance exceeds that of the fund's benchmark, other share classes may not. See page 3 for returns for all share classes.
5
ventilation, and air conditioning products manufacturer. The company’s quarterly financial results were lower than anticipated, as bookings for its climate control business and revenue from chemicals both declined substantially. We ultimately exited the short position.
Another short position that benefited the fund’s results was in the health care sector. Brookdale Senior Living, an operator of senior living communities, fell after reporting disappointing fourth-quarter results. The short position was subsequently exited. Elsewhere in the sector, a portfolio-investment in Merge Healthcare aided results after the health care information company rallied strongly on news of its acquisition by IBM, and we exited the position.
A Look Ahead
At period-end, information technology and consumer staples were the fund’s largest overweight positions on a sector basis. We think that software and internet software and services companies are attractive in the information technology sector, where key themes are mobile, search, cloud computing, big data, and the shift to digital/online retail. This is creating growth and quality opportunities. Valuation and sentiment also are positive for select firms in these industries. In consumer staples, we are finding opportunities in household goods manufacturers. After the dramatic sell-off in 2015, health care names, particularly in the biotech space, are compelling based on valuation factors. Growth and quality metrics also are favorable. The consumer discretionary and financials sectors, both portfolio underweights, continue to face challenges, in our opinion. Growth scores are not favorable in consumer discretionary, particularly among specialty retailers. In fundamental terms, many of these traditional brick-and-mortar retailers face challenging business conditions and have poor growth and quality rankings. We find that large-cap real estate investment trusts and diversified financial services firms are challenged across virtually all dimensions. Our disciplined, objective, and systematic investment strategy is designed to take advantage of opportunities at the individual company level in both the long and short portions of the portfolio. We believe this approach is the most powerful way to capitalize on market inefficiencies that lead to the mispricing of individual stocks.
6
| Fund Characteristics |
| JUNE 30, 2016 | |
| Top Ten Long Holdings | % of net assets |
| Apple, Inc. | 5.46% |
| Alphabet, Inc., Class A | 4.75% |
| Amazon.com, Inc. | 3.49% |
| Facebook, Inc., Class A | 3.24% |
| Microsoft Corp. | 3.23% |
| Walt Disney Co. (The) | 2.36% |
| PepsiCo, Inc. | 2.05% |
| Verizon Communications, Inc. | 1.85% |
| CVS Health Corp. | 1.72% |
| International Business Machines Corp. | 1.61% |
| Top Five Short Holdings | % of net assets |
| Deltic Timber Corp. | (0.93)% |
| Providence Service Corp. (The) | (0.84)% |
| Inventure Foods, Inc. | (0.83)% |
| Louisiana-Pacific Corp. | (0.78)% |
| Acadia Healthcare Co., Inc. | (0.78)% |
| Types of Investments in Portfolio | % of net assets |
| Common Stocks | 127.4% |
| Common Stocks Sold Short | (28.2)% |
| Temporary Cash Investments | 0.9% |
| Other Assets and Liabilities | (0.1)% |
7
| Shareholder Fee Example |
Fund shareholders may incur two types of costs: (1) transaction costs, including sales charges (loads) on purchase payments and redemption/exchange fees; and (2) ongoing costs, including management fees; distribution and service (12b-1) fees; and other fund expenses. This example is intended to help you understand your ongoing costs (in dollars) of investing in your fund and to compare these costs with the ongoing cost of investing in other mutual funds.
The example is based on an investment of $1,000 made at the beginning of the period and held for the entire period from January 1, 2016 to June 30, 2016.
Actual Expenses
The table provides information about actual account values and actual expenses for each class. You may use the information, together with the amount you invested, to estimate the expenses that you paid over the period. First, identify the share class you own. Then simply divide your account value by $1,000 (for example, an $8,600 account value divided by $1,000 = 8.6), then multiply the result by the number under the heading “Expenses Paid During Period” to estimate the expenses you paid on your account during this period.
If you hold Investor Class shares of any American Century Investments fund, or Institutional Class shares of the American Century Diversified Bond Fund, in an American Century Investments account (i.e., not a financial intermediary or retirement plan account), American Century Investments may charge you a $12.50 semiannual account maintenance fee if the value of those shares is less than $10,000. We will redeem shares automatically in one of your accounts to pay the $12.50 fee. In determining your total eligible investment amount, we will include your investments in all personal accounts (including American Century Investments Brokerage accounts) registered under your Social Security number. Personal accounts include individual accounts, joint accounts, UGMA/UTMA accounts, personal trusts, Coverdell Education Savings Accounts and IRAs (including traditional, Roth, Rollover, SEP-, SARSEP- and SIMPLE-IRAs), and certain other retirement accounts. If you have only business, business retirement, employer-sponsored or American Century Investments Brokerage accounts, you are currently not subject to this fee. If you are subject to the Account Maintenance Fee, your account value could be reduced by the fee amount.
Hypothetical Example for Comparison Purposes
The table also provides information about hypothetical account values and hypothetical expenses based on the actual expense ratio of each class of your fund and an assumed rate of return of 5% per year before expenses, which is not the actual return of a fund’s share class. The hypothetical account values and expenses may not be used to estimate the actual ending account balance or expenses you paid for the period. You may use this information to compare the ongoing costs of investing in your fund and other funds. To do so, compare this 5% hypothetical example with the 5% hypothetical examples that appear in the shareholder reports of the other funds.
Please note that the expenses shown in the table are meant to highlight your ongoing costs only and do not reflect any transactional costs, such as sales charges (loads) or redemption/exchange fees. Therefore, the table is useful in comparing ongoing costs only, and will not help you determine the relative total costs of owning different funds. In addition, if these transactional costs were included, your costs would have been higher.
8
| Beginning Account Value 1/1/16 | Ending Account Value 6/30/16 | Expenses Paid During Period(1) 1/1/16 - 6/30/16 | Annualized Expense Ratio(1) | |
| Actual | ||||
| Investor Class | $1,000 | $992.00 | $9.71 | 1.96% |
| Institutional Class | $1,000 | $992.60 | $8.72 | 1.76% |
| A Class | $1,000 | $990.70 | $10.94 | 2.21% |
| C Class | $1,000 | $987.30 | $14.63 | 2.96% |
| R Class | $1,000 | $989.40 | $12.17 | 2.46% |
| Hypothetical | ||||
| Investor Class | $1,000 | $1,015.12 | $9.82 | 1.96% |
| Institutional Class | $1,000 | $1,016.11 | $8.82 | 1.76% |
| A Class | $1,000 | $1,013.87 | $11.07 | 2.21% |
| C Class | $1,000 | $1,010.14 | $14.79 | 2.96% |
| R Class | $1,000 | $1,012.63 | $12.31 | 2.46% |
| (1) | Expenses are equal to the class's annualized expense ratio listed in the table above, multiplied by the average account value over the period, multiplied by 182, the number of days in the most recent fiscal half-year, divided by 366, to reflect the one-half year period. |
9
| Schedule of Investments |
JUNE 30, 2016
| Shares | Value | |||
| COMMON STOCKS — 127.4% | ||||
| Aerospace and Defense — 4.3% | ||||
Aerojet Rocketdyne Holdings, Inc.(1)(2) | 5,971 | $ | 109,150 | |
B/E Aerospace, Inc.(1) | 8,854 | 408,833 | ||
Boeing Co. (The)(1) | 4,856 | 630,649 | ||
Honeywell International, Inc.(1) | 530 | 61,650 | ||
Huntington Ingalls Industries, Inc.(1) | 513 | 86,199 | ||
Spirit AeroSystems Holdings, Inc., Class A(1)(2) | 4,021 | 172,903 | ||
Textron, Inc.(1) | 10,405 | 380,407 | ||
| 1,849,791 | ||||
| Air Freight and Logistics — 1.5% | ||||
Hub Group, Inc., Class A(2) | 751 | 28,816 | ||
United Parcel Service, Inc., Class B(1) | 5,737 | 617,989 | ||
| 646,805 | ||||
| Airlines — 1.2% | ||||
Hawaiian Holdings, Inc.(1)(2) | 5,456 | 207,110 | ||
JetBlue Airways Corp.(2) | 2,068 | 34,246 | ||
Southwest Airlines Co.(1) | 7,339 | 287,762 | ||
| 529,118 | ||||
| Auto Components — 0.4% | ||||
Cooper-Standard Holding, Inc.(2) | 593 | 46,841 | ||
| Lear Corp. | 1,123 | 114,276 | ||
Stoneridge, Inc.(2) | 1,824 | 27,251 | ||
| 188,368 | ||||
| Beverages — 3.5% | ||||
Coca-Cola Co. (The)(1) | 9,885 | 448,087 | ||
Dr Pepper Snapple Group, Inc.(1) | 1,805 | 174,417 | ||
PepsiCo, Inc.(1) | 8,318 | 881,209 | ||
| 1,503,713 | ||||
| Biotechnology — 8.7% | ||||
AbbVie, Inc.(1) | 8,390 | 519,425 | ||
Aduro Biotech, Inc.(2) | 9,013 | 101,937 | ||
Alexion Pharmaceuticals, Inc.(2) | 220 | 25,687 | ||
Amgen, Inc.(1) | 3,799 | 578,018 | ||
Biogen, Inc.(1)(2) | 1,306 | 315,817 | ||
Celgene Corp.(1)(2) | 4,239 | 418,093 | ||
Cepheid, Inc.(2) | 2,330 | 71,647 | ||
FibroGen, Inc.(1)(2) | 5,242 | 86,021 | ||
| Gilead Sciences, Inc. | 6,749 | 563,002 | ||
Incyte Corp.(1)(2) | 1,874 | 149,882 | ||
Juno Therapeutics, Inc.(2) | 2,430 | 93,409 | ||
Lexicon Pharmaceuticals, Inc.(1)(2) | 7,414 | 106,391 | ||
Medivation, Inc.(1)(2) | 2,292 | 138,208 | ||
Myriad Genetics, Inc.(2) | 3,147 | 96,298 | ||
Opko Health, Inc.(1)(2) | 11,385 | 106,336 | ||
Regeneron Pharmaceuticals, Inc.(1)(2) | 599 | 209,189 | ||
Spectrum Pharmaceuticals, Inc.(1)(2) | 11,887 | 78,098 | ||
10
| Shares | Value | |||
United Therapeutics Corp.(1)(2) | 997 | $ | 105,602 | |
| 3,763,060 | ||||
| Building Products — 1.6% | ||||
| Apogee Enterprises, Inc. | 2,424 | 112,352 | ||
Insteel Industries, Inc.(1) | 10,768 | 307,857 | ||
Masonite International Corp.(2) | 820 | 54,235 | ||
NCI Building Systems, Inc.(2) | 13,356 | 213,563 | ||
| 688,007 | ||||
| Capital Markets — 1.2% | ||||
Artisan Partners Asset Management, Inc., Class A(1) | 7,304 | 202,175 | ||
Federated Investors, Inc., Class B(1) | 7,318 | 210,612 | ||
Medley Management, Inc.(1) | 11,027 | 64,839 | ||
| WisdomTree Investments, Inc. | 2,993 | 29,301 | ||
| 506,927 | ||||
| Chemicals — 5.2% | ||||
Air Products & Chemicals, Inc.(1) | 3,197 | 454,102 | ||
Chase Corp.(1) | 5,263 | 310,885 | ||
LyondellBasell Industries NV, Class A(1) | 3,574 | 265,977 | ||
Minerals Technologies, Inc.(1) | 386 | 21,925 | ||
| PPG Industries, Inc. | 4,333 | 451,282 | ||
| RPM International, Inc. | 1,286 | 64,236 | ||
| Sherwin-Williams Co. (The) | 1,288 | 378,247 | ||
Trinseo SA(1)(2) | 6,752 | 289,863 | ||
| 2,236,517 | ||||
| Commercial Services and Supplies — 1.6% | ||||
Deluxe Corp.(1) | 878 | 58,273 | ||
Herman Miller, Inc.(1) | 9,025 | 269,757 | ||
Interface, Inc.(1) | 22,935 | 349,759 | ||
| 677,789 | ||||
| Communications Equipment — 1.6% | ||||
Arista Networks, Inc.(1)(2) | 1,413 | 90,969 | ||
Ciena Corp.(1)(2) | 15,224 | 285,450 | ||
Extreme Networks, Inc.(1)(2) | 55,898 | 189,494 | ||
Infinera Corp.(1)(2) | 5,749 | 64,849 | ||
ShoreTel, Inc.(1)(2) | 7,773 | 52,001 | ||
| 682,763 | ||||
| Construction Materials — 0.6% | ||||
Headwaters, Inc.(1)(2) | 14,384 | 258,049 | ||
| Containers and Packaging — 0.7% | ||||
Berry Plastics Group, Inc.(1)(2) | 6,956 | 270,240 | ||
Graphic Packaging Holding Co.(1) | 3,096 | 38,824 | ||
| 309,064 | ||||
| Diversified Telecommunication Services — 1.9% | ||||
Verizon Communications, Inc.(1) | 14,267 | 796,669 | ||
| Electrical Equipment — 0.4% | ||||
General Cable Corp.(1) | 13,729 | 174,496 | ||
| Food and Staples Retailing — 2.5% | ||||
CVS Health Corp.(1) | 7,719 | 739,017 | ||
Walgreens Boots Alliance, Inc.(1) | 3,929 | 327,168 | ||
| 1,066,185 | ||||
11
| Shares | Value | |||
| Food Products — 6.1% | ||||
Cal-Maine Foods, Inc.(1) | 6,657 | $ | 295,038 | |
| Campbell Soup Co. | 1,001 | 66,597 | ||
Dean Foods Co.(1) | 18,750 | 339,187 | ||
| Fresh Del Monte Produce, Inc. | 509 | 27,705 | ||
General Mills, Inc.(1) | 7,144 | 509,510 | ||
Hormel Foods Corp.(1) | 9,178 | 335,915 | ||
Ingredion, Inc.(1) | 2,650 | 342,936 | ||
Pilgrim's Pride Corp.(1) | 12,447 | 317,150 | ||
Tyson Foods, Inc., Class A(1) | 5,807 | 387,850 | ||
| 2,621,888 | ||||
| Health Care Equipment and Supplies — 4.2% | ||||
| Baxter International, Inc. | 1,467 | 66,338 | ||
| Becton Dickinson and Co. | 1,722 | 292,034 | ||
Boston Scientific Corp.(2) | 7,372 | 172,284 | ||
C.R. Bard, Inc.(1) | 1,997 | 469,614 | ||
Hologic, Inc.(1)(2) | 9,082 | 314,237 | ||
| ResMed, Inc. | 3,362 | 212,579 | ||
SurModics, Inc.(1)(2) | 4,124 | 96,832 | ||
| Utah Medical Products, Inc. | 2,879 | 181,377 | ||
| 1,805,295 | ||||
| Health Care Providers and Services — 4.0% | ||||
Aetna, Inc.(1) | 2,073 | 253,175 | ||
AmerisourceBergen Corp.(1) | 5,080 | 402,946 | ||
BioTelemetry, Inc.(2) | 6,107 | 99,544 | ||
Express Scripts Holding Co.(1)(2) | 6,406 | 485,575 | ||
HCA Holdings, Inc.(2) | 272 | 20,947 | ||
| HealthSouth Corp. | 3,997 | 155,163 | ||
Laboratory Corp. of America Holdings(2) | 966 | 125,841 | ||
UnitedHealth Group, Inc.(1) | 1,200 | 169,440 | ||
WellCare Health Plans, Inc.(2) | 221 | 23,709 | ||
| 1,736,340 | ||||
| Health Care Technology — 0.9% | ||||
Medidata Solutions, Inc.(1)(2) | 8,527 | 399,660 | ||
| Hotels, Restaurants and Leisure — 5.7% | ||||
Bloomin' Brands, Inc.(1) | 17,389 | 310,741 | ||
Bob Evans Farms, Inc.(1) | 7,286 | 276,504 | ||
Boyd Gaming Corp.(1)(2) | 1,344 | 24,729 | ||
Brinker International, Inc.(1) | 7,973 | 363,011 | ||
| Churchill Downs, Inc. | 562 | 71,014 | ||
Darden Restaurants, Inc.(1) | 6,225 | 394,291 | ||
Dave & Buster's Entertainment, Inc.(2) | 1,163 | 54,417 | ||
Diamond Resorts International, Inc.(1)(2) | 6,014 | 180,179 | ||
Isle of Capri Casinos, Inc.(1)(2) | 19,877 | 364,147 | ||
McDonald's Corp.(1) | 1,782 | 214,446 | ||
Starbucks Corp.(1) | 2,323 | 132,690 | ||
| Yum! Brands, Inc. | 592 | 49,089 | ||
| 2,435,258 | ||||
| Household Products — 1.0% | ||||
Central Garden & Pet Co.(1)(2) | 6,326 | 137,338 | ||
12
| Shares | Value | |||
| Clorox Co. (The) | 2,116 | $ | 292,833 | |
| 430,171 | ||||
| Industrial Conglomerates — 1.1% | ||||
3M Co.(1) | 512 | 89,661 | ||
Carlisle Cos., Inc.(1) | 3,628 | 383,407 | ||
| 473,068 | ||||
| Insurance — 1.3% | ||||
| Aon plc | 1,838 | 200,765 | ||
| Arthur J. Gallagher & Co. | 1,716 | 81,682 | ||
eHealth, Inc.(1)(2) | 9,720 | 136,274 | ||
State National Cos., Inc.(1) | 7,040 | 74,131 | ||
Universal Insurance Holdings, Inc.(1) | 3,673 | 68,244 | ||
| 561,096 | ||||
| Internet and Catalog Retail — 5.6% | ||||
Amazon.com, Inc.(1)(2) | 2,101 | 1,503,518 | ||
Etsy, Inc.(1)(2) | 17,332 | 166,214 | ||
Liberty Interactive Corp. QVC Group, Class A(1)(2) | 16,846 | 427,383 | ||
Shutterfly, Inc.(1)(2) | 7,182 | 334,753 | ||
| 2,431,868 | ||||
| Internet Software and Services — 10.1% | ||||
Alphabet, Inc., Class A(1)(2) | 2,904 | 2,043,051 | ||
Brightcove, Inc.(1)(2) | 9,341 | 82,201 | ||
Care.com, Inc.(2) | 23,765 | 277,575 | ||
Facebook, Inc., Class A(1)(2) | 12,193 | 1,393,416 | ||
GoDaddy, Inc., Class A(2) | 6,633 | 206,883 | ||
Shutterstock, Inc.(2) | 2,393 | 109,599 | ||
Twitter, Inc.(1)(2) | 9,710 | 164,196 | ||
XO Group, Inc.(1)(2) | 3,613 | 62,975 | ||
| 4,339,896 | ||||
| IT Services — 5.9% | ||||
Accenture plc, Class A(1) | 3,744 | 424,158 | ||
CSG Systems International, Inc.(1) | 7,659 | 308,734 | ||
| Global Payments, Inc. | 3,337 | 238,195 | ||
International Business Machines Corp.(1) | 4,562 | 692,420 | ||
Square, Inc.(1)(2) | 9,160 | 82,898 | ||
Syntel, Inc.(2) | 499 | 22,585 | ||
Teradata Corp.(1)(2) | 11,911 | 298,609 | ||
Travelport Worldwide Ltd.(1) | 14,785 | 190,579 | ||
Visa, Inc., Class A(1) | 3,895 | 288,892 | ||
| 2,547,070 | ||||
| Leisure Products — 1.5% | ||||
Nautilus, Inc.(1)(2) | 17,855 | 318,533 | ||
Smith & Wesson Holding Corp.(1)(2) | 11,926 | 324,149 | ||
| 642,682 | ||||
| Life Sciences Tools and Services — 1.6% | ||||
Bruker Corp.(1) | 13,933 | 316,837 | ||
INC Research Holdings, Inc., Class A(1)(2) | 2,338 | 89,148 | ||
Luminex Corp.(1)(2) | 4,897 | 99,066 | ||
| Thermo Fisher Scientific, Inc. | 1,138 | 168,151 | ||
| 673,202 | ||||
13
| Shares | Value | |||
| Machinery — 3.2% | ||||
| Illinois Tool Works, Inc. | 983 | $ | 102,389 | |
PACCAR, Inc.(1) | 7,625 | 395,509 | ||
Stanley Black & Decker, Inc.(1) | 3,355 | 373,143 | ||
| Toro Co. (The) | 3,856 | 340,099 | ||
Wabash National Corp.(1)(2) | 12,163 | 154,470 | ||
| 1,365,610 | ||||
| Media — 4.3% | ||||
CBS Corp., Class B(1) | 1,622 | 88,302 | ||
Comcast Corp., Class A(1) | 4,437 | 289,248 | ||
| Time Warner, Inc. | 872 | 64,127 | ||
Viacom, Inc., Class B(1) | 9,309 | 386,044 | ||
Walt Disney Co. (The)(1) | 10,373 | 1,014,687 | ||
| 1,842,408 | ||||
| Metals and Mining — 1.2% | ||||
| Kaiser Aluminum Corp. | 2,668 | 241,214 | ||
| Steel Dynamics, Inc. | 10,806 | 264,747 | ||
| 505,961 | ||||
| Multiline Retail — 0.7% | ||||
Target Corp.(1) | 4,361 | 304,485 | ||
| Oil, Gas and Consumable Fuels — 0.8% | ||||
| Apache Corp. | 1,968 | 109,558 | ||
Par Pacific Holdings, Inc.(1)(2) | 16,673 | 255,764 | ||
| 365,322 | ||||
| Personal Products — 1.0% | ||||
Herbalife Ltd.(1)(2) | 2,885 | 168,859 | ||
Medifast, Inc.(1) | 6,156 | 204,810 | ||
| Natural Health Trends Corp. | 1,432 | 40,368 | ||
| 414,037 | ||||
| Pharmaceuticals — 2.6% | ||||
Bristol-Myers Squibb Co.(1) | 2,345 | 172,475 | ||
Eli Lilly & Co.(1) | 2,883 | 227,036 | ||
Johnson & Johnson(1) | 4,663 | 565,622 | ||
Mylan NV(1)(2) | 3,239 | 140,054 | ||
| 1,105,187 | ||||
| Professional Services — 0.6% | ||||
| Insperity, Inc. | 694 | 53,598 | ||
Mistras Group, Inc.(2) | 8,712 | 207,955 | ||
| 261,553 | ||||
| Real Estate Investment Trusts (REITs) — 1.6% | ||||
| American Tower Corp. | 2,103 | 238,922 | ||
Lamar Advertising Co., Class A(1) | 4,538 | 300,869 | ||
| PS Business Parks, Inc. | 1,384 | 146,815 | ||
| 686,606 | ||||
| Real Estate Management and Development — 0.8% | ||||
Marcus & Millichap, Inc.(1)(2) | 13,886 | 352,843 | ||
| Road and Rail — 0.1% | ||||
YRC Worldwide, Inc.(2) | 4,552 | 40,058 | ||
| Semiconductors and Semiconductor Equipment — 3.3% | ||||
Applied Materials, Inc.(1) | 19,953 | 478,273 | ||
| Broadcom Ltd. | 1,149 | 178,555 | ||
14
| Shares | Value | |||
Integrated Device Technology, Inc.(2) | 1,963 | $ | 39,515 | |
Intel Corp.(1) | 12,505 | 410,164 | ||
| Lam Research Corp. | 429 | 36,062 | ||
| NVIDIA Corp. | 1,957 | 91,999 | ||
| QUALCOMM, Inc. | 2,193 | 117,479 | ||
| Skyworks Solutions, Inc. | 534 | 33,792 | ||
Synaptics, Inc.(2) | 994 | 53,427 | ||
| 1,439,266 | ||||
| Software — 10.3% | ||||
A10 Networks, Inc.(2) | 31,075 | 201,055 | ||
Adobe Systems, Inc.(1)(2) | 5,672 | 543,321 | ||
Aspen Technology, Inc.(1)(2) | 3,042 | 122,410 | ||
Cadence Design Systems, Inc.(1)(2) | 15,763 | 383,041 | ||
Citrix Systems, Inc.(2) | 3,053 | 244,515 | ||
Electronic Arts, Inc.(1)(2) | 4,253 | 322,207 | ||
Intuit, Inc.(1) | 4,533 | 505,928 | ||
Manhattan Associates, Inc.(2) | 1,026 | 65,797 | ||
Microsoft Corp.(1) | 27,169 | 1,390,238 | ||
Rosetta Stone, Inc.(2) | 21,473 | 166,416 | ||
salesforce.com, inc.(2) | 2,174 | 172,637 | ||
VMware, Inc., Class A(1)(2) | 5,543 | 317,171 | ||
| 4,434,736 | ||||
| Specialty Retail — 2.3% | ||||
American Eagle Outfitters, Inc.(1) | 9,999 | 159,284 | ||
Foot Locker, Inc.(1) | 2,061 | 113,066 | ||
Hibbett Sports, Inc.(2) | 860 | 29,919 | ||
Home Depot, Inc. (The)(1) | 3,111 | 397,244 | ||
Outerwall, Inc.(1) | 5,413 | 227,346 | ||
| Williams-Sonoma, Inc. | 1,628 | 84,868 | ||
| 1,011,727 | ||||
| Technology Hardware, Storage and Peripherals — 6.1% | ||||
Apple, Inc.(1) | 24,564 | 2,348,318 | ||
EMC Corp.(1) | 10,080 | 273,874 | ||
| 2,622,192 | ||||
| Textiles, Apparel and Luxury Goods — 0.1% | ||||
| NIKE, Inc., Class B | 462 | 25,502 | ||
| Thrifts and Mortgage Finance — 0.8% | ||||
Essent Group Ltd.(1)(2) | 15,938 | 347,608 | ||
| Tobacco — 0.9% | ||||
Altria Group, Inc.(1) | 2,965 | 204,467 | ||
| Philip Morris International, Inc. | 1,628 | 165,600 | ||
| 370,067 | ||||
| Trading Companies and Distributors — 0.3% | ||||
HD Supply Holdings, Inc.(2) | 3,945 | 137,365 | ||
| Wireless Telecommunication Services — 0.5% | ||||
T-Mobile US, Inc.(2) | 4,654 | 201,379 | ||
TOTAL COMMON STOCKS (Cost $50,532,384) | 54,808,727 | |||
15
| Shares | Value | |||
| TEMPORARY CASH INVESTMENTS — 0.9% | ||||
| Repurchase Agreement, Fixed Income Clearing Corp., (collateralized by various U.S. Treasury obligations, 3.00%, 5/15/45, valued at $391,000), at 0.20%, dated 6/30/16, due 7/1/16 (Delivery value $383,002) | $ | 383,000 | ||
| State Street Institutional Liquid Reserves Fund, Premier Class | 684 | 684 | ||
TOTAL TEMPORARY CASH INVESTMENTS (Cost $383,684) | 383,684 | |||
TOTAL INVESTMENT SECURITIES BEFORE SECURITIES SOLD SHORT — 128.3% (Cost $50,916,068) | 55,192,411 | |||
| COMMON STOCKS SOLD SHORT — (28.2)% | ||||
| Aerospace and Defense — (0.1)% | ||||
| Hexcel Corp. | (1,259) | (52,425) | ||
| Air Freight and Logistics — (0.9)% | ||||
| Air Transport Services Group, Inc. | (15,587) | (202,008) | ||
| Radiant Logistics, Inc. | (68,352) | (205,056) | ||
| (407,064) | ||||
| Banks — (0.2)% | ||||
| Texas Capital Bancshares, Inc. | (2,167) | (101,329) | ||
| Beverages — (0.4)% | ||||
| Craft Brew Alliance, Inc. | (13,358) | (153,884) | ||
| Biotechnology — (0.9)% | ||||
| Amicus Therapeutics, Inc. | (13,467) | (73,530) | ||
| Bluebird Bio, Inc. | (738) | (31,948) | ||
| Cara Therapeutics, Inc. | (10,060) | (48,389) | ||
| Flexion Therapeutics, Inc. | (6,355) | (95,102) | ||
| Insmed, Inc. | (4,906) | (48,373) | ||
| Ultragenyx Pharmaceutical, Inc. | (2,102) | (102,809) | ||
| (400,151) | ||||
| Capital Markets — (1.7)% | ||||
| BGC Partners, Inc., Class A | (23,238) | (202,403) | ||
| Cowen Group, Inc., Class A | (109,281) | (323,472) | ||
| Waddell & Reed Financial, Inc., Class A | (11,885) | (204,659) | ||
| (730,534) | ||||
| Chemicals — (0.7)% | ||||
| FMC Corp. | (1,723) | (79,792) | ||
| Hawkins, Inc. | (5,302) | (230,160) | ||
| (309,952) | ||||
| Commercial Services and Supplies — (0.2)% | ||||
| Covanta Holding Corp. | (6,251) | (102,829) | ||
| Construction and Engineering — (1.4)% | ||||
| Great Lakes Dredge & Dock Corp. | (68,895) | (300,382) | ||
| Primoris Services Corp. | (14,867) | (281,432) | ||
| (581,814) | ||||
| Diversified Telecommunication Services — (0.7)% | ||||
| Lumos Networks Corp. | (24,780) | (299,838) | ||
| Electronic Equipment, Instruments and Components — (1.0)% | ||||
| FARO Technologies, Inc. | (2,538) | (85,861) | ||
| Mesa Laboratories, Inc. | (2,612) | (321,276) | ||
| (407,137) | ||||
| Food Products — (1.8)% | ||||
| Inventure Foods, Inc. | (45,599) | (356,128) | ||
16
| Shares | Value | |||
| Landec Corp. | (30,120) | $ | (324,091 | ) |
| WhiteWave Foods Co. (The), Class A | (2,286) | (107,305) | ||
| (787,524) | ||||
| Health Care Equipment and Supplies — (0.4)% | ||||
| AtriCure, Inc. | (3,082) | (43,549 | ) | |
| Spectranetics Corp. (The) | (7,209) | (134,880) | ||
| (178,429) | ||||
| Health Care Providers and Services — (2.6)% | ||||
| Acadia Healthcare Co., Inc. | (6,051) | (335,225) | ||
| Capital Senior Living Corp. | (2,071) | (36,595) | ||
| Cross Country Healthcare, Inc. | (9,391) | (130,723) | ||
| Ensign Group, Inc. (The) | (11,470) | (240,985) | ||
| Providence Service Corp. (The) | (8,047) | (361,149) | ||
| (1,104,677) | ||||
| Hotels, Restaurants and Leisure — (0.6)% | ||||
| Kona Grill, Inc. | (16,536) | (177,266) | ||
| MGM Resorts International | (4,362) | (98,712) | ||
| (275,978) | ||||
| Household Durables — (0.9)% | ||||
| CalAtlantic Group, Inc. | (2,908) | (106,753) | ||
| Taylor Morrison Home Corp., Class A | (13,899) | (206,261) | ||
| ZAGG, Inc. | (12,596) | (66,129) | ||
| (379,143) | ||||
| Internet Software and Services — (0.6)% | ||||
| Envestnet, Inc. | (7,730) | (257,486) | ||
| IT Services — (1.6)% | ||||
| Datalink Corp. | (28,059) | (210,443) | ||
| DST Systems, Inc. | (563) | (65,550) | ||
| Forrester Research, Inc. | (657) | (24,217) | ||
| Gartner, Inc. | (2,454) | (239,044) | ||
| MAXIMUS, Inc. | (512) | (28,349) | ||
| Virtusa Corp. | (4,069) | (117,513) | ||
| (685,116) | ||||
| Leisure Products — (0.6)% | ||||
| Arctic Cat, Inc. | (12,253) | (208,301) | ||
| Marine Products Corp. | (3,808) | (32,216) | ||
| (240,517) | ||||
| Machinery — (0.2)% | ||||
| Donaldson Co., Inc. | (1,962) | (67,414) | ||
| Marine — (0.5)% | ||||
| Matson, Inc. | (6,244) | (201,619) | ||
| Media — (0.3)% | ||||
| Charter Communications, Inc., Class A | (591) | (135,126) | ||
| Metals and Mining — (0.5)% | ||||
| Royal Gold, Inc. | (3,107) | (223,766) | ||
| Oil, Gas and Consumable Fuels — (1.9)% | ||||
| Cabot Oil & Gas Corp. | (12,783) | (329,034) | ||
| Carrizo Oil & Gas, Inc. | (1,989) | (71,306) | ||
| Matador Resources Co. | (7,047) | (139,531) | ||
17
| Shares | Value | |||
| Synergy Resources Corp. | (44,608) | $ | (297,089 | ) |
| (836,960) | ||||
| Paper and Forest Products — (1.8)% | ||||
| Deltic Timber Corp. | (5,968) | (400,632) | ||
| KapStone Paper and Packaging Corp. | (3,259) | (42,400) | ||
| Louisiana-Pacific Corp. | (19,435) | (337,197 | ) | |
| (780,229) | ||||
| Pharmaceuticals — (0.6)% | ||||
| Medicines Co. (The) | (877) | (29,493) | ||
| Nektar Therapeutics | (10,372) | (147,594) | ||
| Sagent Pharmaceuticals, Inc. | (5,250) | (78,645) | ||
| (255,732) | ||||
| Real Estate Management and Development — (0.6)% | ||||
| Kennedy-Wilson Holdings, Inc. | (12,458) | (236,204) | ||
| Road and Rail — (1.2)% | ||||
| Avis Budget Group, Inc. | (8,898) | (286,782) | ||
| Knight Transportation, Inc. | (8,093) | (215,112) | ||
| (501,894) | ||||
| Semiconductors and Semiconductor Equipment — (1.2)% | ||||
| Amkor Technology, Inc. | (25,363) | (145,837) | ||
| Lattice Semiconductor Corp. | (34,049) | (182,162) | ||
| MACOM Technology Solutions Holdings, Inc. | (6,227) | (205,367) | ||
| (533,366) | ||||
| Software — (0.9)% | ||||
| CDK Global, Inc. | (469) | (26,025) | ||
| Ellie Mae, Inc. | (667) | (61,130) | ||
| Paylocity Holding Corp. | (5,098) | (220,234) | ||
| SS&C Technologies Holdings, Inc. | (2,980) | (83,678) | ||
| (391,067) | ||||
| Specialty Retail — (0.1)% | ||||
| Destination XL Group, Inc. | (4,710) | (21,525) | ||
| Technology Hardware, Storage and Peripherals — (0.2)% | ||||
| Silicon Graphics International Corp. | (17,199) | (86,511) | ||
| Textiles, Apparel and Luxury Goods — (0.2)% | ||||
| G-III Apparel Group Ltd. | (1,616) | (73,883) | ||
| Trading Companies and Distributors — (0.1)% | ||||
| BMC Stock Holdings, Inc. | (2,538) | (45,227) | ||
| Water Utilities — (0.6)% | ||||
| American States Water Co. | (6,291) | (275,672) | ||
TOTAL COMMON STOCKS SOLD SHORT — (28.2)% (Proceeds $12,678,171) | (12,122,022) | |||
| OTHER ASSETS AND LIABILITIES — (0.1)% | (35,040) | |||
| TOTAL NET ASSETS — 100.0% | $ | 43,035,349 | ||
| NOTES TO SCHEDULE OF INVESTMENTS | ||
| (1) | Security, or a portion thereof, has been pledged at the custodian bank or with a broker for collateral requirements on securities sold short. At the period end, the aggregate value of securities pledged was $39,481,793. |
| (2) | Non-income producing. |
See Notes to Financial Statements.
18
| Statement of Assets and Liabilities |
| JUNE 30, 2016 | |||
| Assets | |||
| Investment securities, at value (cost of $50,916,068) | $ | 55,192,411 | |
| Deposits with broker for securities sold short | 123,784 | ||
| Receivable for investments sold | 233,796 | ||
| Receivable for capital shares sold | 2,190 | ||
| Dividends and interest receivable | 31,035 | ||
| 55,583,216 | |||
| Liabilities | |||
| Securities sold short, at value (proceeds of $12,678,171) | 12,122,022 | ||
| Payable for investments purchased | 296,556 | ||
| Payable for capital shares redeemed | 52,425 | ||
| Accrued management fees | 51,304 | ||
| Distribution and service fees payable | 3,158 | ||
| Dividend expense payable on securities sold short | 8,366 | ||
| Broker fees and charges payable on securities sold short | 11,100 | ||
| Accrued other expenses | 2,936 | ||
| 12,547,867 | |||
| Net Assets | $ | 43,035,349 | |
| Net Assets Consist of: | |||
| Capital (par value and paid-in surplus) | $ | 40,762,502 | |
| Undistributed net investment income | 15,486 | ||
| Accumulated net realized loss | (2,575,131 | ) | |
| Net unrealized appreciation | 4,832,492 | ||
| $ | 43,035,349 | ||
| Net Assets | Shares Outstanding | Net Asset Value Per Share | ||||
| Investor Class, $0.01 Par Value | $34,884,577 | 2,157,966 | $16.17 | |||
| Institutional Class, $0.01 Par Value | $321,833 | 19,893 | $16.18 | |||
| A Class, $0.01 Par Value | $5,333,499 | 332,452 | $16.04* | |||
| C Class, $0.01 Par Value | $2,324,912 | 149,752 | $15.53 | |||
| R Class, $0.01 Par Value | $170,528 | 10,726 | $15.90 | |||
*Maximum offering price $17.02 (net asset value divided by 0.9425).
See Notes to Financial Statements.
19
| Statement of Operations |
| YEAR ENDED JUNE 30, 2016 | |||
| Investment Income (Loss) | |||
| Income: | |||
| Dividends | $ | 1,027,975 | |
| Interest | 750 | ||
| 1,028,725 | |||
| Expenses: | |||
| Dividend expense on securities sold short | 101,297 | ||
| Broker fees and charges on securities sold short | 123,900 | ||
| Management fees | 725,203 | ||
| Distribution and service fees: | |||
| A Class | 15,421 | ||
| C Class | 20,941 | ||
| R Class | 467 | ||
| Directors' fees and expenses | 2,984 | ||
| Other expenses | 5,921 | ||
| 996,134 | |||
| Net investment income (loss) | 32,591 | ||
| Realized and Unrealized Gain (Loss) | |||
| Net realized gain (loss) on: | |||
| Investment transactions | (4,286,276 | ) | |
| Securities sold short transactions | 1,921,589 | ||
| (2,364,687 | ) | ||
| Change in net unrealized appreciation (depreciation) on: | |||
| Investments | 97,152 | ||
| Securities sold short | 775,700 | ||
| 872,852 | |||
| Net realized and unrealized gain (loss) | (1,491,835 | ) | |
| Net Increase (Decrease) in Net Assets Resulting from Operations | $ | (1,459,244 | ) |
See Notes to Financial Statements.
20
| Statement of Changes in Net Assets |
| YEARS ENDED JUNE 30, 2016 AND JUNE 30, 2015 | ||||||
| Increase (Decrease) in Net Assets | June 30, 2016 | June 30, 2015 | ||||
| Operations | ||||||
| Net investment income (loss) | $ | 32,591 | $ | 55,517 | ||
| Net realized gain (loss) | (2,364,687 | ) | 1,258,540 | |||
| Change in net unrealized appreciation (depreciation) | 872,852 | 397,627 | ||||
| Net increase (decrease) in net assets resulting from operations | (1,459,244 | ) | 1,711,684 | |||
| Distributions to Shareholders | ||||||
| From net investment income: | ||||||
| Investor Class | (3,291 | ) | (17,925 | ) | ||
| Institutional Class | (2,704 | ) | (1,515 | ) | ||
| From net realized gains: | ||||||
| Investor Class | (681,026 | ) | (1,163,616 | ) | ||
| Institutional Class | (20,635 | ) | (28,971 | ) | ||
| A Class | (105,645 | ) | (103,386 | ) | ||
| C Class | (40,124 | ) | (44,166 | ) | ||
| R Class | (1,365 | ) | (30,426 | ) | ||
| Decrease in net assets from distributions | (854,790 | ) | (1,390,005 | ) | ||
| Capital Share Transactions | ||||||
| Net increase (decrease) in net assets from capital share transactions (Note 5) | (11,086,791 | ) | 37,951,086 | |||
| Net increase (decrease) in net assets | (13,400,825 | ) | 38,272,765 | |||
| Net Assets | ||||||
| Beginning of period | 56,436,174 | 18,163,409 | ||||
| End of period | $ | 43,035,349 | $ | 56,436,174 | ||
| Undistributed net investment income | $ | 15,486 | $ | 5,940 | ||
See Notes to Financial Statements.
21
| Statement of Cash Flows |
| YEAR ENDED JUNE 30, 2016 | |||
| Cash Flows From (Used In) Operating Activities | |||
| Net increase (decrease) in net assets resulting from operations | $ | (1,459,244 | ) |
| Adjustments to reconcile net increase (decrease) in net assets resulting from operations to net cash from (used in) operating activities: | |||
| Purchases of investment securities | (53,956,071 | ) | |
| Proceeds from investments sold | 66,860,299 | ||
| Purchases to cover securities sold short | (24,337,133 | ) | |
| Proceeds from securities sold short | 22,767,147 | ||
| (Increase) decrease in short-term investments | 749,670 | ||
| (Increase) decrease in deposits with broker for securities sold short | (106,524 | ) | |
| (Increase) decrease in receivable for investments sold | 7,006,906 | ||
| (Increase) decrease in dividends and interest receivable | 12,876 | ||
| Increase (decrease) in payable for investments purchased | (7,167,920 | ) | |
| Increase (decrease) in accrued management fees | (16,558 | ) | |
| Increase (decrease) in distribution and service fees payable | 786 | ||
| Increase (decrease) in dividend expense payable on securities sold short | 4,492 | ||
| Increase (decrease) in broker fees and charges payable on securities sold short | 11,100 | ||
| Increase (decrease) in accrued other expenses | 2,936 | ||
| Change in net unrealized (appreciation) depreciation on investments | (97,152 | ) | |
| Net realized (gain) loss on investment transactions | 4,286,276 | ||
| Change in net unrealized (appreciation) depreciation on securities sold short | (775,700 | ) | |
| Net realized (gain) loss on securities sold short transactions | (1,921,589 | ) | |
| Net cash from (used in) operating activities | 11,864,597 | ||
| Cash Flows From (Used In) Financing Activities | |||
| Proceeds from shares sold | 19,574,846 | ||
| Payments for shares redeemed | (31,426,622 | ) | |
| Distributions paid, net of reinvestments | (12,821 | ) | |
| Net cash from (used in) financing activities | (11,864,597 | ) | |
| Net Increase (Decrease) In Cash | — | ||
| Cash at beginning of period | — | ||
| Cash at end of period | — | ||
| Supplemental disclosure of cash flow information: | |||
| Non cash financing activities not included herein consist of all reinvestment of distributions of $841,969. | |||
See Notes to Financial Statements.
22
| Notes to Financial Statements |
JUNE 30, 2016
1. Organization
American Century Quantitative Equity Funds, Inc. (the corporation) is registered under the Investment Company Act of 1940, as amended (the 1940 Act), as an open-end management investment company and is organized as a Maryland corporation. Disciplined Growth Plus Fund (the fund) is one fund in a series issued by the corporation. The fund’s investment objective is to seek long-term capital growth.
The fund offers the Investor Class, the Institutional Class, the A Class, the C Class and the R Class. The A Class may incur an initial sales charge. The A Class and C Class may be subject to a contingent deferred sales charge. The share classes differ principally in their respective sales charges and distribution and shareholder servicing expenses and arrangements. The Institutional Class is made available to institutional shareholders or through financial intermediaries whose clients do not require the same level of shareholder and administrative services as shareholders of other classes. As a result, the Institutional Class is charged a lower unified management fee.
2. Significant Accounting Policies
The following is a summary of significant accounting policies consistently followed by the fund in preparation of its financial statements. The fund is an investment company and follows accounting and reporting guidance in accordance with accounting principles generally accepted in the United States of America. This may require management to make certain estimates and assumptions at the date of the financial statements. Actual results could differ from these estimates. Management evaluated the impact of events or transactions occurring through the date the financial statements were issued that would merit recognition or disclosure.
Investment Valuations — The fund determines the fair value of its investments and computes its net asset value per share at the close of regular trading (usually 4 p.m. Eastern time) on the New York Stock Exchange (NYSE) on each day the NYSE is open. The Board of Directors has adopted valuation policies and procedures to guide the investment advisor in the fund’s investment valuation process and to provide methodologies for the oversight of the fund’s pricing function.
Equity securities that are listed or traded on a domestic securities exchange are valued at the last reported sales price or at the official closing price as provided by the exchange. Equity securities traded on foreign securities exchanges are generally valued at the closing price of such securities on the exchange where primarily traded or at the close of the NYSE, if that is earlier. If no last sales price is reported, or if local convention or regulation so provides, the mean of the latest bid and asked prices may be used. Securities traded over-the-counter are valued at the mean of the latest bid and asked prices, the last sales price, or the official closing price.
Open-end management investment companies are valued at the reported net asset value per share. Repurchase agreements are valued at cost, which approximates fair value.
If the fund determines that the market price for an investment is not readily available or the valuation methods mentioned above do not reflect an investment’s fair value, such investment is valued as determined in good faith by the Board of Directors or its delegate, in accordance with policies and procedures adopted by the Board of Directors. In its determination of fair value, the fund may review several factors including, but not limited to, market information regarding the specific investment or comparable investments and correlation with other investment types, futures indices or general market indicators. Circumstances that may cause the fund to use these procedures to value an investment include, but are not limited to: an investment has been declared in default or is distressed; trading in a security has been suspended during the trading day or a security is not actively trading on its principal exchange; prices received from a regular pricing source are deemed unreliable; or there is a foreign market holiday and no trading occurred.
The fund monitors for significant events occurring after the close of an investment’s primary exchange but before the fund’s net asset value per share is determined. Significant events may include, but are not limited to: corporate announcements and transactions; governmental action and political unrest that could impact a specific investment or an investment sector; or armed conflicts, natural disasters and similar events that could affect investments in a specific country or region. The fund also monitors for significant fluctuations between domestic and foreign markets, as evidenced by the U.S. market or such other indicators that the Board of
23
Directors, or its delegate, deems appropriate. If significant fluctuations in foreign markets are identified, the fund may apply a model-derived factor to the closing price of equity securities traded on foreign securities exchanges. The factor is based on observable market data as provided by an independent pricing service.
Security Transactions — Security transactions are accounted for as of the trade date. Net realized gains and losses are determined on the identified cost basis, which is also used for federal income tax purposes.
Investment Income — Dividend income less foreign taxes withheld, if any, is recorded as of the ex-dividend date. Distributions received on securities that represent a return of capital or long-term capital gain are recorded as a reduction of cost of investments and/or as a realized gain. The fund may estimate the components of distributions received that may be considered nontaxable distributions or long-term capital gain distributions for income tax purposes. Interest income is recorded on the accrual basis and includes accretion of discounts and amortization of premiums.
Securities Sold Short — The fund enters into short sales, which is selling securities it does not own, as part of its normal investment activities. Upon selling a security short, the fund will segregate cash, cash equivalents or other appropriate liquid securities in at least an amount equal to the current market value of the securities sold short until the fund replaces the borrowed security. Interest earned on segregated cash for securities sold short is reflected as interest income. The fund is required to pay any dividends or interest due on securities sold short. Such dividends and interest are recorded as an expense. The fund may pay fees or charges to the broker on the assets borrowed for securities sold short. These fees are calculated daily based upon the value of each security sold short and a rate that is dependent on the availability of such security. Liabilities for securities sold short are valued daily and changes in value are recorded as change in net unrealized appreciation (depreciation) on securities sold short. The fund records realized gain (loss) on a security sold short when it is terminated by the fund and includes as a component of net realized gain (loss) on securities sold short transactions.
Repurchase Agreements — The fund may enter into repurchase agreements with institutions that American Century Investment Management, Inc. (ACIM) (the investment advisor) has determined are creditworthy pursuant to criteria adopted by the Board of Directors. The fund requires that the collateral, represented by securities, received in a repurchase transaction be transferred to the custodian in a manner sufficient to enable the fund to obtain those securities in the event of a default under the repurchase agreement. ACIM monitors, on a daily basis, the securities transferred to ensure the value, including accrued interest, of the securities under each repurchase agreement is equal to or greater than amounts owed to the fund under each repurchase agreement.
Joint Trading Account — Pursuant to an Exemptive Order issued by the Securities and Exchange Commission, the fund, along with certain other funds in the American Century Investments family of funds, may transfer uninvested cash balances into a joint trading account. These balances are invested in one or more repurchase agreements that are collateralized by U.S. Treasury or Agency obligations.
Segregated Assets — In accordance with the 1940 Act, the fund segregates assets on its books and records to cover certain types of investments, including, but not limited to, futures contracts and short sales. ACIM monitors, on a daily basis, the securities segregated to ensure the fund designates a sufficient amount of liquid assets, marked-to-market daily. The fund may also receive assets or be required to pledge assets at the custodian bank or with a broker for margin requirements on futures contracts and short sales.
Income Tax Status — It is the fund’s policy to distribute substantially all net investment income and net realized gains to shareholders and to otherwise qualify as a regulated investment company under provisions of the Internal Revenue Code. Accordingly, no provision has been made for income taxes. The fund files U.S. federal, state, local and non-U.S. tax returns as applicable. The fund's tax returns are subject to examination by the relevant taxing authority until expiration of the applicable statute of limitations, which is generally three years from the date of filing but can be longer in certain jurisdictions. At this time, management believes there are no uncertain tax positions which, based on their technical merit, would not be sustained upon examination and for which it is reasonably possible that the total amounts of unrecognized tax benefits will significantly change in the next twelve months.
Multiple Class — All shares of the fund represent an equal pro rata interest in the net assets of the class to which such shares belong, and have identical voting, dividend, liquidation and other rights and the same terms and conditions, except for class specific expenses and exclusive rights to vote on matters affecting only individual classes. Income, non-class specific expenses, and realized and unrealized capital gains and losses of the fund are allocated to each class of shares based on their relative net assets.
24
Distributions to Shareholders — Distributions from net investment income, if any, are generally declared and paid semiannually. Distributions from net realized gains, if any, are generally declared and paid annually.
Indemnifications — Under the corporation’s organizational documents, its officers and directors are indemnified against certain liabilities arising out of the performance of their duties to the fund. In addition, in the normal course of business, the fund enters into contracts that provide general indemnifications. The maximum exposure under these arrangements is unknown as this would involve future claims that may be made against a fund. The risk of material loss from such claims is considered by management to be remote.
Statement of Cash Flows — The Statement of Cash Flows has been prepared using the indirect method which requires net increase (decrease) in net assets resulting from operations to be adjusted to reconcile to net cash from (used in) operating activities. The beginning of period and end of period cash is the amount of domestic and foreign currency included in the fund's Statement of Assets and Liabilities and represents the cash on hand at the custodian bank and does not include any short-term investments or deposits with brokers for securities sold short.
3. Fees and Transactions with Related Parties
Certain officers and directors of the corporation are also officers and/or directors of American Century Companies, Inc. (ACC). The corporation’s investment advisor, ACIM, the corporation's distributor, American Century Investment Services, Inc. (ACIS), and the corporation’s transfer agent, American Century Services, LLC, are wholly owned, directly or indirectly, by ACC.
Management Fees — The corporation has entered into a management agreement with ACIM, under which ACIM provides the fund with investment advisory and management services in exchange for a single, unified management fee (the fee) per class. The agreement provides that all expenses of managing and operating the fund, except distribution and service fees, expenses on securities sold short, brokerage expenses, taxes, interest, fees and expenses of the independent directors (including legal counsel fees), and extraordinary expenses, will be paid by ACIM. The fee is computed and accrued daily based on each class’s daily net assets and paid monthly in arrears. The fee consists of (1) an Investment Category Fee based on the daily net assets of the fund and certain other accounts managed by the investment advisor that are in the same broad investment category as the fund and (2) a Complex Fee based on the assets of all the funds in the American Century Investments family of funds. The rates for the Investment Category Fee range from 1.1180% to 1.3000%. The rates for the Complex Fee range from 0.2500% to 0.3100% for the Investor Class, A Class, C Class and R Class. The rates for the Complex Fee range from 0.0500% to 0.1100% for the Institutional Class. The effective annual management fee for each class for the year ended June 30, 2016 was 1.45% for the Investor Class, A Class, C Class and R Class and 1.25% for the Institutional Class.
Distribution and Service Fees — The Board of Directors has adopted a separate Master Distribution and Individual Shareholder Services Plan for each of the A Class, C Class and R Class (collectively the plans), pursuant to Rule 12b-1 of the 1940 Act. The plans provide that the A Class will pay ACIS an annual distribution and service fee of 0.25%. The plans provide that the C Class will pay ACIS an annual distribution and service fee of 1.00%, of which 0.25% is paid for individual shareholder services and 0.75% is paid for distribution services. The plans provide that the R Class will pay ACIS an annual distribution and service fee of 0.50%. The fees are computed and accrued daily based on each class’s daily net assets and paid monthly in arrears. The fees are used to pay financial intermediaries for distribution and individual shareholder services. Fees incurred under the plans during the year ended June 30, 2016 are detailed in the Statement of Operations.
Directors' Fees and Expenses — The Board of Directors is responsible for overseeing the investment advisor’s management and operations of the fund. The directors receive detailed information about the fund and its investment advisor regularly throughout the year, and meet at least quarterly with management of the investment advisor to review reports about fund operations. The fund’s officers do not receive compensation from the fund.
Interfund Transactions — The fund may enter into security transactions with other American Century Investments funds and other client accounts of the investment advisor, in accordance with the 1940 Act rules and procedures adopted by the Board of Directors. The rules and procedures require, among other things, that these transactions be effected at the independent current market price of the security. During the period, the interfund purchases and sales were $528,078 and $408,066, respectively.
25
4. Investment Transactions
Purchases and sales of investment securities and securities sold short, excluding short-term investments, for the year ended June 30, 2016 were $78,293,204 and $89,610,928, respectively.
5. Capital Share Transactions
Transactions in shares of the fund were as follows:
| Year ended June 30, 2016 | Year ended June 30, 2015 | |||||||||
| Shares | Amount | Shares | Amount | |||||||
| Investor Class/Shares Authorized | 50,000,000 | 50,000,000 | ||||||||
| Sold | 886,708 | $ | 14,447,579 | 2,658,117 | $ | 44,752,766 | ||||
| Issued in reinvestment of distributions | 41,064 | 671,496 | 73,450 | 1,161,766 | ||||||
| Redeemed | (1,647,058 | ) | (26,354,358 | ) | (802,518 | ) | (13,346,874 | ) | ||
| (719,286 | ) | (11,235,283 | ) | 1,929,049 | 32,567,658 | |||||
| Institutional Class/Shares Authorized | 25,000,000 | 30,000,000 | ||||||||
| Sold | 33,169 | 551,402 | 60,759 | 1,028,313 | ||||||
| Issued in reinvestment of distributions | 1,422 | 23,339 | 1,922 | 30,486 | ||||||
| Redeemed | (76,229 | ) | (1,229,122 | ) | (32,548 | ) | (561,840 | ) | ||
| (41,638 | ) | (654,381 | ) | 30,133 | 496,959 | |||||
| A Class/Shares Authorized | 20,000,000 | 20,000,000 | ||||||||
| Sold | 186,896 | 3,040,819 | 330,337 | 5,529,284 | ||||||
| Issued in reinvestment of distributions | 6,501 | 105,645 | 6,568 | 103,386 | ||||||
| Redeemed | (227,670 | ) | (3,576,611 | ) | (48,590 | ) | (822,100 | ) | ||
| (34,273 | ) | (430,147 | ) | 288,315 | 4,810,570 | |||||
| C Class/Shares Authorized | 15,000,000 | 15,000,000 | ||||||||
| Sold | 86,120 | 1,367,239 | 69,160 | 1,141,909 | ||||||
| Issued in reinvestment of distributions | 2,541 | 40,124 | 2,866 | 44,166 | ||||||
| Redeemed | (19,616 | ) | (302,299 | ) | (35,817 | ) | (594,138 | ) | ||
| 69,045 | 1,105,064 | 36,209 | 591,937 | |||||||
| R Class/Shares Authorized | 15,000,000 | 15,000,000 | ||||||||
| Sold | 8,067 | 128,194 | 736 | 12,148 | ||||||
| Issued in reinvestment of distributions | 85 | 1,365 | 1,943 | 30,426 | ||||||
| Redeemed | (99 | ) | (1,603 | ) | (32,725 | ) | (558,612 | ) | ||
| 8,053 | 127,956 | (30,046 | ) | (516,038 | ) | |||||
| Net increase (decrease) | (718,099 | ) | $ | (11,086,791 | ) | 2,253,660 | $ | 37,951,086 | ||
6. Fair Value Measurements
The fund’s investments valuation process is based on several considerations and may use multiple inputs to determine the fair value of the investments held by the fund. In conformity with accounting principles generally accepted in the United States of America, the inputs used to determine a valuation are classified into three broad levels.
| • | Level 1 valuation inputs consist of unadjusted quoted prices in an active market for identical investments. |
| • | Level 2 valuation inputs consist of direct or indirect observable market data (including quoted prices for comparable investments, evaluations of subsequent market events, interest rates, prepayment speeds, credit risk, etc.). These inputs also consist of quoted prices for identical investments initially expressed in local currencies that are adjusted through translation into U.S. dollars. |
| • | Level 3 valuation inputs consist of unobservable data (including a fund’s own assumptions). |
26
The level classification is based on the lowest level input that is significant to the fair valuation measurement. The valuation inputs are not necessarily an indication of the risks associated with investing in these securities or other financial instruments. There were no significant transfers between levels during the period.
The following is a summary of the level classifications as of period end. The Schedule of Investments provides additional information on the fund’s portfolio holdings.
| Level 1 | Level 2 | Level 3 | ||||||
| Assets | ||||||||
| Investment Securities | ||||||||
| Common Stocks | $ | 54,808,727 | — | — | ||||
| Temporary Cash Investments | 684 | $ | 383,000 | — | ||||
| $ | 54,809,411 | $ | 383,000 | — | ||||
| Liabilities | ||||||||
| Securities Sold Short | ||||||||
| Common Stocks | $ | 12,122,022 | — | — | ||||
7. Risk Factors
The fund is subject to short sales risk. If the market price of a security increases after the fund borrows the security, the fund may suffer a loss when it replaces the borrowed security at the higher price. Any loss will be increased by the amount of compensation, interest or dividends, and transaction costs the fund must pay to the lender of the borrowed security.
The fund's investment strategy utilizes leverage, which can increase market exposure and subject the fund to greater risk and higher volatility.
If the fund is overweighted in a stock or sector, any negative development related to that stock or sector will have a greater impact on the fund than other funds that are not overweighted in that stock or sector.
The fund’s investment process may result in high portfolio turnover, which could mean high transaction costs, affecting both performance and capital gains tax liabilities to investors.
8. Federal Tax Information
The tax character of distributions paid during the years ended June 30, 2016 and June 30, 2015 were as follows:
| 2016 | 2015 | |||||
| Distributions Paid From | ||||||
| Ordinary income | $ | 6,119 | $ | 160,700 | ||
| Long-term capital gains | $ | 848,671 | $ | 1,229,305 | ||
The book-basis character of distributions made during the year from net investment income or net realized gains may differ from their ultimate characterization for federal income tax purposes. These differences reflect the differing character of certain income items and net realized gains and losses for financial statement and tax purposes, and may result in reclassification among certain capital accounts on the financial statements.
27
As of June 30, 2016, the federal tax cost of investments and the components of distributable earnings on a tax-basis were as follows:
| Federal tax cost of investments | $ | 50,970,673 | |
| Gross tax appreciation of investments | $ | 6,317,864 | |
| Gross tax depreciation of investments | (2,096,126 | ) | |
| Net tax appreciation (depreciation) of investments | 4,221,738 | ||
| Net tax appreciation (depreciation) on securities sold short | 541,153 | ||
| Net tax appreciation (depreciation) | $ | 4,762,891 | |
| Undistributed ordinary income | $ | 15,486 | |
| Accumulated short-term capital losses | $ | (2,505,530 | ) |
The difference between book-basis and tax-basis unrealized appreciation (depreciation) is attributable primarily to the tax deferral of losses on wash sales.
Accumulated capital losses represent net capital loss carryovers that may be used to offset future realized capital gains for federal income tax purposes. The capital loss carryovers may be carried forward for an unlimited period. Future capital loss carryover utilization in any given year may be subject to Internal Revenue Code limitations.
28
| Financial Highlights |
| For a Share Outstanding Throughout the Years Ended June 30 (except as noted) | ||||||||||||||||
| Per-Share Data | Ratios and Supplemental Data | |||||||||||||||
| Income From Investment Operations: | Distributions From: | Ratio to Average Net Assets of: | ||||||||||||||
Net Asset Value, Beginning of Period | Net Investment Income (Loss)(1) | Net Realized and Unrealized Gain (Loss) | Total From Investment Operations | Net Investment Income | Net Realized Gains | Total Distributions | Net Asset Value, End of Period | Total Return(2) | Operating Expenses | Operating Expenses (excluding expenses on securities sold short) | Net Investment Income (Loss) | Portfolio Turnover Rate | Net Assets, End of Period (in thousands) | |||
| Investor Class | ||||||||||||||||
| 2016 | $16.67 | 0.02 | (0.25) | (0.23) | —(3) | (0.27) | (0.27) | $16.17 | (1.40)% | 1.91% | 1.47% | 0.14% | 121% | $34,885 | ||
| 2015 | $16.02 | 0.04 | 1.54 | 1.58 | (0.01) | (0.92) | (0.93) | $16.67 | 10.22% | 1.80% | 1.45% | 0.22% | 115% | $47,976 | ||
| 2014 | $12.65 | 0.03 | 3.76 | 3.79 | (0.01) | (0.41) | (0.42) | $16.02 | 30.29% | 1.81% | 1.46% | 0.17% | 96% | $15,188 | ||
| 2013 | $10.86 | 0.04 | 1.81 | 1.85 | (0.06) | — | (0.06) | $12.65 | 17.15% | 1.87% | 1.46% | 0.42% | 100% | $8,597 | ||
2012(4) | $10.00 | (0.03) | 0.90 | 0.87 | (0.01) | — | (0.01) | $10.86 | 8.73% | 2.48%(5) | 1.47%(5) | (0.38)%(5) | 89% | $2,249 | ||
| Institutional Class | ||||||||||||||||
| 2016 | $16.69 | 0.04 | (0.24) | (0.20) | (0.04) | (0.27) | (0.31) | $16.18 | (1.26)% | 1.71% | 1.27% | 0.34% | 121% | $322 | ||
| 2015 | $16.03 | 0.06 | 1.57 | 1.63 | (0.05) | (0.92) | (0.97) | $16.69 | 10.49% | 1.60% | 1.25% | 0.42% | 115% | $1,027 | ||
| 2014 | $12.66 | 0.05 | 3.77 | 3.82 | (0.04) | (0.41) | (0.45) | $16.03 | 30.52% | 1.61% | 1.26% | 0.37% | 96% | $503 | ||
| 2013 | $10.87 | 0.09 | 1.79 | 1.88 | (0.09) | — | (0.09) | $12.66 | 17.37% | 1.67% | 1.26% | 0.62% | 100% | $383 | ||
2012(4) | $10.00 | (0.01) | 0.90 | 0.89 | (0.02) | — | (0.02) | $10.87 | 8.87% | 2.28%(5) | 1.27%(5) | (0.18)%(5) | 89% | $327 | ||
| A Class | ||||||||||||||||
| 2016 | $16.59 | (0.02) | (0.26) | (0.28) | — | (0.27) | (0.27) | $16.04 | (1.72)% | 2.16% | 1.72% | (0.11)% | 121% | $5,333 | ||
| 2015 | $15.97 | (0.01) | 1.55 | 1.54 | — | (0.92) | (0.92) | $16.59 | 9.97% | 2.05% | 1.70% | (0.03)% | 115% | $6,083 | ||
| 2014 | $12.63 | (0.01) | 3.76 | 3.75 | — | (0.41) | (0.41) | $15.97 | 29.99% | 2.06% | 1.71% | (0.08)% | 96% | $1,252 | ||
| 2013 | $10.85 | 0.04 | 1.78 | 1.82 | (0.04) | — | (0.04) | $12.63 | 16.79% | 2.12% | 1.71% | 0.17% | 100% | $654 | ||
2012(4) | $10.00 | (0.05) | 0.91 | 0.86 | (0.01) | — | (0.01) | $10.85 | 8.59% | 2.73%(5) | 1.72%(5) | (0.63)%(5) | 89% | $567 | ||
| For a Share Outstanding Throughout the Years Ended June 30 (except as noted) | ||||||||||||||||
| Per-Share Data | Ratios and Supplemental Data | |||||||||||||||
| Income From Investment Operations: | Distributions From: | Ratio to Average Net Assets of: | ||||||||||||||
Net Asset Value, Beginning of Period | Net Investment Income (Loss)(1) | Net Realized and Unrealized Gain (Loss) | Total From Investment Operations | Net Investment Income | Net Realized Gains | Total Distributions | Net Asset Value, End of Period | Total Return(2) | Operating Expenses | Operating Expenses (excluding expenses on securities sold short) | Net Investment Income (Loss) | Portfolio Turnover Rate | Net Assets, End of Period (in thousands) | |||
| C Class | ||||||||||||||||
| 2016 | $16.18 | (0.14) | (0.24) | (0.38) | — | (0.27) | (0.27) | $15.53 | (2.38)% | 2.91% | 2.47% | (0.86)% | 121% | $2,325 | ||
| 2015 | $15.71 | (0.13) | 1.52 | 1.39 | — | (0.92) | (0.92) | $16.18 | 9.16% | 2.80% | 2.45% | (0.78)% | 115% | $1,306 | ||
| 2014 | $12.53 | (0.12) | 3.71 | 3.59 | — | (0.41) | (0.41) | $15.71 | 28.94% | 2.81% | 2.46% | (0.83)% | 96% | $699 | ||
| 2013 | $10.80 | (0.05) | 1.78 | 1.73 | — | — | — | $12.53 | 16.02% | 2.87% | 2.46% | (0.58)% | 100% | $475 | ||
2012(4) | $10.00 | (0.09) | 0.89 | 0.80 | — | — | — | $10.80 | 8.00% | 3.48%(5) | 2.47%(5) | (1.38)%(5) | 89% | $332 | ||
| R Class | ||||||||||||||||
| 2016 | $16.48 | (0.06) | (0.25) | (0.31) | — | (0.27) | (0.27) | $15.90 | (1.91)% | 2.41% | 1.97% | (0.36)% | 121% | $171 | ||
| 2015 | $15.91 | (0.04) | 1.53 | 1.49 | — | (0.92) | (0.92) | $16.48 | 9.69% | 2.30% | 1.95% | (0.28)% | 115% | $44 | ||
| 2014 | $12.62 | (0.05) | 3.75 | 3.70 | — | (0.41) | (0.41) | $15.91 | 29.61% | 2.31% | 1.96% | (0.33)% | 96% | $521 | ||
| 2013 | $10.83 | 0.01 | 1.79 | 1.80 | (0.01) | — | (0.01) | $12.62 | 16.62% | 2.37% | 1.96% | (0.08)% | 100% | $382 | ||
2012(4) | $10.00 | (0.06) | 0.89 | 0.83 | —(3) | — | —(3) | $10.83 | 8.34% | 2.98%(5) | 1.97%(5) | (0.88)%(5) | 89% | $326 | ||
| Notes to Financial Highlights |
| (1) | Computed using average shares outstanding throughout the period. |
| (2) | Total returns are calculated based on the net asset value of the last business day and do not reflect applicable sales charges, if any. Total returns for periods less than one year are not annualized. |
| (3) | Per-share amount was less than $0.005. |
| (4) | October 31, 2011 (fund inception) through June 30, 2012. |
| (5) | Annualized. |
See Notes to Financial Statements.
| Report of Independent Registered Public Accounting Firm |
To the Directors of the American Century Quantitative Equity Funds, Inc. and Shareholders of the Disciplined Growth Plus Fund:
In our opinion, the accompanying statement of assets and liabilities, including the schedule of investments, and the related statements of operations, of changes in net assets and of cash flows and the financial highlights present fairly, in all material respects, the financial position of the Disciplined Growth Plus Fund (one of the sixteen funds comprising the American Century Quantitative Equity Funds, Inc., hereafter referred to as the “Fund”) at June 30, 2016, the results of its operations and its cash flows for the year then ended, the changes in its net assets for each of the two years in the period then ended and the financial highlights for each of the periods presented, in conformity with accounting principles generally accepted in the United States of America. These financial statements and financial highlights (hereafter referred to as "financial statements") are the responsibility of the Fund's management. Our responsibility is to express an opinion on these financial statements based on our audits. We conducted our audits of these financial statements in accordance with the standards of the Public Company Accounting Oversight Board (United States). Those standards require that we plan and perform the audit to obtain reasonable assurance about whether the financial statements are free of material misstatement. An audit includes examining, on a test basis, evidence supporting the amounts and disclosures in the financial statements, assessing the accounting principles used and significant estimates made by management, and evaluating the overall financial statement presentation. We believe that our audits, which included confirmation of securities at June 30, 2016 by correspondence with the custodian and brokers, provide a reasonable basis for our opinion.
PricewaterhouseCoopers LLP
Kansas City, Missouri
August 17, 2016
31
| Management |
Board of Directors
The individuals listed below serve as directors of the funds. Each director will continue to serve in this capacity until death, retirement, resignation or removal from office. The board has adopted a mandatory retirement age for directors who are not “interested persons,” as that term is defined in the Investment Company Act (independent directors). Independent directors shall retire on December 31 of the year in which they reach their 75th birthday; provided, however, that on or after January 1, 2022, independent directors shall retire on December 31 of the year in which they reach their 76th birthday.
Mr. Thomas is an “interested person” because he currently serves as President and Chief Executive Officer of American Century Companies, Inc. (ACC), the parent company of American Century Investment Management, Inc. (ACIM or the advisor). The other directors (more than three-fourths of the total number) are independent. They are not employees, directors or officers of, and have no financial interest in, ACC or any of its wholly owned, direct or indirect, subsidiaries, including ACIM, American Century Investment Services, Inc. (ACIS) and American Century Services, LLC (ACS), and they do not have any other affiliations, positions or relationships that would cause them to be considered “interested persons” under the Investment Company Act. The directors serve in this capacity for eight (in the case of Mr. Thomas, 15) registered investment companies in the American Century Investments family of funds.
The following table presents additional information about the directors. The mailing address for each director other than Mr. Thomas is 1665 Charleston Road, Mountain View, California 94043. The mailing address for Mr. Thomas is 4500 Main Street, Kansas City, Missouri 64111.
Name (Year of Birth) | Position(s) Held with Funds | Length of Time Served | Principal Occupation(s) During Past 5 Years | Number of American Century Portfolios Overseen by Director | Other Directorships Held During Past 5 Years |
| Independent Directors | |||||
| Tanya S. Beder (1955) | Director | Since 2011 | Chairman and CEO, SBCC Group Inc. (independent advisory services) (2006 to present) | 45 | CYS Investments, Inc. (NYSE mortgage arbitrage REIT) |
| Jeremy I. Bulow (1954) | Director | Since 2011 | Professor of Economics, Stanford University, Graduate School of Business (1979 to present) | 45 | None |
| Anne Casscells (1958) | Director | Since 2016 | Co-Chief Executive Officer and Chief Investment Officer, Aetos Alternatives Management (investment advisory firm) (2001 to present); Lecturer in Accounting, Stanford University, Graduate School of Business (2009 to present) | 45 | None |
32
Name (Year of Birth) | Position(s) Held with Funds | Length of Time Served | Principal Occupation(s) During Past 5 Years | Number of American Century Portfolios Overseen by Director | Other Directorships Held During Past 5 Years |
| Independent Directors | |||||
| Ronald J. Gilson (1946) | Director and Chairman of the Board | Since 1995 (Chairman since 2005) | Charles J. Meyers Professor of Law and Business, Emeritus, Stanford Law School (1979 to present); Marc and Eva Stern Professor of Law and Business, Columbia University School of Law (1992 to present) | 45 | None |
| Frederick L. A. Grauer (1946) | Director | Since 2008 | Senior Advisor, iShares by BlackRock, Inc. (investment management firm) (2010 to 2011, 2013 to present); Senior Advisor, Course Hero (an educational technology company) (2015 to present) | 45 | None |
| Jonathan D. Levin (1972) | Director | Since 2016 | Holbrook Working Professor of Price Theory, Stanford University, (2000 to present); Chair, Department of Economics, Stanford University (2011 to 2014) | 45 | None |
| Peter F. Pervere (1947) | Director | Since 2007 | Retired | 45 | None |
| John B. Shoven (1947) | Director | Since 2002 | Charles R. Schwab Professor of Economics, Stanford University (1973 to present) | 45 | Cadence Design Systems; Exponent; Financial Engines |
| Interested Director | |||||
| Jonathan S. Thomas (1963) | Director and President | Since 2007 | President and Chief Executive Officer, ACC (March 2007 to present). Also serves as Chief Executive Officer, ACS; Executive Vice President, ACIM; Director, ACC, ACIM and other ACC subsidiaries | 128 | BioMed Valley Discoveries, Inc. |
The Statement of Additional Information has additional information about the fund's directors and is available without charge, upon request, by calling 1-800-345-2021.
33
Officers
The following table presents certain information about the executive officers of the funds. Each officer serves as an officer for each of the 15 investment companies in the American Century family of funds, unless otherwise noted. No officer is compensated for his or her service as an officer of the funds. The listed officers are interested persons of the funds and are appointed or re-appointed on an annual basis. The mailing address for each of the officers listed below is 4500 Main Street, Kansas City, Missouri 64111.
Name (Year of Birth) | Offices with the Funds | Principal Occupation(s) During the Past Five Years |
| Jonathan S. Thomas (1963) | Director and President since 2007 | President and Chief Executive Officer, ACC (March 2007 to present). Also serves as Chief Executive Officer, ACS; Executive Vice President, ACIM; Director, ACC, ACIM and other ACC subsidiaries |
| Amy D. Shelton (1964) | Chief Compliance Officer and Vice President since 2014 | Chief Compliance Officer, American Century funds, (March 2014 to present); Chief Compliance Officer, ACIM (February 2014 to present); Chief Compliance Officer, ACIS (October 2009 to present); Vice President, Client Interactions and Marketing, ACIS (February 2013 to January 2014); Director, Client Interactions and Marketing, ACIS (June 2007 to January 2013). Also serves as Vice President, ACIS |
| Charles A. Etherington (1957) | General Counsel since 2007 and Senior Vice President since 2006 | Attorney, ACC (February 1994 to present); Vice President, ACC (November 2005 to present); General Counsel, ACC (March 2007 to present). Also serves as General Counsel, ACIM, ACS, ACIS and other ACC subsidiaries; and Senior Vice President, ACIM and ACS |
| C. Jean Wade (1964) | Vice President, Treasurer and Chief Financial Officer since 2012 | Vice President, ACS (February 2000 to present) |
| Robert J. Leach (1966) | Vice President since 2006 and Assistant Treasurer since 2012 | Vice President, ACS (February 2000 to present) |
| David H. Reinmiller (1963) | Vice President since 2001 | Attorney, ACC (January 1994 to present); Associate General Counsel, ACC (January 2001 to present). Also serves as Vice President, ACIM and ACS |
| Ward D. Stauffer (1960) | Secretary since 2005 | Attorney, ACC (June 2003 to present) |
34
| Approval of Management Agreement |
At a meeting held on June 14, 2016, the Fund’s Board of Directors (the "Board") unanimously approved the renewal of the management agreement pursuant to which American Century Investment Management, Inc. (the “Advisor”) acts as the investment advisor for the Fund. Under Section 15(c) of the Investment Company Act, contracts for investment advisory services are required to be reviewed, evaluated, and approved by a majority of a fund’s directors/trustees, including a majority of the independent Directors, each year. The Board regards this annual evaluation and renewal as one of its most important responsibilities.
The independent Directors have memorialized a statement regarding the relationship between their ongoing obligations to oversee and evaluate the performance of the Advisor and their annual consideration of renewal of the management agreement. In that statement, the independent Directors noted that their assessment of the Advisor’s performance is an ongoing process that takes place over the entire year and is informed by all of the extensive information that the Board and its committees receive and consider over time. This information, together with the additional materials provided specifically in connection with the review, are central to the Board’s assessment of the Advisor’s performance and its determination whether to renew the Fund’s management agreement.
Prior to its consideration of the renewal of the management agreement, the Board requested and reviewed extensive data and analysis relating to the proposed renewal. This information and analysis was compiled by the Advisor and certain independent providers of evaluation data concerning the Fund and the services provided to the Fund by the Advisor.
In connection with its consideration of the renewal of the management agreement, the Board’s review and evaluation of the services provided by the Advisor included, but was not limited to, the following:
| • | the nature, extent, and quality of investment management, shareholder services, and other services provided by the Advisor to the Fund; |
| • | the wide range of other programs and services the Advisor provides to the Fund and its shareholders on a routine and non-routine basis; |
| • | the investment performance of the Fund, including data comparing the Fund’s performance to appropriate benchmarks and/or a peer group of other mutual funds with similar investment objectives and strategies; |
| • | the cost of owning the Fund compared to the cost of owning similar funds; |
| • | the Advisor’s compliance policies, procedures, and regulatory experience; |
| • | financial data showing the cost of services provided to the Fund, the profitability of the Fund to the Advisor, and the overall profitability of the Advisor; |
| • | possible economies of scale associated with the Advisor’s management of the Fund and other accounts under its management; |
| • | data comparing services provided and charges to other investment management clients of the Advisor; |
| • | acquired fund fees and expenses; |
| • | payments by the Fund and the Advisor to financial intermediaries whose clients are investors in the Fund; and |
| • | any collateral benefits derived by the Advisor from the management of the Fund. |
In keeping with its practice, the Board held two in-person meetings to review and discuss the information provided in response to their request. The independent Directors also had the benefit of the advice of their independent counsel throughout the process.
35
Factors Considered
The Directors considered all of the information provided by the Advisor, the independent data providers, and the independent Directors’ independent counsel in connection with the approval. They determined that the information was sufficient for them to evaluate the management agreement for the Fund. In connection with their review, the Directors did not identify any single factor as being all-important or controlling and each Director may have attributed different levels of importance to different factors. In deciding to renew the management agreement, the Board based its decision on a number of factors, including the following:
Nature, Extent and Quality of Services - Generally. Under the management agreement, the Advisor is responsible for providing or arranging for all services necessary for the operation of the Fund. The Board noted that under the management agreement, the Advisor provides or arranges at its own expense a wide variety of services including:
| • | constructing and designing the Fund |
| • | portfolio research and security selection |
| • | initial capitalization/funding |
| • | securities trading |
| • | Fund administration |
| • | custody of Fund assets |
| • | daily valuation of the Fund’s portfolio |
| • | shareholder servicing and transfer agency, including shareholder confirmations, recordkeeping, and communications |
| • | legal services (except the independent Directors’ counsel) |
| • | regulatory and portfolio compliance |
| • | financial reporting |
| • | marketing and distribution (except amounts paid by the Fund under Rule 12b-1 plans) |
The Board noted that many of these services have expanded over time in terms of both quantity and complexity in response to shareholder demands, competition in the industry, changing distribution channels, and the changing regulatory environment.
Investment Management, Shareholder, and Other Services. The nature of the investment management services provided to the Fund is quite complex and allows Fund shareholders access to professional money management, instant diversification of their investments within an asset class, the opportunity to easily diversify among asset classes by investing in or exchanging among various American Century Investments funds, and liquidity. In evaluating investment performance, the Board expects the Advisor to manage the Fund in accordance with its investment objectives and approved strategies. Further, the Directors recognize that the Advisor has an obligation to seek the best execution of fund trades. In providing these services, the Advisor utilizes teams of investment professionals (portfolio managers, analysts, research assistants, and securities traders) who require extensive information technology, research, training, compliance, and other systems to conduct their business. The Board, directly and through its Portfolio Committee, regularly reviews investment performance information for the Fund, together with comparative information for appropriate benchmarks and/or peer groups of similarly-managed funds, over different time horizons. The Directors also review detailed performance information during the management agreement approval process. If performance concerns are identified, the Fund receives special reviews until performance improves, during which the Board discusses with the Advisor the reasons for such results (e.g., market conditions, security selection) and any efforts being undertaken to improve performance. The Fund’s performance was above its benchmark for the three-year period and below its benchmark for the one-year period reviewed by the Board. The Board found the investment management services provided by the Advisor to the Fund to be satisfactory and consistent with the management agreement.
36
Under the management agreement, the Advisor provides the Fund with a comprehensive package of transfer agency, shareholder, and other services. The Board, directly and through various committees of the Board, regularly reviews reports and evaluations of such services at its regular meetings. These reports include, but are not limited to, information regarding the operational efficiency and accuracy of the shareholder and transfer agency services provided, staffing levels, shareholder satisfaction (as measured by external as well as internal sources), technology support, new products and services offered to Fund shareholders, securities trading activities, portfolio valuation services, auditing services, and legal and operational compliance activities. Certain aspects of shareholder and transfer agency service level efficiency and the quality of securities trading activities are measured by independent third party providers and are presented in comparison to other fund groups not managed by the Advisor.
The Board found the services provided by the Advisor to the Fund under the management agreement to be competitive and of high quality.
Costs of Services and Profitability. The Advisor provides detailed information concerning its cost of providing various services to the Fund, its profitability in managing the Fund, its overall profitability, and its financial condition. The Directors have reviewed with the Advisor the methodology used to prepare this financial information. This information is considered in evaluating the Advisor’s financial condition, its ability to continue to provide services under the management agreement, and the reasonableness of the current management fee. The Board concluded that the Advisor’s profits were reasonable in light of the services provided to the Fund.
Economies of Scale. The Board also reviewed information provided by the Advisor regarding the possible existence of economies of scale in connection with the management of the Fund. The Board concluded that economies of scale are difficult to measure and predict with precision, especially on a fund-by-fund basis. The Board concluded that the Advisor is appropriately sharing economies of scale through its competitive fee structure, offering competitive fees from fund inception, and through reinvestment in its business to provide shareholders enhanced and expanded services.
Comparison to Other Funds’ Fees. The management agreement provides that the Fund pays the Advisor a single, all-inclusive (or unified) management fee for providing all services necessary for the management and operation of the Fund, other than brokerage expenses, expenses attributable to short sales, taxes, interest, extraordinary expenses, the fees and expenses of the Fund’s independent Directors (including their independent legal counsel), and expenses incurred in connection with the provision of shareholder services and distribution services under a plan adopted pursuant to Rule 12b-1 under the 1940 Act. Under the unified fee structure, the Advisor is responsible for providing all investment advisory, custody, audit, administrative, compliance, recordkeeping, marketing, and shareholder services, or arranging and supervising third parties to provide such services. By contrast, most other funds are charged a variety of fees, including an investment advisory fee, a transfer agency fee, an administrative fee, distribution charges, and other expenses. Other than their investment advisory fees and any applicable Rule 12b-1 fees, all other components of the total fees charged by these other funds may be increased without shareholder approval. The Board believes the unified fee structure is a benefit to Fund shareholders because it clearly discloses to shareholders the cost of owning Fund shares, and, since the unified fee cannot be increased without a vote of Fund shareholders, it shifts to the Advisor the risk of increased costs of operating the Fund and provides a direct incentive to minimize administrative inefficiencies. Part of the Board’s analysis of fee levels involves reviewing certain evaluative data compiled by an independent provider and comparing the Fund’s unified fee to the total expense ratio of peer funds. The unified fee charged to shareholders of the Fund was at the median of the total expense ratios of the Fund’s peer universe. The Board concluded that the management fee paid by the Fund to the Advisor under the management agreement is reasonable in light of the services provided to the Fund.
37
Comparison to Fees and Services Provided to Other Clients of the Advisor. The Board also requested and received information from the Advisor concerning the nature of the services, fees, costs, and profitability of its advisory services to advisory clients other than the Fund. They observed that these varying types of client accounts require different services and involve different regulatory and entrepreneurial risks than the management of the Fund. The Board analyzed this information and concluded that the fees charged and services provided to the Fund were reasonable by comparison.
Payments to Intermediaries. The Directors also requested and received a description of payments made to intermediaries by the Fund and the Advisor. These payments include various payments made by the Fund or the Advisor to different types of intermediaries and recordkeepers for distribution and service activities provided for the Fund.
Collateral or “Fall-Out” Benefits Derived by the Advisor. The Board considered the existence of collateral benefits the Advisor may receive as a result of its relationship with the Fund. The Board noted that the Advisor’s primary business is managing mutual funds and it generally does not use fund or shareholder information to generate profits in other lines of business, and therefore does not derive any significant collateral benefits from them. The Board noted that the Advisor receives proprietary research from broker-dealers that execute fund portfolio transactions. The Board also determined that the Advisor is able to provide investment management services to certain clients other than the Fund, at least in part, due to its existing infrastructure built to serve the fund complex. The Board concluded, however, that the assets of those other clients are not material to the analysis and, where applicable, may be included with the assets of the Fund to determine breakpoints in the management fee schedule.
Existing Relationship. The Board also considered whether there was any reason for not continuing the existing arrangement with the Advisor. In this regard, the Board was mindful of the potential disruptions of the Fund’s operations and various risks, uncertainties, and other effects that could occur as a result of a decision not to continue such relationship. In particular, the Board recognized that most shareholders have invested in the Fund on the strength of the Advisor’s industry standing and reputation and in the expectation that the Advisor will have a continuing role in providing advisory services to the Fund.
Conclusion of the Directors. As a result of this process, the Board, including all of the independent Directors and assisted by the advice of independent legal counsel, taking into account all of the factors discussed above and the information provided by the Advisor and others in connection with its review and throughout the year, concluded that the management agreement between the Fund and the Advisor is fair and reasonable in light of the services provided and should be renewed.
38
| Proxy Voting Results |
A special meeting of shareholders was held on June 13, 2016, to vote on the following proposal. The proposal received the required number of votes and was adopted. A summary of voting results is listed below.
To elect four directors to the Board of Directors of American Century Quantitative Equity Funds, Inc.:
| Affirmative | Withhold | ||||||
| Tanya S. Beder | $ | 8,473,153,264 | $ | 121,459,590 | |||
| Jeremy I. Bulow | $ | 8,469,793,581 | $ | 124,819,273 | |||
| Anne Casscells | $ | 8,465,895,232 | $ | 128,717,622 | |||
| Jonathan D. Levin | $ | 8,468,929,867 | $ | 125,682,987 | |||
The other directors whose term of office continued after the meeting include Jonathan S. Thomas, Ronald J. Gilson, Frederick L. A. Grauer, Peter F. Pervere and John B. Shoven.
39
| Additional Information |
Retirement Account Information
As required by law, distributions you receive from certain IRAs are subject to federal income tax withholding, unless you elect not to have withholding apply. Tax will be withheld on the total amount withdrawn even though you may be receiving amounts that are not subject to withholding, such as nondeductible contributions. In such case, excess amounts of withholding could occur. You may adjust your withholding election so that a greater or lesser amount will be withheld.
If you don’t want us to withhold on this amount, you must notify us to not withhold the federal income tax. You may notify us in writing or in certain situations by telephone or through other electronic means. For systematic withdrawals, your withholding election will remain in effect until revoked or changed by filing a new election. You have the right to revoke your election at any time.
Remember, even if you elect not to have income tax withheld, you are liable for paying income tax on the taxable portion of your withdrawal. If you elect not to have income tax withheld or you don’t have enough income tax withheld, you may be responsible for payment of estimated tax. You may incur penalties under the estimated tax rules if your withholding and estimated tax payments are not sufficient. You can reduce or defer the income tax on a distribution by directly or indirectly rolling such distribution over to another IRA or eligible plan. You should consult your tax advisor for additional information.
State tax will be withheld if, at the time of your distribution, your address is within one of the mandatory withholding states and you have federal income tax withheld (or as otherwise required by state law). State taxes will be withheld from your distribution in accordance with the respective state rules.
Distributions you receive from 403(b), 457 and qualified plans are subject to special tax and withholding rules. Your plan administrator or plan sponsor is required to provide you with a special tax notice explaining those rules at the time you request a distribution. If applicable, federal and/or state taxes may be withheld from your distribution amount.
Proxy Voting Policies
Descriptions of the principles and policies that the fund's investment advisor uses in exercising the voting rights associated with the securities purchased and/or held by the fund are available without charge, upon request, by calling 1-800-345-2021 or visiting the "About Us" page of American Century Investments’ website at americancentury.com. A description of the policies is also available on the Securities and Exchange Commission’s website at sec.gov. Information regarding how the investment advisor voted proxies relating to portfolio securities during the most recent 12-month period ended June 30 is available on the "About Us" page at americancentury.com. It is also available at sec.gov.
Quarterly Portfolio Disclosure
The fund files its complete schedule of portfolio holdings with the Securities and Exchange Commission (SEC) for the first and third quarters of each fiscal year on Form N-Q. The fund’s Forms N-Q are available on the SEC’s website at sec.gov, and may be reviewed and copied at the SEC’s Public Reference Room in Washington, DC. Information on the operation of the Public Reference Room may be obtained by calling 1-800-SEC-0330. The fund also makes its complete schedule of portfolio holdings for the most recent quarter of its fiscal year available on its website at americancentury.com and, upon request, by calling 1-800-345-2021.
40
Other Tax Information
The following information is provided pursuant to provisions of the Internal Revenue Code.
The fund hereby designates up to the maximum amount allowable as qualified dividend income for the fiscal year ended June 30, 2016.
For corporate taxpayers, the fund hereby designates $6,119, or up to the maximum amount allowable, of ordinary income distributions paid during the fiscal year ended June 30, 2016 as qualified for the corporate dividends received deduction.
The fund hereby designates $848,671, or up to the maximum amount allowable, as long-term capital gain distributions (20% rate gain distributions) for the fiscal year ended June 30, 2016.
41
| Notes |
42
| Notes |
43
| Notes |
44
| ||
| Contact Us | americancentury.com | |
| Automated Information Line | 1-800-345-8765 | |
| Investor Services Representative | 1-800-345-2021 or 816-531-5575 | |
| Investors Using Advisors | 1-800-378-9878 | |
| Business, Not-For-Profit, Employer-Sponsored Retirement Plans | 1-800-345-3533 | |
| Banks and Trust Companies, Broker-Dealers, Financial Professionals, Insurance Companies | 1-800-345-6488 | |
| Telecommunications Relay Service for the Deaf | 711 | |
| American Century Quantitative Equity Funds, Inc. | ||
Investment Advisor: American Century Investment Management, Inc. Kansas City, Missouri | ||
| This report and the statements it contains are submitted for the general information of our shareholders. The report is not authorized for distribution to prospective investors unless preceded or accompanied by an effective prospectus. | ||
| ©2016 American Century Proprietary Holdings, Inc. All rights reserved. CL-ANN-89959 1608 | ||
| Annual Report | |
| June 30, 2016 | |
| Emerging Markets Value Fund | |
| Table of Contents |
| President's Letter | 2 | |
| Performance | 3 | |
| Portfolio Commentary | ||
| Fund Characteristics | ||
| Shareholder Fee Example | ||
| Schedule of Investments | ||
| Statement of Assets and Liabilities | ||
| Statement of Operations | ||
| Statement of Changes in Net Assets | ||
| Notes to Financial Statements | ||
| Financial Highlights | ||
| Report of Independent Registered Public Accounting Firm | ||
| Management | ||
| Approval of Management Agreement | ||
| Proxy Voting Results | ||
| Additional Information | ||
Any opinions expressed in this report reflect those of the author as of the date of the report, and do not necessarily represent the opinions of American Century Investments® or any other person in the American Century Investments organization. Any such opinions are subject to change at any time based upon market or other conditions and American Century Investments disclaims any responsibility to update such opinions. These opinions may not be relied upon as investment advice and, because investment decisions made by American Century Investments funds are based on numerous factors, may not be relied upon as an indication of trading intent on behalf of any American Century Investments fund. Security examples are used for representational purposes only and are not intended as recommendations to purchase or sell securities. Performance information for comparative indices and securities is provided to American Century Investments by third party vendors. To the best of American Century Investments’ knowledge, such information is accurate at the time of printing.
| President’s Letter |
Jonathan ThomasDear Investor:
Thank you for reviewing this annual report for the 12 months ended June 30, 2016. It provides investment performance and portfolio information for the reporting period, plus longer-term historical performance data.
Annual reports remain important vehicles for conveying information about fund returns, including market and economic factors that affected performance during the reporting period. For additional, updated investment and market insights, we encourage you to visit our website, americancentury.com.
Market Volatility Increased, But Not for the Reasons Anticipated
Going into this reporting period, investors anticipated increased market volatility and uncertainty as the Federal Reserve (the Fed) appeared poised to raise short-term interest rates toward more historically normal levels. This policy change was expected to affect investor sentiment, U.S. Treasury yield behavior, relative currency values, inflation expectations, and corporate costs and earnings.
This Fed-centric outlook didn’t fully account for global factors, which ultimately drove sentiment, volatility, and performance during the reporting period. During 2015, the primary catalyst was China, where slowing economic growth, currency devaluations, and massive monetary policy easing sent shock waves through the global markets. The Fed ended up delaying (until December 2015) its only small rate hike during the reporting period. Afterward, China-related events repeated in January and early February this year, further delaying Fed action.
Oil was another catalyst—its price collapses devalued entire market sectors and contributed to broad market volatility and negative sentiment. Later, as China and oil appeared to stabilize, Brexit occurred—the unexpected decision by United Kingdom voters to leave the European Union. This produced more shock waves, and altered central bank policies around the world. In this environment, relatively defensive assets performed best for the 12 months, including the stocks of gold-producing companies, utilities, real estate investment trusts (REITs), and long-maturity U.S. Treasury securities.
Looking ahead, we believe the markets face further uncertainty and volatility as they digest Brexit, the Italian bank crisis, China’s economic mysteries, and the U.S. presidential election. Negative interest rates in Europe and Japan represent part of the market’s response to the global macroeconomic climate. These negative rates are suppressing interest rates around the world while driving up the value of the U.S. dollar and U.S. bonds. In a broad sense, stocks also benefit from the central bank stimulus that is driving interest rates into negative territory, and from relative yield advantages as bond yields are pushed lower. It’s an unusual and challenging environment. We appreciate your continued trust in us.
Sincerely,
Jonathan Thomas
President and Chief Executive Officer
American Century Investments
2
| Performance |
| Total Returns as of June 30, 2016 | ||||
Average Annual Returns | ||||
| Ticker Symbol | 1 year | Since Inception | Inception Date | |
| Investor Class | AEVVX | -18.36% | -10.55% | 10/31/13 |
| MSCI Emerging Markets Value Index | — | -14.41% | -7.60% | — |
| MSCI Emerging Markets Index | — | -12.05% | -5.50% | — |
| Institutional Class | AEVNX | -18.17% | -10.37% | 10/31/13 |
| A Class | AEVLX | 10/31/13 | ||
| No sales charge | -18.49% | -10.76% | ||
| With sales charge | -23.21% | -12.72% | ||
| C Class | AEVTX | -19.07% | -11.41% | 10/31/13 |
| R Class | AEVRX | -18.71% | -10.98% | 10/31/13 |
Returns would have been lower if a portion of the fees had not been waived.
Sales charges include initial sales charges and contingent deferred sales charges (CDSCs), as applicable. A Class shares have a 5.75% maximum initial sales charge and may be subject to a maximum CDSC of 1.00%. C Class shares redeemed within 12 months of purchase are subject to a maximum CDSC of 1.00%. The SEC requires that mutual funds provide performance information net of maximum sales charges in all cases where charges could be applied.
Data presented reflect past performance. Past performance is no guarantee of future results. Current performance may be higher or lower than the performance shown. Total returns for periods less than one year are not annualized. Investment return and principal value will fluctuate, and redemption value may be more or less than original cost. Data assumes reinvestment of dividends and capital gains, and none of the charts reflect the deduction of taxes that a shareholder would pay on fund distributions or the redemption of fund shares. To obtain performance data current to the most recent month end, please call 1-800-345-2021 or visit americancentury.com. For additional information about the fund, please consult the prospectus.
3
| Growth of $10,000 Over Life of Class |
| $10,000 investment made October 31, 2013 |
| Performance for other share classes will vary due to differences in fee structure. |
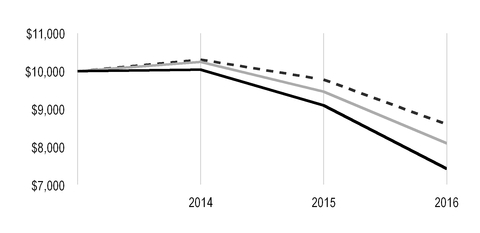
| Value on June 30, 2016 | |
| Investor Class — $7,430 | |
| MSCI Emerging Markets Value Index — $8,099 | |
| MSCI Emerging Markets Index — $8,600 | |
Ending value would have been lower if a portion of the fees had not been waived.
| Total Annual Fund Operating Expenses | ||||
| Investor Class | Institutional Class | A Class | C Class | R Class |
| 1.57% | 1.37% | 1.82% | 2.57% | 2.07% |
The total annual fund operating expenses shown is as stated in the fund’s prospectus current as of the date of this report. The prospectus may vary from the expense ratio shown elsewhere in this report because it is based on a different time period, includes acquired fund fees and expenses, and, if applicable, does not include fee waivers or expense reimbursements.
Data presented reflect past performance. Past performance is no guarantee of future results. Current performance may be higher or lower than the performance shown. Total returns for periods less than one year are not annualized. Investment return and principal value will fluctuate, and redemption value may be more or less than original cost. Data assumes reinvestment of dividends and capital gains, and none of the charts reflect the deduction of taxes that a shareholder would pay on fund distributions or the redemption of fund shares. To obtain performance data current to the most recent month end, please call 1-800-345-2021 or visit americancentury.com. For additional information about the fund, please consult the prospectus.
4
| Portfolio Commentary |
Portfolio Managers: Elizabeth Xie, Yulin Long, and Vinod Chandrashekaran
Performance Summary
Emerging Markets Value returned -18.36%* for the fiscal year ended June 30, 2016, compared with the -14.41% return of the fund’s benchmark, the MSCI Emerging Markets Value Index.
Emerging Markets Value declined, underperforming the MSCI Emerging Markets Value Index. The fund’s stock selection process incorporates factors of valuation, quality, growth, and sentiment, while striving to minimize unintended risks along industries and other risk characteristics. The fund's valuation factors detracted from selection results, while quality, sentiment and growth charcteristics were somewhat supportive. Security selection across a number of sectors weighed on the fund’s relative returns, although detraction was most pronounced in the financials sector. Conversely, consumer discretionary and energy sector holdings contributed to relative results. From a regional perspective, holdings in Taiwan, South Korea, and Brazil were leading detractors from performance, while stock selection in China and positioning in Greece contributed to relative results.
Financials Sector Leading Detractor
Stock selection in financials weighed on relative performance, due in part to an overweight investment, relative to the benchmark, in Taiwan-based diversified financial services provider Fubon Financial Holding. The stock sold off sharply along with other Taiwan-based shares after the country’s January 2016 presidential elections sparked political uncertainty and concerns over heightened tensions with China.
Stock selection in the information technology sector also hindered results. There, a key detractor from the fund’s relative performance was its underweight position in Korea-based Samsung Electronics, whose stock surged higher in April after the electronics company reported better-than-expected first-quarter earnings, fueled by strong sales and healthy pricing of its smartphones.
Against a backdrop of heightened political turmoil and economic upheaval, several Brazil-based holdings also weighed on performance. These included a portfolio-only investment in JBS, the world’s largest meat processing company, and an overweight position in Brazil-based power utility Cia Energetica de Minas Gerais. Both positions were ultimately liquidated. Another detractor in the utilities sector, China-based Huadian Power International, an overweight position, was pressured by weaker Chinese power demand and tariff issues.
Consumer Discretionary Sector Outperformed
On a positive note, relative performance was aided by stock selection in the consumer discretionary sector, assisted by a portfolio-only investment in China-based New Oriental Education & Technology Group, the largest provider of private educational services in China. In recent years the company has shifted its focus from teaching English to providing tutoring for Chinese students in the K-12 educational market, a niche that provides more stable revenue growth that has been less sensitive to economic concerns.
* All fund returns referenced in this commentary are for Investor Class shares. Returns would have been lower if a portion of the fees had not been waived. Performance for other share classes will vary due to differences in fee structure; when Investor Class performance exceeds that of the fund's benchmark, other share classes may not. See page 3 for returns for all share classes.
5
Stock selection in the energy sector also contributed to relative performance, due in part to underweights in Brazil-based Petroleo Brasileiro and China-based PetroChina, two oil companies that sold off sharply in the second half of 2015 as oil prices declined further. PetroChina subsequently reported its weakest profits on record in the first quarter of 2016, further pressuring its stock performance.
Elsewhere, relative performance was enhanced by a portfolio-only investment in Mexico-based food products company Gruma SAB de CV, one of the world’s leading suppliers of tortillas and corn-based products. Consumer staples companies, especially in the food products area, have benefited from investors’ search for stable-growing, more defensive investments as havens against market volatility. Additionally, an overweight investment in South Africa-based materials company Sappi contributed to results. Sappi is the world’s largest producer of dissolving wood pulp, a raw material used as a cotton substitute in apparel manufacturing. The company’s share price performance has been supported by improved profits growth, as higher prices for a competing product have helped spur global demand.
A Look Ahead
We believe that the economic environment in many emerging markets—accommodative monetary policy, stabilizing global commodity prices, and the range-bound U.S. dollar—continues to be generally supportive of equities in those regions. Although the effects of Brexit seem likely to impact emerging markets countries, we think that recovery will not be compromised. While elevated volatility weighs on markets in the aftermath of this global risk event, most emerging markets countries have limited direct trade and financial links with the U.K. The likelihood of a near-term Federal Reserve interest rate hike remains low, and coupled with an accommodative European Central Bank and Bank of Japan, gives emerging markets central banks room to cut rates, which is positive for emerging markets. At the same time, governments and consumers are gaining momentum. Greater and more efficient government spending supports recovering consumer activity and disposable income. Nevertheless, questions remain about China, where despite signs of economic stabilization, investors still question policy effectiveness amid rising debt levels. In an uncertain market environment, our disciplined, objective, and systematic investment strategy is designed to take advantage of opportunities at the individual company level. We believe this approach is the most powerful way to capitalize on market inefficiencies that lead to the mispricing of individual stocks.
6
| Fund Characteristics |
| JUNE 30, 2016 | |
| Top Ten Holdings | % of net assets |
| iShares MSCI India ETF | 4.0% |
| China Mobile Ltd. | 3.6% |
| China Construction Bank Corp., H Shares | 3.0% |
| iShares MSCI Emerging Markets ETF | 1.9% |
| Samsung Electronics Co. Ltd. | 1.9% |
| China Petroleum & Chemical Corp., H Shares | 1.9% |
| Industrial & Commercial Bank of China Ltd., H Shares | 1.8% |
| Hon Hai Precision Industry Co. Ltd. | 1.5% |
| Korea Electric Power Corp. | 1.4% |
| Infosys Ltd. ADR | 1.4% |
| Types of Investments in Portfolio | % of net assets |
| Common Stocks | 91.3% |
| Exchange-Traded Funds | 6.2% |
| Total Equity Exposure | 97.5% |
| Temporary Cash Investments | 2.0% |
| Other Assets and Liabilities | 0.5% |
| Investments by Country | % of net assets |
| China | 25.7% |
| South Korea | 14.3% |
| Taiwan | 10.7% |
| South Africa | 7.9% |
| Brazil | 7.6% |
| Russia | 3.7% |
| Malaysia | 3.7% |
| India | 3.5% |
| Indonesia | 3.2% |
| Mexico | 2.9% |
| Other Countries | 8.1% |
Exchange-Traded Funds(1) | 6.2% |
Cash and Equivalents(2) | 2.5% |
| (1) | Category may increase exposure to the countries indicated. The Schedule of Investments provides additional information on the fund's portfolio holdings. |
| (2) | Includes temporary cash investments and other assets and liabilities. |
7
| Shareholder Fee Example |
Fund shareholders may incur two types of costs: (1) transaction costs, including sales charges (loads) on purchase payments and redemption/exchange fees; and (2) ongoing costs, including management fees; distribution and service (12b-1) fees; and other fund expenses. This example is intended to help you understand your ongoing costs (in dollars) of investing in your fund and to compare these costs with the ongoing cost of investing in other mutual funds.
The example is based on an investment of $1,000 made at the beginning of the period and held for the entire period from January 1, 2016 to June 30, 2016.
Actual Expenses
The table provides information about actual account values and actual expenses for each class. You may use the information, together with the amount you invested, to estimate the expenses that you paid over the period. First, identify the share class you own. Then simply divide your account value by $1,000 (for example, an $8,600 account value divided by $1,000 = 8.6), then multiply the result by the number under the heading “Expenses Paid During Period” to estimate the expenses you paid on your account during this period.
If you hold Investor Class shares of any American Century Investments fund, or Institutional Class shares of the American Century Diversified Bond Fund, in an American Century Investments account (i.e., not a financial intermediary or retirement plan account), American Century Investments may charge you a $12.50 semiannual account maintenance fee if the value of those shares is less than $10,000. We will redeem shares automatically in one of your accounts to pay the $12.50 fee. In determining your total eligible investment amount, we will include your investments in all personal accounts (including American Century Investments Brokerage accounts) registered under your Social Security number. Personal accounts include individual accounts, joint accounts, UGMA/UTMA accounts, personal trusts, Coverdell Education Savings Accounts and IRAs (including traditional, Roth, Rollover, SEP-, SARSEP- and SIMPLE-IRAs), and certain other retirement accounts. If you have only business, business retirement, employer-sponsored or American Century Investments Brokerage accounts, you are currently not subject to this fee. If you are subject to the Account Maintenance Fee, your account value could be reduced by the fee amount.
Hypothetical Example for Comparison Purposes
The table also provides information about hypothetical account values and hypothetical expenses based on the actual expense ratio of each class of your fund and an assumed rate of return of 5% per year before expenses, which is not the actual return of a fund’s share class. The hypothetical account values and expenses may not be used to estimate the actual ending account balance or expenses you paid for the period. You may use this information to compare the ongoing costs of investing in your fund and other funds. To do so, compare this 5% hypothetical example with the 5% hypothetical examples that appear in the shareholder reports of the other funds.
Please note that the expenses shown in the table are meant to highlight your ongoing costs only and do not reflect any transactional costs, such as sales charges (loads) or redemption/exchange fees. Therefore, the table is useful in comparing ongoing costs only, and will not help you determine the relative total costs of owning different funds. In addition, if these transactional costs were included, your costs would have been higher.
8
| Beginning Account Value 1/1/16 | Ending Account Value 6/30/16 | Expenses Paid During Period(1) 1/1/16 - 6/30/16 | Annualized Expense Ratio(1) | |
| Actual | ||||
| Investor Class (after waiver) | $1,000 | $1,071.40 | $7.67 | 1.49% |
| Investor Class (before waiver) | $1,000 | $1,071.40(2) | $8.03 | 1.56% |
| Institutional Class (after waiver) | $1,000 | $1,072.90 | $6.65 | 1.29% |
| Institutional Class (before waiver) | $1,000 | $1,072.90(2) | $7.01 | 1.36% |
| A Class (after waiver) | $1,000 | $1,069.90 | $8.95 | 1.74% |
| A Class (before waiver) | $1,000 | $1,069.90(2) | $9.32 | 1.81% |
| C Class (after waiver) | $1,000 | $1,067.00 | $12.80 | 2.49% |
| C Class (before waiver) | $1,000 | $1,067.00(2) | $13.16 | 2.56% |
| R Class (after waiver) | $1,000 | $1,070.00 | $10.24 | 1.99% |
| R Class (before waiver) | $1,000 | $1,070.00(2) | $10.60 | 2.06% |
| Hypothetical | ||||
| Investor Class (after waiver) | $1,000 | $1,017.45 | $7.47 | 1.49% |
| Investor Class (before waiver) | $1,000 | $1,017.11 | $7.82 | 1.56% |
| Institutional Class (after waiver) | $1,000 | $1,018.45 | $6.47 | 1.29% |
| Institutional Class (before waiver) | $1,000 | $1,018.10 | $6.82 | 1.36% |
| A Class (after waiver) | $1,000 | $1,016.21 | $8.72 | 1.74% |
| A Class (before waiver) | $1,000 | $1,015.86 | $9.07 | 1.81% |
| C Class (after waiver) | $1,000 | $1,012.48 | $12.46 | 2.49% |
| C Class (before waiver) | $1,000 | $1,012.13 | $12.81 | 2.56% |
| R Class (after waiver) | $1,000 | $1,014.97 | $9.97 | 1.99% |
| R Class (before waiver) | $1,000 | $1,014.62 | $10.32 | 2.06% |
| (1) | Expenses are equal to the class's annualized expense ratio listed in the table above, multiplied by the average account value over the period, multiplied by 182, the number of days in the most recent fiscal half-year, divided by 366, to reflect the one-half year period. |
| (2) | Ending account value assumes the return earned after waiver and would have been lower if a portion of the fees had not been waived. |
9
| Schedule of Investments |
JUNE 30, 2016
| Shares | Value | |||
| COMMON STOCKS — 91.3% | ||||
| Brazil — 7.6% | ||||
| Banco Bradesco SA Preference Shares | 6,534 | $ | 51,197 | |
| Banco do Brasil SA | 7,000 | 37,045 | ||
| Banco Santander Brasil SA ADR | 3,000 | 17,100 | ||
| BB Seguridade Participacoes SA | 4,900 | 42,573 | ||
| BM&FBovespa SA | 5,900 | 32,730 | ||
| Braskem SA Preference Shares | 3,500 | 20,702 | ||
| EDP - Energias do Brasil SA | 7,600 | 32,224 | ||
| Itau Unibanco Holding SA ADR | 5,100 | 48,144 | ||
| Itau Unibanco Holding SA Preference Shares | 2,700 | 25,434 | ||
Petroleo Brasileiro SA Preference Shares ADR(1) | 11,476 | 66,676 | ||
| Sul America SA | 2,900 | 14,092 | ||
| Vale SA ADR | 7,500 | 37,950 | ||
| 425,867 | ||||
| Chile — 1.1% | ||||
| Enersis Americas SA ADR | 7,200 | 61,776 | ||
| China — 25.7% | ||||
| Agricultural Bank of China Ltd., H Shares | 76,000 | 27,948 | ||
| Air China Ltd., H Shares | 60,000 | 41,175 | ||
Alibaba Group Holding Ltd. ADR(1) | 330 | 26,245 | ||
Baidu, Inc. ADR(1) | 120 | 19,818 | ||
| Bank of China Ltd., H Shares | 107,000 | 42,800 | ||
| Bank of Communications Co. Ltd., H Shares | 25,000 | 15,949 | ||
| China CITIC Bank Corp. Ltd., H Shares | 94,000 | 57,297 | ||
| China Communications Services Corp. Ltd., H Shares | 120,000 | 63,012 | ||
| China Construction Bank Corp., H Shares | 253,000 | 168,131 | ||
| China Everbright Ltd. | 12,000 | 23,272 | ||
| China Galaxy Securities Co. Ltd., H Shares | 67,500 | 60,984 | ||
| China Merchants Bank Co. Ltd., H Shares | 23,500 | 52,907 | ||
| China Mobile Ltd. | 17,500 | 202,126 | ||
| China Petroleum & Chemical Corp., H Shares | 144,000 | 103,882 | ||
| China Railway Construction Corp. Ltd., H Shares | 14,000 | 17,644 | ||
| China Railway Group Ltd., H Shares | 12,000 | 9,034 | ||
China Taiping Insurance Holdings Co. Ltd.(1) | 4,400 | 8,277 | ||
| China Vanke Co. Ltd., H Shares | 15,500 | 30,682 | ||
| Chongqing Changan Automobile Co. Ltd., B Shares | 6,500 | 9,103 | ||
| Chongqing Rural Commercial Bank Co. Ltd., H Shares | 19,000 | 9,647 | ||
| CNOOC Ltd. | 33,000 | 41,156 | ||
| Evergrande Real Estate Group Ltd. | 23,000 | 14,134 | ||
| Huadian Power International Corp. Ltd., H Shares | 78,000 | 37,195 | ||
| Huaneng Power International, Inc., H Shares | 18,000 | 11,128 | ||
| Industrial & Commercial Bank of China Ltd., H Shares | 179,000 | 99,436 | ||
| Kunlun Energy Co. Ltd. | 18,000 | 15,039 | ||
| NetEase, Inc. ADR | 100 | 19,322 | ||
| New Oriental Education & Technology Group, Inc. ADR | 1,260 | 52,769 | ||
10
| Shares | Value | |||
| PetroChina Co. Ltd., H Shares | 20,000 | $ | 13,603 | |
| PICC Property & Casualty Co. Ltd., H Shares | 28,000 | 44,257 | ||
| Ping An Insurance Group Co., H Shares | 6,500 | 28,758 | ||
| Shimao Property Holdings Ltd. | 9,000 | 11,399 | ||
| Sinopec Shanghai Petrochemical Co. Ltd. | 64,000 | 29,337 | ||
| Sinotrans Ltd., H Shares | 32,000 | 14,395 | ||
| Tencent Holdings Ltd. | 900 | 20,504 | ||
| 1,442,365 | ||||
| Colombia — 0.3% | ||||
| Bancolombia SA Preference Shares | 1,855 | 16,182 | ||
| Greece — 0.4% | ||||
JUMBO SA(1) | 850 | 11,288 | ||
| OPAP SA | 1,665 | 11,460 | ||
| 22,748 | ||||
| India — 3.5% | ||||
| HDFC Bank Ltd. ADR | 800 | 53,080 | ||
| ICICI Bank Ltd. ADR | 600 | 4,308 | ||
| Infosys Ltd. ADR | 4,300 | 76,755 | ||
Tata Motors Ltd. ADR(1) | 1,824 | 63,238 | ||
| 197,381 | ||||
| Indonesia — 3.2% | ||||
| Astra International Tbk PT | 27,900 | 15,727 | ||
| Bank Mandiri Persero Tbk PT | 39,100 | 28,345 | ||
| Bank Negara Indonesia Persero Tbk PT | 104,900 | 41,473 | ||
| Bank Rakyat Indonesia Persero Tbk PT | 79,900 | 65,623 | ||
| Telekomunikasi Indonesia Persero Tbk PT | 49,300 | 14,958 | ||
| United Tractors Tbk PT | 10,300 | 11,599 | ||
| 177,725 | ||||
| Malaysia — 3.7% | ||||
| AirAsia Bhd | 44,000 | 28,492 | ||
| Alliance Financial Group Bhd | 40,800 | 40,744 | ||
| Berjaya Sports Toto Bhd | 22,257 | 16,779 | ||
| CIMB Group Holdings Bhd | 28,900 | 31,424 | ||
| Hong Leong Bank Bhd | 4,900 | 16,061 | ||
| Hong Leong Financial Group Bhd | 4,900 | 17,859 | ||
| Malayan Banking Bhd | 20,300 | 41,078 | ||
| Public Bank Bhd | 2,800 | 13,486 | ||
| 205,923 | ||||
| Mexico — 2.9% | ||||
| America Movil SAB de CV, Series L ADR | 1,908 | 23,392 | ||
| Gentera SAB de CV | 5,200 | 9,315 | ||
| Gruma SAB de CV, B Shares | 3,050 | 43,875 | ||
| Grupo Aeroportuario del Pacifico SAB de CV, B Shares | 500 | 5,140 | ||
| Kimberly-Clark de Mexico SAB de CV, A Shares | 14,300 | 33,782 | ||
OHL Mexico SAB de CV(1) | 39,100 | 47,906 | ||
| 163,410 | ||||
| Peru — 0.8% | ||||
| Credicorp Ltd. | 300 | 46,299 | ||
| Philippines — 0.7% | ||||
| Globe Telecom, Inc. | 805 | 40,591 | ||
11
| Shares | Value | |||
| Poland — 1.2% | ||||
Grupa Lotos SA(1) | 2,400 | $ | 18,541 | |
| Polski Koncern Naftowy Orlen SA | 666 | 11,654 | ||
| Polskie Gornictwo Naftowe i Gazownictwo SA | 25,846 | 36,884 | ||
| 67,079 | ||||
| Qatar — 0.5% | ||||
| Qatar Gas Transport Co. Ltd. | 4,531 | 28,750 | ||
| Russia — 3.7% | ||||
| Gazprom PJSC ADR | 4,744 | 20,488 | ||
| MMC Norilsk Nickel PJSC ADR | 1,873 | 24,932 | ||
| Moscow Exchange MICEX-RTS PJSC | 32,780 | 57,777 | ||
| Rosneft PJSC GDR | 8,178 | 41,964 | ||
| Tatneft PJSC ADR | 2,102 | 64,749 | ||
| 209,910 | ||||
| South Africa — 7.9% | ||||
AngloGold Ashanti Ltd. ADR(1) | 4,084 | 73,757 | ||
| Barclays Africa Group Ltd. | 3,295 | 32,512 | ||
| Barloworld Ltd. | 7,905 | 39,647 | ||
Brait SE(1) | 2,433 | 23,400 | ||
| Exxaro Resources Ltd. | 5,806 | 26,735 | ||
| Liberty Holdings Ltd. | 2,009 | 16,531 | ||
| MTN Group Ltd. | 3,693 | 36,115 | ||
| Nedbank Group Ltd. | 2,500 | 31,786 | ||
| RMB Holdings Ltd. | 3,380 | 12,955 | ||
| Sanlam Ltd. | 4,379 | 18,012 | ||
Sappi Ltd.(1) | 11,486 | 53,574 | ||
| Standard Bank Group Ltd. | 5,437 | 47,660 | ||
| Truworths International Ltd. | 4,972 | 29,016 | ||
| 441,700 | ||||
| South Korea — 14.3% | ||||
| CJ Corp. | 102 | 17,978 | ||
| Daelim Industrial Co. Ltd. | 394 | 26,269 | ||
| Dongbu Insurance Co. Ltd. | 247 | 14,870 | ||
| Doosan Heavy Industries & Construction Co. Ltd. | 630 | 11,720 | ||
| Hyosung Corp. | 327 | 35,707 | ||
| Hyundai Development Co-Engineering & Construction | 370 | 12,808 | ||
| Hyundai Engineering & Construction Co. Ltd. | 1,053 | 30,807 | ||
| Kangwon Land, Inc. | 1,061 | 38,498 | ||
| Korea Electric Power Corp. | 1,487 | 78,473 | ||
| KT&G Corp. | 450 | 53,340 | ||
| LG Electronics, Inc. | 439 | 20,681 | ||
| LG Household & Health Care Ltd. Preference Shares | 21 | 12,078 | ||
| Lotte Chemical Corp. | 176 | 43,859 | ||
| POSCO | 241 | 42,580 | ||
| S-Oil Corp. | 881 | 58,301 | ||
| Samsung Electronics Co. Ltd. | 84 | 104,568 | ||
| SK Holdings Co. Ltd. | 177 | 31,178 | ||
| SK Innovation Co. Ltd. | 590 | 72,648 | ||
| SK Telecom Co. Ltd. | 213 | 39,857 | ||
| Woori Bank | 6,523 | 54,227 | ||
| 800,447 | ||||
12
| Shares | Value | |||
| Taiwan — 10.7% | ||||
| Cathay Financial Holding Co. Ltd. | 54,300 | $ | 59,380 | |
| Cheng Shin Rubber Industry Co. Ltd. | 21,000 | 44,190 | ||
| China Steel Corp. | 43,000 | 28,017 | ||
| Far Eastern New Century Corp. | 34,000 | 25,430 | ||
| Formosa Petrochemical Corp. | 20,000 | 54,533 | ||
| Fubon Financial Holding Co. Ltd. | 51,000 | 60,058 | ||
| Highwealth Construction Corp. | 8,400 | 13,911 | ||
| Hon Hai Precision Industry Co. Ltd. | 31,954 | 82,221 | ||
| Lite-On Technology Corp. | 11,000 | 15,118 | ||
| Mega Financial Holding Co. Ltd. | 20,000 | 15,124 | ||
| Novatek Microelectronics Corp. | 3,000 | 11,218 | ||
| Phison Electronics Corp. | 3,000 | 25,947 | ||
| Powertech Technology, Inc. | 9,000 | 19,961 | ||
| Siliconware Precision Industries Co. | 24,000 | 36,859 | ||
| Taiwan Semiconductor Manufacturing Co. Ltd. ADR | 1,700 | 44,591 | ||
| Transcend Information, Inc. | 15,000 | 45,564 | ||
| Wistron Corp. | 26,000 | 18,223 | ||
| 600,345 | ||||
| Thailand — 0.2% | ||||
| Siam Cement PCL (The) | 1,000 | 13,619 | ||
| Turkey — 1.8% | ||||
| Arcelik AS | 3,583 | 23,635 | ||
| Eregli Demir ve Celik Fabrikalari TAS | 20,255 | 28,769 | ||
| TAV Havalimanlari Holding AS | 2,869 | 12,345 | ||
Turk Hava Yollari AO(1) | 4,186 | 8,387 | ||
| Turk Telekomunikasyon AS | 13,927 | 29,482 | ||
| 102,618 | ||||
| United Arab Emirates — 1.1% | ||||
| Dubai Islamic Bank PJSC | 42,504 | 59,228 | ||
TOTAL COMMON STOCKS (Cost $5,262,857) | 5,123,963 | |||
| EXCHANGE-TRADED FUNDS — 6.2% | ||||
| iShares MSCI Brazil Capped ETF | 379 | 11,419 | ||
| iShares MSCI India ETF | 8,135 | 227,129 | ||
| iShares MSCI Emerging Markets ETF | 3,178 | 109,196 | ||
TOTAL EXCHANGE-TRADED FUNDS (Cost $326,091) | 347,744 | |||
| TEMPORARY CASH INVESTMENTS — 2.0% | ||||
| Repurchase Agreement, Fixed Income Clearing Corp., (collateralized by various U.S. Treasury obligations, 3.00%, 11/15/45, valued at $114,875), at 0.20%, dated 6/30/16, due 7/1/16 (Delivery value $109,001) | 109,000 | |||
| State Street Institutional Liquid Reserves Fund, Premier Class | 148 | 148 | ||
TOTAL TEMPORARY CASH INVESTMENTS (Cost $109,148) | 109,148 | |||
TOTAL INVESTMENT SECURITIES — 99.5% (Cost $5,698,096) | 5,580,855 | |||
| OTHER ASSETS AND LIABILITIES — 0.5% | 29,386 | |||
| TOTAL NET ASSETS — 100.0% | $ | 5,610,241 | ||
13
| MARKET SECTOR DIVERSIFICATION | ||
| (as a % of net assets) | ||
| Financials | 34.1 | % |
| Energy | 11.5 | % |
| Information Technology | 10.2 | % |
| Materials | 8.2 | % |
| Telecommunication Services | 7.9 | % |
| Industrials | 6.9 | % |
| Consumer Discretionary | 6.0 | % |
| Utilities | 4.0 | % |
| Consumer Staples | 2.5 | % |
| Exchange-Traded Funds | 6.2 | % |
| Cash and Equivalents* | 2.5 | % |
*Includes temporary cash investments and other assets and liabilities.
| NOTES TO SCHEDULE OF INVESTMENTS | ||
| ADR | - | American Depositary Receipt |
| GDR | - | Global Depositary Receipt |
| (1) | Non-income producing. |
See Notes to Financial Statements.
14
| Statement of Assets and Liabilities |
| JUNE 30, 2016 | |||
| Assets | |||
| Investment securities, at value (cost of $5,698,096) | $ | 5,580,855 | |
| Foreign currency holdings, at value (cost of $5,961) | 5,962 | ||
| Receivable for capital shares sold | 5,203 | ||
| Dividends and interest receivable | 49,724 | ||
| 5,641,744 | |||
| Liabilities | |||
| Payable for investments purchased | 24,198 | ||
| Accrued management fees | 6,227 | ||
| Distribution and service fees payable | 392 | ||
| Accrued other expenses | 686 | ||
| 31,503 | |||
| Net Assets | $ | 5,610,241 | |
| Net Assets Consist of: | |||
| Capital (par value and paid-in surplus) | $ | 7,548,135 | |
| Undistributed net investment income | 47,025 | ||
| Accumulated net realized loss | (1,867,548 | ) | |
| Net unrealized depreciation | (117,371 | ) | |
| $ | 5,610,241 | ||
| Net Assets | Shares Outstanding | Net Asset Value Per Share | ||||
| Investor Class, $0.01 Par Value | $3,118,901 | 442,136 | $7.05 | |||
| Institutional Class, $0.01 Par Value | $1,121,119 | 158,734 | $7.06 | |||
| A Class, $0.01 Par Value | $1,129,810 | 160,446 | $7.04* | |||
| C Class, $0.01 Par Value | $180,940 | 25,822 | $7.01 | |||
| R Class, $0.01 Par Value | $59,471 | 8,463 | $7.03 | |||
*Maximum offering price $7.47 (net asset value divided by 0.9425).
See Notes to Financial Statements.
15
| Statement of Operations |
| YEAR ENDED JUNE 30, 2016 | |||
| Investment Income (Loss) | |||
| Income: | |||
| Dividends (net of foreign taxes withheld of $23,193) | $ | 180,533 | |
| Interest | 148 | ||
| 180,681 | |||
| Expenses: | |||
| Management fees | 71,978 | ||
| Distribution and service fees: | |||
| A Class | 2,790 | ||
| C Class | 1,797 | ||
| R Class | 414 | ||
| Directors' fees and expenses | 287 | ||
| Other expenses | 793 | ||
| 78,059 | |||
| Fees waived | (3,417 | ) | |
| 74,642 | |||
| Net investment income (loss) | 106,039 | ||
| Realized and Unrealized Gain (Loss) | |||
| Net realized gain (loss) on: | |||
| Investment transactions | (1,366,990 | ) | |
| Foreign currency transactions | (6,592 | ) | |
| (1,373,582 | ) | ||
| Change in net unrealized appreciation (depreciation) on: | |||
| Investments | 170,545 | ||
| Translation of assets and liabilities in foreign currencies | 119 | ||
| 170,664 | |||
| Net realized and unrealized gain (loss) | (1,202,918 | ) | |
| Net Increase (Decrease) in Net Assets Resulting from Operations | $ | (1,096,879 | ) |
See Notes to Financial Statements.
16
| Statement of Changes in Net Assets |
| YEARS ENDED JUNE 30, 2016 AND JUNE 30, 2015 | ||||||
| Increase (Decrease) in Net Assets | June 30, 2016 | June 30, 2015 | ||||
| Operations | ||||||
| Net investment income (loss) | $ | 106,039 | $ | 129,924 | ||
| Net realized gain (loss) | (1,373,582 | ) | (363,410 | ) | ||
| Change in net unrealized appreciation (depreciation) | 170,664 | (431,978 | ) | |||
| Net increase (decrease) in net assets resulting from operations | (1,096,879 | ) | (665,464 | ) | ||
| Distributions to Shareholders | ||||||
| From net investment income: | ||||||
| Investor Class | (37,958 | ) | (83,206 | ) | ||
| Institutional Class | (20,247 | ) | (47,628 | ) | ||
| A Class | (15,861 | ) | (41,993 | ) | ||
| C Class | (1,319 | ) | (5,260 | ) | ||
| R Class | (397 | ) | (6,375 | ) | ||
| Decrease in net assets from distributions | (75,782 | ) | (184,462 | ) | ||
| Capital Share Transactions | ||||||
| Net increase (decrease) in net assets from capital share transactions (Note 5) | 742,307 | 630,244 | ||||
| Net increase (decrease) in net assets | (430,354 | ) | (219,682 | ) | ||
| Net Assets | ||||||
| Beginning of period | 6,040,595 | 6,260,277 | ||||
| End of period | $ | 5,610,241 | $ | 6,040,595 | ||
| Undistributed net investment income | $ | 47,025 | $ | 17,550 | ||
See Notes to Financial Statements.
17
| Notes to Financial Statements |
JUNE 30, 2016
1. Organization
American Century Quantitative Equity Funds, Inc. (the corporation) is registered under the Investment Company Act of 1940, as amended (the 1940 Act), as an open-end management investment company and is organized as a Maryland corporation. Emerging Markets Value Fund (the fund) is one fund in a series issued by the corporation. The fund’s investment objective is to seek capital growth.
The fund offers the Investor Class, the Institutional Class, the A Class, the C Class and the R Class. The A Class may incur an initial sales charge. The A Class and C Class may be subject to a contingent deferred sales charge. The share classes differ principally in their respective sales charges and distribution and shareholder servicing expenses and arrangements. The Institutional Class is made available to institutional shareholders or through financial intermediaries whose clients do not require the same level of shareholder and administrative services as shareholders of other classes. As a result, the Institutional Class is charged a lower unified management fee.
2. Significant Accounting Policies
The following is a summary of significant accounting policies consistently followed by the fund in preparation of its financial statements. The fund is an investment company and follows accounting and reporting guidance in accordance with accounting principles generally accepted in the United States of America. This may require management to make certain estimates and assumptions at the date of the financial statements. Actual results could differ from these estimates. Management evaluated the impact of events or transactions occurring through the date the financial statements were issued that would merit recognition or disclosure.
Investment Valuations — The fund determines the fair value of its investments and computes its net asset value per share at the close of regular trading (usually 4 p.m. Eastern time) on the New York Stock Exchange (NYSE) on each day the NYSE is open. The Board of Directors has adopted valuation policies and procedures to guide the investment advisor in the fund’s investment valuation process and to provide methodologies for the oversight of the fund’s pricing function.
Equity securities that are listed or traded on a domestic securities exchange are valued at the last reported sales price or at the official closing price as provided by the exchange. Equity securities traded on foreign securities exchanges are generally valued at the closing price of such securities on the exchange where primarily traded or at the close of the NYSE, if that is earlier. If no last sales price is reported, or if local convention or regulation so provides, the mean of the latest bid and asked prices may be used. Securities traded over-the-counter are valued at the mean of the latest bid and asked prices, the last sales price, or the official closing price. Equity securities initially expressed in local currencies are translated into U.S. dollars at the mean of the appropriate currency exchange rate at the close of the NYSE as provided by an independent pricing service.
Open-end management investment companies are valued at the reported net asset value per share. Repurchase agreements are valued at cost, which approximates fair value.
If the fund determines that the market price for an investment is not readily available or the valuation methods mentioned above do not reflect an investment’s fair value, such investment is valued as determined in good faith by the Board of Directors or its delegate, in accordance with policies and procedures adopted by the Board of Directors. In its determination of fair value, the fund may review several factors including, but not limited to, market information regarding the specific investment or comparable investments and correlation with other investment types, futures indices or general market indicators. Circumstances that may cause the fund to use these procedures to value an investment include, but are not limited to: an investment has been declared in default or is distressed; trading in a security has been suspended during the trading day or a security is not actively trading on its principal exchange; prices received from a regular pricing source are deemed unreliable; or there is a foreign market holiday and no trading occurred.
The fund monitors for significant events occurring after the close of an investment’s primary exchange but before the fund’s net asset value per share is determined. Significant events may include, but are not limited to: corporate announcements and transactions; governmental action and political unrest that could impact a
18
specific investment or an investment sector; or armed conflicts, natural disasters and similar events that could affect investments in a specific country or region. The fund also monitors for significant fluctuations between domestic and foreign markets, as evidenced by the U.S. market or such other indicators that the Board of Directors, or its delegate, deems appropriate. If significant fluctuations in foreign markets are identified, the fund may apply a model-derived factor to the closing price of equity securities traded on foreign securities exchanges. The factor is based on observable market data as provided by an independent pricing service.
Security Transactions — Security transactions are accounted for as of the trade date. Net realized gains and losses are determined on the identified cost basis, which is also used for federal income tax purposes.
Investment Income — Dividend income less foreign taxes withheld, if any, is recorded as of the ex-dividend date. Distributions received on securities that represent a return of capital or long-term capital gain are recorded as a reduction of cost of investments and/or as a realized gain. The fund may estimate the components of distributions received that may be considered nontaxable distributions or long-term capital gain distributions for income tax purposes. Interest income is recorded on the accrual basis and includes accretion of discounts and amortization of premiums.
Foreign Currency Translations — All assets and liabilities initially expressed in foreign currencies are translated into U.S. dollars at prevailing exchange rates at period end. The fund may enter into spot foreign currency exchange contracts to facilitate transactions denominated in a foreign currency. Purchases and sales of investment securities, dividend and interest income, spot foreign currency exchange contracts, and expenses are translated at the rates of exchange prevailing on the respective dates of such transactions. Net realized and unrealized foreign currency exchange gains or losses related to investment securities are a component of net realized gain (loss) on investment transactions and change in net unrealized appreciation (depreciation) on investments, respectively.
Repurchase Agreements — The fund may enter into repurchase agreements with institutions that American Century Investment Management, Inc. (ACIM) (the investment advisor) has determined are creditworthy pursuant to criteria adopted by the Board of Directors. The fund requires that the collateral, represented by securities, received in a repurchase transaction be transferred to the custodian in a manner sufficient to enable the fund to obtain those securities in the event of a default under the repurchase agreement. ACIM monitors, on a daily basis, the securities transferred to ensure the value, including accrued interest, of the securities under each repurchase agreement is equal to or greater than amounts owed to the fund under each repurchase agreement.
Joint Trading Account — Pursuant to an Exemptive Order issued by the Securities and Exchange Commission, the fund, along with certain other funds in the American Century Investments family of funds, may transfer uninvested cash balances into a joint trading account. These balances are invested in one or more repurchase agreements that are collateralized by U.S. Treasury or Agency obligations.
Income Tax Status — It is the fund’s policy to distribute substantially all net investment income and net realized gains to shareholders and to otherwise qualify as a regulated investment company under provisions of the Internal Revenue Code. Accordingly, no provision has been made for income taxes. The fund files U.S. federal, state, local and non-U.S. tax returns as applicable. The fund's tax returns are subject to examination by the relevant taxing authority until expiration of the applicable statute of limitations, which is generally three years from the date of filing but can be longer in certain jurisdictions. At this time, management believes there are no uncertain tax positions which, based on their technical merit, would not be sustained upon examination and for which it is reasonably possible that the total amounts of unrecognized tax benefits will significantly change in the next twelve months.
Multiple Class — All shares of the fund represent an equal pro rata interest in the net assets of the class to which such shares belong, and have identical voting, dividend, liquidation and other rights and the same terms and conditions, except for class specific expenses and exclusive rights to vote on matters affecting only individual classes. Income, non-class specific expenses, and realized and unrealized capital gains and losses of the fund are allocated to each class of shares based on their relative net assets.
Distributions to Shareholders — Distributions from net investment income and net realized gains, if any, are generally declared and paid annually.
Indemnifications — Under the corporation’s organizational documents, its officers and directors are indemnified against certain liabilities arising out of the performance of their duties to the fund. In addition, in the normal course of business, the fund enters into contracts that provide general indemnifications. The
19
maximum exposure under these arrangements is unknown as this would involve future claims that may be made against a fund. The risk of material loss from such claims is considered by management to be remote.
3. Fees and Transactions with Related Parties
Certain officers and directors of the corporation are also officers and/or directors of American Century Companies, Inc. (ACC). The corporation’s investment advisor, ACIM, the corporation's distributor, American Century Investment Services, Inc. (ACIS), and the corporation’s transfer agent, American Century Services, LLC, are wholly owned, directly or indirectly, by ACC. ACIM owns 53% of the shares of the fund. Related parties do not invest in the fund for the purpose of exercising management or control.
Management Fees — The corporation has entered into a management agreement with ACIM, under which ACIM provides the fund with investment advisory and management services in exchange for a single, unified management fee (the fee) per class. The agreement provides that all expenses of managing and operating the fund, except distribution and service fees, brokerage expenses, taxes, interest, fees and expenses of the independent directors (including legal counsel fees), and extraordinary expenses, will be paid by ACIM. The fee is computed and accrued daily based on each class’s daily net assets and paid monthly in arrears. The annual management fee is 1.52% for the Investor Class, A Class, C Class and R Class and 1.32% for the Institutional Class. During the year ended June 30, 2016, the investment advisor agreed to waive 0.07% of the fund's management fee. The investment advisor expects this waiver to continue until July 31, 2017, and cannot terminate it prior to such date without the approval of the Board of Directors. The total amount of the waiver for each class for the year ended June 30, 2016 was $1,677, $775, $781, $126 and $58 for the Investor Class, Institutional Class, A Class, C Class and R Class, respectively. The effective annual management fee after waiver for each class for the year ended June 30, 2016 was 1.45% for the Investor Class, A Class, C Class and R Class and 1.25% for the Institutional Class.
Distribution and Service Fees — The Board of Directors has adopted a separate Master Distribution and Individual Shareholder Services Plan for each of the A Class, C Class and R Class (collectively the plans), pursuant to Rule 12b-1 of the 1940 Act. The plans provide that the A Class will pay ACIS an annual distribution and service fee of 0.25%. The plans provide that the C Class will pay ACIS an annual distribution and service fee of 1.00%, of which 0.25% is paid for individual shareholder services and 0.75% is paid for distribution services. The plans provide that the R Class will pay ACIS an annual distribution and service fee of 0.50%. The fees are computed and accrued daily based on each class’s daily net assets and paid monthly in arrears. The fees are used to pay financial intermediaries for distribution and individual shareholder services. Fees incurred under the plans during the year ended June 30, 2016 are detailed in the Statement of Operations.
Directors' Fees and Expenses — The Board of Directors is responsible for overseeing the investment advisor’s management and operations of the fund. The directors receive detailed information about the fund and its investment advisor regularly throughout the year, and meet at least quarterly with management of the investment advisor to review reports about fund operations. The fund’s officers do not receive compensation from the fund.
Other Expenses — The fund’s other expenses may include interest charges, clearing exchange fees, proxy solicitation expenses, filing fees for foreign tax reclaims and other miscellaneous expenses. The impact of other expenses to the ratio of operating expenses to average net assets was 0.02% for the year ended June 30, 2016.
Acquired Fund Fees and Expenses — The fund may invest in mutual funds, exchange-traded funds, and business development companies (the acquired funds). The fund will indirectly realize its pro rata share of the fees and expenses of the acquired funds in which it invests. These indirect fees and expenses are not paid out of the fund's assets but are reflected in the return realized by the fund on its investment in the acquired funds.
Interfund Transactions — The fund may enter into security transactions with other American Century Investments funds and other client accounts of the investment advisor, in accordance with the 1940 Act rules and procedures adopted by the Board of Directors. The rules and procedures require, among other things, that these transactions be effected at the independent current market price of the security. There were no interfund transactions during the period.
20
4. Investment Transactions
Purchases and sales of investment securities, excluding short-term investments, for the year ended June 30, 2016 were $4,487,504 and $3,795,980, respectively.
5. Capital Share Transactions
Transactions in shares of the fund were as follows:
| Year ended June 30, 2016 | Year ended June 30, 2015 | |||||||||
| Shares | Amount | Shares | Amount | |||||||
| Investor Class/Shares Authorized | 45,000,000 | 50,000,000 | ||||||||
| Sold | 262,248 | $ | 1,844,695 | 168,694 | $ | 1,631,142 | ||||
| Issued in reinvestment of distributions | 5,822 | 37,958 | 9,713 | 82,559 | ||||||
| Redeemed | (148,958 | ) | (1,057,641 | ) | (129,020 | ) | (1,209,216 | ) | ||
| 119,112 | 825,012 | 49,387 | 504,485 | |||||||
| Institutional Class/Shares Authorized | 25,000,000 | 30,000,000 | ||||||||
| Sold | 15 | 100 | 11 | 100 | ||||||
| Issued in reinvestment of distributions | 3,105 | 20,247 | 5,603 | 47,628 | ||||||
| 3,120 | 20,347 | 5,614 | 47,728 | |||||||
| A Class/Shares Authorized | 15,000,000 | 20,000,000 | ||||||||
| Sold | 510 | 3,567 | 3,214 | 29,454 | ||||||
| Issued in reinvestment of distributions | 2,436 | 15,861 | 4,940 | 41,993 | ||||||
| Redeemed | (132 | ) | (858 | ) | (557 | ) | (5,237 | ) | ||
| 2,814 | 18,570 | 7,597 | 66,210 | |||||||
| C Class/Shares Authorized | 15,000,000 | 15,000,000 | ||||||||
| Issued in reinvestment of distributions | 202 | 1,319 | 620 | 5,260 | ||||||
| R Class/Shares Authorized | 15,000,000 | 15,000,000 | ||||||||
| Sold | 4,668 | 31,139 | 21 | 186 | ||||||
| Issued in reinvestment of distributions | 61 | 397 | 750 | 6,375 | ||||||
| Redeemed | (22,037 | ) | (154,477 | ) | — | — | ||||
| (17,308 | ) | (122,941 | ) | 771 | 6,561 | |||||
| Net increase (decrease) | 107,940 | $ | 742,307 | 63,989 | $ | 630,244 | ||||
6. Fair Value Measurements
The fund’s investments valuation process is based on several considerations and may use multiple inputs to determine the fair value of the investments held by the fund. In conformity with accounting principles generally accepted in the United States of America, the inputs used to determine a valuation are classified into three broad levels.
| • | Level 1 valuation inputs consist of unadjusted quoted prices in an active market for identical investments. |
| • | Level 2 valuation inputs consist of direct or indirect observable market data (including quoted prices for comparable investments, evaluations of subsequent market events, interest rates, prepayment speeds, credit risk, etc.). These inputs also consist of quoted prices for identical investments initially expressed in local currencies that are adjusted through translation into U.S. dollars. |
| • | Level 3 valuation inputs consist of unobservable data (including a fund’s own assumptions). |
The level classification is based on the lowest level input that is significant to the fair valuation measurement. The valuation inputs are not necessarily an indication of the risks associated with investing in these securities or other financial instruments. There were no significant transfers between levels during the period.
21
The following is a summary of the level classifications as of period end. The Schedule of Investments provides additional information on the fund’s portfolio holdings.
| Level 1 | Level 2 | Level 3 | ||||||
| Assets | ||||||||
| Investment Securities | ||||||||
| Common Stocks | ||||||||
| Brazil | $ | 169,870 | $ | 255,997 | — | |||
| Chile | 61,776 | — | — | |||||
| China | 118,154 | 1,324,211 | — | |||||
| India | 197,381 | — | — | |||||
| Mexico | 23,392 | 140,018 | — | |||||
| Peru | 46,299 | — | — | |||||
| South Africa | 73,757 | 367,943 | — | |||||
| Taiwan | 44,591 | 555,754 | — | |||||
| Other Countries | — | 1,744,820 | — | |||||
| Exchange-Traded Funds | 347,744 | — | — | |||||
| Temporary Cash Investments | 148 | 109,000 | — | |||||
| $ | 1,083,112 | $ | 4,497,743 | — | ||||
7. Risk Factors
There are certain risks involved in investing in foreign securities. These risks include those resulting from future adverse political, social and economic developments, fluctuations in currency exchange rates, the possible imposition of exchange controls, and other foreign laws or restrictions. Investing in emerging markets may accentuate these risks.
8. Federal Tax Information
The tax character of distributions paid during the years ended June 30, 2016 and June 30, 2015 were as follows:
| 2016 | 2015 | |||||
| Distributions Paid From | ||||||
| Ordinary income | $ | 75,782 | $ | 184,462 | ||
| Long-term capital gains | — | — | ||||
The book-basis character of distributions made during the year from net investment income or net realized gains may differ from their ultimate characterization for federal income tax purposes. These differences reflect the differing character of certain income items and net realized gains and losses for financial statement and tax purposes, and may result in reclassification among certain capital accounts on the financial statements.
As of June 30, 2016, the federal tax cost of investments and the components of distributable earnings on a tax-basis were as follows:
| Federal tax cost of investments | $ | 5,742,015 | |
| Gross tax appreciation of investments | $ | 334,888 | |
| Gross tax depreciation of investments | (496,048 | ) | |
| Net tax appreciation (depreciation) of investments | (161,160 | ) | |
Net tax appreciation (depreciation) on translation of assets and liabilities in foreign currencies | (130 | ) | |
| Net tax appreciation (depreciation) | $ | (161,290 | ) |
| Undistributed ordinary income | $ | 79,309 | |
| Accumulated short-term capital losses | $ | (950,873 | ) |
| Accumulated long-term capital losses | $ | (905,040 | ) |
22
The difference between book-basis and tax-basis unrealized appreciation (depreciation) is attributable primarily to the realization to ordinary income for tax purposes of unrealized gains on investments in passive foreign investment companies.
Accumulated capital losses represent net capital loss carryovers that may be used to offset future realized capital gains for federal income tax purposes. The capital loss carryovers may be carried forward for an unlimited period. Future capital loss carryover utilization in any given year may be subject to Internal Revenue Code limitations.
23
| Financial Highlights |
| For a Share Outstanding Throughout the Years Ended June 30 (except as noted) | |||||||||||||||
| Per-Share Data | Ratios and Supplemental Data | ||||||||||||||
| Income From Investment Operations: | Ratio to Average Net Assets of: | ||||||||||||||
| Net Asset Value, Beginning of Period | Net Investment Income (Loss)(1) | Net Realized and Unrealized Gain (Loss) | Total From Investment Operations | Distributions From Net Investment Income | Net Asset Value, End of Period | Total Return(2) | Operating Expenses(3) | Operating Expenses (before expense waiver)(3) | Net Investment Income (Loss) | Net Investment Income (Loss) (before expense waiver) | Portfolio Turnover Rate | Net Assets, End of Period (in thousands) | |||
| Investor Class | |||||||||||||||
| 2016 | $8.79 | 0.16 | (1.78) | (1.62) | (0.12) | $7.05 | (18.36)% | 1.47% | 1.54% | 2.24% | 2.17% | 78% | $3,119 | ||
| 2015 | $10.04 | 0.21 | (1.16) | (0.95) | (0.30) | $8.79 | (9.36)% | 1.46% | 1.53% | 2.16% | 2.09% | 83% | $2,839 | ||
2014(4) | $10.00 | 0.13 | (0.09) | 0.04 | — | $10.04 | 0.40% | 1.46%(5) | 1.53%(5) | 1.91%(5) | 1.84%(5) | 44% | $2,748 | ||
| Institutional Class | |||||||||||||||
| 2016 | $8.80 | 0.16 | (1.77) | (1.61) | (0.13) | $7.06 | (18.17)% | 1.27% | 1.34% | 2.44% | 2.37% | 78% | $1,121 | ||
| 2015 | $10.06 | 0.22 | (1.16) | (0.94) | (0.32) | $8.80 | (9.26)% | 1.26% | 1.33% | 2.36% | 2.29% | 83% | $1,369 | ||
2014(4) | $10.00 | 0.13 | (0.07) | 0.06 | — | $10.06 | 0.60% | 1.26%(5) | 1.33%(5) | 2.11%(5) | 2.04%(5) | 44% | $1,508 | ||
| A Class | |||||||||||||||
| 2016 | $8.77 | 0.13 | (1.76) | (1.63) | (0.10) | $7.04 | (18.49)% | 1.72% | 1.79% | 1.99% | 1.92% | 78% | $1,130 | ||
| 2015 | $10.03 | 0.18 | (1.16) | (0.98) | (0.28) | $8.77 | (9.71)% | 1.71% | 1.78% | 1.91% | 1.84% | 83% | $1,383 | ||
2014(4) | $10.00 | 0.10 | (0.07) | 0.03 | — | $10.03 | 0.30% | 1.71%(5) | 1.78%(5) | 1.66%(5) | 1.59%(5) | 44% | $1,504 | ||
| C Class | |||||||||||||||
| 2016 | $8.73 | 0.08 | (1.75) | (1.67) | (0.05) | $7.01 | (19.07)% | 2.47% | 2.54% | 1.24% | 1.17% | 78% | $181 | ||
| 2015 | $9.98 | 0.11 | (1.15) | (1.04) | (0.21) | $8.73 | (10.36)% | 2.46% | 2.53% | 1.16% | 1.09% | 83% | $224 | ||
2014(4) | $10.00 | 0.05 | (0.07) | (0.02) | — | $9.98 | (0.20)% | 2.46%(5) | 2.53%(5) | 0.91%(5) | 0.84%(5) | 44% | $249 | ||
| For a Share Outstanding Throughout the Years Ended June 30 (except as noted) | |||||||||||||||
| Per-Share Data | Ratios and Supplemental Data | ||||||||||||||
| Income From Investment Operations: | Ratio to Average Net Assets of: | ||||||||||||||
| Net Asset Value, Beginning of Period | Net Investment Income (Loss)(1) | Net Realized and Unrealized Gain (Loss) | Total From Investment Operations | Distributions From Net Investment Income | Net Asset Value, End of Period | Total Return(2) | Operating Expenses(3) | Operating Expenses (before expense waiver)(3) | Net Investment Income (Loss) | Net Investment Income (Loss) (before expense waiver) | Portfolio Turnover Rate | Net Assets, End of Period (in thousands) | |||
| R Class | |||||||||||||||
| 2016 | $8.76 | 0.14 | (1.79) | (1.65) | (0.08) | $7.03 | (18.71)% | 1.97% | 2.04% | 1.74% | 1.67% | 78% | $59 | ||
| 2015 | $10.01 | 0.15 | (1.14) | (0.99) | (0.26) | $8.76 | (9.86)% | 1.96% | 2.03% | 1.66% | 1.59% | 83% | $226 | ||
2014(4) | $10.00 | 0.08 | (0.07) | 0.01 | — | $10.01 | 0.10% | 1.96%(5) | 2.03%(5) | 1.41%(5) | 1.34%(5) | 44% | $250 | ||
| Notes to Financial Highlights |
| (1) | Computed using average shares outstanding throughout the period. |
| (2) | Total returns are calculated based on the net asset value of the last business day and do not reflect applicable sales charges, if any. Total returns for periods less than one year are not annualized. |
| (3) | Ratio of operating expenses to average net assets does not include any fees and expenses of the acquired funds. |
| (4) | October 31, 2013 (fund inception) through June 30, 2014. |
| (5) | Annualized. |
See Notes to Financial Statements.
| Report of Independent Registered Public Accounting Firm |
To the Directors of the American Century Quantitative Equity Funds, Inc. and Shareholders of the Emerging Markets Value Fund:
In our opinion, the accompanying statement of assets and liabilities, including the schedule of investments, and the related statements of operations and of changes in net assets and the financial highlights present fairly, in all material respects, the financial position of the Emerging Markets Value Fund (one of the sixteen funds comprising the American Century Quantitative Equity Funds, Inc., hereafter referred to as the “Fund”) at June 30, 2016, the results of its operations for the year then ended and the changes in its net assets for each of the two years in the period then ended and the financial highlights for each of the periods presented, in conformity with accounting principles generally accepted in the United States of America. These financial statements and financial highlights (hereafter referred to as "financial statements") are the responsibility of the Fund's management. Our responsibility is to express an opinion on these financial statements based on our audits. We conducted our audits of these financial statements in accordance with the standards of the Public Company Accounting Oversight Board (United States). Those standards require that we plan and perform the audit to obtain reasonable assurance about whether the financial statements are free of material misstatement. An audit includes examining, on a test basis, evidence supporting the amounts and disclosures in the financial statements, assessing the accounting principles used and significant estimates made by management, and evaluating the overall financial statement presentation. We believe that our audits, which included confirmation of securities at June 30, 2016 by correspondence with the custodian and brokers, provide a reasonable basis for our opinion.
PricewaterhouseCoopers LLP
Kansas City, Missouri
August 17, 2016
26
| Management |
Board of Directors
The individuals listed below serve as directors of the funds. Each director will continue to serve in this capacity until death, retirement, resignation or removal from office. The board has adopted a mandatory retirement age for directors who are not “interested persons,” as that term is defined in the Investment Company Act (independent directors). Independent directors shall retire on December 31 of the year in which they reach their 75th birthday; provided, however, that on or after January 1, 2022, independent directors shall retire on December 31 of the year in which they reach their 76th birthday.
Mr. Thomas is an “interested person” because he currently serves as President and Chief Executive Officer of American Century Companies, Inc. (ACC), the parent company of American Century Investment Management, Inc. (ACIM or the advisor). The other directors (more than three-fourths of the total number) are independent. They are not employees, directors or officers of, and have no financial interest in, ACC or any of its wholly owned, direct or indirect, subsidiaries, including ACIM, American Century Investment Services, Inc. (ACIS) and American Century Services, LLC (ACS), and they do not have any other affiliations, positions or relationships that would cause them to be considered “interested persons” under the Investment Company Act. The directors serve in this capacity for eight (in the case of Mr. Thomas, 15) registered investment companies in the American Century Investments family of funds.
The following table presents additional information about the directors. The mailing address for each director other than Mr. Thomas is 1665 Charleston Road, Mountain View, California 94043. The mailing address for Mr. Thomas is 4500 Main Street, Kansas City, Missouri 64111.
Name (Year of Birth) | Position(s) Held with Funds | Length of Time Served | Principal Occupation(s) During Past 5 Years | Number of American Century Portfolios Overseen by Director | Other Directorships Held During Past 5 Years |
| Independent Directors | |||||
| Tanya S. Beder (1955) | Director | Since 2011 | Chairman and CEO, SBCC Group Inc. (independent advisory services) (2006 to present) | 45 | CYS Investments, Inc. (NYSE mortgage arbitrage REIT) |
| Jeremy I. Bulow (1954) | Director | Since 2011 | Professor of Economics, Stanford University, Graduate School of Business (1979 to present) | 45 | None |
| Anne Casscells (1958) | Director | Since 2016 | Co-Chief Executive Officer and Chief Investment Officer, Aetos Alternatives Management (investment advisory firm) (2001 to present); Lecturer in Accounting, Stanford University, Graduate School of Business (2009 to present) | 45 | None |
27
Name (Year of Birth) | Position(s) Held with Funds | Length of Time Served | Principal Occupation(s) During Past 5 Years | Number of American Century Portfolios Overseen by Director | Other Directorships Held During Past 5 Years |
| Independent Directors | |||||
| Ronald J. Gilson (1946) | Director and Chairman of the Board | Since 1995 (Chairman since 2005) | Charles J. Meyers Professor of Law and Business, Emeritus, Stanford Law School (1979 to present); Marc and Eva Stern Professor of Law and Business, Columbia University School of Law (1992 to present) | 45 | None |
| Frederick L. A. Grauer (1946) | Director | Since 2008 | Senior Advisor, iShares by BlackRock, Inc. (investment management firm) (2010 to 2011, 2013 to present); Senior Advisor, Course Hero (an educational technology company) (2015 to present) | 45 | None |
| Jonathan D. Levin (1972) | Director | Since 2016 | Holbrook Working Professor of Price Theory, Stanford University, (2000 to present); Chair, Department of Economics, Stanford University (2011 to 2014) | 45 | None |
| Peter F. Pervere (1947) | Director | Since 2007 | Retired | 45 | None |
| John B. Shoven (1947) | Director | Since 2002 | Charles R. Schwab Professor of Economics, Stanford University (1973 to present) | 45 | Cadence Design Systems; Exponent; Financial Engines |
| Interested Director | |||||
| Jonathan S. Thomas (1963) | Director and President | Since 2007 | President and Chief Executive Officer, ACC (March 2007 to present). Also serves as Chief Executive Officer, ACS; Executive Vice President, ACIM; Director, ACC, ACIM and other ACC subsidiaries | 128 | BioMed Valley Discoveries, Inc. |
The Statement of Additional Information has additional information about the fund's directors and is available without charge, upon request, by calling 1-800-345-2021.
28
Officers
The following table presents certain information about the executive officers of the funds. Each officer serves as an officer for each of the 15 investment companies in the American Century family of funds, unless otherwise noted. No officer is compensated for his or her service as an officer of the funds. The listed officers are interested persons of the funds and are appointed or re-appointed on an annual basis. The mailing address for each of the officers listed below is 4500 Main Street, Kansas City, Missouri 64111.
Name (Year of Birth) | Offices with the Funds | Principal Occupation(s) During the Past Five Years |
| Jonathan S. Thomas (1963) | Director and President since 2007 | President and Chief Executive Officer, ACC (March 2007 to present). Also serves as Chief Executive Officer, ACS; Executive Vice President, ACIM; Director, ACC, ACIM and other ACC subsidiaries |
| Amy D. Shelton (1964) | Chief Compliance Officer and Vice President since 2014 | Chief Compliance Officer, American Century funds, (March 2014 to present); Chief Compliance Officer, ACIM (February 2014 to present); Chief Compliance Officer, ACIS (October 2009 to present); Vice President, Client Interactions and Marketing, ACIS (February 2013 to January 2014); Director, Client Interactions and Marketing, ACIS (June 2007 to January 2013). Also serves as Vice President, ACIS |
| Charles A. Etherington (1957) | General Counsel since 2007 and Senior Vice President since 2006 | Attorney, ACC (February 1994 to present); Vice President, ACC (November 2005 to present); General Counsel, ACC (March 2007 to present). Also serves as General Counsel, ACIM, ACS, ACIS and other ACC subsidiaries; and Senior Vice President, ACIM and ACS |
| C. Jean Wade (1964) | Vice President, Treasurer and Chief Financial Officer since 2012 | Vice President, ACS (February 2000 to present) |
| Robert J. Leach (1966) | Vice President since 2006 and Assistant Treasurer since 2012 | Vice President, ACS (February 2000 to present) |
| David H. Reinmiller (1963) | Vice President since 2001 | Attorney, ACC (January 1994 to present); Associate General Counsel, ACC (January 2001 to present). Also serves as Vice President, ACIM and ACS |
| Ward D. Stauffer (1960) | Secretary since 2005 | Attorney, ACC (June 2003 to present) |
29
| Approval of Management Agreement |
At a meeting held on June 14, 2016, the Fund’s Board of Directors (the "Board") unanimously approved the renewal of the management agreement pursuant to which American Century Investment Management, Inc. (the “Advisor”) acts as the investment advisor for the Fund. Under Section 15(c) of the Investment Company Act, contracts for investment advisory services are required to be reviewed, evaluated, and approved by a majority of a fund’s directors/trustees, including a majority of the independent Directors, each year. The Board regards this annual evaluation and renewal as one of its most important responsibilities.
The independent Directors have memorialized a statement regarding the relationship between their ongoing obligations to oversee and evaluate the performance of the Advisor and their annual consideration of renewal of the management agreement. In that statement, the independent Directors noted that their assessment of the Advisor’s performance is an ongoing process that takes place over the entire year and is informed by all of the extensive information that the Board and its committees receive and consider over time. This information, together with the additional materials provided specifically in connection with the review, are central to the Board’s assessment of the Advisor’s performance and its determination whether to renew the Fund’s management agreement.
Prior to its consideration of the renewal of the management agreement, the Board requested and reviewed extensive data and analysis relating to the proposed renewal. This information and analysis was compiled by the Advisor and certain independent providers of evaluation data concerning the Fund and the services provided to the Fund by the Advisor.
In connection with its consideration of the renewal of the management agreement, the Board’s review and evaluation of the services provided by the Advisor included, but was not limited to, the following:
| • | the nature, extent, and quality of investment management, shareholder services, and other services provided by the Advisor to the Fund; |
| • | the wide range of other programs and services the Advisor provides to the Fund and its shareholders on a routine and non-routine basis; |
| • | the investment performance of the Fund, including data comparing the Fund’s performance to appropriate benchmarks and/or a peer group of other mutual funds with similar investment objectives and strategies; |
| • | the cost of owning the Fund compared to the cost of owning similar funds; |
| • | the Advisor’s compliance policies, procedures, and regulatory experience; |
| • | financial data showing the cost of services provided to the Fund, the profitability of the Fund to the Advisor, and the overall profitability of the Advisor; |
| • | possible economies of scale associated with the Advisor’s management of the Fund and other accounts under its management; |
| • | data comparing services provided and charges to other investment management clients of the Advisor; |
| • | acquired fund fees and expenses; |
| • | payments by the Fund and the Advisor to financial intermediaries whose clients are investors in the Fund; and |
| • | any collateral benefits derived by the Advisor from the management of the Fund. |
In keeping with its practice, the Board held two in-person meetings to review and discuss the information provided in response to their request. The independent Directors also had the benefit of the advice of their independent counsel throughout the process.
30
Factors Considered
The Directors considered all of the information provided by the Advisor, the independent data providers, and the independent Directors’ independent counsel in connection with the approval. They determined that the information was sufficient for them to evaluate the management agreement for the Fund. In connection with their review, the Directors did not identify any single factor as being all-important or controlling and each Director may have attributed different levels of importance to different factors. In deciding to renew the management agreement, the Board based its decision on a number of factors, including the following:
Nature, Extent and Quality of Services - Generally. Under the management agreement, the Advisor is responsible for providing or arranging for all services necessary for the operation of the Fund. The Board noted that under the management agreement, the Advisor provides or arranges at its own expense a wide variety of services including:
| • | constructing and designing the Fund |
| • | portfolio research and security selection |
| • | initial capitalization/funding |
| • | securities trading |
| • | Fund administration |
| • | custody of Fund assets |
| • | daily valuation of the Fund’s portfolio |
| • | shareholder servicing and transfer agency, including shareholder confirmations, recordkeeping, and communications |
| • | legal services (except the independent Directors’ counsel) |
| • | regulatory and portfolio compliance |
| • | financial reporting |
| • | marketing and distribution (except amounts paid by the Fund under Rule 12b-1 plans) |
The Board noted that many of these services have expanded over time in terms of both quantity and complexity in response to shareholder demands, competition in the industry, changing distribution channels, and the changing regulatory environment.
Investment Management, Shareholder, and Other Services. The nature of the investment management services provided to the Fund is quite complex and allows Fund shareholders access to professional money management, instant diversification of their investments within an asset class, the opportunity to easily diversify among asset classes by investing in or exchanging among various American Century Investments funds, and liquidity. In evaluating investment performance, the Board expects the Advisor to manage the Fund in accordance with its investment objectives and approved strategies. Further, the Directors recognize that the Advisor has an obligation to seek the best execution of fund trades. In providing these services, the Advisor utilizes teams of investment professionals (portfolio managers, analysts, research assistants, and securities traders) who require extensive information technology, research, training, compliance, and other systems to conduct their business. The Board, directly and through its Portfolio Committee, regularly reviews investment performance information for the Fund, together with comparative information for appropriate benchmarks and/or peer groups of similarly-managed funds, over different time horizons. The Directors also review detailed performance information during the management agreement approval process. If performance concerns are identified, the Fund receives special reviews until performance improves, during which the Board discusses with the Advisor the reasons for such results (e.g., market conditions, security selection) and any efforts being undertaken to improve performance. The Fund’s performance was below its benchmark for the one-year period reviewed by the Board. The Board discussed the Fund’s performance with the Advisor and was satisfied with the efforts being undertaken by the Advisor. The Board found the investment management services provided by the Advisor to the Fund to be satisfactory and consistent with the management agreement.
31
Under the management agreement, the Advisor provides the Fund with a comprehensive package of transfer agency, shareholder, and other services. The Board, directly and through various committees of the Board, regularly reviews reports and evaluations of such services at its regular meetings. These reports include, but are not limited to, information regarding the operational efficiency and accuracy of the shareholder and transfer agency services provided, staffing levels, shareholder satisfaction (as measured by external as well as internal sources), technology support, new products and services offered to Fund shareholders, securities trading activities, portfolio valuation services, auditing services, and legal and operational compliance activities. Certain aspects of shareholder and transfer agency service level efficiency and the quality of securities trading activities are measured by independent third party providers and are presented in comparison to other fund groups not managed by the Advisor.
The Board found the services provided by the Advisor to the Fund under the management agreement to be competitive and of high quality.
Costs of Services and Profitability. The Advisor provides detailed information concerning its cost of providing various services to the Fund, its profitability in managing the Fund, its overall profitability, and its financial condition. The Directors have reviewed with the Advisor the methodology used to prepare this financial information. This information is considered in evaluating the Advisor’s financial condition, its ability to continue to provide services under the management agreement, and the reasonableness of the current management fee. The Board concluded that the Advisor’s profits were reasonable in light of the services provided to the Fund.
Economies of Scale. The Board also reviewed information provided by the Advisor regarding the possible existence of economies of scale in connection with the management of the Fund. The Board concluded that economies of scale are difficult to measure and predict with precision, especially on a fund-by-fund basis. The Board concluded that the Advisor is appropriately sharing economies of scale through its competitive fee structure, offering competitive fees from fund inception, and through reinvestment in its business to provide shareholders enhanced and expanded services.
Comparison to Other Funds’ Fees. The management agreement provides that the Fund pays the Advisor a single, all-inclusive (or unified) management fee for providing all services necessary for the management and operation of the Fund, other than brokerage expenses, expenses attributable to short sales, taxes, interest, extraordinary expenses, the fees and expenses of the Fund’s independent Directors (including their independent legal counsel), and expenses incurred in connection with the provision of shareholder services and distribution services under a plan adopted pursuant to Rule 12b-1 under the 1940 Act. Under the unified fee structure, the Advisor is responsible for providing all investment advisory, custody, audit, administrative, compliance, recordkeeping, marketing, and shareholder services, or arranging and supervising third parties to provide such services. By contrast, most other funds are charged a variety of fees, including an investment advisory fee, a transfer agency fee, an administrative fee, distribution charges, and other expenses. Other than their investment advisory fees and any applicable Rule 12b-1 fees, all other components of the total fees charged by these other funds may be increased without shareholder approval. The Board believes the unified fee structure is a benefit to Fund shareholders because it clearly discloses to shareholders the cost of owning Fund shares, and, since the unified fee cannot be increased without a vote of Fund shareholders, it shifts to the Advisor the risk of increased costs of operating the Fund and provides a direct incentive to minimize administrative inefficiencies. Part of the Board’s analysis of fee levels involves reviewing certain evaluative data compiled by an independent provider and comparing the Fund’s unified fee to the total expense ratio of peer funds. The unified fee charged to shareholders of the Fund was above the median of the total expense ratios of the Fund’s peer universe. The Board concluded that the management fee paid by the Fund to the Advisor under the management agreement is reasonable in light of the services provided to the Fund.
32
Comparison to Fees and Services Provided to Other Clients of the Advisor. The Board also requested and received information from the Advisor concerning the nature of the services, fees, costs, and profitability of its advisory services to advisory clients other than the Fund. They observed that these varying types of client accounts require different services and involve different regulatory and entrepreneurial risks than the management of the Fund. The Board analyzed this information and concluded that the fees charged and services provided to the Fund were reasonable by comparison.
Payments to Intermediaries. The Directors also requested and received a description of payments made to intermediaries by the Fund and the Advisor. These payments include various payments made by the Fund or the Advisor to different types of intermediaries and recordkeepers for distribution and service activities provided for the Fund.
Collateral or “Fall-Out” Benefits Derived by the Advisor. The Board considered the existence of collateral benefits the Advisor may receive as a result of its relationship with the Fund. The Board noted that the Advisor’s primary business is managing mutual funds and it generally does not use fund or shareholder information to generate profits in other lines of business, and therefore does not derive any significant collateral benefits from them. The Board noted that the Advisor receives proprietary research from broker-dealers that execute fund portfolio transactions. The Board also determined that the Advisor is able to provide investment management services to certain clients other than the Fund, at least in part, due to its existing infrastructure built to serve the fund complex.
Existing Relationship. The Board also considered whether there was any reason for not continuing the existing arrangement with the Advisor. In this regard, the Board was mindful of the potential disruptions of the Fund’s operations and various risks, uncertainties, and other effects that could occur as a result of a decision not to continue such relationship. In particular, the Board recognized that most shareholders have invested in the Fund on the strength of the Advisor’s industry standing and reputation and in the expectation that the Advisor will have a continuing role in providing advisory services to the Fund.
Conclusion of the Directors. As a result of this process, the Board, including all of the independent Directors and assisted by the advice of independent legal counsel, taking into account all of the factors discussed above and the information provided by the Advisor and others in connection with its review and throughout the year, concluded that the management agreement between the Fund and the Advisor is fair and reasonable in light of the services provided and should be renewed.
33
| Proxy Voting Results |
A special meeting of shareholders was held on June 13, 2016, to vote on the following proposal. The proposal received the required number of votes and was adopted. A summary of voting results is listed below.
To elect four directors to the Board of Directors of American Century Quantitative Equity Funds, Inc.:
| Affirmative | Withhold | ||||||
| Tanya S. Beder | $ | 8,473,153,264 | $ | 121,459,590 | |||
| Jeremy I. Bulow | $ | 8,469,793,581 | $ | 124,819,273 | |||
| Anne Casscells | $ | 8,465,895,232 | $ | 128,717,622 | |||
| Jonathan D. Levin | $ | 8,468,929,867 | $ | 125,682,987 | |||
The other directors whose term of office continued after the meeting include Jonathan S. Thomas, Ronald J. Gilson, Frederick L. A. Grauer, Peter F. Pervere and John B. Shoven.
34
| Additional Information |
Retirement Account Information
As required by law, distributions you receive from certain IRAs are subject to federal income tax withholding, unless you elect not to have withholding apply. Tax will be withheld on the total amount withdrawn even though you may be receiving amounts that are not subject to withholding, such as nondeductible contributions. In such case, excess amounts of withholding could occur. You may adjust your withholding election so that a greater or lesser amount will be withheld.
If you don’t want us to withhold on this amount, you must notify us to not withhold the federal income tax. You may notify us in writing or in certain situations by telephone or through other electronic means. For systematic withdrawals, your withholding election will remain in effect until revoked or changed by filing a new election. You have the right to revoke your election at any time.
Remember, even if you elect not to have income tax withheld, you are liable for paying income tax on the taxable portion of your withdrawal. If you elect not to have income tax withheld or you don’t have enough income tax withheld, you may be responsible for payment of estimated tax. You may incur penalties under the estimated tax rules if your withholding and estimated tax payments are not sufficient. You can reduce or defer the income tax on a distribution by directly or indirectly rolling such distribution over to another IRA or eligible plan. You should consult your tax advisor for additional information.
State tax will be withheld if, at the time of your distribution, your address is within one of the mandatory withholding states and you have federal income tax withheld (or as otherwise required by state law). State taxes will be withheld from your distribution in accordance with the respective state rules.
Distributions you receive from 403(b), 457 and qualified plans are subject to special tax and withholding rules. Your plan administrator or plan sponsor is required to provide you with a special tax notice explaining those rules at the time you request a distribution. If applicable, federal and/or state taxes may be withheld from your distribution amount.
Proxy Voting Policies
Descriptions of the principles and policies that the fund's investment advisor uses in exercising the voting rights associated with the securities purchased and/or held by the fund are available without charge, upon request, by calling 1-800-345-2021 or visiting the "About Us" page of American Century Investments’ website at americancentury.com. A description of the policies is also available on the Securities and Exchange Commission’s website at sec.gov. Information regarding how the investment advisor voted proxies relating to portfolio securities during the most recent 12-month period ended June 30 is available on the "About Us" page at americancentury.com. It is also available at sec.gov.
Quarterly Portfolio Disclosure
The fund files its complete schedule of portfolio holdings with the Securities and Exchange Commission (SEC) for the first and third quarters of each fiscal year on Form N-Q. The fund’s Forms N-Q are available on the SEC’s website at sec.gov, and may be reviewed and copied at the SEC’s Public Reference Room in Washington, DC. Information on the operation of the Public Reference Room may be obtained by calling 1-800-SEC-0330. The fund also makes its complete schedule of portfolio holdings for the most recent quarter of its fiscal year available on its website at americancentury.com and, upon request, by calling 1-800-345-2021.
35
Other Tax Information
The following information is provided pursuant to provisions of the Internal Revenue Code.
The fund hereby designates up to the maximum amount allowable as qualified dividend income for the fiscal year ended June 30, 2016.
For the fiscal year ended June 30, 2016, the fund intends to pass through to shareholders foreign source income of $198,766 and foreign taxes paid of $23,193, or up to the maximum amount allowable, as a foreign tax credit. Foreign source income and foreign tax expense per outstanding share on June 30, 2016 are $0.2498 and $0.0292, respectively.
36
| ||
| Contact Us | americancentury.com | |
| Automated Information Line | 1-800-345-8765 | |
| Investor Services Representative | 1-800-345-2021 or 816-531-5575 | |
| Investors Using Advisors | 1-800-378-9878 | |
| Business, Not-For-Profit, Employer-Sponsored Retirement Plans | 1-800-345-3533 | |
| Banks and Trust Companies, Broker-Dealers, Financial Professionals, Insurance Companies | 1-800-345-6488 | |
| Telecommunications Relay Service for the Deaf | 711 | |
| American Century Quantitative Equity Funds, Inc. | ||
Investment Advisor: American Century Investment Management, Inc. Kansas City, Missouri | ||
| This report and the statements it contains are submitted for the general information of our shareholders. The report is not authorized for distribution to prospective investors unless preceded or accompanied by an effective prospectus. | ||
| ©2016 American Century Proprietary Holdings, Inc. All rights reserved. CL-ANN-89960 1608 | ||
| Annual Report | |
| June 30, 2016 | |
| Equity Growth Fund | |
| Table of Contents |
| President's Letter | 2 | |
| Performance | 3 | |
| Portfolio Commentary | ||
| Fund Characteristics | ||
| Shareholder Fee Example | ||
| Schedule of Investments | ||
| Statement of Assets and Liabilities | ||
| Statement of Operations | ||
| Statement of Changes in Net Assets | ||
| Notes to Financial Statements | ||
| Financial Highlights | ||
| Report of Independent Registered Public Accounting Firm | ||
| Management | ||
| Approval of Management Agreement | ||
| Proxy Voting Results | ||
| Additional Information | ||
Any opinions expressed in this report reflect those of the author as of the date of the report, and do not necessarily represent the opinions of American Century Investments® or any other person in the American Century Investments organization. Any such opinions are subject to change at any time based upon market or other conditions and American Century Investments disclaims any responsibility to update such opinions. These opinions may not be relied upon as investment advice and, because investment decisions made by American Century Investments funds are based on numerous factors, may not be relied upon as an indication of trading intent on behalf of any American Century Investments fund. Security examples are used for representational purposes only and are not intended as recommendations to purchase or sell securities. Performance information for comparative indices and securities is provided to American Century Investments by third party vendors. To the best of American Century Investments’ knowledge, such information is accurate at the time of printing.
| President’s Letter |
Jonathan ThomasDear Investor:
Thank you for reviewing this annual report for the 12 months ended June 30, 2016. It provides investment performance and portfolio information for the reporting period, plus longer-term historical performance data.
Annual reports remain important vehicles for conveying information about fund returns, including market and economic factors that affected performance during the reporting period. For additional, updated investment and market insights, we encourage you to visit our website, americancentury.com.
Market Volatility Increased, But Not for the Reasons Anticipated
Going into this reporting period, investors anticipated increased market volatility and uncertainty as the Federal Reserve (the Fed) appeared poised to raise short-term interest rates toward more historically normal levels. This policy change was expected to affect investor sentiment, U.S. Treasury yield behavior, relative currency values, inflation expectations, and corporate costs and earnings.
This Fed-centric outlook didn’t fully account for global factors, which ultimately drove sentiment, volatility, and performance during the reporting period. During 2015, the primary catalyst was China, where slowing economic growth, currency devaluations, and massive monetary policy easing sent shock waves through the global markets. The Fed ended up delaying (until December 2015) its only small rate hike during the reporting period. Afterward, China-related events repeated in January and early February this year, further delaying Fed action.
Oil was another catalyst—its price collapses devalued entire market sectors and contributed to broad market volatility and negative sentiment. Later, as China and oil appeared to stabilize, Brexit occurred—the unexpected decision by United Kingdom voters to leave the European Union. This produced more shock waves, and altered central bank policies around the world. In this environment, relatively defensive assets performed best for the 12 months, including the stocks of gold-producing companies, utilities, real estate investment trusts (REITs), and long-maturity U.S. Treasury securities.
Looking ahead, we believe the markets face further uncertainty and volatility as they digest Brexit, the Italian bank crisis, China’s economic mysteries, and the U.S. presidential election. Negative interest rates in Europe and Japan represent part of the market’s response to the global macroeconomic climate. These negative rates are suppressing interest rates around the world while driving up the value of the U.S. dollar and U.S. bonds. In a broad sense, stocks also benefit from the central bank stimulus that is driving interest rates into negative territory, and from relative yield advantages as bond yields are pushed lower. It’s an unusual and challenging environment. We appreciate your continued trust in us.
Sincerely,
Jonathan Thomas
President and Chief Executive Officer
American Century Investments
2
| Performance |
| Total Returns as of June 30, 2016 | |||||
| Average Annual Returns | |||||
Ticker Symbol | 1 year | 5 years | 10 years | Inception Date | |
| Investor Class | BEQGX | -2.78% | 10.51% | 6.23% | 5/9/91 |
| S&P 500 Index | — | 3.99% | 12.09% | 7.42% | — |
| Institutional Class | AMEIX | -2.58% | 10.73% | 6.44% | 1/2/98 |
| A Class | BEQAX | 10/9/97 | |||
| No sales charge | -3.03% | 10.24% | 5.97% | ||
| With sales charge | -8.60% | 8.94% | 5.34% | ||
| C Class | AEYCX | -3.73% | 9.42% | 5.18% | 7/18/01 |
| R Class | AEYRX | -3.24% | 9.97% | 5.70% | 7/29/05 |
Prior to September 4, 2007, the A Class was referred to as the Advisor Class and did not have a front-end sales charge. Performance prior to that date has been adjusted to reflect this charge.
Sales charges include initial sales charges and contingent deferred sales charges (CDSCs), as applicable. A Class shares have a 5.75% maximum initial sales charge and may be subject to a maximum CDSC of 1.00%. C Class shares redeemed within 12 months of purchase are subject to a maximum CDSC of 1.00%. The SEC requires that mutual funds provide performance information net of maximum sales charges in all cases where charges could be applied.
Data presented reflect past performance. Past performance is no guarantee of future results. Current performance may be higher or lower than the performance shown. Total returns for periods less than one year are not annualized. Investment return and principal value will fluctuate, and redemption value may be more or less than original cost. Data assumes reinvestment of dividends and capital gains, and none of the charts reflect the deduction of taxes that a shareholder would pay on fund distributions or the redemption of fund shares. To obtain performance data current to the most recent month end, please call 1-800-345-2021 or visit americancentury.com. For additional information about the fund, please consult the prospectus.
3
| Growth of $10,000 Over 10 Years |
| $10,000 investment made June 30, 2006 |
| Performance for other share classes will vary due to differences in fee structure. |

| Value on June 30, 2016 | |
| Investor Class — $18,314 | |
| S&P 500 Index — $20,465 | |
| Total Annual Fund Operating Expenses | ||||
| Investor Class | Institutional Class | A Class | C Class | R Class |
| 0.67% | 0.47% | 0.92% | 1.67% | 1.17% |
The total annual fund operating expenses shown is as stated in the fund’s prospectus current as of the date of this report. The prospectus may vary from the expense ratio shown elsewhere in this report because it is based on a different time period, includes acquired fund fees and expenses, and, if applicable, does not include fee waivers or expense reimbursements.
Data presented reflect past performance. Past performance is no guarantee of future results. Current performance may be higher or lower than the performance shown. Total returns for periods less than one year are not annualized. Investment return and principal value will fluctuate, and redemption value may be more or less than original cost. Data assumes reinvestment of dividends and capital gains, and none of the charts reflect the deduction of taxes that a shareholder would pay on fund distributions or the redemption of fund shares. To obtain performance data current to the most recent month end, please call 1-800-345-2021 or visit americancentury.com. For additional information about the fund, please consult the prospectus.
4
| Portfolio Commentary |
Portfolio Manager: Claudia Musat
In May 2016, portfolio manager Bill Martin left the fund's management team.
Performance Summary
Equity Growth returned -2.78%* for the fiscal year ended June 30, 2016, compared with the 3.99% return of its benchmark, the S&P 500 Index.
Equity Growth declined during the fiscal year, underperforming its benchmark, the S&P 500 Index. Security selection in the industrials, consumer discretionary, and financials sectors led fund detraction, while materials sector holdings contributed to relative performance.
Equity Growth’s stock selection process incorporates factors of valuation, quality, growth, and sentiment while striving to minimize unintended risks along industries and other risk characteristics. Within the fund, valuation factors were detrimental to selection results, while quality- and sentiment-based insights were somewhat positive. Growth was largely neutral.
Stock Choices Across Several Sectors Hindered Relative Returns
A number of industrials sector holdings pressured the fund’s 12-month results, although no individual position was a leading underperformer. Similarly, consumer discretionary holdings weighed on results, driven by a portfolio-only position in GoPro, as the wearable camera maker’s stock slumped on concerns about economic growth in China and a bleak outlook for wearable camera demand. We ultimately sold our stake in the position.
Security selection in the financials sector was also a principal detractor. A number of capital markets holdings weighed on the sector’s results, including Legg Mason, an overweight position relative to the benchmark. The asset manager’s stock price came under pressure after reporting a quarterly net loss and announcing several strategic acquisitions and agreements. Shares of commercial real estate services company Jones Lang LaSalle, a portfolio-only holding, declined sharply on disappointing quarterly earnings in early 2016 during a difficult environment for financial stocks. Both holding were subsequently liquidated.
Health care was another area of weakness, particularly among biotechnology companies. An overweight position in Biogen hindered results. The biopharmaceutical holding’s share price fell sharply on disappointing revenue and lowered earnings guidance for 2015 as a result of declining sales of its Tecfidera multiple sclerosis treatment. Nevertheless, we believe the holding’s attractive valuation and growth characteristics support our positioning. Elsewhere, the fund’s underweight position, relative to the benchmark, in internet giant Alphabet, the parent company of Google, negatively impacted results as its stock price appreciated strongly during the period on substantial growth in mobile advertising revenues as users increasingly migrated to mobile platforms.
| * | All fund returns referenced in this commentary are for Investor Class shares. Performance for other share classes will vary due to differences in fee structure; when Investor Class performance exceeds that of the fund's benchmark, other share classes may not. See page 3 for returns for all share classes. |
5
Materials Sector Holdings Contributed
Stock selection in the materials sector bolstered the fund’s relative returns, especially an overweight position in Newmont Mining. The gold and silver miner benefited from rising precious metals prices, which bolstered the broad sector during the second half of the period. The holding’s valuation and growth metrics declined, and we opted to exit our investment. Portfolio-only holding Cabot, a specialty chemicals manufacturer, also gained on the commodity rally that lifted many materials stocks.
Several consumer staples stocks were leading individual outperformers, helping to limit the fund’s decline. These included Kroger, a grocery chain operator, whose strong profit growth was fueled by rising comparable store sales. Deceleration across most factors led us to liquidate our investment in the stock. Tyson Foods was beneficial as the poultry processor’s stock price reached new highs after beating quarterly earnings projections and raising future profit guidance.
A Look Ahead
At period end, consumer staples and information technology were the fund’s largest overweight positions on a sector basis. In consumer staples, we are finding opportunities in household goods manufacturers. We think that software and internet software and services companies are attractive in the information technology sector, where key themes are mobile, search, cloud computing, big data, and the shift to digital/online retail. This is creating growth and quality opportunities. Valuation and sentiment also are positive for select firms in these industries. After the dramatic sell-off in 2015, health care names, particularly in the biotech space, are compelling based on valuation factors. Growth and quality metrics also are favorable. The financials and consumer discretionary sectors, both portfolio underweights, continue to face challenges, in our opinion. In financials, we find that large-cap real estate investment trusts and diversified financial services firms are challenged across virtually all dimensions. Growth scores are not favorable in consumer discretionary, particularly among specialty retailers. In fundamental terms, many of these traditional brick-and-mortar retailers face challenging business conditions and have poor growth and quality rankings. Our disciplined, objective, and systematic investment strategy is designed to take advantage of opportunities at the individual company level. We believe this approach is the most powerful way to capitalize on market inefficiencies that lead to the mispricing of individual stocks. Our strategy is designed to provide investors with well-diversified and risk-controlled exposure to broad U.S. equities. As such, we do not see significant deviations in sector weightings versus the S&P 500.
6
| Fund Characteristics |
| JUNE 30, 2016 | |
| Top Ten Holdings | % of net assets |
| Alphabet, Inc., Class A | 3.1% |
| Microsoft Corp. | 3.0% |
| Amazon.com, Inc. | 2.3% |
| Exxon Mobil Corp. | 2.1% |
| Apple, Inc. | 2.1% |
| Procter & Gamble Co. (The) | 2.1% |
| Merck & Co., Inc. | 1.9% |
| Facebook, Inc., Class A | 1.8% |
| Intel Corp. | 1.7% |
| PepsiCo, Inc. | 1.7% |
| Top Five Industries | % of net assets |
| Software | 6.6% |
| Biotechnology | 5.3% |
| Pharmaceuticals | 5.1% |
| Internet Software and Services | 4.9% |
| Food Products | 4.4% |
| Types of Investments in Portfolio | % of net assets |
| Common Stocks | 99.1% |
| Temporary Cash Investments | 0.9% |
| Other Assets and Liabilities | —* |
*Category is less than 0.05% of total net assets.
7
| Shareholder Fee Example |
Fund shareholders may incur two types of costs: (1) transaction costs, including sales charges (loads) on purchase payments and redemption/exchange fees; and (2) ongoing costs, including management fees; distribution and service (12b-1) fees; and other fund expenses. This example is intended to help you understand your ongoing costs (in dollars) of investing in your fund and to compare these costs with the ongoing cost of investing in other mutual funds.
The example is based on an investment of $1,000 made at the beginning of the period and held for the entire period from January 1, 2016 to June 30, 2016.
Actual Expenses
The table provides information about actual account values and actual expenses for each class. You may use the information, together with the amount you invested, to estimate the expenses that you paid over the period. First, identify the share class you own. Then simply divide your account value by $1,000 (for example, an $8,600 account value divided by $1,000 = 8.6), then multiply the result by the number under the heading “Expenses Paid During Period” to estimate the expenses you paid on your account during this period.
If you hold Investor Class shares of any American Century Investments fund, or Institutional Class shares of the American Century Diversified Bond Fund, in an American Century Investments account (i.e., not a financial intermediary or retirement plan account), American Century Investments may charge you a $12.50 semiannual account maintenance fee if the value of those shares is less than $10,000. We will redeem shares automatically in one of your accounts to pay the $12.50 fee. In determining your total eligible investment amount, we will include your investments in all personal accounts (including American Century Investments Brokerage accounts) registered under your Social Security number. Personal accounts include individual accounts, joint accounts, UGMA/UTMA accounts, personal trusts, Coverdell Education Savings Accounts and IRAs (including traditional, Roth, Rollover, SEP-, SARSEP- and SIMPLE-IRAs), and certain other retirement accounts. If you have only business, business retirement, employer-sponsored or American Century Investments Brokerage accounts, you are currently not subject to this fee. If you are subject to the Account Maintenance Fee, your account value could be reduced by the fee amount.
Hypothetical Example for Comparison Purposes
The table also provides information about hypothetical account values and hypothetical expenses based on the actual expense ratio of each class of your fund and an assumed rate of return of 5% per year before expenses, which is not the actual return of a fund’s share class. The hypothetical account values and expenses may not be used to estimate the actual ending account balance or expenses you paid for the period. You may use this information to compare the ongoing costs of investing in your fund and other funds. To do so, compare this 5% hypothetical example with the 5% hypothetical examples that appear in the shareholder reports of the other funds.
Please note that the expenses shown in the table are meant to highlight your ongoing costs only and do not reflect any transactional costs, such as sales charges (loads) or redemption/exchange fees. Therefore, the table is useful in comparing ongoing costs only, and will not help you determine the relative total costs of owning different funds. In addition, if these transactional costs were included, your costs would have been higher.
8
| Beginning Account Value 1/1/16 | Ending Account Value 6/30/16 | Expenses Paid During Period(1) 1/1/16 - 6/30/16 | Annualized Expense Ratio(1) | |
| Actual | ||||
| Investor Class | $1,000 | $1,015.50 | $3.41 | 0.68% |
| Institutional Class | $1,000 | $1,016.50 | $2.41 | 0.48% |
| A Class | $1,000 | $1,014.00 | $4.66 | 0.93% |
| C Class | $1,000 | $1,010.80 | $8.40 | 1.68% |
| R Class | $1,000 | $1,013.10 | $5.91 | 1.18% |
| Hypothetical | ||||
| Investor Class | $1,000 | $1,021.48 | $3.42 | 0.68% |
| Institutional Class | $1,000 | $1,022.48 | $2.41 | 0.48% |
| A Class | $1,000 | $1,020.24 | $4.67 | 0.93% |
| C Class | $1,000 | $1,016.51 | $8.42 | 1.68% |
| R Class | $1,000 | $1,019.00 | $5.92 | 1.18% |
| (1) | Expenses are equal to the class's annualized expense ratio listed in the table above, multiplied by the average account value over the period, multiplied by 182, the number of days in the most recent fiscal half-year, divided by 366, to reflect the one-half year period. |
9
| Schedule of Investments |
JUNE 30, 2016
| Shares | Value | |||
| COMMON STOCKS — 99.1% | ||||
| Aerospace and Defense — 2.0% | ||||
| Boeing Co. (The) | 308,925 | $ | 40,120,090 | |
Spirit AeroSystems Holdings, Inc., Class A(1) | 494,583 | 21,267,069 | ||
| 61,387,159 | ||||
| Airlines — 1.4% | ||||
| Alaska Air Group, Inc. | 102,023 | 5,946,920 | ||
| Delta Air Lines, Inc. | 155,612 | 5,668,945 | ||
JetBlue Airways Corp.(1) | 716,923 | 11,872,245 | ||
United Continental Holdings, Inc.(1) | 507,967 | 20,846,966 | ||
| 44,335,076 | ||||
| Auto Components — 1.3% | ||||
| Goodyear Tire & Rubber Co. (The) | 846,167 | 21,712,645 | ||
| Lear Corp. | 202,836 | 20,640,592 | ||
| 42,353,237 | ||||
| Banks — 2.9% | ||||
| Citigroup, Inc. | 1,116,843 | 47,342,975 | ||
| JPMorgan Chase & Co. | 248,435 | 15,437,751 | ||
| SunTrust Banks, Inc. | 367,468 | 15,095,585 | ||
| Wells Fargo & Co. | 296,770 | 14,046,124 | ||
| 91,922,435 | ||||
| Beverages — 2.1% | ||||
| Coca-Cola Co. (The) | 89,153 | 4,041,306 | ||
| Dr Pepper Snapple Group, Inc. | 93,288 | 9,014,419 | ||
| PepsiCo, Inc. | 495,483 | 52,491,469 | ||
| 65,547,194 | ||||
| Biotechnology — 5.3% | ||||
| AbbVie, Inc. | 661,930 | 40,980,086 | ||
| Amgen, Inc. | 307,244 | 46,747,175 | ||
Biogen, Inc.(1) | 134,347 | 32,487,791 | ||
| Gilead Sciences, Inc. | 516,100 | 43,053,062 | ||
United Therapeutics Corp.(1) | 29,549 | 3,129,830 | ||
| 166,397,944 | ||||
| Building Products — 1.2% | ||||
| Owens Corning | 553,981 | 28,541,101 | ||
USG Corp.(1) | 328,253 | 8,849,701 | ||
| 37,390,802 | ||||
| Capital Markets — 0.4% | ||||
| Eaton Vance Corp. | 332,898 | 11,764,615 | ||
| Chemicals — 3.7% | ||||
| Air Products & Chemicals, Inc. | 233,186 | 33,121,740 | ||
| Cabot Corp. | 496,232 | 22,657,953 | ||
| Dow Chemical Co. (The) | 628,990 | 31,267,093 | ||
| PPG Industries, Inc. | 262,089 | 27,296,569 | ||
| 114,343,355 | ||||
| Communications Equipment — 1.6% | ||||
| Cisco Systems, Inc. | 1,735,337 | 49,786,819 | ||
10
| Shares | Value | |||
| Consumer Finance — 2.7% | ||||
| American Express Co. | 503,539 | $ | 30,595,030 | |
| Discover Financial Services | 560,002 | 30,010,507 | ||
Synchrony Financial(1) | 993,003 | 25,103,116 | ||
| 85,708,653 | ||||
| Containers and Packaging — 0.2% | ||||
| Avery Dennison Corp. | 91,735 | 6,857,191 | ||
| Diversified Financial Services — 1.6% | ||||
Berkshire Hathaway, Inc., Class B(1) | 147,745 | 21,391,999 | ||
| MSCI, Inc., Class A | 50,799 | 3,917,619 | ||
| Nasdaq, Inc. | 400,557 | 25,904,021 | ||
| 51,213,639 | ||||
| Diversified Telecommunication Services — 2.8% | ||||
| AT&T, Inc. | 976,194 | 42,181,343 | ||
| Verizon Communications, Inc. | 819,916 | 45,784,109 | ||
| 87,965,452 | ||||
| Electric Utilities — 0.3% | ||||
| NextEra Energy, Inc. | 61,954 | 8,078,802 | ||
| Energy Equipment and Services — 1.3% | ||||
| Atwood Oceanics, Inc. | 427,322 | 5,350,071 | ||
Dril-Quip, Inc.(1) | 16,886 | 986,649 | ||
FMC Technologies, Inc.(1) | 840,859 | 22,425,710 | ||
| Rowan Cos. plc | 665,117 | 11,745,966 | ||
| 40,508,396 | ||||
| Food and Staples Retailing — 1.5% | ||||
| Wal-Mart Stores, Inc. | 629,585 | 45,972,297 | ||
| Food Products — 4.4% | ||||
| Campbell Soup Co. | 65,510 | 4,358,380 | ||
| Dean Foods Co. | 806,836 | 14,595,663 | ||
| General Mills, Inc. | 314,951 | 22,462,305 | ||
| Hershey Co. (The) | 195,487 | 22,185,820 | ||
| Hormel Foods Corp. | 724,768 | 26,526,509 | ||
| Ingredion, Inc. | 79,992 | 10,351,765 | ||
| Pilgrim's Pride Corp. | 400,509 | 10,204,969 | ||
| Tyson Foods, Inc., Class A | 389,765 | 26,032,405 | ||
| 136,717,816 | ||||
| Gas Utilities — 0.7% | ||||
| ONE Gas, Inc. | 133,918 | 8,917,600 | ||
| Southwest Gas Corp. | 75,656 | 5,954,884 | ||
| UGI Corp. | 144,646 | 6,545,231 | ||
| 21,417,715 | ||||
| Health Care Equipment and Supplies — 3.2% | ||||
| Abbott Laboratories | 39,690 | 1,560,214 | ||
| Becton Dickinson and Co. | 35,490 | 6,018,749 | ||
| C.R. Bard, Inc. | 117,284 | 27,580,505 | ||
| Medtronic plc | 447,183 | 38,802,069 | ||
| St. Jude Medical, Inc. | 325,642 | 25,400,076 | ||
| 99,361,613 | ||||
| Health Care Providers and Services — 2.0% | ||||
| Aetna, Inc. | 130,262 | 15,908,898 | ||
| AmerisourceBergen Corp. | 140,213 | 11,121,695 | ||
11
| Shares | Value | |||
Express Scripts Holding Co.(1) | 461,115 | $ | 34,952,517 | |
| 61,983,110 | ||||
| Hotels, Restaurants and Leisure — 2.2% | ||||
| Bloomin' Brands, Inc. | 567,895 | 10,148,284 | ||
| Carnival Corp. | 586,201 | 25,910,084 | ||
| Darden Restaurants, Inc. | 400,797 | 25,386,482 | ||
| McDonald's Corp. | 72,843 | 8,765,926 | ||
| 70,210,776 | ||||
| Household Products — 3.3% | ||||
| Clorox Co. (The) | 31,354 | 4,339,080 | ||
| Kimberly-Clark Corp. | 243,877 | 33,528,210 | ||
| Procter & Gamble Co. (The) | 772,008 | 65,365,917 | ||
| 103,233,207 | ||||
| Independent Power and Renewable Electricity Producers — 0.1% | ||||
| Ormat Technologies, Inc. | 35,914 | 1,571,597 | ||
| Industrial Conglomerates — 3.5% | ||||
| 3M Co. | 134,299 | 23,518,441 | ||
| Carlisle Cos., Inc. | 233,786 | 24,706,504 | ||
| Danaher Corp. | 341,932 | 34,535,132 | ||
| General Electric Co. | 816,614 | 25,707,009 | ||
| 108,467,086 | ||||
| Insurance — 2.0% | ||||
| Aflac, Inc. | 69,951 | 5,047,664 | ||
| Aon plc | 84,895 | 9,273,081 | ||
| Hanover Insurance Group, Inc. (The) | 279,778 | 23,674,814 | ||
| Prudential Financial, Inc. | 19,341 | 1,379,787 | ||
| Unum Group | 696,467 | 22,140,686 | ||
| 61,516,032 | ||||
| Internet and Catalog Retail — 2.3% | ||||
Amazon.com, Inc.(1) | 98,711 | 70,639,566 | ||
Priceline Group, Inc. (The)(1) | 1,241 | 1,549,277 | ||
| 72,188,843 | ||||
| Internet Software and Services — 4.9% | ||||
Alphabet, Inc., Class A(1) | 141,372 | 99,459,443 | ||
Facebook, Inc., Class A(1) | 485,041 | 55,430,486 | ||
| 154,889,929 | ||||
| IT Services — 1.7% | ||||
| International Business Machines Corp. | 301,831 | 45,811,909 | ||
PayPal Holdings, Inc.(1) | 198,941 | 7,263,336 | ||
| 53,075,245 | ||||
| Life Sciences Tools and Services — 1.1% | ||||
| Thermo Fisher Scientific, Inc. | 241,266 | 35,649,464 | ||
| Machinery — 1.9% | ||||
| PACCAR, Inc. | 586,184 | 30,405,364 | ||
| Stanley Black & Decker, Inc. | 230,145 | 25,596,727 | ||
| Toro Co. (The) | 41,331 | 3,645,394 | ||
| 59,647,485 | ||||
| Media — 2.4% | ||||
AMC Networks, Inc., Class A(1) | 45,935 | 2,775,393 | ||
| Time Warner, Inc. | 387,052 | 28,463,804 | ||
| Viacom, Inc., Class B | 613,824 | 25,455,281 | ||
12
| Shares | Value | |||
| Walt Disney Co. (The) | 182,639 | $ | 17,865,747 | |
| 74,560,225 | ||||
| Metals and Mining — 1.0% | ||||
| Barrick Gold Corp. | 287,992 | 6,148,629 | ||
| Nucor Corp. | 526,101 | 25,994,651 | ||
| 32,143,280 | ||||
| Multi-Utilities — 0.1% | ||||
| CenterPoint Energy, Inc. | 73,123 | 1,754,952 | ||
| Multiline Retail — 1.1% | ||||
| Target Corp. | 479,854 | 33,503,406 | ||
| Oil, Gas and Consumable Fuels — 3.8% | ||||
| Apache Corp. | 79,954 | 4,451,039 | ||
| Chevron Corp. | 323,809 | 33,944,897 | ||
| Exxon Mobil Corp. | 712,709 | 66,809,342 | ||
| World Fuel Services Corp. | 289,838 | 13,764,407 | ||
| 118,969,685 | ||||
| Personal Products — 0.5% | ||||
| Estee Lauder Cos., Inc. (The), Class A | 168,467 | 15,333,866 | ||
| Pharmaceuticals — 5.1% | ||||
| Johnson & Johnson | 269,685 | 32,712,791 | ||
| Merck & Co., Inc. | 1,009,054 | 58,131,601 | ||
Mylan NV(1) | 599,050 | 25,902,922 | ||
| Pfizer, Inc. | 1,221,626 | 43,013,451 | ||
| 159,760,765 | ||||
| Real Estate Investment Trusts (REITs) — 2.4% | ||||
| Host Hotels & Resorts, Inc. | 928,756 | 15,055,135 | ||
| Lamar Advertising Co., Class A | 476,101 | 31,565,496 | ||
| Liberty Property Trust | 121,077 | 4,809,178 | ||
| Ryman Hospitality Properties, Inc. | 266,287 | 13,487,437 | ||
| Sunstone Hotel Investors, Inc. | 535,976 | 6,469,230 | ||
| WP Carey, Inc. | 73,850 | 5,126,667 | ||
| 76,513,143 | ||||
| Real Estate Management and Development — 0.4% | ||||
Realogy Holdings Corp.(1) | 413,143 | 11,989,410 | ||
| Semiconductors and Semiconductor Equipment — 4.1% | ||||
| Applied Materials, Inc. | 1,158,437 | 27,767,735 | ||
| Intel Corp. | 1,631,060 | 53,498,768 | ||
| NVIDIA Corp. | 68,302 | 3,210,877 | ||
| QUALCOMM, Inc. | 722,321 | 38,694,736 | ||
| Teradyne, Inc. | 189,264 | 3,726,608 | ||
| 126,898,724 | ||||
| Software — 6.6% | ||||
Adobe Systems, Inc.(1) | 373,776 | 35,804,003 | ||
Electronic Arts, Inc.(1) | 167,048 | 12,655,557 | ||
| Intuit, Inc. | 65,384 | 7,297,508 | ||
| Microsoft Corp. | 1,834,531 | 93,872,951 | ||
| Oracle Corp. | 709,973 | 29,059,195 | ||
Synopsys, Inc.(1) | 126,544 | 6,843,500 | ||
VMware, Inc., Class A(1) | 376,333 | 21,533,774 | ||
| 207,066,488 | ||||
13
| Shares | Value | |||
| Specialty Retail — 0.3% | ||||
| Best Buy Co., Inc. | 212,414 | $ | 6,499,868 | |
| Foot Locker, Inc. | 83,501 | 4,580,865 | ||
| 11,080,733 | ||||
| Technology Hardware, Storage and Peripherals — 3.3% | ||||
| Apple, Inc. | 694,237 | 66,369,057 | ||
| EMC Corp. | 362,788 | 9,856,950 | ||
| HP, Inc. | 1,657,223 | 20,798,149 | ||
| NetApp, Inc. | 265,258 | 6,522,694 | ||
| 103,546,850 | ||||
| Thrifts and Mortgage Finance — 0.6% | ||||
Essent Group Ltd.(1) | 912,968 | 19,911,832 | ||
| Tobacco — 1.5% | ||||
| Altria Group, Inc. | 275,807 | 19,019,651 | ||
| Philip Morris International, Inc. | 264,463 | 26,901,176 | ||
| 45,920,827 | ||||
| Trading Companies and Distributors — 0.3% | ||||
HD Supply Holdings, Inc.(1) | 296,827 | 10,335,516 | ||
TOTAL COMMON STOCKS (Cost $2,711,657,399) | 3,100,752,686 | |||
| TEMPORARY CASH INVESTMENTS — 0.9% | ||||
| Repurchase Agreement, Fixed Income Clearing Corp., (collateralized by various U.S. Treasury obligations, 3.625%, 8/15/43, valued at $26,838,500), at 0.20%, dated 6/30/16, due 7/1/16 (Delivery value $26,309,146) | 26,309,000 | |||
| State Street Institutional Liquid Reserves Fund, Premier Class | 17,476 | 17,476 | ||
TOTAL TEMPORARY CASH INVESTMENTS (Cost $26,326,476) | 26,326,476 | |||
TOTAL INVESTMENT SECURITIES — 100.0% (Cost $2,737,983,875) | 3,127,079,162 | |||
OTHER ASSETS AND LIABILITIES† | 1,170,556 | |||
| TOTAL NET ASSETS — 100.0% | $ | 3,128,249,718 | ||
| NOTES TO SCHEDULE OF INVESTMENTS | ||
| † | Category is less than 0.05% of total net assets. |
| (1) | Non-income producing. |
See Notes to Financial Statements.
14
| Statement of Assets and Liabilities |
| JUNE 30, 2016 | |||
| Assets | |||
| Investment securities, at value (cost of $2,737,983,875) | $ | 3,127,079,162 | |
| Receivable for capital shares sold | 1,113,005 | ||
| Dividends and interest receivable | 3,533,214 | ||
| 3,131,725,381 | |||
| Liabilities | |||
| Payable for capital shares redeemed | 1,707,765 | ||
| Accrued management fees | 1,631,326 | ||
| Distribution and service fees payable | 52,242 | ||
| Accrued other expenses | 84,330 | ||
| 3,475,663 | |||
| Net Assets | $ | 3,128,249,718 | |
| Net Assets Consist of: | |||
| Capital (par value and paid-in surplus) | $ | 2,769,492,539 | |
| Undistributed net investment income | 917,942 | ||
| Accumulated net realized loss | (31,256,050 | ) | |
| Net unrealized appreciation | 389,095,287 | ||
| $ | 3,128,249,718 | ||
| Net Assets | Shares Outstanding | Net Asset Value Per Share | ||||
| Investor Class, $0.01 Par Value | $2,488,950,672 | 90,702,275 | $27.44 | |||
| Institutional Class, $0.01 Par Value | $453,857,944 | 16,527,769 | $27.46 | |||
| A Class, $0.01 Par Value | $144,364,735 | 5,266,523 | $27.41* | |||
| C Class, $0.01 Par Value | $12,541,574 | 461,324 | $27.19 | |||
| R Class, $0.01 Par Value | $28,534,793 | 1,040,352 | $27.43 | |||
*Maximum offering price $29.08 (net asset value divided by 0.9425).
See Notes to Financial Statements.
15
| Statement of Operations |
| YEAR ENDED JUNE 30, 2016 | |||
| Investment Income (Loss) | |||
| Income: | |||
| Dividends (net of foreign taxes withheld of $864) | $ | 70,234,108 | |
| Interest | 19,816 | ||
| 70,253,924 | |||
| Expenses: | |||
| Management fees | 21,092,385 | ||
| Distribution and service fees: | |||
| A Class | 424,530 | ||
| C Class | 147,523 | ||
| R Class | 145,308 | ||
| Directors' fees and expenses | 195,235 | ||
| Other expenses | 90,384 | ||
| 22,095,365 | |||
| Net investment income (loss) | 48,158,559 | ||
| Realized and Unrealized Gain (Loss) | |||
| Net realized gain (loss) on: | |||
| Investment transactions | (28,024,071 | ) | |
| Futures contract transactions | (723,568 | ) | |
| (28,747,639 | ) | ||
| Change in net unrealized appreciation (depreciation) on investments | (129,839,493 | ) | |
| Net realized and unrealized gain (loss) | (158,587,132 | ) | |
| Net Increase (Decrease) in Net Assets Resulting from Operations | $ | (110,428,573 | ) |
See Notes to Financial Statements.
16
| Statement of Changes in Net Assets |
| YEARS ENDED JUNE 30, 2016 AND JUNE 30, 2015 | ||||||
| Increase (Decrease) in Net Assets | June 30, 2016 | June 30, 2015 | ||||
| Operations | ||||||
| Net investment income (loss) | $ | 48,158,559 | $ | 50,980,964 | ||
| Net realized gain (loss) | (28,747,639 | ) | 363,455,274 | |||
| Change in net unrealized appreciation (depreciation) | (129,839,493 | ) | (217,200,573 | ) | ||
| Net increase (decrease) in net assets resulting from operations | (110,428,573 | ) | 197,235,665 | |||
| Distributions to Shareholders | ||||||
| From net investment income: | ||||||
| Investor Class | (37,271,245 | ) | (37,349,584 | ) | ||
| Institutional Class | (7,553,157 | ) | (7,409,434 | ) | ||
| A Class | (1,927,047 | ) | (3,702,487 | ) | ||
| C Class | (58,274 | ) | (59,419 | ) | ||
| R Class | (264,938 | ) | (227,876 | ) | ||
| From net realized gains: | ||||||
| Investor Class | (168,968,392 | ) | (282,828,250 | ) | ||
| Institutional Class | (29,482,046 | ) | (48,133,435 | ) | ||
| A Class | (10,827,066 | ) | (33,969,356 | ) | ||
| C Class | (983,273 | ) | (1,618,433 | ) | ||
| R Class | (1,855,795 | ) | (2,983,117 | ) | ||
| Decrease in net assets from distributions | (259,191,233 | ) | (418,281,391 | ) | ||
| Capital Share Transactions | ||||||
| Net increase (decrease) in net assets from capital share transactions (Note 5) | (128,314,563 | ) | 503,434,509 | |||
| Net increase (decrease) in net assets | (497,934,369 | ) | 282,388,783 | |||
| Net Assets | ||||||
| Beginning of period | 3,626,184,087 | 3,343,795,304 | ||||
| End of period | $ | 3,128,249,718 | $ | 3,626,184,087 | ||
| Undistributed net investment income | $ | 917,942 | $ | 732,783 | ||
See Notes to Financial Statements.
17
| Notes to Financial Statements |
JUNE 30, 2016
1. Organization
American Century Quantitative Equity Funds, Inc. (the corporation) is registered under the Investment Company Act of 1940, as amended (the 1940 Act), as an open-end management investment company and is organized as a Maryland corporation. Equity Growth Fund (the fund) is one fund in a series issued by the corporation. The fund’s investment objective is to seek long-term capital growth by investing in common stocks.
The fund offers the Investor Class, the Institutional Class, the A Class, the C Class and the R Class. The A Class may incur an initial sales charge. The A Class and C Class may be subject to a contingent deferred sales charge. The share classes differ principally in their respective sales charges and distribution and shareholder servicing expenses and arrangements. The Institutional Class is made available to institutional shareholders or through financial intermediaries whose clients do not require the same level of shareholder and administrative services as shareholders of other classes. As a result, the Institutional Class is charged a lower unified management fee.
2. Significant Accounting Policies
The following is a summary of significant accounting policies consistently followed by the fund in preparation of its financial statements. The fund is an investment company and follows accounting and reporting guidance in accordance with accounting principles generally accepted in the United States of America. This may require management to make certain estimates and assumptions at the date of the financial statements. Actual results could differ from these estimates. Management evaluated the impact of events or transactions occurring through the date the financial statements were issued that would merit recognition or disclosure.
Investment Valuations — The fund determines the fair value of its investments and computes its net asset value per share at the close of regular trading (usually 4 p.m. Eastern time) on the New York Stock Exchange (NYSE) on each day the NYSE is open. The Board of Directors has adopted valuation policies and procedures to guide the investment advisor in the fund’s investment valuation process and to provide methodologies for the oversight of the fund’s pricing function.
Equity securities that are listed or traded on a domestic securities exchange are valued at the last reported sales price or at the official closing price as provided by the exchange. Equity securities traded on foreign securities exchanges are generally valued at the closing price of such securities on the exchange where primarily traded or at the close of the NYSE, if that is earlier. If no last sales price is reported, or if local convention or regulation so provides, the mean of the latest bid and asked prices may be used. Securities traded over-the-counter are valued at the mean of the latest bid and asked prices, the last sales price, or the official closing price.
Open-end management investment companies are valued at the reported net asset value per share. Repurchase agreements are valued at cost, which approximates fair value. Exchange-traded futures contracts are valued at the settlement price as provided by the appropriate clearing corporation.
If the fund determines that the market price for an investment is not readily available or the valuation methods mentioned above do not reflect an investment’s fair value, such investment is valued as determined in good faith by the Board of Directors or its delegate, in accordance with policies and procedures adopted by the Board of Directors. In its determination of fair value, the fund may review several factors including, but not limited to, market information regarding the specific investment or comparable investments and correlation with other investment types, futures indices or general market indicators. Circumstances that may cause the fund to use these procedures to value an investment include, but are not limited to: an investment has been declared in default or is distressed; trading in a security has been suspended during the trading day or a security is not actively trading on its principal exchange; prices received from a regular pricing source are deemed unreliable; or there is a foreign market holiday and no trading occurred.
The fund monitors for significant events occurring after the close of an investment’s primary exchange but before the fund’s net asset value per share is determined. Significant events may include, but are not limited to: corporate announcements and transactions; governmental action and political unrest that could impact a specific investment or an investment sector; or armed conflicts, natural disasters and similar events that could
18
affect investments in a specific country or region. The fund also monitors for significant fluctuations between domestic and foreign markets, as evidenced by the U.S. market or such other indicators that the Board of Directors, or its delegate, deems appropriate. If significant fluctuations in foreign markets are identified, the fund may apply a model-derived factor to the closing price of equity securities traded on foreign securities exchanges. The factor is based on observable market data as provided by an independent pricing service.
Security Transactions — Security transactions are accounted for as of the trade date. Net realized gains and losses are determined on the identified cost basis, which is also used for federal income tax purposes.
Investment Income — Dividend income less foreign taxes withheld, if any, is recorded as of the ex-dividend date. Distributions received on securities that represent a return of capital or long-term capital gain are recorded as a reduction of cost of investments and/or as a realized gain. The fund may estimate the components of distributions received that may be considered nontaxable distributions or long-term capital gain distributions for income tax purposes. Interest income is recorded on the accrual basis and includes accretion of discounts and amortization of premiums.
Repurchase Agreements — The fund may enter into repurchase agreements with institutions that American Century Investment Management, Inc. (ACIM) (the investment advisor) has determined are creditworthy pursuant to criteria adopted by the Board of Directors. The fund requires that the collateral, represented by securities, received in a repurchase transaction be transferred to the custodian in a manner sufficient to enable the fund to obtain those securities in the event of a default under the repurchase agreement. ACIM monitors, on a daily basis, the securities transferred to ensure the value, including accrued interest, of the securities under each repurchase agreement is equal to or greater than amounts owed to the fund under each repurchase agreement.
Joint Trading Account — Pursuant to an Exemptive Order issued by the Securities and Exchange Commission, the fund, along with certain other funds in the American Century Investments family of funds, may transfer uninvested cash balances into a joint trading account. These balances are invested in one or more repurchase agreements that are collateralized by U.S. Treasury or Agency obligations.
Segregated Assets — In accordance with the 1940 Act, the fund segregates assets on its books and records to cover futures contracts. ACIM monitors, on a daily basis, the securities segregated to ensure the fund designates a sufficient amount of liquid assets, marked-to-market daily. The fund may also receive assets or be required to pledge assets at the custodian bank or with a broker for margin requirements on futures contracts.
Income Tax Status — It is the fund’s policy to distribute substantially all net investment income and net realized gains to shareholders and to otherwise qualify as a regulated investment company under provisions of the Internal Revenue Code. Accordingly, no provision has been made for income taxes. The fund files U.S. federal, state, local and non-U.S. tax returns as applicable. The fund's tax returns are subject to examination by the relevant taxing authority until expiration of the applicable statute of limitations, which is generally three years from the date of filing but can be longer in certain jurisdictions. At this time, management believes there are no uncertain tax positions which, based on their technical merit, would not be sustained upon examination and for which it is reasonably possible that the total amounts of unrecognized tax benefits will significantly change in the next twelve months.
Multiple Class — All shares of the fund represent an equal pro rata interest in the net assets of the class to which such shares belong, and have identical voting, dividend, liquidation and other rights and the same terms and conditions, except for class specific expenses and exclusive rights to vote on matters affecting only individual classes. Income, non-class specific expenses, and realized and unrealized capital gains and losses of the fund are allocated to each class of shares based on their relative net assets.
Distributions to Shareholders — Distributions from net investment income, if any, are generally declared and paid quarterly. Distributions from net realized gains, if any, are generally declared and paid annually.
Indemnifications — Under the corporation’s organizational documents, its officers and directors are indemnified against certain liabilities arising out of the performance of their duties to the fund. In addition, in the normal course of business, the fund enters into contracts that provide general indemnifications. The maximum exposure under these arrangements is unknown as this would involve future claims that may be made against a fund. The risk of material loss from such claims is considered by management to be remote.
19
3. Fees and Transactions with Related Parties
Certain officers and directors of the corporation are also officers and/or directors of American Century Companies, Inc. (ACC). The corporation’s investment advisor, ACIM, the corporation's distributor, American Century Investment Services, Inc. (ACIS), and the corporation’s transfer agent, American Century Services, LLC, are wholly owned, directly or indirectly, by ACC. Various funds issued by American Century Asset Allocation Portfolios, Inc. own, in aggregate, 13% of the shares of the fund.
Management Fees — The corporation has entered into a management agreement with ACIM, under which ACIM provides the fund with investment advisory and management services in exchange for a single, unified management fee (the fee) per class. The agreement provides that all expenses of managing and operating the fund, except distribution and service fees, brokerage expenses, taxes, interest, fees and expenses of the independent directors (including legal counsel fees), and extraordinary expenses, will be paid by ACIM. The fee is computed and accrued daily based on each class’s daily net assets and paid monthly in arrears. The fee consists of (1) an Investment Category Fee based on the daily net assets of the fund and certain other accounts managed by the investment advisor that are in the same broad investment category as the fund and (2) a Complex Fee based on the assets of all the funds in the American Century Investments family of funds. The rates for the Investment Category Fee range from 0.3380% to 0.5200%. The rates for the Complex Fee range from 0.2500% to 0.3100% for the Investor Class, A Class, C Class and R Class. The rates for the Complex Fee range from 0.0500% to 0.1100% for the Institutional Class. The effective annual management fee for each class for the year ended June 30, 2016 was 0.66% for the Investor Class, A Class, C Class and R Class and 0.46% for the Institutional Class.
Distribution and Service Fees — The Board of Directors has adopted a separate Master Distribution and Individual Shareholder Services Plan for each of the A Class, C Class and R Class (collectively the plans), pursuant to Rule 12b-1 of the 1940 Act. The plans provide that the A Class will pay ACIS an annual distribution and service fee of 0.25%. The plans provide that the C Class will pay ACIS an annual distribution and service fee of 1.00%, of which 0.25% is paid for individual shareholder services and 0.75% is paid for distribution services. The plans provide that the R Class will pay ACIS an annual distribution and service fee of 0.50%. The fees are computed and accrued daily based on each class’s daily net assets and paid monthly in arrears. The fees are used to pay financial intermediaries for distribution and individual shareholder services. Fees incurred under the plans during the year ended June 30, 2016 are detailed in the Statement of Operations.
Directors' Fees and Expenses — The Board of Directors is responsible for overseeing the investment advisor’s management and operations of the fund. The directors receive detailed information about the fund and its investment advisor regularly throughout the year, and meet at least quarterly with management of the investment advisor to review reports about fund operations. The fund’s officers do not receive compensation from the fund.
Interfund Transactions — The fund may enter into security transactions with other American Century Investments funds and other client accounts of the investment advisor, in accordance with the 1940 Act rules and procedures adopted by the Board of Directors. The rules and procedures require, among other things, that these transactions be effected at the independent current market price of the security. During the period, the interfund purchases and sales were $15,467,854 and $15,468,977, respectively.
4. Investment Transactions
Purchases and sales of investment securities, excluding short-term investments, for the year ended June 30, 2016 were $2,979,377,537 and $3,309,563,936, respectively.
20
5. Capital Share Transactions
Transactions in shares of the fund were as follows:
| Year ended June 30, 2016 | Year ended June 30, 2015 | |||||||||
| Shares | Amount | Shares | Amount | |||||||
| Investor Class/Shares Authorized | 500,000,000 | 540,000,000 | ||||||||
| Sold | 8,773,841 | $ | 245,418,381 | 20,258,376 | $ | 639,302,774 | ||||
| Issued in reinvestment of distributions | 7,451,534 | 203,615,468 | 10,481,982 | 316,028,595 | ||||||
| Redeemed | (19,995,458 | ) | (552,526,785 | ) | (14,708,804 | ) | (464,454,934 | ) | ||
| (3,770,083 | ) | (103,492,936 | ) | 16,031,554 | 490,876,435 | |||||
| Institutional Class/Shares Authorized | 100,000,000 | 100,000,000 | ||||||||
| Sold | 1,742,174 | 48,715,996 | 3,926,959 | 123,462,438 | ||||||
| Issued in reinvestment of distributions | 1,324,158 | 36,226,019 | 1,829,155 | 55,233,638 | ||||||
| Redeemed | (2,801,956 | ) | (77,828,677 | ) | (3,231,529 | ) | (102,105,104 | ) | ||
| 264,376 | 7,113,338 | 2,524,585 | 76,590,972 | |||||||
| A Class/Shares Authorized | 70,000,000 | 70,000,000 | ||||||||
| Sold | 1,075,248 | 30,338,952 | 2,679,859 | 85,038,764 | ||||||
| Issued in reinvestment of distributions | 441,683 | 12,047,893 | 1,225,614 | 36,863,988 | ||||||
| Redeemed | (2,646,486 | ) | (73,610,845 | ) | (6,638,188 | ) | (208,956,030 | ) | ||
| (1,129,555 | ) | (31,224,000 | ) | (2,732,715 | ) | (87,053,278 | ) | |||
| C Class/Shares Authorized | 20,000,000 | 20,000,000 | ||||||||
| Sold | 70,349 | 1,995,450 | 147,521 | 4,689,887 | ||||||
| Issued in reinvestment of distributions | 36,184 | 976,297 | 52,859 | 1,570,942 | ||||||
| Redeemed | (184,738 | ) | (5,069,110 | ) | (74,620 | ) | (2,374,222 | ) | ||
| (78,205 | ) | (2,097,363 | ) | 125,760 | 3,886,607 | |||||
| R Class/Shares Authorized | 20,000,000 | 20,000,000 | ||||||||
| Sold | 357,922 | 9,969,090 | 820,406 | 26,240,916 | ||||||
| Issued in reinvestment of distributions | 77,763 | 2,120,331 | 106,935 | 3,210,993 | ||||||
| Redeemed | (386,389 | ) | (10,703,023 | ) | (327,138 | ) | (10,318,136 | ) | ||
| 49,296 | 1,386,398 | 600,203 | 19,133,773 | |||||||
| Net increase (decrease) | (4,664,171 | ) | $ | (128,314,563 | ) | 16,549,387 | $ | 503,434,509 | ||
6. Fair Value Measurements
The fund’s investments valuation process is based on several considerations and may use multiple inputs to determine the fair value of the investments held by the fund. In conformity with accounting principles generally accepted in the United States of America, the inputs used to determine a valuation are classified into three broad levels.
| • | Level 1 valuation inputs consist of unadjusted quoted prices in an active market for identical investments. |
| • | Level 2 valuation inputs consist of direct or indirect observable market data (including quoted prices for comparable investments, evaluations of subsequent market events, interest rates, prepayment speeds, credit risk, etc.). These inputs also consist of quoted prices for identical investments initially expressed in local currencies that are adjusted through translation into U.S. dollars. |
| • | Level 3 valuation inputs consist of unobservable data (including a fund’s own assumptions). |
The level classification is based on the lowest level input that is significant to the fair valuation measurement. The valuation inputs are not necessarily an indication of the risks associated with investing in these securities or other financial instruments. There were no significant transfers between levels during the period.
21
The following is a summary of the level classifications as of period end. The Schedule of Investments provides additional information on the fund’s portfolio holdings.
| Level 1 | Level 2 | Level 3 | ||||||
| Assets | ||||||||
| Investment Securities | ||||||||
| Common Stocks | $ | 3,100,752,686 | — | — | ||||
| Temporary Cash Investments | 17,476 | $ | 26,309,000 | — | ||||
| $ | 3,100,770,162 | $ | 26,309,000 | — | ||||
7. Derivative Instruments
Equity Price Risk — The fund is subject to equity price risk in the normal course of pursuing its investment objectives. A fund may enter into futures contracts based on an equity index in order to manage its exposure to changes in market conditions. A fund may purchase futures contracts to gain exposure to increases in market value or sell futures contracts to protect against a decline in market value. Upon entering into a futures contract, a fund is required to deposit either cash or securities in an amount equal to a certain percentage of the contract value (initial margin). Subsequent payments (variation margin) are made or received daily, in cash, by a fund. The variation margin is equal to the daily change in the contract value and is recorded as unrealized gains and losses. A fund recognizes a realized gain or loss when the contract is closed or expires. Net realized and unrealized gains or losses occurring during the holding period of futures contracts are a component of net realized gain (loss) on futures contract transactions and change in net unrealized appreciation (depreciation) on futures contracts, respectively. One of the risks of entering into futures contracts is the possibility that the change in value of the contract may not correlate with the changes in value of the underlying securities. During the period, the fund participated in equity price risk derivative instruments for temporary investment purposes.
At period end, the fund did not have any derivative instruments disclosed on the Statement of Assets and Liabilities. For the year ended June 30, 2016, the effect of equity price risk derivative instruments on the Statement of Operations was $(723,568) in net realized gain (loss) on futures contract transactions.
8. Federal Tax Information
The tax character of distributions paid during the years ended June 30, 2016 and June 30, 2015 were as follows:
| 2016 | 2015 | |||||
| Distributions Paid From | ||||||
| Ordinary income | $ | 84,048,681 | $ | 151,497,997 | ||
| Long-term capital gains | $ | 175,142,552 | $ | 266,783,394 | ||
The book-basis character of distributions made during the year from net investment income or net realized gains may differ from their ultimate characterization for federal income tax purposes. These differences reflect the differing character of certain income items and net realized gains and losses for financial statement and tax purposes, and may result in reclassification among certain capital accounts on the financial statements.
As of June 30, 2016, the federal tax cost of investments and the components of distributable earnings on a tax-basis were as follows:
| Federal tax cost of investments | $ | 2,741,481,966 | |
| Gross tax appreciation of investments | $ | 501,133,009 | |
| Gross tax depreciation of investments | (115,535,813 | ) | |
| Net tax appreciation (depreciation) of investments | $ | 385,597,196 | |
| Undistributed ordinary income | $ | 917,942 | |
| Accumulated short-term capital losses | $ | (27,757,959 | ) |
22
The difference between book-basis and tax-basis unrealized appreciation (depreciation) is attributable primarily to the tax deferral of losses on wash sales.
Accumulated capital losses represent net capital loss carryovers that may be used to offset future realized capital gains for federal income tax purposes. The capital loss carryovers may be carried forward for an unlimited period. Future capital loss carryover utilization in any given year may be subject to Internal Revenue Code limitations.
23
| Financial Highlights |
| For a Share Outstanding Throughout the Years Ended June 30 (except as noted) | |||||||||||||||
| Per-Share Data | Ratios and Supplemental Data | ||||||||||||||
| Income From Investment Operations: | Distributions From: | Ratio to Average Net Assets of: | |||||||||||||
| Net Asset Value, Beginning of Period | Net Investment Income (Loss)(1) | Net Realized and Unrealized Gain (Loss) | Total From Investment Operations | Net Investment Income | Net Realized Gains | Total Distributions | Net Asset Value, End of Period | Total Return(2) | Operating Expenses | Net Investment Income (Loss) | Portfolio Turnover Rate | Net Assets, End of Period (in thousands) | |||
| Investor Class | |||||||||||||||
| 2016 | $30.56 | 0.41 | (1.29) | (0.88) | (0.40) | (1.84) | (2.24) | $27.44 | (2.78)% | 0.67% | 1.45% | 91% | $2,488,951 | ||
| 2015 | $32.75 | 0.46 | 1.37 | 1.83 | (0.43) | (3.59) | (4.02) | $30.56 | 5.93% | 0.67% | 1.45% | 86% | $2,886,976 | ||
| 2014 | $27.74 | 0.44 | 6.31 | 6.75 | (0.43) | (1.31) | (1.74) | $32.75 | 24.92% | 0.67% | 1.45% | 80% | $2,568,711 | ||
| 2013 | $23.30 | 0.47 | 4.43 | 4.90 | (0.46) | — | (0.46) | $27.74 | 21.19% | 0.68% | 1.82% | 94% | $2,080,375 | ||
| 2012 | $22.37 | 0.34 | 0.93 | 1.27 | (0.34) | — | (0.34) | $23.30 | 5.76% | 0.68% | 1.55% | 86% | $1,654,130 | ||
| Institutional Class | |||||||||||||||
| 2016 | $30.58 | 0.46 | (1.29) | (0.83) | (0.45) | (1.84) | (2.29) | $27.46 | (2.58)% | 0.47% | 1.65% | 91% | $453,858 | ||
| 2015 | $32.77 | 0.53 | 1.37 | 1.90 | (0.50) | (3.59) | (4.09) | $30.58 | 6.13% | 0.47% | 1.65% | 86% | $497,333 | ||
| 2014 | $27.75 | 0.50 | 6.32 | 6.82 | (0.49) | (1.31) | (1.80) | $32.77 | 25.19% | 0.47% | 1.65% | 80% | $450,166 | ||
| 2013 | $23.31 | 0.52 | 4.43 | 4.95 | (0.51) | — | (0.51) | $27.75 | 21.42% | 0.48% | 2.02% | 94% | $303,312 | ||
| 2012 | $22.38 | 0.38 | 0.93 | 1.31 | (0.38) | — | (0.38) | $23.31 | 5.97% | 0.48% | 1.75% | 86% | $216,802 | ||
| A Class | |||||||||||||||
| 2016 | $30.53 | 0.33 | (1.29) | (0.96) | (0.32) | (1.84) | (2.16) | $27.41 | (3.03)% | 0.92% | 1.20% | 91% | $144,365 | ||
| 2015 | $32.72 | 0.38 | 1.37 | 1.75 | (0.35) | (3.59) | (3.94) | $30.53 | 5.67% | 0.92% | 1.20% | 86% | $195,262 | ||
| 2014 | $27.72 | 0.37 | 6.29 | 6.66 | (0.35) | (1.31) | (1.66) | $32.72 | 24.59% | 0.92% | 1.20% | 80% | $298,677 | ||
| 2013 | $23.28 | 0.40 | 4.43 | 4.83 | (0.39) | — | (0.39) | $27.72 | 20.91% | 0.93% | 1.57% | 94% | $240,027 | ||
| 2012 | $22.35 | 0.28 | 0.93 | 1.21 | (0.28) | — | (0.28) | $23.28 | 5.51% | 0.93% | 1.30% | 86% | $183,498 | ||
| For a Share Outstanding Throughout the Years Ended June 30 (except as noted) | |||||||||||||||
| Per-Share Data | Ratios and Supplemental Data | ||||||||||||||
| Income From Investment Operations: | Distributions From: | Ratio to Average Net Assets of: | |||||||||||||
| Net Asset Value, Beginning of Period | Net Investment Income (Loss)(1) | Net Realized and Unrealized Gain (Loss) | Total From Investment Operations | Net Investment Income | Net Realized Gains | Total Distributions | Net Asset Value, End of Period | Total Return(2) | Operating Expenses | Net Investment Income (Loss) | Portfolio Turnover Rate | Net Assets, End of Period (in thousands) | |||
| C Class | |||||||||||||||
| 2016 | $30.29 | 0.12 | (1.27) | (1.15) | (0.11) | (1.84) | (1.95) | $27.19 | (3.73)% | 1.67% | 0.45% | 91% | $12,542 | ||
| 2015 | $32.50 | 0.15 | 1.35 | 1.50 | (0.12) | (3.59) | (3.71) | $30.29 | 4.87% | 1.67% | 0.45% | 86% | $16,342 | ||
| 2014 | $27.54 | 0.14 | 6.25 | 6.39 | (0.12) | (1.31) | (1.43) | $32.50 | 23.68% | 1.67% | 0.45% | 80% | $13,447 | ||
| 2013 | $23.13 | 0.21 | 4.40 | 4.61 | (0.20) | — | (0.20) | $27.54 | 20.02% | 1.68% | 0.82% | 94% | $9,039 | ||
| 2012 | $22.21 | 0.12 | 0.92 | 1.04 | (0.12) | — | (0.12) | $23.13 | 4.71% | 1.68% | 0.55% | 86% | $7,013 | ||
| R Class | |||||||||||||||
| 2016 | $30.54 | 0.27 | (1.29) | (1.02) | (0.25) | (1.84) | (2.09) | $27.43 | (3.24)% | 1.17% | 0.95% | 91% | $28,535 | ||
| 2015 | $32.74 | 0.32 | 1.35 | 1.67 | (0.28) | (3.59) | (3.87) | $30.54 | 5.38% | 1.17% | 0.95% | 86% | $30,271 | ||
| 2014 | $27.73 | 0.29 | 6.30 | 6.59 | (0.27) | (1.31) | (1.58) | $32.74 | 24.31% | 1.17% | 0.95% | 80% | $12,795 | ||
| 2013 | $23.29 | 0.34 | 4.43 | 4.77 | (0.33) | — | (0.33) | $27.73 | 20.60% | 1.18% | 1.32% | 94% | $9,600 | ||
| 2012 | $22.36 | 0.23 | 0.93 | 1.16 | (0.23) | — | (0.23) | $23.29 | 5.24% | 1.18% | 1.05% | 86% | $6,848 | ||
| Notes to Financial Highlights |
| (1) | Computed using average shares outstanding throughout the period. |
| (2) | Total returns are calculated based on the net asset value of the last business day and do not reflect applicable sales charges, if any. Total returns for periods less than one year are not annualized. |
See Notes to Financial Statements.
| Report of Independent Registered Public Accounting Firm |
To the Directors of the American Century Quantitative Equity Funds, Inc. and Shareholders of the Equity Growth Fund:
In our opinion, the accompanying statement of assets and liabilities, including the schedule of investments, and the related statements of operations and of changes in net assets and the financial highlights present fairly, in all material respects, the financial position of the Equity Growth Fund (one of the sixteen funds comprising the American Century Quantitative Equity Funds, Inc., hereafter referred to as the “Fund”) at June 30, 2016, the results of its operations for the year then ended, the changes in its net assets for each of the two years in the period then ended and the financial highlights for each of the five years in the period then ended, in conformity with accounting principles generally accepted in the United States of America. These financial statements and financial highlights (hereafter referred to as "financial statements") are the responsibility of the Fund's management. Our responsibility is to express an opinion on these financial statements based on our audits. We conducted our audits of these financial statements in accordance with the standards of the Public Company Accounting Oversight Board (United States). Those standards require that we plan and perform the audit to obtain reasonable assurance about whether the financial statements are free of material misstatement. An audit includes examining, on a test basis, evidence supporting the amounts and disclosures in the financial statements, assessing the accounting principles used and significant estimates made by management, and evaluating the overall financial statement presentation. We believe that our audits, which included confirmation of securities at June 30, 2016 by correspondence with the custodian and brokers, provide a reasonable basis for our opinion.
PricewaterhouseCoopers LLP
Kansas City, Missouri
August 17, 2016
26
| Management |
Board of Directors
The individuals listed below serve as directors of the funds. Each director will continue to serve in this capacity until death, retirement, resignation or removal from office. The board has adopted a mandatory retirement age for directors who are not “interested persons,” as that term is defined in the Investment Company Act (independent directors). Independent directors shall retire on December 31 of the year in which they reach their 75th birthday; provided, however, that on or after January 1, 2022, independent directors shall retire on December 31 of the year in which they reach their 76th birthday.
Mr. Thomas is an “interested person” because he currently serves as President and Chief Executive Officer of American Century Companies, Inc. (ACC), the parent company of American Century Investment Management, Inc. (ACIM or the advisor). The other directors (more than three-fourths of the total number) are independent. They are not employees, directors or officers of, and have no financial interest in, ACC or any of its wholly owned, direct or indirect, subsidiaries, including ACIM, American Century Investment Services, Inc. (ACIS) and American Century Services, LLC (ACS), and they do not have any other affiliations, positions or relationships that would cause them to be considered “interested persons” under the Investment Company Act. The directors serve in this capacity for eight (in the case of Mr. Thomas, 15) registered investment companies in the American Century Investments family of funds.
The following table presents additional information about the directors. The mailing address for each director other than Mr. Thomas is 1665 Charleston Road, Mountain View, California 94043. The mailing address for Mr. Thomas is 4500 Main Street, Kansas City, Missouri 64111.
Name (Year of Birth) | Position(s) Held with Funds | Length of Time Served | Principal Occupation(s) During Past 5 Years | Number of American Century Portfolios Overseen by Director | Other Directorships Held During Past 5 Years |
| Independent Directors | |||||
| Tanya S. Beder (1955) | Director | Since 2011 | Chairman and CEO, SBCC Group Inc. (independent advisory services) (2006 to present) | 45 | CYS Investments, Inc. (NYSE mortgage arbitrage REIT) |
| Jeremy I. Bulow (1954) | Director | Since 2011 | Professor of Economics, Stanford University, Graduate School of Business (1979 to present) | 45 | None |
| Anne Casscells (1958) | Director | Since 2016 | Co-Chief Executive Officer and Chief Investment Officer, Aetos Alternatives Management (investment advisory firm) (2001 to present); Lecturer in Accounting, Stanford University, Graduate School of Business (2009 to present) | 45 | None |
27
Name (Year of Birth) | Position(s) Held with Funds | Length of Time Served | Principal Occupation(s) During Past 5 Years | Number of American Century Portfolios Overseen by Director | Other Directorships Held During Past 5 Years |
| Independent Directors | |||||
| Ronald J. Gilson (1946) | Director and Chairman of the Board | Since 1995 (Chairman since 2005) | Charles J. Meyers Professor of Law and Business, Emeritus, Stanford Law School (1979 to present); Marc and Eva Stern Professor of Law and Business, Columbia University School of Law (1992 to present) | 45 | None |
| Frederick L. A. Grauer (1946) | Director | Since 2008 | Senior Advisor, iShares by BlackRock, Inc. (investment management firm) (2010 to 2011, 2013 to present); Senior Advisor, Course Hero (an educational technology company) (2015 to present) | 45 | None |
| Jonathan D. Levin (1972) | Director | Since 2016 | Holbrook Working Professor of Price Theory, Stanford University, (2000 to present); Chair, Department of Economics, Stanford University (2011 to 2014) | 45 | None |
| Peter F. Pervere (1947) | Director | Since 2007 | Retired | 45 | None |
| John B. Shoven (1947) | Director | Since 2002 | Charles R. Schwab Professor of Economics, Stanford University (1973 to present) | 45 | Cadence Design Systems; Exponent; Financial Engines |
| Interested Director | |||||
| Jonathan S. Thomas (1963) | Director and President | Since 2007 | President and Chief Executive Officer, ACC (March 2007 to present). Also serves as Chief Executive Officer, ACS; Executive Vice President, ACIM; Director, ACC, ACIM and other ACC subsidiaries | 128 | BioMed Valley Discoveries, Inc. |
The Statement of Additional Information has additional information about the fund's directors and is available without charge, upon request, by calling 1-800-345-2021.
28
Officers
The following table presents certain information about the executive officers of the funds. Each officer serves as an officer for each of the 15 investment companies in the American Century family of funds, unless otherwise noted. No officer is compensated for his or her service as an officer of the funds. The listed officers are interested persons of the funds and are appointed or re-appointed on an annual basis. The mailing address for each of the officers listed below is 4500 Main Street, Kansas City, Missouri 64111.
Name (Year of Birth) | Offices with the Funds | Principal Occupation(s) During the Past Five Years |
| Jonathan S. Thomas (1963) | Director and President since 2007 | President and Chief Executive Officer, ACC (March 2007 to present). Also serves as Chief Executive Officer, ACS; Executive Vice President, ACIM; Director, ACC, ACIM and other ACC subsidiaries |
| Amy D. Shelton (1964) | Chief Compliance Officer and Vice President since 2014 | Chief Compliance Officer, American Century funds, (March 2014 to present); Chief Compliance Officer, ACIM (February 2014 to present); Chief Compliance Officer, ACIS (October 2009 to present); Vice President, Client Interactions and Marketing, ACIS (February 2013 to January 2014); Director, Client Interactions and Marketing, ACIS (June 2007 to January 2013). Also serves as Vice President, ACIS |
| Charles A. Etherington (1957) | General Counsel since 2007 and Senior Vice President since 2006 | Attorney, ACC (February 1994 to present); Vice President, ACC (November 2005 to present); General Counsel, ACC (March 2007 to present). Also serves as General Counsel, ACIM, ACS, ACIS and other ACC subsidiaries; and Senior Vice President, ACIM and ACS |
| C. Jean Wade (1964) | Vice President, Treasurer and Chief Financial Officer since 2012 | Vice President, ACS (February 2000 to present) |
| Robert J. Leach (1966) | Vice President since 2006 and Assistant Treasurer since 2012 | Vice President, ACS (February 2000 to present) |
| David H. Reinmiller (1963) | Vice President since 2001 | Attorney, ACC (January 1994 to present); Associate General Counsel, ACC (January 2001 to present). Also serves as Vice President, ACIM and ACS |
| Ward D. Stauffer (1960) | Secretary since 2005 | Attorney, ACC (June 2003 to present) |
29
| Approval of Management Agreement |
At a meeting held on June 14, 2016, the Fund’s Board of Directors (the "Board") unanimously approved the renewal of the management agreement pursuant to which American Century Investment Management, Inc. (the “Advisor”) acts as the investment advisor for the Fund. Under Section 15(c) of the Investment Company Act, contracts for investment advisory services are required to be reviewed, evaluated, and approved by a majority of a fund’s directors/trustees, including a majority of the independent Directors, each year. The Board regards this annual evaluation and renewal as one of its most important responsibilities.
The independent Directors have memorialized a statement regarding the relationship between their ongoing obligations to oversee and evaluate the performance of the Advisor and their annual consideration of renewal of the management agreement. In that statement, the independent Directors noted that their assessment of the Advisor’s performance is an ongoing process that takes place over the entire year and is informed by all of the extensive information that the Board and its committees receive and consider over time. This information, together with the additional materials provided specifically in connection with the review, are central to the Board’s assessment of the Advisor’s performance and its determination whether to renew the Fund’s management agreement.
Prior to its consideration of the renewal of the management agreement, the Board requested and reviewed extensive data and analysis relating to the proposed renewal. This information and analysis was compiled by the Advisor and certain independent providers of evaluation data concerning the Fund and the services provided to the Fund by the Advisor.
In connection with its consideration of the renewal of the management agreement, the Board’s review and evaluation of the services provided by the Advisor included, but was not limited to, the following:
| • | the nature, extent, and quality of investment management, shareholder services, and other services provided by the Advisor to the Fund; |
| • | the wide range of other programs and services the Advisor provides to the Fund and its shareholders on a routine and non-routine basis; |
| • | the investment performance of the Fund, including data comparing the Fund’s performance to appropriate benchmarks and/or a peer group of other mutual funds with similar investment objectives and strategies; |
| • | the cost of owning the Fund compared to the cost of owning similar funds; |
| • | the Advisor’s compliance policies, procedures, and regulatory experience; |
| • | financial data showing the cost of services provided to the Fund, the profitability of the Fund to the Advisor, and the overall profitability of the Advisor; |
| • | possible economies of scale associated with the Advisor’s management of the Fund and other accounts under its management; |
| • | data comparing services provided and charges to other investment management clients of the Advisor; |
| • | acquired fund fees and expenses; |
| • | payments by the Fund and the Advisor to financial intermediaries whose clients are investors in the Fund; and |
| • | any collateral benefits derived by the Advisor from the management of the Fund. |
In keeping with its practice, the Board held two in-person meetings to review and discuss the information provided in response to their request. The independent Directors also had the benefit of the advice of their independent counsel throughout the process.
30
Factors Considered
The Directors considered all of the information provided by the Advisor, the independent data providers, and the independent Directors’ independent counsel in connection with the approval. They determined that the information was sufficient for them to evaluate the management agreement for the Fund. In connection with their review, the Directors did not identify any single factor as being all-important or controlling and each Director may have attributed different levels of importance to different factors. In deciding to renew the management agreement, the Board based its decision on a number of factors, including the following:
Nature, Extent and Quality of Services - Generally. Under the management agreement, the Advisor is responsible for providing or arranging for all services necessary for the operation of the Fund. The Board noted that under the management agreement, the Advisor provides or arranges at its own expense a wide variety of services including:
| • | constructing and designing the Fund |
| • | portfolio research and security selection |
| • | initial capitalization/funding |
| • | securities trading |
| • | Fund administration |
| • | custody of Fund assets |
| • | daily valuation of the Fund’s portfolio |
| • | shareholder servicing and transfer agency, including shareholder confirmations, recordkeeping, and communications |
| • | legal services (except the independent Directors’ counsel) |
| • | regulatory and portfolio compliance |
| • | financial reporting |
| • | marketing and distribution (except amounts paid by the Fund under Rule 12b-1 plans) |
The Board noted that many of these services have expanded over time in terms of both quantity and complexity in response to shareholder demands, competition in the industry, changing distribution channels, and the changing regulatory environment.
Investment Management, Shareholder, and Other Services. The nature of the investment management services provided to the Fund is quite complex and allows Fund shareholders access to professional money management, instant diversification of their investments within an asset class, the opportunity to easily diversify among asset classes by investing in or exchanging among various American Century Investments funds, and liquidity. In evaluating investment performance, the Board expects the Advisor to manage the Fund in accordance with its investment objectives and approved strategies. Further, the Directors recognize that the Advisor has an obligation to seek the best execution of fund trades. In providing these services, the Advisor utilizes teams of investment professionals (portfolio managers, analysts, research assistants, and securities traders) who require extensive information technology, research, training, compliance, and other systems to conduct their business. The Board, directly and through its Portfolio Committee, regularly reviews investment performance information for the Fund, together with comparative information for appropriate benchmarks and/or peer groups of similarly-managed funds, over different time horizons. The Directors also review detailed performance information during the management agreement approval process. If performance concerns are identified, the Fund receives special reviews until performance improves, during which the Board discusses with the Advisor the reasons for such results (e.g., market conditions, security selection) and any efforts being undertaken to improve performance. The Fund’s performance was at its benchmark for the five-year period and below its benchmark for the one-, three-, and ten-year periods reviewed by the Board. The Board discussed the Fund’s performance with the Advisor and was satisfied with the efforts being undertaken by the Advisor. The Board found the investment management services provided by the Advisor to the Fund to be satisfactory and consistent with the management agreement.
31
Under the management agreement, the Advisor provides the Fund with a comprehensive package of transfer agency, shareholder, and other services. The Board, directly and through various committees of the Board, regularly reviews reports and evaluations of such services at its regular meetings. These reports include, but are not limited to, information regarding the operational efficiency and accuracy of the shareholder and transfer agency services provided, staffing levels, shareholder satisfaction (as measured by external as well as internal sources), technology support, new products and services offered to Fund shareholders, securities trading activities, portfolio valuation services, auditing services, and legal and operational compliance activities. Certain aspects of shareholder and transfer agency service level efficiency and the quality of securities trading activities are measured by independent third party providers and are presented in comparison to other fund groups not managed by the Advisor.
The Board found the services provided by the Advisor to the Fund under the management agreement to be competitive and of high quality.
Costs of Services and Profitability. The Advisor provides detailed information concerning its cost of providing various services to the Fund, its profitability in managing the Fund, its overall profitability, and its financial condition. The Directors have reviewed with the Advisor the methodology used to prepare this financial information. This information is considered in evaluating the Advisor’s financial condition, its ability to continue to provide services under the management agreement, and the reasonableness of the current management fee. The Board concluded that the Advisor’s profits were reasonable in light of the services provided to the Fund.
Economies of Scale. The Board also reviewed information provided by the Advisor regarding the possible existence of economies of scale in connection with the management of the Fund. The Board concluded that economies of scale are difficult to measure and predict with precision, especially on a fund-by-fund basis. The Board concluded that the Advisor is appropriately sharing economies of scale through its competitive fee structure, offering competitive fees from fund inception, and through reinvestment in its business to provide shareholders enhanced and expanded services.
Comparison to Other Funds’ Fees. The management agreement provides that the Fund pays the Advisor a single, all-inclusive (or unified) management fee for providing all services necessary for the management and operation of the Fund, other than brokerage expenses, expenses attributable to short sales, taxes, interest, extraordinary expenses, the fees and expenses of the Fund’s independent Directors (including their independent legal counsel), and expenses incurred in connection with the provision of shareholder services and distribution services under a plan adopted pursuant to Rule 12b-1 under the 1940 Act. Under the unified fee structure, the Advisor is responsible for providing all investment advisory, custody, audit, administrative, compliance, recordkeeping, marketing, and shareholder services, or arranging and supervising third parties to provide such services. By contrast, most other funds are charged a variety of fees, including an investment advisory fee, a transfer agency fee, an administrative fee, distribution charges, and other expenses. Other than their investment advisory fees and any applicable Rule 12b-1 fees, all other components of the total fees charged by these other funds may be increased without shareholder approval. The Board believes the unified fee structure is a benefit to Fund shareholders because it clearly discloses to shareholders the cost of owning Fund shares, and, since the unified fee cannot be increased without a vote of Fund shareholders, it shifts to the Advisor the risk of increased costs of operating the Fund and provides a direct incentive to minimize administrative inefficiencies. Part of the Board’s analysis of fee levels involves reviewing certain evaluative data compiled by an independent provider and comparing the Fund’s unified fee to the total expense ratio of peer funds. The unified fee charged to shareholders of the Fund was below the median of the total expense ratios of the Fund’s peer group. The Board concluded that the management fee paid by the Fund to the Advisor under the management agreement is reasonable in light of the services provided to the Fund.
32
Comparison to Fees and Services Provided to Other Clients of the Advisor. The Board also requested and received information from the Advisor concerning the nature of the services, fees, costs, and profitability of its advisory services to advisory clients other than the Fund. They observed that these varying types of client accounts require different services and involve different regulatory and entrepreneurial risks than the management of the Fund. The Board analyzed this information and concluded that the fees charged and services provided to the Fund were reasonable by comparison.
Payments to Intermediaries. The Directors also requested and received a description of payments made to intermediaries by the Fund and the Advisor. These payments include various payments made by the Fund or the Advisor to different types of intermediaries and recordkeepers for distribution and service activities provided for the Fund.
Collateral or “Fall-Out” Benefits Derived by the Advisor. The Board considered the existence of collateral benefits the Advisor may receive as a result of its relationship with the Fund. The Board noted that the Advisor’s primary business is managing mutual funds and it generally does not use fund or shareholder information to generate profits in other lines of business, and therefore does not derive any significant collateral benefits from them. The Board noted that the Advisor receives proprietary research from broker-dealers that execute fund portfolio transactions. The Board also determined that the Advisor is able to provide investment management services to certain clients other than the Fund, at least in part, due to its existing infrastructure built to serve the fund complex. The Board concluded, however, that the assets of those other clients are not material to the analysis and, where applicable, may be included with the assets of the Fund to determine breakpoints in the management fee schedule.
Existing Relationship. The Board also considered whether there was any reason for not continuing the existing arrangement with the Advisor. In this regard, the Board was mindful of the potential disruptions of the Fund’s operations and various risks, uncertainties, and other effects that could occur as a result of a decision not to continue such relationship. In particular, the Board recognized that most shareholders have invested in the Fund on the strength of the Advisor’s industry standing and reputation and in the expectation that the Advisor will have a continuing role in providing advisory services to the Fund.
Conclusion of the Directors. As a result of this process, the Board, including all of the independent Directors and assisted by the advice of independent legal counsel, taking into account all of the factors discussed above and the information provided by the Advisor and others in connection with its review and throughout the year, concluded that the management agreement between the Fund and the Advisor is fair and reasonable in light of the services provided and should be renewed.
33
| Proxy Voting Results |
A special meeting of shareholders was held on June 13, 2016, to vote on the following proposal. The proposal received the required number of votes and was adopted. A summary of voting results is listed below.
To elect four directors to the Board of Directors of American Century Quantitative Equity Funds, Inc.:
| Affirmative | Withhold | ||||||
| Tanya S. Beder | $ | 8,473,153,264 | $ | 121,459,590 | |||
| Jeremy I. Bulow | $ | 8,469,793,581 | $ | 124,819,273 | |||
| Anne Casscells | $ | 8,465,895,232 | $ | 128,717,622 | |||
| Jonathan D. Levin | $ | 8,468,929,867 | $ | 125,682,987 | |||
The other directors whose term of office continued after the meeting include Jonathan S. Thomas, Ronald J. Gilson, Frederick L. A. Grauer, Peter F. Pervere and John B. Shoven.
34
| Additional Information |
Retirement Account Information
As required by law, distributions you receive from certain IRAs are subject to federal income tax withholding, unless you elect not to have withholding apply. Tax will be withheld on the total amount withdrawn even though you may be receiving amounts that are not subject to withholding, such as nondeductible contributions. In such case, excess amounts of withholding could occur. You may adjust your withholding election so that a greater or lesser amount will be withheld.
If you don’t want us to withhold on this amount, you must notify us to not withhold the federal income tax. You may notify us in writing or in certain situations by telephone or through other electronic means. For systematic withdrawals, your withholding election will remain in effect until revoked or changed by filing a new election. You have the right to revoke your election at any time.
Remember, even if you elect not to have income tax withheld, you are liable for paying income tax on the taxable portion of your withdrawal. If you elect not to have income tax withheld or you don’t have enough income tax withheld, you may be responsible for payment of estimated tax. You may incur penalties under the estimated tax rules if your withholding and estimated tax payments are not sufficient. You can reduce or defer the income tax on a distribution by directly or indirectly rolling such distribution over to another IRA or eligible plan. You should consult your tax advisor for additional information.
State tax will be withheld if, at the time of your distribution, your address is within one of the mandatory withholding states and you have federal income tax withheld (or as otherwise required by state law). State taxes will be withheld from your distribution in accordance with the respective state rules.
Distributions you receive from 403(b), 457 and qualified plans are subject to special tax and withholding rules. Your plan administrator or plan sponsor is required to provide you with a special tax notice explaining those rules at the time you request a distribution. If applicable, federal and/or state taxes may be withheld from your distribution amount.
Proxy Voting Policies
Descriptions of the principles and policies that the fund's investment advisor uses in exercising the voting rights associated with the securities purchased and/or held by the fund are available without charge, upon request, by calling 1-800-345-2021 or visiting the "About Us" page of American Century Investments’ website at americancentury.com. A description of the policies is also available on the Securities and Exchange Commission’s website at sec.gov. Information regarding how the investment advisor voted proxies relating to portfolio securities during the most recent 12-month period ended June 30 is available on the "About Us" page at americancentury.com. It is also available at sec.gov.
Quarterly Portfolio Disclosure
The fund files its complete schedule of portfolio holdings with the Securities and Exchange Commission (SEC) for the first and third quarters of each fiscal year on Form N-Q. The fund’s Forms N-Q are available on the SEC’s website at sec.gov, and may be reviewed and copied at the SEC’s Public Reference Room in Washington, DC. Information on the operation of the Public Reference Room may be obtained by calling 1-800-SEC-0330. The fund also makes its complete schedule of portfolio holdings for the most recent quarter of its fiscal year available on its website at americancentury.com and, upon request, by calling 1-800-345-2021.
35
Other Tax Information
The following information is provided pursuant to provisions of the Internal Revenue Code.
The fund hereby designates up to the maximum amount allowable as qualified dividend income for the fiscal year ended June 30, 2016.
For corporate taxpayers, the fund hereby designates $46,349,642, or up to the maximum amount allowable, of ordinary income distributions paid during the fiscal year ended June 30, 2016 as qualified for the corporate dividends received deduction.
The fund hereby designates $36,966,256 as qualified short-term capital gain distributions for purposes of Internal Revenue Code Section 871 for the fiscal year ended June 30, 2016.
The fund hereby designates $175,142,552, or up to the maximum amount allowable, as long-term capital gain distributions (20% rate gain distributions) for the fiscal year ended June 30, 2016.
36
| ||
| Contact Us | americancentury.com | |
| Automated Information Line | 1-800-345-8765 | |
| Investor Services Representative | 1-800-345-2021 or 816-531-5575 | |
| Investors Using Advisors | 1-800-378-9878 | |
| Business, Not-For-Profit, Employer-Sponsored Retirement Plans | 1-800-345-3533 | |
| Banks and Trust Companies, Broker-Dealers, Financial Professionals, Insurance Companies | 1-800-345-6488 | |
| Telecommunications Relay Service for the Deaf | 711 | |
| American Century Quantitative Equity Funds, Inc. | ||
Investment Advisor: American Century Investment Management, Inc. Kansas City, Missouri | ||
| This report and the statements it contains are submitted for the general information of our shareholders. The report is not authorized for distribution to prospective investors unless preceded or accompanied by an effective prospectus. | ||
| ©2016 American Century Proprietary Holdings, Inc. All rights reserved. CL-ANN-89954 1608 | ||
| Annual Report | |
| June 30, 2016 | |
| Global Gold Fund | |
| Table of Contents |
| President's Letter | 2 | |
| Performance | 3 | |
| Portfolio Commentary | ||
| Fund Characteristics | ||
| Shareholder Fee Example | ||
| Schedule of Investments | ||
| Statement of Assets and Liabilities | ||
| Statement of Operations | ||
| Statement of Changes in Net Assets | ||
| Notes to Financial Statements | ||
| Financial Highlights | ||
| Report of Independent Registered Public Accounting Firm | ||
| Management | ||
| Approval of Management Agreement | ||
| Proxy Voting Results | ||
| Additional Information | ||
Any opinions expressed in this report reflect those of the author as of the date of the report, and do not necessarily represent the opinions of American Century Investments® or any other person in the American Century Investments organization. Any such opinions are subject to change at any time based upon market or other conditions and American Century Investments disclaims any responsibility to update such opinions. These opinions may not be relied upon as investment advice and, because investment decisions made by American Century Investments funds are based on numerous factors, may not be relied upon as an indication of trading intent on behalf of any American Century Investments fund. Security examples are used for representational purposes only and are not intended as recommendations to purchase or sell securities. Performance information for comparative indices and securities is provided to American Century Investments by third party vendors. To the best of American Century Investments’ knowledge, such information is accurate at the time of printing.
| President’s Letter |
Jonathan ThomasDear Investor:
Thank you for reviewing this annual report for the 12 months ended June 30, 2016. It provides investment performance and portfolio information for the reporting period, plus longer-term historical performance data.
Annual reports remain important vehicles for conveying information about fund returns, including market and economic factors that affected performance during the reporting period. For additional, updated investment and market insights, we encourage you to visit our website, americancentury.com.
Market Volatility Increased, But Not for the Reasons Anticipated
Going into this reporting period, investors anticipated increased market volatility and uncertainty as the Federal Reserve (the Fed) appeared poised to raise short-term interest rates toward more historically normal levels. This policy change was expected to affect investor sentiment, U.S. Treasury yield behavior, relative currency values, inflation expectations, and corporate costs and earnings.
This Fed-centric outlook didn’t fully account for global factors, which ultimately drove sentiment, volatility, and performance during the reporting period. During 2015, the primary catalyst was China, where slowing economic growth, currency devaluations, and massive monetary policy easing sent shock waves through the global markets. The Fed ended up delaying (until December 2015) its only small rate hike during the reporting period. Afterward, China-related events repeated in January and early February this year, further delaying Fed action.
Oil was another catalyst—its price collapses devalued entire market sectors and contributed to broad market volatility and negative sentiment. Later, as China and oil appeared to stabilize, Brexit occurred—the unexpected decision by United Kingdom voters to leave the European Union. This produced more shock waves, and altered central bank policies around the world. In this environment, relatively defensive assets performed best for the 12 months, including the stocks of gold-producing companies, utilities, real estate investment trusts (REITs), and long-maturity U.S. Treasury securities.
Looking ahead, we believe the markets face further uncertainty and volatility as they digest Brexit, the Italian bank crisis, China’s economic mysteries, and the U.S. presidential election. Negative interest rates in Europe and Japan represent part of the market’s response to the global macroeconomic climate. These negative rates are suppressing interest rates around the world while driving up the value of the U.S. dollar and U.S. bonds. In a broad sense, stocks also benefit from the central bank stimulus that is driving interest rates into negative territory, and from relative yield advantages as bond yields are pushed lower. It’s an unusual and challenging environment. We appreciate your continued trust in us.
Sincerely,
Jonathan Thomas
President and Chief Executive Officer
American Century Investments
2
| Performance |
| Total Returns as of June 30, 2016 | ||||||
Average Annual Returns | ||||||
| Ticker Symbol | 1 year | 5 years | 10 years | Since Inception | Inception Date | |
| Investor Class | BGEIX | 61.72% | -10.65% | -0.88% | — | 8/17/88 |
| NYSE Arca Gold Miners Index | — | 58.34% | -11.49% | -2.10% | — | — |
| MSCI World Index | — | -2.78% | 6.62% | 4.43% | — | — |
| Institutional Class | AGGNX | 62.07% | -10.46% | — | -2.57% | 9/28/07 |
| A Class | ACGGX | 5/6/98 | ||||
| No sales charge | 61.32% | -10.87% | -1.13% | — | ||
| With sales charge | 52.12% | -11.92% | -1.71% | — | ||
| C Class | AGYCX | 60.20% | -11.54% | — | -3.74% | 9/28/07 |
| R Class | AGGWX | 60.88% | -11.09% | — | -3.26% | 9/28/07 |
Average annual returns since inception are presented when ten years of performance history is not available.
Prior to September 4, 2007, the A Class was referred to as the Advisor Class and did not have a front-end sales charge. Performance prior to that date has been adjusted to reflect this charge. Extraordinary performance is attributable in part to unusually favorable market conditions and may not be repeated or consistently achieved in the future.
Sales charges include initial sales charges and contingent deferred sales charges (CDSCs), as applicable. A Class shares have a 5.75% maximum initial sales charge and may be subject to a maximum CDSC of 1.00%. C Class shares redeemed within 12 months of purchase are subject to a maximum CDSC of 1.00%. The SEC requires that mutual funds provide performance information net of maximum sales charges in all cases where charges could be applied.
Data presented reflect past performance. Past performance is no guarantee of future results. Current performance may be higher or lower than the performance shown. Total returns for periods less than one year are not annualized. Investment return and principal value will fluctuate, and redemption value may be more or less than original cost. Data assumes reinvestment of dividends and capital gains, and none of the charts reflect the deduction of taxes that a shareholder would pay on fund distributions or the redemption of fund shares. To obtain performance data current to the most recent month end, please call 1-800-345-2021 or visit americancentury.com. For additional information about the fund, please consult the prospectus.
3
| Growth of $10,000 Over 10 Years |
| $10,000 investment made June 30, 2006 |
| Performance for other share classes will vary due to differences in fee structure. |
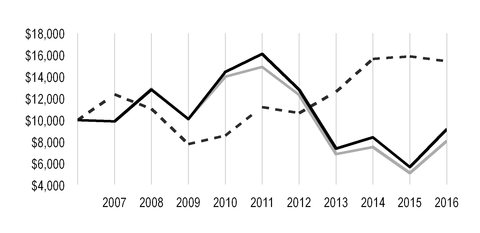
| Value on June 30, 2016 | |
| Investor Class — $9,156 | |
| NYSE Arca Gold Miners Index — $8,091 | |
| MSCI World Index — $15,429 | |
| Total Annual Fund Operating Expenses | ||||
| Investor Class | Institutional Class | A Class | C Class | R Class |
| 0.67% | 0.47% | 0.92% | 1.67% | 1.17% |
The total annual fund operating expenses shown is as stated in the fund’s prospectus current as of the date of this report. The prospectus may vary from the expense ratio shown elsewhere in this report because it is based on a different time period, includes acquired fund fees and expenses, and, if applicable, does not include fee waivers or expense reimbursements.
Data presented reflect past performance. Past performance is no guarantee of future results. Current performance may be higher or lower than the performance shown. Total returns for periods less than one year are not annualized. Investment return and principal value will fluctuate, and redemption value may be more or less than original cost. Data assumes reinvestment of dividends and capital gains, and none of the charts reflect the deduction of taxes that a shareholder would pay on fund distributions or the redemption of fund shares. To obtain performance data current to the most recent month end, please call 1-800-345-2021 or visit americancentury.com. For additional information about the fund, please consult the prospectus.
4
| Portfolio Commentary |
Portfolio Managers: Yulin Long and Elizabeth Xie
In May 2016, portfolio managers Bill Martin and Lynette Pang left the fund's management team. They were replaced by Yulin Long and Elizabeth Xie.
Performance Summary
Global Gold advanced 61.72%* for the 12 months ended June 30, 2016. The portfolio’s benchmark, the NYSE Arca Gold Miners Index, gained 58.34%. The fund’s outperformance relative to the benchmark primarily was due to stock selection.
Gold Prices Struggled Early in Period
Gold bullion prices were volatile during the 12-month period, but increased overall due to a sharp rally in the second half of the period. During the first six months, gold prices generally declined on expectations for the Federal Reserve (Fed) to begin “normalizing” short-term interest rates. The prospect of higher interest rates and resulting stronger U.S. dollar pressured gold prices. Gold, which is priced in U.S. dollars and generally moves in the opposite direction of the greenback, became more expensive for foreign buyers. On December 16, 2015, the Fed finally ended its unprecedented near-zero interest rate policy, which had been in place since 2008, and implemented its first rate hike in more than nine years. Furthermore, the Fed indicated more rate hikes were likely to come in 2016. Against this backdrop, gold prices declined 10% for the six-month period ended December 31, 2015, according to COMEX, the primary market for metals trading.
Central Bank Policies, Brexit Drove Gold Prices Higher
A significant shift in the gold market emerged early in 2016. A sharp first-quarter slowdown in the U.S. economy, along with ongoing concerns about the health of the global economy, lessened the likelihood of Fed rate normalization progressing at the originally expected pace. Accordingly, the U.S. dollar weakened versus most currencies. In addition, aggressive stimulus measures from the European Central Bank and Bank of Japan, including the introduction of negative interest rates, further supported gold.
Demand for gold soared 21% year over year through the first quarter of 2016, the fastest pace on record, according to the World Gold Council. Private investment accounted for the bulk of the demand increase. Gold prices-and demand for the precious metal-increased further in the final months of the period, largely due to the global economic uncertainty triggered by the June 23 “Brexit” vote, which revealed U.K. voters’ desire to leave the European Union. Gold benefited from its status as a perceived “safe-haven” asset in times of uncertainty and turmoil, and prices soared 25% in the six-month period ended June 30, 2016.
For the 12-month period, gold prices increased 13% from $1,171 an ounce as of June 30, 2015, to $1,321 a year later. Gold mining stocks generally outperformed the gold bullion largely due to improving profit margins.
Portfolio Positioning Favored Quality
The fund typically holds a 20% allocation to explorers and emerging producers, which are more closely tied to the performance of the metal than are the larger gold producers. We also believe
* All fund returns referenced in this commentary are for Investor Class shares. Performance for other share classes will vary due to differences in fee structures; when Investor Class performance exceeds that of the fund’s benchmark, other share classes may not. See page 3 for returns for all share classes.
5
these companies provide most of the growth opportunities in the sector. We maintained the quality of this allocation by focusing on higher-grade projects and operations in comparatively “safe” geopolitical jurisdictions, while avoiding companies requiring financing in the next two years.
Canada Led Contributors
Overall, stock selection and an overweight position relative to the benchmark in Canada, along with underweight positions in China and Hong Kong, contributed to the fund’s relative performance. Notable individual contributors included a portfolio-only position in Gold Standard Ventures and an overweight position in Guyana Goldfields. Gold Standard focuses its acquisition and exploration activities on Nevada. Investors have high expectations for the company’s large, undeveloped land on the Carlin trend in the state. This pro-mining jurisdiction is close to processing facilities and infrastructure and contains more than 20 million ounces of gold, according to company reports. In addition, the company has a strong cash position. Investors believe successful drill results could boost interest in the company’s projects and possibly lead to a takeover offer.
Guyana Goldfields, a mineral exploration company, is based in Canada but primarily engaged in the exploration and development of gold deposits in Guyana, South America. The company began commercial gold production at its flagship Aurora mine in 2015, and in May, Guyana reported strong production and financial results, including a profit margin of $418 per ounce of gold, during its first commercial quarter of production. The company also said it was on track to achieve its 2016 production targets while increasing operating efficiencies and controlling costs. By the end of the reporting period, several analysts had increased their price targets for the company’s stock.
South Africa Underweight Was a Main Detractor
An underweight position relative to the benchmark in South Africa and stock selection in the U.S. and Australia detracted from relative results. In terms of individual holdings, a portfolio-only position in GoGold Resources, a Canada-based company engaged in exploration, development, and production of gold, silver, and copper, primarily in Mexico, was a main detractor. The company’s stock declined due to production delays during the first half of the reporting period. In early 2016, the company completed a $10 million upgrade to implement a process for recovering gold and silver more quickly. At the end of the first quarter of 2016, GoGold reported an 8% increase in silver production, and management indicated production would increase for the remainder of 2016.
South Africa-based Sibanye Gold, which is the largest producer of gold in South African mines, reported robust earnings growth during the period. Furthermore, at year-end 2015, the company’s dividend beat analysts’ expectations, and management forecasted strong cash flows for 2016. Similar to other South African gold producers, Sibanye benefited from a weak local currency, as it receives revenue in dollars and its costs are in rand. Seeking to capitalize on its earnings strength and share price gains, Sibanye also announced plans to purchase gold and platinum assets in 2016. These factors supported strong stock gains, and the fund’s underweight position in Sibanye weighed on relative results.
Security Selection Remains Key
We believe longer-term support for gold prices could come in the form of strong demand from central banks in the emerging markets, rising consumer demand from emerging economies, and rising inflation stemming from the effects of unprecedented monetary and fiscal policies in the developed world.
As always, we believe security selection remains crucial. In particular, we favor what we believe to be high-quality, inexpensive stocks with positive market sentiment. We will seek to provide an investment that moves in line with gold prices and add value wherever possible.
6
| Fund Characteristics |
| JUNE 30, 2016 | |
| Top Ten Holdings | % of net assets |
| Barrick Gold Corp. | 7.1% |
Agnico-Eagle Mines Ltd.(1) | 6.7% |
| Newmont Mining Corp. | 6.3% |
| Randgold Resources Ltd. ADR | 6.2% |
| Newcrest Mining Ltd. | 4.9% |
| Franco-Nevada Corp. | 4.6% |
Goldcorp, Inc.(1) | 4.6% |
| Detour Gold Corp. | 4.5% |
AngloGold Ashanti Ltd.(1) | 4.5% |
Gold Standard Ventures Corp.(1) | 4.1% |
| (1) Includes shares traded on all exchanges. | |
| Geographic Composition | % of net assets |
| Canada | 63.0% |
| United States | 10.3% |
| South Africa | 8.5% |
| Australia | 7.3% |
| United Kingdom | 7.2% |
| Peru | 1.8% |
| China | 0.8% |
| Hong Kong | 0.1% |
Cash and Equivalents(2) | 1.0% |
| (2) Includes temporary cash investments and other assets and liabilities. | |
| Types of Investments in Portfolio | % of net assets |
| Foreign Common Stocks | 88.7% |
| Domestic Common Stocks | 10.3% |
| Warrants | —* |
| Total Equity Exposure | 99.0% |
| Temporary Cash Investments | 0.9% |
| Other Assets and Liabilities | 0.1% |
*Category is less than 0.05% of total net assets.
7
| Shareholder Fee Example |
Fund shareholders may incur two types of costs: (1) transaction costs, including sales charges (loads) on purchase payments and redemption/exchange fees; and (2) ongoing costs, including management fees; distribution and service (12b-1) fees; and other fund expenses. This example is intended to help you understand your ongoing costs (in dollars) of investing in your fund and to compare these costs with the ongoing cost of investing in other mutual funds.
The example is based on an investment of $1,000 made at the beginning of the period and held for the entire period from January 1, 2016 to June 30, 2016.
Actual Expenses
The table provides information about actual account values and actual expenses for each class. You may use the information, together with the amount you invested, to estimate the expenses that you paid over the period. First, identify the share class you own. Then simply divide your account value by $1,000 (for example, an $8,600 account value divided by $1,000 = 8.6), then multiply the result by the number under the heading “Expenses Paid During Period” to estimate the expenses you paid on your account during this period.
If you hold Investor Class shares of any American Century Investments fund, or Institutional Class shares of the American Century Diversified Bond Fund, in an American Century Investments account (i.e., not a financial intermediary or retirement plan account), American Century Investments may charge you a $12.50 semiannual account maintenance fee if the value of those shares is less than $10,000. We will redeem shares automatically in one of your accounts to pay the $12.50 fee. In determining your total eligible investment amount, we will include your investments in all personal accounts (including American Century Investments Brokerage accounts) registered under your Social Security number. Personal accounts include individual accounts, joint accounts, UGMA/UTMA accounts, personal trusts, Coverdell Education Savings Accounts and IRAs (including traditional, Roth, Rollover, SEP-, SARSEP- and SIMPLE-IRAs), and certain other retirement accounts. If you have only business, business retirement, employer-sponsored or American Century Investments Brokerage accounts, you are currently not subject to this fee. If you are subject to the Account Maintenance Fee, your account value could be reduced by the fee amount.
Hypothetical Example for Comparison Purposes
The table also provides information about hypothetical account values and hypothetical expenses based on the actual expense ratio of each class of your fund and an assumed rate of return of 5% per year before expenses, which is not the actual return of a fund’s share class. The hypothetical account values and expenses may not be used to estimate the actual ending account balance or expenses you paid for the period. You may use this information to compare the ongoing costs of investing in your fund and other funds. To do so, compare this 5% hypothetical example with the 5% hypothetical examples that appear in the shareholder reports of the other funds.
Please note that the expenses shown in the table are meant to highlight your ongoing costs only and do not reflect any transactional costs, such as sales charges (loads) or redemption/exchange fees. Therefore, the table is useful in comparing ongoing costs only, and will not help you determine the relative total costs of owning different funds. In addition, if these transactional costs were included, your costs would have been higher.
8
| Beginning Account Value 1/1/16 | Ending Account Value 6/30/16 | Expenses Paid During Period(1) 1/1/16 - 6/30/16 | Annualized Expense Ratio(1) | |
| Actual | ||||
| Investor Class | $1,000 | $2,027.80 | $5.12 | 0.68% |
| Institutional Class | $1,000 | $2,029.40 | $3.62 | 0.48% |
| A Class | $1,000 | $2,026.50 | $7.00 | 0.93% |
| C Class | $1,000 | $2,016.40 | $12.60 | 1.68% |
| R Class | $1,000 | $2,023.10 | $8.87 | 1.18% |
| Hypothetical | ||||
| Investor Class | $1,000 | $1,021.48 | $3.42 | 0.68% |
| Institutional Class | $1,000 | $1,022.48 | $2.41 | 0.48% |
| A Class | $1,000 | $1,020.24 | $4.67 | 0.93% |
| C Class | $1,000 | $1,016.51 | $8.42 | 1.68% |
| R Class | $1,000 | $1,019.00 | $5.92 | 1.18% |
| (1) | Expenses are equal to the class's annualized expense ratio listed in the table above, multiplied by the average account value over the period, multiplied by 182, the number of days in the most recent fiscal half-year, divided by 366, to reflect the one-half year period. |
9
| Schedule of Investments |
JUNE 30, 2016
| Shares | Value | |||
| COMMON STOCKS — 99.0% | ||||
| Australia — 7.3% | ||||
| Evolution Mining Ltd. | 1,761,300 | $ | 3,070,420 | |
Gold Road Resources Ltd.(1) | 5,909,090 | 2,892,155 | ||
Newcrest Mining Ltd.(1) | 1,477,513 | 25,406,897 | ||
| Northern Star Resources Ltd. | 990,000 | 3,655,638 | ||
St. Barbara Ltd.(1) | 1,135,700 | 2,504,489 | ||
| 37,529,599 | ||||
| Canada — 63.0% | ||||
| Agnico-Eagle Mines Ltd. | 454,666 | 24,331,907 | ||
| Agnico-Eagle Mines Ltd. New York Shares | 192,600 | 10,304,100 | ||
Alacer Gold Corp.(1) | 629,000 | 1,499,532 | ||
| Alamos Gold, Inc., Class A | 669,600 | 5,758,161 | ||
ATAC Resources Ltd.(1) | 2,073,300 | 1,331,970 | ||
B2Gold Corp.(1) | 2,780,182 | 6,972,243 | ||
| Barrick Gold Corp. | 1,717,912 | 36,677,421 | ||
| Centerra Gold, Inc. | 63,600 | 379,055 | ||
Continental Gold, Inc.(1) | 621,000 | 1,744,828 | ||
Detour Gold Corp.(1) | 932,201 | 23,320,358 | ||
| Eldorado Gold Corp. | 2,020,100 | 9,084,547 | ||
First Majestic Silver Corp.(1) | 102,400 | 1,391,014 | ||
| Franco-Nevada Corp. | 312,294 | 23,746,865 | ||
GoGold Resources, Inc.(1) | 6,397,425 | 6,090,664 | ||
Gold Standard Ventures Corp.(1) | 2,452,700 | 4,562,022 | ||
Gold Standard Ventures Corp. (Acquired 2/25/14, Cost $6,052,538)(1)(2) | 8,877,162 | 16,490,722 | ||
| Goldcorp, Inc. | 1,193,376 | 22,833,898 | ||
| Goldcorp, Inc. New York Shares | 39,500 | 755,635 | ||
Guyana Goldfields, Inc.(1) | 1,734,121 | 12,429,243 | ||
IAMGOLD Corp.(1) | 341,519 | 1,414,240 | ||
Kinross Gold Corp.(1) | 930,152 | 4,564,545 | ||
Kinross Gold Corp. New York Shares(1) | 1,410,057 | 6,895,179 | ||
MAG Silver Corp.(1) | 334,000 | 4,211,355 | ||
| Nevsun Resources Ltd. | 220,400 | 646,554 | ||
New Gold, Inc.(1) | 1,652,600 | 7,227,207 | ||
| OceanaGold Corp. | 1,859,053 | 7,094,029 | ||
Orezone Gold Corp.(1)(3) | 6,200,000 | 5,470,800 | ||
| Osisko Gold Royalties Ltd. | 333,290 | 4,357,187 | ||
| Pan American Silver Corp. | 78,270 | 1,289,203 | ||
| Pan American Silver Corp. NASDAQ Shares | 145,300 | 2,390,185 | ||
Premier Gold Mines Ltd.(1) | 2,212,500 | 6,558,981 | ||
Primero Mining Corp.(1) | 786,212 | 1,636,991 | ||
Roxgold, Inc.(1) | 6,088,400 | 7,210,226 | ||
Sandstorm Gold Ltd.(1) | 345,000 | 1,551,492 | ||
SEMAFO, Inc.(1) | 1,463,100 | 7,021,340 | ||
| Silver Wheaton Corp. | 744,400 | 17,515,732 | ||
| Tahoe Resources, Inc. | 412,200 | 6,173,668 | ||
10
| Shares | Value | |||
Torex Gold Resources, Inc.(1) | 2,389,290 | $ | 4,272,038 | |
| Yamana Gold, Inc. | 1,833,522 | 9,536,954 | ||
| Yamana Gold, Inc. New York Shares | 1,252,081 | 6,510,821 | ||
| 323,252,912 | ||||
| China — 0.8% | ||||
| Zhaojin Mining Industry Co. Ltd. | 1,406,500 | 1,488,767 | ||
| Zijin Mining Group Co. Ltd., H Shares | 7,992,000 | 2,673,337 | ||
| 4,162,104 | ||||
| Hong Kong — 0.1% | ||||
| G-Resources Group Ltd. | 24,249,000 | 462,913 | ||
| Peru — 1.8% | ||||
Cia de Minas Buenaventura SAA ADR(1) | 784,700 | 9,377,165 | ||
| South Africa — 8.5% | ||||
AngloGold Ashanti Ltd.(1) | 435,302 | 7,920,839 | ||
AngloGold Ashanti Ltd. ADR(1) | 836,676 | 15,110,368 | ||
| Gold Fields Ltd. | 1,638,310 | 7,988,311 | ||
| Gold Fields Ltd. ADR | 299,000 | 1,465,100 | ||
Harmony Gold Mining Co. Ltd.(1) | 773,950 | 2,772,215 | ||
Harmony Gold Mining Co. Ltd. ADR(1) | 183,300 | 661,713 | ||
| Sibanye Gold Ltd. ADR | 561,100 | 7,642,182 | ||
| 43,560,728 | ||||
| United Kingdom — 7.2% | ||||
| Centamin plc | 271,300 | 477,254 | ||
| Fresnillo plc | 200,203 | 4,424,329 | ||
| Randgold Resources Ltd. ADR | 285,300 | 31,965,012 | ||
| 36,866,595 | ||||
| United States — 10.3% | ||||
Coeur Mining, Inc.(1) | 225,959 | 2,408,723 | ||
| Hecla Mining Co. | 513,475 | 2,618,723 | ||
| Newmont Mining Corp. | 825,914 | 32,309,756 | ||
| Royal Gold, Inc. | 217,721 | 15,680,266 | ||
| 53,017,468 | ||||
TOTAL COMMON STOCKS (Cost $305,410,078) | 508,229,484 | |||
WARRANTS† | ||||
Canada† | ||||
Sandstorm Gold Ltd.(1) (Cost $—) | 115,000 | 17,803 | ||
| TEMPORARY CASH INVESTMENTS — 0.9% | ||||
| Repurchase Agreement, Fixed Income Clearing Corp., (collateralized by various U.S. Treasury obligations, 3.00%, 5/15/45, valued at $4,784,000), at 0.20%, dated 6/30/16, due 7/1/16 (Delivery value $4,685,026) | 4,685,000 | |||
| State Street Institutional Liquid Reserves Fund, Premier Class | 3,271 | 3,271 | ||
TOTAL TEMPORARY CASH INVESTMENTS (Cost $4,688,271) | 4,688,271 | |||
TOTAL INVESTMENT SECURITIES — 99.9% (Cost $310,098,349) | 512,935,558 | |||
| OTHER ASSETS AND LIABILITIES — 0.1% | 557,335 | |||
| TOTAL NET ASSETS — 100.0% | $ | 513,492,893 | ||
11
| NOTES TO SCHEDULE OF INVESTMENTS | ||
| ADR | - | American Depositary Receipt |
| † | Category is less than 0.05% of total net assets. |
| (1) | Non-income producing. |
| (2) | Restricted security that may not be offered for public sale without being registered with the Securities and Exchange Commission and/or may be subject to resale, redemption or transferability restrictions. The aggregate value of these securities at the period end was $16,490,722, which represented 3.2% of total net assets. |
| (3) | Affiliated Company: the fund’s holding represents ownership of 5% or more of the voting securities of the company; therefore, the company is affiliated as defined in the Investment Company Act of 1940. |
See Notes to Financial Statements.
12
| Statement of Assets and Liabilities |
| JUNE 30, 2016 | |||
| Assets | |||
| Investment securities - unaffiliated, at value (cost of $307,752,086) | $ | 507,464,758 | |
| Investment securities - affiliated, at value (cost of $2,346,263) | 5,470,800 | ||
| Total investment securities, at value (cost of $310,098,349) | 512,935,558 | ||
| Foreign currency holdings, at value (cost of $217,212) | 217,806 | ||
| Receivable for investments sold | 144,343 | ||
| Receivable for capital shares sold | 934,829 | ||
| Dividends and interest receivable | 164,838 | ||
| 514,397,374 | |||
| Liabilities | |||
| Payable for capital shares redeemed | 624,238 | ||
| Accrued management fees | 250,443 | ||
| Distribution and service fees payable | 6,365 | ||
| Accrued other expenses | 23,435 | ||
| 904,481 | |||
| Net Assets | $ | 513,492,893 | |
| Net Assets Consist of: | |||
| Capital (par value and paid-in surplus) | $ | 432,958,549 | |
| Accumulated net investment loss | (5,409,259 | ) | |
| Accumulated net realized loss | (116,894,303 | ) | |
| Net unrealized appreciation | 202,837,906 | ||
| $ | 513,492,893 | ||
| Net Assets | Shares Outstanding | Net Asset Value Per Share | ||||
| Investor Class, $0.01 Par Value | $474,952,342 | 40,743,278 | $11.66 | |||
| Institutional Class, $0.01 Par Value | $15,579,393 | 1,326,282 | $11.75 | |||
| A Class, $0.01 Par Value | $15,195,527 | 1,324,865 | $11.47* | |||
| C Class, $0.01 Par Value | $2,589,402 | 233,851 | $11.07 | |||
| R Class, $0.01 Par Value | $5,176,229 | 454,320 | $11.39 | |||
*Maximum offering price $12.17 (net asset value divided by 0.9425).
See Notes to Financial Statements.
13
| Statement of Operations |
| YEAR ENDED JUNE 30, 2016 | |||
| Investment Income (Loss) | |||
| Income: | |||
| Dividends (net of foreign taxes withheld of $260,110) | $ | 2,291,039 | |
| Interest | 4,154 | ||
| 2,295,193 | |||
| Expenses: | |||
| Management fees | 2,048,015 | ||
| Distribution and service fees: | |||
| A Class | 19,827 | ||
| C Class | 16,300 | ||
| R Class | 14,455 | ||
| Directors' fees and expenses | 17,402 | ||
| Other expenses | 24,270 | ||
| 2,140,269 | |||
| Net investment income (loss) | 154,924 | ||
| Realized and Unrealized Gain (Loss) | |||
| Net realized gain (loss) on: | |||
| Investment transactions (including $1,098,295 from affiliates) | (291,825 | ) | |
| Foreign currency transactions | (67,711 | ) | |
| (359,536 | ) | ||
| Change in net unrealized appreciation (depreciation) on: | |||
| Investments | 192,086,622 | ||
| Translation of assets and liabilities in foreign currencies | 1,188 | ||
| 192,087,810 | |||
| Net realized and unrealized gain (loss) | 191,728,274 | ||
| Net Increase (Decrease) in Net Assets Resulting from Operations | $ | 191,883,198 | |
See Notes to Financial Statements.
14
| Statement of Changes in Net Assets |
| YEARS ENDED JUNE 30, 2016 AND JUNE 30, 2015 | ||||||
| Increase (Decrease) in Net Assets | June 30, 2016 | June 30, 2015 | ||||
| Operations | ||||||
| Net investment income (loss) | $ | 154,924 | $ | 767,291 | ||
| Net realized gain (loss) | (359,536 | ) | (22,463,895 | ) | ||
| Change in net unrealized appreciation (depreciation) | 192,087,810 | (138,729,520 | ) | |||
| Net increase (decrease) in net assets resulting from operations | 191,883,198 | (160,426,124 | ) | |||
| Distributions to Shareholders | ||||||
| From net investment income: | ||||||
| Investor Class | — | (10,071,945 | ) | |||
| Institutional Class | — | (349,838 | ) | |||
| A Class | — | (241,144 | ) | |||
| C Class | — | (56,176 | ) | |||
| R Class | — | (72,275 | ) | |||
| Decrease in net assets from distributions | — | (10,791,378 | ) | |||
| Capital Share Transactions | ||||||
| Net increase (decrease) in net assets from capital share transactions (Note 5) | 11,398,665 | (13,658,823 | ) | |||
| Redemption Fees | ||||||
| Increase in net assets from redemption fees | 109,427 | 46,235 | ||||
| Net increase (decrease) in net assets | 203,391,290 | (184,830,090 | ) | |||
| Net Assets | ||||||
| Beginning of period | 310,101,603 | 494,931,693 | ||||
| End of period | $ | 513,492,893 | $ | 310,101,603 | ||
Accumulated net investment loss/ Distributions in excess of net investment income | $ | (5,409,259 | ) | $ | (11,269,847 | ) |
See Notes to Financial Statements.
15
| Notes to Financial Statements |
JUNE 30, 2016
1. Organization
American Century Quantitative Equity Funds, Inc. (the corporation) is registered under the Investment Company Act of 1940, as amended (the 1940 Act), as an open-end management investment company and is organized as a Maryland corporation. Global Gold Fund (the fund) is one fund in a series issued by the corporation. The fund’s investment objective is to seek to realize a total return (capital growth and dividends) consistent with investment in securities of companies that are engaged in mining, processing, fabricating or distributing gold or other precious metals throughout the world.
The fund offers the Investor Class, the Institutional Class, the A Class, the C Class and the R Class. The A Class may incur an initial sales charge. The A Class and C Class may be subject to a contingent deferred sales charge. The share classes differ principally in their respective sales charges and distribution and shareholder servicing expenses and arrangements. The Institutional Class is made available to institutional shareholders or through financial intermediaries whose clients do not require the same level of shareholder and administrative services as shareholders of other classes. As a result, the Institutional Class is charged a lower unified management fee.
2. Significant Accounting Policies
The following is a summary of significant accounting policies consistently followed by the fund in preparation of its financial statements. The fund is an investment company and follows accounting and reporting guidance in accordance with accounting principles generally accepted in the United States of America. This may require management to make certain estimates and assumptions at the date of the financial statements. Actual results could differ from these estimates. Management evaluated the impact of events or transactions occurring through the date the financial statements were issued that would merit recognition or disclosure.
Investment Valuations — The fund determines the fair value of its investments and computes its net asset value per share at the close of regular trading (usually 4 p.m. Eastern time) on the New York Stock Exchange (NYSE) on each day the NYSE is open. The Board of Directors has adopted valuation policies and procedures to guide the investment advisor in the fund’s investment valuation process and to provide methodologies for the oversight of the fund’s pricing function.
Equity securities that are listed or traded on a domestic securities exchange are valued at the last reported sales price or at the official closing price as provided by the exchange. Equity securities traded on foreign securities exchanges are generally valued at the closing price of such securities on the exchange where primarily traded or at the close of the NYSE, if that is earlier. If no last sales price is reported, or if local convention or regulation so provides, the mean of the latest bid and asked prices may be used. Securities traded over-the-counter are valued at the mean of the latest bid and asked prices, the last sales price, or the official closing price. Equity securities initially expressed in local currencies are translated into U.S. dollars at the mean of the appropriate currency exchange rate at the close of the NYSE as provided by an independent pricing service.
Open-end management investment companies are valued at the reported net asset value per share. Repurchase agreements are valued at cost, which approximates fair value.
If the fund determines that the market price for an investment is not readily available or the valuation methods mentioned above do not reflect an investment’s fair value, such investment is valued as determined in good faith by the Board of Directors or its delegate, in accordance with policies and procedures adopted by the Board of Directors. In its determination of fair value, the fund may review several factors including, but not limited to, market information regarding the specific investment or comparable investments and correlation with other investment types, futures indices or general market indicators. Circumstances that may cause the fund to use these procedures to value an investment include, but are not limited to: an investment has been declared in default or is distressed; trading in a security has been suspended during the trading day or a security is not actively trading on its principal exchange; prices received from a regular pricing source are deemed unreliable; or there is a foreign market holiday and no trading occurred.
The fund monitors for significant events occurring after the close of an investment’s primary exchange but before the fund’s net asset value per share is determined. Significant events may include, but are not limited
16
to: corporate announcements and transactions; governmental action and political unrest that could impact a specific investment or an investment sector; or armed conflicts, natural disasters and similar events that could affect investments in a specific country or region. The fund also monitors for significant fluctuations between domestic and foreign markets, as evidenced by the U.S. market or such other indicators that the Board of Directors, or its delegate, deems appropriate. If significant fluctuations in foreign markets are identified, the fund may apply a model-derived factor to the closing price of equity securities traded on foreign securities exchanges. The factor is based on observable market data as provided by an independent pricing service.
Security Transactions — Security transactions are accounted for as of the trade date. Net realized gains and losses are determined on the identified cost basis, which is also used for federal income tax purposes.
Investment Income — Dividend income less foreign taxes withheld, if any, is recorded as of the ex-dividend date. Distributions received on securities that represent a return of capital or long-term capital gain are recorded as a reduction of cost of investments and/or as a realized gain. The fund may estimate the components of distributions received that may be considered nontaxable distributions or long-term capital gain distributions for income tax purposes. Interest income is recorded on the accrual basis and includes accretion of discounts and amortization of premiums.
Foreign Currency Translations — All assets and liabilities initially expressed in foreign currencies are translated into U.S. dollars at prevailing exchange rates at period end. The fund may enter into spot foreign currency exchange contracts to facilitate transactions denominated in a foreign currency. Purchases and sales of investment securities, dividend and interest income, spot foreign currency exchange contracts, and expenses are translated at the rates of exchange prevailing on the respective dates of such transactions. Net realized and unrealized foreign currency exchange gains or losses related to investment securities are a component of net realized gain (loss) on investment transactions and change in net unrealized appreciation (depreciation) on investments, respectively.
Repurchase Agreements — The fund may enter into repurchase agreements with institutions that American Century Investment Management, Inc. (ACIM) (the investment advisor) has determined are creditworthy pursuant to criteria adopted by the Board of Directors. The fund requires that the collateral, represented by securities, received in a repurchase transaction be transferred to the custodian in a manner sufficient to enable the fund to obtain those securities in the event of a default under the repurchase agreement. ACIM monitors, on a daily basis, the securities transferred to ensure the value, including accrued interest, of the securities under each repurchase agreement is equal to or greater than amounts owed to the fund under each repurchase agreement.
Joint Trading Account — Pursuant to an Exemptive Order issued by the Securities and Exchange Commission, the fund, along with certain other funds in the American Century Investments family of funds, may transfer uninvested cash balances into a joint trading account. These balances are invested in one or more repurchase agreements that are collateralized by U.S. Treasury or Agency obligations.
Income Tax Status — It is the fund’s policy to distribute substantially all net investment income and net realized gains to shareholders and to otherwise qualify as a regulated investment company under provisions of the Internal Revenue Code. Accordingly, no provision has been made for income taxes. The fund files U.S. federal, state, local and non-U.S. tax returns as applicable. The fund's tax returns are subject to examination by the relevant taxing authority until expiration of the applicable statute of limitations, which is generally three years from the date of filing but can be longer in certain jurisdictions. At this time, management believes there are no uncertain tax positions which, based on their technical merit, would not be sustained upon examination and for which it is reasonably possible that the total amounts of unrecognized tax benefits will significantly change in the next twelve months.
Multiple Class — All shares of the fund represent an equal pro rata interest in the net assets of the class to which such shares belong, and have identical voting, dividend, liquidation and other rights and the same terms and conditions, except for class specific expenses and exclusive rights to vote on matters affecting only individual classes. Income, non-class specific expenses, and realized and unrealized capital gains and losses of the fund are allocated to each class of shares based on their relative net assets.
Distributions to Shareholders — Distributions from net investment income, if any, are generally declared and paid semiannually. Distributions from net realized gains, if any, are generally declared and paid annually.
Redemption Fees — The fund may impose a 1.00% redemption fee on shares held less than 60 days. The fee may not be applicable to all classes. The redemption fee is retained by the fund and helps cover
17
transaction costs that long-term investors may bear when the fund sells securities to meet investor redemptions.
Indemnifications — Under the corporation’s organizational documents, its officers and directors are indemnified against certain liabilities arising out of the performance of their duties to the fund. In addition, in the normal course of business, the fund enters into contracts that provide general indemnifications. The maximum exposure under these arrangements is unknown as this would involve future claims that may be made against a fund. The risk of material loss from such claims is considered by management to be remote.
3. Fees and Transactions with Related Parties
Certain officers and directors of the corporation are also officers and/or directors of American Century Companies, Inc. (ACC). The corporation’s investment advisor, ACIM, the corporation's distributor, American Century Investment Services, Inc. (ACIS), and the corporation’s transfer agent, American Century Services, LLC, are wholly owned, directly or indirectly, by ACC.
Management Fees — The corporation has entered into a management agreement with ACIM, under which ACIM provides the fund with investment advisory and management services in exchange for a single, unified management fee (the fee) per class. The agreement provides that all expenses of managing and operating the fund, except distribution and service fees, brokerage expenses, taxes, interest, fees and expenses of the independent directors (including legal counsel fees), and extraordinary expenses, will be paid by ACIM. The fee is computed and accrued daily based on each class’s daily net assets and paid monthly in arrears. The fee consists of (1) an Investment Category Fee based on the daily net assets of the fund and certain other accounts managed by the investment advisor that are in the same broad investment category as the fund and (2) a Complex Fee based on the assets of all the funds in the American Century Investments family of funds. The rates for the Investment Category Fee range from 0.3380% to 0.5200%. The rates for the Complex Fee range from 0.2500% to 0.3100% for the Investor Class, A Class, C Class and R Class. The rates for the Complex Fee range from 0.0500% to 0.1100% for the Institutional Class. The effective annual management fee for each class for the year ended June 30, 2016 was 0.67% for the Investor Class, A Class, C Class and R Class and 0.47% for the Institutional Class.
Distribution and Service Fees — The Board of Directors has adopted a separate Master Distribution and Individual Shareholder Services Plan for each of the A Class, C Class and R Class (collectively the plans), pursuant to Rule 12b-1 of the 1940 Act. The plans provide that the A Class will pay ACIS an annual distribution and service fee of 0.25%. The plans provide that the C Class will pay ACIS an annual distribution and service fee of 1.00%, of which 0.25% is paid for individual shareholder services and 0.75% is paid for distribution services. The plans provide that the R Class will pay ACIS an annual distribution and service fee of 0.50%. The fees are computed and accrued daily based on each class’s daily net assets and paid monthly in arrears. The fees are used to pay financial intermediaries for distribution and individual shareholder services. Fees incurred under the plans during the year ended June 30, 2016 are detailed in the Statement of Operations.
Directors' Fees and Expenses — The Board of Directors is responsible for overseeing the investment advisor’s management and operations of the fund. The directors receive detailed information about the fund and its investment advisor regularly throughout the year, and meet at least quarterly with management of the investment advisor to review reports about fund operations. The fund’s officers do not receive compensation from the fund.
Interfund Transactions — The fund may enter into security transactions with other American Century Investments funds and other client accounts of the investment advisor, in accordance with the 1940 Act rules and procedures adopted by the Board of Directors. The rules and procedures require, among other things, that these transactions be effected at the independent current market price of the security. During the period, the interfund purchases were $723,806 and there were no interfund sales.
4. Investment Transactions
Purchases and sales of investment securities, excluding short-term investments, for the year ended June 30, 2016 were $43,720,424 and $34,113,804, respectively.
18
5. Capital Share Transactions
Transactions in shares of the fund were as follows:
| Year ended June 30, 2016 | Year ended June 30, 2015 | |||||||||
| Shares | Amount | Shares | Amount | |||||||
| Investor Class/Shares Authorized | 250,000,000 | 300,000,000 | ||||||||
| Sold | 10,061,872 | $ | 80,043,196 | 6,245,224 | $ | 54,744,954 | ||||
| Issued in reinvestment of distributions | — | — | 1,337,081 | 9,359,567 | ||||||
| Redeemed | (9,306,467 | ) | (71,764,552 | ) | (8,672,509 | ) | (72,469,815 | ) | ||
| 755,405 | 8,278,644 | (1,090,204 | ) | (8,365,294 | ) | |||||
| Institutional Class/Shares Authorized | 30,000,000 | 30,000,000 | ||||||||
| Sold | 804,753 | 6,404,812 | 507,084 | 4,587,343 | ||||||
| Issued in reinvestment of distributions | — | — | 49,764 | 349,838 | ||||||
| Redeemed | (808,537 | ) | (6,142,676 | ) | (516,894 | ) | (4,501,765 | ) | ||
| (3,784 | ) | 262,136 | 39,954 | 435,416 | ||||||
| A Class/Shares Authorized | 20,000,000 | 20,000,000 | ||||||||
| Sold | 1,099,174 | 9,133,207 | 1,144,536 | 10,110,276 | ||||||
| Issued in reinvestment of distributions | — | — | 34,064 | 235,378 | ||||||
| Redeemed | (862,066 | ) | (6,719,713 | ) | (1,771,595 | ) | (16,188,007 | ) | ||
| 237,108 | 2,413,494 | (592,995 | ) | (5,842,353 | ) | |||||
| C Class/Shares Authorized | 15,000,000 | 20,000,000 | ||||||||
| Sold | 71,547 | 581,177 | 113,525 | 975,833 | ||||||
| Issued in reinvestment of distributions | — | — | 6,931 | 46,781 | ||||||
| Redeemed | (130,502 | ) | (871,463 | ) | (153,298 | ) | (1,166,484 | ) | ||
| (58,955 | ) | (290,286 | ) | (32,842 | ) | (143,870 | ) | |||
| R Class/Shares Authorized | 20,000,000 | 20,000,000 | ||||||||
| Sold | 270,161 | 2,009,091 | 189,809 | 1,580,878 | ||||||
| Issued in reinvestment of distributions | — | — | 10,100 | 69,590 | ||||||
| Redeemed | (173,864 | ) | (1,274,414 | ) | (162,801 | ) | (1,393,190 | ) | ||
| 96,297 | 734,677 | 37,108 | 257,278 | |||||||
| Net increase (decrease) | 1,026,071 | $ | 11,398,665 | (1,638,979 | ) | $ | (13,658,823 | ) | ||
6. Affiliated Company Transactions
If a fund's holding represents ownership of 5% or more of the voting securities of a company, the company is affiliated as defined in the 1940 Act. A summary of transactions for each company which is or was an affiliate at or during the year ended June 30, 2016 follows:
| Company | Beginning Value | Purchase Cost | Sales Cost | Realized Gain (Loss) | Dividend Income | Ending Value | |||||||||||
Gold Standard Ventures Corp.(1)(2)(3)(4) | $ | 4,596,633 | $ | 2,451,010 | $ | 1,768,567 | $ | 1,098,295 | — | —(1) | |||||||
Orezone Gold Corp.(3) | — | 2,346,263 | — | — | — | $ | 5,470,800 | ||||||||||
| $ | 4,596,633 | $ | 4,797,273 | $ | 1,768,567 | $ | 1,098,295 | — | $ | 5,470,800 | |||||||
| (1) | Company was not an affiliate at June 30, 2016. |
| (2) | Includes all common stocks and warrants of the issuer held by the fund. |
| (3) | Non-income producing. |
| (4) | A portion has been deemed restricted. |
19
7. Fair Value Measurements
The fund’s investments valuation process is based on several considerations and may use multiple inputs to determine the fair value of the investments held by the fund. In conformity with accounting principles generally accepted in the United States of America, the inputs used to determine a valuation are classified into three broad levels.
| • | Level 1 valuation inputs consist of unadjusted quoted prices in an active market for identical investments. |
| • | Level 2 valuation inputs consist of direct or indirect observable market data (including quoted prices for comparable investments, evaluations of subsequent market events, interest rates, prepayment speeds, credit risk, etc.). These inputs also consist of quoted prices for identical investments initially expressed in local currencies that are adjusted through translation into U.S. dollars. |
| • | Level 3 valuation inputs consist of unobservable data (including a fund’s own assumptions). |
The level classification is based on the lowest level input that is significant to the fair valuation measurement. The valuation inputs are not necessarily an indication of the risks associated with investing in these securities or other financial instruments. There were no significant transfers between levels during the period.
The following is a summary of the level classifications as of period end. The Schedule of Investments provides additional information on the fund’s portfolio holdings.
| Level 1 | Level 2 | Level 3 | ||||||
| Assets | ||||||||
| Investment Securities | ||||||||
| Common Stocks | ||||||||
| Canada | $ | 85,611,095 | $ | 237,641,817 | — | |||
| Peru | 9,377,165 | — | — | |||||
| South Africa | 24,879,363 | 18,681,365 | — | |||||
| United Kingdom | 31,965,012 | 4,901,583 | — | |||||
| United States | 53,017,468 | — | — | |||||
| Other Countries | — | 42,154,616 | — | |||||
| Warrants | — | 17,803 | — | |||||
| Temporary Cash Investments | 3,271 | 4,685,000 | — | |||||
| $ | 204,853,374 | $ | 308,082,184 | — | ||||
8. Risk Factors
There are certain risks involved in investing in foreign securities. These risks include those resulting from future adverse political, social and economic developments, fluctuations in currency exchange rates, the possible imposition of exchange controls, and other foreign laws or restrictions. Investing in emerging markets may accentuate these risks.
The fund concentrates its investments in a narrow segment of the total market. Because of this, the fund may be subject to greater risk and market fluctuations than a portfolio representing a broader range of industries. Gold stocks are generally considered speculative because of high share price volatility. The price of gold will likely impact the value of the companies in which the fund invests. The price of gold will fluctuate, sometimes considerably. Though many investors believe that gold investments hedge against inflation, currency devaluations and stock market declines, there is no guarantee that these historical inverse relationships will continue.
20
9. Federal Tax Information
The tax character of distributions paid during the years ended June 30, 2016 and June 30, 2015 were as follows:
| 2016 | 2015 | ||||
| Distributions Paid From | |||||
| Ordinary income | — | $ | 10,791,378 | ||
| Long-term capital gains | — | — | |||
The book-basis character of distributions made during the year from net investment income or net realized gains may differ from their ultimate characterization for federal income tax purposes. These differences reflect the differing character of certain income items and net realized gains and losses for financial statement and tax purposes, and may result in reclassification among certain capital accounts on the financial statements.
The reclassifications, which are primarily due to gains on investments in passive foreign investment companies, were made to accumulated net investment loss $5,705,664, and accumulated net realized loss $(5,705,664).
As of June 30, 2016, the federal tax cost of investments and the components of distributable earnings on a tax-basis were as follows:
| Federal tax cost of investments | $ | 354,541,834 | |
| Gross tax appreciation of investments | $ | 186,701,825 | |
| Gross tax depreciation of investments | (28,308,101 | ) | |
| Net tax appreciation (depreciation) of investments | 158,393,724 | ||
| Net tax appreciation (depreciation) on translation of assets and liabilities in foreign currencies | 697 | ||
| Net tax appreciation (depreciation) | $ | 158,394,421 | |
| Undistributed ordinary income | $ | 31,585,574 | |
| Accumulated short-term capital losses | $ | (24,239,127 | ) |
| Accumulated long-term capital losses | $ | (85,206,524 | ) |
The difference between book-basis and tax-basis unrealized appreciation (depreciation) is attributable primarily to the realization to ordinary income for tax purposes of unrealized gains on investments in passive foreign investment companies.
Accumulated capital losses represent net capital loss carryovers that may be used to offset future realized capital gains for federal income tax purposes. The capital loss carryovers may be carried forward for an unlimited period. Future capital loss carryover utilization in any given year may be subject to Internal Revenue Code limitations.
21
| Financial Highlights |
| For a Share Outstanding Throughout the Years Ended June 30 (except as noted) | |||||||||||||||
| Per-Share Data | Ratios and Supplemental Data | ||||||||||||||
| Income From Investment Operations: | Distributions From: | Ratio to Average Net Assets of: | |||||||||||||
Net Asset Value, Beginning of Period | Net Investment Income (Loss)(1) | Net Realized and Unrealized Gain (Loss) | Total From Investment Operations | Net Investment Income | Net Realized Gains | Total Distributions | Net Asset Value, End of Period | Total Return(2) | Operating Expenses | Net Investment Income (Loss) | Portfolio Turnover Rate | Net Assets, End of Period (in thousands) | |||
| Investor Class | |||||||||||||||
| 2016 | $7.21 | —(3) | 4.45 | 4.45 | — | — | — | $11.66 | 61.72% | 0.68% | 0.06% | 11% | $474,952 | ||
| 2015 | $11.08 | 0.02 | (3.64) | (3.62) | (0.25) | — | (0.25) | $7.21 | (32.61)% | 0.67% | 0.21% | 17% | $288,172 | ||
| 2014 | $9.72 | 0.04 | 1.32 | 1.36 | — | — | — | $11.08 | 13.99% | 0.67% | 0.40% | 29% | $455,211 | ||
| 2013 | $17.08 | 0.10 | (7.26) | (7.16) | (0.20) | — | (0.20) | $9.72 | (42.43)% | 0.68% | 0.61% | 6% | $419,703 | ||
| 2012 | $22.90 | 0.05 | (4.50) | (4.45) | — | (1.37) | (1.37) | $17.08 | (20.43)% | 0.69% | 0.23% | 8% | $789,135 | ||
| Institutional Class | |||||||||||||||
| 2016 | $7.25 | 0.02 | 4.48 | 4.50 | — | — | — | $11.75 | 62.07% | 0.48% | 0.26% | 11% | $15,579 | ||
| 2015 | $11.14 | 0.04 | (3.67) | (3.63) | (0.26) | — | (0.26) | $7.25 | (32.48)% | 0.47% | 0.41% | 17% | $9,639 | ||
| 2014 | $9.75 | 0.06 | 1.33 | 1.39 | — | — | — | $11.14 | 14.26% | 0.47% | 0.60% | 29% | $14,375 | ||
| 2013 | $17.13 | 0.14 | (7.28) | (7.14) | (0.24) | — | (0.24) | $9.75 | (42.30)% | 0.48% | 0.81% | 6% | $13,976 | ||
| 2012 | $22.92 | 0.10 | (4.52) | (4.42) | — | (1.37) | (1.37) | $17.13 | (20.28)% | 0.49% | 0.43% | 8% | $15,971 | ||
| A Class | |||||||||||||||
| 2016 | $7.11 | (0.01) | 4.37 | 4.36 | — | — | — | $11.47 | 61.32% | 0.93% | (0.19)% | 11% | $15,196 | ||
| 2015 | $10.94 | (0.01) | (3.59) | (3.60) | (0.23) | — | (0.23) | $7.11 | (32.84)% | 0.92% | (0.04)% | 17% | $7,732 | ||
| 2014 | $9.61 | 0.01 | 1.32 | 1.33 | — | — | — | $10.94 | 13.84% | 0.92% | 0.15% | 29% | $18,387 | ||
| 2013 | $16.90 | 0.06 | (7.19) | (7.13) | (0.16) | — | (0.16) | $9.61 | (42.61)% | 0.93% | 0.36% | 6% | $10,561 | ||
| 2012 | $22.72 | —(3) | (4.45) | (4.45) | — | (1.37) | (1.37) | $16.90 | (20.60)% | 0.94% | (0.02)% | 8% | $15,550 | ||
| For a Share Outstanding Throughout the Years Ended June 30 (except as noted) | |||||||||||||||
| Per-Share Data | Ratios and Supplemental Data | ||||||||||||||
| Income From Investment Operations: | Distributions From: | Ratio to Average Net Assets of: | |||||||||||||
Net Asset Value, Beginning of Period | Net Investment Income (Loss)(1) | Net Realized and Unrealized Gain (Loss) | Total From Investment Operations | Net Investment Income | Net Realized Gains | Total Distributions | Net Asset Value, End of Period | Total Return(2) | Operating Expenses | Net Investment Income (Loss) | Portfolio Turnover Rate | Net Assets, End of Period (in thousands) | |||
| C Class | |||||||||||||||
| 2016 | $6.91 | (0.06) | 4.22 | 4.16 | — | — | — | $11.07 | 60.20% | 1.68% | (0.94)% | 11% | $2,589 | ||
| 2015 | $10.64 | (0.07) | (3.48) | (3.55) | (0.18) | — | (0.18) | $6.91 | (33.36)% | 1.67% | (0.79)% | 17% | $2,024 | ||
| 2014 | $9.42 | (0.06) | 1.28 | 1.22 | — | — | — | $10.64 | 12.95% | 1.67% | (0.60)% | 29% | $3,465 | ||
| 2013 | $16.56 | (0.05) | (7.06) | (7.11) | (0.03) | — | (0.03) | $9.42 | (43.02)% | 1.68% | (0.39)% | 6% | $2,102 | ||
| 2012 | $22.46 | (0.16) | (4.37) | (4.53) | — | (1.37) | (1.37) | $16.56 | (21.21)% | 1.69% | (0.77)% | 8% | $2,826 | ||
| R Class | |||||||||||||||
| 2016 | $7.08 | (0.03) | 4.34 | 4.31 | — | — | — | $11.39 | 60.88% | 1.18% | (0.44)% | 11% | $5,176 | ||
| 2015 | $10.89 | (0.02) | (3.58) | (3.60) | (0.21) | — | (0.21) | $7.08 | (32.98)% | 1.17% | (0.29)% | 17% | $2,534 | ||
| 2014 | $9.59 | (0.01) | 1.31 | 1.30 | — | — | — | $10.89 | 13.56% | 1.17% | (0.10)% | 29% | $3,494 | ||
| 2013 | $16.86 | 0.03 | (7.18) | (7.15) | (0.12) | — | (0.12) | $9.59 | (42.74)% | 1.18% | 0.11% | 6% | $2,574 | ||
| 2012 | $22.73 | (0.05) | (4.45) | (4.50) | — | (1.37) | (1.37) | $16.86 | (20.82)% | 1.19% | (0.27)% | 8% | $2,623 | ||
| Notes to Financial Highlights |
| (1) | Computed using average shares outstanding throughout the period. |
| (2) | Total returns are calculated based on the net asset value of the last business day and do not reflect applicable sales charges, if any. Total returns for periods less than one year are not annualized. |
| (3) | Per-share amount was less than $0.005. |
See Notes to Financial Statements.
| Report of Independent Registered Public Accounting Firm |
To the Directors of the American Century Quantitative Equity Funds, Inc. and Shareholders of the Global Gold Fund:
In our opinion, the accompanying statement of assets and liabilities, including the schedule of investments, and the related statements of operations and of changes in net assets and the financial highlights present fairly, in all material respects, the financial position of the Global Gold Fund (one of the sixteen funds comprising the American Century Quantitative Equity Funds, Inc., hereafter referred to as the “Fund”) at June 30, 2016, the results of its operations for the year then ended, the changes in its net assets for each of the two years in the period then ended and the financial highlights for each of the five years in the period then ended, in conformity with accounting principles generally accepted in the United States of America. These financial statements and financial highlights (hereafter referred to as "financial statements") are the responsibility of the Fund's management. Our responsibility is to express an opinion on these financial statements based on our audits. We conducted our audits of these financial statements in accordance with the standards of the Public Company Accounting Oversight Board (United States). Those standards require that we plan and perform the audit to obtain reasonable assurance about whether the financial statements are free of material misstatement. An audit includes examining, on a test basis, evidence supporting the amounts and disclosures in the financial statements, assessing the accounting principles used and significant estimates made by management, and evaluating the overall financial statement presentation. We believe that our audits, which included confirmation of securities at June 30, 2016 by correspondence with the custodian and brokers, provide a reasonable basis for our opinion.
PricewaterhouseCoopers LLP
Kansas City, Missouri
August 17, 2016
24
| Management |
Board of Directors
The individuals listed below serve as directors of the funds. Each director will continue to serve in this capacity until death, retirement, resignation or removal from office. The board has adopted a mandatory retirement age for directors who are not “interested persons,” as that term is defined in the Investment Company Act (independent directors). Independent directors shall retire on December 31 of the year in which they reach their 75th birthday; provided, however, that on or after January 1, 2022, independent directors shall retire on December 31 of the year in which they reach their 76th birthday.
Mr. Thomas is an “interested person” because he currently serves as President and Chief Executive Officer of American Century Companies, Inc. (ACC), the parent company of American Century Investment Management, Inc. (ACIM or the advisor). The other directors (more than three-fourths of the total number) are independent. They are not employees, directors or officers of, and have no financial interest in, ACC or any of its wholly owned, direct or indirect, subsidiaries, including ACIM, American Century Investment Services, Inc. (ACIS) and American Century Services, LLC (ACS), and they do not have any other affiliations, positions or relationships that would cause them to be considered “interested persons” under the Investment Company Act. The directors serve in this capacity for eight (in the case of Mr. Thomas, 15) registered investment companies in the American Century Investments family of funds.
The following table presents additional information about the directors. The mailing address for each director other than Mr. Thomas is 1665 Charleston Road, Mountain View, California 94043. The mailing address for Mr. Thomas is 4500 Main Street, Kansas City, Missouri 64111.
Name (Year of Birth) | Position(s) Held with Funds | Length of Time Served | Principal Occupation(s) During Past 5 Years | Number of American Century Portfolios Overseen by Director | Other Directorships Held During Past 5 Years |
| Independent Directors | |||||
| Tanya S. Beder (1955) | Director | Since 2011 | Chairman and CEO, SBCC Group Inc. (independent advisory services) (2006 to present) | 45 | CYS Investments, Inc. (NYSE mortgage arbitrage REIT) |
| Jeremy I. Bulow (1954) | Director | Since 2011 | Professor of Economics, Stanford University, Graduate School of Business (1979 to present) | 45 | None |
| Anne Casscells (1958) | Director | Since 2016 | Co-Chief Executive Officer and Chief Investment Officer, Aetos Alternatives Management (investment advisory firm) (2001 to present); Lecturer in Accounting, Stanford University, Graduate School of Business (2009 to present) | 45 | None |
25
Name (Year of Birth) | Position(s) Held with Funds | Length of Time Served | Principal Occupation(s) During Past 5 Years | Number of American Century Portfolios Overseen by Director | Other Directorships Held During Past 5 Years |
| Independent Directors | |||||
| Ronald J. Gilson (1946) | Director and Chairman of the Board | Since 1995 (Chairman since 2005) | Charles J. Meyers Professor of Law and Business, Emeritus, Stanford Law School (1979 to present); Marc and Eva Stern Professor of Law and Business, Columbia University School of Law (1992 to present) | 45 | None |
| Frederick L. A. Grauer (1946) | Director | Since 2008 | Senior Advisor, iShares by BlackRock, Inc. (investment management firm) (2010 to 2011, 2013 to present); Senior Advisor, Course Hero (an educational technology company) (2015 to present) | 45 | None |
| Jonathan D. Levin (1972) | Director | Since 2016 | Holbrook Working Professor of Price Theory, Stanford University, (2000 to present); Chair, Department of Economics, Stanford University (2011 to 2014) | 45 | None |
| Peter F. Pervere (1947) | Director | Since 2007 | Retired | 45 | None |
| John B. Shoven (1947) | Director | Since 2002 | Charles R. Schwab Professor of Economics, Stanford University (1973 to present) | 45 | Cadence Design Systems; Exponent; Financial Engines |
| Interested Director | |||||
| Jonathan S. Thomas (1963) | Director and President | Since 2007 | President and Chief Executive Officer, ACC (March 2007 to present). Also serves as Chief Executive Officer, ACS; Executive Vice President, ACIM; Director, ACC, ACIM and other ACC subsidiaries | 128 | BioMed Valley Discoveries, Inc. |
The Statement of Additional Information has additional information about the fund's directors and is available without charge, upon request, by calling 1-800-345-2021.
26
Officers
The following table presents certain information about the executive officers of the funds. Each officer serves as an officer for each of the 15 investment companies in the American Century family of funds, unless otherwise noted. No officer is compensated for his or her service as an officer of the funds. The listed officers are interested persons of the funds and are appointed or re-appointed on an annual basis. The mailing address for each of the officers listed below is 4500 Main Street, Kansas City, Missouri 64111.
Name (Year of Birth) | Offices with the Funds | Principal Occupation(s) During the Past Five Years |
| Jonathan S. Thomas (1963) | Director and President since 2007 | President and Chief Executive Officer, ACC (March 2007 to present). Also serves as Chief Executive Officer, ACS; Executive Vice President, ACIM; Director, ACC, ACIM and other ACC subsidiaries |
| Amy D. Shelton (1964) | Chief Compliance Officer and Vice President since 2014 | Chief Compliance Officer, American Century funds, (March 2014 to present); Chief Compliance Officer, ACIM (February 2014 to present); Chief Compliance Officer, ACIS (October 2009 to present); Vice President, Client Interactions and Marketing, ACIS (February 2013 to January 2014); Director, Client Interactions and Marketing, ACIS (June 2007 to January 2013). Also serves as Vice President, ACIS |
| Charles A. Etherington (1957) | General Counsel since 2007 and Senior Vice President since 2006 | Attorney, ACC (February 1994 to present); Vice President, ACC (November 2005 to present); General Counsel, ACC (March 2007 to present). Also serves as General Counsel, ACIM, ACS, ACIS and other ACC subsidiaries; and Senior Vice President, ACIM and ACS |
| C. Jean Wade (1964) | Vice President, Treasurer and Chief Financial Officer since 2012 | Vice President, ACS (February 2000 to present) |
| Robert J. Leach (1966) | Vice President since 2006 and Assistant Treasurer since 2012 | Vice President, ACS (February 2000 to present) |
| David H. Reinmiller (1963) | Vice President since 2001 | Attorney, ACC (January 1994 to present); Associate General Counsel, ACC (January 2001 to present). Also serves as Vice President, ACIM and ACS |
| Ward D. Stauffer (1960) | Secretary since 2005 | Attorney, ACC (June 2003 to present) |
27
| Approval of Management Agreement |
At a meeting held on June 14, 2016, the Fund’s Board of Directors (the "Board") unanimously approved the renewal of the management agreement pursuant to which American Century Investment Management, Inc. (the “Advisor”) acts as the investment advisor for the Fund. Under Section 15(c) of the Investment Company Act, contracts for investment advisory services are required to be reviewed, evaluated, and approved by a majority of a fund’s directors/trustees, including a majority of the independent Directors, each year. The Board regards this annual evaluation and renewal as one of its most important responsibilities.
The independent Directors have memorialized a statement regarding the relationship between their ongoing obligations to oversee and evaluate the performance of the Advisor and their annual consideration of renewal of the management agreement. In that statement, the independent Directors noted that their assessment of the Advisor’s performance is an ongoing process that takes place over the entire year and is informed by all of the extensive information that the Board and its committees receive and consider over time. This information, together with the additional materials provided specifically in connection with the review, are central to the Board’s assessment of the Advisor’s performance and its determination whether to renew the Fund’s management agreement.
Prior to its consideration of the renewal of the management agreement, the Board requested and reviewed extensive data and analysis relating to the proposed renewal. This information and analysis was compiled by the Advisor and certain independent providers of evaluation data concerning the Fund and the services provided to the Fund by the Advisor.
In connection with its consideration of the renewal of the management agreement, the Board’s review and evaluation of the services provided by the Advisor included, but was not limited to, the following:
| • | the nature, extent, and quality of investment management, shareholder services, and other services provided by the Advisor to the Fund; |
| • | the wide range of other programs and services the Advisor provides to the Fund and its shareholders on a routine and non-routine basis; |
| • | the investment performance of the Fund, including data comparing the Fund’s performance to appropriate benchmarks and/or a peer group of other mutual funds with similar investment objectives and strategies; |
| • | the cost of owning the Fund compared to the cost of owning similar funds; |
| • | the Advisor’s compliance policies, procedures, and regulatory experience; |
| • | financial data showing the cost of services provided to the Fund, the profitability of the Fund to the Advisor, and the overall profitability of the Advisor; |
| • | possible economies of scale associated with the Advisor’s management of the Fund and other accounts under its management; |
| • | data comparing services provided and charges to other investment management clients of the Advisor; |
| • | acquired fund fees and expenses; |
| • | payments by the Fund and the Advisor to financial intermediaries whose clients are investors in the Fund; and |
| • | any collateral benefits derived by the Advisor from the management of the Fund. |
In keeping with its practice, the Board held two in-person meetings to review and discuss the information provided in response to their request. The independent Directors also had the benefit of the advice of their independent counsel throughout the process.
28
Factors Considered
The Directors considered all of the information provided by the Advisor, the independent data providers, and the independent Directors’ independent counsel in connection with the approval. They determined that the information was sufficient for them to evaluate the management agreement for the Fund. In connection with their review, the Directors did not identify any single factor as being all-important or controlling and each Director may have attributed different levels of importance to different factors. In deciding to renew the management agreement, the Board based its decision on a number of factors, including the following:
Nature, Extent and Quality of Services - Generally. Under the management agreement, the Advisor is responsible for providing or arranging for all services necessary for the operation of the Fund. The Board noted that under the management agreement, the Advisor provides or arranges at its own expense a wide variety of services including:
| • | constructing and designing the Fund |
| • | portfolio research and security selection |
| • | initial capitalization/funding |
| • | securities trading |
| • | Fund administration |
| • | custody of Fund assets |
| • | daily valuation of the Fund’s portfolio |
| • | shareholder servicing and transfer agency, including shareholder confirmations, recordkeeping, and communications |
| • | legal services (except the independent Directors’ counsel) |
| • | regulatory and portfolio compliance |
| • | financial reporting |
| • | marketing and distribution (except amounts paid by the Fund under Rule 12b-1 plans) |
The Board noted that many of these services have expanded over time in terms of both quantity and complexity in response to shareholder demands, competition in the industry, changing distribution channels, and the changing regulatory environment.
Investment Management, Shareholder, and Other Services. The nature of the investment management services provided to the Fund is quite complex and allows Fund shareholders access to professional money management, instant diversification of their investments within an asset class, the opportunity to easily diversify among asset classes by investing in or exchanging among various American Century Investments funds, and liquidity. In evaluating investment performance, the Board expects the Advisor to manage the Fund in accordance with its investment objectives and approved strategies. Further, the Directors recognize that the Advisor has an obligation to seek the best execution of fund trades. In providing these services, the Advisor utilizes teams of investment professionals (portfolio managers, analysts, research assistants, and securities traders) who require extensive information technology, research, training, compliance, and other systems to conduct their business. The Board, directly and through its Portfolio Committee, regularly reviews investment performance information for the Fund, together with comparative information for appropriate benchmarks and/or peer groups of similarly-managed funds, over different time horizons. The Directors also review detailed performance information during the management agreement approval process. If performance concerns are identified, the Fund receives special reviews until performance improves, during which the Board discusses with the Advisor the reasons for such results (e.g., market conditions, security selection) and any efforts being undertaken to improve performance. The Fund’s performance was above its benchmark for the one-, three-, five-, and ten-year periods reviewed by the Board. The Board found the investment management services provided by the Advisor to the Fund to be satisfactory and consistent with the management agreement.
29
Under the management agreement, the Advisor provides the Fund with a comprehensive package of transfer agency, shareholder, and other services. The Board, directly and through various committees of the Board, regularly reviews reports and evaluations of such services at its regular meetings. These reports include, but are not limited to, information regarding the operational efficiency and accuracy of the shareholder and transfer agency services provided, staffing levels, shareholder satisfaction (as measured by external as well as internal sources), technology support, new products and services offered to Fund shareholders, securities trading activities, portfolio valuation services, auditing services, and legal and operational compliance activities. Certain aspects of shareholder and transfer agency service level efficiency and the quality of securities trading activities are measured by independent third party providers and are presented in comparison to other fund groups not managed by the Advisor.
The Board found the services provided by the Advisor to the Fund under the management agreement to be competitive and of high quality.
Costs of Services and Profitability. The Advisor provides detailed information concerning its cost of providing various services to the Fund, its profitability in managing the Fund, its overall profitability, and its financial condition. The Directors have reviewed with the Advisor the methodology used to prepare this financial information. This information is considered in evaluating the Advisor’s financial condition, its ability to continue to provide services under the management agreement, and the reasonableness of the current management fee. The Board concluded that the Advisor’s profits were reasonable in light of the services provided to the Fund.
Economies of Scale. The Board also reviewed information provided by the Advisor regarding the possible existence of economies of scale in connection with the management of the Fund. The Board concluded that economies of scale are difficult to measure and predict with precision, especially on a fund-by-fund basis. The Board concluded that the Advisor is appropriately sharing economies of scale through its competitive fee structure, offering competitive fees from fund inception, and through reinvestment in its business to provide shareholders enhanced and expanded services.
Comparison to Other Funds’ Fees. The management agreement provides that the Fund pays the Advisor a single, all-inclusive (or unified) management fee for providing all services necessary for the management and operation of the Fund, other than brokerage expenses, expenses attributable to short sales, taxes, interest, extraordinary expenses, the fees and expenses of the Fund’s independent Directors (including their independent legal counsel), and expenses incurred in connection with the provision of shareholder services and distribution services under a plan adopted pursuant to Rule 12b-1 under the 1940 Act. Under the unified fee structure, the Advisor is responsible for providing all investment advisory, custody, audit, administrative, compliance, recordkeeping, marketing, and shareholder services, or arranging and supervising third parties to provide such services. By contrast, most other funds are charged a variety of fees, including an investment advisory fee, a transfer agency fee, an administrative fee, distribution charges, and other expenses. Other than their investment advisory fees and any applicable Rule 12b-1 fees, all other components of the total fees charged by these other funds may be increased without shareholder approval. The Board believes the unified fee structure is a benefit to Fund shareholders because it clearly discloses to shareholders the cost of owning Fund shares, and, since the unified fee cannot be increased without a vote of Fund shareholders, it shifts to the Advisor the risk of increased costs of operating the Fund and provides a direct incentive to minimize administrative inefficiencies. Part of the Board’s analysis of fee levels involves reviewing certain evaluative data compiled by an independent provider and comparing the Fund’s unified fee to the total expense ratio of peer funds. The unified fee charged to shareholders of the Fund was below the median of the total expense ratios of the Fund’s peer universe. The Board concluded that the management fee paid by the Fund to the Advisor under the management agreement is reasonable in light of the services provided to the Fund.
30
Comparison to Fees and Services Provided to Other Clients of the Advisor. The Board also requested and received information from the Advisor concerning the nature of the services, fees, costs, and profitability of its advisory services to advisory clients other than the Fund. They observed that these varying types of client accounts require different services and involve different regulatory and entrepreneurial risks than the management of the Fund. The Board analyzed this information and concluded that the fees charged and services provided to the Fund were reasonable by comparison.
Payments to Intermediaries. The Directors also requested and received a description of payments made to intermediaries by the Fund and the Advisor. These payments include various payments made by the Fund or the Advisor to different types of intermediaries and recordkeepers for distribution and service activities provided for the Fund.
Collateral or “Fall-Out” Benefits Derived by the Advisor. The Board considered the existence of collateral benefits the Advisor may receive as a result of its relationship with the Fund. The Board noted that the Advisor’s primary business is managing mutual funds and it generally does not use fund or shareholder information to generate profits in other lines of business, and therefore does not derive any significant collateral benefits from them. The Board noted that the Advisor receives proprietary research from broker-dealers that execute fund portfolio transactions. The Board also determined that the Advisor is able to provide investment management services to certain clients other than the Fund, at least in part, due to its existing infrastructure built to serve the fund complex. The Board concluded, however, that the assets of those other clients are not material to the analysis and, where applicable, may be included with the assets of the Fund to determine breakpoints in the management fee schedule.
Existing Relationship. The Board also considered whether there was any reason for not continuing the existing arrangement with the Advisor. In this regard, the Board was mindful of the potential disruptions of the Fund’s operations and various risks, uncertainties, and other effects that could occur as a result of a decision not to continue such relationship. In particular, the Board recognized that most shareholders have invested in the Fund on the strength of the Advisor’s industry standing and reputation and in the expectation that the Advisor will have a continuing role in providing advisory services to the Fund.
Conclusion of the Directors. As a result of this process, the Board, including all of the independent Directors and assisted by the advice of independent legal counsel, taking into account all of the factors discussed above and the information provided by the Advisor and others in connection with its review and throughout the year, concluded that the management agreement between the Fund and the Advisor is fair and reasonable in light of the services provided and should be renewed.
31
| Proxy Voting Results |
A special meeting of shareholders was held on June 13, 2016, to vote on the following proposal. The proposal received the required number of votes and was adopted. A summary of voting results is listed below.
To elect four directors to the Board of Directors of American Century Quantitative Equity Funds, Inc.:
| Affirmative | Withhold | ||||||
| Tanya S. Beder | $ | 8,473,153,264 | $ | 121,459,590 | |||
| Jeremy I. Bulow | $ | 8,469,793,581 | $ | 124,819,273 | |||
| Anne Casscells | $ | 8,465,895,232 | $ | 128,717,622 | |||
| Jonathan D. Levin | $ | 8,468,929,867 | $ | 125,682,987 | |||
The other directors whose term of office continued after the meeting include Jonathan S. Thomas, Ronald J. Gilson, Frederick L. A. Grauer, Peter F. Pervere and John B. Shoven.
32
| Additional Information |
Retirement Account Information
As required by law, distributions you receive from certain IRAs are subject to federal income tax withholding, unless you elect not to have withholding apply. Tax will be withheld on the total amount withdrawn even though you may be receiving amounts that are not subject to withholding, such as nondeductible contributions. In such case, excess amounts of withholding could occur. You may adjust your withholding election so that a greater or lesser amount will be withheld.
If you don’t want us to withhold on this amount, you must notify us to not withhold the federal income tax. You may notify us in writing or in certain situations by telephone or through other electronic means. For systematic withdrawals, your withholding election will remain in effect until revoked or changed by filing a new election. You have the right to revoke your election at any time.
Remember, even if you elect not to have income tax withheld, you are liable for paying income tax on the taxable portion of your withdrawal. If you elect not to have income tax withheld or you don’t have enough income tax withheld, you may be responsible for payment of estimated tax. You may incur penalties under the estimated tax rules if your withholding and estimated tax payments are not sufficient. You can reduce or defer the income tax on a distribution by directly or indirectly rolling such distribution over to another IRA or eligible plan. You should consult your tax advisor for additional information.
State tax will be withheld if, at the time of your distribution, your address is within one of the mandatory withholding states and you have federal income tax withheld (or as otherwise required by state law). State taxes will be withheld from your distribution in accordance with the respective state rules.
Distributions you receive from 403(b), 457 and qualified plans are subject to special tax and withholding rules. Your plan administrator or plan sponsor is required to provide you with a special tax notice explaining those rules at the time you request a distribution. If applicable, federal and/or state taxes may be withheld from your distribution amount.
Proxy Voting Policies
Descriptions of the principles and policies that the fund's investment advisor uses in exercising the voting rights associated with the securities purchased and/or held by the fund are available without charge, upon request, by calling 1-800-345-2021 or visiting the "About Us" page of American Century Investments’ website at americancentury.com. A description of the policies is also available on the Securities and Exchange Commission’s website at sec.gov. Information regarding how the investment advisor voted proxies relating to portfolio securities during the most recent 12-month period ended June 30 is available on the "About Us" page at americancentury.com. It is also available at sec.gov.
Quarterly Portfolio Disclosure
The fund files its complete schedule of portfolio holdings with the Securities and Exchange Commission (SEC) for the first and third quarters of each fiscal year on Form N-Q. The fund’s Forms N-Q are available on the SEC’s website at sec.gov, and may be reviewed and copied at the SEC’s Public Reference Room in Washington, DC. Information on the operation of the Public Reference Room may be obtained by calling 1-800-SEC-0330. The fund also makes its complete schedule of portfolio holdings for the most recent quarter of its fiscal year available on its website at americancentury.com and, upon request, by calling 1-800-345-2021.
33
| Notes |
34
| Notes |
35
| Notes |
36
| ||
| Contact Us | americancentury.com | |
| Automated Information Line | 1-800-345-8765 | |
| Investor Services Representative | 1-800-345-2021 or 816-531-5575 | |
| Investors Using Advisors | 1-800-378-9878 | |
| Business, Not-For-Profit, Employer-Sponsored Retirement Plans | 1-800-345-3533 | |
| Banks and Trust Companies, Broker-Dealers, Financial Professionals, Insurance Companies | 1-800-345-6488 | |
| Telecommunications Relay Service for the Deaf | 711 | |
| American Century Quantitative Equity Funds, Inc. | ||
Investment Advisor: American Century Investment Management, Inc. Kansas City, Missouri | ||
| This report and the statements it contains are submitted for the general information of our shareholders. The report is not authorized for distribution to prospective investors unless preceded or accompanied by an effective prospectus. | ||
| ©2016 American Century Proprietary Holdings, Inc. All rights reserved. CL-ANN-89952 1608 | ||
| Annual Report | |
| June 30, 2016 | |
| Income & Growth Fund | |
| Table of Contents |
| President's Letter | 2 | |
| Performance | 3 | |
| Portfolio Commentary | ||
| Fund Characteristics | ||
| Shareholder Fee Example | ||
| Schedule of Investments | ||
| Statement of Assets and Liabilities | ||
| Statement of Operations | ||
| Statement of Changes in Net Assets | ||
| Notes to Financial Statements | ||
| Financial Highlights | ||
| Report of Independent Registered Public Accounting Firm | ||
| Management | ||
| Approval of Management Agreement | ||
| Proxy Voting Results | ||
| Additional Information | ||
Any opinions expressed in this report reflect those of the author as of the date of the report, and do not necessarily represent the opinions of American Century Investments® or any other person in the American Century Investments organization. Any such opinions are subject to change at any time based upon market or other conditions and American Century Investments disclaims any responsibility to update such opinions. These opinions may not be relied upon as investment advice and, because investment decisions made by American Century Investments funds are based on numerous factors, may not be relied upon as an indication of trading intent on behalf of any American Century Investments fund. Security examples are used for representational purposes only and are not intended as recommendations to purchase or sell securities. Performance information for comparative indices and securities is provided to American Century Investments by third party vendors. To the best of American Century Investments’ knowledge, such information is accurate at the time of printing.
| President’s Letter |
Jonathan ThomasDear Investor:
Thank you for reviewing this annual report for the 12 months ended June 30, 2016. It provides investment performance and portfolio information for the reporting period, plus longer-term historical performance data.
Annual reports remain important vehicles for conveying information about fund returns, including market and economic factors that affected performance during the reporting period. For additional, updated investment and market insights, we encourage you to visit our website, americancentury.com.
Market Volatility Increased, But Not for the Reasons Anticipated
Going into this reporting period, investors anticipated increased market volatility and uncertainty as the Federal Reserve (the Fed) appeared poised to raise short-term interest rates toward more historically normal levels. This policy change was expected to affect investor sentiment, U.S. Treasury yield behavior, relative currency values, inflation expectations, and corporate costs and earnings.
This Fed-centric outlook didn’t fully account for global factors, which ultimately drove sentiment, volatility, and performance during the reporting period. During 2015, the primary catalyst was China, where slowing economic growth, currency devaluations, and massive monetary policy easing sent shock waves through the global markets. The Fed ended up delaying (until December 2015) its only small rate hike during the reporting period. Afterward, China-related events repeated in January and early February this year, further delaying Fed action.
Oil was another catalyst—its price collapses devalued entire market sectors and contributed to broad market volatility and negative sentiment. Later, as China and oil appeared to stabilize, Brexit occurred—the unexpected decision by United Kingdom voters to leave the European Union. This produced more shock waves, and altered central bank policies around the world. In this environment, relatively defensive assets performed best for the 12 months, including the stocks of gold-producing companies, utilities, real estate investment trusts (REITs), and long-maturity U.S. Treasury securities.
Looking ahead, we believe the markets face further uncertainty and volatility as they digest Brexit, the Italian bank crisis, China’s economic mysteries, and the U.S. presidential election. Negative interest rates in Europe and Japan represent part of the market’s response to the global macroeconomic climate. These negative rates are suppressing interest rates around the world while driving up the value of the U.S. dollar and U.S. bonds. In a broad sense, stocks also benefit from the central bank stimulus that is driving interest rates into negative territory, and from relative yield advantages as bond yields are pushed lower. It’s an unusual and challenging environment. We appreciate your continued trust in us.
Sincerely,
Jonathan Thomas
President and Chief Executive Officer
American Century Investments
2
| Performance |
| Total Returns as of June 30, 2016 | |||||
| Average Annual Returns | |||||
Ticker Symbol | 1 year | 5 years | 10 years | Inception Date | |
| Investor Class | BIGRX | 1.00% | 10.75% | 5.94% | 12/17/90 |
| S&P 500 Index | — | 3.99% | 12.09% | 7.42% | — |
| Institutional Class | AMGIX | 1.21% | 10.97% | 6.16% | 1/28/98 |
| A Class | AMADX | 12/15/97 | |||
| No sales charge | 0.75% | 10.47% | 5.68% | ||
| With sales charge | -5.04% | 9.17% | 5.06% | ||
| C Class | ACGCX | 0.01% | 9.66% | 4.89% | 6/28/01 |
| R Class | AICRX | 0.52% | 10.20% | 5.42% | 8/29/03 |
Prior to September 4, 2007, the A Class was referred to as the Advisor Class and did not have a front-end sales charge. Performance prior to that date has been adjusted to reflect this charge.
Sales charges include initial sales charges and contingent deferred sales charges (CDSCs), as applicable. A Class shares have a 5.75% maximum initial sales charge and may be subject to a maximum CDSC of 1.00%. C Class shares redeemed within 12 months of purchase are subject to a maximum CDSC of 1.00%. The SEC requires that mutual funds provide performance information net of maximum sales charges in all cases where charges could be applied.
Data presented reflect past performance. Past performance is no guarantee of future results. Current performance may be higher or lower than the performance shown. Total returns for periods less than one year are not annualized. Investment return and principal value will fluctuate, and redemption value may be more or less than original cost. Data assumes reinvestment of dividends and capital gains, and none of the charts reflect the deduction of taxes that a shareholder would pay on fund distributions or the redemption of fund shares. To obtain performance data current to the most recent month end, please call 1-800-345-2021 or visit americancentury.com. For additional information about the fund, please consult the prospectus.
3
| Growth of $10,000 Over 10 Years |
| $10,000 investment made June 30, 2006 |
| Performance for other share classes will vary due to differences in fee structure. |
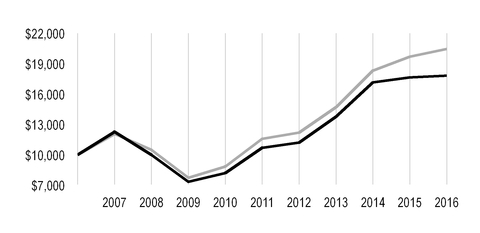
| Value on June 30, 2016 | |
| Investor Class — $17,819 | |
| S&P 500 Index — $20,465 | |
| Total Annual Fund Operating Expenses | ||||
| Investor Class | Institutional Class | A Class | C Class | R Class |
| 0.67% | 0.47% | 0.92% | 1.67% | 1.17% |
The total annual fund operating expenses shown is as stated in the fund’s prospectus current as of the date of this report. The prospectus may vary from the expense ratio shown elsewhere in this report because it is based on a different time period, includes acquired fund fees and expenses, and, if applicable, does not include fee waivers or expense reimbursements.
Data presented reflect past performance. Past performance is no guarantee of future results. Current performance may be higher or lower than the performance shown. Total returns for periods less than one year are not annualized. Investment return and principal value will fluctuate, and redemption value may be more or less than original cost. Data assumes reinvestment of dividends and capital gains, and none of the charts reflect the deduction of taxes that a shareholder would pay on fund distributions or the redemption of fund shares. To obtain performance data current to the most recent month end, please call 1-800-345-2021 or visit americancentury.com. For additional information about the fund, please consult the prospectus.
4
| Portfolio Commentary |
Portfolio Managers: Brian Garbe and Claudia Musat
Performance Summary
Income & Growth returned 1.00%* for the fiscal year ended June 30, 2016, compared with the 3.99% return of its benchmark, the S&P 500 Index.
Income & Growth produced gains for the 12-month period, but was unable to match the return of its benchmark, the S&P 500 Index. Security selection in the industrials, information technology, and consumer discretionary sectors detracted from fund results, while financials sector holdings and positioning in the telecommunication services sector contributed to relative performance.
Income & Growth’s stock selection process incorporates factors of valuation, quality, growth, and sentiment (with a valuation tilt), while striving to minimize unintended risks along industries and other risk characteristics. Within the fund, valuation-based insights were detrimental to selection results, while quality, growth and sentiment factors were marginally positive.
Industrials Sector Led Relative Detractors
Underperformance among industrials sector holdings came from a number of industries but was most prominently focused in machinery, where stock selection and an overweight detracted from the fund’s relative gains. A notable holding that hampered results was Cummins, a portfolio overweight relative to the benchmark. The company’s stock was weakened due to a slowdown in demand for its products, which led the diesel engine manufacturer to announce restructuring plans and reduce its full-year outlook, and we subsequently exited the position.
Information technology was also an area of weakness, led by declines in SeagateTechnology. The hard drive and data storage maker’s stock fell on lower-than-expected first-quarter results. Continued softness in PC sales drove the company’s performance and caused management to lower future guidance. We continue to favor the holding based on its strong valuation and quality profiles. The fund’s underweight positions in internet giant Alphabet, the parent company of Google, and social networking company Facebook negatively impacted results as both appreciated strongly during the period on substantial growth in mobile advertising revenues as users increasingly migrated to mobile platforms. We increased our exposure to both names during the year based on improvement across most factors.
The consumer discretionary sector’s underperformance came largely from our underweight in Amazon.com, whose stock reached new highs during the year as the internet retailer continued to generate strong growth in its core marketplace division as well as in online cloud computing services. Our positioning is supported by weak valuation and sentiment measures. Elsewhere, several health care stocks dampened fund returns including an overweight position in Biogen, a biopharmaceutical holding. The company announced disappointing revenues and lowered earnings guidance for 2015 as a result of declining sales of Tecfidera, its multiple sclerosis treatment, which led to steep drop in the holding's share price. Nevertheless, we believe the holding’s attractive valuation and growth characteristics support our positioning.
* All fund returns referenced in this commentary are for Investor Class shares. Performance for other share classes will vary due to differences in fee structure; when Investor Class performance exceeds that of the fund's benchmark, other share classes may not. See page 3 for returns for all share classes.
5
Financials Sector Holdings Bolstered Results
Stock choices in the financials sector, particularly among real estate investment trusts (REITs), contributed to the fund’s relative gains. An overweight position in self-storage facilities operator Public Storage aided fund results as the company’s share price climbed on high occupancy levels and increasing rental income per occupied square foot. Mid-American Apartment Communities, a REIT focusing primarily on multi-family homes, gained on strength in the rental market as occupancy rates continued to fall while rents rose. We opted to lock in gains and exited our investments in both holdings. Weyerhaeuser, a company specializing in timber and wood products, advanced on its acquisition of an industry peer to create the largest timber company in the U.S.
An overweight position in AT&T aided the fund’s results as the telecommunications giant’s stock advanced on solid revenue growth from new customers in its and DIRECTV segments. Elsewhere, individual contribution stemmed from not owning energy infrastructure company Kinder Morgan as its share price fell steeply during the first half of the period on declining oil prices.
A Look Ahead
At period-end, consumer staples was the fund’s largest overweight position on a sector basis. There, we are finding opportunities in household goods manufacturers. The information technology sector is also a key overweight. After the dramatic sell-off in 2015, health care names, particularly in the biotech space, are compelling based on valuation factors. Growth and quality metrics also are favorable. The financials sector, a leading portfolio underweight, continues to face challenges, in our opinion, and we find that diversified financial services firms are challenged across virtually all dimensions. The industrials and energy sectors also represent key underweights, relative to the benchmark. Our disciplined, objective, and systematic investment strategy is designed to take advantage of opportunities at the individual company level. We believe this approach is the most powerful way to capitalize on market inefficiencies that lead to the mispricing of individual stocks. Our strategy is designed to provide broad U.S. equity market exposure with strong current income and exceptional risk management.
6
| Fund Characteristics |
| JUNE 30, 2016 | |
| Top Ten Holdings | % of net assets |
| Microsoft Corp. | 3.0% |
| Apple, Inc. | 2.8% |
| Johnson & Johnson | 2.8% |
| AT&T, Inc. | 2.5% |
| Procter & Gamble Co. (The) | 2.1% |
| Verizon Communications, Inc. | 2.0% |
| Pfizer, Inc. | 2.0% |
| Alphabet, Inc.* | 1.7% |
| Exxon Mobil Corp. | 1.7% |
| Cisco Systems, Inc. | 1.7% |
| *Includes all classes of the issuer held by the fund. | |
| Top Five Industries | % of net assets |
| Pharmaceuticals | 6.6% |
| Technology Hardware, Storage and Peripherals | 6.0% |
| Software | 5.4% |
| Semiconductors and Semiconductor Equipment | 5.1% |
| Biotechnology | 4.5% |
| Types of Investments in Portfolio | % of net assets |
| Common Stocks | 99.0% |
| Temporary Cash Investments | 1.0% |
| Other Assets and Liabilities | —** |
**Category is less than 0.05% of total net assets.
7
| Shareholder Fee Example |
Fund shareholders may incur two types of costs: (1) transaction costs, including sales charges (loads) on purchase payments and redemption/exchange fees; and (2) ongoing costs, including management fees; distribution and service (12b-1) fees; and other fund expenses. This example is intended to help you understand your ongoing costs (in dollars) of investing in your fund and to compare these costs with the ongoing cost of investing in other mutual funds.
The example is based on an investment of $1,000 made at the beginning of the period and held for the entire period from January 1, 2016 to June 30, 2016.
Actual Expenses
The table provides information about actual account values and actual expenses for each class. You may use the information, together with the amount you invested, to estimate the expenses that you paid over the period. First, identify the share class you own. Then simply divide your account value by $1,000 (for example, an $8,600 account value divided by $1,000 = 8.6), then multiply the result by the number under the heading “Expenses Paid During Period” to estimate the expenses you paid on your account during this period.
If you hold Investor Class shares of any American Century Investments fund, or Institutional Class shares of the American Century Diversified Bond Fund, in an American Century Investments account (i.e., not a financial intermediary or retirement plan account), American Century Investments may charge you a $12.50 semiannual account maintenance fee if the value of those shares is less than $10,000. We will redeem shares automatically in one of your accounts to pay the $12.50 fee. In determining your total eligible investment amount, we will include your investments in all personal accounts (including American Century Investments Brokerage accounts) registered under your Social Security number. Personal accounts include individual accounts, joint accounts, UGMA/UTMA accounts, personal trusts, Coverdell Education Savings Accounts and IRAs (including traditional, Roth, Rollover, SEP-, SARSEP- and SIMPLE-IRAs), and certain other retirement accounts. If you have only business, business retirement, employer-sponsored or American Century Investments Brokerage accounts, you are currently not subject to this fee. If you are subject to the Account Maintenance Fee, your account value could be reduced by the fee amount.
Hypothetical Example for Comparison Purposes
The table also provides information about hypothetical account values and hypothetical expenses based on the actual expense ratio of each class of your fund and an assumed rate of return of 5% per year before expenses, which is not the actual return of a fund’s share class. The hypothetical account values and expenses may not be used to estimate the actual ending account balance or expenses you paid for the period. You may use this information to compare the ongoing costs of investing in your fund and other funds. To do so, compare this 5% hypothetical example with the 5% hypothetical examples that appear in the shareholder reports of the other funds.
Please note that the expenses shown in the table are meant to highlight your ongoing costs only and do not reflect any transactional costs, such as sales charges (loads) or redemption/exchange fees. Therefore, the table is useful in comparing ongoing costs only, and will not help you determine the relative total costs of owning different funds. In addition, if these transactional costs were included, your costs would have been higher.
8
| Beginning Account Value 1/1/16 | Ending Account Value 6/30/16 | Expenses Paid During Period(1) 1/1/16 - 6/30/16 | Annualized Expense Ratio(1) | |
| Actual | ||||
| Investor Class | $1,000 | $1,050.00 | $3.47 | 0.68% |
| Institutional Class | $1,000 | $1,051.20 | $2.45 | 0.48% |
| A Class | $1,000 | $1,048.80 | $4.74 | 0.93% |
| C Class | $1,000 | $1,045.10 | $8.54 | 1.68% |
| R Class | $1,000 | $1,047.50 | $6.01 | 1.18% |
| Hypothetical | ||||
| Investor Class | $1,000 | $1,021.48 | $3.42 | 0.68% |
| Institutional Class | $1,000 | $1,022.48 | $2.41 | 0.48% |
| A Class | $1,000 | $1,020.24 | $4.67 | 0.93% |
| C Class | $1,000 | $1,016.51 | $8.42 | 1.68% |
| R Class | $1,000 | $1,019.00 | $5.92 | 1.18% |
| (1) | Expenses are equal to the class's annualized expense ratio listed in the table above, multiplied by the average account value over the period, multiplied by 182, the number of days in the most recent fiscal half-year, divided by 366, to reflect the one-half year period. |
9
| Schedule of Investments |
JUNE 30, 2016
| Shares | Value | |||
| COMMON STOCKS — 99.0% | ||||
| Aerospace and Defense — 1.5% | ||||
| Boeing Co. (The) | 180,385 | $ | 23,426,600 | |
| Honeywell International, Inc. | 40,627 | 4,725,733 | ||
| 28,152,333 | ||||
| Air Freight and Logistics — 0.4% | ||||
| United Parcel Service, Inc., Class B | 78,366 | 8,441,586 | ||
| Automobiles — 1.3% | ||||
| Ford Motor Co. | 1,523,847 | 19,154,757 | ||
| General Motors Co. | 215,950 | 6,111,385 | ||
| 25,266,142 | ||||
| Banks — 2.8% | ||||
| Citigroup, Inc. | 22,973 | 973,825 | ||
| JPMorgan Chase & Co. | 401,031 | 24,920,066 | ||
| SunTrust Banks, Inc. | 437,369 | 17,967,119 | ||
| Wells Fargo & Co. | 187,739 | 8,885,687 | ||
| 52,746,697 | ||||
| Beverages — 3.2% | ||||
| Coca-Cola Co. (The) | 507,387 | 22,999,853 | ||
| Dr Pepper Snapple Group, Inc. | 78,811 | 7,615,507 | ||
| PepsiCo, Inc. | 290,100 | 30,733,194 | ||
| 61,348,554 | ||||
| Biotechnology — 4.5% | ||||
| AbbVie, Inc. | 451,566 | 27,956,451 | ||
| Amgen, Inc. | 176,704 | 26,885,514 | ||
Biogen, Inc.(1) | 22,520 | 5,445,786 | ||
| Gilead Sciences, Inc. | 309,577 | 25,824,913 | ||
| 86,112,664 | ||||
| Capital Markets — 1.2% | ||||
| BGC Partners, Inc., Class A | 456,868 | 3,979,320 | ||
| Eaton Vance Corp. | 287,849 | 10,172,584 | ||
| WisdomTree Investments, Inc. | 936,175 | 9,165,153 | ||
| 23,317,057 | ||||
| Chemicals — 3.6% | ||||
| Air Products & Chemicals, Inc. | 129,588 | 18,406,680 | ||
| Dow Chemical Co. (The) | 391,393 | 19,456,146 | ||
| Eastman Chemical Co. | 206,506 | 14,021,757 | ||
| PPG Industries, Inc. | 157,073 | 16,359,153 | ||
| 68,243,736 | ||||
| Communications Equipment — 1.7% | ||||
| Cisco Systems, Inc. | 1,123,205 | 32,224,752 | ||
| Consumer Finance — 1.0% | ||||
| American Express Co. | 177,255 | 10,770,014 | ||
| Discover Financial Services | 149,063 | 7,988,286 | ||
| 18,758,300 | ||||
| Containers and Packaging — 1.6% | ||||
| Avery Dennison Corp. | 168,771 | 12,615,632 | ||
10
| Shares | Value | |||
| International Paper Co. | 407,983 | $ | 17,290,320 | |
| 29,905,952 | ||||
| Diversified Financial Services — 0.6% | ||||
Berkshire Hathaway, Inc., Class B(1) | 85,040 | 12,312,942 | ||
| Diversified Telecommunication Services — 4.5% | ||||
| AT&T, Inc. | 1,071,404 | 46,295,367 | ||
| Verizon Communications, Inc. | 700,255 | 39,102,239 | ||
| 85,397,606 | ||||
| Electric Utilities — 1.4% | ||||
| FirstEnergy Corp. | 402,227 | 14,041,745 | ||
| PPL Corp. | 342,236 | 12,919,409 | ||
| 26,961,154 | ||||
| Energy Equipment and Services — 0.9% | ||||
| Helmerich & Payne, Inc. | 140,653 | 9,442,036 | ||
| Noble Corp. plc | 822,246 | 6,775,307 | ||
| Oceaneering International, Inc. | 39,241 | 1,171,736 | ||
| 17,389,079 | ||||
| Food and Staples Retailing — 1.6% | ||||
| Wal-Mart Stores, Inc. | 414,030 | 30,232,471 | ||
| Food Products — 2.9% | ||||
| Campbell Soup Co. | 132,302 | 8,802,052 | ||
| General Mills, Inc. | 302,988 | 21,609,104 | ||
| Hershey Co. (The) | 64,232 | 7,289,690 | ||
| Hormel Foods Corp. | 286,900 | 10,500,540 | ||
| Tyson Foods, Inc., Class A | 112,606 | 7,520,955 | ||
| 55,722,341 | ||||
| Health Care Equipment and Supplies — 4.2% | ||||
| Abbott Laboratories | 506,285 | 19,902,063 | ||
| C.R. Bard, Inc. | 6,713 | 1,578,629 | ||
| Medtronic plc | 313,420 | 27,195,454 | ||
| ResMed, Inc. | 241,369 | 15,261,762 | ||
| St. Jude Medical, Inc. | 213,453 | 16,649,334 | ||
| 80,587,242 | ||||
| Health Care Providers and Services — 0.9% | ||||
| AmerisourceBergen Corp. | 206,872 | 16,409,087 | ||
| Hotels, Restaurants and Leisure — 2.5% | ||||
| Carnival Corp. | 340,207 | 15,037,149 | ||
| Darden Restaurants, Inc. | 266,374 | 16,872,129 | ||
| McDonald's Corp. | 59,493 | 7,159,388 | ||
| Yum! Brands, Inc. | 116,522 | 9,662,004 | ||
| 48,730,670 | ||||
| Household Durables — 1.7% | ||||
| Garmin Ltd. | 420,977 | 17,857,844 | ||
| Tupperware Brands Corp. | 273,550 | 15,395,394 | ||
| 33,253,238 | ||||
| Household Products — 3.7% | ||||
| Clorox Co. (The) | 77,535 | 10,730,069 | ||
| Kimberly-Clark Corp. | 147,894 | 20,332,467 | ||
| Procter & Gamble Co. (The) | 470,950 | 39,875,336 | ||
| 70,937,872 | ||||
11
| Shares | Value | |||
| Industrial Conglomerates — 2.2% | ||||
| 3M Co. | 145,592 | $ | 25,496,071 | |
| General Electric Co. | 515,607 | 16,231,308 | ||
| 41,727,379 | ||||
| Insurance — 1.7% | ||||
| Aflac, Inc. | 140,451 | 10,134,944 | ||
| Prudential Financial, Inc. | 251,600 | 17,949,144 | ||
| Unum Group | 129,933 | 4,130,570 | ||
| 32,214,658 | ||||
| Internet and Catalog Retail — 0.8% | ||||
Amazon.com, Inc.(1) | 20,401 | 14,599,364 | ||
| Internet Software and Services — 2.3% | ||||
Alphabet, Inc., Class A(1) | 29,849 | 20,999,667 | ||
Alphabet, Inc., Class C(1) | 16,900 | 11,696,490 | ||
Facebook, Inc., Class A(1) | 104,412 | 11,932,203 | ||
| 44,628,360 | ||||
| IT Services — 1.9% | ||||
| International Business Machines Corp. | 208,802 | 31,691,968 | ||
| Western Union Co. (The) | 296,264 | 5,682,343 | ||
| 37,374,311 | ||||
| Leisure Products — 0.8% | ||||
| Mattel, Inc. | 482,409 | 15,094,578 | ||
| Machinery — 2.2% | ||||
| Illinois Tool Works, Inc. | 27,990 | 2,915,438 | ||
| PACCAR, Inc. | 328,375 | 17,032,811 | ||
| Stanley Black & Decker, Inc. | 152,459 | 16,956,490 | ||
| Timken Co. (The) | 173,110 | 5,307,553 | ||
| 42,212,292 | ||||
| Media — 2.0% | ||||
| Comcast Corp., Class A | 9,363 | 610,374 | ||
| Time Warner, Inc. | 272,660 | 20,051,416 | ||
| Viacom, Inc., Class B | 398,027 | 16,506,180 | ||
| Walt Disney Co. (The) | 14,651 | 1,433,161 | ||
| 38,601,131 | ||||
| Metals and Mining — 0.9% | ||||
| Nucor Corp. | 330,109 | 16,310,686 | ||
| Reliance Steel & Aluminum Co. | 17,636 | 1,356,208 | ||
| 17,666,894 | ||||
Multi-Utilities† | ||||
| CenterPoint Energy, Inc. | 29,197 | 700,728 | ||
| Multiline Retail — 1.0% | ||||
| Target Corp. | 268,511 | 18,747,438 | ||
| Oil, Gas and Consumable Fuels — 3.8% | ||||
| Apache Corp. | 33,190 | 1,847,687 | ||
| Chevron Corp. | 126,603 | 13,271,793 | ||
| Enbridge, Inc. | 175,964 | 7,453,835 | ||
| Exxon Mobil Corp. | 346,554 | 32,485,972 | ||
| Occidental Petroleum Corp. | 9,140 | 690,618 | ||
| Valero Energy Corp. | 318,224 | 16,229,424 | ||
| 71,979,329 | ||||
12
| Shares | Value | |||
| Pharmaceuticals — 6.6% | ||||
| Eli Lilly & Co. | 36,384 | $ | 2,865,240 | |
| Johnson & Johnson | 435,160 | 52,784,908 | ||
| Merck & Co., Inc. | 555,746 | 32,016,527 | ||
| Pfizer, Inc. | 1,107,714 | 39,002,610 | ||
| 126,669,285 | ||||
| Real Estate Investment Trusts (REITs) — 4.4% | ||||
| CBL & Associates Properties, Inc. | 182,170 | 1,696,003 | ||
| Corporate Office Properties Trust | 341,824 | 10,107,735 | ||
| Equity Residential | 164,934 | 11,360,654 | ||
| Hospitality Properties Trust | 377,546 | 10,873,325 | ||
| Liberty Property Trust | 459,574 | 18,254,279 | ||
| Select Income REIT | 270,824 | 7,038,716 | ||
| Ventas, Inc. | 100,196 | 7,296,273 | ||
| Weyerhaeuser Co. | 81,896 | 2,438,044 | ||
| WP Carey, Inc. | 218,263 | 15,151,817 | ||
| 84,216,846 | ||||
| Semiconductors and Semiconductor Equipment — 5.1% | ||||
| Analog Devices, Inc. | 152,069 | 8,613,188 | ||
| Applied Materials, Inc. | 706,835 | 16,942,835 | ||
| Intel Corp. | 956,289 | 31,366,279 | ||
| Intersil Corp., Class A | 204,719 | 2,771,895 | ||
| QUALCOMM, Inc. | 452,040 | 24,215,783 | ||
| Teradyne, Inc. | 657,458 | 12,945,348 | ||
| 96,855,328 | ||||
| Software — 5.4% | ||||
| CA, Inc. | 560,156 | 18,389,921 | ||
| Microsoft Corp. | 1,106,176 | 56,603,026 | ||
| Oracle Corp. | 677,334 | 27,723,281 | ||
| 102,716,228 | ||||
| Specialty Retail — 1.1% | ||||
| American Eagle Outfitters, Inc. | 885,411 | 14,104,597 | ||
| Williams-Sonoma, Inc. | 149,986 | 7,818,770 | ||
| 21,923,367 | ||||
| Technology Hardware, Storage and Peripherals — 6.0% | ||||
| Apple, Inc. | 561,313 | 53,661,523 | ||
| EMC Corp. | 611,169 | 16,605,462 | ||
| HP, Inc. | 1,220,037 | 15,311,464 | ||
| NetApp, Inc. | 584,854 | 14,381,560 | ||
| Seagate Technology plc | 596,012 | 14,518,852 | ||
| 114,478,861 | ||||
| Tobacco — 3.1% | ||||
| Altria Group, Inc. | 421,546 | 29,069,812 | ||
| Philip Morris International, Inc. | 301,590 | 30,677,735 | ||
| 59,747,547 | ||||
TOTAL COMMON STOCKS (Cost $1,534,799,559) | 1,894,605,399 | |||
| TEMPORARY CASH INVESTMENTS — 1.0% | ||||
| Repurchase Agreement, Fixed Income Clearing Corp., (collateralized by various U.S. Treasury obligations, 3.625%, 8/15/43, valued at $19,532,500), at 0.20%, dated 6/30/16, due 7/1/16 (Delivery value $19,144,106) | 19,144,000 | |||
13
| Shares | Value | |||
| State Street Institutional Liquid Reserves Fund, Premier Class | 12,579 | $ | 12,579 | |
TOTAL TEMPORARY CASH INVESTMENTS (Cost $19,156,579) | 19,156,579 | |||
TOTAL INVESTMENT SECURITIES — 100.0% (Cost $1,553,956,138) | 1,913,761,978 | |||
OTHER ASSETS AND LIABILITIES† | 940,997 | |||
| TOTAL NET ASSETS — 100.0% | $ | 1,914,702,975 | ||
| NOTES TO SCHEDULE OF INVESTMENTS | ||
| † | Category is less than 0.05% of total net assets. |
| (1) | Non-income producing. |
See Notes to Financial Statements.
14
| Statement of Assets and Liabilities |
| JUNE 30, 2016 | |||
| Assets | |||
| Investment securities, at value (cost of $1,553,956,138) | $ | 1,913,761,978 | |
| Cash | 75,144 | ||
| Receivable for capital shares sold | 490,892 | ||
| Dividends and interest receivable | 3,235,303 | ||
| 1,917,563,317 | |||
| Liabilities | |||
| Payable for capital shares redeemed | 1,718,046 | ||
| Accrued management fees | 1,014,344 | ||
| Distribution and service fees payable | 56,896 | ||
| Accrued other expenses | 71,056 | ||
| 2,860,342 | |||
| Net Assets | $ | 1,914,702,975 | |
| Net Assets Consist of: | |||
| Capital (par value and paid-in surplus) | $ | 1,576,572,835 | |
| Undistributed net investment income | 898,525 | ||
| Accumulated net realized loss | (22,574,225 | ) | |
| Net unrealized appreciation | 359,805,840 | ||
| $ | 1,914,702,975 | ||
| Net Assets | Shares Outstanding | Net Asset Value Per Share | ||||
| Investor Class, $0.01 Par Value | $1,551,663,828 | 45,752,729 | $33.91 | |||
| Institutional Class, $0.01 Par Value | $127,625,535 | 3,759,259 | $33.95 | |||
| A Class, $0.01 Par Value | $205,389,594 | 6,063,686 | $33.87* | |||
| C Class, $0.01 Par Value | $6,734,389 | 199,131 | $33.82 | |||
| R Class, $0.01 Par Value | $23,289,629 | 686,886 | $33.91 | |||
*Maximum offering price $35.94 (net asset value divided by 0.9425).
See Notes to Financial Statements.
15
| Statement of Operations |
| YEAR ENDED JUNE 30, 2016 | |||
| Investment Income (Loss) | |||
| Income: | |||
| Dividends (net of foreign taxes withheld of $104,034) | $ | 58,419,263 | |
| Interest | 15,228 | ||
| 58,434,491 | |||
| Expenses: | |||
| Management fees | 12,378,190 | ||
| Distribution and service fees: | |||
| A Class | 536,430 | ||
| C Class | 74,152 | ||
| R Class | 93,595 | ||
| Directors' fees and expenses | 111,517 | ||
| Other expenses | 74,372 | ||
| 13,268,256 | |||
| Net investment income (loss) | 45,166,235 | ||
| Realized and Unrealized Gain (Loss) | |||
| Net realized gain (loss) on investment transactions | (20,226,396 | ) | |
| Change in net unrealized appreciation (depreciation) on investments | (11,671,361 | ) | |
| Net realized and unrealized gain (loss) | (31,897,757 | ) | |
| Net Increase (Decrease) in Net Assets Resulting from Operations | $ | 13,268,478 | |
See Notes to Financial Statements.
16
| Statement of Changes in Net Assets |
| YEARS ENDED JUNE 30, 2016 AND JUNE 30, 2015 | ||||||
| Increase (Decrease) in Net Assets | June 30, 2016 | June 30, 2015 | ||||
| Operations | ||||||
| Net investment income (loss) | $ | 45,166,235 | $ | 43,841,371 | ||
| Net realized gain (loss) | (20,226,396 | ) | 207,611,599 | |||
| Change in net unrealized appreciation (depreciation) | (11,671,361 | ) | (190,785,796 | ) | ||
| Net increase (decrease) in net assets resulting from operations | 13,268,478 | 60,667,174 | ||||
| Distributions to Shareholders | ||||||
| From net investment income: | ||||||
| Investor Class | (38,365,924 | ) | (35,776,708 | ) | ||
| Institutional Class | (3,238,375 | ) | (2,466,264 | ) | ||
| A Class | (4,767,828 | ) | (4,447,473 | ) | ||
| C Class | (107,495 | ) | (75,024 | ) | ||
| R Class | (385,565 | ) | (100,753 | ) | ||
| From net realized gains: | ||||||
| Investor Class | (97,868,677 | ) | (90,387,647 | ) | ||
| Institutional Class | (7,414,764 | ) | (5,069,239 | ) | ||
| A Class | (13,620,564 | ) | (12,936,597 | ) | ||
| C Class | (493,788 | ) | (345,108 | ) | ||
| R Class | (1,181,595 | ) | (310,610 | ) | ||
| Decrease in net assets from distributions | (167,444,575 | ) | (151,915,423 | ) | ||
| Capital Share Transactions | ||||||
| Net increase (decrease) in net assets from capital share transactions (Note 5) | 23,941,525 | 97,184,450 | ||||
| Net increase (decrease) in net assets | (130,234,572 | ) | 5,936,201 | |||
| Net Assets | ||||||
| Beginning of period | 2,044,937,547 | 2,039,001,346 | ||||
| End of period | $ | 1,914,702,975 | $ | 2,044,937,547 | ||
| Undistributed net investment income | $ | 898,525 | $ | 2,695,063 | ||
See Notes to Financial Statements.
17
| Notes to Financial Statements |
JUNE 30, 2016
1. Organization
American Century Quantitative Equity Funds, Inc. (the corporation) is registered under the Investment Company Act of 1940, as amended (the 1940 Act), as an open-end management investment company and is organized as a Maryland corporation. Income & Growth Fund (the fund) is one fund in a series issued by the corporation. The fund’s investment objective is to seek long-term capital growth by investing in common stocks. Income is a secondary objective.
The fund offers the Investor Class, the Institutional Class, the A Class, the C Class and the R Class. The A Class may incur an initial sales charge. The A Class and C Class may be subject to a contingent deferred sales charge. The share classes differ principally in their respective sales charges and distribution and shareholder servicing expenses and arrangements. The Institutional Class is made available to institutional shareholders or through financial intermediaries whose clients do not require the same level of shareholder and administrative services as shareholders of other classes. As a result, the Institutional Class is charged a lower unified management fee.
2. Significant Accounting Policies
The following is a summary of significant accounting policies consistently followed by the fund in preparation of its financial statements. The fund is an investment company and follows accounting and reporting guidance in accordance with accounting principles generally accepted in the United States of America. This may require management to make certain estimates and assumptions at the date of the financial statements. Actual results could differ from these estimates. Management evaluated the impact of events or transactions occurring through the date the financial statements were issued that would merit recognition or disclosure.
Investment Valuations — The fund determines the fair value of its investments and computes its net asset value per share at the close of regular trading (usually 4 p.m. Eastern time) on the New York Stock Exchange (NYSE) on each day the NYSE is open. The Board of Directors has adopted valuation policies and procedures to guide the investment advisor in the fund’s investment valuation process and to provide methodologies for the oversight of the fund’s pricing function.
Equity securities that are listed or traded on a domestic securities exchange are valued at the last reported sales price or at the official closing price as provided by the exchange. Equity securities traded on foreign securities exchanges are generally valued at the closing price of such securities on the exchange where primarily traded or at the close of the NYSE, if that is earlier. If no last sales price is reported, or if local convention or regulation so provides, the mean of the latest bid and asked prices may be used. Securities traded over-the-counter are valued at the mean of the latest bid and asked prices, the last sales price, or the official closing price.
Open-end management investment companies are valued at the reported net asset value per share. Repurchase agreements are valued at cost, which approximates fair value.
If the fund determines that the market price for an investment is not readily available or the valuation methods mentioned above do not reflect an investment’s fair value, such investment is valued as determined in good faith by the Board of Directors or its delegate, in accordance with policies and procedures adopted by the Board of Directors. In its determination of fair value, the fund may review several factors including, but not limited to, market information regarding the specific investment or comparable investments and correlation with other investment types, futures indices or general market indicators. Circumstances that may cause the fund to use these procedures to value an investment include, but are not limited to: an investment has been declared in default or is distressed; trading in a security has been suspended during the trading day or a security is not actively trading on its principal exchange; prices received from a regular pricing source are deemed unreliable; or there is a foreign market holiday and no trading occurred.
The fund monitors for significant events occurring after the close of an investment’s primary exchange but before the fund’s net asset value per share is determined. Significant events may include, but are not limited to: corporate announcements and transactions; governmental action and political unrest that could impact a specific investment or an investment sector; or armed conflicts, natural disasters and similar events that could affect investments in a specific country or region. The fund also monitors for significant fluctuations between
18
domestic and foreign markets, as evidenced by the U.S. market or such other indicators that the Board of Directors, or its delegate, deems appropriate. If significant fluctuations in foreign markets are identified, the fund may apply a model-derived factor to the closing price of equity securities traded on foreign securities exchanges. The factor is based on observable market data as provided by an independent pricing service.
Security Transactions — Security transactions are accounted for as of the trade date. Net realized gains and losses are determined on the identified cost basis, which is also used for federal income tax purposes.
Investment Income — Dividend income less foreign taxes withheld, if any, is recorded as of the ex-dividend date. Distributions received on securities that represent a return of capital or long-term capital gain are recorded as a reduction of cost of investments and/or as a realized gain. The fund may estimate the components of distributions received that may be considered nontaxable distributions or long-term capital gain distributions for income tax purposes. Interest income is recorded on the accrual basis and includes accretion of discounts and amortization of premiums.
Repurchase Agreements — The fund may enter into repurchase agreements with institutions that American Century Investment Management, Inc. (ACIM) (the investment advisor) has determined are creditworthy pursuant to criteria adopted by the Board of Directors. The fund requires that the collateral, represented by securities, received in a repurchase transaction be transferred to the custodian in a manner sufficient to enable the fund to obtain those securities in the event of a default under the repurchase agreement. ACIM monitors, on a daily basis, the securities transferred to ensure the value, including accrued interest, of the securities under each repurchase agreement is equal to or greater than amounts owed to the fund under each repurchase agreement.
Joint Trading Account — Pursuant to an Exemptive Order issued by the Securities and Exchange Commission, the fund, along with certain other funds in the American Century Investments family of funds, may transfer uninvested cash balances into a joint trading account. These balances are invested in one or more repurchase agreements that are collateralized by U.S. Treasury or Agency obligations.
Income Tax Status — It is the fund’s policy to distribute substantially all net investment income and net realized gains to shareholders and to otherwise qualify as a regulated investment company under provisions of the Internal Revenue Code. Accordingly, no provision has been made for income taxes. The fund files U.S. federal, state, local and non-U.S. tax returns as applicable. The fund's tax returns are subject to examination by the relevant taxing authority until expiration of the applicable statute of limitations, which is generally three years from the date of filing but can be longer in certain jurisdictions. At this time, management believes there are no uncertain tax positions which, based on their technical merit, would not be sustained upon examination and for which it is reasonably possible that the total amounts of unrecognized tax benefits will significantly change in the next twelve months.
Multiple Class — All shares of the fund represent an equal pro rata interest in the net assets of the class to which such shares belong, and have identical voting, dividend, liquidation and other rights and the same terms and conditions, except for class specific expenses and exclusive rights to vote on matters affecting only individual classes. Income, non-class specific expenses, and realized and unrealized capital gains and losses of the fund are allocated to each class of shares based on their relative net assets.
Distributions to Shareholders — Distributions from net investment income, if any, are generally declared and paid quarterly. Distributions from net realized gains, if any, are generally declared and paid annually.
Indemnifications — Under the corporation’s organizational documents, its officers and directors are indemnified against certain liabilities arising out of the performance of their duties to the fund. In addition, in the normal course of business, the fund enters into contracts that provide general indemnifications. The maximum exposure under these arrangements is unknown as this would involve future claims that may be made against a fund. The risk of material loss from such claims is considered by management to be remote.
19
3. Fees and Transactions with Related Parties
Certain officers and directors of the corporation are also officers and/or directors of American Century Companies, Inc. (ACC). The corporation’s investment advisor, ACIM, the corporation's distributor, American Century Investment Services, Inc. (ACIS), and the corporation’s transfer agent, American Century Services, LLC, are wholly owned, directly or indirectly, by ACC.
Management Fees — The corporation has entered into a management agreement with ACIM, under which ACIM provides the fund with investment advisory and management services in exchange for a single, unified management fee (the fee) per class. The agreement provides that all expenses of managing and operating the fund, except distribution and service fees, brokerage expenses, taxes, interest, fees and expenses of the independent directors (including legal counsel fees), and extraordinary expenses, will be paid by ACIM. The fee is computed and accrued daily based on each class's daily net assets and paid monthly in arrears. The fee consists of (1) an Investment Category Fee based on the daily net assets of the fund and certain other accounts managed by the investment advisor that are in the same broad investment category as the fund and (2) a Complex Fee based on the assets of all the funds in the American Century Investments family of funds. The rates for the Investment Category Fee range from 0.3380% to 0.5200%. The rates for the Complex Fee range from 0.2500% to 0.3100% for the Investor Class, A Class, C Class and R Class. The rates for the Complex Fee range from 0.0500% to 0.1100% for the Institutional Class. The effective annual management fee for each class for the year ended June 30, 2016 was 0.67% for the Investor Class, A Class, C Class and R Class and 0.47% for the Institutional Class.
Distribution and Service Fees — The Board of Directors has adopted a separate Master Distribution and Individual Shareholder Services Plan for each of the A Class, C Class and R Class (collectively the plans), pursuant to Rule 12b-1 of the 1940 Act. The plans provide that the A Class will pay ACIS an annual distribution and service fee of 0.25%. The plans provide that the C Class will pay ACIS an annual distribution and service fee of 1.00%, of which 0.25% is paid for individual shareholder services and 0.75% is paid for distribution services. The plans provide that the R Class will pay ACIS an annual distribution and service fee of 0.50%. The fees are computed and accrued daily based on each class’s daily net assets and paid monthly in arrears. The fees are used to pay financial intermediaries for distribution and individual shareholder services. Fees incurred under the plans during the year ended June 30, 2016 are detailed in the Statement of Operations.
Directors' Fees and Expenses — The Board of Directors is responsible for overseeing the investment advisor’s management and operations of the fund. The directors receive detailed information about the fund and its investment advisor regularly throughout the year, and meet at least quarterly with management of the investment advisor to review reports about fund operations. The fund’s officers do not receive compensation from the fund.
Interfund Transactions — The fund may enter into security transactions with other American Century Investments funds and other client accounts of the investment advisor, in accordance with the 1940 Act rules and procedures adopted by the Board of Directors. The rules and procedures require, among other things, that these transactions be effected at the independent current market price of the security. During the period, the interfund purchases and sales were $2,206,880 and $24,736,424, respectively.
4. Investment Transactions
Purchases and sales of investment securities, excluding short-term investments, for the year ended June 30, 2016 were $1,485,497,323 and $1,582,913,465, respectively.
20
5. Capital Share Transactions
Transactions in shares of the fund were as follows:
| Year ended June 30, 2016 | Year ended June 30, 2015 | |||||||||
| Shares | Amount | Shares | Amount | |||||||
| Investor Class/Shares Authorized | 300,000,000 | 300,000,000 | ||||||||
| Sold | 2,570,316 | $ | 86,770,800 | 4,415,849 | $ | 168,672,622 | ||||
| Issued in reinvestment of distributions | 3,982,081 | 131,051,786 | 3,268,566 | 121,705,253 | ||||||
| Redeemed | (5,812,015 | ) | (196,809,510 | ) | (7,024,223 | ) | (268,686,559 | ) | ||
| 740,382 | 21,013,076 | 660,192 | 21,691,316 | |||||||
| Institutional Class/Shares Authorized | 40,000,000 | 40,000,000 | ||||||||
| Sold | 816,069 | 27,561,359 | 1,560,257 | 59,605,348 | ||||||
| Issued in reinvestment of distributions | 322,790 | 10,642,236 | 201,775 | 7,523,360 | ||||||
| Redeemed | (798,260 | ) | (27,106,046 | ) | (657,649 | ) | (25,123,907 | ) | ||
| 340,599 | 11,097,549 | 1,104,383 | 42,004,801 | |||||||
| A Class/Shares Authorized | 65,000,000 | 65,000,000 | ||||||||
| Sold | 854,433 | 28,620,972 | 1,698,135 | 64,741,039 | ||||||
| Issued in reinvestment of distributions | 530,158 | 17,411,948 | 455,721 | 16,933,109 | ||||||
| Redeemed | (1,840,006 | ) | (62,129,542 | ) | (1,676,829 | ) | (63,966,041 | ) | ||
| (455,415 | ) | (16,096,622 | ) | 477,027 | 17,708,107 | |||||
| C Class/Shares Authorized | 15,000,000 | 20,000,000 | ||||||||
| Sold | 26,445 | 887,112 | 93,204 | 3,538,958 | ||||||
| Issued in reinvestment of distributions | 15,355 | 501,920 | 9,705 | 358,605 | ||||||
| Redeemed | (66,091 | ) | (2,176,535 | ) | (21,226 | ) | (806,570 | ) | ||
| (24,291 | ) | (787,503 | ) | 81,683 | 3,090,993 | |||||
| R Class/Shares Authorized | 20,000,000 | 20,000,000 | ||||||||
| Sold | 375,734 | 12,613,710 | 373,738 | 14,253,451 | ||||||
| Issued in reinvestment of distributions | 18,106 | 594,687 | 10,528 | 390,820 | ||||||
| Redeemed | (132,890 | ) | (4,493,372 | ) | (51,221 | ) | (1,955,038 | ) | ||
| 260,950 | 8,715,025 | 333,045 | 12,689,233 | |||||||
| Net increase (decrease) | 862,225 | $ | 23,941,525 | 2,656,330 | $ | 97,184,450 | ||||
6. Fair Value Measurements
The fund’s investments valuation process is based on several considerations and may use multiple inputs to determine the fair value of the investments held by the fund. In conformity with accounting principles generally accepted in the United States of America, the inputs used to determine a valuation are classified into three broad levels.
| • | Level 1 valuation inputs consist of unadjusted quoted prices in an active market for identical investments. |
| • | Level 2 valuation inputs consist of direct or indirect observable market data (including quoted prices for comparable investments, evaluations of subsequent market events, interest rates, prepayment speeds, credit risk, etc.). These inputs also consist of quoted prices for identical investments initially expressed in local currencies that are adjusted through translation into U.S. dollars. |
| • | Level 3 valuation inputs consist of unobservable data (including a fund’s own assumptions). |
The level classification is based on the lowest level input that is significant to the fair valuation measurement. The valuation inputs are not necessarily an indication of the risks associated with investing in these securities or other financial instruments. There were no significant transfers between levels during the period.
21
The following is a summary of the level classifications as of period end. The Schedule of Investments provides additional information on the fund’s portfolio holdings.
| Level 1 | Level 2 | Level 3 | ||||||
| Assets | ||||||||
| Investment Securities | ||||||||
| Common Stocks | $ | 1,894,605,399 | — | — | ||||
| Temporary Cash Investments | 12,579 | $ | 19,144,000 | — | ||||
| $ | 1,894,617,978 | $ | 19,144,000 | — | ||||
7. Federal Tax Information
The tax character of distributions paid during the years ended June 30, 2016 and June 30, 2015 were as follows:
| 2016 | 2015 | |||||
| Distributions Paid From | ||||||
| Ordinary income | $ | 66,550,057 | $ | 64,654,748 | ||
| Long-term capital gains | $ | 100,894,518 | $ | 87,260,675 | ||
The book-basis character of distributions made during the year from net investment income or net realized gains may differ from their ultimate characterization for federal income tax purposes. These differences reflect the differing character of certain income items and net realized gains and losses for financial statement and tax purposes, and may result in reclassification among certain capital accounts on the financial statements.
As of June 30, 2016, the federal tax cost of investments and the components of distributable earnings on a tax-basis were as follows:
| Federal tax cost of investments | $ | 1,558,366,588 | |
| Gross tax appreciation of investments | $ | 408,262,133 | |
| Gross tax depreciation of investments | (52,866,743 | ) | |
| Net tax appreciation (depreciation) of investments | $ | 355,395,390 | |
| Undistributed ordinary income | $ | 898,525 | |
| Accumulated short-term capital losses | $ | (18,163,775 | ) |
The difference between book-basis and tax-basis unrealized appreciation (depreciation) is attributable primarily to the tax deferral of losses on wash sales.
Accumulated capital losses represent net capital loss carryovers that may be used to offset future realized capital gains for federal income tax purposes. The capital loss carryovers may be carried forward for an unlimited period. Future capital loss carryover utilization in any given year may be subject to Internal Revenue Code limitations.
22
| Financial Highlights |
| For a Share Outstanding Throughout the Years Ended June 30 (except as noted) | |||||||||||||||
| Per-Share Data | Ratios and Supplemental Data | ||||||||||||||
| Income From Investment Operations: | Distributions From: | Ratio to Average Net Assets of: | |||||||||||||
Net Asset Value, Beginning of Period | Net Investment Income (Loss)(1) | Net Realized and Unrealized Gain (Loss) | Total From Investment Operations | Net Investment Income | Net Realized Gains | Total Distributions | Net Asset Value, End of Period | Total Return(2) | Operating Expenses | Net Investment Income (Loss) | Portfolio Turnover Rate | Net Assets, End of Period (in thousands) | |||
| Investor Class | |||||||||||||||
| 2016 | $36.78 | 0.82 | (0.61) | 0.21 | (0.84) | (2.24) | (3.08) | $33.91 | 1.00% | 0.68% | 2.40% | 79% | $1,551,664 | ||
| 2015 | $38.52 | 0.81 | 0.29 | 1.10 | (0.79) | (2.05) | (2.84) | $36.78 | 2.87% | 0.67% | 2.11% | 79% | $1,655,693 | ||
| 2014 | $31.58 | 0.77 | 6.95 | 7.72 | (0.78) | — | (0.78) | $38.52 | 24.66% | 0.67% | 2.17% | 76% | $1,708,291 | ||
| 2013 | $26.29 | 0.68 | 5.27 | 5.95 | (0.66) | — | (0.66) | $31.58 | 22.86% | 0.68% | 2.39% | 74% | $1,417,796 | ||
| 2012 | $25.54 | 0.43 | 0.76 | 1.19 | (0.44) | — | (0.44) | $26.29 | 4.75% | 0.68% | 1.73% | 53% | $1,306,254 | ||
| Institutional Class | |||||||||||||||
| 2016 | $36.82 | 0.88 | (0.60) | 0.28 | (0.91) | (2.24) | (3.15) | $33.95 | 1.21% | 0.48% | 2.60% | 79% | $127,626 | ||
| 2015 | $38.55 | 0.88 | 0.30 | 1.18 | (0.86) | (2.05) | (2.91) | $36.82 | 3.10% | 0.47% | 2.31% | 79% | $125,872 | ||
| 2014 | $31.61 | 0.84 | 6.95 | 7.79 | (0.85) | — | (0.85) | $38.55 | 24.89% | 0.47% | 2.37% | 76% | $89,218 | ||
| 2013 | $26.31 | 0.74 | 5.27 | 6.01 | (0.71) | — | (0.71) | $31.61 | 23.12% | 0.48% | 2.59% | 74% | $68,152 | ||
| 2012 | $25.56 | 0.48 | 0.76 | 1.24 | (0.49) | — | (0.49) | $26.31 | 4.96% | 0.48% | 1.93% | 53% | $97,809 | ||
| A Class | |||||||||||||||
| 2016 | $36.74 | 0.73 | (0.61) | 0.12 | (0.75) | (2.24) | (2.99) | $33.87 | 0.75% | 0.93% | 2.15% | 79% | $205,390 | ||
| 2015 | $38.48 | 0.71 | 0.29 | 1.00 | (0.69) | (2.05) | (2.74) | $36.74 | 2.62% | 0.92% | 1.86% | 79% | $239,515 | ||
| 2014 | $31.55 | 0.68 | 6.94 | 7.62 | (0.69) | — | (0.69) | $38.48 | 24.34% | 0.92% | 1.92% | 76% | $232,471 | ||
| 2013 | $26.26 | 0.63 | 5.24 | 5.87 | (0.58) | — | (0.58) | $31.55 | 22.58% | 0.93% | 2.14% | 74% | $191,007 | ||
| 2012 | $25.52 | 0.37 | 0.74 | 1.11 | (0.37) | — | (0.37) | $26.26 | 4.46% | 0.93% | 1.48% | 53% | $116,762 | ||
| For a Share Outstanding Throughout the Years Ended June 30 (except as noted) | |||||||||||||||
| Per-Share Data | Ratios and Supplemental Data | ||||||||||||||
| Income From Investment Operations: | Distributions From: | Ratio to Average Net Assets of: | |||||||||||||
Net Asset Value, Beginning of Period | Net Investment Income (Loss)(1) | Net Realized and Unrealized Gain (Loss) | Total From Investment Operations | Net Investment Income | Net Realized Gains | Total Distributions | Net Asset Value, End of Period | Total Return(2) | Operating Expenses | Net Investment Income (Loss) | Portfolio Turnover Rate | Net Assets, End of Period (in thousands) | |||
| C Class | |||||||||||||||
| 2016 | $36.68 | 0.47 | (0.60) | (0.13) | (0.49) | (2.24) | (2.73) | $33.82 | 0.01% | 1.68% | 1.40% | 79% | $6,734 | ||
| 2015 | $38.42 | 0.42 | 0.29 | 0.71 | (0.40) | (2.05) | (2.45) | $36.68 | 1.86% | 1.67% | 1.11% | 79% | $8,195 | ||
| 2014 | $31.50 | 0.41 | 6.93 | 7.34 | (0.42) | — | (0.42) | $38.42 | 23.42% | 1.67% | 1.17% | 76% | $5,445 | ||
| 2013 | $26.23 | 0.41 | 5.23 | 5.64 | (0.37) | — | (0.37) | $31.50 | 21.63% | 1.68% | 1.39% | 74% | $1,965 | ||
| 2012 | $25.48 | 0.18 | 0.76 | 0.94 | (0.19) | — | (0.19) | $26.23 | 3.73% | 1.68% | 0.73% | 53% | $1,151 | ||
| R Class | |||||||||||||||
| 2016 | $36.77 | 0.65 | (0.60) | 0.05 | (0.67) | (2.24) | (2.91) | $33.91 | 0.52% | 1.18% | 1.90% | 79% | $23,290 | ||
| 2015 | $38.51 | 0.60 | 0.31 | 0.91 | (0.60) | (2.05) | (2.65) | $36.77 | 2.36% | 1.17% | 1.61% | 79% | $15,663 | ||
| 2014 | $31.57 | 0.59 | 6.95 | 7.54 | (0.60) | — | (0.60) | $38.51 | 24.05% | 1.17% | 1.67% | 76% | $3,577 | ||
| 2013 | $26.28 | 0.57 | 5.23 | 5.80 | (0.51) | — | (0.51) | $31.57 | 22.26% | 1.18% | 1.89% | 74% | $2,050 | ||
| 2012 | $25.54 | 0.31 | 0.74 | 1.05 | (0.31) | — | (0.31) | $26.28 | 4.19% | 1.18% | 1.23% | 53% | $997 | ||
| Notes to Financial Highlights |
| (1) | Computed using average shares outstanding throughout the period. |
| (2) | Total returns are calculated based on the net asset value of the last business day and do not reflect applicable sales charges, if any. Total returns for periods less than one year are not annualized. |
See Notes to Financial Statements.
| Report of Independent Registered Public Accounting Firm |
To the Directors of the American Century Quantitative Equity Funds, Inc. and Shareholders of the Income & Growth Fund:
In our opinion, the accompanying statement of assets and liabilities, including the schedule of investments, and the related statements of operations and of changes in net assets and the financial highlights present fairly, in all material respects, the financial position of the Income & Growth Fund (one of the sixteen funds comprising the American Century Quantitative Equity Funds, Inc., hereafter referred to as the “Fund”) at June 30, 2016, the results of its operations for the year then ended, the changes in its net assets for each of the two years in the period then ended and the financial highlights for each of the five years in the period then ended, in conformity with accounting principles generally accepted in the United States of America. These financial statements and financial highlights (hereafter referred to as "financial statements") are the responsibility of the Fund's management. Our responsibility is to express an opinion on these financial statements based on our audits. We conducted our audits of these financial statements in accordance with the standards of the Public Company Accounting Oversight Board (United States). Those standards require that we plan and perform the audit to obtain reasonable assurance about whether the financial statements are free of material misstatement. An audit includes examining, on a test basis, evidence supporting the amounts and disclosures in the financial statements, assessing the accounting principles used and significant estimates made by management, and evaluating the overall financial statement presentation. We believe that our audits, which included confirmation of securities at June 30, 2016 by correspondence with the custodian and brokers, provide a reasonable basis for our opinion.
PricewaterhouseCoopers LLP
Kansas City, Missouri
August 17, 2016
25
| Management |
Board of Directors
The individuals listed below serve as directors of the funds. Each director will continue to serve in this capacity until death, retirement, resignation or removal from office. The board has adopted a mandatory retirement age for directors who are not “interested persons,” as that term is defined in the Investment Company Act (independent directors). Independent directors shall retire on December 31 of the year in which they reach their 75th birthday; provided, however, that on or after January 1, 2022, independent directors shall retire on December 31 of the year in which they reach their 76th birthday.
Mr. Thomas is an “interested person” because he currently serves as President and Chief Executive Officer of American Century Companies, Inc. (ACC), the parent company of American Century Investment Management, Inc. (ACIM or the advisor). The other directors (more than three-fourths of the total number) are independent. They are not employees, directors or officers of, and have no financial interest in, ACC or any of its wholly owned, direct or indirect, subsidiaries, including ACIM, American Century Investment Services, Inc. (ACIS) and American Century Services, LLC (ACS), and they do not have any other affiliations, positions or relationships that would cause them to be considered “interested persons” under the Investment Company Act. The directors serve in this capacity for eight (in the case of Mr. Thomas, 15) registered investment companies in the American Century Investments family of funds.
The following table presents additional information about the directors. The mailing address for each director other than Mr. Thomas is 1665 Charleston Road, Mountain View, California 94043. The mailing address for Mr. Thomas is 4500 Main Street, Kansas City, Missouri 64111.
Name (Year of Birth) | Position(s) Held with Funds | Length of Time Served | Principal Occupation(s) During Past 5 Years | Number of American Century Portfolios Overseen by Director | Other Directorships Held During Past 5 Years |
| Independent Directors | |||||
| Tanya S. Beder (1955) | Director | Since 2011 | Chairman and CEO, SBCC Group Inc. (independent advisory services) (2006 to present) | 45 | CYS Investments, Inc. (NYSE mortgage arbitrage REIT) |
| Jeremy I. Bulow (1954) | Director | Since 2011 | Professor of Economics, Stanford University, Graduate School of Business (1979 to present) | 45 | None |
| Anne Casscells (1958) | Director | Since 2016 | Co-Chief Executive Officer and Chief Investment Officer, Aetos Alternatives Management (investment advisory firm) (2001 to present); Lecturer in Accounting, Stanford University, Graduate School of Business (2009 to present) | 45 | None |
26
Name (Year of Birth) | Position(s) Held with Funds | Length of Time Served | Principal Occupation(s) During Past 5 Years | Number of American Century Portfolios Overseen by Director | Other Directorships Held During Past 5 Years |
| Independent Directors | |||||
| Ronald J. Gilson (1946) | Director and Chairman of the Board | Since 1995 (Chairman since 2005) | Charles J. Meyers Professor of Law and Business, Emeritus, Stanford Law School (1979 to present); Marc and Eva Stern Professor of Law and Business, Columbia University School of Law (1992 to present) | 45 | None |
| Frederick L. A. Grauer (1946) | Director | Since 2008 | Senior Advisor, iShares by BlackRock, Inc. (investment management firm) (2010 to 2011, 2013 to present); Senior Advisor, Course Hero (an educational technology company) (2015 to present) | 45 | None |
| Jonathan D. Levin (1972) | Director | Since 2016 | Holbrook Working Professor of Price Theory, Stanford University, (2000 to present); Chair, Department of Economics, Stanford University (2011 to 2014) | 45 | None |
| Peter F. Pervere (1947) | Director | Since 2007 | Retired | 45 | None |
| John B. Shoven (1947) | Director | Since 2002 | Charles R. Schwab Professor of Economics, Stanford University (1973 to present) | 45 | Cadence Design Systems; Exponent; Financial Engines |
| Interested Director | |||||
| Jonathan S. Thomas (1963) | Director and President | Since 2007 | President and Chief Executive Officer, ACC (March 2007 to present). Also serves as Chief Executive Officer, ACS; Executive Vice President, ACIM; Director, ACC, ACIM and other ACC subsidiaries | 128 | BioMed Valley Discoveries, Inc. |
The Statement of Additional Information has additional information about the fund's directors and is available without charge, upon request, by calling 1-800-345-2021.
27
Officers
The following table presents certain information about the executive officers of the funds. Each officer serves as an officer for each of the 15 investment companies in the American Century family of funds, unless otherwise noted. No officer is compensated for his or her service as an officer of the funds. The listed officers are interested persons of the funds and are appointed or re-appointed on an annual basis. The mailing address for each of the officers listed below is 4500 Main Street, Kansas City, Missouri 64111.
Name (Year of Birth) | Offices with the Funds | Principal Occupation(s) During the Past Five Years |
| Jonathan S. Thomas (1963) | Director and President since 2007 | President and Chief Executive Officer, ACC (March 2007 to present). Also serves as Chief Executive Officer, ACS; Executive Vice President, ACIM; Director, ACC, ACIM and other ACC subsidiaries |
| Amy D. Shelton (1964) | Chief Compliance Officer and Vice President since 2014 | Chief Compliance Officer, American Century funds, (March 2014 to present); Chief Compliance Officer, ACIM (February 2014 to present); Chief Compliance Officer, ACIS (October 2009 to present); Vice President, Client Interactions and Marketing, ACIS (February 2013 to January 2014); Director, Client Interactions and Marketing, ACIS (June 2007 to January 2013). Also serves as Vice President, ACIS |
| Charles A. Etherington (1957) | General Counsel since 2007 and Senior Vice President since 2006 | Attorney, ACC (February 1994 to present); Vice President, ACC (November 2005 to present); General Counsel, ACC (March 2007 to present). Also serves as General Counsel, ACIM, ACS, ACIS and other ACC subsidiaries; and Senior Vice President, ACIM and ACS |
| C. Jean Wade (1964) | Vice President, Treasurer and Chief Financial Officer since 2012 | Vice President, ACS (February 2000 to present) |
| Robert J. Leach (1966) | Vice President since 2006 and Assistant Treasurer since 2012 | Vice President, ACS (February 2000 to present) |
| David H. Reinmiller (1963) | Vice President since 2001 | Attorney, ACC (January 1994 to present); Associate General Counsel, ACC (January 2001 to present). Also serves as Vice President, ACIM and ACS |
| Ward D. Stauffer (1960) | Secretary since 2005 | Attorney, ACC (June 2003 to present) |
28
| Approval of Management Agreement |
At a meeting held on June 14, 2016, the Fund’s Board of Directors (the "Board") unanimously approved the renewal of the management agreement pursuant to which American Century Investment Management, Inc. (the “Advisor”) acts as the investment advisor for the Fund. Under Section 15(c) of the Investment Company Act, contracts for investment advisory services are required to be reviewed, evaluated, and approved by a majority of a fund’s directors/trustees, including a majority of the independent Directors, each year. The Board regards this annual evaluation and renewal as one of its most important responsibilities.
The independent Directors have memorialized a statement regarding the relationship between their ongoing obligations to oversee and evaluate the performance of the Advisor and their annual consideration of renewal of the management agreement. In that statement, the independent Directors noted that their assessment of the Advisor’s performance is an ongoing process that takes place over the entire year and is informed by all of the extensive information that the Board and its committees receive and consider over time. This information, together with the additional materials provided specifically in connection with the review, are central to the Board’s assessment of the Advisor’s performance and its determination whether to renew the Fund’s management agreement.
Prior to its consideration of the renewal of the management agreement, the Board requested and reviewed extensive data and analysis relating to the proposed renewal. This information and analysis was compiled by the Advisor and certain independent providers of evaluation data concerning the Fund and the services provided to the Fund by the Advisor.
In connection with its consideration of the renewal of the management agreement, the Board’s review and evaluation of the services provided by the Advisor included, but was not limited to, the following:
| • | the nature, extent, and quality of investment management, shareholder services, and other services provided by the Advisor to the Fund; |
| • | the wide range of other programs and services the Advisor provides to the Fund and its shareholders on a routine and non-routine basis; |
| • | the investment performance of the Fund, including data comparing the Fund’s performance to appropriate benchmarks and/or a peer group of other mutual funds with similar investment objectives and strategies; |
| • | the cost of owning the Fund compared to the cost of owning similar funds; |
| • | the Advisor’s compliance policies, procedures, and regulatory experience; |
| • | financial data showing the cost of services provided to the Fund, the profitability of the Fund to the Advisor, and the overall profitability of the Advisor; |
| • | possible economies of scale associated with the Advisor’s management of the Fund and other accounts under its management; |
| • | data comparing services provided and charges to other investment management clients of the Advisor; |
| • | acquired fund fees and expenses; |
| • | payments by the Fund and the Advisor to financial intermediaries whose clients are investors in the Fund; and |
| • | any collateral benefits derived by the Advisor from the management of the Fund. |
In keeping with its practice, the Board held two in-person meetings to review and discuss the information provided in response to their request. The independent Directors also had the benefit of the advice of their independent counsel throughout the process.
29
Factors Considered
The Directors considered all of the information provided by the Advisor, the independent data providers, and the independent Directors’ independent counsel in connection with the approval. They determined that the information was sufficient for them to evaluate the management agreement for the Fund. In connection with their review, the Directors did not identify any single factor as being all-important or controlling and each Director may have attributed different levels of importance to different factors. In deciding to renew the management agreement, the Board based its decision on a number of factors, including the following:
Nature, Extent and Quality of Services - Generally. Under the management agreement, the Advisor is responsible for providing or arranging for all services necessary for the operation of the Fund. The Board noted that under the management agreement, the Advisor provides or arranges at its own expense a wide variety of services including:
| • | constructing and designing the Fund |
| • | portfolio research and security selection |
| • | initial capitalization/funding |
| • | securities trading |
| • | Fund administration |
| • | custody of Fund assets |
| • | daily valuation of the Fund’s portfolio |
| • | shareholder servicing and transfer agency, including shareholder confirmations, recordkeeping, and communications |
| • | legal services (except the independent Directors’ counsel) |
| • | regulatory and portfolio compliance |
| • | financial reporting |
| • | marketing and distribution (except amounts paid by the Fund under Rule 12b-1 plans) |
The Board noted that many of these services have expanded over time in terms of both quantity and complexity in response to shareholder demands, competition in the industry, changing distribution channels, and the changing regulatory environment.
Investment Management, Shareholder, and Other Services. The nature of the investment management services provided to the Fund is quite complex and allows Fund shareholders access to professional money management, instant diversification of their investments within an asset class, the opportunity to easily diversify among asset classes by investing in or exchanging among various American Century Investments funds, and liquidity. In evaluating investment performance, the Board expects the Advisor to manage the Fund in accordance with its investment objectives and approved strategies. Further, the Directors recognize that the Advisor has an obligation to seek the best execution of fund trades. In providing these services, the Advisor utilizes teams of investment professionals (portfolio managers, analysts, research assistants, and securities traders) who require extensive information technology, research, training, compliance, and other systems to conduct their business. The Board, directly and through its Portfolio Committee, regularly reviews investment performance information for the Fund, together with comparative information for appropriate benchmarks and/or peer groups of similarly-managed funds, over different time horizons. The Directors also review detailed performance information during the management agreement approval process. If performance concerns are identified, the Fund receives special reviews until performance improves, during which the Board discusses with the Advisor the reasons for such results (e.g., market conditions, security selection) and any efforts being undertaken to improve performance. The Fund’s performance was below its benchmark for the one-, three-, five-, and ten-year periods reviewed by the Board. The Board discussed the Fund’s performance with the Advisor and was satisfied with the efforts being undertaken by the Advisor. The Board found the investment management services provided by the Advisor to the Fund to be satisfactory and consistent with the management agreement.
30
Under the management agreement, the Advisor provides the Fund with a comprehensive package of transfer agency, shareholder, and other services. The Board, directly and through various committees of the Board, regularly reviews reports and evaluations of such services at its regular meetings. These reports include, but are not limited to, information regarding the operational efficiency and accuracy of the shareholder and transfer agency services provided, staffing levels, shareholder satisfaction (as measured by external as well as internal sources), technology support, new products and services offered to Fund shareholders, securities trading activities, portfolio valuation services, auditing services, and legal and operational compliance activities. Certain aspects of shareholder and transfer agency service level efficiency and the quality of securities trading activities are measured by independent third party providers and are presented in comparison to other fund groups not managed by the Advisor.
The Board found the services provided by the Advisor to the Fund under the management agreement to be competitive and of high quality.
Costs of Services and Profitability. The Advisor provides detailed information concerning its cost of providing various services to the Fund, its profitability in managing the Fund, its overall profitability, and its financial condition. The Directors have reviewed with the Advisor the methodology used to prepare this financial information. This information is considered in evaluating the Advisor’s financial condition, its ability to continue to provide services under the management agreement, and the reasonableness of the current management fee. The Board concluded that the Advisor’s profits were reasonable in light of the services provided to the Fund.
Economies of Scale. The Board also reviewed information provided by the Advisor regarding the possible existence of economies of scale in connection with the management of the Fund. The Board concluded that economies of scale are difficult to measure and predict with precision, especially on a fund-by-fund basis. The Board concluded that the Advisor is appropriately sharing economies of scale through its competitive fee structure, offering competitive fees from fund inception, and through reinvestment in its business to provide shareholders enhanced and expanded services.
Comparison to Other Funds’ Fees. The management agreement provides that the Fund pays the Advisor a single, all-inclusive (or unified) management fee for providing all services necessary for the management and operation of the Fund, other than brokerage expenses, expenses attributable to short sales, taxes, interest, extraordinary expenses, the fees and expenses of the Fund’s independent Directors (including their independent legal counsel), and expenses incurred in connection with the provision of shareholder services and distribution services under a plan adopted pursuant to Rule 12b-1 under the 1940 Act. Under the unified fee structure, the Advisor is responsible for providing all investment advisory, custody, audit, administrative, compliance, recordkeeping, marketing, and shareholder services, or arranging and supervising third parties to provide such services. By contrast, most other funds are charged a variety of fees, including an investment advisory fee, a transfer agency fee, an administrative fee, distribution charges, and other expenses. Other than their investment advisory fees and any applicable Rule 12b-1 fees, all other components of the total fees charged by these other funds may be increased without shareholder approval. The Board believes the unified fee structure is a benefit to Fund shareholders because it clearly discloses to shareholders the cost of owning Fund shares, and, since the unified fee cannot be increased without a vote of Fund shareholders, it shifts to the Advisor the risk of increased costs of operating the Fund and provides a direct incentive to minimize administrative inefficiencies. Part of the Board’s analysis of fee levels involves reviewing certain evaluative data compiled by an independent provider and comparing the Fund’s unified fee to the total expense ratio of peer funds. The unified fee charged to shareholders of the Fund was below the median of the total expense ratios of the Fund’s peer group. The Board concluded that the management fee paid by the Fund to the Advisor under the management agreement is reasonable in light of the services provided to the Fund.
31
Comparison to Fees and Services Provided to Other Clients of the Advisor. The Board also requested and received information from the Advisor concerning the nature of the services, fees, costs, and profitability of its advisory services to advisory clients other than the Fund. They observed that these varying types of client accounts require different services and involve different regulatory and entrepreneurial risks than the management of the Fund. The Board analyzed this information and concluded that the fees charged and services provided to the Fund were reasonable by comparison.
Payments to Intermediaries. The Directors also requested and received a description of payments made to intermediaries by the Fund and the Advisor. These payments include various payments made by the Fund or the Advisor to different types of intermediaries and recordkeepers for distribution and service activities provided for the Fund.
Collateral or “Fall-Out” Benefits Derived by the Advisor. The Board considered the existence of collateral benefits the Advisor may receive as a result of its relationship with the Fund. The Board noted that the Advisor’s primary business is managing mutual funds and it generally does not use fund or shareholder information to generate profits in other lines of business, and therefore does not derive any significant collateral benefits from them. The Board noted that the Advisor receives proprietary research from broker-dealers that execute fund portfolio transactions. The Board also determined that the Advisor is able to provide investment management services to certain clients other than the Fund, at least in part, due to its existing infrastructure built to serve the fund complex. The Board concluded, however, that the assets of those other clients are not material to the analysis and, where applicable, may be included with the assets of the Fund to determine breakpoints in the management fee schedule.
Existing Relationship. The Board also considered whether there was any reason for not continuing the existing arrangement with the Advisor. In this regard, the Board was mindful of the potential disruptions of the Fund’s operations and various risks, uncertainties, and other effects that could occur as a result of a decision not to continue such relationship. In particular, the Board recognized that most shareholders have invested in the Fund on the strength of the Advisor’s industry standing and reputation and in the expectation that the Advisor will have a continuing role in providing advisory services to the Fund.
Conclusion of the Directors. As a result of this process, the Board, including all of the independent Directors and assisted by the advice of independent legal counsel, taking into account all of the factors discussed above and the information provided by the Advisor and others in connection with its review and throughout the year, concluded that the management agreement between the Fund and the Advisor is fair and reasonable in light of the services provided and should be renewed.
32
| Proxy Voting Results |
A special meeting of shareholders was held on June 13, 2016, to vote on the following proposal. The proposal received the required number of votes and was adopted. A summary of voting results is listed below.
To elect four directors to the Board of Directors of American Century Quantitative Equity Funds, Inc.:
| Affirmative | Withhold | ||||||
| Tanya S. Beder | $ | 8,473,153,264 | $ | 121,459,590 | |||
| Jeremy I. Bulow | $ | 8,469,793,581 | $ | 124,819,273 | |||
| Anne Casscells | $ | 8,465,895,232 | $ | 128,717,622 | |||
| Jonathan D. Levin | $ | 8,468,929,867 | $ | 125,682,987 | |||
The other directors whose term of office continued after the meeting include Jonathan S. Thomas, Ronald J. Gilson, Frederick L. A. Grauer, Peter F. Pervere and John B. Shoven.
33
| Additional Information |
Retirement Account Information
As required by law, distributions you receive from certain IRAs are subject to federal income tax withholding, unless you elect not to have withholding apply. Tax will be withheld on the total amount withdrawn even though you may be receiving amounts that are not subject to withholding, such as nondeductible contributions. In such case, excess amounts of withholding could occur. You may adjust your withholding election so that a greater or lesser amount will be withheld.
If you don’t want us to withhold on this amount, you must notify us to not withhold the federal income tax. You may notify us in writing or in certain situations by telephone or through other electronic means. For systematic withdrawals, your withholding election will remain in effect until revoked or changed by filing a new election. You have the right to revoke your election at any time.
Remember, even if you elect not to have income tax withheld, you are liable for paying income tax on the taxable portion of your withdrawal. If you elect not to have income tax withheld or you don’t have enough income tax withheld, you may be responsible for payment of estimated tax. You may incur penalties under the estimated tax rules if your withholding and estimated tax payments are not sufficient. You can reduce or defer the income tax on a distribution by directly or indirectly rolling such distribution over to another IRA or eligible plan. You should consult your tax advisor for additional information.
State tax will be withheld if, at the time of your distribution, your address is within one of the mandatory withholding states and you have federal income tax withheld (or as otherwise required by state law). State taxes will be withheld from your distribution in accordance with the respective state rules.
Distributions you receive from 403(b), 457 and qualified plans are subject to special tax and withholding rules. Your plan administrator or plan sponsor is required to provide you with a special tax notice explaining those rules at the time you request a distribution. If applicable, federal and/or state taxes may be withheld from your distribution amount.
Proxy Voting Policies
Descriptions of the principles and policies that the fund's investment advisor uses in exercising the voting rights associated with the securities purchased and/or held by the fund are available without charge, upon request, by calling 1-800-345-2021 or visiting the "About Us" page of American Century Investments’ website at americancentury.com. A description of the policies is also available on the Securities and Exchange Commission’s website at sec.gov. Information regarding how the investment advisor voted proxies relating to portfolio securities during the most recent 12-month period ended June 30 is available on the "About Us" page at americancentury.com. It is also available at sec.gov.
Quarterly Portfolio Disclosure
The fund files its complete schedule of portfolio holdings with the Securities and Exchange Commission (SEC) for the first and third quarters of each fiscal year on Form N-Q. The fund’s Forms N-Q are available on the SEC’s website at sec.gov, and may be reviewed and copied at the SEC’s Public Reference Room in Washington, DC. Information on the operation of the Public Reference Room may be obtained by calling 1-800-SEC-0330. The fund also makes its complete schedule of portfolio holdings for the most recent quarter of its fiscal year available on its website at americancentury.com and, upon request, by calling 1-800-345-2021.
34
Other Tax Information
The following information is provided pursuant to provisions of the Internal Revenue Code.
The fund hereby designates up to the maximum amount allowable as qualified dividend income for the fiscal year ended June 30, 2016.
For corporate taxpayers, the fund hereby designates $44,175,079, or up to the maximum amount allowable, of ordinary income distributions paid during the fiscal year ended June 30, 2016 as qualified for the corporate dividends received deduction.
The fund hereby designates $19,679,915 as qualified short-term capital gain distributions for purposes of Internal Revenue Code Section 871 for the fiscal year ended June 30, 2016.
The fund hereby designates $100,894,518, or up to the maximum amount allowable, as long-term capital gain distributions (20% rate gain distributions) for the fiscal year ended June 30, 2016.
35
| Notes |
36
| ||
| Contact Us | americancentury.com | |
| Automated Information Line | 1-800-345-8765 | |
| Investor Services Representative | 1-800-345-2021 or 816-531-5575 | |
| Investors Using Advisors | 1-800-378-9878 | |
| Business, Not-For-Profit, Employer-Sponsored Retirement Plans | 1-800-345-3533 | |
| Banks and Trust Companies, Broker-Dealers, Financial Professionals, Insurance Companies | 1-800-345-6488 | |
| Telecommunications Relay Service for the Deaf | 711 | |
| American Century Quantitative Equity Funds, Inc. | ||
Investment Advisor: American Century Investment Management, Inc. Kansas City, Missouri | ||
| This report and the statements it contains are submitted for the general information of our shareholders. The report is not authorized for distribution to prospective investors unless preceded or accompanied by an effective prospectus. | ||
| ©2016 American Century Proprietary Holdings, Inc. All rights reserved. CL-ANN-89955 1608 | ||
| Annual Report | |
| June 30, 2016 | |
| International Core Equity Fund | |
39
40
| Table of Contents |
| President's Letter | 2 | |
| Performance | 3 | |
| Portfolio Commentary | ||
| Fund Characteristics | ||
| Shareholder Fee Example | ||
| Schedule of Investments | ||
| Statement of Assets and Liabilities | ||
| Statement of Operations | ||
| Statement of Changes in Net Assets | ||
| Notes to Financial Statements | ||
| Financial Highlights | ||
| Report of Independent Registered Public Accounting Firm | ||
| Management | ||
| Approval of Management Agreement | ||
| Proxy Voting Results | ||
| Additional Information | ||
Any opinions expressed in this report reflect those of the author as of the date of the report, and do not necessarily represent the opinions of American Century Investments® or any other person in the American Century Investments organization. Any such opinions are subject to change at any time based upon market or other conditions and American Century Investments disclaims any responsibility to update such opinions. These opinions may not be relied upon as investment advice and, because investment decisions made by American Century Investments funds are based on numerous factors, may not be relied upon as an indication of trading intent on behalf of any American Century Investments fund. Security examples are used for representational purposes only and are not intended as recommendations to purchase or sell securities. Performance information for comparative indices and securities is provided to American Century Investments by third party vendors. To the best of American Century Investments’ knowledge, such information is accurate at the time of printing.
| President’s Letter |
Jonathan ThomasDear Investor:
Thank you for reviewing this annual report for the 12 months ended June 30, 2016. It provides investment performance and portfolio information for the reporting period, plus longer-term historical performance data.
Annual reports remain important vehicles for conveying information about fund returns, including market and economic factors that affected performance during the reporting period. For additional, updated investment and market insights, we encourage you to visit our website, americancentury.com.
Market Volatility Increased, But Not for the Reasons Anticipated
Going into this reporting period, investors anticipated increased market volatility and uncertainty as the Federal Reserve (the Fed) appeared poised to raise short-term interest rates toward more historically normal levels. This policy change was expected to affect investor sentiment, U.S. Treasury yield behavior, relative currency values, inflation expectations, and corporate costs and earnings.
This Fed-centric outlook didn’t fully account for global factors, which ultimately drove sentiment, volatility, and performance during the reporting period. During 2015, the primary catalyst was China, where slowing economic growth, currency devaluations, and massive monetary policy easing sent shock waves through the global markets. The Fed ended up delaying (until December 2015) its only small rate hike during the reporting period. Afterward, China-related events repeated in January and early February this year, further delaying Fed action.
Oil was another catalyst—its price collapses devalued entire market sectors and contributed to broad market volatility and negative sentiment. Later, as China and oil appeared to stabilize, Brexit occurred—the unexpected decision by United Kingdom voters to leave the European Union. This produced more shock waves, and altered central bank policies around the world. In this environment, relatively defensive assets performed best for the 12 months, including the stocks of gold-producing companies, utilities, real estate investment trusts (REITs), and long-maturity U.S. Treasury securities.
Looking ahead, we believe the markets face further uncertainty and volatility as they digest Brexit, the Italian bank crisis, China’s economic mysteries, and the U.S. presidential election. Negative interest rates in Europe and Japan represent part of the market’s response to the global macroeconomic climate. These negative rates are suppressing interest rates around the world while driving up the value of the U.S. dollar and U.S. bonds. In a broad sense, stocks also benefit from the central bank stimulus that is driving interest rates into negative territory, and from relative yield advantages as bond yields are pushed lower. It’s an unusual and challenging environment. We appreciate your continued trust in us.
Sincerely,
Jonathan Thomas
President and Chief Executive Officer
American Century Investments
2
| Performance |
| Total Returns as of June 30, 2016 | |||||
| Average Annual Returns | |||||
| Ticker Symbol | 1 year | 5 years | Since Inception | Inception Date | |
| Investor Class | ACIMX | -11.53% | 1.49% | 0.09% | 11/30/06 |
| MSCI EAFE Index | — | -10.16% | 1.68% | 0.53% | — |
| Institutional Class | ACIUX | -11.34% | 1.67% | 0.29% | 11/30/06 |
| A Class | ACIQX | 11/30/06 | |||
| No sales charge | -11.75% | 1.26% | -0.14% | ||
| With sales charge | -16.80% | 0.08% | -0.76% | ||
| C Class | ACIKX | -12.48% | 0.45% | -0.91% | 11/30/06 |
| R Class | ACIRX | -11.90% | 0.99% | -0.40% | 11/30/06 |
Sales charges include initial sales charges and contingent deferred sales charges (CDSCs), as applicable. A Class shares have a 5.75% maximum initial sales charge and may be subject to a maximum CDSC of 1.00%. C Class shares redeemed within 12 months of purchase are subject to a maximum CDSC of 1.00%. The SEC requires that mutual funds provide performance information net of maximum sales charges in all cases where charges could be applied.
Data presented reflect past performance. Past performance is no guarantee of future results. Current performance may be higher or lower than the performance shown. Total returns for periods less than one year are not annualized. Investment return and principal value will fluctuate, and redemption value may be more or less than original cost. Data assumes reinvestment of dividends and capital gains, and none of the charts reflect the deduction of taxes that a shareholder would pay on fund distributions or the redemption of fund shares. To obtain performance data current to the most recent month end, please call 1-800-345-2021 or visit americancentury.com. For additional information about the fund, please consult the prospectus.
3
| Growth of $10,000 Over Life of Class |
| $10,000 investment made November 30, 2006 |
| Performance for other share classes will vary due to differences in fee structure. |
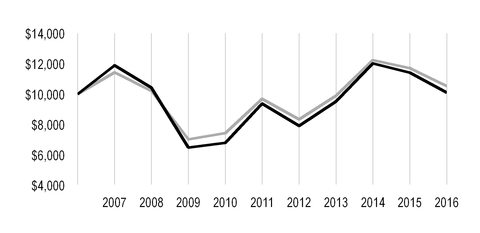
| Value on June 30, 2016 | |
| Investor Class — $10,086 | |
| MSCI EAFE Index — $10,517 | |
| Total Annual Fund Operating Expenses | ||||
| Investor Class | Institutional Class | A Class | C Class | R Class |
| 1.16% | 0.96% | 1.41% | 2.16% | 1.66% |
The total annual fund operating expenses shown is as stated in the fund’s prospectus current as of the date of this report. The prospectus may vary from the expense ratio shown elsewhere in this report because it is based on a different time period, includes acquired fund fees and expenses, and, if applicable, does not include fee waivers or expense reimbursements.
Data presented reflect past performance. Past performance is no guarantee of future results. Current performance may be higher or lower than the performance shown. Total returns for periods less than one year are not annualized. Investment return and principal value will fluctuate, and redemption value may be more or less than original cost. Data assumes reinvestment of dividends and capital gains, and none of the charts reflect the deduction of taxes that a shareholder would pay on fund distributions or the redemption of fund shares. To obtain performance data current to the most recent month end, please call 1-800-345-2021 or visit americancentury.com. For additional information about the fund, please consult the prospectus.
4
| Portfolio Commentary |
Portfolio Managers: Elizabeth Xie, Yulin Long, and Vinod Chandrashekaran
Performance Summary
International Core Equity returned -11.53%* for the fiscal year ended June 30, 2016, compared with the -10.16% return of the fund’s benchmark, the MSCI EAFE Index.
International Core Equity declined, underperforming the MSCI EAFE Index. Stock selection in the health care and consumer discretionary sectors weighed on the fund’s results, while financials and telecommunication services sector holdings aided relative returns. From a geographical perspective, underperformance was most pronounced in the U.K., while stock selection in Japan and Sweden was beneficial. The fund’s stock selection process incorporates factors of valuation, quality, and sentiment, while striving to minimize unintended risks along industries and other risk characteristics. Stock selection insights based on valuation proved difficult while quality and sentiment drivers were supportive.
U.K. Consumer Discretionary Holdings Weighed on Fund Returns
U.K.-based consumer discretionary stocks were a key area of weakness as they generally suffered in the wake of Brexit as investors feared potential slowing of the British economy and weaker consumer confidence. Homebuilder Persimmon was a key detractor as investors’ concern about the potential spillover effect of falling home prices and sales volumes on profitability dampened the company’s stock price. Nevertheless, we stand by our positioning based on the company’s strong valuation and sentiment profiles. Likewise, media holding Sky, which is attractive across quality and valuation, declined as investors worried about Brexit’s impact on the holding. Elsewhere in the U.K., a portfolio-only investment in The Go-Ahead Group, an industrials holdings, also weighed on returns. The public transport operator fell ahead of the “leave” vote after company management warned that necessary infrastructure investments in its Govia Thameslink Rail (GTR) franchise would severely impact profits and lead to shrinking margins. The shares were further pressured by post-Brexit anxiety. Strength across all factors led to our positioning. Outside of the U.K., France-based automobile manufacturer Peugeot suffered amid the general downturn in the global auto market resulting from weakness in China during the first half of the year, and was hurt by the post-Brexit fallout, with the company’s shares losing value in anticipation of lower car sales in the U.K., one of its main markets. We remain confident in the investment based on robust valuation and quality profiles and above-average sentiment metrics.
Outside of Europe, key detraction stemmed from an overweight position, relative to the benchmark, in Tokyo Electric Power Company. The electricity producer’s stock price trended down during much of the year, and was especially impacted by the inception of the government’s plan to liberalize electricity markets in hopes of spurring competition. Attractive valuation and quality measures support our overweight. Elsewhere, an overweight position in Israel-based Teva Pharmaceutical Industries negatively impacted results. The specialty and generic drugmaker’s quarterly revenues declined, driven by falling sales of Copaxone, its multiple sclerosis treatment. Our investment in the company is justified by a robust valuation profile and above-average quality metrics.
* All fund returns referenced in this commentary are for Investor Class shares. Performance for other share classes will vary due to differences in fee structure; when Investor Class performance exceeds that of the fund's benchmark, other share classes may not. See page 3 for returns for all share classes.
5
Japan-Based Companies Aided Relative Results
Japan-based holdings were key relative contributors, due in part to currency weakness during the first half of the period. A portfolio-only position in Pola Orbis Holdings was a leading country and portfolio contributor. The cosmetics and personal product manufacturer announced its sixth-consecutive annual revenue and operating profit, which was driven by its flagship POLA brand in Japan. WHITE SHOT Inner Lock IX, a skin whitening cream popular among tourists, and sales of Jurlique in Australia also bolstered revenue gains. Strength across sentiment and quality indicators support our positioning. Land-line telephone operator Nippon Telegraph and Telephone released strong quarterly earnings and raised its year-end dividend forecast, helping to bolster its stock price.
In Sweden, contribution stemmed from a portfolio-only position in Peab. The construction and civil engineering company released solid results for 2015, driven by rising orders across all business areas, with particular improvement in housing development. We retain this non-index position based on its attractive profiles across all characteristics. Key contribution also came from an overweight position in Denmark-based Vestas Wind Systems. The wind turbine manufacturer produced rising quarterly earnings and revenues and upgraded its full-year outlook based on growing demand and rising orders for renewable power generation. The agreement on climate change reached during the Paris climate change conference was also a boon for the company’s stock price, and the portfolio’s overweight is based on strength across all measures. An overweight position in Hong Kong-based Link REIT was beneficial as the REIT, with interests in retail properties and parking lots, rallied strongly after announcing solid results for the fiscal year ended March 31, with revenue growing by 13.2% on an annual basis, and net property income rising by 14.9%. The position’s quality and valuation metrics support the portfolio’s overweight.
A Look Ahead
We think that valuation and quality are attractive outside the U.S, and we favor food retailers, construction and engineering, airlines, media, and consumer durables companies, many of which have positive momentum to go with good valuations and earnings quality. Chemicals, banks, real estate, and transport segments are less attractive, as we see poor momentum and mixed signals. On a country basis overweights, relative to the benchmark, include Hong Kong, Denmark, Sweden, Germany, Italy, and the Netherlands. The fund is underweight, relative to the benchmark, in Switzerland, the U.K., and Australia.
6
| Fund Characteristics |
| JUNE 30, 2016 | |
| Top Ten Holdings | % of net assets |
| Roche Holding AG | 2.8% |
| Royal Dutch Shell plc, B Shares | 2.0% |
| Imperial Brands plc | 1.5% |
| Swiss Reinsurance Co. | 1.5% |
| Industria de Diseno Textil SA | 1.4% |
| Rio Tinto plc | 1.4% |
| BNP Paribas SA | 1.4% |
| Nippon Telegraph & Telephone Corp. | 1.4% |
| NTT DOCOMO, Inc. | 1.4% |
| Safran SA | 1.3% |
| Investments by Country | % of net assets |
| Japan | 21.7% |
| United Kingdom | 17.5% |
| France | 10.3% |
| Germany | 9.5% |
| Switzerland | 6.5% |
| Australia | 5.5% |
| Hong Kong | 4.5% |
| Netherlands | 4.1% |
| Sweden | 3.8% |
| Spain | 3.2% |
| Denmark | 3.1% |
| Italy | 3.0% |
| Other Countries | 4.6% |
Exchange-Traded Funds(1) | 1.1% |
Cash and Equivalents(2) | 1.6% |
(1) Category may increase exposure to the countries indicated. The Schedule of Investments provides additional information on the fund's portfolio holdings. | |
(2) Includes temporary cash investments and other assets and liabilities. | |
| Types of Investments in Portfolio | % of net assets |
| Common Stocks | 97.3% |
| Exchange-Traded Funds | 1.1% |
| Rights | —* |
| Total Equity Exposure | 98.4% |
| Temporary Cash Investments | 0.6% |
| Other Assets and Liabilities | 1.0% |
*Category is less than 0.05% of total net assets.
7
| Shareholder Fee Example |
Fund shareholders may incur two types of costs: (1) transaction costs, including sales charges (loads) on purchase payments and redemption/exchange fees; and (2) ongoing costs, including management fees; distribution and service (12b-1) fees; and other fund expenses. This example is intended to help you understand your ongoing costs (in dollars) of investing in your fund and to compare these costs with the ongoing cost of investing in other mutual funds.
The example is based on an investment of $1,000 made at the beginning of the period and held for the entire period from January 1, 2016 to June 30, 2016.
Actual Expenses
The table provides information about actual account values and actual expenses for each class. You may use the information, together with the amount you invested, to estimate the expenses that you paid over the period. First, identify the share class you own. Then simply divide your account value by $1,000 (for example, an $8,600 account value divided by $1,000 = 8.6), then multiply the result by the number under the heading “Expenses Paid During Period” to estimate the expenses you paid on your account during this period.
If you hold Investor Class shares of any American Century Investments fund, or Institutional Class shares of the American Century Diversified Bond Fund, in an American Century Investments account (i.e., not a financial intermediary or retirement plan account), American Century Investments may charge you a $12.50 semiannual account maintenance fee if the value of those shares is less than $10,000. We will redeem shares automatically in one of your accounts to pay the $12.50 fee. In determining your total eligible investment amount, we will include your investments in all personal accounts (including American Century Investments Brokerage accounts) registered under your Social Security number. Personal accounts include individual accounts, joint accounts, UGMA/UTMA accounts, personal trusts, Coverdell Education Savings Accounts and IRAs (including traditional, Roth, Rollover, SEP-, SARSEP- and SIMPLE-IRAs), and certain other retirement accounts. If you have only business, business retirement, employer-sponsored or American Century Investments Brokerage accounts, you are currently not subject to this fee. If you are subject to the Account Maintenance Fee, your account value could be reduced by the fee amount.
Hypothetical Example for Comparison Purposes
The table also provides information about hypothetical account values and hypothetical expenses based on the actual expense ratio of each class of your fund and an assumed rate of return of 5% per year before expenses, which is not the actual return of a fund’s share class. The hypothetical account values and expenses may not be used to estimate the actual ending account balance or expenses you paid for the period. You may use this information to compare the ongoing costs of investing in your fund and other funds. To do so, compare this 5% hypothetical example with the 5% hypothetical examples that appear in the shareholder reports of the other funds.
Please note that the expenses shown in the table are meant to highlight your ongoing costs only and do not reflect any transactional costs, such as sales charges (loads) or redemption/exchange fees. Therefore, the table is useful in comparing ongoing costs only, and will not help you determine the relative total costs of owning different funds. In addition, if these transactional costs were included, your costs would have been higher.
8
| Beginning Account Value 1/1/16 | Ending Account Value 6/30/16 | Expenses Paid During Period(1) 1/1/16 - 6/30/16 | Annualized Expense Ratio(1) | |
| Actual | ||||
| Investor Class | $1,000 | $949.50 | $5.77 | 1.19% |
| Institutional Class | $1,000 | $949.60 | $4.80 | 0.99% |
| A Class | $1,000 | $948.30 | $6.98 | 1.44% |
| C Class | $1,000 | $944.50 | $10.59 | 2.19% |
| R Class | $1,000 | $947.00 | $8.18 | 1.69% |
| Hypothetical | ||||
| Investor Class | $1,000 | $1,018.95 | $5.97 | 1.19% |
| Institutional Class | $1,000 | $1,019.94 | $4.97 | 0.99% |
| A Class | $1,000 | $1,017.70 | $7.22 | 1.44% |
| C Class | $1,000 | $1,013.97 | $10.97 | 2.19% |
| R Class | $1,000 | $1,016.46 | $8.47 | 1.69% |
| (1) | Expenses are equal to the class's annualized expense ratio listed in the table above, multiplied by the average account value over the period, multiplied by 182, the number of days in the most recent fiscal half-year, divided by 366, to reflect the one-half year period. |
9
| Schedule of Investments |
JUNE 30, 2016
| Shares | Value | |||
| COMMON STOCKS — 97.3% | ||||
| Australia — 5.5% | ||||
| Australia & New Zealand Banking Group Ltd. | 9,918 | $ | 180,835 | |
| CIMIC Group Ltd. | 6,920 | 185,329 | ||
| Commonwealth Bank of Australia | 4,596 | 257,918 | ||
| Fortescue Metals Group Ltd. | 33,014 | 88,857 | ||
| Magellan Financial Group Ltd. | 10,142 | 170,021 | ||
Newcrest Mining Ltd.(1) | 4,929 | 84,758 | ||
| Qantas Airways Ltd. | 40,753 | 85,926 | ||
| Rio Tinto Ltd. | 2,083 | 71,732 | ||
| Telstra Corp. Ltd. | 45,785 | 190,541 | ||
| Treasury Wine Estates Ltd. | 12,018 | 83,135 | ||
| Westpac Banking Corp. | 9,102 | 202,128 | ||
| 1,601,180 | ||||
| Belgium — 0.3% | ||||
| Anheuser-Busch InBev SA/NV | 539 | 70,851 | ||
KBC Groep NV(1) | 635 | 31,131 | ||
| 101,982 | ||||
| Denmark — 3.1% | ||||
| Coloplast A/S, B Shares | 3,594 | 268,283 | ||
| Novo Nordisk A/S, B Shares | 5,516 | 296,634 | ||
| Vestas Wind Systems A/S | 4,959 | 336,540 | ||
| 901,457 | ||||
| France — 10.3% | ||||
| AXA SA | 19,363 | 388,995 | ||
| BNP Paribas SA | 9,023 | 405,656 | ||
| Cie de Saint-Gobain | 2,674 | 102,364 | ||
| Cie Generale des Etablissements Michelin, Class B | 573 | 54,283 | ||
| Eurazeo SA | 4,673 | 278,918 | ||
Nexans SA(1) | 1,739 | 73,265 | ||
| Orange SA | 7,101 | 115,988 | ||
Peugeot SA(1) | 15,906 | 193,743 | ||
| Safran SA | 5,746 | 390,514 | ||
| Sanofi | 2,869 | 241,162 | ||
| Societe Generale SA | 1,658 | 52,398 | ||
| TOTAL SA | 6,141 | 296,129 | ||
| Valeo SA | 4,332 | 193,478 | ||
| Vinci SA | 2,823 | 201,059 | ||
| 2,987,952 | ||||
| Germany — 9.5% | ||||
| Allianz SE | 2,686 | 382,680 | ||
| BASF SE | 1,827 | 139,377 | ||
| Bayer AG | 2,529 | 254,448 | ||
| Continental AG | 1,089 | 204,654 | ||
| Deutsche Telekom AG | 19,366 | 329,503 | ||
| E.ON SE | 16,288 | 162,956 | ||
| Hannover Rueck SE | 2,897 | 302,703 | ||
10
| Shares | Value | |||
| HOCHTIEF AG | 579 | $ | 74,584 | |
| METRO AG | 9,056 | 277,034 | ||
| Muenchener Rueckversicherungs-Gesellschaft AG | 1,613 | 269,578 | ||
| ProSiebenSat.1 Media SE | 7,514 | 328,104 | ||
| STADA Arzneimittel AG | 812 | 41,859 | ||
| 2,767,480 | ||||
| Hong Kong — 4.5% | ||||
| BOC Hong Kong Holdings Ltd. | 76,000 | 229,247 | ||
| Hang Seng Bank Ltd. | 19,400 | 333,008 | ||
| Link REIT | 50,000 | 342,056 | ||
| PCCW Ltd. | 66,000 | 44,290 | ||
| WH Group Ltd. | 438,000 | 346,567 | ||
| 1,295,168 | ||||
| India — 0.1% | ||||
| Vedanta Resources plc | 5,136 | 28,578 | ||
| Israel — 0.9% | ||||
| Teva Pharmaceutical Industries Ltd. | 5,105 | 258,407 | ||
| Italy — 3.0% | ||||
| Enel SpA | 69,596 | 309,528 | ||
| Eni SpA | 9,542 | 154,052 | ||
| Mediaset SpA | 20,194 | 71,082 | ||
| Prysmian SpA | 14,831 | 325,120 | ||
| 859,782 | ||||
| Japan — 21.7% | ||||
| Bridgestone Corp. | 5,600 | 178,820 | ||
| Canon, Inc. | 5,800 | 165,501 | ||
| Central Japan Railway Co. | 1,000 | 176,996 | ||
| Chiyoda Corp. | 9,000 | 59,060 | ||
| Coca-Cola West Co. Ltd. | 7,900 | 222,787 | ||
| Daiichi Sankyo Co. Ltd. | 13,600 | 328,161 | ||
| Fuji Heavy Industries Ltd. | 9,900 | 338,899 | ||
| Hitachi Construction Machinery Co. Ltd. | 7,900 | 114,378 | ||
| Hoya Corp. | 5,700 | 202,943 | ||
| Iida Group Holdings Co. Ltd. | 11,900 | 242,381 | ||
| Japan Airlines Co. Ltd. | 8,100 | 259,982 | ||
| Japan Tobacco, Inc. | 3,100 | 124,188 | ||
| JX Holdings, Inc. | 61,000 | 237,037 | ||
| Kao Corp. | 1,000 | 57,709 | ||
| KDDI Corp. | 4,400 | 133,942 | ||
| Komatsu Ltd. | 17,700 | 307,483 | ||
| Lawson, Inc. | 400 | 31,711 | ||
| Mazda Motor Corp. | 2,000 | 26,787 | ||
| Mitsubishi Chemical Holdings Corp. | 38,300 | 174,682 | ||
| Mixi, Inc. | 7,200 | 294,858 | ||
| Nexon Co. Ltd. | 17,100 | 251,208 | ||
| Nippon Telegraph & Telephone Corp. | 8,600 | 403,714 | ||
| NTT Data Corp. | 6,400 | 301,591 | ||
| NTT DOCOMO, Inc. | 14,600 | 392,855 | ||
| ORIX Corp. | 22,200 | 283,482 | ||
| Panasonic Corp. | 3,800 | 32,880 | ||
| Pola Orbis Holdings, Inc. | 2,300 | 214,190 | ||
11
| Shares | Value | |||
| Seiko Epson Corp. | 7,200 | $ | 115,058 | |
| Sumitomo Chemical Co. Ltd. | 27,000 | 110,724 | ||
| Toho Gas Co. Ltd. | 34,000 | 276,621 | ||
Tokyo Electric Power Co. Holdings, Inc.(1) | 31,700 | 133,676 | ||
| Toyota Boshoku Corp. | 2,400 | 49,823 | ||
| Toyota Motor Corp. | 1,000 | 49,997 | ||
| 6,294,124 | ||||
| Netherlands — 4.1% | ||||
| Boskalis Westminster NV | 2,846 | 98,165 | ||
| Heineken Holding NV | 2,208 | 180,366 | ||
| ING Groep NV CVA | 36,553 | 379,925 | ||
| Koninklijke Ahold NV | 16,633 | 369,887 | ||
| NN Group NV | 2,848 | 79,120 | ||
| Unilever NV CVA | 1,600 | 74,590 | ||
| 1,182,053 | ||||
| New Zealand — 0.8% | ||||
| Spark New Zealand Ltd. | 89,095 | 225,804 | ||
| Norway — 1.5% | ||||
| Norsk Hydro ASA | 40,497 | 148,008 | ||
Subsea 7 SA(1) | 29,353 | 287,299 | ||
| 435,307 | ||||
| Portugal — 0.5% | ||||
| Jeronimo Martins SGPS SA | 8,505 | 133,994 | ||
| Singapore — 0.5% | ||||
| Jardine Cycle & Carriage Ltd. | 5,500 | 150,907 | ||
| Spain — 3.2% | ||||
| ACS Actividades de Construccion y Servicios SA | 6,072 | 166,380 | ||
| Banco Santander SA | 40,454 | 157,504 | ||
| Endesa SA | 7,177 | 144,347 | ||
| Industria de Diseno Textil SA | 12,276 | 409,374 | ||
| Mediaset Espana Comunicacion SA | 3,550 | 39,751 | ||
| 917,356 | ||||
| Sweden — 3.8% | ||||
| Atlas Copco AB, A Shares | 3,918 | 101,451 | ||
| Axfood AB | 14,246 | 272,509 | ||
| Electrolux AB | 5,133 | 139,413 | ||
Fastighets AB Balder, B Shares(1) | 9,886 | 249,407 | ||
| Intrum Justitia AB | 9,816 | 306,731 | ||
| Peab AB | 5,673 | 42,933 | ||
| 1,112,444 | ||||
| Switzerland — 6.5% | ||||
| Adecco Group AG | 2,069 | 104,228 | ||
| Galenica AG | 23 | 30,983 | ||
| Nestle SA | 3,804 | 293,424 | ||
| Novartis AG | 2,000 | 164,528 | ||
| Roche Holding AG | 3,023 | 798,164 | ||
| SGS SA | 28 | 64,203 | ||
| Swiss Reinsurance Co. | 4,913 | 429,525 | ||
| 1,885,055 | ||||
| United Kingdom — 17.5% | ||||
| Berkeley Group Holdings plc | 2,544 | 86,603 | ||
12
| Shares | Value | |||
| BHP Billiton plc | 10,089 | $ | 126,905 | |
| BP plc | 36,684 | 214,210 | ||
| British American Tobacco plc | 3,519 | 228,983 | ||
| BT Group plc | 2,839 | 15,676 | ||
| Centrica plc | 102,269 | 308,760 | ||
| Dart Group plc | 8,076 | 56,987 | ||
| Debenhams plc | 27,160 | 20,157 | ||
Evraz plc(1) | 74,858 | 136,409 | ||
| GKN plc | 56,538 | 203,505 | ||
| GlaxoSmithKline plc | 14,421 | 310,027 | ||
| Glencore plc | 44,482 | 90,883 | ||
| Go-Ahead Group plc | 7,947 | 208,145 | ||
| HSBC Holdings plc | 50,739 | 316,969 | ||
| Imperial Brands plc | 8,119 | 440,739 | ||
| Investec plc | 43,743 | 275,723 | ||
| Legal & General Group plc | 55,399 | 143,592 | ||
| Persimmon plc | 10,523 | 205,348 | ||
| Petrofac Ltd. | 4,935 | 51,289 | ||
| Rio Tinto plc | 13,185 | 407,550 | ||
| Royal Dutch Shell plc, B Shares | 21,554 | 592,719 | ||
| SABMiller plc | 1,127 | 65,701 | ||
| Segro plc | 29,557 | 165,928 | ||
| Shire plc | 1,638 | 100,867 | ||
| Sky plc | 25,308 | 287,253 | ||
| 5,060,928 | ||||
TOTAL COMMON STOCKS (Cost $28,703,800) | 28,199,958 | |||
| EXCHANGE-TRADED FUNDS — 1.1% | ||||
| iShares MSCI Japan ETF (Cost $351,092) | 28,546 | 328,279 | ||
RIGHTS† | ||||
Spain† | ||||
ACS Actividades de Construccion y Servicios SA(1) (Cost $4,762) | 6,072 | 4,265 | ||
| TEMPORARY CASH INVESTMENTS — 0.6% | ||||
| State Street Institutional Liquid Reserves Fund, Premier Class (Cost $163,747) | 163,747 | 163,747 | ||
TOTAL INVESTMENT SECURITIES — 99.0% (Cost $29,223,401) | 28,696,249 | |||
| OTHER ASSETS AND LIABILITIES — 1.0% | 290,693 | |||
| TOTAL NET ASSETS — 100.0% | $ | 28,986,942 | ||
13
| MARKET SECTOR DIVERSIFICATION | ||
| (as a % of net assets) | ||
| Financials | 21.9 | % |
| Industrials | 13.2 | % |
| Consumer Discretionary | 12.2 | % |
| Consumer Staples | 12.0 | % |
| Health Care | 10.5 | % |
| Telecommunication Services | 6.5 | % |
| Energy | 6.2 | % |
| Materials | 5.5 | % |
| Utilities | 4.7 | % |
| Information Technology | 4.6 | % |
| Exchange-Traded Funds | 1.1 | % |
| Cash and Equivalents* | 1.6 | % |
* Includes temporary cash investments and other assets and liabilities.
| NOTES TO SCHEDULE OF INVESTMENTS | ||
| CVA | - | Certificaten Van Aandelen |
| † | Category is less than 0.05% of total net assets. |
| (1) | Non-income producing. |
See Notes to Financial Statements.
14
| Statement of Assets and Liabilities |
| JUNE 30, 2016 | |||
| Assets | |||
| Investment securities, at value (cost of $29,223,401) | $ | 28,696,249 | |
| Foreign currency holdings, at value (cost of $65,118) | 64,876 | ||
| Receivable for investments sold | 78,376 | ||
| Receivable for capital shares sold | 89,665 | ||
| Dividends and interest receivable | 96,349 | ||
| 29,025,515 | |||
| Liabilities | |||
| Payable for investments purchased | 88 | ||
| Payable for capital shares redeemed | 3,727 | ||
| Accrued management fees | 27,672 | ||
| Distribution and service fees payable | 2,563 | ||
| Accrued other expenses | 4,523 | ||
| 38,573 | |||
| Net Assets | $ | 28,986,942 | |
| Net Assets Consist of: | |||
| Capital (par value and paid-in surplus) | $ | 35,254,317 | |
| Undistributed net investment income | 254,521 | ||
| Accumulated net realized loss | (5,992,407 | ) | |
| Net unrealized depreciation | (529,489 | ) | |
| $ | 28,986,942 | ||
| Net Assets | Shares Outstanding | Net Asset Value Per Share | ||||
| Investor Class, $0.01 Par Value | $19,646,086 | 2,549,683 | $7.71 | |||
| Institutional Class, $0.01 Par Value | $1,182,924 | 153,167 | $7.72 | |||
| A Class, $0.01 Par Value | $6,441,162 | 835,243 | $7.71* | |||
| C Class, $0.01 Par Value | $1,134,254 | 148,005 | $7.66 | |||
| R Class, $0.01 Par Value | $582,516 | 75,788 | $7.69 | |||
*Maximum offering price $8.18 (net asset value divided by 0.9425).
See Notes to Financial Statements.
15
| Statement of Operations |
| YEAR ENDED JUNE 30, 2016 | |||
| Investment Income (Loss) | |||
| Income: | |||
| Dividends (net of foreign taxes withheld of $93,145) | $ | 1,004,837 | |
| Interest | 624 | ||
| 1,005,461 | |||
| Expenses: | |||
| Management fees | 368,544 | ||
| Distribution and service fees: | |||
| A Class | 18,384 | ||
| C Class | 11,392 | ||
| R Class | 2,784 | ||
| Directors' fees and expenses | 1,904 | ||
| Other expenses | 6,242 | ||
| 409,250 | |||
| Net investment income (loss) | 596,211 | ||
| Realized and Unrealized Gain (Loss) | |||
| Net realized gain (loss) on: | |||
| Investment transactions | (3,496,922 | ) | |
| Foreign currency transactions | (8,892 | ) | |
| (3,505,814 | ) | ||
| Change in net unrealized appreciation (depreciation) on: | |||
| Investments (includes (increase) decrease in accrued foreign taxes of $630) | (1,246,441 | ) | |
| Translation of assets and liabilities in foreign currencies | (979 | ) | |
| (1,247,420 | ) | ||
| Net realized and unrealized gain (loss) | (4,753,234 | ) | |
| Net Increase (Decrease) in Net Assets Resulting from Operations | $ | (4,157,023 | ) |
See Notes to Financial Statements.
16
| Statement of Changes in Net Assets |
| YEARS ENDED JUNE 30, 2016 AND JUNE 30, 2015 | ||||||
| Increase (Decrease) in Net Assets | June 30, 2016 | June 30, 2015 | ||||
| Operations | ||||||
| Net investment income (loss) | $ | 596,211 | $ | 583,087 | ||
| Net realized gain (loss) | (3,505,814 | ) | (427,668 | ) | ||
| Change in net unrealized appreciation (depreciation) | (1,247,420 | ) | (1,163,304 | ) | ||
| Net increase (decrease) in net assets resulting from operations | (4,157,023 | ) | (1,007,885 | ) | ||
| Distributions to Shareholders | ||||||
| From net investment income: | ||||||
| Investor Class | (454,533 | ) | (406,457 | ) | ||
| Institutional Class | (33,011 | ) | (29,164 | ) | ||
| A Class | (128,078 | ) | (103,878 | ) | ||
| C Class | (11,272 | ) | (16,337 | ) | ||
| R Class | (8,431 | ) | (7,243 | ) | ||
| Decrease in net assets from distributions | (635,325 | ) | (563,079 | ) | ||
| Capital Share Transactions | ||||||
| Net increase (decrease) in net assets from capital share transactions (Note 5) | (93,154 | ) | 17,157,171 | |||
| Redemption Fees | ||||||
| Increase in net assets from redemption fees | 11,621 | 7,666 | ||||
| Net increase (decrease) in net assets | (4,873,881 | ) | 15,593,873 | |||
| Net Assets | ||||||
| Beginning of period | 33,860,823 | 18,266,950 | ||||
| End of period | $ | 28,986,942 | $ | 33,860,823 | ||
| Undistributed net investment income | $ | 254,521 | $ | 295,161 | ||
See Notes to Financial Statements.
17
| Notes to Financial Statements |
JUNE 30, 2016
1. Organization
American Century Quantitative Equity Funds, Inc. (the corporation) is registered under the Investment Company Act of 1940, as amended (the 1940 Act), as an open-end management investment company and is organized as a Maryland corporation. International Core Equity Fund (the fund) is one fund in a series issued by the corporation. The fund’s investment objective is to seek long-term capital growth.
The fund offers the Investor Class, the Institutional Class, the A Class, the C Class and the R Class. The A Class may incur an initial sales charge. The A Class and C Class may be subject to a contingent deferred sales charge. The share classes differ principally in their respective sales charges and distribution and shareholder servicing expenses and arrangements. The Institutional Class is made available to institutional shareholders or through financial intermediaries whose clients do not require the same level of shareholder and administrative services as shareholders of other classes. As a result, the Institutional Class is charged a lower unified management fee.
2. Significant Accounting Policies
The following is a summary of significant accounting policies consistently followed by the fund in preparation of its financial statements. The fund is an investment company and follows accounting and reporting guidance in accordance with accounting principles generally accepted in the United States of America. This may require management to make certain estimates and assumptions at the date of the financial statements. Actual results could differ from these estimates. Management evaluated the impact of events or transactions occurring through the date the financial statements were issued that would merit recognition or disclosure.
Investment Valuations — The fund determines the fair value of its investments and computes its net asset value per share at the close of regular trading (usually 4 p.m. Eastern time) on the New York Stock Exchange (NYSE) on each day the NYSE is open. The Board of Directors has adopted valuation policies and procedures to guide the investment advisor in the fund’s investment valuation process and to provide methodologies for the oversight of the fund’s pricing function.
Equity securities that are listed or traded on a domestic securities exchange are valued at the last reported sales price or at the official closing price as provided by the exchange. Equity securities traded on foreign securities exchanges are generally valued at the closing price of such securities on the exchange where primarily traded or at the close of the NYSE, if that is earlier. If no last sales price is reported, or if local convention or regulation so provides, the mean of the latest bid and asked prices may be used. Securities traded over-the-counter are valued at the mean of the latest bid and asked prices, the last sales price, or the official closing price. Equity securities initially expressed in local currencies are translated into U.S. dollars at the mean of the appropriate currency exchange rate at the close of the NYSE as provided by an independent pricing service.
Open-end management investment companies are valued at the reported net asset value per share. Repurchase agreements are valued at cost, which approximates fair value.
If the fund determines that the market price for an investment is not readily available or the valuation methods mentioned above do not reflect an investment’s fair value, such investment is valued as determined in good faith by the Board of Directors or its delegate, in accordance with policies and procedures adopted by the Board of Directors. In its determination of fair value, the fund may review several factors including, but not limited to, market information regarding the specific investment or comparable investments and correlation with other investment types, futures indices or general market indicators. Circumstances that may cause the fund to use these procedures to value an investment include, but are not limited to: an investment has been declared in default or is distressed; trading in a security has been suspended during the trading day or a security is not actively trading on its principal exchange; prices received from a regular pricing source are deemed unreliable; or there is a foreign market holiday and no trading occurred.
The fund monitors for significant events occurring after the close of an investment’s primary exchange but before the fund’s net asset value per share is determined. Significant events may include, but are not limited to: corporate announcements and transactions; governmental action and political unrest that could impact a
18
specific investment or an investment sector; or armed conflicts, natural disasters and similar events that could affect investments in a specific country or region. The fund also monitors for significant fluctuations between domestic and foreign markets, as evidenced by the U.S. market or such other indicators that the Board of Directors, or its delegate, deems appropriate. If significant fluctuations in foreign markets are identified, the fund may apply a model-derived factor to the closing price of equity securities traded on foreign securities exchanges. The factor is based on observable market data as provided by an independent pricing service.
Security Transactions — Security transactions are accounted for as of the trade date. Net realized gains and losses are determined on the identified cost basis, which is also used for federal income tax purposes. Certain countries impose taxes on realized gains on the sale of securities registered in their country. The fund records the foreign tax expense, if any, on an accrual basis. The foreign tax expense on realized gains and unrealized appreciation reduces the net realized gain (loss) on investment transactions and net unrealized appreciation (depreciation) on investments, respectively.
Investment Income — Dividend income less foreign taxes withheld, if any, is recorded as of the ex-dividend date. Distributions received on securities that represent a return of capital or long-term capital gain are recorded as a reduction of cost of investments and/or as a realized gain. The fund may estimate the components of distributions received that may be considered nontaxable distributions or long-term capital gain distributions for income tax purposes. Interest income is recorded on the accrual basis and includes accretion of discounts and amortization of premiums.
Foreign Currency Translations — All assets and liabilities initially expressed in foreign currencies are translated into U.S. dollars at prevailing exchange rates at period end. The fund may enter into spot foreign currency exchange contracts to facilitate transactions denominated in a foreign currency. Purchases and sales of investment securities, dividend and interest income, spot foreign currency exchange contracts, and expenses are translated at the rates of exchange prevailing on the respective dates of such transactions. Net realized and unrealized foreign currency exchange gains or losses related to investment securities are a component of net realized gain (loss) on investment transactions and change in net unrealized appreciation (depreciation) on investments, respectively.
Repurchase Agreements — The fund may enter into repurchase agreements with institutions that American Century Investment Management, Inc. (ACIM) (the investment advisor) has determined are creditworthy pursuant to criteria adopted by the Board of Directors. The fund requires that the collateral, represented by securities, received in a repurchase transaction be transferred to the custodian in a manner sufficient to enable the fund to obtain those securities in the event of a default under the repurchase agreement. ACIM monitors, on a daily basis, the securities transferred to ensure the value, including accrued interest, of the securities under each repurchase agreement is equal to or greater than amounts owed to the fund under each repurchase agreement.
Joint Trading Account — Pursuant to an Exemptive Order issued by the Securities and Exchange Commission, the fund, along with certain other funds in the American Century Investments family of funds, may transfer uninvested cash balances into a joint trading account. These balances are invested in one or more repurchase agreements that are collateralized by U.S. Treasury or Agency obligations.
Income Tax Status — It is the fund’s policy to distribute substantially all net investment income and net realized gains to shareholders and to otherwise qualify as a regulated investment company under provisions of the Internal Revenue Code. Accordingly, no provision has been made for income taxes. The fund files U.S. federal, state, local and non-U.S. tax returns as applicable. The fund's tax returns are subject to examination by the relevant taxing authority until expiration of the applicable statute of limitations, which is generally three years from the date of filing but can be longer in certain jurisdictions. At this time, management believes there are no uncertain tax positions which, based on their technical merit, would not be sustained upon examination and for which it is reasonably possible that the total amounts of unrecognized tax benefits will significantly change in the next twelve months.
Multiple Class — All shares of the fund represent an equal pro rata interest in the net assets of the class to which such shares belong, and have identical voting, dividend, liquidation and other rights and the same terms and conditions, except for class specific expenses and exclusive rights to vote on matters affecting only individual classes. Income, non-class specific expenses, and realized and unrealized capital gains and losses of the fund are allocated to each class of shares based on their relative net assets.
Distributions to Shareholders — Distributions from net investment income and net realized gains, if any, are generally declared and paid annually.
19
Redemption Fees — The fund may impose a 2.00% redemption fee on shares held less than 60 days. The fee may not be applicable to all classes. The redemption fee is retained by the fund and helps cover transaction costs that long-term investors may bear when the fund sells securities to meet investor redemptions.
Indemnifications — Under the corporation’s organizational documents, its officers and directors are indemnified against certain liabilities arising out of the performance of their duties to the fund. In addition, in the normal course of business, the fund enters into contracts that provide general indemnifications. The maximum exposure under these arrangements is unknown as this would involve future claims that may be made against a fund. The risk of material loss from such claims is considered by management to be remote.
3. Fees and Transactions with Related Parties
Certain officers and directors of the corporation are also officers and/or directors of American Century Companies, Inc. (ACC). The corporation’s investment advisor, ACIM, the corporation's distributor, American Century Investment Services, Inc. (ACIS), and the corporation’s transfer agent, American Century Services, LLC, are wholly owned, directly or indirectly, by ACC.
Management Fees — The corporation has entered into a management agreement with ACIM, under which ACIM provides the fund with investment advisory and management services in exchange for a single, unified management fee (the fee) per class. The agreement provides that all expenses of managing and operating the fund, except distribution and service fees, brokerage expenses, taxes, interest, fees and expenses of the independent directors (including legal counsel fees), and extraordinary expenses, will be paid by ACIM. The fee is computed and accrued daily based on each class's daily net assets and paid monthly in arrears. The fee consists of (1) an Investment Category Fee based on the daily net assets of the fund and certain other accounts managed by the investment advisor that are in the same broad investment category as the fund and (2) a Complex Fee based on the assets of all the funds in the American Century Investments family of funds. The rates for the Investment Category Fee range from 0.8180% to 1.0000%. The rates for the Complex Fee range from 0.2500% to 0.3100% for the Investor Class, A Class, C Class and R Class. The rates for the Complex Fee range from 0.0500% to 0.1100% for the Institutional Class. The effective annual management fee for each class for the year ended June 30, 2016 was 1.15% for the Investor Class, A Class, C Class and R Class and 0.95% for the Institutional Class.
Distribution and Service Fees — The Board of Directors has adopted a separate Master Distribution and Individual Shareholder Services Plan for each of the A Class, C Class and R Class (collectively the plans), pursuant to Rule 12b-1 of the 1940 Act. The plans provide that the A Class will pay ACIS an annual distribution and service fee of 0.25%. The plans provide that the C Class will pay ACIS an annual distribution and service fee of 1.00%, of which 0.25% is paid for individual shareholder services and 0.75% is paid for distribution services. The plans provide that the R Class will pay ACIS an annual distribution and service fee of 0.50%. The fees are computed and accrued daily based on each class’s daily net assets and paid monthly in arrears. The fees are used to pay financial intermediaries for distribution and individual shareholder services. Fees incurred under the plans during the year ended June 30, 2016 are detailed in the Statement of Operations.
Directors' Fees and Expenses — The Board of Directors is responsible for overseeing the investment advisor’s management and operations of the fund. The directors receive detailed information about the fund and its investment advisor regularly throughout the year, and meet at least quarterly with management of the investment advisor to review reports about fund operations. The fund’s officers do not receive compensation from the fund.
Other Expenses — The fund’s other expenses may include interest charges, clearing exchange fees, proxy solicitation expenses, filing fees for foreign tax reclaims and other miscellaneous expenses. The impact of other expenses to the ratio of operating expenses to average net assets was 0.02% for the year ended June 30, 2016.
Acquired Fund Fees and Expenses — The fund may invest in mutual funds, exchange-traded funds, and business development companies (the acquired funds). The fund will indirectly realize its pro rata share of the fees and expenses of the acquired funds in which it invests. These indirect fees and expenses are not paid out of the fund's assets but are reflected in the return realized by the fund on its investment in the acquired funds.
20
Interfund Transactions — The fund may enter into security transactions with other American Century Investments funds and other client accounts of the investment advisor, in accordance with the 1940 Act rules and procedures adopted by the Board of Directors. The rules and procedures require, among other things, that these transactions be effected at the independent current market price of the security. During the period, the interfund sales were $355,456 and there were no interfund purchases.
4. Investment Transactions
Purchases and sales of investment securities, excluding short-term investments, for the year ended June 30, 2016 were $37,463,589 and $37,315,626, respectively.
5. Capital Share Transactions
Transactions in shares of the fund were as follows:
| Year ended June 30, 2016 | Year ended June 30, 2015 | |||||||||
| Shares | Amount | Shares | Amount | |||||||
| Investor Class/Shares Authorized | 40,000,000 | 40,000,000 | ||||||||
| Sold | 1,794,729 | $ | 14,683,328 | 1,924,053 | $ | 17,329,540 | ||||
| Issued in reinvestment of distributions | 54,868 | 439,489 | 47,144 | 395,534 | ||||||
| Redeemed | (1,816,957 | ) | (14,662,062 | ) | (679,341 | ) | (6,153,477 | ) | ||
| 32,640 | 460,755 | 1,291,856 | 11,571,597 | |||||||
| Institutional Class/Shares Authorized | 25,000,000 | 30,000,000 | ||||||||
| Sold | 127,204 | 1,006,633 | 128,621 | 1,147,409 | ||||||
| Issued in reinvestment of distributions | 4,116 | 33,011 | 3,476 | 29,164 | ||||||
| Redeemed | (160,182 | ) | (1,277,117 | ) | (45,068 | ) | (427,394 | ) | ||
| (28,862 | ) | (237,473 | ) | 87,029 | 749,179 | |||||
| A Class/Shares Authorized | 20,000,000 | 20,000,000 | ||||||||
| Sold | 296,869 | 2,446,797 | 777,883 | 7,045,308 | ||||||
| Issued in reinvestment of distributions | 15,677 | 125,885 | 12,262 | 102,876 | ||||||
| Redeemed | (399,036 | ) | (3,161,451 | ) | (195,594 | ) | (1,774,912 | ) | ||
| (86,490 | ) | (588,769 | ) | 594,551 | 5,373,272 | |||||
| C Class/Shares Authorized | 15,000,000 | 20,000,000 | ||||||||
| Sold | 43,899 | 352,058 | 79,712 | 722,985 | ||||||
| Issued in reinvestment of distributions | 1,283 | 10,279 | 1,806 | 15,136 | ||||||
| Redeemed | (26,227 | ) | (211,171 | ) | (64,906 | ) | (604,859 | ) | ||
| 18,955 | 151,166 | 16,612 | 133,262 | |||||||
| R Class/Shares Authorized | 15,000,000 | 15,000,000 | ||||||||
| Sold | 18,553 | 150,026 | 57,990 | 531,779 | ||||||
| Issued in reinvestment of distributions | 1,053 | 8,431 | 864 | 7,243 | ||||||
| Redeemed | (4,521 | ) | (37,290 | ) | (126,841 | ) | (1,209,161 | ) | ||
| 15,085 | 121,167 | (67,987 | ) | (670,139 | ) | |||||
| Net increase (decrease) | (48,672 | ) | $ | (93,154 | ) | 1,922,061 | $ | 17,157,171 | ||
21
6. Fair Value Measurements
The fund’s investments valuation process is based on several considerations and may use multiple inputs to determine the fair value of the investments held by the fund. In conformity with accounting principles generally accepted in the United States of America, the inputs used to determine a valuation are classified into three broad levels.
| • | Level 1 valuation inputs consist of unadjusted quoted prices in an active market for identical investments. |
| • | Level 2 valuation inputs consist of direct or indirect observable market data (including quoted prices for comparable investments, evaluations of subsequent market events, interest rates, prepayment speeds, credit risk, etc.). These inputs also consist of quoted prices for identical investments initially expressed in local currencies that are adjusted through translation into U.S. dollars. |
| • | Level 3 valuation inputs consist of unobservable data (including a fund’s own assumptions). |
The level classification is based on the lowest level input that is significant to the fair valuation measurement. The valuation inputs are not necessarily an indication of the risks associated with investing in these securities or other financial instruments. There were no significant transfers between levels during the period.
The following is a summary of the level classifications as of period end. The Schedule of Investments provides additional information on the fund’s portfolio holdings.
| Level 1 | Level 2 | Level 3 | ||||||
| Assets | ||||||||
| Investment Securities | ||||||||
| Common Stocks | — | $ | 28,199,958 | — | ||||
| Exchange-Traded Funds | $ | 328,279 | — | — | ||||
| Rights | — | 4,265 | — | |||||
| Temporary Cash Investments | 163,747 | — | — | |||||
| $ | 492,026 | $ | 28,204,223 | — | ||||
7. Risk Factors
There are certain risks involved in investing in foreign securities. These risks include those resulting from future adverse political, social and economic developments, fluctuations in currency exchange rates, the possible imposition of exchange controls, and other foreign laws or restrictions. Investing in emerging markets may accentuate these risks.
The fund’s investment process may result in high portfolio turnover, which could mean high transaction costs, affecting both performance and capital gains tax liabilities to investors.
8. Federal Tax Information
The tax character of distributions paid during the years ended June 30, 2016 and June 30, 2015 were as follows:
| 2016 | 2015 | |||||
| Distributions Paid From | ||||||
| Ordinary income | $ | 635,325 | $ | 563,079 | ||
| Long-term capital gains | — | — | ||||
The book-basis character of distributions made during the year from net investment income or net realized gains may differ from their ultimate characterization for federal income tax purposes. These differences reflect the differing character of certain income items and net realized gains and losses for financial statement and tax purposes, and may result in reclassification among certain capital accounts on the financial statements.
22
As of June 30, 2016, the federal tax cost of investments and the components of distributable earnings on a tax-basis were as follows:
| Federal tax cost of investments | $ | 29,450,262 | |
| Gross tax appreciation of investments | $ | 1,860,789 | |
| Gross tax depreciation of investments | (2,614,802 | ) | |
| Net tax appreciation (depreciation) of investments | (754,013 | ) | |
| Net tax appreciation (depreciation) on translation of assets and liabilities in foreign currencies | (2,461 | ) | |
| Net tax appreciation (depreciation) | $ | (756,474 | ) |
| Undistributed ordinary income | $ | 371,594 | |
| Accumulated short-term capital losses | $ | (5,455,205 | ) |
Accumulated long-term capital losses | $ | (427,290 | ) |
The difference between book-basis and tax-basis unrealized appreciation (depreciation) is attributable primarily to the realization to ordinary income for tax purposes of unrealized gains on investments in passive foreign investment companies.
Accumulated capital losses represent net capital loss carryovers that may be used to offset future realized capital gains for federal income tax purposes. Any unlimited losses will be required to be utilized prior to the losses which carry an expiration date. Future capital loss carryover utilization in any given year may be subject to Internal Revenue Code limitations. Capital loss carryovers expire as follows:
| 2017* | 2018* | Unlimited (Short-Term) | Unlimited (Long-Term) |
| $(47,669) | $(1,979,923) | $(3,427,613) | $(427,290) |
*As a result of a shift in ownership of the fund, the utilization of these capital loss carryovers are limited.
23
| Financial Highlights |
| For a Share Outstanding Throughout the Years Ended June 30 (except as noted) | |||||||||||||
| Per-Share Data | Ratios and Supplemental Data | ||||||||||||
| Income From Investment Operations: | Ratio to Average Net Assets of: | ||||||||||||
Net Asset Value, Beginning of Period | Net Investment Income (Loss)(1) | Net Realized and Unrealized Gain (Loss) | Total From Investment Operations | Distributions From Net Investment Income | Net Asset Value, End of Period | Total Return(2) | Operating Expenses | Net Investment Income (Loss) | Portfolio Turnover Rate | Net Assets, End of Period (in thousands) | |||
| Investor Class | |||||||||||||
| 2016 | $8.89 | 0.16 | (1.18) | (1.02) | (0.16) | $7.71 | (11.53)% | 1.17% | 1.94% | 117% | $19,646 | ||
| 2015 | $9.68 | 0.24 | (0.75) | (0.51) | (0.28) | $8.89 | (5.11)% | 1.15% | 2.67% | 96% | $22,366 | ||
| 2014 | $7.77 | 0.26 | 1.76 | 2.02 | (0.11) | $9.68 | 26.15% | 1.15% | 2.61% | 125% | $11,859 | ||
| 2013 | $6.66 | 0.22 | 1.13 | 1.35 | (0.24) | $7.77 | 20.60% | 1.16% | 2.85% | 101% | $3,233 | ||
| 2012 | $8.08 | 0.15 | (1.43) | (1.28) | (0.14) | $6.66 | (15.68)% | 1.18% | 2.42% | 113% | $1,917 | ||
| Institutional Class | |||||||||||||
| 2016 | $8.90 | 0.17 | (1.17) | (1.00) | (0.18) | $7.72 | (11.34)% | 0.97% | 2.14% | 117% | $1,183 | ||
| 2015 | $9.69 | 0.26 | (0.75) | (0.49) | (0.30) | $8.90 | (4.91)% | 0.95% | 2.87% | 96% | $1,621 | ||
| 2014 | $7.78 | 0.28 | 1.76 | 2.04 | (0.13) | $9.69 | 26.37% | 0.95% | 2.81% | 125% | $921 | ||
| 2013 | $6.67 | 0.22 | 1.15 | 1.37 | (0.26) | $7.78 | 20.81% | 0.96% | 3.05% | 101% | $504 | ||
| 2012 | $8.10 | 0.18 | (1.45) | (1.27) | (0.16) | $6.67 | (15.59)% | 0.98% | 2.62% | 113% | $419 | ||
| A Class | |||||||||||||
| 2016 | $8.89 | 0.13 | (1.17) | (1.04) | (0.14) | $7.71 | (11.75)% | 1.42% | 1.69% | 117% | $6,441 | ||
| 2015 | $9.67 | 0.24 | (0.76) | (0.52) | (0.26) | $8.89 | (5.25)% | 1.40% | 2.42% | 96% | $8,196 | ||
| 2014 | $7.76 | 0.16 | 1.84 | 2.00 | (0.09) | $9.67 | 25.87% | 1.40% | 2.36% | 125% | $3,164 | ||
| 2013 | $6.65 | 0.19 | 1.15 | 1.34 | (0.23) | $7.76 | 20.34% | 1.41% | 2.60% | 101% | $2,162 | ||
| 2012 | $8.07 | 0.18 | (1.47) | (1.29) | (0.13) | $6.65 | (15.92)% | 1.43% | 2.17% | 113% | $1,845 | ||
| For a Share Outstanding Throughout the Years Ended June 30 (except as noted) | |||||||||||||
| Per-Share Data | Ratios and Supplemental Data | ||||||||||||
| Income From Investment Operations: | Ratio to Average Net Assets of: | ||||||||||||
Net Asset Value, Beginning of Period | Net Investment Income (Loss)(1) | Net Realized and Unrealized Gain (Loss) | Total From Investment Operations | Distributions From Net Investment Income | Net Asset Value, End of Period | Total Return(2) | Operating Expenses | Net Investment Income (Loss) | Portfolio Turnover Rate | Net Assets, End of Period (in thousands) | |||
| C Class | |||||||||||||
| 2016 | $8.84 | 0.08 | (1.18) | (1.10) | (0.08) | $7.66 | (12.48)% | 2.17% | 0.94% | 117% | $1,134 | ||
| 2015 | $9.62 | 0.13 | (0.72) | (0.59) | (0.19) | $8.84 | (6.02)% | 2.15% | 1.67% | 96% | $1,141 | ||
| 2014 | $7.72 | 0.14 | 1.78 | 1.92 | (0.02) | $9.62 | 24.92% | 2.15% | 1.61% | 125% | $1,081 | ||
| 2013 | $6.62 | 0.14 | 1.13 | 1.27 | (0.17) | $7.72 | 19.40% | 2.16% | 1.85% | 101% | $974 | ||
| 2012 | $8.04 | 0.11 | (1.45) | (1.34) | (0.08) | $6.62 | (16.62)% | 2.18% | 1.42% | 113% | $698 | ||
| R Class | |||||||||||||
| 2016 | $8.86 | 0.12 | (1.17) | (1.05) | (0.12) | $7.69 | (11.90)% | 1.67% | 1.44% | 117% | $583 | ||
| 2015 | $9.65 | 0.16 | (0.72) | (0.56) | (0.23) | $8.86 | (5.61)% | 1.65% | 2.17% | 96% | $538 | ||
| 2014 | $7.74 | 0.19 | 1.79 | 1.98 | (0.07) | $9.65 | 25.62% | 1.65% | 2.11% | 125% | $1,242 | ||
| 2013 | $6.64 | 0.17 | 1.14 | 1.31 | (0.21) | $7.74 | 19.93% | 1.66% | 2.35% | 101% | $956 | ||
| 2012 | $8.06 | 0.14 | (1.45) | (1.31) | (0.11) | $6.64 | (16.15)% | 1.68% | 1.92% | 113% | $795 | ||
| Notes to Financial Highlights |
| (1) | Computed using average shares outstanding throughout the period. |
| (2) | Total returns are calculated based on the net asset value of the last business day and do not reflect applicable sales charges, if any. Total returns for periods less than one year are not annualized. |
See Notes to Financial Statements.
| Report of Independent Registered Public Accounting Firm |
To the Directors of the American Century Quantitative Equity Funds, Inc. and Shareholders of the International Core Equity Fund:
In our opinion, the accompanying statement of assets and liabilities, including the schedule of investments, and the related statements of operations and of changes in net assets and the financial highlights present fairly, in all material respects, the financial position of the International Core Equity Fund (one of the sixteen funds comprising the American Century Quantitative Equity Funds, Inc., hereafter referred to as the “Fund”) at June 30, 2016, the results of its operations for the year then ended, the changes in its net assets for each of the two years in the period then ended and the financial highlights for each of the five years in the period then ended, in conformity with accounting principles generally accepted in the United States of America. These financial statements and financial highlights (hereafter referred to as "financial statements") are the responsibility of the Fund's management. Our responsibility is to express an opinion on these financial statements based on our audits. We conducted our audits of these financial statements in accordance with the standards of the Public Company Accounting Oversight Board (United States). Those standards require that we plan and perform the audit to obtain reasonable assurance about whether the financial statements are free of material misstatement. An audit includes examining, on a test basis, evidence supporting the amounts and disclosures in the financial statements, assessing the accounting principles used and significant estimates made by management, and evaluating the overall financial statement presentation. We believe that our audits, which included confirmation of securities at June 30, 2016 by correspondence with the custodian and brokers, provide a reasonable basis for our opinion.
PricewaterhouseCoopers LLP
Kansas City, Missouri
August 17, 2016
26
| Management |
Board of Directors
The individuals listed below serve as directors of the funds. Each director will continue to serve in this capacity until death, retirement, resignation or removal from office. The board has adopted a mandatory retirement age for directors who are not “interested persons,” as that term is defined in the Investment Company Act (independent directors). Independent directors shall retire on December 31 of the year in which they reach their 75th birthday; provided, however, that on or after January 1, 2022, independent directors shall retire on December 31 of the year in which they reach their 76th birthday.
Mr. Thomas is an “interested person” because he currently serves as President and Chief Executive Officer of American Century Companies, Inc. (ACC), the parent company of American Century Investment Management, Inc. (ACIM or the advisor). The other directors (more than three-fourths of the total number) are independent. They are not employees, directors or officers of, and have no financial interest in, ACC or any of its wholly owned, direct or indirect, subsidiaries, including ACIM, American Century Investment Services, Inc. (ACIS) and American Century Services, LLC (ACS), and they do not have any other affiliations, positions or relationships that would cause them to be considered “interested persons” under the Investment Company Act. The directors serve in this capacity for eight (in the case of Mr. Thomas, 15) registered investment companies in the American Century Investments family of funds.
The following table presents additional information about the directors. The mailing address for each director other than Mr. Thomas is 1665 Charleston Road, Mountain View, California 94043. The mailing address for Mr. Thomas is 4500 Main Street, Kansas City, Missouri 64111.
Name (Year of Birth) | Position(s) Held with Funds | Length of Time Served | Principal Occupation(s) During Past 5 Years | Number of American Century Portfolios Overseen by Director | Other Directorships Held During Past 5 Years |
| Independent Directors | |||||
| Tanya S. Beder (1955) | Director | Since 2011 | Chairman and CEO, SBCC Group Inc. (independent advisory services) (2006 to present) | 45 | CYS Investments, Inc. (NYSE mortgage arbitrage REIT) |
| Jeremy I. Bulow (1954) | Director | Since 2011 | Professor of Economics, Stanford University, Graduate School of Business (1979 to present) | 45 | None |
| Anne Casscells (1958) | Director | Since 2016 | Co-Chief Executive Officer and Chief Investment Officer, Aetos Alternatives Management (investment advisory firm) (2001 to present); Lecturer in Accounting, Stanford University, Graduate School of Business (2009 to present) | 45 | None |
27
Name (Year of Birth) | Position(s) Held with Funds | Length of Time Served | Principal Occupation(s) During Past 5 Years | Number of American Century Portfolios Overseen by Director | Other Directorships Held During Past 5 Years |
| Independent Directors | |||||
| Ronald J. Gilson (1946) | Director and Chairman of the Board | Since 1995 (Chairman since 2005) | Charles J. Meyers Professor of Law and Business, Emeritus, Stanford Law School (1979 to present); Marc and Eva Stern Professor of Law and Business, Columbia University School of Law (1992 to present) | 45 | None |
| Frederick L. A. Grauer (1946) | Director | Since 2008 | Senior Advisor, iShares by BlackRock, Inc. (investment management firm) (2010 to 2011, 2013 to present); Senior Advisor, Course Hero (an educational technology company) (2015 to present) | 45 | None |
| Jonathan D. Levin (1972) | Director | Since 2016 | Holbrook Working Professor of Price Theory, Stanford University, (2000 to present); Chair, Department of Economics, Stanford University (2011 to 2014) | 45 | None |
| Peter F. Pervere (1947) | Director | Since 2007 | Retired | 45 | None |
| John B. Shoven (1947) | Director | Since 2002 | Charles R. Schwab Professor of Economics, Stanford University (1973 to present) | 45 | Cadence Design Systems; Exponent; Financial Engines |
| Interested Director | |||||
| Jonathan S. Thomas (1963) | Director and President | Since 2007 | President and Chief Executive Officer, ACC (March 2007 to present). Also serves as Chief Executive Officer, ACS; Executive Vice President, ACIM; Director, ACC, ACIM and other ACC subsidiaries | 128 | BioMed Valley Discoveries, Inc. |
The Statement of Additional Information has additional information about the fund's directors and is available without charge, upon request, by calling 1-800-345-2021.
28
Officers
The following table presents certain information about the executive officers of the funds. Each officer serves as an officer for each of the 15 investment companies in the American Century family of funds, unless otherwise noted. No officer is compensated for his or her service as an officer of the funds. The listed officers are interested persons of the funds and are appointed or re-appointed on an annual basis. The mailing address for each of the officers listed below is 4500 Main Street, Kansas City, Missouri 64111.
Name (Year of Birth) | Offices with the Funds | Principal Occupation(s) During the Past Five Years |
| Jonathan S. Thomas (1963) | Director and President since 2007 | President and Chief Executive Officer, ACC (March 2007 to present). Also serves as Chief Executive Officer, ACS; Executive Vice President, ACIM; Director, ACC, ACIM and other ACC subsidiaries |
| Amy D. Shelton (1964) | Chief Compliance Officer and Vice President since 2014 | Chief Compliance Officer, American Century funds, (March 2014 to present); Chief Compliance Officer, ACIM (February 2014 to present); Chief Compliance Officer, ACIS (October 2009 to present); Vice President, Client Interactions and Marketing, ACIS (February 2013 to January 2014); Director, Client Interactions and Marketing, ACIS (June 2007 to January 2013). Also serves as Vice President, ACIS |
| Charles A. Etherington (1957) | General Counsel since 2007 and Senior Vice President since 2006 | Attorney, ACC (February 1994 to present); Vice President, ACC (November 2005 to present); General Counsel, ACC (March 2007 to present). Also serves as General Counsel, ACIM, ACS, ACIS and other ACC subsidiaries; and Senior Vice President, ACIM and ACS |
| C. Jean Wade (1964) | Vice President, Treasurer and Chief Financial Officer since 2012 | Vice President, ACS (February 2000 to present) |
| Robert J. Leach (1966) | Vice President since 2006 and Assistant Treasurer since 2012 | Vice President, ACS (February 2000 to present) |
| David H. Reinmiller (1963) | Vice President since 2001 | Attorney, ACC (January 1994 to present); Associate General Counsel, ACC (January 2001 to present). Also serves as Vice President, ACIM and ACS |
| Ward D. Stauffer (1960) | Secretary since 2005 | Attorney, ACC (June 2003 to present) |
29
| Approval of Management Agreement |
At a meeting held on June 14, 2016, the Fund’s Board of Directors (the "Board") unanimously approved the renewal of the management agreement pursuant to which American Century Investment Management, Inc. (the “Advisor”) acts as the investment advisor for the Fund. Under Section 15(c) of the Investment Company Act, contracts for investment advisory services are required to be reviewed, evaluated, and approved by a majority of a fund’s directors/trustees, including a majority of the independent Directors, each year. The Board regards this annual evaluation and renewal as one of its most important responsibilities.
The independent Directors have memorialized a statement regarding the relationship between their ongoing obligations to oversee and evaluate the performance of the Advisor and their annual consideration of renewal of the management agreement. In that statement, the independent Directors noted that their assessment of the Advisor’s performance is an ongoing process that takes place over the entire year and is informed by all of the extensive information that the Board and its committees receive and consider over time. This information, together with the additional materials provided specifically in connection with the review, are central to the Board’s assessment of the Advisor’s performance and its determination whether to renew the Fund’s management agreement.
Prior to its consideration of the renewal of the management agreement, the Board requested and reviewed extensive data and analysis relating to the proposed renewal. This information and analysis was compiled by the Advisor and certain independent providers of evaluation data concerning the Fund and the services provided to the Fund by the Advisor.
In connection with its consideration of the renewal of the management agreement, the Board’s review and evaluation of the services provided by the Advisor included, but was not limited to, the following:
| • | the nature, extent, and quality of investment management, shareholder services, and other services provided by the Advisor to the Fund; |
| • | the wide range of other programs and services the Advisor provides to the Fund and its shareholders on a routine and non-routine basis; |
| • | the investment performance of the Fund, including data comparing the Fund’s performance to appropriate benchmarks and/or a peer group of other mutual funds with similar investment objectives and strategies; |
| • | the cost of owning the Fund compared to the cost of owning similar funds; |
| • | the Advisor’s compliance policies, procedures, and regulatory experience; |
| • | financial data showing the cost of services provided to the Fund, the profitability of the Fund to the Advisor, and the overall profitability of the Advisor; |
| • | possible economies of scale associated with the Advisor’s management of the Fund and other accounts under its management; |
| • | data comparing services provided and charges to other investment management clients of the Advisor; |
| • | acquired fund fees and expenses; |
| • | payments by the Fund and the Advisor to financial intermediaries whose clients are investors in the Fund; and |
| • | any collateral benefits derived by the Advisor from the management of the Fund. |
In keeping with its practice, the Board held two in-person meetings to review and discuss the information provided in response to their request. The independent Directors also had the benefit of the advice of their independent counsel throughout the process.
30
Factors Considered
The Directors considered all of the information provided by the Advisor, the independent data providers, and the independent Directors’ independent counsel in connection with the approval. They determined that the information was sufficient for them to evaluate the management agreement for the Fund. In connection with their review, the Directors did not identify any single factor as being all-important or controlling and each Director may have attributed different levels of importance to different factors. In deciding to renew the management agreement, the Board based its decision on a number of factors, including the following:
Nature, Extent and Quality of Services - Generally. Under the management agreement, the Advisor is responsible for providing or arranging for all services necessary for the operation of the Fund. The Board noted that under the management agreement, the Advisor provides or arranges at its own expense a wide variety of services including:
| • | constructing and designing the Fund |
| • | portfolio research and security selection |
| • | initial capitalization/funding |
| • | securities trading |
| • | Fund administration |
| • | custody of Fund assets |
| • | daily valuation of the Fund’s portfolio |
| • | shareholder servicing and transfer agency, including shareholder confirmations, recordkeeping, and communications |
| • | legal services (except the independent Directors’ counsel) |
| • | regulatory and portfolio compliance |
| • | financial reporting |
| • | marketing and distribution (except amounts paid by the Fund under Rule 12b-1 plans) |
The Board noted that many of these services have expanded over time in terms of both quantity and complexity in response to shareholder demands, competition in the industry, changing distribution channels, and the changing regulatory environment.
Investment Management, Shareholder, and Other Services. The nature of the investment management services provided to the Fund is quite complex and allows Fund shareholders access to professional money management, instant diversification of their investments within an asset class, the opportunity to easily diversify among asset classes by investing in or exchanging among various American Century Investments funds, and liquidity. In evaluating investment performance, the Board expects the Advisor to manage the Fund in accordance with its investment objectives and approved strategies. Further, the Directors recognize that the Advisor has an obligation to seek the best execution of fund trades. In providing these services, the Advisor utilizes teams of investment professionals (portfolio managers, analysts, research assistants, and securities traders) who require extensive information technology, research, training, compliance, and other systems to conduct their business. The Board, directly and through its Portfolio Committee, regularly reviews investment performance information for the Fund, together with comparative information for appropriate benchmarks and/or peer groups of similarly-managed funds, over different time horizons. The Directors also review detailed performance information during the management agreement approval process. If performance concerns are identified, the Fund receives special reviews until performance improves, during which the Board discusses with the Advisor the reasons for such results (e.g., market conditions, security selection) and any efforts being undertaken to improve performance. The Fund’s performance was above its benchmark for the one-, three-, and five-year periods reviewed by the Board. The Board found the investment management services provided by the Advisor to the Fund to be satisfactory and consistent with the management agreement.
31
Under the management agreement, the Advisor provides the Fund with a comprehensive package of transfer agency, shareholder, and other services. The Board, directly and through various committees of the Board, regularly reviews reports and evaluations of such services at its regular meetings. These reports include, but are not limited to, information regarding the operational efficiency and accuracy of the shareholder and transfer agency services provided, staffing levels, shareholder satisfaction (as measured by external as well as internal sources), technology support, new products and services offered to Fund shareholders, securities trading activities, portfolio valuation services, auditing services, and legal and operational compliance activities. Certain aspects of shareholder and transfer agency service level efficiency and the quality of securities trading activities are measured by independent third party providers and are presented in comparison to other fund groups not managed by the Advisor.
The Board found the services provided by the Advisor to the Fund under the management agreement to be competitive and of high quality.
Costs of Services and Profitability. The Advisor provides detailed information concerning its cost of providing various services to the Fund, its profitability in managing the Fund, its overall profitability, and its financial condition. The Directors have reviewed with the Advisor the methodology used to prepare this financial information. This information is considered in evaluating the Advisor’s financial condition, its ability to continue to provide services under the management agreement, and the reasonableness of the current management fee. The Board concluded that the Advisor’s profits were reasonable in light of the services provided to the Fund.
Economies of Scale. The Board also reviewed information provided by the Advisor regarding the possible existence of economies of scale in connection with the management of the Fund. The Board concluded that economies of scale are difficult to measure and predict with precision, especially on a fund-by-fund basis. The Board concluded that the Advisor is appropriately sharing economies of scale through its competitive fee structure, offering competitive fees from fund inception, and through reinvestment in its business to provide shareholders enhanced and expanded services.
Comparison to Other Funds’ Fees. The management agreement provides that the Fund pays the Advisor a single, all-inclusive (or unified) management fee for providing all services necessary for the management and operation of the Fund, other than brokerage expenses, expenses attributable to short sales, taxes, interest, extraordinary expenses, the fees and expenses of the Fund’s independent Directors (including their independent legal counsel), and expenses incurred in connection with the provision of shareholder services and distribution services under a plan adopted pursuant to Rule 12b-1 under the 1940 Act. Under the unified fee structure, the Advisor is responsible for providing all investment advisory, custody, audit, administrative, compliance, recordkeeping, marketing, and shareholder services, or arranging and supervising third parties to provide such services. By contrast, most other funds are charged a variety of fees, including an investment advisory fee, a transfer agency fee, an administrative fee, distribution charges, and other expenses. Other than their investment advisory fees and any applicable Rule 12b-1 fees, all other components of the total fees charged by these other funds may be increased without shareholder approval. The Board believes the unified fee structure is a benefit to Fund shareholders because it clearly discloses to shareholders the cost of owning Fund shares, and, since the unified fee cannot be increased without a vote of Fund shareholders, it shifts to the Advisor the risk of increased costs of operating the Fund and provides a direct incentive to minimize administrative inefficiencies. Part of the Board’s analysis of fee levels involves reviewing certain evaluative data compiled by an independent provider and comparing the Fund’s unified fee to the total expense ratio of peer funds. The unified fee charged to shareholders of the Fund was below the median of the total expense ratios of the Fund’s peer universe. The Board concluded that the management fee paid by the Fund to the Advisor under the management agreement is reasonable in light of the services provided to the Fund.
32
Comparison to Fees and Services Provided to Other Clients of the Advisor. The Board also requested and received information from the Advisor concerning the nature of the services, fees, costs, and profitability of its advisory services to advisory clients other than the Fund. They observed that these varying types of client accounts require different services and involve different regulatory and entrepreneurial risks than the management of the Fund. The Board analyzed this information and concluded that the fees charged and services provided to the Fund were reasonable by comparison.
Payments to Intermediaries. The Directors also requested and received a description of payments made to intermediaries by the Fund and the Advisor. These payments include various payments made by the Fund or the Advisor to different types of intermediaries and recordkeepers for distribution and service activities provided for the Fund.
Collateral or “Fall-Out” Benefits Derived by the Advisor. The Board considered the existence of collateral benefits the Advisor may receive as a result of its relationship with the Fund. The Board noted that the Advisor’s primary business is managing mutual funds and it generally does not use fund or shareholder information to generate profits in other lines of business, and therefore does not derive any significant collateral benefits from them. The Board noted that the Advisor receives proprietary research from broker-dealers that execute fund portfolio transactions. The Board also determined that the Advisor is able to provide investment management services to certain clients other than the Fund, at least in part, due to its existing infrastructure built to serve the fund complex. The Board concluded, however, that the assets of those other clients are not material to the analysis and, where applicable, may be included with the assets of the Fund to determine breakpoints in the management fee schedule.
Existing Relationship. The Board also considered whether there was any reason for not continuing the existing arrangement with the Advisor. In this regard, the Board was mindful of the potential disruptions of the Fund’s operations and various risks, uncertainties, and other effects that could occur as a result of a decision not to continue such relationship. In particular, the Board recognized that most shareholders have invested in the Fund on the strength of the Advisor’s industry standing and reputation and in the expectation that the Advisor will have a continuing role in providing advisory services to the Fund.
Conclusion of the Directors. As a result of this process, the Board, including all of the independent Directors and assisted by the advice of independent legal counsel, taking into account all of the factors discussed above and the information provided by the Advisor and others in connection with its review and throughout the year, concluded that the management agreement between the Fund and the Advisor is fair and reasonable in light of the services provided and should be renewed.
33
| Proxy Voting Results |
A special meeting of shareholders was held on June 13, 2016, to vote on the following proposal. The proposal received the required number of votes and was adopted. A summary of voting results is listed below.
To elect four directors to the Board of Directors of American Century Quantitative Equity Funds, Inc.:
| Affirmative | Withhold | ||||||
| Tanya S. Beder | $ | 8,473,153,264 | $ | 121,459,590 | |||
| Jeremy I. Bulow | $ | 8,469,793,581 | $ | 124,819,273 | |||
| Anne Casscells | $ | 8,465,895,232 | $ | 128,717,622 | |||
| Jonathan D. Levin | $ | 8,468,929,867 | $ | 125,682,987 | |||
The other directors whose term of office continued after the meeting include Jonathan S. Thomas, Ronald J. Gilson, Frederick L. A. Grauer, Peter F. Pervere and John B. Shoven.
34
| Additional Information |
Retirement Account Information
As required by law, distributions you receive from certain IRAs are subject to federal income tax withholding, unless you elect not to have withholding apply. Tax will be withheld on the total amount withdrawn even though you may be receiving amounts that are not subject to withholding, such as nondeductible contributions. In such case, excess amounts of withholding could occur. You may adjust your withholding election so that a greater or lesser amount will be withheld.
If you don’t want us to withhold on this amount, you must notify us to not withhold the federal income tax. You may notify us in writing or in certain situations by telephone or through other electronic means. For systematic withdrawals, your withholding election will remain in effect until revoked or changed by filing a new election. You have the right to revoke your election at any time.
Remember, even if you elect not to have income tax withheld, you are liable for paying income tax on the taxable portion of your withdrawal. If you elect not to have income tax withheld or you don’t have enough income tax withheld, you may be responsible for payment of estimated tax. You may incur penalties under the estimated tax rules if your withholding and estimated tax payments are not sufficient. You can reduce or defer the income tax on a distribution by directly or indirectly rolling such distribution over to another IRA or eligible plan. You should consult your tax advisor for additional information.
State tax will be withheld if, at the time of your distribution, your address is within one of the mandatory withholding states and you have federal income tax withheld (or as otherwise required by state law). State taxes will be withheld from your distribution in accordance with the respective state rules.
Distributions you receive from 403(b), 457 and qualified plans are subject to special tax and withholding rules. Your plan administrator or plan sponsor is required to provide you with a special tax notice explaining those rules at the time you request a distribution. If applicable, federal and/or state taxes may be withheld from your distribution amount.
Proxy Voting Policies
Descriptions of the principles and policies that the fund's investment advisor uses in exercising the voting rights associated with the securities purchased and/or held by the fund are available without charge, upon request, by calling 1-800-345-2021 or visiting the "About Us" page of American Century Investments’ website at americancentury.com. A description of the policies is also available on the Securities and Exchange Commission’s website at sec.gov. Information regarding how the investment advisor voted proxies relating to portfolio securities during the most recent 12-month period ended June 30 is available on the "About Us" page at americancentury.com. It is also available at sec.gov.
Quarterly Portfolio Disclosure
The fund files its complete schedule of portfolio holdings with the Securities and Exchange Commission (SEC) for the first and third quarters of each fiscal year on Form N-Q. The fund’s Forms N-Q are available on the SEC’s website at sec.gov, and may be reviewed and copied at the SEC’s Public Reference Room in Washington, DC. Information on the operation of the Public Reference Room may be obtained by calling 1-800-SEC-0330. The fund also makes its complete schedule of portfolio holdings for the most recent quarter of its fiscal year available on its website at americancentury.com and, upon request, by calling 1-800-345-2021.
35
Other Tax Information
The following information is provided pursuant to provisions of the Internal Revenue Code.
The fund hereby designates up to the maximum amount allowable as qualified dividend income for the fiscal year ended June 30, 2016.
For the fiscal year ended June 30, 2016, the fund intends to pass through to shareholders foreign source income of $1,084,558 and foreign taxes paid of $90,348, or up to the maximum amount allowable, as a foreign tax credit. Foreign source income and foreign tax expense per outstanding share on June 30, 2016 are $0.2883 and $0.0240, respectively.
36
| ||
| Contact Us | americancentury.com | |
| Automated Information Line | 1-800-345-8765 | |
| Investor Services Representative | 1-800-345-2021 or 816-531-5575 | |
| Investors Using Advisors | 1-800-378-9878 | |
| Business, Not-For-Profit, Employer-Sponsored Retirement Plans | 1-800-345-3533 | |
| Banks and Trust Companies, Broker-Dealers, Financial Professionals, Insurance Companies | 1-800-345-6488 | |
| Telecommunications Relay Service for the Deaf | 711 | |
| American Century Quantitative Equity Funds, Inc. | ||
Investment Advisor: American Century Investment Management, Inc. Kansas City, Missouri | ||
| This report and the statements it contains are submitted for the general information of our shareholders. The report is not authorized for distribution to prospective investors unless preceded or accompanied by an effective prospectus. | ||
| ©2016 American Century Proprietary Holdings, Inc. All rights reserved. CL-ANN-89949 1608 | ||
| Annual Report | |
| June 30, 2016 | |
| Multi-Asset Real Return Fund | |
| Table of Contents |
| President's Letter | 2 | |
| Performance | 3 | |
| Portfolio Commentary | ||
| Fund Characteristics | ||
| Shareholder Fee Example | ||
| Schedule of Investments | ||
| Statement of Assets and Liabilities | ||
| Statement of Operations | ||
| Statement of Changes in Net Assets | ||
| Notes to Financial Statements | ||
| Financial Highlights | ||
| Report of Independent Registered Public Accounting Firm | ||
| Management | ||
| Approval of Management Agreement | ||
| Proxy Voting Results | ||
| Additional Information | ||
Any opinions expressed in this report reflect those of the author as of the date of the report, and do not necessarily represent the opinions of American Century Investments® or any other person in the American Century Investments organization. Any such opinions are subject to change at any time based upon market or other conditions and American Century Investments disclaims any responsibility to update such opinions. These opinions may not be relied upon as investment advice and, because investment decisions made by American Century Investments funds are based on numerous factors, may not be relied upon as an indication of trading intent on behalf of any American Century Investments fund. Security examples are used for representational purposes only and are not intended as recommendations to purchase or sell securities. Performance information for comparative indices and securities is provided to American Century Investments by third party vendors. To the best of American Century Investments’ knowledge, such information is accurate at the time of printing.
| President’s Letter |
Jonathan ThomasDear Investor:
Thank you for reviewing this annual report for the 12 months ended June 30, 2016. It provides investment performance and portfolio information for the reporting period, plus longer-term historical performance data.
Annual reports remain important vehicles for conveying information about fund returns, including market and economic factors that affected performance during the reporting period. For additional, updated investment and market insights, we encourage you to visit our website, americancentury.com.
Market Volatility Increased, But Not for the Reasons Anticipated
Going into this reporting period, investors anticipated increased market volatility and uncertainty as the Federal Reserve (the Fed) appeared poised to raise short-term interest rates toward more historically normal levels. This policy change was expected to affect investor sentiment, U.S. Treasury yield behavior, relative currency values, inflation expectations, and corporate costs and earnings.
This Fed-centric outlook didn’t fully account for global factors, which ultimately drove sentiment, volatility, and performance during the reporting period. During 2015, the primary catalyst was China, where slowing economic growth, currency devaluations, and massive monetary policy easing sent shock waves through the global markets. The Fed ended up delaying (until December 2015) its only small rate hike during the reporting period. Afterward, China-related events repeated in January and early February this year, further delaying Fed action.
Oil was another catalyst—its price collapses devalued entire market sectors and contributed to broad market volatility and negative sentiment. Later, as China and oil appeared to stabilize, Brexit occurred—the unexpected decision by United Kingdom voters to leave the European Union. This produced more shock waves, and altered central bank policies around the world. In this environment, relatively defensive assets performed best for the 12 months, including the stocks of gold-producing companies, utilities, real estate investment trusts (REITs), and long-maturity U.S. Treasury securities.
Looking ahead, we believe the markets face further uncertainty and volatility as they digest Brexit, the Italian bank crisis, China’s economic mysteries, and the U.S. presidential election. Negative interest rates in Europe and Japan represent part of the market’s response to the global macroeconomic climate. These negative rates are suppressing interest rates around the world while driving up the value of the U.S. dollar and U.S. bonds. In a broad sense, stocks also benefit from the central bank stimulus that is driving interest rates into negative territory, and from relative yield advantages as bond yields are pushed lower. It’s an unusual and challenging environment. We appreciate your continued trust in us.
Sincerely,
Jonathan Thomas
President and Chief Executive Officer
American Century Investments
2
| Performance |
| Total Returns as of June 30, 2016 | |||||
| Average Annual Returns | |||||
| Ticker Symbol | 1 year | 5 years | Since Inception | Inception Date | |
| Investor Class | ASIOX | -1.15% | -2.01% | -0.37% | 4/30/10 |
| Barclays U.S. Treasury Inflation Protected Securities (TIPS) Index | — | 4.35% | 2.63% | 3.60% | — |
| Barclays U.S. 1-3 Month Treasury Bill Index | — | 0.14% | 0.06% | 0.08% | — |
| Institutional Class | ASINX | -0.94% | -1.79% | -0.17% | 4/30/10 |
| A Class | ASIDX | 4/30/10 | |||
| No sales charge | -1.37% | -2.24% | -0.62% | ||
| With sales charge | -7.04% | -3.38% | -1.57% | ||
| C Class | ASIZX | -2.05% | -2.97% | -1.36% | 4/30/10 |
| R Class | ASIUX | -1.59% | -2.47% | -0.87% | 4/30/10 |
Returns would have been lower if a portion of the fees had not been waived.
Effective June 1, 2016, the fund’s benchmark changed from the Barclays U.S. 1-3 Month Treasury Bill Index to the Barclays U.S. Treasury Inflation Protected Securities (TIPS) Index. The fund’s investment advisor believes that the Barclays U.S. Treasury Inflation Protected Securities (TIPS) Index aligns better with the fund’s strategy.
Sales charges include initial sales charges and contingent deferred sales charges (CDSCs), as applicable. A Class shares have a 5.75% maximum initial sales charge and may be subject to a maximum CDSC of 1.00%. C Class shares redeemed within 12 months of purchase are subject to a maximum CDSC of 1.00%. The SEC requires that mutual funds provide performance information net of maximum sales charges in all cases where charges could be applied.
Data presented reflect past performance. Past performance is no guarantee of future results. Current performance may be higher or lower than the performance shown. Total returns for periods less than one year are not annualized. Investment return and principal value will fluctuate, and redemption value may be more or less than original cost. Data assumes reinvestment of dividends and capital gains, and none of the charts reflect the deduction of taxes that a shareholder would pay on fund distributions or the redemption of fund shares. To obtain performance data current to the most recent month end, please call 1-800-345-2021 or visit americancentury.com. For additional information about the fund, please consult the prospectus.
3
| Growth of $10,000 Over Life of Class |
| $10,000 investment made April 30, 2010 |
| Performance for other share classes will vary due to differences in fee structure. |
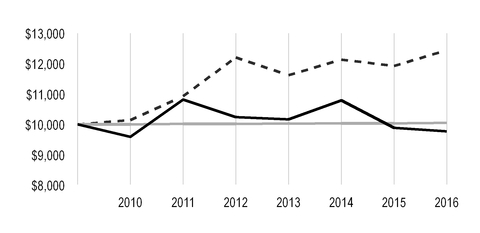
| Value on June 30, 2016 | |
| Investor Class — $9,773 | |
| Barclays U.S. 1-3 Month Treasury Bill Index — $10,047 | |
| Barclays U.S. Treasury Inflation Protected Securities (TIPS) Index — $12,443 | |
Ending value would have been lower if a portion of the fees had not been waived.
| Total Annual Fund Operating Expenses | ||||
| Investor Class | Institutional Class | A Class | C Class | R Class |
| 1.17% | 0.97% | 1.42% | 2.17% | 1.67% |
The total annual fund operating expenses shown is as stated in the fund’s prospectus current as of the date of this report. The prospectus may vary from the expense ratio shown elsewhere in this report because it is based on a different time period, includes acquired fund fees and expenses, and, if applicable, does not include fee waivers or expense reimbursements.
Data presented reflect past performance. Past performance is no guarantee of future results. Current performance may be higher or lower than the performance shown. Total returns for periods less than one year are not annualized. Investment return and principal value will fluctuate, and redemption value may be more or less than original cost. Data assumes reinvestment of dividends and capital gains, and none of the charts reflect the deduction of taxes that a shareholder would pay on fund distributions or the redemption of fund shares. To obtain performance data current to the most recent month end, please call 1-800-345-2021 or visit americancentury.com. For additional information about the fund, please consult the prospectus.
4
| Portfolio Commentary |
Portfolio Managers: Bob Gahagan, Brian Howell, John Lovito, and Steven Brown
Effective May 2016, the fund’s name changed to Multi-Asset Real Return Fund, reflecting new strategies designed to improve the portfolio’s risk-adjusted return potential and its ability to tactically provide competitive returns in multiple inflationary environments. The portfolio will continue to offer enhanced real return potential in high and rising inflationary periods, while also seeking to preserve wealth and provide income in low inflation or deflationary environments. Also, effective May 2016, portfolio manager Bill Martin left the fund's management team.
Performance Summary
For the 12 months ended June 30, 2016, Multi-Asset Real Return declined -1.15%,* while the
Barclays U.S. Treasury Inflation Protected Securities (TIPS) Index gained 4.35% and the Barclays U.S. 1-3 Month Treasury Bill Index advanced 0.14%.
The fund’s performance reflected a volatile 12-month period in which investments that typically provide investor protection against the primary sources of inflation generated mixed performance. Most notably, commodity prices, a key inflation trigger and bellwether, declined -26.08% during the period, according to the S&P Goldman Sachs Commodities Index, a measure of global commodities prices. Oil prices were a main driver of the performance, as indicated by declines of -17.89% for Brent oil and -18.86% for West Texas Intermediate crude. Gains in other asset classes were not sufficient to offset commodity-related losses for the portfolio.
Inflation Remained Muted on Weak Growth, Falling Commodity Prices
In the first half of the reporting period, concerns about slowing growth in China and plunging prices for oil and other commodities weighed on inflation expectations and inflation-sensitive investments. At the same time, speculation surrounding the timing of a widely anticipated rate hike from the U.S. Federal Reserve (the Fed) strengthened the U.S. dollar versus most other currencies. In the second half of the period, some of these key trends subsided or reversed course. For example, China reported signs of economic stabilization, oil and gold prices rallied sharply, and the dollar’s strength eased as the Fed resumed a more dovish tone in the face of mounting global economic uncertainties and the surprising Brexit vote.
Overall, though, global growth remained weak and current inflation and longer-term inflation expectations were mostly subdued during the 12-month period, despite ongoing and aggressive stimulus programs from central banks in Europe, Japan, and China, and reluctance from the Fed to meaningfully tighten monetary policy. In the U.S., the annual headline inflation rate was 1.0% at the end of June 2016. Inflation rates in Europe, the U.K., and Japan were even lower, and deflation fears persisted in many markets. Similarly, modest U.S. economic growth (1.1%, annualized, in the first quarter of 2016) was slightly better than anemic growth in Europe, the U.K., and Japan.
Longer-term inflation expectations, as measured by the 10-year breakeven rate (the yield difference between 10-year TIPS, and nominal 10-year Treasuries) declined from 189 basis points (1 basis point equals 0.01%) on June 30, 2015, to 143 basis points a year later. Theoretically, this rate indicates the market’s expectations for inflation for the next 10 years and also reflects the inflation rate (1.43% or higher) required for 10-year TIPS to outperform nominal 10-year Treasuries during that period.
* All fund returns referenced in this commentary are for Investor Class shares. Returns would have been lower if a portion of the fees had not been waived. Performance for other share classes will vary due to differences in fee structures; when Investor Class performance exceeds that of the fund’s benchmark, other share classes may not. See page 3 for returns for all share classes.
5
Commodity-Related Investments Pulled Down Performance
For most of the period, against our original target allocations before the May changes, the portfolio generally maintained a neutral weighting in inflation-linked bonds and other fixed-income securities, an underweight in non-dollar currency investments, an underweight to commodity-related investments, a neutral weighting to gold-related investments, and an overweight in global real estate investment trusts (REITs).
Despite our underweight position in commodity-related investments, the losses generated by this position were the biggest driver of the fund’s negative performance for the reporting period. The underperformance of commodity-related investments as China and global growth struggled, and the relative weightings of these investments in the portfolio, were too much to overcome, despite positive performance from other sectors.
An example of positive performance included our overweight to global REITs. In particular, property stocks in North America, Japan, and Australia rallied. The inflation-linked bond component also contributed. This component consisted primarily of TIPS, corporate bonds, and mortgage-backed securities (MBS) in conjunction with inflation “swaps”, effectively creating an “inflation overlay" for the corporate and mortgage securities. TIPS benefited from generally robust demand for Treasuries, while demand for yield supported corporate securities and MBS.
The portfolio’s non-dollar currency investments generated mixed results. In particular, underweight allocations to the euro and the yen, which appreciated versus the dollar, weighed on results, while an underweight to the pound, which plunged versus the dollar, contributed to performance. A rebound among many emerging markets currencies also contributed to performance.
Portfolio Changes in May
In conjunction with the fund’s new investment strategies, we altered the portfolio’s asset mix in May. Specifically, we changed the portfolio’s foreign currency investments from a dedicated, strategic exposure to a tactical currency risk management strategy (currency overlay). We also broadened the portfolio’s equity allocation to include infrastructure equities (transportation, utilities, oil and gas storage and transportation, and construction) and equities in select industries that have demonstrated pricing power at different stages of the business cycle (health care, food, information technology services, consumer finance, insurance, defense, and durables).
In addition, we increased the portfolio’s flexibility to invest in fixed-income securities by replacing the fund’s strategic weighting in TIPS with the ability to use a broad range of debt securities, including nominal and inflation-linked bonds. We now have the flexibility to decrease the strategic weighting to TIPS and include more diverse asset classes that can potentially provide competitive returns in multiple environments.
At the end of the reporting period, portfolio positioning included approximately 60% in fixed-income securities, 21% in infrastructure and sector equities, 12% in global REITs, 7% in commodity-related investments, and a currency overlay of 25%.
Outlook
Although U.S. headline inflation remains tame, core inflation (headline inflation minus food and energy costs) has moved higher recently, ending the period at 2.3%. We believe headline inflation eventually will converge with core inflation, and a stabilization in commodity prices coupled with continued trend growth ultimately will create higher inflation than is currently priced into the financial markets. In the meantime, the portfolio’s recent strategy changes will enable us to employ more asset classes and make more tactical changes in an effort to take advantage of the current inflation backdrop and our outlook for inflation.
6
| Fund Characteristics |
| JUNE 30, 2016 | |
| Types of Investments in Portfolio | % of net assets |
| U.S. Treasury Securities | 48.1% |
| Domestic Common Stocks | 24.8% |
| Foreign Common Stocks* | 10.6% |
| Corporate Bonds | 6.5% |
| Collateralized Mortgage Obligations | 4.4% |
| Exchange-Traded Funds | 3.5% |
| Commercial Mortgage-Backed Securities | 0.9% |
| Asset-Backed Securities | 0.9% |
| Temporary Cash Investments | 0.6% |
| Other Assets and Liabilities | (0.3)% |
*Includes depositary shares, dual listed securities and foreign ordinary shares.
7
| Shareholder Fee Example |
Fund shareholders may incur two types of costs: (1) transaction costs, including sales charges (loads) on purchase payments and redemption/exchange fees; and (2) ongoing costs, including management fees; distribution and service (12b-1) fees; and other fund expenses. This example is intended to help you understand your ongoing costs (in dollars) of investing in your fund and to compare these costs with the ongoing cost of investing in other mutual funds.
The example is based on an investment of $1,000 made at the beginning of the period and held for the entire period from January 1, 2016 to June 30, 2016.
Actual Expenses
The table provides information about actual account values and actual expenses for each class. You may use the information, together with the amount you invested, to estimate the expenses that you paid over the period. First, identify the share class you own. Then simply divide your account value by $1,000 (for example, an $8,600 account value divided by $1,000 = 8.6), then multiply the result by the number under the heading “Expenses Paid During Period” to estimate the expenses you paid on your account during this period.
If you hold Investor Class shares of any American Century Investments fund, or Institutional Class shares of the American Century Diversified Bond Fund, in an American Century Investments account (i.e., not a financial intermediary or retirement plan account), American Century Investments may charge you a $12.50 semiannual account maintenance fee if the value of those shares is less than $10,000. We will redeem shares automatically in one of your accounts to pay the $12.50 fee. In determining your total eligible investment amount, we will include your investments in all personal accounts (including American Century Investments Brokerage accounts) registered under your Social Security number. Personal accounts include individual accounts, joint accounts, UGMA/UTMA accounts, personal trusts, Coverdell Education Savings Accounts and IRAs (including traditional, Roth, Rollover, SEP-, SARSEP- and SIMPLE-IRAs), and certain other retirement accounts. If you have only business, business retirement, employer-sponsored or American Century Investments Brokerage accounts, you are currently not subject to this fee. If you are subject to the Account Maintenance Fee, your account value could be reduced by the fee amount.
Hypothetical Example for Comparison Purposes
The table also provides information about hypothetical account values and hypothetical expenses based on the actual expense ratio of each class of your fund and an assumed rate of return of 5% per year before expenses, which is not the actual return of a fund’s share class. The hypothetical account values and expenses may not be used to estimate the actual ending account balance or expenses you paid for the period. You may use this information to compare the ongoing costs of investing in your fund and other funds. To do so, compare this 5% hypothetical example with the 5% hypothetical examples that appear in the shareholder reports of the other funds.
Please note that the expenses shown in the table are meant to highlight your ongoing costs only and do not reflect any transactional costs, such as sales charges (loads) or redemption/exchange fees. Therefore, the table is useful in comparing ongoing costs only, and will not help you determine the relative total costs of owning different funds. In addition, if these transactional costs were included, your costs would have been higher.
8
| Beginning Account Value 1/1/16 | Ending Account Value 6/30/16 | Expenses Paid During Period(1) 1/1/16 - 6/30/16 | Annualized Expense Ratio(1) | |
| Actual | ||||
| Investor Class (after waiver) | $1,000 | $1,057.20 | $4.71 | 0.92% |
| Investor Class (before waiver) | $1,000 | $1,057.20(2) | $5.73 | 1.12% |
| Institutional Class (after waiver) | $1,000 | $1,058.20 | $3.68 | 0.72% |
| Institutional Class (before waiver) | $1,000 | $1,058.20(2) | $4.71 | 0.92% |
| A Class (after waiver) | $1,000 | $1,056.30 | $5.98 | 1.17% |
| A Class (before waiver) | $1,000 | $1,056.30(2) | $7.00 | 1.37% |
| C Class (after waiver) | $1,000 | $1,052.10 | $9.80 | 1.92% |
| C Class (before waiver) | $1,000 | $1,052.10(2) | $10.82 | 2.12% |
| R Class (after waiver) | $1,000 | $1,054.50 | $7.25 | 1.42% |
| R Class (before waiver) | $1,000 | $1,054.50(2) | $8.28 | 1.62% |
| Hypothetical | ||||
| Investor Class (after waiver) | $1,000 | $1,020.29 | $4.62 | 0.92% |
| Investor Class (before waiver) | $1,000 | $1,019.29 | $5.62 | 1.12% |
| Institutional Class (after waiver) | $1,000 | $1,021.28 | $3.62 | 0.72% |
| Institutional Class (before waiver) | $1,000 | $1,020.29 | $4.62 | 0.92% |
| A Class (after waiver) | $1,000 | $1,019.05 | $5.87 | 1.17% |
| A Class (before waiver) | $1,000 | $1,018.05 | $6.87 | 1.37% |
| C Class (after waiver) | $1,000 | $1,015.32 | $9.62 | 1.92% |
| C Class (before waiver) | $1,000 | $1,014.32 | $10.62 | 2.12% |
| R Class (after waiver) | $1,000 | $1,017.80 | $7.12 | 1.42% |
| R Class (before waiver) | $1,000 | $1,016.81 | $8.12 | 1.62% |
| (1) | Expenses are equal to the class's annualized expense ratio listed in the table above, multiplied by the average account value over the period, multiplied by 182, the number of days in the most recent fiscal half-year, divided by 366, to reflect the one-half year period. |
| (2) | Ending account value assumes the return earned after waiver and would have been lower if a portion of the fees had not been waived. |
9
| Schedule of Investments |
JUNE 30, 2016
Principal Amount/Shares | Value | |||||
| U.S. TREASURY SECURITIES — 48.1% | ||||||
| U.S. Treasury Inflation Indexed Bonds, 2.375%, 1/15/25 | $ | 1,205,845 | $ | 1,441,518 | ||
| U.S. Treasury Inflation Indexed Bonds, 2.00%, 1/15/26 | 723,288 | 852,039 | ||||
| U.S. Treasury Inflation Indexed Bonds, 3.875%, 4/15/29 | 509,397 | 734,868 | ||||
| U.S. Treasury Inflation Indexed Bonds, 2.125%, 2/15/40 | 332,091 | 435,254 | ||||
| U.S. Treasury Inflation Indexed Bonds, 2.125%, 2/15/41 | 54,628 | 72,230 | ||||
| U.S. Treasury Inflation Indexed Bonds, 1.375%, 2/15/44 | 718,627 | 832,864 | ||||
| U.S. Treasury Inflation Indexed Bonds, 1.00%, 2/15/46 | 252,445 | 273,086 | ||||
| U.S. Treasury Inflation Indexed Notes, 1.625%, 1/15/18 | 228,416 | 237,141 | ||||
| U.S. Treasury Inflation Indexed Notes, 0.125%, 4/15/18 | 155,256 | 157,629 | ||||
U.S. Treasury Inflation Indexed Notes, 2.125%, 1/15/19(1) | 55,720 | 59,804 | ||||
| U.S. Treasury Inflation Indexed Notes, 0.125%, 4/15/19 | 204,218 | 208,627 | ||||
| U.S. Treasury Inflation Indexed Notes, 1.875%, 7/15/19 | 168,084 | 181,983 | ||||
| U.S. Treasury Inflation Indexed Notes, 1.375%, 1/15/20 | 221,286 | 236,452 | ||||
| U.S. Treasury Inflation Indexed Notes, 1.25%, 7/15/20 | 548,550 | 590,052 | ||||
| U.S. Treasury Inflation Indexed Notes, 0.125%, 1/15/22 | 1,691,376 | 1,726,063 | ||||
| U.S. Treasury Inflation Indexed Notes, 0.25%, 1/15/25 | 1,565,748 | 1,591,426 | ||||
| U.S. Treasury Inflation Indexed Notes, 0.375%, 7/15/25 | 1,210,716 | 1,247,944 | ||||
TOTAL U.S. TREASURY SECURITIES (Cost $10,763,590) | 10,878,980 | |||||
| COMMON STOCKS — 35.4% | ||||||
| Aerospace and Defense — 0.4% | ||||||
| Boeing Co. (The) | 402 | 52,208 | ||||
| Huntington Ingalls Industries, Inc. | 277 | 46,544 | ||||
| 98,752 | ||||||
| Air Freight and Logistics — 0.6% | ||||||
| CH Robinson Worldwide, Inc. | 823 | 61,108 | ||||
| Expeditors International of Washington, Inc. | 1,253 | 61,447 | ||||
| 122,555 | ||||||
| Airlines — 0.5% | ||||||
| Delta Air Lines, Inc. | 1,431 | 52,131 | ||||
| Southwest Airlines Co. | 1,440 | 56,463 | ||||
| 108,594 | ||||||
| Beverages — 0.2% | ||||||
| PepsiCo, Inc. | 500 | 52,970 | ||||
| Biotechnology — 0.4% | ||||||
| Amgen, Inc. | 319 | 48,536 | ||||
| Gilead Sciences, Inc. | 588 | 49,051 | ||||
| 97,587 | ||||||
| Building Products — 0.5% | ||||||
| Allegion plc | 891 | 61,862 | ||||
| Masco Corp. | 1,891 | 58,508 | ||||
| 120,370 | ||||||
| Chemicals — 1.4% | ||||||
| Arkema SA | 317 | 24,463 | ||||
| BASF SE | 339 | 25,861 | ||||
10
Principal Amount/Shares | Value | |||||
| Chr Hansen Holding A/S | 418 | $ | 27,448 | |||
| Eastman Chemical Co. | 357 | 24,240 | ||||
| Ecolab, Inc. | 221 | 26,211 | ||||
| Linde AG | 176 | 24,496 | ||||
| LyondellBasell Industries NV, Class A | 327 | 24,335 | ||||
| Monsanto Co. | 239 | 24,715 | ||||
| PPG Industries, Inc. | 243 | 25,309 | ||||
| RPM International, Inc. | 521 | 26,024 | ||||
| Sherwin-Williams Co. (The) | 90 | 26,430 | ||||
| W.R. Grace & Co. | 333 | 24,379 | ||||
| 303,911 | ||||||
| Communications Equipment — 0.3% | ||||||
| Cisco Systems, Inc. | 2,089 | 59,933 | ||||
| Construction and Engineering — 0.5% | ||||||
| Fluor Corp. | 1,156 | 56,968 | ||||
| HOCHTIEF AG | 470 | 60,543 | ||||
| 117,511 | ||||||
| Containers and Packaging — 0.8% | ||||||
| Avery Dennison Corp. | 807 | 60,323 | ||||
| Packaging Corp. of America | 874 | 58,497 | ||||
| Sealed Air Corp. | 1,300 | 59,761 | ||||
| 178,581 | ||||||
| Electric Utilities — 2.0% | ||||||
| Edison International | 846 | 65,709 | ||||
| Emera, Inc. | 1,726 | 64,955 | ||||
| Fortum Oyj | 4,055 | 64,968 | ||||
| ITC Holdings Corp. | 1,360 | 63,675 | ||||
| NextEra Energy, Inc. | 507 | 66,113 | ||||
| PPL Corp. | 1,575 | 59,456 | ||||
| Terna Rete Elettrica Nazionale SpA | 11,012 | 61,359 | ||||
| 446,235 | ||||||
| Energy Equipment and Services — 0.5% | ||||||
| Core Laboratories NV | 220 | 27,256 | ||||
FMC Technologies, Inc.(2) | 991 | 26,430 | ||||
| Technip SA | 487 | 26,487 | ||||
| Tenaris SA | 2,037 | 29,458 | ||||
| 109,631 | ||||||
| Food and Staples Retailing — 0.2% | ||||||
| Wal-Mart Stores, Inc. | 719 | 52,501 | ||||
| Food Products — 0.8% | ||||||
| General Mills, Inc. | 806 | 57,484 | ||||
| Mead Johnson Nutrition Co. | 613 | 55,630 | ||||
| Tyson Foods, Inc., Class A | 815 | 54,434 | ||||
| 167,548 | ||||||
| Gas Utilities — 0.3% | ||||||
| UGI Corp. | 1,402 | 63,441 | ||||
| Health Care Equipment and Supplies — 0.5% | ||||||
| C.R. Bard, Inc. | 231 | 54,322 | ||||
| Medtronic plc | 614 | 53,277 | ||||
| 107,599 | ||||||
11
Principal Amount/Shares | Value | |||||
| Health Care Providers and Services — 0.9% | ||||||
| Aetna, Inc. | 425 | $ | 51,905 | |||
| Chartwell Retirement Residences | 3,030 | 36,985 | ||||
Express Scripts Holding Co.(2) | 669 | 50,710 | ||||
| Quest Diagnostics, Inc. | 652 | 53,080 | ||||
| 192,680 | ||||||
| Hotels, Restaurants and Leisure — 1.1% | ||||||
| Carnival Corp. | 1,055 | 46,631 | ||||
| Domino's Pizza, Inc. | 413 | 54,260 | ||||
| Marriott International, Inc., Class A | 744 | 49,446 | ||||
| McDonald's Corp. | 421 | 50,663 | ||||
| Wyndham Worldwide Corp. | 744 | 52,995 | ||||
| 253,995 | ||||||
| Household Durables — 0.2% | ||||||
| Newell Brands, Inc. | 1,062 | 51,581 | ||||
| Insurance — 0.9% | ||||||
| Aflac, Inc. | 733 | 52,893 | ||||
| Marsh & McLennan Cos., Inc. | 767 | 52,509 | ||||
| Progressive Corp. (The) | 1,538 | 51,523 | ||||
| Prudential Financial, Inc. | 648 | 46,228 | ||||
| 203,153 | ||||||
| Internet Software and Services — 0.5% | ||||||
Alphabet, Inc., Class A(2) | 68 | 47,840 | ||||
Facebook, Inc., Class A(2) | 429 | 49,026 | ||||
NEXTDC Ltd.(2) | 4,526 | 11,843 | ||||
| 108,709 | ||||||
| IT Services — 1.7% | ||||||
| Amdocs Ltd. | 881 | 50,851 | ||||
| Global Payments, Inc. | 646 | 46,112 | ||||
| International Business Machines Corp. | 332 | 50,391 | ||||
| MasterCard, Inc., Class A | 526 | 46,320 | ||||
| Total System Services, Inc. | 946 | 50,242 | ||||
| Visa, Inc., Class A | 638 | 47,320 | ||||
| Western Union Co. (The) | 2,619 | 50,232 | ||||
| Xerox Corp. | 5,031 | 47,744 | ||||
| 389,212 | ||||||
| Life Sciences Tools and Services — 0.2% | ||||||
Waters Corp.(2) | 365 | 51,337 | ||||
| Metals and Mining — 0.6% | ||||||
| Barrick Gold Corp. | 1,552 | 33,135 | ||||
| Newmont Mining Corp. | 814 | 31,843 | ||||
| Nucor Corp. | 536 | 26,484 | ||||
| Reliance Steel & Aluminum Co. | 352 | 27,069 | ||||
| Steel Dynamics, Inc. | 1,058 | 25,921 | ||||
| 144,452 | ||||||
| Multi-Utilities — 0.8% | ||||||
| Ameren Corp. | 877 | 46,990 | ||||
| Canadian Utilities Ltd., A Shares | 2,142 | 62,057 | ||||
12
Principal Amount/Shares | Value | |||||
| NiSource, Inc. | 2,532 | $ | 67,149 | |||
| 176,196 | ||||||
| Oil, Gas and Consumable Fuels — 2.8% | ||||||
| EQT Midstream Partners LP | 798 | 64,079 | ||||
| Exxon Mobil Corp. | 297 | 27,841 | ||||
| Inter Pipeline Ltd. | 2,929 | 62,119 | ||||
Leucrotta Exploration, Inc.(2) | 8,491 | 11,567 | ||||
| Magellan Midstream Partners LP | 841 | 63,916 | ||||
| Neste Oyj | 776 | 27,803 | ||||
| OMV AG | 961 | 26,921 | ||||
| ONEOK Partners LP | 1,579 | 63,255 | ||||
| Shell Midstream Partners LP | 1,770 | 59,808 | ||||
| Spectra Energy Partners LP | 1,326 | 62,561 | ||||
| Statoil ASA | 1,674 | 28,986 | ||||
| Tesoro Corp. | 323 | 24,199 | ||||
| TOTAL SA | 558 | 26,908 | ||||
| TransCanada Corp. | 1,427 | 64,529 | ||||
| Valero Energy Corp. | 473 | 24,123 | ||||
| 638,615 | ||||||
| Pharmaceuticals — 0.2% | ||||||
| Johnson & Johnson | 445 | 53,979 | ||||
| Real Estate Investment Trusts (REITs) — 10.2% | ||||||
| Acadia Realty Trust | 1,491 | 52,960 | ||||
| Advance Residence Investment Corp. | 11 | 29,404 | ||||
| Allied Properties Real Estate Investment Trust | 875 | 26,197 | ||||
| American Campus Communities, Inc. | 1,123 | 59,373 | ||||
| American Tower Corp. | 570 | 64,758 | ||||
| Apartment Investment & Management Co., Class A | 2,062 | 91,058 | ||||
| AvalonBay Communities, Inc. | 210 | 37,882 | ||||
| Big Yellow Group plc | 1,394 | 14,537 | ||||
| Camden Property Trust | 654 | 57,827 | ||||
| CapitaLand Mall Trust | 10,800 | 17,149 | ||||
| Charter Hall Group | 3,470 | 13,155 | ||||
| Colony Starwood Homes | 1,727 | 52,535 | ||||
| CubeSmart | 1,800 | 55,584 | ||||
| Daiwa House Residential Investment Corp. | 8 | 21,657 | ||||
| Derwent London plc | 438 | 15,434 | ||||
| Dexus Property Group | 4,862 | 32,835 | ||||
| Digital Realty Trust, Inc. | 651 | 70,952 | ||||
| Duke Realty Corp. | 2,681 | 71,475 | ||||
| Equinix, Inc. | 106 | 41,099 | ||||
| Extra Space Storage, Inc. | 363 | 33,592 | ||||
| Goodman Group | 5,842 | 31,141 | ||||
| Great Portland Estates plc | 1,844 | 15,450 | ||||
| H&R Real Estate Investment Trust | 800 | 13,939 | ||||
| Hyprop Investments Ltd. | 2,350 | 20,772 | ||||
| Iron Mountain, Inc. | 1,659 | 66,078 | ||||
| Japan Real Estate Investment Corp. | 7 | 43,083 | ||||
| Kimco Realty Corp. | 2,436 | 76,442 | ||||
| Klepierre | 622 | 27,750 | ||||
13
Principal Amount/Shares | Value | |||||
| Land Securities Group plc | 2,294 | $ | 32,466 | |||
| Liberty Property Trust | 1,298 | 51,557 | ||||
| Link REIT | 9,500 | 64,991 | ||||
| Mack-Cali Realty Corp. | 1,692 | 45,684 | ||||
| Mapletree Industrial Trust | 13,500 | 17,269 | ||||
| Mori Hills REIT Investment Corp. | 27 | 42,200 | ||||
| Orix JREIT, Inc. | 20 | 34,350 | ||||
| Physicians Realty Trust | 2,620 | 55,046 | ||||
| ProLogis, Inc. | 973 | 47,716 | ||||
| Public Storage | 235 | 60,064 | ||||
| Retail Properties of America, Inc. | 1,908 | 32,245 | ||||
| RioCan Real Estate Investment Trust | 736 | 16,709 | ||||
| Safestore Holdings plc | 3,168 | 15,619 | ||||
| Scentre Group | 11,321 | 41,639 | ||||
| Simon Property Group, Inc. | 845 | 183,280 | ||||
| STORE Capital Corp. | 1,875 | 55,219 | ||||
| Unibail-Rodamco SE | 216 | 56,591 | ||||
| Ventas, Inc. | 1,306 | 95,103 | ||||
| VEREIT, Inc. | 6,675 | 67,684 | ||||
| Vornado Realty Trust | 854 | 85,502 | ||||
| Westfield Corp. | 5,019 | 39,988 | ||||
| 2,295,040 | ||||||
| Real Estate Management and Development — 2.4% | ||||||
| Ayala Land, Inc. | 31,800 | 26,300 | ||||
| BR Malls Participacoes SA | 4,360 | 17,536 | ||||
| Bumi Serpong Damai Tbk PT | 100,900 | 16,201 | ||||
| Cheung Kong Property Holdings Ltd. | 7,500 | 47,210 | ||||
| China Overseas Land & Investment Ltd. | 8,000 | 25,530 | ||||
| China Resources Land Ltd. | 11,555 | 27,090 | ||||
| City Developments Ltd. | 1,200 | 7,311 | ||||
| Deutsche Wohnen AG | 1,841 | 62,478 | ||||
| Hufvudstaden AB, A Shares | 1,933 | 30,270 | ||||
| Hulic Co. Ltd. | 4,700 | 49,277 | ||||
| Hysan Development Co., Ltd. | 3,000 | 13,378 | ||||
| Inmobiliaria Colonial SA | 31,314 | 22,692 | ||||
| Longfor Properties Co. Ltd. | 11,000 | 14,319 | ||||
| Mitsui Fudosan Co. Ltd. | 2,000 | 45,656 | ||||
| Nexity SA | 243 | 12,386 | ||||
| SM Prime Holdings, Inc. | 22,700 | 13,252 | ||||
| Summarecon Agung Tbk PT | 62,800 | 8,660 | ||||
| Sun Hung Kai Properties Ltd. | 3,750 | 45,180 | ||||
| UNITE Group plc (The) | 1,924 | 15,947 | ||||
| Vonovia SE | 1,314 | 47,955 | ||||
| 548,628 | ||||||
| Road and Rail — 1.1% | ||||||
| Canadian National Railway Co. | 1,030 | 60,822 | ||||
| DSV A/S | 1,338 | 56,256 | ||||
| J.B. Hunt Transport Services, Inc. | 741 | 59,969 | ||||
| Union Pacific Corp. | 718 | 62,645 | ||||
| 239,692 | ||||||
14
Principal Amount/Shares | Value | |||||
| Software — 1.1% | ||||||
| CA, Inc. | 1,555 | $ | 51,051 | |||
Electronic Arts, Inc.(2) | 666 | 50,456 | ||||
| Intuit, Inc. | 471 | 52,568 | ||||
| Microsoft Corp. | 972 | 49,737 | ||||
| Oracle Corp. | 1,319 | 53,987 | ||||
| 257,799 | ||||||
| Transportation Infrastructure — 0.5% | ||||||
| Abertis Infraestructuras SA | 4,118 | 60,522 | ||||
| Atlantia SpA | 2,275 | 56,742 | ||||
| 117,264 | ||||||
| Water Utilities — 0.3% | ||||||
| American Water Works Co., Inc. | 807 | 68,200 | ||||
TOTAL COMMON STOCKS (Cost $7,492,385) | 7,998,251 | |||||
| CORPORATE BONDS — 6.5% | ||||||
| Beverages — 0.2% | ||||||
| Constellation Brands, Inc., 3.875%, 11/15/19 | $ | 50,000 | 52,813 | |||
| Chemicals — 0.3% | ||||||
| Ashland, Inc., 4.75%, 8/15/22 | 75,000 | 75,469 | ||||
| Communications Equipment — 0.2% | ||||||
CommScope, Inc., 4.375%, 6/15/20(3) | 50,000 | 51,625 | ||||
| Construction and Engineering — 0.3% | ||||||
| SBA Communications Corp., 5.625%, 10/1/19 | 75,000 | 77,719 | ||||
| Consumer Finance — 0.4% | ||||||
| CIT Group, Inc., 5.00%, 8/15/22 | 40,000 | 40,800 | ||||
| GLP Capital LP / GLP Financing II, Inc., 4.875%, 11/1/20 | 50,000 | 52,429 | ||||
| 93,229 | ||||||
| Diversified Financial Services — 0.1% | ||||||
| Morgan Stanley, MTN, 5.625%, 9/23/19 | 20,000 | 22,207 | ||||
| MUFG Union Bank N.A., 2.625%, 9/26/18 | 10,000 | 10,222 | ||||
| 32,429 | ||||||
| Diversified Telecommunication Services — 0.3% | ||||||
| Frontier Communications Corp., 8.50%, 4/15/20 | 50,000 | 53,250 | ||||
| Verizon Communications, Inc., 3.65%, 9/14/18 | 20,000 | 21,027 | ||||
| 74,277 | ||||||
| Gas Utilities — 0.5% | ||||||
| Energy Transfer Partners LP, 2.50%, 6/15/18 | 50,000 | 49,793 | ||||
| Tesoro Logistics LP / Tesoro Logistics Finance Corp., 6.25%, 10/15/22 | 50,000 | 52,375 | ||||
| 102,168 | ||||||
| Health Care Providers and Services — 0.6% | ||||||
| CHS / Community Health Systems, Inc., 5.125%, 8/15/18 | 12,000 | 12,225 | ||||
Fresenius Medical Care US Finance II, Inc., 5.625%, 7/31/19(3) | 70,000 | 76,168 | ||||
| HCA, Inc., 4.25%, 10/15/19 | 50,000 | 52,250 | ||||
| 140,643 | ||||||
| Household Durables — 0.2% | ||||||
| Lennar Corp., 4.75%, 4/1/21 | 50,000 | 52,250 | ||||
| Insurance — 0.2% | ||||||
| International Lease Finance Corp., 6.25%, 5/15/19 | 50,000 | 53,993 | ||||
15
Principal Amount/Shares | Value | |||||
| Internet Software and Services — 0.2% | ||||||
| Netflix, Inc., 5.375%, 2/1/21 | $ | 40,000 | $ | 42,680 | ||
| Media — 0.5% | ||||||
| CCO Holdings LLC / CCO Holdings Capital Corp., 5.25%, 9/30/22 | 40,000 | 41,150 | ||||
Nielsen Finance LLC / Nielsen Finance Co., 5.00%, 4/15/22(3) | 70,000 | 71,662 | ||||
| 112,812 | ||||||
| Multi-Utilities — 0.5% | ||||||
Calpine Corp., 5.875%, 1/15/24(3) | 50,000 | 52,250 | ||||
| CMS Energy Corp., 8.75%, 6/15/19 | 25,000 | 30,155 | ||||
| Dominion Gas Holdings LLC, 1.05%, 11/1/16 | 20,000 | 20,008 | ||||
| 102,413 | ||||||
| Oil, Gas and Consumable Fuels — 0.5% | ||||||
| Bill Barrett Corp., 7.00%, 10/15/22 | 75,000 | 54,375 | ||||
| Concho Resources, Inc., 6.50%, 1/15/22 | 50,000 | 51,437 | ||||
| 105,812 | ||||||
| Pharmaceuticals — 0.1% | ||||||
| Mylan, Inc., 1.35%, 11/29/16 | 10,000 | 9,990 | ||||
| Real Estate Investment Trusts (REITs) — 0.5% | ||||||
| Crown Castle International Corp., 5.25%, 1/15/23 | 75,000 | 84,454 | ||||
| HCP, Inc., 6.00%, 1/30/17 | 25,000 | 25,658 | ||||
| 110,112 | ||||||
| Specialty Retail — 0.3% | ||||||
| Hertz Corp. (The), 6.75%, 4/15/19 | 55,000 | 56,159 | ||||
| Technology Hardware, Storage and Peripherals — 0.3% | ||||||
Diamond 1 Finance Corp. / Diamond 2 Finance Corp., 4.42%, 6/15/21(3) | 60,000 | 61,735 | ||||
| Wireless Telecommunication Services — 0.3% | ||||||
| Sprint Communications, Inc., 6.00%, 12/1/16 | 70,000 | 70,613 | ||||
TOTAL CORPORATE BONDS (Cost $1,477,288) | 1,478,941 | |||||
COLLATERALIZED MORTGAGE OBLIGATIONS(4) — 4.4% | ||||||
| Private Sponsor Collateralized Mortgage Obligations — 4.2% | ||||||
| ABN Amro Mortgage Corp., Series 2003-6, Class 1A4, 5.50%, 5/25/33 | 5,217 | 5,387 | ||||
| Banc of America Mortgage Securities, Inc., Series 2005-1, Class 1A15, 5.50%, 2/25/35 | 28,688 | 29,581 | ||||
| Bear Stearns Adjustable Rate Mortgage Trust, Series 2004-12, Class 2A1, VRN, 3.00%, 7/1/16 | 24,584 | 24,504 | ||||
| Bear Stearns Adjustable Rate Mortgage Trust, Series 2006-1, Class A1, VRN, 2.58%, 7/1/16 | 61,284 | 59,987 | ||||
| Citigroup Mortgage Loan Trust, Inc., Series 2004-UST1, Class A4, VRN, 2.63%, 7/1/16 | 39,798 | 38,422 | ||||
| Citigroup Mortgage Loan Trust, Inc., Series 2005-4, Class A, VRN, 2.82%, 7/1/16 | 49,438 | 48,418 | ||||
| Countrywide Home Loan Mortgage Pass-Through Trust, Series 2004-4, Class A19, 5.25%, 5/25/34 | 47,186 | 48,277 | ||||
| Countrywide Home Loan Mortgage Pass-Through Trust, Series 2004-5, Class 2A4, 5.50%, 5/25/34 | 7,138 | 7,193 | ||||
| First Horizon Mortgage Pass-Through Trust, Series 2005-AR3, Class 4A1, VRN, 2.78%, 7/1/16 | 30,307 | 29,209 | ||||
| GSR Mortgage Loan Trust, Series 2005-AR6, Class 2A1, VRN, 2.88%, 7/1/16 | 57,420 | 57,789 | ||||
16
Principal Amount/Shares | Value | |||||
| JPMorgan Mortgage Trust, Series 2005-A6, Class 7A1, VRN, 2.74%, 7/1/16 | $ | 50,667 | $ | 48,290 | ||
| JPMorgan Mortgage Trust, Series 2006-A3, Class 7A1, VRN, 2.96%, 7/1/16 | 13,700 | 13,741 | ||||
JPMorgan Mortgage Trust, Series 2016-1, Class A7 SEQ, 3.50%, 5/25/46(3) | 100,000 | 105,140 | ||||
| PHHMC Mortgage Pass-Through Certificates, Series 2007-6, Class A1, VRN, 5.44%, 7/1/16 | 6,419 | 6,395 | ||||
Sequoia Mortgage Trust, Series 2014-3, Class A14, VRN, 3.00%, 7/1/16(3) | 46,506 | 47,132 | ||||
| Thornburg Mortgage Securities Trust, Series 2004-3, Class A, VRN, 1.19%, 7/25/16 | 15,523 | 14,269 | ||||
| WaMu Mortgage Pass-Through Certificates, Series 2003-S11, Class 3A5, 5.95%, 11/25/33 | 11,179 | 11,480 | ||||
| Wells Fargo Mortgage-Backed Securities Trust, Series 2004-E, Class A2, VRN, 3.08%, 7/1/16 | 60,431 | 61,065 | ||||
| Wells Fargo Mortgage-Backed Securities Trust, Series 2005-AR14, Class A1, VRN, 2.81%, 7/1/16 | 13,969 | 13,717 | ||||
| Wells Fargo Mortgage-Backed Securities Trust, Series 2005-AR16, Class 3A2, VRN, 2.94%, 7/1/16 | 40,363 | 40,510 | ||||
| Wells Fargo Mortgage-Backed Securities Trust, Series 2005-AR7, Class 1A1, VRN, 3.09%, 7/1/16 | 23,062 | 23,013 | ||||
| Wells Fargo Mortgage-Backed Securities Trust, Series 2006-10, Class A4 SEQ, 6.00%, 8/25/36 | 49,363 | 49,825 | ||||
| Wells Fargo Mortgage-Backed Securities Trust, Series 2006-9, Class 1A9 SEQ, 6.00%, 8/25/36 | 22,301 | 22,785 | ||||
| Wells Fargo Mortgage-Backed Securities Trust, Series 2006-AR15, Class A1, VRN, 2.74%, 7/1/16 | 33,272 | 30,766 | ||||
| Wells Fargo Mortgage-Backed Securities Trust, Series 2007-11, Class A3 SEQ, 6.00%, 8/25/37 | 29,712 | 29,532 | ||||
| Wells Fargo Mortgage-Backed Securities Trust, Series 2007-13, Class A1, 6.00%, 9/25/37 | 37,767 | 38,383 | ||||
| Wells Fargo Mortgage-Backed Securities Trust, Series 2007-14, Class 2A2, 5.50%, 10/25/22 | 9,790 | 10,064 | ||||
| Wells Fargo Mortgage-Backed Securities Trust, Series 2007-16, Class 1A1, 6.00%, 12/28/37 | 10,925 | 11,332 | ||||
| Wells Fargo Mortgage-Backed Securities Trust, Series 2007-AR10, Class 1A1, VRN, 6.30%, 7/1/16 | 6,185 | 6,064 | ||||
WinWater Mortgage Loan Trust, Series 2014-1, Class A4 SEQ, VRN, 3.50%, 7/1/16(3) | 29,898 | 30,302 | ||||
| 962,572 | ||||||
| U.S. Government Agency Collateralized Mortgage Obligations — 0.2% | ||||||
| FHLMC, Series 2824, Class LB SEQ, 4.50%, 7/15/24 | 36,121 | 38,976 | ||||
TOTAL COLLATERALIZED MORTGAGE OBLIGATIONS (Cost $988,974) | 1,001,548 | |||||
| EXCHANGE-TRADED FUNDS — 3.5% | ||||||
iShares S&P GSCI Commodity Indexed Trust(2) | 24,643 | 382,459 | ||||
PowerShares DB Commodity Index Tracking Fund(2) | 25,876 | 397,197 | ||||
TOTAL EXCHANGE-TRADED FUNDS (Cost $752,751) | 779,656 | |||||
COMMERCIAL MORTGAGE-BACKED SECURITIES(4) — 0.9% | ||||||
BB-UBS Trust, Series 2012-SHOW, Class A SEQ, 3.43%, 11/5/36(3) | $ | 50,000 | 53,369 | |||
Core Industrial Trust, Series 2015-CALW, Class B, 3.25%, 2/10/34(3) | 50,000 | 52,035 | ||||
Core Industrial Trust, Series 2015-TEXW, Class B, 3.33%, 2/10/34(3) | 50,000 | 51,972 | ||||
17
Principal Amount/Shares | Value | |||||
| GS Mortgage Securities Corp. II, Series 2016-GS2, Class B, 3.76%, 5/10/49 | $ | 40,000 | $ | 41,834 | ||
TOTAL COMMERCIAL MORTGAGE-BACKED SECURITIES (Cost $196,018) | 199,210 | |||||
ASSET-BACKED SECURITIES(4) — 0.9% | ||||||
Hilton Grand Vacations Trust, Series 2014-AA, Class A SEQ, 1.77%, 11/25/26(3) | 42,209 | 41,580 | ||||
MVW Owner Trust, Series 2014-1A, Class B, 2.70%, 9/22/31(3) | 127,410 | 127,657 | ||||
Sierra Timeshare Receivables Funding LLC, Series 2015-1A, Class A, 2.40%, 3/22/32(3) | 24,047 | 24,120 | ||||
TOTAL ASSET-BACKED SECURITIES (Cost $193,640) | 193,357 | |||||
| TEMPORARY CASH INVESTMENTS — 0.6% | ||||||
| State Street Institutional Liquid Reserves Fund, Premier Class | 113,947 | 113,947 | ||||
| State Street Institutional U.S. Government Money Market Fund, Premier Class | 30,089 | 30,089 | ||||
TOTAL TEMPORARY CASH INVESTMENTS (Cost $144,036) | 144,036 | |||||
TOTAL INVESTMENT SECURITIES — 100.3% (Cost $22,008,682) | 22,673,979 | |||||
| OTHER ASSETS AND LIABILITIES — (0.3)% | (58,211) | |||||
| TOTAL NET ASSETS — 100.0% | $ | 22,615,768 | ||||
FORWARD FOREIGN CURRENCY EXCHANGE CONTRACTS
| Currency Purchased | Currency Sold | Counterparty | Settlement Date | Unrealized Appreciation (Depreciation) | |||||
| AUD | 687,305 | USD | 494,970 | UBS AG | 9/21/16 | $ | 16,184 | ||
| USD | 752,557 | CAD | 986,557 | JPMorgan Chase Bank N.A. | 9/21/16 | (11,183 | ) | ||
| USD | 76,347 | CAD | 98,621 | JPMorgan Chase Bank N.A. | 9/21/16 | — | |||
| USD | 1,000,516 | CLP | 698,560,164 | UBS AG | 9/21/16 | (47,625 | ) | ||
| USD | 99,280 | CLP | 68,453,345 | UBS AG | 9/21/16 | (3,430 | ) | ||
| COP | 2,350,596,157 | USD | 742,098 | UBS AG | 9/21/16 | 49,683 | |||
| USD | 573,877 | HUF | 158,843,425 | JPMorgan Chase Bank N.A. | 9/21/16 | 15,686 | |||
| USD | 101,815 | HUF | 28,988,758 | JPMorgan Chase Bank N.A. | 9/21/16 | (54 | ) | ||
| USD | 498,816 | ILS | 1,922,668 | JPMorgan Chase Bank N.A. | 9/21/16 | (262 | ) | ||
| USD | 68,734 | ILS | 263,014 | JPMorgan Chase Bank N.A. | 9/21/16 | 462 | |||
| INR | 50,911,713 | USD | 744,214 | UBS AG | 9/21/16 | 105 | |||
| INR | 5,529,298 | USD | 81,361 | UBS AG | 9/21/16 | (524 | ) | ||
| USD | 495,872 | JPY | 50,373,638 | JPMorgan Chase Bank N.A. | 9/21/16 | 6,782 | |||
| USD | 332,206 | JPY | 34,205,540 | JPMorgan Chase Bank N.A. | 9/21/16 | 95 | |||
| USD | 849,804 | KRW | 988,747,080 | UBS AG | 9/21/16 | (7,148 | ) | ||
| MXN | 27,910,163 | USD | 1,480,081 | JPMorgan Chase Bank N.A. | 9/21/16 | 34,761 | |||
| MXN | 3,537,623 | USD | 188,429 | JPMorgan Chase Bank N.A. | 9/21/16 | 3,577 | |||
| MYR | 3,129,572 | USD | 765,738 | UBS AG | 9/21/16 | 17,229 | |||
| MYR | 2,017,475 | USD | 499,437 | UBS AG | 9/21/16 | 5,302 | |||
| USD | 750,677 | MYR | 3,129,572 | UBS AG | 9/21/16 | (32,290 | ) | ||
| USD | 164,860 | NOK | 1,370,928 | JPMorgan Chase Bank N.A. | 9/21/16 | 1,070 | |||
| USD | 165,964 | NOK | 1,395,334 | JPMorgan Chase Bank N.A. | 9/21/16 | (742 | ) | ||
| USD | 495,527 | NZD | 731,600 | UBS AG | 9/21/16 | (24,788 | ) | ||
| USD | 847,506 | PHP | 39,595,491 | UBS AG | 9/21/16 | 10,082 | |||
| PLN | 1,361,508 | USD | 348,256 | JPMorgan Chase Bank N.A. | 9/21/16 | (3,770 | ) | ||
18
| Currency Purchased | Currency Sold | Counterparty | Settlement Date | Unrealized Appreciation (Depreciation) | |||||
| USD | 563,091 | PLN | 2,219,300 | JPMorgan Chase Bank N.A. | 9/21/16 | $ | 1,567 | ||
| RUB | 10,635,026 | USD | 162,491 | UBS AG | 9/21/16 | 449 | |||
| RUB | 10,374,266 | USD | 159,115 | UBS AG | 9/21/16 | (170 | ) | ||
| USD | 753,692 | SGD | 1,039,944 | JPMorgan Chase Bank N.A. | 9/21/16 | (17,672 | ) | ||
| USD | 72,044 | SGD | 98,057 | JPMorgan Chase Bank N.A. | 9/21/16 | (688 | ) | ||
| THB | 30,023,175 | USD | 852,326 | UBS AG | 9/21/16 | 975 | |||
| TRY | 952,146 | USD | 325,309 | JPMorgan Chase Bank N.A. | 9/21/16 | (429 | ) | ||
| USD | 845,192 | TWD | 27,278,565 | UBS AG | 9/21/16 | (3,687 | ) | ||
| ZAR | 8,825,403 | USD | 565,695 | JPMorgan Chase Bank N.A. | 9/21/16 | 24,167 | |||
| $ | 33,714 | ||||||||
| FUTURES CONTRACTS | ||||||||
| Contracts Purchased | Expiration Date | Underlying Face Amount at Value | Unrealized Appreciation (Depreciation) | |||||
| 4 | U.S. Treasury 2-Year Notes | September 2016 | $ | 877,312 | $ | 5,366 | ||
| 10 | U.S. Treasury 5-Year Notes | September 2016 | 1,221,641 | 18,899 | ||||
| $ | 2,098,953 | $ | 24,265 | |||||
| Contracts Sold | Expiration Date | Underlying Face Amount at Value | Unrealized Appreciation (Depreciation) | |||||
| 3 | U.S. Treasury 10-Year Notes | September 2016 | $ | 398,953 | $ | (10,788 | ) | |
| 4 | U.S. Treasury 10-Year Ultra Notes | September 2016 | 582,687 | (6,399) | ||||
| $ | 981,640 | $ | (17,187 | ) | ||||
| TOTAL RETURN SWAP AGREEMENTS | ||||||||||
| Counterparty | Notional Amount | Floating Rate Referenced Index | Pay/Receive Total Return of Referenced Index | Fixed Rate | Termination Date | Value | ||||
| Bank of America N.A. | $ | 1,000,000 | U.S. CPI Urban Consumers NSA Index | Receive | 2.21% | 3/13/19 | $ | (51,118 | ) | |
| Bank of America N.A. | 700,000 | U.S. CPI Urban Consumers NSA Index | Receive | 1.41% | 8/27/20 | (267 | ) | |||
| Barclays Bank plc | 1,000,000 | U.S. CPI Urban Consumers NSA Index | Receive | 1.64% | 2/3/20 | (16,457 | ) | |||
| Morgan Stanley Capital Services LLC | 500,000 | U.S. CPI Urban Consumers NSA Index | Receive | 2.24% | 8/19/19 | (29,262 | ) | |||
| $ | (97,104 | ) | ||||||||
19
| NOTES TO SCHEDULE OF INVESTMENTS | ||
| AUD | - | Australian Dollar |
| CAD | - | Canadian Dollar |
| CLP | - | Chilean Peso |
| COP | - | Colombian Peso |
| CPI | - | Consumer Price Index |
| FHLMC | - | Federal Home Loan Mortgage Corporation |
| HUF | - | Hungarian Forint |
| ILS | - | Israeli Shekel |
| INR | - | Indian Rupee |
| JPY | - | Japanese Yen |
| KRW | - | South Korean Won |
| MTN | - | Medium Term Note |
| MXN | - | Mexican Peso |
| MYR | - | Malaysian Ringgit |
| NOK | - | Norwegian Krone |
| NSA | - | Not Seasonally Adjusted |
| NZD | - | New Zealand Dollar |
| PHP | - | Philippine Peso |
| PLN | - | Polish Zloty |
| RUB | - | Russian Ruble |
| SEQ | - | Sequential Payer |
| SGD | - | Singapore Dollar |
| THB | - | Thai Baht |
| TRY | - | Turkish Lira |
| TWD | - | Taiwanese Dollar |
| USD | - | United States Dollar |
| VRN | - | Variable Rate Note. Interest reset date is indicated. Rate shown is effective at the period end. |
| ZAR | - | South African Rand |
| (1) | Security, or a portion thereof, has been pledged at the custodian bank or with a broker for margin requirements on futures contracts. At the period end, the aggregate value of securities pledged was $18,053. |
| (2) | Non-income producing. |
| (3) | Security was purchased pursuant to Rule 144A under the Securities Act of 1933 and may be sold in transactions exempt from registration, normally to qualified institutional investors. The aggregate value of these securities at the period end was $846,747, which represented 3.7% of total net assets. |
| (4) | Final maturity date indicated, unless otherwise noted. |
See Notes to Financial Statements.
20
| Statement of Assets and Liabilities |
| JUNE 30, 2016 | |||
| Assets | |||
| Investment securities, at value (cost of $22,008,682) | $ | 22,673,979 | |
| Cash | 107 | ||
| Foreign currency holdings, at value (cost of $12,438) | 12,395 | ||
| Receivable for investments sold | 49,649 | ||
| Receivable for capital shares sold | 936 | ||
| Receivable for variation margin on futures contracts | 2,203 | ||
| Unrealized appreciation on forward foreign currency exchange contracts | 188,176 | ||
| Interest and dividends receivable | 84,879 | ||
| Other assets | 184 | ||
| 23,012,508 | |||
| Liabilities | |||
| Payable for investments purchased | 87,360 | ||
| Payable for capital shares redeemed | 35,742 | ||
| Unrealized depreciation on forward foreign currency exchange contracts | 154,462 | ||
| Swap agreements, at value | 97,104 | ||
| Accrued management fees | 15,846 | ||
| Distribution and service fees payable | 2,876 | ||
| Accrued other expenses | 3,350 | ||
| 396,740 | |||
| Net Assets | $ | 22,615,768 | |
| Net Assets Consist of: | |||
| Capital (par value and paid-in surplus) | $ | 28,984,222 | |
| Accumulated net investment loss | (292,417 | ) | |
| Accumulated net realized loss | (6,684,770 | ) | |
| Net unrealized appreciation | 608,733 | ||
| $ | 22,615,768 | ||
| Net Assets | Shares Outstanding | Net Asset Value Per Share | ||||
| Investor Class, $0.01 Par Value | $14,229,614 | 1,508,870 | $9.43 | |||
| Institutional Class, $0.01 Par Value | $1,384,327 | 146,365 | $9.46 | |||
| A Class, $0.01 Par Value | $4,586,959 | 489,060 | $9.38* | |||
| C Class, $0.01 Par Value | $2,309,750 | 254,222 | $9.09 | |||
| R Class, $0.01 Par Value | $105,118 | 11,316 | $9.29 | |||
*Maximum offering price $9.95 (net asset value divided by 0.9425).
See Notes to Financial Statements.
21
| Statement of Operations |
| YEAR ENDED JUNE 30, 2016 | |||
| Investment Income (Loss) | |||
| Income: | |||
| Interest | $ | 206,586 | |
| Dividends (net of foreign taxes withheld of $6,994) | 199,049 | ||
| 405,635 | |||
| Expenses: | |||
| Management fees | 317,603 | ||
| Distribution and service fees: | |||
| A Class | 15,311 | ||
| C Class | 39,736 | ||
| R Class | 506 | ||
| Directors' fees and expenses | 1,797 | ||
| Other expenses | 4,491 | ||
| 379,444 | |||
| Fees waived | (59,323 | ) | |
| 320,121 | |||
| Net investment income (loss) | 85,514 | ||
| Realized and Unrealized Gain (Loss) | |||
| Net realized gain (loss) on: | |||
| Investment transactions | (2,158,817 | ) | |
| Futures contract transactions | (9,023 | ) | |
| Swap agreement transactions | (61,690 | ) | |
| Foreign currency transactions | (500,385 | ) | |
| (2,729,915 | ) | ||
| Change in net unrealized appreciation (depreciation) on: | |||
| Investments | 1,262,407 | ||
| Futures contracts | 7,078 | ||
| Swap agreements | 23,614 | ||
| Translation of assets and liabilities in foreign currencies | 30,165 | ||
| 1,323,264 | |||
| Net realized and unrealized gain (loss) | (1,406,651 | ) | |
| Net Increase (Decrease) in Net Assets Resulting from Operations | $ | (1,321,137 | ) |
See Notes to Financial Statements.
22
| Statement of Changes in Net Assets |
| YEARS ENDED JUNE 30, 2016 AND JUNE 30, 2015 | ||||||
| Increase (Decrease) in Net Assets | June 30, 2016 | June 30, 2015 | ||||
| Operations | ||||||
| Net investment income (loss) | $ | 85,514 | $ | 17,626 | ||
| Net realized gain (loss) | (2,729,915 | ) | (1,574,610 | ) | ||
| Change in net unrealized appreciation (depreciation) | 1,323,264 | (3,120,662 | ) | |||
| Net increase (decrease) in net assets resulting from operations | (1,321,137 | ) | (4,677,646 | ) | ||
| Distributions to Shareholders | ||||||
| From net investment income: | ||||||
| Investor Class | — | (295,073 | ) | |||
| Institutional Class | — | (17,817 | ) | |||
| A Class | — | (55,820 | ) | |||
| R Class | — | (221 | ) | |||
| Decrease in net assets from distributions | — | (368,931 | ) | |||
| Capital Share Transactions | ||||||
| Net increase (decrease) in net assets from capital share transactions (Note 5) | (15,188,752 | ) | (8,638,049 | ) | ||
| Net increase (decrease) in net assets | (16,509,889 | ) | (13,684,626 | ) | ||
| Net Assets | ||||||
| Beginning of period | 39,125,657 | 52,810,283 | ||||
| End of period | $ | 22,615,768 | $ | 39,125,657 | ||
Accumulated net investment loss/ Distributions in excess of net investment income | $ | (292,417 | ) | $ | (832,688 | ) |
See Notes to Financial Statements.
23
| Notes to Financial Statements |
JUNE 30, 2016
1. Organization
American Century Quantitative Equity Funds, Inc. (the corporation) is registered under the Investment Company Act of 1940, as amended (the 1940 Act), as an open-end management investment company and is organized as a Maryland corporation. Multi-Asset Real Return Fund (formerly Strategic Inflation Opportunities Fund) (the fund) is one fund in a series issued by the corporation. The fund’s investment objective is to seek total real return.
The fund offers the Investor Class, the Institutional Class, the A Class, the C Class and the R Class. The A Class may incur an initial sales charge. The A Class and C Class may be subject to a contingent deferred sales charge. The share classes differ principally in their respective sales charges and distribution and shareholder servicing expenses and arrangements. The Institutional Class is made available to institutional shareholders or through financial intermediaries whose clients do not require the same level of shareholder and administrative services as shareholders of other classes. As a result, the Institutional Class is charged a lower unified management fee.
2. Significant Accounting Policies
The following is a summary of significant accounting policies consistently followed by the fund in preparation of its financial statements. The fund is an investment company and follows accounting and reporting guidance in accordance with accounting principles generally accepted in the United States of America. This may require management to make certain estimates and assumptions at the date of the financial statements. Actual results could differ from these estimates. Management evaluated the impact of events or transactions occurring through the date the financial statements were issued that would merit recognition or disclosure.
Investment Valuations — The fund determines the fair value of its investments and computes its net asset value per share at the close of regular trading (usually 4 p.m. Eastern time) on the New York Stock Exchange (NYSE) on each day the NYSE is open. The Board of Directors has adopted valuation policies and procedures to guide the investment advisor in the fund’s investment valuation process and to provide methodologies for the oversight of the fund’s pricing function.
Fixed income securities are valued at the evaluated mean as provided by independent pricing services or at the mean of the most recent bid and asked prices as provided by investment dealers. Corporate bonds, U.S. Treasury and Government Agency securities, convertible bonds and sovereign governments and agencies are valued using market models that consider trade data, quotations from dealers and active market makers, relevant yield curve and spread data, creditworthiness, trade data or market information on comparable securities, and other relevant security specific information. Mortgage-related and asset-backed securities are valued based on models that consider trade data, prepayment and default projections, benchmark yield and spread data and estimated cash flows of each tranche of the issuer.
Equity securities that are listed or traded on a domestic securities exchange are valued at the last reported sales price or at the official closing price as provided by the exchange. Equity securities traded on foreign securities exchanges are generally valued at the closing price of such securities on the exchange where primarily traded or at the close of the NYSE, if that is earlier. If no last sales price is reported, or if local convention or regulation so provides, the mean of the latest bid and asked prices may be used. Securities traded over-the-counter are valued at the mean of the latest bid and asked prices, the last sales price, or the official closing price. Equity securities initially expressed in local currencies are translated into U.S. dollars at the mean of the appropriate currency exchange rate at the close of the NYSE as provided by an independent pricing service.
Open-end management investment companies are valued at the reported net asset value per share. Exchange-traded futures contracts are valued at the settlement price as provided by the appropriate clearing corporation. Swap agreements are valued at an evaluated price as provided by independent pricing services or independent brokers. Forward foreign currency exchange contracts are valued at the mean of the appropriate forward exchange rate at the close of the NYSE as provided by an independent pricing service.
If the fund determines that the market price for an investment is not readily available or the valuation methods mentioned above do not reflect an investment’s fair value, such investment is valued as determined in good
24
faith by the Board of Directors or its delegate, in accordance with policies and procedures adopted by the Board of Directors. In its determination of fair value, the fund may review several factors including, but not limited to, market information regarding the specific investment or comparable investments and correlation with other investment types, futures indices or general market indicators. Circumstances that may cause the fund to use these procedures to value an investment include, but are not limited to: an investment has been declared in default or is distressed; trading in a security has been suspended during the trading day or a security is not actively trading on its principal exchange; prices received from a regular pricing source are deemed unreliable; or there is a foreign market holiday and no trading occurred.
The fund monitors for significant events occurring after the close of an investment’s primary exchange but before the fund’s net asset value per share is determined. Significant events may include, but are not limited to: corporate announcements and transactions; governmental action and political unrest that could impact a specific investment or an investment sector; or armed conflicts, natural disasters and similar events that could affect investments in a specific country or region. The fund also monitors for significant fluctuations between domestic and foreign markets, as evidenced by the U.S. market or such other indicators that the Board of Directors, or its delegate, deems appropriate. If significant fluctuations in foreign markets are identified, the fund may apply a model-derived factor to the closing price of equity securities traded on foreign securities exchanges. The factor is based on observable market data as provided by an independent pricing service.
Security Transactions — Security transactions are accounted for as of the trade date. Net realized gains and losses are determined on the identified cost basis, which is also used for federal income tax purposes.
Investment Income — Dividend income less foreign taxes withheld, if any, is recorded as of the ex-dividend date. Distributions received on securities that represent a return of capital or long-term capital gain are recorded as a reduction of cost of investments and/or as a realized gain. The fund may estimate the components of distributions received that may be considered nontaxable distributions or long-term capital gain distributions for income tax purposes. Interest income is recorded on the accrual basis and includes paydown gain (loss) and accretion of discounts and amortization of premiums. Inflation adjustments related to inflation-linked debt securities are reflected as interest income.
Foreign Currency Translations — All assets and liabilities initially expressed in foreign currencies are translated into U.S. dollars at prevailing exchange rates at period end. The fund may enter into spot foreign currency exchange contracts to facilitate transactions denominated in a foreign currency. Purchases and sales of investment securities, dividend and interest income, spot foreign currency exchange contracts, and expenses are translated at the rates of exchange prevailing on the respective dates of such transactions. Net realized and unrealized foreign currency exchange gains or losses related to investment securities are a component of net realized gain (loss) on investment transactions and change in net unrealized appreciation (depreciation) on investments, respectively.
Income Tax Status — It is the fund’s policy to distribute substantially all net investment income and net realized gains to shareholders and to otherwise qualify as a regulated investment company under provisions of the Internal Revenue Code. Accordingly, no provision has been made for income taxes. The fund files U.S. federal, state, local and non-U.S. tax returns as applicable. The fund's tax returns are subject to examination by the relevant taxing authority until expiration of the applicable statute of limitations, which is generally three years from the date of filing but can be longer in certain jurisdictions. At this time, management believes there are no uncertain tax positions which, based on their technical merit, would not be sustained upon examination and for which it is reasonably possible that the total amounts of unrecognized tax benefits will significantly change in the next twelve months.
Segregated Assets — In accordance with the 1940 Act, the fund segregates assets on its books and records to cover certain types of investments, including, but not limited to, futures contracts, forward commitments, when-issued securities, swap agreements and certain forward foreign currency exchange contracts. American Century Investment Management, Inc. (ACIM) (the investment advisor) monitors, on a daily basis, the securities segregated to ensure the fund designates a sufficient amount of liquid assets, marked-to-market daily. The fund may also receive assets or be required to pledge assets at the custodian bank or with a broker for margin requirements on futures contracts, forward commitments and swap agreements.
Multiple Class — All shares of the fund represent an equal pro rata interest in the net assets of the class to which such shares belong, and have identical voting, dividend, liquidation and other rights and the same terms and conditions, except for class specific expenses and exclusive rights to vote on matters affecting only individual classes. Income, non-class specific expenses, and realized and unrealized capital gains and losses of the fund are allocated to each class of shares based on their relative net assets.
25
Distributions to Shareholders — Distributions from net investment income, if any, are generally declared and paid quarterly. Distributions from net realized gains, if any, are generally declared and paid annually.
Indemnifications — Under the corporation’s organizational documents, its officers and directors are indemnified against certain liabilities arising out of the performance of their duties to the fund. In addition, in the normal course of business, the fund enters into contracts that provide general indemnifications. The maximum exposure under these arrangements is unknown as this would involve future claims that may be made against a fund. The risk of material loss from such claims is considered by management to be remote.
3. Fees and Transactions with Related Parties
Certain officers and directors of the corporation are also officers and/or directors of American Century Companies, Inc. (ACC). The corporation’s investment advisor, ACIM, the corporation's distributor, American Century Investment Services, Inc. (ACIS), and the corporation’s transfer agent, American Century Services, LLC, are wholly owned, directly or indirectly, by ACC.
Management Fees — The corporation has entered into a management agreement with ACIM, under which ACIM provides the fund with investment advisory and management services in exchange for a single, unified management fee (the fee) per class. The agreement provides that all expenses of managing and operating the fund, except distribution and service fees, brokerage expenses, taxes, interest, fees and expenses of the independent directors (including legal counsel fees), and extraordinary expenses, will be paid by ACIM. The fee is computed and accrued daily based on each class’s daily net assets and paid monthly in arrears. The fee consists of (1) an Investment Category Fee based on the daily net assets of the fund and certain other accounts managed by the investment advisor that are in the same broad investment category as the fund and (2) a Complex Fee based on the assets of all the funds in the American Century Investments family of funds. The rates for the Investment Category Fee range from 0.7754% to 0.8929%. The rates for the Complex Fee range from 0.2500% to 0.3100% for the Investor Class, A Class, C Class and R Class. The rates for the Complex Fee range from 0.0500% to 0.1100% for the Institutional Class. During the year ended June 30, 2016, the investment advisor agreed to waive 0.2000% of the fund's management fee. The investment advisor expects this waiver to continue until July 31, 2017 and cannot terminate it prior to such date without the approval of the Board of Directors. The total amount of the waiver for each class for the year ended June 30, 2016 was $36,895, $2,030, $12,249, $7,947 and $202 for the Investor Class, Institutional Class, A Class, C Class and R Class, respectively. The effective annual management fee before waiver for each class for the year ended June 30, 2016 was 1.08% for the Investor Class, A Class, C Class and R Class and 0.88% for the Institutional Class. The effective annual management fee after waiver for each class for the year ended June 30, 2016 was 0.88% for the Investor Class, A Class, C Class and R Class and 0.68% for the Institutional Class.
Distribution and Service Fees — The Board of Directors has adopted a separate Master Distribution and Individual Shareholder Services Plan for each of the A Class, C Class and R Class (collectively the plans), pursuant to Rule 12b-1 of the 1940 Act. The plans provide that the A Class will pay ACIS an annual distribution and service fee of 0.25%. The plans provide that the C Class will pay ACIS an annual distribution and service fee of 1.00%, of which 0.25% is paid for individual shareholder services and 0.75% is paid for distribution services. The plans provide that the R Class will pay ACIS an annual distribution and service fee of 0.50%. The fees are computed and accrued daily based on each class’s daily net assets and paid monthly in arrears. The fees are used to pay financial intermediaries for distribution and individual shareholder services. Fees incurred under the plans during the year ended June 30, 2016 are detailed in the Statement of Operations.
Directors' Fees and Expenses — The Board of Directors is responsible for overseeing the investment advisor’s management and operations of the fund. The directors receive detailed information about the fund and its investment advisor regularly throughout the year, and meet at least quarterly with management of the investment advisor to review reports about fund operations. The fund’s officers do not receive compensation from the fund.
Other Expenses — The fund’s other expenses may include interest charges, clearing exchange fees, proxy solicitation expenses, filing fees for foreign tax reclaims and other miscellaneous expenses. The impact of other expenses to the ratio of operating expenses to average net assets was 0.02% for the year ended June 30, 2016.
26
Acquired Fund Fees and Expenses — The fund may invest in mutual funds, exchange-traded funds, and business development companies (the acquired funds). The fund will indirectly realize its pro rata share of the fees and expenses of the acquired funds in which it invests. These indirect fees and expenses are not paid out of the fund's assets but are reflected in the return realized by the fund on its investment in the acquired funds.
Interfund Transactions — The fund may enter into security transactions with other American Century Investments funds and other client accounts of the investment advisor, in accordance with the 1940 Act rules and procedures adopted by the Board of Directors. The rules and procedures require, among other things, that these transactions be effected at the independent current market price of the security. During the period, the interfund purchases and sales were $193,346 and $217,489, respectively.
4. Investment Transactions
Purchases of investment securities, excluding short-term investments, for the year ended June 30, 2016 totaled $36,592,562, of which $14,540,865 represented U.S. Treasury and Government Agency obligations.
Sales of investment securities, excluding short-term investments, for the year ended June 30, 2016 totaled $44,131,078, of which $18,250,452 represented U.S. Treasury and Government Agency obligations.
5. Capital Share Transactions
Transactions in shares of the fund were as follows:
| Year ended June 30, 2016 | Year ended June 30, 2015 | |||||||||
| Shares | Amount | Shares | Amount | |||||||
| Investor Class/Shares Authorized | 50,000,000 | 50,000,000 | ||||||||
| Sold | 505,975 | $ | 4,628,549 | 1,296,364 | $ | 13,315,015 | ||||
| Issued in reinvestment of distributions | — | — | 20,753 | 210,942 | ||||||
| Redeemed | (1,518,740 | ) | (13,617,174 | ) | (1,487,088 | ) | (14,658,510 | ) | ||
| (1,012,765 | ) | (8,988,625 | ) | (169,971 | ) | (1,132,553 | ) | |||
| Institutional Class/Shares Authorized | 25,000,000 | 30,000,000 | ||||||||
| Sold | 66,918 | 620,732 | 29,488 | 295,312 | ||||||
| Issued in reinvestment of distributions | — | — | 1,764 | 17,817 | ||||||
| Redeemed | (35,967 | ) | (328,621 | ) | (44,989 | ) | (437,567 | ) | ||
| 30,951 | 292,111 | (13,737 | ) | (124,438 | ) | |||||
| A Class/Shares Authorized | 35,000,000 | 40,000,000 | ||||||||
| Sold | 5,563 | 50,786 | 33,869 | 338,497 | ||||||
| Issued in reinvestment of distributions | — | — | 5,446 | 55,711 | ||||||
| Redeemed | (398,208 | ) | (3,592,349 | ) | (501,558 | ) | (4,982,560 | ) | ||
| (392,645 | ) | (3,541,563 | ) | (462,243 | ) | (4,588,352 | ) | |||
| C Class/Shares Authorized | 20,000,000 | 20,000,000 | ||||||||
| Sold | 19,179 | 168,828 | 32,327 | 316,647 | ||||||
| Redeemed | (355,190 | ) | (3,120,673 | ) | (324,564 | ) | (3,109,811 | ) | ||
| (336,011 | ) | (2,951,845 | ) | (292,237 | ) | (2,793,164 | ) | |||
| R Class/Shares Authorized | 15,000,000 | 15,000,000 | ||||||||
| Sold | 186 | 1,675 | 24 | 237 | ||||||
| Issued in reinvestment of distributions | — | — | 22 | 221 | ||||||
| Redeemed | (55 | ) | (505 | ) | — | — | ||||
| 131 | 1,170 | 46 | 458 | |||||||
| Net increase (decrease) | (1,710,339 | ) | $ | (15,188,752 | ) | (938,142 | ) | $ | (8,638,049 | ) |
27
6. Fair Value Measurements
The fund’s investments valuation process is based on several considerations and may use multiple inputs to determine the fair value of the investments held by the fund. In conformity with accounting principles generally accepted in the United States of America, the inputs used to determine a valuation are classified into three broad levels.
| • | Level 1 valuation inputs consist of unadjusted quoted prices in an active market for identical investments. |
| • | Level 2 valuation inputs consist of direct or indirect observable market data (including quoted prices for comparable investments, evaluations of subsequent market events, interest rates, prepayment speeds, credit risk, etc.). These inputs also consist of quoted prices for identical investments initially expressed in local currencies that are adjusted through translation into U.S. dollars. |
| • | Level 3 valuation inputs consist of unobservable data (including a fund’s own assumptions). |
The level classification is based on the lowest level input that is significant to the fair valuation measurement. The valuation inputs are not necessarily an indication of the risks associated with investing in these securities or other financial instruments. There were no significant transfers between levels during the period.
The following is a summary of the level classifications as of period end. The Schedule of Investments provides additional information on the fund’s portfolio holdings.
| Level 1 | Level 2 | Level 3 | ||||||
| Assets | ||||||||
| Investment Securities | ||||||||
| U.S. Treasury Securities | — | $ | 10,878,980 | — | ||||
| Common Stocks | ||||||||
| Chemicals | $ | 201,643 | 102,268 | — | ||||
| Construction and Engineering | 56,968 | 60,543 | — | |||||
| Electric Utilities | 254,953 | 191,282 | — | |||||
| Energy Equipment and Services | 53,686 | 55,945 | — | |||||
| Health Care Providers and Services | 155,695 | 36,985 | — | |||||
| Internet Software and Services | 96,866 | 11,843 | — | |||||
| Multi-Utilities | 114,139 | 62,057 | — | |||||
| Oil, Gas and Consumable Fuels | 454,311 | 184,304 | — | |||||
| Real Estate Investment Trusts (REITs) | 1,610,715 | 684,325 | — | |||||
| Real Estate Management and Development | — | 548,628 | — | |||||
| Road and Rail | 122,614 | 117,078 | — | |||||
| Transportation Infrastructure | — | 117,264 | — | |||||
| Other Industries | 2,704,139 | — | — | |||||
| Corporate Bonds | — | 1,478,941 | — | |||||
| Collateralized Mortgage Obligations | — | 1,001,548 | — | |||||
| Exchange-Traded Funds | 779,656 | — | — | |||||
| Commercial Mortgage-Backed Securities | — | 199,210 | — | |||||
| Asset-Backed Securities | — | 193,357 | — | |||||
| Temporary Cash Investments | 144,036 | — | — | |||||
| $ | 6,749,421 | $ | 15,924,558 | — | ||||
| Other Financial Instruments | ||||||||
| Futures Contracts | $ | 24,265 | — | — | ||||
| Forward Foreign Currency Exchange Contracts | — | $ | 188,176 | — | ||||
| $ | 24,265 | $ | 188,176 | — | ||||
| Liabilities | ||||||||
| Other Financial Instruments | ||||||||
| Futures Contracts | $ | 17,187 | — | — | ||||
| Swap Agreements | — | $ | 97,104 | — | ||||
| Forward Foreign Currency Exchange Contracts | — | 154,462 | — | |||||
| $ | 17,187 | $ | 251,566 | — | ||||
28
7. Derivative Instruments
Foreign Currency Risk — The fund is subject to foreign currency exchange rate risk in the normal course of pursuing its investment objectives. The value of foreign investments held by a fund may be significantly affected by changes in foreign currency exchange rates. The dollar value of a foreign security generally decreases when the value of the dollar rises against the foreign currency in which the security is denominated and tends to increase when the value of the dollar declines against such foreign currency. A fund may enter into forward foreign currency exchange contracts to reduce a fund's exposure to foreign currency exchange rate fluctuations or to gain exposure to the fluctuations in the value of foreign currencies. The net U.S. dollar value of foreign currency underlying all contractual commitments held by a fund and the resulting unrealized appreciation or depreciation are determined daily. Realized gain or loss is recorded upon the termination of the contract. Net realized and unrealized gains or losses occurring during the holding period of forward foreign currency exchange contracts are a component of net realized gain (loss) on foreign currency transactions and change in net unrealized appreciation (depreciation) on translation of assets and liabilities in foreign currencies, respectively. A fund bears the risk of an unfavorable change in the foreign currency exchange rate underlying the forward contract. Additionally, losses, up to the fair value, may arise if the counterparties do not perform under the contract terms. The fund's average U.S. dollar exposure to foreign currency risk derivative instruments held during the period was $27,882,826.
Interest Rate Risk — The fund is subject to interest rate risk in the normal course of pursuing its investment objectives. The value of bonds generally declines as interest rates rise. A fund may enter into futures contracts based on a bond index or a specific underlying security. A fund may purchase futures contracts to gain exposure to increases in market value or sell futures contracts to protect against a decline in market value. Upon entering into a futures contract, a fund will segregate cash, cash equivalents or other appropriate liquid securities on its records in amounts sufficient to meet requirements. Subsequent payments (variation margin) are made or received daily, in cash, by a fund. The variation margin is equal to the daily change in the contract value and is recorded as unrealized gains and losses. A fund recognizes a realized gain or loss when the futures contract is closed or expires. Net realized and unrealized gains or losses occurring during the holding period of futures contracts are a component of net realized gain (loss) on futures contract transactions and change in net unrealized appreciation (depreciation) on futures contracts, respectively. One of the risks of entering into futures contracts is the possibility that the change in value of the contract may not correlate with the changes in value of the underlying securities. The fund's average exposure to interest rate risk derivative instruments held during the period was 19 contracts.
Other Contracts — A fund may enter into total return swap agreements in order to attempt to obtain or preserve a particular return or spread at a lower cost than obtaining a return or spread through purchases and/or sales of instruments in other markets or gain exposure to certain markets in the most economical way possible. A fund will segregate cash, cash equivalents or other appropriate liquid securities on its records in amounts sufficient to meet requirements. Changes in value, including the periodic amounts of interest to be paid or received on swap agreements, are recorded as unrealized appreciation (depreciation) on swap agreements. Realized gain or loss is recorded upon receipt or payment of a periodic settlement or termination of swap agreements. Net realized and unrealized gains or losses occurring during the holding period of swap agreements are a component of net realized gain (loss) on swap agreement transactions and change in net unrealized appreciation (depreciation) on swap agreements, respectively. The risks of entering into swap agreements include the possible lack of liquidity, failure of the counterparty to meet its obligations, and that there may be unfavorable changes in the underlying investments or instruments, including inflationary risk.
The fund's average notional amount held during the period was $4,054,167.
29
Value of Derivative Instruments as of June 30, 2016
| Asset Derivatives | Liability Derivatives | |||||||
| Type of Risk Exposure | Location on Statement of Assets and Liabilities | Value | Location on Statement of Assets and Liabilities | Value | ||||
| Foreign Currency Risk | Unrealized appreciation on forward foreign currency exchange contracts | $ | 188,176 | Unrealized depreciation on forward foreign currency exchange contracts | $ | 154,462 | ||
| Interest Rate Risk | Receivable for variation margin on futures contracts* | 2,203 | Payable for variation margin on futures contracts* | — | ||||
| Other Contracts | Swap agreements | — | Swap agreements | 97,104 | ||||
| $ | 190,379 | $ | 251,566 | |||||
| * | Included in the unrealized appreciation (depreciation) on futures contracts as reported in the Schedule of Investments. |
Effect of Derivative Instruments on the Statement of Operations for the Year Ended June 30, 2016
| Net Realized Gain (Loss) | Change in Net Unrealized Appreciation (Depreciation) | |||||||
| Type of Risk Exposure | Location on Statement of Operations | Value | Location on Statement of Operations | Value | ||||
| Foreign Currency Risk | Net realized gain (loss) on foreign currency transactions | $ | (499,984 | ) | Change in net unrealized appreciation (depreciation) on translation of assets and liabilities in foreign currencies | $ | 30,342 | |
| Interest Rate Risk | Net realized gain (loss) on futures contract transactions | (9,023 | ) | Change in net unrealized appreciation (depreciation) on futures contracts | 7,078 | |||
| Other Contracts | Net realized gain (loss) on swap agreement transactions | (61,690 | ) | Change in net unrealized appreciation (depreciation) on swap agreements | 23,614 | |||
| $ | (570,697 | ) | $ | 61,034 | ||||
Counterparty Risk — The fund is subject to counterparty risk, or the risk that an institution will fail to perform its obligations to the fund. The investment advisor attempts to minimize counterparty risk prior to entering into transactions by performing extensive reviews of the creditworthiness of all potential counterparties. The fund may also enter into agreements that provide provisions for legally enforceable master netting arrangements to manage the credit risk between counterparties related to forward foreign currency exchange contracts and/or swap agreements. A master netting arrangement provides for the net settlement of multiple contracts with a single counterparty through a single payment in the event of default or termination of any one contract. To mitigate counterparty risk, the fund may receive assets or be required to pledge assets at the custodian bank or with a broker as designated under prescribed collateral provisions.
30
The fund does not offset assets and liabilities subject to master netting arrangements on the Statement of Assets and Liabilities for financial reporting purposes. The fund’s asset derivatives and liability derivatives that are subject to legally enforceable offsetting arrangements as of period end were as follows:
| Counterparty | Gross Amount on Statement of Assets and Liabilities | Amount Eligible for Offset | Collateral | Net Exposure* | |||||||
| Assets | |||||||||||
| JPMorgan Chase Bank N.A. | $ | 88,167 | $ | (34,800 | ) | — | $ | 53,367 | |||
| UBS AG | 100,009 | (100,009) | — | — | |||||||
| $ | 188,176 | $ | (134,809 | ) | — | $ | 53,367 | ||||
| Liabilities | |||||||||||
| Bank of America N.A. | $ | 51,385 | — | — | $ | 51,385 | |||||
| Barclays Bank plc | 16,457 | — | — | 16,457 | |||||||
| JPMorgan Chase Bank N.A. | 34,800 | $ | (34,800 | ) | — | — | |||||
| Morgan Stanley Capital Services LLC | 29,262 | — | — | 29,262 | |||||||
| UBS AG | 119,662 | (100,009) | — | 19,653 | |||||||
| $ | 251,566 | $ | (134,809 | ) | — | $ | 116,757 | ||||
* The net exposure represents the amount receivable from the counterparty or amount payable to the counterparty in the event of default or termination.
8. Risk Factors
There are certain risks involved in investing in foreign securities. These risks include those resulting from future adverse political, social and economic developments, fluctuations in currency exchange rates, the possible imposition of exchange controls, and other foreign laws or restrictions. Investing in emerging markets may accentuate these risks.
There are certain risks involved with investing in forward foreign currency exchange contracts. Changes in the value of foreign currencies against the U.S. dollar could result in gains or losses to the fund. The value of a share of the fund is determined in U.S. dollars. As a result, the fund could recognize a gain or loss based solely upon a change in the exchange rate between the foreign currency and the U.S. dollar. Changes in exchange rates may increase losses and lower gains from the fund’s investments. The overall impact on the fund may be significant depending on the currencies represented in the portfolio and how each one appreciates or depreciates in relation to the U.S. dollar. Currency trends are unpredictable and exchange rates in foreign currencies may fluctuate significantly over short periods of time for a number of reasons, including changes in interest rates, intervention (or the failure to intervene) by U.S. or foreign governments, central banks or Supranational entities, or by the imposition of currency controls or other political developments in the United States or abroad.
The fund’s commodity-related investments may be subject to greater volatility than investments in traditional securities. The value of the fund’s commodity-related investments may be affected by changes in overall market movements, interest rate changes, and volatility in commodity-related indexes. The value of these investments may also be affected by factors affecting a particular commodity, such as weather, disease, embargoes, tariffs, taxes and economic, political and regulatory developments.
The fund may be subject to certain risks similar to those associated with direct investment in real estate including but not limited to: local or regional economic conditions, changes in zoning laws, changes in property values, property tax increases, overbuilding, increased competition, environmental contamination, natural disasters, and interest rate risk.
The fund’s investment process may result in high portfolio turnover, which could mean high transaction costs, affecting both performance and capital gains tax liabilities to investors.
31
9. Federal Tax Information
The tax character of distributions paid during the years ended June 30, 2016 and June 30, 2015 were as follows:
| 2016 | 2015 | ||||
| Distributions Paid From | |||||
| Ordinary income | — | $ | 368,931 | ||
| Long-term capital gains | — | — | |||
The book-basis character of distributions made during the year from net investment income or net realized gains may differ from their ultimate characterization for federal income tax purposes. These differences reflect the differing character of certain income items and net realized gains and losses for financial statement and tax purposes, and may result in reclassification among certain capital accounts on the financial statements.
The reclassifications, which are primarily due to net operating losses and foreign currency gains and losses, were made to capital $(858,338), accumulated net investment loss $454,757, and accumulated net realized loss $403,581.
As of June 30, 2016, the federal tax cost of investments and the components of distributable earnings on a tax-basis were as follows:
| Federal tax cost of investments | $ | 22,278,958 | |
| Gross tax appreciation of investments | $ | 670,399 | |
| Gross tax depreciation of investments | (275,378 | ) | |
| Net tax appreciation (depreciation) of investments | 395,021 | ||
Net tax appreciation (depreciation) on derivatives and translation of assets and liabilities in foreign currencies | (118,084 | ) | |
| Net tax appreciation (depreciation) | $ | 276,937 | |
| Other book-to-tax adjustments | $ | (19,083 | ) |
| Undistributed ordinary income | — | ||
| Accumulated short-term capital losses | $ | (3,879,362 | ) |
| Accumulated long-term capital losses | $ | (2,592,798 | ) |
| Late-year ordinary loss deferral | $ | (154,148 | ) |
The difference between book-basis and tax-basis unrealized appreciation (depreciation) is attributable primarily to the tax deferral of losses on wash sales. Other book-to-tax adjustments are attributable primarily to the tax deferral of losses on straddle positions.
Accumulated capital losses represent net capital loss carryovers that may be used to offset future realized capital gains for federal income tax purposes. The capital loss carryovers may be carried forward for an unlimited period. Future capital loss carryover utilization in any given year may be subject to Internal Revenue Code limitations.
Loss deferrals represent certain qualified losses that the fund has elected to treat as having been incurred in the following fiscal year for federal income tax purposes.
32
| Financial Highlights |
| For a Share Outstanding Throughout the Years Ended June 30 (except as noted) | |||||||||||||||||
| Per-Share Data | Ratios and Supplemental Data | ||||||||||||||||
| Income From Investment Operations: | Distributions From: | Ratio to Average Net Assets of: | |||||||||||||||
Net Asset Value, Beginning of Period | Net Investment Income (Loss)(1) | Net Realized and Unrealized Gain (Loss) | Total From Investment Operations | Net Investment Income | Net Realized Gains | Total Distributions | Net Asset Value, End of Period | Total Return(2) | Operating Expenses(3) | Operating Expenses (before expense waiver)(3) | Net Investment Income (Loss) | Net Investment Income (Loss) (before expense waiver) | Portfolio Turnover Rate | Net Assets, End of Period (in thousands) | |||
| Investor Class | |||||||||||||||||
| 2016 | $9.54 | 0.04 | (0.15) | (0.11) | — | — | — | $9.43 | (1.15)% | 0.90% | 1.10% | 0.47% | 0.27% | 152% | $14,230 | ||
| 2015 | $10.50 | 0.02 | (0.89) | (0.87) | (0.09) | — | (0.09) | $9.54 | (8.35)% | 0.89% | 1.09% | 0.24% | 0.04% | 93% | $24,054 | ||
| 2014 | $9.92 | 0.03 | 0.57 | 0.60 | (0.02) | — | (0.02) | $10.50 | 6.09% | 0.91% | 1.09% | 0.27% | 0.09% | 87% | $28,261 | ||
| 2013 | $9.99 | (0.03) | (0.04) | (0.07) | — | — | — | $9.92 | (0.70)% | 1.09% | 1.09% | (0.31)% | (0.31)% | 85% | $45,728 | ||
| 2012 | $10.71 | 0.01 | (0.57) | (0.56) | (0.13) | (0.03) | (0.16) | $9.99 | (5.32)% | 1.08% | 1.09% | 0.12% | 0.11% | 80% | $65,968 | ||
| Institutional Class | |||||||||||||||||
| 2016 | $9.55 | 0.08 | (0.17) | (0.09) | — | — | — | $9.46 | (0.94)% | 0.70% | 0.90% | 0.67% | 0.47% | 152% | $1,384 | ||
| 2015 | $10.53 | 0.04 | (0.89) | (0.85) | (0.13) | — | (0.13) | $9.55 | (8.15)% | 0.69% | 0.89% | 0.44% | 0.24% | 93% | $1,102 | ||
| 2014 | $9.94 | 0.05 | 0.58 | 0.63 | (0.04) | — | (0.04) | $10.53 | 6.28% | 0.71% | 0.89% | 0.47% | 0.29% | 87% | $1,360 | ||
| 2013 | $9.99 | (0.02) | (0.03) | (0.05) | — | — | — | $9.94 | (0.40)% | 0.89% | 0.89% | (0.11)% | (0.11)% | 85% | $2,995 | ||
| 2012 | $10.71 | 0.04 | (0.58) | (0.54) | (0.15) | (0.03) | (0.18) | $9.99 | (5.13)% | 0.88% | 0.89% | 0.32% | 0.31% | 80% | $7,078 | ||
| For a Share Outstanding Throughout the Years Ended June 30 (except as noted) | |||||||||||||||||
| Per-Share Data | Ratios and Supplemental Data | ||||||||||||||||
| Income From Investment Operations: | Distributions From: | Ratio to Average Net Assets of: | |||||||||||||||
Net Asset Value, Beginning of Period | Net Investment Income (Loss)(1) | Net Realized and Unrealized Gain (Loss) | Total From Investment Operations | Net Investment Income | Net Realized Gains | Total Distributions | Net Asset Value, End of Period | Total Return(2) | Operating Expenses(3) | Operating Expenses (before expense waiver)(3) | Net Investment Income (Loss) | Net Investment Income (Loss) (before expense waiver) | Portfolio Turnover Rate | Net Assets, End of Period (in thousands) | |||
| A Class | |||||||||||||||||
| 2016 | $9.51 | 0.03 | (0.16) | (0.13) | — | — | — | $9.38 | (1.37)% | 1.15% | 1.35% | 0.22% | 0.02% | 152% | $4,587 | ||
| 2015 | $10.45 | —(4) | (0.89) | (0.89) | (0.05) | — | (0.05) | $9.51 | (8.59)% | 1.14% | 1.34% | (0.01)% | (0.21)% | 93% | $8,385 | ||
| 2014 | $9.87 | —(4) | 0.58 | 0.58 | — | — | — | $10.45 | 5.88% | 1.16% | 1.34% | 0.02% | (0.16)% | 87% | $14,044 | ||
| 2013 | $9.97 | (0.05) | (0.05) | (0.10) | — | — | — | $9.87 | (1.00)% | 1.34% | 1.34% | (0.56)% | (0.56)% | 85% | $23,108 | ||
| 2012 | $10.69 | (0.02) | (0.56) | (0.58) | (0.11) | (0.03) | (0.14) | $9.97 | (5.51)% | 1.33% | 1.34% | (0.13)% | (0.14)% | 80% | $31,305 | ||
| C Class | |||||||||||||||||
| 2016 | $9.28 | (0.05) | (0.14) | (0.19) | — | — | — | $9.09 | (2.05)% | 1.90% | 2.10% | (0.53)% | (0.73)% | 152% | $2,310 | ||
| 2015 | $10.23 | (0.08) | (0.87) | (0.95) | — | — | — | $9.28 | (9.29)% | 1.89% | 2.09% | (0.76)% | (0.96)% | 93% | $5,479 | ||
| 2014 | $9.74 | (0.07) | 0.56 | 0.49 | — | — | — | $10.23 | 5.03% | 1.91% | 2.09% | (0.73)% | (0.91)% | 87% | $9,029 | ||
| 2013 | $9.90 | (0.12) | (0.04) | (0.16) | — | — | — | $9.74 | (1.62)% | 2.09% | 2.09% | (1.31)% | (1.31)% | 85% | $11,025 | ||
| 2012 | $10.65 | (0.08) | (0.59) | (0.67) | (0.05) | (0.03) | (0.08) | $9.90 | (6.33)% | 2.08% | 2.09% | (0.88)% | (0.89)% | 80% | $8,667 | ||
| R Class | |||||||||||||||||
| 2016 | $9.44 | 0.01 | (0.16) | (0.15) | — | — | — | $9.29 | (1.59)% | 1.40% | 1.60% | (0.03)% | (0.23)% | 152% | $105 | ||
| 2015 | $10.38 | (0.03) | (0.89) | (0.92) | (0.02) | — | (0.02) | $9.44 | (8.88)% | 1.39% | 1.59% | (0.26)% | (0.46)% | 93% | $106 | ||
| 2014 | $9.83 | (0.02) | 0.57 | 0.55 | — | — | — | $10.38 | 5.60% | 1.41% | 1.59% | (0.23)% | (0.41)% | 87% | $116 | ||
| 2013 | $9.94 | (0.08) | (0.03) | (0.11) | — | — | — | $9.83 | (1.11)% | 1.59% | 1.59% | (0.81)% | (0.81)% | 85% | $136 | ||
| 2012 | $10.67 | (0.04) | (0.57) | (0.61) | (0.09) | (0.03) | (0.12) | $9.94 | (5.78)% | 1.58% | 1.59% | (0.38)% | (0.39)% | 80% | $137 | ||
| Notes to Financial Highlights |
| (1) | Computed using average shares outstanding throughout the period. |
| (2) | Total returns are calculated based on the net asset value of the last business day and do not reflect applicable sales charges, if any. Total returns for periods less than one year are not annualized. |
| (3) | Ratio of operating expenses to average net assets does not include any fees and expenses of the acquired funds. |
| (4) | Per-share amount was less than $0.005. |
See Notes to Financial Statements.
| Report of Independent Registered Public Accounting Firm |
To the Directors of the American Century Quantitative Equity Funds, Inc. and Shareholders of the Multi-Asset Real Return Fund, formerly the Strategic Inflation Opportunities Fund:
In our opinion, the accompanying statement of assets and liabilities, including the schedule of investments, and the related statements of operations and of changes in net assets and the financial highlights present fairly, in all material respects, the financial position of the Multi-Asset Real Return Fund, formerly the Strategic Inflation Opportunities Fund, (one of the sixteen funds comprising the American Century Quantitative Equity Funds, Inc., hereafter referred to as the “Fund”) at June 30, 2016, the results of its operations for the year then ended, the changes in its net assets for each of the two years in the period then ended and the financial highlights for each of the five years in the period then ended, in conformity with accounting principles generally accepted in the United States of America. These financial statements and financial highlights (hereafter referred to as "financial statements") are the responsibility of the Fund's management. Our responsibility is to express an opinion on these financial statements based on our audits. We conducted our audits of these financial statements in accordance with the standards of the Public Company Accounting Oversight Board (United States). Those standards require that we plan and perform the audit to obtain reasonable assurance about whether the financial statements are free of material misstatement. An audit includes examining, on a test basis, evidence supporting the amounts and disclosures in the financial statements, assessing the accounting principles used and significant estimates made by management, and evaluating the overall financial statement presentation. We believe that our audits, which included confirmation of securities at June 30, 2016 by correspondence with the custodian and brokers, provide a reasonable basis for our opinion.
PricewaterhouseCoopers LLP
Kansas City, Missouri
August 17, 2016
36
| Management |
Board of Directors
The individuals listed below serve as directors of the funds. Each director will continue to serve in this capacity until death, retirement, resignation or removal from office. The board has adopted a mandatory retirement age for directors who are not “interested persons,” as that term is defined in the Investment Company Act (independent directors). Independent directors shall retire on December 31 of the year in which they reach their 75th birthday; provided, however, that on or after January 1, 2022, independent directors shall retire on December 31 of the year in which they reach their 76th birthday.
Mr. Thomas is an “interested person” because he currently serves as President and Chief Executive Officer of American Century Companies, Inc. (ACC), the parent company of American Century Investment Management, Inc. (ACIM or the advisor). The other directors (more than three-fourths of the total number) are independent. They are not employees, directors or officers of, and have no financial interest in, ACC or any of its wholly owned, direct or indirect, subsidiaries, including ACIM, American Century Investment Services, Inc. (ACIS) and American Century Services, LLC (ACS), and they do not have any other affiliations, positions or relationships that would cause them to be considered “interested persons” under the Investment Company Act. The directors serve in this capacity for eight (in the case of Mr. Thomas, 15) registered investment companies in the American Century Investments family of funds.
The following table presents additional information about the directors. The mailing address for each director other than Mr. Thomas is 1665 Charleston Road, Mountain View, California 94043. The mailing address for Mr. Thomas is 4500 Main Street, Kansas City, Missouri 64111.
Name (Year of Birth) | Position(s) Held with Funds | Length of Time Served | Principal Occupation(s) During Past 5 Years | Number of American Century Portfolios Overseen by Director | Other Directorships Held During Past 5 Years |
| Independent Directors | |||||
| Tanya S. Beder (1955) | Director | Since 2011 | Chairman and CEO, SBCC Group Inc. (independent advisory services) (2006 to present) | 45 | CYS Investments, Inc. (NYSE mortgage arbitrage REIT) |
| Jeremy I. Bulow (1954) | Director | Since 2011 | Professor of Economics, Stanford University, Graduate School of Business (1979 to present) | 45 | None |
| Anne Casscells (1958) | Director | Since 2016 | Co-Chief Executive Officer and Chief Investment Officer, Aetos Alternatives Management (investment advisory firm) (2001 to present); Lecturer in Accounting, Stanford University, Graduate School of Business (2009 to present) | 45 | None |
37
Name (Year of Birth) | Position(s) Held with Funds | Length of Time Served | Principal Occupation(s) During Past 5 Years | Number of American Century Portfolios Overseen by Director | Other Directorships Held During Past 5 Years |
| Independent Directors | |||||
| Ronald J. Gilson (1946) | Director and Chairman of the Board | Since 1995 (Chairman since 2005) | Charles J. Meyers Professor of Law and Business, Emeritus, Stanford Law School (1979 to present); Marc and Eva Stern Professor of Law and Business, Columbia University School of Law (1992 to present) | 45 | None |
| Frederick L. A. Grauer (1946) | Director | Since 2008 | Senior Advisor, iShares by BlackRock, Inc. (investment management firm) (2010 to 2011, 2013 to present); Senior Advisor, Course Hero (an educational technology company) (2015 to present) | 45 | None |
| Jonathan D. Levin (1972) | Director | Since 2016 | Holbrook Working Professor of Price Theory, Stanford University, (2000 to present); Chair, Department of Economics, Stanford University (2011 to 2014) | 45 | None |
| Peter F. Pervere (1947) | Director | Since 2007 | Retired | 45 | None |
| John B. Shoven (1947) | Director | Since 2002 | Charles R. Schwab Professor of Economics, Stanford University (1973 to present) | 45 | Cadence Design Systems; Exponent; Financial Engines |
| Interested Director | |||||
| Jonathan S. Thomas (1963) | Director and President | Since 2007 | President and Chief Executive Officer, ACC (March 2007 to present). Also serves as Chief Executive Officer, ACS; Executive Vice President, ACIM; Director, ACC, ACIM and other ACC subsidiaries | 128 | BioMed Valley Discoveries, Inc. |
The Statement of Additional Information has additional information about the fund's directors and is available without charge, upon request, by calling 1-800-345-2021.
38
Officers
The following table presents certain information about the executive officers of the funds. Each officer serves as an officer for each of the 15 investment companies in the American Century family of funds, unless otherwise noted. No officer is compensated for his or her service as an officer of the funds. The listed officers are interested persons of the funds and are appointed or re-appointed on an annual basis. The mailing address for each of the officers listed below is 4500 Main Street, Kansas City, Missouri 64111.
Name (Year of Birth) | Offices with the Funds | Principal Occupation(s) During the Past Five Years |
| Jonathan S. Thomas (1963) | Director and President since 2007 | President and Chief Executive Officer, ACC (March 2007 to present). Also serves as Chief Executive Officer, ACS; Executive Vice President, ACIM; Director, ACC, ACIM and other ACC subsidiaries |
| Amy D. Shelton (1964) | Chief Compliance Officer and Vice President since 2014 | Chief Compliance Officer, American Century funds, (March 2014 to present); Chief Compliance Officer, ACIM (February 2014 to present); Chief Compliance Officer, ACIS (October 2009 to present); Vice President, Client Interactions and Marketing, ACIS (February 2013 to January 2014); Director, Client Interactions and Marketing, ACIS (June 2007 to January 2013). Also serves as Vice President, ACIS |
| Charles A. Etherington (1957) | General Counsel since 2007 and Senior Vice President since 2006 | Attorney, ACC (February 1994 to present); Vice President, ACC (November 2005 to present); General Counsel, ACC (March 2007 to present). Also serves as General Counsel, ACIM, ACS, ACIS and other ACC subsidiaries; and Senior Vice President, ACIM and ACS |
| C. Jean Wade (1964) | Vice President, Treasurer and Chief Financial Officer since 2012 | Vice President, ACS (February 2000 to present) |
| Robert J. Leach (1966) | Vice President since 2006 and Assistant Treasurer since 2012 | Vice President, ACS (February 2000 to present) |
| David H. Reinmiller (1963) | Vice President since 2001 | Attorney, ACC (January 1994 to present); Associate General Counsel, ACC (January 2001 to present). Also serves as Vice President, ACIM and ACS |
| Ward D. Stauffer (1960) | Secretary since 2005 | Attorney, ACC (June 2003 to present) |
39
| Approval of Management Agreement |
At a meeting held on June 14, 2016, the Fund’s Board of Directors (the "Board") unanimously approved the renewal of the management agreement pursuant to which American Century Investment Management, Inc. (the “Advisor”) acts as the investment advisor for the Fund. Under Section 15(c) of the Investment Company Act, contracts for investment advisory services are required to be reviewed, evaluated, and approved by a majority of a fund’s directors/trustees, including a majority of the independent Directors, each year. The Board regards this annual evaluation and renewal as one of its most important responsibilities.
The independent Directors have memorialized a statement regarding the relationship between their ongoing obligations to oversee and evaluate the performance of the Advisor and their annual consideration of renewal of the management agreement. In that statement, the independent Directors noted that their assessment of the Advisor’s performance is an ongoing process that takes place over the entire year and is informed by all of the extensive information that the Board and its committees receive and consider over time. This information, together with the additional materials provided specifically in connection with the review, are central to the Board’s assessment of the Advisor’s performance and its determination whether to renew the Fund’s management agreement.
Prior to its consideration of the renewal of the management agreement, the Board requested and reviewed extensive data and analysis relating to the proposed renewal. This information and analysis was compiled by the Advisor and certain independent providers of evaluation data concerning the Fund and the services provided to the Fund by the Advisor.
In connection with its consideration of the renewal of the management agreement, the Board’s review and evaluation of the services provided by the Advisor included, but was not limited to, the following:
| • | the nature, extent, and quality of investment management, shareholder services, and other services provided by the Advisor to the Fund; |
| • | the wide range of other programs and services the Advisor provides to the Fund and its shareholders on a routine and non-routine basis; |
| • | the investment performance of the Fund, including data comparing the Fund’s performance to appropriate benchmarks and/or a peer group of other mutual funds with similar investment objectives and strategies; |
| • | the cost of owning the Fund compared to the cost of owning similar funds; |
| • | the Advisor’s compliance policies, procedures, and regulatory experience; |
| • | financial data showing the cost of services provided to the Fund, the profitability of the Fund to the Advisor, and the overall profitability of the Advisor; |
| • | possible economies of scale associated with the Advisor’s management of the Fund and other accounts under its management; |
| • | data comparing services provided and charges to other investment management clients of the Advisor; |
| • | acquired fund fees and expenses; |
| • | payments by the Fund and the Advisor to financial intermediaries whose clients are investors in the Fund; and |
| • | any collateral benefits derived by the Advisor from the management of the Fund. |
In keeping with its practice, the Board held two in-person meetings to review and discuss the information provided in response to their request. The independent Directors also had the benefit of the advice of their independent counsel throughout the process.
40
Factors Considered
The Directors considered all of the information provided by the Advisor, the independent data providers, and the independent Directors’ independent counsel in connection with the approval. They determined that the information was sufficient for them to evaluate the management agreement for the Fund. In connection with their review, the Directors did not identify any single factor as being all-important or controlling and each Director may have attributed different levels of importance to different factors. In deciding to renew the management agreement, the Board based its decision on a number of factors, including the following:
Nature, Extent and Quality of Services - Generally. Under the management agreement, the Advisor is responsible for providing or arranging for all services necessary for the operation of the Fund. The Board noted that under the management agreement, the Advisor provides or arranges at its own expense a wide variety of services including:
| • | constructing and designing the Fund |
| • | portfolio research and security selection |
| • | initial capitalization/funding |
| • | securities trading |
| • | Fund administration |
| • | custody of Fund assets |
| • | daily valuation of the Fund’s portfolio |
| • | shareholder servicing and transfer agency, including shareholder confirmations, recordkeeping, and communications |
| • | legal services (except the independent Directors’ counsel) |
| • | regulatory and portfolio compliance |
| • | financial reporting |
| • | marketing and distribution (except amounts paid by the Fund under Rule 12b-1 plans) |
The Board noted that many of these services have expanded over time in terms of both quantity and complexity in response to shareholder demands, competition in the industry, changing distribution channels, and the changing regulatory environment.
Investment Management, Shareholder, and Other Services. The nature of the investment management services provided to the Fund is quite complex and allows Fund shareholders access to professional money management, instant diversification of their investments within an asset class, the opportunity to easily diversify among asset classes by investing in or exchanging among various American Century Investments funds, and liquidity. In evaluating investment performance, the Board expects the Advisor to manage the Fund in accordance with its investment objectives and approved strategies. Further, the Directors recognize that the Advisor has an obligation to seek the best execution of fund trades. In providing these services, the Advisor utilizes teams of investment professionals (portfolio managers, analysts, research assistants, and securities traders) who require extensive information technology, research, training, compliance, and other systems to conduct their business. The Board, directly and through its Portfolio Committee, regularly reviews investment performance information for the Fund, together with comparative information for appropriate benchmarks and/or peer groups of similarly-managed funds, over different time horizons. The Directors also review detailed performance information during the management agreement approval process. If performance concerns are identified, the Fund receives special reviews until performance improves, during which the Board discusses with the Advisor the reasons for such results (e.g., market conditions, security selection) and any efforts being undertaken to improve performance. The Fund’s performance was above its benchmark for the one-, three-, and five-year periods reviewed by the Board. The Board found the investment management services provided by the Advisor to the Fund to be satisfactory and consistent with the management agreement.
41
Under the management agreement, the Advisor provides the Fund with a comprehensive package of transfer agency, shareholder, and other services. The Board, directly and through various committees of the Board, regularly reviews reports and evaluations of such services at its regular meetings. These reports include, but are not limited to, information regarding the operational efficiency and accuracy of the shareholder and transfer agency services provided, staffing levels, shareholder satisfaction (as measured by external as well as internal sources), technology support, new products and services offered to Fund shareholders, securities trading activities, portfolio valuation services, auditing services, and legal and operational compliance activities. Certain aspects of shareholder and transfer agency service level efficiency and the quality of securities trading activities are measured by independent third party providers and are presented in comparison to other fund groups not managed by the Advisor.
The Board found the services provided by the Advisor to the Fund under the management agreement to be competitive and of high quality.
Costs of Services and Profitability. The Advisor provides detailed information concerning its cost of providing various services to the Fund, its profitability in managing the Fund, its overall profitability, and its financial condition. The Directors have reviewed with the Advisor the methodology used to prepare this financial information. This information is considered in evaluating the Advisor’s financial condition, its ability to continue to provide services under the management agreement, and the reasonableness of the current management fee. The Board concluded that the Advisor’s profits were reasonable in light of the services provided to the Fund.
Economies of Scale. The Board also reviewed information provided by the Advisor regarding the possible existence of economies of scale in connection with the management of the Fund. The Board concluded that economies of scale are difficult to measure and predict with precision, especially on a fund-by-fund basis. The Board concluded that the Advisor is appropriately sharing economies of scale through its competitive fee structure, offering competitive fees from fund inception, and through reinvestment in its business to provide shareholders enhanced and expanded services.
Comparison to Other Funds’ Fees. The management agreement provides that the Fund pays the Advisor a single, all-inclusive (or unified) management fee for providing all services necessary for the management and operation of the Fund, other than brokerage expenses, expenses attributable to short sales, taxes, interest, extraordinary expenses, the fees and expenses of the Fund’s independent Directors (including their independent legal counsel), and expenses incurred in connection with the provision of shareholder services and distribution services under a plan adopted pursuant to Rule 12b-1 under the 1940 Act. Under the unified fee structure, the Advisor is responsible for providing all investment advisory, custody, audit, administrative, compliance, recordkeeping, marketing, and shareholder services, or arranging and supervising third parties to provide such services. By contrast, most other funds are charged a variety of fees, including an investment advisory fee, a transfer agency fee, an administrative fee, distribution charges, and other expenses. Other than their investment advisory fees and any applicable Rule 12b-1 fees, all other components of the total fees charged by these other funds may be increased without shareholder approval. The Board believes the unified fee structure is a benefit to Fund shareholders because it clearly discloses to shareholders the cost of owning Fund shares, and, since the unified fee cannot be increased without a vote of Fund shareholders, it shifts to the Advisor the risk of increased costs of operating the Fund and provides a direct incentive to minimize administrative inefficiencies. Part of the Board’s analysis of fee levels involves reviewing certain evaluative data compiled by an independent provider and comparing the Fund’s unified fee to the total expense ratio of peer funds. The unified fee charged to shareholders of the Fund was below the median of the total expense ratios of the Fund’s peer universe. The Board concluded that the management fee paid by the Fund to the Advisor under the management agreement is reasonable in light of the services provided to the Fund.
42
Comparison to Fees and Services Provided to Other Clients of the Advisor. The Board also requested and received information from the Advisor concerning the nature of the services, fees, costs, and profitability of its advisory services to advisory clients other than the Fund. They observed that these varying types of client accounts require different services and involve different regulatory and entrepreneurial risks than the management of the Fund. The Board analyzed this information and concluded that the fees charged and services provided to the Fund were reasonable by comparison.
Payments to Intermediaries. The Directors also requested and received a description of payments made to intermediaries by the Fund and the Advisor. These payments include various payments made by the Fund or the Advisor to different types of intermediaries and recordkeepers for distribution and service activities provided for the Fund.
Collateral or “Fall-Out” Benefits Derived by the Advisor. The Board considered the existence of collateral benefits the Advisor may receive as a result of its relationship with the Fund. The Board noted that the Advisor’s primary business is managing mutual funds and it generally does not use fund or shareholder information to generate profits in other lines of business, and therefore does not derive any significant collateral benefits from them. The Board noted that the Advisor receives proprietary research from broker-dealers that execute fund portfolio transactions. The Board also determined that the Advisor is able to provide investment management services to certain clients other than the Fund, at least in part, due to its existing infrastructure built to serve the fund complex. The Board concluded, however, that the assets of those other clients are not material to the analysis and, where applicable, may be included with the assets of the Fund to determine breakpoints in the management fee schedule.
Existing Relationship. The Board also considered whether there was any reason for not continuing the existing arrangement with the Advisor. In this regard, the Board was mindful of the potential disruptions of the Fund’s operations and various risks, uncertainties, and other effects that could occur as a result of a decision not to continue such relationship. In particular, the Board recognized that most shareholders have invested in the Fund on the strength of the Advisor’s industry standing and reputation and in the expectation that the Advisor will have a continuing role in providing advisory services to the Fund.
Conclusion of the Directors. As a result of this process, the Board, including all of the independent Directors and assisted by the advice of independent legal counsel, taking into account all of the factors discussed above and the information provided by the Advisor and others in connection with its review and throughout the year, concluded that the management agreement between the Fund and the Advisor is fair and reasonable in light of the services provided and should be renewed.
43
| Proxy Voting Results |
A special meeting of shareholders was held on June 13, 2016, to vote on the following proposal. The proposal received the required number of votes and was adopted. A summary of voting results is listed below.
To elect four directors to the Board of Directors of American Century Quantitative Equity Funds, Inc.:
| Affirmative | Withhold | ||||||
| Tanya S. Beder | $ | 8,473,153,264 | $ | 121,459,590 | |||
| Jeremy I. Bulow | $ | 8,469,793,581 | $ | 124,819,273 | |||
| Anne Casscells | $ | 8,465,895,232 | $ | 128,717,622 | |||
| Jonathan D. Levin | $ | 8,468,929,867 | $ | 125,682,987 | |||
The other directors whose term of office continued after the meeting include Jonathan S. Thomas, Ronald J. Gilson, Frederick L. A. Grauer, Peter F. Pervere and John B. Shoven.
44
| Additional Information |
Retirement Account Information
As required by law, distributions you receive from certain IRAs are subject to federal income tax withholding, unless you elect not to have withholding apply. Tax will be withheld on the total amount withdrawn even though you may be receiving amounts that are not subject to withholding, such as nondeductible contributions. In such case, excess amounts of withholding could occur. You may adjust your withholding election so that a greater or lesser amount will be withheld.
If you don’t want us to withhold on this amount, you must notify us to not withhold the federal income tax. You may notify us in writing or in certain situations by telephone or through other electronic means. For systematic withdrawals, your withholding election will remain in effect until revoked or changed by filing a new election. You have the right to revoke your election at any time.
Remember, even if you elect not to have income tax withheld, you are liable for paying income tax on the taxable portion of your withdrawal. If you elect not to have income tax withheld or you don’t have enough income tax withheld, you may be responsible for payment of estimated tax. You may incur penalties under the estimated tax rules if your withholding and estimated tax payments are not sufficient. You can reduce or defer the income tax on a distribution by directly or indirectly rolling such distribution over to another IRA or eligible plan. You should consult your tax advisor for additional information.
State tax will be withheld if, at the time of your distribution, your address is within one of the mandatory withholding states and you have federal income tax withheld (or as otherwise required by state law). State taxes will be withheld from your distribution in accordance with the respective state rules.
Distributions you receive from 403(b), 457 and qualified plans are subject to special tax and withholding rules. Your plan administrator or plan sponsor is required to provide you with a special tax notice explaining those rules at the time you request a distribution. If applicable, federal and/or state taxes may be withheld from your distribution amount.
Proxy Voting Policies
Descriptions of the principles and policies that the fund's investment advisor uses in exercising the voting rights associated with the securities purchased and/or held by the fund are available without charge, upon request, by calling 1-800-345-2021 or visiting the "About Us" page of American Century Investments’ website at americancentury.com. A description of the policies is also available on the Securities and Exchange Commission’s website at sec.gov. Information regarding how the investment advisor voted proxies relating to portfolio securities during the most recent 12-month period ended June 30 is available on the "About Us" page at americancentury.com. It is also available at sec.gov.
Quarterly Portfolio Disclosure
The fund files its complete schedule of portfolio holdings with the Securities and Exchange Commission (SEC) for the first and third quarters of each fiscal year on Form N-Q. The fund’s Forms N-Q are available on the SEC’s website at sec.gov, and may be reviewed and copied at the SEC’s Public Reference Room in Washington, DC. Information on the operation of the Public Reference Room may be obtained by calling 1-800-SEC-0330. The fund also makes its complete schedule of portfolio holdings for the most recent quarter of its fiscal year available on its website at americancentury.com and, upon request, by calling 1-800-345-2021.
45
| Notes |
46
| Notes |
47
| Notes |
48
| ||
| Contact Us | americancentury.com | |
| Automated Information Line | 1-800-345-8765 | |
| Investor Services Representative | 1-800-345-2021 or 816-531-5575 | |
| Investors Using Advisors | 1-800-378-9878 | |
| Business, Not-For-Profit, Employer-Sponsored Retirement Plans | 1-800-345-3533 | |
| Banks and Trust Companies, Broker-Dealers, Financial Professionals, Insurance Companies | 1-800-345-6488 | |
| Telecommunications Relay Service for the Deaf | 711 | |
| American Century Quantitative Equity Funds, Inc. | ||
Investment Advisor: American Century Investment Management, Inc. Kansas City, Missouri | ||
| This report and the statements it contains are submitted for the general information of our shareholders. The report is not authorized for distribution to prospective investors unless preceded or accompanied by an effective prospectus. | ||
| ©2016 American Century Proprietary Holdings, Inc. All rights reserved. CL-ANN-89957 1608 | ||
| Annual Report | |
| June 30, 2016 | |
| NT Core Equity Plus Fund | |
51
52
| Table of Contents |
| Performance | 2 | |
| Portfolio Commentary | ||
| Fund Characteristics | ||
| Shareholder Fee Example | ||
| Schedule of Investments | ||
| Statement of Assets and Liabilities | ||
| Statement of Operations | ||
| Statement of Changes in Net Assets | ||
| Statement of Cash Flows | ||
| Notes to Financial Statements | ||
| Financial Highlights | ||
| Report of Independent Registered Public Accounting Firm | ||
| Management | ||
| Approval of Management Agreement | ||
| Proxy Voting Results | ||
| Additional Information | ||
Any opinions expressed in this report reflect those of the author as of the date of the report, and do not necessarily represent the opinions of American Century Investments® or any other person in the American Century Investments organization. Any such opinions are subject to change at any time based upon market or other conditions and American Century Investments disclaims any responsibility to update such opinions. These opinions may not be relied upon as investment advice and, because investment decisions made by American Century Investments funds are based on numerous factors, may not be relied upon as an indication of trading intent on behalf of any American Century Investments fund. Security examples are used for representational purposes only and are not intended as recommendations to purchase or sell securities. Performance information for comparative indices and securities is provided to American Century Investments by third party vendors. To the best of American Century Investments’ knowledge, such information is accurate at the time of printing.
| Performance |
| Total Returns as of June 30, 2016 | ||||
| Average Annual Returns | ||||
Ticker Symbol | 1 year | Since Inception | Inception Date | |
| Institutional Class | ACNKX | -1.96% | 13.04% | 12/1/11 |
| S&P 500 Index | — | 3.99% | 14.50% | — |
| Growth of $10,000 Over Life of Class |
| $10,000 investment made December 1, 2011 |
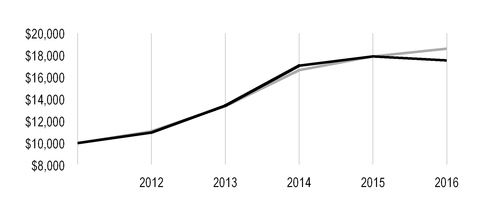
| Value on June 30, 2016 | |
| Institutional Class — $17,539 | |
| S&P 500 Index — $18,603 | |
| Total Annual Fund Operating Expenses | |
| Institutional Class | 1.53% |
The total annual fund operating expenses shown is as stated in the fund’s prospectus current as of the date of this report. The prospectus may vary from the expense ratio shown elsewhere in this report because it is based on a different time period, includes acquired fund fees and expenses, and, if applicable, does not include fee waivers or expense reimbursements.
Data presented reflect past performance. Past performance is no guarantee of future results. Current performance may be higher or lower than the performance shown. Total returns for periods less than one year are not annualized. Investment return and principal value will fluctuate, and redemption value may be more or less than original cost. Data assumes reinvestment of dividends and capital gains, and none of the charts reflect the deduction of taxes that a shareholder would pay on fund distributions or the redemption of fund shares. To obtain performance data current to the most recent month end, please call 1-800-345-2021 or visit americancentury.com. For additional information about the fund, please consult the prospectus.
2
| Portfolio Commentary |
Portfolio Managers: Scott Wittman and Claudia Musat
In May 2016, portfolio manager Bill Martin left the fund's management team.
Performance Summary
NT Core Equity Plus returned -1.96% for the fiscal year ended June 30, 2016, compared with the 3.99% return of its benchmark, the S&P 500 Index.
NT Core Equity Plus declined for the 12-month period, underperforming the return of its benchmark, the S&P 500 Index. The fund is managed to have a 100% net exposure to the equity market by investing approximately 130% of its net assets in long positions, while 30% of its net assets are sold short. The proceeds from the securities sold short are used to fund the purchase of the additional 30% of long positions The portfolio’s stock selection process incorporates factors of valuation, quality, growth, and sentiment while striving to minimize unintended risks along industries and other risk characteristics. Within the fund, valuation-based factors proved most difficult, although sentiment and growth indicators also detracted from performance. Security selection in the financials, consumer discretionary, and industrials sectors weighed on relative performance the most, while health care and information technology sector holdings were relative contributors.
Financials Sector Led Detractors
Security selection in the financials sector was the principal detractor from the fund’s twelve-month results. Shares of commercial real estate services company Jones Lang LaSalle, a portfolio-only position, declined sharply on disappointing quarterly earnings in early 2016 during a difficult environment for financial stocks. A number of capital markets holdings also weighed on the sector’s results, including Legg Mason, an overweight position relative to the benchmark. The asset manager’s stock price came under pressure after reporting a quarterly net loss and announcing several strategic acquisitions and agreements. We ultimately liquidated our positions in both holdings.
The consumer discretionary sector was also an area of underperformance during the twelve-month period. A portfolio-only position in GoPro detracted as the wearable camera maker’s stock slumped on concerns about economic growth in China and a bleak outlook for wearable camera demand. Wolverine World Wide, which owns a portfolio of footwear brands including Keds, Merrell, and Hush Puppies, fell on disappointing quarterly sales results amid a difficult global retail and consumer environment. We subsequently exited the portfolio’s stake in both positions.
Key detraction on an individual holding level came from two short positions (a trade made to benefit from a stock’s decline) in the materials sector. Royal Gold and Hecla Mining, both precious metals companies, rallied sharply together with advancing gold prices during the second half of the period. We maintain our short positions based on weakness across most characteristics.
Health Care Sector Contributed
Security selection among health care companies helped position the sector as a leading relative outperformer in the fund. A number of short position were especially beneficial. These included Brookdale Senior Living, an operator of senior living communities, and Acadia Healthcare, a provider of behavioral health treatment services, both key sector contributors. Brookdale Senior Living stock fell after the company reported disappointing fourth-quarter results. Similarly, shares of Acadia Healthcare weakened as its fourth-quarter earnings fell short of expectations.
3
The information technology sector was also an area of strength, led by a short position in SunEdison. The solar energy company’s stock fell after a quarterly earnings miss early in the year, and we unwound the fund’s short position. Sector contribution also came from Applied Materials, a long position. The semiconductor maker’s shares moved up on the heels of strong quarterly earnings reports and higher future guidance as the company captured market share from competitors and anticipated higher demand. Elsewhere in the fund, key individual contribution stemmed from Newmont Mining, which rose on the recovery in precious metals prices.
A Look Ahead
At period-end, information technology and consumer staples were among the fund’s largest overweight positions on a sector basis. We think that software and internet software and services companies are attractive in the information technology sector, where key themes are mobile, search, cloud computing, big data, and the shift to digital/online retail. This is creating growth and quality opportunities. Valuation and sentiment also are positive for select firms in these industries. In consumer staples, we are finding opportunities in household goods manufacturers. After the dramatic sell-off in 2015, health care names, particularly in the biotech space, are compelling based on valuation factors. Growth and quality metrics also are favorable. The financials and consumer discretionary sectors, both portfolio underweights, continue to face challenges, in our opinion. In financials, we find that large-cap real estate investment trusts and diversified financial services firms are challenged across virtually all dimensions. Growth scores are not favorable in consumer discretionary, particularly among specialty retailers. In fundamental terms, many of these traditional brick-and-mortar retailers face challenging business conditions and have poor growth and quality rankings. Our disciplined, objective, and systematic investment strategy is designed to take advantage of opportunities at the individual company level in both the long and short portions of the portfolio. We believe this approach is the most powerful way to capitalize on market inefficiencies that lead to the mispricing of individual stocks.
4
| Fund Characteristics |
| JUNE 30, 2016 | |
| Top Ten Long Holdings | % of net assets |
| Alphabet, Inc., Class A | 2.79% |
| Apple, Inc. | 2.59% |
| Amazon.com, Inc. | 2.42% |
| Microsoft Corp. | 2.34% |
| Johnson & Johnson | 2.21% |
| Exxon Mobil Corp. | 2.10% |
| Verizon Communications, Inc. | 2.03% |
| Procter & Gamble Co. (The) | 2.02% |
| PepsiCo, Inc. | 1.81% |
| Intel Corp. | 1.72% |
| Top Five Short Holdings | % of net assets |
| Olin Corp. | (0.87)% |
| Louisiana-Pacific Corp. | (0.85)% |
| Royal Gold, Inc. | (0.84)% |
| CST Brands, Inc. | (0.80)% |
| Waste Connections, Inc. | (0.76)% |
| Types of Investments in Portfolio | % of net assets |
| Common Stocks | 127.6% |
| Common Stocks Sold Short | (29.0)% |
| Temporary Cash Investments | 1.1% |
| Other Assets and Liabilities | 0.3% |
5
| Shareholder Fee Example |
Fund shareholders may incur two types of costs: (1) transaction costs, including sales charges (loads) on purchase payments and redemption/exchange fees; and (2) ongoing costs, including management fees; distribution and service (12b-1) fees; and other fund expenses. This example is intended to help you understand your ongoing costs (in dollars) of investing in your fund and to compare these costs with the ongoing cost of investing in other mutual funds.
The example is based on an investment of $1,000 made at the beginning of the period and held for the entire period from January 1, 2016 to June 30, 2016.
Actual Expenses
The table provides information about actual account values and actual expenses for each class. You may use the information, together with the amount you invested, to estimate the expenses that you paid over the period. First, identify the share class you own. Then simply divide your account value by $1,000 (for example, an $8,600 account value divided by $1,000 = 8.6), then multiply the result by the number under the heading “Expenses Paid During Period” to estimate the expenses you paid on your account during this period.
Hypothetical Example for Comparison Purposes
The table also provides information about hypothetical account values and hypothetical expenses based on the actual expense ratio of each class of your fund and an assumed rate of return of 5% per year before expenses, which is not the actual return of a fund’s share class. The hypothetical account values and expenses may not be used to estimate the actual ending account balance or expenses you paid for the period. You may use this information to compare the ongoing costs of investing in your fund and other funds. To do so, compare this 5% hypothetical example with the 5% hypothetical examples that appear in the shareholder reports of the other funds.
Please note that the expenses shown in the table are meant to highlight your ongoing costs only and do not reflect any transactional costs, such as sales charges (loads) or redemption/exchange fees. Therefore, the table is useful in comparing ongoing costs only, and will not help you determine the relative total costs of owning different funds. In addition, if these transactional costs were included, your costs would have been higher.
| Beginning Account Value 1/1/16 | Ending Account Value 6/30/16 | Expenses Paid During Period(1) 1/1/16 - 6/30/16 | Annualized Expense Ratio(1) | |
| Actual | ||||
| Institutional Class | $1,000 | $1,011.40 | $8.75 | 1.75% |
| Hypothetical | ||||
| Institutional Class | $1,000 | $1,016.16 | $8.77 | 1.75% |
| (1) | Expenses are equal to the class's annualized expense ratio listed in the table above, multiplied by the average account value over the period, multiplied by 182, the number of days in the most recent fiscal half-year, divided by 366, to reflect the one-half year period. |
6
| Schedule of Investments |
JUNE 30, 2016
| Shares | Value | |||
| COMMON STOCKS — 127.6% | ||||
| Aerospace and Defense — 4.1% | ||||
B/E Aerospace, Inc.(1) | 34,671 | $ | 1,600,933 | |
Boeing Co. (The)(1) | 46,284 | 6,010,903 | ||
Honeywell International, Inc.(1) | 32,746 | 3,809,015 | ||
Huntington Ingalls Industries, Inc.(1) | 26,051 | 4,377,350 | ||
Spirit AeroSystems Holdings, Inc., Class A(1)(2) | 80,382 | 3,456,426 | ||
Textron, Inc.(1) | 63,636 | 2,326,532 | ||
| 21,581,159 | ||||
| Airlines — 1.6% | ||||
Delta Air Lines, Inc.(1) | 61,044 | 2,223,833 | ||
JetBlue Airways Corp.(1)(2) | 165,426 | 2,739,455 | ||
United Continental Holdings, Inc.(1)(2) | 80,982 | 3,323,501 | ||
| 8,286,789 | ||||
| Auto Components — 1.1% | ||||
Goodyear Tire & Rubber Co. (The)(1) | 136,825 | 3,510,930 | ||
| Lear Corp. | 21,325 | 2,170,032 | ||
| 5,680,962 | ||||
| Automobiles — 0.1% | ||||
Ford Motor Co.(1) | 31,903 | 401,021 | ||
| Banks — 3.2% | ||||
Bank of America Corp.(1) | 66,115 | 877,346 | ||
Citigroup, Inc.(1) | 180,620 | 7,656,482 | ||
JPMorgan Chase & Co.(1) | 40,303 | 2,504,428 | ||
| TCF Financial Corp. | 273,076 | 3,454,411 | ||
Wells Fargo & Co.(1) | 48,390 | 2,290,299 | ||
| 16,782,966 | ||||
| Beverages — 2.7% | ||||
Coca-Cola Co. (The)(1) | 19,966 | 905,059 | ||
Dr Pepper Snapple Group, Inc.(1) | 37,510 | 3,624,591 | ||
PepsiCo, Inc.(1) | 90,660 | 9,604,521 | ||
| 14,134,171 | ||||
| Biotechnology — 4.1% | ||||
AbbVie, Inc.(1) | 65,584 | 4,060,305 | ||
Amgen, Inc.(1) | 29,028 | 4,416,610 | ||
Biogen, Inc.(1)(2) | 10,907 | 2,637,531 | ||
Celgene Corp.(1)(2) | 33,347 | 3,289,015 | ||
Gilead Sciences, Inc.(1) | 51,806 | 4,321,656 | ||
Medivation, Inc.(2) | 9,486 | 572,006 | ||
Myriad Genetics, Inc.(2) | 37,012 | 1,132,567 | ||
United Therapeutics Corp.(1)(2) | 11,052 | 1,170,628 | ||
| 21,600,318 | ||||
| Building Products — 1.7% | ||||
Masonite International Corp.(2) | 6,199 | 410,002 | ||
Owens Corning(1) | 81,035 | 4,174,923 | ||
USG Corp.(1)(2) | 163,234 | 4,400,789 | ||
| 8,985,714 | ||||
7
| Shares | Value | |||
| Capital Markets — 0.9% | ||||
Ameriprise Financial, Inc.(1) | 25,443 | $ | 2,286,054 | |
Artisan Partners Asset Management, Inc., Class A(1) | 30,152 | 834,607 | ||
| Eaton Vance Corp. | 40,803 | 1,441,978 | ||
| 4,562,639 | ||||
| Chemicals — 4.7% | ||||
Air Products & Chemicals, Inc.(1) | 36,538 | 5,189,857 | ||
Cabot Corp.(1) | 86,823 | 3,964,338 | ||
Dow Chemical Co. (The)(1) | 114,013 | 5,667,586 | ||
Minerals Technologies, Inc.(1) | 66,612 | 3,783,562 | ||
PPG Industries, Inc.(1) | 44,986 | 4,685,292 | ||
| RPM International, Inc. | 27,865 | 1,391,857 | ||
| 24,682,492 | ||||
| Commercial Services and Supplies — 1.5% | ||||
Deluxe Corp.(1) | 57,205 | 3,796,696 | ||
Herman Miller, Inc.(1) | 136,525 | 4,080,732 | ||
| 7,877,428 | ||||
| Communications Equipment — 2.4% | ||||
Ciena Corp.(2) | 89,495 | 1,678,031 | ||
Cisco Systems, Inc.(1) | 310,422 | 8,906,007 | ||
Juniper Networks, Inc.(1) | 96,744 | 2,175,773 | ||
| 12,759,811 | ||||
| Consumer Finance — 2.0% | ||||
| American Express Co. | 40,650 | 2,469,894 | ||
Discover Financial Services(1) | 90,923 | 4,872,564 | ||
Synchrony Financial(1)(2) | 133,832 | 3,383,273 | ||
| 10,725,731 | ||||
| Containers and Packaging — 1.9% | ||||
Avery Dennison Corp.(1) | 34,892 | 2,608,177 | ||
Berry Plastics Group, Inc.(1)(2) | 106,389 | 4,133,212 | ||
| Graphic Packaging Holding Co. | 94,729 | 1,187,902 | ||
Sealed Air Corp.(1) | 42,232 | 1,941,405 | ||
| 9,870,696 | ||||
| Diversified Financial Services — 1.5% | ||||
Berkshire Hathaway, Inc., Class B(1)(2) | 19,216 | 2,782,285 | ||
| MSCI, Inc., Class A | 14,026 | 1,081,685 | ||
Nasdaq, Inc.(1) | 63,278 | 4,092,188 | ||
| 7,956,158 | ||||
| Diversified Telecommunication Services — 3.6% | ||||
AT&T, Inc.(1) | 192,675 | 8,325,487 | ||
Verizon Communications, Inc.(1) | 193,140 | 10,784,937 | ||
| 19,110,424 | ||||
| Electric Utilities — 0.2% | ||||
| FirstEnergy Corp. | 36,385 | 1,270,200 | ||
| Electronic Equipment, Instruments and Components — 0.1% | ||||
| Belden, Inc. | 10,255 | 619,094 | ||
| Energy Equipment and Services — 1.8% | ||||
Atwood Oceanics, Inc.(1) | 81,828 | 1,024,486 | ||
| Diamond Offshore Drilling, Inc. | 104,590 | 2,544,675 | ||
Dril-Quip, Inc.(1)(2) | 35,537 | 2,076,427 | ||
8
| Shares | Value | |||
Rowan Cos. plc(1) | 226,435 | $ | 3,998,842 | |
| 9,644,430 | ||||
| Food and Staples Retailing — 2.3% | ||||
CVS Health Corp.(1) | 34,345 | 3,288,190 | ||
SUPERVALU, Inc.(1)(2) | 263,943 | 1,245,811 | ||
Wal-Mart Stores, Inc.(1) | 103,327 | 7,544,938 | ||
| 12,078,939 | ||||
| Food Products — 5.0% | ||||
Cal-Maine Foods, Inc.(1) | 37,947 | 1,681,811 | ||
Dean Foods Co.(1) | 171,497 | 3,102,381 | ||
| Fresh Del Monte Produce, Inc. | 19,802 | 1,077,823 | ||
General Mills, Inc.(1) | 53,820 | 3,838,443 | ||
Hormel Foods Corp.(1) | 103,484 | 3,787,514 | ||
| Ingredion, Inc. | 29,779 | 3,853,700 | ||
Pilgrim's Pride Corp.(1) | 143,110 | 3,646,443 | ||
Seaboard Corp.(1)(2) | 377 | 1,082,231 | ||
Tyson Foods, Inc., Class A(1) | 67,381 | 4,500,377 | ||
| 26,570,723 | ||||
| Gas Utilities — 1.8% | ||||
ONE Gas, Inc.(1) | 62,116 | 4,136,304 | ||
| Southwest Gas Corp. | 31,263 | 2,460,711 | ||
UGI Corp.(1) | 63,400 | 2,868,850 | ||
| 9,465,865 | ||||
| Health Care Equipment and Supplies — 4.6% | ||||
Abbott Laboratories(1) | 139,530 | 5,484,924 | ||
| Becton Dickinson and Co. | 4,897 | 830,482 | ||
Boston Scientific Corp.(2) | 52,522 | 1,227,439 | ||
| C.R. Bard, Inc. | 24,007 | 5,645,486 | ||
Hologic, Inc.(1)(2) | 67,964 | 2,351,555 | ||
| Medtronic plc | 28,871 | 2,505,137 | ||
| ResMed, Inc. | 31,910 | 2,017,669 | ||
St. Jude Medical, Inc.(1) | 58,160 | 4,536,480 | ||
| 24,599,172 | ||||
| Health Care Providers and Services — 3.3% | ||||
Aetna, Inc.(1) | 46,332 | 5,658,527 | ||
AmerisourceBergen Corp.(1) | 41,182 | 3,266,556 | ||
| Cigna Corp. | 7,778 | 995,506 | ||
Express Scripts Holding Co.(1)(2) | 75,621 | 5,732,072 | ||
Laboratory Corp. of America Holdings(2) | 12,922 | 1,683,349 | ||
| 17,336,010 | ||||
| Health Care Technology — 0.6% | ||||
Allscripts Healthcare Solutions, Inc.(1)(2) | 146,097 | 1,855,432 | ||
Medidata Solutions, Inc.(1)(2) | 31,909 | 1,495,575 | ||
| 3,351,007 | ||||
| Hotels, Restaurants and Leisure — 3.8% | ||||
Bloomin' Brands, Inc.(1) | 222,692 | 3,979,506 | ||
Brinker International, Inc.(1) | 77,005 | 3,506,038 | ||
Carnival Corp.(1) | 94,722 | 4,186,712 | ||
| Churchill Downs, Inc. | 9,660 | 1,220,638 | ||
Darden Restaurants, Inc.(1) | 62,922 | 3,985,480 | ||
9
| Shares | Value | |||
| McDonald's Corp. | 25,466 | $ | 3,064,578 | |
| 19,942,952 | ||||
| Household Products — 3.0% | ||||
| Clorox Co. (The) | 14,880 | 2,059,243 | ||
| Kimberly-Clark Corp. | 22,532 | 3,097,700 | ||
Procter & Gamble Co. (The)(1) | 126,499 | 10,710,670 | ||
| 15,867,613 | ||||
| Industrial Conglomerates — 3.3% | ||||
| 3M Co. | 15,420 | 2,700,350 | ||
Carlisle Cos., Inc.(1) | 44,309 | 4,682,575 | ||
Danaher Corp.(1) | 55,381 | 5,593,481 | ||
General Electric Co.(1) | 140,299 | 4,416,613 | ||
| 17,393,019 | ||||
| Insurance — 3.0% | ||||
| Aflac, Inc. | 38,945 | 2,810,271 | ||
Aspen Insurance Holdings Ltd.(1) | 91,841 | 4,259,586 | ||
Hanover Insurance Group, Inc. (The)(1) | 47,184 | 3,992,710 | ||
Prudential Financial, Inc.(1) | 66,623 | 4,752,885 | ||
| 15,815,452 | ||||
| Internet and Catalog Retail — 2.4% | ||||
Amazon.com, Inc.(2) | 17,914 | 12,819,617 | ||
| Internet Software and Services — 4.2% | ||||
Alphabet, Inc., Class A(1)(2) | 21,036 | 14,799,457 | ||
Facebook, Inc., Class A(1)(2) | 65,074 | 7,436,657 | ||
VeriSign, Inc.(2) | 3,490 | 301,745 | ||
| 22,537,859 | ||||
| IT Services — 2.8% | ||||
Cognizant Technology Solutions Corp., Class A(2) | 21,915 | 1,254,415 | ||
International Business Machines Corp.(1) | 53,390 | 8,103,534 | ||
PayPal Holdings, Inc.(1)(2) | 61,871 | 2,258,910 | ||
Teradata Corp.(2) | 9,626 | 241,324 | ||
Xerox Corp.(1) | 306,409 | 2,907,821 | ||
| 14,766,004 | ||||
| Leisure Products — 0.2% | ||||
| Brunswick Corp. | 5,319 | 241,057 | ||
| Hasbro, Inc. | 12,812 | 1,076,080 | ||
| 1,317,137 | ||||
| Life Sciences Tools and Services — 1.4% | ||||
Bruker Corp.(1) | 68,728 | 1,562,875 | ||
Thermo Fisher Scientific, Inc.(1) | 39,808 | 5,882,030 | ||
| 7,444,905 | ||||
| Machinery — 2.4% | ||||
| ITT, Inc. | 42,277 | 1,352,019 | ||
PACCAR, Inc.(1) | 78,815 | 4,088,134 | ||
Stanley Black & Decker, Inc.(1) | 46,401 | 5,160,719 | ||
| Timken Co. (The) | 71,047 | 2,178,301 | ||
| 12,779,173 | ||||
| Media — 4.9% | ||||
AMC Networks, Inc., Class A(2) | 49,849 | 3,011,877 | ||
CBS Corp., Class B(1) | 80,013 | 4,355,908 | ||
| Cinemark Holdings, Inc. | 95,104 | 3,467,492 | ||
10
| Shares | Value | |||
Comcast Corp., Class A(1) | 17,450 | $ | 1,137,565 | |
MSG Networks, Inc., Class A(2) | 25,577 | 392,351 | ||
Regal Entertainment Group, Class A(1) | 118,808 | 2,618,528 | ||
Time Warner, Inc.(1) | 73,964 | 5,439,313 | ||
Viacom, Inc., Class B(1) | 50,284 | 2,085,277 | ||
Walt Disney Co. (The)(1) | 35,478 | 3,470,458 | ||
| 25,978,769 | ||||
| Metals and Mining — 3.6% | ||||
Carpenter Technology Corp.(1) | 131,125 | 4,317,946 | ||
Newmont Mining Corp.(1) | 151,790 | 5,938,025 | ||
Nucor Corp.(1) | 86,536 | 4,275,744 | ||
| Reliance Steel & Aluminum Co. | 16,404 | 1,261,467 | ||
Steel Dynamics, Inc.(1) | 143,178 | 3,507,861 | ||
| 19,301,043 | ||||
| Multiline Retail — 0.9% | ||||
Target Corp.(1) | 69,826 | 4,875,251 | ||
| Oil, Gas and Consumable Fuels — 4.0% | ||||
| Apache Corp. | 12,845 | 715,081 | ||
Chevron Corp.(1) | 52,345 | 5,487,327 | ||
Exxon Mobil Corp.(1) | 118,976 | 11,152,810 | ||
World Fuel Services Corp.(1) | 83,668 | 3,973,393 | ||
| 21,328,611 | ||||
| Personal Products — 0.4% | ||||
Herbalife Ltd.(1)(2) | 35,737 | 2,091,687 | ||
| Pharmaceuticals — 5.9% | ||||
Jazz Pharmaceuticals plc(2) | 8,742 | 1,235,332 | ||
Johnson & Johnson(1) | 96,500 | 11,705,450 | ||
Merck & Co., Inc.(1) | 157,785 | 9,089,994 | ||
Mylan NV(1)(2) | 74,739 | 3,231,714 | ||
Pfizer, Inc.(1) | 175,532 | 6,180,482 | ||
| 31,442,972 | ||||
| Real Estate Investment Trusts (REITs) — 3.6% | ||||
Host Hotels & Resorts, Inc.(1) | 257,558 | 4,175,015 | ||
| Iron Mountain, Inc. | 45,902 | 1,828,277 | ||
Lamar Advertising Co., Class A(1) | 73,273 | 4,858,000 | ||
| PS Business Parks, Inc. | 22,790 | 2,417,563 | ||
RLJ Lodging Trust(1) | 134,333 | 2,881,443 | ||
Sunstone Hotel Investors, Inc.(1) | 264,582 | 3,193,505 | ||
| 19,353,803 | ||||
| Real Estate Management and Development — 0.7% | ||||
Realogy Holdings Corp.(1)(2) | 119,996 | 3,482,284 | ||
| Semiconductors and Semiconductor Equipment — 4.6% | ||||
Analog Devices, Inc.(1) | 37,964 | 2,150,281 | ||
Applied Materials, Inc.(1) | 201,162 | 4,821,853 | ||
| Broadcom Ltd. | 5,570 | 865,578 | ||
Intel Corp.(1) | 277,736 | 9,109,741 | ||
| NVIDIA Corp. | 7,002 | 329,164 | ||
QUALCOMM, Inc.(1) | 111,217 | 5,957,895 | ||
| Teradyne, Inc. | 65,250 | 1,284,772 | ||
| 24,519,284 | ||||
11
| Shares | Value | |||
| Software — 7.2% | ||||
Activision Blizzard, Inc.(1) | 18,956 | $ | 751,226 | |
Adobe Systems, Inc.(2) | 32,517 | 3,114,803 | ||
Cadence Design Systems, Inc.(1)(2) | 169,043 | 4,107,745 | ||
Electronic Arts, Inc.(1)(2) | 28,824 | 2,183,706 | ||
Mentor Graphics Corp.(1) | 69,973 | 1,487,626 | ||
Microsoft Corp.(1) | 242,879 | 12,428,119 | ||
Oracle Corp.(1) | 185,945 | 7,610,729 | ||
Synopsys, Inc.(1)(2) | 82,850 | 4,480,528 | ||
VMware, Inc., Class A(2) | 35,257 | 2,017,406 | ||
| 38,181,888 | ||||
| Specialty Retail — 2.6% | ||||
American Eagle Outfitters, Inc.(1) | 245,449 | 3,910,002 | ||
| Best Buy Co., Inc. | 100,346 | 3,070,588 | ||
Foot Locker, Inc.(1) | 69,367 | 3,805,474 | ||
Michaels Cos., Inc. (The)(2) | 58,213 | 1,655,578 | ||
| Williams-Sonoma, Inc. | 30,002 | 1,564,004 | ||
| 14,005,646 | ||||
| Technology Hardware, Storage and Peripherals — 3.9% | ||||
Apple, Inc.(1) | 143,412 | 13,710,187 | ||
EMC Corp.(1) | 221,813 | 6,026,659 | ||
| HP, Inc. | 35,057 | 439,965 | ||
NetApp, Inc.(1) | 17,362 | 426,932 | ||
| 20,603,743 | ||||
| Thrifts and Mortgage Finance — 0.9% | ||||
Essent Group Ltd.(1)(2) | 208,587 | 4,549,282 | ||
| Trading Companies and Distributors — 0.5% | ||||
HD Supply Holdings, Inc.(2) | 83,270 | 2,899,461 | ||
| Wireless Telecommunication Services — 0.6% | ||||
T-Mobile US, Inc.(1)(2) | 68,133 | 2,948,115 | ||
TOTAL COMMON STOCKS (Cost $614,401,271) | 676,179,489 | |||
| TEMPORARY CASH INVESTMENTS — 1.1% | ||||
| Repurchase Agreement, Fixed Income Clearing Corp., (collateralized by various U.S. Treasury obligations, 3.00%, 11/15/45, valued at $6,076,888), at 0.20%, dated 6/30/16, due 7/1/16 (Delivery value $5,955,033) | 5,955,000 | |||
| State Street Institutional Liquid Reserves Fund, Premier Class | 4,609 | 4,609 | ||
TOTAL TEMPORARY CASH INVESTMENTS (Cost $5,959,609) | 5,959,609 | |||
TOTAL INVESTMENT SECURITIES BEFORE SECURITIES SOLD SHORT — 128.7% (Cost $620,360,880) | 682,139,098 | |||
| COMMON STOCKS SOLD SHORT — (29.0)% | ||||
| Aerospace and Defense — (0.4)% | ||||
| Hexcel Corp. | (57,685) | (2,402,003 | ) | |
| Airlines — (0.6)% | ||||
| Spirit Airlines, Inc. | (71,340) | (3,201,026 | ) | |
| Biotechnology — (0.6)% | ||||
| Bluebird Bio, Inc. | (19,080) | (825,973 | ) | |
| Neurocrine Biosciences, Inc. | (9,562) | (434,593 | ) | |
| Radius Health, Inc. | (19,044) | (699,867 | ) | |
| Ultragenyx Pharmaceutical, Inc. | (23,628) | (1,155,646 | ) | |
| (3,116,079 | ) | |||
12
| Shares | Value | |||
| Chemicals — (1.5)% | ||||
| CF Industries Holdings, Inc. | (134,112) | $ | (3,232,099 | ) |
| Olin Corp. | (184,666) | (4,587,104 | ) | |
| (7,819,203 | ) | |||
| Commercial Services and Supplies — (1.3)% | ||||
| Covanta Holding Corp. | (172,791) | (2,842,412 | ) | |
| Waste Connections, Inc. | (55,635) | (4,008,502 | ) | |
| (6,850,914 | ) | |||
| Communications Equipment — (0.1)% | ||||
| EchoStar Corp., Class A | (17,233) | (684,150 | ) | |
| Containers and Packaging — (0.4)% | ||||
| Ball Corp. | (31,329) | (2,264,773 | ) | |
| Distributors — (0.4)% | ||||
| LKQ Corp. | (61,920) | (1,962,864 | ) | |
| Diversified Financial Services — (0.7)% | ||||
| Leucadia National Corp. | (219,383) | (3,801,907 | ) | |
| Diversified Telecommunication Services — (0.7)% | ||||
| Frontier Communications Corp. | (501,574) | (2,477,776 | ) | |
| Zayo Group Holdings, Inc. | (36,981) | (1,032,879 | ) | |
| (3,510,655 | ) | |||
| Electric Utilities — (0.6)% | ||||
| PNM Resources, Inc. | (91,705) | (3,250,025 | ) | |
| Electronic Equipment, Instruments and Components — (0.4)% | ||||
| Anixter International, Inc. | (38,897) | (2,072,432 | ) | |
| Food Products — (0.9)% | ||||
| J&J Snack Foods Corp. | (24,749) | (2,951,813 | ) | |
| WhiteWave Foods Co. (The), Class A | (40,292) | (1,891,307 | ) | |
| (4,843,120 | ) | |||
| Health Care Providers and Services — (2.9)% | ||||
| Acadia Healthcare Co., Inc. | (61,750) | (3,420,950 | ) | |
| Brookdale Senior Living, Inc. | (184,778) | (2,852,972 | ) | |
| Centene Corp. | (15,439) | (1,101,882 | ) | |
| Envision Healthcare Holdings, Inc. | (27,230) | (690,825 | ) | |
| Henry Schein, Inc. | (8,882) | (1,570,338 | ) | |
| Patterson Cos., Inc. | (25,778) | (1,234,508 | ) | |
| Premier, Inc., Class A | (27,132) | (887,216 | ) | |
| Team Health Holdings, Inc. | (93,212) | (3,790,932 | ) | |
| (15,549,623 | ) | |||
| Hotels, Restaurants and Leisure — (0.9)% | ||||
| Chipotle Mexican Grill, Inc. | (2,268) | (913,460 | ) | |
| MGM Resorts International | (155,985) | (3,529,941 | ) | |
| Texas Roadhouse, Inc. | (5,759) | (262,610 | ) | |
| (4,706,011 | ) | |||
| Household Durables — (0.9)% | ||||
| CalAtlantic Group, Inc. | (88,349) | (3,243,292 | ) | |
| Lennar Corp., Class A | (33,160) | (1,528,676 | ) | |
| (4,771,968 | ) | |||
| Insurance — (1.4)% | ||||
| Assurant, Inc. | (45,495) | (3,926,673 | ) | |
| MBIA, Inc. | (424,791) | (2,901,323 | ) | |
13
| Shares | Value | |||
| ProAssurance Corp. | (11,082) | $ | (593,441 | ) |
| (7,421,437 | ) | |||
| Internet Software and Services — (0.1)% | ||||
| Yahoo!, Inc. | (18,103) | (679,949 | ) | |
| IT Services — (1.6)% | ||||
| DST Systems, Inc. | (4,378) | (509,731 | ) | |
| EPAM Systems, Inc. | (37,021) | (2,380,820 | ) | |
| Fidelity National Information Services, Inc. | (24,802) | (1,827,411 | ) | |
| MAXIMUS, Inc. | (64,573) | (3,575,407 | ) | |
| (8,293,369 | ) | |||
| Marine — (0.7)% | ||||
| Kirby Corp. | (58,825) | (3,670,092 | ) | |
| Media — (1.2)% | ||||
| Lions Gate Entertainment Corp. | (41,619) | (841,952 | ) | |
| Loral Space & Communications, Inc. | (68,403) | (2,412,574 | ) | |
| Tribune Media Co. | (74,207) | (2,907,430 | ) | |
| (6,161,956 | ) | |||
| Metals and Mining — (2.3)% | ||||
| Allegheny Technologies, Inc. | (64,913) | (827,641 | ) | |
| Compass Minerals International, Inc. | (43,942) | (3,260,057 | ) | |
| Hecla Mining Co. | (736,955) | (3,758,470 | ) | |
| Royal Gold, Inc. | (62,126) | (4,474,315 | ) | |
| (12,320,483 | ) | |||
| Multiline Retail — (0.7)% | ||||
| Dollar Tree, Inc. | (38,644) | (3,641,811 | ) | |
| Oil, Gas and Consumable Fuels — (0.1)% | ||||
| SemGroup Corp., Class A | (21,149) | (688,611 | ) | |
| Paper and Forest Products — (0.8)% | ||||
| Louisiana-Pacific Corp. | (260,214) | (4,514,713 | ) | |
| Pharmaceuticals — (0.9)% | ||||
| Medicines Co. (The) | (98,148) | (3,300,717 | ) | |
| Nektar Therapeutics | (87,708) | (1,248,085 | ) | |
| (4,548,802 | ) | |||
| Real Estate Investment Trusts (REITs) — (0.1)% | ||||
| Potlatch Corp. | (11,181) | (381,272 | ) | |
| Real Estate Management and Development — (0.6)% | ||||
| Howard Hughes Corp. (The) | (14,871) | (1,700,052 | ) | |
| Kennedy-Wilson Holdings, Inc. | (81,179) | (1,539,154 | ) | |
| (3,239,206 | ) | |||
| Road and Rail — (0.7)% | ||||
| Genesee & Wyoming, Inc., Class A | (65,666) | (3,871,011 | ) | |
| Semiconductors and Semiconductor Equipment — (0.5)% | ||||
| MACOM Technology Solutions Holdings, Inc. | (80,675) | (2,660,661 | ) | |
| Software — (0.6)% | ||||
| CDK Global, Inc. | (11,428) | (634,140 | ) | |
| SS&C Technologies Holdings, Inc. | (82,404) | (2,313,904 | ) | |
| (2,948,044 | ) | |||
| Specialty Retail — (1.9)% | ||||
| Cabela's, Inc. | (27,462) | (1,374,748 | ) | |
| CarMax, Inc. | (65,238) | (3,198,619 | ) | |
| CST Brands, Inc. | (98,921) | (4,261,517 | ) | |
14
| Shares | Value | |||
| Guess?, Inc. | (98,370) | $ | (1,480,468 | ) |
| (10,315,352 | ) | |||
| Textiles, Apparel and Luxury Goods — (0.5)% | ||||
| G-III Apparel Group Ltd. | (53,297) | (2,436,739 | ) | |
| Transportation Infrastructure — (0.7)% | ||||
| Macquarie Infrastructure Corp. | (49,246) | (3,646,666 | ) | |
| Water Utilities — (0.2)% | ||||
| Aqua America, Inc. | (22,907) | (816,864 | ) | |
| Wireless Telecommunication Services — (0.1)% | ||||
| United States Cellular Corp. | (12,506) | (491,111 | ) | |
TOTAL COMMON STOCKS SOLD SHORT (Proceeds $158,267,516) | (153,554,902 | ) | ||
| OTHER ASSETS AND LIABILITIES — 0.3% | 1,519,835 | |||
| TOTAL NET ASSETS — 100.0% | $ | 530,104,031 | ||
| NOTES TO SCHEDULE OF INVESTMENTS | ||
| (1) | Security, or a portion thereof, has been pledged at the custodian bank or with a broker for collateral requirements on securities sold short. At the period end, the aggregate value of securities pledged was $448,776,746. |
| (2) | Non-income producing. |
See Notes to Financial Statements.
15
| Statement of Assets and Liabilities |
| JUNE 30, 2016 | |||
| Assets | |||
| Investment securities, at value (cost of $620,360,880) | $ | 682,139,098 | |
| Deposits with broker for securities sold short | 1,222,467 | ||
| Receivable for capital shares sold | 356,786 | ||
| Dividends and interest receivable | 600,635 | ||
| 684,318,986 | |||
| Liabilities | |||
| Securities sold short, at value (proceeds of $158,267,516) | 153,554,902 | ||
| Accrued management fees | 470,183 | ||
| Dividend expense payable on securities sold short | 90,759 | ||
| Broker fees and charges payable on securities sold short | 98,591 | ||
| Accrued other expenses | 520 | ||
| 154,214,955 | |||
| Net Assets | $ | 530,104,031 | |
| Institutional Class Capital Shares, $0.01 Par Value | |||
| Shares authorized | 200,000,000 | ||
| Shares outstanding | 40,469,850 | ||
| Net Asset Value Per Share | $ | 13.10 | |
| Net Assets Consist of: | |||
| Capital (par value and paid-in surplus) | $ | 491,400,020 | |
| Accumulated net realized loss | (27,786,821 | ) | |
| Net unrealized appreciation | 66,490,832 | ||
| $ | 530,104,031 | ||
See Notes to Financial Statements.
16
| Statement of Operations |
| YEAR ENDED JUNE 30, 2016 | |||
| Investment Income (Loss) | |||
| Income: | |||
| Dividends | $ | 13,084,605 | |
| Interest | 13,744 | ||
| 13,098,349 | |||
| Expenses: | |||
| Dividend expense on securities sold short | 1,655,230 | ||
| Broker fees and charges on securities sold short | 1,167,764 | ||
| Management fees | 5,338,365 | ||
| Directors' fees and expenses | 28,398 | ||
| Other expenses | 5,036 | ||
| 8,194,793 | |||
| Net investment income (loss) | 4,903,556 | ||
| Realized and Unrealized Gain (Loss) | |||
| Net realized gain (loss) on: | |||
| Investment transactions | (34,821,652 | ) | |
| Securities sold short transactions | 8,314,077 | ||
| Foreign currency transactions | 345 | ||
| (26,507,230 | ) | ||
| Change in net unrealized appreciation (depreciation) on: | |||
| Investments | 7,802,959 | ||
| Securities sold short | 6,874,866 | ||
| 14,677,825 | |||
| Net realized and unrealized gain (loss) | (11,829,405 | ) | |
| Net Increase (Decrease) in Net Assets Resulting from Operations | $ | (6,925,849 | ) |
See Notes to Financial Statements.
17
| Statement of Changes in Net Assets |
| YEARS ENDED JUNE 30, 2016 AND JUNE 30, 2015 | ||||||
| Increase (Decrease) in Net Assets | June 30, 2016 | June 30, 2015 | ||||
| Operations | ||||||
| Net investment income (loss) | $ | 4,903,556 | $ | 4,367,299 | ||
| Net realized gain (loss) | (26,507,230 | ) | 45,065,903 | |||
| Change in net unrealized appreciation (depreciation) | 14,677,825 | (30,658,217 | ) | |||
| Net increase (decrease) in net assets resulting from operations | (6,925,849 | ) | 18,774,985 | |||
| Distributions to Shareholders | ||||||
| From net investment income | (4,937,666 | ) | (4,115,172 | ) | ||
| From net realized gains | (30,690,487 | ) | (43,391,423 | ) | ||
| Decrease in net assets from distributions | (35,628,153 | ) | (47,506,595 | ) | ||
| Capital Share Transactions | ||||||
| Proceeds from shares sold | 81,890,205 | 93,554,643 | ||||
| Proceeds from reinvestment of distributions | 35,628,153 | 47,506,595 | ||||
| Payments for shares redeemed | (19,557,811 | ) | (24,508,840 | ) | ||
| Net increase (decrease) in net assets from capital share transactions | 97,960,547 | 116,552,398 | ||||
| Net increase (decrease) in net assets | 55,406,545 | 87,820,788 | ||||
| Net Assets | ||||||
| Beginning of period | 474,697,486 | 386,876,698 | ||||
| End of period | $ | 530,104,031 | $ | 474,697,486 | ||
| Undistributed net investment income | — | $ | 241,436 | |||
| Transactions in Shares of the Fund | ||||||
| Sold | 6,281,507 | 6,360,257 | ||||
| Issued in reinvestment of distributions | 2,719,946 | 3,298,154 | ||||
| Redeemed | (1,471,483 | ) | (1,605,334 | ) | ||
| Net increase (decrease) in shares of the fund | 7,529,970 | 8,053,077 | ||||
See Notes to Financial Statements.
18
| Statement of Cash Flows |
| YEAR ENDED JUNE 30, 2016 | |||
| Cash Flows From (Used In) Operating Activities | |||
| Net increase (decrease) in net assets resulting from operations | $ | (6,925,849 | ) |
| Adjustments to reconcile net increase (decrease) in net assets resulting from operations to net cash from (used in) operating activities: | |||
| Purchases of investment securities | (570,719,301 | ) | |
| Proceeds from investments sold | 473,656,367 | ||
| Purchases to cover securities sold short | (179,221,772 | ) | |
| Proceeds from securities sold short | 208,806,833 | ||
| (Increase) decrease in short-term investments | (1,942,644 | ) | |
| (Increase) decrease in deposits with broker for securities sold short | 1,460,880 | ||
| (Increase) decrease in receivable for investments sold | 27,089,675 | ||
| (Increase) decrease in dividends and interest receivable | 23,276 | ||
| Increase (decrease) in payable for investments purchased | (26,610,197 | ) | |
| Increase (decrease) in accrued management fees | 39,697 | ||
| Increase (decrease) in dividend expense payable on securities sold short | 25,133 | ||
| Increase (decrease) in broker fees and charges payable on securities sold short | 98,591 | ||
| Increase (decrease) in accrued other expenses | 520 | ||
| Change in net unrealized (appreciation) depreciation on investments | (7,802,959 | ) | |
| Net realized (gain) loss on investment transactions | 34,821,652 | ||
| Change in net unrealized (appreciation) depreciation on securities sold short | (6,874,866 | ) | |
| Net realized (gain) loss on securities sold short transactions | (8,314,077 | ) | |
| Net cash from (used in) operating activities | (62,389,041 | ) | |
| Cash Flows From (Used In) Financing Activities | |||
| Proceeds from shares sold | 81,946,852 | ||
| Payments for shares redeemed | (19,557,811 | ) | |
| Distributions paid, net of reinvestments | — | ||
| Net cash from (used in) financing activities | 62,389,041 | ||
| Net Increase (Decrease) In Cash | — | ||
| Cash at beginning of period | — | ||
| Cash at end of period | — | ||
| Supplemental disclosure of cash flow information: | |||
| Non cash financing activities not included herein consist of all reinvestment of distributions of $35,628,153. | |||
See Notes to Financial Statements.
19
| Notes to Financial Statements |
JUNE 30, 2016
1. Organization
American Century Quantitative Equity Funds, Inc. (the corporation) is registered under the Investment Company Act of 1940, as amended (the 1940 Act), as an open-end management investment company and is organized as a Maryland corporation. NT Core Equity Plus Fund (the fund) is one fund in a series issued by the corporation. The fund’s investment objective is to seek long-term capital growth. The fund is not permitted to invest in securities issued by companies assigned the Global Industry Classification Standard for the tobacco industry.
2. Significant Accounting Policies
The following is a summary of significant accounting policies consistently followed by the fund in preparation of its financial statements. The fund is an investment company and follows accounting and reporting guidance in accordance with accounting principles generally accepted in the United States of America. This may require management to make certain estimates and assumptions at the date of the financial statements. Actual results could differ from these estimates. Management evaluated the impact of events or transactions occurring through the date the financial statements were issued that would merit recognition or disclosure.
Investment Valuations — The fund determines the fair value of its investments and computes its net asset value per share at the close of regular trading (usually 4 p.m. Eastern time) on the New York Stock Exchange (NYSE) on each day the NYSE is open. The Board of Directors has adopted valuation policies and procedures to guide the investment advisor in the fund’s investment valuation process and to provide methodologies for the oversight of the fund’s pricing function.
Equity securities that are listed or traded on a domestic securities exchange are valued at the last reported sales price or at the official closing price as provided by the exchange. Equity securities traded on foreign securities exchanges are generally valued at the closing price of such securities on the exchange where primarily traded or at the close of the NYSE, if that is earlier. If no last sales price is reported, or if local convention or regulation so provides, the mean of the latest bid and asked prices may be used. Securities traded over-the-counter are valued at the mean of the latest bid and asked prices, the last sales price, or the official closing price. Equity securities initially expressed in local currencies are translated into U.S. dollars at the mean of the appropriate currency exchange rate at the close of the NYSE as provided by an independent pricing service.
Open-end management investment companies are valued at the reported net asset value per share. Repurchase agreements are valued at cost, which approximates fair value.
If the fund determines that the market price for an investment is not readily available or the valuation methods mentioned above do not reflect an investment’s fair value, such investment is valued as determined in good faith by the Board of Directors or its delegate, in accordance with policies and procedures adopted by the Board of Directors. In its determination of fair value, the fund may review several factors including, but not limited to, market information regarding the specific investment or comparable investments and correlation with other investment types, futures indices or general market indicators. Circumstances that may cause the fund to use these procedures to value an investment include, but are not limited to: an investment has been declared in default or is distressed; trading in a security has been suspended during the trading day or a security is not actively trading on its principal exchange; prices received from a regular pricing source are deemed unreliable; or there is a foreign market holiday and no trading occurred.
The fund monitors for significant events occurring after the close of an investment’s primary exchange but before the fund’s net asset value per share is determined. Significant events may include, but are not limited to: corporate announcements and transactions; governmental action and political unrest that could impact a specific investment or an investment sector; or armed conflicts, natural disasters and similar events that could affect investments in a specific country or region. The fund also monitors for significant fluctuations between domestic and foreign markets, as evidenced by the U.S. market or such other indicators that the Board of Directors, or its delegate, deems appropriate. If significant fluctuations in foreign markets are identified, the fund may apply a model-derived factor to the closing price of equity securities traded on foreign securities exchanges. The factor is based on observable market data as provided by an independent pricing service.
20
Security Transactions — Security transactions are accounted for as of the trade date. Net realized gains and losses are determined on the identified cost basis, which is also used for federal income tax purposes.
Investment Income — Dividend income less foreign taxes withheld, if any, is recorded as of the ex-dividend date. Distributions received on securities that represent a return of capital or long-term capital gain are recorded as a reduction of cost of investments and/or as a realized gain. The fund may estimate the components of distributions received that may be considered nontaxable distributions or long-term capital gain distributions for income tax purposes. Interest income is recorded on the accrual basis and includes accretion of discounts and amortization of premiums.
Securities Sold Short — The fund enters into short sales, which is selling securities it does not own, as part of its normal investment activities. Upon selling a security short, the fund will segregate cash, cash equivalents or other appropriate liquid securities in at least an amount equal to the current market value of the securities sold short until the fund replaces the borrowed security. Interest earned on segregated cash for securities sold short is reflected as interest income. The fund is required to pay any dividends or interest due on securities sold short. Such dividends and interest are recorded as an expense. The fund may pay fees or charges to the broker on the assets borrowed for securities sold short. These fees are calculated daily based upon the value of each security sold short and a rate that is dependent on the availability of such security. Liabilities for securities sold short are valued daily and changes in value are recorded as change in net unrealized appreciation (depreciation) on securities sold short. The fund records realized gain (loss) on a security sold short when it is terminated by the fund and includes as a component of net realized gain (loss) on securities sold short transactions.
Foreign Currency Translations — All assets and liabilities initially expressed in foreign currencies are translated into U.S. dollars at prevailing exchange rates at period end. The fund may enter into spot foreign currency exchange contracts to facilitate transactions denominated in a foreign currency. Purchases and sales of investment securities, dividend and interest income, spot foreign currency exchange contracts, and expenses are translated at the rates of exchange prevailing on the respective dates of such transactions. Net realized and unrealized foreign currency exchange gains or losses related to investment securities are a component of net realized gain (loss) on investment transactions and change in net unrealized appreciation (depreciation) on investments, respectively. Net realized and unrealized foreign currency exchange gains or losses related to securities sold short are a component of net realized gain (loss) on securities sold short transactions and change in net unrealized appreciation (depreciation) on securities sold short, respectively.
Repurchase Agreements — The fund may enter into repurchase agreements with institutions that American Century Investment Management, Inc. (ACIM) (the investment advisor) has determined are creditworthy pursuant to criteria adopted by the Board of Directors. The fund requires that the collateral, represented by securities, received in a repurchase transaction be transferred to the custodian in a manner sufficient to enable the fund to obtain those securities in the event of a default under the repurchase agreement. ACIM monitors, on a daily basis, the securities transferred to ensure the value, including accrued interest, of the securities under each repurchase agreement is equal to or greater than amounts owed to the fund under each repurchase agreement.
Joint Trading Account — Pursuant to an Exemptive Order issued by the Securities and Exchange Commission, the fund, along with certain other funds in the American Century Investments family of funds, may transfer uninvested cash balances into a joint trading account. These balances are invested in one or more repurchase agreements that are collateralized by U.S. Treasury or Agency obligations.
Segregated Assets — In accordance with the 1940 Act, the fund segregates assets on its books and records to cover certain types of investments, including, but not limited to, futures contracts and short sales. ACIM monitors, on a daily basis, the securities segregated to ensure the fund designates a sufficient amount of liquid assets, marked-to-market daily. The fund may also receive assets or be required to pledge assets at the custodian bank or with a broker for margin requirements on futures contracts and short sales.
Income Tax Status — It is the fund’s policy to distribute substantially all net investment income and net realized gains to shareholders and to otherwise qualify as a regulated investment company under provisions of the Internal Revenue Code. Accordingly, no provision has been made for income taxes. The fund files U.S. federal, state, local and non-U.S. tax returns as applicable. The fund's tax returns are subject to examination by the relevant taxing authority until expiration of the applicable statute of limitations, which is generally three years from the date of filing but can be longer in certain jurisdictions. At this time, management believes there are no uncertain tax positions which, based on their technical merit, would not be sustained upon examination
21
and for which it is reasonably possible that the total amounts of unrecognized tax benefits will significantly change in the next twelve months.
Distributions to Shareholders — Distributions from net investment income, if any, are generally declared and paid semiannually. Distributions from net realized gains, if any, are generally declared and paid annually.
Indemnifications — Under the corporation’s organizational documents, its officers and directors are indemnified against certain liabilities arising out of the performance of their duties to the fund. In addition, in the normal course of business, the fund enters into contracts that provide general indemnifications. The maximum exposure under these arrangements is unknown as this would involve future claims that may be made against a fund. The risk of material loss from such claims is considered by management to be remote.
Statement of Cash Flows — The Statement of Cash Flows has been prepared using the indirect method which requires net increase (decrease) in net assets resulting from operations to be adjusted to reconcile to net cash from (used in) operating activities. The beginning of period and end of period cash is the amount of domestic and foreign currency included in the fund's Statement of Assets and Liabilities and represents the cash on hand at the custodian bank and does not include any short-term investments or deposits with brokers for securities sold short.
3. Fees and Transactions with Related Parties
Certain officers and directors of the corporation are also officers and/or directors of American Century Companies, Inc. (ACC). The corporation’s investment advisor, ACIM, the corporation's distributor, American Century Investment Services, Inc., and the corporation’s transfer agent, American Century Services, LLC, are wholly owned, directly or indirectly, by ACC. Various funds issued by American Century Asset Allocation Portfolios, Inc. own, in aggregate, 100% of the shares of the fund. Related parties do not invest in the fund for the purpose of exercising management or control.
Management Fees — The corporation has entered into a management agreement with ACIM, under which ACIM provides the fund with investment advisory and management services in exchange for a single, unified management fee (the fee). The agreement provides that all expenses of managing and operating the fund, except distribution and service fees, expenses on securities sold short, brokerage expenses, taxes, interest, fees and expenses of the independent directors (including legal counsel fees), and extraordinary expenses, will be paid by ACIM. The fee is computed and accrued daily based on the daily net assets of the fund and paid monthly in arrears. The fee consists of (1) an Investment Category Fee based on the daily net assets of the fund and certain other accounts managed by the investment advisor that are in the same broad investment category as the fund and (2) a Complex Fee based on the assets of all the funds in the American Century Investments family of funds. The rates for the Investment Category Fee range from 0.9680% to 1.1500%. The rates for the Complex Fee range from 0.0500% to 0.1100%. The effective annual management fee for the year ended June 30, 2016 was 1.09%.
Directors' Fees and Expenses — The Board of Directors is responsible for overseeing the investment advisor’s management and operations of the fund. The directors receive detailed information about the fund and its investment advisor regularly throughout the year, and meet at least quarterly with management of the investment advisor to review reports about fund operations. The fund’s officers do not receive compensation from the fund.
Interfund Transactions — The fund may enter into security transactions with other American Century Investments funds and other client accounts of the investment advisor, in accordance with the 1940 Act rules and procedures adopted by the Board of Directors. The rules and procedures require, among other things, that these transactions be effected at the independent current market price of the security. During the period, the interfund purchases and sales were $1,885,664 and $6,002,367, respectively.
4. Investment Transactions
Purchases and sales of investment securities and securities sold short, excluding short-term investments, for the year ended June 30, 2016 were $749,930,727 and $681,608,064, respectively.
22
5. Fair Value Measurements
The fund’s investments valuation process is based on several considerations and may use multiple inputs to determine the fair value of the investments held by the fund. In conformity with accounting principles generally accepted in the United States of America, the inputs used to determine a valuation are classified into three broad levels.
| • | Level 1 valuation inputs consist of unadjusted quoted prices in an active market for identical investments. |
| • | Level 2 valuation inputs consist of direct or indirect observable market data (including quoted prices for comparable investments, evaluations of subsequent market events, interest rates, prepayment speeds, credit risk, etc.). These inputs also consist of quoted prices for identical investments initially expressed in local currencies that are adjusted through translation into U.S. dollars. |
| • | Level 3 valuation inputs consist of unobservable data (including a fund’s own assumptions). |
The level classification is based on the lowest level input that is significant to the fair valuation measurement. The valuation inputs are not necessarily an indication of the risks associated with investing in these securities or other financial instruments. There were no significant transfers between levels during the period.
The following is a summary of the level classifications as of period end. The Schedule of Investments provides additional information on the fund’s portfolio holdings.
| Level 1 | Level 2 | Level 3 | ||||||
| Assets | ||||||||
| Investment Securities | ||||||||
| Common Stocks | $ | 676,179,489 | — | — | ||||
| Temporary Cash Investments | 4,609 | $ | 5,955,000 | — | ||||
| $ | 676,184,098 | $ | 5,955,000 | — | ||||
| Liabilities | ||||||||
| Securities Sold Short | ||||||||
| Common Stocks | $ | 153,554,902 | — | — | ||||
6. Risk Factors
The fund is subject to short sales risk. If the market price of a security increases after the fund borrows the security, the fund may suffer a loss when it replaces the borrowed security at the higher price. Any loss will be increased by the amount of compensation, interest or dividends, and transaction costs the fund must pay to the lender of the borrowed security.
The fund's investment strategy utilizes leverage, which can increase market exposure and subject the fund to greater risk and higher volatility.
If the fund is overweighted in a stock or sector, any negative development related to that stock or sector will have a greater impact on the fund than other funds that are not overweighted in that stock or sector.
The fund’s investment process may result in high portfolio turnover, which could mean high transaction costs, affecting both performance and capital gains tax liabilities to investors.
23
7. Federal Tax Information
The tax character of distributions paid during the years ended June 30, 2016 and June 30, 2015 were as follows:
| 2016 | 2015 | |||||
| Distributions Paid From | ||||||
| Ordinary income | $ | 4,940,682 | $ | 8,267,044 | ||
| Long-term capital gains | $ | 30,687,471 | $ | 39,239,551 | ||
The book-basis character of distributions made during the year from net investment income or net realized gains may differ from their ultimate characterization for federal income tax purposes. These differences reflect the differing character of certain income items and net realized gains and losses for financial statement and tax purposes, and may result in reclassification among certain capital accounts on the financial statements.
As of June 30, 2016, the federal tax cost of investments and the components of distributable earnings on a tax-basis were as follows:
| Federal tax cost of investments | $ | 620,744,577 | |
| Gross tax appreciation of investments | $ | 85,295,633 | |
| Gross tax depreciation of investments | (23,901,112 | ) | |
| Net tax appreciation (depreciation) of investments | 61,394,521 | ||
| Net tax appreciation (depreciation) on securities sold short | 4,544,739 | ||
| Net tax appreciation (depreciation) | $ | 65,939,260 | |
| Undistributed ordinary income | — | ||
| Accumulated short-term capital losses | $ | (27,235,249 | ) |
The difference between book-basis and tax-basis unrealized appreciation (depreciation) is attributable primarily to the tax deferral of losses on wash sales.
Accumulated capital losses represent net capital loss carryovers that may be used to offset future realized capital gains for federal income tax purposes. The capital loss carryovers may be carried forward for an unlimited period. Future capital loss carryover utilization in any given year may be subject to Internal Revenue Code limitations.
24
| Financial Highlights |
| For a Share Outstanding Throughout the Years Ended June 30 (except as noted) | ||||||||||||||||
| Per-Share Data | Ratios and Supplemental Data | |||||||||||||||
| Income From Investment Operations: | Distributions From: | Ratio to Average Net Assets of: | ||||||||||||||
Net Asset Value, Beginning of Period | Net Investment Income (Loss)(1) | Net Realized and Unrealized Gain (Loss) | Total From Investment Operations | Net Investment Income | Net Realized Gains | Total Distributions | Net Asset Value, End of Period | Total Return(2) | Operating Expenses | Operating Expenses (excluding expenses on securities sold short) | Net Investment Income (Loss) | Portfolio Turnover Rate | Net Assets, End of Period (in thousands) | |||
| Institutional Class | ||||||||||||||||
| 2016 | $14.41 | 0.14 | (0.44) | (0.30) | (0.12) | (0.89) | (1.01) | $13.10 | (1.96)% | 1.68% | 1.10% | 1.01% | 109% | $530,104 | ||
| 2015 | $15.55 | 0.16 | 0.58 | 0.74 | (0.14) | (1.74) | (1.88) | $14.41 | 4.86% | 1.53% | 1.10% | 1.03% | 106% | $474,697 | ||
| 2014 | $13.05 | 0.13 | 3.33 | 3.46 | (0.12) | (0.84) | (0.96) | $15.55 | 27.10% | 1.57% | 1.10% | 0.88% | 104% | $386,877 | ||
| 2013 | $10.95 | 0.16 | 2.26 | 2.42 | (0.18) | (0.14) | (0.32) | $13.05 | 22.54% | 1.66% | 1.10% | 1.35% | 111% | $267,576 | ||
2012(3) | $10.00 | 0.03 | 0.92 | 0.95 | —(4) | — | —(4) | $10.95 | 9.55% | 1.86%(5) | 1.11%(5) | 0.53%(5) | 81% | $188,648 | ||
| Notes to Financial Highlights |
| (1) | Computed using average shares outstanding throughout the period. |
| (2) | Total returns are calculated based on the net asset value of the last business day. Total returns for periods less than one year are not annualized. |
| (3) | December 1, 2011 (fund inception) through June 30, 2012. |
| (4) | Per-share amount was less than $0.005. |
| (5) | Annualized. |
See Notes to Financial Statements.
| Report of Independent Registered Public Accounting Firm |
To the Directors of the American Century Quantitative Equity Funds, Inc. and Shareholders of the NT Core Equity Plus Fund:
In our opinion, the accompanying statement of assets and liabilities, including the schedule of investments, and the related statements of operations, of changes in net assets and of cash flows and the financial highlights present fairly, in all material respects, the financial position of the NT Core Equity Plus Fund (one of the sixteen funds comprising the American Century Quantitative Equity Funds, Inc., hereafter referred to as the “Fund”) at June 30, 2016, the results of its operations and its cash flows for the year then ended, the changes in its net assets for each of the two years in the period then ended and the financial highlights for each of the periods presented, in conformity with accounting principles generally accepted in the United States of America. These financial statements and financial highlights (hereafter referred to as "financial statements") are the responsibility of the Fund's management. Our responsibility is to express an opinion on these financial statements based on our audits. We conducted our audits of these financial statements in accordance with the standards of the Public Company Accounting Oversight Board (United States). Those standards require that we plan and perform the audit to obtain reasonable assurance about whether the financial statements are free of material misstatement. An audit includes examining, on a test basis, evidence supporting the amounts and disclosures in the financial statements, assessing the accounting principles used and significant estimates made by management, and evaluating the overall financial statement presentation. We believe that our audits, which included confirmation of securities at June 30, 2016 by correspondence with the custodian and brokers, provide a reasonable basis for our opinion.
PricewaterhouseCoopers LLP
Kansas City, Missouri
August 17, 2016
26
| Management |
Board of Directors
The individuals listed below serve as directors of the funds. Each director will continue to serve in this capacity until death, retirement, resignation or removal from office. The board has adopted a mandatory retirement age for directors who are not “interested persons,” as that term is defined in the Investment Company Act (independent directors). Independent directors shall retire on December 31 of the year in which they reach their 75th birthday; provided, however, that on or after January 1, 2022, independent directors shall retire on December 31 of the year in which they reach their 76th birthday.
Mr. Thomas is an “interested person” because he currently serves as President and Chief Executive Officer of American Century Companies, Inc. (ACC), the parent company of American Century Investment Management, Inc. (ACIM or the advisor). The other directors (more than three-fourths of the total number) are independent. They are not employees, directors or officers of, and have no financial interest in, ACC or any of its wholly owned, direct or indirect, subsidiaries, including ACIM, American Century Investment Services, Inc. (ACIS) and American Century Services, LLC (ACS), and they do not have any other affiliations, positions or relationships that would cause them to be considered “interested persons” under the Investment Company Act. The directors serve in this capacity for eight (in the case of Mr. Thomas, 15) registered investment companies in the American Century Investments family of funds.
The following table presents additional information about the directors. The mailing address for each director other than Mr. Thomas is 1665 Charleston Road, Mountain View, California 94043. The mailing address for Mr. Thomas is 4500 Main Street, Kansas City, Missouri 64111.
Name (Year of Birth) | Position(s) Held with Funds | Length of Time Served | Principal Occupation(s) During Past 5 Years | Number of American Century Portfolios Overseen by Director | Other Directorships Held During Past 5 Years |
| Independent Directors | |||||
| Tanya S. Beder (1955) | Director | Since 2011 | Chairman and CEO, SBCC Group Inc. (independent advisory services) (2006 to present) | 45 | CYS Investments, Inc. (NYSE mortgage arbitrage REIT) |
| Jeremy I. Bulow (1954) | Director | Since 2011 | Professor of Economics, Stanford University, Graduate School of Business (1979 to present) | 45 | None |
| Anne Casscells (1958) | Director | Since 2016 | Co-Chief Executive Officer and Chief Investment Officer, Aetos Alternatives Management (investment advisory firm) (2001 to present); Lecturer in Accounting, Stanford University, Graduate School of Business (2009 to present) | 45 | None |
27
Name (Year of Birth) | Position(s) Held with Funds | Length of Time Served | Principal Occupation(s) During Past 5 Years | Number of American Century Portfolios Overseen by Director | Other Directorships Held During Past 5 Years |
| Independent Directors | |||||
| Ronald J. Gilson (1946) | Director and Chairman of the Board | Since 1995 (Chairman since 2005) | Charles J. Meyers Professor of Law and Business, Emeritus, Stanford Law School (1979 to present); Marc and Eva Stern Professor of Law and Business, Columbia University School of Law (1992 to present) | 45 | None |
| Frederick L. A. Grauer (1946) | Director | Since 2008 | Senior Advisor, iShares by BlackRock, Inc. (investment management firm) (2010 to 2011, 2013 to present); Senior Advisor, Course Hero (an educational technology company) (2015 to present) | 45 | None |
| Jonathan D. Levin (1972) | Director | Since 2016 | Holbrook Working Professor of Price Theory, Stanford University, (2000 to present); Chair, Department of Economics, Stanford University (2011 to 2014) | 45 | None |
| Peter F. Pervere (1947) | Director | Since 2007 | Retired | 45 | None |
| John B. Shoven (1947) | Director | Since 2002 | Charles R. Schwab Professor of Economics, Stanford University (1973 to present) | 45 | Cadence Design Systems; Exponent; Financial Engines |
| Interested Director | |||||
| Jonathan S. Thomas (1963) | Director and President | Since 2007 | President and Chief Executive Officer, ACC (March 2007 to present). Also serves as Chief Executive Officer, ACS; Executive Vice President, ACIM; Director, ACC, ACIM and other ACC subsidiaries | 128 | BioMed Valley Discoveries, Inc. |
The Statement of Additional Information has additional information about the fund's directors and is available without charge, upon request, by calling 1-800-345-2021.
28
Officers
The following table presents certain information about the executive officers of the funds. Each officer serves as an officer for each of the 15 investment companies in the American Century family of funds, unless otherwise noted. No officer is compensated for his or her service as an officer of the funds. The listed officers are interested persons of the funds and are appointed or re-appointed on an annual basis. The mailing address for each of the officers listed below is 4500 Main Street, Kansas City, Missouri 64111.
Name (Year of Birth) | Offices with the Funds | Principal Occupation(s) During the Past Five Years |
| Jonathan S. Thomas (1963) | Director and President since 2007 | President and Chief Executive Officer, ACC (March 2007 to present). Also serves as Chief Executive Officer, ACS; Executive Vice President, ACIM; Director, ACC, ACIM and other ACC subsidiaries |
| Amy D. Shelton (1964) | Chief Compliance Officer and Vice President since 2014 | Chief Compliance Officer, American Century funds, (March 2014 to present); Chief Compliance Officer, ACIM (February 2014 to present); Chief Compliance Officer, ACIS (October 2009 to present); Vice President, Client Interactions and Marketing, ACIS (February 2013 to January 2014); Director, Client Interactions and Marketing, ACIS (June 2007 to January 2013). Also serves as Vice President, ACIS |
| Charles A. Etherington (1957) | General Counsel since 2007 and Senior Vice President since 2006 | Attorney, ACC (February 1994 to present); Vice President, ACC (November 2005 to present); General Counsel, ACC (March 2007 to present). Also serves as General Counsel, ACIM, ACS, ACIS and other ACC subsidiaries; and Senior Vice President, ACIM and ACS |
| C. Jean Wade (1964) | Vice President, Treasurer and Chief Financial Officer since 2012 | Vice President, ACS (February 2000 to present) |
| Robert J. Leach (1966) | Vice President since 2006 and Assistant Treasurer since 2012 | Vice President, ACS (February 2000 to present) |
| David H. Reinmiller (1963) | Vice President since 2001 | Attorney, ACC (January 1994 to present); Associate General Counsel, ACC (January 2001 to present). Also serves as Vice President, ACIM and ACS |
| Ward D. Stauffer (1960) | Secretary since 2005 | Attorney, ACC (June 2003 to present) |
29
| Approval of Management Agreement |
At a meeting held on June 14, 2016, the Fund’s Board of Directors (the "Board") unanimously approved the renewal of the management agreement pursuant to which American Century Investment Management, Inc. (the “Advisor”) acts as the investment advisor for the Fund. Under Section 15(c) of the Investment Company Act, contracts for investment advisory services are required to be reviewed, evaluated, and approved by a majority of a fund’s directors/trustees, including a majority of the independent Directors, each year. The Board regards this annual evaluation and renewal as one of its most important responsibilities.
The independent Directors have memorialized a statement regarding the relationship between their ongoing obligations to oversee and evaluate the performance of the Advisor and their annual consideration of renewal of the management agreement. In that statement, the independent Directors noted that their assessment of the Advisor’s performance is an ongoing process that takes place over the entire year and is informed by all of the extensive information that the Board and its committees receive and consider over time. This information, together with the additional materials provided specifically in connection with the review, are central to the Board’s assessment of the Advisor’s performance and its determination whether to renew the Fund’s management agreement.
Prior to its consideration of the renewal of the management agreement, the Board requested and reviewed extensive data and analysis relating to the proposed renewal. This information and analysis was compiled by the Advisor and certain independent providers of evaluation data concerning the Fund and the services provided to the Fund by the Advisor.
In connection with its consideration of the renewal of the management agreement, the Board’s review and evaluation of the services provided by the Advisor included, but was not limited to, the following:
| • | the nature, extent, and quality of investment management, shareholder services, and other services provided by the Advisor to the Fund; |
| • | the wide range of other programs and services the Advisor provides to the Fund and its shareholders on a routine and non-routine basis; |
| • | the investment performance of the Fund, including data comparing the Fund’s performance to appropriate benchmarks and/or a peer group of other mutual funds with similar investment objectives and strategies; |
| • | the cost of owning the Fund compared to the cost of owning similar funds; |
| • | the Advisor’s compliance policies, procedures, and regulatory experience; |
| • | financial data showing the cost of services provided to the Fund, the profitability of the Fund to the Advisor, and the overall profitability of the Advisor; |
| • | possible economies of scale associated with the Advisor’s management of the Fund and other accounts under its management; |
| • | data comparing services provided and charges to other investment management clients of the Advisor; |
| • | acquired fund fees and expenses; |
| • | payments by the Fund and the Advisor to financial intermediaries whose clients are investors in the Fund; and |
| • | any collateral benefits derived by the Advisor from the management of the Fund. |
In keeping with its practice, the Board held two in-person meetings to review and discuss the information provided in response to their request. The independent Directors also had the benefit of the advice of their independent counsel throughout the process.
30
Factors Considered
The Directors considered all of the information provided by the Advisor, the independent data providers, and the independent Directors’ independent counsel in connection with the approval. They determined that the information was sufficient for them to evaluate the management agreement for the Fund. In connection with their review, the Directors did not identify any single factor as being all-important or controlling and each Director may have attributed different levels of importance to different factors. In deciding to renew the management agreement, the Board based its decision on a number of factors, including the following:
Nature, Extent and Quality of Services - Generally. Under the management agreement, the Advisor is responsible for providing or arranging for all services necessary for the operation of the Fund. The Board noted that under the management agreement, the Advisor provides or arranges at its own expense a wide variety of services including:
| • | constructing and designing the Fund |
| • | portfolio research and security selection |
| • | initial capitalization/funding |
| • | securities trading |
| • | Fund administration |
| • | custody of Fund assets |
| • | daily valuation of the Fund’s portfolio |
| • | shareholder servicing and transfer agency, including shareholder confirmations, recordkeeping, and communications |
| • | legal services (except the independent Directors’ counsel) |
| • | regulatory and portfolio compliance |
| • | financial reporting |
| • | marketing and distribution (except amounts paid by the Fund under Rule 12b-1 plans) |
The Board noted that many of these services have expanded over time in terms of both quantity and complexity in response to shareholder demands, competition in the industry, changing distribution channels, and the changing regulatory environment.
Investment Management, Shareholder, and Other Services. The nature of the investment management services provided to the Fund is quite complex and allows Fund shareholders access to professional money management, instant diversification of their investments within an asset class, the opportunity to easily diversify among asset classes by investing in or exchanging among various American Century Investments funds, and liquidity. In evaluating investment performance, the Board expects the Advisor to manage the Fund in accordance with its investment objectives and approved strategies. Further, the Directors recognize that the Advisor has an obligation to seek the best execution of fund trades. In providing these services, the Advisor utilizes teams of investment professionals (portfolio managers, analysts, research assistants, and securities traders) who require extensive information technology, research, training, compliance, and other systems to conduct their business. The Board, directly and through its Portfolio Committee, regularly reviews investment performance information for the Fund, together with comparative information for appropriate benchmarks and/or peer groups of similarly-managed funds, over different time horizons. The Directors also review detailed performance information during the management agreement approval process. If performance concerns are identified, the Fund receives special reviews until performance improves, during which the Board discusses with the Advisor the reasons for such results (e.g., market conditions, security selection) and any efforts being undertaken to improve performance. The Fund’s performance was above its benchmark for the three-year period and below its benchmark for the one-year period reviewed by the Board. The Board discussed the Fund’s performance with the Advisor and was satisfied with the efforts being undertaken by the Advisor. The Board found the investment management services provided by the Advisor to the Fund to be satisfactory and consistent with the management agreement.
31
Under the management agreement, the Advisor provides the Fund with a comprehensive package of transfer agency, shareholder, and other services. The Board, directly and through various committees of the Board, regularly reviews reports and evaluations of such services at its regular meetings. These reports include, but are not limited to, information regarding the operational efficiency and accuracy of the shareholder and transfer agency services provided, staffing levels, shareholder satisfaction (as measured by external as well as internal sources), technology support, new products and services offered to Fund shareholders, securities trading activities, portfolio valuation services, auditing services, and legal and operational compliance activities. Certain aspects of shareholder and transfer agency service level efficiency and the quality of securities trading activities are measured by independent third party providers and are presented in comparison to other fund groups not managed by the Advisor.
The Board found the services provided by the Advisor to the Fund under the management agreement to be competitive and of high quality.
Costs of Services and Profitability. The Advisor provides detailed information concerning its cost of providing various services to the Fund, its profitability in managing the Fund, its overall profitability, and its financial condition. The Directors have reviewed with the Advisor the methodology used to prepare this financial information. This information is considered in evaluating the Advisor’s financial condition, its ability to continue to provide services under the management agreement, and the reasonableness of the current management fee. The Board concluded that the Advisor’s profits were reasonable in light of the services provided to the Fund.
Economies of Scale. The Board also reviewed information provided by the Advisor regarding the possible existence of economies of scale in connection with the management of the Fund. The Board concluded that economies of scale are difficult to measure and predict with precision, especially on a fund-by-fund basis. The Board concluded that the Advisor is appropriately sharing economies of scale through its competitive fee structure, offering competitive fees from fund inception, and through reinvestment in its business to provide shareholders enhanced and expanded services.
Comparison to Other Funds’ Fees. The management agreement provides that the Fund pays the Advisor a single, all-inclusive (or unified) management fee for providing all services necessary for the management and operation of the Fund, other than brokerage expenses, expenses attributable to short sales, taxes, interest, extraordinary expenses, the fees and expenses of the Fund’s independent Directors (including their independent legal counsel), and expenses incurred in connection with the provision of shareholder services and distribution services under a plan adopted pursuant to Rule 12b-1 under the 1940 Act. Under the unified fee structure, the Advisor is responsible for providing all investment advisory, custody, audit, administrative, compliance, recordkeeping, marketing, and shareholder services, or arranging and supervising third parties to provide such services. By contrast, most other funds are charged a variety of fees, including an investment advisory fee, a transfer agency fee, an administrative fee, distribution charges, and other expenses. Other than their investment advisory fees and any applicable Rule 12b-1 fees, all other components of the total fees charged by these other funds may be increased without shareholder approval. The Board believes the unified fee structure is a benefit to Fund shareholders because it clearly discloses to shareholders the cost of owning Fund shares, and, since the unified fee cannot be increased without a vote of Fund shareholders, it shifts to the Advisor the risk of increased costs of operating the Fund and provides a direct incentive to minimize administrative inefficiencies. Part of the Board’s analysis of fee levels involves reviewing certain evaluative data compiled by an independent provider and comparing the Fund’s unified fee to the total expense ratio of peer funds. The unified fee charged to shareholders of the Fund was below the median of the total expense ratios of the Fund’s peer group. The Board concluded that the management fee paid by the Fund to the Advisor under the management agreement is reasonable in light of the services provided to the Fund.
32
Comparison to Fees and Services Provided to Other Clients of the Advisor. The Board also requested and received information from the Advisor concerning the nature of the services, fees, costs, and profitability of its advisory services to advisory clients other than the Fund. They observed that these varying types of client accounts require different services and involve different regulatory and entrepreneurial risks than the management of the Fund. The Board analyzed this information and concluded that the fees charged and services provided to the Fund were reasonable by comparison.
Payments to Intermediaries. The Directors also requested and received a description of payments made to intermediaries by the Fund and the Advisor. These payments include various payments made by the Fund or the Advisor to different types of intermediaries and recordkeepers for distribution and service activities provided for the Fund.
Collateral or “Fall-Out” Benefits Derived by the Advisor. The Board considered the existence of collateral benefits the Advisor may receive as a result of its relationship with the Fund. The Board noted that the Advisor’s primary business is managing mutual funds and it generally does not use fund or shareholder information to generate profits in other lines of business, and therefore does not derive any significant collateral benefits from them. The Board noted that the Advisor receives proprietary research from broker-dealers that execute fund portfolio transactions. The Board also determined that the Advisor is able to provide investment management services to certain clients other than the Fund, at least in part, due to its existing infrastructure built to serve the fund complex. The Board concluded, however, that the assets of those other clients are not material to the analysis and, where applicable, may be included with the assets of the Fund to determine breakpoints in the management fee schedule.
Existing Relationship. The Board also considered whether there was any reason for not continuing the existing arrangement with the Advisor. In this regard, the Board was mindful of the potential disruptions of the Fund’s operations and various risks, uncertainties, and other effects that could occur as a result of a decision not to continue such relationship. In particular, the Board recognized that most shareholders have invested in the Fund on the strength of the Advisor’s industry standing and reputation and in the expectation that the Advisor will have a continuing role in providing advisory services to the Fund.
Conclusion of the Directors. As a result of this process, the Board, including all of the independent Directors and assisted by the advice of independent legal counsel, taking into account all of the factors discussed above and the information provided by the Advisor and others in connection with its review and throughout the year, concluded that the management agreement between the Fund and the Advisor is fair and reasonable in light of the services provided and should be renewed.
33
| Proxy Voting Results |
A special meeting of shareholders was held on June 13, 2016, to vote on the following proposal. The proposal received the required number of votes and was adopted. A summary of voting results is listed below.
To elect four directors to the Board of Directors of American Century Quantitative Equity Funds, Inc.:
| Affirmative | Withhold | ||||||
| Tanya S. Beder | $ | 8,473,153,264 | $ | 121,459,590 | |||
| Jeremy I. Bulow | $ | 8,469,793,581 | $ | 124,819,273 | |||
| Anne Casscells | $ | 8,465,895,232 | $ | 128,717,622 | |||
| Jonathan D. Levin | $ | 8,468,929,867 | $ | 125,682,987 | |||
The other directors whose term of office continued after the meeting include Jonathan S. Thomas, Ronald J. Gilson, Frederick L. A. Grauer, Peter F. Pervere and John B. Shoven.
34
| Additional Information |
Retirement Account Information
As required by law, distributions you receive from certain IRAs are subject to federal income tax withholding, unless you elect not to have withholding apply. Tax will be withheld on the total amount withdrawn even though you may be receiving amounts that are not subject to withholding, such as nondeductible contributions. In such case, excess amounts of withholding could occur. You may adjust your withholding election so that a greater or lesser amount will be withheld.
If you don’t want us to withhold on this amount, you must notify us to not withhold the federal income tax. You may notify us in writing or in certain situations by telephone or through other electronic means. For systematic withdrawals, your withholding election will remain in effect until revoked or changed by filing a new election. You have the right to revoke your election at any time.
Remember, even if you elect not to have income tax withheld, you are liable for paying income tax on the taxable portion of your withdrawal. If you elect not to have income tax withheld or you don’t have enough income tax withheld, you may be responsible for payment of estimated tax. You may incur penalties under the estimated tax rules if your withholding and estimated tax payments are not sufficient. You can reduce or defer the income tax on a distribution by directly or indirectly rolling such distribution over to another IRA or eligible plan. You should consult your tax advisor for additional information.
State tax will be withheld if, at the time of your distribution, your address is within one of the mandatory withholding states and you have federal income tax withheld (or as otherwise required by state law). State taxes will be withheld from your distribution in accordance with the respective state rules.
Distributions you receive from 403(b), 457 and qualified plans are subject to special tax and withholding rules. Your plan administrator or plan sponsor is required to provide you with a special tax notice explaining those rules at the time you request a distribution. If applicable, federal and/or state taxes may be withheld from your distribution amount.
Proxy Voting Policies
Descriptions of the principles and policies that the fund's investment advisor uses in exercising the voting rights associated with the securities purchased and/or held by the fund are available without charge, upon request, by calling 1-800-345-2021 or visiting the "About Us" page of American Century Investments’ website at americancentury.com. A description of the policies is also available on the Securities and Exchange Commission’s website at sec.gov. Information regarding how the investment advisor voted proxies relating to portfolio securities during the most recent 12-month period ended June 30 is available on the "About Us" page at americancentury.com. It is also available at sec.gov.
Quarterly Portfolio Disclosure
The fund files its complete schedule of portfolio holdings with the Securities and Exchange Commission (SEC) for the first and third quarters of each fiscal year on Form N-Q. The fund’s Forms N-Q are available on the SEC’s website at sec.gov, and may be reviewed and copied at the SEC’s Public Reference Room in Washington, DC. Information on the operation of the Public Reference Room may be obtained by calling 1-800-SEC-0330. The fund also makes its complete schedule of portfolio holdings for the most recent quarter of its fiscal year available on its website at americancentury.com and, upon request, by calling 1-800-345-2021.
35
Other Tax Information
The following information is provided pursuant to provisions of the Internal Revenue Code.
The fund hereby designates up to the maximum amount allowable as qualified dividend income for the fiscal year ended June 30, 2016.
For corporate taxpayers, the fund hereby designates $4,940,682, or up to the maximum amount allowable, of ordinary income distributions paid during the fiscal year ended June 30, 2016 as qualified for the corporate dividends received deduction.
The fund hereby designates $30,687,471, or up to the maximum amount allowable, as long-term capital gain distributions (20% rate gain distributions) for the fiscal year ended June 30, 2016.
36
| ||
| Contact Us | americancentury.com | |
| Automated Information Line | 1-800-345-8765 | |
| Investor Services Representative | 1-800-345-2021 or 816-531-5575 | |
| Investors Using Advisors | 1-800-378-9878 | |
| Business, Not-For-Profit, Employer-Sponsored Retirement Plans | 1-800-345-3533 | |
| Banks and Trust Companies, Broker-Dealers, Financial Professionals, Insurance Companies | 1-800-345-6488 | |
| Telecommunications Relay Service for the Deaf | 711 | |
| American Century Quantitative Equity Funds, Inc. | ||
Investment Advisor: American Century Investment Management, Inc. Kansas City, Missouri | ||
| This report and the statements it contains are submitted for the general information of our shareholders. The report is not authorized for distribution to prospective investors unless preceded or accompanied by an effective prospectus. | ||
| ©2016 American Century Proprietary Holdings, Inc. All rights reserved. CL-ANN-89963 1608 | ||
| Annual Report | |
| June 30, 2016 | |
| NT Disciplined Growth Fund | |
| Table of Contents |
| Performance | 2 | |
| Portfolio Commentary | ||
| Fund Characteristics | ||
| Shareholder Fee Example | ||
| Schedule of Investments | ||
| Statement of Assets and Liabilities | ||
| Statement of Operations | ||
| Statement of Changes in Net Assets | ||
| Notes to Financial Statements | ||
| Financial Highlights | ||
| Report of Independent Registered Public Accounting Firm | ||
| Management | ||
| Approval of Management Agreement | ||
| Proxy Voting Results | ||
| Additional Information | ||
Any opinions expressed in this report reflect those of the author as of the date of the report, and do not necessarily represent the opinions of American Century Investments® or any other person in the American Century Investments organization. Any such opinions are subject to change at any time based upon market or other conditions and American Century Investments disclaims any responsibility to update such opinions. These opinions may not be relied upon as investment advice and, because investment decisions made by American Century Investments funds are based on numerous factors, may not be relied upon as an indication of trading intent on behalf of any American Century Investments fund. Security examples are used for representational purposes only and are not intended as recommendations to purchase or sell securities. Performance information for comparative indices and securities is provided to American Century Investments by third party vendors. To the best of American Century Investments’ knowledge, such information is accurate at the time of printing.
| Performance |
| Total Returns as of June 30, 2016 | ||||
| Average Annual Returns | ||||
Ticker Symbol | 1 year | Since Inception | Inception Date | |
| Investor Class | ANTDX | -2.18% | -3.46% | 3/19/15 |
| Russell 1000 Growth Index | — | 3.02% | 1.54% | — |
| Institutional Class | ANDGX | -2.03% | -3.27% | 3/19/15 |
| Growth of $10,000 Over Life of Class |
| $10,000 investment made March 19, 2015 |
| Performance for other share classes will vary due to differences in fee structure. |
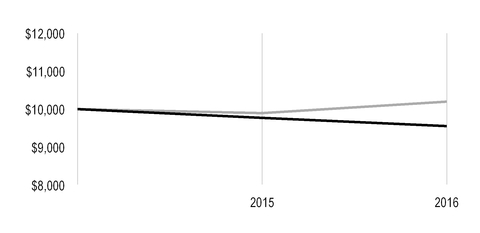
| Value on June 30, 2016 | |
| Investor Class — $9,557 | |
| Russell 1000 Growth Index — $10,198 | |
| Total Annual Fund Operating Expenses | |
| Investor Class | Institutional Class |
| 1.01% | 0.81% |
The total annual fund operating expenses shown is as stated in the fund’s prospectus current as of the date of this report. The prospectus may vary from the expense ratio shown elsewhere in this report because it is based on a different time period, includes acquired fund fees and expenses, and, if applicable, does not include fee waivers or expense reimbursements.
Data presented reflect past performance. Past performance is no guarantee of future results. Current performance may be higher or lower than the performance shown. Total returns for periods less than one year are not annualized. Investment return and principal value will fluctuate, and redemption value may be more or less than original cost. Data assumes reinvestment of dividends and capital gains, and none of the charts reflect the deduction of taxes that a shareholder would pay on fund distributions or the redemption of fund shares. To obtain performance data current to the most recent month end, please call 1-800-345-2021 or visit americancentury.com. For additional information about the fund, please consult the prospectus.
2
| Portfolio Commentary |
Portfolio Manager: Lynette Pang
In May 2016, portfolio manager Bill Martin left the fund's management team.
Performance Summary
NT Disciplined Growth returned -2.03%* for the fiscal year ended June 30, 2016, compared with the 3.02% return of its benchmark, the Russell 1000 Growth Index.
NT Disciplined Growth declined during the 12-month period, underperforming its benchmark, the Russell 1000 Growth Index. Stock selection in the consumer discretionary sector was a leading detractor from fund results, although industrials and financials holdings were also key underperformers. Conversely, positioning in telecommunication services and materials aided relative returns, as did information technology sector holdings.
NT Disciplined Growth’s stock selection process incorporates factors of valuation, quality, growth, and sentiment while striving to minimize unintended risks along industries and other risk characteristics. Within the fund, valuation factors detracted from selection results, while quality and growth were supportive. Sentiment factors were largely neutral.
Consumer Discretionary Sector Pressured Results
Consumer discretionary sector holdings were key drivers of the fund’s underperformance during the 12-month period. An overweight position, relative to the benchmark, in GoPro detracted as the wearable camera maker’s stock slumped on concerns about economic growth in China and a bleak outlook for wearable camera demand. An overweight position in specialty retailer Aaron’s also pressured results. The company’s stock slumped as lower same-store sales and significant escalation in bad debt expense caused the rent-to-own home goods retailer to miss quarterly earnings and revenue expectations and lower its future guidance. An overweight position in restaurant franchise operator Brinker International dampened results due to softer-than-expected sales at its Chili’s casual restaurants. We subsequently exited the portfolio’s stake in each position.
The fund’s industrials holdings also weighed on returns, led by an overweight position in United Continental Holdings. The airline weakened on disappointing financial results, driven by declining unit revenue due in part to a strong dollar and subsequently lower demand from international travelers. At home, falling oil prices earlier in the year hurt travel demand in its Houston hub, the center of the U.S. energy industry, contributing to management’s disappointing second-quarter outlook. Our investment in the stock is supported by above-average profiles across all factors.
A number of positions in the financials sector weighed on the fund’s returns. Shares of commercial real estate services company Jones Lang LaSalle, a portfolio overweight, declined sharply on disappointing quarterly earnings in early 2016 during a difficult environment for financial stocks. We ultimately liquidated our position in the holding. Elsewhere, several health care stocks pressured fund returns including an overweight position in Biogen. The biopharmaceutical holding’s share price fell sharply on disappointing revenue and lowered earnings guidance for 2015 as a result of declining sales of its Tecfidera multiple sclerosis treatment. Nevertheless, we believe the holding’s attractive valuation and growth characteristics support our positioning.
* All fund returns referenced in this commentary are for Institutional Class shares. Performance for other share classes will vary due to differences in fee structure; when Institutional Class performance exceeds that of the fund's benchmark, other share classes may not. See page 2 for returns for all share classes.
3
Telecommunication Services Aided Returns
Telecommunication services sector positioning contributed to the fund’s relative returns, especially overweight exposure to a number of diversified telecommunication services providers. An overweight in Verizon Communications aided fund results after the telecommunications giant surpassed quarterly financial expectations on solid subscriber growth in its mobile and FiOS divisions. Positioning in the materials sector also benefited relative returns, although no single holding was a leading contributor.
Semiconductor manufacturers helped to bolster information technology returns, positioning that sector as a key contributor. Key outperformance came from an overweight position in Applied Materials. The semiconductor maker’s shares moved up on the heels of strong quarterly earnings reports and higher future guidance as the company captured market share from competitors and anticipated higher demand. Key sector contribution also stemmed from Cadence Design Systems, a maker of hardware and software products for validating chip designs, whose fourth-quarter financial results beat Wall Street expectations, due in part to strong sales of its new Palladium Z1 enterprise emulation platform. We opted to lock in gains and sold our stake in the holding.
Positioning in the energy sector, particularly an underweight to oil, gas and consumable fuels holdings, benefited results as oil prices sank to their lowest levels since early 2009 on widening oversupply and uncertain future demand during the first half of the year. In this environment, not holding natural gas processer Williams Companies was beneficial as its stock price declined steeply on weak energy sector returns. Elsewhere, an overweight position in Tyson Foods was beneficial as the poultry processor’s stock price reached new highs after beating quarterly earnings projections and raising future profit guidance.
A Look Ahead
At period-end, information technology and consumer staples were among the fund’s largest overweight positions on a sector basis. We think that software and internet software and services companies are attractive in the information technology sector, where key themes are mobile, search, cloud computing, big data, and the shift to digital/online retail. This is creating growth and quality opportunities. Valuation and sentiment also are positive for select firms in these industries. In consumer staples, we are finding opportunities in household goods manufacturers. After the dramatic sell-off in 2015, health care names, particularly in the biotech space, are compelling based on valuation factors. Growth and quality metrics also are favorable. The consumer discretionary and financials sectors, both portfolio underweights, continue to face challenges, in our opinion. Growth scores are not favorable in consumer discretionary, particularly among specialty retailers. In fundamental terms, many of these traditional brick-and-mortar retailers face challenging business conditions and have poor growth and quality rankings. We find that large-cap real estate investment trusts and diversified financial services firms are challenged across virtually all dimensions. Our disciplined, objective, and systematic investment strategy is designed to take advantage of opportunities at the individual company level. We believe this approach is the most powerful way to capitalize on market inefficiencies that lead to the mispricing of individual stocks.
4
| Fund Characteristics |
| JUNE 30, 2016 | |
| Top Ten Holdings | % of net assets |
| Alphabet, Inc., Class A | 4.8% |
| Apple, Inc. | 4.2% |
| Amazon.com, Inc. | 3.3% |
| Facebook, Inc., Class A | 3.3% |
| Microsoft Corp. | 3.1% |
| Walt Disney Co. (The) | 2.4% |
| PepsiCo, Inc. | 2.2% |
| Amgen, Inc. | 2.0% |
| Verizon Communications, Inc. | 1.8% |
| AbbVie, Inc. | 1.8% |
| Top Five Industries | % of net assets |
| Software | 9.3% |
| Internet Software and Services | 8.7% |
| Biotechnology | 8.0% |
| Media | 6.4% |
| Technology Hardware, Storage and Peripherals | 5.0% |
| Types of Investments in Portfolio | % of net assets |
| Common Stocks | 99.0% |
| Temporary Cash Investments | 1.1% |
| Other Assets and Liabilities | (0.1)% |
5
| Shareholder Fee Example |
Fund shareholders may incur two types of costs: (1) transaction costs, including sales charges (loads) on purchase payments and redemption/exchange fees; and (2) ongoing costs, including management fees; distribution and service (12b-1) fees; and other fund expenses. This example is intended to help you understand your ongoing costs (in dollars) of investing in your fund and to compare these costs with the ongoing cost of investing in other mutual funds.
The example is based on an investment of $1,000 made at the beginning of the period and held for the entire period from January 1, 2016 to June 30, 2016.
Actual Expenses
The table provides information about actual account values and actual expenses for each class. You may use the information, together with the amount you invested, to estimate the expenses that you paid over the period. First, identify the share class you own. Then simply divide your account value by $1,000 (for example, an $8,600 account value divided by $1,000 = 8.6), then multiply the result by the number under the heading “Expenses Paid During Period” to estimate the expenses you paid on your account during this period.
Hypothetical Example for Comparison Purposes
The table also provides information about hypothetical account values and hypothetical expenses based on the actual expense ratio of each class of your fund and an assumed rate of return of 5% per year before expenses, which is not the actual return of a fund’s share class. The hypothetical account values and expenses may not be used to estimate the actual ending account balance or expenses you paid for the period. You may use this information to compare the ongoing costs of investing in your fund and other funds. To do so, compare this 5% hypothetical example with the 5% hypothetical examples that appear in the shareholder reports of the other funds.
Please note that the expenses shown in the table are meant to highlight your ongoing costs only and do not reflect any transactional costs, such as sales charges (loads) or redemption/exchange fees. Therefore, the table is useful in comparing ongoing costs only, and will not help you determine the relative total costs of owning different funds. In addition, if these transactional costs were included, your costs would have been higher.
| Beginning Account Value 1/1/16 | Ending Account Value 6/30/16 | Expenses Paid During Period(1) 1/1/16 - 6/30/16 | Annualized Expense Ratio(1) | |
| Actual | ||||
| Investor Class | $1,000 | $1,003.70 | $5.08 | 1.02% |
| Institutional Class | $1,000 | $1,004.60 | $4.09 | 0.82% |
| Hypothetical | ||||
| Investor Class | $1,000 | $1,019.79 | $5.12 | 1.02% |
| Institutional Class | $1,000 | $1,020.79 | $4.12 | 0.82% |
| (1) | Expenses are equal to the class's annualized expense ratio listed in the table above, multiplied by the average account value over the period, multiplied by 182, the number of days in the most recent fiscal half-year, divided by 366, to reflect the one-half year period. |
6
| Schedule of Investments |
JUNE 30, 2016
| Shares | Value | |||
| COMMON STOCKS — 99.0% | ||||
| Aerospace and Defense — 2.6% | ||||
| B/E Aerospace, Inc. | 93,777 | $ | 4,330,153 | |
| Boeing Co. (The) | 59,496 | 7,726,746 | ||
| Honeywell International, Inc. | 4,347 | 505,643 | ||
| 12,562,542 | ||||
| Airlines — 2.4% | ||||
| Delta Air Lines, Inc. | 92,327 | 3,363,473 | ||
Hawaiian Holdings, Inc.(1) | 79,166 | 3,005,141 | ||
JetBlue Airways Corp.(1) | 228,165 | 3,778,413 | ||
United Continental Holdings, Inc.(1) | 35,880 | 1,472,515 | ||
| 11,619,542 | ||||
| Auto Components — 0.8% | ||||
Cooper-Standard Holding, Inc.(1) | 6,486 | 512,329 | ||
| Lear Corp. | 34,118 | 3,471,848 | ||
| 3,984,177 | ||||
| Beverages — 3.1% | ||||
| Coca-Cola Co. (The) | 103,627 | 4,697,412 | ||
| PepsiCo, Inc. | 99,656 | 10,557,557 | ||
| 15,254,969 | ||||
| Biotechnology — 8.0% | ||||
| AbbVie, Inc. | 145,490 | 9,007,286 | ||
| Amgen, Inc. | 63,071 | 9,596,253 | ||
Biogen, Inc.(1) | 20,873 | 5,047,509 | ||
Celgene Corp.(1) | 59,267 | 5,845,504 | ||
| Gilead Sciences, Inc. | 96,829 | 8,077,475 | ||
Incyte Corp.(1) | 6,176 | 493,956 | ||
United Therapeutics Corp.(1) | 9,939 | 1,052,739 | ||
| 39,120,722 | ||||
| Building Products — 0.3% | ||||
USG Corp.(1) | 52,702 | 1,420,846 | ||
| Capital Markets — 0.4% | ||||
| Federated Investors, Inc., Class B | 76,313 | 2,196,288 | ||
| Chemicals — 2.7% | ||||
| Air Products & Chemicals, Inc. | 38,938 | 5,530,754 | ||
| PPG Industries, Inc. | 48,532 | 5,054,608 | ||
| Sherwin-Williams Co. (The) | 8,308 | 2,439,810 | ||
| 13,025,172 | ||||
| Communications Equipment — 1.1% | ||||
Arista Networks, Inc.(1) | 38,445 | 2,475,089 | ||
Ciena Corp.(1) | 155,927 | 2,923,631 | ||
F5 Networks, Inc.(1) | 745 | 84,811 | ||
| 5,483,531 | ||||
| Consumer Finance — 0.1% | ||||
| American Express Co. | 12,020 | 730,335 | ||
| Containers and Packaging — 0.1% | ||||
| Avery Dennison Corp. | 8,972 | 670,657 | ||
7
| Shares | Value | |||
| Diversified Telecommunication Services — 2.7% | ||||
| AT&T, Inc. | 91,586 | $ | 3,957,431 | |
| Verizon Communications, Inc. | 161,858 | 9,038,151 | ||
| 12,995,582 | ||||
| Food and Staples Retailing — 2.1% | ||||
| CVS Health Corp. | 15,902 | 1,522,458 | ||
| Sysco Corp. | 87,992 | 4,464,714 | ||
| Walgreens Boots Alliance, Inc. | 50,200 | 4,180,154 | ||
| 10,167,326 | ||||
| Food Products — 4.5% | ||||
| Campbell Soup Co. | 29,950 | 1,992,573 | ||
| General Mills, Inc. | 88,415 | 6,305,758 | ||
| Hormel Foods Corp. | 119,732 | 4,382,191 | ||
| Ingredion, Inc. | 36,134 | 4,676,101 | ||
| Tyson Foods, Inc., Class A | 70,707 | 4,722,521 | ||
| 22,079,144 | ||||
| Gas Utilities — 0.3% | ||||
| Southwest Gas Corp. | 19,589 | 1,541,850 | ||
| Health Care Equipment and Supplies — 4.3% | ||||
| Baxter International, Inc. | 16,010 | 723,972 | ||
| Becton Dickinson and Co. | 28,816 | 4,886,906 | ||
Boston Scientific Corp.(1) | 124,333 | 2,905,662 | ||
| C.R. Bard, Inc. | 21,271 | 5,002,088 | ||
Hologic, Inc.(1) | 87,231 | 3,018,193 | ||
| ResMed, Inc. | 70,592 | 4,463,532 | ||
| 21,000,353 | ||||
| Health Care Providers and Services — 3.1% | ||||
| AmerisourceBergen Corp. | 48,198 | 3,823,065 | ||
Express Scripts Holding Co.(1) | 80,788 | 6,123,731 | ||
Laboratory Corp. of America Holdings(1) | 19,252 | 2,507,958 | ||
| UnitedHealth Group, Inc. | 17,931 | 2,531,857 | ||
| 14,986,611 | ||||
| Health Care Technology — 0.4% | ||||
Medidata Solutions, Inc.(1) | 40,944 | 1,919,045 | ||
| Hotels, Restaurants and Leisure — 3.1% | ||||
| Bob Evans Farms, Inc. | 24,607 | 933,836 | ||
| Churchill Downs, Inc. | 17,306 | 2,186,786 | ||
| Darden Restaurants, Inc. | 62,684 | 3,970,405 | ||
| McDonald's Corp. | 53,472 | 6,434,820 | ||
| Starbucks Corp. | 28,265 | 1,614,497 | ||
| Yum! Brands, Inc. | 2,786 | 231,015 | ||
| 15,371,359 | ||||
| Household Products — 2.3% | ||||
| Clorox Co. (The) | 37,315 | 5,164,023 | ||
| Kimberly-Clark Corp. | 44,395 | 6,103,424 | ||
| 11,267,447 | ||||
| Industrial Conglomerates — 2.1% | ||||
| 3M Co. | 6,451 | 1,129,699 | ||
| Carlisle Cos., Inc. | 42,670 | 4,509,366 | ||
| Danaher Corp. | 44,095 | 4,453,595 | ||
| 10,092,660 | ||||
8
| Shares | Value | |||
| Insurance — 1.2% | ||||
| Aon plc | 4,166 | $ | 455,052 | |
| Arthur J. Gallagher & Co. | 93,880 | 4,468,688 | ||
| Universal Insurance Holdings, Inc. | 61,557 | 1,143,729 | ||
| 6,067,469 | ||||
| Internet and Catalog Retail — 3.6% | ||||
Amazon.com, Inc.(1) | 22,942 | 16,417,754 | ||
Shutterfly, Inc.(1) | 22,180 | 1,033,810 | ||
| 17,451,564 | ||||
| Internet Software and Services — 8.7% | ||||
Alphabet, Inc., Class A(1) | 33,393 | 23,492,977 | ||
Facebook, Inc., Class A(1) | 139,540 | 15,946,631 | ||
GoDaddy, Inc., Class A(1) | 67,434 | 2,103,267 | ||
| j2 Global, Inc. | 17,641 | 1,114,382 | ||
Twitter, Inc.(1) | 13,521 | 228,640 | ||
| 42,885,897 | ||||
| IT Services — 4.2% | ||||
CoreLogic, Inc.(1) | 18,333 | 705,454 | ||
| CSG Systems International, Inc. | 86,398 | 3,482,703 | ||
| Global Payments, Inc. | 44,212 | 3,155,853 | ||
| International Business Machines Corp. | 53,227 | 8,078,794 | ||
PayPal Holdings, Inc.(1) | 16,778 | 612,565 | ||
Syntel, Inc.(1) | 7,998 | 361,989 | ||
Teradata Corp.(1) | 16,199 | 406,109 | ||
| Travelport Worldwide Ltd. | 74,999 | 966,737 | ||
| Visa, Inc., Class A | 40,202 | 2,981,782 | ||
| 20,751,986 | ||||
| Leisure Products — 0.5% | ||||
Smith & Wesson Holding Corp.(1) | 95,910 | 2,606,834 | ||
| Life Sciences Tools and Services — 0.8% | ||||
| Bruker Corp. | 33,054 | 751,648 | ||
| Thermo Fisher Scientific, Inc. | 20,228 | 2,988,889 | ||
| 3,740,537 | ||||
| Machinery — 0.9% | ||||
| Stanley Black & Decker, Inc. | 5,214 | 579,901 | ||
| Toro Co. (The) | 43,961 | 3,877,360 | ||
| 4,457,261 | ||||
| Media — 6.4% | ||||
AMC Networks, Inc., Class A(1) | 36,482 | 2,204,243 | ||
| CBS Corp., Class B | 55,709 | 3,032,798 | ||
| Cinemark Holdings, Inc. | 44,619 | 1,626,809 | ||
| Comcast Corp., Class A | 44,774 | 2,918,817 | ||
| Time Warner, Inc. | 69,261 | 5,093,454 | ||
| Viacom, Inc., Class B | 114,213 | 4,736,413 | ||
| Walt Disney Co. (The) | 119,209 | 11,661,024 | ||
| 31,273,558 | ||||
| Metals and Mining — 0.7% | ||||
| Steel Dynamics, Inc. | 141,943 | 3,477,603 | ||
| Multiline Retail — 0.8% | ||||
| Target Corp. | 57,269 | 3,998,522 | ||
9
| Shares | Value | |||
| Pharmaceuticals — 1.6% | ||||
| Bristol-Myers Squibb Co. | 19,906 | $ | 1,464,086 | |
| Johnson & Johnson | 12,517 | 1,518,312 | ||
| Merck & Co., Inc. | 52,464 | 3,022,451 | ||
Mylan NV(1) | 14,833 | 641,379 | ||
| Pfizer, Inc. | 39,786 | 1,400,865 | ||
| 8,047,093 | ||||
| Real Estate Investment Trusts (REITs) — 1.3% | ||||
| American Tower Corp. | 52,535 | 5,968,501 | ||
| Armada Hoffler Properties, Inc. | 36,279 | 498,474 | ||
| 6,466,975 | ||||
| Semiconductors and Semiconductor Equipment — 3.1% | ||||
| Applied Materials, Inc. | 188,978 | 4,529,803 | ||
| Broadcom Ltd. | 4,563 | 709,090 | ||
| Intel Corp. | 139,247 | 4,567,301 | ||
| NVIDIA Corp. | 23,396 | 1,099,846 | ||
| QUALCOMM, Inc. | 84,137 | 4,507,219 | ||
| 15,413,259 | ||||
| Software — 9.3% | ||||
Adobe Systems, Inc.(1) | 65,516 | 6,275,777 | ||
Citrix Systems, Inc.(1) | 42,118 | 3,373,230 | ||
Electronic Arts, Inc.(1) | 71,622 | 5,426,083 | ||
| Intuit, Inc. | 46,239 | 5,160,735 | ||
Manhattan Associates, Inc.(1) | 3,998 | 256,392 | ||
| Microsoft Corp. | 295,706 | 15,131,276 | ||
| Oracle Corp. | 105,190 | 4,305,427 | ||
salesforce.com, inc.(1) | 56,788 | 4,509,535 | ||
VMware, Inc., Class A(1) | 17,509 | 1,001,865 | ||
| 45,440,320 | ||||
| Specialty Retail — 3.0% | ||||
| American Eagle Outfitters, Inc. | 253,084 | 4,031,628 | ||
| Foot Locker, Inc. | 58,130 | 3,189,012 | ||
| Home Depot, Inc. (The) | 28,797 | 3,677,089 | ||
Michaels Cos., Inc. (The)(1) | 51,219 | 1,456,668 | ||
| Williams-Sonoma, Inc. | 43,858 | 2,286,318 | ||
| 14,640,715 | ||||
| Technology Hardware, Storage and Peripherals — 5.0% | ||||
| Apple, Inc. | 216,104 | 20,659,543 | ||
| EMC Corp. | 141,561 | 3,846,212 | ||
| 24,505,755 | ||||
| Thrifts and Mortgage Finance — 0.2% | ||||
Essent Group Ltd.(1) | 55,984 | 1,221,011 | ||
| Trading Companies and Distributors — 0.8% | ||||
HD Supply Holdings, Inc.(1) | 109,260 | 3,804,433 | ||
| Wireless Telecommunication Services — 0.4% | ||||
T-Mobile US, Inc.(1) | 43,255 | 1,871,644 | ||
TOTAL COMMON STOCKS (Cost $469,791,386) | 485,612,594 | |||
10
| Shares | Value | |||
| TEMPORARY CASH INVESTMENTS — 1.1% | ||||
| Repurchase Agreement, Fixed Income Clearing Corp., (collateralized by various U.S. Treasury obligations, 3.00%, 11/15/45, valued at $5,261,275), at 0.20%, dated 6/30/16, due 7/1/16 (Delivery value $5,156,029) | $ | 5,156,000 | ||
| State Street Institutional Liquid Reserves Fund, Premier Class | 3,966 | 3,966 | ||
TOTAL TEMPORARY CASH INVESTMENTS (Cost $5,159,966) | 5,159,966 | |||
TOTAL INVESTMENT SECURITIES — 100.1% (Cost $474,951,352) | 490,772,560 | |||
| OTHER ASSETS AND LIABILITIES — (0.1)% | (257,186) | |||
| TOTAL NET ASSETS — 100.0% | $ | 490,515,374 | ||
| NOTES TO SCHEDULE OF INVESTMENTS | ||
| (1) | Non-income producing. |
See Notes to Financial Statements.
11
| Statement of Assets and Liabilities |
| JUNE 30, 2016 | |||
| Assets | |||
| Investment securities, at value (cost of $474,951,352) | $ | 490,772,560 | |
| Receivable for investments sold | 3,994,528 | ||
| Receivable for capital shares sold | 12,921 | ||
| Dividends and interest receivable | 352,827 | ||
| 495,132,836 | |||
| Liabilities | |||
| Payable for investments purchased | 4,275,982 | ||
| Accrued management fees | 340,970 | ||
| Accrued other expenses | 510 | ||
| 4,617,462 | |||
| Net Assets | $ | 490,515,374 | |
| Net Assets Consist of: | |||
| Capital (par value and paid-in surplus) | $ | 511,455,936 | |
| Undistributed net investment income | 153,762 | ||
| Accumulated net realized loss | (36,915,532 | ) | |
| Net unrealized appreciation | 15,821,208 | ||
| $ | 490,515,374 | ||
| Net Assets | Shares Outstanding | Net Asset Value Per Share | ||||
| Investor Class, $0.01 Par Value | $92,560,334 | 9,749,485 | $9.49 | |||
| Institutional Class, $0.01 Par Value | $397,955,040 | 41,913,132 | $9.49 | |||
See Notes to Financial Statements.
12
| Statement of Operations |
| YEAR ENDED JUNE 30, 2016 | |||
| Investment Income (Loss) | |||
| Income: | |||
| Dividends | $ | 7,504,879 | |
| Interest | 5,394 | ||
| 7,510,273 | |||
| Expenses: | |||
| Management fees | 3,924,939 | ||
| Directors' fees and expenses | 26,738 | ||
| Other expenses | 1,631 | ||
| 3,953,308 | |||
| Net investment income (loss) | 3,556,965 | ||
| Realized and Unrealized Gain (Loss) | |||
| Net realized gain (loss) on investment transactions | (35,726,607 | ) | |
| Change in net unrealized appreciation (depreciation) on investments | 25,527,203 | ||
| Net realized and unrealized gain (loss) | (10,199,404 | ) | |
| Net Increase (Decrease) in Net Assets Resulting from Operations | $ | (6,642,439 | ) |
See Notes to Financial Statements.
13
| Statement of Changes in Net Assets |
| YEAR ENDED JUNE 30, 2016 AND PERIOD ENDED JUNE 30, 2015 | ||||||
| Increase (Decrease) in Net Assets | June 30, 2016 | June 30, 2015(1) | ||||
| Operations | ||||||
| Net investment income (loss) | $ | 3,556,965 | $ | 898,155 | ||
| Net realized gain (loss) | (35,726,607 | ) | (1,229,851 | ) | ||
| Change in net unrealized appreciation (depreciation) | 25,527,203 | (9,705,995 | ) | |||
| Net increase (decrease) in net assets resulting from operations | (6,642,439 | ) | (10,037,691 | ) | ||
| Distributions to Shareholders | ||||||
| From net investment income: | ||||||
| Investor Class | (654,766 | ) | — | |||
| Institutional Class | (3,605,666 | ) | — | |||
| Decrease in net assets from distributions | (4,260,432 | ) | — | |||
| Capital Share Transactions | ||||||
| Net increase (decrease) in net assets from capital share transactions (Note 5) | 49,846,137 | 461,609,799 | ||||
| Net increase (decrease) in net assets | 38,943,266 | 451,572,108 | ||||
| Net Assets | ||||||
| Beginning of period | 451,572,108 | — | ||||
| End of period | $ | 490,515,374 | $ | 451,572,108 | ||
| Undistributed net investment income | $ | 153,762 | $ | 893,621 | ||
| (1) | March 19, 2015 (fund inception) through June 30, 2015. |
See Notes to Financial Statements.
14
| Notes to Financial Statements |
JUNE 30, 2016
1. Organization
American Century Quantitative Equity Funds, Inc. (the corporation) is registered under the Investment Company Act of 1940, as amended (the 1940 Act), as an open-end management investment company and is organized as a Maryland corporation. NT Disciplined Growth Fund (the fund) is one fund in a series issued by the corporation. The fund’s investment objective is to seek long-term capital growth. The fund is not permitted to invest in securities issued by companies assigned the Global Industry Classification Standard for the tobacco industry.
The fund offers the Investor Class and the Institutional Class, which have different fees and expenses. The difference in the fee structures between the classes is the result of their separate arrangements for shareholder and distribution services, which may be provided indirectly through another American Century Investment mutual fund. As a result, the investment advisor is able to charge the Institutional Class a lower unified management fee. All classes of the fund commenced sale on March 19, 2015, the fund’s inception date.
2. Significant Accounting Policies
The following is a summary of significant accounting policies consistently followed by the fund in preparation of its financial statements. The fund is an investment company and follows accounting and reporting guidance in accordance with accounting principles generally accepted in the United States of America. This may require management to make certain estimates and assumptions at the date of the financial statements. Actual results could differ from these estimates. Management evaluated the impact of events or transactions occurring through the date the financial statements were issued that would merit recognition or disclosure.
Investment Valuations — The fund determines the fair value of its investments and computes its net asset value per share at the close of regular trading (usually 4 p.m. Eastern time) on the New York Stock Exchange (NYSE) on each day the NYSE is open. The Board of Directors has adopted valuation policies and procedures to guide the investment advisor in the fund’s investment valuation process and to provide methodologies for the oversight of the fund’s pricing function.
Equity securities that are listed or traded on a domestic securities exchange are valued at the last reported sales price or at the official closing price as provided by the exchange. Equity securities traded on foreign securities exchanges are generally valued at the closing price of such securities on the exchange where primarily traded or at the close of the NYSE, if that is earlier. If no last sales price is reported, or if local convention or regulation so provides, the mean of the latest bid and asked prices may be used. Securities traded over-the-counter are valued at the mean of the latest bid and asked prices, the last sales price, or the official closing price.
Open-end management investment companies are valued at the reported net asset value per share. Repurchase agreements are valued at cost, which approximates fair value.
If the fund determines that the market price for an investment is not readily available or the valuation methods mentioned above do not reflect an investment’s fair value, such investment is valued as determined in good faith by the Board of Directors or its delegate, in accordance with policies and procedures adopted by the Board of Directors. In its determination of fair value, the fund may review several factors including, but not limited to, market information regarding the specific investment or comparable investments and correlation with other investment types, futures indices or general market indicators. Circumstances that may cause the fund to use these procedures to value an investment include, but are not limited to: an investment has been declared in default or is distressed; trading in a security has been suspended during the trading day or a security is not actively trading on its principal exchange; prices received from a regular pricing source are deemed unreliable; or there is a foreign market holiday and no trading occurred.
The fund monitors for significant events occurring after the close of an investment’s primary exchange but before the fund’s net asset value per share is determined. Significant events may include, but are not limited to: corporate announcements and transactions; governmental action and political unrest that could impact a specific investment or an investment sector; or armed conflicts, natural disasters and similar events that could
15
affect investments in a specific country or region. The fund also monitors for significant fluctuations between domestic and foreign markets, as evidenced by the U.S. market or such other indicators that the Board of Directors, or its delegate, deems appropriate. If significant fluctuations in foreign markets are identified, the fund may apply a model-derived factor to the closing price of equity securities traded on foreign securities exchanges. The factor is based on observable market data as provided by an independent pricing service.
Security Transactions — Security transactions are accounted for as of the trade date. Net realized gains and losses are determined on the identified cost basis, which is also used for federal income tax purposes.
Investment Income — Dividend income less foreign taxes withheld, if any, is recorded as of the ex-dividend date. Distributions received on securities that represent a return of capital or long-term capital gain are recorded as a reduction of cost of investments and/or as a realized gain. The fund may estimate the components of distributions received that may be considered nontaxable distributions or long-term capital gain distributions for income tax purposes. Interest income is recorded on the accrual basis and includes accretion of discounts and amortization of premiums.
Repurchase Agreements — The fund may enter into repurchase agreements with institutions that American Century Investment Management, Inc. (ACIM) (the investment advisor) has determined are creditworthy pursuant to criteria adopted by the Board of Directors. The fund requires that the collateral, represented by securities, received in a repurchase transaction be transferred to the custodian in a manner sufficient to enable the fund to obtain those securities in the event of a default under the repurchase agreement. ACIM monitors, on a daily basis, the securities transferred to ensure the value, including accrued interest, of the securities under each repurchase agreement is equal to or greater than amounts owed to the fund under each repurchase agreement.
Joint Trading Account — Pursuant to an Exemptive Order issued by the Securities and Exchange Commission, the fund, along with certain other funds in the American Century Investments family of funds, may transfer uninvested cash balances into a joint trading account. These balances are invested in one or more repurchase agreements that are collateralized by U.S. Treasury or Agency obligations.
Income Tax Status — It is the fund’s policy to distribute substantially all net investment income and net realized gains to shareholders and to otherwise qualify as a regulated investment company under provisions of the Internal Revenue Code. Accordingly, no provision has been made for income taxes. The fund files U.S. federal, state, local and non-U.S. tax returns as applicable. The fund's tax returns are subject to examination by the relevant taxing authority until expiration of the applicable statute of limitations, which is generally three years from the date of filing but can be longer in certain jurisdictions. At this time, management believes there are no uncertain tax positions which, based on their technical merit, would not be sustained upon examination and for which it is reasonably possible that the total amounts of unrecognized tax benefits will significantly change in the next twelve months.
Multiple Class — All shares of the fund represent an equal pro rata interest in the net assets of the class to which such shares belong, and have identical voting, dividend, liquidation and other rights and the same terms and conditions, except for class specific expenses and exclusive rights to vote on matters affecting only individual classes. Income, non-class specific expenses, and realized and unrealized capital gains and losses of the fund are allocated to each class of shares based on their relative net assets.
Distributions to Shareholders — Distributions from net investment income, if any, are generally declared and paid semiannually. Distributions from net realized gains, if any, are generally declared and paid annually.
Indemnifications — Under the corporation’s organizational documents, its officers and directors are indemnified against certain liabilities arising out of the performance of their duties to the fund. In addition, in the normal course of business, the fund enters into contracts that provide general indemnifications. The maximum exposure under these arrangements is unknown as this would involve future claims that may be made against a fund. The risk of material loss from such claims is considered by management to be remote.
3. Fees and Transactions with Related Parties
Certain officers and directors of the corporation are also officers and/or directors of American Century Companies, Inc. (ACC). The corporation’s investment advisor, ACIM, the corporation's distributor, American Century Investment Services, Inc., and the corporation’s transfer agent, American Century Services, LLC, are wholly owned, directly or indirectly, by ACC. Various funds issued by American Century Asset Allocation Portfolios, Inc. own, in aggregate, 100% of the shares of the fund. Related parties do not invest in the fund for the purpose of exercising management or control.
16
Management Fees — The corporation has entered into a management agreement with ACIM, under which ACIM provides the fund with investment advisory and management services in exchange for a single, unified management fee (the fee) per class. The agreement provides that all expenses of managing and operating the fund, except distribution and service fees, brokerage expenses, taxes, interest, fees and expenses of the independent directors (including legal counsel fees), and extraordinary expenses, will be paid by ACIM. The fee is computed and accrued daily based on each class’s daily net assets and paid monthly in arrears. The fee consists of (1) an Investment Category Fee based on the daily net assets of the fund and certain other accounts managed by the investment advisor that are in the same broad investment category as the fund and (2) a Complex Fee based on the assets of all the funds in the American Century Investments family of funds. The rates for the Investment Category Fee range from 0.6880% to 0.8700%. The rates for the Complex Fee range from 0.2500% to 0.3100% for the Investor Class and 0.0500% to 0.1100% for the Institutional Class. The effective annual management fee for each class for the year ended June 30, 2016 was 1.01% for the Investor Class and 0.81% for the Institutional Class.
Directors' Fees and Expenses — The Board of Directors is responsible for overseeing the investment advisor’s management and operations of the fund. The directors receive detailed information about the fund and its investment advisor regularly throughout the year, and meet at least quarterly with management of the investment advisor to review reports about fund operations. The fund’s officers do not receive compensation from the fund.
Interfund Transactions — The fund may enter into security transactions with other American Century Investments funds and other client accounts of the investment advisor, in accordance with the 1940 Act rules and procedures adopted by the Board of Directors. The rules and procedures require, among other things, that these transactions be effected at the independent current market price of the security. During the period, the interfund purchases and sales were $8,512,991 and $6,609,099, respectively.
4. Investment Transactions
Purchases and sales of investment securities, excluding short-term investments, for the year ended June 30, 2016 were $584,680,904 and $535,952,482, respectively.
5. Capital Share Transactions
Transactions in shares of the fund were as follows:
| Year ended June 30, 2016 | Period ended June 30, 2015(1) | |||||||||
| Shares | Amount | Shares | Amount | |||||||
| Investor Class/Shares Authorized | 90,000,000 | 90,000,000 | ||||||||
| Sold | 126,434 | $ | 1,196,322 | 9,760,412 | $ | 97,603,873 | ||||
| Issued in reinvestment of distributions | 68,521 | 654,766 | — | — | ||||||
| Redeemed | (113,359 | ) | (1,108,480 | ) | (92,523 | ) | (921,053 | ) | ||
| 81,596 | 742,608 | 9,667,889 | 96,682,820 | |||||||
| Institutional Class/Shares Authorized | 240,000,000 | 240,000,000 | ||||||||
| Sold | 6,617,974 | 60,796,931 | 36,954,067 | 369,151,500 | ||||||
| Issued in reinvestment of distributions | 377,479 | 3,605,666 | — | — | ||||||
| Redeemed | (1,612,154 | ) | (15,299,068 | ) | (424,234 | ) | (4,224,521 | ) | ||
| 5,383,299 | 49,103,529 | 36,529,833 | 364,926,979 | |||||||
| Net increase (decrease) | 5,464,895 | $ | 49,846,137 | 46,197,722 | $ | 461,609,799 | ||||
| (1) | March 19, 2015 (fund inception) through June 30, 2015. |
6. Fair Value Measurements
The fund’s investments valuation process is based on several considerations and may use multiple inputs to determine the fair value of the investments held by the fund. In conformity with accounting principles generally accepted in the United States of America, the inputs used to determine a valuation are classified into three broad levels.
17
| • | Level 1 valuation inputs consist of unadjusted quoted prices in an active market for identical investments. |
| • | Level 2 valuation inputs consist of direct or indirect observable market data (including quoted prices for comparable investments, evaluations of subsequent market events, interest rates, prepayment speeds, credit risk, etc.). These inputs also consist of quoted prices for identical investments initially expressed in local currencies that are adjusted through translation into U.S. dollars. |
| • | Level 3 valuation inputs consist of unobservable data (including a fund’s own assumptions). |
The level classification is based on the lowest level input that is significant to the fair valuation measurement. The valuation inputs are not necessarily an indication of the risks associated with investing in these securities or other financial instruments. There were no significant transfers between levels during the period.
The following is a summary of the level classifications as of period end. The Schedule of Investments provides additional information on the fund’s portfolio holdings.
| Level 1 | Level 2 | Level 3 | ||||||
| Assets | ||||||||
| Investment Securities | ||||||||
| Common Stocks | $ | 485,612,594 | — | — | ||||
| Temporary Cash Investments | 3,966 | $ | 5,156,000 | — | ||||
| $ | 485,616,560 | $ | 5,156,000 | — | ||||
7. Risk Factors
The fund’s investment process may result in high portfolio turnover, which could mean high transaction costs, affecting both performance and capital gains tax liabilities to investors.
8. Federal Tax Information
The tax character of distributions paid during the year ended June 30, 2016 and the period March 19, 2015 (fund inception) through June 30, 2015 were as follows:
| 2016 | 2015 | ||||
| Distributions Paid From | |||||
| Ordinary income | $ | 4,260,432 | — | ||
| Long-term capital gains | — | — | |||
The book-basis character of distributions made during the year from net investment income or net realized gains may differ from their ultimate characterization for federal income tax purposes. These differences reflect the differing character of certain income items and net realized gains and losses for financial statement and tax purposes, and may result in reclassification among certain capital accounts on the financial statements.
As of June 30, 2016, the federal tax cost of investments and the components of distributable earnings on a tax-basis were as follows:
| Federal tax cost of investments | $ | 476,408,292 | |
| Gross tax appreciation of investments | $ | 36,505,805 | |
| Gross tax depreciation of investments | (22,141,537 | ) | |
| Net tax appreciation (depreciation) of investments | $ | 14,364,268 | |
| Undistributed ordinary income | $ | 153,762 | |
| Accumulated short-term capital losses | $ | (35,458,592 | ) |
The difference between book-basis and tax-basis unrealized appreciation (depreciation) is attributable primarily to the tax deferral of losses on wash sales.
Accumulated capital losses represent net capital loss carryovers that may be used to offset future realized capital gains for federal income tax purposes. The capital loss carryovers may be carried forward for an unlimited period. Future capital loss carryover utilization in any given year may be subject to Internal Revenue Code limitations.
18
| Financial Highlights |
| For a Share Outstanding Throughout the Years Ended June 30 (except as noted) | |||||||||||||
| Per-Share Data | Ratios and Supplemental Data | ||||||||||||
| Income From Investment Operations: | Ratio to Average Net Assets of: | ||||||||||||
Net Asset Value, Beginning of Period | Net Investment Income (Loss)(1) | Net Realized and Unrealized Gain (Loss) | Total From Investment Operations | Distributions From Net Investment Income | Net Asset Value, End of Period | Total Return(2) | Operating Expenses | Net Investment Income (Loss) | Portfolio Turnover Rate | Net Assets, End of Period (in thousands) | |||
| Investor Class | |||||||||||||
| 2016 | $9.77 | 0.06 | (0.27) | (0.21) | (0.07) | $9.49 | (2.18)% | 1.02% | 0.62% | 118% | $92,560 | ||
2015(3) | $10.00 | 0.02 | (0.25) | (0.23) | — | $9.77 | (2.30)% | 1.01%(4) | 0.55%(4) | 29% | $94,459 | ||
| Institutional Class | |||||||||||||
| 2016 | $9.78 | 0.08 | (0.28) | (0.20) | (0.09) | $9.49 | (2.03)% | 0.82% | 0.82% | 118% | $397,955 | ||
2015(3) | $10.00 | 0.02 | (0.24) | (0.22) | — | $9.78 | (2.20)% | 0.81%(4) | 0.75%(4) | 29% | $357,113 | ||
| Notes to Financial Highlights |
| (1) | Computed using average shares outstanding throughout the period. |
| (2) | Total returns are calculated based on the net asset value of the last business day. Total returns for periods less than one year are not annualized. |
| (3) | March 19, 2015 (fund inception) through June 30, 2015. |
| (4) | Annualized. |
See Notes to Financial Statements.
| Report of Independent Registered Public Accounting Firm |
To the Directors of the American Century Quantitative Equity Funds, Inc. and Shareholders of the NT Disciplined Growth Fund:
In our opinion, the accompanying statement of assets and liabilities, including the schedule of investments, and the related statements of operations and of changes in net assets and the financial highlights present fairly, in all material respects, the financial position of the NT Disciplined Growth Fund (one of the sixteen funds comprising the American Century Quantitative Equity Funds, Inc., hereafter referred to as the “Fund”) at June 30, 2016, the results of its operations for the year then ended, and the changes in its net assets and the financial highlights for the year then ended and for the period March 19, 2015 through June 30, 2015, in conformity with accounting principles generally accepted in the United States of America. These financial statements and financial highlights (hereafter referred to as "financial statements") are the responsibility of the Fund's management. Our responsibility is to express an opinion on these financial statements based on our audits. We conducted our audits of these financial statements in accordance with the standards of the Public Company Accounting Oversight Board (United States). Those standards require that we plan and perform the audit to obtain reasonable assurance about whether the financial statements are free of material misstatement. An audit includes examining, on a test basis, evidence supporting the amounts and disclosures in the financial statements, assessing the accounting principles used and significant estimates made by management, and evaluating the overall financial statement presentation. We believe that our audits, which included confirmation of securities at June 30, 2016 by correspondence with the custodian and brokers, provide a reasonable basis for our opinion.
PricewaterhouseCoopers LLP
Kansas City, Missouri
August 17, 2016
20
| Management |
Board of Directors
The individuals listed below serve as directors of the funds. Each director will continue to serve in this capacity until death, retirement, resignation or removal from office. The board has adopted a mandatory retirement age for directors who are not “interested persons,” as that term is defined in the Investment Company Act (independent directors). Independent directors shall retire on December 31 of the year in which they reach their 75th birthday; provided, however, that on or after January 1, 2022, independent directors shall retire on December 31 of the year in which they reach their 76th birthday.
Mr. Thomas is an “interested person” because he currently serves as President and Chief Executive Officer of American Century Companies, Inc. (ACC), the parent company of American Century Investment Management, Inc. (ACIM or the advisor). The other directors (more than three-fourths of the total number) are independent. They are not employees, directors or officers of, and have no financial interest in, ACC or any of its wholly owned, direct or indirect, subsidiaries, including ACIM, American Century Investment Services, Inc. (ACIS) and American Century Services, LLC (ACS), and they do not have any other affiliations, positions or relationships that would cause them to be considered “interested persons” under the Investment Company Act. The directors serve in this capacity for eight (in the case of Mr. Thomas, 15) registered investment companies in the American Century Investments family of funds.
The following table presents additional information about the directors. The mailing address for each director other than Mr. Thomas is 1665 Charleston Road, Mountain View, California 94043. The mailing address for Mr. Thomas is 4500 Main Street, Kansas City, Missouri 64111.
Name (Year of Birth) | Position(s) Held with Funds | Length of Time Served | Principal Occupation(s) During Past 5 Years | Number of American Century Portfolios Overseen by Director | Other Directorships Held During Past 5 Years |
| Independent Directors | |||||
| Tanya S. Beder (1955) | Director | Since 2011 | Chairman and CEO, SBCC Group Inc. (independent advisory services) (2006 to present) | 45 | CYS Investments, Inc. (NYSE mortgage arbitrage REIT) |
| Jeremy I. Bulow (1954) | Director | Since 2011 | Professor of Economics, Stanford University, Graduate School of Business (1979 to present) | 45 | None |
| Anne Casscells (1958) | Director | Since 2016 | Co-Chief Executive Officer and Chief Investment Officer, Aetos Alternatives Management (investment advisory firm) (2001 to present); Lecturer in Accounting, Stanford University, Graduate School of Business (2009 to present) | 45 | None |
21
Name (Year of Birth) | Position(s) Held with Funds | Length of Time Served | Principal Occupation(s) During Past 5 Years | Number of American Century Portfolios Overseen by Director | Other Directorships Held During Past 5 Years |
| Independent Directors | |||||
| Ronald J. Gilson (1946) | Director and Chairman of the Board | Since 1995 (Chairman since 2005) | Charles J. Meyers Professor of Law and Business, Emeritus, Stanford Law School (1979 to present); Marc and Eva Stern Professor of Law and Business, Columbia University School of Law (1992 to present) | 45 | None |
| Frederick L. A. Grauer (1946) | Director | Since 2008 | Senior Advisor, iShares by BlackRock, Inc. (investment management firm) (2010 to 2011, 2013 to present); Senior Advisor, Course Hero (an educational technology company) (2015 to present) | 45 | None |
| Jonathan D. Levin (1972) | Director | Since 2016 | Holbrook Working Professor of Price Theory, Stanford University, (2000 to present); Chair, Department of Economics, Stanford University (2011 to 2014) | 45 | None |
| Peter F. Pervere (1947) | Director | Since 2007 | Retired | 45 | None |
| John B. Shoven (1947) | Director | Since 2002 | Charles R. Schwab Professor of Economics, Stanford University (1973 to present) | 45 | Cadence Design Systems; Exponent; Financial Engines |
| Interested Director | |||||
| Jonathan S. Thomas (1963) | Director and President | Since 2007 | President and Chief Executive Officer, ACC (March 2007 to present). Also serves as Chief Executive Officer, ACS; Executive Vice President, ACIM; Director, ACC, ACIM and other ACC subsidiaries | 128 | BioMed Valley Discoveries, Inc. |
The Statement of Additional Information has additional information about the fund's directors and is available without charge, upon request, by calling 1-800-345-2021.
22
Officers
The following table presents certain information about the executive officers of the funds. Each officer serves as an officer for each of the 15 investment companies in the American Century family of funds, unless otherwise noted. No officer is compensated for his or her service as an officer of the funds. The listed officers are interested persons of the funds and are appointed or re-appointed on an annual basis. The mailing address for each of the officers listed below is 4500 Main Street, Kansas City, Missouri 64111.
Name (Year of Birth) | Offices with the Funds | Principal Occupation(s) During the Past Five Years |
| Jonathan S. Thomas (1963) | Director and President since 2007 | President and Chief Executive Officer, ACC (March 2007 to present). Also serves as Chief Executive Officer, ACS; Executive Vice President, ACIM; Director, ACC, ACIM and other ACC subsidiaries |
| Amy D. Shelton (1964) | Chief Compliance Officer and Vice President since 2014 | Chief Compliance Officer, American Century funds, (March 2014 to present); Chief Compliance Officer, ACIM (February 2014 to present); Chief Compliance Officer, ACIS (October 2009 to present); Vice President, Client Interactions and Marketing, ACIS (February 2013 to January 2014); Director, Client Interactions and Marketing, ACIS (June 2007 to January 2013). Also serves as Vice President, ACIS |
| Charles A. Etherington (1957) | General Counsel since 2007 and Senior Vice President since 2006 | Attorney, ACC (February 1994 to present); Vice President, ACC (November 2005 to present); General Counsel, ACC (March 2007 to present). Also serves as General Counsel, ACIM, ACS, ACIS and other ACC subsidiaries; and Senior Vice President, ACIM and ACS |
| C. Jean Wade (1964) | Vice President, Treasurer and Chief Financial Officer since 2012 | Vice President, ACS (February 2000 to present) |
| Robert J. Leach (1966) | Vice President since 2006 and Assistant Treasurer since 2012 | Vice President, ACS (February 2000 to present) |
| David H. Reinmiller (1963) | Vice President since 2001 | Attorney, ACC (January 1994 to present); Associate General Counsel, ACC (January 2001 to present). Also serves as Vice President, ACIM and ACS |
| Ward D. Stauffer (1960) | Secretary since 2005 | Attorney, ACC (June 2003 to present) |
23
| Approval of Management Agreement |
At a meeting held on June 14, 2016, the Fund’s Board of Directors (the "Board") unanimously approved the renewal of the management agreement pursuant to which American Century Investment Management, Inc. (the “Advisor”) acts as the investment advisor for the Fund. Under Section 15(c) of the Investment Company Act, contracts for investment advisory services are required to be reviewed, evaluated, and approved by a majority of a fund’s directors/trustees, including a majority of the independent Directors, each year. The Board regards this annual evaluation and renewal as one of its most important responsibilities.
The independent Directors have memorialized a statement regarding the relationship between their ongoing obligations to oversee and evaluate the performance of the Advisor and their annual consideration of renewal of the management agreement. In that statement, the independent Directors noted that their assessment of the Advisor’s performance is an ongoing process that takes place over the entire year and is informed by all of the extensive information that the Board and its committees receive and consider over time. This information, together with the additional materials provided specifically in connection with the review, are central to the Board’s assessment of the Advisor’s performance and its determination whether to renew the Fund’s management agreement.
Prior to its consideration of the renewal of the management agreement, the Board requested and reviewed extensive data and analysis relating to the proposed renewal. This information and analysis was compiled by the Advisor and certain independent providers of evaluation data concerning the Fund and the services provided to the Fund by the Advisor.
In connection with its consideration of the renewal of the management agreement, the Board’s review and evaluation of the services provided by the Advisor included, but was not limited to, the following:
| • | the nature, extent, and quality of investment management, shareholder services, and other services provided by the Advisor to the Fund; |
| • | the wide range of other programs and services the Advisor provides to the Fund and its shareholders on a routine and non-routine basis; |
| • | the investment performance of the Fund, including data comparing the Fund’s performance to appropriate benchmarks and/or a peer group of other mutual funds with similar investment objectives and strategies; |
| • | the cost of owning the Fund compared to the cost of owning similar funds; |
| • | the Advisor’s compliance policies, procedures, and regulatory experience; |
| • | financial data showing the cost of services provided to the Fund, the profitability of the Fund to the Advisor, and the overall profitability of the Advisor; |
| • | possible economies of scale associated with the Advisor’s management of the Fund and other accounts under its management; |
| • | data comparing services provided and charges to other investment management clients of the Advisor; |
| • | acquired fund fees and expenses; |
| • | payments by the Fund and the Advisor to financial intermediaries whose clients are investors in the Fund; and |
| • | any collateral benefits derived by the Advisor from the management of the Fund. |
In keeping with its practice, the Board held two in-person meetings to review and discuss the information provided in response to their request. The independent Directors also had the benefit of the advice of their independent counsel throughout the process.
24
Factors Considered
The Directors considered all of the information provided by the Advisor, the independent data providers, and the independent Directors’ independent counsel in connection with the approval. They determined that the information was sufficient for them to evaluate the management agreement for the Fund. In connection with their review, the Directors did not identify any single factor as being all-important or controlling and each Director may have attributed different levels of importance to different factors. In deciding to renew the management agreement, the Board based its decision on a number of factors, including the following:
Nature, Extent and Quality of Services - Generally. Under the management agreement, the Advisor is responsible for providing or arranging for all services necessary for the operation of the Fund. The Board noted that under the management agreement, the Advisor provides or arranges at its own expense a wide variety of services including:
| • | constructing and designing the Fund |
| • | portfolio research and security selection |
| • | initial capitalization/funding |
| • | securities trading |
| • | Fund administration |
| • | custody of Fund assets |
| • | daily valuation of the Fund’s portfolio |
| • | shareholder servicing and transfer agency, including shareholder confirmations, recordkeeping, and communications |
| • | legal services (except the independent Directors’ counsel) |
| • | regulatory and portfolio compliance |
| • | financial reporting |
| • | marketing and distribution (except amounts paid by the Fund under Rule 12b-1 plans) |
The Board noted that many of these services have expanded over time in terms of both quantity and complexity in response to shareholder demands, competition in the industry, changing distribution channels, and the changing regulatory environment.
Investment Management, Shareholder, and Other Services. The nature of the investment management services provided to the Fund is quite complex and allows Fund shareholders access to professional money management, instant diversification of their investments within an asset class, the opportunity to easily diversify among asset classes by investing in or exchanging among various American Century Investments funds, and liquidity. In evaluating investment performance, the Board expects the Advisor to manage the Fund in accordance with its investment objectives and approved strategies. Further, the Directors recognize that the Advisor has an obligation to seek the best execution of fund trades. In providing these services, the Advisor utilizes teams of investment professionals (portfolio managers, analysts, research assistants, and securities traders) who require extensive information technology, research, training, compliance, and other systems to conduct their business. The Board, directly and through its Portfolio Committee, regularly reviews investment performance information for the Fund, together with comparative information for appropriate benchmarks and/or peer groups of similarly-managed funds, over different time horizons. The Directors also review detailed performance information during the management agreement approval process. If performance concerns are identified, the Fund receives special reviews until performance improves, during which the Board discusses with the Advisor the reasons for such results (e.g., market conditions, security selection) and any efforts being undertaken to improve performance. The Fund has less than one year of performance history. The Board, directly and through its Portfolio Committee, regularly reviews the investment management services of the Advisor. The Board found the investment management services provided by the Advisor to the Fund to be satisfactory and consistent with the management agreement.
25
Under the management agreement, the Advisor provides the Fund with a comprehensive package of transfer agency, shareholder, and other services. The Board, directly and through various committees of the Board, regularly reviews reports and evaluations of such services at its regular meetings. These reports include, but are not limited to, information regarding the operational efficiency and accuracy of the shareholder and transfer agency services provided, staffing levels, shareholder satisfaction (as measured by external as well as internal sources), technology support, new products and services offered to Fund shareholders, securities trading activities, portfolio valuation services, auditing services, and legal and operational compliance activities. Certain aspects of shareholder and transfer agency service level efficiency and the quality of securities trading activities are measured by independent third party providers and are presented in comparison to other fund groups not managed by the Advisor.
The Board found the services provided by the Advisor to the Fund under the management agreement to be competitive and of high quality.
Costs of Services and Profitability. The Advisor provides detailed information concerning its cost of providing various services to the Fund, its profitability in managing the Fund, its overall profitability, and its financial condition. The Directors have reviewed with the Advisor the methodology used to prepare this financial information. This information is considered in evaluating the Advisor’s financial condition, its ability to continue to provide services under the management agreement, and the reasonableness of the current management fee. The Board concluded that the Advisor’s profits were reasonable in light of the services provided to the Fund.
Economies of Scale. The Board also reviewed information provided by the Advisor regarding the possible existence of economies of scale in connection with the management of the Fund. The Board concluded that economies of scale are difficult to measure and predict with precision, especially on a fund-by-fund basis. The Board concluded that the Advisor is appropriately sharing economies of scale through its competitive fee structure, offering competitive fees from fund inception, and through reinvestment in its business to provide shareholders enhanced and expanded services.
Comparison to Other Funds’ Fees. The management agreement provides that the Fund pays the Advisor a single, all-inclusive (or unified) management fee for providing all services necessary for the management and operation of the Fund, other than brokerage expenses, expenses attributable to short sales, taxes, interest, extraordinary expenses, the fees and expenses of the Fund’s independent Directors (including their independent legal counsel), and expenses incurred in connection with the provision of shareholder services and distribution services under a plan adopted pursuant to Rule 12b-1 under the 1940 Act. Under the unified fee structure, the Advisor is responsible for providing all investment advisory, custody, audit, administrative, compliance, recordkeeping, marketing, and shareholder services, or arranging and supervising third parties to provide such services. By contrast, most other funds are charged a variety of fees, including an investment advisory fee, a transfer agency fee, an administrative fee, distribution charges, and other expenses. Other than their investment advisory fees and any applicable Rule 12b-1 fees, all other components of the total fees charged by these other funds may be increased without shareholder approval. The Board believes the unified fee structure is a benefit to Fund shareholders because it clearly discloses to shareholders the cost of owning Fund shares, and, since the unified fee cannot be increased without a vote of Fund shareholders, it shifts to the Advisor the risk of increased costs of operating the Fund and provides a direct incentive to minimize administrative inefficiencies. Part of the Board’s analysis of fee levels involves reviewing certain evaluative data compiled by an independent provider and comparing the Fund’s unified fee to the total expense ratio of peer funds. The unified fee charged to shareholders of the Fund was at the median of the total expense ratios of the Fund’s peer group. The Board concluded that the management fee paid by the Fund to the Advisor under the management agreement is reasonable in light of the services provided to the Fund.
26
Comparison to Fees and Services Provided to Other Clients of the Advisor. The Board also requested and received information from the Advisor concerning the nature of the services, fees, costs, and profitability of its advisory services to advisory clients other than the Fund. They observed that these varying types of client accounts require different services and involve different regulatory and entrepreneurial risks than the management of the Fund. The Board analyzed this information and concluded that the fees charged and services provided to the Fund were reasonable by comparison.
Payments to Intermediaries. The Directors also requested and received a description of payments made to intermediaries by the Fund and the Advisor. These payments include various payments made by the Fund or the Advisor to different types of intermediaries and recordkeepers for distribution and service activities provided for the Fund.
Collateral or “Fall-Out” Benefits Derived by the Advisor. The Board considered the existence of collateral benefits the Advisor may receive as a result of its relationship with the Fund. The Board noted that the Advisor’s primary business is managing mutual funds and it generally does not use fund or shareholder information to generate profits in other lines of business, and therefore does not derive any significant collateral benefits from them. The Board noted that the Advisor receives proprietary research from broker-dealers that execute fund portfolio transactions. The Board also determined that the Advisor is able to provide investment management services to certain clients other than the Fund, at least in part, due to its existing infrastructure built to serve the fund complex. The Board concluded, however, that the assets of those other clients are not material to the analysis and, where applicable, may be included with the assets of the Fund to determine breakpoints in the management fee schedule.
Existing Relationship. The Board also considered whether there was any reason for not continuing the existing arrangement with the Advisor. In this regard, the Board was mindful of the potential disruptions of the Fund’s operations and various risks, uncertainties, and other effects that could occur as a result of a decision not to continue such relationship. In particular, the Board recognized that most shareholders have invested in the Fund on the strength of the Advisor’s industry standing and reputation and in the expectation that the Advisor will have a continuing role in providing advisory services to the Fund.
Conclusion of the Directors. As a result of this process, the Board, including all of the independent Directors and assisted by the advice of independent legal counsel, taking into account all of the factors discussed above and the information provided by the Advisor and others in connection with its review and throughout the year, concluded that the management agreement between the Fund and the Advisor is fair and reasonable in light of the services provided and should be renewed.
27
| Proxy Voting Results |
A special meeting of shareholders was held on June 13, 2016, to vote on the following proposal. The proposal received the required number of votes and was adopted. A summary of voting results is listed below.
To elect four directors to the Board of Directors of American Century Quantitative Equity Funds, Inc.:
| Affirmative | Withhold | ||||||
| Tanya S. Beder | $ | 8,473,153,264 | $ | 121,459,590 | |||
| Jeremy I. Bulow | $ | 8,469,793,581 | $ | 124,819,273 | |||
| Anne Casscells | $ | 8,465,895,232 | $ | 128,717,622 | |||
| Jonathan D. Levin | $ | 8,468,929,867 | $ | 125,682,987 | |||
The other directors whose term of office continued after the meeting include Jonathan S. Thomas, Ronald J. Gilson, Frederick L. A. Grauer, Peter F. Pervere and John B. Shoven.
28
| Additional Information |
Retirement Account Information
As required by law, distributions you receive from certain IRAs are subject to federal income tax withholding, unless you elect not to have withholding apply. Tax will be withheld on the total amount withdrawn even though you may be receiving amounts that are not subject to withholding, such as nondeductible contributions. In such case, excess amounts of withholding could occur. You may adjust your withholding election so that a greater or lesser amount will be withheld.
If you don’t want us to withhold on this amount, you must notify us to not withhold the federal income tax. You may notify us in writing or in certain situations by telephone or through other electronic means. For systematic withdrawals, your withholding election will remain in effect until revoked or changed by filing a new election. You have the right to revoke your election at any time.
Remember, even if you elect not to have income tax withheld, you are liable for paying income tax on the taxable portion of your withdrawal. If you elect not to have income tax withheld or you don’t have enough income tax withheld, you may be responsible for payment of estimated tax. You may incur penalties under the estimated tax rules if your withholding and estimated tax payments are not sufficient. You can reduce or defer the income tax on a distribution by directly or indirectly rolling such distribution over to another IRA or eligible plan. You should consult your tax advisor for additional information.
State tax will be withheld if, at the time of your distribution, your address is within one of the mandatory withholding states and you have federal income tax withheld (or as otherwise required by state law). State taxes will be withheld from your distribution in accordance with the respective state rules.
Distributions you receive from 403(b), 457 and qualified plans are subject to special tax and withholding rules. Your plan administrator or plan sponsor is required to provide you with a special tax notice explaining those rules at the time you request a distribution. If applicable, federal and/or state taxes may be withheld from your distribution amount.
Proxy Voting Policies
Descriptions of the principles and policies that the fund's investment advisor uses in exercising the voting rights associated with the securities purchased and/or held by the fund are available without charge, upon request, by calling 1-800-345-2021 or visiting the "About Us" page of American Century Investments’ website at americancentury.com. A description of the policies is also available on the Securities and Exchange Commission’s website at sec.gov. Information regarding how the investment advisor voted proxies relating to portfolio securities during the most recent 12-month period ended June 30 is available on the "About Us" page at americancentury.com. It is also available at sec.gov.
Quarterly Portfolio Disclosure
The fund files its complete schedule of portfolio holdings with the Securities and Exchange Commission (SEC) for the first and third quarters of each fiscal year on Form N-Q. The fund’s Forms N-Q are available on the SEC’s website at sec.gov, and may be reviewed and copied at the SEC’s Public Reference Room in Washington, DC. Information on the operation of the Public Reference Room may be obtained by calling 1-800-SEC-0330. The fund also makes its complete schedule of portfolio holdings for the most recent quarter of its fiscal year available on its website at americancentury.com and, upon request, by calling 1-800-345-2021.
29
Other Tax Information
The following information is provided pursuant to provisions of the Internal Revenue Code.
The fund hereby designates up to the maximum amount allowable as qualified dividend income for the fiscal year ended June 30, 2016.
For corporate taxpayers, the fund hereby designates $4,260,432, or up to the maximum amount allowable, of ordinary income distributions paid during the fiscal year ended June 30, 2016 as qualified for the corporate dividends received deduction.
30
| Notes |
31
| Notes |
32
| ||
| Contact Us | americancentury.com | |
| Automated Information Line | 1-800-345-8765 | |
| Investor Services Representative | 1-800-345-2021 or 816-531-5575 | |
| Investors Using Advisors | 1-800-378-9878 | |
| Business, Not-For-Profit, Employer-Sponsored Retirement Plans | 1-800-345-3533 | |
| Banks and Trust Companies, Broker-Dealers, Financial Professionals, Insurance Companies | 1-800-345-6488 | |
| Telecommunications Relay Service for the Deaf | 711 | |
| American Century Quantitative Equity Funds, Inc. | ||
Investment Advisor: American Century Investment Management, Inc. Kansas City, Missouri | ||
| This report and the statements it contains are submitted for the general information of our shareholders. The report is not authorized for distribution to prospective investors unless preceded or accompanied by an effective prospectus. | ||
| ©2016 American Century Proprietary Holdings, Inc. All rights reserved. CL-ANN-89964 1608 | ||
| Annual Report | |
| June 30, 2016 | |
| NT Equity Growth Fund | |
| Table of Contents |
| Performance | 2 | |
| Portfolio Commentary | ||
| Fund Characteristics | ||
| Shareholder Fee Example | ||
| Schedule of Investments | ||
| Statement of Assets and Liabilities | ||
| Statement of Operations | ||
| Statement of Changes in Net Assets | ||
| Notes to Financial Statements | ||
| Financial Highlights | ||
| Report of Independent Registered Public Accounting Firm | ||
| Management | ||
| Approval of Management Agreement | ||
| Proxy Voting Results | ||
| Additional Information | ||
Any opinions expressed in this report reflect those of the author as of the date of the report, and do not necessarily represent the opinions of American Century Investments® or any other person in the American Century Investments organization. Any such opinions are subject to change at any time based upon market or other conditions and American Century Investments disclaims any responsibility to update such opinions. These opinions may not be relied upon as investment advice and, because investment decisions made by American Century Investments funds are based on numerous factors, may not be relied upon as an indication of trading intent on behalf of any American Century Investments fund. Security examples are used for representational purposes only and are not intended as recommendations to purchase or sell securities. Performance information for comparative indices and securities is provided to American Century Investments by third party vendors. To the best of American Century Investments’ knowledge, such information is accurate at the time of printing.
| Performance |
| Total Returns as of June 30, 2016 | |||||
| Average Annual Returns | |||||
Ticker Symbol | 1 year | 5 years | 10 years | Inception Date | |
| Institutional Class | ACLEX | -2.65% | 10.62% | 6.40% | 5/12/06 |
| S&P 500 Index | — | 3.99% | 12.09% | 7.42% | — |
| Growth of $10,000 Over 10 Years |
| $10,000 investment made June 30, 2006 |
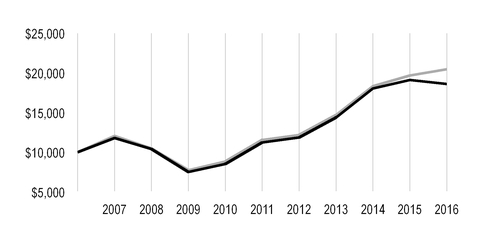
| Value on June 30, 2016 | |
| Institutional Class — $18,611 | |
| S&P 500 Index — $20,465 | |
| Total Annual Fund Operating Expenses | |
| Institutional Class | 0.47% |
The total annual fund operating expenses shown is as stated in the fund’s prospectus current as of the date of this report. The prospectus may vary from the expense ratio shown elsewhere in this report because it is based on a different time period, includes acquired fund fees and expenses, and, if applicable, does not include fee waivers or expense reimbursements.
Data presented reflect past performance. Past performance is no guarantee of future results. Current performance may be higher or lower than the performance shown. Total returns for periods less than one year are not annualized. Investment return and principal value will fluctuate, and redemption value may be more or less than original cost. Data assumes reinvestment of dividends and capital gains, and none of the charts reflect the deduction of taxes that a shareholder would pay on fund distributions or the redemption of fund shares. To obtain performance data current to the most recent month end, please call 1-800-345-2021 or visit americancentury.com. For additional information about the fund, please consult the prospectus.
2
| Portfolio Commentary |
Portfolio Manager: Claudia Musat
In May 2016, portfolio manager Bill Martin left the fund's management team.
Performance Summary
NT Equity Growth returned -2.65% for the fiscal year ended June 30, 2016, compared with the 3.99% return of its benchmark, the S&P 500 Index.
NT Equity Growth declined during the fiscal year, underperforming its benchmark, the S&P 500 Index. Security selection in the industrials, consumer discretionary, and financials sectors led fund detraction, while materials sector holdings contributed to relative performance.
NT Equity Growth’s stock selection process incorporates factors of valuation, quality, growth, and sentiment while striving to minimize unintended risks along industries and other risk characteristics. Within the fund, valuation factors were detrimental to selection results, while quality- and sentiment-based insights were somewhat positive. Growth was largely neutral.
Stock Choices Across Several Sectors Hindered Relative Returns
A number of industrials sector holdings pressured the fund’s 12-month results, although no individual position was a leading underperformer. Similarly, consumer discretionary holdings weighed on results, driven by a portfolio-only position in GoPro, as the wearable camera maker’s stock slumped on concerns about economic growth in China and a bleak outlook for wearable camera demand. We ultimately sold our stake in the position.
Security selection in the financials sector was also a principal detractor. A number of capital markets holdings weighed on the sector’s results, including Legg Mason, an overweight position relative to the benchmark. The asset manager’s stock price came under pressure after reporting a quarterly net loss and announcing several strategic acquisitions and agreements. Shares of commercial real estate services company Jones Lang LaSalle, a portfolio-only holding, declined sharply on disappointing quarterly earnings in early 2016 during a difficult environment for financial stocks. Both holding were subsequently liquidated.
Health care was another area of weakness, particularly among biotechnology companies. An overweight position in Biogen hindered results. The biopharmaceutical holding’s share price fell sharply on disappointing revenue and lowered earnings guidance for 2015 as a result of declining sales of its Tecfidera multiple sclerosis treatment. Nevertheless, we believe the holding’s attractive valuation and growth characteristics support our positioning. Elsewhere, the fund’s underweight position, relative to the benchmark, in internet giant Alphabet, the parent company of Google, negatively impacted results as its stock price appreciated strongly during the period on substantial growth in mobile advertising revenues as users increasingly migrated to mobile platforms.
Materials Sector Holdings Contributed
Stock selection in the materials sector bolstered the fund’s relative returns, especially an overweight position in Newmont Mining. The gold and silver miner benefited from rising precious metals prices, which bolstered the broad sector during the second half of the period. The holding’s valuation and growth metrics declined, and we opted to exit our investment. A portfolio-only position in Cabot, a specialty chemicals manufacturer, also contributed as the stock gained on the commodity rally that lifted many materials stocks.
3
Individual outperformers that helped to limit the fund’s decline included Kroger, a grocery chain operator, whose strong profit growth was fueled by rising comparable store sales. Deceleration across most factors led us to liquidate our investment in the stock. Elsewhere in the fund, an overweight position in Applied Materials aided results as the semiconductor maker’s shares moved up on the heels of strong quarterly earnings reports and higher future guidance as the company captured market share from competitors and anticipated higher demand.
A Look Ahead
At period end, information technology and health care were the fund’s largest overweight positions on a sector basis. In information technology, we think that software and internet software and services companies are attractive in the information technology sector, where key themes are mobile, search, cloud computing, big data, and the shift to digital/online retail. This is creating growth and quality opportunities. Valuation and sentiment also are positive for select firms in these industries. After the dramatic sell-off in 2015, health care names, particularly in the biotech space, are compelling based on valuation factors. Growth and quality metrics also are favorable. The consumer discretionary and financials sectors, both portfolio underweights, continue to face challenges, in our opinion. Growth scores are not favorable in consumer discretionary, particularly among specialty retailers. In fundamental terms, many of these traditional brick-and-mortar retailers face challenging business conditions and have poor growth and quality rankings. In financials, we find that large-cap real estate investment trusts and diversified financial services firms are challenged across virtually all dimensions. Our disciplined, objective, and systematic investment strategy is designed to take advantage of opportunities at the individual company level. We believe this approach is the most powerful way to capitalize on market inefficiencies that lead to the mispricing of individual stocks. Our strategy is designed to provide investors with well-diversified and risk-controlled exposure to broad U.S. equities. As such, we do not see significant
deviations in sector weightings versus the S&P 500.
4
| Fund Characteristics |
| JUNE 30, 2016 | |
| Top Ten Holdings | % of net assets |
| Alphabet, Inc., Class A | 3.1% |
| Microsoft Corp. | 3.0% |
| Amazon.com, Inc. | 2.2% |
| Procter & Gamble Co. (The) | 2.2% |
| Exxon Mobil Corp. | 2.1% |
| Apple, Inc. | 2.1% |
| Merck & Co., Inc. | 1.9% |
| PepsiCo, Inc. | 1.8% |
| Facebook, Inc., Class A | 1.8% |
| Intel Corp. | 1.7% |
| Top Five Industries | % of net assets |
| Software | 6.7% |
| Biotechnology | 5.3% |
| Pharmaceuticals | 5.1% |
| Internet Software and Services | 4.9% |
| Food Products | 4.6% |
| Types of Investments in Portfolio | % of net assets |
| Common Stocks | 98.5% |
| Temporary Cash Investments | 1.1% |
| Other Assets and Liabilities | 0.4% |
5
| Shareholder Fee Example |
Fund shareholders may incur two types of costs: (1) transaction costs, including sales charges (loads) on purchase payments and redemption/exchange fees; and (2) ongoing costs, including management fees; distribution and service (12b-1) fees; and other fund expenses. This example is intended to help you understand your ongoing costs (in dollars) of investing in your fund and to compare these costs with the ongoing cost of investing in other mutual funds.
The example is based on an investment of $1,000 made at the beginning of the period and held for the entire period from January 1, 2016 to June 30, 2016.
Actual Expenses
The table provides information about actual account values and actual expenses for each class. You may use the information, together with the amount you invested, to estimate the expenses that you paid over the period. First, identify the share class you own. Then simply divide your account value by $1,000 (for example, an $8,600 account value divided by $1,000 = 8.6), then multiply the result by the number under the heading “Expenses Paid During Period” to estimate the expenses you paid on your account during this period.
Hypothetical Example for Comparison Purposes
The table also provides information about hypothetical account values and hypothetical expenses based on the actual expense ratio of each class of your fund and an assumed rate of return of 5% per year before expenses, which is not the actual return of a fund’s share class. The hypothetical account values and expenses may not be used to estimate the actual ending account balance or expenses you paid for the period. You may use this information to compare the ongoing costs of investing in your fund and other funds. To do so, compare this 5% hypothetical example with the 5% hypothetical examples that appear in the shareholder reports of the other funds.
Please note that the expenses shown in the table are meant to highlight your ongoing costs only and do not reflect any transactional costs, such as sales charges (loads) or redemption/exchange fees. Therefore, the table is useful in comparing ongoing costs only, and will not help you determine the relative total costs of owning different funds. In addition, if these transactional costs were included, your costs would have been higher.
| Beginning Account Value 1/1/16 | Ending Account Value 6/30/16 | Expenses Paid During Period(1) 1/1/16 - 6/30/16 | Annualized Expense Ratio(1) | |
| Actual | ||||
| Institutional Class | $1,000 | $1,016.90 | $2.36 | 0.47% |
| Hypothetical | ||||
| Institutional Class | $1,000 | $1,022.53 | $2.36 | 0.47% |
| (1) | Expenses are equal to the class's annualized expense ratio listed in the table above, multiplied by the average account value over the period, multiplied by 182, the number of days in the most recent fiscal half-year, divided by 366, to reflect the one-half year period. |
6
| Schedule of Investments |
JUNE 30, 2016
| Shares | Value | |||
| COMMON STOCKS — 98.5% | ||||
| Aerospace and Defense — 1.9% | ||||
| Boeing Co. (The) | 151,926 | $ | 19,730,630 | |
Spirit AeroSystems Holdings, Inc., Class A(1) | 238,354 | 10,249,222 | ||
| 29,979,852 | ||||
| Airlines — 1.4% | ||||
| Alaska Air Group, Inc. | 51,215 | 2,985,322 | ||
| Delta Air Lines, Inc. | 79,530 | 2,897,278 | ||
JetBlue Airways Corp.(1) | 353,333 | 5,851,195 | ||
United Continental Holdings, Inc.(1) | 248,473 | 10,197,332 | ||
| 21,931,127 | ||||
| Auto Components — 1.3% | ||||
| Goodyear Tire & Rubber Co. (The) | 404,041 | 10,367,692 | ||
| Lear Corp. | 95,172 | 9,684,703 | ||
| 20,052,395 | ||||
| Banks — 2.9% | ||||
| Citigroup, Inc. | 541,692 | 22,962,324 | ||
| JPMorgan Chase & Co. | 122,501 | 7,612,212 | ||
| SunTrust Banks, Inc. | 170,977 | 7,023,735 | ||
| Wells Fargo & Co. | 148,529 | 7,029,878 | ||
| 44,628,149 | ||||
| Beverages — 2.3% | ||||
| Coca-Cola Co. (The) | 72,031 | 3,265,165 | ||
| Dr Pepper Snapple Group, Inc. | 53,291 | 5,149,510 | ||
| PepsiCo, Inc. | 262,000 | 27,756,280 | ||
| 36,170,955 | ||||
| Biotechnology — 5.3% | ||||
| AbbVie, Inc. | 331,019 | 20,493,386 | ||
| Amgen, Inc. | 153,310 | 23,326,117 | ||
Biogen, Inc.(1) | 67,034 | 16,210,162 | ||
| Gilead Sciences, Inc. | 254,653 | 21,243,153 | ||
United Therapeutics Corp.(1) | 13,121 | 1,389,776 | ||
| 82,662,594 | ||||
| Building Products — 1.1% | ||||
| Owens Corning | 267,819 | 13,798,035 | ||
USG Corp.(1) | 151,971 | 4,097,138 | ||
| 17,895,173 | ||||
| Capital Markets — 0.3% | ||||
| Eaton Vance Corp. | 150,979 | 5,335,598 | ||
| Chemicals — 3.7% | ||||
| Air Products & Chemicals, Inc. | 117,561 | 16,698,364 | ||
| Cabot Corp. | 253,150 | 11,558,829 | ||
| Dow Chemical Co. (The) | 320,066 | 15,910,481 | ||
| PPG Industries, Inc. | 132,299 | 13,778,941 | ||
| 57,946,615 | ||||
| Communications Equipment — 1.6% | ||||
| Cisco Systems, Inc. | 858,930 | 24,642,702 | ||
7
| Shares | Value | |||
| Consumer Finance — 2.8% | ||||
| American Express Co. | 254,534 | $ | 15,465,486 | |
| Discover Financial Services | 279,877 | 14,998,608 | ||
Synchrony Financial(1) | 494,508 | 12,501,162 | ||
| 42,965,256 | ||||
| Containers and Packaging — 0.2% | ||||
| Avery Dennison Corp. | 51,598 | 3,856,950 | ||
| Diversified Financial Services — 1.6% | ||||
Berkshire Hathaway, Inc., Class B(1) | 74,817 | 10,832,753 | ||
| MSCI, Inc., Class A | 27,114 | 2,091,032 | ||
| Nasdaq, Inc. | 193,382 | 12,506,014 | ||
| 25,429,799 | ||||
| Diversified Telecommunication Services — 2.9% | ||||
| AT&T, Inc. | 494,198 | 21,354,296 | ||
| Verizon Communications, Inc. | 420,829 | 23,499,091 | ||
| 44,853,387 | ||||
| Electric Utilities — 0.3% | ||||
| NextEra Energy, Inc. | 41,180 | 5,369,872 | ||
| Energy Equipment and Services — 1.3% | ||||
| Atwood Oceanics, Inc. | 210,672 | 2,637,614 | ||
Dril-Quip, Inc.(1) | 17,328 | 1,012,475 | ||
FMC Technologies, Inc.(1) | 421,149 | 11,232,044 | ||
| Rowan Cos. plc | 329,643 | 5,821,495 | ||
| 20,703,628 | ||||
| Food and Staples Retailing — 1.5% | ||||
| Wal-Mart Stores, Inc. | 319,976 | 23,364,647 | ||
| Food Products — 4.6% | ||||
| Campbell Soup Co. | 38,282 | 2,546,901 | ||
| Dean Foods Co. | 417,285 | 7,548,686 | ||
| General Mills, Inc. | 169,866 | 12,114,843 | ||
| Hershey Co. (The) | 104,773 | 11,890,688 | ||
| Hormel Foods Corp. | 365,292 | 13,369,687 | ||
| Ingredion, Inc. | 42,555 | 5,507,043 | ||
| Pilgrim's Pride Corp. | 209,636 | 5,341,525 | ||
| Tyson Foods, Inc., Class A | 194,364 | 12,981,572 | ||
| 71,300,945 | ||||
| Gas Utilities — 0.8% | ||||
| ONE Gas, Inc. | 73,181 | 4,873,123 | ||
| Southwest Gas Corp. | 46,180 | 3,634,828 | ||
| UGI Corp. | 79,350 | 3,590,587 | ||
| 12,098,538 | ||||
| Health Care Equipment and Supplies — 3.3% | ||||
| Abbott Laboratories | 24,304 | 955,390 | ||
| Becton Dickinson and Co. | 20,258 | 3,435,554 | ||
| C.R. Bard, Inc. | 62,991 | 14,812,964 | ||
| Medtronic plc | 223,361 | 19,381,034 | ||
| St. Jude Medical, Inc. | 158,391 | 12,354,498 | ||
| 50,939,440 | ||||
| Health Care Providers and Services — 2.0% | ||||
| Aetna, Inc. | 68,543 | 8,371,157 | ||
| AmerisourceBergen Corp. | 67,869 | 5,383,369 | ||
8
| Shares | Value | |||
Express Scripts Holding Co.(1) | 228,298 | $ | 17,304,988 | |
| 31,059,514 | ||||
| Hotels, Restaurants and Leisure — 2.3% | ||||
| Bloomin' Brands, Inc. | 300,627 | 5,372,205 | ||
| Carnival Corp. | 295,991 | 13,082,802 | ||
| Darden Restaurants, Inc. | 201,132 | 12,739,701 | ||
| McDonald's Corp. | 42,703 | 5,138,879 | ||
| 36,333,587 | ||||
| Household Products — 3.5% | ||||
| Clorox Co. (The) | 21,627 | 2,992,960 | ||
| Kimberly-Clark Corp. | 128,556 | 17,673,879 | ||
| Procter & Gamble Co. (The) | 400,964 | 33,949,622 | ||
| 54,616,461 | ||||
Independent Power and Renewable Electricity Producers† | ||||
| Ormat Technologies, Inc. | 16,492 | 721,690 | ||
| Industrial Conglomerates — 3.5% | ||||
| 3M Co. | 68,918 | 12,068,920 | ||
| Carlisle Cos., Inc. | 115,886 | 12,246,832 | ||
| Danaher Corp. | 170,590 | 17,229,590 | ||
| General Electric Co. | 416,643 | 13,115,922 | ||
| 54,661,264 | ||||
| Insurance — 2.0% | ||||
| Aflac, Inc. | 37,743 | 2,723,535 | ||
| Aon plc | 41,578 | 4,541,565 | ||
| Hanover Insurance Group, Inc. (The) | 152,925 | 12,940,514 | ||
| Prudential Financial, Inc. | 7,957 | 567,652 | ||
| Unum Group | 344,081 | 10,938,335 | ||
| 31,711,601 | ||||
| Internet and Catalog Retail — 2.3% | ||||
Amazon.com, Inc.(1) | 48,971 | 35,044,627 | ||
Priceline Group, Inc. (The)(1) | 583 | 727,823 | ||
| 35,772,450 | ||||
| Internet Software and Services — 4.9% | ||||
Alphabet, Inc., Class A(1) | 70,335 | 49,482,783 | ||
Facebook, Inc., Class A(1) | 240,775 | 27,515,767 | ||
| 76,998,550 | ||||
| IT Services — 1.7% | ||||
| International Business Machines Corp. | 155,652 | 23,624,860 | ||
PayPal Holdings, Inc.(1) | 92,039 | 3,360,344 | ||
| 26,985,204 | ||||
| Life Sciences Tools and Services — 1.1% | ||||
| Thermo Fisher Scientific, Inc. | 118,668 | 17,534,384 | ||
| Machinery — 1.9% | ||||
| PACCAR, Inc. | 281,730 | 14,613,335 | ||
| Stanley Black & Decker, Inc. | 114,443 | 12,728,350 | ||
| Toro Co. (The) | 18,069 | 1,593,686 | ||
| 28,935,371 | ||||
| Media — 2.4% | ||||
AMC Networks, Inc., Class A(1) | 21,748 | 1,314,014 | ||
| Time Warner, Inc. | 199,897 | 14,700,425 | ||
| Viacom, Inc., Class B | 303,700 | 12,594,439 | ||
9
| Shares | Value | |||
| Walt Disney Co. (The) | 88,536 | $ | 8,660,592 | |
| 37,269,470 | ||||
| Metals and Mining — 1.0% | ||||
| Barrick Gold Corp. | 135,826 | 2,899,885 | ||
| Nucor Corp. | 256,164 | 12,657,063 | ||
| 15,556,948 | ||||
| Multi-Utilities — 0.1% | ||||
| CenterPoint Energy, Inc. | 41,333 | 991,992 | ||
| Multiline Retail — 1.1% | ||||
| Target Corp. | 235,846 | 16,466,768 | ||
| Oil, Gas and Consumable Fuels — 3.8% | ||||
| Apache Corp. | 41,197 | 2,293,437 | ||
| Chevron Corp. | 160,341 | 16,808,547 | ||
| Exxon Mobil Corp. | 355,993 | 33,370,784 | ||
| World Fuel Services Corp. | 145,229 | 6,896,925 | ||
| 59,369,693 | ||||
| Personal Products — 0.5% | ||||
| Estee Lauder Cos., Inc. (The), Class A | 87,125 | 7,930,117 | ||
| Pharmaceuticals — 5.1% | ||||
| Johnson & Johnson | 144,276 | 17,500,679 | ||
| Merck & Co., Inc. | 504,900 | 29,087,289 | ||
Mylan NV(1) | 290,216 | 12,548,940 | ||
| Pfizer, Inc. | 605,137 | 21,306,873 | ||
| 80,443,781 | ||||
| Real Estate Investment Trusts (REITs) — 2.5% | ||||
| Host Hotels & Resorts, Inc. | 442,756 | 7,177,075 | ||
| Lamar Advertising Co., Class A | 235,745 | 15,629,893 | ||
| Liberty Property Trust | 66,889 | 2,656,831 | ||
| Ryman Hospitality Properties, Inc. | 138,524 | 7,016,240 | ||
| Sunstone Hotel Investors, Inc. | 274,896 | 3,317,995 | ||
| WP Carey, Inc. | 50,997 | 3,540,212 | ||
| 39,338,246 | ||||
| Real Estate Management and Development — 0.4% | ||||
Realogy Holdings Corp.(1) | 197,721 | 5,737,863 | ||
| Semiconductors and Semiconductor Equipment — 4.0% | ||||
| Applied Materials, Inc. | 580,322 | 13,910,318 | ||
| Intel Corp. | 819,707 | 26,886,390 | ||
| NVIDIA Corp. | 28,627 | 1,345,755 | ||
| QUALCOMM, Inc. | 359,568 | 19,262,058 | ||
| Teradyne, Inc. | 83,782 | 1,649,668 | ||
| 63,054,189 | ||||
| Software — 6.7% | ||||
Adobe Systems, Inc.(1) | 184,587 | 17,681,589 | ||
Electronic Arts, Inc.(1) | 81,519 | 6,175,880 | ||
| Intuit, Inc. | 39,925 | 4,456,029 | ||
| Microsoft Corp. | 915,826 | 46,862,816 | ||
| Oracle Corp. | 357,281 | 14,623,511 | ||
Synopsys, Inc.(1) | 71,556 | 3,869,749 | ||
VMware, Inc., Class A(1) | 181,614 | 10,391,953 | ||
| 104,061,527 | ||||
10
| Shares | Value | |||
| Specialty Retail — 0.3% | ||||
| Best Buy Co., Inc. | 99,061 | $ | 3,031,267 | |
| Foot Locker, Inc. | 43,462 | 2,384,325 | ||
| 5,415,592 | ||||
| Technology Hardware, Storage and Peripherals — 3.3% | ||||
| Apple, Inc. | 347,804 | 33,250,062 | ||
| EMC Corp. | 177,131 | 4,812,649 | ||
| HP, Inc. | 811,101 | 10,179,318 | ||
| NetApp, Inc. | 134,799 | 3,314,708 | ||
| 51,556,737 | ||||
| Thrifts and Mortgage Finance — 0.7% | ||||
Essent Group Ltd.(1) | 464,530 | 10,131,399 | ||
| Trading Companies and Distributors — 0.3% | ||||
HD Supply Holdings, Inc.(1) | 138,673 | 4,828,594 | ||
TOTAL COMMON STOCKS (Cost $1,394,596,443) | 1,539,610,614 | |||
| TEMPORARY CASH INVESTMENTS — 1.1% | ||||
| Repurchase Agreement, Fixed Income Clearing Corp., (collateralized by various U.S. Treasury obligations, 3.625%, 2/15/44, valued at $17,941,919), at 0.20%, dated 6/30/16, due 7/1/16 (Delivery value $17,586,098) | 17,586,000 | |||
| State Street Institutional Liquid Reserves Fund, Premier Class | 11,653 | 11,653 | ||
TOTAL TEMPORARY CASH INVESTMENTS (Cost $17,597,653) | 17,597,653 | |||
TOTAL INVESTMENT SECURITIES — 99.6% (Cost $1,412,194,096) | 1,557,208,267 | |||
| OTHER ASSETS AND LIABILITIES — 0.4% | 6,476,965 | |||
| TOTAL NET ASSETS — 100.0% | $ | 1,563,685,232 | ||
| NOTES TO SCHEDULE OF INVESTMENTS |
| † | Category is less than 0.05% of total net assets. |
| (1) | Non-income producing. |
See Notes to Financial Statements.
11
| Statement of Assets and Liabilities |
| JUNE 30, 2016 | |||
| Assets | |||
| Investment securities, at value (cost of $1,412,194,096) | $ | 1,557,208,267 | |
| Receivable for capital shares sold | 5,486,259 | ||
| Dividends and interest receivable | 1,608,670 | ||
| 1,564,303,196 | |||
| Liabilities | |||
| Payable for capital shares redeemed | 29,949 | ||
| Accrued management fees | 587,497 | ||
| Accrued other expenses | 518 | ||
| 617,964 | |||
| Net Assets | $ | 1,563,685,232 | |
| Institutional Class Capital Shares, $0.01 Par Value | |||
| Shares authorized | 600,000,000 | ||
| Shares outstanding | 139,645,559 | ||
| Net Asset Value Per Share | $ | 11.20 | |
| Net Assets Consist of: | |||
| Capital (par value and paid-in surplus) | $ | 1,455,769,986 | |
| Undistributed net investment income | 510,183 | ||
| Accumulated net realized loss | (37,609,108 | ) | |
| Net unrealized appreciation | 145,014,171 | ||
| $ | 1,563,685,232 | ||
See Notes to Financial Statements.
12
| Statement of Operations |
| YEAR ENDED JUNE 30, 2016 | |||
| Investment Income (Loss) | |||
| Income: | |||
| Dividends (net of foreign taxes withheld of $407) | $ | 30,245,658 | |
| Interest | 17,678 | ||
| 30,263,336 | |||
| Expenses: | |||
| Management fees | 6,652,873 | ||
| Directors' fees and expenses | 83,311 | ||
| Other expenses | 2,510 | ||
| 6,738,694 | |||
| Net investment income (loss) | 23,524,642 | ||
| Realized and Unrealized Gain (Loss) | |||
| Net realized gain (loss) on: | |||
| Investment transactions | (35,478,346 | ) | |
| Futures contract transactions | 308,777 | ||
| (35,169,569 | ) | ||
| Change in net unrealized appreciation (depreciation) on investments | (14,149,930 | ) | |
| Net realized and unrealized gain (loss) | (49,319,499 | ) | |
| Net Increase (Decrease) in Net Assets Resulting from Operations | $ | (25,794,857 | ) |
See Notes to Financial Statements.
13
| Statement of Changes in Net Assets |
| YEARS ENDED JUNE 30, 2016 AND JUNE 30, 2015 | ||||||
| Increase (Decrease) in Net Assets | June 30, 2016 | June 30, 2015 | ||||
| Operations | ||||||
| Net investment income (loss) | $ | 23,524,642 | $ | 20,484,007 | ||
| Net realized gain (loss) | (35,169,569 | ) | 110,870,229 | |||
| Change in net unrealized appreciation (depreciation) | (14,149,930 | ) | (60,626,024 | ) | ||
| Net increase (decrease) in net assets resulting from operations | (25,794,857 | ) | 70,728,212 | |||
| Distributions to Shareholders | ||||||
| From net investment income | (24,040,330 | ) | (19,553,090 | ) | ||
| From net realized gains | (68,995,192 | ) | (111,633,314 | ) | ||
| Decrease in net assets from distributions | (93,035,522 | ) | (131,186,404 | ) | ||
| Capital Share Transactions | ||||||
| Proceeds from shares sold | 317,445,635 | 288,468,292 | ||||
| Proceeds from reinvestment of distributions | 93,035,522 | 131,186,404 | ||||
| Payments for shares redeemed | (109,014,706 | ) | (102,850,160 | ) | ||
| Net increase (decrease) in net assets from capital share transactions | 301,466,451 | 316,804,536 | ||||
| Net increase (decrease) in net assets | 182,636,072 | 256,346,344 | ||||
| Net Assets | ||||||
| Beginning of period | 1,381,049,160 | 1,124,702,816 | ||||
| End of period | $ | 1,563,685,232 | $ | 1,381,049,160 | ||
| Undistributed net investment income | $ | 510,183 | $ | 1,406,402 | ||
| Transactions in Shares of the Fund | ||||||
| Sold | 28,713,747 | 23,274,654 | ||||
| Issued in reinvestment of distributions | 8,349,663 | 10,792,181 | ||||
| Redeemed | (9,700,221 | ) | (8,060,298 | ) | ||
| Net increase (decrease) in shares of the fund | 27,363,189 | 26,006,537 | ||||
See Notes to Financial Statements.
14
| Notes to Financial Statements |
JUNE 30, 2016
1. Organization
American Century Quantitative Equity Funds, Inc. (the corporation) is registered under the Investment Company Act of 1940, as amended (the 1940 Act), as an open-end management investment company and is organized as a Maryland corporation. NT Equity Growth Fund (the fund) is one fund in a series issued by the corporation. The fund’s investment objective is to seek long-term capital growth. The fund is not permitted to invest in securities issued by companies assigned the Global Industry Classification Standard for the tobacco industry.
2. Significant Accounting Policies
The following is a summary of significant accounting policies consistently followed by the fund in preparation of its financial statements. The fund is an investment company and follows accounting and reporting guidance in accordance with accounting principles generally accepted in the United States of America. This may require management to make certain estimates and assumptions at the date of the financial statements. Actual results could differ from these estimates. Management evaluated the impact of events or transactions occurring through the date the financial statements were issued that would merit recognition or disclosure.
Investment Valuations — The fund determines the fair value of its investments and computes its net asset value per share at the close of regular trading (usually 4 p.m. Eastern time) on the New York Stock Exchange (NYSE) on each day the NYSE is open. The Board of Directors has adopted valuation policies and procedures to guide the investment advisor in the fund’s investment valuation process and to provide methodologies for the oversight of the fund’s pricing function.
Equity securities that are listed or traded on a domestic securities exchange are valued at the last reported sales price or at the official closing price as provided by the exchange. Equity securities traded on foreign securities exchanges are generally valued at the closing price of such securities on the exchange where primarily traded or at the close of the NYSE, if that is earlier. If no last sales price is reported, or if local convention or regulation so provides, the mean of the latest bid and asked prices may be used. Securities traded over-the-counter are valued at the mean of the latest bid and asked prices, the last sales price, or the official closing price.
Open-end management investment companies are valued at the reported net asset value per share. Repurchase agreements are valued at cost, which approximates fair value. Exchange-traded futures contracts are valued at the settlement price as provided by the appropriate clearing corporation.
If the fund determines that the market price for an investment is not readily available or the valuation methods mentioned above do not reflect an investment’s fair value, such investment is valued as determined in good faith by the Board of Directors or its delegate, in accordance with policies and procedures adopted by the Board of Directors. In its determination of fair value, the fund may review several factors including, but not limited to, market information regarding the specific investment or comparable investments and correlation with other investment types, futures indices or general market indicators. Circumstances that may cause the fund to use these procedures to value an investment include, but are not limited to: an investment has been declared in default or is distressed; trading in a security has been suspended during the trading day or a security is not actively trading on its principal exchange; prices received from a regular pricing source are deemed unreliable; or there is a foreign market holiday and no trading occurred.
The fund monitors for significant events occurring after the close of an investment’s primary exchange but before the fund’s net asset value per share is determined. Significant events may include, but are not limited to: corporate announcements and transactions; governmental action and political unrest that could impact a specific investment or an investment sector; or armed conflicts, natural disasters and similar events that could affect investments in a specific country or region. The fund also monitors for significant fluctuations between domestic and foreign markets, as evidenced by the U.S. market or such other indicators that the Board of Directors, or its delegate, deems appropriate. If significant fluctuations in foreign markets are identified, the fund may apply a model-derived factor to the closing price of equity securities traded on foreign securities exchanges. The factor is based on observable market data as provided by an independent pricing service.
15
Security Transactions — Security transactions are accounted for as of the trade date. Net realized gains and losses are determined on the identified cost basis, which is also used for federal income tax purposes.
Investment Income — Dividend income less foreign taxes withheld, if any, is recorded as of the ex-dividend date. Distributions received on securities that represent a return of capital or long-term capital gain are recorded as a reduction of cost of investments and/or as a realized gain. The fund may estimate the components of distributions received that may be considered nontaxable distributions or long-term capital gain distributions for income tax purposes. Interest income is recorded on the accrual basis and includes accretion of discounts and amortization of premiums.
Repurchase Agreements — The fund may enter into repurchase agreements with institutions that American Century Investment Management, Inc. (ACIM) (the investment advisor) has determined are creditworthy pursuant to criteria adopted by the Board of Directors. The fund requires that the collateral, represented by securities, received in a repurchase transaction be transferred to the custodian in a manner sufficient to enable the fund to obtain those securities in the event of a default under the repurchase agreement. ACIM monitors, on a daily basis, the securities transferred to ensure the value, including accrued interest, of the securities under each repurchase agreement is equal to or greater than amounts owed to the fund under each repurchase agreement.
Joint Trading Account — Pursuant to an Exemptive Order issued by the Securities and Exchange Commission, the fund, along with certain other funds in the American Century Investments family of funds, may transfer uninvested cash balances into a joint trading account. These balances are invested in one or more repurchase agreements that are collateralized by U.S. Treasury or Agency obligations.
Segregated Assets — In accordance with the 1940 Act, the fund segregates assets on its books and records to cover futures contracts. ACIM monitors, on a daily basis, the securities segregated to ensure the fund designates a sufficient amount of liquid assets, marked-to-market daily. The fund may also receive assets or be required to pledge assets at the custodian bank or with a broker for margin requirements on futures contracts.
Income Tax Status — It is the fund’s policy to distribute substantially all net investment income and net realized gains to shareholders and to otherwise qualify as a regulated investment company under provisions of the Internal Revenue Code. Accordingly, no provision has been made for income taxes. The fund files U.S. federal, state, local and non-U.S. tax returns as applicable. The fund's tax returns are subject to examination by the relevant taxing authority until expiration of the applicable statute of limitations, which is generally three years from the date of filing but can be longer in certain jurisdictions. At this time, management believes there are no uncertain tax positions which, based on their technical merit, would not be sustained upon examination and for which it is reasonably possible that the total amounts of unrecognized tax benefits will significantly change in the next twelve months.
Distributions to Shareholders — Distributions from net investment income, if any, are generally declared and paid quarterly. Distributions from net realized gains, if any, are generally declared and paid annually.
Indemnifications — Under the corporation’s organizational documents, its officers and directors are indemnified against certain liabilities arising out of the performance of their duties to the fund. In addition, in the normal course of business, the fund enters into contracts that provide general indemnifications. The maximum exposure under these arrangements is unknown as this would involve future claims that may be made against a fund. The risk of material loss from such claims is considered by management to be remote.
3. Fees and Transactions with Related Parties
Certain officers and directors of the corporation are also officers and/or directors of American Century Companies, Inc. (ACC). The corporation’s investment advisor, ACIM, the corporation's distributor, American Century Investment Services, Inc., and the corporation’s transfer agent, American Century Services, LLC, are wholly owned, directly or indirectly, by ACC. Various funds issued by American Century Asset Allocation Portfolios, Inc. own, in aggregate, 100% of the shares of the fund. Related parties do not invest in the fund for the purpose of exercising management or control.
Management Fees — The corporation has entered into a management agreement with ACIM, under which ACIM provides the fund with investment advisory and management services in exchange for a single, unified management fee (the fee). The agreement provides that all expenses of managing and operating the fund, except distribution and service fees, brokerage expenses, taxes, interest, fees and expenses of the independent directors (including legal counsel fees), and extraordinary expenses, will be paid by ACIM. The
16
fee is computed and accrued daily based on the daily net assets of the fund and paid monthly in arrears. The fee consists of (1) an Investment Category Fee based on the daily net assets of the fund and certain other accounts managed by the investment advisor that are in the same broad investment category as the fund and (2) a Complex Fee based on the assets of all the funds in the American Century Investments family of funds. The rates for the Investment Category Fee range from 0.3380% to 0.5200%. The rates for the Complex Fee range from 0.0500% to 0.1100%. The effective annual management fee for the year ended June 30, 2016 was 0.46%.
Directors' Fees and Expenses — The Board of Directors is responsible for overseeing the investment advisor’s management and operations of the fund. The directors receive detailed information about the fund and its investment advisor regularly throughout the year, and meet at least quarterly with management of the investment advisor to review reports about fund operations. The fund’s officers do not receive compensation from the fund.
Interfund Transactions — The fund may enter into security transactions with other American Century Investments funds and other client accounts of the investment advisor, in accordance with the 1940 Act rules and procedures adopted by the Board of Directors. The rules and procedures require, among other things, that these transactions be effected at the independent current market price of the security. During the period, the interfund purchases and sales were $7,832,117 and $5,653,550, respectively.
4. Investment Transactions
Purchases and sales of investment securities, excluding short-term investments, for the year ended June 30, 2016 were $1,555,488,696 and $1,326,035,587, respectively.
5. Fair Value Measurements
The fund’s investments valuation process is based on several considerations and may use multiple inputs to determine the fair value of the investments held by the fund. In conformity with accounting principles generally accepted in the United States of America, the inputs used to determine a valuation are classified into three broad levels.
| • | Level 1 valuation inputs consist of unadjusted quoted prices in an active market for identical investments. |
| • | Level 2 valuation inputs consist of direct or indirect observable market data (including quoted prices for comparable investments, evaluations of subsequent market events, interest rates, prepayment speeds, credit risk, etc.). These inputs also consist of quoted prices for identical investments initially expressed in local currencies that are adjusted through translation into U.S. dollars. |
| • | Level 3 valuation inputs consist of unobservable data (including a fund’s own assumptions). |
The level classification is based on the lowest level input that is significant to the fair valuation measurement. The valuation inputs are not necessarily an indication of the risks associated with investing in these securities or other financial instruments. There were no significant transfers between levels during the period.
The following is a summary of the level classifications as of period end. The Schedule of Investments provides additional information on the fund’s portfolio holdings.
| Level 1 | Level 2 | Level 3 | ||||||
| Assets | ||||||||
| Investment Securities | ||||||||
| Common Stocks | $ | 1,539,610,614 | — | — | ||||
| Temporary Cash Investments | 11,653 | $ | 17,586,000 | — | ||||
| $ | 1,539,622,267 | $ | 17,586,000 | — | ||||
17
6. Derivative Instruments
Equity Price Risk — The fund is subject to equity price risk in the normal course of pursuing its investment objectives. A fund may enter into futures contracts based on an equity index in order to manage its exposure to changes in market conditions. A fund may purchase futures contracts to gain exposure to increases in market value or sell futures contracts to protect against a decline in market value. Upon entering into a futures contract, a fund is required to deposit either cash or securities in an amount equal to a certain percentage of the contract value (initial margin). Subsequent payments (variation margin) are made or received daily, in cash, by a fund. The variation margin is equal to the daily change in the contract value and is recorded as unrealized gains and losses. A fund recognizes a realized gain or loss when the contract is closed or expires. Net realized and unrealized gains or losses occurring during the holding period of futures contracts are a component of net realized gain (loss) on futures contract transactions and change in net unrealized appreciation (depreciation) on futures contracts, respectively. One of the risks of entering into futures contracts is the possibility that the change in value of the contract may not correlate with the changes in value of the underlying securities. During the period, the fund participated in equity price risk derivative instruments for temporary investment purposes.
At period end, the fund did not have any derivative instruments disclosed on the Statement of Assets and Liabilities. For the year ended June 30, 2016, the effect of equity price risk derivative instruments on the Statement of Operations was $308,777 in net realized gain (loss) on futures contract transactions.
7. Federal Tax Information
The tax character of distributions paid during the years ended June 30, 2016 and June 30, 2015 were as follows:
| 2016 | 2015 | |||||
| Distributions Paid From | ||||||
| Ordinary income | $ | 36,988,594 | $ | 53,605,692 | ||
| Long-term capital gains | $ | 56,046,928 | $ | 77,580,712 | ||
The book-basis character of distributions made during the year from net investment income or net realized gains may differ from their ultimate characterization for federal income tax purposes. These differences reflect the differing character of certain income items and net realized gains and losses for financial statement and tax purposes, and may result in reclassification among certain capital accounts on the financial statements.
As of June 30, 2016, the federal tax cost of investments and the components of distributable earnings on a tax-basis were as follows:
| Federal tax cost of investments | $ | 1,416,969,660 | |
| Gross tax appreciation of investments | $ | 191,796,018 | |
| Gross tax depreciation of investments | (51,557,411 | ) | |
| Net tax appreciation (depreciation) of investments | $ | 140,238,607 | |
| Undistributed ordinary income | $ | 510,183 | |
| Accumulated short-term capital losses | $ | (32,833,544 | ) |
The difference between book-basis and tax-basis unrealized appreciation (depreciation) is attributable primarily to the tax deferral of losses on wash sales.
Accumulated capital losses represent net capital loss carryovers that may be used to offset future realized capital gains for federal income tax purposes. The capital loss carryovers may be carried forward for an unlimited period. Future capital loss carryover utilization in any given year may be subject to Internal Revenue Code limitations.
18
| Financial Highlights |
| For a Share Outstanding Throughout the Years Ended June 30 (except as noted) | |||||||||||||||
| Per-Share Data | Ratios and Supplemental Data | ||||||||||||||
| Income From Investment Operations: | Distributions From: | Ratio to Average Net Assets of: | |||||||||||||
Net Asset Value, Beginning of Period | Net Investment Income (Loss)(1) | Net Realized and Unrealized Gain (Loss) | Total From Investment Operations | Net Investment Income | Net Realized Gains | Total Distributions | Net Asset Value, End of Period | Total Return(2) | Operating Expenses | Net Investment Income (Loss) | Portfolio Turnover Rate | Net Assets, End of Period (in thousands) | |||
| Institutional Class | |||||||||||||||
| 2016 | $12.30 | 0.19 | (0.53) | (0.34) | (0.19) | (0.57) | (0.76) | $11.20 | (2.65)% | 0.47% | 1.65% | 94% | $1,563,685 | ||
| 2015 | $13.04 | 0.21 | 0.53 | 0.74 | (0.20) | (1.28) | (1.48) | $12.30 | 5.97% | 0.47% | 1.66% | 84% | $1,381,049 | ||
| 2014 | $11.58 | 0.20 | 2.59 | 2.79 | (0.19) | (1.14) | (1.33) | $13.04 | 25.29% | 0.47% | 1.64% | 77% | $1,124,703 | ||
| 2013 | $10.20 | 0.22 | 1.87 | 2.09 | (0.21) | (0.50) | (0.71) | $11.58 | 21.39% | 0.48% | 2.03% | 95% | $779,677 | ||
| 2012 | $10.27 | 0.17 | 0.35 | 0.52 | (0.18) | (0.41) | (0.59) | $10.20 | 5.65% | 0.48% | 1.75% | 104% | $558,993 | ||
| Notes to Financial Highlights |
| (1) | Computed using average shares outstanding throughout the period. |
| (2) | Total returns are calculated based on the net asset value of the last business day. Total returns for periods less than one year are not annualized. |
See Notes to Financial Statements.
| Report of Independent Registered Public Accounting Firm |
To the Directors of the American Century Quantitative Equity Funds, Inc. and Shareholders of the NT Equity Growth Fund:
In our opinion, the accompanying statement of assets and liabilities, including the schedule of investments, and the related statements of operations and of changes in net assets and the financial highlights present fairly, in all material respects, the financial position of the NT Equity Growth Fund (one of the sixteen funds comprising the American Century Quantitative Equity Funds, Inc., hereafter referred to as the “Fund”) at June 30, 2016, the results of its operations for the year then ended, the changes in its net assets for each of the two years in the period then ended and the financial highlights for each of the five years in the period then ended, in conformity with accounting principles generally accepted in the United States of America. These financial statements and financial highlights (hereafter referred to as "financial statements") are the responsibility of the Fund's management. Our responsibility is to express an opinion on these financial statements based on our audits. We conducted our audits of these financial statements in accordance with the standards of the Public Company Accounting Oversight Board (United States). Those standards require that we plan and perform the audit to obtain reasonable assurance about whether the financial statements are free of material misstatement. An audit includes examining, on a test basis, evidence supporting the amounts and disclosures in the financial statements, assessing the accounting principles used and significant estimates made by management, and evaluating the overall financial statement presentation. We believe that our audits, which included confirmation of securities at June 30, 2016 by correspondence with the custodian and brokers, provide a reasonable basis for our opinion.
PricewaterhouseCoopers LLP
Kansas City, Missouri
August 17, 2016
20
| Management |
Board of Directors
The individuals listed below serve as directors of the funds. Each director will continue to serve in this capacity until death, retirement, resignation or removal from office. The board has adopted a mandatory retirement age for directors who are not “interested persons,” as that term is defined in the Investment Company Act (independent directors). Independent directors shall retire on December 31 of the year in which they reach their 75th birthday; provided, however, that on or after January 1, 2022, independent directors shall retire on December 31 of the year in which they reach their 76th birthday.
Mr. Thomas is an “interested person” because he currently serves as President and Chief Executive Officer of American Century Companies, Inc. (ACC), the parent company of American Century Investment Management, Inc. (ACIM or the advisor). The other directors (more than three-fourths of the total number) are independent. They are not employees, directors or officers of, and have no financial interest in, ACC or any of its wholly owned, direct or indirect, subsidiaries, including ACIM, American Century Investment Services, Inc. (ACIS) and American Century Services, LLC (ACS), and they do not have any other affiliations, positions or relationships that would cause them to be considered “interested persons” under the Investment Company Act. The directors serve in this capacity for eight (in the case of Mr. Thomas, 15) registered investment companies in the American Century Investments family of funds.
The following table presents additional information about the directors. The mailing address for each director other than Mr. Thomas is 1665 Charleston Road, Mountain View, California 94043. The mailing address for Mr. Thomas is 4500 Main Street, Kansas City, Missouri 64111.
Name (Year of Birth) | Position(s) Held with Funds | Length of Time Served | Principal Occupation(s) During Past 5 Years | Number of American Century Portfolios Overseen by Director | Other Directorships Held During Past 5 Years |
| Independent Directors | |||||
| Tanya S. Beder (1955) | Director | Since 2011 | Chairman and CEO, SBCC Group Inc. (independent advisory services) (2006 to present) | 45 | CYS Investments, Inc. (NYSE mortgage arbitrage REIT) |
| Jeremy I. Bulow (1954) | Director | Since 2011 | Professor of Economics, Stanford University, Graduate School of Business (1979 to present) | 45 | None |
| Anne Casscells (1958) | Director | Since 2016 | Co-Chief Executive Officer and Chief Investment Officer, Aetos Alternatives Management (investment advisory firm) (2001 to present); Lecturer in Accounting, Stanford University, Graduate School of Business (2009 to present) | 45 | None |
21
Name (Year of Birth) | Position(s) Held with Funds | Length of Time Served | Principal Occupation(s) During Past 5 Years | Number of American Century Portfolios Overseen by Director | Other Directorships Held During Past 5 Years |
| Independent Directors | |||||
| Ronald J. Gilson (1946) | Director and Chairman of the Board | Since 1995 (Chairman since 2005) | Charles J. Meyers Professor of Law and Business, Emeritus, Stanford Law School (1979 to present); Marc and Eva Stern Professor of Law and Business, Columbia University School of Law (1992 to present) | 45 | None |
| Frederick L. A. Grauer (1946) | Director | Since 2008 | Senior Advisor, iShares by BlackRock, Inc. (investment management firm) (2010 to 2011, 2013 to present); Senior Advisor, Course Hero (an educational technology company) (2015 to present) | 45 | None |
| Jonathan D. Levin (1972) | Director | Since 2016 | Holbrook Working Professor of Price Theory, Stanford University, (2000 to present); Chair, Department of Economics, Stanford University (2011 to 2014) | 45 | None |
| Peter F. Pervere (1947) | Director | Since 2007 | Retired | 45 | None |
| John B. Shoven (1947) | Director | Since 2002 | Charles R. Schwab Professor of Economics, Stanford University (1973 to present) | 45 | Cadence Design Systems; Exponent; Financial Engines |
| Interested Director | |||||
| Jonathan S. Thomas (1963) | Director and President | Since 2007 | President and Chief Executive Officer, ACC (March 2007 to present). Also serves as Chief Executive Officer, ACS; Executive Vice President, ACIM; Director, ACC, ACIM and other ACC subsidiaries | 128 | BioMed Valley Discoveries, Inc. |
The Statement of Additional Information has additional information about the fund's directors and is available without charge, upon request, by calling 1-800-345-2021.
22
Officers
The following table presents certain information about the executive officers of the funds. Each officer serves as an officer for each of the 15 investment companies in the American Century family of funds, unless otherwise noted. No officer is compensated for his or her service as an officer of the funds. The listed officers are interested persons of the funds and are appointed or re-appointed on an annual basis. The mailing address for each of the officers listed below is 4500 Main Street, Kansas City, Missouri 64111.
Name (Year of Birth) | Offices with the Funds | Principal Occupation(s) During the Past Five Years |
| Jonathan S. Thomas (1963) | Director and President since 2007 | President and Chief Executive Officer, ACC (March 2007 to present). Also serves as Chief Executive Officer, ACS; Executive Vice President, ACIM; Director, ACC, ACIM and other ACC subsidiaries |
| Amy D. Shelton (1964) | Chief Compliance Officer and Vice President since 2014 | Chief Compliance Officer, American Century funds, (March 2014 to present); Chief Compliance Officer, ACIM (February 2014 to present); Chief Compliance Officer, ACIS (October 2009 to present); Vice President, Client Interactions and Marketing, ACIS (February 2013 to January 2014); Director, Client Interactions and Marketing, ACIS (June 2007 to January 2013). Also serves as Vice President, ACIS |
| Charles A. Etherington (1957) | General Counsel since 2007 and Senior Vice President since 2006 | Attorney, ACC (February 1994 to present); Vice President, ACC (November 2005 to present); General Counsel, ACC (March 2007 to present). Also serves as General Counsel, ACIM, ACS, ACIS and other ACC subsidiaries; and Senior Vice President, ACIM and ACS |
| C. Jean Wade (1964) | Vice President, Treasurer and Chief Financial Officer since 2012 | Vice President, ACS (February 2000 to present) |
| Robert J. Leach (1966) | Vice President since 2006 and Assistant Treasurer since 2012 | Vice President, ACS (February 2000 to present) |
| David H. Reinmiller (1963) | Vice President since 2001 | Attorney, ACC (January 1994 to present); Associate General Counsel, ACC (January 2001 to present). Also serves as Vice President, ACIM and ACS |
| Ward D. Stauffer (1960) | Secretary since 2005 | Attorney, ACC (June 2003 to present) |
23
| Approval of Management Agreement |
At a meeting held on June 14, 2016, the Fund’s Board of Directors (the "Board") unanimously approved the renewal of the management agreement pursuant to which American Century Investment Management, Inc. (the “Advisor”) acts as the investment advisor for the Fund. Under Section 15(c) of the Investment Company Act, contracts for investment advisory services are required to be reviewed, evaluated, and approved by a majority of a fund’s directors/trustees, including a majority of the independent Directors, each year. The Board regards this annual evaluation and renewal as one of its most important responsibilities.
The independent Directors have memorialized a statement regarding the relationship between their ongoing obligations to oversee and evaluate the performance of the Advisor and their annual consideration of renewal of the management agreement. In that statement, the independent Directors noted that their assessment of the Advisor’s performance is an ongoing process that takes place over the entire year and is informed by all of the extensive information that the Board and its committees receive and consider over time. This information, together with the additional materials provided specifically in connection with the review, are central to the Board’s assessment of the Advisor’s performance and its determination whether to renew the Fund’s management agreement.
Prior to its consideration of the renewal of the management agreement, the Board requested and reviewed extensive data and analysis relating to the proposed renewal. This information and analysis was compiled by the Advisor and certain independent providers of evaluation data concerning the Fund and the services provided to the Fund by the Advisor.
In connection with its consideration of the renewal of the management agreement, the Board’s review and evaluation of the services provided by the Advisor included, but was not limited to, the following:
| • | the nature, extent, and quality of investment management, shareholder services, and other services provided by the Advisor to the Fund; |
| • | the wide range of other programs and services the Advisor provides to the Fund and its shareholders on a routine and non-routine basis; |
| • | the investment performance of the Fund, including data comparing the Fund’s performance to appropriate benchmarks and/or a peer group of other mutual funds with similar investment objectives and strategies; |
| • | the cost of owning the Fund compared to the cost of owning similar funds; |
| • | the Advisor’s compliance policies, procedures, and regulatory experience; |
| • | financial data showing the cost of services provided to the Fund, the profitability of the Fund to the Advisor, and the overall profitability of the Advisor; |
| • | possible economies of scale associated with the Advisor’s management of the Fund and other accounts under its management; |
| • | data comparing services provided and charges to other investment management clients of the Advisor; |
| • | acquired fund fees and expenses; |
| • | payments by the Fund and the Advisor to financial intermediaries whose clients are investors in the Fund; and |
| • | any collateral benefits derived by the Advisor from the management of the Fund. |
In keeping with its practice, the Board held two in-person meetings to review and discuss the information provided in response to their request. The independent Directors also had the benefit of the advice of their independent counsel throughout the process.
24
Factors Considered
The Directors considered all of the information provided by the Advisor, the independent data providers, and the independent Directors’ independent counsel in connection with the approval. They determined that the information was sufficient for them to evaluate the management agreement for the Fund. In connection with their review, the Directors did not identify any single factor as being all-important or controlling and each Director may have attributed different levels of importance to different factors. In deciding to renew the management agreement, the Board based its decision on a number of factors, including the following:
Nature, Extent and Quality of Services - Generally. Under the management agreement, the Advisor is responsible for providing or arranging for all services necessary for the operation of the Fund. The Board noted that under the management agreement, the Advisor provides or arranges at its own expense a wide variety of services including:
| • | constructing and designing the Fund |
| • | portfolio research and security selection |
| • | initial capitalization/funding |
| • | securities trading |
| • | Fund administration |
| • | custody of Fund assets |
| • | daily valuation of the Fund’s portfolio |
| • | shareholder servicing and transfer agency, including shareholder confirmations, recordkeeping, and communications |
| • | legal services (except the independent Directors’ counsel) |
| • | regulatory and portfolio compliance |
| • | financial reporting |
| • | marketing and distribution (except amounts paid by the Fund under Rule 12b-1 plans) |
The Board noted that many of these services have expanded over time in terms of both quantity and complexity in response to shareholder demands, competition in the industry, changing distribution channels, and the changing regulatory environment.
Investment Management, Shareholder, and Other Services. The nature of the investment management services provided to the Fund is quite complex and allows Fund shareholders access to professional money management, instant diversification of their investments within an asset class, the opportunity to easily diversify among asset classes by investing in or exchanging among various American Century Investments funds, and liquidity. In evaluating investment performance, the Board expects the Advisor to manage the Fund in accordance with its investment objectives and approved strategies. Further, the Directors recognize that the Advisor has an obligation to seek the best execution of fund trades. In providing these services, the Advisor utilizes teams of investment professionals (portfolio managers, analysts, research assistants, and securities traders) who require extensive information technology, research, training, compliance, and other systems to conduct their business. The Board, directly and through its Portfolio Committee, regularly reviews investment performance information for the Fund, together with comparative information for appropriate benchmarks and/or peer groups of similarly-managed funds, over different time horizons. The Directors also review detailed performance information during the management agreement approval process. If performance concerns are identified, the Fund receives special reviews until performance improves, during which the Board discusses with the Advisor the reasons for such results (e.g., market conditions, security selection) and any efforts being undertaken to improve performance. The Fund’s performance was below its benchmark for the one-, three-, and five-year periods reviewed by the Board. The Board discussed the Fund’s performance with the Advisor and was satisfied with the efforts being undertaken by the Advisor. The Board found the investment management services provided by the Advisor to the Fund to be satisfactory and consistent with the management agreement.
25
Under the management agreement, the Advisor provides the Fund with a comprehensive package of transfer agency, shareholder, and other services. The Board, directly and through various committees of the Board, regularly reviews reports and evaluations of such services at its regular meetings. These reports include, but are not limited to, information regarding the operational efficiency and accuracy of the shareholder and transfer agency services provided, staffing levels, shareholder satisfaction (as measured by external as well as internal sources), technology support, new products and services offered to Fund shareholders, securities trading activities, portfolio valuation services, auditing services, and legal and operational compliance activities. Certain aspects of shareholder and transfer agency service level efficiency and the quality of securities trading activities are measured by independent third party providers and are presented in comparison to other fund groups not managed by the Advisor.
The Board found the services provided by the Advisor to the Fund under the management agreement to be competitive and of high quality.
Costs of Services and Profitability. The Advisor provides detailed information concerning its cost of providing various services to the Fund, its profitability in managing the Fund, its overall profitability, and its financial condition. The Directors have reviewed with the Advisor the methodology used to prepare this financial information. This information is considered in evaluating the Advisor’s financial condition, its ability to continue to provide services under the management agreement, and the reasonableness of the current management fee. The Board concluded that the Advisor’s profits were reasonable in light of the services provided to the Fund.
Economies of Scale. The Board also reviewed information provided by the Advisor regarding the possible existence of economies of scale in connection with the management of the Fund. The Board concluded that economies of scale are difficult to measure and predict with precision, especially on a fund-by-fund basis. The Board concluded that the Advisor is appropriately sharing economies of scale through its competitive fee structure, offering competitive fees from fund inception, and through reinvestment in its business to provide shareholders enhanced and expanded services.
Comparison to Other Funds’ Fees. The management agreement provides that the Fund pays the Advisor a single, all-inclusive (or unified) management fee for providing all services necessary for the management and operation of the Fund, other than brokerage expenses, expenses attributable to short sales, taxes, interest, extraordinary expenses, the fees and expenses of the Fund’s independent Directors (including their independent legal counsel), and expenses incurred in connection with the provision of shareholder services and distribution services under a plan adopted pursuant to Rule 12b-1 under the 1940 Act. Under the unified fee structure, the Advisor is responsible for providing all investment advisory, custody, audit, administrative, compliance, recordkeeping, marketing, and shareholder services, or arranging and supervising third parties to provide such services. By contrast, most other funds are charged a variety of fees, including an investment advisory fee, a transfer agency fee, an administrative fee, distribution charges, and other expenses. Other than their investment advisory fees and any applicable Rule 12b-1 fees, all other components of the total fees charged by these other funds may be increased without shareholder approval. The Board believes the unified fee structure is a benefit to Fund shareholders because it clearly discloses to shareholders the cost of owning Fund shares, and, since the unified fee cannot be increased without a vote of Fund shareholders, it shifts to the Advisor the risk of increased costs of operating the Fund and provides a direct incentive to minimize administrative inefficiencies. Part of the Board’s analysis of fee levels involves reviewing certain evaluative data compiled by an independent provider and comparing the Fund’s unified fee to the total expense ratio of peer funds. The unified fee charged to shareholders of the Fund was below the median of the total expense ratios of the Fund’s peer group. The Board concluded that the management fee paid by the Fund to the Advisor under the management agreement is reasonable in light of the services provided to the Fund.
26
Comparison to Fees and Services Provided to Other Clients of the Advisor. The Board also requested and received information from the Advisor concerning the nature of the services, fees, costs, and profitability of its advisory services to advisory clients other than the Fund. They observed that these varying types of client accounts require different services and involve different regulatory and entrepreneurial risks than the management of the Fund. The Board analyzed this information and concluded that the fees charged and services provided to the Fund were reasonable by comparison.
Payments to Intermediaries. The Directors also requested and received a description of payments made to intermediaries by the Fund and the Advisor. These payments include various payments made by the Fund or the Advisor to different types of intermediaries and recordkeepers for distribution and service activities provided for the Fund.
Collateral or “Fall-Out” Benefits Derived by the Advisor. The Board considered the existence of collateral benefits the Advisor may receive as a result of its relationship with the Fund. The Board noted that the Advisor’s primary business is managing mutual funds and it generally does not use fund or shareholder information to generate profits in other lines of business, and therefore does not derive any significant collateral benefits from them. The Board noted that the Advisor receives proprietary research from broker-dealers that execute fund portfolio transactions. The Board also determined that the Advisor is able to provide investment management services to certain clients other than the Fund, at least in part, due to its existing infrastructure built to serve the fund complex. The Board concluded, however, that the assets of those other clients are not material to the analysis and, where applicable, may be included with the assets of the Fund to determine breakpoints in the management fee schedule.
Existing Relationship. The Board also considered whether there was any reason for not continuing the existing arrangement with the Advisor. In this regard, the Board was mindful of the potential disruptions of the Fund’s operations and various risks, uncertainties, and other effects that could occur as a result of a decision not to continue such relationship. In particular, the Board recognized that most shareholders have invested in the Fund on the strength of the Advisor’s industry standing and reputation and in the expectation that the Advisor will have a continuing role in providing advisory services to the Fund.
Conclusion of the Directors. As a result of this process, the Board, including all of the independent Directors and assisted by the advice of independent legal counsel, taking into account all of the factors discussed above and the information provided by the Advisor and others in connection with its review and throughout the year, concluded that the management agreement between the Fund and the Advisor is fair and reasonable in light of the services provided and should be renewed.
27
| Proxy Voting Results |
A special meeting of shareholders was held on June 13, 2016, to vote on the following proposal. The proposal received the required number of votes and was adopted. A summary of voting results is listed below.
To elect four directors to the Board of Directors of American Century Quantitative Equity Funds, Inc.:
| Affirmative | Withhold | ||||||
| Tanya S. Beder | $ | 8,473,153,264 | $ | 121,459,590 | |||
| Jeremy I. Bulow | $ | 8,469,793,581 | $ | 124,819,273 | |||
| Anne Casscells | $ | 8,465,895,232 | $ | 128,717,622 | |||
| Jonathan D. Levin | $ | 8,468,929,867 | $ | 125,682,987 | |||
The other directors whose term of office continued after the meeting include Jonathan S. Thomas, Ronald J. Gilson, Frederick L. A. Grauer, Peter F. Pervere and John B. Shoven.
28
| Additional Information |
Retirement Account Information
As required by law, distributions you receive from certain IRAs are subject to federal income tax withholding, unless you elect not to have withholding apply. Tax will be withheld on the total amount withdrawn even though you may be receiving amounts that are not subject to withholding, such as nondeductible contributions. In such case, excess amounts of withholding could occur. You may adjust your withholding election so that a greater or lesser amount will be withheld.
If you don’t want us to withhold on this amount, you must notify us to not withhold the federal income tax. You may notify us in writing or in certain situations by telephone or through other electronic means. For systematic withdrawals, your withholding election will remain in effect until revoked or changed by filing a new election. You have the right to revoke your election at any time.
Remember, even if you elect not to have income tax withheld, you are liable for paying income tax on the taxable portion of your withdrawal. If you elect not to have income tax withheld or you don’t have enough income tax withheld, you may be responsible for payment of estimated tax. You may incur penalties under the estimated tax rules if your withholding and estimated tax payments are not sufficient. You can reduce or defer the income tax on a distribution by directly or indirectly rolling such distribution over to another IRA or eligible plan. You should consult your tax advisor for additional information.
State tax will be withheld if, at the time of your distribution, your address is within one of the mandatory withholding states and you have federal income tax withheld (or as otherwise required by state law). State taxes will be withheld from your distribution in accordance with the respective state rules.
Distributions you receive from 403(b), 457 and qualified plans are subject to special tax and withholding rules. Your plan administrator or plan sponsor is required to provide you with a special tax notice explaining those rules at the time you request a distribution. If applicable, federal and/or state taxes may be withheld from your distribution amount.
Proxy Voting Policies
Descriptions of the principles and policies that the fund's investment advisor uses in exercising the voting rights associated with the securities purchased and/or held by the fund are available without charge, upon request, by calling 1-800-345-2021 or visiting the "About Us" page of American Century Investments’ website at americancentury.com. A description of the policies is also available on the Securities and Exchange Commission’s website at sec.gov. Information regarding how the investment advisor voted proxies relating to portfolio securities during the most recent 12-month period ended June 30 is available on the "About Us" page at americancentury.com. It is also available at sec.gov.
Quarterly Portfolio Disclosure
The fund files its complete schedule of portfolio holdings with the Securities and Exchange Commission (SEC) for the first and third quarters of each fiscal year on Form N-Q. The fund’s Forms N-Q are available on the SEC’s website at sec.gov, and may be reviewed and copied at the SEC’s Public Reference Room in Washington, DC. Information on the operation of the Public Reference Room may be obtained by calling 1-800-SEC-0330. The fund also makes its complete schedule of portfolio holdings for the most recent quarter of its fiscal year available on its website at americancentury.com and, upon request, by calling 1-800-345-2021.
29
Other Tax Information
The following information is provided pursuant to provisions of the Internal Revenue Code.
The fund hereby designates up to the maximum amount allowable as qualified dividend income for the fiscal year ended June 30, 2016.
For corporate taxpayers, the fund hereby designates $22,645,115, or up to the maximum amount allowable, of ordinary income distributions paid during the fiscal year ended June 30, 2016 as qualified for the corporate dividends received deduction.
The fund hereby designates $12,937,077 as qualified short-term capital gain distributions for purposes of Internal Revenue Code Section 871 for the fiscal year ended June 30, 2016.
The fund hereby designates $56,046,928, or up to the maximum amount allowable, as long-term capital gain distributions (20% rate gain distributions) for the fiscal year ended June 30, 2016.
30
| Notes |
31
| Notes |
32
| ||
| Contact Us | americancentury.com | |
| Automated Information Line | 1-800-345-8765 | |
| Investor Services Representative | 1-800-345-2021 or 816-531-5575 | |
| Investors Using Advisors | 1-800-378-9878 | |
| Business, Not-For-Profit, Employer-Sponsored Retirement Plans | 1-800-345-3533 | |
| Banks and Trust Companies, Broker-Dealers, Financial Professionals, Insurance Companies | 1-800-345-6488 | |
| Telecommunications Relay Service for the Deaf | 711 | |
| American Century Quantitative Equity Funds, Inc. | ||
Investment Advisor: American Century Investment Management, Inc. Kansas City, Missouri | ||
| This report and the statements it contains are submitted for the general information of our shareholders. The report is not authorized for distribution to prospective investors unless preceded or accompanied by an effective prospectus. | ||
| ©2016 American Century Proprietary Holdings, Inc. All rights reserved. CL-ANN-89961 1608 | ||
| Annual Report | |
| June 30, 2016 | |
| NT Small Company Fund | |
| Table of Contents |
| Performance | 2 | |
| Portfolio Commentary | ||
| Fund Characteristics | ||
| Shareholder Fee Example | ||
| Schedule of Investments | ||
| Statement of Assets and Liabilities | ||
| Statement of Operations | ||
| Statement of Changes in Net Assets | ||
| Notes to Financial Statements | ||
| Financial Highlights | ||
| Report of Independent Registered Public Accounting Firm | ||
| Management | ||
| Approval of Management Agreement | ||
| Proxy Voting Results | ||
| Additional Information | ||
Any opinions expressed in this report reflect those of the author as of the date of the report, and do not necessarily represent the opinions of American Century Investments® or any other person in the American Century Investments organization. Any such opinions are subject to change at any time based upon market or other conditions and American Century Investments disclaims any responsibility to update such opinions. These opinions may not be relied upon as investment advice and, because investment decisions made by American Century Investments funds are based on numerous factors, may not be relied upon as an indication of trading intent on behalf of any American Century Investments fund. Security examples are used for representational purposes only and are not intended as recommendations to purchase or sell securities. Performance information for comparative indices and securities is provided to American Century Investments by third party vendors. To the best of American Century Investments’ knowledge, such information is accurate at the time of printing.
| Performance |
| Total Returns as of June 30, 2016 | |||||
| Average Annual Returns | |||||
Ticker Symbol | 1 year | 5 years | 10 years | Inception Date | |
| Institutional Class | ACLOX | -8.27% | 8.97% | 4.13% | 5/12/06 |
| Russell 2000 Index | — | -6.73% | 8.34% | 6.19% | — |
| Growth of $10,000 Over 10 Years |
| $10,000 investment made June 30, 2006 |
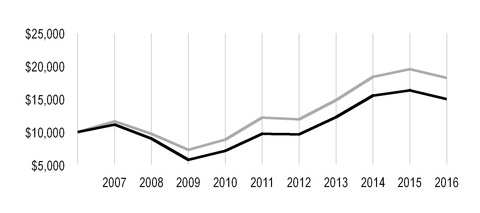
| Value on June 30, 2016 | |
| Institutional Class — $14,995 | |
| Russell 2000 Index — $18,240 | |
| Total Annual Fund Operating Expenses | |
| Institutional Class | 0.67% |
The total annual fund operating expenses shown is as stated in the fund’s prospectus current as of the date of this report. The prospectus may vary from the expense ratio shown elsewhere in this report because it is based on a different time period, includes acquired fund fees and expenses, and, if applicable, does not include fee waivers or expense reimbursements.
Data presented reflect past performance. Past performance is no guarantee of future results. Current performance may be higher or lower than the performance shown. Total returns for periods less than one year are not annualized. Investment return and principal value will fluctuate, and redemption value may be more or less than original cost. Data assumes reinvestment of dividends and capital gains, and none of the charts reflect the deduction of taxes that a shareholder would pay on fund distributions or the redemption of fund shares. To obtain performance data current to the most recent month end, please call 1-800-345-2021 or visit americancentury.com. For additional information about the fund, please consult the prospectus.
2
| Portfolio Commentary |
Portfolio Managers: Brian Garbe and Tal Sansani
Performance Summary
NT Small Company returned -8.27% for the fiscal year ended June 30, 2016, compared with the -6.73% return of its benchmark, the Russell 2000 Index.
NT Small Company declined during the fiscal year, underperforming the return of its benchmark, the Russell 2000 Index. NT Small Company’s stock selection process incorporates factors of valuation, quality, growth, and sentiment while striving to minimize unintended risks along industries and other risk characteristics. The fund’s valuation factors detracted from selection results, while growth and quality were supportive. Sentiment was largely neutral. Security selection in the financials and information technology sectors provided leading detraction, while consumer discretionary and health care holdings benefited fund results.
Financials Holdings Led Detractors
On a sector basis, stock selection in the financials sector imparted the largest relative detraction. An overweight position, relative to the benchmark, in First NBC Bank hampered results after the lender announced a delay in filing its 2015 10-K due to internal accounting errors, which prompted several investigations into securities fraud violations. We retain our overweight based on attractive valuation and sentiment characteristics. Heritage Insurance also weighed on relative results. Despite beating analyst expectations, the casualty insurer’s share price slipped following release of the company’s quarterly results. Our overweight position remains supported by the company’s very attractive valuation and quality profiles.
Detraction in the information technology sector was driven in part by Monster Worldwide. The employment website’s stock fell sharply on declining fourth-quarter revenues as job seekers increasingly turned to social networking sites in their quest for employment. The holding’s strong valuation and quality signals support our overweight positioning. Shares of VASCO Data Security International, an IT security company, plunged following the company’s below-consensus future guidance despite strong earnings-per-share growth and increased price targets. We find the holding compelling on its robust quality measures, and above-average valuation and sentiment factors.
Elsewhere, key individual underperformers included Outerwall, the parent company of Redbox retail movie rental kiosks, which tumbled as the company lowered earnings and revenue expectations and announced a leadership change at Redbox. An overweight position in Astronics, an aerospace and defense supplier of high-performance lighting and safety systems, was detrimental following its stock price decline on disappointing third-quarter growth in the aerospace sector. We ultimately exited our stakes in both holdings.
Consumer Discretionary and Health Care Positions Contributed
Consumer discretionary sector contribution was led by, LifeLock, a provider of theft identity protection services. The company’s stock advanced on an increase in third-quarter sales and management’s announcement that it had reached a settlement with the Federal Trade Commission about outstanding litigation surrounding its marketing practices.
3
In health care, key contribution stemmed from our overweight position in Affymetrix, a portfolio overweight. The stock price of the gene testing and analysis provider rose steeply in January in response to a $1.3 billion bid to be acquired by Thermo Fisher Scientific. Shares received another lift after a group of former executives offered to buy the company in a $1.5 billion all-cash deal, besting the earlier bid from Thermo Fisher Scientific. We subsequently exited our position.
Outperformance also came from several materials holdings. Trinseo’s stock price advanced after the maker of emulsion polymers and plastics exceeded fourth-quarter earnings expectation. Rayonier Advanced Materials, a cellulose specialties manufacturer, nearly doubled its first-quarter net income and surpassed earnings expectations due to management’s cost cutting measures, which are offsetting weakness in its top line growth. Elsewhere, an overweight position in Virgin America helped to boost relative performance as the passenger airline’s stock soared on the announced acquisition by Alaska Airlines. We opted to lock in gains and exited the position.
A Look Ahead
The materials sector, where quality measures are positive, is a key fund overweight at period-end. After recent struggles in the commodity space, we are finding select metals and mining companies with healthy balance sheets, high-quality earnings, and attractive valuations. We believe that the information technology and health care sectors also present opportunities, and maintain overweight positions in both. Many internet and information technology equipment companies offer high-quality earnings and balance sheets. Valuation and momentum also are considerations here. Conversely, we consider financials to be challenged along multiple dimensions, and maintain the fund’s underweight to the sector. Real estate investment trusts (REITs) appear overvalued, while many banks score poorly on growth metrics. This makes fundamental sense. With interest rates low, investors have piled into high-yielding REITs, while continuing low rates weigh on banks. Our disciplined, objective, and systematic investment strategy is designed to take advantage of opportunities at the individual company level. We believe this approach is the most powerful way to capitalize on market inefficiencies that lead to the mispricing of individual stocks.
4
| Fund Characteristics |
| JUNE 30, 2016 | |
| Top Ten Holdings | % of net assets |
| Deluxe Corp. | 0.8% |
| ONE Gas, Inc. | 0.8% |
| CoreSite Realty Corp. | 0.7% |
| Integra LifeSciences Holdings Corp. | 0.7% |
| Diamond Resorts International, Inc. | 0.7% |
| Primerica, Inc. | 0.7% |
| Universal Forest Products, Inc. | 0.7% |
| American Eagle Outfitters, Inc. | 0.7% |
| Coeur Mining, Inc. | 0.7% |
| Bank of the Ozarks, Inc. | 0.7% |
| Top Five Industries | % of net assets |
| Real Estate Investment Trusts (REITs) | 7.9% |
| Banks | 7.2% |
| Biotechnology | 5.1% |
| Internet Software and Services | 4.3% |
| Software | 4.2% |
| Types of Investments in Portfolio | % of net assets |
| Common Stocks | 99.1% |
| Temporary Cash Investments | 1.0% |
| Other Assets and Liabilities | (0.1)% |
5
| Shareholder Fee Example |
Fund shareholders may incur two types of costs: (1) transaction costs, including sales charges (loads) on purchase payments and redemption/exchange fees; and (2) ongoing costs, including management fees; distribution and service (12b-1) fees; and other fund expenses. This example is intended to help you understand your ongoing costs (in dollars) of investing in your fund and to compare these costs with the ongoing cost of investing in other mutual funds.
The example is based on an investment of $1,000 made at the beginning of the period and held for the entire period from January 1, 2016 to June 30, 2016.
Actual Expenses
The table provides information about actual account values and actual expenses for each class. You may use the information, together with the amount you invested, to estimate the expenses that you paid over the period. First, identify the share class you own. Then simply divide your account value by $1,000 (for example, an $8,600 account value divided by $1,000 = 8.6), then multiply the result by the number under the heading “Expenses Paid During Period” to estimate the expenses you paid on your account during this period.
Hypothetical Example for Comparison Purposes
The table also provides information about hypothetical account values and hypothetical expenses based on the actual expense ratio of each class of your fund and an assumed rate of return of 5% per year before expenses, which is not the actual return of a fund’s share class. The hypothetical account values and expenses may not be used to estimate the actual ending account balance or expenses you paid for the period. You may use this information to compare the ongoing costs of investing in your fund and other funds. To do so, compare this 5% hypothetical example with the 5% hypothetical examples that appear in the shareholder reports of the other funds.
Please note that the expenses shown in the table are meant to highlight your ongoing costs only and do not reflect any transactional costs, such as sales charges (loads) or redemption/exchange fees. Therefore, the table is useful in comparing ongoing costs only, and will not help you determine the relative total costs of owning different funds. In addition, if these transactional costs were included, your costs would have been higher.
| Beginning Account Value 1/1/16 | Ending Account Value 6/30/16 | Expenses Paid During Period(1) 1/1/16 - 6/30/16 | Annualized Expense Ratio(1) | |
| Actual | ||||
| Institutional Class | $1,000 | $1,002.40 | $3.34 | 0.67% |
| Hypothetical | ||||
| Institutional Class | $1,000 | $1,021.53 | $3.37 | 0.67% |
| (1) | Expenses are equal to the class's annualized expense ratio listed in the table above, multiplied by the average account value over the period, multiplied by 182, the number of days in the most recent fiscal half-year, divided by 366, to reflect the one-half year period. |
6
| Schedule of Investments |
JUNE 30, 2016
| Shares | Value | |||
| COMMON STOCKS — 99.1% | ||||
| Aerospace and Defense — 0.6% | ||||
Aerojet Rocketdyne Holdings, Inc.(1) | 130,145 | $ | 2,379,051 | |
| Air Freight and Logistics — 0.7% | ||||
Atlas Air Worldwide Holdings, Inc.(1) | 36,211 | 1,499,860 | ||
Hub Group, Inc., Class A(1) | 29,957 | 1,149,450 | ||
| 2,649,310 | ||||
| Airlines — 0.9% | ||||
Hawaiian Holdings, Inc.(1) | 57,558 | 2,184,902 | ||
JetBlue Airways Corp.(1) | 74,724 | 1,237,429 | ||
| 3,422,331 | ||||
| Auto Components — 1.8% | ||||
American Axle & Manufacturing Holdings, Inc.(1) | 146,642 | 2,123,376 | ||
| Cooper Tire & Rubber Co. | 61,531 | 1,834,855 | ||
Cooper-Standard Holding, Inc.(1) | 27,794 | 2,195,448 | ||
Stoneridge, Inc.(1) | 56,744 | 847,755 | ||
| 7,001,434 | ||||
| Banks — 7.2% | ||||
| Bank of the Ozarks, Inc. | 71,260 | 2,673,675 | ||
| BBCN Bancorp, Inc. | 39,436 | 588,385 | ||
| Berkshire Hills Bancorp, Inc. | 21,765 | 585,914 | ||
| Cardinal Financial Corp. | 11,175 | 245,180 | ||
| Cathay General Bancorp | 50,731 | 1,430,614 | ||
| Central Pacific Financial Corp. | 11,118 | 262,385 | ||
| Chemical Financial Corp. | 21,187 | 790,063 | ||
| Enterprise Financial Services Corp. | 10,869 | 303,136 | ||
FCB Financial Holdings, Inc., Class A(1) | 64,610 | 2,196,740 | ||
First BanCorp(1) | 109,351 | 434,123 | ||
| First Busey Corp. | 24,051 | 514,451 | ||
| First Midwest Bancorp, Inc. | 74,384 | 1,306,183 | ||
First NBC Bank Holding Co.(1) | 74,355 | 1,248,420 | ||
Franklin Financial Network, Inc.(1) | 20,265 | 635,510 | ||
| Great Western Bancorp, Inc. | 79,271 | 2,500,207 | ||
| Heartland Financial USA, Inc. | 35,619 | 1,256,995 | ||
| Home BancShares, Inc. | 116,170 | 2,299,004 | ||
| Independent Bank Group, Inc. | 4,372 | 187,603 | ||
| LegacyTexas Financial Group, Inc. | 52,394 | 1,409,923 | ||
| Opus Bank | 61,374 | 2,074,441 | ||
Pacific Premier Bancorp, Inc.(1) | 29,091 | 698,184 | ||
| Peoples Bancorp, Inc. | 7,065 | 153,946 | ||
| PrivateBancorp, Inc. | 23,099 | 1,017,049 | ||
| Southside Bancshares, Inc. | 2,726 | 84,282 | ||
| Towne Bank | 3,990 | 86,384 | ||
| Trico Bancshares | 27,590 | 761,484 | ||
| United Community Banks, Inc. | 4,089 | 74,788 | ||
Western Alliance Bancorp(1) | 71,248 | 2,326,247 | ||
| 28,145,316 | ||||
7
| Shares | Value | |||
| Beverages — 0.1% | ||||
National Beverage Corp.(1) | 6,077 | $ | 381,696 | |
| Biotechnology — 5.1% | ||||
Achillion Pharmaceuticals, Inc.(1) | 238,216 | 1,858,085 | ||
Aduro Biotech, Inc.(1) | 34,887 | 394,572 | ||
Applied Genetic Technologies Corp.(1) | 46,179 | 652,509 | ||
BioSpecifics Technologies Corp.(1) | 11,487 | 458,791 | ||
Blueprint Medicines Corp.(1) | 7,443 | 150,721 | ||
Cepheid, Inc.(1) | 72,088 | 2,216,706 | ||
Eagle Pharmaceuticals, Inc.(1) | 26,899 | 1,043,412 | ||
Emergent BioSolutions, Inc.(1) | 60,082 | 1,689,506 | ||
Epizyme, Inc.(1) | 16,971 | 173,783 | ||
FibroGen, Inc.(1) | 51,741 | 849,070 | ||
Genomic Health, Inc.(1) | 9,554 | 247,401 | ||
Insys Therapeutics, Inc.(1) | 92,959 | 1,202,889 | ||
Lexicon Pharmaceuticals, Inc.(1) | 47,864 | 686,848 | ||
Ligand Pharmaceuticals, Inc., Class B(1) | 20,719 | 2,471,155 | ||
MiMedx Group, Inc.(1) | 105,881 | 844,930 | ||
Myriad Genetics, Inc.(1) | 79,551 | 2,434,261 | ||
Natera, Inc.(1) | 9,471 | 114,268 | ||
Repligen Corp.(1) | 42,649 | 1,166,877 | ||
Rigel Pharmaceuticals, Inc.(1) | 29,809 | 66,474 | ||
Seres Therapeutics, Inc.(1) | 24,982 | 725,727 | ||
Spectrum Pharmaceuticals, Inc.(1) | 63,007 | 413,956 | ||
| 19,861,941 | ||||
| Building Products — 3.7% | ||||
American Woodmark Corp.(1) | 18,813 | 1,248,807 | ||
| Apogee Enterprises, Inc. | 52,050 | 2,412,517 | ||
Continental Building Products, Inc.(1) | 98,055 | 2,179,763 | ||
Gibraltar Industries, Inc.(1) | 13,232 | 417,734 | ||
| Insteel Industries, Inc. | 26,810 | 766,498 | ||
Masonite International Corp.(1) | 36,116 | 2,388,712 | ||
NCI Building Systems, Inc.(1) | 32,915 | 526,311 | ||
Nortek, Inc.(1) | 3,297 | 195,545 | ||
Patrick Industries, Inc.(1) | 17,750 | 1,070,148 | ||
Ply Gem Holdings, Inc.(1) | 31,453 | 458,270 | ||
| Universal Forest Products, Inc. | 29,891 | 2,770,597 | ||
| 14,434,902 | ||||
| Capital Markets — 1.5% | ||||
| Evercore Partners, Inc., Class A | 46,922 | 2,073,483 | ||
| Moelis & Co., Class A | 69,311 | 1,559,498 | ||
| OM Asset Management plc | 34,363 | 458,746 | ||
Piper Jaffray Cos.(1) | 43,697 | 1,647,377 | ||
| 5,739,104 | ||||
| Chemicals — 2.6% | ||||
| FutureFuel Corp. | 17,761 | 193,240 | ||
| H.B. Fuller Co. | 55,132 | 2,425,257 | ||
| KMG Chemicals, Inc. | 7,422 | 192,898 | ||
Koppers Holdings, Inc.(1) | 21,330 | 655,471 | ||
| Minerals Technologies, Inc. | 41,838 | 2,376,398 | ||
OMNOVA Solutions, Inc.(1) | 22,970 | 166,532 | ||
8
| Shares | Value | |||
| Rayonier Advanced Materials, Inc. | 149,967 | $ | 2,038,052 | |
Trinseo SA(1) | 47,884 | 2,055,660 | ||
| 10,103,508 | ||||
| Commercial Services and Supplies — 3.4% | ||||
ARC Document Solutions, Inc.(1) | 184,093 | 716,122 | ||
| Brady Corp., Class A | 19,123 | 584,399 | ||
| Brink's Co. (The) | 45,842 | 1,306,039 | ||
| Deluxe Corp. | 47,394 | 3,145,540 | ||
| Ennis, Inc. | 102,675 | 1,969,306 | ||
| Herman Miller, Inc. | 81,180 | 2,426,470 | ||
| Interface, Inc. | 109,935 | 1,676,509 | ||
| Quad/Graphics, Inc. | 52,003 | 1,211,150 | ||
| West Corp. | 21,772 | 428,037 | ||
| 13,463,572 | ||||
| Communications Equipment — 2.1% | ||||
Ciena Corp.(1) | 123,770 | 2,320,687 | ||
Extreme Networks, Inc.(1) | 214,161 | 726,006 | ||
Infinera Corp.(1) | 82,053 | 925,558 | ||
Ixia(1) | 26,526 | 260,485 | ||
NETGEAR, Inc.(1) | 50,466 | 2,399,154 | ||
Polycom, Inc.(1) | 150,774 | 1,696,208 | ||
| 8,328,098 | ||||
| Construction and Engineering — 0.9% | ||||
Aegion Corp.(1) | 22,844 | 445,687 | ||
MasTec, Inc.(1) | 111,691 | 2,492,943 | ||
Tutor Perini Corp.(1) | 28,120 | 662,226 | ||
| 3,600,856 | ||||
| Consumer Finance — 0.7% | ||||
Regional Management Corp.(1) | 69,991 | 1,026,068 | ||
World Acceptance Corp.(1) | 40,032 | 1,825,459 | ||
| 2,851,527 | ||||
| Containers and Packaging — 0.9% | ||||
Berry Plastics Group, Inc.(1) | 62,917 | 2,444,325 | ||
| Graphic Packaging Holding Co. | 98,031 | 1,229,309 | ||
| 3,673,634 | ||||
| Diversified Consumer Services — 0.9% | ||||
| Capella Education Co. | 22,341 | 1,176,030 | ||
LifeLock, Inc.(1) | 26,040 | 411,692 | ||
Regis Corp.(1) | 30,630 | 381,344 | ||
Strayer Education, Inc.(1) | 28,757 | 1,412,832 | ||
| 3,381,898 | ||||
| Diversified Financial Services — 0.2% | ||||
| GAIN Capital Holdings, Inc. | 102,781 | 649,576 | ||
| MarketAxess Holdings, Inc. | 1,977 | 287,456 | ||
| 937,032 | ||||
| Diversified Telecommunication Services — 0.4% | ||||
| ATN International, Inc. | 8,891 | 691,809 | ||
FairPoint Communications, Inc.(1) | 46,997 | 689,916 | ||
General Communication, Inc., Class A(1) | 19,273 | 304,513 | ||
| 1,686,238 | ||||
9
| Shares | Value | |||
| Electric Utilities — 0.1% | ||||
| Spark Energy, Inc., Class A | 9,067 | $ | 299,664 | |
| Electrical Equipment — 0.9% | ||||
| AZZ, Inc. | 30,179 | 1,810,136 | ||
| General Cable Corp. | 132,156 | 1,679,703 | ||
| 3,489,839 | ||||
| Electronic Equipment, Instruments and Components — 3.3% | ||||
| Belden, Inc. | 41,423 | 2,500,706 | ||
Coherent, Inc.(1) | 27,945 | 2,564,792 | ||
II-VI, Inc.(1) | 10,534 | 197,618 | ||
QLogic Corp.(1) | 152,432 | 2,246,848 | ||
Sanmina Corp.(1) | 77,357 | 2,073,941 | ||
| SYNNEX Corp. | 13,774 | 1,306,051 | ||
Tech Data Corp.(1) | 26,971 | 1,937,866 | ||
| 12,827,822 | ||||
| Energy Equipment and Services — 0.7% | ||||
| Archrock, Inc. | 65,195 | 614,137 | ||
| Atwood Oceanics, Inc. | 94,056 | 1,177,581 | ||
Matrix Service Co.(1) | 8,517 | 140,445 | ||
McDermott International, Inc.(1) | 179,320 | 885,841 | ||
| 2,818,004 | ||||
| Food and Staples Retailing — 0.1% | ||||
| SpartanNash Co. | 18,556 | 567,442 | ||
| Food Products — 2.7% | ||||
| Cal-Maine Foods, Inc. | 47,932 | 2,124,346 | ||
| Dean Foods Co. | 142,255 | 2,573,393 | ||
Farmer Brothers Co.(1) | 4,075 | 130,645 | ||
| Fresh Del Monte Produce, Inc. | 36,868 | 2,006,725 | ||
Omega Protein Corp.(1) | 88,632 | 1,771,754 | ||
| Pilgrim's Pride Corp. | 32,584 | 830,240 | ||
Post Holdings, Inc.(1) | 4,792 | 396,250 | ||
Seaboard Corp.(1) | 242 | 694,695 | ||
| 10,528,048 | ||||
| Gas Utilities — 0.8% | ||||
| ONE Gas, Inc. | 45,862 | 3,053,951 | ||
| Health Care Equipment and Supplies — 4.0% | ||||
| Analogic Corp. | 23,041 | 1,830,377 | ||
Anika Therapeutics, Inc.(1) | 11,712 | 628,349 | ||
| Hill-Rom Holdings, Inc. | 23,445 | 1,182,800 | ||
ICU Medical, Inc.(1) | 23,007 | 2,594,039 | ||
Integra LifeSciences Holdings Corp.(1) | 35,569 | 2,837,695 | ||
| LeMaitre Vascular, Inc. | 40,514 | 578,135 | ||
LivaNova plc(1) | 24,747 | 1,243,042 | ||
Merit Medical Systems, Inc.(1) | 20,774 | 411,948 | ||
NxStage Medical, Inc.(1) | 21,183 | 459,247 | ||
OraSure Technologies, Inc.(1) | 202,583 | 1,197,266 | ||
Orthofix International NV(1) | 10,761 | 456,266 | ||
SurModics, Inc.(1) | 5,938 | 139,424 | ||
| West Pharmaceutical Services, Inc. | 30,904 | 2,344,996 | ||
| 15,903,584 | ||||
10
| Shares | Value | |||
| Health Care Providers and Services — 1.3% | ||||
Air Methods Corp.(1) | 13,489 | $ | 483,311 | |
| HealthSouth Corp. | 46,940 | 1,822,211 | ||
| Landauer, Inc. | 7,959 | 327,592 | ||
RadNet, Inc.(1) | 57,890 | 309,132 | ||
Triple-S Management Corp., Class B(1) | 11,130 | 271,906 | ||
WellCare Health Plans, Inc.(1) | 18,692 | 2,005,278 | ||
| 5,219,430 | ||||
| Health Care Technology — 1.1% | ||||
| Computer Programs & Systems, Inc. | 22,753 | 908,300 | ||
Medidata Solutions, Inc.(1) | 54,104 | 2,535,854 | ||
| Quality Systems, Inc. | 77,192 | 919,357 | ||
| 4,363,511 | ||||
| Hotels, Restaurants and Leisure — 3.6% | ||||
| Bloomin' Brands, Inc. | 136,916 | 2,446,689 | ||
| Bob Evans Farms, Inc. | 46,273 | 1,756,061 | ||
Boyd Gaming Corp.(1) | 121,180 | 2,229,712 | ||
| Churchill Downs, Inc. | 17,045 | 2,153,806 | ||
Diamond Resorts International, Inc.(1) | 93,200 | 2,792,272 | ||
| DineEquity, Inc. | 6,809 | 577,267 | ||
Isle of Capri Casinos, Inc.(1) | 111,041 | 2,034,271 | ||
| Sonic Corp. | 7,406 | 200,332 | ||
| Speedway Motorsports, Inc. | 7,081 | 125,688 | ||
| 14,316,098 | ||||
| Household Durables — 0.1% | ||||
ZAGG, Inc.(1) | 67,847 | 356,197 | ||
| Household Products — 0.3% | ||||
Central Garden & Pet Co.(1) | 59,498 | 1,291,702 | ||
| Independent Power and Renewable Electricity Producers — 1.2% | ||||
| NRG Yield, Inc., Class A | 137,731 | 2,096,266 | ||
| Ormat Technologies, Inc. | 58,741 | 2,570,506 | ||
| 4,666,772 | ||||
| Insurance — 2.9% | ||||
| AMERISAFE, Inc. | 26,697 | 1,634,390 | ||
| Argo Group International Holdings Ltd. | 16,460 | 854,274 | ||
eHealth, Inc.(1) | 8,025 | 112,510 | ||
| Federated National Holding Co. | 26,105 | 497,039 | ||
| Heritage Insurance Holdings, Inc. | 65,634 | 785,639 | ||
| Primerica, Inc. | 48,758 | 2,790,908 | ||
| Selective Insurance Group, Inc. | 69,700 | 2,663,237 | ||
| State National Cos., Inc. | 7,684 | 80,913 | ||
| United Insurance Holdings Corp. | 12,706 | 208,124 | ||
| Universal Insurance Holdings, Inc. | 89,894 | 1,670,231 | ||
| 11,297,265 | ||||
| Internet and Catalog Retail — 0.7% | ||||
| PetMed Express, Inc. | 22,721 | 426,246 | ||
Shutterfly, Inc.(1) | 51,186 | 2,385,779 | ||
| 2,812,025 | ||||
| Internet Software and Services — 4.3% | ||||
Brightcove, Inc.(1) | 10,582 | 93,121 | ||
Carbonite, Inc.(1) | 10,149 | 98,750 | ||
11
| Shares | Value | |||
comScore, Inc.(1) | 17,207 | $ | 410,903 | |
DHI Group, Inc.(1) | 55,348 | 344,818 | ||
| EarthLink Holdings Corp. | 292,502 | 1,872,013 | ||
Endurance International Group Holdings, Inc.(1) | 11,918 | 107,143 | ||
Everyday Health, Inc.(1) | 47,050 | 370,754 | ||
Five9, Inc.(1) | 15,722 | 187,092 | ||
| j2 Global, Inc. | 41,681 | 2,632,989 | ||
LogMeIn, Inc.(1) | 28,095 | 1,782,066 | ||
Monster Worldwide, Inc.(1) | 285,693 | 682,806 | ||
| NIC, Inc. | 7,955 | 174,533 | ||
Shutterstock, Inc.(1) | 53,046 | 2,429,507 | ||
Stamps.com, Inc.(1) | 26,964 | 2,357,193 | ||
TechTarget, Inc.(1) | 7,546 | 61,123 | ||
Web.com Group, Inc.(1) | 103,363 | 1,879,139 | ||
XO Group, Inc.(1) | 83,217 | 1,450,472 | ||
| 16,934,422 | ||||
| IT Services — 2.3% | ||||
CACI International, Inc., Class A(1) | 11,951 | 1,080,490 | ||
| Convergys Corp. | 28,317 | 707,925 | ||
| CSG Systems International, Inc. | 49,730 | 2,004,616 | ||
| EVERTEC, Inc. | 45,201 | 702,423 | ||
NeuStar, Inc., Class A(1) | 97,453 | 2,291,120 | ||
| Travelport Worldwide Ltd. | 169,539 | 2,185,358 | ||
| 8,971,932 | ||||
| Leisure Products — 0.9% | ||||
Nautilus, Inc.(1) | 54,531 | 972,833 | ||
Smith & Wesson Holding Corp.(1) | 94,079 | 2,557,067 | ||
| 3,529,900 | ||||
| Life Sciences Tools and Services — 1.3% | ||||
Cambrex Corp.(1) | 50,529 | 2,613,865 | ||
INC Research Holdings, Inc., Class A(1) | 45,951 | 1,752,112 | ||
Luminex Corp.(1) | 43,617 | 882,372 | ||
| 5,248,349 | ||||
| Machinery — 2.2% | ||||
| Albany International Corp., Class A | 19,469 | 777,397 | ||
| Global Brass & Copper Holdings, Inc. | 81,401 | 2,221,433 | ||
Lydall, Inc.(1) | 10,376 | 400,099 | ||
| Mueller Industries, Inc., Class A | 74,767 | 2,383,572 | ||
| Mueller Water Products, Inc., Class A | 62,934 | 718,706 | ||
Wabash National Corp.(1) | 164,491 | 2,089,036 | ||
| 8,590,243 | ||||
| Media — 1.3% | ||||
| AMC Entertainment Holdings, Inc., Class A | 78,391 | 2,164,376 | ||
| Entercom Communications Corp., Class A | 35,193 | 477,569 | ||
| Nexstar Broadcasting Group, Inc., Class A | 46,298 | 2,202,859 | ||
| tronc, Inc. | 14,013 | 193,379 | ||
| 5,038,183 | ||||
| Metals and Mining — 2.8% | ||||
| Carpenter Technology Corp. | 42,218 | 1,390,239 | ||
Coeur Mining, Inc.(1) | 256,700 | 2,736,422 | ||
| Commercial Metals Co. | 148,566 | 2,510,765 | ||
12
| Shares | Value | |||
| Kaiser Aluminum Corp. | 19,375 | $ | 1,751,694 | |
Ryerson Holding Corp.(1) | 12,457 | 217,997 | ||
| Schnitzer Steel Industries, Inc., Class A | 14,512 | 255,411 | ||
| TimkenSteel Corp. | 84,321 | 811,168 | ||
| Worthington Industries, Inc. | 28,456 | 1,203,689 | ||
| 10,877,385 | ||||
| Multiline Retail — 0.9% | ||||
| Big Lots, Inc. | 50,272 | 2,519,130 | ||
Ollie's Bargain Outlet Holdings, Inc.(1) | 42,740 | 1,063,799 | ||
| 3,582,929 | ||||
| Oil, Gas and Consumable Fuels — 0.5% | ||||
Clean Energy Fuels Corp.(1) | 86,677 | 300,769 | ||
| DHT Holdings, Inc. | 154,635 | 777,814 | ||
Par Pacific Holdings, Inc.(1) | 49,487 | 759,131 | ||
| 1,837,714 | ||||
| Paper and Forest Products — 0.8% | ||||
Clearwater Paper Corp.(1) | 18,048 | 1,179,798 | ||
| Schweitzer-Mauduit International, Inc. | 56,580 | 1,996,142 | ||
| 3,175,940 | ||||
| Personal Products — 0.6% | ||||
| Medifast, Inc. | 41,213 | 1,371,156 | ||
| Natural Health Trends Corp. | 34,151 | 962,717 | ||
| 2,333,873 | ||||
| Pharmaceuticals — 1.8% | ||||
Depomed, Inc.(1) | 24,322 | 477,198 | ||
Heska Corp.(1) | 3,176 | 118,052 | ||
| Innoviva, Inc. | 138,015 | 1,453,298 | ||
Prestige Brands Holdings, Inc.(1) | 46,314 | 2,565,795 | ||
SciClone Pharmaceuticals, Inc.(1) | 35,429 | 462,703 | ||
Sucampo Pharmaceuticals, Inc., Class A(1) | 51,905 | 569,398 | ||
Supernus Pharmaceuticals, Inc.(1) | 60,719 | 1,236,846 | ||
| 6,883,290 | ||||
| Professional Services — 0.9% | ||||
| Barrett Business Services, Inc. | 5,283 | 218,293 | ||
ICF International, Inc.(1) | 22,949 | 938,614 | ||
| Kelly Services, Inc., Class A | 8,045 | 152,614 | ||
RPX Corp.(1) | 12,757 | 116,982 | ||
TriNet Group, Inc.(1) | 96,852 | 2,013,553 | ||
| 3,440,056 | ||||
| Real Estate Investment Trusts (REITs) — 7.9% | ||||
| Anworth Mortgage Asset Corp. | 44,572 | 209,488 | ||
| Armada Hoffler Properties, Inc. | 52,904 | 726,901 | ||
| Chesapeake Lodging Trust | 56,128 | 1,304,976 | ||
| Colony Capital, Inc. | 28,628 | 439,440 | ||
| CoreSite Realty Corp. | 32,200 | 2,855,818 | ||
| CyrusOne, Inc. | 23,342 | 1,299,216 | ||
| DiamondRock Hospitality Co. | 86,210 | 778,476 | ||
| FelCor Lodging Trust, Inc. | 342,195 | 2,131,875 | ||
| GEO Group, Inc. (The) | 52,885 | 1,807,609 | ||
| Government Properties Income Trust | 59,175 | 1,364,575 | ||
| Investors Real Estate Trust | 159,743 | 1,033,537 | ||
13
| Shares | Value | |||
| Medical Properties Trust, Inc. | 86,633 | $ | 1,317,688 | |
| Monmouth Real Estate Investment Corp. | 23,787 | 315,416 | ||
| National Storage Affiliates Trust | 13,555 | 282,215 | ||
| New Senior Investment Group, Inc. | 38,829 | 414,694 | ||
| Pennsylvania Real Estate Investment Trust | 105,854 | 2,270,568 | ||
| PS Business Parks, Inc. | 24,232 | 2,570,531 | ||
| Resource Capital Corp. | 51,633 | 664,000 | ||
| Ryman Hospitality Properties, Inc. | 50,909 | 2,578,541 | ||
| Saul Centers, Inc. | 1,404 | 86,641 | ||
| Summit Hotel Properties, Inc. | 187,024 | 2,476,198 | ||
| Sunstone Hotel Investors, Inc. | 215,667 | 2,603,101 | ||
| Xenia Hotels & Resorts, Inc. | 95,842 | 1,608,229 | ||
| 31,139,733 | ||||
| Real Estate Management and Development — 1.5% | ||||
Altisource Portfolio Solutions SA(1) | 69,169 | 1,925,665 | ||
Forestar Group, Inc.(1) | 14,892 | 177,066 | ||
Marcus & Millichap, Inc.(1) | 53,165 | 1,350,923 | ||
| RE/MAX Holdings, Inc., Class A | 58,102 | 2,339,186 | ||
| 5,792,840 | ||||
| Road and Rail — 0.2% | ||||
YRC Worldwide, Inc.(1) | 99,035 | 871,508 | ||
| Semiconductors and Semiconductor Equipment — 3.0% | ||||
Advanced Energy Industries, Inc.(1) | 62,683 | 2,379,447 | ||
Cirrus Logic, Inc.(1) | 29,832 | 1,157,183 | ||
Inphi Corp.(1) | 27,126 | 868,846 | ||
Integrated Device Technology, Inc.(1) | 119,131 | 2,398,107 | ||
| IXYS Corp. | 13,459 | 137,955 | ||
MaxLinear, Inc., Class A(1) | 88,027 | 1,582,725 | ||
NeoPhotonics Corp.(1) | 53,249 | 507,463 | ||
Rudolph Technologies, Inc.(1) | 22,791 | 353,944 | ||
Synaptics, Inc.(1) | 31,980 | 1,718,925 | ||
| Tessera Technologies, Inc. | 18,934 | 580,138 | ||
| 11,684,733 | ||||
| Software — 4.2% | ||||
A10 Networks, Inc.(1) | 21,317 | 137,921 | ||
ACI Worldwide, Inc.(1) | 12,246 | 238,920 | ||
Aspen Technology, Inc.(1) | 60,924 | 2,451,582 | ||
Barracuda Networks, Inc.(1) | 74,235 | 1,123,918 | ||
BroadSoft, Inc.(1) | 8,844 | 362,869 | ||
Gigamon, Inc.(1) | 66,403 | 2,482,808 | ||
Manhattan Associates, Inc.(1) | 30,167 | 1,934,610 | ||
MicroStrategy, Inc., Class A(1) | 14,652 | 2,564,393 | ||
| Pegasystems, Inc. | 53,936 | 1,453,575 | ||
Qualys, Inc.(1) | 4,051 | 120,760 | ||
RealPage, Inc.(1) | 10,236 | 228,570 | ||
Rovi Corp.(1) | 83,660 | 1,308,442 | ||
Rubicon Project, Inc. (The)(1) | 35,467 | 484,125 | ||
Silver Spring Networks, Inc.(1) | 21,832 | 265,259 | ||
VASCO Data Security International, Inc.(1) | 63,042 | 1,033,258 | ||
Zix Corp.(1) | 83,887 | 314,576 | ||
| 16,505,586 | ||||
14
| Shares | Value | |||
| Specialty Retail — 1.8% | ||||
| American Eagle Outfitters, Inc. | 173,399 | $ | 2,762,246 | |
| Children's Place, Inc. (The) | 26,693 | 2,140,245 | ||
Express, Inc.(1) | 127,874 | 1,855,452 | ||
Party City Holdco, Inc.(1) | 24,192 | 336,510 | ||
Sportsman's Warehouse Holdings, Inc.(1) | 9,637 | 77,674 | ||
| 7,172,127 | ||||
| Technology Hardware, Storage and Peripherals — 0.4% | ||||
Cray, Inc.(1) | 20,179 | 603,755 | ||
Stratasys Ltd.(1) | 43,021 | 984,751 | ||
| 1,588,506 | ||||
| Textiles, Apparel and Luxury Goods — 0.5% | ||||
Delta Apparel, Inc.(1) | 4,205 | 94,823 | ||
| Movado Group, Inc. | 20,668 | 448,082 | ||
Perry Ellis International, Inc.(1) | 68,015 | 1,368,462 | ||
| 1,911,367 | ||||
| Thrifts and Mortgage Finance — 1.3% | ||||
BofI Holding, Inc.(1) | 110,705 | 1,960,585 | ||
Essent Group Ltd.(1) | 105,881 | 2,309,265 | ||
| Meta Financial Group, Inc. | 6,988 | 356,108 | ||
NMI Holdings, Inc., Class A(1) | 65,258 | 357,614 | ||
| 4,983,572 | ||||
| Trading Companies and Distributors — 0.1% | ||||
Veritiv Corp.(1) | 7,030 | 264,187 | ||
| Wireless Telecommunication Services — 0.1% | ||||
| Spok Holdings, Inc. | 29,774 | 570,619 | ||
TOTAL COMMON STOCKS (Cost $365,433,365) | 388,781,796 | |||
| TEMPORARY CASH INVESTMENTS — 1.0% | ||||
| Repurchase Agreement, Fixed Income Clearing Corp., (collateralized by various U.S. Treasury obligations, 3.00%, 5/15/45, valued at $4,134,250), at 0.20%, dated 6/30/16, due 7/1/16 (Delivery value $4,049,022) | 4,049,000 | |||
| State Street Institutional Liquid Reserves Fund, Premier Class | 3,334 | 3,334 | ||
TOTAL TEMPORARY CASH INVESTMENTS (Cost $4,052,334) | 4,052,334 | |||
TOTAL INVESTMENT SECURITIES — 100.1% (Cost $369,485,699) | 392,834,130 | |||
| OTHER ASSETS AND LIABILITIES — (0.1)% | (496,896) | |||
| TOTAL NET ASSETS — 100.0% | $ | 392,337,234 | ||
| NOTES TO SCHEDULE OF INVESTMENTS |
| (1) | Non-income producing. |
See Notes to Financial Statements.
15
| Statement of Assets and Liabilities |
| JUNE 30, 2016 | |||
| Assets | |||
| Investment securities, at value (cost of $369,485,699) | $ | 392,834,130 | |
| Receivable for investments sold | 10,570,463 | ||
| Receivable for capital shares sold | 240,289 | ||
| Dividends and interest receivable | 343,673 | ||
| 403,988,555 | |||
| Liabilities | |||
| Payable for investments purchased | 11,436,928 | ||
| Accrued management fees | 213,875 | ||
| Accrued other expenses | 518 | ||
| 11,651,321 | |||
| Net Assets | $ | 392,337,234 | |
| Institutional Class Capital Shares, $0.01 Par Value | |||
| Shares authorized | 225,000,000 | ||
| Shares outstanding | 46,106,670 | ||
| Net Asset Value Per Share | $ | 8.51 | |
| Net Assets Consist of: | |||
| Capital (par value and paid-in surplus) | $ | 381,264,384 | |
| Undistributed net investment income | 1,134,001 | ||
| Accumulated net realized loss | (13,409,582 | ) | |
| Net unrealized appreciation | 23,348,431 | ||
| $ | 392,337,234 | ||
See Notes to Financial Statements.
16
| Statement of Operations |
| YEAR ENDED JUNE 30, 2016 | |||
| Investment Income (Loss) | |||
| Income: | |||
| Dividends (net of foreign taxes withheld of $471) | $ | 4,461,348 | |
| Interest | 4,184 | ||
| 4,465,532 | |||
| Expenses: | |||
| Management fees | 2,405,776 | ||
| Directors' fees and expenses | 21,093 | ||
| Other expenses | 1,353 | ||
| 2,428,222 | |||
| Net investment income (loss) | 2,037,310 | ||
| Realized and Unrealized Gain (Loss) | |||
| Net realized gain (loss) on: | |||
| Investment transactions | (10,570,777 | ) | |
| Futures contract transactions | 109,818 | ||
| Foreign currency transactions | (68 | ) | |
| (10,461,027 | ) | ||
| Change in net unrealized appreciation (depreciation) on investments | (17,740,038 | ) | |
| Net realized and unrealized gain (loss) | (28,201,065 | ) | |
| Net Increase (Decrease) in Net Assets Resulting from Operations | $ | (26,163,755 | ) |
See Notes to Financial Statements.
17
| Statement of Changes in Net Assets |
| YEARS ENDED JUNE 30, 2016 AND JUNE 30, 2015 | ||||||
| Increase (Decrease) in Net Assets | June 30, 2016 | June 30, 2015 | ||||
| Operations | ||||||
| Net investment income (loss) | $ | 2,037,310 | $ | 1,616,444 | ||
| Net realized gain (loss) | (10,461,027 | ) | 44,852,665 | |||
| Change in net unrealized appreciation (depreciation) | (17,740,038 | ) | (23,576,735 | ) | ||
| Net increase (decrease) in net assets resulting from operations | (26,163,755 | ) | 22,892,374 | |||
| Distributions to Shareholders | ||||||
| From net investment income | (2,048,986 | ) | (1,036,862 | ) | ||
| From net realized gains | (27,355,643 | ) | (45,882,682 | ) | ||
| Decrease in net assets from distributions | (29,404,629 | ) | (46,919,544 | ) | ||
| Capital Share Transactions | ||||||
| Proceeds from shares sold | 90,177,917 | 71,435,059 | ||||
| Proceeds from reinvestment of distributions | 29,404,629 | 46,919,544 | ||||
| Payments for shares redeemed | (24,851,004 | ) | (112,283,342 | ) | ||
| Net increase (decrease) in net assets from capital share transactions | 94,731,542 | 6,071,261 | ||||
| Net increase (decrease) in net assets | 39,163,158 | (17,955,909 | ) | |||
| Net Assets | ||||||
| Beginning of period | 353,174,076 | 371,129,985 | ||||
| End of period | $ | 392,337,234 | $ | 353,174,076 | ||
| Undistributed net investment income | $ | 1,134,001 | $ | 1,052,907 | ||
| Transactions in Shares of the Fund | ||||||
| Sold | 10,652,784 | 6,976,850 | ||||
| Issued in reinvestment of distributions | 3,441,188 | 5,013,513 | ||||
| Redeemed | (2,848,522 | ) | (10,862,964 | ) | ||
| Net increase (decrease) in shares of the fund | 11,245,450 | 1,127,399 | ||||
See Notes to Financial Statements.
18
| Notes to Financial Statements |
JUNE 30, 2016
1. Organization
American Century Quantitative Equity Funds, Inc. (the corporation) is registered under the Investment Company Act of 1940, as amended (the 1940 Act), as an open-end management investment company and is organized as a Maryland corporation. NT Small Company Fund (the fund) is one fund in a series issued by the corporation. The fund’s investment objective is to seek long-term capital growth. The fund is not permitted to invest in securities issued by companies assigned the Global Industry Classification Standard for the tobacco industry.
2. Significant Accounting Policies
The following is a summary of significant accounting policies consistently followed by the fund in preparation of its financial statements. The fund is an investment company and follows accounting and reporting guidance in accordance with accounting principles generally accepted in the United States of America. This may require management to make certain estimates and assumptions at the date of the financial statements. Actual results could differ from these estimates. Management evaluated the impact of events or transactions occurring through the date the financial statements were issued that would merit recognition or disclosure.
Investment Valuations — The fund determines the fair value of its investments and computes its net asset value per share at the close of regular trading (usually 4 p.m. Eastern time) on the New York Stock Exchange (NYSE) on each day the NYSE is open. The Board of Directors has adopted valuation policies and procedures to guide the investment advisor in the fund’s investment valuation process and to provide methodologies for the oversight of the fund’s pricing function.
Equity securities that are listed or traded on a domestic securities exchange are valued at the last reported sales price or at the official closing price as provided by the exchange. Equity securities traded on foreign securities exchanges are generally valued at the closing price of such securities on the exchange where primarily traded or at the close of the NYSE, if that is earlier. If no last sales price is reported, or if local convention or regulation so provides, the mean of the latest bid and asked prices may be used. Securities traded over-the-counter are valued at the mean of the latest bid and asked prices, the last sales price, or the official closing price. Equity securities initially expressed in local currencies are translated into U.S. dollars at the mean of the appropriate currency exchange rate at the close of the NYSE as provided by an independent pricing service.
Open-end management investment companies are valued at the reported net asset value per share. Repurchase agreements are valued at cost, which approximates fair value. Exchange-traded futures contracts are valued at the settlement price as provided by the appropriate clearing corporation.
If the fund determines that the market price for an investment is not readily available or the valuation methods mentioned above do not reflect an investment’s fair value, such investment is valued as determined in good faith by the Board of Directors or its delegate, in accordance with policies and procedures adopted by the Board of Directors. In its determination of fair value, the fund may review several factors including, but not limited to, market information regarding the specific investment or comparable investments and correlation with other investment types, futures indices or general market indicators. Circumstances that may cause the fund to use these procedures to value an investment include, but are not limited to: an investment has been declared in default or is distressed; trading in a security has been suspended during the trading day or a security is not actively trading on its principal exchange; prices received from a regular pricing source are deemed unreliable; or there is a foreign market holiday and no trading occurred.
The fund monitors for significant events occurring after the close of an investment’s primary exchange but before the fund’s net asset value per share is determined. Significant events may include, but are not limited to: corporate announcements and transactions; governmental action and political unrest that could impact a specific investment or an investment sector; or armed conflicts, natural disasters and similar events that could affect investments in a specific country or region. The fund also monitors for significant fluctuations between domestic and foreign markets, as evidenced by the U.S. market or such other indicators that the Board of Directors, or its delegate, deems appropriate. If significant fluctuations in foreign markets are identified, the
19
fund may apply a model-derived factor to the closing price of equity securities traded on foreign securities exchanges. The factor is based on observable market data as provided by an independent pricing service.
Security Transactions — Security transactions are accounted for as of the trade date. Net realized gains and losses are determined on the identified cost basis, which is also used for federal income tax purposes.
Investment Income — Dividend income less foreign taxes withheld, if any, is recorded as of the ex-dividend date. Distributions received on securities that represent a return of capital or long-term capital gain are recorded as a reduction of cost of investments and/or as a realized gain. The fund may estimate the components of distributions received that may be considered nontaxable distributions or long-term capital gain distributions for income tax purposes. Interest income is recorded on the accrual basis and includes accretion of discounts and amortization of premiums.
Foreign Currency Translations — All assets and liabilities initially expressed in foreign currencies are translated into U.S. dollars at prevailing exchange rates at period end. The fund may enter into spot foreign currency exchange contracts to facilitate transactions denominated in a foreign currency. Purchases and sales of investment securities, dividend and interest income, spot foreign currency exchange contracts, and expenses are translated at the rates of exchange prevailing on the respective dates of such transactions. Net realized and unrealized foreign currency exchange gains or losses related to investment securities are a component of net realized gain (loss) on investment transactions and change in net unrealized appreciation (depreciation) on investments, respectively.
Repurchase Agreements — The fund may enter into repurchase agreements with institutions that American Century Investment Management, Inc. (ACIM) (the investment advisor) has determined are creditworthy pursuant to criteria adopted by the Board of Directors. The fund requires that the collateral, represented by securities, received in a repurchase transaction be transferred to the custodian in a manner sufficient to enable the fund to obtain those securities in the event of a default under the repurchase agreement. ACIM monitors, on a daily basis, the securities transferred to ensure the value, including accrued interest, of the securities under each repurchase agreement is equal to or greater than amounts owed to the fund under each repurchase agreement.
Joint Trading Account — Pursuant to an Exemptive Order issued by the Securities and Exchange Commission, the fund, along with certain other funds in the American Century Investments family of funds, may transfer uninvested cash balances into a joint trading account. These balances are invested in one or more repurchase agreements that are collateralized by U.S. Treasury or Agency obligations.
Segregated Assets — In accordance with the 1940 Act, the fund segregates assets on its books and records to cover futures contracts. ACIM monitors, on a daily basis, the securities segregated to ensure the fund designates a sufficient amount of liquid assets, marked-to-market daily. The fund may also receive assets or be required to pledge assets at the custodian bank or with a broker for margin requirements on futures contracts.
Income Tax Status — It is the fund’s policy to distribute substantially all net investment income and net realized gains to shareholders and to otherwise qualify as a regulated investment company under provisions of the Internal Revenue Code. Accordingly, no provision has been made for income taxes. The fund files U.S. federal, state, local and non-U.S. tax returns as applicable. The fund's tax returns are subject to examination by the relevant taxing authority until expiration of the applicable statute of limitations, which is generally three years from the date of filing but can be longer in certain jurisdictions. At this time, management believes there are no uncertain tax positions which, based on their technical merit, would not be sustained upon examination and for which it is reasonably possible that the total amounts of unrecognized tax benefits will significantly change in the next twelve months.
Distributions to Shareholders — Distributions from net investment income, if any, are generally declared and paid quarterly. Distributions from net realized gains, if any, are generally declared and paid annually.
Indemnifications — Under the corporation’s organizational documents, its officers and directors are indemnified against certain liabilities arising out of the performance of their duties to the fund. In addition, in the normal course of business, the fund enters into contracts that provide general indemnifications. The maximum exposure under these arrangements is unknown as this would involve future claims that may be made against a fund. The risk of material loss from such claims is considered by management to be remote.
20
3. Fees and Transactions with Related Parties
Certain officers and directors of the corporation are also officers and/or directors of American Century Companies, Inc. (ACC). The corporation’s investment advisor, ACIM, the corporation's distributor, American Century Investment Services, Inc., and the corporation’s transfer agent, American Century Services, LLC, are wholly owned, directly or indirectly, by ACC. Various funds issued by American Century Asset Allocation Portfolios, Inc. own, in aggregate, 100% of the shares of the fund. Related parties do not invest in the fund for the purpose of exercising management or control.
Management Fees — The corporation has entered into a management agreement with ACIM, under which ACIM provides the fund with investment advisory and management services in exchange for a single, unified management fee (the fee). The agreement provides that all expenses of managing and operating the fund, except distribution and service fees, brokerage expenses, taxes, interest, fees and expenses of the independent directors (including legal counsel fees), and extraordinary expenses, will be paid by ACIM. The fee is computed and accrued daily based on the daily net assets of the fund and paid monthly in arrears. The fee consists of (1) an Investment Category Fee based on the daily net assets of the fund and certain other accounts managed by the investment advisor that are in the same broad investment category as the fund and (2) a Complex Fee based on the assets of all the funds in the American Century Investments family of funds. The rates for the Investment Category Fee range from 0.5380% to 0.7200%. The rates for the Complex Fee range from 0.0500% to 0.1100%. The effective annual management fee for the year ended June 30, 2016 was 0.66%.
Directors' Fees and Expenses — The Board of Directors is responsible for overseeing the investment advisor’s management and operations of the fund. The directors receive detailed information about the fund and its investment advisor regularly throughout the year, and meet at least quarterly with management of the investment advisor to review reports about fund operations. The fund’s officers do not receive compensation from the fund.
Interfund Transactions — The fund may enter into security transactions with other American Century Investments funds and other client accounts of the investment advisor, in accordance with the 1940 Act rules and procedures adopted by the Board of Directors. The rules and procedures require, among other things, that these transactions be effected at the independent current market price of the security. During the period, the interfund purchases and sales were $2,761,614 and $6,121,068, respectively.
4. Investment Transactions
Purchases and sales of investment securities, excluding short-term investments, for the year ended June 30, 2016 were $453,227,440 and $386,294,577, respectively.
5. Fair Value Measurements
The fund’s investments valuation process is based on several considerations and may use multiple inputs to determine the fair value of the investments held by the fund. In conformity with accounting principles generally accepted in the United States of America, the inputs used to determine a valuation are classified into three broad levels.
| • | Level 1 valuation inputs consist of unadjusted quoted prices in an active market for identical investments. |
| • | Level 2 valuation inputs consist of direct or indirect observable market data (including quoted prices for comparable investments, evaluations of subsequent market events, interest rates, prepayment speeds, credit risk, etc.). These inputs also consist of quoted prices for identical investments initially expressed in local currencies that are adjusted through translation into U.S. dollars. |
| • | Level 3 valuation inputs consist of unobservable data (including a fund’s own assumptions). |
The level classification is based on the lowest level input that is significant to the fair valuation measurement. The valuation inputs are not necessarily an indication of the risks associated with investing in these securities or other financial instruments. There were no significant transfers between levels during the period.
21
The following is a summary of the level classifications as of period end. The Schedule of Investments provides additional information on the fund’s portfolio holdings.
| Level 1 | Level 2 | Level 3 | ||||||
| Assets | ||||||||
| Investment Securities | ||||||||
| Common Stocks | $ | 388,781,796 | — | — | ||||
| Temporary Cash Investments | 3,334 | $ | 4,049,000 | — | ||||
| $ | 388,785,130 | $ | 4,049,000 | — | ||||
6. Derivative Instruments
Equity Price Risk — The fund is subject to equity price risk in the normal course of pursuing its investment objectives. A fund may enter into futures contracts based on an equity index in order to manage its exposure to changes in market conditions. A fund may purchase futures contracts to gain exposure to increases in market value or sell futures contracts to protect against a decline in market value. Upon entering into a futures contract, a fund is required to deposit either cash or securities in an amount equal to a certain percentage of the contract value (initial margin). Subsequent payments (variation margin) are made or received daily, in cash, by a fund. The variation margin is equal to the daily change in the contract value and is recorded as unrealized gains and losses. A fund recognizes a realized gain or loss when the contract is closed or expires. Net realized and unrealized gains or losses occurring during the holding period of futures contracts are a component of net realized gain (loss) on futures contract transactions and change in net unrealized appreciation (depreciation) on futures contracts, respectively. One of the risks of entering into futures contracts is the possibility that the change in value of the contract may not correlate with the changes in value of the underlying securities. During the period, the fund participated in equity price risk derivative instruments for temporary investment purposes.
At period end, the fund did not have any derivative instruments disclosed on the Statement of Assets and Liabilities. For the year ended June 30, 2016, the effect of equity price risk derivative instruments on the Statement of Operations was $109,818 in net realized gain (loss) on futures contract transactions.
7. Risk Factors
The fund’s investment process may result in high portfolio turnover, which could mean high transaction costs, affecting both performance and capital gains tax liabilities to investors.
The fund invests in common stocks of small companies. Because of this, the fund may be subject to greater risk and market fluctuations than a fund investing in larger, more established companies.
8. Federal Tax Information
The tax character of distributions paid during the years ended June 30, 2016 and June 30, 2015 were as follows:
| 2016 | 2015 | |||||
| Distributions Paid From | ||||||
| Ordinary income | $ | 4,553,985 | $ | 11,136,377 | ||
| Long-term capital gains | $ | 24,850,644 | $ | 35,783,167 | ||
The book-basis character of distributions made during the year from net investment income or net realized gains may differ from their ultimate characterization for federal income tax purposes. These differences reflect the differing character of certain income items and net realized gains and losses for financial statement and tax purposes, and may result in reclassification among certain capital accounts on the financial statements.
22
As of June 30, 2016, the federal tax cost of investments and the components of distributable earnings on a tax-basis were as follows:
| Federal tax cost of investments | $ | 371,010,419 | |
| Gross tax appreciation of investments | $ | 44,503,237 | |
| Gross tax depreciation of investments | (22,679,526 | ) | |
| Net tax appreciation (depreciation) of investments | $ | 21,823,711 | |
| Undistributed ordinary income | $ | 1,134,001 | |
| Post-October capital loss deferral | $ | (11,884,862 | ) |
The difference between book-basis and tax-basis unrealized appreciation (depreciation) is attributable primarily to the tax deferral of losses on wash sales.
Loss deferrals represent certain qualified losses that the fund has elected to treat as having been incurred in the following fiscal year for federal income tax purposes.
23
| Financial Highlights |
| For a Share Outstanding Throughout the Years Ended June 30 (except as noted) | |||||||||||||||
| Per-Share Data | Ratios and Supplemental Data | ||||||||||||||
| Income From Investment Operations: | Distributions From: | Ratio to Average Net Assets of: | |||||||||||||
Net Asset Value, Beginning of Period | Net Investment Income (Loss)(1) | Net Realized and Unrealized Gain (Loss) | Total From Investment Operations | Net Investment Income | Net Realized Gains | Total Distributions | Net Asset Value, End of Period | Total Return(2) | Operating Expenses | Net Investment Income (Loss) | Portfolio Turnover Rate | Net Assets, End of Period (in thousands) | |||
| Institutional Class | |||||||||||||||
| 2016 | $10.13 | 0.05 | (0.89) | (0.84) | (0.05) | (0.73) | (0.78) | $8.51 | (8.27)% | 0.67% | 0.56% | 107% | $392,337 | ||
| 2015 | $11.00 | 0.04 | 0.41 | 0.45 | (0.03) | (1.29) | (1.32) | $10.13 | 5.12% | 0.67% | 0.43% | 119% | $353,174 | ||
| 2014 | $9.89 | 0.04 | 2.48 | 2.52 | (0.04) | (1.37) | (1.41) | $11.00 | 26.77% | 0.67% | 0.38% | 96% | $371,130 | ||
| 2013 | $8.27 | 0.10 | 2.03 | 2.13 | (0.10) | (0.41) | (0.51) | $9.89 | 26.98% | 0.68% | 1.12% | 106% | $255,865 | ||
| 2012 | $9.17 | 0.06 | (0.23) | (0.17) | (0.03) | (0.70) | (0.73) | $8.27 | (0.98)% | 0.68% | 0.67% | 86% | $177,436 | ||
| Notes to Financial Highlights |
| (1) | Computed using average shares outstanding throughout the period. |
| (2) | Total returns are calculated based on the net asset value of the last business day. Total returns for periods less than one year are not annualized. |
See Notes to Financial Statements.
| Report of Independent Registered Public Accounting Firm |
To the Directors of the American Century Quantitative Equity Funds, Inc. and Shareholders of the NT Small Company Fund:
In our opinion, the accompanying statement of assets and liabilities, including the schedule of investments, and the related statements of operations and of changes in net assets and the financial highlights present fairly, in all material respects, the financial position of the NT Small Company Fund (one of the sixteen funds comprising the American Century Quantitative Equity Funds, Inc., hereafter referred to as the “Fund”) at June 30, 2016, the results of its operations for the year then ended, the changes in its net assets for each of the two years in the period then ended and the financial highlights for each of the five years in the period then ended, in conformity with accounting principles generally accepted in the United States of America. These financial statements and financial highlights (hereafter referred to as "financial statements") are the responsibility of the Fund's management. Our responsibility is to express an opinion on these financial statements based on our audits. We conducted our audits of these financial statements in accordance with the standards of the Public Company Accounting Oversight Board (United States). Those standards require that we plan and perform the audit to obtain reasonable assurance about whether the financial statements are free of material misstatement. An audit includes examining, on a test basis, evidence supporting the amounts and disclosures in the financial statements, assessing the accounting principles used and significant estimates made by management, and evaluating the overall financial statement presentation. We believe that our audits, which included confirmation of securities at June 30, 2016 by correspondence with the custodian and brokers, provide a reasonable basis for our opinion.
PricewaterhouseCoopers LLP
Kansas City, Missouri
August 17, 2016
25
| Management |
Board of Directors
The individuals listed below serve as directors of the funds. Each director will continue to serve in this capacity until death, retirement, resignation or removal from office. The board has adopted a mandatory retirement age for directors who are not “interested persons,” as that term is defined in the Investment Company Act (independent directors). Independent directors shall retire on December 31 of the year in which they reach their 75th birthday; provided, however, that on or after January 1, 2022, independent directors shall retire on December 31 of the year in which they reach their 76th birthday.
Mr. Thomas is an “interested person” because he currently serves as President and Chief Executive Officer of American Century Companies, Inc. (ACC), the parent company of American Century Investment Management, Inc. (ACIM or the advisor). The other directors (more than three-fourths of the total number) are independent. They are not employees, directors or officers of, and have no financial interest in, ACC or any of its wholly owned, direct or indirect, subsidiaries, including ACIM, American Century Investment Services, Inc. (ACIS) and American Century Services, LLC (ACS), and they do not have any other affiliations, positions or relationships that would cause them to be considered “interested persons” under the Investment Company Act. The directors serve in this capacity for eight (in the case of Mr. Thomas, 15) registered investment companies in the American Century Investments family of funds.
The following table presents additional information about the directors. The mailing address for each director other than Mr. Thomas is 1665 Charleston Road, Mountain View, California 94043. The mailing address for Mr. Thomas is 4500 Main Street, Kansas City, Missouri 64111.
Name (Year of Birth) | Position(s) Held with Funds | Length of Time Served | Principal Occupation(s) During Past 5 Years | Number of American Century Portfolios Overseen by Director | Other Directorships Held During Past 5 Years |
| Independent Directors | |||||
| Tanya S. Beder (1955) | Director | Since 2011 | Chairman and CEO, SBCC Group Inc. (independent advisory services) (2006 to present) | 45 | CYS Investments, Inc. (NYSE mortgage arbitrage REIT) |
| Jeremy I. Bulow (1954) | Director | Since 2011 | Professor of Economics, Stanford University, Graduate School of Business (1979 to present) | 45 | None |
| Anne Casscells (1958) | Director | Since 2016 | Co-Chief Executive Officer and Chief Investment Officer, Aetos Alternatives Management (investment advisory firm) (2001 to present); Lecturer in Accounting, Stanford University, Graduate School of Business (2009 to present) | 45 | None |
26
Name (Year of Birth) | Position(s) Held with Funds | Length of Time Served | Principal Occupation(s) During Past 5 Years | Number of American Century Portfolios Overseen by Director | Other Directorships Held During Past 5 Years |
| Independent Directors | |||||
| Ronald J. Gilson (1946) | Director and Chairman of the Board | Since 1995 (Chairman since 2005) | Charles J. Meyers Professor of Law and Business, Emeritus, Stanford Law School (1979 to present); Marc and Eva Stern Professor of Law and Business, Columbia University School of Law (1992 to present) | 45 | None |
| Frederick L. A. Grauer (1946) | Director | Since 2008 | Senior Advisor, iShares by BlackRock, Inc. (investment management firm) (2010 to 2011, 2013 to present); Senior Advisor, Course Hero (an educational technology company) (2015 to present) | 45 | None |
| Jonathan D. Levin (1972) | Director | Since 2016 | Holbrook Working Professor of Price Theory, Stanford University, (2000 to present); Chair, Department of Economics, Stanford University (2011 to 2014) | 45 | None |
| Peter F. Pervere (1947) | Director | Since 2007 | Retired | 45 | None |
| John B. Shoven (1947) | Director | Since 2002 | Charles R. Schwab Professor of Economics, Stanford University (1973 to present) | 45 | Cadence Design Systems; Exponent; Financial Engines |
| Interested Director | |||||
| Jonathan S. Thomas (1963) | Director and President | Since 2007 | President and Chief Executive Officer, ACC (March 2007 to present). Also serves as Chief Executive Officer, ACS; Executive Vice President, ACIM; Director, ACC, ACIM and other ACC subsidiaries | 128 | BioMed Valley Discoveries, Inc. |
The Statement of Additional Information has additional information about the fund's directors and is available without charge, upon request, by calling 1-800-345-2021.
27
Officers
The following table presents certain information about the executive officers of the funds. Each officer serves as an officer for each of the 15 investment companies in the American Century family of funds, unless otherwise noted. No officer is compensated for his or her service as an officer of the funds. The listed officers are interested persons of the funds and are appointed or re-appointed on an annual basis. The mailing address for each of the officers listed below is 4500 Main Street, Kansas City, Missouri 64111.
Name (Year of Birth) | Offices with the Funds | Principal Occupation(s) During the Past Five Years |
| Jonathan S. Thomas (1963) | Director and President since 2007 | President and Chief Executive Officer, ACC (March 2007 to present). Also serves as Chief Executive Officer, ACS; Executive Vice President, ACIM; Director, ACC, ACIM and other ACC subsidiaries |
| Amy D. Shelton (1964) | Chief Compliance Officer and Vice President since 2014 | Chief Compliance Officer, American Century funds, (March 2014 to present); Chief Compliance Officer, ACIM (February 2014 to present); Chief Compliance Officer, ACIS (October 2009 to present); Vice President, Client Interactions and Marketing, ACIS (February 2013 to January 2014); Director, Client Interactions and Marketing, ACIS (June 2007 to January 2013). Also serves as Vice President, ACIS |
| Charles A. Etherington (1957) | General Counsel since 2007 and Senior Vice President since 2006 | Attorney, ACC (February 1994 to present); Vice President, ACC (November 2005 to present); General Counsel, ACC (March 2007 to present). Also serves as General Counsel, ACIM, ACS, ACIS and other ACC subsidiaries; and Senior Vice President, ACIM and ACS |
| C. Jean Wade (1964) | Vice President, Treasurer and Chief Financial Officer since 2012 | Vice President, ACS (February 2000 to present) |
| Robert J. Leach (1966) | Vice President since 2006 and Assistant Treasurer since 2012 | Vice President, ACS (February 2000 to present) |
| David H. Reinmiller (1963) | Vice President since 2001 | Attorney, ACC (January 1994 to present); Associate General Counsel, ACC (January 2001 to present). Also serves as Vice President, ACIM and ACS |
| Ward D. Stauffer (1960) | Secretary since 2005 | Attorney, ACC (June 2003 to present) |
28
| Approval of Management Agreement |
At a meeting held on June 14, 2016, the Fund’s Board of Directors (the "Board") unanimously approved the renewal of the management agreement pursuant to which American Century Investment Management, Inc. (the “Advisor”) acts as the investment advisor for the Fund. Under Section 15(c) of the Investment Company Act, contracts for investment advisory services are required to be reviewed, evaluated, and approved by a majority of a fund’s directors/trustees, including a majority of the independent Directors, each year. The Board regards this annual evaluation and renewal as one of its most important responsibilities.
The independent Directors have memorialized a statement regarding the relationship between their ongoing obligations to oversee and evaluate the performance of the Advisor and their annual consideration of renewal of the management agreement. In that statement, the independent Directors noted that their assessment of the Advisor’s performance is an ongoing process that takes place over the entire year and is informed by all of the extensive information that the Board and its committees receive and consider over time. This information, together with the additional materials provided specifically in connection with the review, are central to the Board’s assessment of the Advisor’s performance and its determination whether to renew the Fund’s management agreement.
Prior to its consideration of the renewal of the management agreement, the Board requested and reviewed extensive data and analysis relating to the proposed renewal. This information and analysis was compiled by the Advisor and certain independent providers of evaluation data concerning the Fund and the services provided to the Fund by the Advisor.
In connection with its consideration of the renewal of the management agreement, the Board’s review and evaluation of the services provided by the Advisor included, but was not limited to, the following:
| • | the nature, extent, and quality of investment management, shareholder services, and other services provided by the Advisor to the Fund; |
| • | the wide range of other programs and services the Advisor provides to the Fund and its shareholders on a routine and non-routine basis; |
| • | the investment performance of the Fund, including data comparing the Fund’s performance to appropriate benchmarks and/or a peer group of other mutual funds with similar investment objectives and strategies; |
| • | the cost of owning the Fund compared to the cost of owning similar funds; |
| • | the Advisor’s compliance policies, procedures, and regulatory experience; |
| • | financial data showing the cost of services provided to the Fund, the profitability of the Fund to the Advisor, and the overall profitability of the Advisor; |
| • | possible economies of scale associated with the Advisor’s management of the Fund and other accounts under its management; |
| • | data comparing services provided and charges to other investment management clients of the Advisor; |
| • | acquired fund fees and expenses; |
| • | payments by the Fund and the Advisor to financial intermediaries whose clients are investors in the Fund; and |
| • | any collateral benefits derived by the Advisor from the management of the Fund. |
In keeping with its practice, the Board held two in-person meetings to review and discuss the information provided in response to their request. The independent Directors also had the benefit of the advice of their independent counsel throughout the process.
29
Factors Considered
The Directors considered all of the information provided by the Advisor, the independent data providers, and the independent Directors’ independent counsel in connection with the approval. They determined that the information was sufficient for them to evaluate the management agreement for the Fund. In connection with their review, the Directors did not identify any single factor as being all-important or controlling and each Director may have attributed different levels of importance to different factors. In deciding to renew the management agreement, the Board based its decision on a number of factors, including the following:
Nature, Extent and Quality of Services - Generally. Under the management agreement, the Advisor is responsible for providing or arranging for all services necessary for the operation of the Fund. The Board noted that under the management agreement, the Advisor provides or arranges at its own expense a wide variety of services including:
| • | constructing and designing the Fund |
| • | portfolio research and security selection |
| • | initial capitalization/funding |
| • | securities trading |
| • | Fund administration |
| • | custody of Fund assets |
| • | daily valuation of the Fund’s portfolio |
| • | shareholder servicing and transfer agency, including shareholder confirmations, recordkeeping, and communications |
| • | legal services (except the independent Directors’ counsel) |
| • | regulatory and portfolio compliance |
| • | financial reporting |
| • | marketing and distribution (except amounts paid by the Fund under Rule 12b-1 plans) |
The Board noted that many of these services have expanded over time in terms of both quantity and complexity in response to shareholder demands, competition in the industry, changing distribution channels, and the changing regulatory environment.
Investment Management, Shareholder, and Other Services. The nature of the investment management services provided to the Fund is quite complex and allows Fund shareholders access to professional money management, instant diversification of their investments within an asset class, the opportunity to easily diversify among asset classes by investing in or exchanging among various American Century Investments funds, and liquidity. In evaluating investment performance, the Board expects the Advisor to manage the Fund in accordance with its investment objectives and approved strategies. Further, the Directors recognize that the Advisor has an obligation to seek the best execution of fund trades. In providing these services, the Advisor utilizes teams of investment professionals (portfolio managers, analysts, research assistants, and securities traders) who require extensive information technology, research, training, compliance, and other systems to conduct their business. The Board, directly and through its Portfolio Committee, regularly reviews investment performance information for the Fund, together with comparative information for appropriate benchmarks and/or peer groups of similarly-managed funds, over different time horizons. The Directors also review detailed performance information during the management agreement approval process. If performance concerns are identified, the Fund receives special reviews until performance improves, during which the Board discusses with the Advisor the reasons for such results (e.g., market conditions, security selection) and any efforts being undertaken to improve performance. The Fund’s performance was above its benchmark for the one-, three-, and five-year periods reviewed by the Board. The Board found the investment management services provided by the Advisor to the Fund to be satisfactory and consistent with the management agreement.
30
Under the management agreement, the Advisor provides the Fund with a comprehensive package of transfer agency, shareholder, and other services. The Board, directly and through various committees of the Board, regularly reviews reports and evaluations of such services at its regular meetings. These reports include, but are not limited to, information regarding the operational efficiency and accuracy of the shareholder and transfer agency services provided, staffing levels, shareholder satisfaction (as measured by external as well as internal sources), technology support, new products and services offered to Fund shareholders, securities trading activities, portfolio valuation services, auditing services, and legal and operational compliance activities. Certain aspects of shareholder and transfer agency service level efficiency and the quality of securities trading activities are measured by independent third party providers and are presented in comparison to other fund groups not managed by the Advisor.
The Board found the services provided by the Advisor to the Fund under the management agreement to be competitive and of high quality.
Costs of Services and Profitability. The Advisor provides detailed information concerning its cost of providing various services to the Fund, its profitability in managing the Fund, its overall profitability, and its financial condition. The Directors have reviewed with the Advisor the methodology used to prepare this financial information. This information is considered in evaluating the Advisor’s financial condition, its ability to continue to provide services under the management agreement, and the reasonableness of the current management fee. The Board concluded that the Advisor’s profits were reasonable in light of the services provided to the Fund.
Economies of Scale. The Board also reviewed information provided by the Advisor regarding the possible existence of economies of scale in connection with the management of the Fund. The Board concluded that economies of scale are difficult to measure and predict with precision, especially on a fund-by-fund basis. The Board concluded that the Advisor is appropriately sharing economies of scale through its competitive fee structure, offering competitive fees from fund inception, and through reinvestment in its business to provide shareholders enhanced and expanded services.
Comparison to Other Funds’ Fees. The management agreement provides that the Fund pays the Advisor a single, all-inclusive (or unified) management fee for providing all services necessary for the management and operation of the Fund, other than brokerage expenses, expenses attributable to short sales, taxes, interest, extraordinary expenses, the fees and expenses of the Fund’s independent Directors (including their independent legal counsel), and expenses incurred in connection with the provision of shareholder services and distribution services under a plan adopted pursuant to Rule 12b-1 under the 1940 Act. Under the unified fee structure, the Advisor is responsible for providing all investment advisory, custody, audit, administrative, compliance, recordkeeping, marketing, and shareholder services, or arranging and supervising third parties to provide such services. By contrast, most other funds are charged a variety of fees, including an investment advisory fee, a transfer agency fee, an administrative fee, distribution charges, and other expenses. Other than their investment advisory fees and any applicable Rule 12b-1 fees, all other components of the total fees charged by these other funds may be increased without shareholder approval. The Board believes the unified fee structure is a benefit to Fund shareholders because it clearly discloses to shareholders the cost of owning Fund shares, and, since the unified fee cannot be increased without a vote of Fund shareholders, it shifts to the Advisor the risk of increased costs of operating the Fund and provides a direct incentive to minimize administrative inefficiencies. Part of the Board’s analysis of fee levels involves reviewing certain evaluative data compiled by an independent provider and comparing the Fund’s unified fee to the total expense ratio of peer funds. The unified fee charged to shareholders of the Fund was below the median of the total expense ratios of the Fund’s peer group. The Board concluded that the management fee paid by the Fund to the Advisor under the management agreement is reasonable in light of the services provided to the Fund.
31
Comparison to Fees and Services Provided to Other Clients of the Advisor. The Board also requested and received information from the Advisor concerning the nature of the services, fees, costs, and profitability of its advisory services to advisory clients other than the Fund. They observed that these varying types of client accounts require different services and involve different regulatory and entrepreneurial risks than the management of the Fund. The Board analyzed this information and concluded that the fees charged and services provided to the Fund were reasonable by comparison.
Payments to Intermediaries. The Directors also requested and received a description of payments made to intermediaries by the Fund and the Advisor. These payments include various payments made by the Fund or the Advisor to different types of intermediaries and recordkeepers for distribution and service activities provided for the Fund.
Collateral or “Fall-Out” Benefits Derived by the Advisor. The Board considered the existence of collateral benefits the Advisor may receive as a result of its relationship with the Fund. The Board noted that the Advisor’s primary business is managing mutual funds and it generally does not use fund or shareholder information to generate profits in other lines of business, and therefore does not derive any significant collateral benefits from them. The Board noted that the Advisor receives proprietary research from broker-dealers that execute fund portfolio transactions. The Board also determined that the Advisor is able to provide investment management services to certain clients other than the Fund, at least in part, due to its existing infrastructure built to serve the fund complex. The Board concluded, however, that the assets of those other clients are not material to the analysis and, where applicable, may be included with the assets of the Fund to determine breakpoints in the management fee schedule.
Existing Relationship. The Board also considered whether there was any reason for not continuing the existing arrangement with the Advisor. In this regard, the Board was mindful of the potential disruptions of the Fund’s operations and various risks, uncertainties, and other effects that could occur as a result of a decision not to continue such relationship. In particular, the Board recognized that most shareholders have invested in the Fund on the strength of the Advisor’s industry standing and reputation and in the expectation that the Advisor will have a continuing role in providing advisory services to the Fund.
Conclusion of the Directors. As a result of this process, the Board, including all of the independent Directors and assisted by the advice of independent legal counsel, taking into account all of the factors discussed above and the information provided by the Advisor and others in connection with its review and throughout the year, concluded that the management agreement between the Fund and the Advisor is fair and reasonable in light of the services provided and should be renewed.
32
| Proxy Voting Results |
A special meeting of shareholders was held on June 13, 2016, to vote on the following proposal. The proposal received the required number of votes and was adopted. A summary of voting results is listed below.
To elect four directors to the Board of Directors of American Century Quantitative Equity Funds, Inc.:
| Affirmative | Withhold | ||||||
| Tanya S. Beder | $ | 8,473,153,264 | $ | 121,459,590 | |||
| Jeremy I. Bulow | $ | 8,469,793,581 | $ | 124,819,273 | |||
| Anne Casscells | $ | 8,465,895,232 | $ | 128,717,622 | |||
| Jonathan D. Levin | $ | 8,468,929,867 | $ | 125,682,987 | |||
The other directors whose term of office continued after the meeting include Jonathan S. Thomas, Ronald J. Gilson, Frederick L. A. Grauer, Peter F. Pervere and John B. Shoven.
33
| Additional Information |
Retirement Account Information
As required by law, distributions you receive from certain IRAs are subject to federal income tax withholding, unless you elect not to have withholding apply. Tax will be withheld on the total amount withdrawn even though you may be receiving amounts that are not subject to withholding, such as nondeductible contributions. In such case, excess amounts of withholding could occur. You may adjust your withholding election so that a greater or lesser amount will be withheld.
If you don’t want us to withhold on this amount, you must notify us to not withhold the federal income tax. You may notify us in writing or in certain situations by telephone or through other electronic means. For systematic withdrawals, your withholding election will remain in effect until revoked or changed by filing a new election. You have the right to revoke your election at any time.
Remember, even if you elect not to have income tax withheld, you are liable for paying income tax on the taxable portion of your withdrawal. If you elect not to have income tax withheld or you don’t have enough income tax withheld, you may be responsible for payment of estimated tax. You may incur penalties under the estimated tax rules if your withholding and estimated tax payments are not sufficient. You can reduce or defer the income tax on a distribution by directly or indirectly rolling such distribution over to another IRA or eligible plan. You should consult your tax advisor for additional information.
State tax will be withheld if, at the time of your distribution, your address is within one of the mandatory withholding states and you have federal income tax withheld (or as otherwise required by state law). State taxes will be withheld from your distribution in accordance with the respective state rules.
Distributions you receive from 403(b), 457 and qualified plans are subject to special tax and withholding rules. Your plan administrator or plan sponsor is required to provide you with a special tax notice explaining those rules at the time you request a distribution. If applicable, federal and/or state taxes may be withheld from your distribution amount.
Proxy Voting Policies
Descriptions of the principles and policies that the fund's investment advisor uses in exercising the voting rights associated with the securities purchased and/or held by the fund are available without charge, upon request, by calling 1-800-345-2021 or visiting the "About Us" page of American Century Investments’ website at americancentury.com. A description of the policies is also available on the Securities and Exchange Commission’s website at sec.gov. Information regarding how the investment advisor voted proxies relating to portfolio securities during the most recent 12-month period ended June 30 is available on the "About Us" page at americancentury.com. It is also available at sec.gov.
Quarterly Portfolio Disclosure
The fund files its complete schedule of portfolio holdings with the Securities and Exchange Commission (SEC) for the first and third quarters of each fiscal year on Form N-Q. The fund’s Forms N-Q are available on the SEC’s website at sec.gov, and may be reviewed and copied at the SEC’s Public Reference Room in Washington, DC. Information on the operation of the Public Reference Room may be obtained by calling 1-800-SEC-0330. The fund also makes its complete schedule of portfolio holdings for the most recent quarter of its fiscal year available on its website at americancentury.com and, upon request, by calling 1-800-345-2021.
34
Other Tax Information
The following information is provided pursuant to provisions of the Internal Revenue Code.
The fund hereby designates up to the maximum amount allowable as qualified dividend income for the fiscal year ended June 30, 2016.
For corporate taxpayers, the fund hereby designates $2,230,155, or up to the maximum amount allowable, of ordinary income distributions paid during the fiscal year ended June 30, 2016 as qualified for the corporate dividends received deduction.
The fund hereby designates $2,502,612 as qualified short-term capital gain distributions for purposes of Internal Revenue Code Section 871 for the fiscal year ended June 30, 2016.
The fund hereby designates $24,850,644, or up to the maximum amount allowable, as long-term capital gain distributions (20% rate gain distributions) for the fiscal year ended June 30, 2016.
35
| Notes |
36
| ||
| Contact Us | americancentury.com | |
| Automated Information Line | 1-800-345-8765 | |
| Investor Services Representative | 1-800-345-2021 or 816-531-5575 | |
| Investors Using Advisors | 1-800-378-9878 | |
| Business, Not-For-Profit, Employer-Sponsored Retirement Plans | 1-800-345-3533 | |
| Banks and Trust Companies, Broker-Dealers, Financial Professionals, Insurance Companies | 1-800-345-6488 | |
| Telecommunications Relay Service for the Deaf | 711 | |
| American Century Quantitative Equity Funds, Inc. | ||
Investment Advisor: American Century Investment Management, Inc. Kansas City, Missouri | ||
| This report and the statements it contains are submitted for the general information of our shareholders. The report is not authorized for distribution to prospective investors unless preceded or accompanied by an effective prospectus. | ||
| ©2016 American Century Proprietary Holdings, Inc. All rights reserved. CL-ANN-89962 1608 | ||
| Annual Report | |
| June 30, 2016 | |
| Small Company Fund | |
| Table of Contents |
| President's Letter | 2 | |
| Performance | 3 | |
| Portfolio Commentary | ||
| Fund Characteristics | ||
| Shareholder Fee Example | ||
| Schedule of Investments | ||
| Statement of Assets and Liabilities | ||
| Statement of Operations | ||
| Statement of Changes in Net Assets | ||
| Notes to Financial Statements | ||
| Financial Highlights | ||
| Report of Independent Registered Public Accounting Firm | ||
| Management | ||
| Approval of Management Agreement | ||
| Proxy Voting Results | ||
| Additional Information | ||
Any opinions expressed in this report reflect those of the author as of the date of the report, and do not necessarily represent the opinions of American Century Investments® or any other person in the American Century Investments organization. Any such opinions are subject to change at any time based upon market or other conditions and American Century Investments disclaims any responsibility to update such opinions. These opinions may not be relied upon as investment advice and, because investment decisions made by American Century Investments funds are based on numerous factors, may not be relied upon as an indication of trading intent on behalf of any American Century Investments fund. Security examples are used for representational purposes only and are not intended as recommendations to purchase or sell securities. Performance information for comparative indices and securities is provided to American Century Investments by third party vendors. To the best of American Century Investments’ knowledge, such information is accurate at the time of printing.
| President’s Letter |
Jonathan ThomasDear Investor:
Thank you for reviewing this annual report for the 12 months ended June 30, 2016. It provides investment performance and portfolio information for the reporting period, plus longer-term historical performance data.
Annual reports remain important vehicles for conveying information about fund returns, including market and economic factors that affected performance during the reporting period. For additional, updated investment and market insights, we encourage you to visit our website, americancentury.com.
Market Volatility Increased, But Not for the Reasons Anticipated
Going into this reporting period, investors anticipated increased market volatility and uncertainty as the Federal Reserve (the Fed) appeared poised to raise short-term interest rates toward more historically normal levels. This policy change was expected to affect investor sentiment, U.S. Treasury yield behavior, relative currency values, inflation expectations, and corporate costs and earnings.
This Fed-centric outlook didn’t fully account for global factors, which ultimately drove sentiment, volatility, and performance during the reporting period. During 2015, the primary catalyst was China, where slowing economic growth, currency devaluations, and massive monetary policy easing sent shock waves through the global markets. The Fed ended up delaying (until December 2015) its only small rate hike during the reporting period. Afterward, China-related events repeated in January and early February this year, further delaying Fed action.
Oil was another catalyst—its price collapses devalued entire market sectors and contributed to broad market volatility and negative sentiment. Later, as China and oil appeared to stabilize, Brexit occurred—the unexpected decision by United Kingdom voters to leave the European Union. This produced more shock waves, and altered central bank policies around the world. In this environment, relatively defensive assets performed best for the 12 months, including the stocks of gold-producing companies, utilities, real estate investment trusts (REITs), and long-maturity U.S. Treasury securities.
Looking ahead, we believe the markets face further uncertainty and volatility as they digest Brexit, the Italian bank crisis, China’s economic mysteries, and the U.S. presidential election. Negative interest rates in Europe and Japan represent part of the market’s response to the global macroeconomic climate. These negative rates are suppressing interest rates around the world while driving up the value of the U.S. dollar and U.S. bonds. In a broad sense, stocks also benefit from the central bank stimulus that is driving interest rates into negative territory, and from relative yield advantages as bond yields are pushed lower. It’s an unusual and challenging environment. We appreciate your continued trust in us.
Sincerely,
Jonathan Thomas
President and Chief Executive Officer
American Century Investments
2
| Performance |
| Total Returns as of June 30, 2016 | ||||||
| Average Annual Returns | ||||||
Ticker Symbol | 1 year | 5 years | 10 years | Since Inception | Inception Date | |
| Investor Class | ASQIX | -8.63% | 8.66% | 4.05% | — | 7/31/98 |
| Russell 2000 Index | — | -6.73% | 8.34% | 6.19% | — | — |
| Institutional Class | ASCQX | -8.50% | 8.89% | 4.26% | — | 10/1/99 |
| A Class | ASQAX | — | 9/7/00 | |||
| No sales charge | -8.89% | 8.40% | 3.78% | — | ||
| With sales charge | -14.15% | 7.12% | 3.17% | — | ||
| C Class | ASQCX | -9.58% | 7.60% | — | 10.33% | 3/1/10 |
| R Class | ASCRX | -9.10% | 8.14% | 3.53% | — | 8/29/03 |
Average annual returns since inception are presented when ten years of performance history is not available. Prior to March 1, 2010, the A Class was referred to as the Advisor Class and did not have a front-end sales charge. Performance prior to that date has been adjusted to reflect this charge.
Sales charges include initial sales charges and contingent deferred sales charges (CDSCs), as applicable. A Class shares have a 5.75% maximum initial sales charge and may be subject to a maximum CDSC of 1.00%. C Class shares redeemed within 12 months of purchase are subject to a maximum CDSC of 1.00%. The SEC requires that mutual funds provide performance information net of maximum sales charges in all cases where charges could be applied.
Data presented reflect past performance. Past performance is no guarantee of future results. Current performance may be higher or lower than the performance shown. Total returns for periods less than one year are not annualized. Investment return and principal value will fluctuate, and redemption value may be more or less than original cost. Data assumes reinvestment of dividends and capital gains, and none of the charts reflect the deduction of taxes that a shareholder would pay on fund distributions or the redemption of fund shares. To obtain performance data current to the most recent month end, please call 1-800-345-2021 or visit americancentury.com. For additional information about the fund, please consult the prospectus.
3
| Growth of $10,000 Over 10 Years |
| $10,000 investment made June 30, 2006 |
| Performance for other share classes will vary due to differences in fee structure. |

| Value on June 30, 2016 | |
| Investor Class — $14,875 | |
| Russell 2000 Index — $18,240 | |
| Total Annual Fund Operating Expenses | ||||
| Investor Class | Institutional Class | A Class | C Class | R Class |
| 0.87% | 0.67% | 1.12% | 1.87% | 1.37% |
The total annual fund operating expenses shown is as stated in the fund’s prospectus current as of the date of this report. The prospectus may vary from the expense ratio shown elsewhere in this report because it is based on a different time period, includes acquired fund fees and expenses, and, if applicable, does not include fee waivers or expense reimbursements.
Data presented reflect past performance. Past performance is no guarantee of future results. Current performance may be higher or lower than the performance shown. Total returns for periods less than one year are not annualized. Investment return and principal value will fluctuate, and redemption value may be more or less than original cost. Data assumes reinvestment of dividends and capital gains, and none of the charts reflect the deduction of taxes that a shareholder would pay on fund distributions or the redemption of fund shares. To obtain performance data current to the most recent month end, please call 1-800-345-2021 or visit americancentury.com. For additional information about the fund, please consult the prospectus.
4
| Portfolio Commentary |
Portfolio Managers: Brian Garbe and Tal Sansani
Performance Summary
Small Company returned -8.63%* for the fiscal year ended June 30, 2016, compared with the -6.73% return of its benchmark, the Russell 2000 Index.
Small Company declined during the fiscal year, underperforming the return of its benchmark, the Russell 2000 Index. Small Company’s stock selection process incorporates factors of valuation, quality, growth, and sentiment while striving to minimize unintended risks along industries and other risk characteristics. The fund’s valuation factors detracted from selection results, while growth and quality were supportive. Sentiment was largely neutral. Security selection in the financials and information technology sectors provided leading detraction, while consumer discretionary and health care holdings benefited fund results.
Financials Holdings Led Detracted
On a sector basis, stock selection in the financials sector imparted the largest relative detraction. An overweight position, relative to the benchmark, in First NBC Bank hampered results after the lender announced a delay in filing its 2015 10-K due to internal accounting errors, which prompted several investigations into securities fraud violations. We retain our overweight based on attractive valuation and sentiment characteristics. Marcus & Millichap, a brokerage firm specializing in commercial real estate investments, weakened after third-quarter earnings and revenues fell short of analyst expectations. The stock’s attractive valuation and quality profiles support our overweight.
Detraction in the information technology sector was driven in part by Monster Worldwide. The employment website’s stock fell sharply on declining fourth-quarter revenues as job seekers increasingly turned to social networking sites in their quest for employment. The holding’s strong valuation and quality signals support our overweight positioning. Shares of VASCO Data Security International, an IT security company, plunged following the company’s below-consensus future guidance despite strong earnings-per-share growth and increased price targets. We find the holding compelling on its robust quality and valuation measures, and above-average sentiment factors.
Elsewhere, key individual underperformers included Outerwall, the parent company of Redbox retail movie rental kiosks, which tumbled as the company lowered earnings and revenue expectations and announced a leadership change at Redbox. An overweight position in Astronics, an aerospace and defense supplier of high-performance lighting and safety systems, was detrimental following its stock price decline on disappointing third-quarter growth in the aerospace sector. We ultimately exited our stakes in both holdings.
Consumer Discretionary and Health Care Positions Contributed
Consumer discretionary sector contribution was led by LifeLock, a provider of theft identity protection services. The company’s stock advanced on an increase in third-quarter sales and management’s announcement that it had reached a settlement with the Federal Trade Commission about outstanding litigation surrounding its marketing practices.
* All fund returns referenced in this commentary are for Investor Class shares. Performance for other share classes will vary due to differences in fee structure; when Investor Class performance exceeds that of the fund's benchmark, other share classes may not. See page 3 for returns for all share classes.
5
In health care, key contribution stemmed from our overweight position in Affymetrix, a portfolio overweight. The stock price of the gene testing and analysis provider rose steeply in January in response to a $1.3 billion bid to be acquired by Thermo Fisher Scientific. Shares received another lift after a group of former executives offered to buy the company in a $1.5 billion all-cash deal, besting the earlier bid from Thermo Fisher Scientific. We subsequently exited our position.
Outperformance also came from several materials holdings. Trinseo’s stock price advanced after the maker of emulsion polymers and plastics exceeded fourth-quarter earnings expectation. Rayonier Advanced Materials, a cellulose specialties manufacturer, nearly doubled its first-quarter net income and surpassed earnings expectations due to management’s cost cutting measures, which are offsetting weakness in its top line growth. Elsewhere, an overweight position in Virgin America helped to boost relative performance as the passenger airline’s stock soared on the announced acquisition by Alaska Airlines. We opted to lock in gains and exited the position.
A Look Ahead
The materials sector, where quality measures are positive, is a key fund overweight at period-end. After recent struggles in the commodity space, we are finding select metals and mining companies with healthy balance sheets, high-quality earnings, and attractive valuations. We believe that the information technology and health care sectors also present opportunities, and maintain overweight positions in both. Many internet and information technology equipment companies offer high-quality earnings and balance sheets. Valuation and momentum also are considerations here. Conversely, we consider financials to be challenged along multiple dimensions, and maintain the fund’s underweight to the sector. Real estate investment trusts (REITs) appear overvalued, while many banks score poorly on growth metrics. This makes fundamental sense. With interest rates low, investors have piled into high-yielding REITs, while continuing low rates weigh on banks. Our disciplined, objective, and systematic investment strategy is designed to take advantage of opportunities at the individual company level. We believe this approach is the most powerful way to capitalize on market inefficiencies that lead to the mispricing of individual stocks.
6
| Fund Characteristics |
| JUNE 30, 2016 | |
| Top Ten Holdings | % of net assets |
| Deluxe Corp. | 0.8% |
| ONE Gas, Inc. | 0.8% |
| Diamond Resorts International, Inc. | 0.7% |
| Primerica, Inc. | 0.7% |
| Integra LifeSciences Holdings Corp. | 0.7% |
| CoreSite Realty Corp. | 0.7% |
| Universal Forest Products, Inc. | 0.7% |
| American Eagle Outfitters, Inc. | 0.7% |
| Coeur Mining, Inc. | 0.7% |
| Bank of the Ozarks, Inc. | 0.7% |
| Top Five Industries | % of net assets |
| Real Estate Investment Trusts (REITs) | 7.9% |
| Banks | 7.1% |
| Biotechnology | 5.1% |
| Internet Software and Services | 4.3% |
| Software | 4.2% |
| Types of Investments in Portfolio | % of net assets |
| Common Stocks | 99.1% |
| Temporary Cash Investments | 1.0% |
| Other Assets and Liabilities | (0.1)% |
7
| Shareholder Fee Example |
Fund shareholders may incur two types of costs: (1) transaction costs, including sales charges (loads) on purchase payments and redemption/exchange fees; and (2) ongoing costs, including management fees; distribution and service (12b-1) fees; and other fund expenses. This example is intended to help you understand your ongoing costs (in dollars) of investing in your fund and to compare these costs with the ongoing cost of investing in other mutual funds.
The example is based on an investment of $1,000 made at the beginning of the period and held for the entire period from January 1, 2016 to June 30, 2016.
Actual Expenses
The table provides information about actual account values and actual expenses for each class. You may use the information, together with the amount you invested, to estimate the expenses that you paid over the period. First, identify the share class you own. Then simply divide your account value by $1,000 (for example, an $8,600 account value divided by $1,000 = 8.6), then multiply the result by the number under the heading “Expenses Paid During Period” to estimate the expenses you paid on your account during this period.
If you hold Investor Class shares of any American Century Investments fund, or Institutional Class shares of the American Century Diversified Bond Fund, in an American Century Investments account (i.e., not a financial intermediary or retirement plan account), American Century Investments may charge you a $12.50 semiannual account maintenance fee if the value of those shares is less than $10,000. We will redeem shares automatically in one of your accounts to pay the $12.50 fee. In determining your total eligible investment amount, we will include your investments in all personal accounts (including American Century Investments Brokerage accounts) registered under your Social Security number. Personal accounts include individual accounts, joint accounts, UGMA/UTMA accounts, personal trusts, Coverdell Education Savings Accounts and IRAs (including traditional, Roth, Rollover, SEP-, SARSEP- and SIMPLE-IRAs), and certain other retirement accounts. If you have only business, business retirement, employer-sponsored or American Century Investments Brokerage accounts, you are currently not subject to this fee. If you are subject to the Account Maintenance Fee, your account value could be reduced by the fee amount.
Hypothetical Example for Comparison Purposes
The table also provides information about hypothetical account values and hypothetical expenses based on the actual expense ratio of each class of your fund and an assumed rate of return of 5% per year before expenses, which is not the actual return of a fund’s share class. The hypothetical account values and expenses may not be used to estimate the actual ending account balance or expenses you paid for the period. You may use this information to compare the ongoing costs of investing in your fund and other funds. To do so, compare this 5% hypothetical example with the 5% hypothetical examples that appear in the shareholder reports of the other funds.
Please note that the expenses shown in the table are meant to highlight your ongoing costs only and do not reflect any transactional costs, such as sales charges (loads) or redemption/exchange fees. Therefore, the table is useful in comparing ongoing costs only, and will not help you determine the relative total costs of owning different funds. In addition, if these transactional costs were included, your costs would have been higher.
8
| Beginning Account Value 1/1/16 | Ending Account Value 6/30/16 | Expenses Paid During Period(1) 1/1/16 - 6/30/16 | Annualized Expense Ratio(1) | |
| Actual | ||||
| Investor Class | $1,000 | $1,000.00 | $4.48 | 0.90% |
| Institutional Class | $1,000 | $1,001.60 | $3.48 | 0.70% |
| A Class | $1,000 | $999.20 | $5.72 | 1.15% |
| C Class | $1,000 | $995.80 | $9.43 | 1.90% |
| R Class | $1,000 | $998.30 | $6.96 | 1.40% |
| Hypothetical | ||||
| Investor Class | $1,000 | $1,020.39 | $4.52 | 0.90% |
| Institutional Class | $1,000 | $1,021.38 | $3.52 | 0.70% |
| A Class | $1,000 | $1,019.15 | $5.77 | 1.15% |
| C Class | $1,000 | $1,015.42 | $9.52 | 1.90% |
| R Class | $1,000 | $1,017.90 | $7.02 | 1.40% |
| (1) | Expenses are equal to the class's annualized expense ratio listed in the table above, multiplied by the average account value over the period, multiplied by 182, the number of days in the most recent fiscal half-year, divided by 366, to reflect the one-half year period. |
9
| Schedule of Investments |
JUNE 30, 2016
| Shares | Value | |||
| COMMON STOCKS — 99.1% | ||||
| Aerospace and Defense — 0.6% | ||||
Aerojet Rocketdyne Holdings, Inc.(1) | 243,427 | $ | 4,449,846 | |
| Air Freight and Logistics — 0.7% | ||||
Atlas Air Worldwide Holdings, Inc.(1) | 70,027 | 2,900,518 | ||
Hub Group, Inc., Class A(1) | 54,818 | 2,103,367 | ||
| 5,003,885 | ||||
| Airlines — 0.9% | ||||
Hawaiian Holdings, Inc.(1) | 109,153 | 4,143,448 | ||
JetBlue Airways Corp.(1) | 136,371 | 2,258,304 | ||
| 6,401,752 | ||||
| Auto Components — 1.8% | ||||
American Axle & Manufacturing Holdings, Inc.(1) | 278,557 | 4,033,505 | ||
| Cooper Tire & Rubber Co. | 116,407 | 3,471,257 | ||
Cooper-Standard Holding, Inc.(1) | 52,780 | 4,169,092 | ||
Stoneridge, Inc.(1) | 109,572 | 1,637,006 | ||
| 13,310,860 | ||||
| Banks — 7.1% | ||||
| Bank of the Ozarks, Inc. | 133,733 | 5,017,662 | ||
| BBCN Bancorp, Inc. | 74,123 | 1,105,915 | ||
| Berkshire Hills Bancorp, Inc. | 41,660 | 1,121,487 | ||
| Cardinal Financial Corp. | 24,165 | 530,180 | ||
| Cathay General Bancorp | 96,948 | 2,733,934 | ||
| Central Pacific Financial Corp. | 22,291 | 526,068 | ||
| Chemical Financial Corp. | 35,301 | 1,316,374 | ||
| Enterprise Financial Services Corp. | 19,923 | 555,653 | ||
FCB Financial Holdings, Inc., Class A(1) | 120,875 | 4,109,750 | ||
First BanCorp(1) | 204,447 | 811,655 | ||
| First Busey Corp. | 46,623 | 997,266 | ||
| First Midwest Bancorp., Inc. | 137,671 | 2,417,503 | ||
First NBC Bank Holding Co.(1) | 141,053 | 2,368,280 | ||
Franklin Financial Network, Inc.(1) | 37,854 | 1,187,101 | ||
| Great Western Bancorp, Inc. | 147,691 | 4,658,174 | ||
| Heartland Financial USA, Inc. | 65,304 | 2,304,578 | ||
| Home BancShares, Inc. | 226,734 | 4,487,066 | ||
| Independent Bank Group, Inc. | 9,698 | 416,141 | ||
| LegacyTexas Financial Group, Inc. | 98,765 | 2,657,766 | ||
| Opus Bank | 116,845 | 3,949,361 | ||
Pacific Premier Bancorp, Inc.(1) | 56,880 | 1,365,120 | ||
| Peoples Bancorp, Inc. | 5,199 | 113,286 | ||
| PrivateBancorp, Inc. | 43,816 | 1,929,219 | ||
| Southside Bancshares, Inc. | 8,308 | 256,871 | ||
| Towne Bank | 12,982 | 281,060 | ||
| Trico Bancshares | 50,795 | 1,401,942 | ||
| United Community Banks, Inc. | 14,074 | 257,413 | ||
Western Alliance Bancorp(1) | 121,337 | 3,961,653 | ||
| 52,838,478 | ||||
10
| Shares | Value | |||
| Beverages — 0.1% | ||||
National Beverage Corp.(1) | 11,224 | $ | 704,979 | |
| Biotechnology — 5.1% | ||||
Achillion Pharmaceuticals, Inc.(1) | 450,996 | 3,517,769 | ||
Aduro Biotech, Inc.(1) | 64,413 | 728,511 | ||
Applied Genetic Technologies Corp.(1) | 86,598 | 1,223,630 | ||
BioSpecifics Technologies Corp.(1) | 22,804 | 910,792 | ||
Blueprint Medicines Corp.(1) | 14,258 | 288,724 | ||
Cepheid, Inc.(1) | 134,835 | 4,146,176 | ||
Eagle Pharmaceuticals, Inc.(1) | 52,371 | 2,031,471 | ||
Emergent BioSolutions, Inc.(1) | 114,382 | 3,216,422 | ||
Epizyme, Inc.(1) | 31,930 | 326,963 | ||
FibroGen, Inc.(1) | 96,940 | 1,590,785 | ||
Genomic Health, Inc.(1) | 17,916 | 463,935 | ||
Insys Therapeutics, Inc.(1) | 179,423 | 2,321,734 | ||
Lexicon Pharmaceuticals, Inc.(1) | 92,770 | 1,331,249 | ||
Ligand Pharmaceuticals, Inc., Class B(1) | 38,991 | 4,650,457 | ||
MiMedx Group, Inc.(1) | 200,475 | 1,599,790 | ||
Myriad Genetics, Inc.(1) | 149,091 | 4,562,185 | ||
Natera, Inc.(1) | 18,505 | 223,263 | ||
Repligen Corp.(1) | 82,088 | 2,245,928 | ||
Rigel Pharmaceuticals, Inc.(1) | 61,802 | 137,818 | ||
Seres Therapeutics, Inc.(1) | 46,853 | 1,361,080 | ||
Spectrum Pharmaceuticals, Inc.(1) | 117,595 | 772,599 | ||
| 37,651,281 | ||||
| Building Products — 3.7% | ||||
American Woodmark Corp.(1) | 36,319 | 2,410,855 | ||
| Apogee Enterprises, Inc. | 95,901 | 4,445,011 | ||
Continental Building Products, Inc.(1) | 182,815 | 4,063,977 | ||
Gibraltar Industries, Inc.(1) | 23,980 | 757,049 | ||
| Insteel Industries, Inc. | 51,905 | 1,483,964 | ||
Masonite International Corp.(1) | 67,106 | 4,438,391 | ||
NCI Building Systems, Inc.(1) | 62,906 | 1,005,867 | ||
Nortek, Inc.(1) | 5,762 | 341,744 | ||
Patrick Industries, Inc.(1) | 34,130 | 2,057,698 | ||
Ply Gem Holdings, Inc.(1) | 61,502 | 896,084 | ||
| Universal Forest Products, Inc. | 56,069 | 5,197,036 | ||
| 27,097,676 | ||||
| Capital Markets — 1.5% | ||||
| Evercore Partners, Inc., Class A | 88,869 | 3,927,121 | ||
| Moelis & Co., Class A | 128,531 | 2,891,947 | ||
| OM Asset Management plc | 75,145 | 1,003,186 | ||
Piper Jaffray Cos.(1) | 83,548 | 3,149,760 | ||
| 10,972,014 | ||||
| Chemicals — 2.6% | ||||
| FutureFuel Corp. | 29,353 | 319,361 | ||
| H.B. Fuller Co. | 102,348 | 4,502,288 | ||
| KMG Chemicals, Inc. | 12,423 | 322,874 | ||
Koppers Holdings, Inc.(1) | 39,519 | 1,214,419 | ||
| Minerals Technologies, Inc. | 79,925 | 4,539,740 | ||
OMNOVA Solutions, Inc.(1) | 49,575 | 359,419 | ||
11
| Shares | Value | |||
| Rayonier Advanced Materials, Inc. | 285,083 | $ | 3,874,278 | |
Trinseo SA(1) | 89,972 | 3,862,498 | ||
| 18,994,877 | ||||
| Commercial Services and Supplies — 3.4% | ||||
ARC Document Solutions, Inc.(1) | 357,798 | 1,391,834 | ||
| Brady Corp., Class A | 34,957 | 1,068,286 | ||
| Brink's Co. (The) | 84,803 | 2,416,038 | ||
| Deluxe Corp. | 87,825 | 5,828,945 | ||
| Ennis, Inc. | 195,657 | 3,752,701 | ||
| Herman Miller, Inc. | 153,617 | 4,591,612 | ||
| Interface, Inc. | 206,184 | 3,144,306 | ||
| Quad/Graphics, Inc. | 97,174 | 2,263,182 | ||
| West Corp. | 41,407 | 814,062 | ||
| 25,270,966 | ||||
| Communications Equipment — 2.1% | ||||
Ciena Corp.(1) | 230,154 | 4,315,387 | ||
Extreme Networks, Inc.(1) | 407,394 | 1,381,066 | ||
Infinera Corp.(1) | 158,362 | 1,786,323 | ||
Ixia(1) | 46,939 | 460,941 | ||
NETGEAR, Inc.(1) | 91,509 | 4,350,338 | ||
Polycom, Inc.(1) | 287,563 | 3,235,084 | ||
| 15,529,139 | ||||
| Construction and Engineering — 0.9% | ||||
Aegion Corp.(1) | 40,882 | 797,608 | ||
MasTec, Inc.(1) | 213,525 | 4,765,878 | ||
Tutor Perini Corp.(1) | 51,003 | 1,201,120 | ||
| 6,764,606 | ||||
| Consumer Finance — 0.7% | ||||
Regional Management Corp.(1) | 134,959 | 1,978,499 | ||
World Acceptance Corp.(1) | 75,642 | 3,449,275 | ||
| 5,427,774 | ||||
| Containers and Packaging — 0.9% | ||||
Berry Plastics Group, Inc.(1) | 114,240 | 4,438,224 | ||
| Graphic Packaging Holding Co. | 184,320 | 2,311,373 | ||
| 6,749,597 | ||||
| Diversified Consumer Services — 0.9% | ||||
| Capella Education Co. | 41,831 | 2,201,984 | ||
LifeLock, Inc.(1) | 50,050 | 791,291 | ||
Regis Corp.(1) | 56,221 | 699,951 | ||
Strayer Education, Inc.(1) | 55,970 | 2,749,806 | ||
| 6,443,032 | ||||
| Diversified Financial Services — 0.2% | ||||
| GAIN Capital Holdings, Inc. | 185,617 | 1,173,100 | ||
| MarketAxess Holdings, Inc. | 4,341 | 631,181 | ||
| 1,804,281 | ||||
| Diversified Telecommunication Services — 0.4% | ||||
| ATN International, Inc. | 14,531 | 1,130,657 | ||
FairPoint Communications, Inc.(1) | 91,426 | 1,342,134 | ||
General Communication, Inc., Class A(1) | 35,904 | 567,283 | ||
| 3,040,074 | ||||
12
| Shares | Value | |||
| Electric Utilities — 0.1% | ||||
| Spark Energy, Inc., Class A | 16,745 | $ | 553,422 | |
| Electrical Equipment — 0.9% | ||||
| AZZ, Inc. | 55,805 | 3,347,184 | ||
| General Cable Corp. | 250,495 | 3,183,791 | ||
| 6,530,975 | ||||
| Electronic Equipment, Instruments and Components — 3.3% | ||||
| Belden, Inc. | 78,424 | 4,734,457 | ||
Coherent, Inc.(1) | 53,820 | 4,939,600 | ||
II-VI, Inc.(1) | 16,535 | 310,197 | ||
QLogic Corp.(1) | 281,095 | 4,143,340 | ||
Sanmina Corp.(1) | 148,319 | 3,976,432 | ||
| SYNNEX Corp. | 26,760 | 2,537,383 | ||
Tech Data Corp.(1) | 49,636 | 3,566,347 | ||
| 24,207,756 | ||||
| Energy Equipment and Services — 0.7% | ||||
| Archrock, Inc. | 120,884 | 1,138,727 | ||
| Atwood Oceanics, Inc. | 174,811 | 2,188,634 | ||
Matrix Service Co.(1) | 16,642 | 274,427 | ||
McDermott International, Inc.(1) | 342,984 | 1,694,341 | ||
| 5,296,129 | ||||
| Food and Staples Retailing — 0.1% | ||||
| SpartanNash Co. | 32,818 | 1,003,574 | ||
| Food Products — 2.6% | ||||
| Cal-Maine Foods, Inc. | 88,791 | 3,935,217 | ||
| Dean Foods Co. | 260,862 | 4,718,994 | ||
Farmer Brothers Co.(1) | 5,393 | 172,900 | ||
| Fresh Del Monte Produce, Inc. | 67,733 | 3,686,707 | ||
Omega Protein Corp.(1) | 165,254 | 3,303,427 | ||
| Pilgrim's Pride Corp. | 57,535 | 1,465,992 | ||
Post Holdings, Inc.(1) | 8,799 | 727,589 | ||
Seaboard Corp.(1) | 416 | 1,194,186 | ||
| 19,205,012 | ||||
| Gas Utilities — 0.8% | ||||
| ONE Gas, Inc. | 84,992 | 5,659,617 | ||
| Health Care Equipment and Supplies — 4.0% | ||||
| Analogic Corp. | 43,610 | 3,464,378 | ||
Anika Therapeutics, Inc.(1) | 22,237 | 1,193,015 | ||
| Hill-Rom Holdings, Inc. | 46,506 | 2,346,228 | ||
ICU Medical, Inc.(1) | 43,209 | 4,871,815 | ||
Integra LifeSciences Holdings Corp.(1) | 65,760 | 5,246,333 | ||
| LeMaitre Vascular, Inc. | 78,037 | 1,113,588 | ||
LivaNova plc(1) | 46,724 | 2,346,947 | ||
Merit Medical Systems, Inc.(1) | 38,863 | 770,653 | ||
NxStage Medical, Inc.(1) | 38,125 | 826,550 | ||
OraSure Technologies, Inc.(1) | 383,523 | 2,266,621 | ||
Orthofix International NV(1) | 18,433 | 781,559 | ||
SurModics, Inc.(1) | 8,186 | 192,207 | ||
| West Pharmaceutical Services, Inc. | 56,148 | 4,260,510 | ||
| 29,680,404 | ||||
13
| Shares | Value | |||
| Health Care Providers and Services — 1.3% | ||||
Air Methods Corp.(1) | 26,177 | $ | 937,922 | |
| HealthSouth Corp. | 89,175 | 3,461,773 | ||
| Landauer, Inc. | 13,939 | 573,729 | ||
RadNet, Inc.(1) | 113,743 | 607,388 | ||
Triple-S Management Corp., Class B(1) | 20,913 | 510,905 | ||
WellCare Health Plans, Inc.(1) | 33,879 | 3,634,539 | ||
| 9,726,256 | ||||
| Health Care Technology — 1.1% | ||||
| Computer Programs & Systems, Inc. | 40,714 | 1,625,303 | ||
Medidata Solutions, Inc.(1) | 103,724 | 4,861,544 | ||
| Quality Systems, Inc. | 144,235 | 1,717,839 | ||
| 8,204,686 | ||||
| Hotels, Restaurants and Leisure — 3.6% | ||||
| Bloomin' Brands, Inc. | 257,772 | 4,606,386 | ||
| Bob Evans Farms, Inc. | 85,130 | 3,230,683 | ||
Boyd Gaming Corp.(1) | 227,235 | 4,181,124 | ||
| Churchill Downs, Inc. | 31,455 | 3,974,654 | ||
Diamond Resorts International, Inc.(1) | 180,949 | 5,421,232 | ||
| DineEquity, Inc. | 11,027 | 934,869 | ||
Isle of Capri Casinos, Inc.(1) | 209,661 | 3,840,990 | ||
| Sonic Corp. | 13,520 | 365,716 | ||
| Speedway Motorsports, Inc. | 7,932 | 140,793 | ||
| 26,696,447 | ||||
| Household Durables — 0.1% | ||||
ZAGG, Inc.(1) | 130,071 | 682,873 | ||
| Household Products — 0.3% | ||||
Central Garden & Pet Co.(1) | 109,778 | 2,383,280 | ||
| Independent Power and Renewable Electricity Producers — 1.1% | ||||
| NRG Yield, Inc., Class A | 251,948 | 3,834,649 | ||
| Ormat Technologies, Inc. | 102,431 | 4,482,380 | ||
| 8,317,029 | ||||
| Insurance — 2.8% | ||||
| AMERISAFE, Inc. | 50,735 | 3,105,997 | ||
| Argo Group International Holdings Ltd. | 28,345 | 1,471,105 | ||
eHealth, Inc.(1) | 14,213 | 199,266 | ||
| Federated National Holding Co. | 50,341 | 958,493 | ||
| Heritage Insurance Holdings, Inc. | 119,630 | 1,431,971 | ||
| Primerica, Inc. | 93,699 | 5,363,331 | ||
| Selective Insurance Group, Inc. | 123,866 | 4,732,920 | ||
| State National Cos., Inc. | 12,137 | 127,802 | ||
| United Insurance Holdings Corp. | 23,215 | 380,262 | ||
| Universal Insurance Holdings, Inc. | 166,903 | 3,101,058 | ||
| 20,872,205 | ||||
| Internet and Catalog Retail — 0.7% | ||||
| PetMed Express, Inc. | 43,243 | 811,239 | ||
Shutterfly, Inc.(1) | 96,899 | 4,516,462 | ||
| 5,327,701 | ||||
| Internet Software and Services — 4.3% | ||||
Brightcove, Inc.(1) | 25,732 | 226,442 | ||
Carbonite, Inc.(1) | 17,461 | 169,895 | ||
14
| Shares | Value | |||
comScore, Inc.(1) | 32,517 | $ | 776,506 | |
DHI Group, Inc.(1) | 103,112 | 642,388 | ||
| EarthLink Holdings Corp. | 542,491 | 3,471,942 | ||
Endurance International Group Holdings, Inc.(1) | 26,842 | 241,309 | ||
Everyday Health, Inc.(1) | 99,082 | 780,766 | ||
Five9, Inc.(1) | 32,230 | 383,537 | ||
| j2 Global, Inc. | 78,451 | 4,955,750 | ||
LogMeIn, Inc.(1) | 52,745 | 3,345,615 | ||
Monster Worldwide, Inc.(1) | 565,383 | 1,351,265 | ||
| NIC, Inc. | 14,223 | 312,053 | ||
Shutterstock, Inc.(1) | 98,767 | 4,523,529 | ||
Stamps.com, Inc.(1) | 50,252 | 4,393,030 | ||
TechTarget, Inc.(1) | 18,346 | 148,603 | ||
Web.com Group, Inc.(1) | 194,010 | 3,527,102 | ||
XO Group, Inc.(1) | 153,602 | 2,677,283 | ||
| 31,927,015 | ||||
| IT Services — 2.3% | ||||
CACI International, Inc., Class A(1) | 22,373 | 2,022,743 | ||
| Convergys Corp. | 50,213 | 1,255,325 | ||
| CSG Systems International, Inc. | 94,392 | 3,804,941 | ||
| EVERTEC, Inc. | 82,163 | 1,276,813 | ||
NeuStar, Inc., Class A(1) | 184,866 | 4,346,200 | ||
| Travelport Worldwide Ltd. | 318,825 | 4,109,654 | ||
| 16,815,676 | ||||
| Leisure Products — 0.9% | ||||
Nautilus, Inc.(1) | 101,327 | 1,807,674 | ||
Smith & Wesson Holding Corp.(1) | 176,400 | 4,794,552 | ||
| 6,602,226 | ||||
| Life Sciences Tools and Services — 1.3% | ||||
Cambrex Corp.(1) | 96,246 | 4,978,805 | ||
INC Research Holdings, Inc., Class A(1) | 87,559 | 3,338,625 | ||
Luminex Corp.(1) | 81,246 | 1,643,607 | ||
| 9,961,037 | ||||
| Machinery — 2.2% | ||||
| Albany International Corp., Class A | 38,221 | 1,526,165 | ||
| Global Brass & Copper Holdings, Inc. | 155,414 | 4,241,248 | ||
Lydall, Inc.(1) | 21,415 | 825,762 | ||
| Mueller Industries, Inc., Class A | 141,819 | 4,521,190 | ||
| Mueller Water Products, Inc., Class A | 125,805 | 1,436,693 | ||
Wabash National Corp.(1) | 313,666 | 3,983,558 | ||
| 16,534,616 | ||||
| Media — 1.3% | ||||
| AMC Entertainment Holdings, Inc., Class A | 147,675 | 4,077,307 | ||
| Entercom Communications Corp., Class A | 62,018 | 841,584 | ||
| Nexstar Broadcasting Group, Inc., Class A | 88,686 | 4,219,680 | ||
| tronc, Inc. | 22,165 | 305,877 | ||
| 9,444,448 | ||||
| Metals and Mining — 2.8% | ||||
| Carpenter Technology Corp. | 77,378 | 2,548,058 | ||
Coeur Mining, Inc.(1) | 479,068 | 5,106,865 | ||
| Commercial Metals Co. | 284,948 | 4,815,621 | ||
15
| Shares | Value | |||
| Kaiser Aluminum Corp. | 36,312 | $ | 3,282,968 | |
Ryerson Holding Corp.(1) | 27,896 | 488,180 | ||
| Schnitzer Steel Industries, Inc., Class A | 27,236 | 479,354 | ||
| TimkenSteel Corp. | 158,191 | 1,521,797 | ||
| Worthington Industries, Inc. | 54,245 | 2,294,563 | ||
| 20,537,406 | ||||
| Multiline Retail — 0.9% | ||||
| Big Lots, Inc. | 94,682 | 4,744,515 | ||
Ollie's Bargain Outlet Holdings, Inc.(1) | 79,223 | 1,971,861 | ||
| 6,716,376 | ||||
| Oil, Gas and Consumable Fuels — 0.5% | ||||
Clean Energy Fuels Corp.(1) | 158,171 | 548,853 | ||
| DHT Holdings, Inc. | 288,996 | 1,453,650 | ||
Par Pacific Holdings, Inc.(1) | 94,109 | 1,443,632 | ||
| 3,446,135 | ||||
| Paper and Forest Products — 0.8% | ||||
Clearwater Paper Corp.(1) | 33,069 | 2,161,720 | ||
| Schweitzer-Mauduit International, Inc. | 105,642 | 3,727,050 | ||
| 5,888,770 | ||||
| Personal Products — 0.6% | ||||
| Medifast, Inc. | 75,284 | 2,504,699 | ||
| Natural Health Trends Corp. | 63,021 | 1,776,562 | ||
| 4,281,261 | ||||
| Pharmaceuticals — 1.8% | ||||
Depomed, Inc.(1) | 44,070 | 864,653 | ||
Heska Corp.(1) | 6,042 | 224,581 | ||
| Innoviva, Inc. | 259,423 | 2,731,724 | ||
Prestige Brands Holdings, Inc.(1) | 88,857 | 4,922,678 | ||
SciClone Pharmaceuticals, Inc.(1) | 68,079 | 889,112 | ||
Sucampo Pharmaceuticals, Inc., Class A(1) | 97,262 | 1,066,964 | ||
Supernus Pharmaceuticals, Inc.(1) | 117,246 | 2,388,301 | ||
| 13,088,013 | ||||
| Professional Services — 0.9% | ||||
| Barrett Business Services, Inc. | 10,986 | 453,941 | ||
ICF International, Inc.(1) | 43,015 | 1,759,313 | ||
| Kelly Services, Inc., Class A | 13,042 | 247,407 | ||
RPX Corp.(1) | 22,356 | 205,005 | ||
TriNet Group, Inc.(1) | 185,229 | 3,850,911 | ||
| 6,516,577 | ||||
| Real Estate Investment Trusts (REITs) — 7.9% | ||||
| Anworth Mortgage Asset Corp. | 48,868 | 229,680 | ||
| Armada Hoffler Properties, Inc. | 97,258 | 1,336,325 | ||
| Chesapeake Lodging Trust | 103,308 | 2,401,911 | ||
| Colony Capital, Inc. | 50,132 | 769,526 | ||
| CoreSite Realty Corp. | 58,768 | 5,212,134 | ||
| CyrusOne, Inc. | 45,242 | 2,518,170 | ||
| DiamondRock Hospitality Co. | 166,596 | 1,504,362 | ||
| FelCor Lodging Trust, Inc. | 648,897 | 4,042,628 | ||
| GEO Group, Inc. (The) | 103,031 | 3,521,600 | ||
| Government Properties Income Trust | 111,235 | 2,565,079 | ||
| Investors Real Estate Trust | 299,919 | 1,940,476 | ||
16
| Shares | Value | |||
| Medical Properties Trust, Inc. | 171,549 | $ | 2,609,260 | |
| Monmouth Real Estate Investment Corp. | 55,554 | 736,646 | ||
| National Storage Affiliates Trust | 31,137 | 648,272 | ||
| New Senior Investment Group, Inc. | 73,577 | 785,802 | ||
| Pennsylvania Real Estate Investment Trust | 197,561 | 4,237,683 | ||
| PS Business Parks, Inc. | 45,864 | 4,865,253 | ||
| Resource Capital Corp. | 88,380 | 1,136,567 | ||
| Ryman Hospitality Properties, Inc. | 95,129 | 4,818,284 | ||
| Saul Centers, Inc. | 2,731 | 168,530 | ||
| Summit Hotel Properties, Inc. | 353,416 | 4,679,228 | ||
| Sunstone Hotel Investors, Inc. | 407,532 | 4,918,911 | ||
| Xenia Hotels & Resorts, Inc. | 172,178 | 2,889,147 | ||
| 58,535,474 | ||||
| Real Estate Management and Development — 1.5% | ||||
Altisource Portfolio Solutions SA(1) | 133,747 | 3,723,516 | ||
Forestar Group, Inc.(1) | 27,803 | 330,578 | ||
Marcus & Millichap, Inc.(1) | 99,236 | 2,521,587 | ||
| RE/MAX Holdings, Inc., Class A | 109,961 | 4,427,030 | ||
| 11,002,711 | ||||
| Road and Rail — 0.2% | ||||
YRC Worldwide, Inc.(1) | 197,717 | 1,739,910 | ||
| Semiconductors and Semiconductor Equipment — 2.9% | ||||
Advanced Energy Industries, Inc.(1) | 114,874 | 4,360,617 | ||
Cirrus Logic, Inc.(1) | 56,367 | 2,186,476 | ||
Inphi Corp.(1) | 50,608 | 1,620,974 | ||
Integrated Device Technology, Inc.(1) | 223,761 | 4,504,309 | ||
| IXYS Corp. | 16,504 | 169,166 | ||
MaxLinear, Inc., Class A(1) | 163,029 | 2,931,262 | ||
NeoPhotonics Corp.(1) | 106,076 | 1,010,904 | ||
Rudolph Technologies, Inc.(1) | 37,760 | 586,413 | ||
Synaptics, Inc.(1) | 60,923 | 3,274,611 | ||
| Tessera Technologies, Inc. | 35,427 | 1,085,483 | ||
| 21,730,215 | ||||
| Software — 4.2% | ||||
A10 Networks, Inc.(1) | 36,598 | 236,789 | ||
ACI Worldwide, Inc.(1) | 26,718 | 521,268 | ||
Aspen Technology, Inc.(1) | 116,578 | 4,691,099 | ||
Barracuda Networks, Inc.(1) | 139,938 | 2,118,661 | ||
BroadSoft, Inc.(1) | 16,472 | 675,846 | ||
Gigamon, Inc.(1) | 124,142 | 4,641,669 | ||
Manhattan Associates, Inc.(1) | 56,401 | 3,616,996 | ||
MicroStrategy, Inc., Class A(1) | 27,118 | 4,746,192 | ||
| Pegasystems, Inc. | 101,364 | 2,731,760 | ||
Qualys, Inc.(1) | 9,871 | 294,255 | ||
RealPage, Inc.(1) | 18,332 | 409,354 | ||
Rovi Corp.(1) | 162,436 | 2,540,499 | ||
Rubicon Project, Inc. (The)(1) | 68,268 | 931,858 | ||
Silver Spring Networks, Inc.(1) | 41,887 | 508,927 | ||
VASCO Data Security International, Inc.(1) | 123,837 | 2,029,689 | ||
Zix Corp.(1) | 161,236 | 604,635 | ||
| 31,299,497 | ||||
17
| Shares | Value | |||
| Specialty Retail — 1.8% | ||||
| American Eagle Outfitters, Inc. | 321,465 | $ | 5,120,937 | |
| Children's Place, Inc. (The) | 49,850 | 3,996,973 | ||
Express, Inc.(1) | 245,408 | 3,560,870 | ||
Party City Holdco, Inc.(1) | 45,620 | 634,574 | ||
Sportsman's Warehouse Holdings, Inc.(1) | 18,261 | 147,184 | ||
| 13,460,538 | ||||
| Technology Hardware, Storage and Peripherals — 0.4% | ||||
Cray, Inc.(1) | 39,578 | 1,184,174 | ||
Stratasys Ltd.(1) | 80,803 | 1,849,580 | ||
| 3,033,754 | ||||
| Textiles, Apparel and Luxury Goods — 0.5% | ||||
Delta Apparel, Inc.(1) | 7,433 | 167,614 | ||
| Movado Group, Inc. | 41,822 | 906,701 | ||
Perry Ellis International, Inc.(1) | 126,871 | 2,552,645 | ||
| 3,626,960 | ||||
| Thrifts and Mortgage Finance — 1.2% | ||||
BofI Holding, Inc.(1) | 209,692 | 3,713,645 | ||
Essent Group Ltd.(1) | 193,354 | 4,217,051 | ||
| Meta Financial Group, Inc. | 11,634 | 592,869 | ||
NMI Holdings, Inc., Class A(1) | 110,322 | 604,564 | ||
| 9,128,129 | ||||
| Tobacco — 0.6% | ||||
| Universal Corp. | 71,778 | 4,144,462 | ||
| Trading Companies and Distributors — 0.1% | ||||
Veritiv Corp.(1) | 12,564 | 472,155 | ||
| Wireless Telecommunication Services — 0.1% | ||||
| Spok Holdings, Inc. | 56,316 | 1,079,296 | ||
TOTAL COMMON STOCKS (Cost $702,154,688) | 733,815,140 | |||
| TEMPORARY CASH INVESTMENTS — 1.0% | ||||
| Repurchase Agreement, Fixed Income Clearing Corp., (collateralized by various U.S. Treasury obligations, 3.00%, 11/15/45, valued at $7,340,513), at 0.20%, dated 6/30/16, due 7/1/16 (Delivery value $7,194,040) | 7,194,000 | |||
| State Street Institutional Liquid Reserves Fund, Premier Class | 5,483 | 5,483 | ||
TOTAL TEMPORARY CASH INVESTMENTS (Cost $7,199,483) | 7,199,483 | |||
TOTAL INVESTMENT SECURITIES — 100.1% (Cost $709,354,171) | 741,014,623 | |||
| OTHER ASSETS AND LIABILITIES — (0.1)% | (772,838) | |||
| TOTAL NET ASSETS — 100.0% | $ | 740,241,785 | ||
| NOTES TO SCHEDULE OF INVESTMENTS |
| (1) | Non-income producing. |
See Notes to Financial Statements.
18
| Statement of Assets and Liabilities |
| JUNE 30, 2016 | |||
| Assets | |||
| Investment securities, at value (cost of $709,354,171) | $ | 741,014,623 | |
| Receivable for investments sold | 20,513,768 | ||
| Receivable for capital shares sold | 173,285 | ||
| Dividends and interest receivable | 634,267 | ||
| 762,335,943 | |||
| Liabilities | |||
| Payable for investments purchased | 20,972,971 | ||
| Payable for capital shares redeemed | 485,183 | ||
| Accrued management fees | 523,193 | ||
| Distribution and service fees payable | 14,898 | ||
| Accrued other expenses | 97,913 | ||
| 22,094,158 | |||
| Net Assets | $ | 740,241,785 | |
| Net Assets Consist of: | |||
| Capital (par value and paid-in surplus) | $ | 794,171,550 | |
| Undistributed net investment income | 1,389,439 | ||
| Accumulated net realized loss | (86,979,656 | ) | |
| Net unrealized appreciation | 31,660,452 | ||
| $ | 740,241,785 | ||
| Net Assets | Shares Outstanding | Net Asset Value Per Share | ||||
| Investor Class, $0.01 Par Value | $654,517,202 | 52,539,863 | $12.46 | |||
| Institutional Class, $0.01 Par Value | $34,094,480 | 2,723,360 | $12.52 | |||
| A Class, $0.01 Par Value | $35,152,838 | 2,884,146 | $12.19* | |||
| C Class, $0.01 Par Value | $1,630,538 | 137,155 | $11.89 | |||
| R Class, $0.01 Par Value | $14,846,727 | 1,238,595 | $11.99 | |||
*Maximum offering price $12.93 (net asset value divided by 0.9425).
See Notes to Financial Statements.
19
| Statement of Operations |
| YEAR ENDED JUNE 30, 2016 | |||
| Investment Income (Loss) | |||
| Income: | |||
| Dividends (net of foreign taxes withheld of $1,097) | $ | 9,227,176 | |
| Interest | 6,899 | ||
| 9,234,075 | |||
| Expenses: | |||
| Management fees | 6,381,175 | ||
| Distribution and service fees: | |||
| A Class | 99,148 | ||
| C Class | 14,737 | ||
| R Class | 61,918 | ||
| Directors' fees and expenses | 42,906 | ||
| Other expenses | 101,578 | ||
| 6,701,462 | |||
| Net investment income (loss) | 2,532,613 | ||
| Realized and Unrealized Gain (Loss) | |||
| Net realized gain (loss) on: | |||
| Investment transactions | (52,628,570 | ) | |
| Futures contract transactions | (2,920,233 | ) | |
| Foreign currency transactions | (161 | ) | |
| (55,548,964 | ) | ||
| Change in net unrealized appreciation (depreciation) on investments | (22,058,181 | ) | |
| Net realized and unrealized gain (loss) | (77,607,145 | ) | |
| Net Increase (Decrease) in Net Assets Resulting from Operations | $ | (75,074,532 | ) |
See Notes to Financial Statements.
20
| Statement of Changes in Net Assets |
| YEARS ENDED JUNE 30, 2016 AND JUNE 30, 2015 | ||||||
| Increase (Decrease) in Net Assets | June 30, 2016 | June 30, 2015 | ||||
| Operations | ||||||
| Net investment income (loss) | $ | 2,532,613 | $ | 1,137,481 | ||
| Net realized gain (loss) | (55,548,964 | ) | 45,887,934 | |||
| Change in net unrealized appreciation (depreciation) | (22,058,181 | ) | (23,392,818 | ) | ||
| Net increase (decrease) in net assets resulting from operations | (75,074,532 | ) | 23,632,597 | |||
| Distributions to Shareholders | ||||||
| From net investment income: | ||||||
| Investor Class | (2,119,963 | ) | (250,135 | ) | ||
| Institutional Class | (201,184 | ) | (48,049 | ) | ||
| A Class | (32,034 | ) | (4,861 | ) | ||
| Decrease in net assets from distributions | (2,353,181 | ) | (303,045 | ) | ||
| Capital Share Transactions | ||||||
| Net increase (decrease) in net assets from capital share transactions (Note 5) | 259,727,780 | 110,853,317 | ||||
| Net increase (decrease) in net assets | 182,300,067 | 134,182,869 | ||||
| Net Assets | ||||||
| Beginning of period | 557,941,718 | 423,758,849 | ||||
| End of period | $ | 740,241,785 | $ | 557,941,718 | ||
| Undistributed net investment income | $ | 1,389,439 | $ | 1,080,762 | ||
See Notes to Financial Statements.
21
| Notes to Financial Statements |
JUNE 30, 2016
1. Organization
American Century Quantitative Equity Funds, Inc. (the corporation) is registered under the Investment Company Act of 1940, as amended (the 1940 Act), as an open-end management investment company and is organized as a Maryland corporation. Small Company Fund (the fund) is one fund in a series issued by the corporation. The fund’s investment objective is to seek long-term capital growth by investing primarily in common stocks of small companies.
The fund offers the Investor Class, the Institutional Class, the A Class, the C Class and the R Class. The A Class may incur an initial sales charge. The A Class and C Class may be subject to a contingent deferred sales charge. The share classes differ principally in their respective sales charges and distribution and shareholder servicing expenses and arrangements. The Institutional Class is made available to institutional shareholders or through financial intermediaries whose clients do not require the same level of shareholder and administrative services as shareholders of other classes. As a result, the Institutional Class is charged a lower unified management fee.
2. Significant Accounting Policies
The following is a summary of significant accounting policies consistently followed by the fund in preparation of its financial statements. The fund is an investment company and follows accounting and reporting guidance in accordance with accounting principles generally accepted in the United States of America. This may require management to make certain estimates and assumptions at the date of the financial statements. Actual results could differ from these estimates. Management evaluated the impact of events or transactions occurring through the date the financial statements were issued that would merit recognition or disclosure.
Investment Valuations — The fund determines the fair value of its investments and computes its net asset value per share at the close of regular trading (usually 4 p.m. Eastern time) on the New York Stock Exchange (NYSE) on each day the NYSE is open. The Board of Directors has adopted valuation policies and procedures to guide the investment advisor in the fund’s investment valuation process and to provide methodologies for the oversight of the fund’s pricing function.
Equity securities that are listed or traded on a domestic securities exchange are valued at the last reported sales price or at the official closing price as provided by the exchange. Equity securities traded on foreign securities exchanges are generally valued at the closing price of such securities on the exchange where primarily traded or at the close of the NYSE, if that is earlier. If no last sales price is reported, or if local convention or regulation so provides, the mean of the latest bid and asked prices may be used. Securities traded over-the-counter are valued at the mean of the latest bid and asked prices, the last sales price, or the official closing price. Equity securities initially expressed in local currencies are translated into U.S. dollars at the mean of the appropriate currency exchange rate at the close of the NYSE as provided by an independent pricing service.
Open-end management investment companies are valued at the reported net asset value per share. Repurchase agreements are valued at cost, which approximates fair value. Exchange-traded futures contracts are valued at the settlement price as provided by the appropriate clearing corporation.
If the fund determines that the market price for an investment is not readily available or the valuation methods mentioned above do not reflect an investment’s fair value, such investment is valued as determined in good faith by the Board of Directors or its delegate, in accordance with policies and procedures adopted by the Board of Directors. In its determination of fair value, the fund may review several factors including, but not limited to, market information regarding the specific investment or comparable investments and correlation with other investment types, futures indices or general market indicators. Circumstances that may cause the fund to use these procedures to value an investment include, but are not limited to: an investment has been declared in default or is distressed; trading in a security has been suspended during the trading day or a security is not actively trading on its principal exchange; prices received from a regular pricing source are deemed unreliable; or there is a foreign market holiday and no trading occurred.
22
The fund monitors for significant events occurring after the close of an investment’s primary exchange but before the fund’s net asset value per share is determined. Significant events may include, but are not limited to: corporate announcements and transactions; governmental action and political unrest that could impact a specific investment or an investment sector; or armed conflicts, natural disasters and similar events that could affect investments in a specific country or region. The fund also monitors for significant fluctuations between domestic and foreign markets, as evidenced by the U.S. market or such other indicators that the Board of Directors, or its delegate, deems appropriate. If significant fluctuations in foreign markets are identified, the fund may apply a model-derived factor to the closing price of equity securities traded on foreign securities exchanges. The factor is based on observable market data as provided by an independent pricing service.
Security Transactions — Security transactions are accounted for as of the trade date. Net realized gains and losses are determined on the identified cost basis, which is also used for federal income tax purposes.
Investment Income — Dividend income less foreign taxes withheld, if any, is recorded as of the ex-dividend date. Distributions received on securities that represent a return of capital or long-term capital gain are recorded as a reduction of cost of investments and/or as a realized gain. The fund may estimate the components of distributions received that may be considered nontaxable distributions or long-term capital gain distributions for income tax purposes. Interest income is recorded on the accrual basis and includes accretion of discounts and amortization of premiums.
Foreign Currency Translations — All assets and liabilities initially expressed in foreign currencies are translated into U.S. dollars at prevailing exchange rates at period end. The fund may enter into spot foreign currency exchange contracts to facilitate transactions denominated in a foreign currency. Purchases and sales of investment securities, dividend and interest income, spot foreign currency exchange contracts, and expenses are translated at the rates of exchange prevailing on the respective dates of such transactions. Net realized and unrealized foreign currency exchange gains or losses related to investment securities are a component of net realized gain (loss) on investment transactions and change in net unrealized appreciation (depreciation) on investments, respectively.
Repurchase Agreements — The fund may enter into repurchase agreements with institutions that American Century Investment Management, Inc. (ACIM) (the investment advisor) has determined are creditworthy pursuant to criteria adopted by the Board of Directors. The fund requires that the collateral, represented by securities, received in a repurchase transaction be transferred to the custodian in a manner sufficient to enable the fund to obtain those securities in the event of a default under the repurchase agreement. ACIM monitors, on a daily basis, the securities transferred to ensure the value, including accrued interest, of the securities under each repurchase agreement is equal to or greater than amounts owed to the fund under each repurchase agreement.
Joint Trading Account — Pursuant to an Exemptive Order issued by the Securities and Exchange Commission, the fund, along with certain other funds in the American Century Investments family of funds, may transfer uninvested cash balances into a joint trading account. These balances are invested in one or more repurchase agreements that are collateralized by U.S. Treasury or Agency obligations.
Segregated Assets — In accordance with the 1940 Act, the fund segregates assets on its books and records to cover futures contracts. ACIM monitors, on a daily basis, the securities segregated to ensure the fund designates a sufficient amount of liquid assets, marked-to-market daily. The fund may also receive assets or be required to pledge assets at the custodian bank or with a broker for margin requirements on futures contracts.
Income Tax Status — It is the fund’s policy to distribute substantially all net investment income and net realized gains to shareholders and to otherwise qualify as a regulated investment company under provisions of the Internal Revenue Code. Accordingly, no provision has been made for income taxes. The fund files U.S. federal, state, local and non-U.S. tax returns as applicable. The fund's tax returns are subject to examination by the relevant taxing authority until expiration of the applicable statute of limitations, which is generally three years from the date of filing but can be longer in certain jurisdictions. At this time, management believes there are no uncertain tax positions which, based on their technical merit, would not be sustained upon examination and for which it is reasonably possible that the total amounts of unrecognized tax benefits will significantly change in the next twelve months.
23
Multiple Class — All shares of the fund represent an equal pro rata interest in the net assets of the class to which such shares belong, and have identical voting, dividend, liquidation and other rights and the same terms and conditions, except for class specific expenses and exclusive rights to vote on matters affecting only individual classes. Income, non-class specific expenses, and realized and unrealized capital gains and losses of the fund are allocated to each class of shares based on their relative net assets.
Distributions to Shareholders — Distributions from net investment income, if any, are generally declared and paid quarterly. Distributions from net realized gains, if any, are generally declared and paid annually.
Indemnifications — Under the corporation’s organizational documents, its officers and directors are indemnified against certain liabilities arising out of the performance of their duties to the fund. In addition, in the normal course of business, the fund enters into contracts that provide general indemnifications. The maximum exposure under these arrangements is unknown as this would involve future claims that may be made against a fund. The risk of material loss from such claims is considered by management to be remote.
3. Fees and Transactions with Related Parties
Certain officers and directors of the corporation are also officers and/or directors of American Century Companies, Inc. (ACC). The corporation’s investment advisor, ACIM, the corporation's distributor, American Century Investment Services, Inc. (ACIS), and the corporation’s transfer agent, American Century Services, LLC, are wholly owned, directly or indirectly, by ACC. Various funds issued by American Century Asset Allocation Portfolios, Inc. and American Century Strategic Asset Allocations, Inc. own, in aggregate, 10% of the shares of the fund.
Management Fees — The corporation has entered into a management agreement with ACIM, under which ACIM provides the fund with investment advisory and management services in exchange for a single, unified management fee (the fee) per class. The agreement provides that all expenses of managing and operating the fund, except distribution and service fees, brokerage expenses, taxes, interest, fees and expenses of the independent directors (including legal counsel fees), and extraordinary expenses, will be paid by ACIM. The fee is computed and accrued daily based on each class's daily net assets and paid monthly in arrears. The fee consists of (1) an Investment Category Fee based on the daily net assets of the fund and certain other accounts managed by the investment advisor that are in the same broad investment category as the fund and (2) a Complex Fee based on the assets of all the funds in the American Century Investments family of funds. The rates for the Investment Category Fee range from 0.5380% to 0.7200%. The rates for the Complex Fee range from 0.2500% to 0.3100% for the Investor Class, A Class, C Class and R Class. The rates for the Complex Fee range from 0.0500% to 0.1100% for the Institutional Class. The effective annual management fee for each class for the year ended June 30, 2016 was 0.86% for the Investor Class, A Class, C Class and R Class and 0.66% for the Institutional Class.
Distribution and Service Fees — The Board of Directors has adopted a separate Master Distribution and Individual Shareholder Services Plan for each of the A Class, C Class and R Class (collectively the plans), pursuant to Rule 12b-1 of the 1940 Act. The plans provide that the A Class will pay ACIS an annual distribution and service fee of 0.25%. The plans provide that the C Class will pay ACIS an annual distribution and service fee of 1.00%, of which 0.25% is paid for individual shareholder services and 0.75% is paid for distribution services. The plans provide that the R Class will pay ACIS an annual distribution and service fee of 0.50%. The fees are computed and accrued daily based on each class’s daily net assets and paid monthly in arrears. The fees are used to pay financial intermediaries for distribution and individual shareholder services. Fees incurred under the plans during the year ended June 30, 2016 are detailed in the Statement of Operations.
Directors' Fees and Expenses — The Board of Directors is responsible for overseeing the investment advisor’s management and operations of the fund. The directors receive detailed information about the fund and its investment advisor regularly throughout the year, and meet at least quarterly with management of the investment advisor to review reports about fund operations. The fund’s officers do not receive compensation from the fund.
Interfund Transactions — The fund may enter into security transactions with other American Century Investments funds and other client accounts of the investment advisor, in accordance with the 1940 Act rules and procedures adopted by the Board of Directors. The rules and procedures require, among other things, that these transactions be effected at the independent current market price of the security. During the period, the interfund purchases and sales were $10,853,331 and $1,288,006, respectively.
24
4. Investment Transactions
Purchases and sales of investment securities, excluding short-term investments, for the year ended June 30, 2016 were $941,791,741 and $684,538,438, respectively.
5. Capital Share Transactions
Transactions in shares of the fund were as follows:
| Year ended June 30, 2016 | Year ended June 30, 2015 | |||||||||
| Shares | Amount | Shares | Amount | |||||||
| Investor Class/Shares Authorized | 325,000,000 | 325,000,000 | ||||||||
| Sold | 27,959,629 | $ | 374,839,010 | 15,678,727 | $ | 205,580,851 | ||||
| Issued in reinvestment of distributions | 166,621 | 2,101,923 | 19,099 | 245,991 | ||||||
| Redeemed | (9,542,261 | ) | (118,579,216 | ) | (7,864,330 | ) | (102,910,372 | ) | ||
| 18,583,989 | 258,361,717 | 7,833,496 | 102,916,470 | |||||||
| Institutional Class/Shares Authorized | 40,000,000 | 40,000,000 | ||||||||
| Sold | 747,609 | 9,260,416 | 576,454 | 7,583,049 | ||||||
| Issued in reinvestment of distributions | 15,875 | 201,111 | 3,715 | 48,033 | ||||||
| Redeemed | (910,355 | ) | (11,332,214 | ) | (737,692 | ) | (9,752,126 | ) | ||
| (146,871 | ) | (1,870,687 | ) | (157,523 | ) | (2,121,044 | ) | |||
| A Class/Shares Authorized | 40,000,000 | 40,000,000 | ||||||||
| Sold | 895,910 | 11,155,578 | 1,574,696 | 20,445,446 | ||||||
| Issued in reinvestment of distributions | 2,303 | 28,423 | 377 | 4,766 | ||||||
| Redeemed | (1,559,834 | ) | (19,042,689 | ) | (1,023,276 | ) | (13,129,731 | ) | ||
| (661,621 | ) | (7,858,688 | ) | 551,797 | 7,320,481 | |||||
| C Class/Shares Authorized | 15,000,000 | 15,000,000 | ||||||||
| Sold | 59,218 | 711,941 | 47,456 | 610,322 | ||||||
| Redeemed | (14,223 | ) | (167,087 | ) | (9,197 | ) | (116,366 | ) | ||
| 44,995 | 544,854 | 38,259 | 493,956 | |||||||
| R Class/Shares Authorized | 20,000,000 | 20,000,000 | ||||||||
| Sold | 1,297,950 | 15,855,516 | 289,212 | 3,666,922 | ||||||
| Redeemed | (452,507 | ) | (5,304,932 | ) | (112,449 | ) | (1,423,468 | ) | ||
| 845,443 | 10,550,584 | 176,763 | 2,243,454 | |||||||
| Net increase (decrease) | 18,665,935 | $ | 259,727,780 | 8,442,792 | $ | 110,853,317 | ||||
6. Fair Value Measurements
The fund’s investments valuation process is based on several considerations and may use multiple inputs to determine the fair value of the investments held by the fund. In conformity with accounting principles generally accepted in the United States of America, the inputs used to determine a valuation are classified into three broad levels.
| • | Level 1 valuation inputs consist of unadjusted quoted prices in an active market for identical investments. |
| • | Level 2 valuation inputs consist of direct or indirect observable market data (including quoted prices for comparable investments, evaluations of subsequent market events, interest rates, prepayment speeds, credit risk, etc.). These inputs also consist of quoted prices for identical investments initially expressed in local currencies that are adjusted through translation into U.S. dollars. |
| • | Level 3 valuation inputs consist of unobservable data (including a fund’s own assumptions). |
25
The level classification is based on the lowest level input that is significant to the fair valuation measurement. The valuation inputs are not necessarily an indication of the risks associated with investing in these securities or other financial instruments. There were no significant transfers between levels during the period.
The following is a summary of the level classifications as of period end. The Schedule of Investments provides additional information on the fund’s portfolio holdings.
| Level 1 | Level 2 | Level 3 | ||||||
| Assets | ||||||||
| Investment Securities | ||||||||
| Common Stocks | $ | 733,815,140 | — | — | ||||
| Temporary Cash Investments | 5,483 | $ | 7,194,000 | — | ||||
| $ | 733,820,623 | $ | 7,194,000 | — | ||||
7. Derivative Instruments
Equity Price Risk — The fund is subject to equity price risk in the normal course of pursuing its investment objectives. A fund may enter into futures contracts based on an equity index in order to manage its exposure to changes in market conditions. A fund may purchase futures contracts to gain exposure to increases in market value or sell futures contracts to protect against a decline in market value. Upon entering into a futures contract, a fund is required to deposit either cash or securities in an amount equal to a certain percentage of the contract value (initial margin). Subsequent payments (variation margin) are made or received daily, in cash, by a fund. The variation margin is equal to the daily change in the contract value and is recorded as unrealized gains and losses. A fund recognizes a realized gain or loss when the contract is closed or expires. Net realized and unrealized gains or losses occurring during the holding period of futures contracts are a component of net realized gain (loss) on futures contract transactions and change in net unrealized appreciation (depreciation) on futures contracts, respectively. One of the risks of entering into futures contracts is the possibility that the change in value of the contract may not correlate with the changes in value of the underlying securities. During the period, the fund participated in equity price risk derivative instruments for temporary investment purposes.
At period end, the fund did not have any derivative instruments disclosed on the Statement of Assets and Liabilities. For the year ended June 30, 2016, the effect of equity price risk derivative instruments on the Statement of Operations was $(2,920,233) in net realized gain (loss) on futures contract transactions.
8. Risk Factors
The fund invests in common stocks of small companies. Because of this, the fund may be subject to greater risk and market fluctuations than a fund investing in larger, more established companies.
9. Federal Tax Information
The tax character of distributions paid during the years ended June 30, 2016 and June 30, 2015 were as follows:
| 2016 | 2015 | |||||
| Distributions Paid From | ||||||
| Ordinary income | $ | 2,353,181 | $ | 303,045 | ||
| Long-term capital gains | — | — | ||||
The book-basis character of distributions made during the year from net investment income or net realized gains may differ from their ultimate characterization for federal income tax purposes. These differences reflect the differing character of certain income items and net realized gains and losses for financial statement and tax purposes, and may result in reclassification among certain capital accounts on the financial statements.
26
As of June 30, 2016, the federal tax cost of investments and the components of distributable earnings on a tax-basis were as follows:
| Federal tax cost of investments | $ | 710,319,837 | |
| Gross tax appreciation of investments | $ | 81,034,203 | |
| Gross tax depreciation of investments | (50,339,417 | ) | |
| Net tax appreciation (depreciation) of investments | $ | 30,694,786 | |
| Undistributed ordinary income | $ | 1,389,439 | |
| Accumulated short-term capital losses | $ | (86,013,990 | ) |
The difference between book-basis and tax-basis unrealized appreciation (depreciation) is attributable primarily to the tax deferral of losses on wash sales.
Accumulated capital losses represent net capital loss carryovers that may be used to offset future realized capital gains for federal income tax purposes. Any unlimited losses will be required to be utilized prior to the losses which carry an expiration date. Future capital loss carryover utilization in any given year may be subject to Internal Revenue Code limitations. Capital loss carryovers of $(31,397,208) expire in 2018 and the remaining losses are unlimited.
27
| Financial Highlights |
| For a Share Outstanding Throughout the Years Ended June 30 (except as noted) | |||||||||||||
| Per-Share Data | Ratios and Supplemental Data | ||||||||||||
| Income From Investment Operations: | Ratio to Average Net Assets of: | ||||||||||||
Net Asset Value, Beginning of Period | Net Investment Income (Loss)(1) | Net Realized and Unrealized Gain (Loss) | Total From Investment Operations | Distributions From Net Investment Income | Net Asset Value, End of Period | Total Return(2) | Operating Expenses | Net Investment Income (Loss) | Portfolio Turnover Rate | Net Assets, End of Period (in thousands) | |||
| Investor Class | |||||||||||||
| 2016 | $13.68 | 0.04 | (1.22) | (1.18) | (0.04) | $12.46 | (8.63)% | 0.88% | 0.36% | 93% | $654,517 | ||
| 2015 | $13.10 | 0.03 | 0.56 | 0.59 | (0.01) | $13.68 | 4.51% | 0.87% | 0.25% | 100% | $464,592 | ||
| 2014 | $10.36 | 0.02 | 2.75 | 2.77 | (0.03) | $13.10 | 26.79% | 0.87% | 0.18% | 83% | $342,090 | ||
| 2013 | $8.24 | 0.08 | 2.12 | 2.20 | (0.08) | $10.36 | 26.92% | 0.88% | 0.92% | 93% | $236,280 | ||
| 2012 | $8.38 | 0.04 | (0.16) | (0.12) | (0.02) | $8.24 | (1.37)% | 0.89% | 0.45% | 72% | $188,519 | ||
| Institutional Class | |||||||||||||
| 2016 | $13.76 | 0.07 | (1.24) | (1.17) | (0.07) | $12.52 | (8.50)% | 0.68% | 0.56% | 93% | $34,094 | ||
| 2015 | $13.15 | 0.06 | 0.57 | 0.63 | (0.02) | $13.76 | 4.77% | 0.67% | 0.45% | 100% | $39,483 | ||
| 2014 | $10.41 | 0.05 | 2.76 | 2.81 | (0.07) | $13.15 | 27.02% | 0.67% | 0.38% | 83% | $39,805 | ||
| 2013 | $8.27 | 0.10 | 2.14 | 2.24 | (0.10) | $10.41 | 27.27% | 0.68% | 1.12% | 93% | $36,886 | ||
| 2012 | $8.42 | 0.05 | (0.15) | (0.10) | (0.05) | $8.27 | (1.20)% | 0.69% | 0.65% | 72% | $29,506 | ||
| A Class | |||||||||||||
| 2016 | $13.39 | 0.01 | (1.20) | (1.19) | (0.01) | $12.19 | (8.89)% | 1.13% | 0.11% | 93% | $35,153 | ||
| 2015 | $12.84 | —(3) | 0.55 | 0.55 | —(3) | $13.39 | 4.30% | 1.12% | 0.00%(4) | 100% | $47,471 | ||
| 2014 | $10.15 | (0.01) | 2.70 | 2.69 | —(3) | $12.84 | 26.54% | 1.12% | (0.07)% | 83% | $38,437 | ||
| 2013 | $8.08 | 0.06 | 2.07 | 2.13 | (0.06) | $10.15 | 26.58% | 1.13% | 0.67% | 93% | $26,862 | ||
| 2012 | $8.22 | 0.02 | (0.15) | (0.13) | (0.01) | $8.08 | (1.64)% | 1.14% | 0.20% | 72% | $25,944 | ||
| For a Share Outstanding Throughout the Years Ended June 30 (except as noted) | |||||||||||||
| Per-Share Data | Ratios and Supplemental Data | ||||||||||||
| Income From Investment Operations: | Ratio to Average Net Assets of: | ||||||||||||
Net Asset Value, Beginning of Period | Net Investment Income (Loss)(1) | Net Realized and Unrealized Gain (Loss) | Total From Investment Operations | Distributions From Net Investment Income | Net Asset Value, End of Period | Total Return(2) | Operating Expenses | Net Investment Income (Loss) | Portfolio Turnover Rate | Net Assets, End of Period (in thousands) | |||
| C Class | |||||||||||||
| 2016 | $13.15 | (0.07) | (1.19) | (1.26) | — | $11.89 | (9.58)% | 1.88% | (0.64)% | 93% | $1,631 | ||
| 2015 | $12.70 | (0.09) | 0.54 | 0.45 | — | $13.15 | 3.54% | 1.87% | (0.75)% | 100% | $1,212 | ||
| 2014 | $10.12 | (0.10) | 2.68 | 2.58 | — | $12.70 | 25.49% | 1.87% | (0.82)% | 83% | $685 | ||
| 2013 | $8.08 | (0.03) | 2.10 | 2.07 | (0.03) | $10.12 | 25.68% | 1.88% | (0.08)% | 93% | $303 | ||
| 2012 | $8.27 | (0.04) | (0.15) | (0.19) | — | $8.08 | (2.30)% | 1.89% | (0.55)% | 72% | $77 | ||
| R Class | |||||||||||||
| 2016 | $13.19 | (0.01) | (1.19) | (1.20) | — | $11.99 | (9.10)% | 1.38% | (0.14)% | 93% | $14,847 | ||
| 2015 | $12.68 | (0.03) | 0.54 | 0.51 | — | $13.19 | 4.02% | 1.37% | (0.25)% | 100% | $5,185 | ||
| 2014 | $10.05 | (0.04) | 2.67 | 2.63 | — | $12.68 | 26.17% | 1.37% | (0.32)% | 83% | $2,743 | ||
| 2013 | $8.00 | 0.04 | 2.06 | 2.10 | (0.05) | $10.05 | 26.33% | 1.38% | 0.42% | 93% | $1,356 | ||
| 2012 | $8.15 | —(3) | (0.15) | (0.15) | — | $8.00 | (1.84)% | 1.39% | (0.05)% | 72% | $930 | ||
| Notes to Financial Highlights |
| (1) | Computed using average shares outstanding throughout the period. |
| (2) | Total returns are calculated based on the net asset value of the last business day and do not reflect applicable sales charges, if any. Total returns for periods less than one year are not annualized. |
| (3) | Per-share amount was less than $0.005. |
| (4) | Ratio was less than 0.005%. |
See Notes to Financial Statements.
| Report of Independent Registered Public Accounting Firm |
To the Directors of the American Century Quantitative Equity Funds, Inc. and Shareholders of the Small Company Fund:
In our opinion, the accompanying statement of assets and liabilities, including the schedule of investments, and the related statements of operations and of changes in net assets and the financial highlights present fairly, in all material respects, the financial position of the Small Company Fund (one of the sixteen funds comprising the American Century Quantitative Equity Funds, Inc., hereafter referred to as the “Fund”) at June 30, 2016, the results of its operations for the year then ended, the changes in its net assets for each of the two years in the period then ended and the financial highlights for each of the five years in the period then ended, in conformity with accounting principles generally accepted in the United States of America. These financial statements and financial highlights (hereafter referred to as "financial statements") are the responsibility of the Fund's management. Our responsibility is to express an opinion on these financial statements based on our audits. We conducted our audits of these financial statements in accordance with the standards of the Public Company Accounting Oversight Board (United States). Those standards require that we plan and perform the audit to obtain reasonable assurance about whether the financial statements are free of material misstatement. An audit includes examining, on a test basis, evidence supporting the amounts and disclosures in the financial statements, assessing the accounting principles used and significant estimates made by management, and evaluating the overall financial statement presentation. We believe that our audits, which included confirmation of securities at June 30, 2016 by correspondence with the custodian and brokers, provide a reasonable basis for our opinion.
PricewaterhouseCoopers LLP
Kansas City, Missouri
August 17, 2016
30
| Management |
Board of Directors
The individuals listed below serve as directors of the funds. Each director will continue to serve in this capacity until death, retirement, resignation or removal from office. The board has adopted a mandatory retirement age for directors who are not “interested persons,” as that term is defined in the Investment Company Act (independent directors). Independent directors shall retire on December 31 of the year in which they reach their 75th birthday; provided, however, that on or after January 1, 2022, independent directors shall retire on December 31 of the year in which they reach their 76th birthday.
Mr. Thomas is an “interested person” because he currently serves as President and Chief Executive Officer of American Century Companies, Inc. (ACC), the parent company of American Century Investment Management, Inc. (ACIM or the advisor). The other directors (more than three-fourths of the total number) are independent. They are not employees, directors or officers of, and have no financial interest in, ACC or any of its wholly owned, direct or indirect, subsidiaries, including ACIM, American Century Investment Services, Inc. (ACIS) and American Century Services, LLC (ACS), and they do not have any other affiliations, positions or relationships that would cause them to be considered “interested persons” under the Investment Company Act. The directors serve in this capacity for eight (in the case of Mr. Thomas, 15) registered investment companies in the American Century Investments family of funds.
The following table presents additional information about the directors. The mailing address for each director other than Mr. Thomas is 1665 Charleston Road, Mountain View, California 94043. The mailing address for Mr. Thomas is 4500 Main Street, Kansas City, Missouri 64111.
Name (Year of Birth) | Position(s) Held with Funds | Length of Time Served | Principal Occupation(s) During Past 5 Years | Number of American Century Portfolios Overseen by Director | Other Directorships Held During Past 5 Years |
| Independent Directors | |||||
| Tanya S. Beder (1955) | Director | Since 2011 | Chairman and CEO, SBCC Group Inc. (independent advisory services) (2006 to present) | 45 | CYS Investments, Inc. (NYSE mortgage arbitrage REIT) |
| Jeremy I. Bulow (1954) | Director | Since 2011 | Professor of Economics, Stanford University, Graduate School of Business (1979 to present) | 45 | None |
| Anne Casscells (1958) | Director | Since 2016 | Co-Chief Executive Officer and Chief Investment Officer, Aetos Alternatives Management (investment advisory firm) (2001 to present); Lecturer in Accounting, Stanford University, Graduate School of Business (2009 to present) | 45 | None |
31
Name (Year of Birth) | Position(s) Held with Funds | Length of Time Served | Principal Occupation(s) During Past 5 Years | Number of American Century Portfolios Overseen by Director | Other Directorships Held During Past 5 Years |
| Independent Directors | |||||
| Ronald J. Gilson (1946) | Director and Chairman of the Board | Since 1995 (Chairman since 2005) | Charles J. Meyers Professor of Law and Business, Emeritus, Stanford Law School (1979 to present); Marc and Eva Stern Professor of Law and Business, Columbia University School of Law (1992 to present) | 45 | None |
| Frederick L. A. Grauer (1946) | Director | Since 2008 | Senior Advisor, iShares by BlackRock, Inc. (investment management firm) (2010 to 2011, 2013 to present); Senior Advisor, Course Hero (an educational technology company) (2015 to present) | 45 | None |
| Jonathan D. Levin (1972) | Director | Since 2016 | Holbrook Working Professor of Price Theory, Stanford University, (2000 to present); Chair, Department of Economics, Stanford University (2011 to 2014) | 45 | None |
| Peter F. Pervere (1947) | Director | Since 2007 | Retired | 45 | None |
| John B. Shoven (1947) | Director | Since 2002 | Charles R. Schwab Professor of Economics, Stanford University (1973 to present) | 45 | Cadence Design Systems; Exponent; Financial Engines |
| Interested Director | |||||
| Jonathan S. Thomas (1963) | Director and President | Since 2007 | President and Chief Executive Officer, ACC (March 2007 to present). Also serves as Chief Executive Officer, ACS; Executive Vice President, ACIM; Director, ACC, ACIM and other ACC subsidiaries | 128 | BioMed Valley Discoveries, Inc. |
The Statement of Additional Information has additional information about the fund's directors and is available without charge, upon request, by calling 1-800-345-2021.
32
Officers
The following table presents certain information about the executive officers of the funds. Each officer serves as an officer for each of the 15 investment companies in the American Century family of funds, unless otherwise noted. No officer is compensated for his or her service as an officer of the funds. The listed officers are interested persons of the funds and are appointed or re-appointed on an annual basis. The mailing address for each of the officers listed below is 4500 Main Street, Kansas City, Missouri 64111.
Name (Year of Birth) | Offices with the Funds | Principal Occupation(s) During the Past Five Years |
| Jonathan S. Thomas (1963) | Director and President since 2007 | President and Chief Executive Officer, ACC (March 2007 to present). Also serves as Chief Executive Officer, ACS; Executive Vice President, ACIM; Director, ACC, ACIM and other ACC subsidiaries |
| Amy D. Shelton (1964) | Chief Compliance Officer and Vice President since 2014 | Chief Compliance Officer, American Century funds, (March 2014 to present); Chief Compliance Officer, ACIM (February 2014 to present); Chief Compliance Officer, ACIS (October 2009 to present); Vice President, Client Interactions and Marketing, ACIS (February 2013 to January 2014); Director, Client Interactions and Marketing, ACIS (June 2007 to January 2013). Also serves as Vice President, ACIS |
| Charles A. Etherington (1957) | General Counsel since 2007 and Senior Vice President since 2006 | Attorney, ACC (February 1994 to present); Vice President, ACC (November 2005 to present); General Counsel, ACC (March 2007 to present). Also serves as General Counsel, ACIM, ACS, ACIS and other ACC subsidiaries; and Senior Vice President, ACIM and ACS |
| C. Jean Wade (1964) | Vice President, Treasurer and Chief Financial Officer since 2012 | Vice President, ACS (February 2000 to present) |
| Robert J. Leach (1966) | Vice President since 2006 and Assistant Treasurer since 2012 | Vice President, ACS (February 2000 to present) |
| David H. Reinmiller (1963) | Vice President since 2001 | Attorney, ACC (January 1994 to present); Associate General Counsel, ACC (January 2001 to present). Also serves as Vice President, ACIM and ACS |
| Ward D. Stauffer (1960) | Secretary since 2005 | Attorney, ACC (June 2003 to present) |
33
| Approval of Management Agreement |
At a meeting held on June 14, 2016, the Fund’s Board of Directors (the "Board") unanimously approved the renewal of the management agreement pursuant to which American Century Investment Management, Inc. (the “Advisor”) acts as the investment advisor for the Fund. Under Section 15(c) of the Investment Company Act, contracts for investment advisory services are required to be reviewed, evaluated, and approved by a majority of a fund’s directors/trustees, including a majority of the independent Directors, each year. The Board regards this annual evaluation and renewal as one of its most important responsibilities.
The independent Directors have memorialized a statement regarding the relationship between their ongoing obligations to oversee and evaluate the performance of the Advisor and their annual consideration of renewal of the management agreement. In that statement, the independent Directors noted that their assessment of the Advisor’s performance is an ongoing process that takes place over the entire year and is informed by all of the extensive information that the Board and its committees receive and consider over time. This information, together with the additional materials provided specifically in connection with the review, are central to the Board’s assessment of the Advisor’s performance and its determination whether to renew the Fund’s management agreement.
Prior to its consideration of the renewal of the management agreement, the Board requested and reviewed extensive data and analysis relating to the proposed renewal. This information and analysis was compiled by the Advisor and certain independent providers of evaluation data concerning the Fund and the services provided to the Fund by the Advisor.
In connection with its consideration of the renewal of the management agreement, the Board’s review and evaluation of the services provided by the Advisor included, but was not limited to, the following:
| • | the nature, extent, and quality of investment management, shareholder services, and other services provided by the Advisor to the Fund; |
| • | the wide range of other programs and services the Advisor provides to the Fund and its shareholders on a routine and non-routine basis; |
| • | the investment performance of the Fund, including data comparing the Fund’s performance to appropriate benchmarks and/or a peer group of other mutual funds with similar investment objectives and strategies; |
| • | the cost of owning the Fund compared to the cost of owning similar funds; |
| • | the Advisor’s compliance policies, procedures, and regulatory experience; |
| • | financial data showing the cost of services provided to the Fund, the profitability of the Fund to the Advisor, and the overall profitability of the Advisor; |
| • | possible economies of scale associated with the Advisor’s management of the Fund and other accounts under its management; |
| • | data comparing services provided and charges to other investment management clients of the Advisor; |
| • | acquired fund fees and expenses; |
| • | payments by the Fund and the Advisor to financial intermediaries whose clients are investors in the Fund; and |
| • | any collateral benefits derived by the Advisor from the management of the Fund. |
In keeping with its practice, the Board held two in-person meetings to review and discuss the information provided in response to their request. The independent Directors also had the benefit of the advice of their independent counsel throughout the process.
34
Factors Considered
The Directors considered all of the information provided by the Advisor, the independent data providers, and the independent Directors’ independent counsel in connection with the approval. They determined that the information was sufficient for them to evaluate the management agreement for the Fund. In connection with their review, the Directors did not identify any single factor as being all-important or controlling and each Director may have attributed different levels of importance to different factors. In deciding to renew the management agreement, the Board based its decision on a number of factors, including the following:
Nature, Extent and Quality of Services - Generally. Under the management agreement, the Advisor is responsible for providing or arranging for all services necessary for the operation of the Fund. The Board noted that under the management agreement, the Advisor provides or arranges at its own expense a wide variety of services including:
| • | constructing and designing the Fund |
| • | portfolio research and security selection |
| • | initial capitalization/funding |
| • | securities trading |
| • | Fund administration |
| • | custody of Fund assets |
| • | daily valuation of the Fund’s portfolio |
| • | shareholder servicing and transfer agency, including shareholder confirmations, recordkeeping, and communications |
| • | legal services (except the independent Directors’ counsel) |
| • | regulatory and portfolio compliance |
| • | financial reporting |
| • | marketing and distribution (except amounts paid by the Fund under Rule 12b-1 plans) |
The Board noted that many of these services have expanded over time in terms of both quantity and complexity in response to shareholder demands, competition in the industry, changing distribution channels, and the changing regulatory environment.
Investment Management, Shareholder, and Other Services. The nature of the investment management services provided to the Fund is quite complex and allows Fund shareholders access to professional money management, instant diversification of their investments within an asset class, the opportunity to easily diversify among asset classes by investing in or exchanging among various American Century Investments funds, and liquidity. In evaluating investment performance, the Board expects the Advisor to manage the Fund in accordance with its investment objectives and approved strategies. Further, the Directors recognize that the Advisor has an obligation to seek the best execution of fund trades. In providing these services, the Advisor utilizes teams of investment professionals (portfolio managers, analysts, research assistants, and securities traders) who require extensive information technology, research, training, compliance, and other systems to conduct their business. The Board, directly and through its Portfolio Committee, regularly reviews investment performance information for the Fund, together with comparative information for appropriate benchmarks and/or peer groups of similarly-managed funds, over different time horizons. The Directors also review detailed performance information during the management agreement approval process. If performance concerns are identified, the Fund receives special reviews until performance improves, during which the Board discusses with the Advisor the reasons for such results (e.g., market conditions, security selection) and any efforts being undertaken to improve performance. The Fund’s performance was above its benchmark for the three- and five-year periods and below its benchmark for the one- and ten-year periods reviewed by the Board. The Board found the investment management services provided by the Advisor to the Fund to be satisfactory and consistent with the management agreement.
35
Under the management agreement, the Advisor provides the Fund with a comprehensive package of transfer agency, shareholder, and other services. The Board, directly and through various committees of the Board, regularly reviews reports and evaluations of such services at its regular meetings. These reports include, but are not limited to, information regarding the operational efficiency and accuracy of the shareholder and transfer agency services provided, staffing levels, shareholder satisfaction (as measured by external as well as internal sources), technology support, new products and services offered to Fund shareholders, securities trading activities, portfolio valuation services, auditing services, and legal and operational compliance activities. Certain aspects of shareholder and transfer agency service level efficiency and the quality of securities trading activities are measured by independent third party providers and are presented in comparison to other fund groups not managed by the Advisor.
The Board found the services provided by the Advisor to the Fund under the management agreement to be competitive and of high quality.
Costs of Services and Profitability. The Advisor provides detailed information concerning its cost of providing various services to the Fund, its profitability in managing the Fund, its overall profitability, and its financial condition. The Directors have reviewed with the Advisor the methodology used to prepare this financial information. This information is considered in evaluating the Advisor’s financial condition, its ability to continue to provide services under the management agreement, and the reasonableness of the current management fee. The Board concluded that the Advisor’s profits were reasonable in light of the services provided to the Fund.
Economies of Scale. The Board also reviewed information provided by the Advisor regarding the possible existence of economies of scale in connection with the management of the Fund. The Board concluded that economies of scale are difficult to measure and predict with precision, especially on a fund-by-fund basis. The Board concluded that the Advisor is appropriately sharing economies of scale through its competitive fee structure, offering competitive fees from fund inception, and through reinvestment in its business to provide shareholders enhanced and expanded services.
Comparison to Other Funds’ Fees. The management agreement provides that the Fund pays the Advisor a single, all-inclusive (or unified) management fee for providing all services necessary for the management and operation of the Fund, other than brokerage expenses, expenses attributable to short sales, taxes, interest, extraordinary expenses, the fees and expenses of the Fund’s independent Directors (including their independent legal counsel), and expenses incurred in connection with the provision of shareholder services and distribution services under a plan adopted pursuant to Rule 12b-1 under the 1940 Act. Under the unified fee structure, the Advisor is responsible for providing all investment advisory, custody, audit, administrative, compliance, recordkeeping, marketing, and shareholder services, or arranging and supervising third parties to provide such services. By contrast, most other funds are charged a variety of fees, including an investment advisory fee, a transfer agency fee, an administrative fee, distribution charges, and other expenses. Other than their investment advisory fees and any applicable Rule 12b-1 fees, all other components of the total fees charged by these other funds may be increased without shareholder approval. The Board believes the unified fee structure is a benefit to Fund shareholders because it clearly discloses to shareholders the cost of owning Fund shares, and, since the unified fee cannot be increased without a vote of Fund shareholders, it shifts to the Advisor the risk of increased costs of operating the Fund and provides a direct incentive to minimize administrative inefficiencies. Part of the Board’s analysis of fee levels involves reviewing certain evaluative data compiled by an independent provider and comparing the Fund’s unified fee to the total expense ratio of peer funds. The unified fee charged to shareholders of the Fund was below the median of the total expense ratios of the Fund’s peer group. The Board concluded that the management fee paid by the Fund to the Advisor under the management agreement is reasonable in light of the services provided to the Fund.
36
Comparison to Fees and Services Provided to Other Clients of the Advisor. The Board also requested and received information from the Advisor concerning the nature of the services, fees, costs, and profitability of its advisory services to advisory clients other than the Fund. They observed that these varying types of client accounts require different services and involve different regulatory and entrepreneurial risks than the management of the Fund. The Board analyzed this information and concluded that the fees charged and services provided to the Fund were reasonable by comparison.
Payments to Intermediaries. The Directors also requested and received a description of payments made to intermediaries by the Fund and the Advisor. These payments include various payments made by the Fund or the Advisor to different types of intermediaries and recordkeepers for distribution and service activities provided for the Fund.
Collateral or “Fall-Out” Benefits Derived by the Advisor. The Board considered the existence of collateral benefits the Advisor may receive as a result of its relationship with the Fund. The Board noted that the Advisor’s primary business is managing mutual funds and it generally does not use fund or shareholder information to generate profits in other lines of business, and therefore does not derive any significant collateral benefits from them. The Board noted that the Advisor receives proprietary research from broker-dealers that execute fund portfolio transactions. The Board also determined that the Advisor is able to provide investment management services to certain clients other than the Fund, at least in part, due to its existing infrastructure built to serve the fund complex. The Board concluded, however, that the assets of those other clients are not material to the analysis and, where applicable, may be included with the assets of the Fund to determine breakpoints in the management fee schedule.
Existing Relationship. The Board also considered whether there was any reason for not continuing the existing arrangement with the Advisor. In this regard, the Board was mindful of the potential disruptions of the Fund’s operations and various risks, uncertainties, and other effects that could occur as a result of a decision not to continue such relationship. In particular, the Board recognized that most shareholders have invested in the Fund on the strength of the Advisor’s industry standing and reputation and in the expectation that the Advisor will have a continuing role in providing advisory services to the Fund.
Conclusion of the Directors. As a result of this process, the Board, including all of the independent Directors and assisted by the advice of independent legal counsel, taking into account all of the factors discussed above and the information provided by the Advisor and others in connection with its review and throughout the year, concluded that the management agreement between the Fund and the Advisor is fair and reasonable in light of the services provided and should be renewed.
37
| Proxy Voting Results |
A special meeting of shareholders was held on June 13, 2016, to vote on the following proposal. The proposal received the required number of votes and was adopted. A summary of voting results is listed below.
To elect four directors to the Board of Directors of American Century Quantitative Equity Funds, Inc.:
| Affirmative | Withhold | ||||||
| Tanya S. Beder | $ | 8,473,153,264 | $ | 121,459,590 | |||
| Jeremy I. Bulow | $ | 8,469,793,581 | $ | 124,819,273 | |||
| Anne Casscells | $ | 8,465,895,232 | $ | 128,717,622 | |||
| Jonathan D. Levin | $ | 8,468,929,867 | $ | 125,682,987 | |||
The other directors whose term of office continued after the meeting include Jonathan S. Thomas, Ronald J. Gilson, Frederick L. A. Grauer, Peter F. Pervere and John B. Shoven.
38
| Additional Information |
Retirement Account Information
As required by law, distributions you receive from certain IRAs are subject to federal income tax withholding, unless you elect not to have withholding apply. Tax will be withheld on the total amount withdrawn even though you may be receiving amounts that are not subject to withholding, such as nondeductible contributions. In such case, excess amounts of withholding could occur. You may adjust your withholding election so that a greater or lesser amount will be withheld.
If you don’t want us to withhold on this amount, you must notify us to not withhold the federal income tax. You may notify us in writing or in certain situations by telephone or through other electronic means. For systematic withdrawals, your withholding election will remain in effect until revoked or changed by filing a new election. You have the right to revoke your election at any time.
Remember, even if you elect not to have income tax withheld, you are liable for paying income tax on the taxable portion of your withdrawal. If you elect not to have income tax withheld or you don’t have enough income tax withheld, you may be responsible for payment of estimated tax. You may incur penalties under the estimated tax rules if your withholding and estimated tax payments are not sufficient. You can reduce or defer the income tax on a distribution by directly or indirectly rolling such distribution over to another IRA or eligible plan. You should consult your tax advisor for additional information.
State tax will be withheld if, at the time of your distribution, your address is within one of the mandatory withholding states and you have federal income tax withheld (or as otherwise required by state law). State taxes will be withheld from your distribution in accordance with the respective state rules.
Distributions you receive from 403(b), 457 and qualified plans are subject to special tax and withholding rules. Your plan administrator or plan sponsor is required to provide you with a special tax notice explaining those rules at the time you request a distribution. If applicable, federal and/or state taxes may be withheld from your distribution amount.
Proxy Voting Policies
Descriptions of the principles and policies that the fund's investment advisor uses in exercising the voting rights associated with the securities purchased and/or held by the fund are available without charge, upon request, by calling 1-800-345-2021 or visiting the "About Us" page of American Century Investments’ website at americancentury.com. A description of the policies is also available on the Securities and Exchange Commission’s website at sec.gov. Information regarding how the investment advisor voted proxies relating to portfolio securities during the most recent 12-month period ended June 30 is available on the "About Us" page at americancentury.com. It is also available at sec.gov.
Quarterly Portfolio Disclosure
The fund files its complete schedule of portfolio holdings with the Securities and Exchange Commission (SEC) for the first and third quarters of each fiscal year on Form N-Q. The fund’s Forms N-Q are available on the SEC’s website at sec.gov, and may be reviewed and copied at the SEC’s Public Reference Room in Washington, DC. Information on the operation of the Public Reference Room may be obtained by calling 1-800-SEC-0330. The fund also makes its complete schedule of portfolio holdings for the most recent quarter of its fiscal year available on its website at americancentury.com and, upon request, by calling 1-800-345-2021.
39
Other Tax Information
The following information is provided pursuant to provisions of the Internal Revenue Code.
The fund hereby designates up to the maximum amount allowable as qualified dividend income for the fiscal year ended June 30, 2016.
For corporate taxpayers, the fund hereby designates $2,353,181, or up to the maximum amount allowable, of ordinary income distributions paid during the fiscal year ended June 30, 2016 as qualified for the corporate dividends received deduction.
40
| ||
| Contact Us | americancentury.com | |
| Automated Information Line | 1-800-345-8765 | |
| Investor Services Representative | 1-800-345-2021 or 816-531-5575 | |
| Investors Using Advisors | 1-800-378-9878 | |
| Business, Not-For-Profit, Employer-Sponsored Retirement Plans | 1-800-345-3533 | |
| Banks and Trust Companies, Broker-Dealers, Financial Professionals, Insurance Companies | 1-800-345-6488 | |
| Telecommunications Relay Service for the Deaf | 711 | |
| American Century Quantitative Equity Funds, Inc. | ||
Investment Advisor: American Century Investment Management, Inc. Kansas City, Missouri | ||
| This report and the statements it contains are submitted for the general information of our shareholders. The report is not authorized for distribution to prospective investors unless preceded or accompanied by an effective prospectus. | ||
| ©2016 American Century Proprietary Holdings, Inc. All rights reserved. CL-ANN-89956 1608 | ||
| Annual Report | |
| June 30, 2016 | |
| Utilities Fund | |
| Table of Contents |
| President's Letter | 2 | |
| Performance | 3 | |
| Portfolio Commentary | ||
| Fund Characteristics | ||
| Shareholder Fee Example | ||
| Schedule of Investments | ||
| Statement of Assets and Liabilities | ||
| Statement of Operations | ||
| Statement of Changes in Net Assets | ||
| Notes to Financial Statements | ||
| Financial Highlights | ||
| Report of Independent Registered Public Accounting Firm | ||
| Management | ||
| Approval of Management Agreement | ||
| Proxy Voting Results | ||
| Additional Information | ||
Any opinions expressed in this report reflect those of the author as of the date of the report, and do not necessarily represent the opinions of American Century Investments® or any other person in the American Century Investments organization. Any such opinions are subject to change at any time based upon market or other conditions and American Century Investments disclaims any responsibility to update such opinions. These opinions may not be relied upon as investment advice and, because investment decisions made by American Century Investments funds are based on numerous factors, may not be relied upon as an indication of trading intent on behalf of any American Century Investments fund. Security examples are used for representational purposes only and are not intended as recommendations to purchase or sell securities. Performance information for comparative indices and securities is provided to American Century Investments by third party vendors. To the best of American Century Investments’ knowledge, such information is accurate at the time of printing.
| President’s Letter |
Jonathan ThomasDear Investor:
Thank you for reviewing this annual report for the 12 months ended June 30, 2016. It provides investment performance and portfolio information for the reporting period, plus longer-term historical performance data.
Annual reports remain important vehicles for conveying information about fund returns, including market and economic factors that affected performance during the reporting period. For additional, updated investment and market insights, we encourage you to visit our website, americancentury.com.
Market Volatility Increased, But Not for the Reasons Anticipated
Going into this reporting period, investors anticipated increased market volatility and uncertainty as the Federal Reserve (the Fed) appeared poised to raise short-term interest rates toward more historically normal levels. This policy change was expected to affect investor sentiment, U.S. Treasury yield behavior, relative currency values, inflation expectations, and corporate costs and earnings.
This Fed-centric outlook didn’t fully account for global factors, which ultimately drove sentiment, volatility, and performance during the reporting period. During 2015, the primary catalyst was China, where slowing economic growth, currency devaluations, and massive monetary policy easing sent shock waves through the global markets. The Fed ended up delaying (until December 2015) its only small rate hike during the reporting period. Afterward, China-related events repeated in January and early February this year, further delaying Fed action.
Oil was another catalyst—its price collapses devalued entire market sectors and contributed to broad market volatility and negative sentiment. Later, as China and oil appeared to stabilize, Brexit occurred—the unexpected decision by United Kingdom voters to leave the European Union. This produced more shock waves, and altered central bank policies around the world. In this environment, relatively defensive assets performed best for the 12 months, including the stocks of gold-producing companies, utilities, real estate investment trusts (REITs), and long-maturity U.S. Treasury securities.
Looking ahead, we believe the markets face further uncertainty and volatility as they digest Brexit, the Italian bank crisis, China’s economic mysteries, and the U.S. presidential election. Negative interest rates in Europe and Japan represent part of the market’s response to the global macroeconomic climate. These negative rates are suppressing interest rates around the world while driving up the value of the U.S. dollar and U.S. bonds. In a broad sense, stocks also benefit from the central bank stimulus that is driving interest rates into negative territory, and from relative yield advantages as bond yields are pushed lower. It’s an unusual and challenging environment. We appreciate your continued trust in us.
Sincerely,
Jonathan Thomas
President and Chief Executive Officer
American Century Investments
2
| Performance |
| Total Returns as of June 30, 2016 | |||||
| Average Annual Returns | |||||
Ticker Symbol | 1 year | 5 years | 10 years | Inception Date | |
| Investor Class | BULIX | 25.76% | 11.71% | 8.70% | 3/1/93 |
| Russell 3000 Utilities Index | — | 28.37% | 12.61% | 8.49% | — |
| S&P 500 Index | — | 3.99% | 12.09% | 7.42% | — |
| Growth of $10,000 Over 10 Years |
| $10,000 investment made June 30, 2006 |
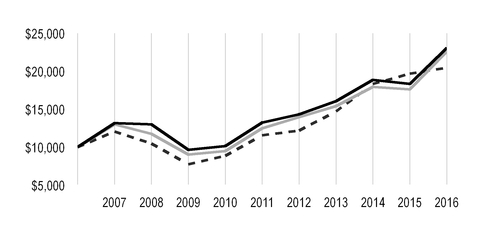
| Value on June 30, 2016 | |
| Investor Class — $23,055 | |
| Russell 3000 Utilities Index — $22,604 | |
| S&P 500 Index — $20,465 | |
| Total Annual Fund Operating Expenses | |
| Investor Class | 0.67% |
The total annual fund operating expenses shown is as stated in the fund’s prospectus current as of the date of this report. The prospectus may vary from the expense ratio shown elsewhere in this report because it is based on a different time period, includes acquired fund fees and expenses, and, if applicable, does not include fee waivers or expense reimbursements.
Data presented reflect past performance. Past performance is no guarantee of future results. Current performance may be higher or lower than the performance shown. Total returns for periods less than one year are not annualized. Investment return and principal value will fluctuate, and redemption value may be more or less than original cost. Data assumes reinvestment of dividends and capital gains, and none of the charts reflect the deduction of taxes that a shareholder would pay on fund distributions or the redemption of fund shares. To obtain performance data current to the most recent month end, please call 1-800-345-2021 or visit americancentury.com. For additional information about the fund, please consult the prospectus.
3
| Portfolio Commentary |
Portfolio Manager: Lynette Pang
In May 2016, portfolio manager Bill Martin left the fund's management team.
Performance Summary
Utilities returned 25.76% for the 12 months ended June 30, 2016, trailing the 28.37% return of its benchmark, the Russell 3000 Utilities Index. By comparison, the S&P 500 Index, a broad market measure, returned 3.99%.
The broad U.S. stock market posted modest gains during the 12-month period, held in check by concerns about global economic growth and central bank policy. Utility stocks posted strong gains that far outpaced the overall market despite the decision by the Federal Reserve (Fed) in December to raise interest rates by a quarter point. At the time, the Fed indicated it would continue to raise rates at a measured pace, but weak global growth kept the central bank from further increases. At the end of the period, U.K. voters unexpectedly approved a referendum for that country to leave the European Union, which jolted the market and reinforced market opinion that further Fed action would be delayed. Dividend-paying utility stocks have benefited from the prolonged low-rate environment as they are often seen as a good alternative to bonds when rates are low. Market volatility and global economic weakness have also contributed to the attractiveness of the sector, which is perceived as defensive, a comparative safe haven during times of difficulty.
The Russell 3000 Utilities Index is primarily made up of utilities and telecommunication services stocks but includes smaller allocations to other sectors. Utilities returned nearly 32% and telecommunication services about 24%. Information technology stocks, a tiny segment of the index, fell sharply, as did industrial stocks, another very small category that includes certain construction and services companies related to the utilities industry.
Looking at fund performance compared with the Russell 3000 Utilities Index, overweighting utility-oriented industrials stocks—primarily in the commercial services and supplies industry—detracted from relative performance. Stock selection in telecommunication services also hampered results. Stock selection and an overweight allocation to information technology detracted as well. Stock selection in the utilities sector, led by gas utilities and multi-utilities, benefited relative performance.
Industrial Stocks Were Key Detractors
Fund performance was hurt by an overweight allocation to the industrials sector, which represents a small portion of the Russell 3000 Utilities Index. West Corp., the fund’s only holding in the sector, declined following announcements that some of its largest clients were moving away from the provider of conference-calling and other business-related telecommunication services. Nevertheless, the company continues to make progress expanding into other communication segments, and has maintained its dividend payout to shareholders.
Stock selection in the telecommunication services sector detracted, primarily among diversified telecommunication services companies. The sector overall underperformed in the second half of 2015 as investors appeared willing to take on more risk in their portfolios. During the first half of 2016, however, dividend-paying stocks have been more attractive, contributing to a rebound. Among significant detractors, integrated telecommunication services firm IDT declined in the second half of 2015 on revenue concerns but bounced back somewhat in 2016, aided by the spin-off of Zedge, its social media app that is also now a fund holding. CenturyLink, which offers an array of telecommunication services to residential and commercial customers, detracted from performance as it declined early in the fiscal year, but its high dividend yield helped it recover
4
somewhat in 2016. Inteliquent, a voice telecommunications wholesaler that sells to larger firms such as AT&T, also weighed on portfolio performance.
An overweight in information technology detracted. The fund’s holding of communications equipment firm QUALCOMM, which is not in the index, was a significant detractor as the company suffered from a competitive business environment, issues with royalty payments, and slower growth in China.
Utilities Benefited Results
Traditional utilities companies—the largest segment of the benchmark and fund—added to relative results through stock selection. Utilities in general received a tailwind from investors’ renewed preference for dividend-paying stocks.
Gas utilities were among the best performers, led by AGL Resources, UGI, and WGL Holdings. Multi-utilities also contributed solidly to performance, including Consolidated Edison and Black Hills. Electric utilities such as Pinnacle West Capital and PPL were top contributors as well. AGL Resources, WGL Holdings, and Black Hills were no longer in the portfolio at the end of the period.
Stock selection among independent power and electricity producers meant the fund’s positioning among these stocks benefited relative results, overcoming the portfolio’s overweight allocation to this underperforming industry. Specifically, much of the contribution came from avoiding several poor performers in the industry segment, where results are often tied to commodity costs. Despite a rebound in gas and other commodity prices in 2016, producers declined for the fiscal year.
Outlook
Utilities employs a structured, disciplined investment approach. We incorporate both growth and value measures into our stock selection process and attempt to balance the portfolio’s risk and expected return.
We continue to overweight utilities and information technology stocks relative to the benchmark. The telecommunication services sector is significantly underweight because of only modest exposure to diversified telecommunication services firms.
5
| Fund Characteristics |
| JUNE 30, 2016 | |
| Top Ten Holdings | % of net assets |
| AT&T, Inc. | 11.2% |
| Verizon Communications, Inc. | 11.0% |
| Exelon Corp. | 4.6% |
| Public Service Enterprise Group, Inc. | 4.5% |
| PG&E Corp. | 4.3% |
| CenturyLink, Inc. | 3.9% |
| Consolidated Edison, Inc. | 3.8% |
| FirstEnergy Corp. | 3.8% |
| Entergy Corp. | 3.6% |
| American Electric Power Co., Inc. | 3.4% |
| Sub-Industry Allocation | % of net assets |
| Electric Utilities | 33.6% |
| Integrated Telecommunication Services | 27.8% |
| Multi-Utilities | 19.5% |
| Independent Power Producers and Energy Traders | 4.8% |
| Gas Utilities | 3.0% |
| Internet Software and Services | 2.6% |
| Alternative Carriers | 1.7% |
| Wireless Telecommunication Services | 1.7% |
| Office Services and Supplies | 1.4% |
| Communications Equipment | 1.0% |
| Water Utilities | 0.7% |
| Application Software | 0.1% |
| Cash and Equivalents* | 2.1% |
| *Includes temporary cash investments and other assets and liabilities. | |
| Types of Investments in Portfolio | % of net assets |
| Common Stocks | 97.9% |
| Temporary Cash Investments | 2.4% |
| Other Assets and Liabilities | (0.3)% |
6
| Shareholder Fee Example |
Fund shareholders may incur two types of costs: (1) transaction costs, including sales charges (loads) on purchase payments and redemption/exchange fees; and (2) ongoing costs, including management fees; distribution and service (12b-1) fees; and other fund expenses. This example is intended to help you understand your ongoing costs (in dollars) of investing in your fund and to compare these costs with the ongoing cost of investing in other mutual funds.
The example is based on an investment of $1,000 made at the beginning of the period and held for the entire period from January 1, 2016 to June 30, 2016.
Actual Expenses
The table provides information about actual account values and actual expenses for each class. You may use the information, together with the amount you invested, to estimate the expenses that you paid over the period. First, identify the share class you own. Then simply divide your account value by $1,000 (for example, an $8,600 account value divided by $1,000 = 8.6), then multiply the result by the number under the heading “Expenses Paid During Period” to estimate the expenses you paid on your account during this period.
If you hold Investor Class shares of any American Century Investments fund, or Institutional Class shares of the American Century Diversified Bond Fund, in an American Century Investments account (i.e., not a financial intermediary or retirement plan account), American Century Investments may charge you a $12.50 semiannual account maintenance fee if the value of those shares is less than $10,000. We will redeem shares automatically in one of your accounts to pay the $12.50 fee. In determining your total eligible investment amount, we will include your investments in all personal accounts (including American Century Investments Brokerage accounts) registered under your Social Security number. Personal accounts include individual accounts, joint accounts, UGMA/UTMA accounts, personal trusts, Coverdell Education Savings Accounts and IRAs (including traditional, Roth, Rollover, SEP-, SARSEP- and SIMPLE-IRAs), and certain other retirement accounts. If you have only business, business retirement, employer-sponsored or American Century Investments Brokerage accounts, you are currently not subject to this fee. If you are subject to the Account Maintenance Fee, your account value could be reduced by the fee amount.
Hypothetical Example for Comparison Purposes
The table also provides information about hypothetical account values and hypothetical expenses based on the actual expense ratio of each class of your fund and an assumed rate of return of 5% per year before expenses, which is not the actual return of a fund’s share class. The hypothetical account values and expenses may not be used to estimate the actual ending account balance or expenses you paid for the period. You may use this information to compare the ongoing costs of investing in your fund and other funds. To do so, compare this 5% hypothetical example with the 5% hypothetical examples that appear in the shareholder reports of the other funds.
Please note that the expenses shown in the table are meant to highlight your ongoing costs only and do not reflect any transactional costs, such as sales charges (loads) or redemption/exchange fees. Therefore, the table is useful in comparing ongoing costs only, and will not help you determine the relative total costs of owning different funds. In addition, if these transactional costs were included, your costs would have been higher.
7
| Beginning Account Value 1/1/16 | Ending Account Value 6/30/16 | Expenses Paid During Period(1) 1/1/16 - 6/30/16 | Annualized Expense Ratio(1) | |
| Actual | ||||
| Investor Class | $1,000 | $1,231.70 | $3.77 | 0.68% |
| Hypothetical | ||||
| Investor Class | $1,000 | $1,021.48 | $3.42 | 0.68% |
| (1) | Expenses are equal to the class's annualized expense ratio listed in the table above, multiplied by the average account value over the period, multiplied by 182, the number of days in the most recent fiscal half-year, divided by 366, to reflect the one-half year period. |
8
| Schedule of Investments |
JUNE 30, 2016
| Shares | Value | |||
| COMMON STOCKS — 97.9% | ||||
| Alternative Carriers — 1.7% | ||||
| Inteliquent, Inc. | 542,295 | $ | 10,786,247 | |
| Application Software — 0.1% | ||||
Zedge, Inc., Class B(1) | 72,834 | 334,308 | ||
| Communications Equipment — 1.0% | ||||
| QUALCOMM, Inc. | 115,984 | 6,213,263 | ||
| Electric Utilities — 33.6% | ||||
| ALLETE, Inc. | 268,476 | 17,351,604 | ||
| American Electric Power Co., Inc. | 314,205 | 22,022,628 | ||
| Duke Energy Corp. | 116,525 | 9,996,680 | ||
| Edison International | 87,010 | 6,758,067 | ||
| Entergy Corp. | 280,326 | 22,804,520 | ||
| Exelon Corp. | 811,928 | 29,521,702 | ||
| FirstEnergy Corp. | 701,427 | 24,486,817 | ||
| Great Plains Energy, Inc. | 328,126 | 9,975,030 | ||
| NextEra Energy, Inc. | 82,403 | 10,745,351 | ||
| OGE Energy Corp. | 140,364 | 4,596,921 | ||
| Pinnacle West Capital Corp. | 249,045 | 20,187,588 | ||
| PPL Corp. | 476,057 | 17,971,152 | ||
| Southern Co. (The) | 232,711 | 12,480,291 | ||
| Spark Energy, Inc., Class A | 198,889 | 6,573,281 | ||
| 215,471,632 | ||||
| Gas Utilities — 3.0% | ||||
| UGI Corp. | 431,116 | 19,507,999 | ||
| Independent Power Producers and Energy Traders — 4.8% | ||||
| AES Corp. (The) | 1,680,557 | 20,973,351 | ||
| Ormat Technologies, Inc. | 228,269 | 9,989,052 | ||
| 30,962,403 | ||||
| Integrated Telecommunication Services — 27.8% | ||||
| AT&T, Inc. | 1,663,169 | 71,865,533 | ||
| ATN International, Inc. | 803 | 62,481 | ||
| CenturyLink, Inc. | 870,070 | 25,240,731 | ||
FairPoint Communications, Inc.(1) | 233,583 | 3,428,999 | ||
| IDT Corp., Class B | 503,118 | 7,139,244 | ||
| Verizon Communications, Inc. | 1,259,593 | 70,335,673 | ||
| 178,072,661 | ||||
| Internet Software and Services — 2.6% | ||||
| j2 Global, Inc. | 263,084 | 16,619,016 | ||
| Multi-Utilities — 19.5% | ||||
| Ameren Corp. | 243,937 | 13,070,145 | ||
| CenterPoint Energy, Inc. | 88,155 | 2,115,720 | ||
| Consolidated Edison, Inc. | 306,191 | 24,630,004 | ||
| Dominion Resources, Inc. | 100,094 | 7,800,325 | ||
| PG&E Corp. | 428,118 | 27,365,303 | ||
| Public Service Enterprise Group, Inc. | 619,346 | 28,867,717 | ||
9
| Shares | Value | |||
| SCANA Corp. | 281,005 | $ | 21,260,838 | |
| 125,110,052 | ||||
| Office Services and Supplies — 1.4% | ||||
| West Corp. | 469,333 | 9,227,087 | ||
| Water Utilities — 0.7% | ||||
| SJW Corp. | 107,255 | 4,223,702 | ||
| Wireless Telecommunication Services — 1.7% | ||||
| Spok Holdings, Inc. | 176,330 | 3,379,365 | ||
T-Mobile US, Inc.(1) | 167,542 | 7,249,542 | ||
| 10,628,907 | ||||
TOTAL COMMON STOCKS (Cost $498,354,348) | 627,157,277 | |||
| TEMPORARY CASH INVESTMENTS — 2.4% | ||||
| Repurchase Agreement, Fixed Income Clearing Corp., (collateralized by various U.S. Treasury obligations, 2.25%, 11/15/25, valued at $15,635,813), at 0.20%, dated 6/30/16, due 7/1/16 (Delivery value $15,325,085) | 15,325,000 | |||
| State Street Institutional Liquid Reserves Fund, Premier Class | 10,358 | 10,358 | ||
TOTAL TEMPORARY CASH INVESTMENTS (Cost $15,335,358) | 15,335,358 | |||
TOTAL INVESTMENT SECURITIES — 100.3% (Cost $513,689,706) | 642,492,635 | |||
| OTHER ASSETS AND LIABILITIES — (0.3)% | (2,150,755) | |||
| TOTAL NET ASSETS — 100.0% | $ | 640,341,880 | ||
| NOTES TO SCHEDULE OF INVESTMENTS | |
| (1) | Non-income producing. |
See Notes to Financial Statements.
10
| Statement of Assets and Liabilities |
| JUNE 30, 2016 | |||
| Assets | |||
| Investment securities, at value (cost of $513,689,706) | $ | 642,492,635 | |
| Receivable for investments sold | 440,781 | ||
| Receivable for capital shares sold | 5,376,098 | ||
| Dividends and interest receivable | 701,755 | ||
| 649,011,269 | |||
| Liabilities | |||
| Payable for investments purchased | 7,845,311 | ||
| Payable for capital shares redeemed | 478,652 | ||
| Accrued management fees | 320,773 | ||
| Accrued other expenses | 24,653 | ||
| 8,669,389 | |||
| Net Assets | $ | 640,341,880 | |
| Investor Class Capital Shares, $0.01 Par Value | |||
| Shares authorized | 180,000,000 | ||
| Shares outstanding | 33,089,653 | ||
| Net Asset Value Per Share | $ | 19.35 | |
| Net Assets Consist of: | |||
| Capital (par value and paid-in surplus) | $ | 505,279,874 | |
| Undistributed net investment income | 49,681 | ||
| Undistributed net realized gain | 6,210,529 | ||
| Net unrealized appreciation | 128,801,796 | ||
| $ | 640,341,880 | ||
See Notes to Financial Statements.
11
| Statement of Operations |
| YEAR ENDED JUNE 30, 2016 | |||
| Investment Income (Loss) | |||
| Income: | |||
| Dividends (net of foreign taxes withheld of $3,626) | $ | 16,745,360 | |
| Interest | 8,196 | ||
| 16,753,556 | |||
| Expenses: | |||
| Management fees | 2,767,185 | ||
| Directors' fees and expenses | 23,526 | ||
| Other expenses | 25,967 | ||
| 2,816,678 | |||
| Net investment income (loss) | 13,936,878 | ||
| Realized and Unrealized Gain (Loss) | |||
| Net realized gain (loss) on investment transactions | 11,195,208 | ||
| Change in net unrealized appreciation (depreciation) on: | |||
| Investments | 79,098,660 | ||
| Translation of assets and liabilities in foreign currencies | (22 | ) | |
| 79,098,638 | |||
| Net realized and unrealized gain (loss) | 90,293,846 | ||
| Net Increase (Decrease) in Net Assets Resulting from Operations | $ | 104,230,724 | |
See Notes to Financial Statements.
12
| Statement of Changes in Net Assets |
| YEARS ENDED JUNE 30, 2016 AND JUNE 30, 2015 | ||||||
| Increase (Decrease) in Net Assets | June 30, 2016 | June 30, 2015 | ||||
| Operations | ||||||
| Net investment income (loss) | $ | 13,936,878 | $ | 12,532,034 | ||
| Net realized gain (loss) | 11,195,208 | 10,573,063 | ||||
| Change in net unrealized appreciation (depreciation) | 79,098,638 | (33,416,808 | ) | |||
| Net increase (decrease) in net assets resulting from operations | 104,230,724 | (10,311,711 | ) | |||
| Distributions to Shareholders | ||||||
| From net investment income | (13,469,560 | ) | (12,941,268 | ) | ||
| From net realized gains | (8,461,839 | ) | (16,748,797 | ) | ||
| Decrease in net assets from distributions | (21,931,399 | ) | (29,690,065 | ) | ||
| Capital Share Transactions | ||||||
| Proceeds from shares sold | 321,157,815 | 85,318,543 | ||||
| Proceeds from reinvestment of distributions | 20,897,310 | 28,340,735 | ||||
| Payments for shares redeemed | (132,394,075 | ) | (140,116,192 | ) | ||
| Net increase (decrease) in net assets from capital share transactions | 209,661,050 | (26,456,914 | ) | |||
| Net increase (decrease) in net assets | 291,960,375 | (66,458,690 | ) | |||
| Net Assets | ||||||
| Beginning of period | 348,381,505 | 414,840,195 | ||||
| End of period | $ | 640,341,880 | $ | 348,381,505 | ||
| Undistributed net investment income | $ | 49,681 | — | |||
| Transactions in Shares of the Fund | ||||||
| Sold | 18,124,997 | 4,765,153 | ||||
| Issued in reinvestment of distributions | 1,261,094 | 1,630,559 | ||||
| Redeemed | (7,699,363 | ) | (7,996,686 | ) | ||
| Net increase (decrease) in shares of the fund | 11,686,728 | (1,600,974 | ) | |||
See Notes to Financial Statements.
13
| Notes to Financial Statements |
JUNE 30, 2016
1. Organization
American Century Quantitative Equity Funds, Inc. (the corporation) is registered under the Investment Company Act of 1940, as amended (the 1940 Act), as an open-end management investment company and is organized as a Maryland corporation. Utilities Fund (the fund) is one fund in a series issued by the corporation. The fund’s investment objectives are to seek current income and long-term growth of capital and income. The fund invests at least 80% of its assets in equity securities of companies engaged in the utilities industry.
2. Significant Accounting Policies
The following is a summary of significant accounting policies consistently followed by the fund in preparation of its financial statements. The fund is an investment company and follows accounting and reporting guidance in accordance with accounting principles generally accepted in the United States of America. This may require management to make certain estimates and assumptions at the date of the financial statements. Actual results could differ from these estimates. Management evaluated the impact of events or transactions occurring through the date the financial statements were issued that would merit recognition or disclosure.
Investment Valuations — The fund determines the fair value of its investments and computes its net asset value per share at the close of regular trading (usually 4 p.m. Eastern time) on the New York Stock Exchange (NYSE) on each day the NYSE is open. The Board of Directors has adopted valuation policies and procedures to guide the investment advisor in the fund’s investment valuation process and to provide methodologies for the oversight of the fund’s pricing function.
Equity securities that are listed or traded on a domestic securities exchange are valued at the last reported sales price or at the official closing price as provided by the exchange. Equity securities traded on foreign securities exchanges are generally valued at the closing price of such securities on the exchange where primarily traded or at the close of the NYSE, if that is earlier. If no last sales price is reported, or if local convention or regulation so provides, the mean of the latest bid and asked prices may be used. Securities traded over-the-counter are valued at the mean of the latest bid and asked prices, the last sales price, or the official closing price. Equity securities initially expressed in local currencies are translated into U.S. dollars at the mean of the appropriate currency exchange rate at the close of the NYSE as provided by an independent pricing service.
Open-end management investment companies are valued at the reported net asset value per share. Repurchase agreements are valued at cost, which approximates fair value.
If the fund determines that the market price for an investment is not readily available or the valuation methods mentioned above do not reflect an investment’s fair value, such investment is valued as determined in good faith by the Board of Directors or its delegate, in accordance with policies and procedures adopted by the Board of Directors. In its determination of fair value, the fund may review several factors including, but not limited to, market information regarding the specific investment or comparable investments and correlation with other investment types, futures indices or general market indicators. Circumstances that may cause the fund to use these procedures to value an investment include, but are not limited to: an investment has been declared in default or is distressed; trading in a security has been suspended during the trading day or a security is not actively trading on its principal exchange; prices received from a regular pricing source are deemed unreliable; or there is a foreign market holiday and no trading occurred.
The fund monitors for significant events occurring after the close of an investment’s primary exchange but before the fund’s net asset value per share is determined. Significant events may include, but are not limited to: corporate announcements and transactions; governmental action and political unrest that could impact a specific investment or an investment sector; or armed conflicts, natural disasters and similar events that could affect investments in a specific country or region. The fund also monitors for significant fluctuations between domestic and foreign markets, as evidenced by the U.S. market or such other indicators that the Board of Directors, or its delegate, deems appropriate. If significant fluctuations in foreign markets are identified, the fund may apply a model-derived factor to the closing price of equity securities traded on foreign securities exchanges. The factor is based on observable market data as provided by an independent pricing service.
14
Security Transactions — Security transactions are accounted for as of the trade date. Net realized gains and losses are determined on the identified cost basis, which is also used for federal income tax purposes.
Investment Income — Dividend income less foreign taxes withheld, if any, is recorded as of the ex-dividend date. Distributions received on securities that represent a return of capital or long-term capital gain are recorded as a reduction of cost of investments and/or as a realized gain. The fund may estimate the components of distributions received that may be considered nontaxable distributions or long-term capital gain distributions for income tax purposes. Interest income is recorded on the accrual basis and includes accretion of discounts and amortization of premiums.
Foreign Currency Translations — All assets and liabilities initially expressed in foreign currencies are translated into U.S. dollars at prevailing exchange rates at period end. The fund may enter into spot foreign currency exchange contracts to facilitate transactions denominated in a foreign currency. Purchases and sales of investment securities, dividend and interest income, spot foreign currency exchange contracts, and expenses are translated at the rates of exchange prevailing on the respective dates of such transactions. Net realized and unrealized foreign currency exchange gains or losses related to investment securities are a component of net realized gain (loss) on investment transactions and change in net unrealized appreciation (depreciation) on investments, respectively.
Repurchase Agreements — The fund may enter into repurchase agreements with institutions that American Century Investment Management, Inc. (ACIM) (the investment advisor) has determined are creditworthy pursuant to criteria adopted by the Board of Directors. The fund requires that the collateral, represented by securities, received in a repurchase transaction be transferred to the custodian in a manner sufficient to enable the fund to obtain those securities in the event of a default under the repurchase agreement. ACIM monitors, on a daily basis, the securities transferred to ensure the value, including accrued interest, of the securities under each repurchase agreement is equal to or greater than amounts owed to the fund under each repurchase agreement.
Joint Trading Account — Pursuant to an Exemptive Order issued by the Securities and Exchange Commission, the fund, along with certain other funds in the American Century Investments family of funds, may transfer uninvested cash balances into a joint trading account. These balances are invested in one or more repurchase agreements that are collateralized by U.S. Treasury or Agency obligations.
Income Tax Status — It is the fund’s policy to distribute substantially all net investment income and net realized gains to shareholders and to otherwise qualify as a regulated investment company under provisions of the Internal Revenue Code. Accordingly, no provision has been made for income taxes. The fund files U.S. federal, state, local and non-U.S. tax returns as applicable. The fund's tax returns are subject to examination by the relevant taxing authority until expiration of the applicable statute of limitations, which is generally three years from the date of filing but can be longer in certain jurisdictions. At this time, management believes there are no uncertain tax positions which, based on their technical merit, would not be sustained upon examination and for which it is reasonably possible that the total amounts of unrecognized tax benefits will significantly change in the next twelve months.
Distributions to Shareholders — Distributions from net investment income, if any, are generally declared and paid quarterly. Distributions from net realized gains, if any, are generally declared and paid annually.
Indemnifications — Under the corporation’s organizational documents, its officers and directors are indemnified against certain liabilities arising out of the performance of their duties to the fund. In addition, in the normal course of business, the fund enters into contracts that provide general indemnifications. The maximum exposure under these arrangements is unknown as this would involve future claims that may be made against a fund. The risk of material loss from such claims is considered by management to be remote.
3. Fees and Transactions with Related Parties
Certain officers and directors of the corporation are also officers and/or directors of American Century Companies, Inc. (ACC). The corporation’s investment advisor, ACIM, the corporation's distributor, American Century Investment Services, Inc., and the corporation’s transfer agent, American Century Services, LLC, are wholly owned, directly or indirectly, by ACC.
Management Fees — The corporation has entered into a management agreement with ACIM, under which ACIM provides the fund with investment advisory and management services in exchange for a single, unified management fee (the fee). The agreement provides that all expenses of managing and operating the fund,
15
except distribution and service fees, brokerage expenses, taxes, interest, fees and expenses of the independent directors (including legal counsel fees), and extraordinary expenses, will be paid by ACIM. The fee is computed and accrued daily based on the daily net assets of the fund and paid monthly in arrears. The fee consists of (1) an Investment Category Fee based on the daily net assets of the fund and certain other accounts managed by the investment advisor that are in the same broad investment category as the fund and (2) a Complex Fee based on the assets of all the funds in the American Century Investments family of funds. The rates for the Investment Category Fee range from 0.3380% to 0.5200%. The rates for the Complex Fee range from 0.2500% to 0.3100%. The effective annual management fee for the year ended June 30, 2016 was 0.67%.
Directors' Fees and Expenses — The Board of Directors is responsible for overseeing the investment advisor’s management and operations of the fund. The directors receive detailed information about the fund and its investment advisor regularly throughout the year, and meet at least quarterly with management of the investment advisor to review reports about fund operations. The fund’s officers do not receive compensation from the fund.
Interfund Transactions — The fund may enter into security transactions with other American Century Investments funds and other client accounts of the investment advisor, in accordance with the 1940 Act rules and procedures adopted by the Board of Directors. The rules and procedures require, among other things, that these transactions be effected at the independent current market price of the security. During the period, the interfund purchases and sales were $2,550,447 and $2,369,085, respectively.
4. Investment Transactions
Purchases and sales of investment securities, excluding short-term investments, for the year ended June 30, 2016 were $341,291,488 and $150,569,461, respectively.
5. Fair Value Measurements
The fund’s investments valuation process is based on several considerations and may use multiple inputs to determine the fair value of the investments held by the fund. In conformity with accounting principles generally accepted in the United States of America, the inputs used to determine a valuation are classified into three broad levels.
| • | Level 1 valuation inputs consist of unadjusted quoted prices in an active market for identical investments. |
| • | Level 2 valuation inputs consist of direct or indirect observable market data (including quoted prices for comparable investments, evaluations of subsequent market events, interest rates, prepayment speeds, credit risk, etc.). These inputs also consist of quoted prices for identical investments initially expressed in local currencies that are adjusted through translation into U.S. dollars. |
| • | Level 3 valuation inputs consist of unobservable data (including a fund’s own assumptions). |
The level classification is based on the lowest level input that is significant to the fair valuation measurement. The valuation inputs are not necessarily an indication of the risks associated with investing in these securities or other financial instruments. There were no significant transfers between levels during the period.
The following is a summary of the level classifications as of period end. The Schedule of Investments provides additional information on the fund’s portfolio holdings.
| Level 1 | Level 2 | Level 3 | ||||||
| Assets | ||||||||
| Investment Securities | ||||||||
| Common Stocks | $ | 627,157,277 | — | — | ||||
| Temporary Cash Investments | 10,358 | $ | 15,325,000 | — | ||||
| $ | 627,167,635 | $ | 15,325,000 | — | ||||
6. Risk Factors
The fund concentrates its investments in a narrow segment of the total market. Because of this, the fund may be subject to greater risk and market fluctuations than a portfolio representing a broader range of industries.
16
7. Federal Tax Information
The tax character of distributions paid during the years ended June 30, 2016 and June 30, 2015 were as follows:
| 2016 | 2015 | |||||
| Distributions Paid From | ||||||
| Ordinary income | $ | 13,469,560 | $ | 14,012,151 | ||
| Long-term capital gains | $ | 8,461,839 | $ | 15,677,914 | ||
The book-basis character of distributions made during the year from net investment income or net realized gains may differ from their ultimate characterization for federal income tax purposes. These differences reflect the differing character of certain income items and net realized gains and losses for financial statement and tax purposes, and may result in reclassification among certain capital accounts on the financial statements.
As of June 30, 2016, the federal tax cost of investments and the components of distributable earnings on a tax-basis were as follows:
| Federal tax cost of investments | $ | 516,606,663 | |
| Gross tax appreciation of investments | $ | 131,130,141 | |
| Gross tax depreciation of investments | (5,244,169 | ) | |
| Net tax appreciation (depreciation) of investments | 125,885,972 | ||
Net tax appreciation (depreciation) on translation of assets and liabilities in foreign currencies | (1,133 | ) | |
| Net tax appreciation (depreciation) | $ | 125,884,839 | |
| Undistributed ordinary income | $ | 4,252,909 | |
| Accumulated long-term gains | $ | 4,924,258 | |
The difference between book-basis and tax-basis unrealized appreciation (depreciation) is attributable primarily to the tax deferral of losses on wash sales.
17
| Financial Highlights |
| For a Share Outstanding Throughout the Years Ended June 30 (except as noted) | |||||||||||||||
| Per-Share Data | Ratios and Supplemental Data | ||||||||||||||
| Income From Investment Operations: | Distributions From: | Ratio to Average Net Assets of: | |||||||||||||
Net Asset Value, Beginning of Period | Net Investment Income (Loss)(1) | Net Realized and Unrealized Gain (Loss) | Total From Investment Operations | Net Investment Income | Net Realized Gains | Total Distributions | Net Asset Value, End of Period | Total Return(2) | Operating Expenses | Net Investment Income (Loss) | Portfolio Turnover Rate | Net Assets, End of Period (in thousands) | |||
| Investor Class | |||||||||||||||
| 2016 | $16.28 | 0.57 | 3.44 | 4.01 | (0.54) | (0.40) | (0.94) | $19.35 | 25.76% | 0.68% | 3.35% | 36% | $640,342 | ||
| 2015 | $18.03 | 0.55 | (0.98) | (0.43) | (0.58) | (0.74) | (1.32) | $16.28 | (2.73)% | 0.67% | 3.14% | 40% | $348,382 | ||
| 2014 | $16.90 | 0.58 | 2.13 | 2.71 | (0.58) | (1.00) | (1.58) | $18.03 | 17.35% | 0.67% | 3.41% | 45% | $414,840 | ||
| 2013 | $16.54 | 0.63 | 1.20 | 1.83 | (0.60) | (0.87) | (1.47) | $16.90 | 12.06% | 0.68% | 3.79% | 41% | $348,272 | ||
| 2012 | $15.93 | 0.60 | 0.66 | 1.26 | (0.55) | (0.10) | (0.65) | $16.54 | 8.20% | 0.68% | 3.83% | 55% | $316,325 | ||
| Notes to Financial Highlights |
| (1) | Computed using average shares outstanding throughout the period. |
| (2) | Total returns are calculated based on the net asset value of the last business day. Total returns for periods less than one year are not annualized. |
See Notes to Financial Statements.
| Report of Independent Registered Public Accounting Firm |
To the Directors of the American Century Quantitative Equity Funds, Inc. and Shareholders of the Utilities Fund:
In our opinion, the accompanying statement of assets and liabilities, including the schedule of investments, and the related statements of operations and of changes in net assets and the financial highlights present fairly, in all material respects, the financial position of the Utilities Fund (one of the sixteen funds comprising the American Century Quantitative Equity Funds, Inc., hereafter referred to as the “Fund”) at June 30, 2016, the results of its operations for the year then ended, the changes in its net assets for each of the two years in the period then ended and the financial highlights for each of the five years in the period then ended, in conformity with accounting principles generally accepted in the United States of America. These financial statements and financial highlights (hereafter referred to as "financial statements") are the responsibility of the Fund's management. Our responsibility is to express an opinion on these financial statements based on our audits. We conducted our audits of these financial statements in accordance with the standards of the Public Company Accounting Oversight Board (United States). Those standards require that we plan and perform the audit to obtain reasonable assurance about whether the financial statements are free of material misstatement. An audit includes examining, on a test basis, evidence supporting the amounts and disclosures in the financial statements, assessing the accounting principles used and significant estimates made by management, and evaluating the overall financial statement presentation. We believe that our audits, which included confirmation of securities at June 30, 2016 by correspondence with the custodian and brokers, provide a reasonable basis for our opinion.
PricewaterhouseCoopers LLP
Kansas City, Missouri
August 17, 2016
19
| Management |
Board of Directors
The individuals listed below serve as directors of the funds. Each director will continue to serve in this capacity until death, retirement, resignation or removal from office. The board has adopted a mandatory retirement age for directors who are not “interested persons,” as that term is defined in the Investment Company Act (independent directors). Independent directors shall retire on December 31 of the year in which they reach their 75th birthday; provided, however, that on or after January 1, 2022, independent directors shall retire on December 31 of the year in which they reach their 76th birthday.
Mr. Thomas is an “interested person” because he currently serves as President and Chief Executive Officer of American Century Companies, Inc. (ACC), the parent company of American Century Investment Management, Inc. (ACIM or the advisor). The other directors (more than three-fourths of the total number) are independent. They are not employees, directors or officers of, and have no financial interest in, ACC or any of its wholly owned, direct or indirect, subsidiaries, including ACIM, American Century Investment Services, Inc. (ACIS) and American Century Services, LLC (ACS), and they do not have any other affiliations, positions or relationships that would cause them to be considered “interested persons” under the Investment Company Act. The directors serve in this capacity for eight (in the case of Mr. Thomas, 15) registered investment companies in the American Century Investments family of funds.
The following table presents additional information about the directors. The mailing address for each director other than Mr. Thomas is 1665 Charleston Road, Mountain View, California 94043. The mailing address for Mr. Thomas is 4500 Main Street, Kansas City, Missouri 64111.
Name (Year of Birth) | Position(s) Held with Funds | Length of Time Served | Principal Occupation(s) During Past 5 Years | Number of American Century Portfolios Overseen by Director | Other Directorships Held During Past 5 Years |
| Independent Directors | |||||
| Tanya S. Beder (1955) | Director | Since 2011 | Chairman and CEO, SBCC Group Inc. (independent advisory services) (2006 to present) | 45 | CYS Investments, Inc. (NYSE mortgage arbitrage REIT) |
| Jeremy I. Bulow (1954) | Director | Since 2011 | Professor of Economics, Stanford University, Graduate School of Business (1979 to present) | 45 | None |
| Anne Casscells (1958) | Director | Since 2016 | Co-Chief Executive Officer and Chief Investment Officer, Aetos Alternatives Management (investment advisory firm) (2001 to present); Lecturer in Accounting, Stanford University, Graduate School of Business (2009 to present) | 45 | None |
20
Name (Year of Birth) | Position(s) Held with Funds | Length of Time Served | Principal Occupation(s) During Past 5 Years | Number of American Century Portfolios Overseen by Director | Other Directorships Held During Past 5 Years |
| Independent Directors | |||||
| Ronald J. Gilson (1946) | Director and Chairman of the Board | Since 1995 (Chairman since 2005) | Charles J. Meyers Professor of Law and Business, Emeritus, Stanford Law School (1979 to present); Marc and Eva Stern Professor of Law and Business, Columbia University School of Law (1992 to present) | 45 | None |
| Frederick L. A. Grauer (1946) | Director | Since 2008 | Senior Advisor, iShares by BlackRock, Inc. (investment management firm) (2010 to 2011, 2013 to present); Senior Advisor, Course Hero (an educational technology company) (2015 to present) | 45 | None |
| Jonathan D. Levin (1972) | Director | Since 2016 | Holbrook Working Professor of Price Theory, Stanford University, (2000 to present); Chair, Department of Economics, Stanford University (2011 to 2014) | 45 | None |
| Peter F. Pervere (1947) | Director | Since 2007 | Retired | 45 | None |
| John B. Shoven (1947) | Director | Since 2002 | Charles R. Schwab Professor of Economics, Stanford University (1973 to present) | 45 | Cadence Design Systems; Exponent; Financial Engines |
| Interested Director | |||||
| Jonathan S. Thomas (1963) | Director and President | Since 2007 | President and Chief Executive Officer, ACC (March 2007 to present). Also serves as Chief Executive Officer, ACS; Executive Vice President, ACIM; Director, ACC, ACIM and other ACC subsidiaries | 128 | BioMed Valley Discoveries, Inc. |
The Statement of Additional Information has additional information about the fund's directors and is available without charge, upon request, by calling 1-800-345-2021.
21
Officers
The following table presents certain information about the executive officers of the funds. Each officer serves as an officer for each of the 15 investment companies in the American Century family of funds, unless otherwise noted. No officer is compensated for his or her service as an officer of the funds. The listed officers are interested persons of the funds and are appointed or re-appointed on an annual basis. The mailing address for each of the officers listed below is 4500 Main Street, Kansas City, Missouri 64111.
Name (Year of Birth) | Offices with the Funds | Principal Occupation(s) During the Past Five Years |
| Jonathan S. Thomas (1963) | Director and President since 2007 | President and Chief Executive Officer, ACC (March 2007 to present). Also serves as Chief Executive Officer, ACS; Executive Vice President, ACIM; Director, ACC, ACIM and other ACC subsidiaries |
| Amy D. Shelton (1964) | Chief Compliance Officer and Vice President since 2014 | Chief Compliance Officer, American Century funds, (March 2014 to present); Chief Compliance Officer, ACIM (February 2014 to present); Chief Compliance Officer, ACIS (October 2009 to present); Vice President, Client Interactions and Marketing, ACIS (February 2013 to January 2014); Director, Client Interactions and Marketing, ACIS (June 2007 to January 2013). Also serves as Vice President, ACIS |
| Charles A. Etherington (1957) | General Counsel since 2007 and Senior Vice President since 2006 | Attorney, ACC (February 1994 to present); Vice President, ACC (November 2005 to present); General Counsel, ACC (March 2007 to present). Also serves as General Counsel, ACIM, ACS, ACIS and other ACC subsidiaries; and Senior Vice President, ACIM and ACS |
| C. Jean Wade (1964) | Vice President, Treasurer and Chief Financial Officer since 2012 | Vice President, ACS (February 2000 to present) |
| Robert J. Leach (1966) | Vice President since 2006 and Assistant Treasurer since 2012 | Vice President, ACS (February 2000 to present) |
| David H. Reinmiller (1963) | Vice President since 2001 | Attorney, ACC (January 1994 to present); Associate General Counsel, ACC (January 2001 to present). Also serves as Vice President, ACIM and ACS |
| Ward D. Stauffer (1960) | Secretary since 2005 | Attorney, ACC (June 2003 to present) |
22
| Approval of Management Agreement |
At a meeting held on June 14, 2016, the Fund’s Board of Directors (the "Board") unanimously approved the renewal of the management agreement pursuant to which American Century Investment Management, Inc. (the “Advisor”) acts as the investment advisor for the Fund. Under Section 15(c) of the Investment Company Act, contracts for investment advisory services are required to be reviewed, evaluated, and approved by a majority of a fund’s directors/trustees, including a majority of the independent Directors, each year. The Board regards this annual evaluation and renewal as one of its most important responsibilities.
The independent Directors have memorialized a statement regarding the relationship between their ongoing obligations to oversee and evaluate the performance of the Advisor and their annual consideration of renewal of the management agreement. In that statement, the independent Directors noted that their assessment of the Advisor’s performance is an ongoing process that takes place over the entire year and is informed by all of the extensive information that the Board and its committees receive and consider over time. This information, together with the additional materials provided specifically in connection with the review, are central to the Board’s assessment of the Advisor’s performance and its determination whether to renew the Fund’s management agreement.
Prior to its consideration of the renewal of the management agreement, the Board requested and reviewed extensive data and analysis relating to the proposed renewal. This information and analysis was compiled by the Advisor and certain independent providers of evaluation data concerning the Fund and the services provided to the Fund by the Advisor.
In connection with its consideration of the renewal of the management agreement, the Board’s review and evaluation of the services provided by the Advisor included, but was not limited to, the following:
| • | the nature, extent, and quality of investment management, shareholder services, and other services provided by the Advisor to the Fund; |
| • | the wide range of other programs and services the Advisor provides to the Fund and its shareholders on a routine and non-routine basis; |
| • | the investment performance of the Fund, including data comparing the Fund’s performance to appropriate benchmarks and/or a peer group of other mutual funds with similar investment objectives and strategies; |
| • | the cost of owning the Fund compared to the cost of owning similar funds; |
| • | the Advisor’s compliance policies, procedures, and regulatory experience; |
| • | financial data showing the cost of services provided to the Fund, the profitability of the Fund to the Advisor, and the overall profitability of the Advisor; |
| • | possible economies of scale associated with the Advisor’s management of the Fund and other accounts under its management; |
| • | data comparing services provided and charges to other investment management clients of the Advisor; |
| • | acquired fund fees and expenses; |
| • | payments by the Fund and the Advisor to financial intermediaries whose clients are investors in the Fund; and |
| • | any collateral benefits derived by the Advisor from the management of the Fund. |
In keeping with its practice, the Board held two in-person meetings to review and discuss the information provided in response to their request. The independent Directors also had the benefit of the advice of their independent counsel throughout the process.
23
Factors Considered
The Directors considered all of the information provided by the Advisor, the independent data providers, and the independent Directors’ independent counsel in connection with the approval. They determined that the information was sufficient for them to evaluate the management agreement for the Fund. In connection with their review, the Directors did not identify any single factor as being all-important or controlling and each Director may have attributed different levels of importance to different factors. In deciding to renew the management agreement, the Board based its decision on a number of factors, including the following:
Nature, Extent and Quality of Services - Generally. Under the management agreement, the Advisor is responsible for providing or arranging for all services necessary for the operation of the Fund. The Board noted that under the management agreement, the Advisor provides or arranges at its own expense a wide variety of services including:
| • | constructing and designing the Fund |
| • | portfolio research and security selection |
| • | initial capitalization/funding |
| • | securities trading |
| • | Fund administration |
| • | custody of Fund assets |
| • | daily valuation of the Fund’s portfolio |
| • | shareholder servicing and transfer agency, including shareholder confirmations, recordkeeping, and communications |
| • | legal services (except the independent Directors’ counsel) |
| • | regulatory and portfolio compliance |
| • | financial reporting |
| • | marketing and distribution (except amounts paid by the Fund under Rule 12b-1 plans) |
The Board noted that many of these services have expanded over time in terms of both quantity and complexity in response to shareholder demands, competition in the industry, changing distribution channels, and the changing regulatory environment.
Investment Management, Shareholder, and Other Services. The nature of the investment management services provided to the Fund is quite complex and allows Fund shareholders access to professional money management, instant diversification of their investments within an asset class, the opportunity to easily diversify among asset classes by investing in or exchanging among various American Century Investments funds, and liquidity. In evaluating investment performance, the Board expects the Advisor to manage the Fund in accordance with its investment objectives and approved strategies. Further, the Directors recognize that the Advisor has an obligation to seek the best execution of fund trades. In providing these services, the Advisor utilizes teams of investment professionals (portfolio managers, analysts, research assistants, and securities traders) who require extensive information technology, research, training, compliance, and other systems to conduct their business. The Board, directly and through its Portfolio Committee, regularly reviews investment performance information for the Fund, together with comparative information for appropriate benchmarks and/or peer groups of similarly-managed funds, over different time horizons. The Directors also review detailed performance information during the management agreement approval process. If performance concerns are identified, the Fund receives special reviews until performance improves, during which the Board discusses with the Advisor the reasons for such results (e.g., market conditions, security selection) and any efforts being undertaken to improve performance. The Fund’s performance was above its benchmark for the three- and ten-year periods and below its benchmark for the one- and five-year periods reviewed by the Board. The Board discussed the Fund’s performance with the Advisor and was satisfied with the efforts being undertaken by the Advisor. The Board found the investment management services provided by the Advisor to the Fund to be satisfactory and consistent with the management agreement.
24
Under the management agreement, the Advisor provides the Fund with a comprehensive package of transfer agency, shareholder, and other services. The Board, directly and through various committees of the Board, regularly reviews reports and evaluations of such services at its regular meetings. These reports include, but are not limited to, information regarding the operational efficiency and accuracy of the shareholder and transfer agency services provided, staffing levels, shareholder satisfaction (as measured by external as well as internal sources), technology support, new products and services offered to Fund shareholders, securities trading activities, portfolio valuation services, auditing services, and legal and operational compliance activities. Certain aspects of shareholder and transfer agency service level efficiency and the quality of securities trading activities are measured by independent third party providers and are presented in comparison to other fund groups not managed by the Advisor.
The Board found the services provided by the Advisor to the Fund under the management agreement to be competitive and of high quality.
Costs of Services and Profitability. The Advisor provides detailed information concerning its cost of providing various services to the Fund, its profitability in managing the Fund, its overall profitability, and its financial condition. The Directors have reviewed with the Advisor the methodology used to prepare this financial information. This information is considered in evaluating the Advisor’s financial condition, its ability to continue to provide services under the management agreement, and the reasonableness of the current management fee. The Board concluded that the Advisor’s profits were reasonable in light of the services provided to the Fund.
Economies of Scale. The Board also reviewed information provided by the Advisor regarding the possible existence of economies of scale in connection with the management of the Fund. The Board concluded that economies of scale are difficult to measure and predict with precision, especially on a fund-by-fund basis. The Board concluded that the Advisor is appropriately sharing economies of scale through its competitive fee structure, offering competitive fees from fund inception, and through reinvestment in its business to provide shareholders enhanced and expanded services.
Comparison to Other Funds’ Fees. The management agreement provides that the Fund pays the Advisor a single, all-inclusive (or unified) management fee for providing all services necessary for the management and operation of the Fund, other than brokerage expenses, expenses attributable to short sales, taxes, interest, extraordinary expenses, the fees and expenses of the Fund’s independent Directors (including their independent legal counsel), and expenses incurred in connection with the provision of shareholder services and distribution services under a plan adopted pursuant to Rule 12b-1 under the 1940 Act. Under the unified fee structure, the Advisor is responsible for providing all investment advisory, custody, audit, administrative, compliance, recordkeeping, marketing, and shareholder services, or arranging and supervising third parties to provide such services. By contrast, most other funds are charged a variety of fees, including an investment advisory fee, a transfer agency fee, an administrative fee, distribution charges, and other expenses. Other than their investment advisory fees and any applicable Rule 12b-1 fees, all other components of the total fees charged by these other funds may be increased without shareholder approval. The Board believes the unified fee structure is a benefit to Fund shareholders because it clearly discloses to shareholders the cost of owning Fund shares, and, since the unified fee cannot be increased without a vote of Fund shareholders, it shifts to the Advisor the risk of increased costs of operating the Fund and provides a direct incentive to minimize administrative inefficiencies. Part of the Board’s analysis of fee levels involves reviewing certain evaluative data compiled by an independent provider and comparing the Fund’s unified fee to the total expense ratio of peer funds. The unified fee charged to shareholders of the Fund was below the median of the total expense ratios of the Fund’s peer universe. The Board concluded that the management fee paid by the Fund to the Advisor under the management agreement is reasonable in light of the services provided to the Fund.
25
Comparison to Fees and Services Provided to Other Clients of the Advisor. The Board also requested and received information from the Advisor concerning the nature of the services, fees, costs, and profitability of its advisory services to advisory clients other than the Fund. They observed that these varying types of client accounts require different services and involve different regulatory and entrepreneurial risks than the management of the Fund. The Board analyzed this information and concluded that the fees charged and services provided to the Fund were reasonable by comparison.
Payments to Intermediaries. The Directors also requested and received a description of payments made to intermediaries by the Fund and the Advisor. These payments include various payments made by the Fund or the Advisor to different types of intermediaries and recordkeepers for distribution and service activities provided for the Fund.
Collateral or “Fall-Out” Benefits Derived by the Advisor. The Board considered the existence of collateral benefits the Advisor may receive as a result of its relationship with the Fund. The Board noted that the Advisor’s primary business is managing mutual funds and it generally does not use fund or shareholder information to generate profits in other lines of business, and therefore does not derive any significant collateral benefits from them. The Board noted that the Advisor receives proprietary research from broker-dealers that execute fund portfolio transactions. The Board also determined that the Advisor is able to provide investment management services to certain clients other than the Fund, at least in part, due to its existing infrastructure built to serve the fund complex. The Board concluded, however, that the assets of those other clients are not material to the analysis and, where applicable, may be included with the assets of the Fund to determine breakpoints in the management fee schedule.
Existing Relationship. The Board also considered whether there was any reason for not continuing the existing arrangement with the Advisor. In this regard, the Board was mindful of the potential disruptions of the Fund’s operations and various risks, uncertainties, and other effects that could occur as a result of a decision not to continue such relationship. In particular, the Board recognized that most shareholders have invested in the Fund on the strength of the Advisor’s industry standing and reputation and in the expectation that the Advisor will have a continuing role in providing advisory services to the Fund.
Conclusion of the Directors. As a result of this process, the Board, including all of the independent Directors and assisted by the advice of independent legal counsel, taking into account all of the factors discussed above and the information provided by the Advisor and others in connection with its review and throughout the year, concluded that the management agreement between the Fund and the Advisor is fair and reasonable in light of the services provided and should be renewed.
26
| Proxy Voting Results |
A special meeting of shareholders was held on June 13, 2016, to vote on the following proposal. The proposal received the required number of votes and was adopted. A summary of voting results is listed below.
To elect four directors to the Board of Directors of American Century Quantitative Equity Funds, Inc.:
| Affirmative | Withhold | ||||||
| Tanya S. Beder | $ | 8,473,153,264 | $ | 121,459,590 | |||
| Jeremy I. Bulow | $ | 8,469,793,581 | $ | 124,819,273 | |||
| Anne Casscells | $ | 8,465,895,232 | $ | 128,717,622 | |||
| Jonathan D. Levin | $ | 8,468,929,867 | $ | 125,682,987 | |||
The other directors whose term of office continued after the meeting include Jonathan S. Thomas, Ronald J. Gilson, Frederick L. A. Grauer, Peter F. Pervere and John B. Shoven.
27
| Additional Information |
Retirement Account Information
As required by law, distributions you receive from certain IRAs are subject to federal income tax withholding, unless you elect not to have withholding apply. Tax will be withheld on the total amount withdrawn even though you may be receiving amounts that are not subject to withholding, such as nondeductible contributions. In such case, excess amounts of withholding could occur. You may adjust your withholding election so that a greater or lesser amount will be withheld.
If you don’t want us to withhold on this amount, you must notify us to not withhold the federal income tax. You may notify us in writing or in certain situations by telephone or through other electronic means. For systematic withdrawals, your withholding election will remain in effect until revoked or changed by filing a new election. You have the right to revoke your election at any time.
Remember, even if you elect not to have income tax withheld, you are liable for paying income tax on the taxable portion of your withdrawal. If you elect not to have income tax withheld or you don’t have enough income tax withheld, you may be responsible for payment of estimated tax. You may incur penalties under the estimated tax rules if your withholding and estimated tax payments are not sufficient. You can reduce or defer the income tax on a distribution by directly or indirectly rolling such distribution over to another IRA or eligible plan. You should consult your tax advisor for additional information.
State tax will be withheld if, at the time of your distribution, your address is within one of the mandatory withholding states and you have federal income tax withheld (or as otherwise required by state law). State taxes will be withheld from your distribution in accordance with the respective state rules.
Distributions you receive from 403(b), 457 and qualified plans are subject to special tax and withholding rules. Your plan administrator or plan sponsor is required to provide you with a special tax notice explaining those rules at the time you request a distribution. If applicable, federal and/or state taxes may be withheld from your distribution amount.
Proxy Voting Policies
Descriptions of the principles and policies that the fund's investment advisor uses in exercising the voting rights associated with the securities purchased and/or held by the fund are available without charge, upon request, by calling 1-800-345-2021 or visiting the "About Us" page of American Century Investments’ website at americancentury.com. A description of the policies is also available on the Securities and Exchange Commission’s website at sec.gov. Information regarding how the investment advisor voted proxies relating to portfolio securities during the most recent 12-month period ended June 30 is available on the "About Us" page at americancentury.com. It is also available at sec.gov.
Quarterly Portfolio Disclosure
The fund files its complete schedule of portfolio holdings with the Securities and Exchange Commission (SEC) for the first and third quarters of each fiscal year on Form N-Q. The fund’s Forms N-Q are available on the SEC’s website at sec.gov, and may be reviewed and copied at the SEC’s Public Reference Room in Washington, DC. Information on the operation of the Public Reference Room may be obtained by calling 1-800-SEC-0330. The fund also makes its complete schedule of portfolio holdings for the most recent quarter of its fiscal year available on its website at americancentury.com and, upon request, by calling 1-800-345-2021.
28
Other Tax Information
The following information is provided pursuant to provisions of the Internal Revenue Code.
The fund hereby designates up to the maximum amount allowable as qualified dividend income for the fiscal year ended June 30, 2016.
For corporate taxpayers, the fund hereby designates $13,469,560, or up to the maximum amount allowable, of ordinary income distributions paid during the fiscal year ended June 30, 2016 as qualified for the corporate dividends received deduction.
The fund hereby designates $8,461,839, or up to the maximum amount allowable, as long-term capital gain distributions (20% rate gain distributions) for the fiscal year ended June 30, 2016.
29
| Notes |
30
| Notes |
31
| Notes |
32
| ||
| Contact Us | americancentury.com | |
| Automated Information Line | 1-800-345-8765 | |
| Investor Services Representative | 1-800-345-2021 or 816-531-5575 | |
| Investors Using Advisors | 1-800-378-9878 | |
| Business, Not-For-Profit, Employer-Sponsored Retirement Plans | 1-800-345-3533 | |
| Banks and Trust Companies, Broker-Dealers, Financial Professionals, Insurance Companies | 1-800-345-6488 | |
| Telecommunications Relay Service for the Deaf | 711 | |
| American Century Quantitative Equity Funds, Inc. | ||
Investment Advisor: American Century Investment Management, Inc. Kansas City, Missouri | ||
| This report and the statements it contains are submitted for the general information of our shareholders. The report is not authorized for distribution to prospective investors unless preceded or accompanied by an effective prospectus. | ||
| ©2016 American Century Proprietary Holdings, Inc. All rights reserved. CL-ANN-89950 1608 | ||
ITEM 2. CODE OF ETHICS.
| (a) | The registrant has adopted a Code of Ethics for Senior Financial Officers that applies to the registrant’s principal executive officer, principal financial officer, principal accounting officer, and persons performing similar functions. |
| (b) | No response required. |
| (c) | None. |
| (d) | None. |
| (e) | Not applicable. |
| (f) | The registrant’s Code of Ethics for Senior Financial Officers was filed as Exhibit 12 (a)(1) to American Century Asset Allocation Portfolios, Inc.’s Annual Certified Shareholder Report on Form N-CSR, File No. 811-21591, on September 29, 2005, and is incorporated herein by reference. |
ITEM 3. AUDIT COMMITTEE FINANCIAL EXPERT.
| (a)(1) | The registrant's board has determined that the registrant has at least one audit committee financial expert serving on its audit committee. |
| (a)(2) | Tanya S. Beder, Anne Casscells, Peter F. Pervere and Ronald J. Gilson are the registrant's designated audit committee financial experts. They are "independent" as defined in Item 3 of Form N-CSR. |
| (a)(3) | Not applicable. |
| (b) | No response required. |
| (c) | No response required. |
| (d) | No response required. |
ITEM 4. PRINCIPAL ACCOUNTANT FEES AND SERVICES.
| (a) | Audit Fees. |
The aggregate fees billed for each of the last two fiscal years for professional services rendered by the principal accountant for the audit of the registrant’s annual financial statements or services that are normally provided by the accountant in connection with statutory and regulatory filings or engagements for those fiscal years were as follows:
FY 2015: $446,973
FY 2016: $460,947
| (b) | Audit-Related Fees. |
The aggregate fees billed in each of the last two fiscal years for assurance and related services by the principal accountant that are reasonably related to the performance of the audit of the registrant’s financial statements and are not reported under paragraph (a) of this Item were as follows:
For services rendered to the registrant:
FY 2015: $0
FY 2016: $0
Fees required to be approved pursuant to paragraph (c)(7)(ii) of Rule 2-01 of Regulation S-X (relating to certain engagements for non-audit services with the registrant’s investment adviser and its affiliates):
FY 2015: $0
FY 2016: $0
(c)Tax Fees.
The aggregate fees billed in each of the last two fiscal years for professional services rendered by the principal accountant for tax compliance, tax advice, and tax planning were as follows:
For services rendered to the registrant:
FY 2015: $0
FY 2016: $0
Fees required to be approved pursuant to paragraph (c)(7)(ii) of Rule 2-01 of Regulation S-X (relating to certain engagements for non-audit services with the registrant’s investment adviser and its affiliates):
FY 2015: $0
FY 2016: $0
(d)All Other Fees.
The aggregate fees billed in each of the last two fiscal years for products and services provided by the principal accountant, other than the services reported in paragraphs (a) through (c) of this Item were as follows:
For services rendered to the registrant:
FY 2015: $0
FY 2016: $0
Fees required to be approved pursuant to paragraph (c)(7)(ii) of Rule 2-01 of Regulation S-X (relating to certain engagements for non-audit services with the registrant’s investment adviser and its affiliates):
FY 2015: $0
FY 2016: $0
(e)(1)In accordance with paragraph (c)(7)(i)(A) of Rule 2-01 of Regulation S-X, before the accountant is engaged by the registrant to render audit or non-audit services, the engagement is approved by the registrant’s audit committee. Pursuant to paragraph (c)(7)(ii) of Rule 2-01 of Regulation S-X, the registrant’s audit committee also pre-approves its accountant’s engagements for non-audit services with the registrant’s investment adviser, its parent company, and any entity controlled by, or under common control with the investment adviser that provides
ongoing services to the registrant, if the engagement relates directly to the operations and financial reporting of the registrant.
| (e)(2) | All services described in each of paragraphs (b) through (d) of this Item were pre-approved before the engagement by the registrant’s audit committee pursuant to paragraph (c)(7)(i)(A) of Rule 2-01 of Regulation S-X. Consequently, none of such services were required to be approved by the audit committee pursuant to paragraph (c)(7)(i)(C). |
| (f) | The percentage of hours expended on the principal accountant’s engagement to audit the registrant’s financial statements for the most recent fiscal year that were attributed to work performed by persons other than the principal accountant’s full-time, permanent employees was less than 50%. |
| (g) | The aggregate non-audit fees billed by the registrant’s accountant for services rendered to the registrant, and rendered to the registrant’s investment adviser (not including any sub-adviser whose role is primarily portfolio management and is subcontracted with or overseen by another investment adviser), and any entity controlling, controlled by, or under common control with the adviser that provides ongoing services to the registrant for each of the last two fiscal years of the registrant were as follows: |
FY 2015: $310,094
FY 2016: $167,395
(h) The registrant’s investment adviser and accountant have notified the registrant’s audit committee of all non-audit services that were rendered by the registrant’s accountant to the registrant’s investment adviser, its parent company, and any entity controlled by, or under common control with the investment adviser that provides services to the registrant, which services were not required to be pre-approved pursuant to paragraph (c)(7)(ii) of Rule 2-01 of Regulation S-X. The notification provided to the registrant’s audit committee included sufficient details regarding such services to allow the registrant’s audit committee to consider the continuing independence of its principal accountant.
ITEM 5. AUDIT COMMITTEE OF LISTED REGISTRANTS.
Not applicable.
ITEM 6. INVESTMENTS.
| (a) | The schedule of investments is included as part of the report to stockholders filed under Item 1 of this Form. |
| (b) | Not applicable. |
ITEM 7. DISCLOSURE OF PROXY VOTING POLICIES AND PROCEDURES FOR CLOSED-END MANAGEMENT INVESTMENT COMPANIES.
Not applicable.
ITEM 8. PORTFOLIO MANAGERS OF CLOSED-END MANAGEMENT INVESTMENT COMPANIES.
Not applicable.
ITEM 9. PURCHASES OF EQUITY SECURITIES BY CLOSED-END MANAGEMENT INVESTMENT COMPANY AND AFFILIATED PURCHASERS.
Not applicable.
ITEM 10. SUBMISSION OF MATTERS TO A VOTE OF SECURITY HOLDERS.
During the reporting period, there were no material changes to the procedures by which shareholders may recommend nominees to the registrant’s board.
ITEM 11. CONTROLS AND PROCEDURES.
| (a) | The registrant's principal executive officer and principal financial officer have concluded that the registrant's disclosure controls and procedures (as defined in Rule 30a-3(c) under the Investment Company Act of 1940) are effective based on their evaluation of these controls and procedures as of a date within 90 days of the filing date of this report. |
| (b) | There were no changes in the registrant's internal control over financial reporting (as defined in Rule 30a-3(d) under the Investment Company Act of 1940) that occurred during the registrant's second fiscal quarter of the period covered by this report that have materially affected, or are reasonably likely to materially affect, the registrant's internal control over financial reporting. |
ITEM 12. EXHIBITS.
| (a)(1) | Registrant’s Code of Ethics for Senior Financial Officers, which is the subject of the disclosure required by Item 2 of Form N-CSR, was filed as Exhibit 12(a)(1) to American Century Asset Allocation Portfolios, Inc.’s Certified Shareholder Report on Form N-CSR, File No. 811-21591, on September 29, 2005. |
| (a)(2) | Separate certifications by the registrant’s principal executive officer and principal financial officer, pursuant to Section 302 of the Sarbanes-Oxley Act of 2002 and Rule 30a-2(a) under the Investment Company Act of 1940, are filed and attached hereto as EX-99.CERT. |
| (a)(3) | Not applicable. |
| (b) | A certification by the registrant’s chief executive officer and chief financial officer, pursuant to Section 906 of the Sarbanes-Oxley Act of 2002, is furnished and attached hereto as EX-99.906CERT. |
SIGNATURES
Pursuant to the requirements of the Securities Exchange Act of 1934 and the Investment Company Act of 1940, the registrant has duly caused this report to be signed on its behalf by the undersigned, thereunto duly authorized.
| Registrant: | American Century Quantitative Equity Funds, Inc. | |||
| By: | /s/ Jonathan S. Thomas | |||
| Name: | Jonathan S. Thomas | |||
| Title: | President | |||
| Date: | August 24, 2016 | |||
Pursuant to the requirements of the Securities Exchange Act of 1934 and the Investment Company Act of 1940, this report has been signed below by the following persons on behalf of the registrant and in the capacities and on the dates indicated.
| By: | /s/ Jonathan S. Thomas | ||
| Name: | Jonathan S. Thomas | ||
| Title: | President | ||
| (principal executive officer) | |||
| Date: | August 24, 2016 | ||
| By: | /s/ C. Jean Wade | ||
| Name: | C. Jean Wade | ||
| Title: | Vice President, Treasurer, and | ||
| Chief Financial Officer | |||
| (principal financial officer) | |||
| Date: | August 24, 2016 | ||